EXPANDING THE INFORMATION TECHNOLOGY AGREEMENT...
73
DG Trade EXPANDING THE INFORMATION TECHNOLOGY AGREEMENT (ITA) ECONOMIC AND TRADE IMPACTS | FINAL REPORT | OCTOBER 2010
-
Upload
duongnguyet -
Category
Documents
-
view
220 -
download
0
Transcript of EXPANDING THE INFORMATION TECHNOLOGY AGREEMENT...

DG Trade
EXPANDING THE INFORMATION TECHNOLOGY AGREEMENT (ITA) ECONOMIC AND TRADE IMPACTS | FINAL REPORT | OCTOBER 2010

Expanding the Information Technology Agreement (ITA)
2
COLOPHON
Authors: Martin H. Thelle, Eva R. Sunesen and Holger N. Jensen
Client: European Commission, DG Trade
Date: October 2010
Contact: SANKT ANNÆ PLADS 13, 2nd FLOOR | DK-1250 COPENHAGEN
PHONE: +45 2333 1810 | FAX: +45 7027 0741
WWW.COPENHAGENECONOMICS.COM
Expanding the Information Technology Agreement (ITA)
3
Preface ......................................................................................................................... 4
Chapter 1 Summary ................................................................................................ 5
1.2. Three scenarios analysed in this study .................................................................... 5
Chapter 2 Trade in information technology products .............................................. 9
2.1. Background about the agreement .......................................................................... 9
2.2. Current trade in ITA goods ................................................................................. 11
2.3. Increase in ITA trade over time ........................................................................... 14
2.4. Role of non-ITA countries ................................................................................... 15
Chapter 3 The wider industry picture .................................................................... 17
3.1. Shifting trade patterns ......................................................................................... 17
3.2. Trade, production and sales ................................................................................. 20
3.3. Global ICT firms ................................................................................................ 25
3.4. Intra-firm trade ................................................................................................... 30
3.5. Trade in intermediate and capital goods .............................................................. 30
3.6. Chinese exports is specialised in low price products ............................................. 34
3.7. FDI in ICT ......................................................................................................... 35
3.8. Conclusion .......................................................................................................... 40
Chapter 4 Including more countries in the ITA ..................................................... 42
4.1. Current trade with candidates for inclusion ......................................................... 42
4.2. Tariffs on trade with countries considered for inclusion ....................................... 46
4.3. Trade impacts of extending the country coverage ................................................. 47
4.4. Economic and welfare impacts of extending the country coverage ........................ 48
4.5. Conclusions ......................................................................................................... 50
Chapter 5 Extending the product coverage of the ITA ........................................... 51
5.1. Current trade in products suggested for inclusion ................................................ 51
5.2. Tariffs on products suggested for inclusion .......................................................... 53
5.3. Trade impacts of extending the product coverage ................................................ 54
5.4. Economic and welfare impacts of extending the product coverage ....................... 55
5.5. Conclusions ......................................................................................................... 59
Chapter 6 Including NTBs in the ITA ................................................................... 60
6.1. Identified NTBs on ITA products ....................................................................... 60
6.2. Model of global trade in ITA products ................................................................ 64
6.3. Impact on trade in the CA harmonisation scenario .............................................. 68
6.4. Conclusion .......................................................................................................... 70
References .................................................................................................................. 71
TABLE OF CONTENTS

Expanding the Information Technology Agreement (ITA)
4
This is the report requested in the terms of reference entitled "The Information Technology
Agreement - ITA" under the framework contract (TRADE/07/A2).
The overall objective of this study is to provide DG Trade with an economic analysis of the
proposed expansion of the ITA in terms of product and geographic coverage.
Our task has been to provide empirically evidence on the possible impacts of the proposed
expansion of the ITA, both in terms of country and product coverage and with regard to the
reduction of regulatory barriers.
Disclaimer The views expressed in this report are those of the authors and do not necessarily reflect
those of the European Commission. Neither the European Commission nor any person act-
ing on behalf of the Commission is responsible for the information provided in this docu-
ment.
Martin H. Thelle
(Partner, Project Manager)
Brussels, October 2010
PREFACE

Expanding the Information Technology Agreement (ITA)
5
The Information Technology Agreement (ITA) removed tariffs on a large number of IT
products intended for professional and business use. The product list in Annex to the ITA
comprises more than 250 products including computers, telecommunications equipment,
semiconductors and semiconductor manufacturing equipment, software and scientific in-
struments.1
More members joining the ITA
ITA membership has steadily increased from the 29 original signatories in 1996 to 73 mem-
bers in 2010, and it has increasing participation from developing countries. The ITA is a so-
called “critical-mass” agreement: although its membership covers only a subset of all WTO
members, these members account for about 92 percent of world trade in ITA goods (97 per-
cent when intra-EU trade is included). At the same time, it gives all WTO members the
right to duty free treatment of their ITA product exports to ITA members. As such, the
agreement has a free-rider element: WTO members who are not ITA-members, such as Bra-
zil, Mexico and Argentina, are not required to reciprocate and can maintain high tariffs on
ITA members' exports to their markets.
New products evolve
A key characteristic of the information technology industry is the rapid pace of technological
change. This has significantly changed the product landscape since 1996 when the ITA was
negotiated. This has given rise to disputes regarding the treatment of specific products and
the question whether they are covered or not by the ITA provisions on duty free trade. A
WTO panel recently concluded against the EU in an ITA dispute submitted by the US, Ja-
pan and Taiwan. Many ITA members agree that it is time to review the product coverage.
EC proposing a review of the ITA
An EC proposal on reviewing the ITA was communicated on 16 September 2008 to the
ITA members in Geneva. It firstly concerns the removal of existing non-tariff barriers
(NTBs) and prohibition of new ones. Secondly, it calls for negotiations on the product cov-
erage of the agreement. Finally, the proposal calls for inclusion of new members to the ITA.
This study estimates the likely economic and trade impact of three EU-proposed extensions
of the ITA, in the form of three policy scenarios.
1.2. THREE SCENARIOS ANALYSED IN THIS STUDY We use available trade data on current and proposed ITA product coverage and we apply
partial equilibrium and gravity models to estimate the outcomes. Specifically, we analyse the
impact of three scenarios: 1) expanding the country coverage of the ITA
2) expanding the product coverage of the ITA
3) reducing regulatory barriers to trade in ITA products (NTBs)
1 There is no specific definition of information technology in the agreement itself.
Chapter 1 SUMMARY

Expanding the Information Technology Agreement (ITA)
6
We find that the benefits for the EU are very small for the first scenario, somewhat larger for
the second scenario and substantial for the third scenario.
The three scenarios have been complemented with an analysis of current trade flows in ITA
goods (Chapter 2) and an ICT industry analysis of production location, supply chains and
assessment of trade in intermediary products (Chapter 3). The results of the three scenarios
are summarized below.
Scenario 1: Expanding the country coverage has little impact on the EUScenario 1: Expanding the country coverage has little impact on the EUScenario 1: Expanding the country coverage has little impact on the EUScenario 1: Expanding the country coverage has little impact on the EU
In Chapter 4 we analyse a scenario in which six countries are added to the ITA membership:
Brazil, Argentina, Mexico, Chile, South Africa and Russia.
The EU exports around €120 billion worth of ITA goods per year, of which €90 billion goes
to other ITA members (based on 2007 data). EU exports of ITA goods to non-WTO mem-
bers amount to €16 billion, and the remaining €14 billion is exports to WTO members that
have chosen not to join the ITA.
The six new ITA members in the scenario reduce their import tariffs on ITA goods to zero
for all WTO countries. Existing ITA members already apply zero tariffs to these new ITA
members, by virtue of the MFN nature of the ITA. The only exception is Russia which is
not yet a WTO country and may still face tariffs on its ITA exports to ITA countries.
For European ITA exports tariffs on exports to Brazil and Argentina will go down from an
average of around 10 percent to zero. This change will be beneficial, but the impact will be
low since EU exports to Argentina and Brazil are low. Moreover, one should bear in mind
that duty free trade with Argentina and Brazil may also be achieved through a future EU-
Mercosur FTA currently under negotiation. Country coverage expansion to Russia also im-
plies a reduction of tariffs on EU exports, but Russia’s tariffs on IT products are very low
from the outset. For EU exports to the remaining newcomers (Mexico, Chile and South Af-
rica) there will be no change, since the EU already has trade agreements with these countries
ensuring duty free trade in goods, including the IT products covered by the ITA. In conclu-
sion, the ITA country expansion will help EU exporters, but only very little.
Other ITA members can expect to benefit from inviting these six countries into the ITA,
particular those that do not have FTAs with these six countries. We find that there is a small
positive global welfare effect of extending the ITA to cover Argentina, Brazil, Chile, Mexico,
Russia and South Africa.
Scenario 2: Expanding the product coverage has positive impact on the EUScenario 2: Expanding the product coverage has positive impact on the EUScenario 2: Expanding the product coverage has positive impact on the EUScenario 2: Expanding the product coverage has positive impact on the EU
In Chapter 5 we assess the trade and economic impacts of extending the product coverage of
the ITA. The analysis is based on a defined list of products proposed by the Commission as
new ITA products. We have quantified the impact of extending the ITA in the product di-
mension, while keeping the country coverage as in the current ITA. The tariff reduction sce-

Expanding the Information Technology Agreement (ITA)
7
nario therefore implies reducing existing tariffs to zero for all bilateral trade between ITA
countries as well as on the ITA countries’ import from non-ITA WTO countries for all
products listed for the product extension.
EU exports of products on the product extension list amounts to €55 billion per year, of
which €42 billion is to other ITA members and €7 billion goes to other WTO countries
outside the ITA, and another €7 billion is exports to non-WTO members. The EU imports
of the products on the extension list amounts to €40 billion, of which €38 billion is from
other ITA members.
EU exporters of the products including on the product expansion list face a tariff of 2.5 per-
cent on average across current ITA members (trade weighted average). The tariff protection
differs from product to product. The largest product group (measured by value of EU’s ex-
port) is products under heading 85 (‘electrical machinery and equipment’) for which EU ex-
ports face an average import duty of 1.6 percent across current ITA members.
EU tariffs on the suggested new ITA products are lower than the tariffs that EU exporters
face when exporting these products abroad. The average tariff per product heading (trade
weighted) is around 1.0 percent or lower for the larger product groups (heading 84 and 90).
EU consumers will benefit from eliminating tariffs on the new ITA products on the list. Al-
though there is a loss in tariff revenue for the EU and a small drop in producer surplus, there
will be a net gain in total welfare. We note that much of ITA trade is in intermediate goods,
and producers of ITA products in one country use ITA products from another country in
their production of a third type of ITA product.
European exports of the listed additional ITA products under heading 85 could increase by
almost €1 billion (or 5% from €17.4 billion to €18.3 billion). European imports of the listed
additional heading 85 products could increase by almost €1.5 billion (or 10% from €14.7
billion to €16.2 billion). For other product groups there is little impact.
By lowering the price of these new ITA products and increasing consumption, extending the
scope of the ITA product list will therefore benefit EU companies and improve their possi-
bility for doing business. Extending the ITA to cover more products will also benefit con-
sumers of these products since they will face lower prices and a wider set of products to
choose from. At the same time, the European economy will lose tariff revenue.
Combining all these elements in one single number, we find that there is a net welfare gain
for EU economy of around € 45 million from eliminating tariffs on the extended list of
products as proposed by the EU Commission. Consumers’ welfare will increase by an
equivalent of around €520 million (consumer surplus) and producers will on aggregate not
be negatively nor positively affected. EU producers benefit from better access to foreign
markets but also face more competition at home, and our assessment shows that these two
impacts on EU producers net out. Taking the changes in tariff revenue (which will drop by
Expanding the Information Technology Agreement (ITA)
8
€475 million) into account, we find a positive net welfare impact of €45 million for the EU
as a whole.
Scenario 3: Major impact of reducing regulatory barriers on ITA trScenario 3: Major impact of reducing regulatory barriers on ITA trScenario 3: Major impact of reducing regulatory barriers on ITA trScenario 3: Major impact of reducing regulatory barriers on ITA tradeadeadeade
In Chapter 6, we assess the impact of regulatory barriers on trade in ITA products. We find
that the trade potential of reducing barriers related to conformity assessment requirements is
significant.
Overly costly conformity assessment requirements are the single most important barrier to
ITA trade. The need to undergo multiple conformity assessment procedures in order to meet
government technical regulations in both domestic as well as in export markets is flagged by
ICT producers and users as blocking trade, and empirical studies of their impact seem to
support this view.
Relying on a number of recent empirical studies, we find there is a considerable trade expan-
sion potential of reducing the barriers to ITA trade caused by cumbersome, complex and/or
duplicative conformity assessment procedures.
When the EU introduced Supplier’s Declaration of Conformity (SDoC) on many of the
products under the ITA in late 1990s and early 2000s, it reduced costly duplication of con-
formity assessment procedures for trade between Member States. However, SDoC did not
only apply to intra-EU trade. It also made it easier for non-EU countries to export to the
EU market. As such, the NTB reduction was not reciprocal, since no NTB reductions were
undertaken by other ITA members. As a result, EU producers experienced a relative loss in
competitiveness compared to non-EU producers who were given improved access to the EU
markets. Harmonising conformity assessment procedures among ITA countries could re-
move this asymmetry.
We have analysed the impact of a scenario where ITA members that have not introduced
SDoC (i.e. having conformity assessment requiring e.g. third party testing as in e.g. the US,
Korea, Japan, China and others) adopt an SDoC system similar to that in the EU. In this
scenario, no changes are assumed for countries that already have SDoC system (e.g. the EU,
Canada, Australia, Norway and others).
The harmonisation of conformity assessment is estimated to result in €13 billion additional
export for the EU. Compared with the possible increase from expansion of the ITA in the
product dimension, which is €3 billion (see Chapter 5), the increase in EU exports is much
higher from just resolving one of the NTBs. The expansion in the country dimension (see
Chapter 4) is not estimated to provide any increase in EU’s ITA exports. European consum-
ers will also be largely unaffected by this, since no changes occur on imported products.

Expanding the Information Technology Agreement (ITA)
9
Information technology is a vital input for the global economy. The use of these new tech-
nologies leads to productivity improvements and consumer benefits across all areas of busi-
ness and many areas of our private lives.
The Information Technology Agreement (ITA) from 1996 aimed at removing trade barriers
for some of these information technology products. The primary focus of the agreement was
on information technology for professional and business use, which is often thought to
comprise the following broad product categories: computers, telecommunications equip-
ment, semiconductors and semiconductor manufacturing equipment, software and scientific
instruments.2
While originally thought to cover all types of trade barriers, an agreement was reached to re-
duce tariffs on certain information technology products.3 Non-tariff barriers (NTBs) were
also part of the agreement text, but no disciplines on their reduction were included. The
ITA has remained basically unaltered since its birth in 1996.
Since the agreement was made in 1996, many things have happened in the field of informa-
tion technology. Many new products have appeared, the use of different technologies has
converged and the borders between professional and private use are disappearing. New coun-
tries have also entered the scene as both producers and consumers and the supply chain for
producing information and communication technology (ICT) products have changed, with
a strong rise of production in Asia, with China appearing as the new technology power-
house.
It is against this backdrop that we analyse the implications of extending and renewing the
ITA in order to bring the agreement in line with the new technology, the new structure of
the global supply chain for information technology products and include non-tariff measures
in the form of regulatory barriers to trade in its scope.
In this introductory chapter we first provide a short background on the agreement and its
current challenges. We also look at the current trade covered by the agreement. In the next
chapter we show the main characteristics of the global IT industry.
2.1. BACKGROUND ABOUT THE AGREEMENT In 1996, the 1st WTO Ministerial Conference (in Singapore) resulted in the Ministerial Dec-
laration on trade in Information Technology Products, commonly described as Information
Technology Agreement (ITA). Today, the ITA includes forty-three participants4, a consider-
able increase from the fourteen original signatories.
2 There is no specific definition of information technology in the agreement itself. 3 For a more thorough description of the history of the ITA we refer to ECIPE (2009). 4 ITA participants include 70 Members and States or separate customs territories.
Chapter 2 TRADE IN INFORMATION TECHNOLOGY PRODUCTS

Expanding the Information Technology Agreement (ITA)
10
Despite its success, even during the early years some elements of the ITA started to pose ma-
jor challenges to all participants. The focus of such difficulties were product coverage issues,
the absence of any progress in addressing non-tariff barriers (NTBs), which have remained a
significant obstacle for trade in IT products, as well as the non-membership of important
countries active in the trade in IT products.
The ITA intended to deal with issues created by technological convergence, i.e., the increas-
ing number of functions performed by some products possibly blurring the principal func-
tion of a product. However, in practice the mechanisms under the ITA Agreement for the
incorporation of new IT products since the ITA was negotiated5 and the resolution of classi-
fication divergences have not worked effectively. Some of the difficulties arose from the
compromises achieved in 1996, under which certain IT products (such as optical fibres)
were excluded from its coverage.
In sum: the ITA has been very successful, but experience so far has shown that none of the
mechanisms contained in the Agreement has really helped it to keep pace with technological
progress in products or to dismantle existing NTBs.
The WTO dispute relates to EC commitments under the Information Technology Agree-
ment (ITA) to grant duty-free treatment to certain IT products. After complaints alleging
the EC of wrongly collecting import duties on certain LCD screens, set-top boxes and multi-
functional copiers, the US, Japan and Taiwan launched a WTO dispute against the EC in
the summer of 2008. The core of the problem is that the list of ITA products was agreed
thirteen years ago and, despite several offers by the EC to open negotiations on the product
coverage as foreseen in the agreement itself, the list of products has never been updated.
An EC proposal on reviewing the ITA was communicated on 16 September 2008 in Ge-
neva. It firstly concerns the removal of existing non-tariff barriers (NTBs) and prohibition of
new ones as it is important to have a level playing field in this respect even without tariffs.
Secondly, it calls for negotiations on the product coverage. Many ITA members agree that it
is high time to review the product coverage. Technology development has significantly
changed the product landscape since 1996 when the ITA was negotiated. Finally, the pro-
posal calls for inclusion of new members to the ITA. The ITA extends duty free treatment to
all WTO members for IT exports to ITA members. WTO members like Brazil, Mexico and
Argentina benefit from duty free access to ITA members' markets while exports to their
markets face in general very high tariffs.
5 The ITA does not entail automatic product coverage extension. Attachments A and B of the ITA deal with prod-uct coverage. Whilst in Attachment A products are referred to by tariff heading, in Attachment B products are re-ferred to through descriptions. Following the signing of the Agreement, Participants had to communicate the tariff lines implementing Attachment B commitments in their schedules.

Expanding the Information Technology Agreement (ITA)
11
2.2. CURRENT TRADE IN ITA GOODS Global trade in ITA goods is currently accounting for at least €1.22 trillion a year when in-
cluding both ITA members and all other countries not party to the ITA, cf.
Table 2.1.6
Trade covered by the current ITA amounts to €917 billion a year (€891 billlion from other
ITA countries and €26 from non-ITA exporters that are part of WTO) or 92 percent of
global trade in ITA goods (excluding intra-EU trade).7 Expanding the ITA to cover all
WTO countries would increase the coverage of the ITA by €55 billion (and bring the cover-
age up to 97 percent of global trade in current ITA products).
Table 2.1 Global trade in ITA products, 2007
Country ITA importers Non-ITA importers Non-WTO importers Grand total
ITA exporters 891 51 24 966
Non-ITA exporters 26 3 0 30
Non-WTO exporters 1 0 0 1
Grand totalGrand totalGrand totalGrand total 918918918918 55555555 25252525 997997997997
Note: The figures show global trade in ITA products for all countries reporting data for 2007. Data is in billion Euros, 2007. Data excludes intra-EU trade.
Source: Own calculation based on Comtrade data.
EU exports to non-EU countries represent €120 billion, and EU imports of ITA goods from
non-EU countries represent €158 billion, cf. Table 2.2. In sum, the EU is involved as either
an importer or exporter in 41 percent of global trade in ITA goods. Global trade in ITA
goods between non-EU countries correspond to €720 billion.
Table 2.2 The EU and global trade in ITA products, 2007
Exporter Export
EU countries
120
Non-EU countries
878
Of which non-EU countries’ export to
EU countries 158
Non-EU countries 720
Grand total (excl. intraGrand total (excl. intraGrand total (excl. intraGrand total (excl. intra----EU trade)EU trade)EU trade)EU trade)
997997997997
Note: Data is in billion Euros, 2007. Data excludes intra-EU trade. Source: Model input data based on Comtrade data.
China is the largest ITA exporter China is the largest exporter of ITA goods with €271 billion, ahead of the EU which ex-ported €120 billion in 2007 (measured by extra-EU trade). Japan, Singapore and the United
6 This number is slightly underestimating the actual trade volume since not all countries have reported data for all years. A study by the USITC reported global exports of €1.50 trillion for the year 2008, which would suggest an es-timate of €1.3 trillion for 2007 using the reported 10 percent annual growth rate. 7 If intra-EU trade is taken into account, the ITA accounts for 97 percent of global ITA trade.

Expanding the Information Technology Agreement (ITA)
12
States follow. Taken together, the ten largest exporters account for 94 percent of global ex-ports (exclusive of intra-EU trade). The top 30 exporters account for 99.9 percent of global exports (exclusive of intra-EU trade). Intra-EU trade accounted for €222 billion in 2007.
Table 2.3 Top 30 exporters of current ITA goods, 2007
ExporterExporterExporterExporter ITA memberITA memberITA memberITA member ITA export ITA export ITA export ITA export ((((€ billion)€ billion)€ billion)€ billion)
Share of world ITA trade Share of world ITA trade Share of world ITA trade Share of world ITA trade (excluding intra(excluding intra(excluding intra(excluding intra----EU trade)EU trade)EU trade)EU trade)
1 China Yes 271,5 27,2%
2 EU27 (extra-EU trade) Yes 119,9 12,0%
3 Japan Yes 110,0 11,0%
4 Singapore Yes 101,9 10,2%
5 United States Yes 93,7 9,4%
6 Korea Yes 75,8 7,6%
7 Malaysia Yes 73,7 7,4%
8 Philippines Yes 35,3 3,5%
9 Mexico - 26,7 2,7%
10 Thailand Yes 25,8 2,6%
11 Taiwan, China Yes 19,8 2,0%
12 Canada Yes 10,1 1,0%
13 Indonesia Yes 8,1 0,8%
14 Switzerland Yes 6,3 0,6%
15 India Yes 2,5 0,2%
16 Norway Yes 2,3 0,2%
17 Brazil - 2,1 0,2%
18 Costa Rica Yes 2,1 0,2%
19 Hong Kong, China Yes 2,0 0,2%
20 Australia Yes 2,0 0,2%
21 Turkey Yes 1,4 0,1%
22 Israel Yes 1,3 0,1%
23 Russian Federation - 1,0 0,1%
24 South Africa - 0,6 0,1%
25 Croatia Yes 0,5 0,1%
26 Dominican Republic Yes 0,4 0,04%
27 New Zealand Yes 0,3 0,03%
28 Argentina - 0,2 0,02%
29 Serbia - 0,1 0,01%
30 El Salvador Yes 0,1 0,01%
Intra-EU 27 trade 222,0
TOTALTOTALTOTALTOTAL 1.219,9 1.219,9 1.219,9 1.219,9
Total excluding intra-EU 997,9 100%
Note: Exports of current ITA products by exporter regardless of destination. Numbers include export to non-ITA members.
Source: Own calculations based on Comtrade data.
Breaking the ITA down by product segments shows that three segments dominate and to-
gether account for close to 80 percent of trade. The main products are computers (including
peripherals and parts), telecom equipment and semiconductors and integrated circuits, cf.
Table 2.4.

Expanding the Information Technology Agreement (ITA)
13
Table 2.4 ITA exports of current ITA goods by segment, 2007
The world (excluding intra-EU)
Product segment
ITA trade
(€ billion) (pct.)
Computer, Peripherals and Parts 284 28%
Telecom Equipment 197 20%
Semiconductors and Integrated Circuits 311 31%
Semiconductor Manufacturing Equipment 37 4%
Software 23 2%
Measuring Instruments 20 2%
Office Machines (other than computers) 44 4%
Other 81 8%
TOTALTOTALTOTALTOTAL 998998998998 100%100%100%100%
Extra-EU27 exports
Product segment
ITA trade
(€ billion) (pct.)
Computer, Peripherals and Parts 28 23%
Telecom Equipment 35 29%
Semiconductors and Integrated Circuits 27 22%
Semiconductor Manufacturing Equipment 9 7%
Software 4 3%
Measuring Instruments 7 6%
Office Machines (other than computers) 4 3%
Other 7 6%
TOTALTOTALTOTALTOTAL 120120120120 100%100%100%100%
Note: Exports of current ITA products by segment regardless of destination (including export to non-ITA mem-bers). Data is in billion Euros.
Source: Own calculations based on Comtrade data.
EU trade with main partners
The EU’s trade with the US is more or less balanced between imports and exports. The same
is true for trade with Canada. For trade with China, the EU is importing much more than
they are exporting to China. The same is true for ITA trade with Japan and Korea.

Expanding the Information Technology Agreement (ITA)
14
Table 2.5 EU trade with main partners EU export EU Import
EU export to US € 17.7 bn EU import from US € 18.4 bn
… to Canada € 1.0 bn … from Canada € 1.4 bn
… to China € 8.0 bn … from China € 62.3 bn
… to Japan € 3.5 bn … from Japan € 18.7 bn
… to Korea € 3.5 bn … from Korea € 13.0 bn
Total to all countries €120.0 bn Total from all countries €158.0 bn
(excluding intra-EU trade) (excluding intra-EU trade)
Note: Data is in billion Euros. Source: Own calculations based on Comtrade data.
2.3. INCREASE IN ITA TRADE OVER TIME Global IT trade has grown substantially during the time since the start of the ITA. From
1996 through 2008 total ITA products trade (imports and exports) expanded 10.1 percent
annually, cf. USITC (2010). The reduction of tariffs under the ITA surely played a role in
this growth, but the purpose of this report is not to evaluate the impact of the ITA on
growth in IT trade as such.
We note that expansion of trade in ITA goods was steepest between 1996 and 2000, grow-
ing 17.5 percent annually, but declined between 2000 and 2002 (-2.8 percent) as the inter-
net economy went through a downturn (Friar, et al. 2008). In 2002, however, ITA products
trade growth resumed, but at a comparatively slower pace (10.4 percent).
ITA trade has grown more rapidly than merchandise trade in general, and more rapidly than
general ICT trade as defined by the OECD according to data collected by the USITC, cf.
Figure 2.1.

Expanding the Information Technology Agreement (ITA)
15
Figure 2.1 Trade in ICT goods, 1997-2007 Index: 1997 = 100
Note: OECD ICT trade includes trade in copying machines and related parts to maximise the consistency of 2007
data with that for earlier years. The 2007 revision of HS groups together office printers (in the ICT good definition) with photocopiers (not in the current ICT list) whereas previous versions of HS classified them separately. Also, ICT trade does not include UK trade in "Transmit-receive apparatus for radio, TV, etc." due to uncertainties concerning the impact of MTIC VAT Fraud on UK Trade Statistics. USITC maps the coverage of the ITA according to USITC (2010).
Source: Own calculations based on OECD (2008) and USITC (2010).
2.4. ROLE OF NON-ITA COUNTRIES While ITA member countries account for the vast majority of total trade in ITA goods, with
a few non-ITA member countries expanded their share of trade in ITA goods. In 2008, non-
ITA countries accounted for only 6 percent of total trade in ITA goods.
Despite their non-member status, Mexico, Russia, Brazil, and South Africa have demon-
strated strong increase in trade in ITA goods since 1996. Mexico’s export role and Russia’s
import growth are both particularly noteworthy.
Mexico ranks 9th among exporters of ITA goods, cf. Table 2.3. Since Mexico is a WTO
member, its exporters benefit from the MFN nature of the ITA agreement. Additionally, on
the import side, Mexico unilaterally instituted “ITA plus,” which eliminates duties on a wide
variety of critical inputs, machinery, and finished products in the electronics and IT sectors
(Padiema-Peralta, 2008). These lower-cost inputs provide a competitive price advantage to
Mexican producers and exporters. Moreover, due to the North American Free Trade Agree-
ment, there are established ITA production networks linking Mexico with the United States
and Canada; in 2008, 87 percent of Mexico’s ITA exports went to either Canada or the
United States, cf. USITC (2010).
Total goods trade
OECD ICT trade
USITC ITA trade
0
50
100
150
200
250
300
1997 1998 1999 2000 2001 2002 2003 2004 2005 2006 2007 2008

Expanding the Information Technology Agreement (ITA)
16
Russia is rapidly increasing imports of ITA products despite being outside the WTO and the
ITA. While the rest of the world benefited from the technology boom of 1996–2000, Rus-
sia’s ITA imports declined by 15.7 percent, and the country suffered a severe financial crisis
in 1998. Yet, since 2001, Russian imports of ITA products have grown annually by 38.7
percent (USITC, 2010), albeit from a relatively small base. Russia is primarily an importer
of ITA products; rather than export ITA goods, it is major exporter of information and
communication services (OECD 2008, 91). The ITA does not cover services, but Russia’s
strong position in the related services industry may explain its demand for products covered
by the ITA. Russia’s main sources of ITA imports are China, Germany, and Hungary.

Expanding the Information Technology Agreement (ITA)
17
In this chapter we complement the picture of trade flows with an assessment of foreign in-
vestment, domestic market size and industry structures in order to assess the roles that na-
tional production centres play in the global ITA product supply chains. The purpose of the
mapping is to complement the trade analysis and scenarios with a wider industry picture.
3.1. SHIFTING TRADE PATTERNS During the twelve years of duty-free trade in ITA products there have been substantial
changes in trade patterns and market shares for ITA member countries, which reflect
changes in the location of production, with China taking a central role as manufacturing and
assembly hub for many ITA products. As a result, ITA trade is increasing with Asian coun-
tries, particularly China, and developing countries play a more important role today than
they did twelve years ago.
Asia’s role in ITA trade grew extensively during the last decade. While not all countries
within Asia gained equally, several Asian ITA countries are now leading exporters, importers,
and centres for global production networks for ITA products.
The rapidly expanding role of China stands out: China has emerged to become the largest
single player in the global ITA market. Annual export growth rates were strongest for China
(33.5 percent), South Korea (13.1 percent), Taiwan/Chinese Taipei (9.8 percent), and Phil-
ippines (11.0 percent). Similarly, import growth rates were strong for several Asian coun-
tries, led by China (24.4 percent) and including Thailand (9.6 percent), South Korea (9.0
percent), Singapore (6.2 percent), and Japan (5.7 percent).
Asian ITA members now represent five of the ten largest exporters and importers of ITA
products. Japan, formerly the leading exporter of ITA products, is now the second largest
Asian exporter behind China, ceding market share due to sharper growth in exports by other
Asian countries. Japan’s export market share fell from a 1996 high of 18.6 percent to only
9.2 percent in 2008. Despite the decline in ITA export shares in Japan, the robust increase
in ITA market share for several other Asian countries, above all China, indicates a significant
shift in manufacturing capabilities for ITA products towards Asian countries, particularly
developing Asian countries.
Chapter 3 THE WIDER INDUSTRY PICTURE
Expanding the Information Technology Agreement (ITA)
18
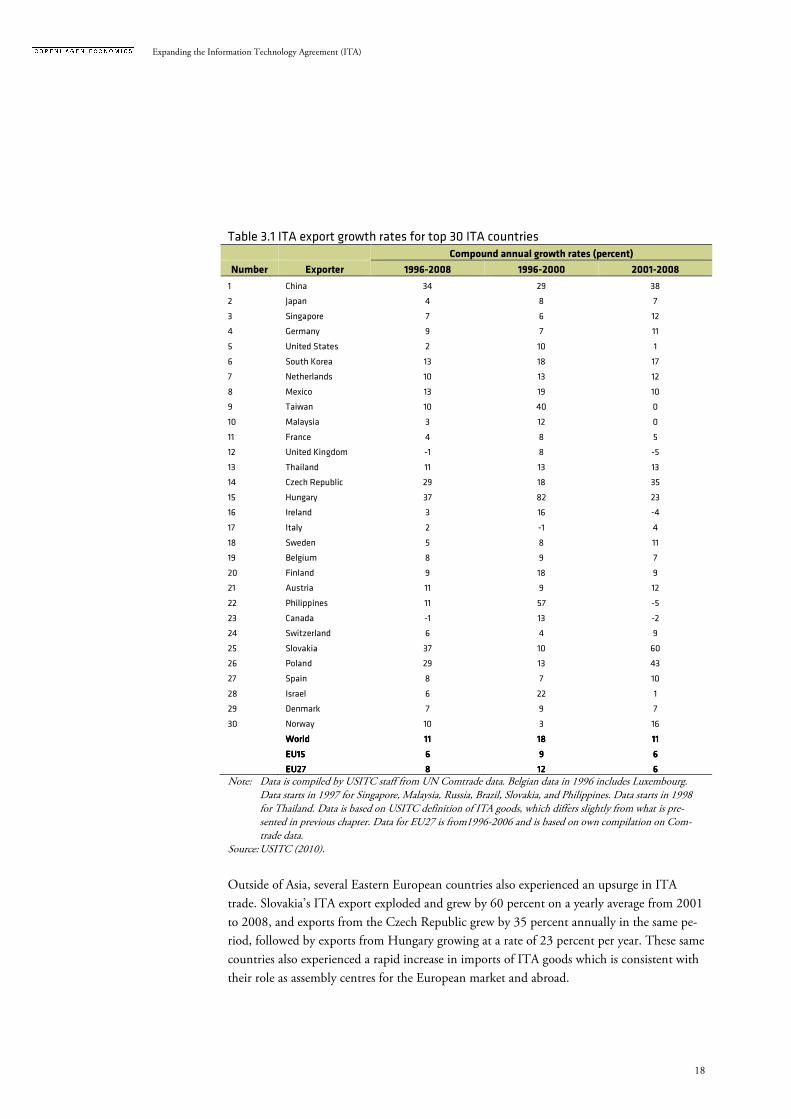
Table 3.1 ITA export growth rates for top 30 ITA countries Compound annual growth rates (percent)
Number Exporter 1996-2008 1996-2000 2001-2008
1 China 34 29 38
2 Japan 4 8 7
3 Singapore 7 6 12
4 Germany 9 7 11
5 United States 2 10 1
6 South Korea 13 18 17
7 Netherlands 10 13 12
8 Mexico 13 19 10
9 Taiwan 10 40 0
10 Malaysia 3 12 0
11 France 4 8 5
12 United Kingdom -1 8 -5
13 Thailand 11 13 13
14 Czech Republic 29 18 35
15 Hungary 37 82 23
16 Ireland 3 16 -4
17 Italy 2 -1 4
18 Sweden 5 8 11
19 Belgium 8 9 7
20 Finland 9 18 9
21 Austria 11 9 12
22 Philippines 11 57 -5
23 Canada -1 13 -2
24 Switzerland 6 4 9
25 Slovakia 37 10 60
26 Poland 29 13 43
27 Spain 8 7 10
28 Israel 6 22 1
29 Denmark 7 9 7
30 Norway 10 3 16
WorldWorldWorldWorld 11111111 18181818 11111111
EUEUEUEU15151515 6666 9999 6666
EU27EU27EU27EU27 8888 12121212 6666
Note: Data is compiled by USITC staff from UN Comtrade data. Belgian data in 1996 includes Luxembourg. Data starts in 1997 for Singapore, Malaysia, Russia, Brazil, Slovakia, and Philippines. Data starts in 1998 for Thailand. Data is based on USITC definition of ITA goods, which differs slightly from what is pre-sented in previous chapter. Data for EU27 is from1996-2006 and is based on own compilation on Com-trade data.
Source: USITC (2010).
Outside of Asia, several Eastern European countries also experienced an upsurge in ITA
trade. Slovakia’s ITA export exploded and grew by 60 percent on a yearly average from 2001
to 2008, and exports from the Czech Republic grew by 35 percent annually in the same pe-
riod, followed by exports from Hungary growing at a rate of 23 percent per year. These same
countries also experienced a rapid increase in imports of ITA goods which is consistent with
their role as assembly centres for the European market and abroad.
Expanding the Information Technology Agreement (ITA)
19
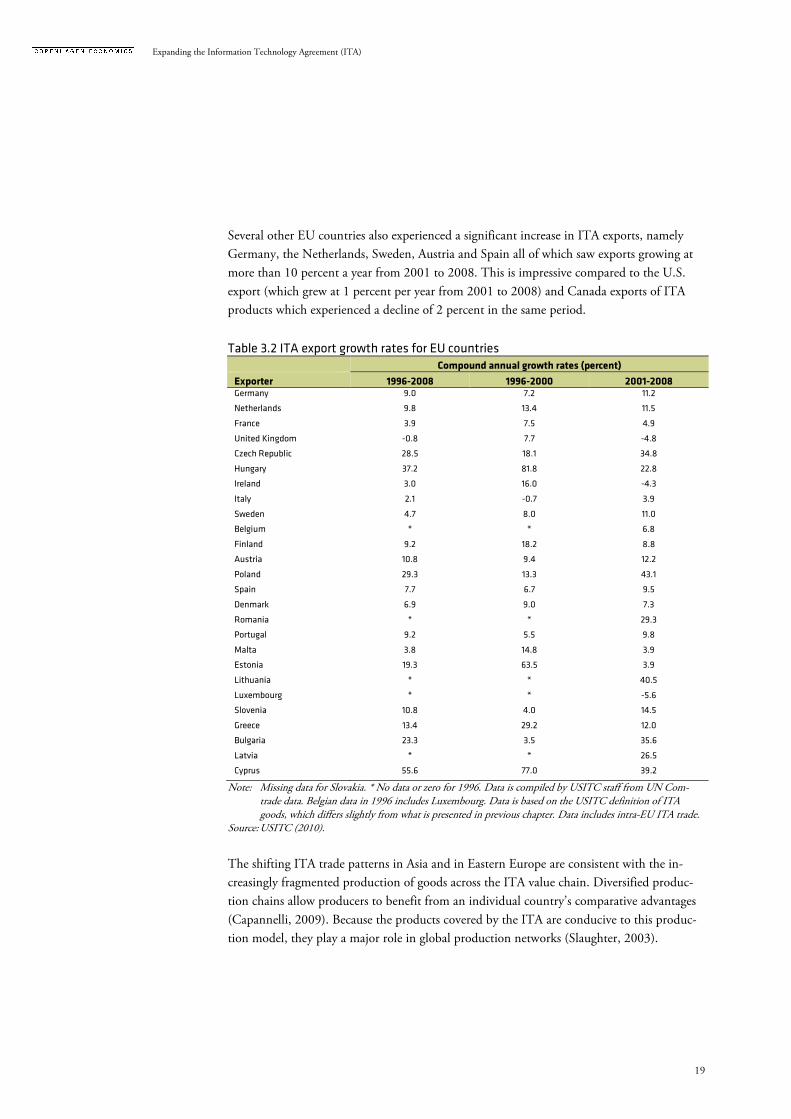
Several other EU countries also experienced a significant increase in ITA exports, namely
Germany, the Netherlands, Sweden, Austria and Spain all of which saw exports growing at
more than 10 percent a year from 2001 to 2008. This is impressive compared to the U.S.
export (which grew at 1 percent per year from 2001 to 2008) and Canada exports of ITA
products which experienced a decline of 2 percent in the same period.
Table 3.2 ITA export growth rates for EU countries Compound annual growth rates (percent)
Exporter 1996-2008 1996-2000 2001-2008 Germany 9.0 7.2 11.2
Netherlands 9.8 13.4 11.5
France 3.9 7.5 4.9
United Kingdom -0.8 7.7 -4.8
Czech Republic 28.5 18.1 34.8
Hungary 37.2 81.8 22.8
Ireland 3.0 16.0 -4.3
Italy 2.1 -0.7 3.9
Sweden 4.7 8.0 11.0
Belgium * * 6.8
Finland 9.2 18.2 8.8
Austria 10.8 9.4 12.2
Poland 29.3 13.3 43.1
Spain 7.7 6.7 9.5
Denmark 6.9 9.0 7.3
Romania * * 29.3
Portugal 9.2 5.5 9.8
Malta 3.8 14.8 3.9
Estonia 19.3 63.5 3.9
Lithuania * * 40.5
Luxembourg * * -5.6
Slovenia 10.8 4.0 14.5
Greece 13.4 29.2 12.0
Bulgaria 23.3 3.5 35.6
Latvia * * 26.5
Cyprus 55.6 77.0 39.2
Note: Missing data for Slovakia. * No data or zero for 1996. Data is compiled by USITC staff from UN Com-trade data. Belgian data in 1996 includes Luxembourg. Data is based on the USITC definition of ITA goods, which differs slightly from what is presented in previous chapter. Data includes intra-EU ITA trade.
Source: USITC (2010).
The shifting ITA trade patterns in Asia and in Eastern Europe are consistent with the in-
creasingly fragmented production of goods across the ITA value chain. Diversified produc-
tion chains allow producers to benefit from an individual country’s comparative advantages
(Capannelli, 2009). Because the products covered by the ITA are conducive to this produc-
tion model, they play a major role in global production networks (Slaughter, 2003).

Expanding the Information Technology Agreement (ITA)
20
3.2. TRADE, PRODUCTION AND SALES The swift in trade patterns is also reflected by production numbers. Electronics production
in China have rocketed from around USD 250 billion in 2005 to over USD 400 billion in
2008, cf. Figure 3.1. Data for the ten of the major EU ICT producing countries8 shows a
production in 2008 of just above the USD 250 billion mark, well ahead of Japan (USD 184
billion) and slightly after the US (USD 282 billion). However, counting the remaining 17
EU Member States could show that the EU is the second largest electronics producer after
China. Other significant electronics producers are S. Korea, Malaysia, Singapore, Taiwan (all
ITA members) and followed by non-ITA members, Mexico and Brazil.
Figure 3.1 Electronics production, 2005 and 2008
Note: The aggregate for EU (labelled EU10*) is comprised of Germany, UK, France, Ireland, Italy, Hungary, Netherlands, Czech Republic, Finland and Sweden. Data for other 17 Member States is not available in the OECD (2009) study. 2005 are current figures at current exchange rates. 2008 are forecasts at 2007 constant values and exchange rates.
Source: OECD, based on data provided by Reed Electronics Research.
Looking at the percentage growth of electronics production between 2005 and 2008, five of
the top ten globally fastest growing countries are EU countries (Slovak Republic, Poland,
Czech Republic, Bulgaria and Greece). Slovak Republic is the fastest of them all with an an-
nual growth of 40 percent between 2005 and 2008. With 15 percent average growth per
year, Poland is keeping track with China. Hungary is the 11th fastest growing electronics
producer.
8 The ten major EU ICT producing countries include Germany, United Kingdom, France, Ireland, Italy, Hungary, Netherlands, Czech Republic, Finland and Sweden.
0
50
100
150
200
250
300
350
400
450
USD Billions
2005 2008

Expanding the Information Technology Agreement (ITA)
21
Production in France, UK, Finland and Belgium contracted in the same period. So did elec-
tronics production in Korea and Japan. However, value added rose substantially in Finland,
Korea and Japan through 2006.
Figure 3.2 Growth in the value of electronics production, 2005-2008 in EU
Note: Data is provided for 23 EU Member States. Source: OECD (2009), based on data provided by Reed Electronics Research.
Outside the EU, we note that the percentage increase in electronics production is highest in
the non-ITA country Brazil, followed by four high-growth Asian production locations (In-
dia, Vietnam, China and Thailand), and with Mexico and Russia as number six and seven
measured on growth from 2005 to 2008 according to numbers collected by the OECD, cf.
Figure 3.3.
Figure 3.3 Growth in the value of electronics production, 2005-2008 in the rest of world
Source: OECD (2009), based on data provided by Reed Electronics Research.
-5
0
5
10
15
20
25
30
35
40
45
Percent per annum
-5
0
5
10
15
20
25Percent per annum

Expanding the Information Technology Agreement (ITA)
22
Value added in the ICT services sector9 increased as a share of business sector value added in
most OECD countries over the period 1996-2006, despite the downturn around 2001. The
ICT sector plays an important role in most developed economies, and contributes on average
with 8 percent of business sector value added across the OECD countries.
In many EU countries, the importance of the ICT sector is larger than the OECD-average.
In Finland, Ireland, Hungary, Sweden and the UK, the share of ICT in total business sector
value added is above 10 percent. Countries like Austria, Greece and Spain are well below av-
erage.
Figure 3.4 Share of ICT value added in the business sector value added, 1995 and 2006
Note: (1) 2005 instead of 2006. (2) 2004 instead of 2006. (4) ICT wholesale (5150) is not available. (5) Tele-
communication services (642) included Postal services. (6) Rental of ICT goods (7123) is not available. Source: OECD (2009).
Looking at ICT goods and ICT services separately shows that Korea, Finland, Japan, Hun-
gary and Ireland as the top production spots measured by their share of value added. Look-
ing at ICT service, some of the same EU countries also appear in top, but Asian countries
are much less reliant on ICT services. Ireland, Finland, United Kingdom, Sweden and the
Netherlands have high shares of ICT service in their value added.
9 The delineation of the ICT sector in the OECD approach is broader than just ITA-goods.
0
2
4
6
8
10
12
14
16
Per cent
2006 1995

Expanding the Information Technology Agreement (ITA)
23
Figure 3.5 Share of ICT valued added in business sector value added (manufacturing),
2006
Note: Labels are the percentage point changes in the share 1995-2006. (1) 2005 instead of 2006. (2) 2004 instead
of 2006. Source: OECD estimates, based on national sources; STAN and National Accounts databases, March 2008.
-1.5
-1.0
-0.3
1.2
-0.6
-2.4
0.0
0.2
-1.6
0.4
2.2
-1.1
1.0
0.4
-1.6
-2.3
-2.6
1.7
-2.7
7.8
0.2
11.4
5.1
0 5 10 15 20 25
Spain
Portugal (1)
Australia
Greece (1)
Belgium
Netherlands
Italy
Norway
Canada
Denmark
Czech Republic
France
Germany
Mexico (2)
Austria
United Kingdom (1)
United States
Sweden (1)
Ireland
Hungary
Japan
Finland
Korea
Per cent
Computer & Office Radio, TV, Communications Rest ICT manufacturing

Expanding the Information Technology Agreement (ITA)
24
Figure 3.6 Share of ICT valued added in business sector value added (services), 2006
Note: Labels are the percentage point change in the share 1995-2006. (1) 2005 instead of 2006. (2) 2004 instead
of 2006. (4) ICT wholesale (5150) is not available. (5) Telecommunication services (642) included Postal services. (6) Rental of ICT goods (7123) is not available.
Source: OECD estimates, based on national sources; STAN and National Accounts databases, March 2008.
A clear sign of the increasing globalisation of the electronics industry is found by comparing
the increase in trade with the increase in production. In Western Europe, production in-
creased 0.4 percent per year from 1996 to 2006 while trade grew at a rate of 6.7 percent in
the same period. In Eastern Europe the growth is much faster, but the pattern is the same.
Production increased at 16.8 percent per year and exports grew at 28.5 percent. The same
pattern is found in other parts of the world.
0.7
1.1
0.8
0.4
-0.6
-1.0
1.6
1.1
0.7
0.3
2.2
1.3
1.5
0.3
2.3
3.2
2.5
2.8
3.2
2.7
2.1
4.1
4.1
0 2 4 6 8 10 12 14
Mexico (2)
Japan (4)
Greece (1,4,5,6)
Austria
Germany (6)
Australia
Korea (6)
Spain
Portugal (1,6)
France
Italy
Canada
Denmark
United States
Belgium (6)
Czech Republic (4,6)
Norway
Hungary
Netherlands
Sweden (1)
United Kingdom (1)
Finland
Ireland
Per cent
Computer & related services Telecommunications Rest ICT services

Expanding the Information Technology Agreement (ITA)
25
Table 3.3 Growth in electronics goods production, trade and sales, 1995-2006
Electronic data processing equipment
Radio communications
Tele-communications Other Total
Western EuropeWestern EuropeWestern EuropeWestern Europe
Imports 6.6 17.5 6.0 5.2 6.8
Exports 5.5 15.5 3.3 5.5 6.5
Trade 6.2 16.4 4.6 5.3 6.7
Production -2.0 5.0 -3.7 0.9 0.4
Market 2.7 4.7 -2.2 1.4 1.9
Americas & AsiaAmericas & AsiaAmericas & AsiaAmericas & Asia----PacificPacificPacificPacific
Imports 7.2 14.0 7.4 6.6 7.3
Exports 5.1 14.3 3.3 5.9 6.1
Trade 6.1 14.2 5.2 6.2 6.7
Production 0.2 7.0 -3.6 1.8 1.7
Market 1.3 6.5 -1.7 1.8 2.1
Eastern EuropeEastern EuropeEastern EuropeEastern Europe
Imports 14.1 26.9 7.0 16.3 15.9
Exports 42.9 36.7 13.2 24.6 28.5
Trade 19.3 30.3 8.4 18.8 19.4
Production 23.9 25.9 8.4 13.9 16.8
Market 11.4 21.9 6.4 11.8 12.2
Emerging eEmerging eEmerging eEmerging economiesconomiesconomiesconomies
Imports 21.7 16.1 5.9 18.9 18.4
Exports 28.2 30.0 20.1 17.9 22.2
Trade 25.9 24.4 12.8 18.4 20.5
Production 26.8 27.4 17.4 14.8 20.2
Market 21.2 18.1 7.4 16.0 16.7
Note: Annual growth for Eastern Europe is given for 1995-2005. Source: OECD, based on data provided by Reed Electronics Research.
3.3. GLOBAL ICT FIRMS The OECD has identified the top 250 ICT firms globally, and has followed their perfor-mance since 2000 (see Box 3.1 below). The top 250 ICT firms employed some 12 million people worldwide in 2006 and generated total revenues of USD 3.375 billion, which grew to USD 3.790 billion in 2007. Employment in the top 250 ICT firms in 2006 in the OECD countries was equivalent to 70 percent of global ICT sector employment in 2006.

Expanding the Information Technology Agreement (ITA)
26
Box 3.1 OECD methodology used to compile top 250 ICT firms database Sources used to identify the top 250 ICT firms include the Business Week’s Information Technology 100, Software Magazine’s Top 50, Forbes 2000, Washington Post 200, Forbes Largest Private Firms, Top 100 Outsourcing, World Top 25 Semiconductors, and a number of other Internet listings. Having identified the candidates for a top 250 listing, details were sourced from the latest annual reports, Securities Exchange Commission 10K and 20F forms, directly from company financial reports and from various Internet investor sources, including Google Finance, Yahoo! Finance, and Reuter’s Multexinvestor. Details for private firms were sourced from the Forbes listing of the largest private firms and directly from company websites. ICT activities are those that “process, deliver, and display information electronically”. Hence, the ICT indus-tries are those that produce the equipment, software and services that enable those activities. The top 250 ICT firms are ranked by 2006 total revenues, the most recent comprehensive financial year re-ported at the time of writing in 2008.
Source: OECD (2009), summary of Box 1.1 page 30.
The 250 ICT firms’ R&D spending was on average around 6 percent of revenues in 2006, compared to an average of 3.8 percent for the top 1000 innovating firms across all sectors, cf. Jaruzelski and Dehoff (2007). Firms like Samsung, IBM, Nokia and Siemens each spent around USD 6 billion per year on R&D. Intel, Matsushita, Sony, Cisco Systems, Motorola and Ericsson spent between app. USD 4 billion and USD 6 billion on R&D per year. What is most notable when comparing development of the top 250 ICT over time is the rapid and remarkable emergence of major indigenous ICT firms from the BRICS countries (Brazil, Russia, India, China and South Africa) and elsewhere? The 2008 list of ICT firms counted several computer manufacturing firms from Taiwan and China. A new wave of global restructuring in the ICT-producing sectors is now clearly visible from the top 250 ICT list of firms. This was already noted in the 2006-edition of the OECD Information Technology Outlook.
The United States still holds the top position with 99 firms and 3.6 million employees in
2006. This is followed by Japan and the EU each with 40 firms.10 Taiwan is fourth on the
list if ranked by employment. Canada (8th) and Korea (9th) have more firms, but fewer em-
ployees. Hong Kong and China ranks 5th and 6th and India holds 7th place on employment
in the top250 firms in 2006.
There were fewer U.S.-based firms in the 2006-list than previous years, and there are more
firms from Asia as well as from countries as Brazil and South Africa. Regionally the Americas
accounted for 39 percent of revenues in the top 250-list, 36 percent of employment and 50
percent of the overall net profit. The firms based in the Asia-Pacific region accounted for 37
percent of revenues, 42 percent of employment and 27 percent of the overall net profit. Eu-
ropean-based firms accounted for 24 percent of revenues, 21 percent of employment and 20
percent of the overall net profit.
10 The 40 firms are from 15different Member States (Germany, France, United Kingdom, Spain, Netherlands, Finland, Sweden, Italy, Greece, Portugal, Belgium, Denmark, Austria, Hungary and Ireland).
Expanding the Information Technology Agreement (ITA)
27
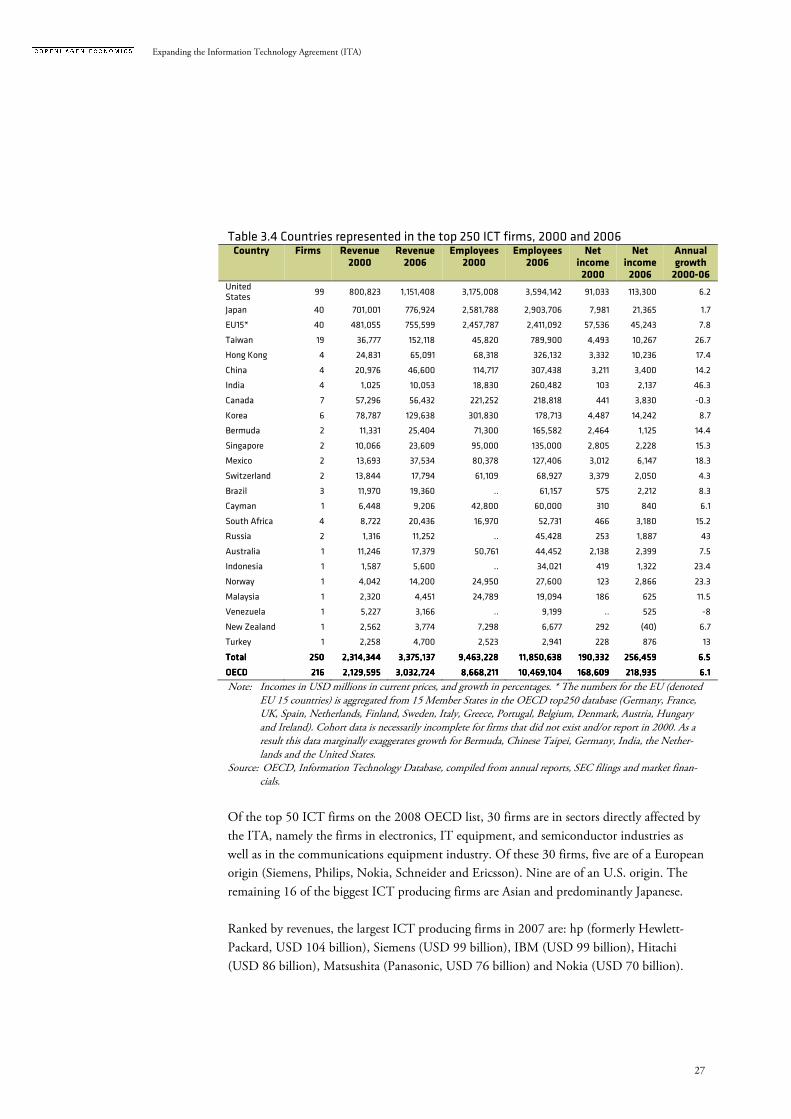
Table 3.4 Countries represented in the top 250 ICT firms, 2000 and 2006 Country Firms Revenue
2000 Revenue 2006
Employees 2000
Employees 2006
Net income 2000
Net income 2006
Annual growth 2000-06
United States
99 800,823 1,151,408 3,175,008 3,594,142 91,033 113,300 6.2
Japan 40 701,001 776,924 2,581,788 2,903,706 7,981 21,365 1.7
EU15* 40 481,055 755,599 2,457,787 2,411,092 57,536 45,243 7.8
Taiwan 19 36,777 152,118 45,820 789,900 4,493 10,267 26.7
Hong Kong 4 24,831 65,091 68,318 326,132 3,332 10,236 17.4
China 4 20,976 46,600 114,717 307,438 3,211 3,400 14.2
India 4 1,025 10,053 18,830 260,482 103 2,137 46.3
Canada 7 57,296 56,432 221,252 218,818 441 3,830 -0.3
Korea 6 78,787 129,638 301,830 178,713 4,487 14,242 8.7
Bermuda 2 11,331 25,404 71,300 165,582 2,464 1,125 14.4
Singapore 2 10,066 23,609 95,000 135,000 2,805 2,228 15.3
Mexico 2 13,693 37,534 80,378 127,406 3,012 6,147 18.3
Switzerland 2 13,844 17,794 61,109 68,927 3,379 2,050 4.3
Brazil 3 11,970 19,360 .. 61,157 575 2,212 8.3
Cayman 1 6,448 9,206 42,800 60,000 310 840 6.1
South Africa 4 8,722 20,436 16,970 52,731 466 3,180 15.2
Russia 2 1,316 11,252 .. 45,428 253 1,887 43
Australia 1 11,246 17,379 50,761 44,452 2,138 2,399 7.5
Indonesia 1 1,587 5,600 .. 34,021 419 1,322 23.4
Norway 1 4,042 14,200 24,950 27,600 123 2,866 23.3
Malaysia 1 2,320 4,451 24,789 19,094 186 625 11.5
Venezuela 1 5,227 3,166 .. 9,199 .. 525 -8
New Zealand 1 2,562 3,774 7,298 6,677 292 (40) 6.7
Turkey 1 2,258 4,700 2,523 2,941 228 876 13
TotalTotalTotalTotal 250250250250 2,314,3442,314,3442,314,3442,314,344 3,375,1373,375,1373,375,1373,375,137 9,463,2289,463,2289,463,2289,463,228 11,850,63811,850,63811,850,63811,850,638 190,332190,332190,332190,332 256,459256,459256,459256,459 6.56.56.56.5
OECDOECDOECDOECD 216216216216 2,129,5952,129,5952,129,5952,129,595 3,032,7243,032,7243,032,7243,032,724 8,668,2118,668,2118,668,2118,668,211 10,469,10410,469,10410,469,10410,469,104 168,609168,609168,609168,609 218,935218,935218,935218,935 6.16.16.16.1
Note: Incomes in USD millions in current prices, and growth in percentages. * The numbers for the EU (denoted EU 15 countries) is aggregated from 15 Member States in the OECD top250 database (Germany, France, UK, Spain, Netherlands, Finland, Sweden, Italy, Greece, Portugal, Belgium, Denmark, Austria, Hungary and Ireland). Cohort data is necessarily incomplete for firms that did not exist and/or report in 2000. As a result this data marginally exaggerates growth for Bermuda, Chinese Taipei, Germany, India, the Nether-lands and the United States.
Source: OECD, Information Technology Database, compiled from annual reports, SEC filings and market finan-cials.
Of the top 50 ICT firms on the 2008 OECD list, 30 firms are in sectors directly affected by
the ITA, namely the firms in electronics, IT equipment, and semiconductor industries as
well as in the communications equipment industry. Of these 30 firms, five are of a European
origin (Siemens, Philips, Nokia, Schneider and Ericsson). Nine are of an U.S. origin. The
remaining 16 of the biggest ICT producing firms are Asian and predominantly Japanese.
Ranked by revenues, the largest ICT producing firms in 2007 are: hp (formerly Hewlett-
Packard, USD 104 billion), Siemens (USD 99 billion), IBM (USD 99 billion), Hitachi
(USD 86 billion), Matsushita (Panasonic, USD 76 billion) and Nokia (USD 70 billion).

Expanding the Information Technology Agreement (ITA)
28
Table 3.5 Top 30 ICT firms ranked by employment in 2006 Firm Country Industry Revenue
2007 Employees
2006 R&D 2006
Net income 2006
Market cap 2007
1 Hitachi Japan Electronics 86,059 390,725 3,546 321 23,920
2 Hon Hai Precision Taiwan IT equipment 51,828 382,000 327 892 ..
3 Siemens Germany Electronics 99,108 371,000 6,312 3,823 116,630
4 IBM USA IT equipment 98,785 355,766 6,107 9,491 154,450
5 Matsushita Japan Electronics 76,488 328,645 4,854 1,327 38,850
6 Toshiba Japan IT equipment 59,761 165,000 3,197 672 ..
7 Sony Japan Electronics 69,665 163,000 4,675 1,062 49,560
8 Fujitsu Japan IT equipment 42,830 158,491 2,071 589 13,060
9 Hewlett-Packard USA IT equipment 104,286 156,000 3,591 6,198 129,370
10 NEC Japan IT equipment 39,072 154,000 167 104 9,620
11 Sumitomo Electric Japan Electronics 20,198 133,853 554 501 ..
12 Emerson Electric USA Electronics 22,572 127,800 356 1,845 36,290
13 Philips Electronics Netherlands Electronics 36,678 125,834 2,095 6,763 43,620
14 Canon Japan Electronics 38,055 120,976 2,650 3,913 69,220
15 Nokia Finland Com. equip. 69,895 109,871 4,896 2,992 121,100
16 Schneider Electric France Electronics 23,695 100,078 411 1,692 21,210
17 Mitsubishi Electric Japan Electronics 32,379 99,444 1,117 822 ..
18 Sanyo Electric Japan Electronics 19,387 94,906 1,070 (1,768) 2,890
19 Intel USA Semicon. 38,334 90,300 5,873 5,044 144,130
20 Samsung Electron. Korea Electronics 67,970 85,813 6,004 8,532 ..
21 Dell Computer USA IT equipment 57,420 82,800 458 3,602 63,110
22 Ricoh Japan Electronics 17,374 81,939 988 834 14,890
23 3M USA Electronics 24,462 75,333 1,522 3,851 62,180
24 Ericsson Sweden Com. equip. 27,788 67,500 3,787 3,537 59,800
25 Motorola USA Com. equip. 36,622 66,000 4,106 3,661 39,220
26 Cisco Systems USA Com. equip. 34,922 49,926 4,067 5,580 190,640
27 Sharp Japan Electronics 26,266 48,927 1,596 762 19,790
28 LG Electronics Korea Electronics 25,286 31,201 1,754 223 ..
29 Apple Inc USA IT equipment 24,006 17,787 712 1,989 109,910
30 ASUSTeK Computer Taiwan IT equipment 17,931 9,587 237 661 9,310
TotalTotalTotalTotal 2,387,3182,387,3182,387,3182,387,318 6,833,4826,833,4826,833,4826,833,482 93,74293,74293,74293,742 147,426147,426147,426147,426 3,301,8703,301,8703,301,8703,301,870
AverageAverageAverageAverage 47,74647,74647,74647,746 136,670136,670136,670136,670 1,8691,8691,8691,869 2,9492,9492,9492,949 66,02966,02966,02966,029
Note: USD millions in current prices. Firms in telecommunication services (e.g. Deutsche Telekom), software (Microsoft) and IT services (e.g. Accenture) are omitted from the list in order to focus on producers of ICT goods and equipment.
Source: OECD (2009), Information Technology Database, compiled from annual reports, SEC filings and market financials.
Taiwan accounts for 19 entries in the OECD list of the world’s top 250 ICT firms. Count-
ing by size rather than by numbers in the top 30, Taiwan stands out together with China, as
a strong hub for ICT manufacturing firms, cf. Box 3.2.
Taiwanese firms account for roughly 80 percent of the production of laptop/notebook com-
puters globally, 65 percent of scanners, 60 percent of monitors (including liquid crystal dis-
play panels), and 40 percent of network interface cards.
Expanding the Information Technology Agreement (ITA)
29
China is now the world’s largest exporter of ICT products after the United States. But it is
estimated that 40-80 percent of China’s computer hardware is produced in Taiwanese-
owned factories. Copenhagen Economics (2008) estimates that Taiwanese-owned firms and
subsidiaries are responsible for 10-20 percent of China’s exports to the EU.
Taiwan has a specific place in the value-added chain of ICT manufacturing production in
both final products and intermediary inputs. The majority of these ICT firms are either con-
tract manufacturers (so-called original equipment manufacturers, OEMs) like Hon Hai Pre-
cision (also known as Foxconn), Flextronics and Cellon, or specialised niche firms - com-
ponent manufacturers like customised chip foundries, processors or LED display makers.
Taiwanese companies are world leaders for laptops, wifi-routers, smartphones, personal digi-
tal assistants (PDAs), customised chip foundry services and finalised LCD monitors, all in
which Taiwan has more than two-thirds of global market share.
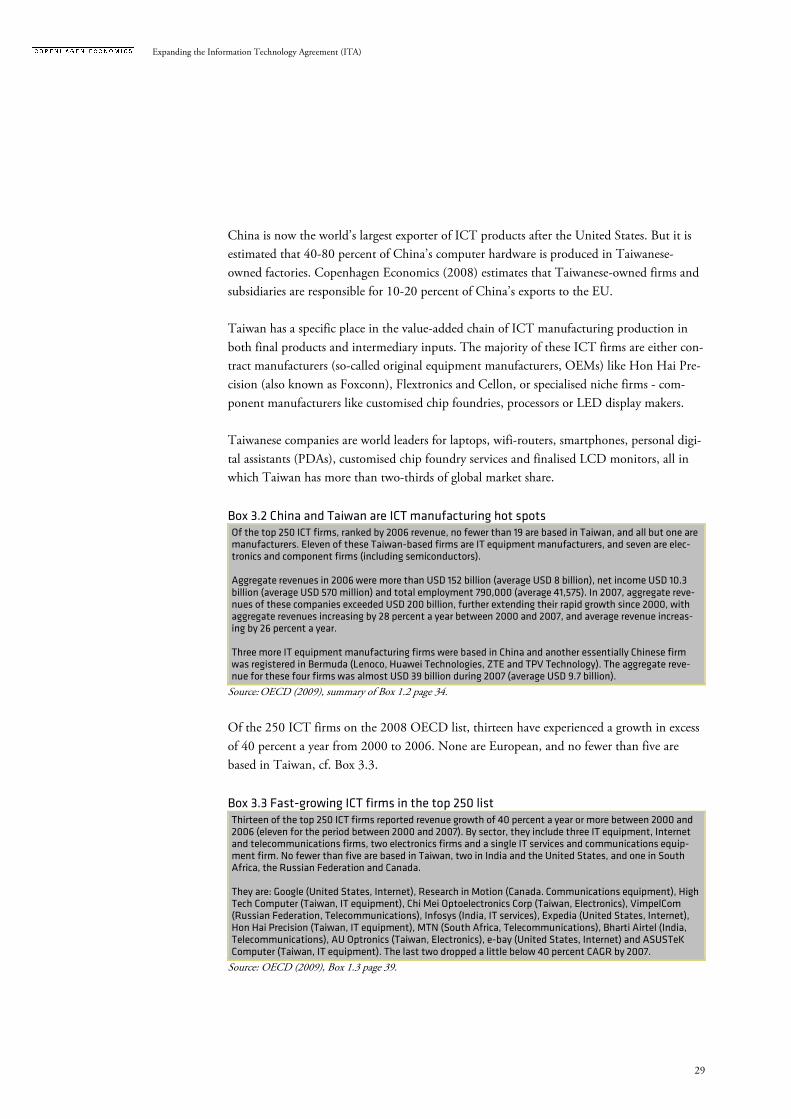
Box 3.2 China and Taiwan are ICT manufacturing hot spots Of the top 250 ICT firms, ranked by 2006 revenue, no fewer than 19 are based in Taiwan, and all but one are manufacturers. Eleven of these Taiwan-based firms are IT equipment manufacturers, and seven are elec-tronics and component firms (including semiconductors). Aggregate revenues in 2006 were more than USD 152 billion (average USD 8 billion), net income USD 10.3 billion (average USD 570 million) and total employment 790,000 (average 41,575). In 2007, aggregate reve-nues of these companies exceeded USD 200 billion, further extending their rapid growth since 2000, with aggregate revenues increasing by 28 percent a year between 2000 and 2007, and average revenue increas-ing by 26 percent a year. Three more IT equipment manufacturing firms were based in China and another essentially Chinese firm was registered in Bermuda (Lenoco, Huawei Technologies, ZTE and TPV Technology). The aggregate reve-nue for these four firms was almost USD 39 billion during 2007 (average USD 9.7 billion).
Source: OECD (2009), summary of Box 1.2 page 34.
Of the 250 ICT firms on the 2008 OECD list, thirteen have experienced a growth in excess
of 40 percent a year from 2000 to 2006. None are European, and no fewer than five are
based in Taiwan, cf. Box 3.3.
Box 3.3 Fast-growing ICT firms in the top 250 list Thirteen of the top 250 ICT firms reported revenue growth of 40 percent a year or more between 2000 and 2006 (eleven for the period between 2000 and 2007). By sector, they include three IT equipment, Internet and telecommunications firms, two electronics firms and a single IT services and communications equip-ment firm. No fewer than five are based in Taiwan, two in India and the United States, and one in South Africa, the Russian Federation and Canada. They are: Google (United States, Internet), Research in Motion (Canada. Communications equipment), High Tech Computer (Taiwan, IT equipment), Chi Mei Optoelectronics Corp (Taiwan, Electronics), VimpelCom (Russian Federation, Telecommunications), Infosys (India, IT services), Expedia (United States, Internet), Hon Hai Precision (Taiwan, IT equipment), MTN (South Africa, Telecommunications), Bharti Airtel (India, Telecommunications), AU Optronics (Taiwan, Electronics), e-bay (United States, Internet) and ASUSTeK Computer (Taiwan, IT equipment). The last two dropped a little below 40 percent CAGR by 2007.
Source: OECD (2009), Box 1.3 page 39.

Expanding the Information Technology Agreement (ITA)
30
3.4. INTRA-FIRM TRADE The ICT industry is one of the most globalised industries. Much of the production of ICT
goods is done by multinational firms with production and sales spread over the globe. Clear
evidence of this is the large and growing share of international trade in ICT goods that takes
place between related enterprises within the same firm, i.e. so-called intra-firm trade.
Few countries other than the US have good data on intra-firm trade. The point of a large
and increasing share of intra-firm trade in the ICT industry is therefore show using US data,
but much of the same pattern can be expected from European firms in the industry.
In 2006, intra-firm trade accounted for 41 percent of total US goods trade – 47 percent of
imports and 30 percent of exports. Intra-firm trade in the ICT manufacturing industries ac-
counted for more than 64 percent of US ICT goods imports and 37 percent of exports, cf.
Table 3.6 US intra-firm trade in ICT goods and services, 2006.
Table 3.6 US intra-firm trade in ICT goods and services, 2006
Total
imports
Related party trade Share
Total exports
Related party trade Share
All NAICS All NAICS All NAICS All NAICS 1 845 0531 845 0531 845 0531 845 053 862 657862 657862 657862 657 47%47%47%47% 929 486929 486929 486929 486 279 832279 832279 832279 832 30%30%30%30%
Computer equipment 83 928 55 347 66% 29 780 10 220 34%
Communication equipment 50 754 30 026 59% 14 995 3 303 22%
Audio & video equipment 46 778 29 169 62% 4 232 1 102 26%
Electronic components 75 042 49 743 66% 49 826 22 187 45%
Magnetic & optical media 4 758 3 043 64% 1 298 539 42%
ICT products 261 260 167 328 64% 100 131 37 351 37%
ICT share of total 14% 19% 11% 13%
All services All services All services All services 307 770307 770307 770307 770 71 16471 16471 16471 164 23%23%23%23% 404 327404 327404 327404 327 103 315103 315103 315103 315 26%26%26%26%
Computer & information services 11 092 8 000 72% 10 096 2 500 25%
ICT share of total 3.60% 11.20% 2.50% 2.40%
Note: USD millions and percentage shares. ICT sectors based on four-digit NAICS. ICT goods include imports for domestic consumption and domestic exports. ICT services include affiliated and total cross-border trade in computer and information services.
Source: OECD (2009), based on data from the US Bureau of Economic Analysis, Survey of Current Business.
3.5. TRADE IN INTERMEDIATE AND CAPITAL GOODS Another way of seeing the global value chain for ICT goods is to look at trade flows between
large world regions. The largest trade flow for current ITA goods is intra-Asian trade (€421
billion, or 34 percent of world trade in ITA goods). Asia’s share of intra-regional trade (Asia-
Asia trade) in its import is 82 percent – i.e. 82 percent of the imports of Asian countries is
from another Asian country. The second largest ITA trade flow in the world is intra-EU
trade (€222 billion or 18 percent of global ITA trade). The third largest ITA trade flow is
exports from Asia to North America (essentially U.S. and Canada), accounting for € 134 bil-
lion (or 11 percent of global ITA trade).

Expanding the Information Technology Agreement (ITA)
31
The share for EU exports in the imports into world regions vary substantially. The EU has
high shares of total import in non-EU European countries (73 percent are imported from
EU), Africa (64 percent) and the Middle East (56 percent). Across all import destinations,
the EU has a share of imports of 28 percent.
Table 3.7 Major trade flows between world regions, current ITA goods, 2007
Importer region
Exporter Africa Asia EU Latin Am.
Middle East
Non-EU Europe
North Am.
Ocea-nia
South Am. TotalTotalTotalTotal
Africa
314 46 179 2 69 2 28 9 7 658658658658
Asia
4,432 421,190 128,024 9,274 6,189 8,383 133,679 8,268 6,837 726,319726,319726,319726,319
EU
11,003 41,328 222,219 1,964 11,375 28,668 18,791 1,733 2,706 341,885341,885341,885341,885
Latin Am.
75 3,636 2,081 417 68 122 21,305 223 1,446 29,37429,37429,37429,374
Middle East
30 325 343 12 96 46 461 14 30 1,3791,3791,3791,379
Non-EU Europe
251 2,092 6,846 46 529 694 945 78 102 11,67011,67011,67011,670
North Am.
981 43,850 19,819 12,756 2,065 1,220 15,964 1,603 5,517 103,775103,775103,775103,775
Oceania
45 671 310 29 53 21 343 739 18 2,3092,3092,3092,309
South Am.
19 91 320 111 7 24 393 7 1,532 2,5112,5112,5112,511
Total (incl. intra-EU trade)
17,151 513,229 380,140 24,612 20,450 39,180 191,911 12,673 18,196 1,219,8801,219,8801,219,8801,219,880
Share of intra-regional imports
2% 82% 58% 2% 0% 2% 8% 6% 8%
EU share of imports
64% 8% 58% 8% 56% 73% 10% 14% 15% 28%28%28%28%
North Am. share of imports
6% 9% 5% 52% 10% 3% 8% 13% 30% 9%9%9%9%
Asia share of imports
26% 82% 34% 38% 30% 21% 70% 65% 38% 60%60%60%60%
Note: Flows are in million Euros. Trade flows according to geographical regions, except EU27. Data includes intra-EU trade.
Source: Own calculations based on Comtrade data.
We employ the United Nations Broad Economic Categories (BEC) classification scheme11 to
distinguish intermediate goods from finished goods. We use this to split the current ITA
goods into intermediate or final goods.
This shows that much of the Asian trade is intermediate products. 61 percent of Asia-Asia
ITA trade is in intermediate goods, compared to an average of 48 percent intermediate
goods over all, and 44 percent for intra-EU trade.
11 The United Nations Classification by Broad Economic Categories (BEC) classifies products into Intermediate goods, Consumption Goods and Capital Goods. http://unstats.un.org/unsd/class/.

Expanding the Information Technology Agreement (ITA)
Table 3.8 Share of m
Exporter
Africa
Asia
EU
Latin Am.
Middle East
Non-EU Europe
North Am.
Oceania
South Am.
TotalTotalTotalTotal
Note: Percent cludes intra
Source: Own calculations based on Comtrade data.
An illustrative example of the integration of the value chain can be seen by looking at the
components needed to
down into seven key segments.
competencies such as design, material science and labour intensive manufacturing
and after-sales repair activities are also important
Figure 3.7 The handset manufacturing value chain
Note: Handset reference design not shown.
Source: KPMG Analysis
The range of technology and manufacturing skill
volving a range of entities and manufacturing models.
of Materials (BOM) is made up of a few high
band, RF IC, Memory) make up 35 percent of the total BOM and the
counts for app. 15 percent according to CLSA analysis.
Expanding the Information Technology Agreement (ITA)
Share of major trade flows in intermediate goods, current ITA goods, 2007Importer region
Africa Asia EU Latin Am.
Middle East
Non-EU
Europe North Am.
33% 41% 79% 9% 8% 52% 62%
24% 61% 36% 59% 23% 22% 31%
40% 59% 44% 57% 28% 36% 43%
13% 73% 43% 56% 56% 27% 38%
69% 70% 62% 80% 47% 65% 69%
EU Europe 57% 47% 50% 52% 66% 54% 40%
35% 63% 40% 64% 32% 40% 49%
25% 59% 48% 78% 31% 29% 36%
29% 51% 53% 44% 56% 49% 25%
35%35%35%35% 61%61%61%61% 41%41%41%41% 61%61%61%61% 28%28%28%28% 33%33%33%33% 34%34%34%34%
of total. Trade flows according to geographical regions, apart from the EU which is EUcludes intra-EU trade. Own calculations based on Comtrade data.
illustrative example of the integration of the value chain can be seen by looking at the
components needed to produce a mobile phone. Handset manufacturing can be broken
down into seven key segments. The handset value chain involves diverse technologies an
competencies such as design, material science and labour intensive manufacturing
sales repair activities are also important
The handset manufacturing value chain
Handset reference design - a critical element of the handset value chain, is also part of the value chain, but not shown. KPMG Analysis
The range of technology and manufacturing skill-sets has led to a complex supply chain i
volving a range of entities and manufacturing models. Up to 50 percent of the Handset Bill
of Materials (BOM) is made up of a few high-value components. Semiconductor ICs (
band, RF IC, Memory) make up 35 percent of the total BOM and the
counts for app. 15 percent according to CLSA analysis.
32
intermediate goods, current ITA goods, 2007
North Am. Oceania
South Am. TotalTotalTotalTotal
62% 55% 38% 45%45%45%45%
31% 20% 49% 50%50%50%50%
43% 50% 51% 44%44%44%44%
38% 33% 7% 41%41%41%41%
69% 78% 75% 66%66%66%66%
40% 33% 33% 50%50%50%50%
49% 32% 35% 54%54%54%54%
36% 46% 29% 46%46%46%46%
25% 55% 20% 28%28%28%28%
34%34%34%34% 27%27%27%27% 39%39%39%39% 48%48%48%48%
, apart from the EU which is EU27. Data in-
illustrative example of the integration of the value chain can be seen by looking at the
Handset manufacturing can be broken
The handset value chain involves diverse technologies and
competencies such as design, material science and labour intensive manufacturing. Testing
also part of the value chain, but
sets has led to a complex supply chain in-
Up to 50 percent of the Handset Bill
Semiconductor ICs (Base-
band, RF IC, Memory) make up 35 percent of the total BOM and the TFT-LCD screen ac-

Expanding the Information Technology Agreement (ITA)
33
Each of the components is typically produced at the location best able to produce that com-
ponent, and that means that a lot of trade takes place in intermediate goods in the ICT sec-
tor, cf. Figure 3.8
Figure 3.8 Different localization for production of each value chain segment
Note: ^ Typical scale of investment for a component manufacturing unit by global component manufacturers in the category.
Source: KPMG analysis.
It is the handset OEM who is the key decision maker regarding handset manufacturing loca-
tion. OEMs set up a manufacturing base in a country, and are accompanied by their key
component suppliers. An example is the Beijing Nokia cluster. The Nokia Beijing cluster has
a capacity to manufacture 25 to 30 million handsets per year and employs 10,000 people.
The Beijing Nokia cluster consists of:
� Elcoteq (EMS)
� Allgon (antenna)
� RF Micro Devices (power modules)
� Sanyo (batteries)
� Beijing GKI (subsidiary of Elcoteq/ PCB assemblies)
� Ibiden Energy (power modules)
� Foxconn (plastics)
� Savcor Coatings
� Perlos (precision metal parts)
Electronics component manufacturing is driven primarily by economies of scale. As wit-
nessed in China and Brazil, component manufacturers follow-source OEMs to electronics
manufacturing locations.
Component/ Process
% of BOM
Capital Investment^
Technology/ Manufacturing
Global Industry Application Key Drivers for Localization
Semiconductor ICs
34% ~ USD 1-2 Bn Wafer fabs sub-micron capability
Foundries in Taiwan and China
Across all electronics
R&D design skills
Passive Components
8% ~ USD 100 Mn R&D –materials; Miniaturization
Specialist vendors in Japan and Europe
Across all electronics
-
PCB BoardPCB Assembly
6% +Conver-
sion
~ USD 10 Mn SMT lines with BGA capability
Specialist FPCB vendors; SMT lines widely distributed
Across all electronics
SMT lines fungible; Labour arbitrage
Modular Components
24% Component specific
System Level Packaging (SLP)
Specialist vendors for LCD, antenna etc
Some alternate apps
-
User Interface Battery
21% ~ USD 10 Mn Various; Tech not a bottleneck
Large base in key manf. locations
Specific to handsets
Labour arbitrage
Plastic Parts 5% ~ USD 10 Mn Precision plastic molding and die
Specialist vendor base for some parts
Wide App. Enables market customization
Box Build Labour ~ USD 1 Mn - Located in lowest cost locations
Wide App. Significant labour arbitrage
2
3
6
5
1
4

Expanding the Information Technology Agreement (ITA)
34
3.6. CHINESE EXPORTS IS SPECIALISED IN LOW PRICE PRODUCTS Is the increasing trade with Asia good or bad for Europe and the US? Research from the Pe-terson Institute for International Economics, see Edwards and Lawrence (2010), finds that export unit values of developed and developing countries of particularly ICT and electronics products differ widely. This shows that there are distinctive patterns of international speciali-zation and that developed and developing countries export fundamentally different products, especially those classified as high tech. Judged by export shares, the United States and devel-oping countries specialise in quite different product categories that, for the most part, do not overlap. Moreover, even when exports are classified in the same category, there are large and system-atic differences in unit values that suggest the products made by developed and developing countries are not very close substitutes-----developed country products are far more sophisti-cated. This finding has important implications. While measures of across product specialization suggest China and other Asian economies have been moving into high-tech exports, the within-product unit value measures indicate they are doing so in the least sophisticated mar-ket segments and the gap in unit values between their exports and those of developed coun-tries has not narrowed over time. Edwards and Lawrence (2010) have assembled six-digit NAICS data for Chinese imports to the United States, high-income OECD imports to the United States, and US exports for 2006. They then rank these according to their share in US imports from China in 2006, and report the top 50 industries, which accounted for about 58 percent of all US-manufactured imports from China. They show that a high degree of international specialization in trade flows suggests that manufactured goods produced and exported by the United States and other developed countries are very different from those exported by the developing countries in general and China in particular.
Since the EU is similar to the United States in many respects regarding imports from China, it may be possible that the results could apply equally well to the EU. Table 3.9 shows a selection of the data for ITA-relevant products as presented by Edwards and Lawrence (2010). There is only one instance where the Chinese price exceeds that of the United State (Printed circuit assembly (electronic)) and none where it exceeds that of the OECD. Such vast differences in prices suggest that China exports very different products than those exported by high-income OECD countries and the United States. Especially the difference in the price of Office machinery (333313) and telephone apparatus (334210) is remarkable.

Expanding the Information Technology Agreement (ITA)
35
Table 3.9 Prices and relative prices of a selection of Chinese export industries in 2006
Chinese price relative
to:
NAICS code Description China
High-income OECD
US exports
High-income OECD
US exports
334111 Electronic computer 652 1,901 2,49 0.34 0.26
334119 Other computer peripheral equipment 113 508 907 0.22 0.12
334220 Radio, TV broadcasting, and wireless equipment 96 164 493 0.58 0.19
333313 Office machinery 84 1,939 757 0.04 0.11
334112 Computer storage device 35 211 1,495 0.17 0.02
334418 Printed circuit assembly (electronic) 30 58 28 0.52 1.08
334210 Telephone apparatus 39 365 963 0.11 0.04
334413 Semiconductor and related device 2 4 3 0.56 0.82
332510 Hardware 4 8 10 0.46 0.42
Note: All units are in numbers (NO) except 332510 which is in kilograms (KG). Source: Edwards and Lawrence (2010). The large differences in prices which are found are indicative of a high degree of specialisa-tion. US imports from developing countries are not close substitutes for US exports or US imports from OECD countries. This explains both why the US terms of trade have im-proved as developing countries have expanded their exports and why the wages of unskilled US workers have not experienced the downward pressures that would have been expected if they were still producing goods that were similar to those made by developing countries. The same must be expected to be the case in a comparison between developing countries and the EU.
3.7. FDI IN ICT In 2007 about one-fifth of all cross-border mergers and acquisitions were ICT-related (USD
170 billion) according to OECD Information Technology Outlook, OECD (2009). Such
deals have been increasingly targeting and originating in non-OECD countries, with coun-
tries in the BRICS particularly active. There has been a considerable slowdown in 2008 fol-
lowing the general slowdown in the global economy.
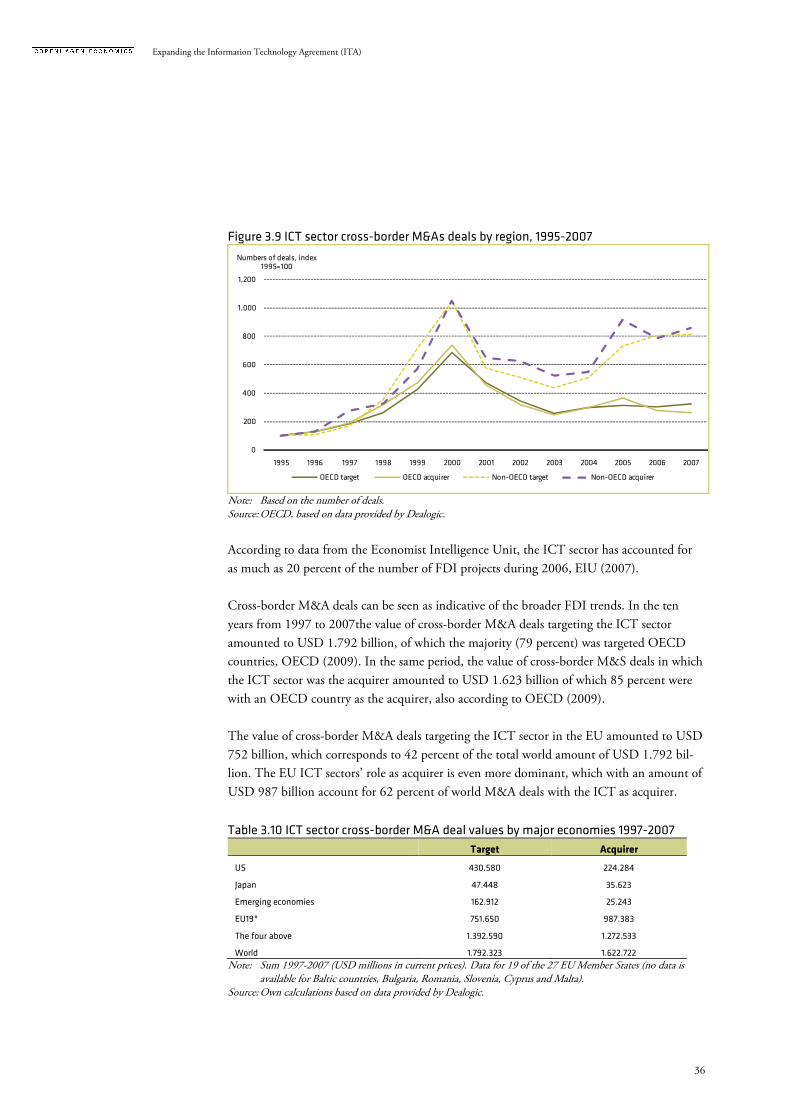
Expanding the Information Technology Agreement (ITA)
36
Figure 3.9 ICT sector cross-border M&As deals by region, 1995-2007
Note: Based on the number of deals. Source: OECD, based on data provided by Dealogic.
According to data from the Economist Intelligence Unit, the ICT sector has accounted for
as much as 20 percent of the number of FDI projects during 2006, EIU (2007).
Cross-border M&A deals can be seen as indicative of the broader FDI trends. In the ten
years from 1997 to 2007the value of cross-border M&A deals targeting the ICT sector
amounted to USD 1.792 billion, of which the majority (79 percent) was targeted OECD
countries, OECD (2009). In the same period, the value of cross-border M&S deals in which
the ICT sector was the acquirer amounted to USD 1.623 billion of which 85 percent were
with an OECD country as the acquirer, also according to OECD (2009).
The value of cross-border M&A deals targeting the ICT sector in the EU amounted to USD
752 billion, which corresponds to 42 percent of the total world amount of USD 1.792 bil-
lion. The EU ICT sectors’ role as acquirer is even more dominant, which with an amount of
USD 987 billion account for 62 percent of world M&A deals with the ICT as acquirer.
Table 3.10 ICT sector cross-border M&A deal values by major economies 1997-2007
Target Acquirer
US 430.580 224.284
Japan 47.448 35.623
Emerging economies 162.912 25.243
EU19* 751.650 987.383
The four above 1.392.590 1.272.533
World 1.792.323 1.622.722
Note: Sum 1997-2007 (USD millions in current prices). Data for 19 of the 27 EU Member States (no data is available for Baltic countries, Bulgaria, Romania, Slovenia, Cyprus and Malta).
Source: Own calculations based on data provided by Dealogic.
0
200
400
600
800
1,000
1,200
1995 1996 1997 1998 1999 2000 2001 2002 2003 2004 2005 2006 2007
Numbers of deals, index 1995=100
OECD target OECD acquirer Non-OECD target Non-OECD acquirer

Expanding the Information Technology Agreement (ITA)
This is also reflected in the
wards deals as the Americas and also the highest number of outwards deals, as shown in
ure 3.10.
Figure 3.10
Note: Total deals including intraSource: OECD, based on data provided by Dealogic.
As a result of the increase in FDI and
years, the share of production taking place at foreign affiliates naturally goes up too. This d
velopment is not unique to the ICT sector, but the global integration of the value chain is
stronger in th
Foreign affiliates typically accounts for between 25 percent and 50 percent
industry turnover in OECD countries, ranging from a low of around 3 percent in Japan to
as high as 70 percent in the Slovak Republic, a
Foreign affiliates’ shares in the ICT industry are often higher than for manufacturing as a
whole. Their share of computer equipment manufacturing turnover exceeds 90 percent in
Ireland and the Czech Republic, and is between 45 a
France, Finland and the UK, cf.
border ownership, which can be assumed to dom
Foreign affiliates’ shares in the telecommunications equipment industry turnover exceeds 80
percent in Hungary, Slovak Republic, Poland and the Czech Republic, and is between 50
12 Data excluding intr
Expanding the Information Technology Agreement (ITA)
This is also reflected in the number of deals with Europe accounting for double as many i
wards deals as the Americas and also the highest number of outwards deals, as shown in
10 ICT sector cross-border M&As deals by region, 1997-2007
Total deals including intra-regional deals. OECD, based on data provided by Dealogic.
As a result of the increase in FDI and cross-border M&A deals in the ICT sector the last ten
years, the share of production taking place at foreign affiliates naturally goes up too. This d
velopment is not unique to the ICT sector, but the global integration of the value chain is
stronger in than in most other sectors.
Foreign affiliates typically accounts for between 25 percent and 50 percent
industry turnover in OECD countries, ranging from a low of around 3 percent in Japan to
as high as 70 percent in the Slovak Republic, according to OECD (2009).
Foreign affiliates’ shares in the ICT industry are often higher than for manufacturing as a
whole. Their share of computer equipment manufacturing turnover exceeds 90 percent in
Ireland and the Czech Republic, and is between 45 and 70 percent in Germany, Hungary,
France, Finland and the UK, cf. Figure 3.11. These high shares include intra
border ownership, which can be assumed to dominate.12
Foreign affiliates’ shares in the telecommunications equipment industry turnover exceeds 80
percent in Hungary, Slovak Republic, Poland and the Czech Republic, and is between 50
Data excluding intra-EU ownership is not available.
37
number of deals with Europe accounting for double as many in-
wards deals as the Americas and also the highest number of outwards deals, as shown in Fig-
2007
border M&A deals in the ICT sector the last ten
years, the share of production taking place at foreign affiliates naturally goes up too. This de-
velopment is not unique to the ICT sector, but the global integration of the value chain is
Foreign affiliates typically accounts for between 25 percent and 50 percent of manufacturing
industry turnover in OECD countries, ranging from a low of around 3 percent in Japan to
ccording to OECD (2009).
Foreign affiliates’ shares in the ICT industry are often higher than for manufacturing as a
whole. Their share of computer equipment manufacturing turnover exceeds 90 percent in
nd 70 percent in Germany, Hungary,
. These high shares include intra-EU cross-
Foreign affiliates’ shares in the telecommunications equipment industry turnover exceeds 80
percent in Hungary, Slovak Republic, Poland and the Czech Republic, and is between 50
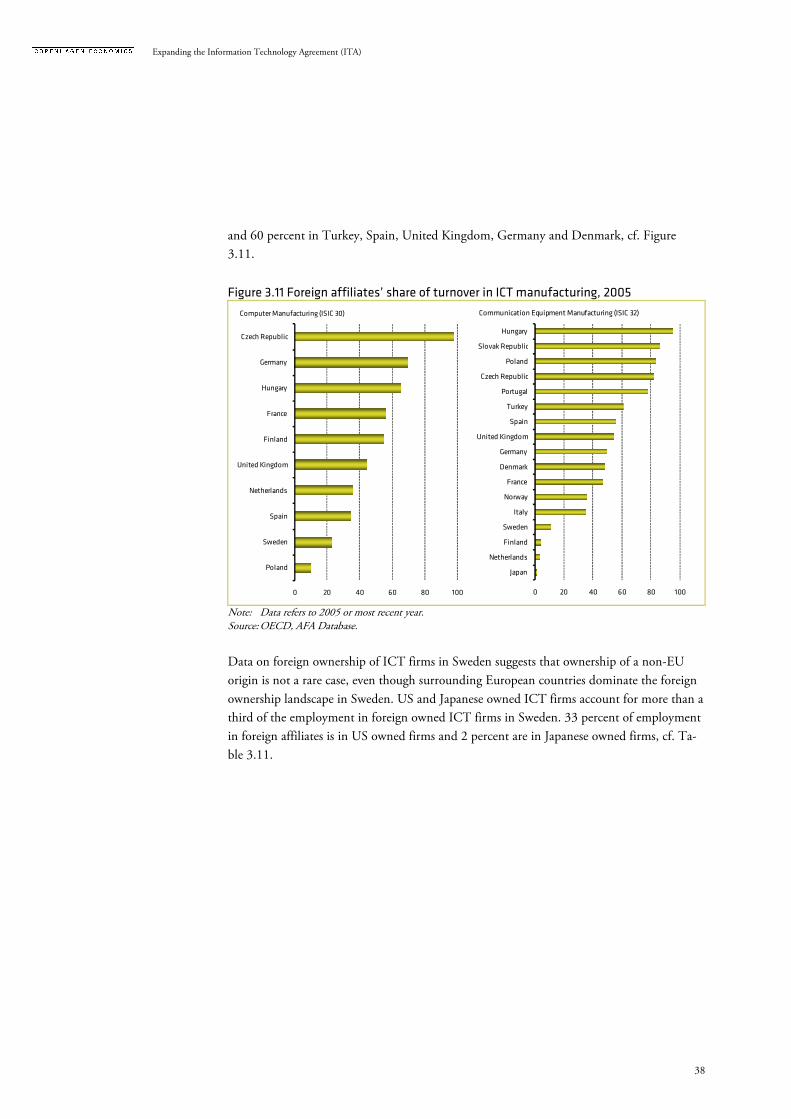
Expanding the Information Technology Agreement (ITA)
38
and 60 percent in Turkey, Spain, United Kingdom, Germany and Denmark, cf. Figure
3.11.
Figure 3.11 Foreign affiliates’ share of turnover in ICT manufacturing, 2005
Note: Data refers to 2005 or most recent year. Source: OECD, AFA Database.
Data on foreign ownership of ICT firms in Sweden suggests that ownership of a non-EU
origin is not a rare case, even though surrounding European countries dominate the foreign
ownership landscape in Sweden. US and Japanese owned ICT firms account for more than a
third of the employment in foreign owned ICT firms in Sweden. 33 percent of employment
in foreign affiliates is in US owned firms and 2 percent are in Japanese owned firms, cf. Ta-
ble 3.11.
0 20 40 60 80 100
Poland
Sweden
Spain
Netherlands
United Kingdom
Finland
France
Hungary
Germany
Czech Republic
Computer Manufacturing (ISIC 30)
0 20 40 60 80 100
Japan
Netherlands
Finland
Sweden
Italy
Norway
France
Denmark
Germany
United Kingdom
Spain
Turkey
Portugal
Czech Republic
Poland
Slovak Republic
Hungary
Communication Equipment Manufacturing (ISIC 32)
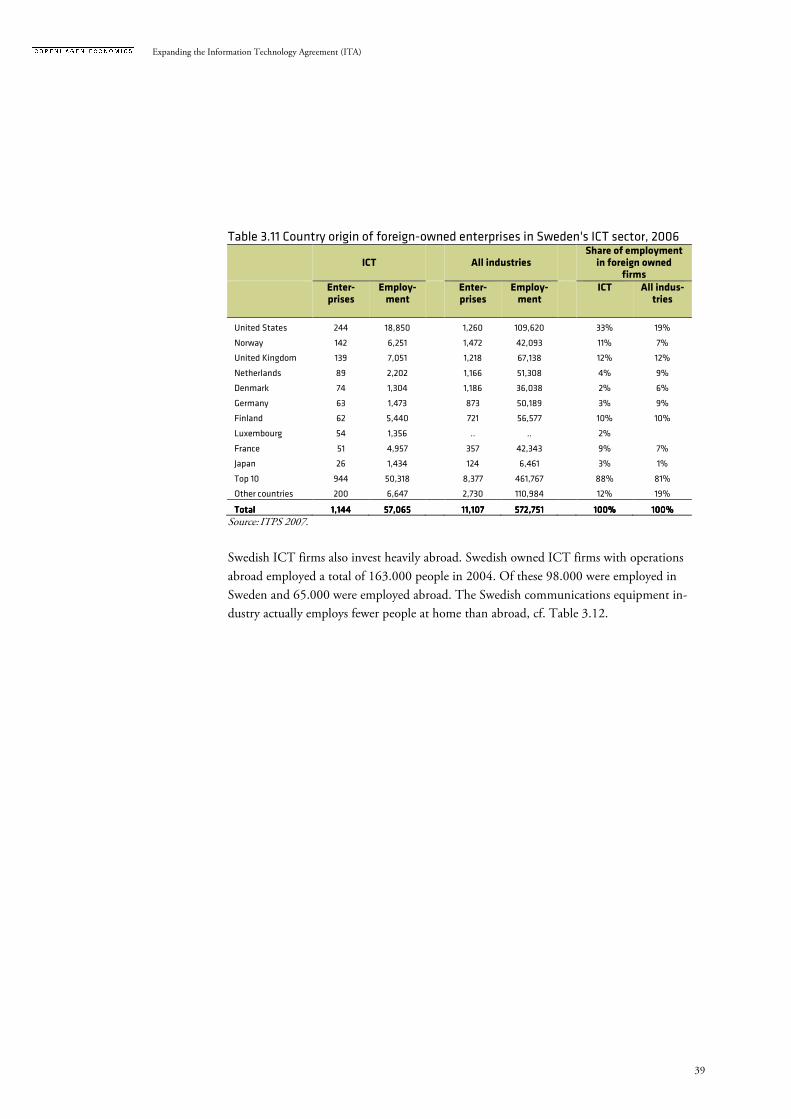
Expanding the Information Technology Agreement (ITA)
39
Table 3.11 Country origin of foreign-owned enterprises in Sweden's ICT sector, 2006
ICT
All industries Share of employment
in foreign owned firms
Enter-prises
Employ-ment
Enter-prises
Employ-ment
ICT All indus-tries
United States 244 18,850 1,260 109,620 33% 19%
Norway 142 6,251 1,472 42,093 11% 7%
United Kingdom 139 7,051 1,218 67,138 12% 12%
Netherlands 89 2,202 1,166 51,308 4% 9%
Denmark 74 1,304 1,186 36,038 2% 6%
Germany 63 1,473 873 50,189 3% 9%
Finland 62 5,440 721 56,577 10% 10%
Luxembourg 54 1,356 .. .. 2%
France 51 4,957 357 42,343 9% 7%
Japan 26 1,434 124 6,461 3% 1%
Top 10 944 50,318 8,377 461,767 88% 81%
Other countries 200 6,647 2,730 110,984 12% 19%
TotalTotalTotalTotal 1,1441,1441,1441,144 57,06557,06557,06557,065 11,10711,10711,10711,107 572,751572,751572,751572,751 100%100%100%100% 100%100%100%100%
Source: ITPS 2007.
Swedish ICT firms also invest heavily abroad. Swedish owned ICT firms with operations
abroad employed a total of 163.000 people in 2004. Of these 98.000 were employed in
Sweden and 65.000 were employed abroad. The Swedish communications equipment in-
dustry actually employs fewer people at home than abroad, cf. Table 3.12.

Expanding the Information Technology Agreement (ITA)
40
Table 3.12 Swedish-owned ICT sector enterprises operating overseas, 2004 Enterprises Employees Industry share Location shares
TotalTotalTotalTotal
ICT equipment manufacturing 11 58.401 4
Office machinery 4 3.471 0.2
Communication equipment 7 54.930 3.8
ICT services 69 104.907 7.3
Communications & post 5 74.761 5.2
Computer & related services 64 30.146 2.1
Total ICT 80 163.308 11.3
All industries 856 1.446.294 100
AbroadAbroadAbroadAbroad
ICT equipment manufacturing 33.970 3.6 58.2
Office machinery 1.993 0.2 57.4
Communication equipment 31.977 3.4 58.2
ICT services 30.696 3.2 29.3
Communications & post 17.725 1.9 23.7
Computer & related services 12.971 1.4 43
Total ICT 64.666 6.8 39.6
All industries 953.635 100 65.9
SwedenSwedenSwedenSweden
ICT equipment manufacturing 24.431 5 41.8
Office machinery 1.478 0.3 42.6
Communication equipment 22.953 4.7 41.8
ICT services 74.211 15.1 70.7
Communications & post 57.036 11.6 76.3
Computer & related services 17.175 3.5 57.0
Total ICT 98.642 20 60.4
All industries 492.659 100 34.1
Source: ITPS 2007.
3.8. CONCLUSION All in all, the review of the top 250 firms shows a picture of an industry with the centre of
gravity moving to Asia. At the same time it also shows a picture of an industry with many
large multinational firms, with presence in many countries. This means that ICT firms of a
European origin have spread their production system around the globe according to where
the best mix of cost and quality is found. As a consequence, what is registered a trade from
Asia to Europe main contain a large share of goods produced on contract in China for a
European based firm, e.g. Nokia. Furthermore, analyses of unit prices shows large differ-
ences, indicating that EU and Asian products may not be in direct competition.
The information technology industry is an industry depending on research and innovation
in order to improve the products and services delivered to consumers. Because of the reliance
on R&D as main input, the industry uses patenting and other means to protect the intellec-
tual property rights related to its products.
The industry is also characterised by short product cycles and with a high pace of innova-
tion. There are differences in the length of product cycles within the industry ranging from

Expanding the Information Technology Agreement (ITA)
41
short (e.g. mobile phones) to medium term (e.g. MR scanners), but compared to many other
industries this is an industry with short cycles with vibrant competition based on both price
and innovation.
Many parts of the information technology industry is characterised by competition between
a small number of large global firms. There are typically five to ten global competitors
within each segment, e.g. mobile phone producers or MR-scanner manufactures. They are
competing on price in the short term, and on innovation in the long term. The products
produced by the firms in each segment of the industry are differentiated from each other and
are close albeit not perfect substitutes, and as a consequence, each producer has some tempo-
rary market power to set prices above marginal costs (this type of competition is called mo-
nopolistic competition). An example is the market for mobile phones. The market for medi-
cal devices is more or less similar in this respect.
For the consumers, these products deliver great value in terms of better productivity and
other benefits. The use of these products must often be bundled with other products and
services to deliver value. A mobile phone needs to be bundled with a communications sub-
scription to deliver value to the busy business man. An MR-scanner needs to be coupled
with a trained doctor or nurse to deliver value to the patients in need, and a laptop computer
needs to be filled with software and connected to the internet to provide value to the con-
sultant needing to deliver a report on time.
Since information technology products have become an essential input in almost all lines of
business, without which companies would lose significant advantages, and since the products
are differentiated and usually bundled with other goods and services to deliver value to con-
sumers, their price is one amongst many parameter determining the demand for these prod-
ucts. As a consequence demand for end-user information technology products is not ex-
tremely sensitive to price changes.
Another characteristic of the industry is that production costs for an additional unit of a cer-
tain IT product is well below the selling price once the initial investment in the product de-
velopment has been paid for. This implies that, within the same product cycle, marginal
production costs are low and producers will respond rapidly to price changes and increase ei-
ther price or output. Since consumers are generally not very responsive to price changes,
producers would tend to increase prices when demand goes up.
In the longer term, however, producers compete on innovation, and the temporary price in-
creases that can be upheld during peaks in demand will be flattened by new entrants or new
innovations from competing firms, and in the medium to long-term few producers can sus-
tain prices above the long run average costs in the industry (including the investment in
R&D in order to stay competitive over several product cycles).

Expanding the Information Technology Agreement (ITA)
42
In this chapter we assess the trade and economic impacts from extending the country cover-
age of the ITA, but without changing the product coverage. The analysis is thus based on
the list of products covered by the existing ITA. Using a partial equilibrium model covering
global trade in current ITA products, we analyse the impact of extending the ITA member-
ship to include more countries.
Concretely, we analyse a scenario in which we include six countries, namely Brazil, Argen-
tina, Mexico, Chile, South Africa and Russia as new ITA members. The first five are WTO
members, and they are large growing traders of ITA products, but currently not being mem-
bers of the ITA. Mexico, Chile and South Africa have no tariffs on EU exports of ITA goods
(either because of EU’s FTAs or because of general tariff reductions), and are de facto already duty free like other ITA members. As WTO members, Brazil and Argentina enjoy the bene-
fits of being able to export duty free to all ITA members, while maintaining existing, and
sometimes high tariffs on the ITA goods they import from the current ITA members.
We also analyse the impact of including Russia in the ITA, even though Russia is not yet a
WTO member. The presumption is that Russia’s WTO accession would be subject to Rus-
sian ITA-membership.13 We assume that Russia’s inclusion in the ITA is on same conditions
as for other WTO members, namely that Russia’s tariff reductions are extended to all WTO
members, including the remaining non-ITA WTO countries.
Thus in this chapter we quantify the impact of an extension of the ITA in the country di-
mension, while keeping the product coverage as in the current ITA. This implies reducing
existing tariffs to zero for all bilateral trade between new and current ITA countries as well as
extending MFN duty free access to the few remaining non-ITA WTO countries for all new
members of the ITA.
We find that there is a small global welfare effect of extending the ITA to cover Argentina,
Brazil, Chile, Mexico, Russia and South Africa. It is mainly the non-EU ITA countries that
benefit from the extension since the EU has already negotiated low tariffs with some these
partners through bilateral FTAs (Mexico, Chile and South Africa). Regarding possible future
impacts of including Argentina and Brazil in the ITA, it should be noted that tariff reduc-
tions on ITA goods imported from the EU to these countries would also be part of any ne-
gotiations between the EU and Mercosur. European owned companies exporting to current
non-ITA members from locations outside Europe without FTAs with these countries may
benefit from the inclusion of more countries under the ITA.
4.1. CURRENT TRADE WITH CANDIDATES FOR INCLUSION Amongst the countries outside the ITA, Mexico is by far the biggest exporter with €26.7 bil-
lion, cf. Table 4.1. Most of this export, however, is to NAFTA partners, the United States
13 Russia can in principle join the ITA prior to joining the WTO as did Saudi Arabia and Taiwan.
Chapter 4 INCLUDING MORE COUNTRIES IN THE ITA

Expanding the Information Technology Agreement (ITA)
43
(€18.6 billion) and Canada (€1.8 billion). Brazil, Russia and South Africa follow as the sec-
ond group of exporters of ITA goods, but the value of their export is small (the value of Bra-
zil’s export of ITA goods is similar to the extra-EU exports by some of the smaller Member
States like the Czech Republic, Portugal or Denmark).
Table 4.1 Export from non-ITA members by destination
ITA importers Non-ITA importers Non-WTO importers Grand total
Mexico 25,042 1,584 34 26,660
Brazil 785 1,327 3 2,115
Russia 699 29 279 1,007
South Africa 331 253 59 643
Argentina 58 106 1 164
Serbia 75 6 67 148
Colombia 45 64 2 111
Chile 44 59 1 104
Other 83 45 21 148
Note: Table shows global trade in ITA products. The first column shows imports by ITA members. The second column shows the import by non-ITA WTO members and the third column shows imports by non-WTO countries. Data is in million Euros, 2007.
Source: Own calculation based on Comtrade data.
Our scenario includes Russia, Mexico, Argentina, Brazil, South Africa and Chile in the
agreement. The inclusion increases the coverage of the ITA by €37 billion which would in-
crease the total coverage of the expanded ITA to €1.18 trillion.
EU trade with proposed new ITA countries
The EU27 is currently exporting around €120 billion worth of ITA products. Three fourth
(75 percent) of EU’s export (value of €90 billion) of ITA goods is to other ITA members,
while the rest is to both WTO members and to non-WTO members, cf. Figure 4.1.
The EU27 is currently importing more than €158 billion worth of ITA products. Almost all
(98 percent) of EU’s import (value of €155 billion) of ITA goods is imported from other
ITA members, while a small share (2 percent) is from non-ITA members.

Expanding the Information Technology Agreement (ITA)
44
Figure 4.1 EU ITA trade with non-EU countries
Note: Data is in billion Euros and is converted into Euros using an exchange rate against the US equal to 0.77.
Data excludes intra-EU trade. Source: Own calculations based on Comtrade data for 2007.
EU exports to countries that are WTO members, but not ITA members totalled €14 billion
in 2007, cf. Table 4.2. South Africa was the largest non-ITA destination for EU export with
over €3 billion worth of exports. This is followed by Brazil (€1.2 billion) and Mexico (€1.0
billion). Argentina, which is a non-ITA member, is only the 11th largest non-ITA destination
for European ITA exports. Russia is the largest non-ITA market for European exports of
ITA with an export amounting to €8.9 billion.
0
20
40
60
80
100
120
140
160
EU Export EU Importer
120
ITA
ITA
158
155
90

Expanding the Information Technology Agreement (ITA)
45
Table 4.2 EU exports to non-ITA WTO members Importer Value of EU ITA exports
South Africa 3,030
Brazil 1,242
Mexico 1,095
Nigeria 1,058
Tunisia 903
Pakistan 737
Kuwait 480
Qatar 468
Venezuela 312
Bangladesh 305
Argentina 299
Chile 269
Kenya 268
Angola 262
Colombia 261
Other Non-ITA members 2,543
TTTTotalotalotalotal EU exports to EU exports to EU exports to EU exports to nnnnonononon----ITAITAITAITA WTO membersWTO membersWTO membersWTO members 13,5313,5313,5313,533333
Note: The table includes WTO members only. Data is in million Euros. Source: Own calculations based on Comtrade data for 2007.
EU exports to the six countries under consideration amounted to €14.8 billion in 2007 of
which electrical machinery and equipment (heading 85) is the largest product group, cf. Ta-
ble 4.3. EU import of ITA goods from these countries is much lower with a total of €2.6 bil-
lion worth of imports. Also here, products in group 85 are dominating. We note that export
to Argentina and Brazil only constitute around 10 percent of total EU export to the six
countries (€1.5 billion out of €14.8 billion). As we will see in the next section, Argentina
and Brazil are the only two of the six ITA-member candidates with substantial tariffs on EU
exports. Since the partial equilibrium model takes initial trade as the starting point of the
calibrations, the combination of low trade volumes and high tariffs indicates that the EU
probably will not be greatly affected by including these countries in the ITA.

Expanding the Information Technology Agreement (ITA)
46
Table 4.3 EU export of ITA products to main non-ITA members Argentina Brazil Chile Mexico Russia South
Africa
Total
84 Machinery and mechani-cal appliances
41 148 33 187 3,227 1,155 4,791
85 Electrical machinery and equipment
223 915 210 804 5,175 1,746 9,073
90 Scientific instruments
35 173 27 98 432 127 893
Other ITA products
1 5 <1 6 18 2 31
Total 299 1,242 269 1,095 8,852 3,030 14,788
Note: Current ITA products for the year 2007. Data is in € million. Source: Own calculations based on Comtrade data.
4.2. TARIFFS ON TRADE WITH COUNTRIES CONSIDERED FOR INCLUSION EU exports to non-ITA members face high tariffs in Argentina, Brazil and Russia, cf. Table
4.4. Trade weighted average applied tariffs range around 7 to 10 percent and go up to 12.8
percent. Russia has lower tariffs on ITA goods (2 to 7 percent). Chile, Mexico and South Af-
rica (ZAF) have no tariffs on ITA goods imported from the EU, because of the FTAs with
these countries, but they have tariffs vis-à-vis other exporters for these goods, so the EU is
enjoying a preferential tariff treatment in these countries without an inclusion of these coun-
tries in the ITA.
Table 4.4 Average applied trade weighted tariffs levied on EU exports
Argen-tina
Brazil Chile Mexico South Africa
Other WTO, non-ITA
Rest of the world
Russia
EU average 10.04% 9.56% 0.00% 0.00% 0.00% 6.18% 7.65% 4.63%
Source: Own calculation based on tariffs reported to TRAINS Database.
As a consequence of the existing ITA (and bilateral FTAs), the EU imposes no tariffs on im-
ports of ITA products from other WTO members, including from Argentina, Brazil, Mexico
and Chile even though they are not ITA members.
It should be noted that the EU Commission has initiated negotiations about a free trade
agreement with the Mercosur countries (which includes Argentina and Brazil), and that re-
duction of tariffs is expected to include ITA goods as well. This will provide the EU with
preferential access to these large markets, compared to including them in the ITA, whereby
Argentina and Brazil will removed tariffs vis-à-vis all WTO members, not just the EU.

Expanding the Information Technology Agreement (ITA)
47
There are also virtually no tariffs on EU imports of ITA goods from Russia, although the EU
is not obliged to provide duty free entrance of these goods for non-WTO members. Only
very few products imported from Russia faces an import tariff in the EU. At the six digit
level, the highest trade weighted EU import tariff is 1.49 percent imposed on television cam-
eras, digital cameras and video camera recorders (product code 85.25.80).14 Therefore, there
will be no substantial tariff reductions for Russia’s export into the EU in the scenario because
nearly all of these are already de facto cut to zero. The main change for the EU trade in ITA
goods in the country expansion scenario is the lowering of tariffs by Brazil, Argentina and
Russia on Europe’s export to these destinations.
4.3. TRADE IMPACTS OF EXTENDING THE COUNTRY COVERAGE Including the listed six countries in the ITA would imply a reduction of import tariffs in Ar-
gentina, Brazil and Russia. Tariffs in South Africa, Chile and Mexico are already low for EU
exporter, and no direct impact can be foreseen from their inclusion in an ITA covering tar-
iffs only. However, it must be noted that including these countries in the ITA will imply a
preference erosion for the EU vis-à-vis the WTO exporters whom do not enjoy duty free ex-
ports to these countries today. This can potentially reduce EU exports to South Africa, Chile
and Mexico. The MFN tariff level on ITA products in South Africa and Mexico is low al-
ready today, but Chile has average tariffs on ITA products of around 6 percent against cer-
tain countries with whom they do not have FTAs.
Our partial equilibrium analysis of the long-run potential impacts shows that EU total ex-
ports to non-EU destinations would increase by a little more than 0.7 percent. EU exports to
Brazil will increase by around 18 to 20 percent, and by 11 to 12 percent to Argentina, but
initial trade volumes are small and all in all the increase will be small measured in percentage
terms. Trade between non-EU countries will also increase, but here the percentage increase
is 0.3 percent, cf. Table 4.5. Total trade in ITA goods would increase slightly from €912.5
billion to €915.7 billion or by 0.4 percent.
14 Tariffs are set at the 10 digit HS code level, and some of these products are facing 3 percent tariffs while others are facing 0 percent tariff. The trade weighted average is 1.49 percent for Russia’s exports into the EU.

Expanding the Information Technology Agreement (ITA)
48
Table 4.5 Trade impact of including six new countries in the ITA
Exporter Initial exportInitial exportInitial exportInitial export New exportNew exportNew exportNew export % change in trade
EU 106,573 107,295 0.7%
B-R-A-M-C-S total
Argentina 156 158 1,3%
Brazil 2116 2,032 -4%
Chile 90 90 0%
Mexico 26,768 26,762 -0%
Russia 1,292 1,364 5,6%
South Africa 556 557 0,2%
Non-EU ITA 151,099 152,036 0,6%
Non-ITA WTO 120 120 0%
Rest of world 132 131 -0%
TotalTotalTotalTotal 912.5912.5912.5912.5 915.7915.7915.7915.7 0.4%0.4%0.4%0.4%
Note: Data is for 2007 and is in € billion. Note that the total deviates slightly from the tables on trade flows above because this table only includes trade flows for which we have tariff data. Totals may not add up due to rounding. Data excludes intra-EU trade.
Source: Model input data based on Comtrade data.
This is a result of increased imports from Russia, Argentina, Chile and Brazil. Since our
simulations reflect long run effects where supply adjusts to demand, there will be little trade
diversion towards the new ITA members and away from current destinations. For this reason
both intra-EU and EU imports from non-EU countries will remain unchanged.
4.4. ECONOMIC AND WELFARE IMPACTS OF EXTENDING THE COUNTRY COVERAGE On the overall level, we find that there is a small positive long-run net welfare impact equal
to €2.8 million of extending the ITA to cover the six new countries, cf. Table 4.6. The loss
to the EU countries is negligible. There is a small drop in tariff revenues since tariffs on Rus-
sian imports are eliminated, and the more favourable export conditions trigger an increase in
EU production and a small drop in consumption.
The reason for these findings is that the EU already enjoys favourable trade conditions in
most B-R-A-M-C-S countries. In fact, the EU’s export to Chile, Mexico and South Africa is
already exempted from tariffs, which means that close to 1/3 of the EU export to the B-R-A-
M-C-S countries (around €4.3 million out of €14.8 million) is freely exported. Also, the
EU’s exports to Russia, accounting for more than half of EU’s total export to the B-R-A-M-
C-S countries (€8.9 million out of €14.8 million), is also prone to relatively low tariffs (on
average 4.63 percent, cf. Table 4.4). The remaining €1.6 billion is being exported to Argen-
tina and Brazil facing high tariffs at around 10 percent.
The non-EU ITA countries experience a gain worth more than €8.2 million.
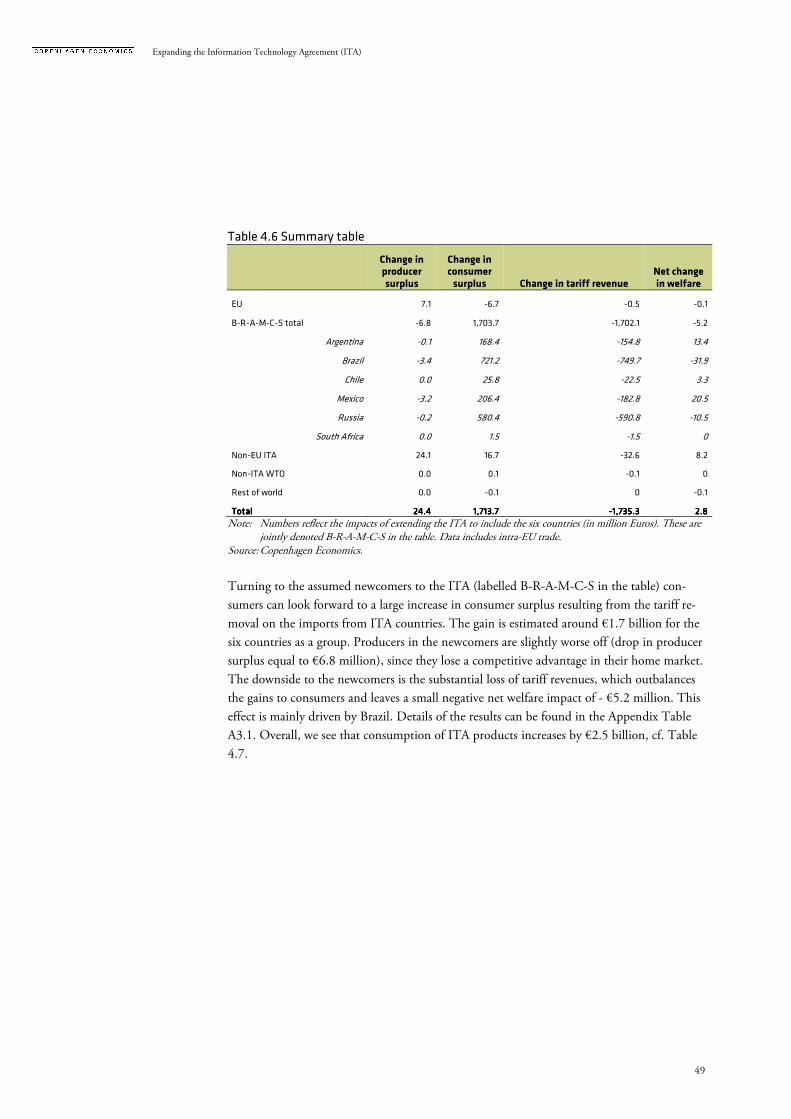
Expanding the Information Technology Agreement (ITA)
49
Table 4.6 Summary table
Change in producer surplus
Change in consumer surplus Change in tariff revenue
Net change in welfare
EU 7.1 -6.7 -0.5 -0.1
B-R-A-M-C-S total -6.8 1,703.7 -1,702.1 -5.2
Argentina -0.1 168.4 -154.8 13.4
Brazil -3.4 721.2 -749.7 -31.9
Chile 0.0 25.8 -22.5 3.3
Mexico -3.2 206.4 -182.8 20.5
Russia -0.2 580.4 -590.8 -10.5
South Africa 0.0 1.5 -1.5 0
Non-EU ITA 24.1 16.7 -32.6 8.2
Non-ITA WTO 0.0 0.1 -0.1 0
Rest of world 0.0 -0.1 0 -0.1
TotalTotalTotalTotal 24.424.424.424.4 1,713.71,713.71,713.71,713.7 ----1,735.31,735.31,735.31,735.3 2.82.82.82.8
Note: Numbers reflect the impacts of extending the ITA to include the six countries (in million Euros). These are jointly denoted B-R-A-M-C-S in the table. Data includes intra-EU trade.
Source: Copenhagen Economics.
Turning to the assumed newcomers to the ITA (labelled B-R-A-M-C-S in the table) con-
sumers can look forward to a large increase in consumer surplus resulting from the tariff re-
moval on the imports from ITA countries. The gain is estimated around €1.7 billion for the
six countries as a group. Producers in the newcomers are slightly worse off (drop in producer
surplus equal to €6.8 million), since they lose a competitive advantage in their home market.
The downside to the newcomers is the substantial loss of tariff revenues, which outbalances
the gains to consumers and leaves a small negative net welfare impact of - €5.2 million. This
effect is mainly driven by Brazil. Details of the results can be found in the Appendix Table
A3.1. Overall, we see that consumption of ITA products increases by €2.5 billion, cf. Table
4.7.

Expanding the Information Technology Agreement (ITA)
50
Table 4.7 Impacts on prices, output and consumption
Change in production
Change in consumption
Change in consumer price
EU 712.7 -9.4 0
B-R-A-M-C-S total -682.4 2,515.8 -3.2
Argentina -12.5 250.9 -5.7
Brazil -335.5 1,090.7 -7.5
Chile -2.9 36.7 -1.3
Mexico -316.3 290.9 -0.6
Russia -15.9 844.5 -4.0
South Africa 0.8 2.2 0
Non-EU ITA 2,409.4 23.4 0
Non-ITA WTO 0.1 0.1 0
Rest of world -0.6 -0.1 0
TotalTotalTotalTotal 2,439.22,439.22,439.22,439.2 2,529.82,529.82,529.82,529.8 ----3.23.23.23.2
Note: Numbers reflect the impacts of extending the ITA to include the six countries (in million Euros). These are jointly denoted B-R-A-M-C-S in the table. Due to rounding there is a small discrepancy between the global change in production and consumption. Since the supply elasticity is very high, supply adjusts to demand and there will be no impact on producer prices. Data includes intra-EU trade.
Source: Copenhagen Economics.
4.5. CONCLUSIONS On the overall level, we find that there is a small positive global welfare impact of extending
the ITA to cover the six countries. The EU and the B-R-A-M-C-S countries do not seem to
be affected by the expansion, whereas non-EU ITA countries are expected to benefit from
having more countries signing the Declaration. The differences in net welfare gains can be
explained by the different initial trade and tariffs structures. The main part of the EU export
to the B-R-A-M-C-S countries already enjoy no or very low tariffs, and the impact on pro-
duction will therefore be relatively low. The B-R-A-M-C-S countries will experience very
large increases in consumption, production drops because they meet increased competition
in the domestic and export markets, and tariff revenues will consequently go down. The
non-EU countries stand to gains since their producers experience a real improvement in
their competitive stance in the global markets, and since the reduced import prices will bene-
fit consumers in these countries.

Expanding the Information Technology Agreement (ITA)
51
In this chapter we assess the trade and economic impacts of extending the product coverage
of the ITA. The analysis is based on a defined list of products proposed by the Commission
as new ITA products. Using a partial equilibrium model of global trade in the new ITA
products, we analyse the impact of eliminating tariffs on these products following the same
structure of tariff reductions as in the current ITA.
Thus in this chapter we quantify the impact of extending the ITA in the product dimension,
while keeping the country coverage as in the current ITA. The ITA is a so-called “critical
mass” agreement which means that any extension of the ITA will automatically benefit all
other WTO members. The tariff reduction scenario therefore implies reducing existing tar-
iffs to zero for all bilateral trade between ITA countries as well as on the ITA countries’ im-
port from non-ITA WTO countries for all products listed for the extension.15
We find that EU consumers will benefit economically from eliminating tariffs on these new
ITA products. Although there is a loss in tariff revenue for EU governments and a small
drop in producer surplus, there will be a net gain in total welfare. As we saw in Chapter 3
(chapter on the wider industry picture), much of the ITA trade is in intermediate goods, and
producers of ITA products in one country use ITA products from another country in their
production of a third type of ITA product. By lowering the price of ITA products and in-
creasing consumption, extending the scope of the ITA product list will therefore benefit EU
companies and improve their possibility for doing business. Extending the coverage to more
products will also benefit consumers of these products since they will get lower prices and a
wider set of products to choose from.
5.1. CURRENT TRADE IN PRODUCTS SUGGESTED FOR INCLUSION The products included on the extended ITA list fall under the following categories:
� Printing, drawing and writing ink (HS3215)
� Chemical preparations for photographic uses (HS3707)
� Other articles of plastic (HS3926)
� Parts and accessories of refined copper (HS741021)
� Machinery and mechanical appliances (various products under heading HS84)
� Electrical machinery and equipment (various products under heading HS85)
� Optical and photographic instruments (various products under heading HS90)
Global trade in goods covered by the current agreement amounts to almost €1 trillion. The
products that have been proposed for inclusion in the ITA account for a trade value of €246
billion, and the inclusion of the listed products in the ITA would increase the product cov-
erage of global ITA trade by 25 percent, cf. Table 5.1.
15 The results in this chapter are based on a list of close to 100 product codes provided to us by the European Commission services, detailing the products suggested being included in an extended ITA.
Chapter 5 EXTENDING THE PRODUCT COVERAGE OF THE ITA

Expanding the Information Technology Agreement (ITA)
52
Table 5.1 Global trade in current ITA and in the product extension
Exporter/Importer ITA countries Non-ITA countries
Non-WTO countries Grand total
Current ITA, sum of export, 1000 Current ITA, sum of export, 1000 Current ITA, sum of export, 1000 Current ITA, sum of export, 1000 €€€€
EU 90,076,818 13,532,662 16,306,904 119,916,384
Non-EU ITA countries 982,382,211 36,998,269 7,760,905 827,141,385
Non-ITA WTO countries 26,363,951 3,421,374 114,689 29,900,014
Non-WTO countries 795,962 114,689 353,385 1,199,866
Grand total 1,099,618,942 54,002,825 24,535,883 978,157,649
Suggested Suggested Suggested Suggested extension, sum of export, 1000 extension, sum of export, 1000 extension, sum of export, 1000 extension, sum of export, 1000 €€€€
EU 41,806,899 6,627,348 6,693,592 55,127,838
Non-EU ITA countries 155,267,643 13,771,172 5,819,407 174,858,222
Non-ITA WTO countries 13,594,363 838,239 84,604 14,517,206
Non-WTO countries 736,193 64,771 318,934 1,119,898
Grand total 211,405,098 21,301,530 12,916,537 245,623,164
% increase in ITA trade% increase in ITA trade% increase in ITA trade% increase in ITA trade
EU 46% 49% 41% 46%
Non-EU ITA countries 16% 37% 75% 21%
Non-ITA WTO countries 52% 25% 74% 49%
Non-WTO countries 92% 128% 90% 93%
Grand total 19% 39% 53% 25%
Note: Data is from 2007 and covers all countries reporting data for that year. Data excludes intra-EU trade. Source: Own calculations based on Comtrade data.
Of the trade value of €246 billion, a total of €211 billion (total ITA countries’ import worth
€211.4 billion minus €0.7billion imported from non-WTO countries) would be imported
by the ITA countries on a MFN basis (critical mass agreement).
Compared to the current ITA products, trade in the products suggested for extension is less
concentrated among ITA members.
The products listed for the product extension are products where the EU has a strong export
performance. Looking at EU’s exports to non-EU countries, the inclusion of new products
would increase by €55 billion from the €120 billion of the current ITA to €175 billion of a
product-extended ITA, cf. Table 5.2. This is an increase of 46 percent. A total of €132 bil-
lion would be export to current ITA members.

Expanding the Information Technology Agreement (ITA)
53
Table 5.2 EU27 exports to non-EU members
Sum of export, 1.000 Euros
WTO Members Non-WTO members Total ITA-members
Non-ITA members
Current ITA 90,076,818 13,532,662 16,306,904 119,916,384
Suggested product extension of ITA 41,806,899 6,627,348 6,693,592 55,127,838
EU export in extended ITA products 131,883,717 20,160,010 23,000,495 175,044,222
Increase in trade volume under ITA 46% 49% 41% 46%
Note: Data is from 2007 and excludes intra-EU trade. Source: Own calculations based on Comtrade data.
The EU imports €40 billion worth of goods listed as suggested new ITA products from non-
EU countries of which €38 billion is from other ITA members, cf. Table 5.3. Compared to
imports of €156 billion under the current ITA, the suggested products constitute a 25 per-
cent increase in the trade volume listed as ITA products.
Table 5.3 EU27 imports from non-EU members
Sum of Import, 1.000 Euros
WTO Members Non-WTO members Total ITA members
Non-ITA members
Current ITA 153,680,637 2,354,305 364,563 156,399,505
Suggested product extension of ITA 38,337,825 1,788,313 182,188 40,308,325
EU import in extended ITA 192,018,461 4,142,618 546,751 196,707,830
Increase in trade volume under ITA 25% 76% 50% 26%
Note: Data is from 2007 and excludes intra-EU trade. Source: Own calculations based on Comtrade data.
5.2. TARIFFS ON PRODUCTS SUGGESTED FOR INCLUSION The ITA countries impose tariffs on EU’s exports of the products on the extension list corre-
sponding to an average of 2.5 percent (trade weighted), cf. Table 5.4. The tariff protection
differs from product to product and between the 2-digit parent headings, with the highest
average tariff protection of 4.5 percent being found on the listed products under parent
heading 39 (‘plastics and articles thereof’). The largest product group measured by value of
EU’s export is for the listed products under heading 85 (‘electrical machinery and equip-
ment’) which for EU exports face an average import duty of 1.6 percent across current ITA
members.

Expanding the Information Technology Agreement (ITA)
54
Table 5.4 Tariffs on EU exports to other ITA countries
Heading Export, million €
Average tariff
for group
Maximum tariff
for group
32 - Tanning or dyeing extracts; tannins and their de-
rivatives; dyes, pigments and other colouring matter;
paints and varnishes; putty and other mastics; inks.
584 3.2% 17.6%
37 - Photographic or cinematographic goods. 222 2.8% 20.0%
39 - Plastics and articles thereof. 2,548 4.5% 25.1%
74 - Copper and articles thereof. 38 2.6% 8.0%
84 - Nuclear reactors, boilers, machinery and me-
chanical appliances; parts thereof.
247 2.0% 8.0%
85 - Electrical machinery and equipment and parts
thereof; sound recorders and reproducers, television
image and sound recorders and reproducers, and
parts and accessories of such articles.
11,471 3.9% 12.5%
90 - Optical, photographic, cinematographic, measur-
ing, checking, precision, medical or surgical instru-
ments and apparatus; parts and accessories thereof.
20,721 1.6% 8.1%
94 - Furniture; bedding, mattresses, mattress sup-
ports, cushions and similar stuffed furnishings; lamps
and lighting fittings, not elsewhere specified or in-
cluded; illuminated signs, illuminated name-plates
and the like; prefabricated buildings.
1,545 1.4% 8.1%
TotalTotalTotalTotal exportexportexportexport 37,37737,37737,37737,377 2.52.52.52.5%%%% ----
Source: Own calculation based on tariffs reported to TRAINS Database. Data excludes intra-EU trade.
EU’s external tariffs on the suggested new ITA products are lower that the tariffs EU export-
ers face abroad. The average tariffs per product heading (trade weighted) are around 1.0 per-
cent or lower, indeed for the larger product groups (heading 85 and 90), cf. Table 5.5.
Table 5.5 EU import weighted tariffs per product heading Heading Weighted tariff
32 - Tanning or dyeing extracts; tannins and their derivatives; dyes, pigments and
other colouring matter; paints and varnishes; putty and other mastics; inks.
1,0%
37 - Photographic or cinematographic goods. 1,0%
39 - Plastics and articles thereof. 0,7%
74 - Copper and articles thereof. 1,3%
84 - Nuclear reactors, boilers, machinery and mechanical appliances; parts thereof. 0,2%
85 - Electrical machinery and equipment and parts thereof; sound recorders and re-
producers, television image and sound recorders and reproducers, and parts and
accessories of such articles.
1,1%
90 - Optical, photographic, cinematographic, measuring, checking, precision, medi-
cal or surgical instruments and apparatus; parts and accessories thereof.
0,3%
94 - Furniture; bedding, mattresses, mattress supports, cushions and similar stuffed
furnishings; lamps and lighting fittings, not elsewhere specified or included; illumi-
nated signs, illuminated name-plates and the like; prefabricated buildings.
0,5%
Source: Own calculation based on tariffs reported to TRAINS Database. Data excludes intra-EU trade.
5.3. TRADE IMPACTS OF EXTENDING THE PRODUCT COVERAGE In this section we use the results from the partial equilibrium model to analyse the impact on
EU trade when we eliminate tariffs on an extended number of ITA products. We discuss the
impacts on EU trade of extending the product coverage in the two most important product
groups: ‘Electrical machinery and equipment’ (Product 85) and ‘Optical and photographic

Expanding the Information Technology Agreement (ITA)
55
instruments’ (Product 90). The results from the other product groups can be found in Ap-
pendix 1.
The EU export of electrical machinery and equipment products on the extended list is worth
more than €18 billion. Eliminating tariffs on these products will imply an increase in EU
export to non-EU countries (extra EU export) of 6 percent, cf. Table 5.6.
Table 5.6 Impacts on EU trade
Extra EU export EU import from non-EU
Million € Initial New
Change
(%) Initial New
Change
(%)
Printing, drawing and writing ink (HS32) 1,146 1,185 3% 752 846 13%
Chemical preparations for photographic uses (HS37) 356 370 4% 494 626 27%
Other articles of plastic (HS39) 4,364 4,754 9% 3,372 3,610 7%
Parts and accessories of refined copper (HS74) 60 63 5% 70 82 17%
Machinery and mechanical appliances (HS84) 443 454 3% 361 369 2%
Electrical machinery and equipment (HS85) 18,093 19,223 6% 16,776 18,720 12%
Optical and photographic instruments (HS90) 27,942 27,766 -1% 20,790 20,811 0%
Note: Data is in million Euros. Data excludes intra-EU trade. Source: Copenhagen Economics.
There is a small drop in export of optical and photographic instruments (Product 90), sug-
gesting that extra-EU export decreases by almost 0.5 percent. Since a MFN clause applies to
all ITA products, all WTO members face the same tariff on individual tariff lines.16 How-
ever, the composition of export varies from country to country, and the trade weighted tar-
iffs will therefore also differ.17 The explanation for the negative impact on extra-EU export of
eliminating tariffs on export of optical and photographic instruments is that the EU exports
mainly ITA products with low tariffs compared to some other large ITA countries. When
exporting to the US, for example, Chinese producers face a trade weighted tariff of 1.3 per-
cent, whereas no tariffs are imposed on these types of ITA products imported from the EU.
This is consistent with Section 3.6 where we found that Chinese exports is specialised in
other types of products than the EU and the US. EU producers therefore lose a competitive
stance since exports by other ITA countries will now face comparable tariffs.
5.4. ECONOMIC AND WELFARE IMPACTS OF EXTENDING THE PRODUCT COVERAGE On the overall level, we find that there is a positive net welfare impact of extending the ITA
with the products proposed by the EU Commission. EU consumers will benefit from the in-
clusion of new products in the ITA, but a loss of tariff revenues will counter balance some of
16 The EU might have preferential access to other markets in cases where a bilateral FTA between the EU and the export destination has been signed, and where other ITA exporters have no such agreement. 17 The trade weighted tariff facing EU producers in a particular export destination, for example, is calculated as the sum of the tariff imposed on a particular ITA product times the product’s share in total EU exports to the destina-tion country.

Expanding the Information Technology Agreement (ITA)
56
the gain. Also, EU producers will lose from the extension since they face increased competi-
tion from other ITA countries in markets, where they used to enjoy protection through bi-
lateral FTAs. Consumers’ surplus will increase by €523 million and producers’ surplus will
go down by €3 million, while tariff revenue will drop by €475 million leaving a positive net
welfare impact of €45 million for the EU as a whole, cf. Table 5.7.
Table 5.7 Summary table (All products)
Change in
producer surplus Change in
consumer surplus Change in tariff
revenue Net change in
welfare
EU -3 523 -475 45
Non-EU ITA 46 2,678 -2,577 147
Non-ITA WTO -2 -2 0 -4
Rest of the world 0 -186 149 -36
TotalTotalTotalTotal 41414141 3,0133,0133,0133,013 ----2,9032,9032,9032,903 152152152152
Note: Numbers reflect the impacts of extending the number of products on the ITA list (million Euros). Data in-cludes intra-EU trade.
Source: Copenhagen Economics.
The net welfare gain to the world is equal to €152 million. The positive net welfare gain
stems mainly from increased trade in electrical machinery and equipment (HS85) products.
Trade in other articles of plastic (HS39), chemical preparations for photographic uses
(HS37) and printing, drawing and writing ink (HS32) also contribute positively to net wel-
fare. It is only trade in optical and photographic instruments (HS90) that contributes nega-
tively to net welfare and the loss is quite small, cf. Figure 5.1.

Expanding the Information Technology Agreement (ITA)
57
Figure 5.1 The net change in EU welfare
Note: Numbers reflect the impacts of extending the number of products on the ITA list (million Euros). Data in-cludes intra-EU trade.
Source: Copenhagen Economics.
We discuss the mechanisms underlying these results for the two main product groups (HS85
and HS90) underneath. The results for individual countries can be found in Appendix 2.
Impacts of eliminating tariffs on electrical machinery and equipment
We find that there is a welfare gain to EU countries equal to €35.3 million from including
the proposed electrical machinery and equipment products on the ITA list, cf. Table 5.8.
Table 5.8 Summary table for electrical machinery and equipment (Product 85)
Change in
producer surplus Change in
consumer surplus Change in tariff
revenue Net change in
welfare
EU -2.7 426.5 -388.5 35.3
Non-EU ITA 34.6 1,873.0 -1,814.0 93.4
Non-ITA WTO -1.5 -0.9 -0.1 -2.5
Rest of the world -0.1 -106.5 81.4 -25.1
TotalTotalTotalTotal 30.430.430.430.4 2,192.12,192.12,192.12,192.1 ----2,121.32,121.32,121.32,121.3 101.1101.1101.1101.1
Note: Numbers reflect the impacts of extending the number of products on the ITA list (million Euros). Data in-cludes intra-EU trade.
Source: Copenhagen Economics.
One part of the reason is the foregone tariff revenue due to the tariff elimination. The large
increase in consumer surplus is caused by a small drop in consumer price and an increase in
consumption worth more than €11 million, cf. Table 5.9. Since production of ITA products
is very responsive to changes in demand, there will be no impact on producer prices.
45.0
35.3
5.42.7 2.6 0.2 0.1
-1.2-10.0
0.0
10.0
20.0
30.0
40.0
50.0
Tota
l
Electrica
l mac
hin
ery an
d
equip
men
t
Oth
er articles of plast
ic
Chem
ical preparat
ions fo
r photo
grap
hic use
s
Printing, drawin
g an
d
writing in
k
Parts
and acces
sories
of
refined
copper
Mac
hin
ery an
d m
echan
ical
applian
ces
Optica
l and photo
grap
hic
inst
rum
ents
Net change in EU welfare (in million Euros)

Expanding the Information Technology Agreement (ITA)
58
Table 5.9 Impacts on prices, output and consumption (Product 85)
Change in output
(million €) Change in consumption
(million €)
Change in consumer price
(percent)
EU -77.0 601.8 -0.8
Non-EU ITA 4,780.8 2,719.9 -1.8
Non-ITA WTO -2,509.7 -1.1 0.0
Rest of the world -51.9 -128.5 2.5
TotalTotalTotalTotal 2,142.22,142.22,142.22,142.2 3,192.13,192.13,192.13,192.1 ----1.11.11.11.1
Note: Numbers reflect the impacts of extending the number of products on the ITA list. Since the supply elasticity is very high, supply adjusts to demand and there will be no impact on producer prices. Data includes intra-EU trade.
Source: Copenhagen Economics.
The non-EU ITA countries also benefit from the tariff reduction since the increase in pro-
ducer and consumer surplus more than outweighs the lost revenue. On the production side,
we find that the increased demand for imports from the non-EU ITA countries (particularly
from the EU countries) drives up production to the benefit of producers in these countries.
Again, we find that the consumers experience a large increase in consumption.
The results depend on the elasticities applied in the simulations. In Appendix 2 we therefore
provide a sensitivity analysis of how responsive the results are to changes in the import de-
mand elasticity, the substitution elasticity and the supply elasticity. We do so for product 85
since this is where the bulk of the trade in the new ITA products take place.
Impacts of eliminating tariffs on optical and photographic instruments
The overall net welfare impacts of eliminating tariffs on optical and photographic instru-
ments are smaller than on electrical machinery and equipment products. EU countries do
not seem to gain from eliminating tariffs on such products, whereas the non-EU ITA coun-
tries experience a gain worth more than €18 million, cf. Table 5.10. This gain takes place at
the expense of countries grouped under “rest of the world”. As can be seen from Appendix
Table A3.8 it is mainly Russia who stand to lose.
Table 5.10 Summary table for optical and photographic instruments (Product 90)
Change in
producer surplus Change in
consumer surplus Change in tariff
revenue Net change in
welfare
EU -1.8 4.0 -3.5 -1.2
Non-EU ITA 2.7 158.0 -142.4 18.3
Non-ITA WTO 0.1 -0.3 0.0 -0.2
Rest of the world 0.2 -66.6 59.4 -7.0
TotalTotalTotalTotal 1.21.21.21.2 95.295.295.295.2 ----86.586.586.586.5 9.99.99.99.9
Note: Numbers reflect the impacts of extending the number of products on the ITA list (million Euros). Data in-cludes intra-EU trade.
Source: Copenhagen Economics.

Expanding the Information Technology Agreement (ITA)
59
We see that the elimination of tariffs will cause demand to shift from EU products (drop in
output worth €2.2 million) towards products produced in other non-EU ITA countries (in-
crease in output worth €2.7 million), cf. Table 5.11. Overall, the elimination of tariffs on
these products causes consumption to increase by €0.4 million.
Table 5.11 Impacts on prices, output and consumption (product 90)
Change in output
(million €) Change in consumption
(million €)
Change in consumer price
(percent)
EU -177.8 5.6 0.0
Non-EU ITA 265.7 222.3 -0.2
Non-ITA WTO 9.7 -0.4 0.0
Rest of the world 19.7 -86.7 1.4
TotalTotalTotalTotal 117.4 140.9 0.00.00.00.0
Note: Numbers reflect the impacts of extending the number of products on the ITA list. Since the supply elasticity is very high, supply adjusts to demand and there will be no impact on producer prices. Data includes intra-EU trade.
Source: Copenhagen Economics.
5.5. CONCLUSIONS We find that there is a net welfare gain for EU economy from eliminating tariffs on the ex-
tended list of products as proposed by the EU Commission. The gain is not as large as the
gain accruing to other ITA countries because the EU mainly exports ITA products that are
subject to low or no tariffs in most of its important export destinations.
It is important to notice that the model does not take into account relocations of production
that might take place if tariffs are eliminated on a larger set of ITA products. If it is the case
than many intermediate goods are tradable without tariffs and final goods face high tariffs,
ITA producers would have an incentive to engage in tariff-jumping FDI by locating produc-
tion in the local market. One example could be a Chinese producer who has located its pro-
duction of flat screens in an Eastern European country in order to serve the EU market
without having to pay tariffs on the final product while at the same time being able to im-
port intermediate goods free of tariffs. Our simulation results might therefore underestimate
the trade impact of eliminating tariffs.

Expanding the Information Technology Agreement (ITA)
60
Trade in ITA products is influenced both by tariffs and by non-tariff barriers (NTBs). NTBs
are currently not included in the ITA but the results in this paper suggest that the trade ex-
pansion potential of reducing NTBs to trade in current ITA products is likely to be signifi-
cant and probably even larger than extending the product coverage or including more coun-
tries in the agreement. Even when we control for other factors that influence global trade in
ITA products we find that most importing countries maintain significant barriers to import
of ITA products.
Some of the barriers to ITA trade are caused by a need to undergo multiple conformity as-
sessment procedures to meet government technical regulations in both domestic as well as in
export markets. In this report we therefore build a model of trade in ITA products that al-
lows us to analyse the trade expansion potential of reducing the barriers to ITA trade caused
by cumbersome, complex and/or duplicative conformity assessment procedures. Based on
our empirical model we define a scenario of NTB reduction where countries that have very
strict conformity assessment requirements adopt the Supplier’s Declaration of Conformity
(SDoC) system, whereas NTBs in countries that have a similar or even less restrictive con-
formity assessment system than the EU remain untouched.
We find that the trade potential of reducing barriers related to conformity assessment re-
quirements are significant and probably larger than extending the number of ITA partici-
pants (Chapter 4) or extending the scope of the ITA (Chapter 5).
6.1. IDENTIFIED NTBS ON ITA PRODUCTS As tariffs on ITA products have been reduced, NTBs have emerged as the most important
obstacles to trade among ITA countries.
Non-tariff barriers on ITA products are related to many different areas:
� Standards
� Conformity assessment
� Marking and labelling requirements
� Local content requirements
� IPR
� Procurement rules
� Export control
� Sector regulation (e.g. telecommunications services)
If standards differ among countries, it can cause problems for trade if some countries have
unique requirements. It is the general view that problems of differences in standards is di-
minishing and a great deal of convergence has occurred for many ITA products as a result of
the work inter alia in the International Electrotechnical Commission (IEC) and the Interna-
tional Telecommunications Union (ITU).
Chapter 6 INCLUDING NTBS IN THE ITA

Expanding the Information Technology Agreement (ITA)
61
For the US, the Ecorys study (2009) identifies NTMs affecting EU-US trade related to ITA
goods. Ecorys (2009) concludes that the EU is already open in terms of electrical machinery
as a consequence of EU efforts to open up the sector through suppliers declaration of con-
formity (SDoC). Further opening by alignment of technical standards, safety provisions, re-
cycling and environmental protection are likely to accrue the benefits estimated in the re-
port.
Other major NTMs include differing product standards, US state-level safety and power
supply certifications, third party testing requirements, 100 percent container scanning, dif-
ferences in IPR systems, residence requirements for staff, the EU’s Waste Electric and Elec-
tronic Equipment (WEEE) directive, differences in patent systems, different customs and
border requirements and electromagnetic compatibility requirements.
For Japan, estimates provided in a study on EU-Japan trade barriers, Copenhagen Econom-
ics (2010), suggests that EU exports of medical devices and precision instruments (some of
which are covered by the ITA) are restrained by the current regulatory requirements, admin-
istrative procedures for conformity assessment and reimbursement assessment. These barriers
together imply an additional cost for European medical device exporters estimated at ap-
proximately 30 percent. In other words, the identified NTMs have an economic impact
comparable to the impact of a 30 percent tariff on the imports of medical devices.
According to estimates provided by European managers in Japan, about 8 to 12 percentage
points of these 30 percent extra costs can be avoided through various actions requiring ef-
forts from both European and Japanese policy makers.
The actions required to achieve this kind of reduction will multiple. No single solution is preferred by European exporters. The preferred solution to reducing the regulatory burden is through the use of international standards (mentioned in 21 percent of the replies). The sec-ond most popular solution is to see harmonisation and convergence between the EU and Ja-pan regarding rules and regulations in the sector (mentioned 18 percent). Simplification of the certification procedure and speeding up the certification process also gets frequently mentioned. Introduction of an SDoC is also mentioned by some exporters as their preferred solution. Review of the pricing and reimbursement system appear as the least frequently mentioned solution. Estimates for the electronics sector in Japan suggest that there is an additional trade cost in Japan of at least 12 percent, according to Copenhagen Economics (2010).
Multiple conformity assessment tests as major obstacle
Among such NTBs, the need to undergo multiple conformity assessment procedures to meet
duplicative government technical regulations is found by the USICT (1998) to constitute an
important barrier to trade in ITA products. This is confirmed by data from the EU Market
Access Database and individual country reports as summarised underneath.
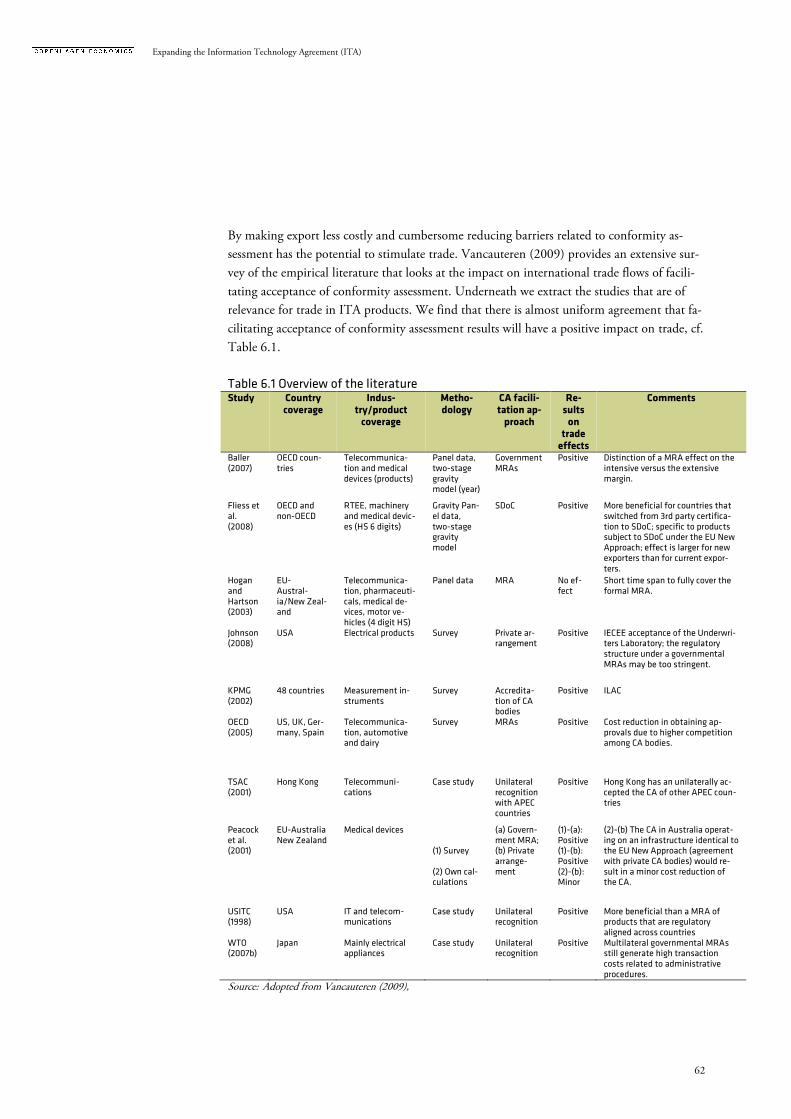
Expanding the Information Technology Agreement (ITA)
62
By making export less costly and cumbersome reducing barriers related to conformity as-
sessment has the potential to stimulate trade. Vancauteren (2009) provides an extensive sur-
vey of the empirical literature that looks at the impact on international trade flows of facili-
tating acceptance of conformity assessment. Underneath we extract the studies that are of
relevance for trade in ITA products. We find that there is almost uniform agreement that fa-
cilitating acceptance of conformity assessment results will have a positive impact on trade, cf.
Table 6.1.
Table 6.1 Overview of the literature Study Country
coverage Indus-
try/product coverage
Metho-dology
CA facili-tation ap-proach
Re-sults on
trade effects
Comments
Baller (2007)
OECD coun-tries
Telecommunica-tion and medical devices (products)
Panel data, two-stage gravity model (year)
Government MRAs
Positive Distinction of a MRA effect on the intensive versus the extensive margin.
Fliess et al. (2008)
OECD and non-OECD
RTEE, machinery and medical devic-es (HS 6 digits)
Gravity Pan-el data, two-stage gravity model
SDoC Positive More beneficial for countries that switched from 3rd party certifica-tion to SDoC; specific to products subject to SDoC under the EU New Approach; effect is larger for new exporters than for current expor-ters.
Hogan and Hartson (2003)
EU-Austral-ia/New Zeal-and
Telecommunica-tion, pharmaceuti-cals, medical de-vices, motor ve-hicles (4 digit HS)
Panel data MRA No ef-fect
Short time span to fully cover the formal MRA.
Johnson (2008)
USA Electrical products Survey Private ar-rangement
Positive IECEE acceptance of the Underwri-ters Laboratory; the regulatory structure under a governmental MRAs may be too stringent.
KPMG (2002)
48 countries Measurement in-struments
Survey Accredita-tion of CA bodies
Positive ILAC
OECD (2005)
US, UK, Ger-many, Spain
Telecommunica-tion, automotive and dairy
Survey MRAs Positive Cost reduction in obtaining ap-provals due to higher competition among CA bodies.
TSAC (2001)
Hong Kong Telecommuni-cations
Case study Unilateral recognition with APEC countries
Positive Hong Kong has an unilaterally ac-cepted the CA of other APEC coun-tries
Peacock et al. (2001)
EU-Australia New Zealand
Medical devices (1) Survey (2) Own cal-culations
(a) Govern-ment MRA; (b) Private arrange-ment
(1)-(a): Positive (1)-(b): Positive (2)-(b): Minor
(2)-(b) The CA in Australia operat-ing on an infrastructure identical to the EU New Approach (agreement with private CA bodies) would re-sult in a minor cost reduction of the CA.
USITC (1998)
USA IT and telecom-munications
Case study Unilateral recognition
Positive More beneficial than a MRA of products that are regulatory aligned across countries
WTO (2007b)
Japan Mainly electrical appliances
Case study Unilateral recognition
Positive Multilateral governmental MRAs still generate high transaction costs related to administrative procedures.
Source: Adopted from Vancauteren (2009),

Expanding the Information Technology Agreement (ITA)
63
Historically, the costs of having to assure compliance to requirements through conformity
assessment in multiple markets have been reduced by the establishment of so-called mutual
recognition agreements (MRAs). Recently, unilateral recognition of other countries’ con-
formity assessment results and SDoCs have emerged as alternative approaches to reducing
such compliance costs.
The European Commission, for example, has requested that the US Occupational Safety &
Health Administration (OSHA) deregulates its current procedures that require products to
go through nationally recognised testing laboratories. In 2008 they published a request for
information and comments on a proposal to permit the use of the EU SDoC as an alterna-
tive to the NRTL's product-approval process.18 In the next section we therefore attempt to
quantify the trade potential of introducing the SDoC in countries with restrictive confor-
mity assessment systems.
Conformity assessment requirements constitute a barrier to ITA trade
Data from the EC Market Access Database (see Appendix 5) suggests that differences in the
conformity assessment approval systems are costly for EU exporters and pose a barrier to
trade in ITA products.
In the US, for example, conformity assessment requirements of electronic products are tested
by Nationally Recognised Testing Laboratories (NRTLs), whereas the EU SDoC allows the
producer to declare that the product meets technical requirements.
For Korea, an example from the EC Market Access Database (see Appendix 5) suggests that
the non-recognition of international standards and compliance certification pose long delays
of export.
Another important export destination for European ITA products is China, where regula-
tion of the telecommunications equipment industry is found to be highly complex and non-
transparent. Here, key recommendations regarding conformity assessment from the Infor-
mation and Communication Technology Working Group are to:19
� Provide certification requirements in writing well in advance of the implementa-
tion date so as to allow for full compliance.
� Provide notification under the WTO-TBT Agreement for any standard that is ap-
plicable to mandatory certification and market access.
� Remove mobile phone from the Key Product List for the Control of Pollution
Caused by Electronic Information Products.
� Allow the Telecommunication Terminal Test Approval Forum (TAF) to take the
lead in creating a manufacturer’s Declaration of Conformity accepted by the Chi-
nese authorities.
18 See European Commission (2009). 19 See European Business in China (2009).

Expanding the Information Technology Agreement (ITA)
64
� Designate one authority to oversee the granting of one compliance label to reduce
complexity and create a fast and effective certification system.
� Stimulate innovation in the Chinese market by limiting descriptive requirements in
standards used in compulsory testing.
Finally, duplication of telecommunications equipment product certification for the Euro-
pean and Japanese markets pose a barrier to EU export of ITA to Japan. Japan has taken
steps to simplify the product approval process firstly, by signing an EU-Japan MRA for tele-
communications terminal equipment in 2001, and secondly by introducing a Supplier’s Self
Verification of Conformity (SVC) in 2004. However, conformity assessment continues to
pose a barrier to ITA trade because the practical implementation of the SVC seems to be
lacking behind, and because the number of accredited testing bodies designated under the
MRA remains low.20 Also, the European Business Council (2009) finds that the SVC only
applies to wired telecommunications terminals, with limited application to wireless/radio
equipment.
Overall, we find that duplicative, cumbersome and non-transparent conformity assessment
requirements appear to constitute serious barriers to trade in ITA products. One way to re-
duce these barriers would be to implement the SDoC in countries that have very restrictive
conformity assessment requirements.
6.2. MODEL OF GLOBAL TRADE IN ITA PRODUCTS We analyse trade in the existing ITA products using a gravity model. Here we include vari-
ables such as tariffs, distance between the importer and the exporter, the size of the import
market, and cultural and linguistic barriers. The macroeconomic variables (GDP and GDP
per capita) and competitiveness indicators (R&D expenditures, internet access and patent
applications) are also included. Also, we include importer dummies to capture all factors that
influence trade and that do not vary over the time period being analysed. We see from Ap-
pendix 4 that these factors have the expected significant impact on ITA trade.
To account for the impact of conformity assessment requirements on trade in ITA products
we include dummy variables that reflect the conformity assessment system in place in the
importing country. We find that the less restrictive the conformity assessment system the
larger the import. In particular, we find that the SDoC system F (adopted by EU countries
in 2000) increased imports from other ITA countries by 26 percent. There was no signifi-
cant impact on imports from non-ITA countries, but it should be recalled that there is al-
most no imports from non-ITA members. Below we use these findings to quantify the pos-
sible impact on trade of implementing the SDoC system in countries that have more restric-
tive conformity assessment procedures.
20 See European Business Council (2009).

Expanding the Information Technology Agreement (ITA)
65
Trade barriers related to conformity assessment requirements
To quantify the trade impact of reducing NTBs related to multiple and non-harmonised
conformity assessment requirements, we used information on the conformity assessment sys-
tem in place in ITA countries. According to a document from the WTO Secretariat from
the working party on NTBs in the ITA21, the conformity assessment systems can be catego-
rised in seven different regimes listed as Type A through G. In the EU, for example, new
conformity assessment requirement procedures were adopted in 2000 that are categorised as
a so-called Type F CA system, cf. Table 6.2. The Type F CA system includes the SDoC type
4, where the supplier or manufacturer of the ITA product self-declares that the equipment
meets the technical and administrative requirement. The seven types of conformity assess-
ment become less and less restrictive as you move down the list: the Type A CA system is
more restrictive and the Type B CA system, the Type B CA system is more restrictive than
the Type C CA system and so forth.
Table 6.2 Description of conformity assessment system in place
CA Type Short Name Description
Type A Regulator Certification by a regulator or delegated entity – the equipment has to be submitted to the regulator or its delegated entity for certification.
Type B 3rd party CAB Certification by 3rd party conformity Assessment Body (CAB) – the equipment has to be submitted to certification bodies recognised (or approved) by the regulator for certification.
Type C SDoC Lab Test & Reg SDoC type 1 – the supplier or manufacturer of the equipment declares the equipment meets the technical and administrative requirement. A testing laboratory recognized by the regulator tests the equipment and the supplier registers this equipment with the regulator.
Type D SDoC Lab Test No Reg SDoC type 2 - the supplier or manufacturer of the equipment declares the equipment meets the technical and administrative requirements on the basis of test reports by a testing laboratory recognized by the regu-lator. No registration of the equipment with the regulator is required.
Type E SDoC Reg No Lab Test SDoC type 3 – the supplier or manufacturer of the equipment declares the equipment meets the technical and administrative requirement. The supplier registers the equipment with the regulator. Testing of the equipment by recognised testing laboratory is not mandatory. If testing is undertaken, the choice of the testing laboratory rests with supplier or manufacturer.
Type F SDoC No Test SDoC type 4 – the supplier or manufacturer of the equipment declares the equipment meets the technical and administrative requirement. Registration of the equipment with the regulator is not required and testing of the equipment by recognised testing laboratory is not manda-tory. If testing is undertaken, the choice of the testing laboratory rests with supplier or manufacturer.
Type G No mandatory No mandatory assessment procedure.
Note: Certification of third-parties typically involve laboratories that have met the government’s requirements for performing safety testing and certification of electrical and other products used in the workplace. NRTLs test and certify these products to determine whether they conform to appropriate US product-safety testing standards.
Source: G/IT/W/17/Rev.4 WTO (2007), Draft List of the Types of Conformity Assessments Procedures for EMC/EMI Used by ITA Participants.
21 See G/IT/W/17/Rev.4 WTO (2007), Draft List of the Types of Conformity Assessments Procedures.

Expanding the Information Technology Agreement (ITA)
66
As described in more details in Appendix 4, we construct four dummy variables based on the
different conformity assessment systems in place and include the dummies in the gravity
model:
� Conformity assessment Type AConformity assessment Type AConformity assessment Type AConformity assessment Type A----B: B: B: B: Includes countries with conformity assess-
ment systems of Type A (S. Korea, Taiwan and Macao China) and Type B (China,
India, Singapore, Honduras and Mauritius).
� ConformityConformityConformityConformity assessment Type Cassessment Type Cassessment Type Cassessment Type C----D: D: D: D: Includes countries with conformity assess-
ment systems of Type C (Jordan) and Type D (Japan, Switzerland and the US).
� Conformity assessment Type FConformity assessment Type FConformity assessment Type FConformity assessment Type F:::: Includes countries with conformity assessment
systems of Type F ( EU, Norway, Canada, Australia, New Zealand, Turkey, Do-
minican Republic and El Salvador).
� Conformity assessment Type GConformity assessment Type GConformity assessment Type GConformity assessment Type G:::: Includes countries with conformity assessment
systems of Type G (Hong Kong, Malaysia, Thailand and the Philippines).
The size of the CA dummies will reflect how ITA trade is affected by the conformity assess-
ment system adopted by the importing country. We use the Type A-B conformity assess-
ment system as benchmarks. Since these types of conformity assessment systems are the most
restrictive, we expect the other dummies to turn out positive in the gravity regressions. The
full set of regression results can be found in Appendix 4.
We find no measurable impact on trade depending on whether the importing country has
conformity assessment of type A, B, C or D (technically, as shown in Appendix 4, the Type
C -D dummy turns out to be insignificant). This means that countries with conformity as-
sessment types C or D do not import more than countries with type A or B. This may not
be surprising, since all four types require testing by a third party, which can be seen as costly
duplication of costs for the exporters. The main difference going to type C or D is the self-
declaration part, but these results on the impact on trade flows tells us that little is gains
from the self-declaration, when the requirement for third party testing is still in place.
On the contrary, going to type F, no third party testing is required, and we find clear and
significant evidence that the conformity assessment of Type F has a positive impact on im-
ports from other ITA countries: imports to countries with a conformity system categorised as
Type F is 26 percent higher compared to a situation where the importer country has a con-
formity assessment system of Type A, B, C or D in place. This result can be interpreted as
suggesting that the adoption of SDoC of Type F results in an increase in imports from ITA
countries of 26 percent. It shall be noted, that this impact is the average estimated impact
across all current ITA products. SDoC apply to a wide range of the current ITA products,
albeit not to all. The estimated average effect takes this in to account. The impact for indi-
vidual products may therefore be higher, while there would be no impact for products where
SDoC is not applicable.

Expanding the Information Technology Agreement (ITA)
67
We also find that there is a large and positive impact on trade for countries, as for example
Malaysia, with no conformity assessment requirements (Type G), and the results indicate
that absence of conformity assessment increases imports by several multiples.
Finally, there is a group of many countries, albeit small importers, for which the WTO Se-
cretariat provide no information about their conformity assessment system in place. These
countries are also found to import approximately 37 percent more than the countries with
the restrictive CA Type A and Type B - all other things being equal.
Figure 6.1 Trade impacts of different conformity assessment systems
Note: The model specification includes the CA systems Type C, D, F and G. No counties have adopted the CA Type E. CA Types A and B are used as benchmarks. The impact is therefore relative to a situation with Type A or B. Impact of having no conformity assessment requirements (Type G) is estimated to have very high impact on trade, and is not shown.
Source: Copenhagen Economics ITA gravity model.
In the next section we use the findings of the trade expansion potential reported above to de-
fine scenarios of NTB reduction, where barriers related to conformity assessment require-
ments are reduced amongst ITA-members.
Trade expansion potential from implementing the SDoC
When the EU countries introduced the SDoC they not only reduce barriers to intra-EU
trade but they also made it easier for other countries to export to the EU market. This is so
because the SDoC reduced NTBs caused by costly duplication of conformity assessment
procedures.
An OECD research paper, Fliess, Gonzales and Schonfeld (2008), looked at the introduc-
tion of SDoC for selected products in the EU and found that intra-EU trade increased by 11
percent when the SDoC was adopted whereas import from non-OECD countries increased
0%
26%
37%
0%
5%
10%
15%
20%
25%
30%
35%
40%
Type C or D Type F No information on CA
Trade expansion potential of implementing different SDoC types Trade expansion potential of implementing different SDoC types Trade expansion potential of implementing different SDoC types Trade expansion potential of implementing different SDoC types (% increase)
Expanding the Information Technology Agreement (ITA)
68
by 26 percent. The products were telecommunications equipment and low-risk medical de-
vices, i.e. including products that are within the scope of the ITA.
The introduction of SDoC reduces trade barriers, but the reduction was not reciprocal and
EU producers experienced a deteriorating market access relative to others. The NTB reduc-
tion was asymmetric: non-EU exporters were given improved access to the EU markets,
whereas the barriers facing EU exporters abroad were unchanged. By harmonising confor-
mity assessment procedures among ITA countries this asymmetry could be removed.
A “CA harmonisation scenario” within the ITA
To reflect this, we define a scenario where countries that have conformity assessment re-
quirements of Type A, B, C or D adopt a conformity assessment system of Type F. In this
scenario, no changes are assumed for countries that already have conformity assessment sys-
tem of Type F or G.
From the previous section we found that imports from ITA countries increased by 26 per-
cent when the conformity assessment of Type F is in place. We use this metric to quantify
the possible impact of Type F being implemented as a common approach between ITA
members, and is replacing the current system in countries with Type A through D. In the
CA harmonisation scenario, we assume that the same trade expansion will follow if other
countries implemented the same conformity assessment system.
6.3. IMPACT ON TRADE IN THE CA HARMONISATION SCENARIO In the scenario of CA harmonisation countries that currently have a CA type A, B, C or D
adopt the type F. From the gravity model we have found that such a reduction of NTBs to
trade in ITA products will bring an increase in imports of 26 percent. All these countries
therefore experience a 26 percent increase in imports from other ITA countries. At the same
time, these countries also trade with each other and the adoption of the SDoC also reduce
barriers to trade between them.
We find that total ITA export for ITA countries will increase by 10 percent in the scenario.
The countries which already have type F conformity assessment will only have positive ef-
fects on exports. Countries that are changing their conformity assessment system away from
their current and to type F will see both their exports and their imports increase. For some
the impact on net-exports is positive, for others it is negative. Countries that export a small
proportion of heir ITA goods to countries that change CA procedures, it means that they
have already benefited from type F in their major markets. Such countries will experience a
negative impact on net-exports. Some of the partners with type A to D today will have a
positive impact on net-exports.
Countries like China, Taiwan, Singapore and the US will experience a negative impact on
net exports, cf. upper part of Table 6.3.

Expanding the Information Technology Agreement (ITA)
69
Table 6.3 Trade impacts of SDoC scenario
Exporter Current CA
type
Share of export to CA type A-D (%)
Impact on ITA exports
(%)
Impact on ITA imports
(%)
Impact on ITA exports (billion €)
Impact on ITA imports (billion €)
Trade impacts in countries that do not have an SDoCTrade impacts in countries that do not have an SDoCTrade impacts in countries that do not have an SDoCTrade impacts in countries that do not have an SDoC
Korea A 57% 15% 26% 11.3 10.0
Taiwan A 57% 15% 26% 2.9 9.7
China B 38% 10% 26% 27.1 28.4
Singapore B 44% 12% 26% 11.8 13.6
India B 39% 10% 26% 0.3 3.3
Honduras B 26% 7% 26% 0.0 0.1
Jordan C 7% 2% 26% 0.0 0.2
Japan D 58% 15% 26% 16.6 12.6
United States D 33% 8% 26% 8.0 40.3
Switzerland D 21% 5% 26% 0.3 2.2
Trade impacts in the countries that already have Trade impacts in the countries that already have Trade impacts in the countries that already have Trade impacts in the countries that already have an an an an SDoCSDoCSDoCSDoC
EU F 43% 11% 0% 13.3 0.0
Canada F 76% 20% 0% 2.0 0.0
Australia F 33% 8% 0% 0.2 0.0
Norway F 27% 7% 0% 0.2 0.0 Dominican Rep. F 90% 23% 0% 0.1 0.0
El Salvador F 92% 24% 0% 0.0 0.0
New Zealand F 33% 9% 0% 0.0 0.0
Turkey F 3% 1% 0% 0.0 0.0
Malaysia G 69% 18% 0% 13.3 0.0
Philippines G 73% 19% 0% 6.7 0.0
Thailand G 60% 16% 0% 4.0 0.0
Hong Kong G 68% 18% 0% 0.4 0.0 Grand total Grand total Grand total Grand total for all ITA for all ITA for all ITA for all ITA countriescountriescountriescountries 40%40%40%40% 10%10%10%10% 12%12%12%12% 126.0126.0126.0126.0 110.3110.3110.3110.3
Note: The calculations are based on the scenario where ITA countries that have a CA type A-D adopt the SDoC. The calculation of the impact on imports is based on the gravity model result that imports increases by 26% when a country with restrictive conformity assessment procedures adopts the SDoC. The calculation of the impact on exports is based on the gravity model result that exports increases by 26% when a trading partner with restrictive conformity assessment procedures adopts the SDoC. Net export is defined as exports minus imports.
Source: Copenhagen Economics.
This will be the case when the increase in imports from other ITA countries is larger than
the increase in exports to the other countries that also adopt the SDoC. In the case of Korea
and Japan, we find that the increase in export to the other countries with type A to D is
strong enough to counterbalance the increase in imports from other ITA countries. Japan,

Expanding the Information Technology Agreement (ITA)
70
for example, will experience and increase in imports worth more than €12 billion and an in-
crease in exports worth around €16 billion. This means that the net impact on exports is a
gain worth more than €4 billion.
For the other ITA countries listed in the lower part of Table 6.3 there will be no impact on
imports and all the countries will therefore experience a net gain equal to the increase in ex-
ports to the countries that adopt the SDoC. The gain will therefore depend on the share of
export to countries with CA types A-D. In Canada 76 percent of its export goes to ITA
countries (mainly the US) and Canada will therefore experience an increase in its ITA ex-
ports equal to 20 percent. For the ITA countries as a whole the CA harmonisation scenario
will bring a gain in net export worth more than €15 billion.
Although the sample are somewhat different (particularly because our analysis excludes intra-
EU trade), these results are very much in line with the findings in Fliess, Gonzales and
Schonfeld (2008), who found that introducing the EU SDoC had a positive impact on im-
port from other EU countries and extra non-EU countries’ trade intensity, cf. Table 6.4.
Table 6.4 Impacts of introducing an SDoC Market entry Trade intensity
Intra-EU -3% 11%
Extra-OECD 3% -
Extra non-OECD 6% 26%
Source: Reproduced from Fliess, Gonzales and Schonfeld (2008).
6.4. CONCLUSION The harmonisation of conformity assessment will result in €13 billion additional export for
the EU according to these estimates. Compared with the possible increase from expansion of
the ITA in the product dimension, which is €3 billion (see Chapter 5), the increase in EU
exports is much higher from just resolving one of the NTBs. The expansion in the country
dimension (see Chapter 4) is not estimated to provide any increase in EU’s ITA exports.

Expanding the Information Technology Agreement (ITA)
71
Association of European Business in the Russian Federation (2009), Position Paper, http://www.aebrus.ru/application/views/FCKEditor/files/FCKEDITOR/File/PP2009SpringSummer.pdf.
Baller, S. (2007), “Trade effects of regional standards liberalization: A heterogeneous firms approach”, World Bank Policy Working Paper 4124, 2007.
Capannelli, Giovanni. (2009), Asian regionalism: How does it compare with Europe?
Copenhagen Economics (2010), Assessment of Barriers to Trade between the EU and Japan, paper commissioned by the European Commission DG Trade.
ECIPE (2008), “Trade in Information Technology Goods: Adapting the ITA to
21st Century Technological Change”, B. Hindley and I. Dreyer, ECIPE Working Paper No. 06/2008
Ecorys (2009), Study on non-tariff measures to EU-US trade and investment.
Edwards, L- and R. Z. Lawrence (2010), “Do Developed and Developing Countries Compete Head to Head in High Tech?” Working Paper Series, WP10-8, June 2010, Petersen Institute of International Economics, Washington, USA
EIU (2007), World investment prospects to 2011 - Foreign direct investment and the challenge of political risk, http://graphics.eiu.com/upload/WIP_2007_WEB.pdf
European Business Council (2009), Time for Change: The EBC Report on the Japanese Business Environment 2009.
European Business in China (2009), Position Paper, http://www.euccc.com.cn/view/media/publications .
European Commission (2009), United States Barriers to Trade and Investment Re-port for 2008.
European Commission (2008), Review of the ITA, http://trade.ec.europa.eu/doclib/docs/2008/september/tradoc_140592.pdf.
REFERENCES

Expanding the Information Technology Agreement (ITA)
72
Fliess, B., Gonzales, F. and Schonfeld, R. (2008), Technical Barriers to Trade: Evaluating the Trade Effects of Supplier’s Declaration of Conformity, OECD Trade Policy Working Paper 78.
Hogan and Hartson LLP (2003), The Economic Impact of Mutual Recognition Agreements on Conformity Assessment: A Review of the Costs, Benefits and Trade Effects Resulting from the European Community’s MRAs Negotiated with Australia and New Zealand, prepared under contract for the European Commission.
ITPS (2007), Foreign Controlled Enterprises 2006, ITPS, Östersund.
Jaruzelski. B. and K. Dehoff (2007), “The Customer Connection: The Global In-novation 1000”, Strategy+Business, Issue 49, published by Booz Allen Ham-ilton.
Johnson, C. (2008), “Technical barriers to trade: Reducing the impact of confor-mity assessment measures”, U.S. International Trade Commission, Office of Industries Working Paper No. ID-19.
KPMG (2002), Potential Impact of the CIPM Mutual Recognition Agreement, Fi-nal Report submitted to BIPM Sevres, France.
OECD (2005), Standards and Conformity Assessment: Minimizing Barriers and Maximizing Benefits: Workshop and Dialogue, Compilation of submissions, Berlin, 21-22 November 2005.
OECD (2006), Information Technology Outlook 2005.
OECD (2007), Information Technology Outlook 2006.
OECD (2008), Information Technology Outlook 2007.
OECD (2009), Information Technology Outlook 2008.
Peacock, S., Mortimer, D., Harris, A., Carter, R. and J. Richardson (2001), An Economic Analysis of Proposed Changes to the Conformity Assessment of Medical Devices, Centre for Health Program Evaluation, Technical Report 15.

Expanding the Information Technology Agreement (ITA)
73
Slaughter, Matthew, (2003), Tariff Elimination for Industrial Goods: Why the Gains Will Far Outweigh Any Losses.
TSAC, Telecommunications Standards Advisory Committee, (2001), Development of Asia-Pacific Economic Cooperation: Mutual Recognition Arrangements for Conformity Assessment of Telecommunication Equipment, TSAC Paper 17/2001, Office of the Telecommunication Committee.
U.S. International Trade Commission (1998), Global Assessment of Standards Bar-riers to Trade in the Information Technology Industry, Paper prepared for the Working party of the Trade Committee.
U.S. International Trade Commission (2010), The Information Technology Agreement: An Assessment of World Trade in Information Technology Products.
Vancauteren, M. (2009), Trade Effects of Approaches Intended to Facilitate Accep-tance of Results of Conformity Assessment: What is the Evidence?, paper pre-sented at the 2009 Workshop and Policy Dialogue on Technical Barriers to Trade.
WTO (2007), Japan’s Experience of Concerning Cross-border Designation Sys-tems, Submission by Japan, G/TBT/W/277, July 10.