Expanding the Horizons of Educational Pair Programming: A ...
128
Utah State University Utah State University DigitalCommons@USU DigitalCommons@USU All Graduate Theses and Dissertations Graduate Studies 5-2010 Expanding the Horizons of Educational Pair Programming: A Expanding the Horizons of Educational Pair Programming: A Methodological Review of Pair Programming in Computer Science Methodological Review of Pair Programming in Computer Science Education Research Education Research Keith B. Rimington Utah State University Follow this and additional works at: https://digitalcommons.usu.edu/etd Part of the Computer Sciences Commons, and the Science and Mathematics Education Commons Recommended Citation Recommended Citation Rimington, Keith B., "Expanding the Horizons of Educational Pair Programming: A Methodological Review of Pair Programming in Computer Science Education Research" (2010). All Graduate Theses and Dissertations. 601. https://digitalcommons.usu.edu/etd/601 This Thesis is brought to you for free and open access by the Graduate Studies at DigitalCommons@USU. It has been accepted for inclusion in All Graduate Theses and Dissertations by an authorized administrator of DigitalCommons@USU. For more information, please contact [email protected].
Transcript of Expanding the Horizons of Educational Pair Programming: A ...

Utah State University Utah State University
DigitalCommons@USU DigitalCommons@USU
All Graduate Theses and Dissertations Graduate Studies
5-2010
Expanding the Horizons of Educational Pair Programming: A Expanding the Horizons of Educational Pair Programming: A
Methodological Review of Pair Programming in Computer Science Methodological Review of Pair Programming in Computer Science
Education Research Education Research
Keith B. Rimington Utah State University
Follow this and additional works at: https://digitalcommons.usu.edu/etd
Part of the Computer Sciences Commons, and the Science and Mathematics Education Commons
Recommended Citation Recommended Citation Rimington, Keith B., "Expanding the Horizons of Educational Pair Programming: A Methodological Review of Pair Programming in Computer Science Education Research" (2010). All Graduate Theses and Dissertations. 601. https://digitalcommons.usu.edu/etd/601
This Thesis is brought to you for free and open access by the Graduate Studies at DigitalCommons@USU. It has been accepted for inclusion in All Graduate Theses and Dissertations by an authorized administrator of DigitalCommons@USU. For more information, please contact [email protected].

EXPANDING THE HORIZONS OF EDUCATIONAL PAIR PROGRAMMING:
A METHODOLOGICAL REVIEW OF PAIR PROGRAMMING
IN COMPUTER SCIENCE EDUCATION RESEARCH
by
Keith B. Rimington
A thesis submitted in partial fulfillment of the requirements for the degree
of
MASTER OF SCIENCE
in
Computer Science
Approved: _____________________________ Stephen W. Clyde, PhD Major Professor
_____________________________ Renée Bryce, PhD Committee Member
_____________________________ Daniel Watson, PhD Committee Member
_____________________________ Byron R. Burnham, EdD Dean of Graduate Studies
UTAH STATE UNIVERSITY Logan, Utah
2010

ii
Copyright © Keith Rimington 2010
All Rights Reserved

iii
ABSTRACT
Expanding the Horizons of Educational Pair Programming:
A Methodological Review of Pair Programming
in Computer Science Education Research
by
Keith B. Rimington, Master of Science
Utah State University, 2010
Professor: Dr. Stephen W. Clyde Department: Computer Science
Educators and researchers continue to explore the benefits, real or imagined, of
implementing pair programming as part of the computer science pedagogy. Current
reviews of computer science educational research practices do not focus on educational
pair programming. This thesis presents a review of the research methods used in recent
educational pair programming research. The primary purpose of this review is to inform
the ongoing dialogue about and to provide evidence-based recommendations for
improving educational pair programming research.
Replicating the design of a previous computer science education methodological
review, this study inspected a sample of 108 articles from a population of 129 of articles
related to educational pair programming published from 2000 to 2008. Articles were

iv
classified using a 112-variable taxonomy, identifying report elements, research
methodology, research design, kinds of variables inspected, and statistical practices.
Major findings include several differences between the methodological
characteristics of educational pair programming research when compared to general
computer science education research, including: (a) an increased proportion of studies
involving human participants, (b) a decreased proportion of quantitative methodologies,
and (c) an increased proportion of controlled research designs. There exists some minor
evidence that researchers affiliated with institutions in the United States are more likely
than their counterparts outside of the United States to inspect only student attitudes
and implement a posttest-only research design, and less likely to implement an
experimental or quasi-experimental methodology.
(127 pages)

v
ACKNOWLEDGMENTS
I greatly appreciate the assistance and support I received while conducting this
research.
I have tremendous admiration for and respect of Dr. Stephen Clyde, who
introduced me to this particular kind of research and mentored me through the process.
I am grateful also for the thoughtful contributions of Dr. Renée Bryce and Dr. Daniel
Watson.
I appreciate the excellent faculty and staff of the Utah State University
Department of Computer Science, most notably, each member of my committee, Myra
Cook, Dean Mathias, and Dr. Chad Mano. Each of these had special influence on my
interest in and satisfaction with the science of computing.
I wish to thank Justus Randolph, whom I have never met, but whose excellent
research was my guide.
I am grateful to my colleagues who, besides being excellent friends, helped me
to understand how a career in computer science can fit into a diverse, healthy, and
vibrant life. I also thank my employer and many scholarship providers who made
completing a graduate education possible for me.
I appreciate the lifelong contributions and support of my parents and siblings. I
especially appreciate my brother, Kevin, for numerous late hours listening to and
sharing ideas.
To my wonderful wife, Delores, I owe much of my success and happiness in life.
Her support, affection, wisdom, and love sustain me and give me value, purpose, and

vi
perspective. She is my greatest treasure, with whom I hope to spend eternity. For the
delightful sound of “Daddy!” and the musical babble of laughter, I am thankful to my
beautiful daughters.
Finally, to my God and His Son, who gave me life and light, I express my deepest
adoration and gratitude.
Keith B. Rimington

vii
CONTENTS
ABSTRACT ............................................................................................................................III
ACKNOWLEDGMENTS ......................................................................................................... V
LIST OF TABLES ................................................................................................................. VIII
LIST OF FIGURES .................................................................................................................. X
INTRODUCTION ....................................................................................................................1
METHOD ............................................................................................................................ 17
RESULTS............................................................................................................................. 23
DISCUSSION ....................................................................................................................... 48
CONCLUSION ..................................................................................................................... 67
REFERENCES ...................................................................................................................... 71
APPENDICES ...................................................................................................................... 74

viii
LIST OF TABLES
Table Page
1 Description of the Electronic Search for Representative Population .................. 18
2 Number of Articles Sampled by Year ................................................................... 19
3 Labels for Forums with the Greatest Number of Articles .................................... 24
4 Institutions with Greatest Number of Articles ..................................................... 24
5 Proportions of Report Elements .......................................................................... 26
6 Proportions of Articles Falling into Each Adapted Kinnunen Category ............... 27
7 Proportions of Articles Falling into Each of Valentine’s Categories .................... 28
8 Proportions of Articles Dealing with Human Participants ................................... 29
9 Proportions of Grade Level of Participants .......................................................... 29
10 Proportions of Undergraduate Level of Computing Curriculum ......................... 30
11 Proportions of Articles Providing Only Anecdotal Evidence ................................ 30
12 Proportions of Types of Articles Not Dealing with Human Participants .............. 30
13 Proportions of Methodology Types Used ............................................................ 31
14 Proportions of Types of Methods ........................................................................ 32
15 Proportions of Types of Experimental/Quasi-Experimental Designs Used ......... 32
16 Proportions of Types of Independent Variables Used ......................................... 34
17 Proportions of Types of Dependent Variables Measured ................................... 35
18 Proportions of Types of Mediating or Moderating Variables Investigated ......... 36
19 Proportions of Types of Measures Used .............................................................. 37
20 Proportions of Types of Inferential Analyses Used .............................................. 38

ix
21 Proportions of Types of Effect Sizes Reported .................................................... 38
22 Cross Tabulation of Anecdotal-Only Papers by Forum Type ............................... 41
23 Cross Tabulation of Experimental Papers by Forum Type ................................... 41
24 Cross Tabulation of Attitudes-Only Papers by Forum Type ................................. 41
25 Cross Tabulation of One-Group Posttest-Only Papers by Forum Type ............... 42
26 Cross Tabulation of Anecdotal-Only Papers by Year ........................................... 43
27 Cross Tabulation of One-Group Posttest-Only Papers by Year ........................... 43
28 Cross Tabulation of Experimental Papers by Year ............................................... 43
29 Cross Tabulation of Attitudes-Only Papers by Year ............................................. 44
30 Cross Tabulation of Attitudes-Only Papers by Region of Affiliation .................... 46
31 Cross Tabulation of Experimental Papers by Region of Affiliation ...................... 46
32 Cross Tabulation of One-Group Posttest-Only Papers by Region of Affiliation .. 46
33 Cross Tabulation of Anecdotal-Only Papers by Region of Affiliation .................. 47
34 Profile Comparison of Educational Pair Programming Research ........................ 61

x
LIST OF FIGURES
Figure Page
1 Proportions of articles published in each forum ................................................. 23
2 Frequency of articles published by number of authors ....................................... 25
3 Comparison of proportions of report elements between studies ...................... 27
4 Comparison of proportions of research designs between studies ...................... 33

INTRODUCTION
As the practice of pair programming gathers popularity in industry, educators
increasingly explore the benefits, real or imagined, of implementing pair programming
into computer science education (CSE). Because research results about educational pair
programming have the potential to affect policy regarding the use of pair programming
as a pedagogical tool, and because changes in policy affect the lives and educational
quality of human students, it is important to ensure high quality research methodology.
A review of research methods in the current body of literature, called a methodological
review (Randolph, 2007, pp. 1-2), can identify areas of improvement to the science and
inform dialogue about the scope, quality, and direction of current research efforts.
Pair programming research is a young field, and pair programming in CSE even
younger. This author found no published review that evaluates the methods used in
educational pair programming research. Hence, this study is the first of its kind. While
some related reviews exist, they are either of a different kind, such as meta-analysis, or
of a different scope, such as general computer science education. In an effort to fill the
gap in the current research, and promote the improvement of research practices in the
field, I conducted a thorough methodological review on a representative sample of all
the pair-programming-related research articles published in major computer science
education research journals and conferences from 2000-2008.
This thesis builds upon the work of Randolph (2007), who conducted a rigorous
methodological review sampling articles from all areas of CSE research. I modeled this
study after Randolph’s in an effort to achieve the same goals stated by Randolph: To

2
“make a contribution to the field by supplying a solid ground on which to make
recommendations for improvement and to promote informed dialogue about computer
science education research” (Randolph, p. 2).
The results of this methodological review promote improvement of educational
pair programming research practices, the natural consequence of which is improvement
in computer science instructional methodology, and ultimately improvement in student
success.
Pair Programming in Computer Science Education
Pair programming is a relatively new practice that extends the concept of
collaborative development by assigning two developers to a single workstation.
Programmers actively collaborate using a role-based protocol (Williams, 2007). In
industry, the practice of pair programming was popularized by agile programming
methodologies such as extreme Programming (XP) (Beck, 2001). The application of pair
programming to computer science education began to appear in the literature in the
late 1990’s (Keefe, Sheard, & Dick, 2006).
Recent studies explore the use of pair programming in a variety of situations, for
example, by implementing variations in pair selection methods, pair trading strategies,
paired task characteristics, and combinations of other software development
methodologies. The diversity of contexts combined with the tendency for reports to
contain positive results from the application of pair programming strengthen the case
for its use in computer science pedagogy. Benefits reported include:

3
Increased student success (Williams, Wiebe, Yang, Ferzli, & Miller, 2002),
High confidence, enjoyment, and perception of learning (Williams, 1999),
Improved retention, confidence, and program quality (McDowell, Werner,
Bullock, & Fernald, 2006),
Improved success for women (Werner, Hanks, & McDowell, 2004), and
Improved student grades, and improved success rates on solo exams in
courses that used pair programming on assignments (Williams, McDowell,
Nagappan, Fernald, & Werner, 2003).
There exist some doubt and disagreement among researchers regarding the
value of pair programming in computer science education despite the broad spectrum
of measured benefits. Notwithstanding the evidence in favor of the practice, some
researchers, such as Hulkko and Abrahamsson (2005) and Reges (2006), have reported
contradictory results or doubt the validity and general applicability of the practice. It is
reasonable to speculate that this doubt arises from one of two causes, namely that
current empirical evidence favoring pair programming may be insufficient, or that it may
be the case that the quality of empirical evidence is inadequate.
Heany and Daly (2004) described the current condition of pair programming
research, claiming that current studies “fail to conclusively show that pair programming
improves learning, but our hunch is that it does when used correctly” (p. 117). Valentine
(2004) echoed the sentiment that current research methods are inadequate when
describing so-called “Marco Polo” papers, which he described as “a staple at the
[SIGCSE] Symposium,” in which “reasoning is defined, the component parts are

4
explained, and then… a conclusion is drawn like ‘Overall, I believe the *topic+ has been a
big success’” (p. 256).
Anecdotal papers such as these are not without value to the community, as they
can encourage the reader to consider and explore new ideas, and even stimulate ideas
for empirical research; however, as research they are susceptible to nearly every threat
to internal validity, and often lack reliable analysis, replicability, and appropriate
application of the scientific method.
Applying Methodological Review to Improve Practice
When research has the potential for affecting changes in policy or practice,
researchers must bear the responsibility of ensuring high quality in research practices.
Krippendorff (2004) describes the ethical requirement of ensuring high research quality,
stating that when findings can “aid business decisions…, categorize people, or affect the
lives of individual human beings in other ways, wrong conclusions may have costly
consequences” (p. 316). He calls for the use of content analysis, arguing, “Validation
reduces the risk of making decisions based on misleading research findings” (p. 316).
Thus, uncertainty in the findings of researchers regarding the educational quality
of pair programming invites content analysis practices such as methodological reviews
to validate and provide direction for the current research.
Krippendorff (2004) identifies the characteristics of effective content analysis,
describing it as a scientific technique “learnable and divorceable from the personal
authority of the researcher,” that must be reliable and “should result in findings that are
5
replicable” (p. 18). For these reasons, well-designed methodological reviews do not
require extensive experience or expertise in the field in order to yield valid and
convincing results.
Methodological reviews differ in kind from typical content analyses, which
generally focus on aggregating or comparing results across a body of research.
Methodological reviews, instead, focus on “the research process, that is, the methods
by which a research topic is addressed, including research design and statistical analyses
issues” (Keselman et al., 1998, p. 350). Methodological reviews have the capability of
informing editorial decision making and influencing methodological practice.
Furthermore, methodological reviews can provide guidance to educators who mentor
student researchers to ensure that “students have adequate skills to interpret the
published literature of a discipline and to carry out their own projects” (Keselman et al.,
1998, p. 351).
Randolph (2007) described two conditions under which a methodological review
can provide valuable recommendations for process and policy improvement:
…The first is when there is consensus among experts for “best practice” but actual practice is expected to fall far short of best practice. The methodological review can identify these shortcomings and suggest policies for research funding and publication. For example, in the Keselman and colleagues (1998) review, they found that there was a difference between how statisticians use ANOVA and how social science researchers use ANOVA. Thus, the rationale for the Keselman and colleagues review was that the recommendations given by the statisticians could benefit the research practices of the social science researchers. The second condition is when there are islands of practice that can benefit from exposure to each other—for example, when there are groups that practice research in different ways or at different levels. (pp. 15-16)

6
CSE researchers do not overlook the need to reach across islands of practice and
determine best practices. Indeed, Goldweber and colleagues have urged drawing upon,
when possible, existing methodologies, stating (emphasis added):
To date much of what is published as [computer science education research] (called “research” or not) has been concerned with noticing phenomena: “This is what happens when I teach x in this way.” What moves recognition of phenomena to evidence is purposeful investigation and a relationship to theory…. …We need to go beyond “this works for me” to draw upon - even develop - theories of action, and report studies designed to illuminate them. (Goldweber, Clark, Fincher, & Pears, 2004)
Insofar as research of pair programming in computer science education is a
subset of general CSE research, the need to draw upon existing, interdisciplinary
strategies and best practices is essential to advancing the field.
A Review of Related Methodological Reviews
Methodological reviews are not new to CSE research or to pair programming
research; however, there do not appear to be reviews specifically addressing the
intersection of the two fields. Here, I summarize the findings of several methodological
reviews closely related to research of either computer science education or of pair
programming. For a more comprehensive summary of computer science education
methodological reviews, see Randolph (2007, p. 24).
Valentine (2004) presented a methodological review of articles published as part
of the annual SIGCSE Technical Symposium. He evaluated two criteria for each article,
namely, whether or not the article dealt with first-year college students, and which of

7
six defined content categories best describes the report style. With a little humor,
Valentine defined the content categories as:
Experimental, or applying any kind of scientific analysis,
Tool presentation or evaluation,
Philosophical, or initiating a discussion or debate,
Marco Polo, the label for most non-experimental case studies,
John Henry, the tall tales of the Symposium, and
Nifty, the so-called “icing on the cake” of the Symposium. (pp. 256-257)
Of the 444 articles in the sample reporting research on first-year undergraduate
students, Marco Polo papers, experimental studies, and tool descriptions comprised
most of the articles in Valentine’s (2004) sample. The proportions of articles for each
category grouped by year provides evidence of a decreasing yearly trend in the
proportions of Marco Polo papers and an increasing yearly trend in the proportions of
experimental papers. As a result of this methodological review, Valentine issued a
challenge to SIGCSE members to “push their presentations *to the+ next step”, that is,
expend at least the minimal level of effort to upgrade a Marco Polo case study to an
experimental study (p. 259). He argued that the level of effort necessary should be small
in comparison to the effort already spent on the tool or the intervention that must
otherwise be presented as a Marco Polo paper.
Perhaps the most rigorous and comprehensive review of computer science
education research is the study conducted by Randolph (2007) as a doctoral
dissertation, which evaluates characteristics and relationships in the kinds of research
generally accepted by computer science education journals and conferences. The scope
of this work is both large, including 352 research articles from a collection of 1306
articles and conference publications, and broad, utilizing a 111-point scale (of which,

8
Valentine’s content category was one) for evaluating and research publications and
defining the taxonomy. For convenience in comparison later, listed below is Randolph’s
summary of results.
About one third of articles did not report research on human participants.
Most of the articles that did not deal with human participants were program descriptions.
Nearly 40% of articles dealing with human participants only provided anecdotal evidence.
Of the articles that provided more than anecdotal evidence, most articles used experimental/quasi-experimental or explanatory descriptive methods.
Questionnaires were clearly the most frequently used type of measurement instrument. Almost all of the measurement instruments that should have psychometric information provided about them did not have psychometric information provided.
Student instruction, attitudes, and gender were the most frequent independent, dependent, and mediating/moderating variables, respectively.
Of the articles that used an experimental research design, the majority used the one-group posttest-only design.
When inferential statistics were used, the amount of statistical information used was inadequate in many cases (pp. 128-129).
Additionally, Randolph analyzed and compared several subgroups in the sample,
finding quantitative evidence of the following:
There was a decreasing yearly trend in the number of anecdotal-only articles and in the number of articles that used explanatory descriptive methods.
First authors affiliated with North American institutions tended to publish papers in which experimental/quasi-experimental methods were used; first authors affiliated with Middle Eastern or European institutions tended to not publish papers in which experimental or quasi-experimental methods were used.
First authors affiliated with Middle Eastern institutions strongly tended to publish explanatory descriptive articles.
First authors affiliated with Asian-Pacific or Eurasian institutions tended to publish articles in which attitudes were the sole dependent variable; and
First authors affiliated with North American institutions tended to publish more anecdotal-only articles than their peers in other regions. However this proportion had been decreasing linearly over time. (p. 130)

9
True to the promise that methodological review can promote informed dialogue
and effect change, Randolph’s dissertation sparked discussion and action in the SIGCSE
community. Lister (2007) published an invited column that both criticized an inadequate
analysis of qualitative methods, and generally agreed with most of Randolph’s findings
while urging the SIGCSE community to improve the quality and image of the research.
Simon, and colleagues, conducted a classification of CSE literature published in the first
three years of the International Workshop on Computing Education (Simon et al., 2008).
Sheard, Simon, Hamilton, and Lönnburg (2009) recently reported a methodological
review with results that validate some of Randolph’s findings, and that explore in more
detail the methodological characteristics of qualitative studies published in six major
forums.
In a predecessor to the methodological review cited above, Randolph, Bednarik,
and Myller (2005) examined research articles published in the Koli Calling conference
held near Helsinki in an effort to improve the quality of research published in that
forum. Because the Koli Calling conference was very young (4 years) at the time, a
methodological review could carry exceptional influence to shape and direct the future
of the conference. Like the journal articles and conference proceedings Randolph
reported on in 2007, empirical studies in Koli Calling extensively used exploratory
descriptive and quasi-experimental methodologies. Unlike Randolph’s 2007 report,
findings in the Koli conference consisted mostly of program or project descriptions, and
deviated “sharply from structures that are expected in behavioral science papers”

10
(2005, p. 107). With this information, Randolph provided credible and informed
recommendations to improve the quality of the conference.
More recently, Randolph (2008) reported an evaluation of methods used in 29
program evaluations for K-12 classrooms published between 1971 and 2005. The intent
of the review was to promote improvement of instruction for young computer science
students. Using a scale similar, though smaller, than the one described above, Randolph
identifies several strengths and weaknesses in the current body of program evaluations.
Strengths reported include the following: first, most program evaluations
preferred the use of tests and direct observation over surveys with self-reports of
learning; second, experimental designs exhibited good design characteristics and
adequate controls; and, third, the research exhibited a broad spectrum of
methodologies, including exploratory, experimental and qualitative designs.
Weaknesses reported include lack of reliability measures in the data,
underrepresentation of studies measuring computer science achievement, gender
factors, and lack of the level of detail necessary for evaluations to be replicated using
only information available in the report. As with his other reviews, Randolph provides
recommendations for research improvement with potential to affect the success of K-12
computer science students positively.
Hulkko and Abrahamsson (2005) reported a small methodological review of pair
programming research. They identified an increasing trend in yearly publication rates
from 1998 to 2004, and evaluated two methodological characteristics, namely:

11
Type of study, any of survey, experiment, case study, or experience report,
and
Context under which pair programming research took place, for example, as
a component of extreme programming, pair programming effects on a
software development project, or pair programming educational topics. (pp.
496-497)
Educational pair programming represents the second largest pair programming
context reported in the study; however, the sample size was sufficiently small that the
authors only conclude that “studies focused on using pair programming for educational
purposes in university settings have not been thoroughly explored” (p. 496). The
product of the review consists of a family of research questions classified as having or
not having empirical evidence.
Purpose, Questions, and Hypotheses
The intent of this thesis is to analyze the state of pair-programming research in
CSE and make credible recommendations toward improving research methods. To do
so, I answered the following research question, adapted from Randolph (2007, pp. 39-
41): What are the methodological properties of research reported in articles in major
computer science education research forums related to pair programming from the
years 2000-2008? Following Randolph’s model, the question contains the following sub-
questions:

12
1. What is the proportion of articles that reported research on human
participants?
2. Of the articles that did not report research on human participants, what
types of articles are being used and in what proportions?
3. Of the articles that did report research on human participants, what
proportion provide only anecdotal evidence for their claims?
4. Of the articles that reported research on human participants, what types of
methodologies are used and in what proportions?
5. Of the articles that report research on human participants, what measures
were used, in what proportions, and was psychometric information
reported?
6. Of the articles that report research on human participants, what are the
types of independent, dependent, mediating, and moderating factors
examined and in what proportions?
7. Of the articles that used experimental methodologies, what types of designs
were used and in what proportions, and were participants randomly assigned
or selected?
8. Of the articles that reported research on human participants, what are the
characteristics of the articles’ structures?
9. Of the articles that reported quantitative results, what kind of statistical
practices were used and in what proportions?

13
Supplementing these eight descriptive questions are additional questions about
associations, or islands of practice, within the data. The intent of these questions is to
provide insight into trends in practice, and identify with greater precision areas
requiring improvement.
The three associative questions, each of which requires inspection of four
associations, are as follows:
1. Is there an association between type of publication (whether articles are
published in conferences or in journals) and frequency of articles providing
only anecdotal evidence, frequency of articles using experimental/quasi-
experimental research methods, frequency of articles in which the one-group
posttest-only design was exclusively used, and frequency of articles in which
attitudes were the sole dependent variable?
2. Is there a yearly trend (from 2000-2008) in terms of the frequency of articles
providing only anecdotal evidence, frequency of articles using
experimental/quasi-experimental research methods, frequency of articles in
which the one-group posttest-only design was exclusively used, and
frequency of articles in which attitudes were the sole dependent variable?
3. Is there an association between the region of the first author’s institutional
affiliation and frequency of articles providing only anecdotal evidence,
frequency of articles using experimental/quasi-experimental research
methods, frequency of articles in which the one-group posttest-only design

14
was exclusively used, and frequency of articles in which attitudes were the
sole dependent variable?
These questions specify 12 contrasts, which is fewer than the fifteen analyzed by
Randolph. The reason for this is that the data are inadequate to inspect associations
related to rates of explanatory descriptive articles.
Because pair programming pedagogy is a subcomponent of computer science
pedagogy, it seemed reasonable to predict that there would be no significant difference
between results obtained by this sample and the sample reported by Randolph (2007,
pp. 128-129). Expected results are as follows:
1. About one third of articles will not report research on human participants.
2. Most articles not dealing with human participants are program descriptions.
3. Many articles dealing with human participants provide only anecdotal
evidence.
4. Of empirical articles, most use experimental, quasi-experimental or
explanatory descriptive methods.
5. Questionnaires will be the most frequently used type of measurement
instrument. Nearly all instruments will lack psychometric information,
6. Student instruction, attitudes, and gender will be the most frequent
independent, dependent, and mediating/moderating variables, respectively.
7. Most experimental studies will use the one-group posttest-only design,
8. When reporting inferential statistics, the amount of statistical information
will usually be inadequate.

15
Also, I predicted that there would be small, but significant trends in the types of
articles published yearly and that associations exist between region of first author’s
affiliation and the types and quality of articles published by the author.
Biases
As a professional developer, I advocate the use of pair programming to improve
program understanding, code quality, process adherence, and team cohesion. I believe
that when used properly, pair programming can enhance computer science instruction;
however, I acknowledge that the meaning of “used properly” has not been fully
explored.
This study inherits most of its design from the work of Randolph (2007) and,
consequently, it inherits many of his biases, which Randolph describes as the “biases of
a quantitatively trained behavioral scientist” (p. 45). I recognize that this research design
favors and emphasizes quantitative methods. I do not have the opinion that quantitative
methods are necessarily superior to qualitative methods; however, I believe that
exercising forethought and methodological rigor is the ethical duty of contributors to
science, regardless of methodology.
I once had a conversation with a student who, after I described to him the topic
of this thesis, remarked while gesturing toward the university, “If they did that *pair
programming], I would still be in Computer Science.” I believe this student’s sentiment
represents the sentiments of a nontrivial proportion of students having potential in

16
computer science, and warrants serious consideration by educational institutions
worldwide.

17
METHOD
The model for this study is Randolph’s (2007) thorough methodological review.
Most of the variables of the study, their corresponding operationalization, the coding
form and coding book, are derived from it, with modifications as seemed appropriate
for a population of research articles focused on Pair Programming in CSE.
This research represents both a replication and an extension of Randolph’s
study: a replication because many of the core components and analyses of Randolph’s
study are repeated, and an extension due to the application of the current study to a
different population.
This section, describes the process used to obtain the sample, code each
variable, and analyze the resulting data set.
Sample
I collected a random sample, without replacement, from a representative body
of peer-reviewed literature articles addressing pair programming in CSE. Collecting the
representative body of literature involved a combined search from the following
databases: the ACM digital library, IEEE digital library, and Ebsco Host.
Table 1 presents a summary of the search results, wherein only unique entries
are reported for each subsequent query.
A precursor to the main study was an initial review of the complete sample
literature to remove irrelevant articles and ensure the quality of the sample. I
operationalized relevance as having the following characteristics: (1) the article was

18
Table 1
Description of the Electronic Search for Representative Population
Search Date Term(s) Database Records
1 6-8-2008 “pair programming” IEEE Library 74 2 6-8-2008 “paired programming” IEEE Library 3 3 6-8-2008 “pair programming” Ebsco Host (Computer
Source) 21
4 6-8-2008 “paired programming” Ebsco Host (Computer Source)
0
5 6-13-2008 “pair programming” “computer science education”
ACM Library 165
6 6-13-2008 “pair programming” ACM Library 4
published between 2000 and 2008; (2) the topic of pair programming receives more
attention in multiple paragraphs or sections; and (3) the authors discuss pair
programming in the context of CSE or use a student sample. The rationale for including
articles not explicitly CSE-oriented, but use a student sample, is because the classroom
environment differs significantly from industry (Bryant, 2004, pp. 55-56). Of 267 articles,
only 129 qualified under this definition of relevance.
I estimated the size of the population expected after a single-level hand
branching search of references to be 150. To enable statistical analyses and promote
generalizability of results, determining an appropriate sample from the population was
necessary. Selecting a random subsample of the discovered population decreases the
risk of the external threat to validity caused by convenience sampling (Cohen, 2001, p.
9). The size of the sample, 108 articles, was determined using an online tool (Sample
Size Calculator, 2008), configured with the estimated population size of 150, confidence
interval 5%, and confidence level α = .05. These 108 were subsequently drawn without

19
replacement and coded in the order they were drawn. Appendix A lists the articles
selected for the sample.
It was necessary to remove two articles from the sample due to incorrect
classification during the initial review, resulting in a final sample size of 106. This
resulted in a trivial weakening of the confidence interval, 5.17%, as calculated using the
online tool, assuming that the true population size contains 150 articles.
Table 2 presents the number of articles collected and the number of articles
randomly selected, grouped by year of publication. Note that the random sample omits
the two incorrectly classified articles while the total sampling frame includes all 129
articles. The total numbers of articles discovered before screening for relevance are not
reported. Note that the year 2008 had not completed at the time of the sampling.
Table 2
Number of Articles Sampled by Year
Year Random Sample Sampling Frame
1999 1 1 2000 2 3 2001 5 6 2002 3 6 2003 14 15 2004 12 14 2005 22 28 2006 23 28 2007 11 13 2008a 13 15 Total 106 129 a Because the sample was selected in June, 2008, this row does not accurately represent the proportion of articles published in 2008.

20
Coding
As with Randolph’s study, the instrument rates articles for “demographic
characteristics, type of article, type of methodology used, type of research design used,
independent variables examined, measures used, and statistical practices” (2007, p. 52).
I adapted some parts of Randolph’s instrument as seemed appropriate, mostly where
changes involved customizing the format of the coding book, correcting typographical
errors, or adapting categories to reflect those expected from pair programming
research.
The adapted code sheet and coding book, listed in Appendices B and C, include
detailed instructions on how to encode each variable. Randolph provides a thorough
discussion of the instrument, to which the reader can refer for the background and
derivation of each variable (2007, pp. 233-262). This section provides a brief summary of
changes to the original instrument.
Adaptations to variables describing article demographics include the following:
No case number category as assigned,
No volume number for the publication forum was collected, except as
accounted in the references (Appendix A), and
No issue number for the publication forum was collected, except as
accounted in the references (Appendix A).
Adaptations to the variables describing article types include the following:
Some of Kinnunen’s categories, which were not relevant to the study of pair
programming, were modified accordingly, and
21
Type of abstract was replaced with an indication of whether the abstract was
present.
Adaptations to the variables describing independent variables or interventions
included:
Whether the use of pair programming, pair designing, or pair testing, was an
intervention.
Variables describing report structure, methodology type, experimental research
designs, factors, or statistical practices, are unmodified. Not reported here are details
for any typographical or formatting modifications.
Analysis
To answer the research questions, I performed several kinds analysis on the
data, modeled after the analyses reported by Randolph. Randolph reported three
general kinds of analyses: first, aggregate statistics of the probabilities of each variable;
second, association tests for each of the 15 planned contrasts; and, third, logistic
regression for discovering predictive models for certain characteristics. This study
includes replications only of the first two kinds of analyses.
I selected C#.NET 3.5 SP1 as the language to take advantage of the rich predicate
logic capabilities and LINQ for filtering or transforming the data. The original statistics
code listing is available in Appendices D and E. To create a data store compatible with
the LINQ technology required that data be transferred from handwritten coding forms

22
to a SQL Server 2008 database, with intermediate migrations to an OpenOffice.org
spreadsheet, a Microsoft Office spreadsheet, and a Microsoft Office Access database.
To answer the primary research question, I computed frequencies of responses
for each variable, along with confidence intervals using the following resampling
strategy:
We assume that the population is distributed exactly as is the sample. We randomly draw one score from the sample. We record it, replace it, and draw another…. We compute the median of the obtained resample and record it. We repeat this process, obtaining a second sample… and computing and recording a second median. We continue until we have obtained a large number (10,000 or more) of resample medians. We obtain the probability distribution of these medians and treat it like a sampling distribution. From the obtained sampling distribution, we find the .025 and the .975 percentiles. These define the confidence limits. (Wuensch, 2007)
Original code for computing the confidence intervals is reported in Appendix D.
To answer the second research question, I cross tabulated each of the planned
contrasts and analyzed standardized Pearson residuals, as described by Simonoff (2003,
pp. 215-298). For the categorical comparison variables, I also inspected Pearson’s chi-
square test of association as described by Cohen (2001, pp. 642-650). For ordinal
comparison variable, I inspected the M2 statistic described by Agresti, due to its
increased sensitivity to correlational data (Agresti, 2007, pp. 41-42). Original code for
computing residuals, χ2, and M2 is available in Appendix E.
It happened to be the case that too few empirical articles reported explanatory
descriptive methodologies to provide credible analysis in the cross tabulations. As a
result, I omitted the three planned contrasts using explanatory descriptive
methodologies. Consequently, this study contains only the remaining 12.

23
RESULTS
To facilitate comparison between the result of this study and Randolph (2007)
wherever possible, this section contains aggregated results and twelve predetermined
cross tabulations using a similar organization and structure. Compare Randolph (2007,
pp. 65-126).
Aggregated Results
General Characteristics
Forum in which article was published. Figure 1 presents the relative
representation of each forum, adjacent to the equivalent metric from Randolph et al.
(2005, p. 49). Table 3 contains full forum names listed by label. Also listed is the forum
classification as either a journal or a conference. Note that some articles published in
Bulletin, JCSC, and CSE are classified as journals, while it is true that some articles
published in those forums were once conference proceedings.
Figure 1. Proportions of articles published in each forum.
0%
10%
20%
30%
40%
50%
Randolph 2007 Rimington

24
Table 3
Labels for Forums with the Greatest Number of Articles
Label Forum Name Classification
Bulletin SIGCSE Bulletin Journal CSE Computer Science Education Journal JCSE Journal of Computer Science Education Online Journal SIGCSE SIGCSE Technical Symposium Conference ITiCSE Proceedings of the Innovation and Technology in Computer Science
Education Conference Conference
Koli Coli Calling: Finnish/Baltic Sea Conference on Computer Science Education
Conference
ACE Proceedings of the Australasian Computing Education Conference Conference ICER International Computer Science Education Research Workshop Conference FIE ASEE/IEEE Frontiers in Education Conference Conference ICSE International Conference on Software Engineering Conference
Classification of the random sample by forum type resulted in the following: 63
(59.4%) were published in conference proceedings, 40 (37.7%) were published in
journals, and three (2.8%) were published via other means. These proportions differ
substantially from the sample obtained by Randolph for conferences and journals, which
were 76.4% and 23.6%, respectively.
First authors whose articles were most frequently sampled. The first authors
most frequently sampled by this study were Laurie Williams with thirteen articles,
Gerardo Canfora and Brian Hanks with five articles each, Matthias Müller with four
articles, and Charlie McDowell and Shaochun Xu with three articles each. All other
authors were sampled two or fewer times. A total of 69 first authors contributed to the
sample.
First authors’ affiliations. The first authors of the sample represent 61 distinct
institutions. Table 4 presents the quantity of articles from the most frequently
represented institutions and the proportion of sample represented by each institution.

25
Table 4
Institutions with Greatest Number of Articles
Content category Number of articles in the
sample Proportion
North Carolina State University 20 18.9 University of California, Santa Cruz 6 5.7 University of Sannio 5 4.7 Universität Karlsruhe 4 3.8 Fort Lewis College 4 3.8 Fayetteville State University 3 2.8 Other Institutions 64 60.3 Total 106 100.0
Median number of authors per articles. The median number of authors on the
selected articles was 2, with a minimum of 1, maximum of 8, with first and third
quartiles of 2 and 5. The 2.5th and 97.5th percentiles of the median from 10,000 samples
of size 106 were 2 and 3. Figure 2 presents the distribution of articles in the sample
grouped by number of authors.
Median number of pages per article. The median number of pages in the sample
was 7, with a minimum of 2 and a maximum of 30, first quartile of 5 and third quartile of
Figure 2. Frequency of articles published by number of authors
0
5
10
15
20
25
30
1 2 3 4 5 6 7 8
Nu
mb
er o
f ar
ticl
es s
amp
led
Number of authors

26
10. The 2.5th and 97.5th percentiles of the median from 10,000 samples of size 106 were
6 and 8.
Report elements. Table 5 presents the proportion of articles dealing with human
participants having elements considered necessary by the American Psychological
Association for empirical publications (American Psychological Association, 2001, pp. 10-
29). Figure 3 visualizes a comparison between report structure reported in this study to
report structure reported by Randolph (2007, p. 75). Note that Randolph reported low
levels of inter-rater reliability for some of the variables that appear to have the greatest
difference, such as literature review present, purpose stated, setting described,
procedure described, and results and discussion separate.
Kinnunen’s content categories. Table 6 presents the proportions of articles falling
into each of several content categories adapted from the Kinnunen’s Content Category
Table 5
Proportions of Report Elements
Report element n
(of 91) % Lower CI
95% Upper CI
95%
Abstract present 89 97.8 94.5 100.0 Problem is introduced 90 98.9 94.5 100.0 Literature review present 72 79.1 70.3 86.8 Purpose/rationale stated 83 91.2 84.6 96.7 Research questions/hypotheses stated
42 46.2 36.3 56.0
Participants described 79 86.8 79.1 93.4 Setting adequately described 85 93.4 87.9 97.8 Instrument adequately described 43 47.3 37.4 57.1 Procedure adequately described 50 54.9 45.1 64.8 Results and discussion separate 56 61.5 51.6 71.4
Note. Column marginals do not sum to 91 (or 100%) because more than one methodology type per article was possible.

27
Figure 3. Comparison of proportions of report elements between studies
Table 6
Proportions of Articles Falling into Each Adapted Kinnunen Category
Content category n % Lower CI
95% Upper CI
95%
SE methodologies in CSE 64 60.4 50.9 69.8 New way to organize a course 17 16.0 9.4 23.6 SE methodology in industry 15 14.2 7.5 20.8 Tool 8 7.5 2.8 13.2 Other 1 0.9 0.0 2.8 Curriculum 1 0.9 0.0 2.8 Total 106 100.0
(Randolph, 2007, pp. 246-247). The table shows that most articles from this sample
addressed the application of some software engineering principle to CSE. Note that my
confidence in the correctness of this variable is low because some of the categories
selected were not mutually exclusive. Due to the adaptation of this variable,
comparisons cannot be drawn to results reported by Randolph.
Valentine’s research categories. Table 7 presents the proportions of articles
distributed among Valentine’s research categories. Experimental and Marco Polo
studies comprised over 82% of the sampled literature. A greater proportion (48.1%) of
020406080
100
Pair Programming (Rimington) CSE (Randolph)

28
Table 7
Proportions of Articles Falling into Each of Valentine’s Categories
Content category n % Lower CI
95% Upper CI
95%
Experimental 51 48.1 38.7 57.5 Marco Polo 36 34.0 25.5 43.4 Philosophy 12 11.3 5.7 17.9 Tools 6 5.7 1.9 10.4 Nifty 1 0.9 0.0 2.8 John Henry 0 0.0 Total 106 100.0
articles in this sample reported on experimental studies than in the sample reported by
Randolph (40.9%), while a lesser proportion (5.7%) of articles in this sample reported on
tools than in the sample reported by Randolph (12.5%). Differences in the proportions
of others of Valentine’s categories were negligible. Note that confidence intervals for all
of Valentine’s categories reported in this overlap confidence intervals reported by
Randolph.
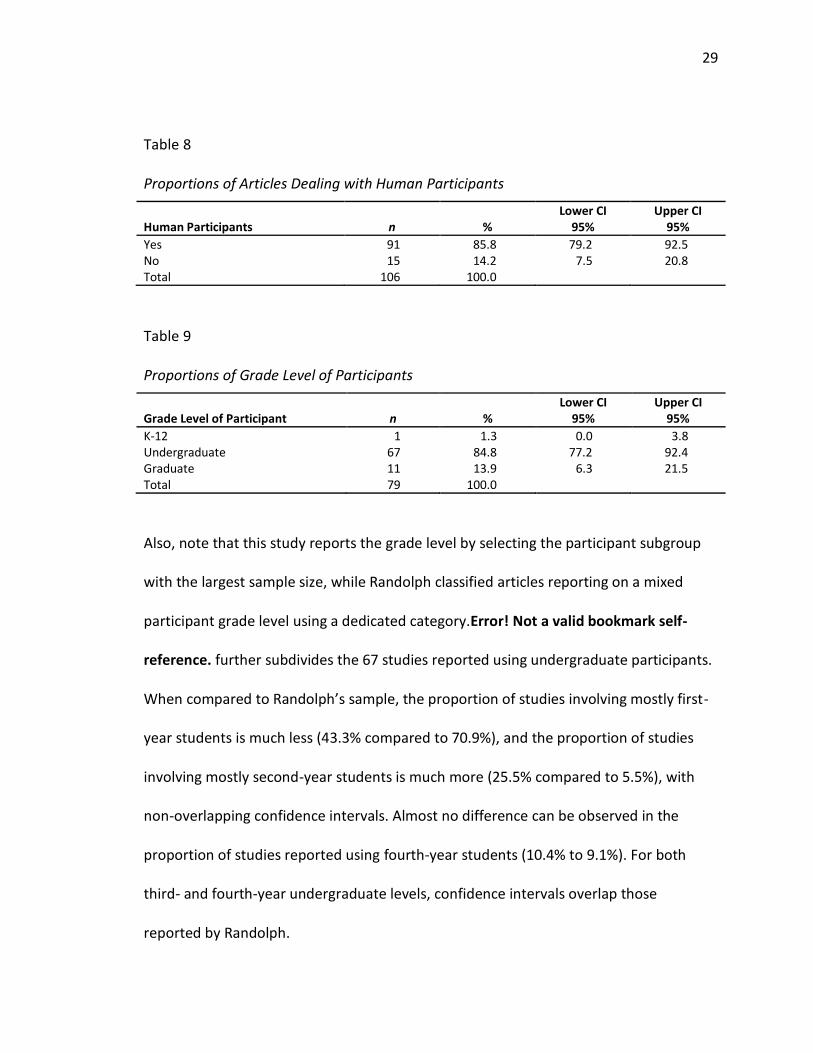
Human participants. As shown in Table 8, of 106 articles in this study, the
majority (85.8%) dealt with human participants. Randolph’s sample contained a
substantially lesser proportion (66.3%) of articles dealing with human participants. Also
note that the 95% confidence interval reported in this study (79.2% - 92.5%) does not
overlap the confidence interval reported by Randolph (62.2% - 70.1%), indicating that, in
this human participants dimension, each study inspected a different population of
research articles.
Grade level of participants. Table 9 presents the grade level of participants in the
91 human-related studies. Note the near-absence of pre-collegiate research, contrasted
to Randolph’s results in which 8% of the articles dealt with pre-collegiate participants.
29
Table 8
Proportions of Articles Dealing with Human Participants
Human Participants n % Lower CI
95% Upper CI
95%
Yes 91 85.8 79.2 92.5 No 15 14.2 7.5 20.8 Total 106 100.0
Table 9
Proportions of Grade Level of Participants
Grade Level of Participant n % Lower CI
95% Upper CI
95%
K-12 1 1.3 0.0 3.8 Undergraduate 67 84.8 77.2 92.4 Graduate 11 13.9 6.3 21.5 Total 79 100.0
Also, note that this study reports the grade level by selecting the participant subgroup
with the largest sample size, while Randolph classified articles reporting on a mixed
participant grade level using a dedicated category.Error! Not a valid bookmark self-
reference. further subdivides the 67 studies reported using undergraduate participants.
When compared to Randolph’s sample, the proportion of studies involving mostly first-
year students is much less (43.3% compared to 70.9%), and the proportion of studies
involving mostly second-year students is much more (25.5% compared to 5.5%), with
non-overlapping confidence intervals. Almost no difference can be observed in the
proportion of studies reported using fourth-year students (10.4% to 9.1%). For both
third- and fourth-year undergraduate levels, confidence intervals overlap those
reported by Randolph.

30
Table 10
Proportions of Undergraduate Level of Computing Curriculum
Year of undergraduate level of computing curriculum n %
Lower CI 95%
Upper CI 95%
First Year 29 43.3 31.3 55.0 Second Year 17 25.4 14.9 35.8 Third Year 14 20.9 11.9 31.3 Fourth Year 7 10.4 3.0 17.9 Total 67 100.0
Table 11
Proportions of Articles Providing Only Anecdotal Evidence
Anecdotal n % Lower CI
95% Upper CI
95%
Yes 23 25.3 16.5 34.1 No 68 74.7 65.9 83.5 Total 91 100.0
Table 12
Proportions of Types of Articles Not Dealing with Human Participants
Type of Article n % Lower CI
95% Upper CI
95%
Theory, methodology, or philosophical paper
7 46.7 20.0 73.3
Program description 4 26.7 6.7 53.3 Panel summarya 3 20.0 0.0 40.0 Literature review 1 6.7 0.0 20.0 Total 15 100.0 aThis item not part of the original coding categories
Anecdotal evidence only. As shown in Table 11, of 91 articles dealing with human
participants, 25.3% presented only anecdotal evidence. The confidence interval for this
measure (16.5% - 34.1%) is nearly non-overlapping with Randolph’s (33.1% - 43.3%).
Types of articles that did not deal with human participants. Table 12 presents the
types of articles represented by the 15 that did not deal with human participants, of

31
which approximately half reported a theoretical, methodological, or philosophical
viewpoint, and approximately a fourth reported a course or program description.
Types of Research Methods and Research Designs Used
Types of research methods used. Table 13 presents the proportions of
methodologies represented in the sample. As in Randolph’s study, the most frequently
used methodology is experimental/quasi-experimental, followed by explanatory
descriptive, causal comparative, correlational, and exploratory descriptive.
Approximately the same proportion (67.0%) of articles was experimental/quasi-
experimental compared to Randolph’s sample (64.6%); however, a noticeably greater
proportion of articles employed explanatory descriptive methodologies (39.6%
compared to 26.4%), with confidence intervals barely overlapping.
Table 14 presents methodology types classified as quantitative, qualitative, and
mixed, operationalized as follows: studies exhibiting only explanatory descriptive
methodologies are qualitative; studies not exhibiting explanatory descriptive
methodologies are quantitative; studies exhibiting explanatory descriptive
Table 13
Proportions of Methodology Types Used
Methodology Type n
(of 91) % Lower CI
95% Upper CI
95%
Experimental/quasi-experimental 61 67.0 57.1 76.9 Explanatory descriptive 36 39.6 29.7 49.5 Causal comparative 11 12.1 5.5 18.7 Correlational 9 9.9 4.4 16.5 Exploratory descriptive 5 5.5 1.1 11.0
Note. Column marginals do not sum to 91 (or 100%) because more than one type per article was possible.

32
Table 14
Proportions of Types of Methods
Type of method n % Lower CI
95% Upper CI
95%
Quantitative 53 58.2 48.4 68.1 Qualitative 26 28.6 19.8 38.5 Mixed 12 13.2 6.6 20.9 Total 91 100.0
Table 15
Proportions of Types of Experimental/Quasi-Experimental Designs Used
Type of experimental design n % Lower CI
95% Upper CI
95%
Posttest with controls 35 51.5 39.7 63.2 Posttest only 21 30.9 20.6 42.6 Repeated measures 12 17.6 8.8 26.5 Multiple factors 5 7.4 1.5 14.7 Pretest/posttest with controls 3 4.4 0 10.3 Pretest/posttest without controls 2 2.9 0 7.4 Single-subject 0 0
Note. Column marginals do not sum to 68 (or 100%) because more than one research design type per article was possible.
methodologies and any of the other quantitative methodologies are mixed. The
proportion of purely quantitative articles (58.2%) is significantly less than the proportion
reported by Randolph (74.3%), with non-overlapping confidence intervals.
Sampling. Of the 91 articles dealing with human participants, 84 (92.3%) used
convenience sampling, 5 (5.5%) used purposive (nonrandom) sampling, and 2 (2.2%)
used random sampling, compared to 86.1% convenience sampling reported by
Randolph.
Research designs. As shown in Table 15, the most frequently used research
design was the controlled, posttest-only design, followed by the one-group posttest-

33
Figure 4. Comparison of proportions of research designs between studies.
only design. This pattern, visualized in Figure 4, is the reverse of that reported by
Randolph. Of the 21 studies that reported using the one-group posttest-only design, 14
used the design exclusively.
Of those dealing with human participants and using an experimental/quasi-
experimental design, most used a quasi-experimental design, that is, used purposive,
convenience, or self-selection for treatment. Of the 61 articles, 34 (55.7%) selected
experimental and control groups using existing or convenience groups, or participants
served as their own controls, 18 (29.5%) used randomized groups, and 9 (14.8%) used
self-selected groups.
Posttest with
controls
Posttest only
Repeated measures
Multiple factors
Pretest/ posttest
with controls
Pretest/ posttest without controls
Single-subject
Rimington 51.5 30.9 17.6 7.4 4.4 2.9 0
Randolph 23.7 54.8 7.5 0 6.5 12.9 3.2
0
10
20
30
40
50
60
Pro
po
rtio
n (
%)

34
Independent, Dependent, and Moderating/Mediating Variables Investigated
Independent variables. As shown in Table 16, nearly all interventions and
independent variables related to student instruction and the application of pair
programming. Other kinds of interventions explored included distributed pair
programming using a tool, the explicit application of pair programming to the design,
test, or review phase of development, other kinds of collaborative development, and
the application of the extreme programming (XP) methodology. The practice of XP is
underrepresented (2.9%) in the experimental/quasi-experimental group, compared to
the 8 (34.8%) studies utilizing XP in the non-experimental group. Other interventions
described in anecdotal papers include variations on pair selection and trading,
specialized projects and assignments, and collaborative programming games.
Table 16
Proportions of Types of Independent Variables Used
Type of independent variable used n
(of 68) % Lower CI
95% Upper CI
95%
Student Instruction 66 97.1 92.6 100.0 Pair programming 63 92.6 85.3 98.5 Distributed pair programming using a
toola 5 7.4 1.5 14.7
Other kinds of collaborative programminga
5 7.4 1.5 14.7
Pair programming applied to design, testing, or reviewsa
5 7.4 1.5 14.7
Extreme Programminga 2 2.9 0.0 7.4 Mentoring 1 1.5 0.0 4.4
Note. Column marginals do not sum to 68 (or 100%) because more than one independent variable type per article was possible. aThis item not part of the original coding categories.

35
Table 17
Proportions of Types of Dependent Variables Used
Type of dependent variable used n
(of 68) % Lower CI
95% Upper CI
95%
Attitudes (student or teacher) 47 69.7 57.4 79.4 Achievement in computer science 25 36.8 25 48.5 Attendance 8 11.8 4.4 19.1 Socialization 3 4.4 0 10.3 Students’ intention for future 2 2.9 0 7.4 Program cost 2 2.9 0 7.4 Computer use 2 2.9 0 7.4 Achievement in core (non-CS)
courses 1 1.5 0 4.4
Task completion timea 9 13.2 Defect rates or passed/failed test casesa
7 10.3
Code metricsa 5 7.4 Code quality (subjective measure)a 4 5.9
Note. Column marginals do not sum to 68 (or 100%) because more than one dependent variable type per article was possible. a This item not part of the original coding categories.
Dependent variables. Table 17 presents the proportions of types of dependent
variables used in articles reporting quantitative statistics. As with Randolph’s study,
attitudes and achievement in computer science were the most frequently measured
variables, though this study shows a noticeably greater proportion of studies measuring
attitude and a decreased proportion of studies measuring achievement. Four additional
variables were identified, including task completion time, defect rates or passed/failed
test cases, code metrics, and subjective measures of code quality. Table 17 presents
proportions of these variables without confidence intervals. Results for studies
measuring teacher instruction or treatment fidelity are not included because the
variables were not measured by any of the studies sampled.

36
Table 18
Proportions of Types of Mediating or Moderating Variables Investigated
Mediating or moderating variable investigated
n (of 20) %
Lower CI 95%
Upper CI 95%
Gender 10 50.0 30.0 70.0 Student achievement 7 35.0 15.0 55.0 Race/ethic origin 2 10.0 0.0 25.0
SAT-Ma 5 25.0 Self-confidence or self-perceptiona 5 25.0 Myers-Briggs personality type indicatora
3 15.0
Felder-Silverman learning stylesa 1 5.0 Instructora 1 5.0
Note. Column marginals do not sum to 20 (or 100%) because more than one independent variable type per article was possible. a This item not part of the original coding categories.
Mediating or moderating variables examined. Of the 68 studies presenting
quantitative evidence, 20 (29.4%) investigated at least one mediating or moderating
variable, as presented in Table 18. Additional factors reported include student SAT math
scores, reports of self confidence or self-perceived aptitude, instructor or setting,
Myers-Briggs personality type indicators (MBTI) and Felder-Silverman learning styles, all
of which are presented in Table 18 without confidence intervals. Factors identified on
the coding sheet but omitted from the report because no studies reported investigating
them include nationality, disability status, and socioeconomic status of participants.
Types of Measures and Statistical Practices
Types of measures used. Table 19 presents the proportions of types of measures
reported in the sample. There exist additional measures corresponding to the additional
dependent variables identified in Table 17. The number of focus groups is not reported
because no study reported measuring focus groups. Measurement validity or reliability

37
Table 19
Proportions of Types of Measures Used
Type of measure used n
(of 68) % Lower CI
95% Upper CI
95%
Questionnaires 48 70.6 58.8 80.9 Grades 23 33.8 23.5 45.6 Student work 17 25.0 14.7 35.3 Teacher- or researcher-made tests 12 17.6 8.8 26.5 Interviews 8 11.8 4.4 19.1 Direct observation 5 7.4 1.5 14.7 Standardized tests 5 7.4 1.5 14.7 Existing records 4 5.9 1.5 11.8 Learning diaries 3 4.4 0 10.3 Log files 2 2.9 0 7.4
Note. Column marginals do not sum to 20 (or 100%) because more than measure type per article was possible.
was provided by 2 (4.2%) of the 48 studies utilizing questionnaires, and by none (0%) of
the studies utilizing teacher- or researcher-made tests, direct observation, or
standardized tests. Questionnaires represent a substantially greater proportion of this
sample (70.6%) than the sample (52.8%) reported by Randolph (2007); all other
measurements have confidence intervals that generally overlap, when comparing
samples.
Types of inferential analyses used. Of the 65 articles that reported quantitative
statistics, 43 (66.2%) also reported some kind of inferential statistic. Table 20 presents
the kinds and proportions of inferential statistics, and the proportions of inferential
statistics that present statistically adequate information.
Type of effect size reported. As shown in Table 21, of the 68 articles presenting
quantitative evidence, 41 (60.3%) reported some type of effect size. Reports that did not
report some type of effect size generally report only the results of a statistical

38
Table 20
Proportions of Types of Inferential Analyses Used
Type of inferential analysis N % Lower CI
95% Upper CI
95%
Parametric analysis (of 43) 31 66.2 55.4 76.9 Measure of centrality and
dispersion reported (of 31) 7 22.6 9.7 38.7 Correlational analysis (of 43) 13 30.2 13.6 44.2
Sample size reported (of 13) 13 100.0 Correlaction or covariance matrix
reported (of 13) 2 15.4 0 38.5 Nonparametric analysis (of 43) 13 30.2 16.3 44.2
Raw data summarized (of 13) 9 69.2 46.2 92.3 Small sample analysis (of 43) 1 2.3 0.0 7.0
Entire data set reported (of 1) 1 100.0 Multivariate analysis (of 43) 0 0.0
Note. Column marginals do not sum to 43 (or 100%) because more than one statistical practice per article was possible.
Table 21
Proportions of Types of Effect Sizes Reported
Type of measure used n
(of 41) % Lower CI
95% Upper CI
95%
Raw difference 41 100.0 Standardized mean difference 3 7.3 0.0 17.1 Odds 1 2.4 0 7.3
Note. Column marginals do not sum to 41 (or 100%) because more than measure type per article was possible.
hypothesis test, or significance test. All 41 articles that reported an effect size reported
raw difference of means, 3 (7.3%) reported the standardized mean, Cohen’s d, and 1
(2.4%) study reported odds. Of the 41 articles reporting means, 16 (39.0%) did not
report a standard deviation or other measure of dispersion. Note that, as in Randolph’s

39
study, an author needed only to report two means so that a reader could compute the
difference to classify as reporting raw difference.
Analysis of Cross Tabulations
This section contains cross tabulations for 12 of the 15 different relationships
explored by Randolph. Contrasts presented here include comparisons of publication
forum types, year of publication, and region of first author’s affiliation to the
proportions of anecdotal-only papers, experimental studies, attitude-only papers, and
one-group posttest-only research designs. This section does not contain the final three
of the relationships reported by Randolph, namely those dealing with empirical research
using the explanatory descriptive research design, because too few articles met these
criteria to enable credible analysis.
To compensate for the increased possibility of a Type I error caused by
performing 12 tests for association, application of the Bonferroni correction seemed
appropriate. This reduced the significance threshold to p = .004.
Because each cross tabulation involves a binary variable, I present adjusted
residuals only for the yes-valued cells. Randolph, citing Agresti, indicates that adjusted
residuals exceeding “about 2 or 3 in absolute value” is a good indicator of significance
(2007, p. 88).

40
Differences between Journal and Conference Proceedings Articles
This section presents the results of comparing the publication forum type to the
following classifications: (1) whether the paper presented only anecdotal evidence; (2)
whether the paper used an experimental or quasi-experimental methodology; (3)
whether the paper reported measures only for participant or researcher attitudes and
reports of self learning; and, (4) whether the paper used only the one-group posttest-
only research design. There is no statistically significant evidence in these findings to
suggest that the proportion of articles from conferences and journals differs.
Anecdotal-only articles. Table 22 presents the proportions of articles dealing with
human participants and reporting only anecdotal results. Journals published 16% fewer
anecdotal-only articles than did conferences; however, though noteworthy, the finding
was not statistically significant, Χ2(1, N = 89) = 2.72, p = 0.099, having medium residuals.
Experimental/quasi-experimental articles. Table 23 presents the proportions of
articles reporting empirical data that also reported an experimental or quasi-
experimental research methodology. Conferences published experimental or quasi-
experimental in 9.1% more cases; this finding is not statistically significant, Χ2(1, N = 66)
= 0.72, p = 0.395.
Attitudes-only articles. Table 24 presents the proportions of articles dealing with
human participants and measuring only participant or researcher attitudes or self-
reports of learning. Conferences published 2.4% fewer articles meeting this criterion, a
finding that is not statistically significant Χ2(1, N = 89) = 0.05, p = 0.820.

41
One-group posttest-only articles. Table 25 presents the proportions of articles
using an experimental or quasi-experimental methodology, but employing only the one-
group posttest-only design. Conferences published 6.6% fewer articles in this category
than journals. The difference is not statistically significant, Χ2(1, N = 62) = 0.38, p =
0.535.
Table 22
Cross Tabulation of Anecdotal-Only Papers by Forum Type
Forum
Anecdotal-only
Total Percentage
Yes Adjusted residual Yes No
Conference 18 39 57 31.6 1.6 Journal 5 27 32 15.6 -1.6 Total 23 66 89 25.8
Table 23
Cross Tabulation of Experimental Papers by Forum Type
Forum
Experimental
Total Percentage
Yes Adjusted residual Yes No
Conference 31 8 39 79.5 0.8 Journal 19 8 27 70.4 -0.8 Total 50 16 66 25.8
Table 24
Cross Tabulation of Attitudes-Only Papers by Forum Type
Forum
Attitudes-only
Total Percentage
Yes Adjusted residual Yes No
Conference 20 37 57 35.1 -0.2 Journal 12 20 32 37.5 0.2 Total 32 57 89 36.0

42
Table 25
Cross Tabulation of One-Group Posttest-Only Papers by Forum Type
Forum
Posttest-only exclusively
Total Percentage
Yes Adjusted residual Yes No
Conference 7 31 38 18.4 -0.6 Journal 6 18 24 25.0 0.6 Total 13 49 62 21.0
Yearly Trends
Examination of the trends indicating proportions of types of articles published
annually yielded no statistically significant results; however, there exist weak trends
related to anecdotal-only papers and posttest-only research designs.
Anecdotal-only articles. Table 26 presents the trends of anecdotal-only
publications by year. The findings are notable, but not statistically significant, M2(1, N =
89) = 3.50, p = 0.062. The direction of the residuals is generally ascending, indicating
that there may be an increasing trend in the proportions of anecdotal-only publications.
One-group posttest-only articles. Table 27 presents the trends of one-group
posttest-only publications by year. The findings are not statistically significant, M2(1, N =
64) = 2.46, p = 0.117; however, there does appear to be a weak descending trend,
indicating that the rate of empirical articles utilizing this design may be declining.
Other types of articles. Table 28 presents the proportions of experimental papers published by year, with no
statistically significant evidence of a trend, M 2(1, N = 68) = 0.65, p = 0.419.

43
Table 29 presents the proportions of attitudes-only papers published by year,
also with no statistically significant trend, M 2(1, N = 91) = 0.02, p = 0.876.
Table 26
Cross Tabulation of Anecdotal-Only Papers by Year
Year
Anecdotal-only
Total Percentage
Yes Adjusted residual Yes No
1999-2000 0 2 2 0.0 -0.8 2001-2002 0 4 4 0.0 -1.2 2003-2004 5 18 23 21.7 -0.5 2005-2006 10 29 39 25.6 0.0 2007-2008 8 13 21 38.1 1.5 Total 23 66 89 25.8
Table 27
Cross Tabulation of One-Group Posttest-Only Papers by Year
Year
Posttest-only exclusively
Total Percentage
Yes Adjusted residual Yes No
1999-2000 2 1 3 66.7 2.0 2001-2002 1 3 4 25.0 0.2 2003-2004 3 12 15 20.0 0.0 2005-2006 5 24 29 17.2 -0.6 2007-2008 2 11 13 15.4 -0.5 Total 13 51 64 20.3
Table 28
Cross Tabulation of Experimental Papers by Year
Year
Experimental
Total Percentage
Yes Adjusted residual Yes No
1999-2000 3 0 3 100.0 1.0 2001-2002 3 1 4 75.0 -0.1 2003-2004 11 7 18 61.1 -1.8 2005-2006 23 7 30 76.7 0.0 2007-2008 12 1 13 92.3 1.5 Total 52 16 68 76.5

44
Table 29
Cross Tabulation of Attitudes-Only Papers by Year
Year
Attitudes-only
Total Percentage
Yes Adjusted residual Yes No
1999-2000 2 1 3 66.7 1.2 2001-2002 1 3 4 25.0 -0.4 2003-2004 7 16 23 30.4 -0.5 2005-2006 13 27 40 32.5 -0.5 2007-2008 9 12 21 42.9 0.8 Total 32 59 91 35.2
Region of First Author’s Affiliation
Comparing types of paper to region of the first author’s affiliation required
collapsing some groups together. Doing so produced cell sizes more likely to produce
meaningful comparisons, but at the sacrifice of some geographic precision. Groups, as
presented here, are as follows: United States, Europe, and other, where other includes
articles from Canada, Mexico, Israel, Thailand, and Australia.
Each comparison of types of paper to the region of the first author’s affiliation
yielded no statistically significant results; however, each category except the anecdotal-
only category yielded results approaching statistical significance.
Attitudes-only papers. The results shows proportions of papers inspecting only
student attitudes and reports of self-learning, grouped by region. Although the results
are not statistically significant using the Bonferroni-adjusted significance threshold of

45
0.004, there would be evidence of a significant trend had the threshold not been
adjusted, Χ2(2, N = 91) = 9.21, p = 0.010. The United States published 39.1% more
attitudes-only papers than did European nations, and 16.4% more attitudes-only papers
than did the other nations represented in this sample. The residuals for Europe and the
United States, which have absolute values greater than 2.7, strengthen the evidence of
association.
Experimental/quasi-experimental articles. Table 31 presents the proportions of
experimental or quasi-experimental papers, grouped by region. Although the
association is not strongly significant, Χ2(2, N = 68) = 5.51, p = 0.064, the residuals are
moderately strong, providing evidence on an association. Note the absence of non-
experimental methodologies employed by authors affiliated with European institutions,
and the prevalence of non-experimental methodologies employed by authors in the
United States.
One-group posttest-only articles. Table 32 presents the proportions of
experimental articles using the one-group posttest-only design. There is no statistically
significant evidence of an association, Χ2(2, N = 64) = 4.39, p = 0.111, but the size of the
residuals warrants merit. Note that no authors in this sample associated with European
universities used the one-group posttest-only design exclusively; and 26.8% of authors
associated with universities in the United States did use the one-group posttest-only
design exclusively.

46
Anecdotal-only articles. There is no statistically significant evidence in this
sample for an association between region of first author’s association and the published
article providing only anecdotal evidence, Χ2(2, N = 89) = 0.10, p = 0.950.
Table 30
Cross Tabulation of Attitudes-Only Papers by Region of Affiliation
Region
Attitudes-only
Total Percentage
Yes Adjusted residual Yes No
Europe 1 16 17 5.9 -2.8 United States 27 33 60 45.0 2.7 Other 4 10 14 28.6 -0.6 Total 32 59 91 35.2
Table 31
Cross Tabulation of Experimental Papers by Region of Affiliation
Region
Experimental
Total Percentage
Yes Adjusted residual Yes No
Europe 13 0 13 100.0 2.2 United States 31 14 45 68.9 -2.1 Other 8 2 10 80.0 0.3 Total 52 16 68 75.6
Table 32
Cross Tabulation of One-Group Posttest-Only Papers by Region of Affiliation
Region
Posttest-only exclusively
Total Percentage
Yes Adjusted residual Yes No
Europe 0 13 13 0.0 -2.0 United States 11 30 41 26.8 1.7 Other 2 8 10 20.0 0.0 Total 13 51 64 20.3

47
Table 33
Cross Tabulation of Anecdotal-Only Papers by Region of Affiliation
Region
Anecdotal-only
Total Percentage
Yes Adjusted residual Yes No
Europe 4 13 17 23.5 -0.2 United States 15 43 58 25.9 0.0 Other 4 10 14 28.6 0.3 Total 23 66 89 25.8

48
DISCUSSION
Threats to Validity
Every effort was made to provide an honest and ethical evaluation of the
literature; however, some threats to internal validity are manifest in this study. Perhaps
the greatest limitation is the lack of inter-rater reliability measures. Without reliability
measures, it is difficult to assert strong conclusions and well-qualified recommendations
for change in policy. In an effort to reduce the risk of single-rater bias in the results, I
read and classified all articles in the order they were drawn from the sample.
This study inherits, with its design, some of the limitations of Randolph’s (2007)
study; for example, this study “did not deeply analyze articles that exclusively used
explanatory descriptive modes of inquiry” (2007, p. 127). Furthermore, Randolph’s
instrument did not clearly explain the difference between qualitative and pure-
anecdotal research (Lister, The Randolph thesis: CSEd research at the crossroads, 2007,
p. 17). Qualitative methodologies appear to be difficult to classify (Sheard et al., 2009, p.
98), which may be an indicator that qualitative report descriptions require
improvement. An attempt to design and validate a new instrument for evaluating
qualitative methodologies is out of the scope of this study.
A limitation related to the 12 cross tabulations is that, as a coder, I was not blind
to the categorization (i.e., forum type, year, and region) of the article. To compensate
for this risk, I classified these categories separately from the remaining data, that is, on

49
another pass. Doing so mitigates, but does not obviate, the limitation of employing a
non-blind coder.
Interpretation of Descriptive Findings
Research on Human Participants
Of the 108 articles sampled, 85.5% dealt with human participants. This
substantially exceeds the proportion reported by Randolph (66.3%). Because the
confidence interval of the current study and that reported by Randolph do not overlap, I
conclude that researchers of educational pair programming explore a greater
proportion of studies with human participants than do researchers of general computer
science education. This measure is easy to accept because pair programming is a
human-centric practice, relatively simple and inexpensive to implement, and applicable
to a broad class of assignment and task types.
Research Not Using Human Participants
Of the articles that did not report research using human participants, nearly half
(46.7%) were philosophical or theoretical papers. About a quarter (26.7%) of the articles
were program descriptions without analysis on the effects of the program on students.
This contrasts sharply with the proportion of program descriptions (60%) reported by
Randolph.
To understand why program descriptions are underrepresented in pair
programming research, it is helpful to consider the following conclusion from Randolph
(2007) regarding computer science education proper:

50
…While many computer science educators may be experts at creating the software and hardware to create automated interventions to increase the learning of computer science, an increased emphasis should be put on the instructional design of the intervention rather than only or primarily on the software and hardware mechanisms for delivering the instructional intervention.... (p. 132)
This analysis does not appear to apply well to pair programming, which is neither
hardware nor software, nor is it an automated intervention. It may be that, because
pairs cannot be constructed, automated, or programmed, but can be organized, guided,
and influenced, program descriptions less frequently apply to educational pair
programming.
Proportions of Anecdotal-Only Articles
Randolph (2007) identified two hazards caused by excessive use of anecdotal
evidence in the literature: first, anecdotal evidence is not appropriate for hypothesis
confirmation (p. 136); second, use of anecdotes appears to encourage “a mismatch
between what was claimed and what, in the spirit of scientific honesty, should have
been claimed” (p. 137). In contrast to these hazards, anecdotal evidence plays the
critical seed-planting role of hypothesis generation (p. 136).
Randolph cited Holloway (1995), who issued the harsh denunciation of software
engineering research, “Rarely, if ever, are *empirical claims about software engineering+
augmented with anything remotely resembling either logical or experimental evidence”
(p. 136). Surprisingly, the proportion of anecdotal papers (25.3%) in the current study is
noticeably less than the proportion (38.2%) reported by Randolph. Due to slightly-
overlapping confidence intervals, conclusions about this difference must be made with

51
caution; however, it is worth noting that the current body of educational pair program
research does not even closely reflect Holloway’s conclusions.
It is difficult to argue whether this proportion is an indicator of health or of
sickness, because there does not seem to be any authoritative direction indicating what
a healthy ratio of anecdotal to empirical research would be. We can reason that, insofar
as anecdotal evidence functions as a means of hypothesis generation, that a healthy
research literature must include some representation from anecdotal evidence. Another
consideration, suggested by Valentine (2004), is that researchers add some empirical
element to what would otherwise be pure anecdotal research.
Types of Research Methods
As shown in Tables 13 and 14, about two-thirds (67.0%) of the articles in the
current study used experimental or quasi-experimental methodologies. Slightly more
than half (58.2%) of the articles sampled used purely quantitative methodologies, with
the remaining articles using qualitative or mixed methodologies. This differs significantly
from Randolph’s sample, wherein nearly three-quarters (74.3%) of the articles sampled
used purely quantitative methodologies.
As with the proportion of anecdotal evidence, there appears to be no
authoritative direction for what the optimum proportion of quantitative, qualitative,
and mixed methods research should be in the literature. Anecdotally, I observed that
articles presenting purely qualitative methods generally did not present their methods
with adequate detail, a sentiment that mirrors that of Sheard and colleagues (2009, p.
98). Pragmatically, however, I agree with Lister (2005) who, while discussing
52
quantitative and qualitative methods, concluded, “There are not bad methods, just bad
research – the inappropriate use of a method” (p. 19).
Johnson and Onwuegbuzie (2004) advocated combining quantitative and
qualitative research. They argue, “What is most fundamental is the research question—
research methods should follow research questions in a way that offers the best chance
to obtain useful answers. Many research questions and combinations of questions are
best and most fully answered through mixed research solutions” (pp. 17-18). If Johnson
and Onwuegbuzie are correct, then educational pair programming research must evolve
to increase the current proportion of mixed-method research articles (13.2%).
Types of Measures Used
As with Randolph’s sample, the most frequently used kinds of measures were
questionnaires, grades, student work, and teacher- or researcher-made tests, though
the current sample has fewer teacher- or researcher-made tests than student work. The
current sample exhibited more interviews (11.8%) and fewer log files (2.9%); however,
due to overlapping confidence intervals, there is no strong evidence of difference
between any measurement type when compared to Randolph’s sample.
Also like Randolph’s sample, nearly all surveys, tests, and observations neglected
to collect or report reliability or validity information. Anecdotally, it appeared that
studies reporting reliability information were more likely to see reuse of the instrument
by other researchers. It seems as though researchers interested in promoting replication

53
of and validation of their research should consider investing time into evaluating
reliability or validity of the instrument.
Dependent, Independent, and Mediating/Moderating Variables Examined
Randolph’s findings conclude that student instruction, attitudes, and gender
represented the greatest proportions of independent, dependent, and
mediating/moderating variables, respectively. The current study supports these
findings.
Randolph has argued that student attitudes “are unreliable indicators of learning
or teaching quality,” (2007, p. 140), and advised the exploration of other, more reliable
measures; however, student attitudes play an important role in computer science
education. Lister (2007) provided the following explanation for the prevalence of
opinion-oriented surveys:
I suspect that the focus in [computer science education] on student opinions may not always be as a proxy for student learning. Since the downturn in student numbers, educators have been looking for approaches to teaching that students enjoy, in the hope of attracting students back to computing. (p. 17)
Allowing for surveys and questionnaires to provide value other than confirming
quality of learning and teaching, it seems some need for reform remains; questionnaires
represented 70.6% of the articles sampled, almost entirely without reliability or validity
information.
Experimental Research Design
Randolph reported that most articles in his sample used the posttest-only and
posttest with controls research designs and that posttest-only designs were used nearly

54
twice as often as posttest with controls designs. The current study partially contradicts
these results; while posttest-only and posttest with controls research designs are used
more frequently than other designs, posttest with controls designs are used much more
often (66.7%) than posttest-only designs. Because one-group posttest-only designs have
nearly insurmountable flaws (Randolph, 2007, pp. 140-141), the results of the current
study are encouraging.
It should be noted that one-group posttest-only designs, like anecdotal data, can
provide some limited value to the literature. Gilner and Morgan (2000) asserted that,
though the design “does not satisfy even the minimum condition for a research
problem, which is investigation of a relationship or comparison,” that, “If nothing else, it
provides pilot data (a common term to indicate exploratory data) for a future study” (p.
95). Because 30.9% of the current sample utilizes the posttest-only design, I suggest that
it is not reasonable to assume that all of these studies are designed or intended for pilot
data.
Confirming the results of Randolph, most experimental or quasi-experimental
studies reported in the current sample used convenience sampling and convenience
assignment. Convenience samples might be considered the educational researcher’s
greatest renewable resource: available, accessible, and affordable. The ease of using a
convenience sample can come with a price, however, by impairing the general
applicability of a study.
Randolph discussed advantages and hazards of this kind of sampling, describing
strategies that researchers can use to preserve research validity under such designs
55
(2007, pp. 142-144). One strategy is to vary the levels of treatment within the sample,
for example, by varying the degrees of required adherence to the pair programming
protocol. By comparing results at differing treatment levels, the researcher isolates the
treatment from other confounding variables.
Report Structure
Investigating the proportions of articles adequately providing various report
elements serves the purpose of evaluating the quality of communication contained in
the report. It seems reasonable to insist that important report elements be adequately
described, considering that the time and effort required to conduct a high quality study
on human participants must be greater than the time and effort required to describe
the process.
Randolph refrained from making assertions about report structure due to low
levels of inter-rater reliability. With this admission, and with the current study lacking
inter-rater reliability measures, it is perhaps inappropriate to draw conclusions from
comparisons. Instead, I will discuss only themes observed in the current study.
Four report elements coded were present in fewer than two-thirds of the
sample: research questions or hypotheses (46.2%), adequate description of instrument
(47.3%), adequate description of procedure (54.9%), and separate treatment of results
and discussion (61.5%). Articles that omit specific research questions, goals, or
hypotheses limit the clarity with which readers can identify and understand their
contribution to the research. Inadequate description of instrument and procedure limit
the replicability of a study by other researchers. Researchers and publishers should
56
carefully consider each report element to ensure the highest quality of communication
in published research. Note that, with regards to the separation of results and
discussion, the American Psychological Association allows for situations wherein
integrating discussion with results is appropriate (American Psychological Association,
2001, p. 26); therefore, I make no recommendations dealing with this report element.
Statistical Practices
Ensuring high quality and adequate detail in statistical reporting provides at least
two benefits. Firstly, quality reporting validates and strengthens claims and conclusions
made by the researcher. Secondly, quality reporting enables and facilitates meta-
analysis, that is, efforts to search for and combine results from disparate, but related,
studies (Cohen, 2001, pp. 237-239).
Much like Randolph’s sample, the current sample contains a high proportion of
articles using inferential statistics without adequate statistical detail, such as dispersion
measures (standard deviation, range, confidence intervals, etc.).
More than one-third (39.7%) of the studies did not report effect sizes. Those
studies that did reported only a comparison or difference of group means. I cannot
conclude whether the proliferation of reports using only raw mean difference is an
indicator of health or weakness in the literature. The APA Task Force on Statistical
Inference identified conditions for which raw difference of means is the preferred effect
size to report:
Always present effect sizes for primary outcomes.... If the units of measurement are meaningful on a practical level (e.g., number of cigarettes smoked per day), then we usually prefer an unstandardized measure (regression coefficient or

57
mean difference) to a standardized measure (r or d) (Wilkinson, L; APA Task Force on Statistical Inference, 1999, p. 599).
Perhaps of more concern than the lack of diversity in effect size types is the
sample proportion reporting no effect size at all. Cohen (2001) emphasized the
inadequacy if hypothesis testing without effect sizes, specifically about parametric
ttests:
What does a very large t value indicate? When a very large t is obtained, we can feel very sure that the effect size is not zero. However, no matter how certain we are that the effect size is not zero, this does not imply that the effect size must be fairly large. …Even a very tiny effect size can lead to a large expected t if very large samples are used. It is important to remember that statistical significance does not imply that the effect size is large enough to be interesting or of any practical importance. (emphasis added; p. 220)
It seems evident that ample need for improvement exists when reporting
inferential statistics in educational pair programming research.
Islands of Practice
This section presents the results of the 12 cross tabulations. It is necessary to
qualify my interpretation of these analyses with the acknowledgment that none of the
12 analyses qualified as statistically significant using the Bonferroni-adjusted threshold
of p < 0.004. I believe, however, that some of the analyses were of practical significance,
even though not of statistical significance.
Journal and Conference Papers
There seemed to be little evidence that journals accepting educational pair
programming research differed from conferences in terms of number of experimental

58
articles, attitude-only papers, and one-group posttest-only designs. There was weak
evidence of an association between type of publication forum and the article providing
only anecdotal evidence. The residuals provide evidence of a moderate effect. If we
accept this association, then we agree that journals favor a marginally greater
proportion of empirical research articles than do conferences. This finding is consistent
with the findings of Randolph (2007, p. 147), who found no compelling associations
when analyzing conferences and journals with χ2 analysis.
Yearly Trends
There was weak evidence of an increasing trend in anecdotal-only publications,
and of a decreasing trend in one-group posttest-only articles, both with modest
residuals. This finding partially contradicts Randolph’s finding that anecdotal-only
articles were decreasing. Though the anecdotal-only trend in the current study warrants
some concern, the trend of decreasing one-group posttest-only research designs is
encouraging.
Region of Origin
Analyzing research articles by region of the first author’s affiliation yielded
moderate statistical significance in all areas except the publication of anecdotal-only
articles. In summary, the findings are:
1. Researchers affiliated with institutions in the United States are much more
likely to produce a paper evaluating only student attitudes and self-reports of
learning than researchers of European institutions. This behavior deviates

59
from Randolph’s finding that researchers from Asian-Pacific or Eurasian
institutions tended to measure attitudes only.
2. Researchers affiliated with institutions in Europe were much more likely to
implement an experimental or quasi-experimental methodology when
compared to researchers in the United States. This is the opposite of an
effect reported by Randolph.
3. Researchers affiliated with institutions in the United States were much more
likely to implement a posttest-only research design than their counterparts in
Europe and other regions. Randolph did not find evidence of an effect for
this comparison.
Combining these findings exposes a theme in educational pair programming
research: researchers affiliated with institutions in the United States are more likely to
use attitude-only, posttest-only designs, and less likely to employ experimental
methodologies than researchers in other areas of the world, especially when contrasted
with Europe. The consistency of this theme increases the practical significance of the
claim that there exist islands of practice when examining educational pair programming
by region.
Profile of the Average Educational Pair Programming Paper
Randolph’s (2007) evaluation of pair programming included a sobering profile,
comprised of combinations of median measurements from his sample, “because of the
narrative efficiency in which it can characterize what computer science education

60
research papers, in general, are like” (p. 161). It is interesting to compare and contrast
his profile with the current study’s profile of educational pair programming research.
Table 34 presents Randolph’s CSE research profile side-by-side with the educational pair
programming research profile.
Recommendations
The primary intent and value of this thesis is to provide inspiration and direction
to educational pair programming researchers, to provide informed guidance to editors,
publishers, and policy makers, and, as a result, increase the quality and credibility of the
research. In this section, I provide again the recommendations of Randolph (2007), and
assert additional recommendations informed by the results of this study.
The Randolph Recommendations
The interested reader is advised to read the evidence-based recommendations
and accompanying explanations provided by Randolph (2007). Each recommendation is
fully supported by the evidence from the current study. In summary, they are to:
Be wary of investigations that only measure students’ self-reports of learning,
Accept anecdotal experience as a means of hypothesis generation, but not as a sole means of hypothesis confirmation,
Insist that authors provide some kind of information about the reliability and validity of measures that they use,
Realize that the one-group posttest-only research design is susceptible to almost all threats to internal validity,
Report informationally adequate statistics, and
Insist that authors provide sufficient detail about participants and procedures. (2007, pp. 162-166)

61
Table 34
Profile Comparison of Educational Pair Programming Research
Computer Science Education Research (Randolph, 2007, p. 162)
Emphasis added.
Educational Pair Programming Research (Current Study)
The typical computer science education research paper is a 5-page conference paper written by two authors.
The typical educational pair programming research paper is a 7-page conference paper written by two or three authors.
The first author is most likely affiliated with a university in North America.
Same.
If the article does not deal with human participants, then it is likely to be a description of some kind of an intervention, such as a new tool or a new way to teach a course.
If the article does not deal with human participants, then it is likely to be a philosophical, opinion paper, or one asserting the expected value of some methodology.
If the article does deal with human participants, then there is a 40% chance that it is basically a description of an intervention in which only anecdotal evidence is provided.
If the article does deal with human participants, then there is a 25% chance that it is basically a description of an intervention in which only anecdotal evidence is provided.
If more than anecdotal evidence is provided the authors probably used a one-group posttest-only design in which they gave out an attitude questionnaire, after the intervention was implemented, to a convenience sample of first-year undergraduate computer science students.
If more than anecdotal evidence is provided the authors probably used a posttest-only with controls design in which they gave out an attitude questionnaire, after the intervention was implemented, to a convenience sample of first-year undergraduate computer science students.
The students were expected to report on how well they liked the intervention or how well they thought that the intervention helped them learn.
Same.
Most likely, the authors presented raw statistics on the proportion of students who held particular attitudes.
Same.

62
I am confident that the application of these six recommendations will improve the
applicability, replicability, and credibility of the educational pair programming literature.
Curriculum Recommendations
This section provides four additional evidence-based recommendations for
consideration by the computer science educator community for the improvement of
future research.
Form an interdisciplinary research partnership whenever possible if conducting
research on human participants. The practice of forming an interdisciplinary research
partnership occurs infrequently in the community. Most authors of educational pair
programming research articles have technical backgrounds rather than educational,
behavioral, or cognitive psychology experience and training.
An example of an interdisciplinary research partnership in practice is the work of
McDowell and colleagues (2006), who regularly include as authors representatives of
their institution’s psychology department. In the sample, McDowell and colleagues’
research typically included sufficient treatment of each report element, and stronger
research designs than the infamous one-group posttest-only design. In their parametric
inferential analyses, they provided appropriate measures of dispersion, sufficient to
qualify their research as a candidate for future meta-analysis. Because of the design
quality evident in their interdisciplinary work, a researcher can place increased trust in
conclusions related to increased retention, confidence, and program quality, and in the
narrowing of the observed student gender gap. Theirs is a pattern worth emulation.

63
Insist upon and provide training to student and faculty researchers in the
practices of gathering and reporting reliable statistical information. It seems reasonable
to expect that improvements in researcher training will result in improvements in the
quality of research measures and reports. Consider encouraging courses supporting
interdisciplinary statistical practices, such as psychological, educational, or behavioral
statistics. Courses such as these should instruct students on the best practices for
reporting statistics, in addition to the proper application of a given statistic to
appropriate situations. Exposure to and understanding of the appropriate application of
research statistics could promote both quality and diversity in statistical measures.
Encourage interregional dialogue and research partnerships. The analysis of
regional islands of practice indicated that different regions in the world practice
educational pair programming research somewhat differently. Researchers should
aggressively familiarize themselves with the practices, habits, and styles of researchers
throughout the world community for the intent of assimilating characteristics that
improve the credibility and general applicability of research results. For example, some
researchers in the United States could benefit from exposure to the quantitative
research published by European authors, while authors in Europe could benefit from
exposure to the variety of interview protocols used in qualitative research published by
institutions in the United States.
Encourage diversity in research methodologies, designs, and measures. Advocate
studies that promote diversity in the practice of research. Mixed qualitative and
quantitative studies may require additional space in journals and conference
64
proceedings to adequately describe procedures. Careful literature review prior to
conducting new research can expose areas of research unexplored by the community,
and thus provide opportunities to increase the depth and breadth of the literature.
Consider each dependent, independent, and mediating or moderating variable reported
in this study with low proportions to be an area requiring future research.
Recommended Future Research
This section presents several areas of research that are underrepresented or
unrepresented in this sample that can, or should, be of interest to the educational pair
programming community. I present each area as a question with some discussion.
What are the effects of pair programming on students K-12? Of the 108 articles
sampled, only one dealt with pre-collegiate students. It is surprising that the sample
contained so few studies on younger students, considering that some effects of pair
programming reported on undergraduate students could be very valuable to younger
students, including increased recruitment and retention to the field of computing, and
increased performance and competence. Can pair programming improve the probability
a young student attends higher education, selects a computer science-related field of
study, and succeeds in the field? Can pair programming have a positive effect on success
in other core K-12 classes? What instructional methodologies are most effective when
implementing pair programming in K-12 computer science pedagogy? These questions
demonstrate the need to expand the exploration of pair programming to younger
students.

65
What are the effects of pair programming on students from low-income families,
or on students with disabilities? Socioeconomic status and disability status were factors
that were unexplored by the current body of research. Because computer science
education provides opportunities for well-paid, well-trained professions, educators
should consider whether pair programming offers students increased opportunities for
socioeconomic development. Research in this area using participants of any age group
can promote diversity and significance to the field.
How does fidelity to a pair programming intervention influence effects? Although
articles in the sample measured a broad range of effects on pair programming groups,
measuring the degree to which students adhered to the pair programming protocol was
scarce. Often, if treatment fidelity was measured at all, measurements consisted of peer
evaluations that were incorporated into student grades. Like all other attitude surveys,
these measures may not fully reflect the effect. What proportion of time should be
spent pairing on a task to achieve the greatest effects? Is there a correlation between
treatment fidelity and some effect? Answers to these questions could provide guidance
for maximizing the benefits and minimizing the costs of educational pair programming.
What are the effects of pair programming if integrated as a core component of
the computer science curriculum? Unaddressed in the 108 articles sampled are best
practices for implementing pair programming as a central practice of computer science
pedagogy throughout the curriculum. Usually, the reported practice of pair
programming is limited to a single course or a small set of courses involving first- and
second-year undergraduates. Some researchers report reverting to solo programming

66
after the first year to ensure student independence, but the sample contains no
published evidence that terminating the practice of pair programming has a negative or
positive effect on students. Such long-term studies are difficult to design and
implement; however, long term studies can resolve doubts some may have that pair
programming is more effective because it is “new,” rather than more effective.
Certainly, the record of positive effects reported over nine years of research warrant
consideration for experimental, curriculum-wide implementation.

67
CONCLUSION
Summary
Pair programming in computer science education is a growing area of research.
In an effort to improve the quality of the research, I conducted a thorough
methodological review, modeled after the review conducted by Randolph (2007), of
educational pair programming research published between 2000 and 2008. A 112-
variable scale for characteristics of the research reports, designs, and methodologies
was used to classify the sample of 108 research articles. The major findings of the
review include:
1. About one-sixth of the articles did not report research on human
participants, which is about half the proportion that is typical in computer
science education research.
2. About half of the articles that did not involve human participants were
philosophical or theoretical in nature.
3. About one-quarter of articles that dealt with human participants only
provided anecdotal evidence for their claims, which is a smaller proportion
than is typical in computer science education research.
4. Of the articles that provided empirical evidence, most articles used
experimental or quasi experimental methods, which is similar to general
computer science education research.

68
5. Of the articles that used an experimental research design, the majority used
a controlled posttest-only design, which is markedly different than typical
computer science education research that usually implements a one-group
posttest-only design.
6. Like typical computer science education research, student instruction,
attitudes, and gender were the most frequent independent, dependent, and
mediating/moderating variables, respectively.
7. Like typical computer science education research, questionnaires were the
most frequently used type of measurement instrument, and usually lacked
measures of psychometric validity.
8. Like typical computer science education research, inferential statistics often
lacked adequate statistical information.
9. There was weak evidence that journals publish a smaller proportion of
articles that provide only anecdotal evidence than do conferences.
10. There was weak evidence of an increasing yearly trend in anecdotal-only
articles and a decreasing yearly trend in the use of the one-group posttest-
only research design.
11. There was moderate evidence that first authors affiliated with institutions in
the United States published a greater proportion of attitude-only papers and
one-group posttest-only research designs, and a smaller proportion of
experimental studies than their counterparts affiliated with other regions,

69
especially when compared to first authors affiliated with European
institutions.
Based on the results of this content analysis, I reassert Randolph’s (2007, pp.
162-166) recommendations with the following additions:
1. Form an interdisciplinary research partnership whenever possible if
conducting research on human participants;
2. Insist upon and provide training to student and faculty researchers in the
practices of gathering and reporting reliable statistical information;
3. Encourage interregional dialogue and research partnerships; and
4. Encourage diversity in research methodologies, designs, and measures.
Finally, I propose several areas of research that were unrepresented or
underrepresented by the sample, which I summarize with the following high-level
research questions:
1. What are the effects of pair programming on students K-12?
2. What are the effects of pair programming on students from low-income
families, or on students with disabilities?
3. How does fidelity to a pair programming intervention influence effects?
4. What are the effects of pair programming if integrated as a core component
of the computer science curriculum?
70
Expanding the Horizons of Educational Pair Programming
I once remarked to a respected instructor that research in the topic of pair
programming was exhausted, and that I planned to explore research somewhere else.
He responded, for which I am deeply grateful, that he did not think this was the case,
and that perhaps, appearing exhausted, the field was at last ready for a review.
Concluding that review, I feel much like a marathon athlete, cresting the top of a great
hill to witness both the broad expanse of tamed fields and orchards, and the beckoning
thrill of unexplored peaks and shores. The pair programming literature also contains
broad, well-explored areas, and unexplored wilderness.
There exists both a capacity and a need for this area of research to grow. If
researchers and publishers will commit to permitting only the highest quality of
research methods, and to using studies designed and dedicated to confirming the
growing body of knowledge, we will see, at last, resolution to the question: Are the
effects of pair programming compelling enough to affect policy in how we provide
computer science education?

71
REFERENCES
Agresti, A. (2007). An introduction to categorical data analysis (2nd ed.). Hoboken, NJ: Wiley-Interscience.
American Psychological Association. (2001). Publication Manual of the American Psychological Association (5th ed.). Washington, DC: Author.
Beck, K. (2001). Extreme programming explained: Embrace change. Addison-Wesley.
Bryant, S. (2004). Double trouble: Mixing qualitative and quantitative methods in the study of eXtreme programmers. IEEE Symposium on Visual Languages and Human Centric Computing, 55-61.
Cohen, B. H. (2001). Explaining psychological statistics (2nd ed.). New York: Wiley.
Gliner, J. A., & Morgan, G. A. (2000). Research methods in applied settings: An integrated approach to design and analysis. Mahwah, NJ: Erlbaum.
Goldweber, M., Clark, M., Fincher, S., & Pears, A. (2004). The relationship between CS education research and the SIGCSE community. Proceedings of the 9th annual SIGCSE conference on Innovation and technology in computer science education, (pp. 228-229). Leeds, United Kingdom.
Heaney, D., & Daly, C. (2004). Mass production of individual feedback. ACM SIGCSE Bulletin , 36 (3), 117-121.
Holloway, C. M. (1995). Software engineering and epistemology. Software Engineering Notes , 20 (2), 20-21.
Hulkko, H., & Abrahamsson, P. (2005). A multiple case study on the impact of pair programming on product quality. ICSE 2005. Proceedings of the 27th International Conference on Software Engineering, 2005, 495-504.
Johnson, R. B., & Onwuegbuaie, A. J. (2004). Mixed methods research: A research paradigm whose time has come. Educational Researcher , 33 (7), 14-26.
Keefe, K., Sheard, J., & Dick, M. (2006). Adopting XP practices for teaching object oriented programming. ACE '06: Proceedings the Sixth Conference on Australasian Computing Education, 52, 91-100.
Keselman, H. J., Huberty, C. J., Liz, L. M., Olejnik, S., Cribbie, R., Donahue, B., et al. (1998). Statistical practices of educational researchers. An analysis of their ANOVA, MANOVA, and ANCOVA analyses. Review of Educational Research , 68 (3), 350-386.

72
Krippendorff, K. (2004). Content analysis: an introduction to its methodology (2nd ed.). Thousand Oaks, CA: Sage.
Lister, R. (2005). Mixed methods: Positivists are from Mars, Constructivists are from Venus. ACM SIGCSE Bulletin , 37 (4), 18-19.
Lister, R. (2007). The Randolph thesis: CSEd research at the crossroads. ACM SIGCSE Bulletin , 39 (4), 16-18.
McDowell, C., Werner, L., Bullock, H. E., & Fernald, J. (2006). Pair programming improves student retention, confidence, and program quality. Communications of the ACM, 49 (8), 90-95.
McDowell, C., Werner, L., Bullock, H. E., & Fernald, J. (2003). The impact of pair programming on student performance, perception, and persistence. ICSE'03: Proceedings of the 25th International Conference on Software Engineering, 602-607.
Randolph, J. J. (2008). A methodological review of the program evaluations in K-12 computer science education. Informatics in Education , 7 (2), 237-258.
Randolph, J. J. (2007, January). Computer science education research at the crossroads: a methodological review of computer science education research, 2000-2005. Ph.D. dissertation, Utah State University, Logan, Utah. Retrieved October 6, 2008, from Dissertations & Theses @ Utah State University database. (Publication No. AAT 3270886)
Randolph, J. J., Bednarik, R., & Myller, N. (2005). A methodological review of the articles published in the proceedings of Koli Calling 2001-2004. Proceedings of the 5th Annual Finnish / Baltic Sea Conference on Computer Science Education pp. 103-109. Finland: Helsinki University of Technology Press.
Reges, S. (2006). Back to basics in CS1 and CS2. SIGCSE '06: Proceedings of the 37th SIGCSE Technical Symposium on Computer Science Eductation, 293-297.
Sample Size Calculator. (2008). Retrieved October 16, 2008, http://www.surveysystem .com/sscalc.htm
Sheard, J., Simon, S., Hamilton, M., & Lönnberg, J. (2009). Analysis of research into the teaching and learning of programming. International Computing Education Workshop. Proceedings of the Fifth International Workshop on Computing Education Research, 93-104. Berkely, CA.

73
Simon, S., Carbone, A., de Raadt, M., Lister, R., Hamilton, M., & Sheard, J. (2008). Classifying computing education papers: Process and results. ICER '08: Proceedings of the Fourth International Workshop on Computing Education, 161-171.
Simonoff, J. S. (2003). Analyzing categorical data (illustrated ed.). New York: Springer.
Valentine, D. W. (2004). CS educational research: A meta-analysis of SIGCSE technical symposium proceedings. Proceedings of the 35th Technical Symposium on Computer Science Education (pp. 255-259). New York: ACM Press.
Werner, L. L., Hanks, B., & McDowell, C. (2004). Pair-programming helps female computer science students. Journal on Educational Resources in Computing , 4 (1), 1-8.
Wilkinson, L; APA Task Force on Statistical Inference. (1999). Statistical methods in psychology journals: Guidelines and explanations. American Psychologist , 54, 594-604.
Williams, L. A. (1999). But, isn't that cheating? 29th ASEE/IEEE Frontiers in Education Conference, 12b9 - 26-27. San Juan, Puerto Rico.
Williams, L. A. (2007). Lessons learned from seven years of pair programming at North Carolina State University. ACM SIGCSE Bulletin, 29 (4), 79-83.
Williams, L. A., McDowell, C., Nagappan, N., Fernald, J., & Werner, L. (2003). Building pair programming knowledge through a family of experiments. ISESE'03. Proceedings of the 2003 International Symposium on Empirical Software Engineering, 143-152.
Williams, L. A., Wiebe, E., Yang, K., Ferzli, M., & Miller, C. (2002). In support of pair programming in the introductory computer science course. Computer Science Education, 12 (3), 197-212.
Wuensch, K. L. (2007). Resampling statistics. Retrieved October 17, 2009, from http://core.ecu.edu/psyc/wuenschk/StatHelp/Resampling.htm

74
APPENDICES

75
Appendix A:
A List of the Articles Included in the Sample
Ahern, T. C. (2005). Work in progress - Effect of instructional design and pair programming on student performance in an introductory programming course. FIE 2005: Proceedings of the 35th Annual Conference of Frontiers in Education, October 19-20, F3E - 11-12.
Al-Kilidar, H., Parkin, P., Aurum, A., & Jeffery, R. (2005). Evaluation of effects of pair work on quality of designs. Proceedings of the 2005 Australian Software Engineering Conference, 78-87.
Allen, E., Cartwright, R., & Reis, C. (2003). Production programming in the classroom. ACM SIGCSE Bulletin, 35(1), 89-93.
Assiter, K. (2005). Balancing depth and breadth in the data structures course. Journal of Computing Sciences in Colleges, 20(3), 255-271.
Austin, K., Dunlap, J., Glover, M., McKinnon, J., Mohney, D., Taft, M., Vysocky, M., & Cratsley, C. (2005). The Virtual Firefly: An interdisciplinary undergraduate research project. Journal of Computing Sciences in Colleges, 20(5), 188-199.
Balcita, A. M., Carver, D. L., & Soffa, M. L.(2002). Shortchanging the future of information technology: The untapped resource. ACM SIGCSE Bulletin, 34(2), 32-35.
Bagley, C. A., & Chou, C. C. (2007). Collaboration and the importance for novices in learning Java computer programming. ACM SIGCSE Bulletin, 39(3), 211-215.
Beck, L. L. (2005). Cooperative learning techniques in CS1: Design and experimental evaluation. ACM SIGCSE Bulletin, 37(1), 470-474.
Begel, A., & Simon, B. (2008). Novice software developers, all over again. ICER 2008: Proceedings of the Fourth International Workshop on Computing Education Research, Sydney, Australia, 3-14.
Benaya, T., & Zur, E. (2007). Collaborative programming projects in an advanced CS course. Journal of Computing Sciences in Colleges, 22(6), 126-135.
Berenson, S. B., Slaten, K. M., Williams, L., & Ho, C. (2004). Voices of women in a software engineering course: Reflections on collaboration. Journal on Educational Resources in Computing (JERIC), 4(1), 1.
Bergin, J., Caristi, J., Dubinsky, Y., Hazzan, O., & Williams, L. (2004). Teaching software development methods: The case of extreme programming. SIGCSE 2004:

76
Proceedings of the 35th Technical Symposium on Computer Science Education, Norfolk, VA, United States, 448-449.
Bergin, J., Kussmaul, C., Reichlmayr, T., Caristi, J., & Pollice, G. (2005). Agile development in computer science education: Practices and prognosis. SIGCSE 2005: Proceedings of the 36th SIGCSE Technical Symposium on Computer Science Education, St. Louis, MO, United States, 130-131.
Bipp, T., Lepper, A., & Schmedding, D. (2008). Pair programming in software development teams - An empirical study of its benefits. Information & Software Technology, 50(3), 231-240.
Bishop-Clark, C., Courte, J., & Elizabeth, B. (2006). Programming in pairs with ALICE to improve confidence, enjoyment, and achievement. Journal of Educational Computing Research, 34(2), 213-228.
Bowyer, J., & Hughes, J. (2006). Assessing undergraduate experience of continuous integration and test-driven development. ICSE 2006: Proceedings of the 28th International Conference on Software Engineering, Shanghai, China, 691-694.
Boyer, K. E., Dwight, A. A., Fondren, R. T., Vouk, M. A., & Lester, J. C. (2008). A development environment for distributed synchronous collaborative programming. ITiCSE 2008: Proceedings of the 13th Annual Conference on Innovation and Technology in Computer Science Education, Madrid, Spain, 158-152.
Braught, G., Eby, L. M., & Wahls, T. (2008). The effects of pair-programming on individual programming skill. SIGCSE 2008: Proceedings of the 39th SIGCSE Technical Symposium on Computer Science Education, Portland, OR, United States, 200-204.
Canfora, G., Cimitile, A., Di Lucca, G. A., & Visaggio, C. A. (2006). How distribution affects the success of pair programming. International Journal of Software Engineering & Knowledge Engineering, 16(2), 293-313.
Canfora, G., Cimitile, A., Garcia, F., Piattini, M., & Visaggio, C. A. (2005). Confirming the influence of educational background in pair-design knowledge through experiments. SAC 2005: Proceedings of the 2005 ACM Symposium on Applied Computing, 1478-1484.
Canfora, G., Cimitile, A., Garcia, F., Piattini, M., & Visaggio, C. A. (2006). Performances of pair designing on software evolution: A controlled experiment. CSMR 2006: Proceedings of the 10th European Conference on Software Maintenance and Reengineering, 00, 22-24.

77
Canfora, G. Cimitile, A., & Visaggio, C. A. (2003). Lessons learned about distributed pair programming: What are the knowledge needs to address? WET ICE 2003: Proceedings of the Twelfth IEEE International Workshops on Enabling Technologies: Infrastructure for Collaborative Enterprises, 314-319.
Canfora, G. Cimitile, A., & Visaggio, C. A. (2004). Working in pairs as a means for design knowledge building: An empirical study. Proceedings of the 12th International Workshop on Program Comprehension, 62-68.
Carver, J. C., Henderson, L., He, L., Hodges, J., & Reese, D. (2007). Increased retention of early computer science and software engineering students using pair programming. CSEET 2007: 20th Conference on Software Engineering Education & Training, 115-122.
Chintakovid, T., Wiedenbeck, S., Burnett, M., & Grigoreanu, V. (2006). Pair collaboration in end-user debugging. VL/HCC 2006: IEEE Symposium on Visual Languages and Human-Centric Computing, 3-10.
Choi, K. S., Deek, F. P., & Im, I. (2008). Exploring the underlying aspects of pair programming: The impact of personality. Information & Software Technology, 50(11), 1114-1126.
Cliburn, D. C. (2003). Experiences with pair programming at a small college. Journal of Computing Sciences in Colleges, 19(1), 20-29.
Čubranid, D., Storey, M. D., & Ryall, J. (2006). A comparison of communication technologies to support novice team programming. ICSE 2006: Proceedings of the 28th Conference on Software Engineering, Shanghai, China, 695-698.
DeClue, T. (2007). A comprehensive capstone project in computer science I: Getting the (instant) message. Journal of Computing Sciences in Colleges, 22(4), 56-61.
DeClue, T. H. (2003). Pair programming and pair trading: Effects on learning and motivation in a CS2 course. Journal of Computing Sciences in Colleges, 18(5), 49-56.
Dooley, J. F. (2003). Software engineering in the liberal arts: Combining theory and practice. ACM SIGCSE Bulletin, Volume 35(2), 48-51.
Edwards, S. H., & Barnette, N. D. (2004). Experiences using tablet PCs in a programming laboratory. CITC5 2004: Proceedings of the 5th Conference on Information Technology Education, Salt Lake City, UT, United States, 160-164.
Fruhling, A., & de Vreede, G. (2006). Field experience with eXtreme programming: Developing an emergency response system. Journal of Management Information Systems, 22(4), 39-68.

78
Gaspar, A., & Langevin, S. (2007). Restoring "coding with intention" in introductory programming courses. SIGITE 2007: Proceedings of the 8th ACM SIGITE Conference on Information Technology Education, Destin, FL, United States, 91-98.
Gehringer, E. F. (2003). A pair-programming experiment in a non-programming course. OOPSLA 2003: Companion of the 18th Annual ACM SIGPLAN Conference on Object-Oriented Programming, Systems, Languages, and Applications, Anaheim, CA, United States, 187-190.
Hanks, B. (2008). Problems encountered by novice pair programmers. Journal on Educational Resources in Computing (JERIC), 7(4), a2.
Hanks, B. (2006). Student attitudes toward pair programming. ACM SIGCSE Bulletin, 38(3), 113-117.
Hanks, B. (2005). Student performance in CS1 with distributed pair programming. ACM SIGCSE Bulletin, 37(3), 316-320.
Hanks, B., McDowell, C., Draper, D., & Krnjajic, M. (2004). Program quality with pair programming in CS1. ITiCSE 2004: Proceedings of the 9th Annual SIGCSE Conference on Innovation and Technology in Computer Science Education, Leeds, United Kingdom, 176-180.
Hanks, B., Wellington, C., Reichlmayr, T., & Coupal, C. (2008). Integrating agility in the CS curriculum: Practices through values. SIGCSE 2008: Proceedings of the 39th SIGCSE Technical Symposium on Computer Science Education, Portland, OR, United States, 19-20.
Hazzan, O. (2003). Cognitive and social aspects of software engineering: A course framework. ITiCSE 2003: Proceedings of the 8th Annual Conference on Innovation and Technology in Computer Science Education, Thessaloniki, Greece, 3-6.
Hazzan, O., & Dubinsky, Y. (2007). Why software engineering programs should teach agile software development. ACM SIGSOFT Software Engineering Notes, 32(2), 6-8.
Hedin, G., Bendix, L., & Magnusson, B. (2003). Introducing software engineering by means of extreme programming. Proceedings of the 25th International conference on Software Engineering, 586-593.
Hickey, T. J., Langton, J., & Alterman R. (2005). Enhancing CS programming lab courses using collaborative editors. Journal of Computing Sciences in Colleges, 20(3) 157-167.

79
Ho, C., Slaten, K., Williams, L. A., & Berenson, S. (2004) Work in progress-unexpected student outcome from collaborative agile software development practices and paired programming in a software engineering course, Frontiers in Education, Savannah, GA, United States, F2C 15-16.
Howard, E. V. (2007). Attitudes on using pair-programming. Journal of Educational Technology Systems, 35(1), 89-103.
Jacobson, N., & Schaefer, S. K. (2008). Pair programming in CS1: Overcoming objections to its adoption. ACM SIGCSE Bulletin, 40(2), 93-96.
Katira, N., Williams, L. A., & Osborne, J. (2005). Towards increasing the compatibility of student pair programmers. ICSE 2005. Proceedings of the 27th International Conference on Software Engineering, St. Louis, MO, United States, 625-626.
Katira, N., Williams, L. A., Wiebe, E., Miller, C., Balik, S., & Gehringer, E. (2004). On understanding compatibility of student pair programmers. SIGCSE 2004: Proceedings of the 35th SIGCSE Technical Symposium on Computer Science Education, Northfolk, VA, United States, 7.
Keefe, K., & Dick, M. (2004). Using Extreme Programming in a capstone project. ACE 2004: Proceedings of the sixth conference on Australasian Computing Education, 30, Dunedin, New Zealand, 151-160.
Keefe, K., Sheard, J., & Dick, M. (2006). Adopting XP practices for teaching object oriented programming. ACE 2006: Proceedings of the 8th Australian Conference on Computing Education, 52, Hobart, Tasmania, Australia, 91-100.
Koster, B. (2006). Agile methods fix software engineering course. Journal of Computing Sciences in Colleges, 22(2), 131-137.
Layman, L., Williams, L. A., Osborne, J., Berenson, S., Slaten, K., & Vouk, M. (2005). How and why collaborative software development impacts the software engineering course. FIE 2005: Proceedings of the 35th Annual Conference on Frontiers in Education, Indianapolis, IN, T4C - 9-14.
Loftus, C., & Ratcliffe, M. (2005). Extreme programming promotes extreme learning? ITiCSE 2005: Proceedings of the 10th Annual SIGCSE Conference on Innovation and Technology in Computer Science Education, Monte de Caparica, Portugal, 311-315.
Mahmoud, Q. H., Dobosiewicz, W., & Swayne, D. (2004). Redesigning introductory computer programming with HTML, JavaScript, and Java. SIGCSE 2004:

80
Proceedings of the 35th SIGCSE Technical Symposium on Computer Science Education, Northfolk, VA, United States, 120-124.
Matzko, S., & Davis, T. (2006). Pair design in undergraduate labs. Journal of Computing Sciences in Colleges, 22(2), 123-130.
McDowell, C., Hanks, B., & Werner, L. (2003). Experimenting with pair programming in the classroom. ACM SIGCSE Bulletin, 35(3), 60-64.
McDowell, C., Werner, L., Bullock, H. E., & Fernald, J. (2006). Pair programming improves student retention, confidence, and program quality. Communications of the ACM, 49(8), 90-95.
McDowell, C., Werner, L., Bullock, H. E., & Fernald, J. (2003). The impact of pair programming on student performance, perception, and persistence. Proceedings of the 25th International Conference on Software Engineering, 602-607.
Mendes, E., Al-Fakhri, L. B., & Luxton-Reilly, A. (2005). Investigating pair-programming in a 2nd year software development and design computer science course. ACM SIGCSE Bulletin, 37(3), 296-300.
Mendes, E., Al-Fakhri, L. B., & Luxton-Reilly, A. (2006). A replicated experiment of pair-programming in a 2nd-year software development and design computer science course. ACM SIGCSE Bulletin, 38(3), 108-112.
Müller, M. M. (2006). A preliminary study on the impact of a pair design phase on pair programming and solo programming. Information & Software Technology, 48(5), 335-344. doi:10.1016.
Müller, M. M., & Padberg, F. (2004). An empirical study about the feelgood factor in pair programming. Proceedings of the 10th International Symposium on Software Metrics, 151-158.
Müller, M. M. (2007). Do Programmer pairs make different mistakes than solo programmers? Journal of Systems & Software, 80(9), 1460-1471. doi:10.1016.
Müller, M. M. (2005). Two controlled experiments concerning the comparison of pair programming to peer review. Journal of Systems & Software, 78(2), 166-179. doi:10.1016
Murphy, C., Phung, D., & Kaiser, G. (2008). A distance learning approach to teaching eXtreme Programming. ITiCSE 2008: Proceedings of the 13th Annual Conference on Innovation and Technology in Computer Science Education, Madrid, Spain, 199-203.
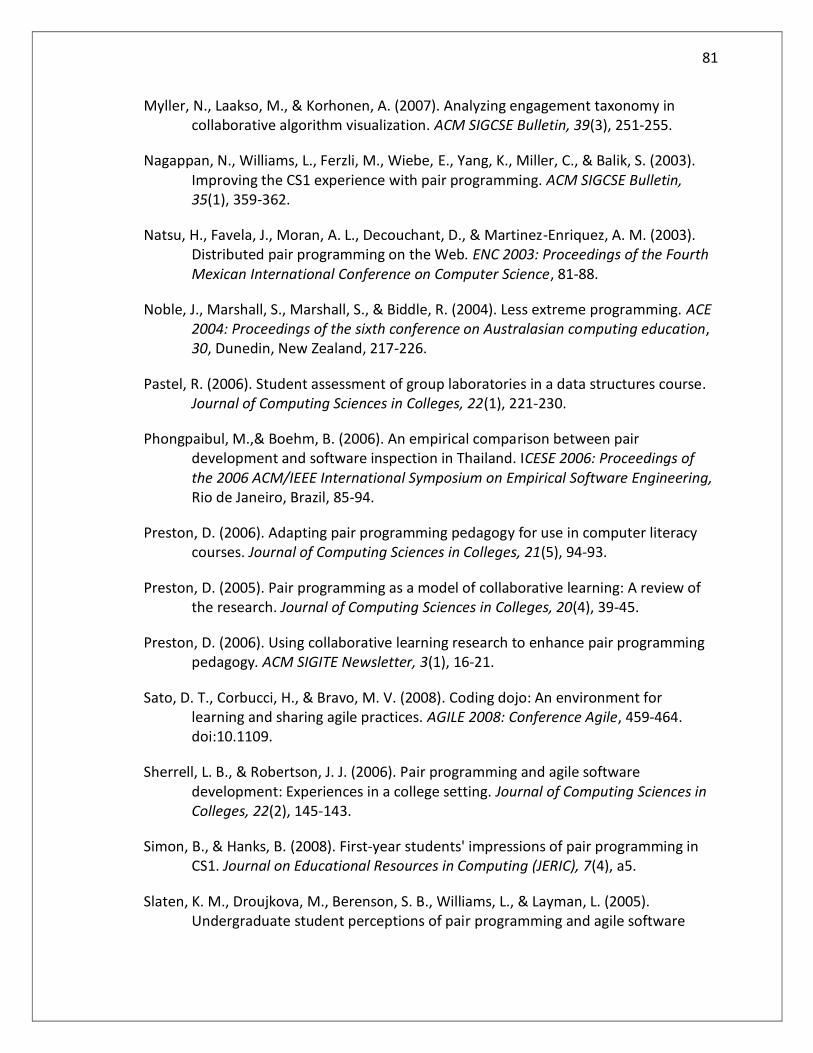
81
Myller, N., Laakso, M., & Korhonen, A. (2007). Analyzing engagement taxonomy in collaborative algorithm visualization. ACM SIGCSE Bulletin, 39(3), 251-255.
Nagappan, N., Williams, L., Ferzli, M., Wiebe, E., Yang, K., Miller, C., & Balik, S. (2003). Improving the CS1 experience with pair programming. ACM SIGCSE Bulletin, 35(1), 359-362.
Natsu, H., Favela, J., Moran, A. L., Decouchant, D., & Martinez-Enriquez, A. M. (2003). Distributed pair programming on the Web. ENC 2003: Proceedings of the Fourth Mexican International Conference on Computer Science, 81-88.
Noble, J., Marshall, S., Marshall, S., & Biddle, R. (2004). Less extreme programming. ACE 2004: Proceedings of the sixth conference on Australasian computing education, 30, Dunedin, New Zealand, 217-226.
Pastel, R. (2006). Student assessment of group laboratories in a data structures course. Journal of Computing Sciences in Colleges, 22(1), 221-230.
Phongpaibul, M.,& Boehm, B. (2006). An empirical comparison between pair development and software inspection in Thailand. ICESE 2006: Proceedings of the 2006 ACM/IEEE International Symposium on Empirical Software Engineering, Rio de Janeiro, Brazil, 85-94.
Preston, D. (2006). Adapting pair programming pedagogy for use in computer literacy courses. Journal of Computing Sciences in Colleges, 21(5), 94-93.
Preston, D. (2005). Pair programming as a model of collaborative learning: A review of the research. Journal of Computing Sciences in Colleges, 20(4), 39-45.
Preston, D. (2006). Using collaborative learning research to enhance pair programming pedagogy. ACM SIGITE Newsletter, 3(1), 16-21.
Sato, D. T., Corbucci, H., & Bravo, M. V. (2008). Coding dojo: An environment for learning and sharing agile practices. AGILE 2008: Conference Agile, 459-464. doi:10.1109.
Sherrell, L. B., & Robertson, J. J. (2006). Pair programming and agile software development: Experiences in a college setting. Journal of Computing Sciences in Colleges, 22(2), 145-143.
Simon, B., & Hanks, B. (2008). First-year students' impressions of pair programming in CS1. Journal on Educational Resources in Computing (JERIC), 7(4), a5.
Slaten, K. M., Droujkova, M., Berenson, S. B., Williams, L., & Layman, L. (2005). Undergraduate student perceptions of pair programming and agile software

82
methodologies: Verifying a model of social interaction. Proceedings of the Agile Conference, 323-330.
Smith, S., & Stoecklin, S. (2001). What we can learn from extreme programming. Journal of Computing Sciences in Colleges, 17(2), Leipzig, Germany, 144-151.
Stapel, K., Lübke, D., & Knauss, E. (2008). Best practices in extreme programming course design. ICSE 2008: Proceedings of the 30th International Conference on Software Engineering, 769-775.
Thomas, L., Ratcliffe, M., & Robertson, A. (2003). Code warriors and code-a-phobes: A study in attitude and pair programming. ACM SIGCSE Bulletin, 35(1), 363-367.
Tomayko, J. E. (2002). A comparison of pair programming to inspections for software defect reduction. Computer Science Education, 12(3), 213-212.
Van Toll, T., Lee, R., & Ahlswede, T. (2007). Evaluating the usefulness of pair programming in a classroom setting. Sixth IEEE/ACIS International Conference on Computer and Information Science, 302-308.
Vanhanen, J., & Lassenius, C. (2005). Effects of pair programming at the development team level: An experiment. International Symposium on Empirical Software Engineering, 336-345.
Wellington, C. A. (2005). Managing a project course using Extreme Programming. FIE 2005: Proceedings of the 35th Annual Conference Frontiers in Education, Indianapolis, IN, T3G - 1-5.
Wellington, C. A., Briggs, T., & Girard, C. D. (2005). Examining team cohesion as an effect of software engineering methodology. HSSE 2005: Proceedings of the 2005 Workshop on Human and Social Factors of Software Engineering, St. Louis, Missouri, United States, 16-20.
Werner, L. L., Campe, S., & Denner, J. (2005). Middle school girls + games programming = information technology fluency. SIGITE 2005: Proceedings of the 6th Conference on Information Technology Education, Newark, New Jersey, United States, 301-305.
Werner, L. L., Hanks, B., & McDowell, C. (2004). Pair-programming helps female computer science students. Journal on Educational Resources in Computing (JERIC), 4(1), 1-8.
White, S., Carter, J., Jamieson, S., Efford, N. & Jenkins, T. (2007). TOPS – Collaboration and competition to stretch our most able programming novices. Thirty-Seventh ASEE/IEEE Frontiers in Education, Milwaukee, WI, 21-24.

83
Williams, L. (1999). But, isn't that cheating? Proceedings of the 29th ASEE/IEEE Frontiers in Education Conference, San Juan, Puerto Rico, 12b9-26 - 12b9-27.
Williams, L. (2001). Integrating pair programming into a software development process. Proceedings of the 14th Conference on Software Engineering Education and Training, 27-36.
Williams, L. (2006). Debunking the nerd stereotype with pair programming. IEEE Computer, 83-85.
Williams, L. A., & Kessler, R. R. (2000). The effects of "pair-pressure" and "pair-learning" on software engineering education. Proceedings of the 13th Conference on Software Engineering Education & Training, IEEE Computer Society, Washington, DC, United States, 59.
Williams, L. A., & Kessler, R. R. (2001) Experiments with industry's "pair-programming" model in the computer science classroom. Computer Science Education, 11(1), 7-20.
Williams, L., Kessler, R. R., Cunningham, W., & Jeffries, R. (2000). Strengthening the case for pair programming. IEEE Software, 17(4), 19-25.
Williams, L., Layman, L., Osborne, J., & Katira, N. (2006). Examining the compatibility of student pair programmers. Agile Conference.
Williams, L., Layman, L., Slaten, K. M., Berenson, S. B., & Seaman, C. (2007). On the impact of a collaborative pedagogy on African American Milennial students in software engineering. ICSE 2007: 29th International Conference on Software Engineering, 677-687.
Williams, L., McCrickard, D. S., Layman, L., & Hussein, K. (2008). Eleven guidelines for implementing pair programming in the classroom. AGILE 2008: Conference Agile, 445-452. doi:10.1109.
Williams, L., McDowell, C., Nagappan, N., Fernald, J., & Werner, L. (2003). Building pair programming knowledge through a family of experiments. ISESE 2003: Proceedings of the 2003 International Symposium on Empirical Software Engineering, 143-152.
Williams, L., & Upchurch, R. (2001). Extreme programming for software engineering education? Thirty-first Annual Frontiers in Education Conference, 1, Reno, NV, United States, T2D - 12-17.
Williams, L., & Upchurch, R. L. (2001). In support of student pair-programming. ACM SIGCSE Bulletin, 33(1), 327-331.

84
Williams, L., Wiebe, E., Yang, K., Ferzli, M, & Miller, C. (2002). In support of pair programming in the introductory computer science course. Computer Science Education, 12(3), 197-212.
Xu, S., & Chen, X. (2005). Pair programming in software evolution. Canadian Conference on Electrical and Computer Engineering, Saskatoon, Canada, 1846-1849.
Xu, S., & Rajlich, V. (2006). Empirical validation of test-driven pair programming in game development. Proceedings of the 5th IEEE/ACIS International Conference on Computer and Information Science and 1st IEEE/ACIS (ICIS-COMSAR) International Workshop on Component-Based Software Engineering, Software Architecture and Reuse, 500-505.
Xu, S., & Rajlich, V. (2005). Pair programming in graduate software engineering course projects. FIE 2005: Proceedings of the 35th Annual Conference of Frontiers in Education, Indianapolis, IN, United States, F1G - 7-12.

85
This page intentionally left blank.
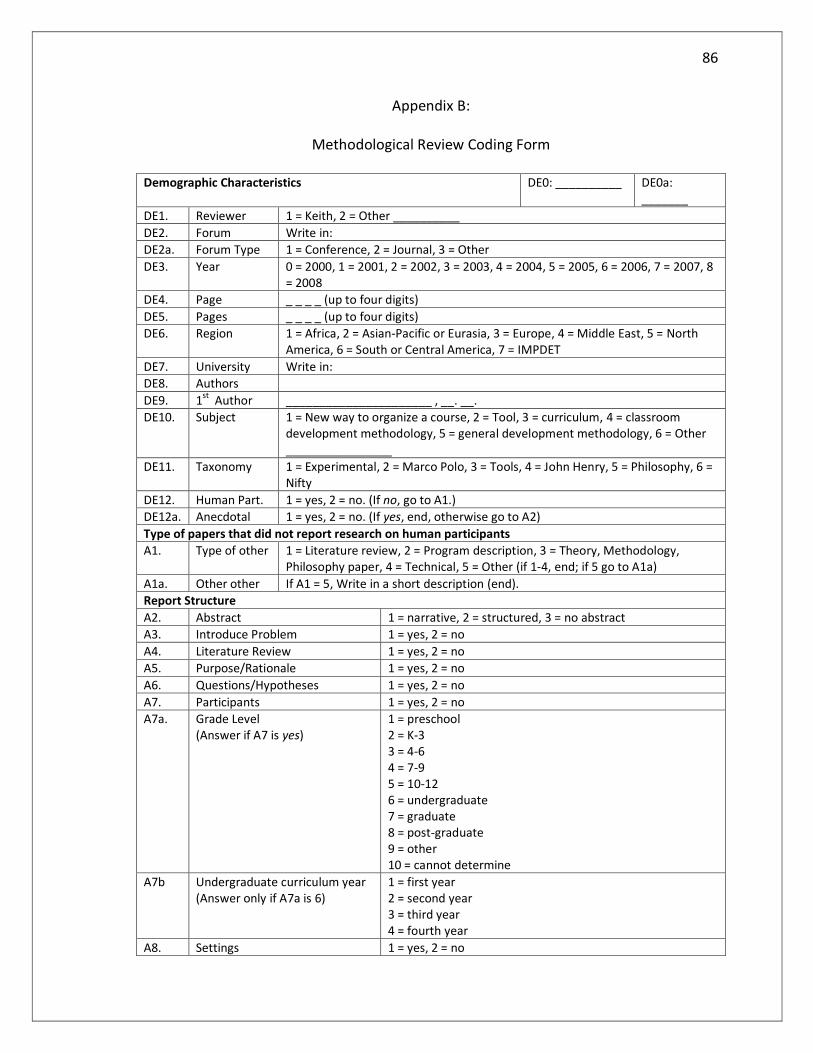
86
Appendix B:
Methodological Review Coding Form
Demographic Characteristics DE0: __________ DE0a: _______
DE1. Reviewer 1 = Keith, 2 = Other __________
DE2. Forum Write in:
DE2a. Forum Type 1 = Conference, 2 = Journal, 3 = Other
DE3. Year 0 = 2000, 1 = 2001, 2 = 2002, 3 = 2003, 4 = 2004, 5 = 2005, 6 = 2006, 7 = 2007, 8 = 2008
DE4. Page _ _ _ _ (up to four digits)
DE5. Pages _ _ _ _ (up to four digits)
DE6. Region 1 = Africa, 2 = Asian-Pacific or Eurasia, 3 = Europe, 4 = Middle East, 5 = North America, 6 = South or Central America, 7 = IMPDET
DE7. University Write in:
DE8. Authors
DE9. 1st Author ______________________ , __. __.
DE10. Subject 1 = New way to organize a course, 2 = Tool, 3 = curriculum, 4 = classroom development methodology, 5 = general development methodology, 6 = Other ________________
DE11. Taxonomy 1 = Experimental, 2 = Marco Polo, 3 = Tools, 4 = John Henry, 5 = Philosophy, 6 = Nifty
DE12. Human Part. 1 = yes, 2 = no. (If no, go to A1.)
DE12a. Anecdotal 1 = yes, 2 = no. (If yes, end, otherwise go to A2)
Type of papers that did not report research on human participants
A1. Type of other 1 = Literature review, 2 = Program description, 3 = Theory, Methodology, Philosophy paper, 4 = Technical, 5 = Other (if 1-4, end; if 5 go to A1a)
A1a. Other other If A1 = 5, Write in a short description (end).
Report Structure
A2. Abstract 1 = narrative, 2 = structured, 3 = no abstract
A3. Introduce Problem 1 = yes, 2 = no
A4. Literature Review 1 = yes, 2 = no
A5. Purpose/Rationale 1 = yes, 2 = no
A6. Questions/Hypotheses 1 = yes, 2 = no
A7. Participants 1 = yes, 2 = no
A7a. Grade Level (Answer if A7 is yes)
1 = preschool 2 = K-3 3 = 4-6 4 = 7-9 5 = 10-12 6 = undergraduate 7 = graduate 8 = post-graduate 9 = other 10 = cannot determine
A7b Undergraduate curriculum year (Answer only if A7a is 6)
1 = first year 2 = second year 3 = third year 4 = fourth year
A8. Settings 1 = yes, 2 = no

87
A9. Instruments 1 = yes, 2 = not described, 3 = none
A10. Procedure 1 = yes, 2 = no
A11. Results and Discussion 1 = yes, 2 = no
Methodology type
T1. Experimental/quasi-experimental
1 = yes, 2 = no
T1a. Assignment (If not M1, skip) 1 = self-selection, 2 = random, 3 = researcher-assigned
T2. Explanatory descriptive 1 = yes, 2 = no
T3. Exploratory description 1 = yes, 2 = no
T4. Correlational 1 = yes, 2 = no
T5. Causal-comparative 1 = yes, 2 = no
T6. IMPDET or anecdotal 1 = yes, 2 = no (if yes, then end)
T7. Selection 1 = random, 2 = purposive, 3 = convenience/preexisting
Experimental research designs
RD1. Experimental Design(s) 1 = yes, 2 = no (if no, then go to I1)
RD2. Posttest, no controls 1 = yes, 2 = no
RD3. Posttest, with controls 1 = yes, 2 = no
RD4. Pretest/posttest without controls
1 = yes, 2 = no
RD5. Pretest/posttest with controls 1 = yes, 2 = no
RD6. Group reported measures 1 = yes, 2 = no
RD6a. If RD6, was there an experimental between-group factor?
1 = yes, 2 = no
RD7. Multiple factor 1 = yes, 2 = no
RD8. Single-subject 1 = yes, 2 = no
RD9. Other 1 = yes, 2 = no
RD10. If RD9, explain:
RD11. Posttest only highest 1 = yes, 2 = no
Independent Variables (interventions)
I1. Was an independent (manipulatable) variable used in this study? 1 = yes, 2 = no
[if yes, go to I2, otherwise go to D1]
I2. Student instruction 1 = yes, 2 = no
I3. Teacher instruction 1 = yes, 2 = no
I4. CS fair/contest 1 = yes, 2 = no
I5. Mentoring 1 = yes, 2 = no
I6. Speakers at school 1 = yes, 2 = no
I7. CS field trips 1 = yes, 2 = no
I8. Pair Design/Testing/Programming 1 = yes, 2 = no
I9 Other Write in:
[go to D1]
Dependent Variables
D1. Attitudes 1 = yes, 2 = no
D2. Attendance 1 = yes, 2 = no
D3. Core achievement 1 = yes, 2 = no

88
D4. CS achievement 1 = yes, 2 = no
D5. Teaching practices 1 = yes, 2 = no
D6. Intentions for future 1 = yes, 2 = no
D7. Program implementation 1 = yes, 2 = no
D8. Costs and benefits $ 1 = yes, 2 = no
D9. Socialization 1 = yes, 2 = no
D10. Computer use 1 = yes, 2 = no
D11. Other 1 = yes, 2 = no
D11a. If D11, explain:
[go to M1]
Measures
M1. Grades 1 = yes, 2 = no
M2. Diary 1 = yes, 2 = no
M3. Questionnaire 1 = yes, 2 = no
M3a. Questionnaire w/ psych 1 = yes, 2 = no
M4. Log files 1 = yes, 2 = no
M5. Test 1 = yes, 2 = no
M5a. Test w/ psych 1 = yes, 2 = no
M6. Interviews 1 = yes, 2 = no
M7. Direct 1 = yes, 2 = no
M7a. Direct w/ psych 1 = yes, 2 = no
M8. Standardized Test 1 = yes, 2 = no
M8a. Standardized Test w/ psych 1 = yes, 2 = no
M9. Student work 1 = yes, 2 = no
M10. Focus groups 1 = yes, 2 = no
M11. Existing data 1 = yes, 2 = no
M12. Other 1 = yes, 2 = no
M12a If M12, explain:
[go to F1]
Factors (non-manipulatable variables)
F1. Were any non-manipulatable factors examined as covariates? 1 = yes, 2 = no
[if F1, go to F2, else go to S1]
F2. Gender 1 = yes, 2 = no
F3. Aptitude 1 = yes, 2 = no
F4. Race/Ethnic Origin 1 = yes, 2 = no
F5. Nationality 1 = yes, 2 = no
F6. Disability 1 = yes, 2 = no
F7. SES 1 = yes, 2 = no
F8. Other 1 = yes, 2 = no
F8a. If F8, explain:
[go to S1]

89
Statistical Practices
S1. Were quantitative results reported? 1 = yes, 2 = no
[if S1, go to S2, else end]
S2. Were inferential statistics used? 1 = yes, 2 = no
[if S2, go to S3, else go to S8]
S3. Parametric test of location used? 1 = yes, 2 = no
[if S3, go to S3a, else go to S4]
S3a. Were cell means and cell variances or cell means, mean square error and degrees of freedom reported?
1 = yes, 2 = no
S4. Were randomized block, repeated measures, or MANOVA used? 1 = yes, 2 = no
[if S4, go to S4a, else go to S5]
S4a. Were cell means reported? 1 = yes, 2 = no
S4b. Were cell sample sizes reported? 1 = yes, 2 = no
S4c. Was pooled within variance or covariance matrix reported? 1 = yes, 2 = no
S5. Were correlational analyses done? 1 = yes, 2 = no
[if S5, go to S5a, else go to S6]
S5a. Was sample size reported? 1 = yes, 2 = no
S5b. Was variance – covariance, or correlation matrix reported? 1 = yes, 2 = no
S6. Were cell means reported? 1 = yes, 2 = no
[if S6, go to S6a, else go to S7]
S6a. Were raw data summarized? 1 = yes, 2 = no
S7. Were analyses for very small samples done? 1 = yes, 2 = no
[if S7, go to S7a, else go to S8]
S7a. Was entire data set reported?
S8. Was an effect size reported? 1 = yes, 2 = no
[if S8, go to S8a, else end]
S8a. Difference in means, proportions? 1 = yes, 2 = no
S8aa. If S8a, was a measure of dispersion reported? 1 = yes, 2 = no
S8b. Standardized mean difference effect size? 1 = yes, 2 = no
S8c. Correlational effect size? 1 = yes, 2 = no
S8d. Odds ratios? 1 = yes, 2 = no
S8e. Odds? 1 = yes, 2 = no
S8f. Relative risk? 1 = yes, 2 = no
S8g. Risk difference? 1 = yes, 2 = no
S8h. Other? 1 = yes, 2 = no
S8i. If S8h, explain:
[end]

90
This page intentionally left blank.

91
Appendix C:
Methodological Review Coding Book
DEMOGRAPHIC CHARACTERISTICS
The variables in this section encode the demographic characteristics of each study.
DE0. This is the case number, assigned by the primary coder.
DE0a. If filled by the primary coder, this article was part of the inter-rater reliability sample.
DE1. Circle the number that corresponds with your name. If your name is not on the list, choose other and write in your name. (Choose one.)
DE2. Write in the name of the publication forum.
DE2a. Circle the number that corresponds to the type of publication. Choose 1 Conference if the article is published in conference proceedings. Choose 2 Journal if the article is published in a journal. Chose 3 Other if the article is published in a book, magazine, or other forum.
DE3. Encircle the year of publication.
DE4. Write in the page on which the article begins. Use four digits (e.g. if article begins on page 347 = 0347). If there is not a page number, write in 0000.
DE5. Write in the length of the article in pages. If the article had no page numbers (e.g. the article is a web page), write in -9.
DE6. Choose the region of origin of the first author’s affiliation. Choose only one. If the regions of the first author’s affiliation cannot be determined, use 7 (IMPDET = impossible to determine).
DE7. Write in the name of the university or affiliation of the first author.
DE8. Write in the number of authors.
DE9. Write in the name of the first author. Last name first, and then initials, which are followed by a period (e.g. Justus Joseph Randolph = Randolph, J. J.). Use a hyphen if a name is hyphenated (Randolph-Ratilainen), but do not use special characters.
DE10. Only choose one. If an article could belong in more than one category, choose the category that the article discusses the most. ‘Tool’ articles supersede ‘new ways to teach a course,’ when the new way to teach a course involves using a new tool.
Choose 1 if the subject of the study involved new ways to organize a course. For example, some courses might include “single new assignments” or “more drastic changes in the course.” An example is (Nagappan, et al., 2003).
Choose 2 if the article discusses “a new tool or experiences using a new tool.” An example is (Hickey, 2005).
Choose 3 if the article discusses the CSE curriculum. These types of articles “mainly present a new curriculum in their institution and elaborate on teachers and students’ experiences.”

92
Choose 4 if the article discusses software development methodology in a computer science education context.
Choose 5 if the article discusses pair programming or software development methodology without discussing computer science education.
Choose 6 if none of the categories above apply.
DE11. This variable is from Valentine’s (2004) methodological review. (The quotes are all from Valentine.) Choose only one category, from the categories listed below.
1. Experimental:
If the author made any attempt at assessing the “treatment” with some scientific analysis, I counted it as an “Experimental” presentation…. Please note that this was a preemptive category, so if the presentation fit here and somewhere else (e.g. a quantified assessment of some new Tool), it was placed here. (p. 256)
Note if experimental was selected on DE11, then DE12 should be yes and DE12a should be no. If DE12a was yes, then DE11 should be something other than experimental – the assumption being that informatl anecdotal accounts are not appropriate empirical analyses.
2. Marco Polo
*This+ category is what has been called by others “Marco Polo” presentations: “I went there and I saw this.” SIGCSE veterans recognize this as a staple at the Symposium. Colleagues describe how their institution has tried a new curriculum, adopted a new language, or put up a new course. The reasoning is defined, the component parts are explained, and then (and this is the giveaway for this category) a conclusion is drawn like “Overall, I believe the *topic+ has been a big success,” or “Students seemed to really enjoy the new *topic+”. (p. 256)
3. Tools
Next there was a large collection of presentations that I classified “Tools”. Among many other things, colleagues have developed software to animate algorithms, to help grade student programs, to teach recursion, and to provide introductory development platforms. (p. 257)
4. John Henry
*Another+, and (happily) the smallest category of presentations would be “John Henry” papers. Every now and then a colleague will describe a course that seems so outrageously difficult (in my opinion), that one suspects it is telling us more about the author than it is about the pedagogy of the class. To give a silly example, I suppose you could teach CS1 as a predicate logic course in IBM 360 assembler – but why would you want to do that? (p. 257)
5. Philosophy
*Another+ classification would be “Philosophy” where the author has made an attempt to generate debate of an issue, on philosophical grounds, among the broader community. (p. 257)
6. Nifty
The most whimsical category would be called “Nifty”, taken from the panels that are now a fixed feature of the TSP. Nifty assignments, projects, puzzles, games, and paradigms are the bubbles in the champagne of SIGCSE. Most of us seem to appreciate innovative, interesting ways to teach

93
students our abstract concepts. Sometimes the difference between Nifty and Tools was fuzzy, but generally a Tool would be used over the course of a semester, and a Nifty assignment was more limited in duration. (p. 257)
DE12. Choose yes if the article reports direct research on human participants – even if the reporting is anecdotal. Choose no if the authors did not report doing research on human participants. For example, if the author wrote, “the participants reported that they liked using the Jeliot program,” then yes should be chosen. If the author instead wrote, “in other articles, people reported that they enjoyed using the Jeliot program,” choose no since the research was not done directly by the author. (If yes go directly to DE12a; otherwise, go to A1.)
DE12a. Choose this if the article reported on investigations on human participants, but only provided anecdotal information. If yes on DE12 and DE12a, end. If no, on DE12a, then go to A2 and mark A1 and A1a as -9. This might include studies that the author purported to be a ‘qualitative study,’ but is without evidence that the researchers used a qualitative methodology.
A1. If the article did not report research on human participants, classify what type of article it is. Choose 1 – literature review if the article is primarily a literature review, meta-analysis, methodological review, review of websites, review of programs, etc. Choose 2 – program description if the article primarily describes a program/software/intervention and does not have even an anecdotal evaluation section. Choose 3 – theory, methodology, or philosophy paper if the paper is primarily a theoretical paper, discussing methodology or philosophical issues, policies, etc. For example, an article that discusses how constructivism is important for computer science education would go into this category. Choose 4 - technical if the article is primarily a technical computer science paper. For example, an article would go into this category if it compared the speed of two algorithms. Finally, choose the (5) other category if the article did not fit into any of the categories above. Use category (5) as a last resort. (If categories 1, 2, 3, or 4 are chosen, go to A2, otherwise, go to A1a.) (Choose only one.)
A1a. If you chose category 5 on variable A1, please write a description of the paper and describe what type of paper you think that it is.
REPORT STRUCTURE
In this section, which is based on the structure suggested for empirical papers by the APA publication manual (2001, pp. 10-30), you will examine the structure of the report. Filling out the report structure is not necessary if it was an explanatory descriptive study, since this report structure does not necessarily apply to qualitative (explanatory descriptive) reports.
A2. Choose 1 – narrative if the abstract was a short (150-250) narrative description of the article. Choose 2 – structured if the abstract is long (450 words) and was clearly broken up into sections. Some of the abstract section headings you might see are ‘background’, ‘purpose’, ‘research questions’, ‘participants’, ‘design’, ‘procedure’, etc. A structured abstract doesn’t necessarily have to have these headings, but it does have to be broken up into sections. Choose 3 – no abstract if there is not an abstract for the paper.
A3. Choose 1 – yes if the paper had even a brief section that describes the background/need/context/problem of the article. Choose 2 – no if there was not a section that puts the article in context, describes the background, or importance of the subject. For example, you should choose yes if an article on gender differences in computing began with a discussion of the gender imbalance in computer science and engineering.
A4. Choose 1 – yes if the author at least mentioned one piece of previous research on the same topic or a closely related topic and related the previous research to the current research. Choose 2 – no if the

94
author did not discuss previous research on the same or a closely related topic or related the previous research to the current research.
A5. Choose 1 – yes if the author explicitly mentioned why the research had been done or how the problem will be solved by the research. Choose 2 – no if the author did not give a rationale for carrying out the study.
A6. Choose 1 – yes if the author explicitly stated the research question(s) or hypotheses of the paper. Choose 2 – no if the author did not explicitly state the research question(s) or hypotheses of the paper.
A7. Choose 1 – yes if the author made any attempt at describing the demographic characteristics of the participants in the study. Choose 2 – no if the author did not describe any of the characteristics of the participants in the study. (Choose 2 if the author only described how many participants were in the study.)
A7a. If A7 is not yes then you do not need to answer this question. Categorize articles based on the grades of the participants in the study. If ages are given and grades are not, use the age references. (Grades take precedent over age when there is a conflict.)
Choose 1 if the students are in pre-school (less than 6 years old).
Choose 2 if the participants are in grades Kindergarten to 3rd-grade (ages 6-9).
Choose 3 if the participants are in grades 4 through 6 (ages 10-12).
Choose 4 if the participants are in grades 7-9 (ages 13-15).
Choose 5 if the participants are in grades 10-12 (ages 16-18).
Choose 6 if the participants are undergraduate students (ages 18-22).
Choose 7 if the participants are graduate students (ages 23-30).
Choose 8 if the participants are post-graduate students (ages 31+).
Choose 9 if the participants come from multiple categories or if they come from some other category than listed above.
Choose 10 if it is impossible to determine the grade level of the participants
A7b. If A7a is not 6 – undergraduate then do not answer this question. Choose the year (1-4) of the corresponding undergraduate computing curriculum dealt with by the article.
A8. Choose 1 – yes if the author made any attempt at describing the setting where the investigation occurred. Setting includes characteristics such as type of course, environment, type of institution, etc. Choose 2 – no if the author did not describe the setting of the study. This might include a description of participants who usually attended a course or a description of the organization of the author’s affiliation.
A9. Choose 1 – yes if special instruments were used to conduct the study and they were described. (For example, if a piece of software was used to measure student responses, then choose 1 if the software was described.) Choose 2 – not described if special instruments were used, but they weren’t described. Choose 3 – none if no special instruments were used in the study.
A10. Choose 1 – yes if the author described the procedures in enough detail that the procedure could be replicated. (If an experiment was conducted, choose yes only if both control and treatment procedures were described.) Choose 2 – no if the author did not describe the procedures in enough detail that the procedure could be replicated. For example, if the author only wrote, “we had students use our program and found that they were pleased with its usability,” then the procedure was clearly not described in enough detail to be replicated and 2 (no) should be chosen.

95
A11. Choose 1 – yes if there is a section/paragraph of the article that deals solely with results. Choose 2 – no if there is not a section/paragraph just for reporting results. For example, choose 2 (no) if the results are dispersed throughout the procedure, discussion, and conclusion sections.
METHODOLOGY TYPE
In this section, you will encode the type of methodology used by the study. Since articles can report multiple methods, choose all that apply.
T1. If the researcher manipulated a variable and compared a factual and counterfactual condition, the case is experimental or quasi-experimental. For example, if a researcher developed an intervention then measured achievement before and after the delivery of the intervention, then an experimental or quasi-experimental methodology was used. Choose 1 – yes if the study used an experimental or quasi-experimental methodology. Choose 2 – no if the study did not use an experimental or quasi-experimental methodology. Note that the study is experimental/quasi-experimental if the researcher administered a one-group posttest-only or a retrospective posttest on an intervention that the researcher implemented. The posttest in this case might actually be a survey.
T1a. Use 1 – self-selection when participants knowingly self-selected into treatment and control groups or when the participants decided the order of treatment and controls themselves. Use 2 - random when participants or treatment and control conditions were assigned randomly (Also use 2 for an alternative treatment design.) Use 3 – researcher-assigned when the researcher purposively assigned participants to treatment and control conditions or the order of treatment and control conditions or in designs where participants serve as their own controls. Also, use 3 when assignment is done by convenience or in existing groups.
T2. Studies that provided deductive answers to “how” questions by explaining the causal relationships involved in a phenomenon is explanatory descriptive. Studies using qualitative methods often fall into this category. For example, if a researcher did in-depth interviews to determine the process that expert programmers go through when debugging a piece of software, this study uses an explanatory descriptive methodology. Choose 1 – yes if the study used an explanatory descriptive methodology and choose 2 – no otherwise. This does not include content analysis, where the researcher simply quantifies qualitative data (e.g., the researcher classifies qualitative data into categories, and then presents the distribution of units into categories.)
T3. Studies that answered “what” or “how much” questions but did not make any causal claims used an exploratory descriptive methodology. Pure survey research is perhaps the most typical example of the exploratory descriptive category, but certain kinds of case studies might qualify as exploratory descriptive research as well. Choose 1 – yes if the study used an exploratory descriptive methodology and choose 2 – no if it did not. Note: if a researcher gave a survey to the participants and the investigation did not examine the implementation of an intervention, then the study was exploratory descriptive.
T4. A study is correlational if it analyzed how continuous levels of one variable systematically covaried with continuous levels of another variable. Studies that conducted correlational analyses, structural equation modeling studies, factor analyses, cluster analyses, and multiple regression analyses are examples of correlational methodologies. Choose 1 – yes if the study used a correlational methodology and choose 2 – no otherwise.
T5. If researchers compared two or more groups on an inherent variable, an article is causal-comparative. For example, if a researcher compares computer science achievement between boys and girls, that case is causal-comparative, because gender is a variable that is inherent in the group and cannot be naturally manipulated by the researcher. Choose 1 – yes if the study used a correlational methodology and choose 2 – no otherwise.

96
T6. If not enough information was given to determine what type of methodology or methodologies were used. If T6, then end.
Examples: A researcher used a group repeated measures design with one between factor (gender) and two within factors (measures, treatment condition). That investigation is an experiment because the researcher manipulated a variable and compared factual and counterfactual conditions (the treatment-condition within factor). The investigation should also be classified as causal-comparative because of the between factor in which two levels of a non-manipulatable variable were compared. Had the researcher not examined the gender variable, this investigation would not be causal-comparative.
A researcher did a regression analysis to regress the number of hours using Jeliot (computer education software) on a test of computer science achievement. In addition, the researcher also examined a dummy variable where Jeliot was used with and without audio feedback. Because of the multiple regression, the investigation was correlational. Because of the manipulatable dummy variable, the investigation also has an experimental or quasi-experimental design.
A researcher gave only a posttest survey to a class after they used the intervention that the researcher assigned. The researcher claimed that 60% of the class, after using the intervention, exhibited mastery on the posttest. Since the researcher claimed that 60% of the class exhibited mastery on the posttest because of the intervention, then the investigation was experimental/quasi-experimental (in M1), using a one-group posttest-only research design (RD2). (Had the researcher done a survey, but not measure the effects of an intervention, then it would have just been exploratory descriptive and not a one-group posttest-only experiment.)
T7. Choose 1 – random if the sampling units were randomly selected. Choose 2 – purposive if the participants were purposively selected. (For example, if the researcher chose to examine only extreme cases this would be purposive selection.) Choose 3 if the researcher chose a convenience sample or existing group. Choose 3 unless there is evidence for random or purposive sampling.
EXPERIMENTAL RESEARCH DESIGNS
If the researcher used an experimental/quasi-experimental methodology, classify the methodology into research design types. Choose 1 for yes and 2 for no.
RD1. Choose 1 if M1 was marked as yes. If yes, one of the following RD# variables must also be a yes, otherwise, go to I1.
RD2. Use this for the one-group posttest-only without controls design. In the one-group posttest only design, the researcher only gives a posttest to a single group and tries to make causal claims. (In this design, the observed mean might be compared to an expected mean.) This includes retrospective posttests, in which participants estimate impact between counterfactual and factual conditions.
RD3. Use this for the posttest with controls design. In the posttest with controls design, the researcher only gives a posttest to both a control and treatment group. Put the regression-discontinuity design into this category too and regressions with a dummy treatment variable into this design. (The independent T-test, regression with a dummy variable, or univariate ANOVA analyses might be used with this research design.)
RD4. Use this for the pretest/posttest without controls design. In pretest/posttest without controls design, the researcher gives a pretest and posttest to only a treatment group. (Dependent T-tests might be used in this design.)

97
RD5. Use this for the pretest/posttest with controls design. In the pretest/posttest with controls design, the researcher gives a pretest and posttest to both a treatment group and one or more control groups. (Independent T-tests of gain scores or ANCOVA might be used on these designs.)
RD6. Use this for repeated measures designs. In the group repeated measures design, the researchers use participants as their own controls, measured over multiple points of time or levels of treatment. (Repeated measures analysis might be used in this design.)
RD6a. Use 1 – yes if there is an experimental between-group factor, that is, if there exists a variable that is varied between groups. Select 2 – no otherwise.
RD7. Use this for designs with multiple factors that examine interactions. If only main effects are examined, code the research design as a control group design (like the case in a one-way ANOVA).
RD8. Use this for single-subject designs. In this design, a researcher uses the logic of the repeated measures design, but only examines a few cases. (Interrupted time series designs apply to this category.)
RD9. Use this if the author did not give enough information to determine the type of experimental research design.
RD10. Use this category if the research design is well explained but not RD2-RD8.
RD11. Choose 1 – yes if the only research design used was the one-group posttest-only design (i.e., if RD2 was marked yes, and RD3 through RD9 were marked no), otherwise mark no. The construct behind this variable is whether a researcher compared a factual with a counterfactual occurrence. It assumes here that the one-group posttest-only design does not compare a factual with a counterfactual condition.
INTERVENTION (INDEPENDENT VARIABLE)
For this group of variables, choose 1 – yes if the listed intervention was used in the article and choose 2 - no if a intervention was not used. Choose all that apply.
I1. Choose 1 - yes if an intervention was used in this investigation. Choose 2 - no if an intervention was not used. There might be an intervention in an experimental/quasi-experimental study or in an explanatory descriptive study; however, there would not be an intervention in a causal-comparative study, since it examines variables not manipulated by the researcher. Also, there would not be an intervention in an exploratory descriptive study (e.g., survey study) since exploratory descriptive research is described here as research on a variable that is not manipulated by the researcher.
If I1 = 1, go to I2, otherwise go to D1.
I2. Choose yes if participants received instruction in computer science by a human or by a computerized tool. Otherwise, choose no.
I3. Choose yes if teachers received instruction on the pedagogy of computer science. Otherwise, choose no.
I4. Choose yes if participants participated in a computer science fair or programming contest. Otherwise, choose no.
I5. Choose yes if participants were assigned to a computer science mentor. Otherwise, choose no.
I6. Choose yes if participants listened to speakers who are computer scientists. Otherwise, choose no.

98
I7. Choose yes if participants took a field trip to a computer-science-related site. Otherwise, choose no.
I8. Choose yes if participants used pair design, pair testing, or pair programming. Otherwise, choose no.
I9. Write in any other interventions employed by the study.
DEPENDENT VARIABLES
In this section, you encode the dependent variables’ outcomes that were examined. Choose 1 for yes and 2 for no. Choose all that apply.
D1. Choose yes if the study measured participant attitudes, including satisfaction, self-reports of learning, motivation, confidence, etc. Otherwise, choose no.
D2. Choose yes if the study measured participant attendance or enrollment in a program, including attrition. Otherwise, choose no.
D3. Choose yes if the study measured achievement in core courses that are not computer science. Otherwise, choose no.
D4. Choose yes if the study measured achievement in computer science. This includes CS test scores, quizzes, assignments, and number of assignments completed. Otherwise, choose no.
D5. Choose yes if the study measured how teachers instruct students. Otherwise, choose no.
D6. Choose yes if the study measured what courses, fields of study, careers, etc, that students planned to take in the future. Otherwise, choose no.
D7. Choose yes if the study measured how well a program or intervention was implemented; that is, treatment fidelity. Otherwise, choose no.
D8. Choose yes if the study measured how much a certain intervention/policy/program costs. Otherwise, choose no.
D9. Choose yes if the study measured how much students socialize with each other or with the instructor. Otherwise, choose no.
D10. Choose yes if the study measured how much or in what way students use computers. Otherwise, choose no.
D11. Use this category for dependent variables that are not included above. Otherwise, choose no.
D11a. If D11, describe the dependent variable(s). Otherwise, choose no.
MEASURES
In this section, you will encode the kinds of measures used to measure the dependent variables. For some measures, you will note if psychometric information, operationalized as the author making any attempt at report information about the reliability or validity of a measure. Choose 1 for yes and 2 for no.
M1. Choose yes if the study measured grades in a computer science course – or overall grades (e.g. GPA). Otherwise, choose no.

99
M2. Choose yes if a learning diary was a measure. Otherwise, choose no.
M3. Choose yes if a questionnaire or survey was a measure. Otherwise, choose no.
M3a. Choose yes if psychometric information was given about the survey or questionnaire. Otherwise, choose no.
M4. Choose yes if computerized log files of participants’ behaviors when using computers was a measure. Otherwise, choose no.
M5. Choose yes if the study utilized teacher-made or researcher-made tests or quizzes. Otherwise, choose no.
M5a. Choose yes if psychometric information is given about the test or quiz. Otherwise, choose no.
M6. Choose yes if interviews with students or teachers was a measure. Otherwise, choose no.
M7. Choose yes if the researchers observed strictly operationalized behaviors. Otherwise, choose no.
M7a. Choose yes if the study provided reliability information (e.g., inter-rater agreement) about the direct observation. Otherwise, choose no.
M8. Choose yes if a standardized test in core subjects or computer science was a measure. Otherwise, choose no.
M8a. Choose yes if the study provided psychometric information for each standardized test. Otherwise, choose no.
M9. Choose yes if exercises/assignments in computer science were a measure – this might include portfolio work. This does not include work on tests, grades, or standardized tests. Otherwise, choose no.
M10. Choose yes if focus groups, SWOT analysis, or the Delphi technique were measures. Otherwise, choose no.
M11. Choose yes if records such as attendance data, school history, etc. were measures. This does not include log files. Otherwise, choose no.
M12. Choose yes if there were measures not included above. Otherwise, choose no.
M12a. If M12, describe.
FACTORS (NON-MANIPULATABLE VARIABLES)
In this section, you will examine the factors or non-manipulatable variables examined by the study. (If they were manipulatable, they should be mentioned as an intervention.) Chose 1 for yes and 2 for no.
F1. Choose yes if the study examined any non-manipulatable factors. Otherwise, choose no. [If yes, go to F2, otherwise go to S1]
F2. Choose yes if the gender of participants or teacher was used as a factor. Otherwise, choose no.
F3. Choose yes if the researcher make a distinction between high and low achieving participants. Otherwise, choose no.

100
F4. Choose yes if race/ethnic origin of participants was a factor. Otherwise, choose no.
F5. Choose yes if nationality, geographic region, or country of origin was a factor. Otherwise, choose no.
F6. Choose yes if disability status of participants was a factor. Otherwise, choose no.
F7. Choose yes if the socio-economic status of participants was a factor. Otherwise, choose no.
F8. Choose yes if the researchers examined factors not listed above. Otherwise, choose no.
F8a. If F8, describe.
STATISTICAL PRACTICES
In this section, you will code for the statistical practices used. Choose 1 for yes and 2 for no. Check all that apply. These categories come from the section informational adequate statistics section of the APA Publication Manual (2001, pp. 23-24).
S1. Choose yes if quantitative results were reported. Otherwise, choose no. [If yes, go to S2, otherwise end]
S2. Choose yes if inferential statistics were used. Otherwise, choose no. [If yes, go to S3, otherwise go to S8]
S3. Choose yes if parametric tests of location were used (e.g., single-group, multiple-group, or multiple-factor tests of means). Otherwise, choose no.
S3a. If S3, choose yes if either cell means and cell sizes were reported or if means cell variances or mean square error and degrees of freedom were reported. Otherwise, choose no.
S4. Choose yes if multivariate types of analysis were used. Otherwise, choose no.
S4a. If S4, choose yes if cell means were reported. Otherwise, choose no.
S4b. If S4, choose yes if sample sizes were reported. Otherwise, choose no.
S4c. If S4, choose yes if pooled within variance or a covariance matrix was reported. Otherwise, choose no.
S5. Choose yes if correlational analyses were done (e.g. multiple regression analyses, factor analysis, and structural equation modeling). Otherwise, choose no.
S5a. If S5, choose yes if sample size was reported. Otherwise, choose no.
S5b. If S5, choose yes if a variance-covariance or correlation matrix was reported. Otherwise, choose no.
S6. Choose yes if non-parametric analyses were used. Otherwise, choose no.
S6a. Choose yes if raw data were summarized. Otherwise, choose no.
S7. Choose yes if analyses for very small samples were done. Otherwise, choose no.
S7a. If S7, choose yes if the entire dataset was reported. Otherwise, choose no.

101
S8. Choose yes if an effect size reported. Otherwise, choose no. [If yes, go to S8a, otherwise end.]
S8a. Choose yes if there was a difference in means, proportions, medians reported. Otherwise, choose no. (Here, authors just needed to present two or more means or proportions. They did not actually have to subtract one from the other. This also includes what is called ‘risk difference.’)
S8aa. If S8a, choose yes if a mean was reported and if a standard deviation was reported. If a median was reported, choose yes if a range was also reported. Otherwise, choose no.
S8b. Choose yes if a standardized mean difference effect size was reported. Otherwise, choose no.
S8c. Choose yes if a correlational effect size was reported. Otherwise, choose no.
58d. Choose yes if odds ratios were reported. Otherwise, choose no.
58e. Choose yes if odds were reported. Otherwise, choose no.
58f. Choose yes if relative risk was reported. Otherwise, choose no.
58h. Choose yes if some type of effect size not listed above was reported. Otherwise, choose no.
58i. if 58h, explain.
End

102
This page intentionally left blank.
103
Appendix D:
C#.NET 3.5 SP1 Code for Confidence Intervals around a Proportion from a Random
Sample
Note: All source code in this work is licensed under the Creative Commons Attribution-Noncommercial 3.0 License. To view a copy of this license, visit http://creativecommons.org/licenses/by-nc/3.0/us/ or send a letter to Creative Commons, 171 Second Street, Suite 300, San Francisco, California, 94105, USA.
// Requires references to System, System.Core, System.Data and System.Data.Linq namespace Noc.Data.Thesis { using System; using System.Collections.Generic; using System.Linq; /// <summary> /// Data type representing the results of resample analysis. /// </summary> /// <typeparam name="TValue">The type of the variable.</typeparam> public class ResampleResult<TValue> { /// <summary>Gets or sets the cell value.</summary> /// <value>The cell value.</value> public TValue Value { get; set; } /// <summary>Gets or sets the cell size.</summary> /// <value>A value between 0 and the overall size of the population.</value> public int N { get; set; } /// <summary>Gets or sets the relative cell weight.</summary> /// <value>A value between 0.0 and 100.0.</value> public double Percent { get; set; } /// <summary>Gets or sets the lower confidence interval of the mean.</summary> /// <value>A value between 0.0 and 100.0.</value> public double LowerCI { get; set; } /// <summary>Gets or sets the upper confidence interval of the mean.</summary> /// <value>A value between 0.0 and 100.0.</value> public double UpperCI { get; set; } /// <summary>Returns a string that represents the resampling result.</summary> /// <returns> /// A <see cref="T:System.String"/> that represents the resampling result. /// </returns> public override string ToString() { return string.Format( @"""{0}"",{1},{2:00.0},{3:00.0},{4:00.0}", this.Value, this.N, this.Percent * 100.0, this.LowerCI * 100.0, this.UpperCI * 100.0); } }
104
/// <summary> /// Class contains logic for resampling for confidence intervals around a /// proportion. Requires that the statistical variables be provided as /// enumerable collections of equatable values. Requires .NET Framework /// 3.5 SP1. /// </summary> public static class Resampler { /// <summary> /// Resamples the specified source, with replacement, up to a specified /// number of times and reports a collection of <c>ResampleResult</c> /// objects, each containing cell sizes, means, and confidence intervals. /// </summary> /// <typeparam name="TResult">The type of the value to resample.</typeparam> /// <param name="source">The source collection of values.</param> /// <param name="resampleCount">The number of random resamples.</param> /// <param name="groupThreshold">Values with frequency less than this threshold /// are reported as the value "Other".</param> /// <returns> /// <c>ResampleResult</c> containing the results of the analysis. /// </returns> public static IEnumerable<ResampleResult<TResult>> Resample<TResult>( this IEnumerable<TResult> source, int resampleCount, int groupThreshold) { var values = source.ToArray(); var samples = new Dictionary<object, int[]>(); var valueCount = values.Length; var otherCount = values.Length; var otherKey = DBNull.Value; var idxlci = (int)Math.Round(resampleCount * 0.025); var idxuci = (int)Math.Round(resampleCount * 0.975); var distinctvals = values.GroupBy(v => v) .Where(g => g.Count() >= groupThreshold) .Select(g => g.Key) .ToArray(); distinctvals.Execute(v => samples[v] = new int[resampleCount]); samples[otherKey] = new int[resampleCount]; // conduct *resamples* number of resamples. for (int i = 0; i < resampleCount; i++) { // draw *count* number of items with replacement. for (int j = 0; j < valueCount; j++) { var value = values.NextValue(); var sample = samples.ContainsKey(value) ? samples[value] : samples[otherKey]; sample[i]++; } } // Sort the resamples for each value to find the 2.5 and 97.5 percentile. foreach (var value in distinctvals) { var sample = samples.ContainsKey(value) ? samples[value] : samples[otherKey]; Array.Sort(sample); var n = values.Count(v => v.Equals(value)); otherCount -= n; var result = new ResampleResult<TResult>() { Value = value, N = n, Percent = n / (double)valueCount, LowerCI = sample[idxlci] / (double)valueCount, UpperCI = sample[idxuci] / (double)valueCount };

105
yield return result; } // Return the "other" category, if it exists. if (otherCount > 0) { yield return new ResampleResult<TResult>() { Value = default(TResult), N = otherCount, Percent = otherCount / (double)valueCount, LowerCI = samples[otherKey][idxlci] / (double)valueCount, UpperCI = samples[otherKey][idxuci] / (double)valueCount }; } } /// <summary> /// Resamples the specified source, with replacement, up to a specified /// number of times and reports a collection of <c>ResampleResult</c> /// objects, each containing cell sizes, means, and confidence intervals. /// </summary> /// <typeparam name="TResult">The type of the value to resample.</typeparam> /// <param name="source">The source collection of values.</param> /// <param name="resampleCount">The number of random resamples.</param> /// <param name="percentile025">The value of the 2.5th percentile.</param> /// <param name="percentile975">The value of the 97.5th percentile.</param> public static void ResampleMedian<TResult>( this IEnumerable<TResult> source, int resampleCount, out TResult percentile025, out TResult percentile975) { var values = source.ToArray(); var samples = new Dictionary<object, int>(); var valueCount = values.Length; var medCount = values.Length / 2; var idxlci = (int)Math.Round(resampleCount * 0.025); var idxuci = (int)Math.Round(resampleCount * 0.975); var medians = new TResult[resampleCount]; var distinctvals = values.Distinct() .OrderBy(v => v) .ToArray(); // conduct *resamples* number of resamples. for (int i = 0; i < resampleCount; i++) { distinctvals.Execute(v => samples[v] = 0); // draw *count* number of items with replacement. for (int j = 0; j < valueCount; j++) { var value = values.NextValue(); samples[value]++; } var sum = 0; var median = distinctvals.First(v => medCount < (sum += samples[v])); medians[i] = median; } Array.Sort(medians); percentile025 = medians[idxlci]; percentile975 = medians[idxuci]; } } /// <summary> /// Utility methods supporting the resampler library. /// </summary> public static class Extensions

106
{ /// <summary> /// Pseudo-random number generator. /// </summary> private static Random rand = new Random(); /// <summary> /// Executes an action on each element of the collection. /// </summary> /// <typeparam name="TResult">The type of the result.</typeparam> /// <param name="source">The source collection.</param> /// <param name="action">The action to perform.</param> public static void Execute<TResult>( this IEnumerable<TResult> source, Action<TResult> action) { foreach (var elem in source) { action(elem); } } /// <summary> /// Retrieves a random value, with replacement, from the collection. /// </summary> /// <typeparam name="TResult">The type of the result.</typeparam> /// <param name="source">The source collection.</param> /// <returns>A random value retrieved from the collection.</returns> public static TResult NextValue<TResult>(this TResult[] source) { return source[rand.Next(source.Length)]; } } } namespace Noc.Data.Thesis.Test { using System.Collections.Generic; using System.IO; using System.Linq; using Microsoft.VisualStudio.TestTools.UnitTesting; /// <summary> /// Sample test harness for resampling. Full test harness not included in this work. ///</summary> [TestClass()] public class ResamplerTest { /// <summary> /// The data access context. /// </summary> private static ThesisData data; /// <summary> ///Gets or sets the test context which provides ///information about and functionality for the current test run. ///</summary> public TestContext TestContext { get; set; } /// <summary> /// Setups the specified test context. /// </summary> /// <param name="testContext">The test context.</param> [ClassInitialize] public static void Setup(TestContext testContext) { data = new ThesisData(); if (File.Exists("resamples.csv")) { File.Delete("resamples.csv"); }

107
} /// <summary> /// Posttest cleanup. /// </summary> [ClassCleanup] public static void Cleanup() { data.Dispose(); data = null; } /// <summary> /// Gathers aggregate statistics for the DE variables. /// </summary> [TestMethod] public void DETest() { short lcimedian, ucimedian; var count = 10000; var records = data.Records; var humanrecords = data.Records.Where(r => r.DE12 == true); var de02 = records.Select(r => r.DE2).Resample(count, 5); AppendResults(de02, "DE2"); var de02a = records.Select(r => r.DE2a).Resample(count, 0); AppendResults(de02a, "DE2a"); var de03 = records.Select(r => r.DE3).Resample(count, 0); AppendResults(de03, "DE3"); var de05 = records.Select(r => r.DE5).Resample(count, 0); AppendResults(de05, "DE5"); records.Select(r => r.DE5 ?? -1).ResampleMedian(count, out lcimedian, out ucimedian); AppendMedianResults(lcimedian, ucimedian, "DE5"); var de06 = records.Select(r => r.DE6).Resample(count, 0); AppendResults(de06, "DE6"); var de07 = records.Select(r => r.DE7).Resample(count, 3); AppendResults(de07, "DE7"); var de08 = records.Select(r => r.DE8).Resample(count, 0); AppendResults(de08, "DE8"); records.Select(r => r.DE8 ?? -1).ResampleMedian(count, out lcimedian, out ucimedian); AppendMedianResults(lcimedian, ucimedian, "DE8"); var de09 = records.Select(r => r.DE9).Resample(count, 3); AppendResults(de09, "DE9"); var de10 = records.Select(r => r.DE10).Resample(count, 0); AppendResults(de10, "DE10"); var de11 = records.Select(r => r.DE11).Resample(count, 0); AppendResults(de11, "DE11"); var de12 = records.Select(r => r.DE12).Resample(count, 0); AppendResults(de12, "DE12"); var de12a = humanrecords.Select(r => r.DE12a).Resample(count, 0); AppendResults(de12a, "DE12a"); } /// <summary> /// Appends the results to a CSV file for analysis. /// </summary>
108
/// <typeparam name="TValue">The type of the value.</typeparam> /// <param name="results">The results to append.</param> /// <param name="heading">The heading text for the results section.</param> private static void AppendResults<TValue>( IEnumerable<ResampleResult<TValue>> results, string heading) { using (var writer = File.AppendText("resamples.csv")) { writer.WriteLine("{0},N (of {1}),%,Lower CI 95%,Upper CI 95%", heading, results.Sum(r => r.N)); foreach (var result in results.OrderByDescending(r => r.N)) { writer.WriteLine(result.ToString()); } writer.WriteLine(); } } /// <summary> /// Appends the median results to a CSV file for analysis. /// </summary> /// <typeparam name="TValue">The type of the value.</typeparam> /// <param name="percentile025">The 2.5th percentile.</param> /// <param name="percentile975">The 97.5th percentile.</param> /// <param name="heading">The heading text for the results section.</param> private static void AppendMedianResults<TValue>( TValue percentile025, TValue percentile975, string heading) { using (var writer = File.AppendText("resamples.csv")) { writer.WriteLine("{0} Median,Value", heading); writer.WriteLine("2.5%,{0}", percentile025); writer.WriteLine("97.5%,{0}", percentile975); writer.WriteLine(); } } } }

109
This page intentionally left blank.

110
Appendix E:
C#.NET 3.5 SP1 Code for Computing the χ2 and M2 Statistics, and Associated Significance
Tests
Note: All source code in this work is licensed under the Creative Commons Attribution-Noncommercial 3.0 License. To view a copy of this license, visit http://creativecommons.org/licenses/by-nc/3.0/us/ or send a letter to Creative Commons, 171 Second Street, Suite 300, San Francisco, California, 94105, USA. Note: Source code in this appendix depends on the open source Math.NET Iridium library for computing the cumulative probability of a χ2 statistic. See http://mathnet.opensourcedotnet.info.
namespace Noc.Data.Thesis { using System; using System.Collections.Generic; using System.IO; using System.Linq; using MathNet.Numerics.Distributions; /// <summary> /// Data type representing the results of chi-square analysis. /// </summary> /// <typeparam name="TValue">The type of the variable.</typeparam> public class ChiSquareResult { /// <summary> /// Initializes a new instance of the <see cref="ChiSquareResult"/> class. /// </summary> /// <param name="df">The degrees of freedom.</param> /// <param name="n">The sample size.</param> /// <param name="x">The the value to evaluate.</param> public ChiSquareResult(int df, int n, double x) { var dist = new ChiSquareDistribution(df); this.Df = df; this.N = n; this.X = x; this.P = 1.0 - dist.CumulativeDistribution(x); } /// <summary>Gets the degrees of freedom.</summary> /// <value>The degrees of freedom.</value> public int Df { get; private set; } /// <summary>Gets the sample size.</summary> /// <value>The sample size.</value> public int N { get; private set; } /// <summary>Gets the chi-square value.</summary> /// <value>The chi-square value.</value> public double X { get; private set; } /// <summary>Gets the P-value of the test for independence.</summary> /// <value>The P-value of the test for independence.</value> public double P { get; private set; } /// <summary> /// Returns a string that reports this χ^2 per APA publication guidelines. /// </summary>

111
/// <returns> /// A <see cref="T:System.String"/> that represents the chi-square result. /// </returns> public override string ToString() { return string.Format( @"""χ^2({0}, N={1})={2:0.00}, p={3:0.000}""", this.Df, this.N, this.X, this.P); } } /// <summary> /// Data type representing the results of M-square analysis. /// </summary> public class MSquareResult { /// <summary> /// Initializes a new instance of the <see cref="MSquareResult"/> class. /// </summary> /// <param name="n">The sample size.</param> /// <param name="x">The value of the m-square statistic.</param> public MSquareResult(int n, double x) { var dist = new ChiSquareDistribution(1); this.N = n; this.X = x; this.P = 1.0 - dist.CumulativeDistribution(x); } /// <summary>Gets the sample size.</summary> /// <value>The sample size.</value> public int N { get; private set; } /// <summary>Gets the m-square value.</summary> /// <value>The m-square value.</value> public double X { get; private set; } /// <summary>Gets the P-value of the test for independence.</summary> /// <value>The P-value of the test for independence.</value> public double P { get; private set; } /// <summary> /// Returns a string that reports this M^2 per APA publication guidelines. /// </summary> /// <returns> /// A <see cref="T:System.String"/> that represents the chi-square result. /// </returns> public override string ToString() { return string.Format( @"""M^2(1, N={0})={1:0.00}, p={2:0.000}""", this.N, this.X, this.P); } } /// <summary> /// Data type representing two values for cross tabulation /// </summary> public class CrossTableKey { /// <summary> /// Initializes a new instance of the <see cref="CrossTableKey"/> class. /// </summary> public CrossTableKey() { }

112
/// <summary> /// Initializes a new instance of the <see cref="CrossTableKey"/> class. /// </summary> /// <param name="first">The first value.</param> /// <param name="second">The second value.</param> public CrossTableKey(object first, object second) { this.First = first; this.Second = second; } /// <summary> /// Gets or sets the value of the first member of the pair. /// </summary> /// <value>The value of the first member of the pair.</value> public object First { get; set; } /// <summary> /// Gets or sets the value of the second member of the pair. /// </summary> /// <value>The value of the second member of the pair.</value> public object Second { get; set; } } /// <summary> /// Data type representing the results of resample analysis. /// </summary> public class CrossTable { /// <summary> /// Array contains a sorted set of distinct values for the rows of the crosstable. /// </summary> private object[] firstKeys; /// <summary> /// Array contains a sorted set of distinct values for the columns of the crosstable. /// </summary> private object[] secondKeys; /// <summary> /// Counts for individual cells in the crosstable. /// </summary> private int[,] cells; /// <summary> /// Container for the values of adjusted residuals and relative cell weights. /// </summary> private double[,] residuals, proportions; /// <summary> /// The labels for the row and column axes. /// </summary> private string labela, labelb; /// <summary> /// Gets the chi square analysis result. /// </summary> /// <value>The chi square analysis result.</value> public ChiSquareResult ChiSquare { get { var lena = this.firstKeys.Length; var lenb = this.secondKeys.Length; double n = this.cells[lena, lenb], chisquare = 0.0; // Accumulate the chi-square statistic. for (int idxa = 0; idxa < lena; idxa++) {

113
for (int idxb = 0; idxb < lenb; idxb++) { var expected = (double)this.cells[lena, idxb] * this.cells[idxa, lenb] / n; var actual = (double)this.cells[idxa, idxb]; chisquare += (actual - expected) * (actual - expected) / expected; } } return new ChiSquareResult((lena - 1) * (lenb - 1), (int)n, chisquare); } } /// <summary> /// Gets the M square analysis result. /// </summary> /// <value>The M square analysis result.</value> public MSquareResult MSquare { get { var lena = this.firstKeys.Length; var lenb = this.secondKeys.Length; double ubar = 0.0, vbar = 0.0; double sdevu = 0.0, sdevv = 0.0; double cov = 0.0, reg, msquare; double n = this.cells[lena, lenb]; // Accumulate the rank score, u-bar, using the array index for u. for (int idxa = 0; idxa < lena; idxa++) { ubar += idxa * this.proportions[idxa, lenb]; } // Accumulate the rank score, v-bar, using the array index for v. for (int idxb = 0; idxb < lenb; idxb++) { vbar += idxb * this.proportions[lena, idxb]; } // Compute the covariance component of the result. for (int idxa = 0; idxa < lena; idxa++) { for (int idxb = 0; idxb < lenb; idxb++) { cov += (idxa - ubar) * (idxb - vbar) * this.proportions[idxa, idxb]; } } // Compute the squared standard deviation of the row values. for (int idxa = 0; idxa < lena; idxa++) { sdevu += (idxa - ubar) * (idxa - ubar) * this.proportions[idxa, lenb]; } // Compute the squared standard deviation of the column values. for (int idxb = 0; idxb < lenb; idxb++) { sdevv += (idxb - vbar) * (idxb - vbar) * this.proportions[lena, idxb]; } // Compute the regression value and, finally, the m-square statistic. reg = cov / Math.Sqrt(sdevu * sdevv); msquare = (n - 1) * reg * reg; return new MSquareResult((int)n, msquare); } }

114
/// <summary> /// Creates a cross table using values from the specified source. /// </summary> /// <param name="source">The source values.</param> /// <param name="labela">The label for the row values.</param> /// <param name="labelb">The label for the column values.</param> /// <returns>A cross table with cell counts, proportions, and residuals populated.</returns> public static CrossTable Create( IEnumerable<CrossTableKey> source, string labela, string labelb) { var table = new CrossTable(); var values = source.ToArray(); table.firstKeys = values.Select(v => v.First) .Distinct() .OrderBy(v => v) .ToArray(); table.secondKeys = values.Select(v => v.Second) .Distinct() .OrderBy(v => v) .ToArray(); var lena = table.firstKeys.Length; var lenb = table.secondKeys.Length; table.cells = new int[lena + 1, lenb + 1]; table.proportions = new double[lena + 1, lenb + 1]; table.residuals = new double[lena + 1, lenb + 1]; table.labela = labela; table.labelb = labelb; // Compute cell counts, including row and column cumulative counts. foreach (var value in values) { var idxa = Array.IndexOf(table.firstKeys, value.First); var idxb = Array.IndexOf(table.secondKeys, value.Second); table.cells[idxa, idxb]++; table.cells[idxa, lenb]++; table.cells[lena, idxb]++; table.cells[lena, lenb]++; } // Compute cell proportions and residuals. double total = table.cells[lena, lenb]; for (int idxa = 0; idxa <= lena; idxa++) { for (int idxb = 0; idxb <= lenb; idxb++) { var na = table.cells[lena, idxb] / total; var nb = table.cells[idxa, lenb] / total; var expected = na * nb * total; var actual = (double)table.cells[idxa, idxb]; table.proportions[idxa, idxb] = actual / total; table.residuals[idxa, idxb] = (actual - expected) / Math.Sqrt(expected * (1 - na) * (1 - nb)); } } return table; } /// <summary> /// Returns a string formatted as a CSV block representing the /// resampling result and residuals. /// </summary> /// <returns> /// A <see cref="T:System.String"/> that represents the resampling result. /// </returns> public override string ToString() { using (var writer = new StringWriter()) {

115
writer.Write(@"""{0}/{1}""", this.labela, this.labelb); this.secondKeys.Execute(s => writer.Write(",{0}", s)); writer.Write(",Total"); this.secondKeys.Execute(s => writer.Write(",Pct.{0}", s)); this.secondKeys.Execute(s => writer.Write(",resid.{0}", s)); writer.WriteLine(); for (int idxa = 0; idxa <= this.firstKeys.Length; idxa++) { writer.Write(idxa == this.firstKeys.Length ? (object)"Total" : this.firstKeys[idxa]); for (int idxb = 0; idxb <= this.secondKeys.Length; idxb++) { writer.Write(",{0}", this.cells[idxa, idxb]); } for (int idxb = 0; idxb < this.secondKeys.Length; idxb++) { var total = (double)this.cells[idxa, this.secondKeys.Length]; writer.Write(",{0:0.0}", 100.0 * this.cells[idxa, idxb] / total); } if (idxa < this.firstKeys.Length) { for (int idxb = 0; idxb < this.secondKeys.Length; idxb++) { writer.Write(",{0:0.0}", this.residuals[idxa, idxb]); } } writer.WriteLine(); } return writer.ToString(); } } } } namespace Noc.Data.Thesis.Test { using System; using System.IO; using System.Linq; using Microsoft.VisualStudio.TestTools.UnitTesting; /// <summary> /// Sample CrossTable test harness. The full harness is not included here. /// </summary> [TestClass()] public class CrossTablerTest { /// <summary> /// The data access context. /// </summary> private static ThesisData data; /// <summary> ///Gets or sets the test context which provides ///information about and functionality for the current test run. ///</summary> public TestContext TestContext { get; set; } /// <summary> /// Setups the specified test context. /// </summary> /// <param name="testContext">The test context.</param> [ClassInitialize] public static void Setup(TestContext testContext) { data = new ThesisData();

116
if (File.Exists("crosstables.csv")) { File.Delete("crosstables.csv"); } } /// <summary> /// Posttest cleanup. /// </summary> [ClassCleanup] public static void Cleanup() { data.Dispose(); data = null; } /// <summary> /// Performs crosstable analysis on forum types. /// </summary> [TestMethod] public void ForumTypeTest() { var records = data.Records; var humanrecords = data.Records.Where(r => r.DE12 == true); var forumrecords = humanrecords.Where(r => r.DE2a != 3); var empiricalrecords = data.Records.Where(r => r.DE12 == true && r.DE12a == false); var empiricalforums = empiricalrecords.Where(r => r.DE2a != 3); var experimentalrecords = empiricalforums.Where(r => r.T1 == true || r.T3 == true || r.T4 == true || r.T5 == true); var isAnecdotal = forumrecords.Select( r => new CrossTableKey(r.DE2a, r.DE12a)); var isExperiment = empiricalforums.Select( r => new CrossTableKey(r.DE2a, r.T2 == false && r.T6 == false)); var isExplanatory = empiricalforums.Select( r => new CrossTableKey(r.DE2a, (r.T2 == true || r.T6 == true) && r.T1 == false && r.T3 == false && r.T4 == false && r.T5 == false)); var isAttitude = forumrecords.Select( r => new CrossTableKey(r.DE2a, r.D1 == true && r.D2 == false && r.D3 == false && r.D4 == false && r.D5 == false && r.D6 == false && r.D7 == false && r.D8 == false && r.D9 == false && r.D10 == false && r.D11 == null)); var isPosttest = experimentalrecords.Select( r => new CrossTableKey(r.DE2a, r.RD11)); // Write results to a file. AppendResults(CrossTable.Create(isAnecdotal, "Forum", "Anecdotal"), false); AppendResults(CrossTable.Create(isExperiment, "Forum", "Experimental"), false); AppendResults(CrossTable.Create(isExplanatory, "Forum", "Explanatory"), false); AppendResults(CrossTable.Create(isAttitude, "Forum", "Attitude-only"), false); AppendResults(CrossTable.Create(isPosttest, "Forum", "Posttest-only"), false); } /// <summary> /// Appends the results to a CSV file for analysis. /// </summary> /// <param name="table">The table to draw.</param> /// <param name="isOrdinal">if set to <c>true</c> report M-square.</param> private static void AppendResults(CrossTable table, bool isOrdinal) { using (var writer = File.AppendText("crosstables.csv"))

117
{ writer.WriteLine(table.ToString()); if (isOrdinal) { writer.WriteLine(table.MSquare.ToString()); } else { writer.WriteLine(table.ChiSquare.ToString()); } writer.WriteLine(); } } } }