Draft report - Food and Agriculture Organization of the United Nations

uestions
Food composition study guide – Q
uestions & exercises
exercises
Vol. 1
Vo
l. 1FA
O
9 7 8 9 2 5 1 0 6 5 4 0 2
I1515E/1/04.10/1
ISBN 978-92-5-106540-2
2 nd revised version

uestions exercises
Vol. 1
THE INTERNATIONAL NETWORK OF FOOD DATA SYSTEMS
FOOD AND AGRICULTURE ORGANIZATION OF THE UNITED NATIONSRome, 2011
U. Ruth Charrondiere
Barbara Burlingame
Sally Berman
Ibrahim Elmadfa

The designations employed and the presentation of material in this information product do not imply the expression of any opinion whatsoever on the part of the Food and Agriculture Organization of the United Nations (FAO) concerning the legal or development status of any country, territory, city or area or of its authorities, or concerning the delimitation of its frontiers or boundaries. The mention of specific companies or products of manufacturers, whether or not these have been patented, does not imply that these have been endorsed or recommended by FAO in preference to others of a similar nature that are not mentioned.
The views expressed in this information product are those of the author(s) and do not necessarily reflect the views of FAO.
E-ISBN 978-92-5-106915-8 (PDF)
All rights reserved. FAO encourages reproduction and dissemination of material in this information product. Non-commercial uses will be authorized free of charge, upon request. Reproduction for resale or other commercial purposes, including educational purposes, may incur fees. Applications for permission to reproduce or disseminate FAO copyright materials, and all queries concerning rights and licences, should be addressed by e-mail to [email protected] or to the Chief, Publishing Policy and Support Branch, Office of Knowledge Exchange, Research and Extension, FAO, Viale delle Terme di Caracalla, 00153 Rome, Italy.
© FAO 2011

Introduction
i
CONTENTS
Foreword iii
Acknowledgements v
Introduction vii
Modules
Module 1 Basic principles of a food composition programme 13
Module 2 Use of food composition data 21
Module 3 Selection and nomenclature of foods in food composition databases
31
Module 4.a Component selection 43
Module 4.b Component nomenclature 51
Module 4.c Component conventions and units 65
Module 4.d Methods of analysing components 77
Module 5 Sampling 95
Module 6 Quality aspects of analytical data 109
Module 7 Resources for food composition
Publishing food composition data
123
Module 8 Recipe and other calculations 133
Module 9 Food composition database management systems and data interchange
151
Module 10 Compilation and documentation 163
Module 10.a Comparing food composition databases 185
Module 10.b Case study - translating food intake into nutrient intake 191
Module 11 Quality considerations in data compilation 195
Module 12 Food biodiversity 205

Introduction
iii
FOREWORD In the 1930s and 1940s, as the individual B vitamins were being discovered, there was a demand for knowledge of their content in foods. FAO began compiling Regional Food Tables using the limited existing data. In the 1940s, Food Analysis Institutes were established in Mexico, Cuba, Columbia and later Peru, with support from the Rockefeller Foundation, the Kellogg Foundation and US AID. The Institute of Nutrition of Central America and Panama (INCAP) was conceived originally as a Food Analysis Institute for Guatemala. Although its mission was broadened, analysis of Central American foods had a high priority and one of its first publications was a ‘Food Composition Table for Central America and Panama’, produced jointly with FAO. However, in the decades that followed, funding and emphasis shifted more towards nutrition studies. Food analysis and nutrient data base compilation in developing countries became limited to a few under-funded laboratories. Available food composition data were increasingly outdated and based on obsolete methods. The irony of this was that, as the studies of human nutrition increased, so did the need for reliable food composition data. In 1973, a small group of internationally involved nutritionists became concerned about the growing obsolescence and inadequacy of available food composition data, especially in developing countries, and concluded that the situation had become urgent. For example, promising studies of diet and chronic diseases were invalid because of unreliable food composition data. The group obtained administrative and financial support from the United Nations University, use of the Rockefeller Foundation Conference Center in Bellagio, Italy, as well as support from the US National Cancer Institute, United States Department of Agriculture, United States Food and Drug Administration and seven major food companies. In addition, FAO, World Health Organization (WHO), International Union of Nutritional Sciences (IUNS) and International Union of Food Science and Technology (IUFoST) were represented. The sponsorship was evidence of how important this issue had become. The Bellagio meeting in 1983 proposed the formation of an International Network of Food Data Systems (INFOODS) to be administered by the United Nations University (UNU) in collaboration with FAO that would establish units for the promotion of an improved food composition database in every country and region, and that would make the best available food composition data freely accessible to nutrition and health workers in all developing countries. This would require a system of nomenclature for universal use and defining the specific content of an ideal data file. With the collaboration of FAO and UNU this was achieved in a few years, a task made feasible by the unexpected rapid development of the Internet. The recommendation to establish a Journal of Food Composition and Analysis (JFCA) was fulfilled. Later, administrative responsibility for INFOODS and JFCA was also assumed by FAO since 1999. Training has not been neglected. The biennial training workshops at Wageningen University have played an important role as has the basic text book by Greenfield and Southgate (2003) Food composition data – production, management and use. Graduates of the Wageningen course have replicated it several times in most of the regions, but financial support for regional courses has been increasingly difficult to obtain. It is now increasingly recognized that, while nutritional deficiencies remain important in some populations, nutrition is an important factor in essentially all infectious and chronic diseases in all populations. The more that is invested in finding out which nutrients and other ingredients of food are responsible, the more important reliable food composition databases become and the greater the need for well trained analysts and food database managers and users. This Food Composition Study Guide comes at an opportune time. Not only is the role of human nutrition in determining current and future health recognized more widely than ever before, but also distance-learning tools such as these are in increasing demand and, in some cases, replace classroom learning. It is an important contribution! Nevin S. Scrimshaw Ph.D., M.D., M.P.H. President, International Nutrition Foundation Institute Professor Emeritus. Massachusetts Institute of Technology


Introduction
v
ACKNOWLEDGEMENTS We are grateful to all those who contributed to the development of the Food Composition Study Guide, particularly to all peer reviewers (Gary Beecher, Eliana Bistrich Giuntini, Rakesh Bhardwaj, Carol Byrd-Bredbenner, Isabel Castanheira, Paolo Colombani, Roger Djoule, Marie Claude Dop, Lois Englberger, Nino dePablo, Jean Francois Hausman, David Haytowitz, Paul Hulshof, Venkatesh Iyenger, Kunchit Judprasong, Jehangir Khan Khali, John Klensin, Harriet Kuhnlein, T. Longvah, Alison Paul, Pamela Pehrsson, Jean Pennington, Janka Porubska, Prapasri Puwastien, Hettie Schönfeldt, Louwrens Smit, Ian Unwin, Ana Vasquez-Caicedo, Elizabete Wenzel), to those who contributed to its content (Marie Luccioni, Edouard Oddo, Enrica Biondi, Prapasri Puwastien) and those who tested the modules: George Annor, Rekia Belahsen, Natasha Danster, Sandra Eisenwagen, Heinz Freisling, Melanie Fröhler, Ingrid Führhacker, Verena Hasenegger, Sonja Kanzler, T. Longvah, Susanne Lüftenegger, Katharina Maierhofer, Elinor Medhammar, Beatrice Mouille, Emma Nilsson, Verena Nowak, Nino dePablo, Doris Rittenschober, Esther Sakyi-Dawson, Annalisa Sivieri, Francisca Smith, Renee Sobolewski, Barbara Stadlmayr, Ramani WijesinhaBettoni as well as the participants of the food composition courses in Bratislava, Slovak Republic (2008), Teheran, Iran (2008), Cotonou, Benin (2009), Accra, Ghana (2009), Pretoria, South Africa (2010), and at the University of Vienna, Austria (2008, 2009). We are also grateful to Omar Bolbol for the cover design and to Giuseppina Di Felice for the layout.

Introduction
vii
INTRODUCTION Since the establishment of the International Network of Food Data Systems (INFOODS) in 1984, there has been a significant improvement in the quality and availability of food composition data worldwide. INFOODS has developed standards and guidelines for the collection, compilation and reporting of food composition data. The network collaborates in the dissemination of knowledge of food composition and standards through regional training courses on the production and management of food composition data. Classroom-based food composition training courses started in 1992. Since then, nine courses have been held in Wageningen, the Netherlands, and 13 courses in Africa, Asia, Latin America, Near East and Oceania. The courses are based on the book Food composition data – production, management and use by H. Greenfield and D.A.T. Southgate (2003), and comprise lectures, group work, practical sessions and field trips. Each course, consisting of 20–30 participants, lasts from two to three weeks, covers all relevant aspects of food composition, and targets professionals in food composition data generation, compilation and use – usually from fields such as nutrition science, food science, public health and analytical chemistry. These courses contribute to capacity-building and strengthening of food composition activities at national and regional levels; improving the availability, comparability and quality of food composition data; improving the adequate use of these data; and the training of trainers, which ultimately lead to improved quality and quantity of compositional data and result in e.g. better dietary assessments, policy decisions, food labels and consumer choice. By the end of 2009, about 500 participants had attended these courses. In many cases, former participants have taken up key positions in their countries and regions in the implementation of food composition programmes and have become trainers in subsequent courses. Others have left the area of food composition. There are still many professionals who have never been trained in food composition and who are in need of this knowledge. In addition, the number of sectors needing food composition data is expanding to areas such as food biodiversity, plant breeding, dietary diversity, food industry and food regulation, to give just a few examples. There is, thus, an obvious and evident need to train more professionals in food composition worldwide and to introduce food composition into the curricula of future professionals, especially nutritionists, food technologists and dieticians However, courses in the classroom are expensive and time-consuming for both participants and organizers, and financial support for such activities is dwindling. In line with the current trend whereby continuing education is no longer restricted to the classroom and professionals learn on the job using distance and e-learning tools, FAO and INFOODS developed the Food Composition Study Guide, a self-study version of the classroom course (Charrondiere et al., 20091). One of the challenges in developing this Study Guide was to make it attractive and understandable for individuals from different educational backgrounds, to maintain student motivation and to encourage them to complete relevant modules. The Food Composition Study Guide is one of several initiatives which FAO will provide to encourage and promote continuing education in food composition activities. AUDIENCE AND OBJECTIVES The Food Composition Study Guide was developed to reach a wide audience and to make knowledge of food composition more accessible and less costly, especially for those not able to attend classroom courses. At the same time, the goal was to ensure that the quality of classroom course content would be maintained in the Food Composition Study Guide. It can be used for self-study, in a university setting or in conjunction with postgraduate food composition courses (e.g. at the end of sessions or of the course to evaluate learning, as a refresher after a course, or as a distance-learning tool). The Study Guide has successfully been implemented in all these settings. The Study Guide is intended mostly for compilers and users of food composition data and also for analysts. The Study Guide is also designed to serve as a basis for master and PhD classes or as distance-learning packages at universities. Some universities have already shown interest in including it in their curricula. As the Study Guide covers all aspects of food composition it will enable students to assimilate all principles to generate, compile or use food composition data and to apply them correctly in their future work. The Study Guide does not cover analytical methods or food composition database management 1 Charrondiere, U.R., Burlingame, B., Berman, S., Elmadfa, I. 2009. Food composition training: Distance learning as a new approach and comparison to courses in the classroom, Journal of Food Composition and Analysis 22, 421–432.

Introduction
viii
systems in depth. Users of the Study Guide will learn how to compile a food composition database, how to use it and, as analysts, they will learn how their data should be generated and presented so that compilers can make the most use of them. The Food Composition Study Guide is a tool to assist learners not only to absorb new material but to assess their understanding of the teaching material. It is mainly based on Greenfield and Southgate (2003) and different sources are sometimes indicated when they represent the actual state of the art on these topics. Students are invited to compare them but will not always receive information on which school of thought is preferred. RELEVANCE The following table indicates which modules are the most relevant for the different groups of students. Number of module
Name of module Relevant for compilers
Relevant for professional users*
Relevant for analysts
1 Basic principles of a food composition programme ●●●●● ●●●●● ●● 2 Use of food composition data ●●●●● ●●●●● ●● 3 Selection and nomenclature of foods in food
composition databases ●●●●● ●●●●● ●●
Components in food composition databases 4.a Component selection ●●●●● ●●●●● ● 4.b Component nomenclature ●●●●● ●●●●● ●●●●● 4.c Component conventions and units ●●●●● ●●●●● ●●●●● 4.d Methods of analysing components ●● ●● ●●●●● 5 Sampling ●●●●● ● ●●●●● 6 Quality aspects of analytical data ●● ●● ●●●●● 7 Resources for food composition
Publishing food composition data ●●●●● ●●●●● ●●●●●
8 Recipe and other calculations ●●●●● ●●●●● ● 9 Food composition database management
systems and data interchange ●●●●● ●●●●● ●
10 Compilation and documentation ●●●●● ●●●●● ●●●●● 10.a Comparing food composition databases ●●●●● ●●●●● ● 10.b Case study - translating food intake into nutrient
intake ●●●●● ●●●●● ●
11 Quality considerations in data compilation ●●●●● ●●●●● ●● 12 Food biodiversity ●●●●● ●●●●● ●●●●●
* A professional user will use food composition data (e.g. to estimate nutrient intake, to produce labels, or to develop diets) and might also compile purpose-driven food composition databases. They are unlikely to sample foods or supervise the analysis of foods.

Introduction
ix
STRUCTURE The Food Composition Study Guide is published in two volumes: Questions and exercises – volume 1 and Answers to the questions and exercises – volume 2. Both volumes consist of 17 modules, grouped under 12 greater subject themes (see the table above). Each module is separated into different sections. The first one states the learning objectives, the material to be studied and an estimation of the time required to complete the module. Often, a list of resources or reference material is indicated along with material for additional reading. The second section contains the questions, the third the exercises. In the volume with the answers, an additional section provides the general feed back. The questions are structured in a way that allows students to become familiar with the basic terms and concepts, and then gradually increase their knowledge by going through the different topics of the subject. The exercises enable learners to apply their newly-acquired knowledge. The students obtain a certain number of points by answering questions and doing exercises correctly. The answers section provides responses to the questions and exercises, and contains other information that may be of interest. In many cases, the answers may be found in Greenfield and Southgate (2003). If no other reference is indicated, the page numbers in the answer section correspond to this book (and not to those of the PDF file). At the end of the each answer section, the ‘General feedback using self-scoring’ gives information on how well students integrate the new knowledge and are able to apply it. HOW TO PROCEED It is recommended that students start with ‘Required reading’, and then answer the questions and complete the exercises. Students will enhance their learning if they try to answer the questions and exercises themselves without looking at the answers. Once this task is completed, they should verify if their answers are correct. In most cases, additional information is provided, either to explain why certain answers are right or wrong or to give more information on the topic. Scoring points are given for each answer, after which the final score can be calculated. With the final score, participants can assign themselves a grade. It is not expected that learners obtain 100% scores in the first run but that they reflect on the issues and learn by doing. Learners who did not fully understand a module are invited to repeat parts of modules, and, if necessary, study some of the reading material again. Students with an advanced knowledge may wish to answer the questions and exercises without previous reading. They might, however, for some questions have to consult the required reading material to find the answers. Some of the assignments require higher-level thinking in the subject matter. For those students interested in learning more about the topic, a number of documents are suggested for further reading. After completing the module(s), the students are kindly requested to e-mail ([email protected] or [email protected]) their score and comments which will help FAO to judge the quality of the module and improve the modules. HOW TO USE THE STUDY GUIDE TO DEVELOP LEARNING PROGRAMMES ON SPECIFIC TOPICS Modules of the Study Guide can be reorganized and form the basis of educational programmes in formal or informal training on specific topics or for specific audiences. For example, universities in nutrition and dietetics could be interested in the use of food composition data, while universities in food technology, food chemistry or food safety are mainly interested in the quality aspects of analytical values of different components found in foods. The success of capacity development of individuals is related to the capacity development of institutions and the enabling environment. Firstly, support from higher-level management of one's institution is important as is the inclusion of the new tasks in the mandate of the institution. Secondly, factors from the policy-enabling environment influence the success of the capacity development of individuals. For example, issues in policies, funding and political may need to be addressed. This may entail holding seminars and meetings with decision-makers, managers and directors of institutions and politicians. In the following three examples are given on possible courses or seminars.

Introduction
x
Example 1. Course on correct use of food composition data The learning objectives will allow students to understand the principles of food composition database development, management and use and be able to apply them:
how databases are set up, developed and maintained (including documentation and budget considerations);
how to involve users, compilers and analysts in food composition programmes; where food composition data can be found and how to judge their quality; how data should be expressed; how data are obtained (including recipe calculations) and compiled, applying quality considerations; the importance of high-quality food composition data and their impact on nutrient intakes and
adequacy. For these learning objectives, use of the following modules is recommended, in part or full. Number of module
Name of module Estimated time for completion
1 Basic principles of a food composition programme 3-8 h 2 Use of food composition data 3-8 h 3 Selection and nomenclature of foods in food composition databases 3-10 h 4.a Component selection 3-9 h 4.b Component nomenclature 3-12 h 4.c Component conventions and units 3-7 h 7 Resources for food composition
Publishing food composition data 3-6 h
8 Recipe and other calculations 4-10 h 10 Compilation and documentation 5-14 h 11 Quality considerations in data compilation 3-9 h
Example 2. Course on achieving high-quality analytical data for food composition The learning objectives will allow students to understand the principles of data quality of analytical data generated for food composition purposes and be able to apply them:
sampling; selecting appropriate analytical methods; quality aspects of analytical data; expression of data (component and foods); the importance of high-quality food composition data and their impact on nutrient intakes and
adequacy. For these learning objectives, use of the following modules is recommended, in part or full.
Number of module
Name of module Estimated time for completion
2 Use of food composition data – exercises only 1 h 3 Selection and nomenclature of foods in food composition databases 3-10 h 4.b Component nomenclature 3-12 h 4.c Component conventions and units 3-7 h 4.d Methods of analysing components 5-16 h 5 Sampling 3-9 h 6 Quality aspects of analytical data 3-9 h 11 Quality considerations in data compilation 3-9 h
Example 3. Seminar for decision-makers on the importance of food composition data
Introduction
xi
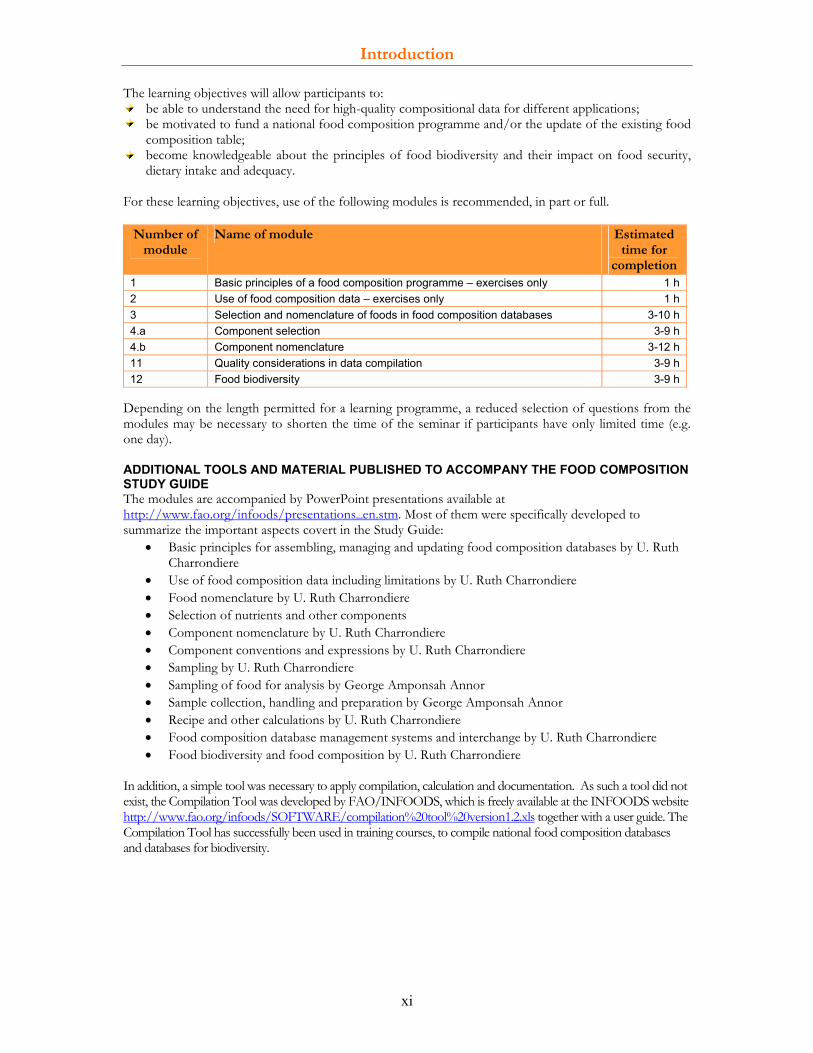
The learning objectives will allow participants to: be able to understand the need for high-quality compositional data for different applications; be motivated to fund a national food composition programme and/or the update of the existing food
composition table; become knowledgeable about the principles of food biodiversity and their impact on food security,
dietary intake and adequacy. For these learning objectives, use of the following modules is recommended, in part or full.
Number of module
Name of module Estimated time for
completion1 Basic principles of a food composition programme – exercises only 1 h 2 Use of food composition data – exercises only 1 h 3 Selection and nomenclature of foods in food composition databases 3-10 h 4.a Component selection 3-9 h 4.b Component nomenclature 3-12 h 11 Quality considerations in data compilation 3-9 h 12 Food biodiversity 3-9 h
Depending on the length permitted for a learning programme, a reduced selection of questions from the modules may be necessary to shorten the time of the seminar if participants have only limited time (e.g. one day). ADDITIONAL TOOLS AND MATERIAL PUBLISHED TO ACCOMPANY THE FOOD COMPOSITION STUDY GUIDE The modules are accompanied by PowerPoint presentations available at http://www.fao.org/infoods/presentations_en.stm. Most of them were specifically developed to summarize the important aspects covert in the Study Guide:
• Basic principles for assembling, managing and updating food composition databases by U. Ruth Charrondiere
• Use of food composition data including limitations by U. Ruth Charrondiere • Food nomenclature by U. Ruth Charrondiere • Selection of nutrients and other components • Component nomenclature by U. Ruth Charrondiere • Component conventions and expressions by U. Ruth Charrondiere • Sampling by U. Ruth Charrondiere • Sampling of food for analysis by George Amponsah Annor • Sample collection, handling and preparation by George Amponsah Annor • Recipe and other calculations by U. Ruth Charrondiere • Food composition database management systems and interchange by U. Ruth Charrondiere • Food biodiversity and food composition by U. Ruth Charrondiere
In addition, a simple tool was necessary to apply compilation, calculation and documentation. As such a tool did not exist, the Compilation Tool was developed by FAO/INFOODS, which is freely available at the INFOODS website http://www.fao.org/infoods/SOFTWARE/compilation%20tool%20version1.2.xls together with a user guide. The Compilation Tool has successfully been used in training courses, to compile national food composition databases and databases for biodiversity.

Introduction
xii

Module 1 – Questions
13
Module 1 BASIC PRINCIPLES OF A FOOD COMPOSITION PROGRAMME
LEARNING OBJECTIVES By the end of this module the student will be able to:
understand the objectives of food composition databases; run a food composition programme (including budget considerations); involve users, compilers and analysts in food composition programmes; collaborate internationally; know how to obtain food composition data.
REQUIRED READING • Charrondière, U.R. ‘Basic principles for assembling, managing and updating food composition
databases’, available at: http://www.fao.org/infoods/presentations_en.stm and if possible: • Greenfield, H. & Southgate, D.A.T. 2003. Food composition data – production, management and use. FAO,
Rome2. Introduction and chapters 1–2 (pp. 5–31). Available at: ftp://ftp.fao.org/docrep/fao/008/y4705e/y4705e00.pdf
RELEVANCE FOR DIFFERENT GROUPS (ON A SCALE OF + TO +++++) • Compilers/ professional users +++++ • Analysts ++ ESTIMATED TIME TO COMPLETE TASKS • Required reading: 1-4 hours • Answering the questions: 1-2 hours • Completing the exercises: 1-2 hours
2 The page numbers indicated correspond to the page numbers of the book (top of the page), and not to the PDF file.

Module 1 – Questions
14
Questions I.Q1 Indicate the correct reasons for compiling and publishing food composition tables and databases. Select True or False. (4 points: ½ point for each correct response)
Reasons for compiling and publishing food composition tables and databases:
True False
to analyse nutrient intakes or develop nutrient requirements. to compare food intakes and relate them to disease outcome. to carry out epidemiological research on the relationship between nutrient intake and disease.
to produce food labels. to develop new analytical methods. to formulate institutional and therapeutic diets and plan menus. to promote nutritionally-important plants and animals to improve health or for breeding programmes.
to inform consumers about good food choices. I.Q2 Before food composition data can be published, a compiler needs to collect the data and manage them systematically. Match the four levels of database management first to their corresponding definition and then to the tasks to be performed by a compiler. (6.5 points: ½ point for each correct response)
Levels of database management: 1. Data sources 2. Archival database 3. Reference database 4. User database
Definition Levels Collection of data that have been scrutinized, standardized, aggregated and completed. Collection in paper or electronic form of published and unpublished literature containing analytical and other compositional data.
A subset of the reference database disseminated to the public in different formats: simplified (also called abbreviated or concise), comprehensive (also called unabridged), or special-purpose tables and databases.
Collection of records holding the original data of the collected literature in electronic format.
Tasks to be carried out related to different levels of database management Levels Update protocols on evaluating, calculating, editing, combining and averaging data Prepare and disseminate different user tables and databases, depending on specific needs Scrutinize (= evaluate) data to obtain good-quality and representative data Assign specific and unique food codes to each food in the database to allow for their retrieval and management within the databases and ensure the traceability of their component values
For users, include concise information on methods, sampling and calculation procedures, nutrient definitions, quality index and literature sources
Compile the collected data and metadata into a computerized format and enter all bibliographic references
Standardize units and express all nutrients and other components in a uniform manner Collect documents and data files with published and unpublished data Add data (borrowed, calculated, imputed) and document all data sources
* Both are possible because most food records are created in the archival database and some in the reference database.

Module 1 – Questions
15
I.Q3 List in the correct order the tasks to be undertaken by a newly appointed food composition compiler involved in developing a food composition programme. The plan calls for a database of 400 foods including 20 analysed foods. Start with 1 for the first task and end with 7 for the last. (3.5 points: ½ point for each correct response)
Tasks of a food composition compiler Order of tasks- Select foods and nutrients - Collect recipes, including ingredients - Compile recipes in the reference database
- Develop guidelines for disseminating data to users (e.g. commercial user, research institutes, others) and corresponding costs - Prepare and disseminate user food composition tables and databases
- Review, collect and compile existing information into an archival database - Develop (or provide input for) sampling plans and analytical programmes, supervise the analytical programme and evaluate analytical reports
- Create a steering committee with stakeholders and users - Obtain training in food composition, e.g. distance learning and/or classroom course - Network with compilers, analysts and users from other countries and with international networks or organizations (e.g. INFOODS Regional Data Centres) - Prepare a budget proposal, and approach potential donors - Obtain information on users’ needs
- Maintain and update the database continuously - Start compiling foods in the reference database - Obtain refresher training in food composition, e.g. classroom course, study tour and/or distance learning - Incorporate the analytical data into the reference database
I.Q4 Before starting a national food composition programme, it is highly recommended that steps be taken to ascertain whether another institution or governmental organization is mandated to undertake food composition-related activities. If this is not the case, authorization should be sought from the appropriate government agency (e.g. agriculture, health) to act as coordinator of the national food composition programme. Which of the following statements are reasons for obtaining such authorization? Select True or False. (2.5 points: ½ point for each correct response) Reasons for obtaining authorization True FalseSuch authorization may prevent another food composition table being published, with the claim that it is the authoritative (official) table for the country in question.
Such authorization may prevent other food composition tables being published in the same country.
Such authorization might result in a budget allocation from the government or other potential donors, both within and outside the country, for the organization to develop, update and maintain a food composition programme.
Such authorization might result in allocated staff time to develop, update and maintain a food composition programme – meaning that food composition work will not be done on a voluntary basis as and when time permits, but as part of the work plan and programmed outputs.
Such authorization charges the organization with developing, updating and maintaining a food composition programme.
Module 1 – Questions
16
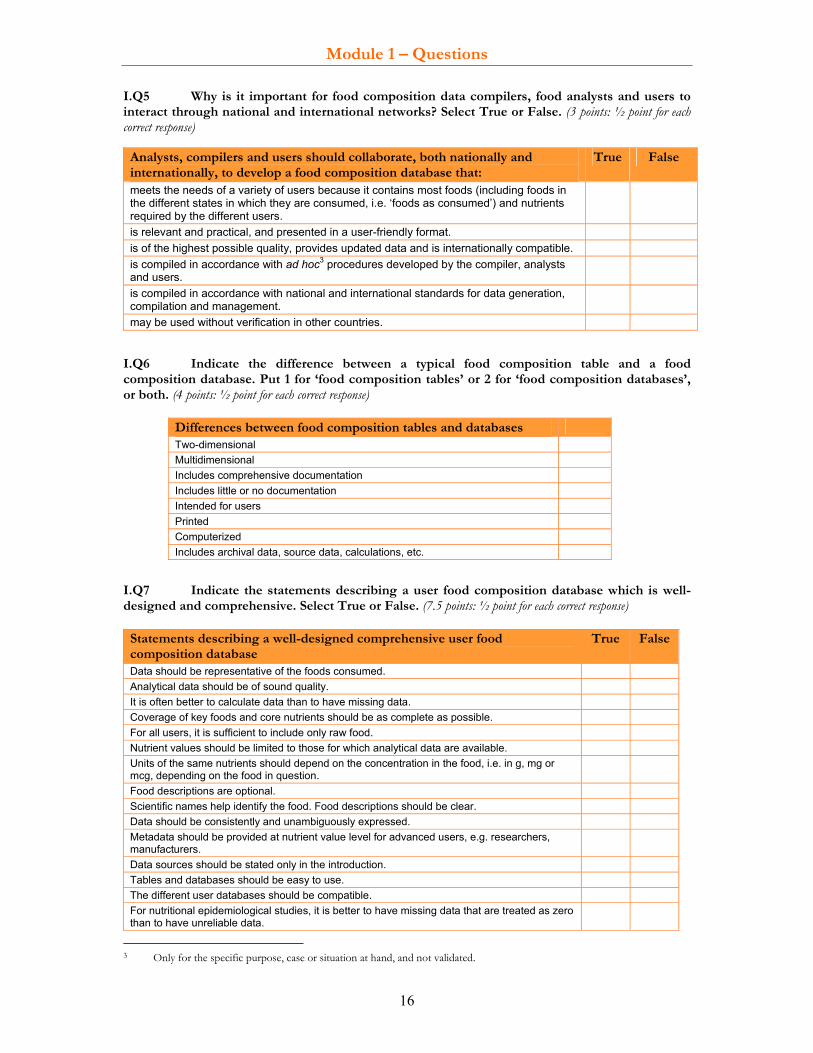
I.Q5 Why is it important for food composition data compilers, food analysts and users to interact through national and international networks? Select True or False. (3 points: ½ point for each correct response) Analysts, compilers and users should collaborate, both nationally and internationally, to develop a food composition database that:
True False
meets the needs of a variety of users because it contains most foods (including foods in the different states in which they are consumed, i.e. ‘foods as consumed’) and nutrients required by the different users.
is relevant and practical, and presented in a user-friendly format. is of the highest possible quality, provides updated data and is internationally compatible. is compiled in accordance with ad hoc3 procedures developed by the compiler, analysts and users.
is compiled in accordance with national and international standards for data generation, compilation and management.
may be used without verification in other countries. I.Q6 Indicate the difference between a typical food composition table and a food composition database. Put 1 for ‘food composition tables’ or 2 for ‘food composition databases’, or both. (4 points: ½ point for each correct response) I.Q7 Indicate the statements describing a user food composition database which is well-designed and comprehensive. Select True or False. (7.5 points: ½ point for each correct response) Statements describing a well-designed comprehensive user food composition database
True False
Data should be representative of the foods consumed. Analytical data should be of sound quality. It is often better to calculate data than to have missing data. Coverage of key foods and core nutrients should be as complete as possible. For all users, it is sufficient to include only raw food. Nutrient values should be limited to those for which analytical data are available. Units of the same nutrients should depend on the concentration in the food, i.e. in g, mg or mcg, depending on the food in question.
Food descriptions are optional. Scientific names help identify the food. Food descriptions should be clear. Data should be consistently and unambiguously expressed. Metadata should be provided at nutrient value level for advanced users, e.g. researchers, manufacturers.
Data sources should be stated only in the introduction. Tables and databases should be easy to use. The different user databases should be compatible. For nutritional epidemiological studies, it is better to have missing data that are treated as zero than to have unreliable data.
3 Only for the specific purpose, case or situation at hand, and not validated.
Differences between food composition tables and databases Two-dimensional Multidimensional Includes comprehensive documentation Includes little or no documentation Intended for users Printed Computerized Includes archival data, source data, calculations, etc.

Module 1 – Questions
17
I.Q8 Plain figures of nutrient values are not meaningful as such; they must be accompanied by the food name and descriptors, the component name and definition, and unit and denominators. In order to facilitate the understanding, use and management of food composition data, the data must also be sufficiently documented with additional metadata, i.e. data about data. Food composition metadata include information on the source and the compositional value: Source description (includes all information needed to identify the origin of the food composition data, e.g. laboratory, literature, etc.), sample descriptions and procedures (which are needed to judge the representativity of the foods); food classification, agricultural production and storage conditions, preservation and cooking methods, food additives or fortificants, value descriptions (include information on source of the value), analytical methods used, uncertainty and specificities of the methods, and statistical description of the analytical data. Which of the following data are considered either to be food composition data or related metadata? Indicate the correct responses with ‘x’. (5 points: ½ point for each correct response)
Data Food composition data/ metadata
Component values Component name and definition Food name and description Sampling Source of data Unit and denominator Method information Statistical information of component values Food groups Information about calculation, including recipes
I.Q9 Give five reasons why it is necessary to continuously update and maintain a food composition database. (5 points: 1 point for each correct response) 1. 2. 3. 4. 5.

Module 1 – Questions
18
I.Q10 Many food composition databases and tables are protected by copyright. This measure is intended to protect intellectual property and prevent unwanted use of data. Hence, users are sometimes required to pay a royalty fee. Select the statements that indicate the consequences of copyright protection for compilers and users. (3 points: ½ point for each correct response) Consequences of strict copyright protection for compilers and users True False Compilers have regularly taken legal action against persons using their data without prior permission.
Compilers may impose acknowledgement of the data source. Compilers derive most of the budget for their food composition programme from royalty fees.
Users do not have free access to the data and cannot use the data they need, unless they pay the fees.
Some users argue that fees for food composition data should be eliminated or reduced. This is because, in most cases, public funds are used to compile the data and because all food composition databases include data borrowed free-of-charge and sometimes without authorization from scientific and other literature.
Interchange of food composition data is enhanced by copyright. I.Q11 List three weak points inherent in food composition data when used to calculate nutrient intake estimations. (3 points: 1 point for each correct response) 1. 2. 3.
Module 1 – Questions
19
EXERCISES
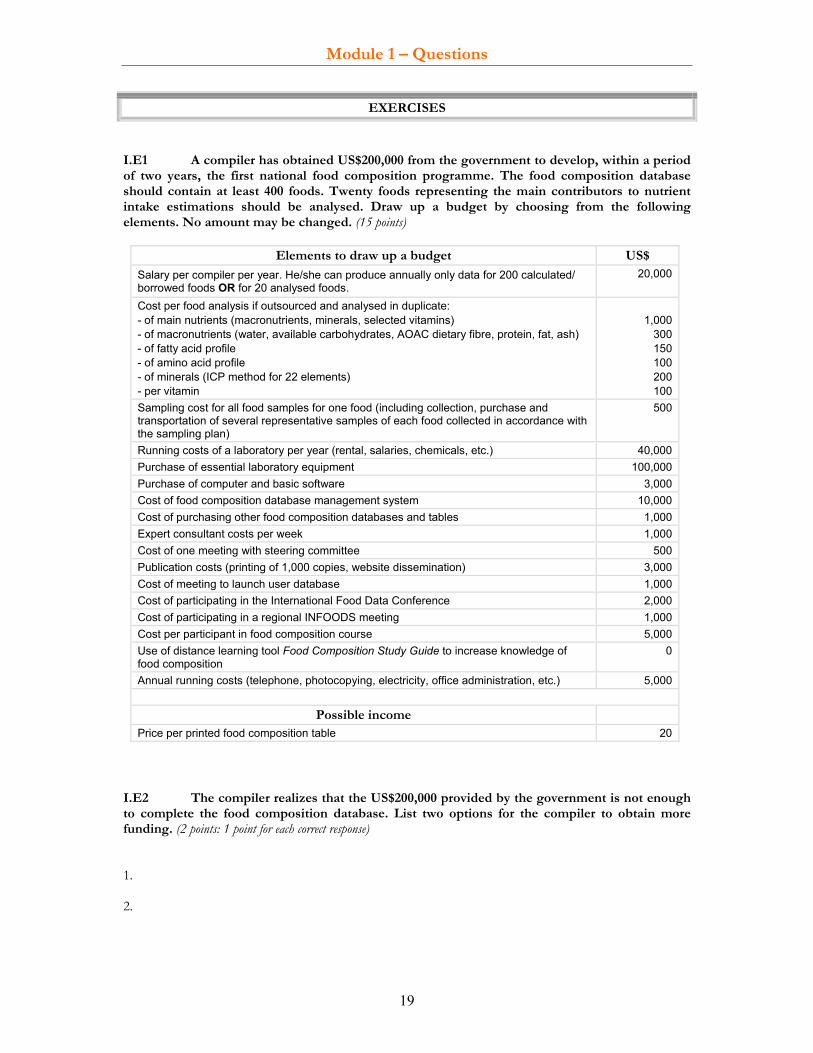
I.E1 A compiler has obtained US$200,000 from the government to develop, within a period of two years, the first national food composition programme. The food composition database should contain at least 400 foods. Twenty foods representing the main contributors to nutrient intake estimations should be analysed. Draw up a budget by choosing from the following elements. No amount may be changed. (15 points)
Elements to draw up a budget US$
Salary per compiler per year. He/she can produce annually only data for 200 calculated/ borrowed foods OR for 20 analysed foods.
20,000
Cost per food analysis if outsourced and analysed in duplicate: - of main nutrients (macronutrients, minerals, selected vitamins) - of macronutrients (water, available carbohydrates, AOAC dietary fibre, protein, fat, ash) - of fatty acid profile - of amino acid profile - of minerals (ICP method for 22 elements) - per vitamin
1,000
300150100200100
Sampling cost for all food samples for one food (including collection, purchase and transportation of several representative samples of each food collected in accordance with the sampling plan)
500
Running costs of a laboratory per year (rental, salaries, chemicals, etc.) 40,000Purchase of essential laboratory equipment 100,000Purchase of computer and basic software 3,000Cost of food composition database management system 10,000Cost of purchasing other food composition databases and tables 1,000Expert consultant costs per week 1,000Cost of one meeting with steering committee 500Publication costs (printing of 1,000 copies, website dissemination) 3,000Cost of meeting to launch user database 1,000Cost of participating in the International Food Data Conference 2,000Cost of participating in a regional INFOODS meeting 1,000Cost per participant in food composition course 5,000Use of distance learning tool Food Composition Study Guide to increase knowledge of food composition
0
Annual running costs (telephone, photocopying, electricity, office administration, etc.) 5,000
Possible income
Price per printed food composition table 20
I.E2 The compiler realizes that the US$200,000 provided by the government is not enough to complete the food composition database. List two options for the compiler to obtain more funding. (2 points: 1 point for each correct response) 1. 2.
Module 1 – Questions
20
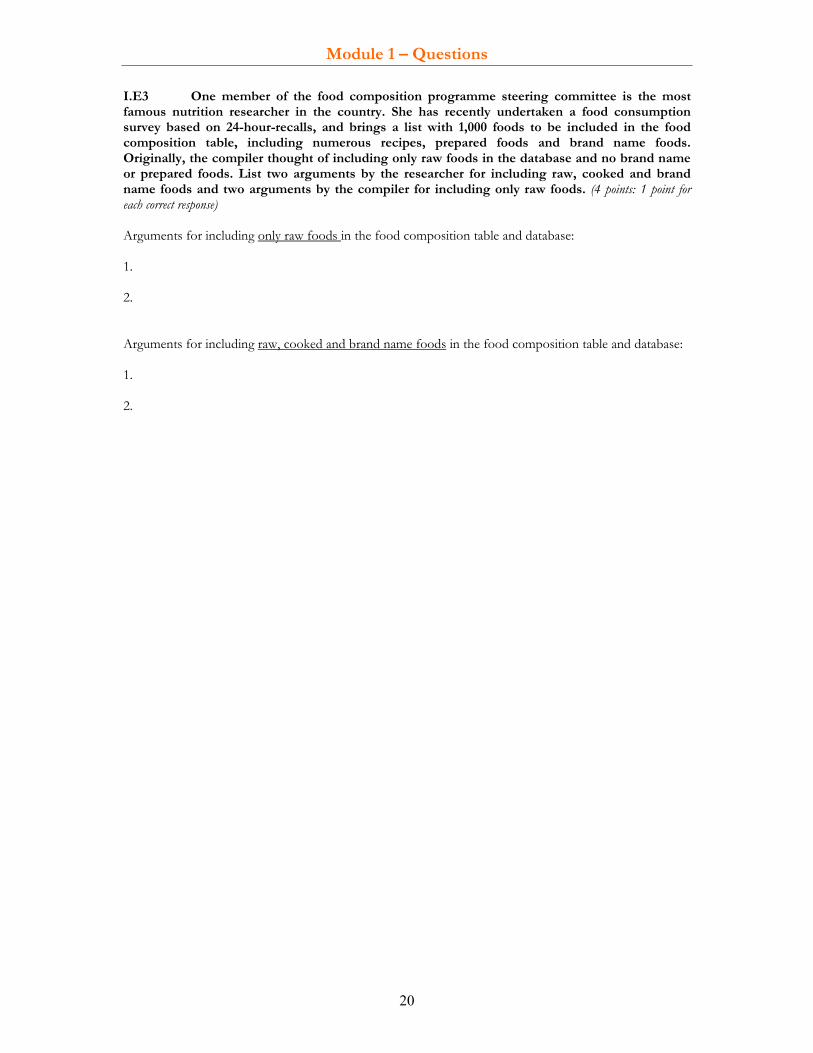
I.E3 One member of the food composition programme steering committee is the most famous nutrition researcher in the country. She has recently undertaken a food consumption survey based on 24-hour-recalls, and brings a list with 1,000 foods to be included in the food composition table, including numerous recipes, prepared foods and brand name foods. Originally, the compiler thought of including only raw foods in the database and no brand name or prepared foods. List two arguments by the researcher for including raw, cooked and brand name foods and two arguments by the compiler for including only raw foods. (4 points: 1 point for each correct response) Arguments for including only raw foods in the food composition table and database: 1. 2. Arguments for including raw, cooked and brand name foods in the food composition table and database: 1. 2.

Module 2 – Questions
21
Module 2 USE OF FOOD COMPOSITION DATA
LEARNING OBJECTIVES By the end of this module the student will be able to:
understand who uses food composition data and for what purpose; understand the importance of high-quality food composition data: understand the role of food composition data in nutrient intake estimations and apply them correctly; understand users’ requirements; consider limitations in food composition data in their use; recognize errors in the application of compositional data and know how to minimize them.
REQUIRED READING • Charrondière, U.R. ‘Use of food composition data including limitations’, available at:
http://www.fao.org/infoods/presentations_en.stm and if possible: • Greenfield, H. & Southgate, D.A.T. 2003. Food composition data – production, management and use. FAO.
Rome4. Chapters 1 (pp. 5–22), 2 (p. 29), 10 (pp. 178-182, 185-186) and 11 (pp. 187-198)..Available at: ftp://ftp.fao.org/docrep/fao/008/y4705e/y4705e00.pdf
RELEVANCE FOR DIFFERENT GROUPS (ON A SCALE OF + TO +++++) • Compilers/ professional users +++++ • Analysts ++
ESTIMATED TIME TO COMPLETE TASKS • Required reading: 1-4 hours • Answering the questions: 1-2 hours • Completing the exercises: 1-2 hours SUGGESTED ADDITIONAL READING • Greenfield, H. 1990. Uses and abuses of food composition data. Supplement to Food Australia 42 (8),
editor. Available at: http://www.fao.org/docrep/008/af281e/af281e00.htm • Rand, W.M., Windham, C.T., Wyse, B. W. & Young, V.R. 1987. Food Composition Data: a User’s
Perspective. United Nations University, Tokyo. Available at http://www.unu.edu/unupress/unupbooks/80633e/80633E00.htm
• Burlingame, B. 2004. Fostering quality data in food composition databases: visions for the future. Journal of Food Composition and Analysis Volume 17, Issues 3-4, pp. 251-258. Available at:: http://www.sciencedirect.com/science?_ob=publicationurl&_tockey=%23toc%236879%232004%23999829996%23503542%23fla%23&_cdi=6879&_pubtype=j&view=c&_auth=y&_acct=c000055286&_version=1&_urlversion=0&_userid=1916222&md5=6f1b1023d9c078822b8fb6357f898f22
4 The page numbers indicated correspond to the page numbers of the book (top of the page), and not to the PDF file.

Module 2 – Questions
22
Questions II.Q1 Match the users of food composition tables and databases to their main application of food composition data. Each user should be matched to one main application. (6 points: ½ point for each correct response)
Users: 1. Nutritionists/dietitians 2. Food scientists/food manufacturers 3. Food chemists 4. Decision-makers at government level 5. Professionals working in agriculture 6. Economists 7. Consumers 8. Epidemiologists 9. Teachers 10. Professionals working in biodiversity 11. Professionals working in food safety and risk assessment 12. Professionals working in food aid
Main application of food composition data
To decide on a diet for losing weight To estimate nutrient changes in new food processing methods and produce food labels on
nutrient composition To calculate nutrient intakes, advise patients on specific diets, e.g. in connection with anaemia
and/or diabetes, and to draw up therapeutic diets To assess the impact of food fortification and decide on the levels thereof To calculate the impact of inadequate nutrient intake on a country’s economic development To assess the adequacy of food aid rations To decide which variety, cultivar or breed is nutritionally superior and would be suitable for
agricultural research To teach pupils about nutrition To identify the use and value of different varieties, cultivars or breeds and determine their impact
on health To compare their own analytical values with existing composition data to estimate the validity of
results To calculate exposure to contaminants that dissolve in fat, e. g. the dioxin content in foods
depends on its fat content; or to determine safe upper limits for nutrients To relate folate intake to cancer risk
II.Q2 How is it possible to satisfy the requirements of different users when compiling user food composition tables and databases? Select the correct statement. (1 point) Satisfaction of different users when compiling user food composition tables and
databases Several types of user databases and tables should be published, e.g. abbreviated (or simplified),
comprehensive or special-purpose tables and databases in printed or electronic form. One user food composition database fits the needs of all.

Module 2 – Questions
23
Optional question for persons with advanced knowledge or who have participated in a food composition course II.Q3 The Codex Alimentarius Commission is currently discussing the possibility of making nutrient content information mandatory on food labels. What impact is this likely to have on food composition work? Select True or False. (3 points: ½ point for each correct response)
True False Likely impact of mandatory nutrient-content labelling on food composition work
Governments and manufacturers may become more interested in generating analytical compositional data and in supporting a food composition programme.
If food composition data, even of low quality, are available in a country, there are no grounds for requesting additional support from the government (or manufacturers).
Governments may have to decide if and which food composition databases may be used for nutritional labelling.
Food composition tables from other countries provide accurate content information on national foods for the national and other markets.
Manufacturers (and governments) might become more supportive of high-quality food composition data if food products were detained or confiscated at the borders of other countries owing to non-compliance with other countries’ labelling legislation.
Manufacturers will generate more compositional data on specific ingredients and give them with all metadata to the food composition programme for publication.
II.Q4 Provide the formula to calculate the nutrient intake estimations of an individual. (1 point) II.Q5 The quality of the nutrient intake estimation depends on that of the food intake estimation and the food composition data. From the following list, indicate those reasons which introduce errors when estimating food intakes. Select True or False. (3.5 points: ½ point for each correct response)
True False Reasons for errors in food intake (or food supply) estimations Due to inherent uncertainties of food consumption data they cannot represent the true (actual
or long-term) food intake of individuals, households, groups or nations. They are only estimates.
Subjects of food consumption surveys may introduce errors due to faulty or incomplete recall of foods consumed.
Errors may be introduced due to survey tools, methodology and study design. Subjects of food consumption surveys may introduce errors by under- or over-reporting
specific foods. Errors may be introduced due to the absence of density data to convert volume to mass
measures. Statistical treatment of data makes it possible to eliminate all bias. Errors may be introduced due to improper matching of reported foods with foods in the food
composition database. II.Q6 Indicate whether food categories are well covered in most food composition tables/databases. Select True or False. (3.5 points: ½ point for each correct response) Well-covered food categories True False Brand name foods/commercial products Raw foods Cooked foods Ready-to-eat foods Recipes Different varieties/cultivars/breeds of the same food Mineral and vitamin supplements

Module 2 – Questions
24
II.Q7 When food composition tables and databases have a poor coverage of certain food categories (as mentioned in II.Q6), what impact can this have on the accuracy of nutrient intake estimations? Select the correct response. (1 point) Poor coverage of these food categories in food composition tables and databases leads to nutrient intake estimations that:
are representative of the actual nutrient intake because most foods are consumed raw. underestimate the mineral and vitamin intake in given countries, especially if fortified foods and nutrient supplements are widely consumed.
underestimate nutrient intake estimations for populations with a high consumption of rice in the event the nutrient values of raw rice are attributed to cooked rice.
result in high-quality nutrient intake estimations because the nutrient values of raw foods are similar to those of prepared foods.
result in high-quality nutrient intake estimations because over-estimations are balanced by underestimations, i.e. random errors balance each other out.
II.Q8 What has a greater impact on nutrient intake estimations: an error in the nutrient composition of foods consumed in large or small amounts? Select the correct response(s). (2 points: ½ point for each correct response) a) In general, errors in nutrient intake estimations are greater where larger amounts of food are consumed; b) In general, errors in nutrient intake estimations are great even if the foods are consumed in small amounts; c) In general, errors in nutrient intake estimations are great if the foods are consumed in small amounts but have a high concentration of nutrients; d) In general, errors in nutrient intake estimations are the same for foods consumed in large or small amounts. II.Q9 What has a greater impact on the nutrient intake estimation of a single nutrient: a systematic 30% underestimation of the nutrient value(s) in all foods or a 30% underestimation of the food intake? Select True or False. (2 points: ½ point for each correct response)
Impact on nutrient intake estimations True FalseA systematic 30% underestimation of the values of a specific nutrient has a greater impact on its nutrient intake estimation compared with a 30% underestimation of food intake.
A 30% underestimation of food intake has a greater impact on the nutrient intake estimation compared with a systematic 30% underestimation of the nutrient values of a specific nutrient.
The impact on the nutrient intake estimation is the same whether the nutrient values are systematically underestimated in all foods or the food intake is underestimated by the same percentage.
The nutrient intake is underestimated by 30% in both cases. II.Q10 List four reasons for changes or differences in nutrient intake estimations over time. (4 points: 1 point for each correct response) 1. 2. 3. 4.

Module 2 – Questions
25
II.Q11 Match the errors in nutrient intake estimations to the corresponding category: limitations in survey tool or design; food matching; and calculation. Select the most important category for each error. (7.5 points: ½ point for each correct response) Errors in nutrient intake estimations due to: Limitations in
survey tool or design
Food and component matching
Calculation
failing to record either the fat or oil used for cooking or to record the cooking method (important for calculating correct fat and fatty acid intake).
selecting incorrect foods in the food composition table due to insufficient details in the food description in the survey and/or the food composition table or database (e.g. missing cooking or processing method) or due to insufficient knowledge about foods.
calculating fatty acid intakes from fatty acids per 100 g of total fatty acids instead of per 100 g of food.
selecting nutrient values of a food with inedible portion (total food) for the same food without inedible portion, and vice versa.
applying nutrient values of a non-fortified food to a reported fortified food.
failing to recognize differences in nutrient values owing to different nutrient expressions, e.g. available carbohydrates vs. total carbohydrates.
using incorrect conversion factors, e.g. vitamin A or folate.
selecting incorrect foods in the food composition table due to problems of language when data are taken from other countries. Even in one language, identical foods may have different names and different foods may have the same name. Examples here are corn and maize, or in different countries the same names of meat cuts might come from different parts of the animal.
failing to include pro-vitamin A carotenoids when estimating vitamin A intake.
applying wrong conversions (volume to weight, portion description to weight). This occurs rather frequently.
selecting a raw food instead of a cooked one (different nutrient values!).
imputing values of nutritionally different foods when estimating nutrient values of missing foods or values.
using inappropriate or outdated recipes and recipe calculation systems, or not recording water as an ingredient.
using uncertain food consumption data, e.g. owing to study tool or study design.
failing to adjust for water, vitamin and mineral losses (or gains) when calculating nutrient intake from a recipe.

Module 2 – Questions
26
II.Q12 For some nutrients, the nutrient values depend on the nutrient definition, expression and analytical methods used. Examples are energy, fibre, carbohydrates, fat, protein, vitamins A, C, D and E, folate, niacin and carotenes. The nutrient values may not be comparable and if different food composition tables and databases are used, there may be systematic differences in nutrient intake estimations among countries and over time. What should the user do to minimize errors in when estimating nutrient intakes and/or when using the nutrient intake estimations of others? Select True or False. (2.5 points: ½ point for each correct response)
How users can minimize errors True FalseProfessional users of food composition tables and databases should always check the nutrient definition used in the table or database, e.g. in the introduction to the table or in the documentation of the database.
Professional users of food composition tables and databases should know the nutrients for which values may differ significantly due to definition, expression, analytical method and unit.
If estimated nutrient intakes from different studies are to be compared, the nutrient definition, analytical methods and expression should be checked for all nutrients. This will allow the user to understand which nutrient intake estimations are comparable.
Users of food composition tables and databases do not need to search for the nutrient expression (e g. total vs. available carbohydrates vs. available carbohydrates in monosaccharide equivalents) in the introduction to the table or database.
If estimated nutrient intakes from different studies are to be compared, there is no need to be concerned about nutrient definition and expression. The impact on nutrient intake estimations and on correlations (to health outcome, for example) is, at best, only marginal.
II.Q13 What can a compiler do to minimize the above-mentioned errors? Select the correct response(s). (2.5 points: ½ point for each correct response) a) Train all users b) Improve food description and coverage, including foods as consumed, recipes and brand name foods c) Improve nutrient description and coverage d) Improve documentation e) Nothing, as the errors are made by users.
II.Q14 Users who wish to achieve good-quality nutrient intake estimations are faced often with either a food composition database containing missing data or without an existing national composition table. Missing foods means that the foods do not exist in the database. A missing nutrient means that the nutrient does not exist in the database, and a missing value means that one nutrient value is not reported for a food. In such cases, users are obliged to estimate, calculate or borrow the missing compositional data themselves. In the table below, match the missing data to the corresponding example and remedy. (3 points: ½ point for each correct response)
Examples of missing food composition data: 1. No dietary fibre in the food composition table; 2. Missing vitamin C value for raw tomato; 3. Fried beef fillet is missing in database, whereas raw beef fillet may be included. Remedies to estimate missing data: 4. Use compositional data from other sources, including other countries; 5. Calculate data using recipes or other algorithms; 6. Estimate data on the basis of own knowledge.
Missing data Missing data example Remedy
Missing nutrient value Missing food Missing component
Module 2 – Questions
27
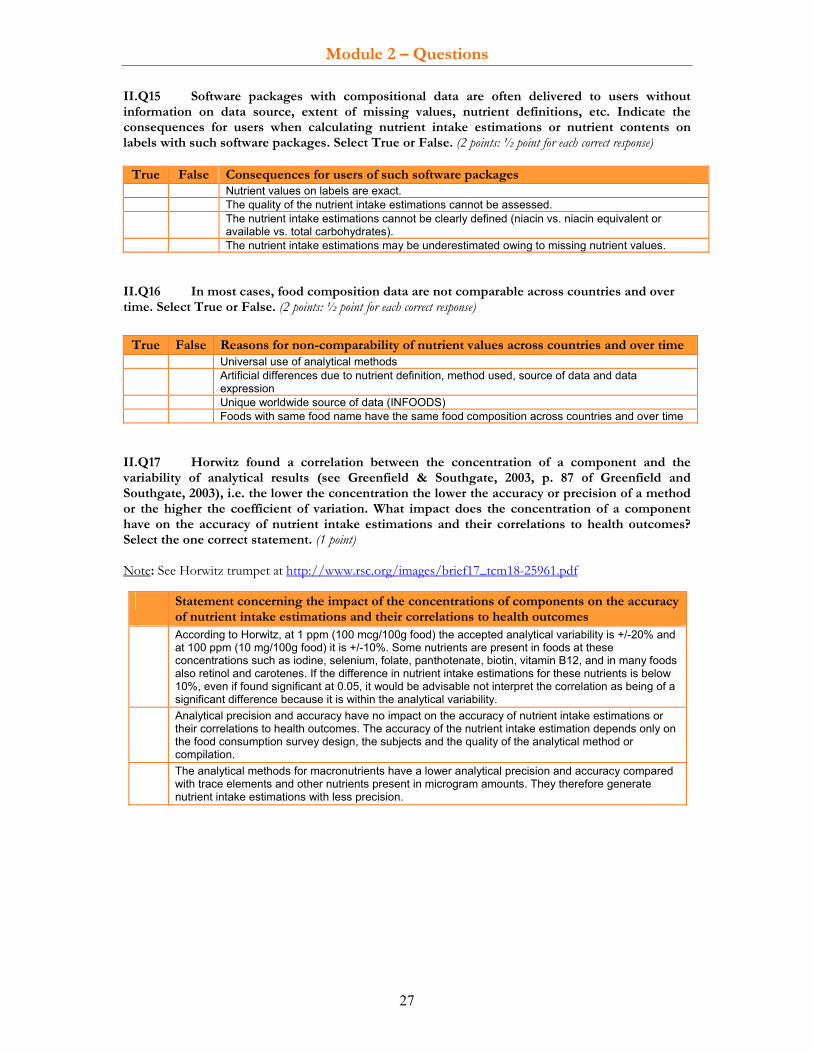
II.Q15 Software packages with compositional data are often delivered to users without information on data source, extent of missing values, nutrient definitions, etc. Indicate the consequences for users when calculating nutrient intake estimations or nutrient contents on labels with such software packages. Select True or False. (2 points: ½ point for each correct response)
True False Consequences for users of such software packages Nutrient values on labels are exact.
The quality of the nutrient intake estimations cannot be assessed. The nutrient intake estimations cannot be clearly defined (niacin vs. niacin equivalent or
available vs. total carbohydrates). The nutrient intake estimations may be underestimated owing to missing nutrient values.
II.Q16 In most cases, food composition data are not comparable across countries and over time. Select True or False. (2 points: ½ point for each correct response)
True False Reasons for non-comparability of nutrient values across countries and over time Universal use of analytical methods Artificial differences due to nutrient definition, method used, source of data and data
expression Unique worldwide source of data (INFOODS) Foods with same food name have the same food composition across countries and over time
II.Q17 Horwitz found a correlation between the concentration of a component and the variability of analytical results (see Greenfield & Southgate, 2003, p. 87 of Greenfield and Southgate, 2003), i.e. the lower the concentration the lower the accuracy or precision of a method or the higher the coefficient of variation. What impact does the concentration of a component have on the accuracy of nutrient intake estimations and their correlations to health outcomes? Select the one correct statement. (1 point) Note: See Horwitz trumpet at http://www.rsc.org/images/brief17_tcm18-25961.pdf
Statement concerning the impact of the concentrations of components on the accuracy of nutrient intake estimations and their correlations to health outcomes
According to Horwitz, at 1 ppm (100 mcg/100g food) the accepted analytical variability is +/-20% and at 100 ppm (10 mg/100g food) it is +/-10%. Some nutrients are present in foods at these concentrations such as iodine, selenium, folate, panthotenate, biotin, vitamin B12, and in many foods also retinol and carotenes. If the difference in nutrient intake estimations for these nutrients is below 10%, even if found significant at 0.05, it would be advisable not interpret the correlation as being of a significant difference because it is within the analytical variability.
Analytical precision and accuracy have no impact on the accuracy of nutrient intake estimations or their correlations to health outcomes. The accuracy of the nutrient intake estimation depends only on the food consumption survey design, the subjects and the quality of the analytical method or compilation.
The analytical methods for macronutrients have a lower analytical precision and accuracy compared with trace elements and other nutrients present in microgram amounts. They therefore generate nutrient intake estimations with less precision.
Module 2 – Questions
28
EXERCISES
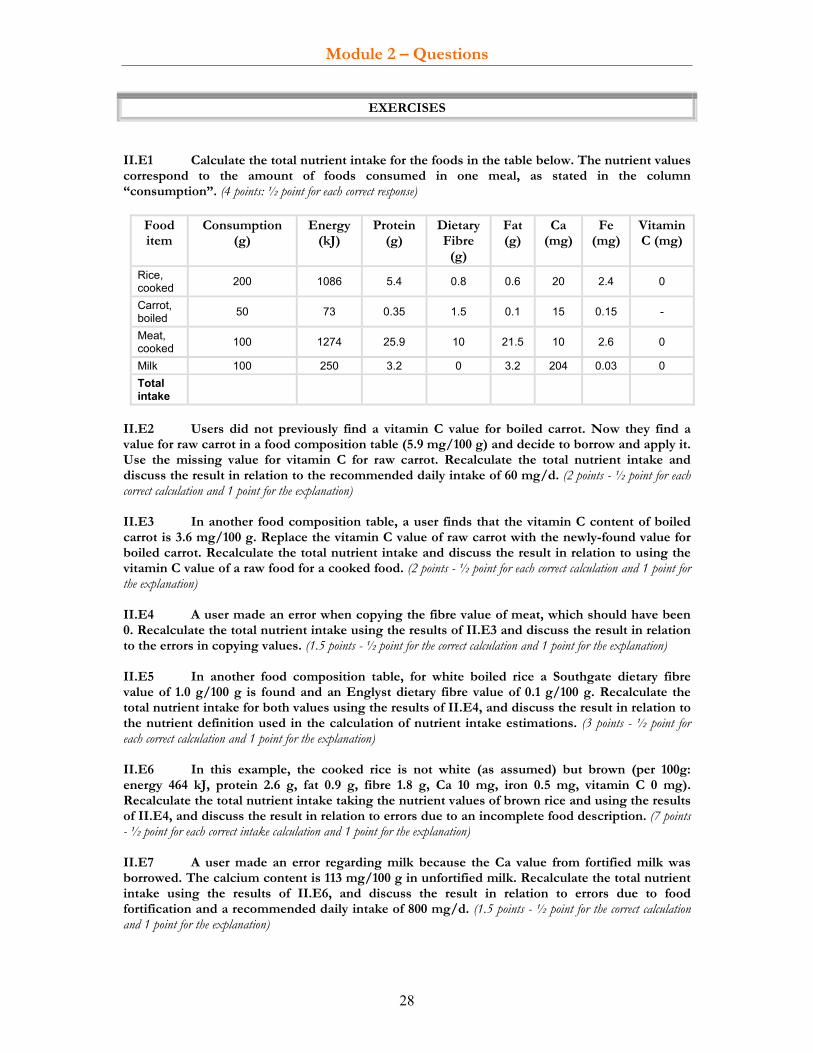
II.E1 Calculate the total nutrient intake for the foods in the table below. The nutrient values correspond to the amount of foods consumed in one meal, as stated in the column “consumption”. (4 points: ½ point for each correct response)
Food item
Consumption (g)
Energy (kJ)
Protein (g)
Dietary Fibre
(g)
Fat (g)
Ca (mg)
Fe (mg)
Vitamin C (mg)
Rice, cooked 200 1086 5.4 0.8 0.6 20 2.4 0
Carrot, boiled 50 73 0.35 1.5 0.1 15 0.15 -
Meat, cooked 100 1274 25.9 10 21.5 10 2.6 0
Milk 100 250 3.2 0 3.2 204 0.03 0 Total intake
II.E2 Users did not previously find a vitamin C value for boiled carrot. Now they find a value for raw carrot in a food composition table (5.9 mg/100 g) and decide to borrow and apply it. Use the missing value for vitamin C for raw carrot. Recalculate the total nutrient intake and discuss the result in relation to the recommended daily intake of 60 mg/d. (2 points - ½ point for each correct calculation and 1 point for the explanation) II.E3 In another food composition table, a user finds that the vitamin C content of boiled carrot is 3.6 mg/100 g. Replace the vitamin C value of raw carrot with the newly-found value for boiled carrot. Recalculate the total nutrient intake and discuss the result in relation to using the vitamin C value of a raw food for a cooked food. (2 points - ½ point for each correct calculation and 1 point for the explanation) II.E4 A user made an error when copying the fibre value of meat, which should have been 0. Recalculate the total nutrient intake using the results of II.E3 and discuss the result in relation to the errors in copying values. (1.5 points - ½ point for the correct calculation and 1 point for the explanation) II.E5 In another food composition table, for white boiled rice a Southgate dietary fibre value of 1.0 g/100 g is found and an Englyst dietary fibre value of 0.1 g/100 g. Recalculate the total nutrient intake for both values using the results of II.E4, and discuss the result in relation to the nutrient definition used in the calculation of nutrient intake estimations. (3 points - ½ point for each correct calculation and 1 point for the explanation) II.E6 In this example, the cooked rice is not white (as assumed) but brown (per 100g: energy 464 kJ, protein 2.6 g, fat 0.9 g, fibre 1.8 g, Ca 10 mg, iron 0.5 mg, vitamin C 0 mg). Recalculate the total nutrient intake taking the nutrient values of brown rice and using the results of II.E4, and discuss the result in relation to errors due to an incomplete food description. (7 points - ½ point for each correct intake calculation and 1 point for the explanation) II.E7 A user made an error regarding milk because the Ca value from fortified milk was borrowed. The calcium content is 113 mg/100 g in unfortified milk. Recalculate the total nutrient intake using the results of II.E6, and discuss the result in relation to errors due to food fortification and a recommended daily intake of 800 mg/d. (1.5 points - ½ point for the correct calculation and 1 point for the explanation)
Module 2 – Questions
29
II.E8 Improve the food description of ‘milk’ and ‘meat, cooked’ to enhance the quality of food matching between reported foods and foods in the food composition table, which would result in better nutrient values and nutrient intake estimations. For meat and milk, list three descriptors each. (3 points: ½ point for each correct response) Meat: 1. 2. 3. Milk: 1. 2. 3. II.E9 Sixty percent of a population takes vitamin and mineral supplements once a week and 30% of the national food supply is fortified with a number of vitamins and minerals. The food composition database does not contain compositional data on fortified foods or vitamins and minerals supplements. State two consequences for nutrient intake estimations and dietary adequacy. (2 points: 1 point for each correct response following the dot (•)) 1. 2.

Module 3 – Questions
31
Module 3 SELECTION AND NOMENCLATURE OF FOODS IN FOOD COMPOSITION
DATABASES LEARNING OBJECTIVES By the end of this module the student will be able to: • select foods for inclusion in a food composition database programme that meets the requirements of
different groups of users; • select foods and nutrients for analysis in a food composition database programme that cover the main
foods and nutrients of the national diet (key food approach); • understand the importance of food nomenclature, including terminology and classification; • describe foods well in a food composition database; • grasp the importance of food description and processing (e.g. cooking and inclusion/exclusion of
inedible parts) and their effect on nutrient values, specifically on water, fat, minerals and vitamins; • comprehend food classification and be able to develop one for one’s own food composition database.
REQUIRED READING • Charrondière, U.R. ‘Food Nomenclature’, available at:
http://www.fao.org/infoods/presentations_en.stm and if possible: • Greenfield, H. & Southgate, D.A.T. 2003. Food composition data – production, management and use. FAO.
Rome5. Chapters 3 (pp. 33-46) and 5 (pp. 75-78). Available at: ftp://ftp.fao.org/docrep/fao/008/y4705e/y4705e00.pdf
EXERCISE MATERIALS • Spreadsheet ‘KeyFood exercise.xls’, needed for exercise III.E4, is available at
http://www.fao.org/infoods/presentations_en.stm. A limited knowledge of Excel is required. • Truswell, S.A., Bateson, D.J., Madafiglio, K.C., Pennigton, J.A.T., Rand, W.M. & Klensin,
J.C. 1991. Committee Report: INFOODS - Guidelines for Describing Foods: A Systematic Approach to Describing Foods to Facilitate International Exchange of Food Composition Data. Academic Press. Journal of Food Composition and Analysis 4, 18-38. Available at: http://www.fao.org/wairdocs/AD069E/AD069E00.HTM
• The LanguaL food description system: its use, thesaurus and further literature, available at http://www.langual.org/. This is also interesting with regard to ‘further links’ to national food composition databases, for example.
RESOURCES Taxonomic websites • http://www.ars-grin.gov/cgi-bin/npgs/html/index.pl • http://mansfeld.ipk-gatersleben.de/
http://www.plantnames.unimelb.edu.au/Sorting/Frontpage.html • http://www.seedtest.org/en/home.html • http://www.fao.org/figis/servlet/static?dom=org&xml=sidp.xml&xp_lang=en&xp_banner=fi • http://www.fishbase.org/home.htm and http://www.fishbase.org/search.php • http://vm.cfsan.fda.gov/%7Efrf/rfe0.html
5 The page numbers indicated correspond to the page numbers of the book (top of the page), and not to the PDF file.

Module 3 – Questions
32
RELEVANCE FOR DIFFERENT GROUPS (ON A SCALE OF + TO +++++) • Compilers/ professional users +++++ • Analysts ++ ESTIMATED TIME TO COMPLETE TASKS • Required reading: 1-4 hours • Answering the questions: 1-2 hours • Completing the exercises: 1-4 hours SUGGESTED ADDITIONAL READING • Haytowitz, D.B., Pehrsson, P.R. & Holden, J.M. 2002. The Identification of Key Foods for Food
Composition Research. Journal of Food Composition and Analysis. 15(2): 183-194. Available at: http://www.nal.usda.gov/fnic/foodcomp/Bulletins/keyfoods.htm

Module 3 – Questions
33
Questions III.Q1 Is it possible for a food composition database to contain all foods consumed by a population? Select True or False. (1.5 points: ½ point for each correct response)
True False Is it possible for a food composition database to contain all foods consumed in a population?
No, it is not possible to cover all foods, recipes and brand name foods consumed by a population. Because of their high number, it would be too expensive and time-consuming to include them all in a food composition database. Therefore, foods included in a food composition database will always be a subset of the total foods available for consumption in a country.
No, it is not possible to cover all foods, recipes and brand name foods consumed in a population. However, the most important ones, which cover most of the food intake of the population, should be included.
Yes, because only 100, or at most 1,000, foods, recipes and brand name foods are consumed in a population.
III.Q2 List the criteria in descending order of importance for prioritizing foods for inclusion in a well-designed national food composition database, i.e. including foods as consumed. Indicate 1 for the most important criteria and 5 for the least important, on the assumption that the main use is for dietary assessment. (2.5 points: ½ point for each correct response) Priority number
Criteria
Raw foods and ‘Foods as consumed’6, greatly consumed by specific subgroups (e.g. infants, ethnic groups)
Raw foods and ‘foods as consumed’, greatly consumed by the entire population Foods important for trade or infrequently consumed foods of no particular nutrient interest Foods on the variety/cultivar/breed levels as well as wild and underutilized foods Food consumed in small amounts that contribute greatly to the specific nutrient intake of the
entire population III.Q3 The key foods approach is used in the USDA database to prioritize foods to be analysed for certain nutrients. This method utilizes existing nutrient profiles and nationally representative food consumption survey data on consumed foods and recipes. The mean daily food consumption, by the population, of each food including its contribution from recipes, is multiplied by their nutrient content for one nutrient (e.g. iron). Emphasis is placed on nutrients of established or potential public health importance. These nutrient intake values per food and nutrient are then sorted and ranked from highest to lowest. This step is repeated for all nutrients being examined. Those foods contributing up to a cumulative total of 25% for each nutrient were assigned to the first quartile; those contributing 25–50%, the second quartile; those contributing 50–75%, the third quartile; and those contributing 75–100%, the fourth quartile. Foods in the first three quartiles for each nutrient were defined as the Key Foods. More information is found in the article of Haytowitz, Pehrsson and Holden (2003), available at http://www.nal.usda.gov/fnic/foodcomp/Bulletins/keyfoods.htm (optional reading).
6 ‘Food as consumed’ means that the food is described in the state in which it is consumed, i.e. brand name foods or
foods without inedible part and cooked if applicable, such as boiled rice. Another definition often used in food consumption surveys is ‘food as purchased’, which means that it is in the state it was bought in, i.e. generally raw and including the inedible part, such as orange or banana with skin.
Module 3 – Questions
34
Answer the following questions: (4 points: 1 point for each correct response following the dot (•)) 1. How are ‘key foods’ defined? 2. What is the purpose of the key foods approach? 3. Which data would you need to identify key foods? 1. 2. 3. III.Q4 A compiler decides to include the most commonly used recipes in the food composition database. Describe the tasks involved in compiling the recipes with their nutrient values. Use the following headings to describe the different tasks: (5 points) (1) Selection of recipes (1 point) – indicate one possible source: (2) Information on ingredients and preparation methods (1 point) – indicate one possible
source: (3) Recipe name and description (1 point) – indicate a possible naming system, including
regional or compositional differences: (4) Presentation of recipe information in a user food composition table – indicate the
information provided to the user on the recipe and its ingredients as well as any additional information. (2 points: ½ point for each correct response following the dot (•)):
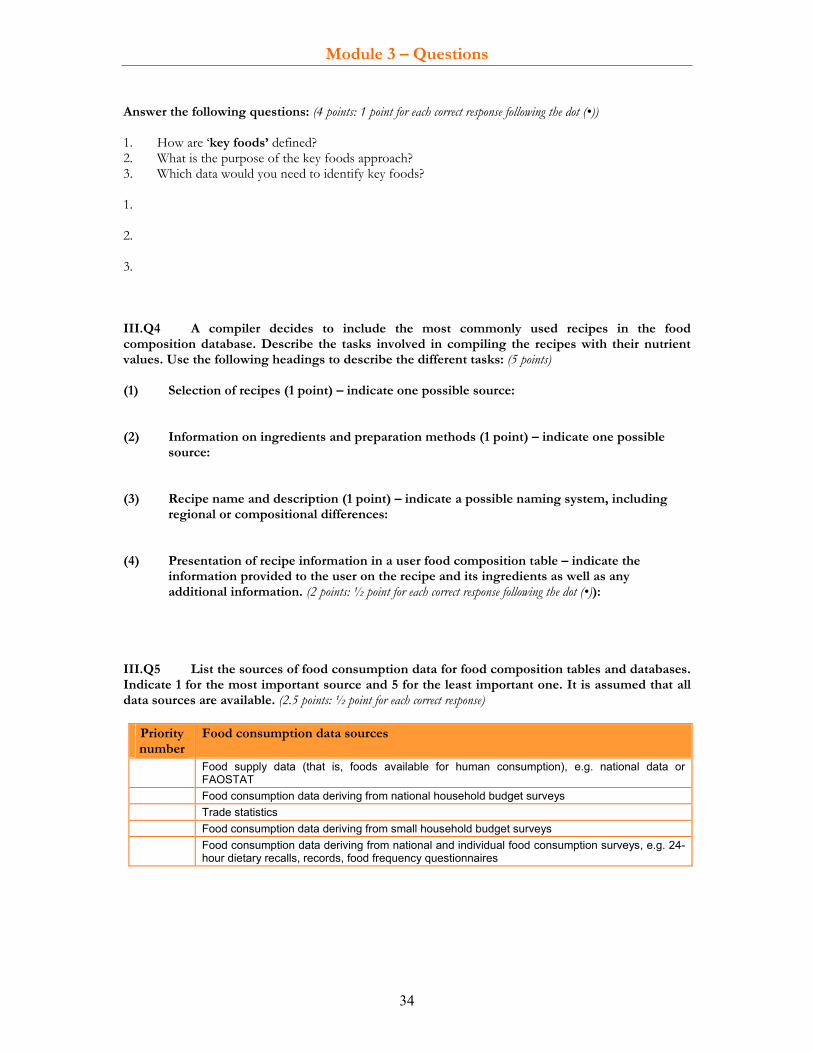
III.Q5 List the sources of food consumption data for food composition tables and databases. Indicate 1 for the most important source and 5 for the least important one. It is assumed that all data sources are available. (2.5 points: ½ point for each correct response)
Priority number
Food consumption data sources
Food supply data (that is, foods available for human consumption), e.g. national data or FAOSTAT
Food consumption data deriving from national household budget surveys Trade statistics Food consumption data deriving from small household budget surveys Food consumption data deriving from national and individual food consumption surveys, e.g. 24-
hour dietary recalls, records, food frequency questionnaires

Module 3 – Questions
35
III.Q6 With regard to standardizing or defining food nomenclature in a food composition database, indicate which of the following elements should always be considered as mandatory and which as optional. (2 points: ½ point for each correct response)
Food nomenclature element Mandatory or optional in a food composition database
Food name Optional/Mandatory Food group Optional/Mandatory Food descriptor Optional/Mandatory Food code Optional/Mandatory
III.Q7 Food groups are defined differently in different countries and regions. Name six generally accepted or widely-used food groups for food composition purposes. (3 points: ½ point for each correct response) 1. 2. 3. III.Q8 Food groups are useful for food composition. Select True or False to explain why food groups are useful in food composition tables and databases. (3 points: ½ point for each correct response)
Usefulness of food groups in food composition tables and databases True False To help identify foods in the food composition table database, e.g. for users To dictate reporting on nutrient intake To serve as a convenient basis for developing a common sampling and analytical plan because of similar food matrix and nutrient values within food groups
To facilitate the compilation and evaluation of data, and to verify the consistency of nutrient values per food group
To conform to the international standard on food grouping To facilitate the application of conversion factors (sometimes done at food group level)
Optional question for those with advanced knowledge or who have participated in a food composition course III.Q9 Some foods are difficult to place within a given food group in a food composition database or table because grouping depends largely on the local culture. For example: potatoes (or other starchy roots) are difficult to classify because they are sometimes seen as vegetables and other times as tubers. List three foods with similar problems, and indicate which food group they might be placed in. (3 points: 1 point for each correct response). Think about where you would put them in your country (no points). 1. 2. 3.

Module 3 – Questions
36
III.Q10 Select the statements that favour the standardization of food groups both for the presentation of food consumption data and for food composition databases. (2 points: ½ point for each correct response) Reasons for standardizing food groups for food consumption survey data and food composition databases
True False
Users of food composition tables and databases can always, by means of the index, find the foods they are interested in.
National compilers can only work within their own food grouping systems (country-specific food groups and subgroups) because of their specific food consumption pattern.
Food consumption at food group level can only be compared if foods are classified in the same food groups.
Some coefficients (e.g. nutrient retention factors) are applied at the food group level.
III.Q11 Name the two internationally used food description systems (see also http://www.fao.org/infoods/nomenclature_en.stm) (1 point –½ point for each correct response) 1. 2. III.Q12 Define briefly a food facet and a food descriptor. (2 points: 1 point for each correct response) Food facet: Food descriptor: III.Q13 ‘Cooking methods’ is one of the major food facets and a corresponding descriptor is ‘raw’. Describe the following cooking methods and their effect on water, fat, minerals and vitamins: (5 points: 1 point for each correct response) a) Boiling: b) Baking: c) Roasting: d) Deep frying: e) Cooking: III.Q14 Explain why the following names should be included in a reference food composition database. (4 points: 1 point for each correct response) 1. Short names 2. Long names

Module 3 – Questions
37
3. Scientific names 4. English food names III.Q15 Many food composition databases and tables include mainly raw foods while others include additionally foods as purchased and/or as consumed. For the following statements, indicate 1 or 2. (5.5 points: ½ point for each correct response) 1 = for food composition tables with mainly raw foods 2 = for food composition tables with raw foods, foods as purchased and/or as consumed Put 1 or 2 Statements
When ‘foods as consumed’ are missing in food composition tables, users are obliged to invent their own calculation systems and to borrow data from other countries, which may result in lower-quality nutrient intake estimations.
Users often apply the nutrient values of raw foods to prepared foods, which leads to major errors in nutrient intake estimations.
Compilers have more knowledge of foods, food preparation and compilation than users. They are therefore in a better position to calculate and estimate good-quality nutrient values of foods as consumed and of recipes.
Compilers include only raw foods as they are more stable in composition compared to prepared foods and recipes.
For users, this type of table means higher costs and more work for them. Compilers are not aware of users’ difficulties if the food composition table contains mainly raw foods. For compilers, this type of table means higher costs and more work for them. In general, this table leads to better-quality nutrient intake estimates. This is not very useful for users seeking data on ‘foods as consumed’. This leads to lower data quality overall because more data are derived or calculated. This is an improvement for users seeking data on prepared foods, such as canned, take-away, frozen and
brand name foods. III.Q16 Give four examples of inedible parts of fruit, vegetable, fish or meat. (2 points: ½ point for each correct response) 1. 2. 3. 4. III.Q17 Which part of the food should be analysed for food composition purposes? Select the correct response. (1 point)
Part to be analysed The total food should be analysed because this is the way in which it is consumed. The inedible part should be analysed because it contains most of the nutrients. Only the edible part of the food should be analysed because food composition tables and databases
contain nutrient values per 100 g edible food.

Module 3 – Questions
38
III.Q18 Indicate the correct statements about edible coefficients and their description. Select True or False. (2.5 points: ½ point for each correct response)
True False Edible coefficients: are independent of culture and individual choice and therefore do not need to be included
in food composition tables and databases. are part of a good food description. facilitate correct food matching. are optional because nutrient values are the same for any given food, with or without
inedible part. are needed to transform the weight of foods as purchased to the edible parts of the food.
III.Q19 In the reference database, the description of a sampled and analysed food is complete only once all information on the sample has been added correctly. In the following table, indicate which food description is added at either the sample collection or sampling handling stage. (10 points: ½ point for each correct response per descriptor)
Food identification and descriptions are added at: Food identification and description
Sample collection Sample handling Sample code Food name Scientific name Brand name Season Sampling location Weight and nature of edible part Weight and nature of inedible part Maturity Part of the food Physical state, e.g. liquid, solid Food processing method for processed food
Food processing method for collected raw food which are processed before analysis
Weight before and after cooking Food preservation method Packing medium Packing material Date of expiry/expiration Digital photograph Composite sample preparation

Module 3 – Questions
39
EXERCISES
III.E1 Match the foods from the food consumption survey below with the foods found in the food composition table, also given below. In some cases, several foods from the food composition table can be matched to a single food from the survey, e.g. tea with milk and sugar = 1 + 2 + 3 (or 4, 5 or 6). (11 points: 1 point for each correct response)
Foods from the food consumption survey: a. Tea with milk and sugar b. Pork chop, grilled, the visible fat not consumed c. Chicken breast, roasted, skin not consumed d. Tomato, grilled e. Aubergine (eggplant), fried in olive oil f. Rice, red, fried g. Rice, white, boiled h. Mutton in sauce i. Mixed vegetables, boiled j. Mango, dark orange flesh, very ripe k. Chocolate bar, Mars
Foods from the national food composition table: 1. Tea 2. Sugar 3. Low-fat milk 4. Standard milk 5. Semi-skimmed milk, fortified 6. Milk powder, full fat 7. Pork, lean 8. Pork, medium fat 9. Pork, fat 10. Chicken 11. Chicken, dark meat 12. Chicken, light meat 13. Chicken, grilled 14. Chicken, grilled, bones in 15. Mutton, fat 16. Tomato 17. Aubergine (eggplant) 18. Vegetable oil 19. Rice 20. Rice, boiled 21. Spinach 22. Carrot 23. Mango 24. Tap water 25. Chocolate bar
Module 3 – Questions
40
III.E2 Take six foods from the food composition table listed in III.E1 and improve the food descriptions, e.g. chocolate = chocolate, powder, 70% cacao. (3 points: ½ point for each food description) 1. 2. 3. 4. 5. 6. III.E3 Exercise on key food approach (adapted from Machteld van Lieshout). Select the key foods for iron, which contribute 75% of the iron intake, from the foods listed in the Excel file ‘KeyFood exercise.xls’. The Excel file is available at: http://www.fao.org/infoods/presentations_en.stm. (8 points: 2 points for each correctly selected key food) Instructions for using Excel file ‘KeyFood exercise.xls’ for this exercise: The ‘KeyFood exercise.xls’ file has four worksheets: ‘Cons and Comp’ (where you find the consumption and composition data of the food consumed), keyFoods protein (an example on the identification of key foods for protein), keyFoods iron (where you should select key foods for iron), and keyFoods fat (where you should select key foods for fat if you wish to do a supplementary exercise). To do this exercise, you need both to have access to Excel and some experience in using it. If you do not have such access, you can do the exercise on paper (although it will take much more time). Note:
• If you are not very familiar with Excel, you might find it helpful to consult ‘Excel help’; which is available at http://office.microsoft.com/en-us/excel/FX100646951033.aspx
• The compositional data are derived from the South African Food composition tables. Logical steps
1. Calculate for each food the nutrient intake (food intake times nutrient content). 2. Calculate the total nutrient intake by summing the nutrient intakes of all foods. 3. Calculate the cumulative % of each food to the total nutrient intake. 4. Order the foods in descending order of contribution. 5. Select the foods contributing 75% of the nutrient intake.
Steps to be followed for iron: • Copy the worksheet ‘Cons and Comp’ into the worksheet ‘keyFoods iron’: In the ‘Cons and Comp’
worksheet, click on upper left cell to select the whole worksheet and then Ctrl+c for copying. Go to worksheet ‘keyFoods iron’ and press the upper left cell and then Ctrl+v to paste the data into the worksheet ‘keyFoods iron’;
• Delete the columns you do not need. Keep the columns with the headings: code, Food item; Mean food intake in g/p/d; Iron in mg/100 g;
• Add the following columns: Iron intake in mg/p/d; %from iron intake from food; Cumulative %intake;
• In column E (Iron intake in mg/p/d) calculate iron intake per food: Mean food intake in g/d/p x Iron in mg/100 g, i.e. put the following formula in E2: =C2*D2/100 (do not forget = in front of the
Module 3 – Questions
41
formula nor to divide by 100 – the latter is done because the iron value is per 100 g food). Copy cell E2 with its formula to cells E3 to E18;
• In column E (Iron intake in g/p/d), calculate the total iron intake by summing up the iron intakes per food: go to cell E19 and press the sum sign from the tool bar ∑;
• In column F (%from iron intake from food), calculate the percent of each food of the total iron intake: put into cell F2 the formula =E2/$E$19*100 (the dollar signs are necessary to tell the computer that it always should look at cell E19; and dividing by 100 gives the percentage). Copy cell F2 with its formula to cells F3 to F18;
• Determine the order of the data in the whole worksheet according to %from iron intake from food: Select the cell in the left upper corner (=select whole worksheet), then in toolbar select ‘’Data” and then ‘Sort’. Choose ‘%from iron intake from food’ (to select the column according to which all data should be sorted) and select ‘Descending’ (so that data will be sorted with highest number first);
• In column G (Cumulative %intake), calculate the cumulative %intake of each food. Put in G2 the value of F2 and put into G3 the formula =G2+F3. Copy cell G3 with its formula to cells G4 to G18;
• Select all foods as key foods for iron that contribute to 75% of the iron intake. III.E4 Select two of the following foods and find their taxonomic names through the websites indicated under Resources. (4 points: 2 points for each correct response) a) Mango: b) Herring: c) Spinach: d) Red kidney bean: III.E5 The objective of a 24-hour recall survey is to estimate the intake of fat and fatty acids to correlate them to the risk of breast cancer. The questionnaire should therefore collect highly detailed information with regard to fat. What kind of data should be available in the food composition table or database? Think about two main levels: nutrients (e.g. saturated or unsaturated fatty acids) and foods (e.g. cooking method, processing). (7 points: 1 point for each correct response following the dot (•)) Nutrient data needed (indicate three) Food coverage and description needed (indicate four)

Module 3 – Questions
42
Optional question for those with advanced knowledge or who have participated in a food composition course III.E6 Select two of the following foods and list the codes of the LanguaL food description system (available at http://www.langual.org/) and codes and descriptors of the INFOODS system (available at http://www.fao.org/infoods/nomenclature_en.stm). When using LanguaL, consult the definition displayed at the top of the screen. Do not use the Eurocode 2 classification. (8 points: 2 points for each correct response) Note: It might be useful to download the LanguaL Food Product Indexer, version 3.91. Available at: http://www.langual.org/langual_downloads.asp The objective of this exercise is to experience the different food description systems.
Food LanguaL INFOODS Mango (Kiew-sa-weya), unripe; raw, Mangifera indica found in the ASEAN food composition table, published in 2000
Pork chop, without visible fat, grilled
Kellogg’s cornflakes, fortified
Porridge, made of oatmeal, full-fat milk and sugar found in Granny’s cookery book, published in 2007. The porridge is made of full-fat milk (500g), 6g oatmeal (60g), white sugar (20g); it is boiled for 15 minutes

Module 4.a – Questions
43
Module 4.a COMPONENT SELECTION
LEARNING OBJECTIVES By the end of this module the student will be able to:
understand the process of selecting food components for a national food composition database; select components for inclusion in archival, reference and user databases7.
REQUIRED READING • Charrondière, U.R. ‘Selection of Nutrients and other Components’, available at:
http://www.fao.org/infoods/presentations_en.stm and if possible: • Greenfield, H. & Southgate, D.A.T. 2003. Food composition data – production, management and use. FAO.
Rome. Chapters 1 (pp. 10-128), 2 (pp. 24-25), 4 (pp. 47-62), 7 (pp. 117, 144-145) and 11 (pp. 179–181 and 191-192). Available at: ftp://ftp.fao.org/docrep/fao/008/y4705e/y4705e00.pdf
RELEVANCE FOR VARIOUS USERS (ON A SCALE OF + TO +++++) • Compilers/ professional users +++++ • Analysts + ESTIMATED TIME TO COMPLETE TASKS • Required reading: 1-4 hours • Answering the questions: 1-2 hours • Completing the exercises: 1-3 hours
7 For an explanation of these terms, see pp. 10-12 of Greenfield & Southgate (2003). 8 The page numbers indicated correspond to the page numbers of the book (top of the page), and not to the PDF file.

Module 4.a – Questions
44
Questions IVa.Q1 Who should discuss the components to be included in a food composition database? Select True or False. (3 points: ½ point for each correct response)
Discuss component inclusion True False Government institutions Analysts Consumers Users Industry Compilers
IVa.Q2 List three considerations that govern the selection of components for food composition tables and databases. (3 points: 1 point for each correct response) 1. 2. 3. IVa.Q3 Why do user food composition tables and databases not include all the components that users consider appropriate? Indicate True or False. (3 points: ½ point for each correct response)
Why user food composition tables and databases do not include all components of interest for users
True False
Lack of funds for food analysis and data compilation Poor knowledge of user requirements Insufficient space in reference database No existing analytical methods for certain food components Lack of knowledge of obsolete food component definitions (e.g. crude fibre is obsolete and should not be used in food composition tables and databases)
Lack of one’s own laboratory facilities IVa.Q4 Should water be included in every food composition database level, i.e. in archival, reference and comprehensive user databases? Select the correct response. (1 point)
Water should be included in every food composition database because it serves as a reference point for other food component values.
Water should not be included in every level of the food composition database because it has no energy value and is not important for nutrient intake estimations.
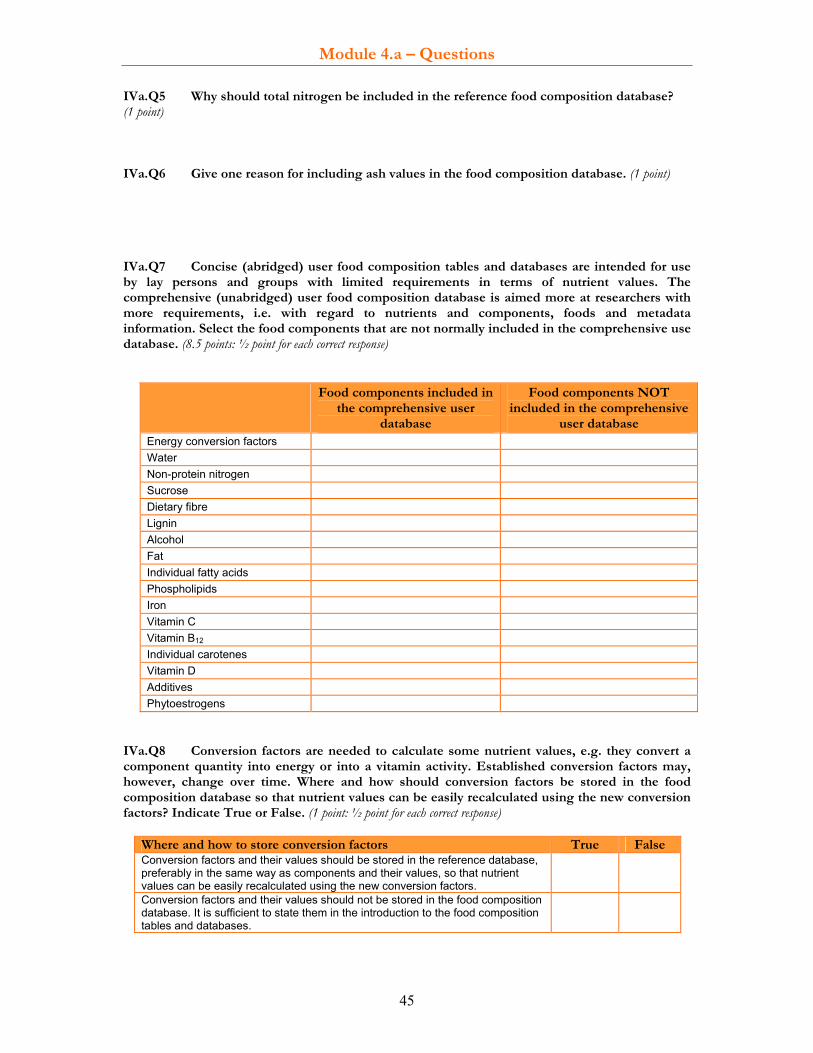
Module 4.a – Questions
45
IVa.Q5 Why should total nitrogen be included in the reference food composition database? (1 point) IVa.Q6 Give one reason for including ash values in the food composition database. (1 point) IVa.Q7 Concise (abridged) user food composition tables and databases are intended for use by lay persons and groups with limited requirements in terms of nutrient values. The comprehensive (unabridged) user food composition database is aimed more at researchers with more requirements, i.e. with regard to nutrients and components, foods and metadata information. Select the food components that are not normally included in the comprehensive use database. (8.5 points: ½ point for each correct response)
Food components included in the comprehensive user
database
Food components NOT included in the comprehensive
user database Energy conversion factors Water Non-protein nitrogen Sucrose Dietary fibre Lignin Alcohol Fat Individual fatty acids Phospholipids Iron Vitamin C Vitamin B12 Individual carotenes Vitamin D Additives Phytoestrogens
IVa.Q8 Conversion factors are needed to calculate some nutrient values, e.g. they convert a component quantity into energy or into a vitamin activity. Established conversion factors may, however, change over time. Where and how should conversion factors be stored in the food composition database so that nutrient values can be easily recalculated using the new conversion factors? Indicate True or False. (1 point: ½ point for each correct response)
Where and how to store conversion factors True False Conversion factors and their values should be stored in the reference database, preferably in the same way as components and their values, so that nutrient values can be easily recalculated using the new conversion factors.
Conversion factors and their values should not be stored in the food composition database. It is sufficient to state them in the introduction to the food composition tables and databases.
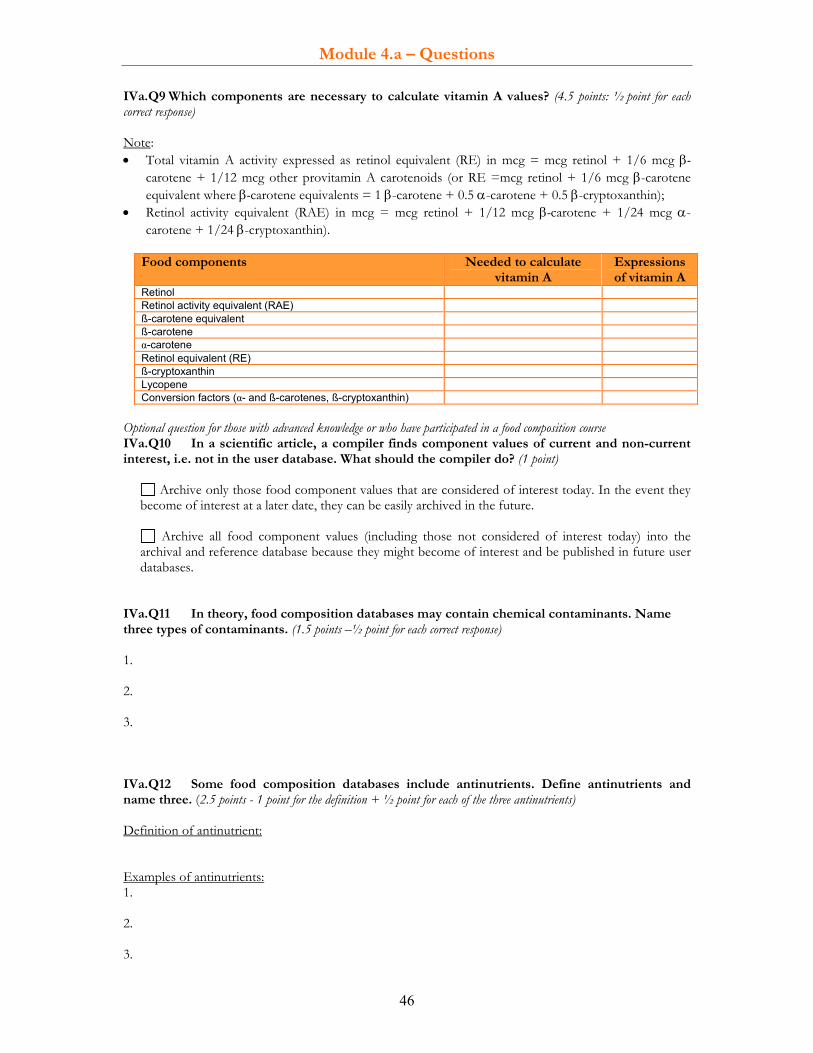
Module 4.a – Questions
46
IVa.Q9 Which components are necessary to calculate vitamin A values? (4.5 points: ½ point for each correct response) Note: • Total vitamin A activity expressed as retinol equivalent (RE) in mcg = mcg retinol + 1/6 mcg β-
carotene + 1/12 mcg other provitamin A carotenoids (or RE =mcg retinol + 1/6 mcg β-carotene equivalent where β-carotene equivalents = 1 β-carotene + 0.5 α-carotene + 0.5 β-cryptoxanthin);
• Retinol activity equivalent (RAE) in mcg = mcg retinol + 1/12 mcg β-carotene + 1/24 mcg α-carotene + 1/24 β-cryptoxanthin).
Food components Needed to calculate
vitamin A Expressions of vitamin A
Retinol Retinol activity equivalent (RAE) ß-carotene equivalent ß-carotene α-carotene Retinol equivalent (RE) ß-cryptoxanthin Lycopene Conversion factors (α- and ß-carotenes, ß-cryptoxanthin)
Optional question for those with advanced knowledge or who have participated in a food composition course IVa.Q10 In a scientific article, a compiler finds component values of current and non-current interest, i.e. not in the user database. What should the compiler do? (1 point)
Archive only those food component values that are considered of interest today. In the event they become of interest at a later date, they can be easily archived in the future.
Archive all food component values (including those not considered of interest today) into the archival and reference database because they might become of interest and be published in future user databases.
IVa.Q11 In theory, food composition databases may contain chemical contaminants. Name three types of contaminants. (1.5 points –½ point for each correct response) 1. 2. 3. IVa.Q12 Some food composition databases include antinutrients. Define antinutrients and name three. (2.5 points - 1 point for the definition + ½ point for each of the three antinutrients) Definition of antinutrient: Examples of antinutrients: 1. 2. 3.

Module 4.a – Questions
47
IVa.Q13 Give two reasons for, and two against, the inclusion of contaminants and antinutrients in food composition databases and tables. (4 points: 1 point for each correct response) Reasons why chemical contaminants and antinutrients should not be included: 1. 2. Reasons why chemical contaminants and antinutrients should be included: 1. 2. IVa.Q14 Bioactive non-nutrient components are rarely included in the main body of user tables and databases. If data on bioactive non-nutrient components are disseminated, they are either listed in annexes of user tables or databases or published through special databases. Select the main reason why data on bioactive food components are not included in the main body of user tables and databases. (1 point)
Main reason for disseminating data on bioactive food components in annexes of user databases or tables or through special databases
Analytical methods are not available. A full dataset of bioactive components are not available for most foods.
Bioactive components are not thought to protect against cardiovascular disease and cancer, and are therefore not included in food composition tables and databases.
The space in user databases is limited. IVa.Q15 Match the following bioactive food components to the groups where they belong. (2 points: ½ point for each correct response)
Bioactive food component groups: 1. Flavonoids 2. Isoflavones 3. Coumestan 4. Lignans
Bioactive food components
Coumestrol Quercetin Isolariciresinol Genistein
IVa.Q16 A lower Glycemic Index (GI) is thought to reduce the risk of cancer and diabetes. It has been proposed that GI values be included in food composition databases. Indicate the possible reasons why GI values are not regularly part of food composition databases. Select True or False. (2 points: ½ point for each correct response)
True False Reasons for non-inclusion of GI values in food composition databases GI values are affected by cooking and processing. GI measurements have a high intra-individual variation, leading to greater uncertainty
about GI values. GI measurements using glucose or white bread as a standard provide similar values. GI values are available for most foods.
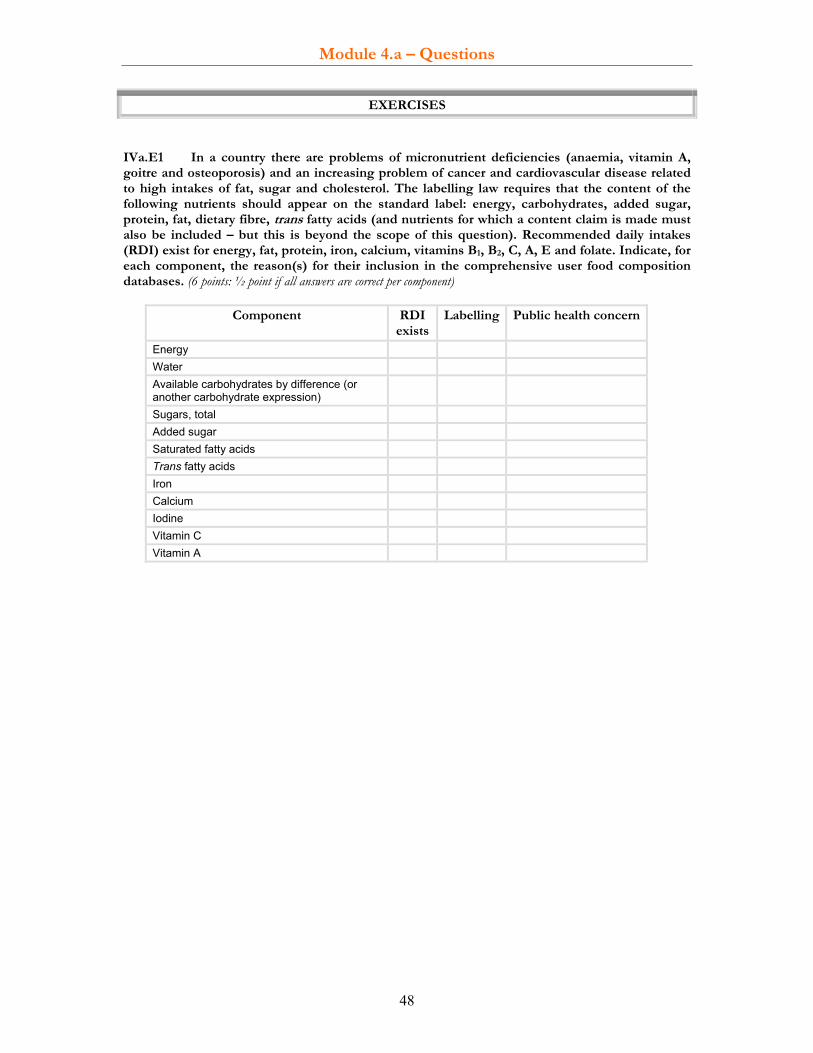
Module 4.a – Questions
48
EXERCISES
IVa.E1 In a country there are problems of micronutrient deficiencies (anaemia, vitamin A, goitre and osteoporosis) and an increasing problem of cancer and cardiovascular disease related to high intakes of fat, sugar and cholesterol. The labelling law requires that the content of the following nutrients should appear on the standard label: energy, carbohydrates, added sugar, protein, fat, dietary fibre, trans fatty acids (and nutrients for which a content claim is made must also be included – but this is beyond the scope of this question). Recommended daily intakes (RDI) exist for energy, fat, protein, iron, calcium, vitamins B1, B2, C, A, E and folate. Indicate, for each component, the reason(s) for their inclusion in the comprehensive user food composition databases. (6 points: ½ point if all answers are correct per component)
Component RDI exists
Labelling Public health concern
Energy Water Available carbohydrates by difference (or another carbohydrate expression)
Sugars, total Added sugar Saturated fatty acids Trans fatty acids Iron Calcium Iodine Vitamin C Vitamin A
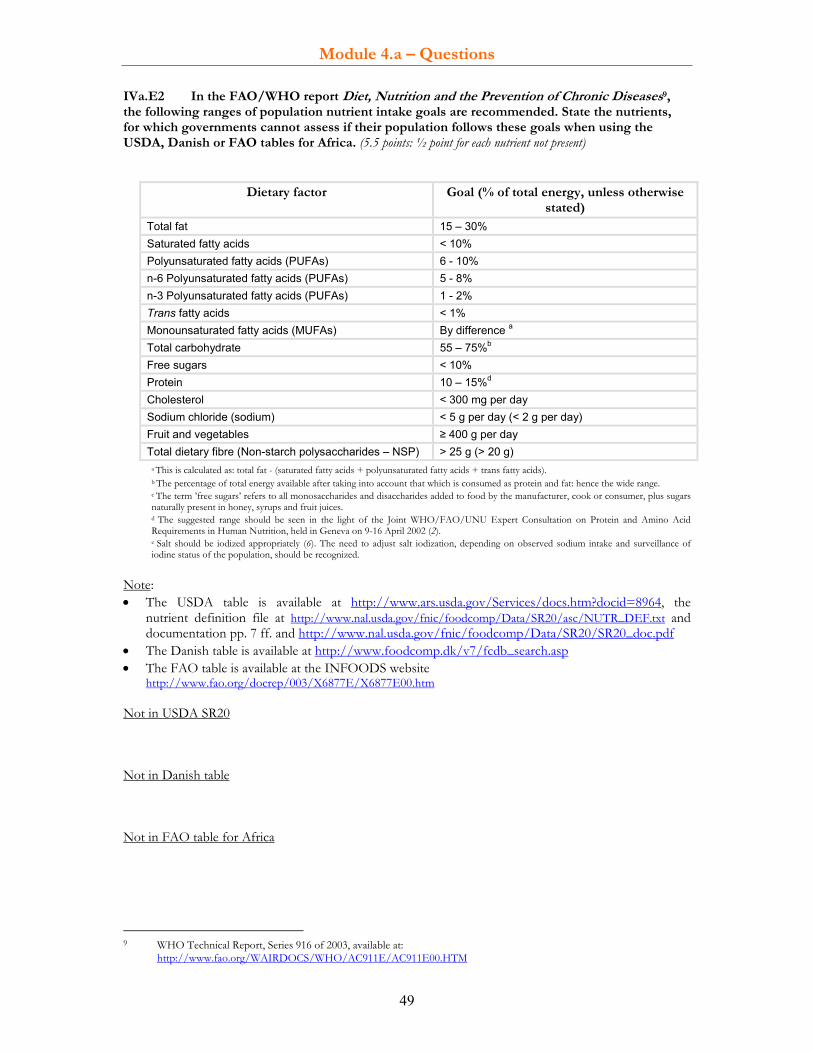
Module 4.a – Questions
49
IVa.E2 In the FAO/WHO report Diet, Nutrition and the Prevention of Chronic Diseases9, the following ranges of population nutrient intake goals are recommended. State the nutrients, for which governments cannot assess if their population follows these goals when using the USDA, Danish or FAO tables for Africa. (5.5 points: ½ point for each nutrient not present)
Dietary factor Goal (% of total energy, unless otherwise stated)
Total fat 15 – 30% Saturated fatty acids < 10% Polyunsaturated fatty acids (PUFAs) 6 - 10% n-6 Polyunsaturated fatty acids (PUFAs) 5 - 8% n-3 Polyunsaturated fatty acids (PUFAs) 1 - 2% Trans fatty acids < 1% Monounsaturated fatty acids (MUFAs) By difference a Total carbohydrate 55 – 75%b Free sugars < 10% Protein 10 – 15%d Cholesterol < 300 mg per day Sodium chloride (sodium) < 5 g per day (< 2 g per day) Fruit and vegetables ≥ 400 g per day Total dietary fibre (Non-starch polysaccharides – NSP) > 25 g (> 20 g)
a This is calculated as: total fat - (saturated fatty acids + polyunsaturated fatty acids + trans fatty acids). b The percentage of total energy available after taking into account that which is consumed as protein and fat: hence the wide range. c The term ’free sugars’ refers to all monosaccharides and disaccharides added to food by the manufacturer, cook or consumer, plus sugars naturally present in honey, syrups and fruit juices. d The suggested range should be seen in the light of the Joint WHO/FAO/UNU Expert Consultation on Protein and Amino Acid Requirements in Human Nutrition, held in Geneva on 9-16 April 2002 (2). e Salt should be iodized appropriately (6). The need to adjust salt iodization, depending on observed sodium intake and surveillance of iodine status of the population, should be recognized.
Note: • The USDA table is available at http://www.ars.usda.gov/Services/docs.htm?docid=8964, the
nutrient definition file at http://www.nal.usda.gov/fnic/foodcomp/Data/SR20/asc/NUTR_DEF.txt and documentation pp. 7 ff. and http://www.nal.usda.gov/fnic/foodcomp/Data/SR20/SR20_doc.pdf
• The Danish table is available at http://www.foodcomp.dk/v7/fcdb_search.asp • The FAO table is available at the INFOODS website
http://www.fao.org/docrep/003/X6877E/X6877E00.htm Not in USDA SR20 Not in Danish table Not in FAO table for Africa
9 WHO Technical Report, Series 916 of 2003, available at: http://www.fao.org/WAIRDOCS/WHO/AC911E/AC911E00.HTM

Module 4.b – Questions
51
Module 4.b COMPONENT NOMENCLATURE
LEARNING OBJECTIVES By the end of this module the student will be able to:
grasp the importance of unambiguous food component identification for sampling, analysis, compilation, and use;
understand the impact of component nomenclature on nutrient values; understand the concept of INFOODS food component identifiers (known as tagnames) and other
systems, and how they can be used in food composition tables and databases; apply INFOODS food component identifiers to different nutrient definitions.
REQUIRED READING • Charrondière, U.R. ‘Component nomenclature’, available at:
http://www.fao.org/infoods/presentations_en.stm and if possible: • Greenfield, H. & Southgate, D.A.T. 2003. Food composition data – production, management and use. FAO.
Rome. Chapters 7 (pp. 101–105 and 146-14710) and 9 (pp. 163-170 and 179-180) and p. 223. Available at: ftp://ftp.fao.org/docrep/fao/008/y4705e/y4705e00.pdf
• Klensin, J.C., Feskanich, D., Lin, V., Truswell, S.A. & Southgate, D.A.T. 1989. Identification of Food Components for INFOODS Data Interchange. UNU, Tokyo. In PDF file: Introduction pp. 5-15 and pp. 72-90 to find tagnames. Available at: http://www.unu.edu/unupress/unupbooks/80734e/80734E00.htm and as PDF file at ftp://ftp.fao.org/es/esn/infoods/Klensinetal1989Identificationoffoodcomponents.pdf.
• Schlotke, F., Becker, W., Ireland, J., Møller, A., Ovaskainen, M.L., Monspart, J. & Unwin, I. 2000. Eurofoods recommendations for food composition database management and data interchange. Report No. EUR 19538. Office for Official Publications of the European Communities, Luxembourg. Component description appears on p. 40 (and as suggested additional reading: component names on pp. 60-74). Available at: ftp://ftp.fao.org/ag/agn/infoods/EurofoodsRecommendations.pdf
EXERCISE MATERIAL • Set of updated tagnames, including recent updates, are available at:
http://www.fao.org/infoods/tagnames_en.stm • EuroFIR Component Thesaurus version 1.1. Available at:
http://eurofir.net/eurofir_knowledge/eurofir_thesauri . And version 1.1 at: http://ethesaurus.eurofir.org/lists/EuroFIR_Component_Thesaurus_version_1.1_num.txt
• Chemical Entities of Biological Interest (ChEBI). Available at http://www.ebi.ac.uk/chebi/ • IUPAC International Chemical Identifier (InChITM). Available at: http://www.iupac.org/inchi/ and
http://wwmm.ch.cam.ac.uk/inchifaq/ • Chemical Abstracts Service (CAS). See http://www.cas.org/. To search CAS numbers, see
http://chem.sis.nlm.nih.gov/chemidplus/and http://chembiofinder.cambridgesoft.com/chembiofinder/SimpleSearch.aspx
RELEVANCE FOR VARIOUS USERS (ON A SCALE OF + TO +++++) • Compilers/ professional users +++++ • Analysts +++++
10 The page numbers indicated correspond to the page numbers of the book (top of the page), and not to the PDF file.

Module 4.b – Questions
52
ESTIMATED TIME TO COMPLETE TASKS • Required reading: 1–4 hours • Answering the questions: 1-4 hours • Completing the exercises: 1-4 hours SUGGESTED ADDITIONAL READING • Charrondiere, U.R. & Burlingame, B. 2007. Identifying food components: INFOODS tagnames
and other component identification systems. Journal of Food Composition and Analysis, volume 20. pp. 713–716. Available at: http://www.sciencedirect.com/science?_ob=PublicationURL&_cdi=6879&_pubType=J&_auth=y&_acct=C000055286&_version=1&_urlVersion=0&_userid=6718006&md5=db64841e2924096349fdfba1225cba8a&jchunk=20#20
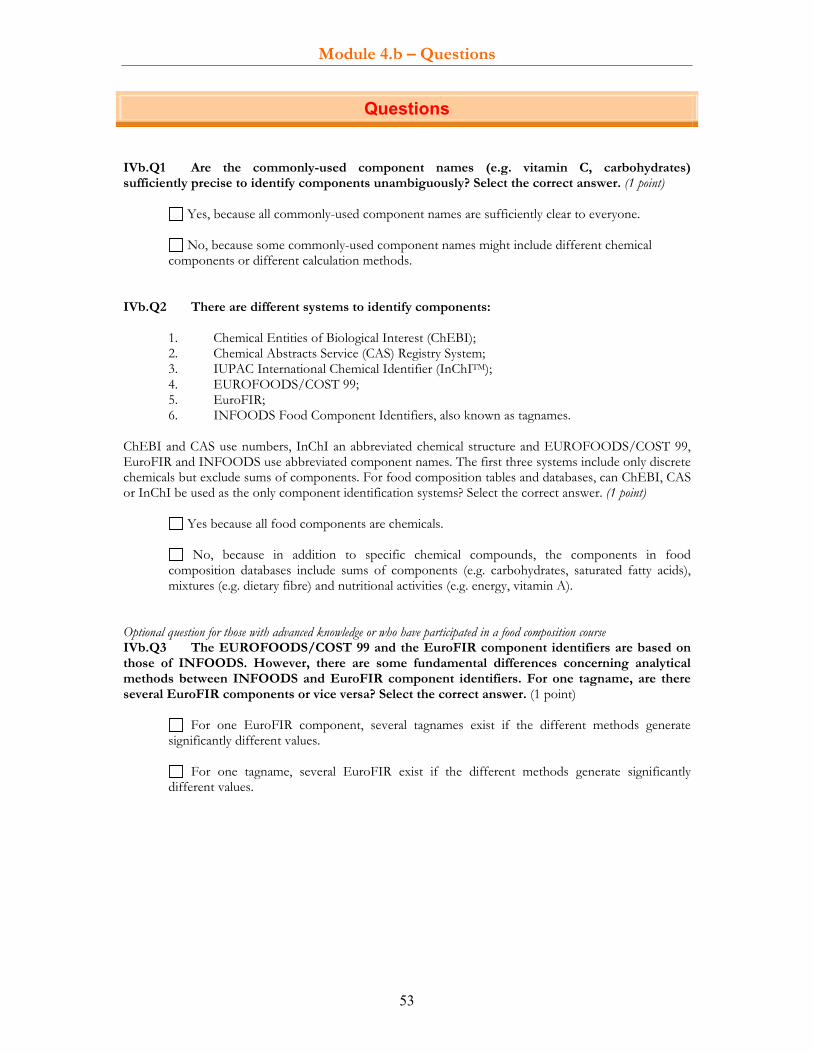
Module 4.b – Questions
53
Questions IVb.Q1 Are the commonly-used component names (e.g. vitamin C, carbohydrates) sufficiently precise to identify components unambiguously? Select the correct answer. (1 point)
Yes, because all commonly-used component names are sufficiently clear to everyone.
No, because some commonly-used component names might include different chemical
components or different calculation methods.
IVb.Q2 There are different systems to identify components:
1. Chemical Entities of Biological Interest (ChEBI); 2. Chemical Abstracts Service (CAS) Registry System; 3. IUPAC International Chemical Identifier (InChITM); 4. EUROFOODS/COST 99; 5. EuroFIR; 6. INFOODS Food Component Identifiers, also known as tagnames.
ChEBI and CAS use numbers, InChI an abbreviated chemical structure and EUROFOODS/COST 99, EuroFIR and INFOODS use abbreviated component names. The first three systems include only discrete chemicals but exclude sums of components. For food composition tables and databases, can ChEBI, CAS or InChI be used as the only component identification systems? Select the correct answer. (1 point)
Yes because all food components are chemicals.
No, because in addition to specific chemical compounds, the components in food composition databases include sums of components (e.g. carbohydrates, saturated fatty acids), mixtures (e.g. dietary fibre) and nutritional activities (e.g. energy, vitamin A).
Optional question for those with advanced knowledge or who have participated in a food composition course IVb.Q3 The EUROFOODS/COST 99 and the EuroFIR component identifiers are based on those of INFOODS. However, there are some fundamental differences concerning analytical methods between INFOODS and EuroFIR component identifiers. For one tagname, are there several EuroFIR components or vice versa? Select the correct answer. (1 point)
For one EuroFIR component, several tagnames exist if the different methods generate significantly different values.
For one tagname, several EuroFIR exist if the different methods generate significantly different values.

Module 4.b – Questions
54
IVb.Q4 Describe the INFOODS food components, also known as tagnames. Indicate the correct responses from the following statements. Select True or False. (4 points: ½ point for each correct response)
True False Statements about tagnames 1. Tagnames are food identifiers. 2. Tagnames are abbreviated food component identifiers that make the unambiguous
identification of all food components possible, to the extent the analysis allows it. 3. Component values with the same tagname are comparable, whereas those with
different tagnames are not. 4. Tagnames with a dash ‘-‘ at the end identify nutrients for which there is no official
analytical method. 5. Food components for which different analytical methods generate significantly
different results always have the same tagname. 6. Tagnames do not use symbols such as ‘:’ because of potential problems in
electronic data interchange. 7. New tagnames should be added when, for example, advances in analytical
methods allow the determination of new components, or when the component is newly used in food composition tables or databases.
8. Tagnames are supplemented by ‘keywords’, which, for example, include additional information on calculation.
IVb.Q5 In the EuroFIR component naming system, information on methods and data expression are reported separately. From the previous question (IV.Q4) select the two statements that do not therefore apply to the EuroFIR component naming system. (1 point) 1. 2. IVb.Q6 Units (e.g. grams) quantify the amount of a component (in the numerator), while the denominator (e.g. per 100 g edible food) indicates in which food quantity the components can be found (in the denominator). Match the following units and denominator to the corresponding statement: (5 points: ½ point for each correct response)
Units and denominator: 1. g 2. mcg 3. kJ 4. IU (international units) 5. per 100 mL 6. per kg 7. per g nitrogen 8. per 100 g dry matter 9. per 100 g total food (as purchased) 10. per 100 g edible portion
Statements Preferred unit for energy (according to SI) Obsolete unit for vitamin A Usual unit for macronutrients Usual unit for folate and vitamin A Usual denominator in food composition tables and databases Denominator used in scientific articles to express nutrient values independent of water content Denominator often used for contaminants Denominator including inedible part Derived denominator for amino acids Denominator sometimes used for beverages
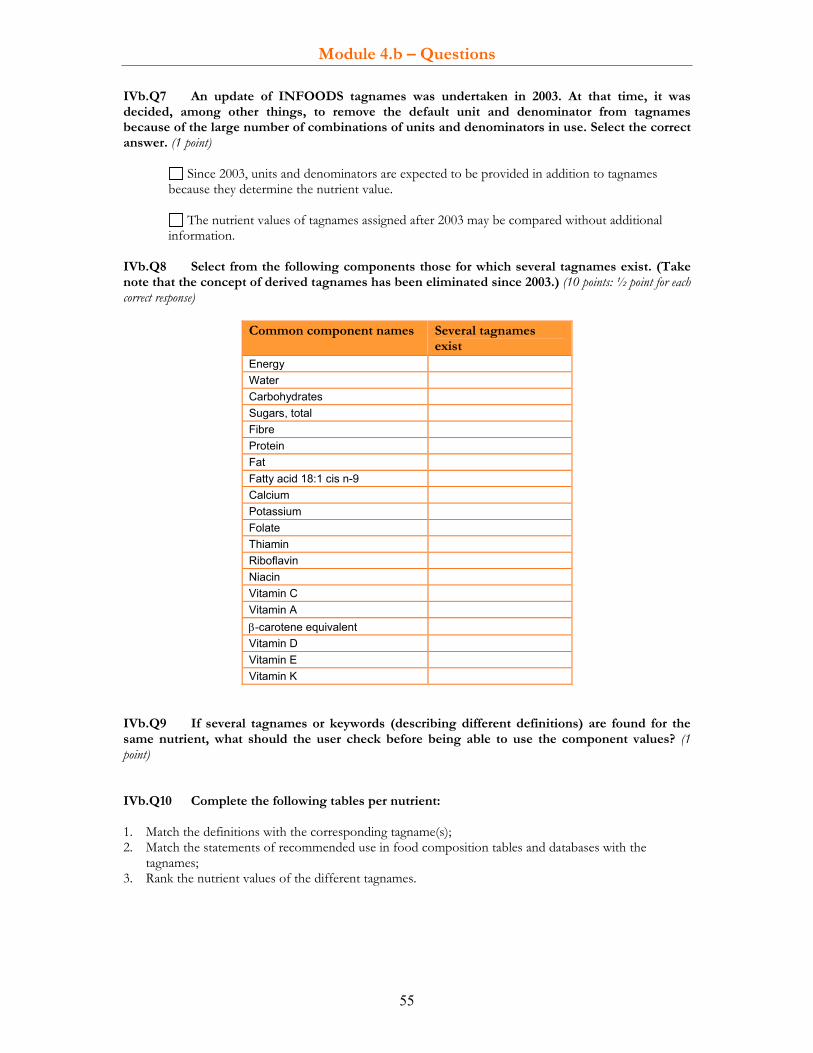
Module 4.b – Questions
55
IVb.Q7 An update of INFOODS tagnames was undertaken in 2003. At that time, it was decided, among other things, to remove the default unit and denominator from tagnames because of the large number of combinations of units and denominators in use. Select the correct answer. (1 point)
Since 2003, units and denominators are expected to be provided in addition to tagnames because they determine the nutrient value.
The nutrient values of tagnames assigned after 2003 may be compared without additional information.
IVb.Q8 Select from the following components those for which several tagnames exist. (Take note that the concept of derived tagnames has been eliminated since 2003.) (10 points: ½ point for each correct response)
Common component names Several tagnames exist
Energy Water Carbohydrates Sugars, total Fibre Protein Fat Fatty acid 18:1 cis n-9 Calcium Potassium Folate Thiamin Riboflavin Niacin Vitamin C Vitamin A β-carotene equivalent Vitamin D Vitamin E Vitamin K
IVb.Q9 If several tagnames or keywords (describing different definitions) are found for the same nutrient, what should the user check before being able to use the component values? (1 point) IVb.Q10 Complete the following tables per nutrient: 1. Match the definitions with the corresponding tagname(s); 2. Match the statements of recommended use in food composition tables and databases with the tagnames; 3. Rank the nutrient values of the different tagnames.

Module 4.b – Questions
56
(a) Fat (4 points: ½ point for each correct response) Definitions 1. Fat, total. Derived by analysis using continuous extraction (Soxhlet method). The nutrient values are lower for cereals but comparable for other food groups. 2. Fat, total. Sum of triglycerides, phospholipids, sterols and related compounds. The analytical method is a mixed solvent extraction. 3. Total fat by NLEA definition (triglyceride equivalents of fatty acids). This is used for labelling in the United States of America. Recommended use in food composition tables and databases 1. Not recommended 2. Recommended 3. Acceptable except for cereals and cereal products Ranking of nutrient values for cereals 1. Tagname provides highest value among all definitions 2. Tagname provides second highest value among all definitions 3. Tagname provides lowest value among all definitions
Tagname Match
with definition
Recommended use in food composition tables and databases
Ranking of nutrient values
FAT FATNLEA ----------------- FATCE
(b) Carbohydrates (4.5 points: ½ point for each correct response) Definitions 1. Total carbohydrates. This value is the sum of analytical values of sugars, starch, oligosaccharides and
dietary fibre. The nutrient value should be similar to ‘Total carbohydrates by difference’. However, nowadays, the concept of available carbohydrates is considered more appropriate and therefore total carbohydrates should be phased out.
2. Available carbohydrates by weight. This value is the sum of analytical values of sugars, starch and glycogen.
3. Available carbohydrates in monosaccharide equivalent. This value is the sum of analytical values of sugars, starch and glycogen. The nutrient value is higher than ‘Available carbohydrates by weight’ because it includes the residual water from the hydrolysis around each monosaccharide. This expression is currently not commonly used in food composition tables and databases(but in the British table).
4. Total carbohydrates by difference. This value is calculated as follows: 100 g minus total grams of water, protein, fat, alcohol and ash. The nutrient value is higher than ‘Available carbohydrates by difference’ by the amount of the fibre value and includes the analytical errors of all contributing nutrients. It is therefore not recommended for use as the only expression for carbohydrates in food composition tables and databases.
5. Available carbohydrates by difference. This value is calculated as follows: 100 g minus total grams of water, protein, fat, alcohol, ash and dietary fibre; or total carbohydrates minus dietary fibre. The nutrient value is similar to ‘Available carbohydrates by weight’, but includes the analytical errors of all contributing nutrients. It should therefore be phased out. However, this expression is acceptable for countries unable to generate analytical values for carbohydrates.
Recommended use in food composition tables and databases 1. Most recommended expression (select only one tagname) 2. Least recommended (select only one tagname)
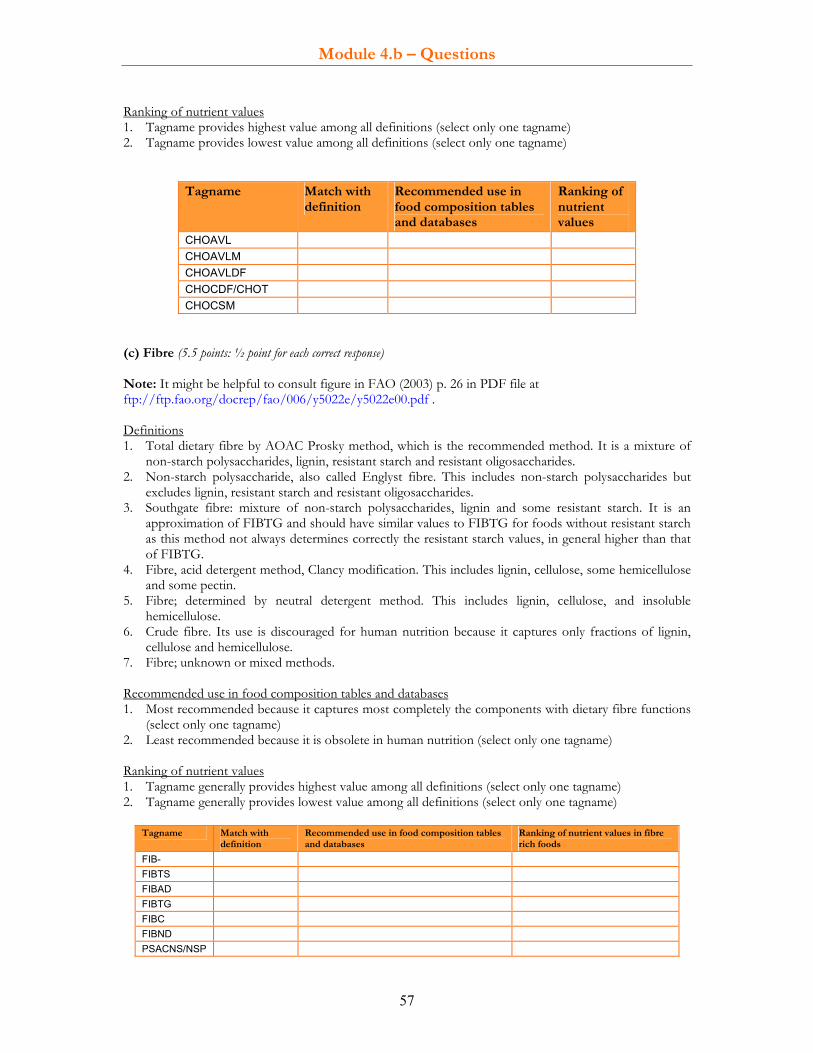
Module 4.b – Questions
57
Ranking of nutrient values 1. Tagname provides highest value among all definitions (select only one tagname) 2. Tagname provides lowest value among all definitions (select only one tagname)
Tagname Match with definition
Recommended use in food composition tables and databases
Ranking of nutrient values
CHOAVL CHOAVLM CHOAVLDF CHOCDF/CHOT CHOCSM
(c) Fibre (5.5 points: ½ point for each correct response) Note: It might be helpful to consult figure in FAO (2003) p. 26 in PDF file at ftp://ftp.fao.org/docrep/fao/006/y5022e/y5022e00.pdf . Definitions 1. Total dietary fibre by AOAC Prosky method, which is the recommended method. It is a mixture of
non-starch polysaccharides, lignin, resistant starch and resistant oligosaccharides. 2. Non-starch polysaccharide, also called Englyst fibre. This includes non-starch polysaccharides but
excludes lignin, resistant starch and resistant oligosaccharides. 3. Southgate fibre: mixture of non-starch polysaccharides, lignin and some resistant starch. It is an
approximation of FIBTG and should have similar values to FIBTG for foods without resistant starch as this method not always determines correctly the resistant starch values, in general higher than that of FIBTG.
4. Fibre, acid detergent method, Clancy modification. This includes lignin, cellulose, some hemicellulose and some pectin.
5. Fibre; determined by neutral detergent method. This includes lignin, cellulose, and insoluble hemicellulose.
6. Crude fibre. Its use is discouraged for human nutrition because it captures only fractions of lignin, cellulose and hemicellulose.
7. Fibre; unknown or mixed methods. Recommended use in food composition tables and databases 1. Most recommended because it captures most completely the components with dietary fibre functions (select only one tagname) 2. Least recommended because it is obsolete in human nutrition (select only one tagname) Ranking of nutrient values 1. Tagname generally provides highest value among all definitions (select only one tagname) 2. Tagname generally provides lowest value among all definitions (select only one tagname)
Tagname Match with definition
Recommended use in food composition tables and databases
Ranking of nutrient values in fibre rich foods
FIB- FIBTS FIBAD FIBTG FIBC FIBND PSACNS/NSP
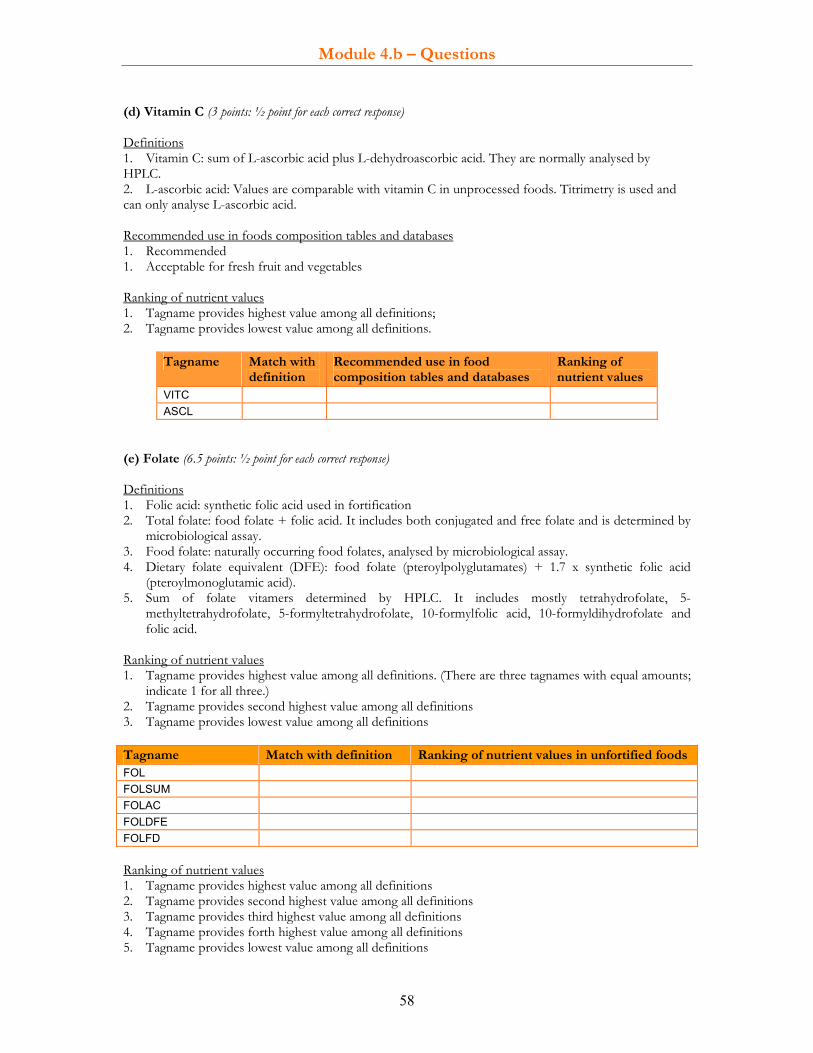
Module 4.b – Questions
58
(d) Vitamin C (3 points: ½ point for each correct response) Definitions 1. Vitamin C: sum of L-ascorbic acid plus L-dehydroascorbic acid. They are normally analysed by HPLC. 2. L-ascorbic acid: Values are comparable with vitamin C in unprocessed foods. Titrimetry is used and can only analyse L-ascorbic acid. Recommended use in foods composition tables and databases 1. Recommended 1. Acceptable for fresh fruit and vegetables Ranking of nutrient values 1. Tagname provides highest value among all definitions; 2. Tagname provides lowest value among all definitions.
Tagname Match with definition
Recommended use in food composition tables and databases
Ranking of nutrient values
VITC ASCL
(e) Folate (6.5 points: ½ point for each correct response) Definitions 1. Folic acid: synthetic folic acid used in fortification 2. Total folate: food folate + folic acid. It includes both conjugated and free folate and is determined by microbiological assay. 3. Food folate: naturally occurring food folates, analysed by microbiological assay. 4. Dietary folate equivalent (DFE): food folate (pteroylpolyglutamates) + 1.7 x synthetic folic acid (pteroylmonoglutamic acid). 5. Sum of folate vitamers determined by HPLC. It includes mostly tetrahydrofolate, 5- methyltetrahydrofolate, 5-formyltetrahydrofolate, 10-formylfolic acid, 10-formyldihydrofolate and folic acid. Ranking of nutrient values 1. Tagname provides highest value among all definitions. (There are three tagnames with equal amounts; indicate 1 for all three.) 2. Tagname provides second highest value among all definitions 3. Tagname provides lowest value among all definitions Tagname Match with definition Ranking of nutrient values in unfortified foods FOL FOLSUM FOLAC FOLDFE FOLFD Ranking of nutrient values 1. Tagname provides highest value among all definitions 2. Tagname provides second highest value among all definitions 3. Tagname provides third highest value among all definitions 4. Tagname provides forth highest value among all definitions 5. Tagname provides lowest value among all definitions

Module 4.b – Questions
59
Tagname Ranking of nutrient values in fortified foods when the amount of the fortificant exceeds that of natural folate
FOL FOLSUM FOLAC FOLDFE FOLFD
(f) Vitamin A (2.5 points: ½ point for each correct response) Definitions 1. Total vitamin A activity expressed in mcg retinol equivalent (RE) = mcg retinol + 1/6 mcg β- carotene + 1/12 mcg other provitamin A carotenoids (or RE =mcg retinol + 1/6 mcg β-carotene equivalent where β-carotene equivalents = 1 β-carotene + 0.5 α-carotene + 0.5 β-cryptoxanthin) 2. Total vitamin A activity expressed in mcg in retinol activity equivalent (RAE) is used e.g. in the United States Department of Agriculture (USDA) database = mcg retinol + 1/12 mcg β- carotene + 1/24 mcg other provitamin A carotenoids (or RAE =mcg retinol + 1/12 mcg β- carotene + 1/24 mcg α-carotene + 1/24 mcg β-cryptoxanthin) 3. Vitamin A; determined by bioassay Ranking of nutrient values 1. Tagname provides highest value among all definitions 2. Tagname provides lowest value among all definitions
Tagname Match with definition
Recommended use in food composition tables and databases
Order of nutrient values
VITAA -------------- ------------ VITA x VITA_RAE x
(g) Vitamin E (3 points: ½ point for each correct response) Definitions 1. α-tocopherol. In some databases, e.g. USDA SR16 and later releases, it is used to represent vitamin E. 2. Vitamin E: active tocopherols and tocotrienols, calculated as mg α-tocopherol equivalents (ATE or TE)11
• = α-tocopherol + 0.4 β-tocopherol + 0.1 γ-tocopherol + 0.01 δ-tocopherol + 0.3 α-tocotrienol + 0.05 β-tocotrienol + 0.01 γ-tocotrienol (mostly used)
• = α-tocopherol + 0.5 β-tocopherol + 0.1 γ-tocopherol + 0.3 α-tocotrienol • = α-tocopherol + 0.4 β-tocopherol + 0.1 γ-tocopherol + 0.01 δ-tocopherol
3. Vitamin E: determined by bioassay 4. Vitamin E: method unknown or variable Ranking of nutrient values 1. Tagname provides highest value among all definitions 2. Tagname provides lowest value among all definitions
11 Information on calculations is to be included through the key words approach.
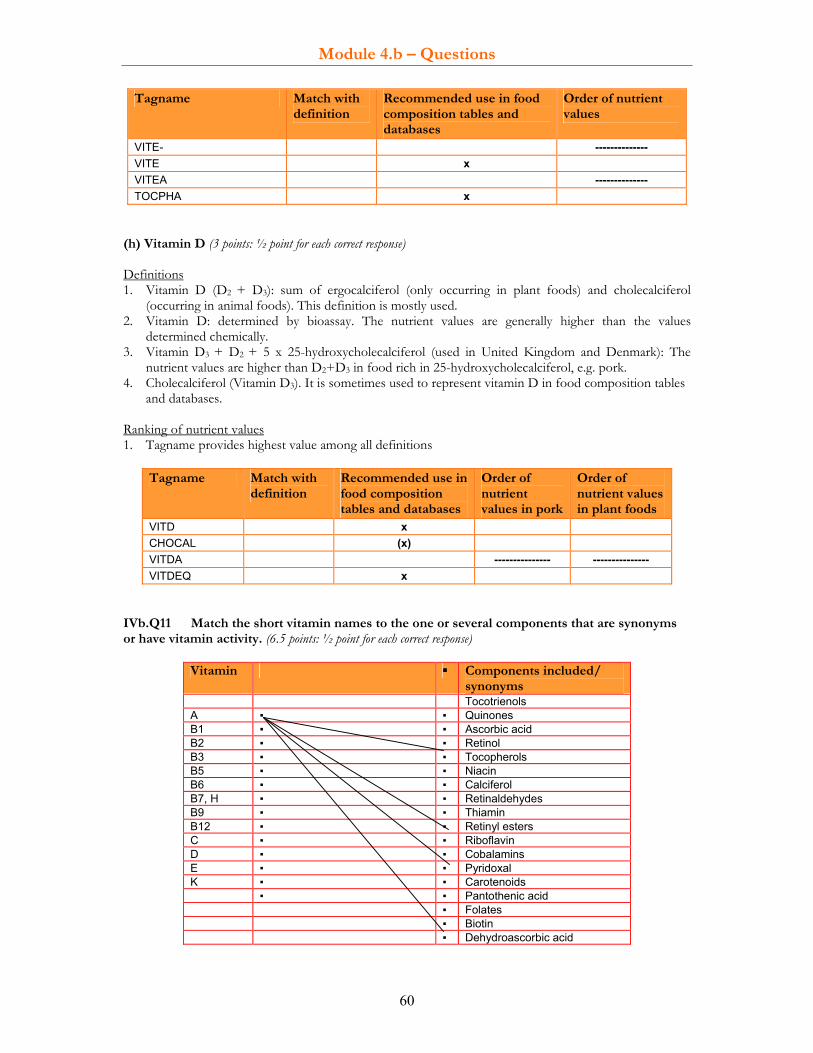
Module 4.b – Questions
60
Tagname Match with definition
Recommended use in food composition tables and databases
Order of nutrient values
VITE- -------------- VITE x VITEA -------------- TOCPHA x
(h) Vitamin D (3 points: ½ point for each correct response) Definitions 1. Vitamin D (D2 + D3): sum of ergocalciferol (only occurring in plant foods) and cholecalciferol (occurring in animal foods). This definition is mostly used. 2. Vitamin D: determined by bioassay. The nutrient values are generally higher than the values determined chemically. 3. Vitamin D3 + D2 + 5 x 25-hydroxycholecalciferol (used in United Kingdom and Denmark): The nutrient values are higher than D2+D3 in food rich in 25-hydroxycholecalciferol, e.g. pork. 4. Cholecalciferol (Vitamin D3). It is sometimes used to represent vitamin D in food composition tables and databases. Ranking of nutrient values 1. Tagname provides highest value among all definitions
Tagname Match with definition
Recommended use in food composition tables and databases
Order of nutrient values in pork
Order of nutrient values in plant foods
VITD x CHOCAL (x) VITDA --------------- --------------- VITDEQ x
IVb.Q11 Match the short vitamin names to the one or several components that are synonyms or have vitamin activity. (6.5 points: ½ point for each correct response)
Vitamin ▪ Components included/ synonyms
Tocotrienols A ▪ ▪ Quinones B1 ▪ ▪ Ascorbic acid B2 ▪ ▪ Retinol B3 ▪ ▪ Tocopherols B5 ▪ ▪ Niacin B6 ▪ ▪ Calciferol B7, H ▪ ▪ Retinaldehydes B9 ▪ ▪ Thiamin B12 ▪ ▪ Retinyl esters C ▪ ▪ Riboflavin D ▪ ▪ Cobalamins E ▪ ▪ Pyridoxal K ▪ ▪ Carotenoids ▪ ▪ Pantothenic acid ▪ Folates ▪ Biotin ▪ Dehydroascorbic acid
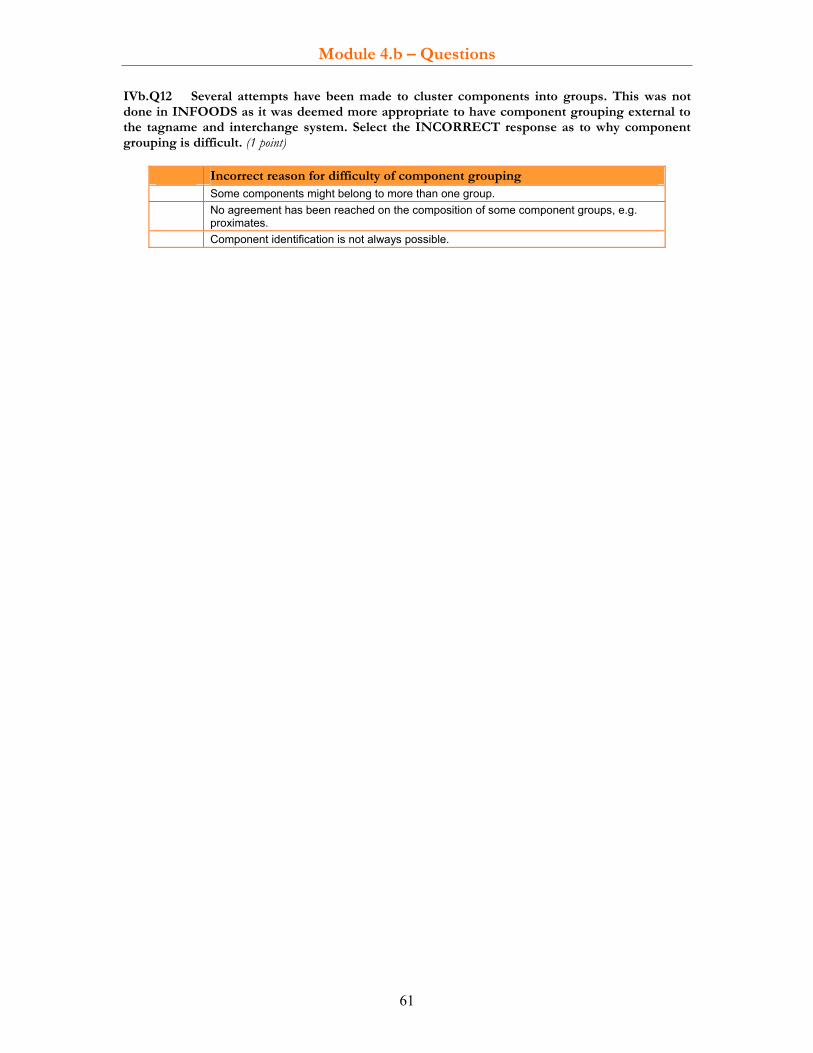
Module 4.b – Questions
61
IVb.Q12 Several attempts have been made to cluster components into groups. This was not done in INFOODS as it was deemed more appropriate to have component grouping external to the tagname and interchange system. Select the INCORRECT response as to why component grouping is difficult. (1 point)
Incorrect reason for difficulty of component grouping Some components might belong to more than one group. No agreement has been reached on the composition of some component groups, e.g.
proximates. Component identification is not always possible.

Module 4.b – Questions
62
EXERCISES
Optional question for those with advanced knowledge or who have participated in a food composition course IVb.E1 For the following INFOODS tagnames find the corresponding component names or codes from EuroFIR, ChEBI and CAS. (11 points: 1 point for each correct response per component). INFOODS tagnames are found on: • Klensin, J.C., Feskanich, D., Lin, V., Truswell, S.A. and Southgate, D.A.T. 1989. Identification of Food
Components for INFOODS Data Interchange. pp. 16-91 in PDF file at: ftp://ftp.fao.org/es/esn/infoods/Klensinetal1989Identificationoffoodcomponents.pdf
• Set of currently available tagnames, including updated ones, available at: http://www.fao.org/infoods/tagnames_en.stm
Other component identifiers may be found at: • EuroFIR components thesaurus version 1.1 Available at:
http://eurofir.net/eurofir_knowledge/eurofir_thesauri and http://ethesaurus.eurofir.org/lists/EuroFIR_Component_Thesaurus_version_1.1_num.txt
• Chemical Entities of Biological Interest (ChEBI). Available at http://www.ebi.ac.uk/chebi/ • Chemical Abstracts Service (CAS). Available at http://www.cas.org/. To search CAS numbers, see
http://chem.sis.nlm.nih.gov/chemidplus/ and http://chembiofinder.cambridgesoft.com/chembiofinder/SimpleSearch.aspx
Note: The purpose of this exercise is to demonstrate that ChEBI or CAS cannot be used exclusively as a component identifier system for food composition purposes because they do not include codes for those nutrients which are summations or equivalents or which are determined by different analytical methods or expressions. In addition, it helps users appreciate the differences in component naming between INFOODS and EuroFIR.
Tagname Component name EuroFIR component
ChEBI code CAS code
XN Conversion factor to calculate total protein from nitrogen
ALA Alanine. Includes only L-arginine
SUGAR Sugars, total
SUGARM Sugars, total; expressed in monosaccharide equivalents
FAMS Fatty acids, total monounsaturated
F18D1TN9 Fatty acid trans 18:1 n-9; elaidic acid; octadecenoic acid
F18D1CN9 Fatty acid 18:1 cis n-9; oleic acid
FIBTG Total dietary fibre by AOAC Prosky method
PSACNS /NSP
Non-starch polysaccharide = Englyst fibre
CARTB β-carotene
VITD- Vitamin D; method of determination unknown

Module 4.b – Questions
63
IVb.E2 Determine the order in the following foods, from the highest to the lowest, of fat values using FAT, FATCE, FATNLEA. It may be useful to recheck the definitions of fat in IVb.Q10 (a) fat. See example of Beef steak. (3 points: 1 point for each correct response per component) a) Beef steak: FAT = FATCE > FATNLEA b) Wheat: c) Trout: d) Olive oil: IVb.E3 In the following foods, determine the order of the dietary fibre values, from the highest to the lowest, using FIBC, FIBTG, FIBTS, PSACNS/NSP and FIB-. (3 points: 1 point for each correct response per component) Note: It would be helpful to look at the tables on pp. 14-15 of FAO (2003): Food energy - methods of analysis and conversion factor, available at ftp://ftp.fao.org/docrep/fao/006/y5022e/y5022e00.pdf. Example: Brown bread: FIBTG > FIBTS (but similar to FIBTG)> PSACNS/NSP > FIBC a) Dates, dried (no resistant starch, 2 g lignin): b) Mango (no resistant starch, 0.3 g lignin): c) Spaghetti, boiled (resistant starch, 0.1 g lignin): IVb.E4 Indicate the corresponding tagname for the following nutrients appearing in the British food composition database McCance and Widdowson’s The Composition of Foods integrated dataset (CoF IDS), available at: http://www.food.gov.uk/science/dietarysurveys/dietsurveys/. Read the sections Details on Nutrient Data (pp.4-7) and Nutrient Definitions and Expressions (pp.17-27) in the documentation (available at http://www.food.gov.uk/multimedia/pdfs/cofuserdoc.pdf). (15 points: 1 point for each correct response per component) Nutrient in CoF IDS Corresponding tagname Protein Fat Carbohydrates Water Energy Dietary fibre Cholesterol Retinol Vitamin A Vitamin D Vitamin E Vitamin C Folate Niacin Calcium

Module 4.c – Questions
65
Module 4.c COMPONENT CONVENTIONS AND EXPRESSIONS
LEARNING OBJECTIVES By the end of this module the student will be able to:
understand the concepts of unit and denominator and their importance for data definition and values; comprehend principles of nutrient calculation using conversion factors and/or aggregations of
components; grasp the implications of different expressions and calculations of nutrient values on database
management and data use, and apply them appropriately; recalculate nutrient values using different units and denominators; determine nutrient values, which by definition are calculated values.
REQUIRED READING • Charrondière, U.R. ‘Component conventions and expressions’ available at:
http://www.fao.org/infoods/presentations_en.stm and if possible: • Greenfield, H. & Southgate, D.A.T. 2003. Food composition data – production, management and use. FAO.
Rome. Chapters 7 (pp. 101-104, 146-147)12 , 9 (pp. 163-170) and 11 (pp. 179-181) and appendix 5 (p. 223). Available at: ftp://ftp.fao.org/docrep/fao/008/y4705e/y4705e00.pdf
• FAO. 2003. Food energy - methods of analysis and conversion factors. PDF version. FAO, Rome. pp. 18-35. Available at: ftp://ftp.fao.org/docrep/fao/006/y5022e/y5022e00.pdf
• Codex Alimentarius. 2001. Food Labelling – Complete Texts (revised). FAO, Rome. pp. 32-34. Available at: ftp://ftp.fao.org/docrep/fao/005/y2770E/y2770E00.pdf
RELEVANCE FOR VARIOUS USERS (ON A SCALE OF + TO +++++) • Compilers/ professional users +++++ • Analysts +++++ ESTIMATED TIME TO COMPLETE TASKS • Required reading: 1–3 hours • Answering the questions: 1–2 hours • Completing the exercises: 1–2 hours
12 The page numbers indicated correspond to the page numbers of the book (top of the page), and not to the PDF file.
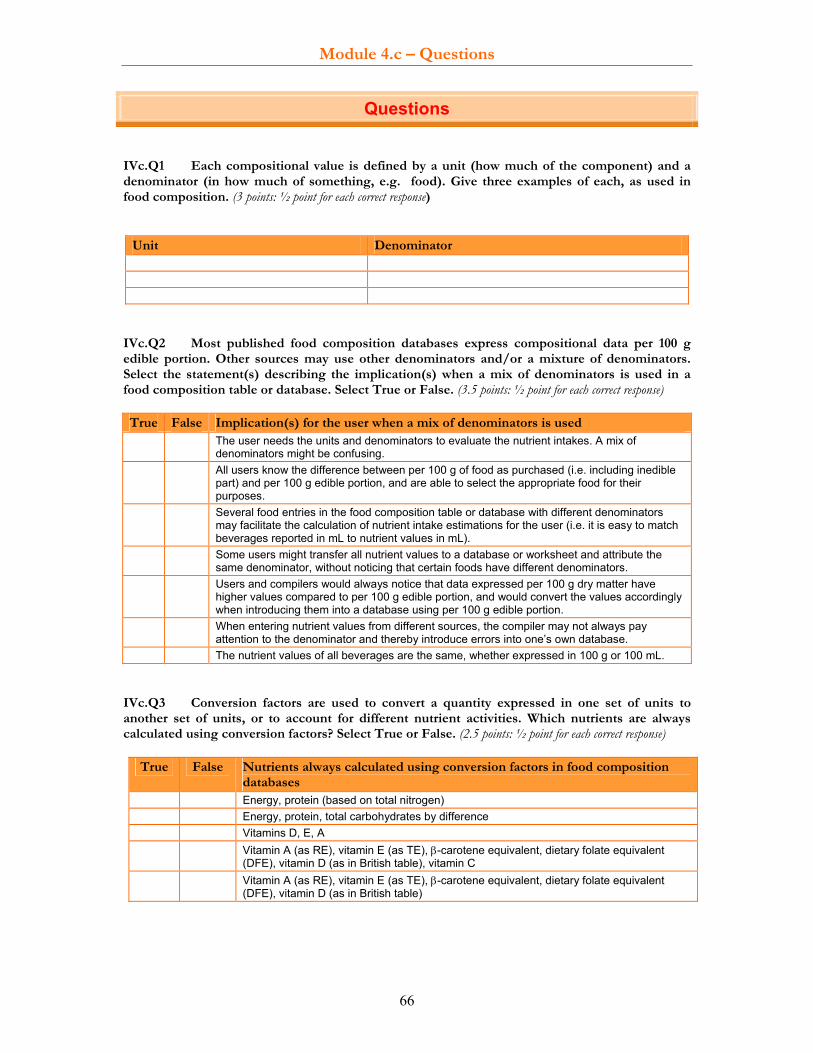
Module 4.c – Questions
66
Questions IVc.Q1 Each compositional value is defined by a unit (how much of the component) and a denominator (in how much of something, e.g. food). Give three examples of each, as used in food composition. (3 points: ½ point for each correct response)
Unit Denominator
IVc.Q2 Most published food composition databases express compositional data per 100 g edible portion. Other sources may use other denominators and/or a mixture of denominators. Select the statement(s) describing the implication(s) when a mix of denominators is used in a food composition table or database. Select True or False. (3.5 points: ½ point for each correct response) True False Implication(s) for the user when a mix of denominators is used
The user needs the units and denominators to evaluate the nutrient intakes. A mix of denominators might be confusing.
All users know the difference between per 100 g of food as purchased (i.e. including inedible part) and per 100 g edible portion, and are able to select the appropriate food for their purposes.
Several food entries in the food composition table or database with different denominators may facilitate the calculation of nutrient intake estimations for the user (i.e. it is easy to match beverages reported in mL to nutrient values in mL).
Some users might transfer all nutrient values to a database or worksheet and attribute the same denominator, without noticing that certain foods have different denominators.
Users and compilers would always notice that data expressed per 100 g dry matter have higher values compared to per 100 g edible portion, and would convert the values accordingly when introducing them into a database using per 100 g edible portion.
When entering nutrient values from different sources, the compiler may not always pay attention to the denominator and thereby introduce errors into one’s own database.
The nutrient values of all beverages are the same, whether expressed in 100 g or 100 mL. IVc.Q3 Conversion factors are used to convert a quantity expressed in one set of units to another set of units, or to account for different nutrient activities. Which nutrients are always calculated using conversion factors? Select True or False. (2.5 points: ½ point for each correct response)
True False Nutrients always calculated using conversion factors in food composition databases
Energy, protein (based on total nitrogen) Energy, protein, total carbohydrates by difference Vitamins D, E, A Vitamin A (as RE), vitamin E (as TE), β-carotene equivalent, dietary folate equivalent
(DFE), vitamin D (as in British table), vitamin C Vitamin A (as RE), vitamin E (as TE), β-carotene equivalent, dietary folate equivalent
(DFE), vitamin D (as in British table)
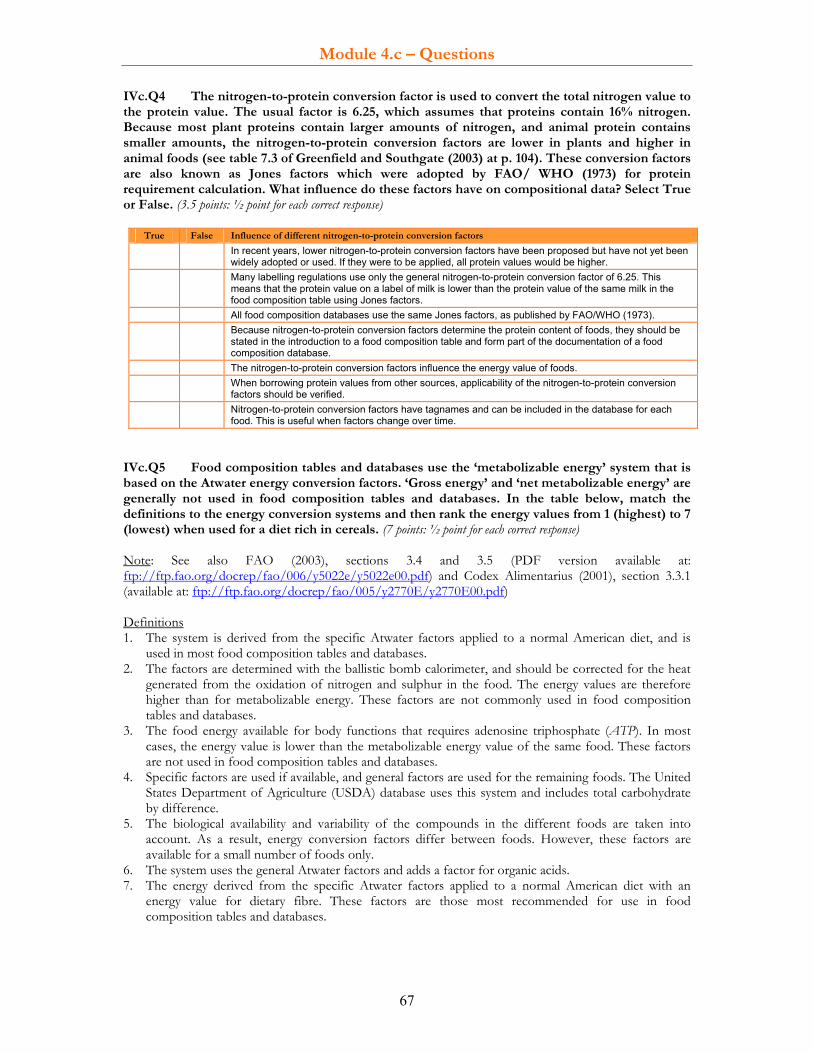
Module 4.c – Questions
67
IVc.Q4 The nitrogen-to-protein conversion factor is used to convert the total nitrogen value to the protein value. The usual factor is 6.25, which assumes that proteins contain 16% nitrogen. Because most plant proteins contain larger amounts of nitrogen, and animal protein contains smaller amounts, the nitrogen-to-protein conversion factors are lower in plants and higher in animal foods (see table 7.3 of Greenfield and Southgate (2003) at p. 104). These conversion factors are also known as Jones factors which were adopted by FAO/ WHO (1973) for protein requirement calculation. What influence do these factors have on compositional data? Select True or False. (3.5 points: ½ point for each correct response)
True False Influence of different nitrogen-to-protein conversion factors
In recent years, lower nitrogen-to-protein conversion factors have been proposed but have not yet been widely adopted or used. If they were to be applied, all protein values would be higher.
Many labelling regulations use only the general nitrogen-to-protein conversion factor of 6.25. This means that the protein value on a label of milk is lower than the protein value of the same milk in the food composition table using Jones factors.
All food composition databases use the same Jones factors, as published by FAO/WHO (1973). Because nitrogen-to-protein conversion factors determine the protein content of foods, they should be
stated in the introduction to a food composition table and form part of the documentation of a food composition database.
The nitrogen-to-protein conversion factors influence the energy value of foods. When borrowing protein values from other sources, applicability of the nitrogen-to-protein conversion
factors should be verified. Nitrogen-to-protein conversion factors have tagnames and can be included in the database for each
food. This is useful when factors change over time. IVc.Q5 Food composition tables and databases use the ‘metabolizable energy’ system that is based on the Atwater energy conversion factors. ‘Gross energy’ and ‘net metabolizable energy’ are generally not used in food composition tables and databases. In the table below, match the definitions to the energy conversion systems and then rank the energy values from 1 (highest) to 7 (lowest) when used for a diet rich in cereals. (7 points: ½ point for each correct response) Note: See also FAO (2003), sections 3.4 and 3.5 (PDF version available at: ftp://ftp.fao.org/docrep/fao/006/y5022e/y5022e00.pdf) and Codex Alimentarius (2001), section 3.3.1 (available at: ftp://ftp.fao.org/docrep/fao/005/y2770E/y2770E00.pdf) Definitions 1. The system is derived from the specific Atwater factors applied to a normal American diet, and is used in most food composition tables and databases. 2. The factors are determined with the ballistic bomb calorimeter, and should be corrected for the heat generated from the oxidation of nitrogen and sulphur in the food. The energy values are therefore higher than for metabolizable energy. These factors are not commonly used in food composition tables and databases. 3. The food energy available for body functions that requires adenosine triphosphate (ATP). In most cases, the energy value is lower than the metabolizable energy value of the same food. These factors are not used in food composition tables and databases. 4. Specific factors are used if available, and general factors are used for the remaining foods. The United States Department of Agriculture (USDA) database uses this system and includes total carbohydrate by difference. 5. The biological availability and variability of the compounds in the different foods are taken into account. As a result, energy conversion factors differ between foods. However, these factors are available for a small number of foods only. 6. The system uses the general Atwater factors and adds a factor for organic acids. 7. The energy derived from the specific Atwater factors applied to a normal American diet with an energy value for dietary fibre. These factors are those most recommended for use in food composition tables and databases.

Module 4.c – Questions
68
Energy conversion system Energy conversion factors in kJ/g (kcal/g)
Match with definition
Rank of energy values
ME – specific Atwater factors P=3.8-18.2 (0.91-4.36), CT=11.3-17.2 (2.70-4.16), F= 35.0-37.7 (8.37-9.02), A=29 (7)
ME – general Atwater factors P=17 (4), CA and CT =17 or 16 (4 or 3.75), F= 37 (9), A=29 (7)
ME – general Atwater factors, including for dietary fibre
P=17 (4), CA and CT =17 or 16 (4 or 3.75), F= 37 (9), A=29 (7), DF=8 (2)
ME – general Atwater factors as proposed by CODEX
P=17 (4), CA and CT=17 or 16 (4 or 3.75), F= 37 (9), A=29 (7), OA=13 (3)
ME – mixed Atwater factor system P=3.8-18.2 (0.91-4.36), CT=11.3-17.2 (2.70-4.16), F= 35.0-37.7 (8.37-9.02), A=29 (7) or P=17 (4), CT=17 or 16 (4 or 3.75), F= 37 (9)
Gross energy P=24 (5.65), CA and CT = 17 (4), F= 40 (9.4), A=30 (7), DF=17 (4)
Net metabolizable energy P=13 (3.2), CA=17 or 16 (4 or 3.75), F= 37 (9), A=26 (6.3), DF=6 (1.4), OA=9 (2.1)
P=protein, CA=available carbohydrates (excluding dietary fibre), CT= total carbohydrates (including dietary fibre), F=fat, A=alcohol, DF= dietary fibre; OA=organic acids IVc.Q6 Is it advisable to publish the copied energy values from other sources in one’s own user food composition database? Select the correct response. (1 point)
Publish copied energy values from other sources Yes, because all food composition databases use the same energy conversion factors. No, because all food composition databases use the same energy conversion factors but
may have different macronutrient values. No, because food composition databases may use different energy conversion factors and
may have different macronutrient values. IVc.Q7 Is it advisable to calculate kJ from kcal through the use of a conversion factor of 4.184 (rounded up to 4.2)? Select True or False. (2 points: ½ point for each correct response)
True False Calculate kJ from kcal It is not advisable to calculate kJ energy values from energy values in kcal
because this may introduce bias. It is recommended that the energy-yielding components be multiplied by the
respective energy conversion factors in kJ. The energy conversion factors in kJ are exactly 4.184 (4.2) times higher than
those in kcal. Energy conversion factors in kJ and in kcal yield exactly the same energy value
when the energy calculation system is the same. IVc.Q8 Which energy conversion factor is recommended for dietary fibre? See FAO (2003), pp. 24 and 29, available at ftp://ftp.fao.org/docrep/fao/006/y5022e/y5022e00.pdf ) Select the correct answer. (1 point)
Recommended energy factor for dietary fibre 17 kJ/g (4 kcal/g) 8.5 kJ/g (2 kcal/g)
8 kJ/g (2 kcal/g)

Module 4.c – Questions
69
IVc.Q9 The energy value of ‘available carbohydrates expressed in monosaccharide equivalent (CHOAVLM13)’ is 16 kJ/g (3.75 kcal/g). Why is it different to the energy value of 17 kJ/g (4 kcal/g) used for ‘available carbohydrates as weight (CHOAVL)’ and ‘available carbohydrates by difference (CHOAVLDF)’? Select True or False. (1.5 points: ½ point for each correct response)
True False Reasons for difference in energy conversion factors The energy conversion factor of carbohydrates expressed in monosaccharide equivalent
is 16 kJ/g (3.75 kcal/g), which corresponds to the energy content of monosaccharides. CHOAVL and CHOAVLDF have an energy conversion factor of 17 kJ/g (4 kcal/g)
because most carbohydrates in foods are polysaccharides, which have a energy content of about 17kJ/g.
The resulting energy values of CHOAVL, CHOAVLDF and CHOAVLM are similar because the lower energy conversion factor of 16 kJ/g (3.75 kcal/g) compensates for the higher nutrient value of CHOAVLM per 100 g edible food (owing to the larger amount of residual water around each monosaccharide compared with di- and polysaccharides).
IVc.Q10 In a recommended diet (55-75% carbohydrates, 10-15% protein, 15-30% fat and > 25 g dietary fibre), which nutrient makes the greatest contribution to energy intake? Select the correct answer. (1 point)
Highest energy-yielding nutrient in recommended diet Protein, because its amount is relatively constant in most diets. Fat, because it has the highest energy conversion factor. Carbohydrates, because they represent the highest proportion of the energy-yielding
components. Dietary fibre, because its energy contribution has been recognized recently.
IVc.Q11 As a general rule, energy values are stated as whole numbers, i.e. without decimal places. Select True or False. (1.5 points: ½ point for each correct response)
True False Reason to express energy values without decimal place There is no specific reason. Energy calculation is an approximation of the true energy content of the food and the use
of decimal places in expressing energy values would give a false impression of accuracy. Energy conversion factors do not have decimal places; therefore, energy values do not
have decimal places. IVc.Q12 Which values and additional information should be stored in the reference database for vitamin A and β-carotene equivalents? Select True or False. (2 points: ½ point for each correct response) Note: Vitamin A is commonly defined as retinol equivalent (RE) = mcg retinol + 1/6 mcg β-carotene + 1/12 other carotenes with vitamin A activity (or RE =mcg retinol + 1/6 mcg β-carotene equivalent where β-carotene equivalents = 1 β-carotene + 0.5 α-carotene + 0.5 β-cryptoxanthin). True False Information to be stored in the reference database to calculate vitamin A
Values of vitamin A in RE, retinol and β-carotene equivalent (in mcg) Values of total carotenes (in mcg) Values of β-carotene, α-carotene and β-cryptoxanthin (in mcg) Conversion factors for β-carotene, α-carotene, β-cryptoxanthin and for β-carotene equivalent to
calculate β-carotene equivalent and RE, as well as the formula to calculate β-carotene equivalent and RE, should be stored in the reference database.
13 The abbreviated component names in parenthesis are the INFOODS component identifiers – see Module 4.b.

Module 4.c – Questions
70
IVc.Q13 Indicate the rounding rule that introduces the least bias. Select True or False. (1.5 points: ½ point for each correct response) True False Rounding rule with least bias
Round down if the last number is 0, 1, 2, 3, 4 or 5 (e.g. 1.273 becomes 1.27). Round up if it is 6, 7, 8 or 9 (e.g. 1.278 becomes 1.28).
Round down if the last digit is 0, 1, 2, 3 or 4 (e.g. 1.273 becomes 1.27). Round up if it is 5, 6, 7, 8 or 9 (e.g. 1.278 becomes 1.28).
Round down if the last digit is 0, 1, 2, 3 or 4 (e.g. 1.273 becomes 1.27). Round up if it is 6, 7, 8 or 9 (e.g. 1.278 becomes 1.28). For 5, round down when the number before is even and round up when it is uneven (e.g. 1.245 becomes 1.24 and 1.235 becomes 1.24).
IVc.Q14 When should rounding take place: before or after summing values? Select True or False. (1.5 points: ½ point for each correct response) True False Timing of rounding
Rounding can be done at any time as it does not influence the final value. Rounding should be done after the summation to avoid introducing additional bias. Rounding should be done before the summation to avoid introducing additional bias.
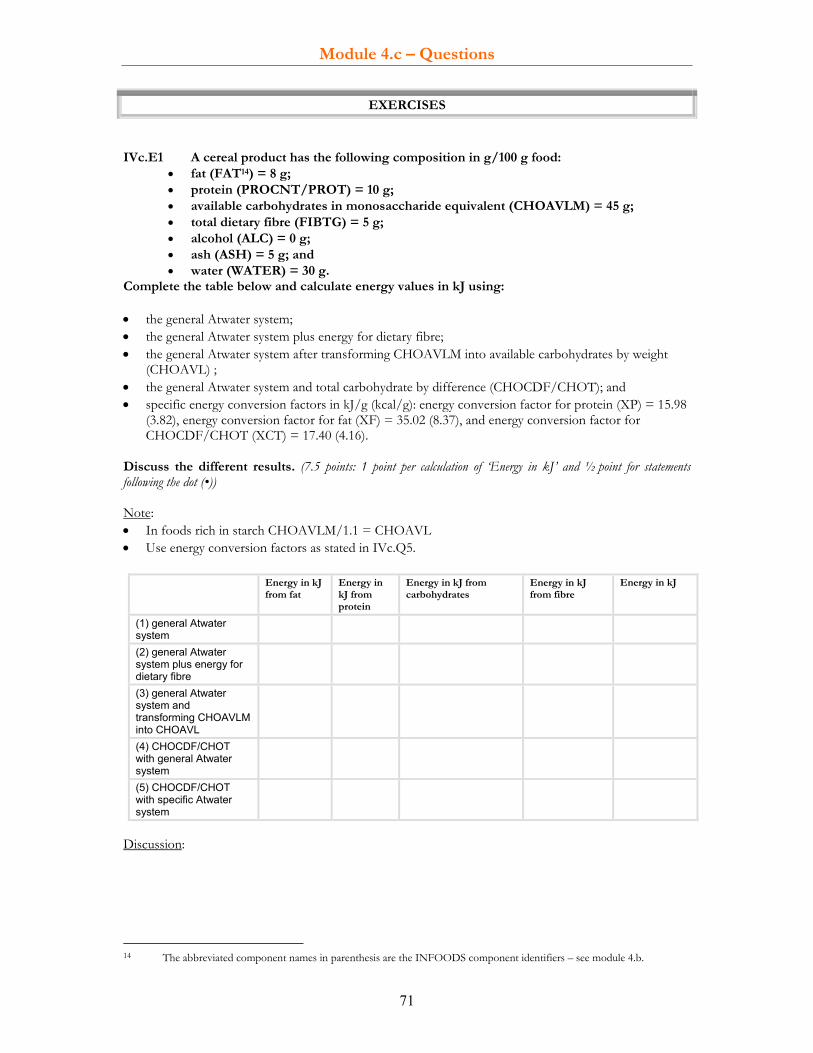
Module 4.c – Questions
71
EXERCISES
IVc.E1 A cereal product has the following composition in g/100 g food:
• fat (FAT14) = 8 g; • protein (PROCNT/PROT) = 10 g; • available carbohydrates in monosaccharide equivalent (CHOAVLM) = 45 g; • total dietary fibre (FIBTG) = 5 g; • alcohol (ALC) = 0 g; • ash (ASH) = 5 g; and • water (WATER) = 30 g.
Complete the table below and calculate energy values in kJ using: • the general Atwater system; • the general Atwater system plus energy for dietary fibre; • the general Atwater system after transforming CHOAVLM into available carbohydrates by weight
(CHOAVL) ; • the general Atwater system and total carbohydrate by difference (CHOCDF/CHOT); and • specific energy conversion factors in kJ/g (kcal/g): energy conversion factor for protein (XP) = 15.98
(3.82), energy conversion factor for fat (XF) = 35.02 (8.37), and energy conversion factor for CHOCDF/CHOT (XCT) = 17.40 (4.16).
Discuss the different results. (7.5 points: 1 point per calculation of ‘Energy in kJ’ and ½ point for statements following the dot (•)) Note: • In foods rich in starch CHOAVLM/1.1 = CHOAVL • Use energy conversion factors as stated in IVc.Q5.
Energy in kJ from fat
Energy in kJ from protein
Energy in kJ from carbohydrates
Energy in kJ from fibre
Energy in kJ
(1) general Atwater system
(2) general Atwater system plus energy for dietary fibre
(3) general Atwater system and transforming CHOAVLM into CHOAVL
(4) CHOCDF/CHOT with general Atwater system
(5) CHOCDF/CHOT with specific Atwater system
Discussion:
14 The abbreviated component names in parenthesis are the INFOODS component identifiers – see module 4.b.
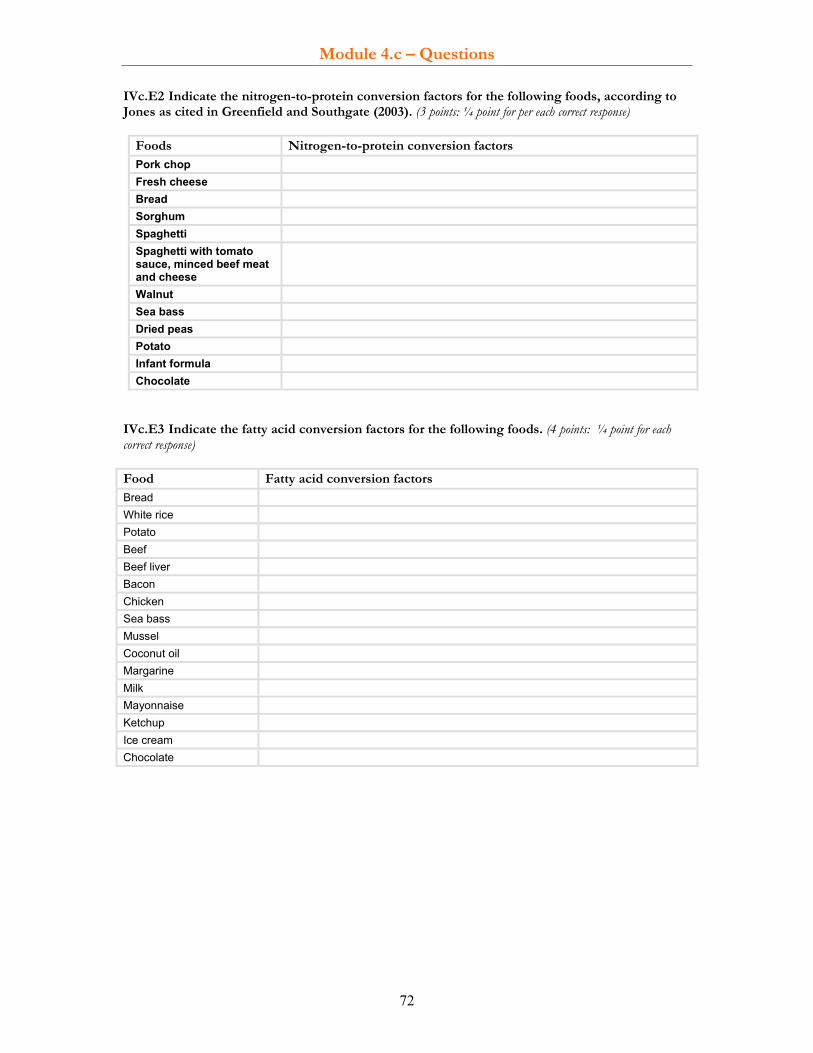
Module 4.c – Questions
72
IVc.E2 Indicate the nitrogen-to-protein conversion factors for the following foods, according to Jones as cited in Greenfield and Southgate (2003). (3 points: ¼ point for per each correct response)
Foods Nitrogen-to-protein conversion factors Pork chop Fresh cheese Bread Sorghum Spaghetti Spaghetti with tomato sauce, minced beef meat and cheese
Walnut Sea bass Dried peas Potato Infant formula Chocolate
IVc.E3 Indicate the fatty acid conversion factors for the following foods. (4 points: ¼ point for each correct response) Food Fatty acid conversion factors Bread White rice Potato Beef Beef liver Bacon Chicken Sea bass Mussel Coconut oil Margarine Milk Mayonnaise Ketchup Ice cream Chocolate

Module 4.c – Questions
73
IVc.E4 The following vitamins include expressions that are calculated. Calculate the nutrient values in the unit and denominator indicated in the table by using the information provided. (20 points: 1 point for each correct calculation) (a) β-carotenes equivalent Values in mcg/100 g edible food except where indicated Red sweet pepper: β-carotene = 3170; α-carotene = 135; β-cryptoxanthin = 1220; α-cryptoxanthin = 10; water 90.4 g/100 g edible food; edible portion 83% Express values as whole numbers with three significant digits. β-carotenes equivalent definitions Nutrient value in mcg/100 g
edible food
= 1 β-carotene + 0.5 α-carotene + 0.5 β-cryptoxanthin
= 1 β-carotene + 0.5 α-carotene + 0.5 β-cryptoxanthin + 0.5 α-cryptoxanthin (b) Vitamin A Values in mcg/100 g dry matter of edible portion except where indicated Kidney, ox, raw: β-carotene equivalent = 2050; retinol = 525; all-trans retinol = 450; 13-cis retinol = 100; retinaldehyde = 0; water = 80 g/100 g edible food; edible portion 88% Express values as whole numbers. Note: All-trans retinol equivalents = all-trans retinol + 0.75 13-cis retinol + 0.90 retinaldehyde (used in United Kingdom)
Vitamin A Nutrient value in mcg/100 g edible food
RE (Retinol equivalent) = mcg retinol + 1/6 mcg β-carotene + 1/12 mcg other provitamin A carotenoids
RE (Retinol equivalent) = mcg retinol + 1/6 mcg β-carotene equivalent
RAE (retinol activity equivalent) = mcg retinol + 1/12 mcg β-carotene + 1/24 mcg other provitamin A carotenoids (USDA, NEVO)
RE = mcg all-trans retinol equivalents + 1/6 mcg β-carotene equivalent (c) Vitamin D Values in mcg/100 g total food except where indicated Sausage, salami, raw: ergocalciferol (vitamin D2) = 0; cholecalciferol (vitamin D3) = 0.306; 25-hydroxycholecalciferol = 0.135; water = 28.7 g/100 g edible food; edible portion 90% Express values with two figures after the decimal place.
Vitamin D definitions Nutrient value in mcg/100 g edible food
= ergocalciferol (vitamin D2) + cholecalciferol (vitamin D3) (used in most food composition databases)
= cholecalciferol (vitamin D3) = Vitamin D2 + D3 + 5 x 25-hydroxycholecalciferol (used in United Kingdom, Denmark)
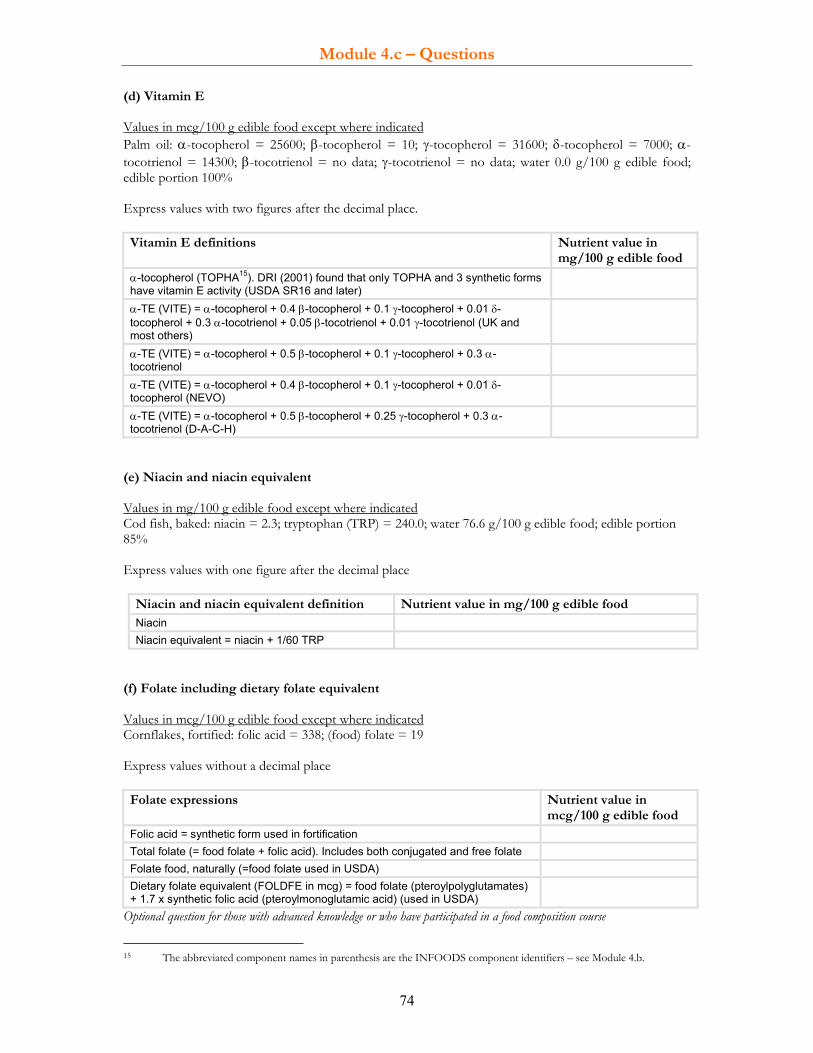
Module 4.c – Questions
74
(d) Vitamin E Values in mcg/100 g edible food except where indicated Palm oil: α-tocopherol = 25600; β-tocopherol = 10; γ-tocopherol = 31600; δ-tocopherol = 7000; α-tocotrienol = 14300; β-tocotrienol = no data; γ-tocotrienol = no data; water 0.0 g/100 g edible food; edible portion 100% Express values with two figures after the decimal place. Vitamin E definitions Nutrient value in
mg/100 g edible food
α-tocopherol (TOPHA15). DRI (2001) found that only TOPHA and 3 synthetic forms have vitamin E activity (USDA SR16 and later)
α-TE (VITE) = α-tocopherol + 0.4 β-tocopherol + 0.1 γ-tocopherol + 0.01 δ-tocopherol + 0.3 α-tocotrienol + 0.05 β-tocotrienol + 0.01 γ-tocotrienol (UK and most others)
α-TE (VITE) = α-tocopherol + 0.5 β-tocopherol + 0.1 γ-tocopherol + 0.3 α-tocotrienol
α-TE (VITE) = α-tocopherol + 0.4 β-tocopherol + 0.1 γ-tocopherol + 0.01 δ-tocopherol (NEVO)
α-TE (VITE) = α-tocopherol + 0.5 β-tocopherol + 0.25 γ-tocopherol + 0.3 α-tocotrienol (D-A-C-H)
(e) Niacin and niacin equivalent Values in mg/100 g edible food except where indicated Cod fish, baked: niacin = 2.3; tryptophan (TRP) = 240.0; water 76.6 g/100 g edible food; edible portion 85% Express values with one figure after the decimal place
Niacin and niacin equivalent definition Nutrient value in mg/100 g edible food Niacin Niacin equivalent = niacin + 1/60 TRP
(f) Folate including dietary folate equivalent Values in mcg/100 g edible food except where indicated Cornflakes, fortified: folic acid = 338; (food) folate = 19 Express values without a decimal place Folate expressions Nutrient value in
mcg/100 g edible food Folic acid = synthetic form used in fortification Total folate (= food folate + folic acid). Includes both conjugated and free folate Folate food, naturally (=food folate used in USDA) Dietary folate equivalent (FOLDFE in mcg) = food folate (pteroylpolyglutamates) + 1.7 x synthetic folic acid (pteroylmonoglutamic acid) (used in USDA)
Optional question for those with advanced knowledge or who have participated in a food composition course
15 The abbreviated component names in parenthesis are the INFOODS component identifiers – see Module 4.b.

Module 4.c – Questions
75
IVc.E5 Available carbohydrates are often defined as the sum of sugars (mono- and disaccharides) and polysaccharides. Glycogen and oligosaccharides are often not included. Indicate the foods for which the exclusion of glycogen and oligosaccharides might result in a significantly lower value of available carbohydrates. Select True or False. (2 points: ½ point for each correct response)
True False Significantly lower value of available carbohydrates due to exclusion of glycogen and oligosaccharides
Liver Legumes Wheat flour Lobster
IVc.E6 The following table shows fatty acid values as a percentage of the sum of fatty acids. Select the food that would have the lowest value for total saturated fatty acids (FASAT) in the food composition database as compared to the true content in the food, if only F4D0, F16D0 and F18D0 were analysed and included in FASAT. (1 point)
Foods FASAT value is the lowest compared to the real composition if only F4D0, F16D0 and F18D0 included
Chicken (flesh only) Cream Duck and skin Edible tallow (beef) Edible tallow (mutton) Egg (chicken)

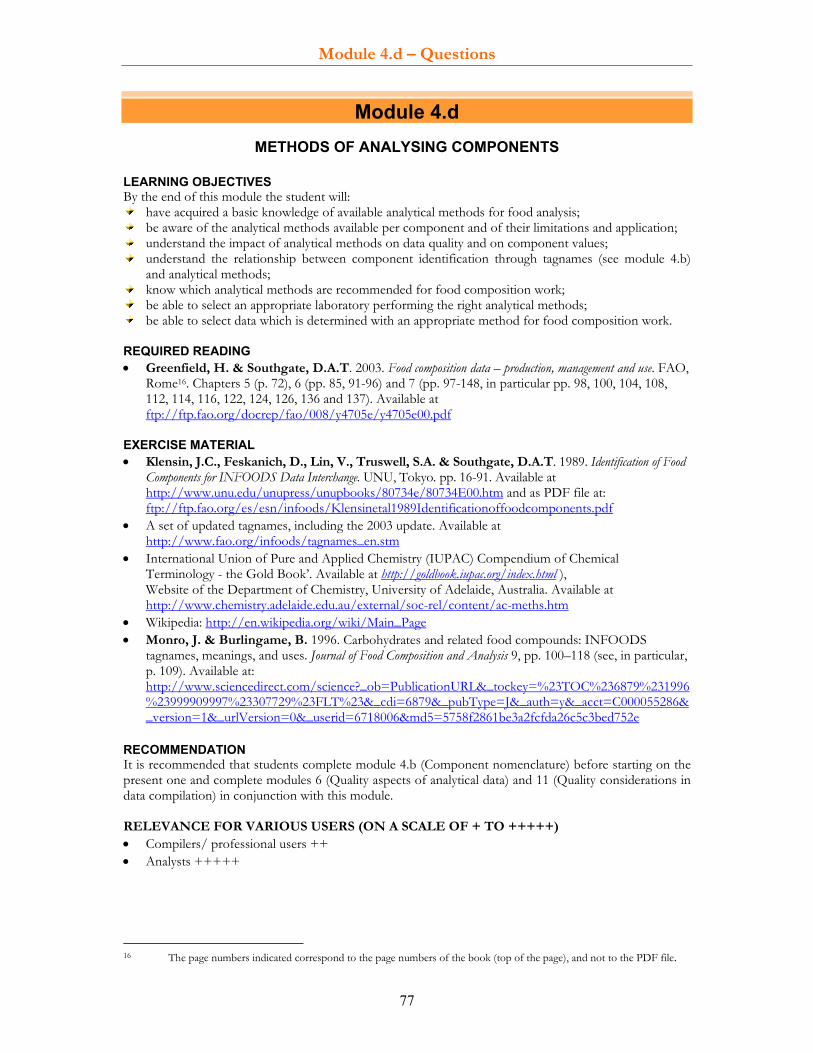
Module 4.d – Questions
77
Module 4.d METHODS OF ANALYSING COMPONENTS
LEARNING OBJECTIVES By the end of this module the student will:
have acquired a basic knowledge of available analytical methods for food analysis; be aware of the analytical methods available per component and of their limitations and application; understand the impact of analytical methods on data quality and on component values; understand the relationship between component identification through tagnames (see module 4.b)
and analytical methods; know which analytical methods are recommended for food composition work; be able to select an appropriate laboratory performing the right analytical methods; be able to select data which is determined with an appropriate method for food composition work.
REQUIRED READING • Greenfield, H. & Southgate, D.A.T. 2003. Food composition data – production, management and use. FAO,
Rome16. Chapters 5 (p. 72), 6 (pp. 85, 91-96) and 7 (pp. 97-148, in particular pp. 98, 100, 104, 108, 112, 114, 116, 122, 124, 126, 136 and 137). Available at ftp://ftp.fao.org/docrep/fao/008/y4705e/y4705e00.pdf
EXERCISE MATERIAL • Klensin, J.C., Feskanich, D., Lin, V., Truswell, S.A. & Southgate, D.A.T. 1989. Identification of Food
Components for INFOODS Data Interchange. UNU, Tokyo. pp. 16-91. Available at http://www.unu.edu/unupress/unupbooks/80734e/80734E00.htm and as PDF file at: ftp://ftp.fao.org/es/esn/infoods/Klensinetal1989Identificationoffoodcomponents.pdf
• A set of updated tagnames, including the 2003 update. Available at http://www.fao.org/infoods/tagnames_en.stm
• International Union of Pure and Applied Chemistry (IUPAC) Compendium of Chemical Terminology - the Gold Book’. Available at http://goldbook.iupac.org/index.html ), Website of the Department of Chemistry, University of Adelaide, Australia. Available at http://www.chemistry.adelaide.edu.au/external/soc-rel/content/ac-meths.htm
• Wikipedia: http://en.wikipedia.org/wiki/Main_Page • Monro, J. & Burlingame, B. 1996. Carbohydrates and related food compounds: INFOODS
tagnames, meanings, and uses. Journal of Food Composition and Analysis 9, pp. 100–118 (see, in particular, p. 109). Available at: http://www.sciencedirect.com/science?_ob=PublicationURL&_tockey=%23TOC%236879%231996%23999909997%23307729%23FLT%23&_cdi=6879&_pubType=J&_auth=y&_acct=C000055286&_version=1&_urlVersion=0&_userid=6718006&md5=5758f2861be3a2fcfda26c5c3bed752e
RECOMMENDATION It is recommended that students complete module 4.b (Component nomenclature) before starting on the present one and complete modules 6 (Quality aspects of analytical data) and 11 (Quality considerations in data compilation) in conjunction with this module. RELEVANCE FOR VARIOUS USERS (ON A SCALE OF + TO +++++) • Compilers/ professional users ++ • Analysts +++++
16 The page numbers indicated correspond to the page numbers of the book (top of the page), and not to the PDF file.

Module 4.d – Questions
78
ESTIMATED TIME TO COMPLETE TASKS • Required reading: 3-8 hours • Answering the questions: 1-4 hours • Completing the exercises: 1-4 hours SUGGESTED ADDITIONAL READING For more detailed information on methods, it is recommended that students consult: • List of essential books for food composition databases (appendix 7, pp. 226-228), in Greenfield &
Southgate (2003) • Association of Analytical Communities (AOAC): recent publications on AOAC methods,
available at http://eoma.aoac.org/ • CEN (European Committee for Standardization) standards: CEN/TC 275 Food analysis - Horizontal
methods, e.g. CEN/TC 275 WG 9 – Vitamins and Carotenoids. Available at http://www.nal.din.de/gremien/CEN%2FTC+275/en/54740484.html
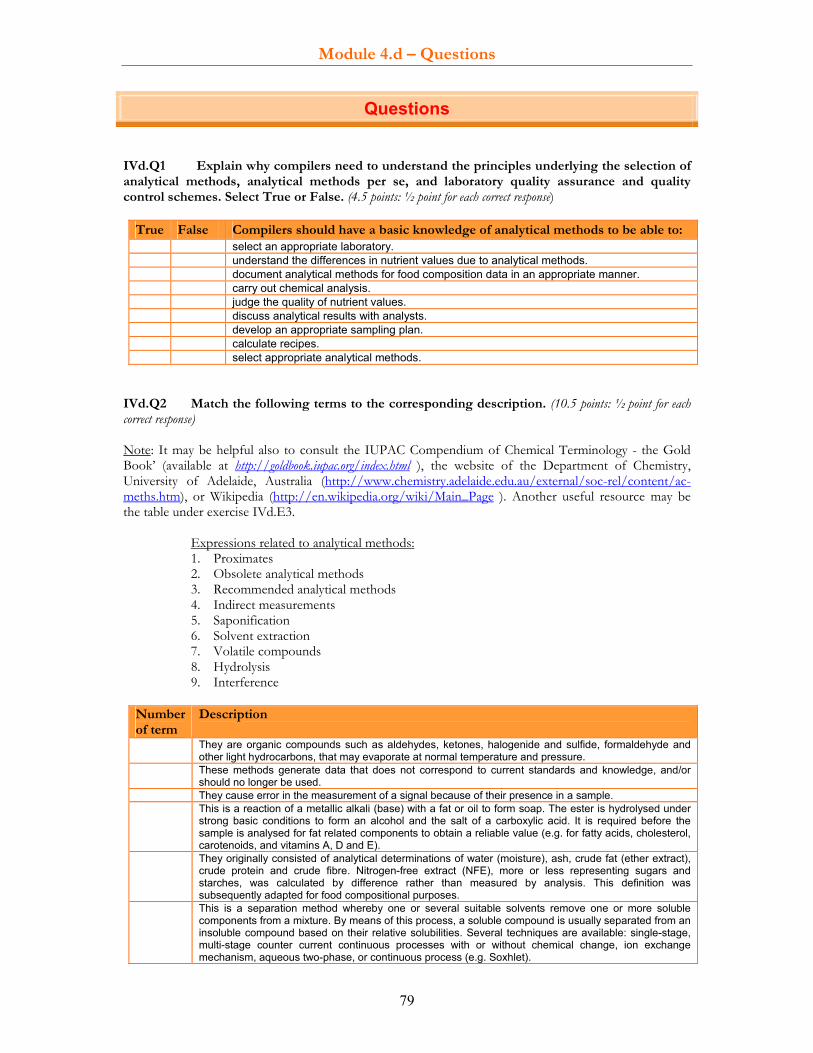
Module 4.d – Questions
79
Questions IVd.Q1 Explain why compilers need to understand the principles underlying the selection of analytical methods, analytical methods per se, and laboratory quality assurance and quality control schemes. Select True or False. (4.5 points: ½ point for each correct response)
True False Compilers should have a basic knowledge of analytical methods to be able to: select an appropriate laboratory. understand the differences in nutrient values due to analytical methods. document analytical methods for food composition data in an appropriate manner. carry out chemical analysis. judge the quality of nutrient values. discuss analytical results with analysts. develop an appropriate sampling plan. calculate recipes. select appropriate analytical methods.
IVd.Q2 Match the following terms to the corresponding description. (10.5 points: ½ point for each correct response) Note: It may be helpful also to consult the IUPAC Compendium of Chemical Terminology - the Gold Book’ (available at http://goldbook.iupac.org/index.html ), the website of the Department of Chemistry, University of Adelaide, Australia (http://www.chemistry.adelaide.edu.au/external/soc-rel/content/ac-meths.htm), or Wikipedia (http://en.wikipedia.org/wiki/Main_Page ). Another useful resource may be the table under exercise IVd.E3.
Expressions related to analytical methods: 1. Proximates 2. Obsolete analytical methods 3. Recommended analytical methods 4. Indirect measurements 5. Saponification 6. Solvent extraction 7. Volatile compounds 8. Hydrolysis 9. Interference
Number of term
Description
They are organic compounds such as aldehydes, ketones, halogenide and sulfide, formaldehyde and other light hydrocarbons, that may evaporate at normal temperature and pressure.
These methods generate data that does not correspond to current standards and knowledge, and/or should no longer be used.
They cause error in the measurement of a signal because of their presence in a sample. This is a reaction of a metallic alkali (base) with a fat or oil to form soap. The ester is hydrolysed under
strong basic conditions to form an alcohol and the salt of a carboxylic acid. It is required before the sample is analysed for fat related components to obtain a reliable value (e.g. for fatty acids, cholesterol, carotenoids, and vitamins A, D and E).
They originally consisted of analytical determinations of water (moisture), ash, crude fat (ether extract), crude protein and crude fibre. Nitrogen-free extract (NFE), more or less representing sugars and starches, was calculated by difference rather than measured by analysis. This definition was subsequently adapted for food compositional purposes.
This is a separation method whereby one or several suitable solvents remove one or more soluble components from a mixture. By means of this process, a soluble compound is usually separated from an insoluble compound based on their relative solubilities. Several techniques are available: single-stage, multi-stage counter current continuous processes with or without chemical change, ion exchange mechanism, aqueous two-phase, or continuous process (e.g. Soxhlet).
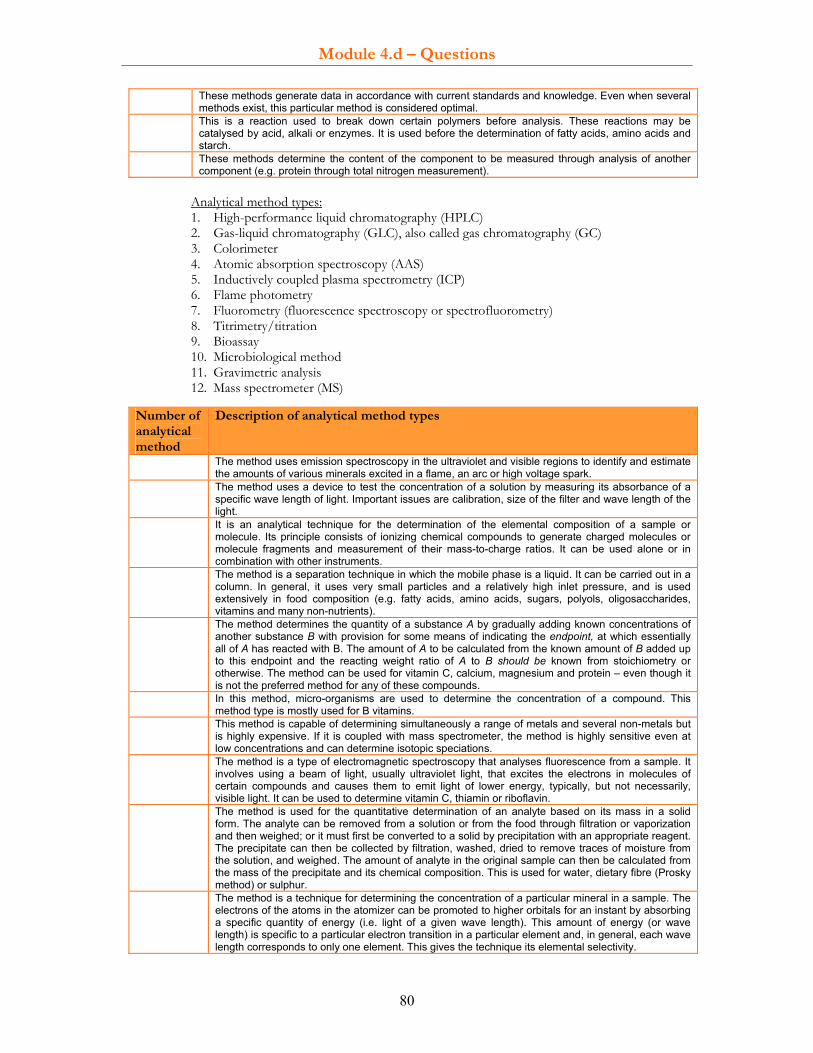
Module 4.d – Questions
80
These methods generate data in accordance with current standards and knowledge. Even when several methods exist, this particular method is considered optimal.
This is a reaction used to break down certain polymers before analysis. These reactions may be catalysed by acid, alkali or enzymes. It is used before the determination of fatty acids, amino acids and starch.
These methods determine the content of the component to be measured through analysis of another component (e.g. protein through total nitrogen measurement).
Analytical method types: 1. High-performance liquid chromatography (HPLC) 2. Gas-liquid chromatography (GLC), also called gas chromatography (GC) 3. Colorimeter 4. Atomic absorption spectroscopy (AAS) 5. Inductively coupled plasma spectrometry (ICP) 6. Flame photometry 7. Fluorometry (fluorescence spectroscopy or spectrofluorometry) 8. Titrimetry/titration 9. Bioassay 10. Microbiological method 11. Gravimetric analysis 12. Mass spectrometer (MS)
Number of analytical method
Description of analytical method types
The method uses emission spectroscopy in the ultraviolet and visible regions to identify and estimate the amounts of various minerals excited in a flame, an arc or high voltage spark.
The method uses a device to test the concentration of a solution by measuring its absorbance of a specific wave length of light. Important issues are calibration, size of the filter and wave length of the light.
It is an analytical technique for the determination of the elemental composition of a sample or molecule. Its principle consists of ionizing chemical compounds to generate charged molecules or molecule fragments and measurement of their mass-to-charge ratios. It can be used alone or in combination with other instruments.
The method is a separation technique in which the mobile phase is a liquid. It can be carried out in a column. In general, it uses very small particles and a relatively high inlet pressure, and is used extensively in food composition (e.g. fatty acids, amino acids, sugars, polyols, oligosaccharides, vitamins and many non-nutrients).
The method determines the quantity of a substance A by gradually adding known concentrations of another substance B with provision for some means of indicating the endpoint, at which essentially all of A has reacted with B. The amount of A to be calculated from the known amount of B added up to this endpoint and the reacting weight ratio of A to B should be known from stoichiometry or otherwise. The method can be used for vitamin C, calcium, magnesium and protein – even though it is not the preferred method for any of these compounds.
In this method, micro-organisms are used to determine the concentration of a compound. This method type is mostly used for B vitamins.
This method is capable of determining simultaneously a range of metals and several non-metals but is highly expensive. If it is coupled with mass spectrometer, the method is highly sensitive even at low concentrations and can determine isotopic speciations.
The method is a type of electromagnetic spectroscopy that analyses fluorescence from a sample. It involves using a beam of light, usually ultraviolet light, that excites the electrons in molecules of certain compounds and causes them to emit light of lower energy, typically, but not necessarily, visible light. It can be used to determine vitamin C, thiamin or riboflavin.
The method is used for the quantitative determination of an analyte based on its mass in a solid form. The analyte can be removed from a solution or from the food through filtration or vaporization and then weighed; or it must first be converted to a solid by precipitation with an appropriate reagent. The precipitate can then be collected by filtration, washed, dried to remove traces of moisture from the solution, and weighed. The amount of analyte in the original sample can then be calculated from the mass of the precipitate and its chemical composition. This is used for water, dietary fibre (Prosky method) or sulphur.
The method is a technique for determining the concentration of a particular mineral in a sample. The electrons of the atoms in the atomizer can be promoted to higher orbitals for an instant by absorbing a specific quantity of energy (i.e. light of a given wave length). This amount of energy (or wave length) is specific to a particular electron transition in a particular element and, in general, each wave length corresponds to only one element. This gives the technique its elemental selectivity.

Module 4.d – Questions
81
Number of analytical method
Description of analytical method types
The method is a procedure for determining the concentration or quality or activity of a substance (e.g. vitamin, amino acids) by measuring its effect on an organism or tissue compared with a standard preparation. It has been used to determine vitamin activities (vitamins A, D and E) and is still used for protein quality (e.g. PER, NPU).
The method is a type of chromatography in which the mobile phase is a carrier gas, usually an inert gas such as helium or an unreactive gas such as nitrogen. The stationary phase is a microscopic layer of liquid or polymer on an inert solid support inside a column. The interactions of these gaseous analytes with the walls of the column (coated by different stationary phases) cause different compounds to elute at different times, called retention time. The comparison of these retention times is the analytical power of this technique, which is used, for example, in the analysis of fatty acids, alcohol, sugars, polyols, oligosaccharides, iodine, and vitamins D, E and C.
IVd.Q3 The main purpose of analytical methods is to separate, identify and quantify compounds. From the following list select the one which is not a principle for separating compounds for analysis. (1 point)
Not a principle for separation of compounds for analysis Solubility Polarity Volatility Function in the human body
IVd.Q4 One way of ascertaining whether methods provide comparable results is to look up the number of INFOODS tagnames for the same component. Select True or False. (2 points: ½ point for each correct response) Note: See introduction of Klensin et al. (1989), available at: http://www.unu.edu/unupress/unupbooks/80734e/80734E00.htm and the INFOODS website with updated tagnames at http://www.fao.org/infoods/tagnames_en.stm
True False Relation between number of tagnames and comparability of analytical methods
Food components for which the different analytical methods give significantly different results have the same tagname.
Component values of the same tagname are comparable; those of different tagnames are not comparable.
Rational methods, i.e. different analytical methods generating similar results, have one tagname. For components with rational methods, the compiler/user may use the values without investigating analytical methods.
Empirical methods, i.e. different analytical methods generating significantly different results, have several tagnames. For these methods the analyst, compiler and user should know which analytical method is recommended for food composition work and which analytical methods provide compatible results.
IVd.Q5 If for the same component, several tagnames exist, it means that either the expression is different (e.g. carbohydrates) or that there are several analytical methods (e.g. fibre) leading to significantly different values. Indicate for the nutrients in the following table (1) whether methods provide comparable results, (2) if there are several tagnames, and (3) if there are different calculations and expressions. Select Yes or No. (42 points: ½ point for each correct response) Note: See Klensin et al. (1989), available at: http://www.unu.edu/unupress/unupbooks/80734e/80734E00.htm and the INFOODS website with updated tagnames at http://www.fao.org/infoods/tagnames_en.stm

Module 4.d – Questions
82
Food component names
Do methods give comparable
results?17 Yes/No
Are there several tagnames? Yes/No
Do different calculations or
expressions exist? Yes/No
Water Total fat Individual fatty acids (FA) --- Fractions of FAs, e.g. saturated fatty acids --- ---
Cholesterol Protein Total nitrogen Individual amino acids --- Individual sugars --- Sugar Individual polyols --- Oligosaccharides Starch Dietary fibres Resistant starch --- --- Alcohol (ethylalcohol or ethanol) Inorganic constituents ---
Retinol Carotenes/ Carotenoids --- Vitamin A (activity) Vitamin D Vitamin E Vitamin K Vitamin C Thiamin Riboflavin Niacin Vitamin B6 Folate(s) Panthothenic acid Biotin
Vita
min
s
Vitamin B12 IVd.Q6 Which nutrient should always be analysed? (1 point) IVd.Q7 Which analytical method may provide non-comparable water values? Select the correct response. (1 point)
Analytical method that may provide non-comparable water values Freeze-drying Oven-drying Microwave oven-drying Dean and Stark distillation
For learners with advanced knowledge IVd.Q8 The classical analytical method for alcohol is distillation. Name the two other methods for measuring alcohol. Indicate one advantage of each method compared with the classical method. (2 points: 1 point for each correct response) 1. 2.
17 This question aims to identify components for which the results depend on method performance, i.e. the ability of the
method to measure the specific component(s) contributing to the nutrient.

Module 4.d – Questions
83
For learners with advanced knowledge IVd.Q9 Select the principles and advantages/disadvantages corresponding to the Kjeldahl or the Dumas method. (3 points: ½ point for each correct response) Principles and advantages/disadvantages Kjeldahl
method Dumas method
It measures the total nitrogen as nitrogen gas after a complete combustion of the food.
Measures the total nitrogen in the food by decomposition of organic samples using concentrated acid solution in presence of a catalyst, adding excess base to the acid digestion to convert ammonium to ammonia followed by boiling and condensation of the ammonia gas in the receiving solution. This is titrated to quantify the amount of nitrogen.
It has high costs. It is environment-friendly. It needs a fume hood. It provides separate values for total nitrogen and non-protein nitrogen.
IVd.Q10 Different empirical analytical methods generate different nutrient values for the same component in the same food. See the example of crude vs. dietary fibre (NSP) in the table below. Indicate the impact of the two methods on fibre intake, adequacy and requirement. Select True or False. (2.5 points: ½ point for each correct response)
Foodstuff Crude fibre (g) Dietary fibre (g) Cereals and millets Rice 0.2 4.1-8.3 Wheat 1.2 11.4-17.2 Sorghum 1.6 9.7-14.3 Bajra 1.6 11.8-20.3 Ragi 3.6 11.5-18.6 Pulses and legumes Green gram (whole) 4.1 15.2 Green gram (dhal) 0.8 13.5 Green gram (dhal) 0.9 14.3 Red gram (dhal) 1.5 14.1 Bengal gram (whole) 3.9 26.6 Bengal gram (dhal) 1.2 13.6 Nuts and oil seeds Groundnut 3.1 6.1 Coconut (dry) 6.6 8.9 Roots and tubers Sweet potato 0.8 7.3 Potato 0.4 4.0 Yam 0.8 5.3 Fruits Banana 0.4 2.5 Mango 0.7 2.3 Vegetables Amaranth 1.0 3.4 Palak 0.6 5.0 Brinjal 1.3 2.0 Ridge gourd 0.5 5.7 Snake gourd 0.8 1.8 Bottle gourd 0.6 2.8 Yellow pumpkin 0.7 0.5
Source: Modified from Rao, 200318
18 Rao, B. N., 2003. Bioactive phytochemicals in Indian foods and their potential in health promotion and disease prevention. Asia Pacific J Clin Nutr 2003: 12 (1): 9-22

Module 4.d – Questions
84
True False Impact of the two methods on fibre intake estimations, adequacy and requirement
For some nutrients (e.g. analysed with empirical methods) the analytical method used influences the percentage of the population reaching dietary adequacy.
There is little impact on the fibre intake estimations because the fibre content in foods is low.
The recommended daily intake (RDI) for fibre might be too low if based on the mean fibre intake of the population, calculated with crude fibre values.
Erroneous decisions may have been taken in nutrition and health programmes because of inadequate nutrient values in the food composition table - probably determined by an inadequate method.
Only recommended analytical methods should be used in food composition databases to allow for better estimation of nutrient intakes and of dietary adequacy/inadequacy.
For learners with advanced knowledge IVd.Q11 When amino acids are analysed, acid hydrolysis leads to a loss of some amino acids. Name the five amino acids that are partially or completely degraded or lost in acid condition. (2.5 points: ½ point for each correct response) Completely degraded or lost with acid hydrolysis: Partially degraded or lost with acid hydrolysis: For learners with advanced knowledge IVd.Q12 How can the concentration of these five amino acids be determined? (3 points: 1 point for each correct response following (•)) IVd.Q13 What are the important considerations for fat analysis? Select True or False. (2 points: ½ point for each correct response) True False Important considerations for fat analysis
The continuous extraction method (Soxhlet method) is recommended for food composition and applicable to all foods.
Check that acid hydrolysis is carried out before the fat determination (if not, depending on the food matrix, the fat value may be too low).
The Soxhlet method provides values that are too low for cereal-based foods. It may, however, be used for non-cereal-based foods.
Extracts from the Soxhlet method may be used for fatty acid analyses. IVd.Q14 The value of ‘total fat’ is higher, lower than, or equal to the sum of fatty acids? Select the correct answer. (1 point)
Value of ‘total fat’ compared to the sum of fatty acids The analytical value of ‘total fat’ is higher than the sum of fatty acids because the fat value
includes glycerol, phospholipids and unsaponifiable components such as sterols. These components are not included in the sum of fatty acids.
The analytical value of ‘total fat’ is lower than the sum of fatty acids because of the fatty acid conversion factor.
The analytical value of ‘total fat’ is the same as the sum of fatty acids because the individual fatty acids are summed up to build the total fat value.

Module 4.d – Questions
85
IVd.Q15 The analysis of vitamins presents a challenge for analysts. Indicate the correct statements on vitamin analysis. Select True or False. (3 points: ½ point for each correct response)
True False Challenges in vitamin analysis As some vitamins are sensitive to light, protection from visible and UV light is
necessary in sample preparation and analysis. Vitamins can be oxidized very rapidly. Therefore, protection is necessary, e.g. addition
of antioxidants or a rapid analysis after sample preparation. Heating can lead to a vitamin isomerization and therefore losses. All analytical methods for vitamins capture all isomers, vitamers and those bound to
other components. Ideally, analysis of vitamins should be able to measure individual vitamers or
components and their vitamin activity separately, if appropriate. The analysis of vitamins should capture interfering substances that have no vitamin
activity. For learners with advanced knowledge IVd.Q16 For B vitamins, which methods have been developed in addition to the existing microbiological assays and colorimetric methods, and for which reason? (2 points: 1 point for each correct response following (•)) For learners with advanced knowledge IVd.Q17 Some analytical methods may be purpose-driven (targeted analysis vs. screening). Are the analytical methods for nutrients in foods, as recommended by Codex Alimentarius, always those used for food composition purposes? Select the correct statement. (1 point) Note: See the Codex Alimentarius document available at: http://www.codexalimentarius.net/download/standards/388/CXS_234e.pdf
True False Analytical method used in food composition are the same as those recommended by Codex
Yes, because laboratories use the same analytical methods for all purposes. No, because the methods recommended by Codex are mostly used to check products’
conformity to current legislation. They do not always need to be as precise as those needed for food composition data.
No, because food-quality control has higher requirements for analytical work than food composition programmes.
IVd.Q18 When analytical data are generated with a recommended analytical method, is the value always of good quality? Select True or False. (1.5 points: ½ point for each correct response)
True False Quality of component value generated with a recommended analytical method
All laboratories can perform the recommended analytical method and produced reliable, good-quality analytical data.
When the recommended analytical methods represent the determination step of the analytical procedure, then the separation, extraction, preparation and calculation steps (if applicable) should also be considered when evaluating the analytical value and its quality.
Some laboratories modify the standard procedure of the recommended analytical method. These modifications do not need to be considered because they do not influence the value or its quality.
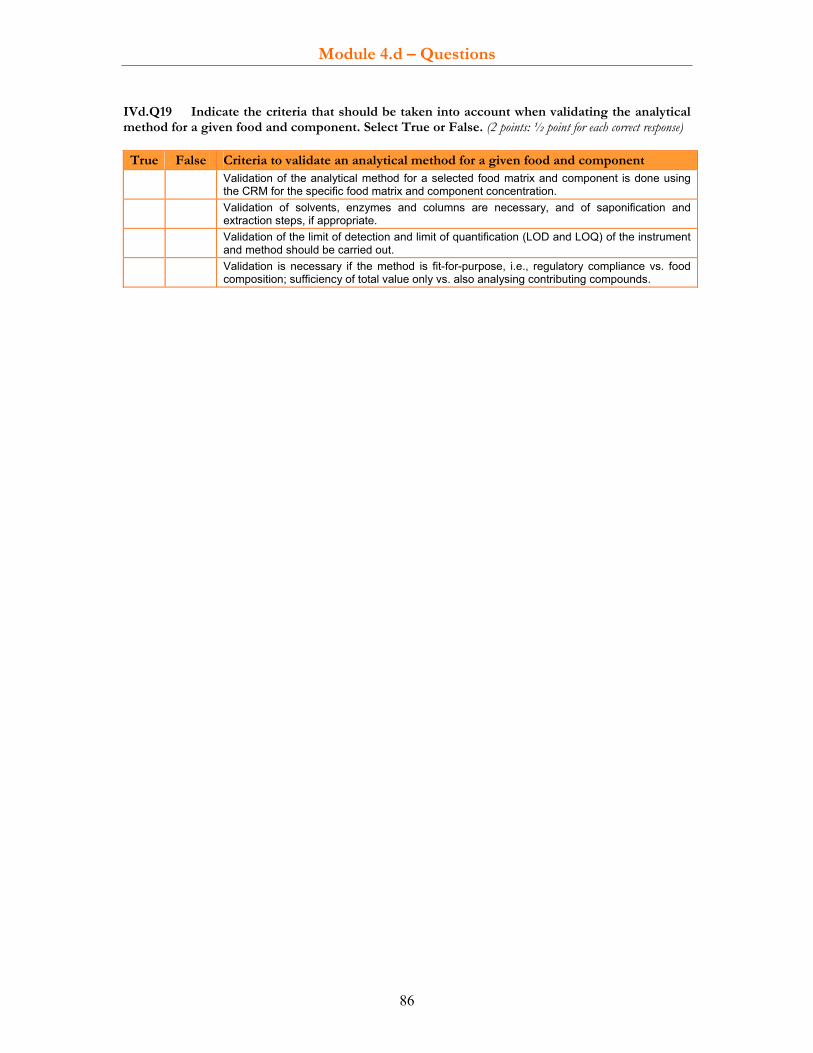
Module 4.d – Questions
86
IVd.Q19 Indicate the criteria that should be taken into account when validating the analytical method for a given food and component. Select True or False. (2 points: ½ point for each correct response) True False Criteria to validate an analytical method for a given food and component
Validation of the analytical method for a selected food matrix and component is done using the CRM for the specific food matrix and component concentration.
Validation of solvents, enzymes and columns are necessary, and of saponification and extraction steps, if appropriate.
Validation of the limit of detection and limit of quantification (LOD and LOQ) of the instrument and method should be carried out.
Validation is necessary if the method is fit-for-purpose, i.e., regulatory compliance vs. food composition; sufficiency of total value only vs. also analysing contributing compounds.

Module 4.d – Questions
87
EXERCISES
For learners with advanced knowledge IVd.E1 Complete the figure on the principles of measuring carbohydrates and dietary fibre using the following words: (6.5 points: ½ point for each correct response)
• ash • protein • nitrogen • lipid components • NSP • lignin • NSP - Englyst method • Total dietary fibre - AOAC Prosky method • free sugars • glucose • monosaccharides • starch • resistant starch
Food sample (dried and finely divided, and defatted if high fat content)
↓ Extract with 80% v/v aqueous alcohol (extracts ..................) → Use extract to measure ..................
↓ Hydrolyse starch enzymatically and precipitate NSP with 80% v/v alcohol → Measure .................. to estimate ..................
↓ Filter and wash residue (includes, ash, .................., .................., .................., .................. etc)
→ Hydrolyse with acid, measure component ..................
↓ ↓ Weigh residue .................. ↓ Measure .................. and .................. ↓ Deduct from residue weight → ..................
IVd.E2 Match the following tagnames to the inclusion of the different dietary fibre compounds: FIBC, FIBAD, FIBTS, FIBTG, PSACNS/NSP, FIBND. (3 points: ½ point for each correct response) Note: See Greenfield & Southgate, 2003, p. 109 of Monro and Burlingame (1996), available at: http://www.sciencedirect.com/science?_ob=PublicationURL&_tockey=%23TOC%236879%231996%23999909997%23307729%23FLT%23&_cdi=6879&_pubType=J&_auth=y&_acct=C000055286&_version=1&_urlVersion=0&_userid=6718006&md5=5758f2861be3a2fcfda26c5c3bed752e or FAO (2003) p. 26 in PDF file at ftp://ftp.fao.org/docrep/fao/006/y5022e/y5022e00.pdf or Klensin et al. (1989) p. 84 in the PDF file.
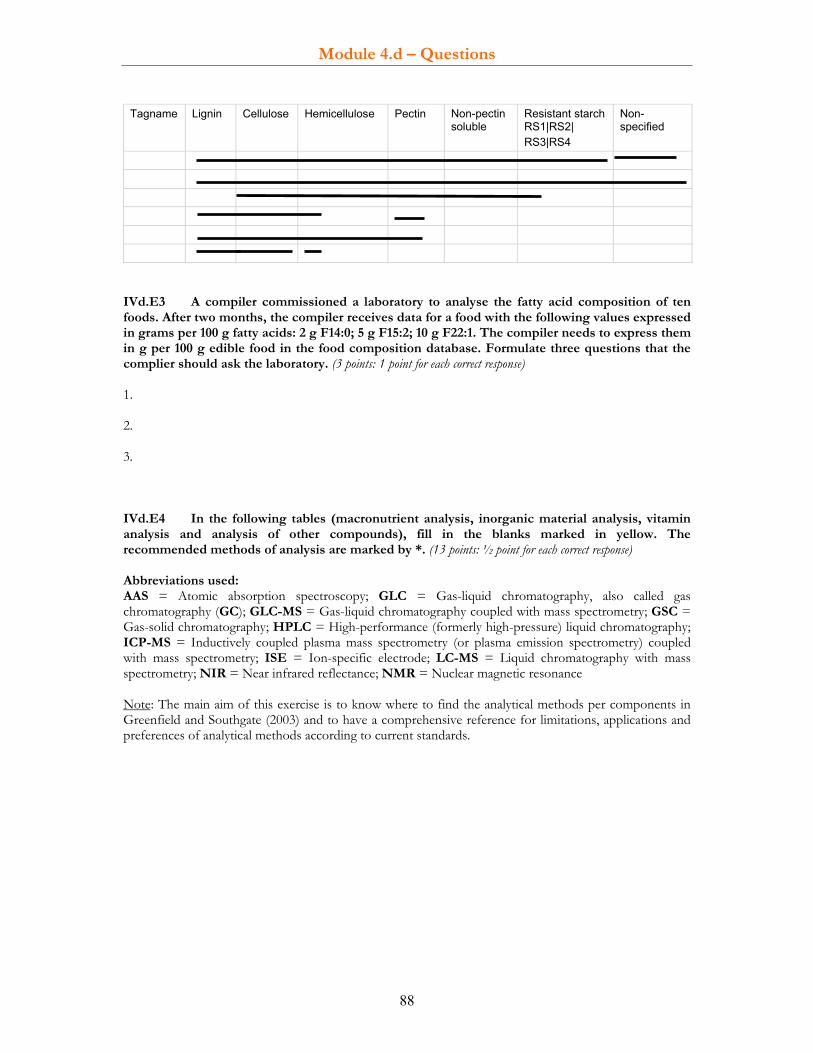
Module 4.d – Questions
88
Tagname Lignin Cellulose Hemicellulose Pectin Non-pectin
soluble Resistant starch RS1|RS2| RS3|RS4
Non-specified
IVd.E3 A compiler commissioned a laboratory to analyse the fatty acid composition of ten foods. After two months, the compiler receives data for a food with the following values expressed in grams per 100 g fatty acids: 2 g F14:0; 5 g F15:2; 10 g F22:1. The compiler needs to express them in g per 100 g edible food in the food composition database. Formulate three questions that the complier should ask the laboratory. (3 points: 1 point for each correct response) 1. 2. 3. IVd.E4 In the following tables (macronutrient analysis, inorganic material analysis, vitamin analysis and analysis of other compounds), fill in the blanks marked in yellow. The recommended methods of analysis are marked by *. (13 points: ½ point for each correct response) Abbreviations used: AAS = Atomic absorption spectroscopy; GLC = Gas-liquid chromatography, also called gas chromatography (GC); GLC-MS = Gas-liquid chromatography coupled with mass spectrometry; GSC = Gas-solid chromatography; HPLC = High-performance (formerly high-pressure) liquid chromatography; ICP-MS = Inductively coupled plasma mass spectrometry (or plasma emission spectrometry) coupled with mass spectrometry; ISE = Ion-specific electrode; LC-MS = Liquid chromatography with mass spectrometry; NIR = Near infrared reflectance; NMR = Nuclear magnetic resonance Note: The main aim of this exercise is to know where to find the analytical methods per components in Greenfield and Southgate (2003) and to have a comprehensive reference for limitations, applications and preferences of analytical methods according to current standards.

Module 4.d – Questions
89
Macronutrient analysis Food component
Available method of analysis Limitation Application
Air oven* ......... This method is applicable to all foods at 60˚C. At 100˚C, it is applicable to all foods except those rich in fat and sugar
Vacuum oven* Loss of volatiles
.........* Slow. Care must be taken to avoid residual water in samples Applicable to most foods
Microwave oven Charring Applicable to medium- or high-moisture foods only
Dean and Stark distillation Safety of solvents used Applicable to foods high in volatiles*
Karl Fisher Applicable to low-moisture, hygroscopic foods
Physical methods (NMR, NIR) High cost and needs calibration for each food group
NMR is applicable to most foods. NIR is only established for cereals and some other foods
Water (moisture)
Chromatography (GLC, GSC) High cost GLC is applicable to meat and meat products only. GSC is applicable only to some meat products
Continuous extraction (single solvent, also called Soxhlet) Time consuming. ......... Applicable to low-moisture foods and non-
cereal foods
Acid hydrolysis Some hydrolysis of lipids. Extracts cannot be used for fatty acid studies
Applicable to all foods except dairy and high-sugar products
Acid hydrolysis and capillary GLC High cost. This method is NLEA-compliant Applicable for most foods
.........* Complete extraction from most foods. Extract often needs clean-up
Applicable to most foods and extract can be used for fatty acid analysis
Alkaline hydrolysis Validated for dairy foods only
Total fat
NIR High cost. Requires extensive calibration against other methods Established only for cereals
HPLC High cost
......... * Moderate to high cost Applicable to all foods. If used for trans fatty acids, capillary techniques are required Fatty acids
Infrared absorption (for trans fatty acids) High cost. Some interference Applicable to all foods
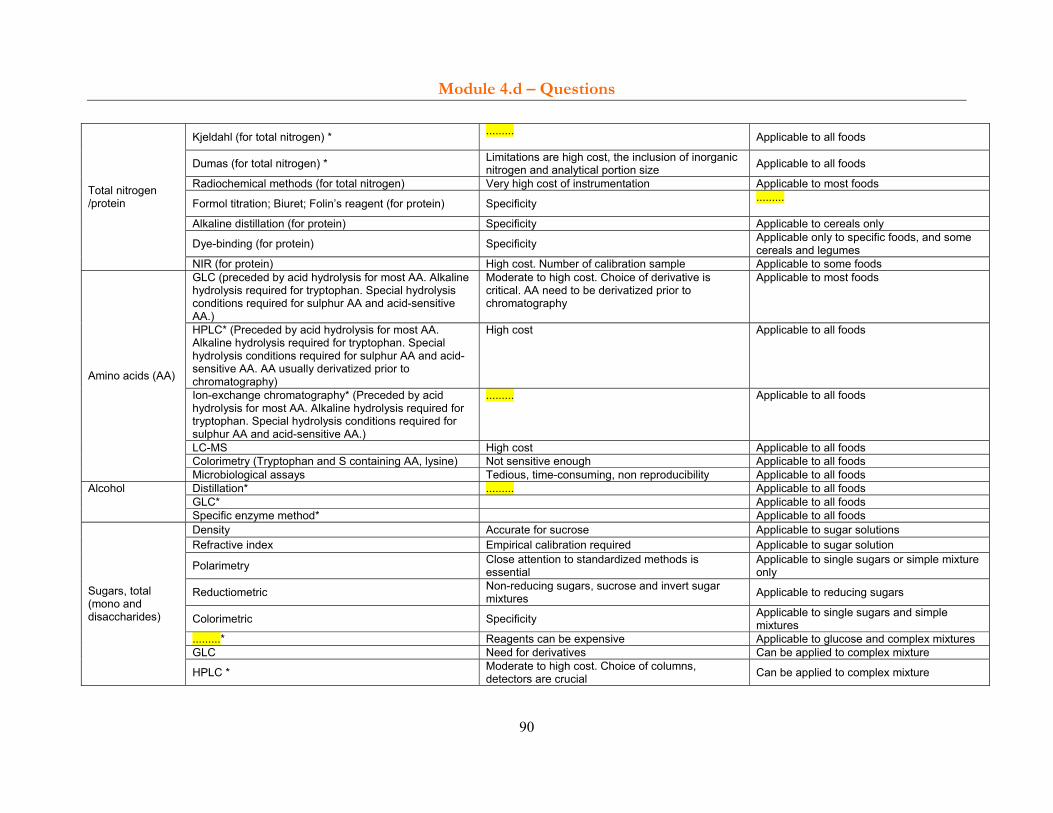
Module 4.d – Questions
90
Kjeldahl (for total nitrogen) * ......... Applicable to all foods
Dumas (for total nitrogen) * Limitations are high cost, the inclusion of inorganic nitrogen and analytical portion size Applicable to all foods
Radiochemical methods (for total nitrogen) Very high cost of instrumentation Applicable to most foods
Formol titration; Biuret; Folin’s reagent (for protein) Specificity .........
Alkaline distillation (for protein) Specificity Applicable to cereals only
Dye-binding (for protein) Specificity Applicable only to specific foods, and some cereals and legumes
Total nitrogen /protein
NIR (for protein) High cost. Number of calibration sample Applicable to some foods GLC (preceded by acid hydrolysis for most AA. Alkaline hydrolysis required for tryptophan. Special hydrolysis conditions required for sulphur AA and acid-sensitive AA.)
Moderate to high cost. Choice of derivative is critical. AA need to be derivatized prior to chromatography
Applicable to most foods
HPLC* (Preceded by acid hydrolysis for most AA. Alkaline hydrolysis required for tryptophan. Special hydrolysis conditions required for sulphur AA and acid-sensitive AA. AA usually derivatized prior to chromatography)
High cost Applicable to all foods
Ion-exchange chromatography* (Preceded by acid hydrolysis for most AA. Alkaline hydrolysis required for tryptophan. Special hydrolysis conditions required for sulphur AA and acid-sensitive AA.)
......... Applicable to all foods
LC-MS High cost Applicable to all foods Colorimetry (Tryptophan and S containing AA, lysine) Not sensitive enough Applicable to all foods
Amino acids (AA)
Microbiological assays Tedious, time-consuming, non reproducibility Applicable to all foods Distillation* ......... Applicable to all foods GLC* Applicable to all foods
Alcohol
Specific enzyme method* Applicable to all foods Density Accurate for sucrose Applicable to sugar solutions Refractive index Empirical calibration required Applicable to sugar solution
Polarimetry Close attention to standardized methods is essential
Applicable to single sugars or simple mixture only
Reductiometric Non-reducing sugars, sucrose and invert sugar mixtures Applicable to reducing sugars
Colorimetric Specificity Applicable to single sugars and simple mixtures
.........* Reagents can be expensive Applicable to glucose and complex mixtures GLC Need for derivatives Can be applied to complex mixture
Sugars, total (mono and disaccharides)
HPLC * Moderate to high cost. Choice of columns, detectors are crucial Can be applied to complex mixture
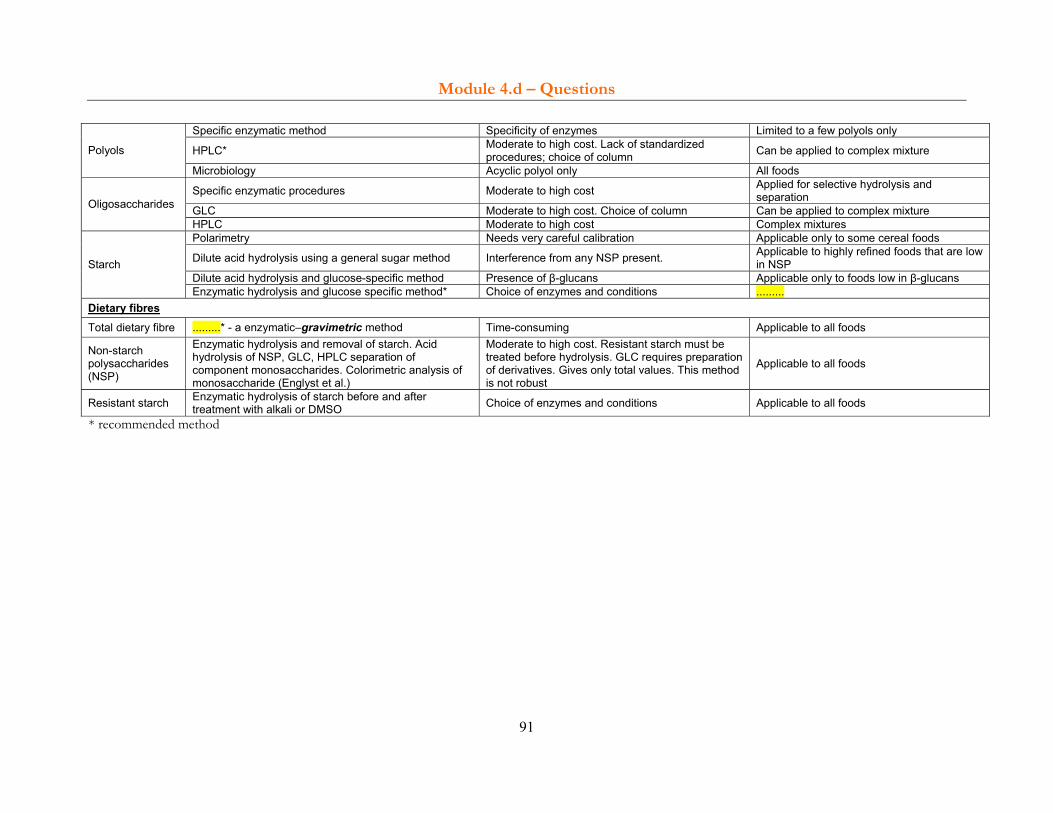
Module 4.d – Questions
91
Specific enzymatic method Specificity of enzymes Limited to a few polyols only
HPLC* Moderate to high cost. Lack of standardized procedures; choice of column Can be applied to complex mixture Polyols
Microbiology Acyclic polyol only All foods
Specific enzymatic procedures Moderate to high cost Applied for selective hydrolysis and separation
GLC Moderate to high cost. Choice of column Can be applied to complex mixture Oligosaccharides
HPLC Moderate to high cost Complex mixtures Polarimetry Needs very careful calibration Applicable only to some cereal foods
Dilute acid hydrolysis using a general sugar method Interference from any NSP present. Applicable to highly refined foods that are low in NSP
Dilute acid hydrolysis and glucose-specific method Presence of β-glucans Applicable only to foods low in β-glucans Starch
Enzymatic hydrolysis and glucose specific method* Choice of enzymes and conditions ......... Dietary fibres Total dietary fibre .........* - a enzymatic–gravimetric method Time-consuming Applicable to all foods
Non-starch polysaccharides (NSP)
Enzymatic hydrolysis and removal of starch. Acid hydrolysis of NSP, GLC, HPLC separation of component monosaccharides. Colorimetric analysis of monosaccharide (Englyst et al.)
Moderate to high cost. Resistant starch must be treated before hydrolysis. GLC requires preparation of derivatives. Gives only total values. This method is not robust
Applicable to all foods
Resistant starch Enzymatic hydrolysis of starch before and after treatment with alkali or DMSO Choice of enzymes and conditions Applicable to all foods
* recommended method
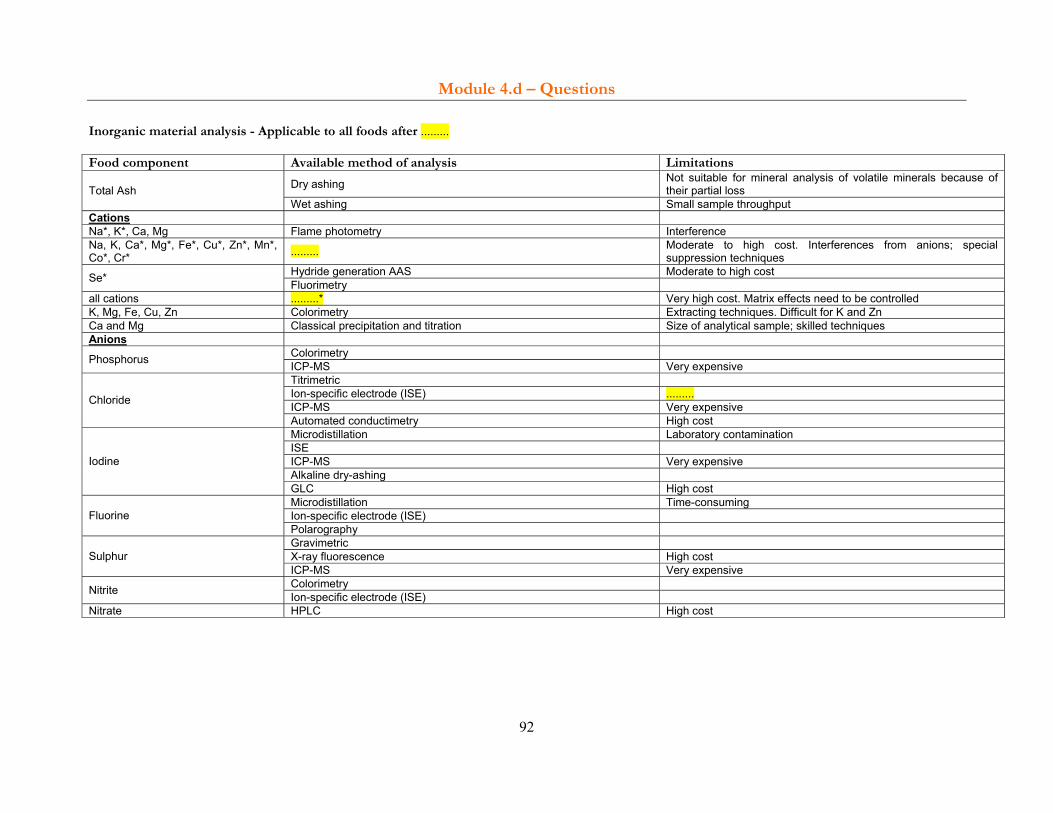
Module 4.d – Questions
92
Inorganic material analysis - Applicable to all foods after ......... Food component Available method of analysis Limitations
Dry ashing Not suitable for mineral analysis of volatile minerals because of their partial loss Total Ash
Wet ashing Small sample throughput Cations Na*, K*, Ca, Mg Flame photometry Interference Na, K, Ca*, Mg*, Fe*, Cu*, Zn*, Mn*, Co*, Cr* ......... Moderate to high cost. Interferences from anions; special
suppression techniques Hydride generation AAS Moderate to high cost Se* Fluorimetry
all cations .........* Very high cost. Matrix effects need to be controlled K, Mg, Fe, Cu, Zn Colorimetry Extracting techniques. Difficult for K and Zn Ca and Mg Classical precipitation and titration Size of analytical sample; skilled techniques Anions
Colorimetry Phosphorus ICP-MS Very expensive Titrimetric Ion-specific electrode (ISE) ......... ICP-MS Very expensive Chloride
Automated conductimetry High cost Microdistillation Laboratory contamination ISE ICP-MS Very expensive Alkaline dry-ashing
Iodine
GLC High cost Microdistillation Time-consuming Ion-specific electrode (ISE) Fluorine Polarography Gravimetric X-ray fluorescence High cost Sulphur ICP-MS Very expensive Colorimetry Nitrite Ion-specific electrode (ISE)
Nitrate HPLC High cost
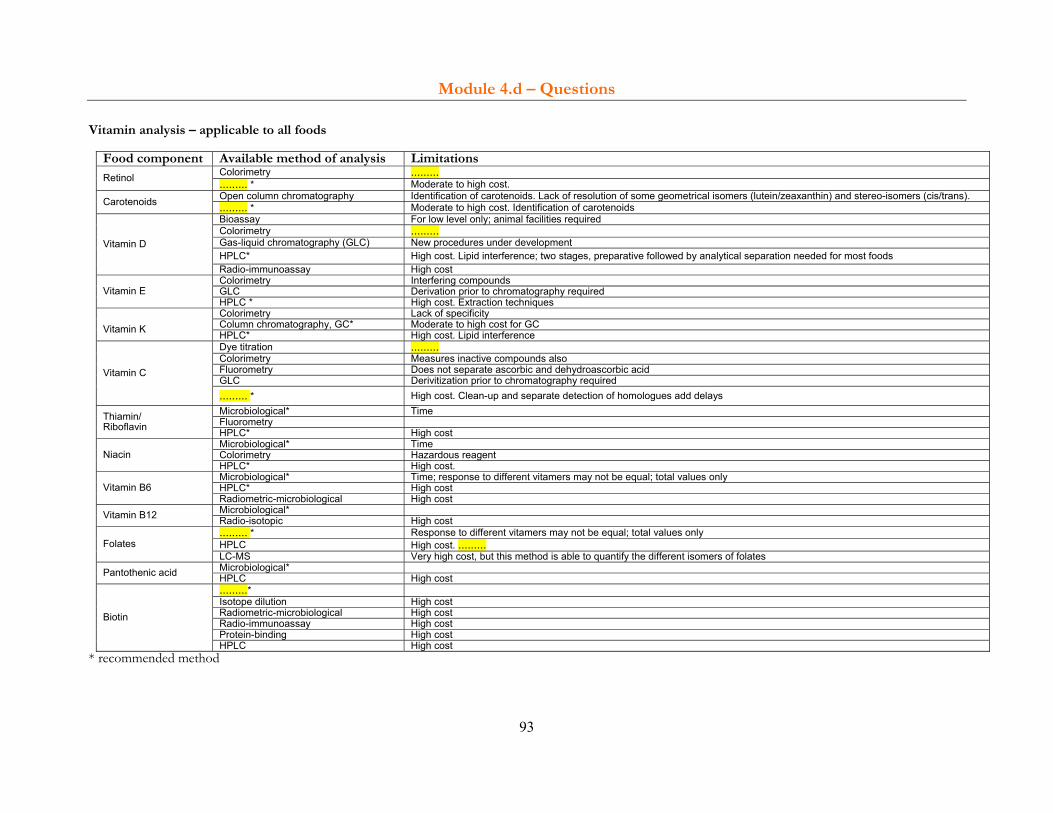
Module 4.d – Questions
93
Vitamin analysis – applicable to all foods
Food component Available method of analysis Limitations Colorimetry ......... Retinol ......... * Moderate to high cost. Open column chromatography Identification of carotenoids. Lack of resolution of some geometrical isomers (lutein/zeaxanthin) and stereo-isomers (cis/trans). Carotenoids ......... * Moderate to high cost. Identification of carotenoids Bioassay For low level only; animal facilities required Colorimetry ......... Gas-liquid chromatography (GLC) New procedures under development HPLC* High cost. Lipid interference; two stages, preparative followed by analytical separation needed for most foods
Vitamin D
Radio-immunoassay High cost Colorimetry Interfering compounds GLC Derivation prior to chromatography required Vitamin E HPLC * High cost. Extraction techniques Colorimetry Lack of specificity Column chromatography, GC* Moderate to high cost for GC
Vitamin K HPLC* High cost. Lipid interference Dye titration ......... Colorimetry Measures inactive compounds also Fluorometry Does not separate ascorbic and dehydroascorbic acid GLC Derivitization prior to chromatography required
Vitamin C
......... * High cost. Clean-up and separate detection of homologues add delays Microbiological* Time Fluorometry Thiamin/
Riboflavin HPLC* High cost Microbiological* Time Colorimetry Hazardous reagent Niacin HPLC* High cost. Microbiological* Time; response to different vitamers may not be equal; total values only HPLC* High cost Vitamin B6 Radiometric-microbiological High cost Microbiological* Vitamin B12 Radio-isotopic High cost ......... * Response to different vitamers may not be equal; total values only HPLC High cost. ......... Folates LC-MS Very high cost, but this method is able to quantify the different isomers of folates Microbiological* Pantothenic acid HPLC High cost .........* Isotope dilution High cost Radiometric-microbiological High cost Radio-immunoassay High cost Protein-binding High cost
Biotin
HPLC High cost * recommended method

Module 4.d – Questions
94
Analysis of other components Food component Available method of analysis Limitations
RBC agglutination Not all blood samples of one animal species will react in an identical manner owing to the existence of several blood groups. Agglutination dilution test semi-quantitative
Spectrophotometric methods Hemagglutinins/Lectins
Radioactive labelling of lectin molecules Requires specialized handling Anion exchange Inability to resolve inositol phosphates adequately HPLC High cost GLC Detects derivatize volatile inositol phosphate forms only after separation by ion-exchange chromatography Capillary electrophoresis Not applicable to all foods
Phytic acid
NMR-MS High costs. Specialized application Capillary electrophoresis Not good for low oxalate content <1.8 mg/100 g. Meant for routine monitoring Ion chromatography High running cost GLC Some forms of oxalate are difficult to methylate; high instrument cost Enzymatic Not applicable to all foods Colorimetry (AOAC) Interference from other acids
Oxalates
HPLC High cost UV-Spectrometry Vanillin HCL reagent Parameters like extraction time, temperature, vanillin and HCL concentration need to be strictly controlled UV-Spectrometry Folin-Denis reagent Non-specific as they can react with any phenol present in plant tissue UV-Spectrometry Prussian blue reagent Non-specific as they can react with any phenol present in plant tissue, qualitative test HPLC Modest success for smaller compounds of derived tannins
Tannins (grouped into condensed tannins also called proanthocyanidins, hydrolysable and derived tannins)
Colorimetry Limited to basic compounds of hydrolysable tannins
Spectrophotometric method Not suitable for determination of medicagenic acid for which titrimetric method for the quantitative determination of this aglycone content has to be employed
Bioassays Saponins
HPLC Identification of individual saponins Colorimetric Does not differentiate between the different protease inhibitors
Trypsin inhibitor ELISA method using monoclonal antibodies derived from mice
......... Sample hydrolysis required for optimum resolution and quantisation of quercetin, kaempferol, myricetin, luteolin and apigenin. Separate extraction without hydrolysis required for analysis of anthocyanidins and flavan-3-ols Flavonoids
LC-MS Hydrolysis not required as long as masses of individual flavonoid conjugates differ by more than mass resolution of mass spectrometer
HPLC Complex conjugates, and their numbers may be difficult to resolve with some reversed-phase columns and simple mobile-phase programs (isocratic) Isoflavones1 and
coumestrol LC-MS Hydrolysis not required as long as masses of individual conjugates differ by more than mass resolution of mass spectrometer
HPLC Isolariciresinol, pinoresinol, secoisolariciresinol and matairesinol Lignans GLC-MS Only for matairesinol, secoisolariciresinol and shonanin in foods as trimethylsylyl derivatives 1 Isoflavones are a subclass of flavonoids but because they have different and unique biological activities than other subclasses of flavonoids, they are analysed and compiled as a separate group
Module 5 – Questions
95
Module 5 SAMPLING
LEARNING OBJECTIVES By the end of this module the student will:
understand the principles of sampling, sampling protocols, sample collection and transportation, sample handling in the laboratory and documentation,
understand specific sampling aspects for food biodiversity purposes; be aware of potential errors in nutrient values caused by incorrect sampling; grasp the importance of sampling as a data-quality issue; be able to develop a simple sampling plan.
REQUIRED READING • Annor, G. A. Sampling of food for analysis. PowerPoint Presentation. Available at:
http://www.fao.org/infoods/presentations_en.stm • Annor, G. A. Sample collection, handling and preparation. PowerPoint Presentation. Available at:
http://www.fao.org/infoods/presentations_en.stm • Charrondière, U.R. ‘Sampling’, available at: http://www.fao.org/infoods/presentations_en.stm and if possible: • Greenfield, H. & Southgate, D.A.T. 2003. Food composition data – production, management and use. FAO.
Rome. Chapters 1 (pp. 26–2819) and 5 (pp. 63–82), and appendices 2 (pp. 214–215) and 3 (pp. 216–220). Available at: ftp://ftp.fao.org/docrep/fao/008/y4705e/y4705e00.pdf
SUGGESTED ADDITIONAL READING • Codex Alimentarius. 2004. General Guidelines on Sampling. CAC/GL 50. pp.8-29. Available at:
http://www.codexalimentarius.net/web/standard_list.do?lang=en; RELEVANCE FOR VARIOUS USERS (ON A SCALE OF + TO +++++) • Compilers +++++ • Professional users + • Analysts +++++ ESTIMATED TIME TO COMPLETE TASKS • Required reading: 1–3 hours • Answering the questions: 1–3 hours • Completing the exercises: 1–3 hours
19 The page numbers indicated correspond to the page numbers of the book (top of the page), and not to the PDF file.

Module 5 – Questions
96
Questions V.Q1 What is the purpose of sampling within a food composition context? Select True or False. (2.5 points: ½ point for each correct response)
Objectives of sampling True False To identify the one food sample to represent the entire food supply To collect representative samples of foods in the food supply To compare different diets in different countries To generate comprehensive and representative compositional data for specific foods
To show the variability of nutrient values in foods V.Q2 From the following list, indicate the characteristics of a food that contribute to variability in nutrient composition. Select True or False. (5.5 points: ½ point for each correct response)
Characteristics contributing to variability in nutrient composition
True False
Geography and season Part of the food Maturity Package size Cultivar, variety and breed Brand names Batches Fortification level Colour Fat and water content Preparation and processing method
V.Q3 Match the food sampling terms to the correct definitions. (6 points: ½ point for each correct response) Note: It may be helpful also to consult the Codex document CAC/GL 50 pp. 8-29; available at: http://www.codexalimentarius.net/web/standard_list.do?lang=en. Terms:
1. Stratified sampling 2. Random sampling 3. Primary food sample 4. Composite food sample 5. Unit 6. Analytical portion 7. Laboratory sample 8. Convenience sampling 9. Reduced food sample 10. Analytical sample 11. Selective sampling 12. Batch/lot
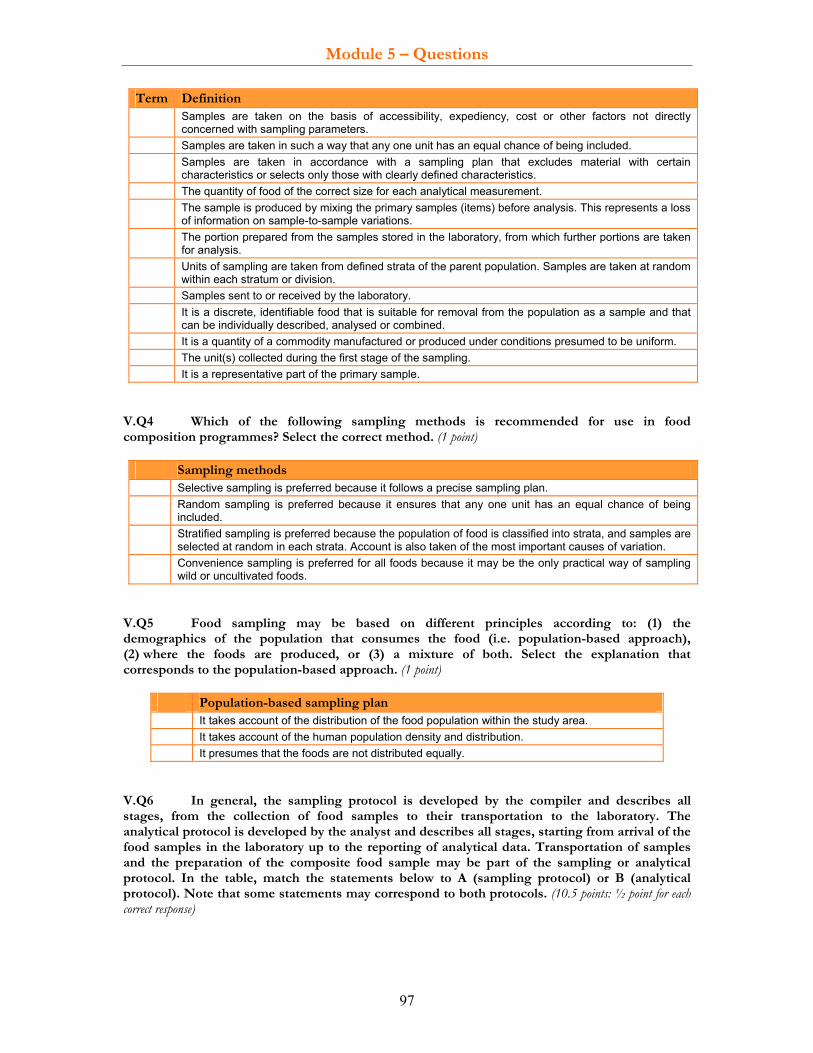
Module 5 – Questions
97
Term Definition Samples are taken on the basis of accessibility, expediency, cost or other factors not directly
concerned with sampling parameters. Samples are taken in such a way that any one unit has an equal chance of being included. Samples are taken in accordance with a sampling plan that excludes material with certain
characteristics or selects only those with clearly defined characteristics. The quantity of food of the correct size for each analytical measurement. The sample is produced by mixing the primary samples (items) before analysis. This represents a loss
of information on sample-to-sample variations. The portion prepared from the samples stored in the laboratory, from which further portions are taken
for analysis. Units of sampling are taken from defined strata of the parent population. Samples are taken at random
within each stratum or division. Samples sent to or received by the laboratory. It is a discrete, identifiable food that is suitable for removal from the population as a sample and that
can be individually described, analysed or combined. It is a quantity of a commodity manufactured or produced under conditions presumed to be uniform. The unit(s) collected during the first stage of the sampling. It is a representative part of the primary sample.
V.Q4 Which of the following sampling methods is recommended for use in food composition programmes? Select the correct method. (1 point)
Sampling methods Selective sampling is preferred because it follows a precise sampling plan. Random sampling is preferred because it ensures that any one unit has an equal chance of being
included. Stratified sampling is preferred because the population of food is classified into strata, and samples are
selected at random in each strata. Account is also taken of the most important causes of variation. Convenience sampling is preferred for all foods because it may be the only practical way of sampling
wild or uncultivated foods. V.Q5 Food sampling may be based on different principles according to: (1) the demographics of the population that consumes the food (i.e. population-based approach), (2) where the foods are produced, or (3) a mixture of both. Select the explanation that corresponds to the population-based approach. (1 point)
Population-based sampling plan It takes account of the distribution of the food population within the study area. It takes account of the human population density and distribution. It presumes that the foods are not distributed equally.
V.Q6 In general, the sampling protocol is developed by the compiler and describes all stages, from the collection of food samples to their transportation to the laboratory. The analytical protocol is developed by the analyst and describes all stages, starting from arrival of the food samples in the laboratory up to the reporting of analytical data. Transportation of samples and the preparation of the composite food sample may be part of the sampling or analytical protocol. In the table, match the statements below to A (sampling protocol) or B (analytical protocol). Note that some statements may correspond to both protocols. (10.5 points: ½ point for each correct response)

Module 5 – Questions
98
A Sampling protocol B Analytical protocol
Information It is based on general knowledge of the foods, e.g. food group, seasonal availability, market share. It is based on information on how foods are produced, processed, distributed and consumed. It describes laboratory equipment and facilities. It describes procedures to process food samples. It describes how many units of foods are to be collected. It describes how food samples are transported from collection sites to the laboratory. It describes storage conditions at the laboratory. It describes the laboratory staff. It describes possible sites for sample collection. It describes methods for analysing nutrients. It describes measures for ensuring the personal security of samplers. It describes the appropriate division of sampling areas into sampling units. It describes procedures for storing food samples prior to being sent to the laboratory. It describes the time schedule for transporting the food samples from collection sites to the laboratory. It describes how long the food samples are stored before being sent to the laboratory. It describes how the samplers are paid. It describes how long laboratory samples are stored. It describes the laboratory’s quality assurance and quality control system. It lists the nutrients to be analysed, including water. It describes training activities. It includes budget allocations.
V.Q7 Indicate the reasons for compilers and analysts to collaborate in the development and implementation of the sampling and analytical protocol. Select True or False. (3 points: ½ point each correct response)
Why compilers and analysts should collaborate in developing and implementing the sampling and analytical programme
True False
To benefit from integrated planning and budgeting (e.g. to estimate required resources) because sampling and analysis are linked to each other
To ensure better method performance To ensure better data quality, representativeness and documentation To ensure that sampling sites are close to the laboratory To ensure a smooth process, from sampling to analysis (e.g. effective sample transportation and sample handling; proper sample storage time/capacity/temperature)
To ensure that sampling and analyses are carried out in a way so that similar foods or foods of the same food groups are collected and analysed at the same time. This facilitates analysis because of their similar food matrix and concentrations (i.e. easier for calibration, reference material, etc)

Module 5 – Questions
99
V.Q8 Indicate the characteristics of a good sampling plan/frame/protocol. Select True or False. (5 points: ½ point for each correct response)
Characteristics of a good sampling plan/frame/protocol: True False provides a detailed description of the sampling process to be undertaken. is a precise, well-documented protocol written after completion of the sampling process.
describes the sampling type and its particular design. is written with the objective of ensuring that no significant changes in composition occur between collection and analysis.
lists several possible sampling methods per food sample, leaving the final choice to the sample collector.
defines the number and size of samples. is always written under contract. is based on a clear understanding of the food populations studied. describes any changes in food composition between collection and analysis. defines the sampling sites.
V.Q9 Match the following expressions to the corresponding description. (1.5 points: ½ point for each correct response)
Expressions: 1. Number of food samples collected 2. Number of analytical samples (sample size) 3. Number of replicates
Expression Description
The number of food samples analysed. A food sample may contain several foods collected at different sample sites and in different seasons. This number is reported as the number of samples in food composition tables (i.e. ‘n’).
The number of analytical repetitions of the same analytical sample to estimate the analytical variability of the method. Analyses made in duplicate means that the same analytical sample was analysed twice; analyses made in triplicate means that the same analytical sample was analysed three times. This number is reported separately and is not indicative of the number of food samples involved.
The number of food units initially taken from the total food population. V.Q10 What is the formula for calculating an adequate sample size, taking account of possible variations of nutrients in the food and of expected accuracy? (1 point) V.Q11 As a rule of thumb, how many foods should be composited into one food sample in general, and for United States’ labelling legislation in particular? What should be the minimum number of analytical samples per food, especially if the results are to be published in peer reviewed journals? (1.5 points: ½ point for each correct response following the dot (•))
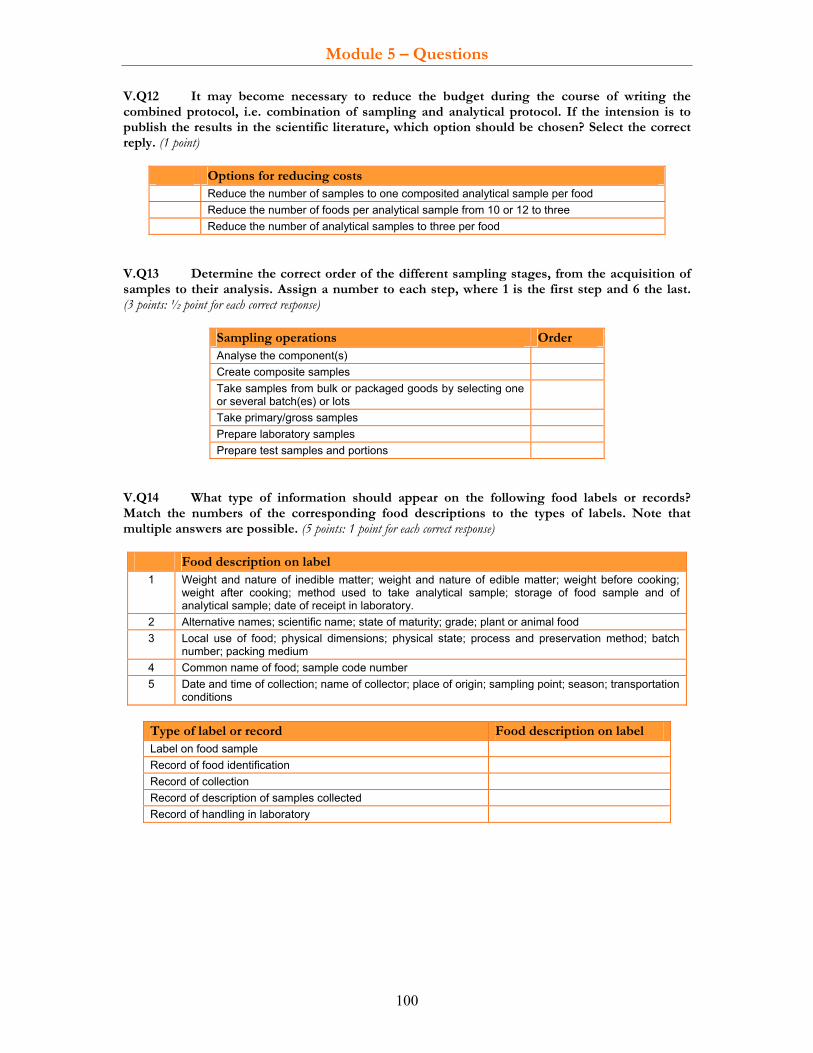
Module 5 – Questions
100
V.Q12 It may become necessary to reduce the budget during the course of writing the combined protocol, i.e. combination of sampling and analytical protocol. If the intension is to publish the results in the scientific literature, which option should be chosen? Select the correct reply. (1 point)
Options for reducing costs Reduce the number of samples to one composited analytical sample per food Reduce the number of foods per analytical sample from 10 or 12 to three Reduce the number of analytical samples to three per food
V.Q13 Determine the correct order of the different sampling stages, from the acquisition of samples to their analysis. Assign a number to each step, where 1 is the first step and 6 the last. (3 points: ½ point for each correct response)
Sampling operations Order Analyse the component(s) Create composite samples Take samples from bulk or packaged goods by selecting one or several batch(es) or lots
Take primary/gross samples Prepare laboratory samples Prepare test samples and portions
V.Q14 What type of information should appear on the following food labels or records? Match the numbers of the corresponding food descriptions to the types of labels. Note that multiple answers are possible. (5 points: 1 point for each correct response)
Food description on label 1 Weight and nature of inedible matter; weight and nature of edible matter; weight before cooking;
weight after cooking; method used to take analytical sample; storage of food sample and of analytical sample; date of receipt in laboratory.
2 Alternative names; scientific name; state of maturity; grade; plant or animal food 3 Local use of food; physical dimensions; physical state; process and preservation method; batch
number; packing medium 4 Common name of food; sample code number 5 Date and time of collection; name of collector; place of origin; sampling point; season; transportation
conditions
Type of label or record Food description on label Label on food sample Record of food identification Record of collection Record of description of samples collected Record of handling in laboratory
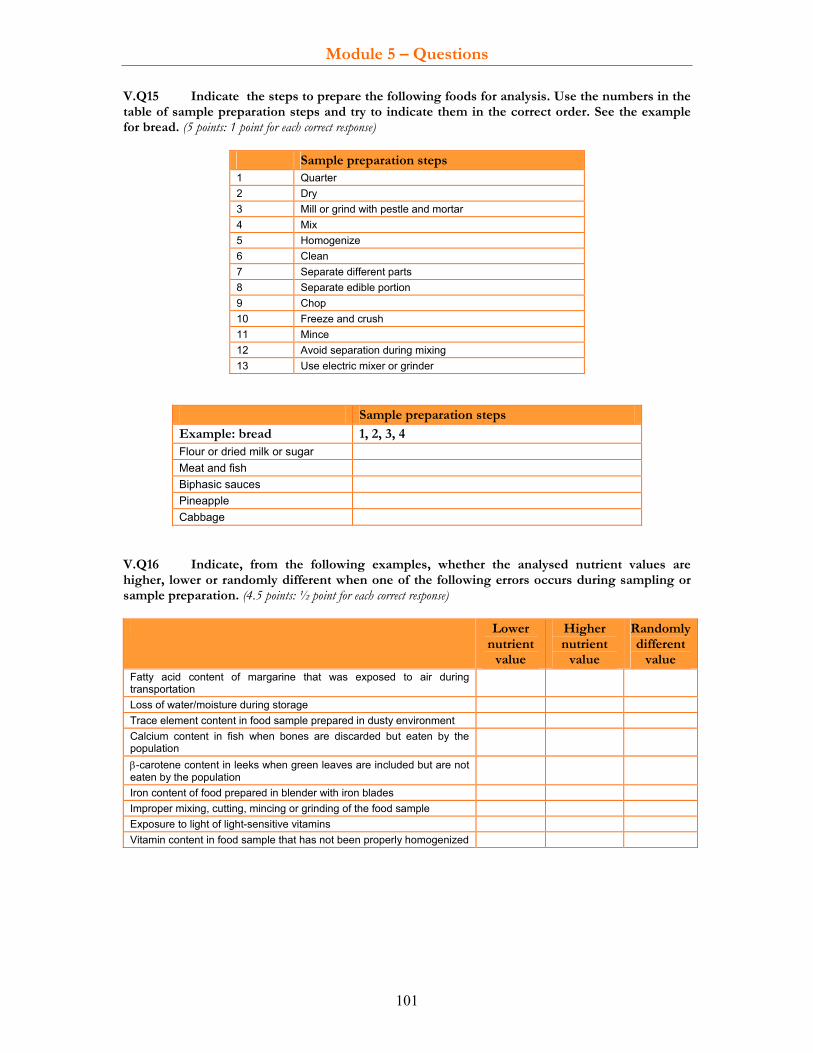
Module 5 – Questions
101
V.Q15 Indicate the steps to prepare the following foods for analysis. Use the numbers in the table of sample preparation steps and try to indicate them in the correct order. See the example for bread. (5 points: 1 point for each correct response)
Sample preparation steps 1 Quarter 2 Dry 3 Mill or grind with pestle and mortar 4 Mix 5 Homogenize 6 Clean 7 Separate different parts 8 Separate edible portion 9 Chop 10 Freeze and crush 11 Mince 12 Avoid separation during mixing 13 Use electric mixer or grinder
Sample preparation steps
Example: bread 1, 2, 3, 4 Flour or dried milk or sugar Meat and fish Biphasic sauces Pineapple Cabbage
V.Q16 Indicate, from the following examples, whether the analysed nutrient values are higher, lower or randomly different when one of the following errors occurs during sampling or sample preparation. (4.5 points: ½ point for each correct response)
Lower nutrient
value
Higher nutrient
value
Randomly different
value Fatty acid content of margarine that was exposed to air during transportation
Loss of water/moisture during storage Trace element content in food sample prepared in dusty environment Calcium content in fish when bones are discarded but eaten by the population
β-carotene content in leeks when green leaves are included but are not eaten by the population
Iron content of food prepared in blender with iron blades Improper mixing, cutting, mincing or grinding of the food sample Exposure to light of light-sensitive vitamins Vitamin content in food sample that has not been properly homogenized
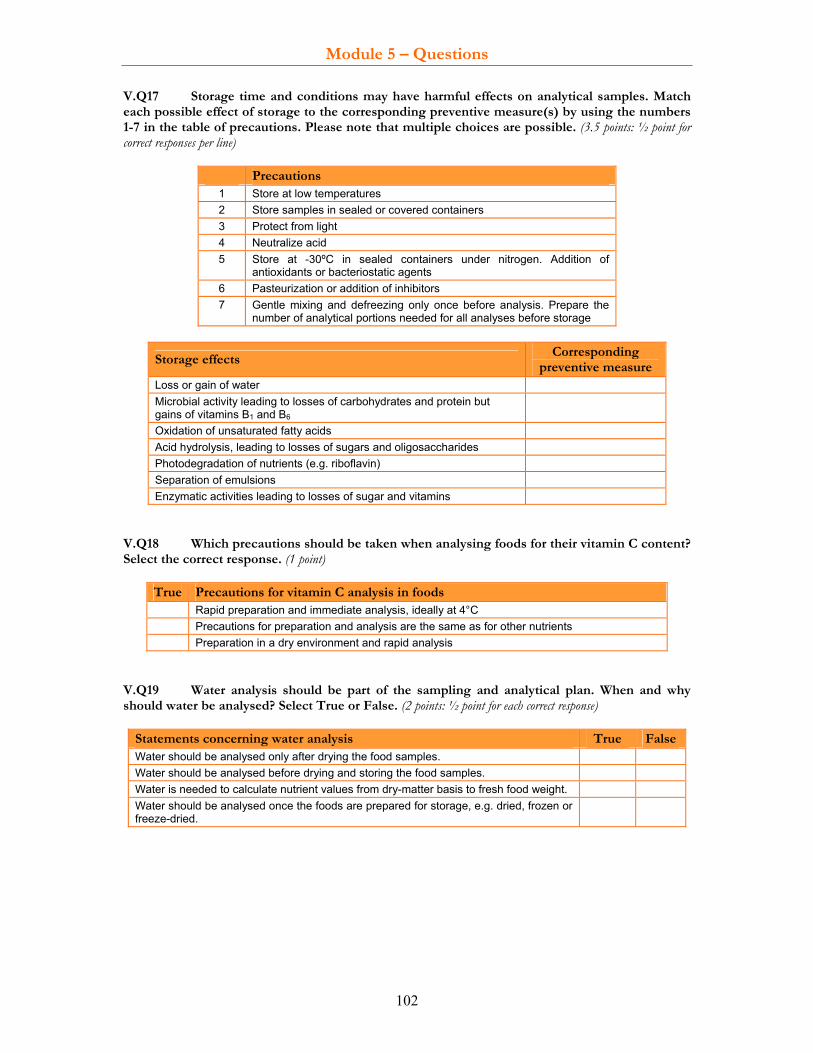
Module 5 – Questions
102
V.Q17 Storage time and conditions may have harmful effects on analytical samples. Match each possible effect of storage to the corresponding preventive measure(s) by using the numbers 1-7 in the table of precautions. Please note that multiple choices are possible. (3.5 points: ½ point for correct responses per line)
Precautions 1 Store at low temperatures 2 Store samples in sealed or covered containers 3 Protect from light 4 Neutralize acid 5 Store at -30ºC in sealed containers under nitrogen. Addition of
antioxidants or bacteriostatic agents 6 Pasteurization or addition of inhibitors 7 Gentle mixing and defreezing only once before analysis. Prepare the
number of analytical portions needed for all analyses before storage
Storage effects Corresponding
preventive measure Loss or gain of water Microbial activity leading to losses of carbohydrates and protein but gains of vitamins B1 and B6
Oxidation of unsaturated fatty acids Acid hydrolysis, leading to losses of sugars and oligosaccharides Photodegradation of nutrients (e.g. riboflavin) Separation of emulsions Enzymatic activities leading to losses of sugar and vitamins
V.Q18 Which precautions should be taken when analysing foods for their vitamin C content? Select the correct response. (1 point)
True Precautions for vitamin C analysis in foods Rapid preparation and immediate analysis, ideally at 4°C Precautions for preparation and analysis are the same as for other nutrients Preparation in a dry environment and rapid analysis
V.Q19 Water analysis should be part of the sampling and analytical plan. When and why should water be analysed? Select True or False. (2 points: ½ point for each correct response)
Statements concerning water analysis True FalseWater should be analysed only after drying the food samples. Water should be analysed before drying and storing the food samples. Water is needed to calculate nutrient values from dry-matter basis to fresh food weight. Water should be analysed once the foods are prepared for storage, e.g. dried, frozen or freeze-dried.

Module 5 – Questions
103
V.Q20 In the scientific literature, an article is found with nutrient values for a food that the compiler would like to incorporate into the national food composition database. The food is collected in a foreign country, and the sampling plan is very comprehensive and well done. The food was analysed with adequate analytical methods. Can the nutrient values in the article be considered as representing the food supply of one’s own country and therefore be considered high quality score for sampling? Select the correct response. (1 point)
True Foods from different countries can represent foods of one’s own country
Yes, if the sampling plan is very comprehensive and the food name is the same. Their nutrient values should obtain a high quality score for sampling.
Yes, if the sampling plan is very comprehensive and the sampling method would be similar in one’s own country. The nutrient values should obtain a high quality score for sampling.
No, because the food is collected in a different country and many factors may be different among countries such as food varieties, soil, climate, processing or market shares. The nutrient values should obtain a low quality score for sampling.
Optional question for those with advanced knowledge or who have participated in a food composition course V.Q21 Mangoes will be sampled in two seasons (December and May). For reasons of economy, a composite sample of the two seasons will be prepared before analysis for 10 nutrients, including vitamins (but excluding vitamin C). How should the first-season mangoes be stored? Select True or False. (2.5 points: ½ point for each correct response)
Correct storage True False At room temperature In a refrigerator In a deep freezer at -18°C In a deep freezer at -30°C Freeze-dried
Optional question for those with advanced knowledge or who have participated in a food composition course V.Q22 A cheese is sampled and needs to be sent to a laboratory for vitamin analysis. Shipment to the laboratory takes three days. It is not possible to keep the sample cool during transportation and the ambient temperature is 35ºC. Select True or False. (2.5 points: ½ point for each correct response)
Transportation considerations True False Transportation in a sealed, isolating container with packed ice assures that the water and vitamin content will not be changed.
Transportation in a vacuum-sealed container with packed ice assures that the water and vitamin content will not be changed.
Transportation in a sealed, isolating container with liquid nitrogen assures that the water and vitamin content will not be changed.
Any means of transportation may be chosen as long as it ensures that the vitamin content remains unchanged while the water/moisture content may change.
Another good laboratory that can be reached within 24 hours should be identified because transporting the cheese for 24 hours in an isolating container with packed ice will preserve its water and vitamin content for this period. Thereafter, the ice melts and changes in the cheese might occur.

Module 5 – Questions
104
Optional question for those with advanced knowledge in food biodiversity V.Q23 Sampling of foods also plays an important part in food biodiversity studies. What are the additional objectives of sampling when referring to food biodiversity ? Select True or False. (2 points: ½ point for each correct response)
Considerations for food biodiversity studies True False Establish connections between genetic resources and the nutrient composition of food
Report connections between food composition and different brand name foods Provide evidence of interactions between environmental influences and the composition of foods
Provide representative year-round, nationwide, mean values for all foods Optional question for those with advanced knowledge in food biodiversity V.Q24 What additional information is needed to correctly identify foods for food biodiversity (i.e. on the level of variety, cultivar or breed) and to adapt the sampling plan for food biodiversity purposes? Select True or False. (3.5 points: ½ point for each correct response)
Additional information needed for food biodiversity True False For all foods, taxonomic information is needed at species level only. Taxonomic information is needed on the level of variety, cultivar or breed. Genetic identification is desirable if taxonomic identification is not possible. Brand name information is needed. Environmental and ecological information is needed. Food consumption frequencies are needed of the most frequently consumed foods (e.g. apples, tomatoes).
Information is needed whether ethical approvals are required when working with specific indigenous communities and/or protected species.
Optional question for those with advanced knowledge or who have participated in a food composition course V.Q25 Sampling for recipes is more complex than sampling for primary foods, and most sampling procedures do not cover recipes. Which data are necessary to develop a good sampling plan for recipes? Select True or False. (4 points: ½ point for each correct response)
Additional data needed for recipes True False A homemade recipe should be representative of that consumed by the population and the amount of all its ingredients should be known.
The way a recipe is prepared in the country should be considered. A recipe prepared by a randomly-selected housewife with ingredients available in her home will be representative of how that recipe is prepared in the country.
In the case of a commercially prepared recipe (e.g. in a restaurant), it is not always possible to know which ingredients have been used or their quantities. At least 10 versions of the same recipe should be collected from different locations in order to represent the recipe. As this type of recipe may be very different to one prepared at home, it should be described as a commercial recipe.
The sampling of ingredients for a recipe can be simplified (e.g. at a nearby market) because the most important consideration is that the amounts of ingredients are representative of the mean consumption of the recipe in the country.
Information about the recipes most often consumed in the country, and their ingredients, can be gathered from food consumption surveys and standard recipe books, or through focus groups.
Ideally, sampling of ingredients for recipes should follow the same procedures as if they were collected for simple foods.
The prepared recipe should be analysed as quickly as possible, or stored adequately to avoid compositional changes, especially of vitamins.
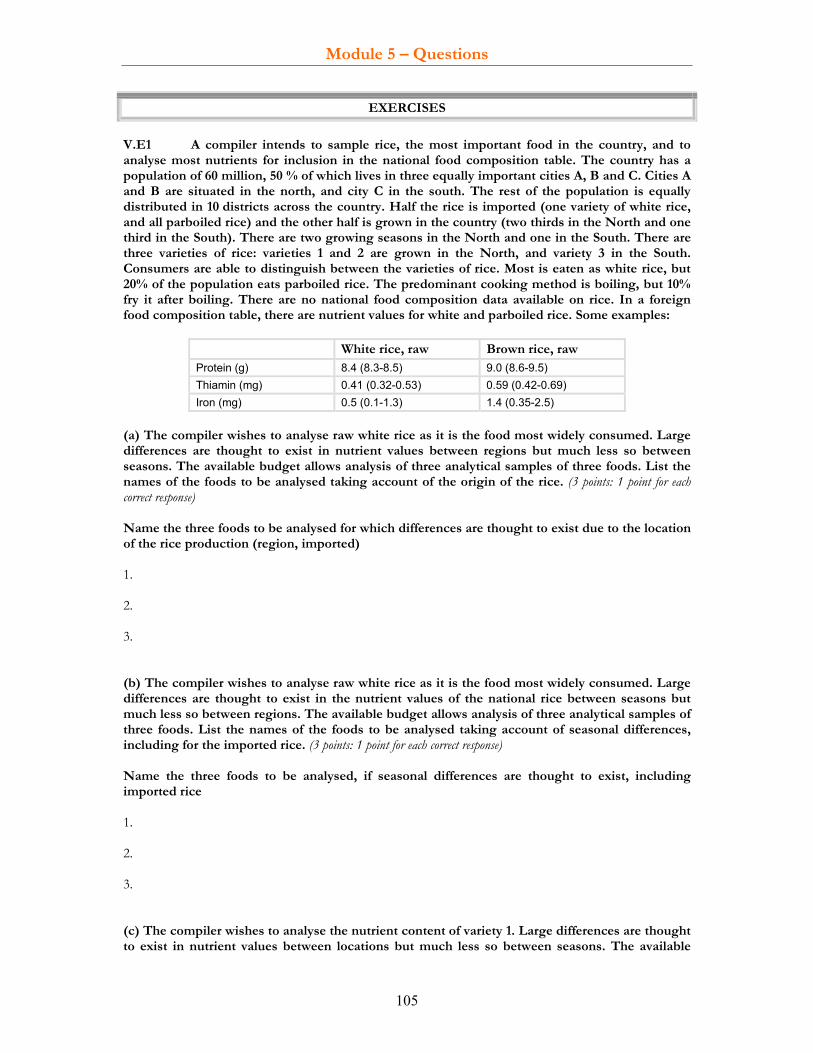
Module 5 – Questions
105
EXERCISES
V.E1 A compiler intends to sample rice, the most important food in the country, and to analyse most nutrients for inclusion in the national food composition table. The country has a population of 60 million, 50 % of which lives in three equally important cities A, B and C. Cities A and B are situated in the north, and city C in the south. The rest of the population is equally distributed in 10 districts across the country. Half the rice is imported (one variety of white rice, and all parboiled rice) and the other half is grown in the country (two thirds in the North and one third in the South). There are two growing seasons in the North and one in the South. There are three varieties of rice: varieties 1 and 2 are grown in the North, and variety 3 in the South. Consumers are able to distinguish between the varieties of rice. Most is eaten as white rice, but 20% of the population eats parboiled rice. The predominant cooking method is boiling, but 10% fry it after boiling. There are no national food composition data available on rice. In a foreign food composition table, there are nutrient values for white and parboiled rice. Some examples:
White rice, raw Brown rice, raw Protein (g) 8.4 (8.3-8.5) 9.0 (8.6-9.5) Thiamin (mg) 0.41 (0.32-0.53) 0.59 (0.42-0.69) Iron (mg) 0.5 (0.1-1.3) 1.4 (0.35-2.5)
(a) The compiler wishes to analyse raw white rice as it is the food most widely consumed. Large differences are thought to exist in nutrient values between regions but much less so between seasons. The available budget allows analysis of three analytical samples of three foods. List the names of the foods to be analysed taking account of the origin of the rice. (3 points: 1 point for each correct response) Name the three foods to be analysed for which differences are thought to exist due to the location of the rice production (region, imported) 1. 2. 3. (b) The compiler wishes to analyse raw white rice as it is the food most widely consumed. Large differences are thought to exist in the nutrient values of the national rice between seasons but much less so between regions. The available budget allows analysis of three analytical samples of three foods. List the names of the foods to be analysed taking account of seasonal differences, including for the imported rice. (3 points: 1 point for each correct response) Name the three foods to be analysed, if seasonal differences are thought to exist, including imported rice 1. 2. 3. (c) The compiler wishes to analyse the nutrient content of variety 1. Large differences are thought to exist in nutrient values between locations but much less so between seasons. The available

Module 5 – Questions
106
budget allows analysis of three analytical samples. List the names of the analytical samples considering the regional differences of variety 1. (3 points: 1 point for each correct response) Food names of the three analytical samples of variety 1 if regional differences are suspected 1. 2. 3. (d) After having analysed the raw white rice for regional differences, an additional budget becomes available for three food analyses to investigate the nutrient content of cooked rice and to publish the results in the food composition database and in a scientific article. Select the correct response. (1 point)
Options for analysing cooked rice for publication in the database and a scientific article
Choose to analyse the boiled white rice only, as it is the most common cooking method: boil the rice of the same three regional rice samples as above and analyse them separately. Then calculate the nutrient retention factors, which you can then use to calculate the nutrient values for other boiled rice.
Choose to analyse one sample of boiled white rice (composite of the three regional samples); one of fried white rice; and one of boiled parboiled rice. In this way, all major cooking methods are analysed.
Choose to analyse two samples of boiled white rice (one composite of the national sample and one of imported rice), and one of boiled parboiled rice. In this way, boiling as the major cooking method is well defined, also taking account of regional differences.
(e) Calculate the sample number for iron in white raw rice (mean from foreign food composition table is 0.5 mg/100 g and the range is 0.1 – 1.3 mg/100 g). An accuracy of 10% and a confidence level of 95% are envisaged. To be able to calculate the sample size, a standard deviation (SD) is needed and three values are necessary to calculate SD. For the purpose of this exercise, SD is estimated as 0.6, assuming that the mean is a value (values are: 0.1; 0.5 and 1.1). Assume a sample size of 10 for the t value. (2 points) Note: for sample size of 10, t = 2.262 and t² = 5.1166
sample size > (t α n-1)2 x SD2/ (accuracy x mean)2
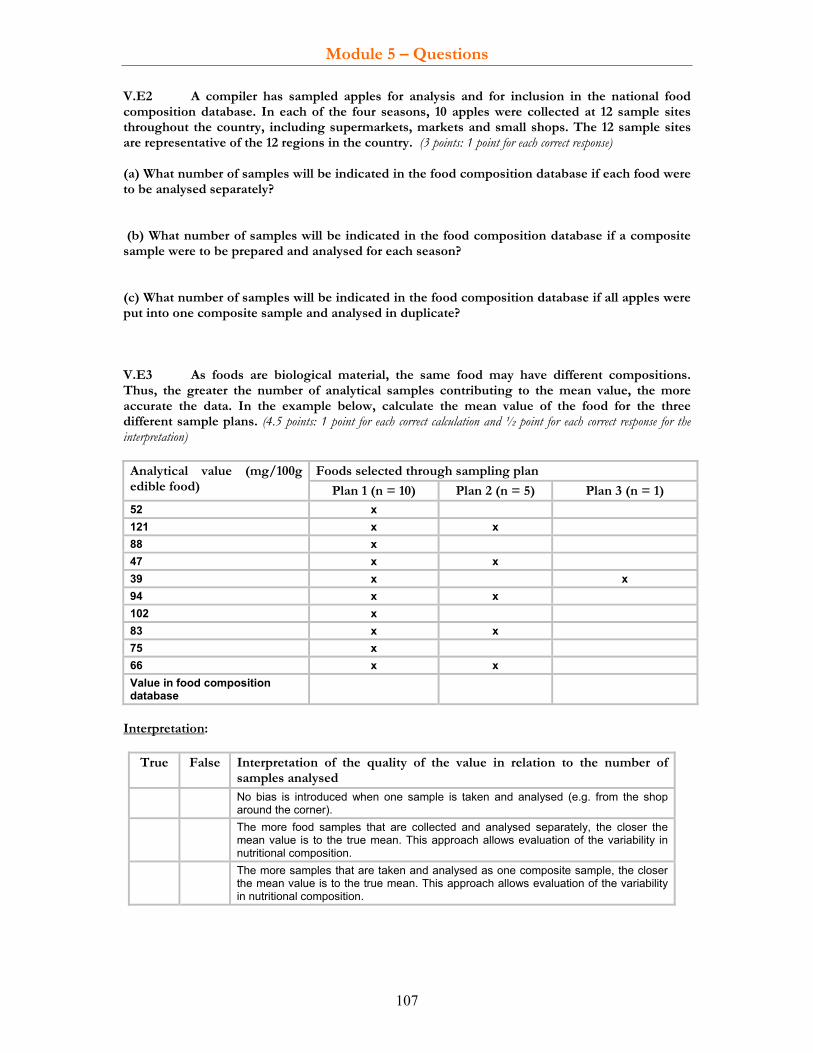
Module 5 – Questions
107
V.E2 A compiler has sampled apples for analysis and for inclusion in the national food composition database. In each of the four seasons, 10 apples were collected at 12 sample sites throughout the country, including supermarkets, markets and small shops. The 12 sample sites are representative of the 12 regions in the country. (3 points: 1 point for each correct response) (a) What number of samples will be indicated in the food composition database if each food were to be analysed separately? (b) What number of samples will be indicated in the food composition database if a composite sample were to be prepared and analysed for each season? (c) What number of samples will be indicated in the food composition database if all apples were put into one composite sample and analysed in duplicate? V.E3 As foods are biological material, the same food may have different compositions. Thus, the greater the number of analytical samples contributing to the mean value, the more accurate the data. In the example below, calculate the mean value of the food for the three different sample plans. (4.5 points: 1 point for each correct calculation and ½ point for each correct response for the interpretation)
Foods selected through sampling plan Analytical value (mg/100g edible food) Plan 1 (n = 10) Plan 2 (n = 5) Plan 3 (n = 1) 52 x 121 x x 88 x 47 x x 39 x x 94 x x 102 x 83 x x 75 x 66 x x Value in food composition database
Interpretation:
True False Interpretation of the quality of the value in relation to the number of samples analysed
No bias is introduced when one sample is taken and analysed (e.g. from the shop around the corner).
The more food samples that are collected and analysed separately, the closer the mean value is to the true mean. This approach allows evaluation of the variability in nutritional composition.
The more samples that are taken and analysed as one composite sample, the closer the mean value is to the true mean. This approach allows evaluation of the variability in nutritional composition.
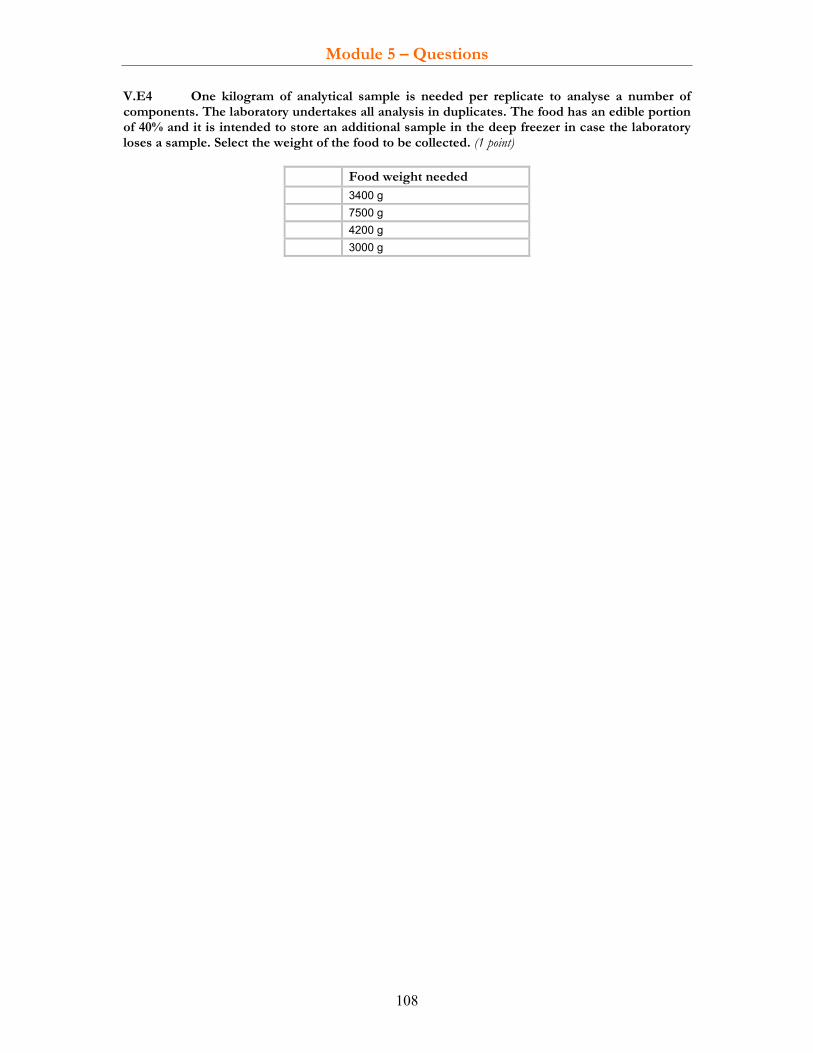
Module 5 – Questions
108
V.E4 One kilogram of analytical sample is needed per replicate to analyse a number of components. The laboratory undertakes all analysis in duplicates. The food has an edible portion of 40% and it is intended to store an additional sample in the deep freezer in case the laboratory loses a sample. Select the weight of the food to be collected. (1 point)
Food weight needed 3400 g
7500 g 4200 g 3000 g

Module 6 – Questions
109
Module 6 QUALITY ASPECTS OF ANALYTICAL DATA
LEARNING OBJECTIVES By the end of this module the student will be able to:
understand the principles governing the choice of analytical methods; apply these principles in the laboratory or when choosing a laboratory for chemical analysis; comprehend the importance and implementation of quality assurance in analytical work.
REQUIRED READING • Elliot, J. Laboratory Quality Systems Assuring Quality in Laboratory performance – Introduction and Overview. A
PowerPoint presentation available at: http://wwwn.cdc.gov/dls/ila/cd/guam/files/Module%201-QS%20Overview.ppt#1
and if possible: • Greenfield, H. & Southgate, D.A.T. 2003. Food composition data – production, management and use. FAO.
Rome. Chapters 5 (p. 7920), 6 (pp. 83-96), 7 (pp. 106, 123) and 8 (pp. 149-162). Available at: ftp://ftp.fao.org/docrep/fao/008/y4705e/y4705e00.pdf
• Codex Alimentarius. 2007. Report of the Twenty-eighth Session of the Codex Committee on Methods of Analysis and Sampling (ALINORM 07/30/23), July 2007, Appendix V. pp. 50-61. Available at: http://www.codexalimentarius.net/web/archives.jsp?lang=en
• EURACHEM/CITAC. 2000. Guide CG4 Quantifying uncertainty in analytical measurement. Second edition. QUAM: 2000.1: pp. 3–10. Available at : http://www.eurachem.org/guides/QUAM2000-1.pdf
• EURACHEM/CITAC Guide. 2003. Traceability in Chemical Measurement – A guide to achieving comparable results in chemical measurements. pp. 3–14 Available at: http://www.eurachem.org/
EXERCISE MATERIAL • Web site of the International Laboratory Accreditation Cooperation: http://www.ilac.org/ • Web site of the National Accreditation Board for Testing and Calibration Laboratories:
http://www.nabl-india.org/nabl/asp/users/documentMgmt.asp?docType=both
RECOMMENDATION It may be helpful to complete module 4.d (Component methods of analysis) before question VI.Q2. RELEVANCE FOR VARIOUS USERS (ON A SCALE OF + TO +++++) • Compilers/ professional users ++ • Analysts +++++ ESTIMATED TIME TO COMPLETE TASKS • Required reading: 1–3 hours • Answering the questions: 1–3 hours • Completing the exercises: 1–3 hours SUGGESTED ADDITIONAL READING • EURACHEM. 1998. The Fitness for Purpose of Analytical Methods - A Laboratory Guide to Method
Validation and Related Topics. Available at: http://www.eurachem.org/guides/valid.pdf. • ISO/IEC. 2005. ISO/IEC 17025. General requirements for the competence of testing and calibration laboratories.
Edition 2. Available at: http://www.iso.org/iso/Catalogue_detail?csnumber=39883 • Wolf, W.R. & Andrews, K.W. 1995. A system for defining reference materials applicable to all food
matrices. Fresenius' Journal of Analytical Chemistry. 352(1-2):73-6
20 The page numbers indicated correspond to the page numbers of the book (top of the page), and not to the PDF file.
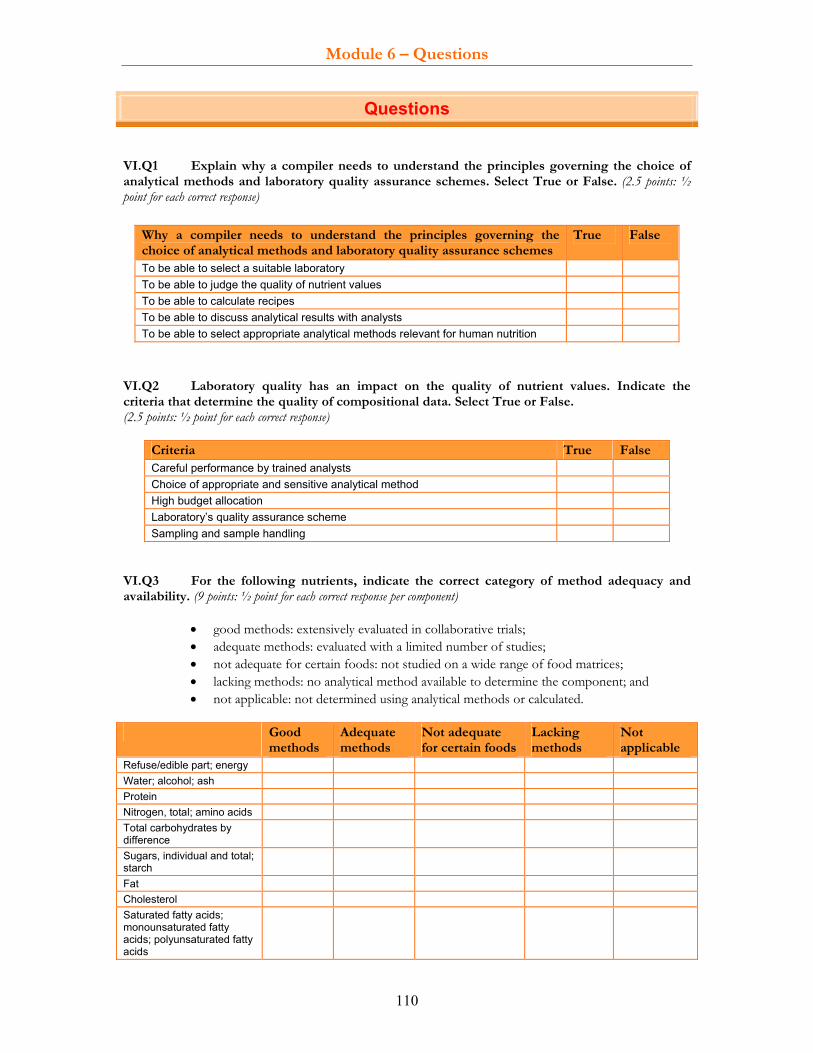
Module 6 – Questions
110
Questions VI.Q1 Explain why a compiler needs to understand the principles governing the choice of analytical methods and laboratory quality assurance schemes. Select True or False. (2.5 points: ½ point for each correct response)
VI.Q2 Laboratory quality has an impact on the quality of nutrient values. Indicate the criteria that determine the quality of compositional data. Select True or False. (2.5 points: ½ point for each correct response)
Criteria True False Careful performance by trained analysts Choice of appropriate and sensitive analytical method High budget allocation Laboratory’s quality assurance scheme Sampling and sample handling
VI.Q3 For the following nutrients, indicate the correct category of method adequacy and availability. (9 points: ½ point for each correct response per component)
• good methods: extensively evaluated in collaborative trials; • adequate methods: evaluated with a limited number of studies; • not adequate for certain foods: not studied on a wide range of food matrices; • lacking methods: no analytical method available to determine the component; and • not applicable: not determined using analytical methods or calculated.
Good
methods Adequate methods
Not adequate for certain foods
Lacking methods
Not applicable
Refuse/edible part; energy Water; alcohol; ash Protein Nitrogen, total; amino acids Total carbohydrates by difference
Sugars, individual and total; starch
Fat Cholesterol Saturated fatty acids; monounsaturated fatty acids; polyunsaturated fatty acids
Why a compiler needs to understand the principles governing the choice of analytical methods and laboratory quality assurance schemes
True False
To be able to select a suitable laboratory To be able to judge the quality of nutrient values To be able to calculate recipes To be able to discuss analytical results with analysts To be able to select appropriate analytical methods relevant for human nutrition

Module 6 – Questions
111
Good methods
Adequate methods
Not adequate for certain foods
Lacking methods
Not applicable
Trans fatty acids Iron; calcium; magnesium; potassium; zinc
Iodine Selenium Ascorbic acid Vitamin C Folate Thiamin; riboflavin; niacin Vitamin A, total Retinol; carotenes; vitamin D and E isomers
VI.Q4 Match the following terms to the corresponding definition. (3.5 points: ½ point for each correct response) Note: It might be helpful also to consult the Codex website, available at: http://www.codexalimentarius.net/web/archives.jsp?lang=en – ALINORM 07/30/23, appendix V.
Terms: 1. Precision 2. Reliability 3. Applicability 4. Accuracy 5. Robustness 6. Sensitivity 7. Specificity
Number Definition
The closeness of agreement between a test result or measurement result and the true value (Codex, 2007).
Quotient of the change in the indication of a measuring system and the corresponding change in the value of the quantity being measured (Codex, 2007).
The analytes, matrices and concentrations for which a method of analysis may be used satisfactorily (Codex, 2007). It may also include warnings on known interference by other analytes.
The ability of a method to measure only the desired substance. Very frequently, methods rely on the absence of interferences to achieve the objective.
The closeness of agreement between independent test/measurement results obtained under stipulated conditions. It depends only on the distribution of random errors and does not relate to the true value or to the specified value (Codex, 2007).
A measure of the capacity of an analytical procedure to remain unaffected by small but deliberate variations in method parameters. It provides an indication of its reliability during normal use (Codex, 2007).
A qualitative term expressing a degree of satisfaction with the performance of a method in relation to applicability, specificity, accuracy, precision, detectability and sensitivity. The type, concentration of the component, and the purposes of the analyses determine the relative importance of the different attributes.

Module 6 – Questions
112
VI.Q5 Indicate the three essential criteria for selecting an analytical method for generating data for a national food composition programme, as suggested by Egan (1974). Select True or False. (3 points: ½ point for each correct response) Criteria True False Preference should be given to methods whose reliability has been established by collaborative studies involving several laboratories.
Preference should be given to methods recommended or adopted by a national organization.
Preference should be given to methods whose reliability has been established by the main laboratory in the field.
Preference should be given to methods of analysis applicable to one specific food matrix. Preference should be given to methods recommended or adopted by international organizations.
Preference should be given to the method applicable to the widest range of food types and matrices rather than those applicable only to specific foods (especially if only a single method is feasible in the laboratory).
VI.Q6 It is possible for laboratories with less-sophisticated equipment to produce good analytical results by applying a labour-intensive but valid analytical method? Select True or False. (1.5 points: ½ point for each correct response)
Statement True FalseYes, because the method meets the quality criteria ‘valid’ and well-trained personnel are capable of carrying out the method correctly.
No, because only sophisticated equipment with automated procedures can produce good-quality results.
No, because all manual and labour-intensive analytical methods have a low level of accuracy.
VI.Q7 Match the following terms to the corresponding definition. (3 points: ½ point for each correct response) Note: It might be helpful also to consult the Codex website, available at http://www.codexalimentarius.net/web/archives.jsp?lang=en – ALINORM 07/30/23, appendix V
Terms: 1. Repeatability standard deviation 2. Repeatability relative standard deviation 3. Limit of detection (LOD) 4. Limit of quantification (LOQ) 5. Recovery 6. Reproducibility/repeatability
Number Definition Precision under repeatability [reproducibility] conditions (Codex, 2007). Standard deviation of test results or measurement results obtained under repeatability [reproducibility]
conditions (Codex, 2007). Proportion or amount of an analyte present in and/or added to the analytical portion of the test material,
which is extracted and presented for measurement (Codex, 2007). The amount of an analyte corresponding to the lowest measurement signal, which, with a defined
confidence, may be interpreted as indicating that the analyte is present in the test sample, without allowing its quantification. It is conventionally defined as field blank + 3σ, which is the standard deviation of the field blank value signal (IUPAC definition).
In terms of an analytical procedure, it is the lowest amount of analyte in a laboratory sample that can be quantitatively determined with a defined confidence (Codex, 2007).
Computed by dividing the repeatability [reproducibility] standard deviation by the mean. It is a useful measure of precision in quantitative studies. This is done so that the variability of sets with different means can be compared. Its values are independent of the amount of analyte over a reasonable range. These values facilitate the comparison of variabilities at different concentrations (Codex, 2007).
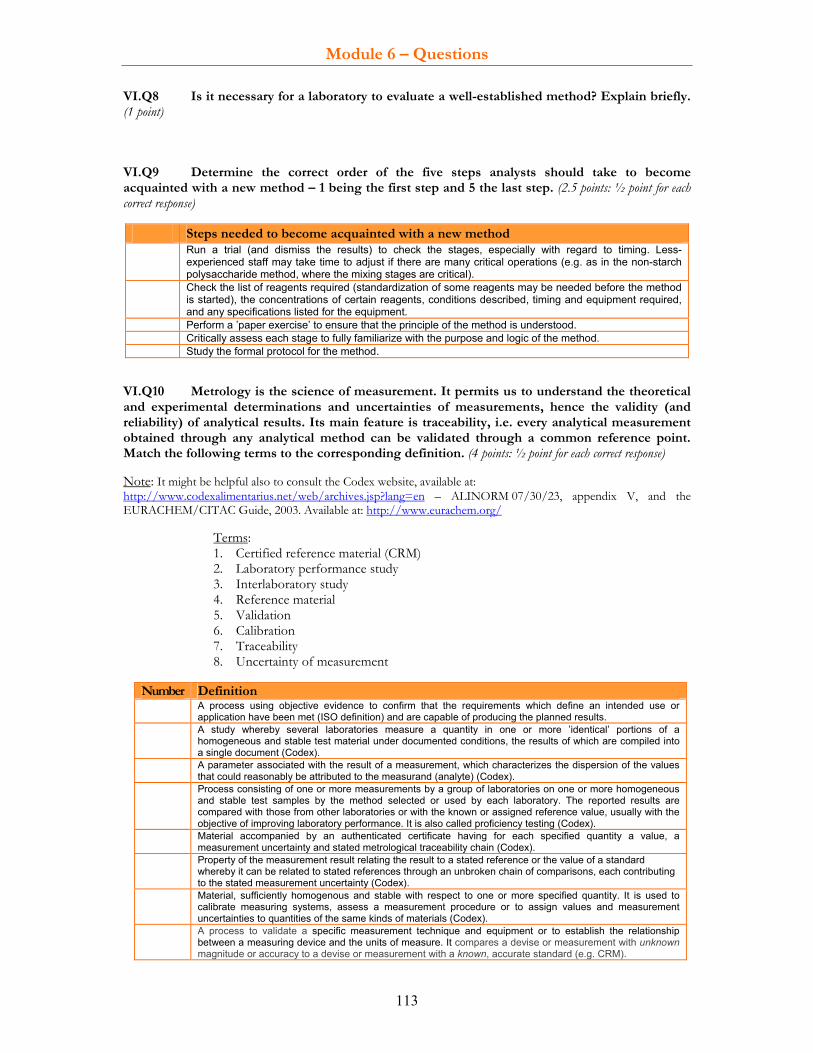
Module 6 – Questions
113
VI.Q8 Is it necessary for a laboratory to evaluate a well-established method? Explain briefly. (1 point) VI.Q9 Determine the correct order of the five steps analysts should take to become acquainted with a new method – 1 being the first step and 5 the last step. (2.5 points: ½ point for each correct response)
Steps needed to become acquainted with a new method Run a trial (and dismiss the results) to check the stages, especially with regard to timing. Less-
experienced staff may take time to adjust if there are many critical operations (e.g. as in the non-starch polysaccharide method, where the mixing stages are critical).
Check the list of reagents required (standardization of some reagents may be needed before the method is started), the concentrations of certain reagents, conditions described, timing and equipment required, and any specifications listed for the equipment.
Perform a ’paper exercise’ to ensure that the principle of the method is understood. Critically assess each stage to fully familiarize with the purpose and logic of the method. Study the formal protocol for the method.
VI.Q10 Metrology is the science of measurement. It permits us to understand the theoretical and experimental determinations and uncertainties of measurements, hence the validity (and reliability) of analytical results. Its main feature is traceability, i.e. every analytical measurement obtained through any analytical method can be validated through a common reference point. Match the following terms to the corresponding definition. (4 points: ½ point for each correct response) Note: It might be helpful also to consult the Codex website, available at: http://www.codexalimentarius.net/web/archives.jsp?lang=en – ALINORM 07/30/23, appendix V, and the EURACHEM/CITAC Guide, 2003. Available at: http://www.eurachem.org/
Terms: 1. Certified reference material (CRM) 2. Laboratory performance study 3. Interlaboratory study 4. Reference material 5. Validation 6. Calibration 7. Traceability 8. Uncertainty of measurement
Number Definition
A process using objective evidence to confirm that the requirements which define an intended use or application have been met (ISO definition) and are capable of producing the planned results.
A study whereby several laboratories measure a quantity in one or more ’identical’ portions of a homogeneous and stable test material under documented conditions, the results of which are compiled into a single document (Codex).
A parameter associated with the result of a measurement, which characterizes the dispersion of the values that could reasonably be attributed to the measurand (analyte) (Codex).
Process consisting of one or more measurements by a group of laboratories on one or more homogeneous and stable test samples by the method selected or used by each laboratory. The reported results are compared with those from other laboratories or with the known or assigned reference value, usually with the objective of improving laboratory performance. It is also called proficiency testing (Codex).
Material accompanied by an authenticated certificate having for each specified quantity a value, a measurement uncertainty and stated metrological traceability chain (Codex).
Property of the measurement result relating the result to a stated reference or the value of a standard whereby it can be related to stated references through an unbroken chain of comparisons, each contributing to the stated measurement uncertainty (Codex).
Material, sufficiently homogenous and stable with respect to one or more specified quantity. It is used to calibrate measuring systems, assess a measurement procedure or to assign values and measurement uncertainties to quantities of the same kinds of materials (Codex).
A process to validate a specific measurement technique and equipment or to establish the relationship between a measuring device and the units of measure. It compares a devise or measurement with unknown magnitude or accuracy to a devise or measurement with a known, accurate standard (e.g. CRM).
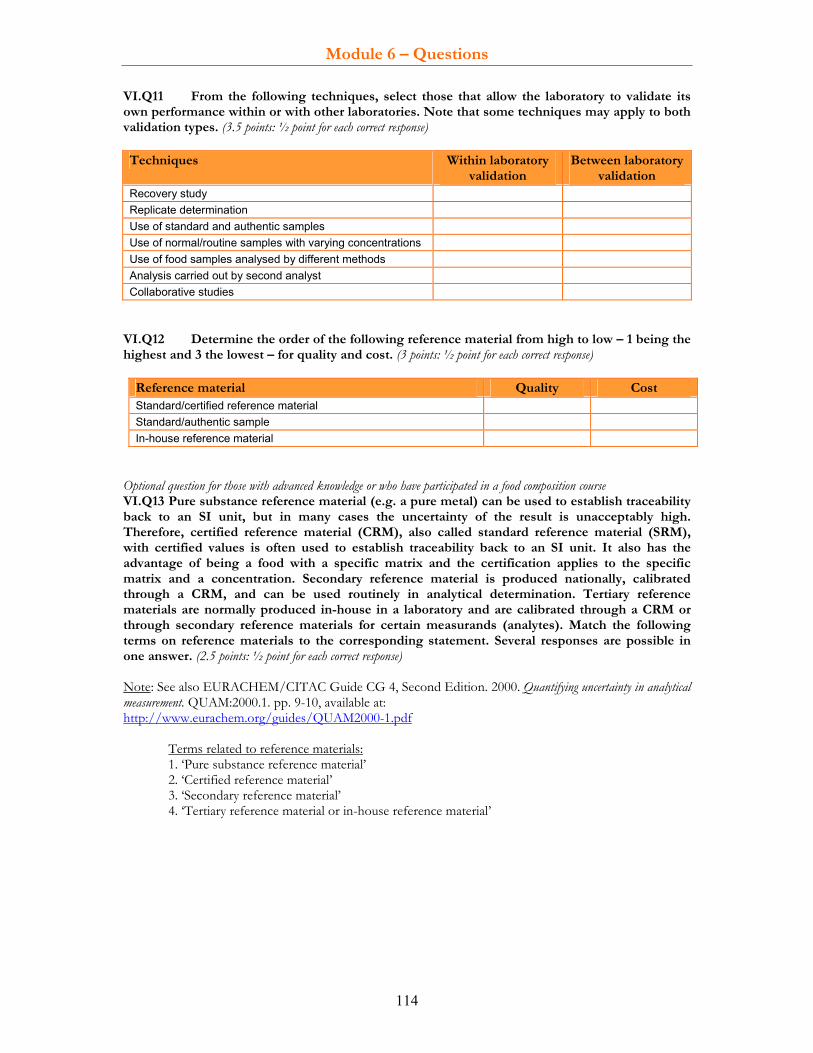
Module 6 – Questions
114
VI.Q11 From the following techniques, select those that allow the laboratory to validate its own performance within or with other laboratories. Note that some techniques may apply to both validation types. (3.5 points: ½ point for each correct response) Techniques Within laboratory
validation Between laboratory
validation Recovery study Replicate determination Use of standard and authentic samples Use of normal/routine samples with varying concentrations Use of food samples analysed by different methods Analysis carried out by second analyst Collaborative studies
VI.Q12 Determine the order of the following reference material from high to low – 1 being the highest and 3 the lowest – for quality and cost. (3 points: ½ point for each correct response)
Reference material Quality Cost Standard/certified reference material Standard/authentic sample In-house reference material
Optional question for those with advanced knowledge or who have participated in a food composition course VI.Q13 Pure substance reference material (e.g. a pure metal) can be used to establish traceability back to an SI unit, but in many cases the uncertainty of the result is unacceptably high. Therefore, certified reference material (CRM), also called standard reference material (SRM), with certified values is often used to establish traceability back to an SI unit. It also has the advantage of being a food with a specific matrix and the certification applies to the specific matrix and a concentration. Secondary reference material is produced nationally, calibrated through a CRM, and can be used routinely in analytical determination. Tertiary reference materials are normally produced in-house in a laboratory and are calibrated through a CRM or through secondary reference materials for certain measurands (analytes). Match the following terms on reference materials to the corresponding statement. Several responses are possible in one answer. (2.5 points: ½ point for each correct response) Note: See also EURACHEM/CITAC Guide CG 4, Second Edition. 2000. Quantifying uncertainty in analytical measurement. QUAM:2000.1. pp. 9-10, available at: http://www.eurachem.org/guides/QUAM2000-1.pdf Terms related to reference materials:
1. ‘Pure substance reference material’ 2. ‘Certified reference material’ 3. ‘Secondary reference material’ 4. ‘Tertiary reference material or in-house reference material’

Module 6 – Questions
115
Statements on reference material
Natural matrix material supplied by internationally-recognized institutions, which can be spiked with certain compounds. It is certified for a certain number of analytes at a specific concentration level, and is used to calibrate instruments while ensuring that a specific food matrix does not create interference.
Reference material often produced within the laboratory with an analyte-specific matrix. It is often of higher quality than standard or authentic samples, and is used in routine work to monitor method performance.
Highest purity substance supplied by internationally-recognized institutions, representing metrological excellence because of highest guarantee of accuracy. It can be used to calibrate CRMs and methods.
It can be used to establish long-term measurement traceability, to identify and develop accurate analytical methods, and to validate independent methods. It is the only reference material that can be used to satisfy regulatory needs.
It is often cheaper and of lower guarantee of accuracy than CRM, and is used to produce in-house reference material. It is produced at the national or regional levels.
Optional question for those with advanced knowledge or who have participated in a food composition course VI.Q14 Wolf and Andrews (1995) suggest that all foods can be classified into one of the nine fields of the pyramid below. They propose that foods falling within the same sector would be chemically similar and thus should behave in a similar analytical manner. Therefore, the same CRM could be used. Indicate the correct statements concerning the matrix and the choice of an appropriate CRM. Select True or False. (1.5 points: ½ point for each correct response)
Correct statements concerning CRM True FalseThe protein, fat and carbohydrate contents of the food to be analysed has to be taken into account in the choice of the appropriate CRM.
Protein is the only component of the matrix of the CRM that causes interference. CRMs have been developed for each of these nine groups and, in general, they can be used for all foods in this group.
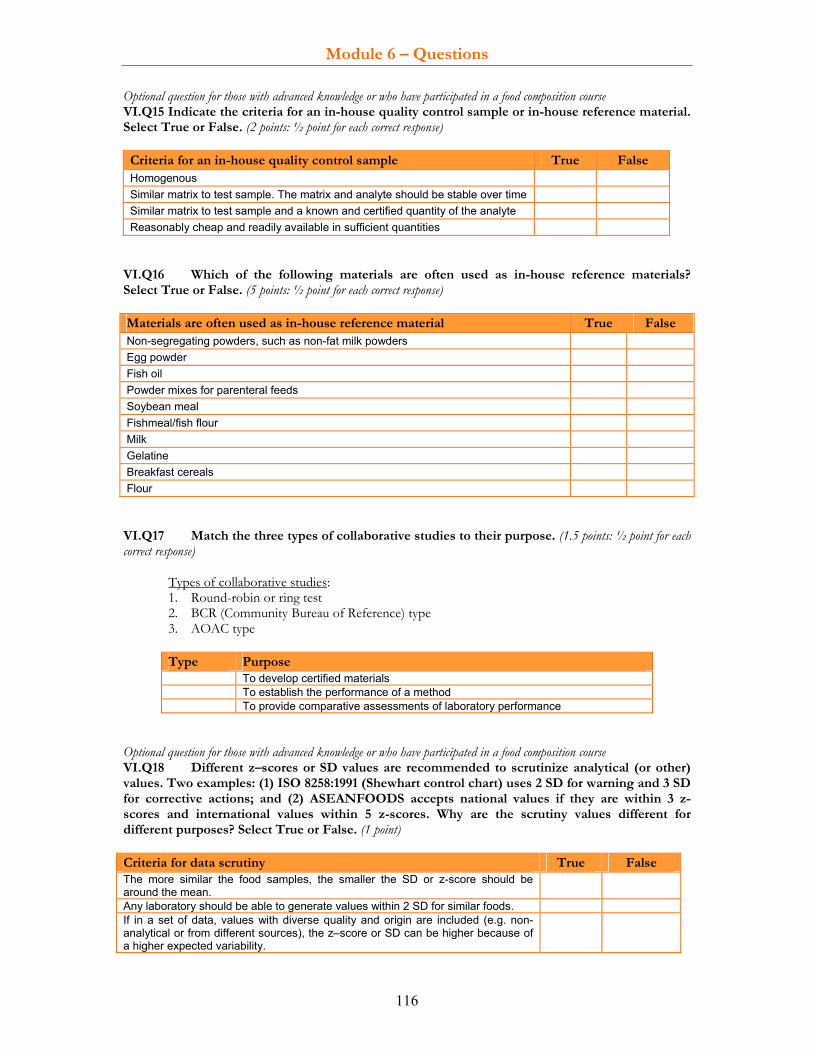
Module 6 – Questions
116
Optional question for those with advanced knowledge or who have participated in a food composition course VI.Q15 Indicate the criteria for an in-house quality control sample or in-house reference material. Select True or False. (2 points: ½ point for each correct response) Criteria for an in-house quality control sample True False Homogenous Similar matrix to test sample. The matrix and analyte should be stable over time Similar matrix to test sample and a known and certified quantity of the analyte Reasonably cheap and readily available in sufficient quantities
VI.Q16 Which of the following materials are often used as in-house reference materials? Select True or False. (5 points: ½ point for each correct response) Materials are often used as in-house reference material True False Non-segregating powders, such as non-fat milk powders Egg powder Fish oil Powder mixes for parenteral feeds Soybean meal Fishmeal/fish flour Milk Gelatine Breakfast cereals Flour VI.Q17 Match the three types of collaborative studies to their purpose. (1.5 points: ½ point for each correct response) Types of collaborative studies:
1. Round-robin or ring test 2. BCR (Community Bureau of Reference) type 3. AOAC type
Type Purpose
To develop certified materials To establish the performance of a method To provide comparative assessments of laboratory performance
Optional question for those with advanced knowledge or who have participated in a food composition course VI.Q18 Different z–scores or SD values are recommended to scrutinize analytical (or other) values. Two examples: (1) ISO 8258:1991 (Shewhart control chart) uses 2 SD for warning and 3 SD for corrective actions; and (2) ASEANFOODS accepts national values if they are within 3 z-scores and international values within 5 z-scores. Why are the scrutiny values different for different purposes? Select True or False. (1 point) Criteria for data scrutiny True False The more similar the food samples, the smaller the SD or z-score should be around the mean.
Any laboratory should be able to generate values within 2 SD for similar foods. If in a set of data, values with diverse quality and origin are included (e.g. non-analytical or from different sources), the z–score or SD can be higher because of a higher expected variability.

Module 6 – Questions
117
VI.Q19 Indicate the purpose of the following checks by selecting ‘Preparation, e.g. of the laboratory sample’, ‘Analytical method’, or ‘Calculations’. Some statements may have two correct answers. (7 points: ½ point for each correct response) Note: Calculations should not be selected if a calculation step is needed while the check is done for another purpose. For example, checking the correct dilution of a laboratory sample corresponds to ‘Preparation e.g. of laboratory samples’.
Checks Preparation, e.g. of laboratory sample
Analytical method
Calculations
Check key-step performance of the method Carry out a recovery study Recalculate recovery Check calculations, including all the secondary operations such as derivation of equations, simple mathematical operations, units
Check destruction of the matrix (for ash) Check completeness of extraction and saponification
Check performance of the analytical equipment
Carry out replications of determinations Check homogeneity of food sample Use homogenous reference material Check composition and concentration of solutions
Run blind analysis Run standard curves Check measurement of recorder peaks
VI.Q20 Briefly describe three common procedures that may lead to systematic errors in analytical values. (3 points: 1 point for each correct response) 1. 2. 3. VI.Q21 Match the following terms to the corresponding definition: (2 points: ½ point for each correct response)
Terms: 1. Data quality 2. Quality control 3. Quality assurance/quality assurance programme 4. Good laboratory practices
Number of term
Definition
A programme of planned and systematic actions to provide adequate confidence that the product or service will satisfy given requirements for quality (fit for purpose). This includes objective measures to evaluate the laboratory’s performance. The objective is to improve and stabilize performance.
Summary of all features that make the values appropriate for the intended use. Operational techniques and activities used to satisfy quality requirements. The objective is to test the
product or service to detect eventual errors. The organizational process and the conditions under which laboratory studies are planned, performed,
monitored, recorded and reported.

Module 6 – Questions
118
VI.Q22 All tasks of a quality assurance programme (QAP) can be categorized. Preventive measures are taken prior to the analysis to ensure accuracy in the analytical testing. Assessment measures are procedures undertaken during the analysis to ascertain that the system is performing correctly. Corrective measures are taken when an error is detected and corrected. Assign the following elements of a QAP to the corresponding category: ‘Measures to prevent errors’, ‘Measures to assess method performance’ and ‘Measures to correct errors’. (7.5 points: ½ point for each correct response) Elements of QAP Measures to
prevent errors
Measures to assess method performance
Measures to correct
errors Proper use of controls and reference standards Adequate qualification and motivation of staff, and continuous training
Replacement of faulty reagents Quality control of reagents, glassware and solvents Quality control of the operation of instruments and other equipment
Laboratory manager with QAP responsibilities Investigation of unusually high or low values, including repeated analyses; checking possible loss or contamination of analyte; rechecking calculations
Well-organized space in laboratory; good ventilation and fume hoods; adequate power supply; and adequate quality and volume of distilled water and reagents
Recalibration Avoidance of contamination Development of quality assurance manual for regular consultation by staff
Maintenance of a proper record-keeping system for analytical results
Schedules for regular servicing, testing and replacement of equipment
Careful scrutiny of results, including comparison with those of other laboratories; selection of repeat analyses
Close attention to all aspects of food sampling; adequate storage of food samples
VI.Q23 Indicate the correct statement(s) concerning recovery studies. Select True or False. (2 points: ½ point for each correct response)
True False Statements concerning recovery studies Recovery studies are used to monitor the accuracy of a method. Recovery studies are used to determine whether or not an analytical method adequately identifies
different concentrations of intrinsic components in a food sample. Recovery studies with added constituents indicate whether the method is capable of determining
the content of endogenous constituents in the food matrix. The recovery is assessed by the ratio between the observed analysed concentration and a
material containing the analyte at a reference level.
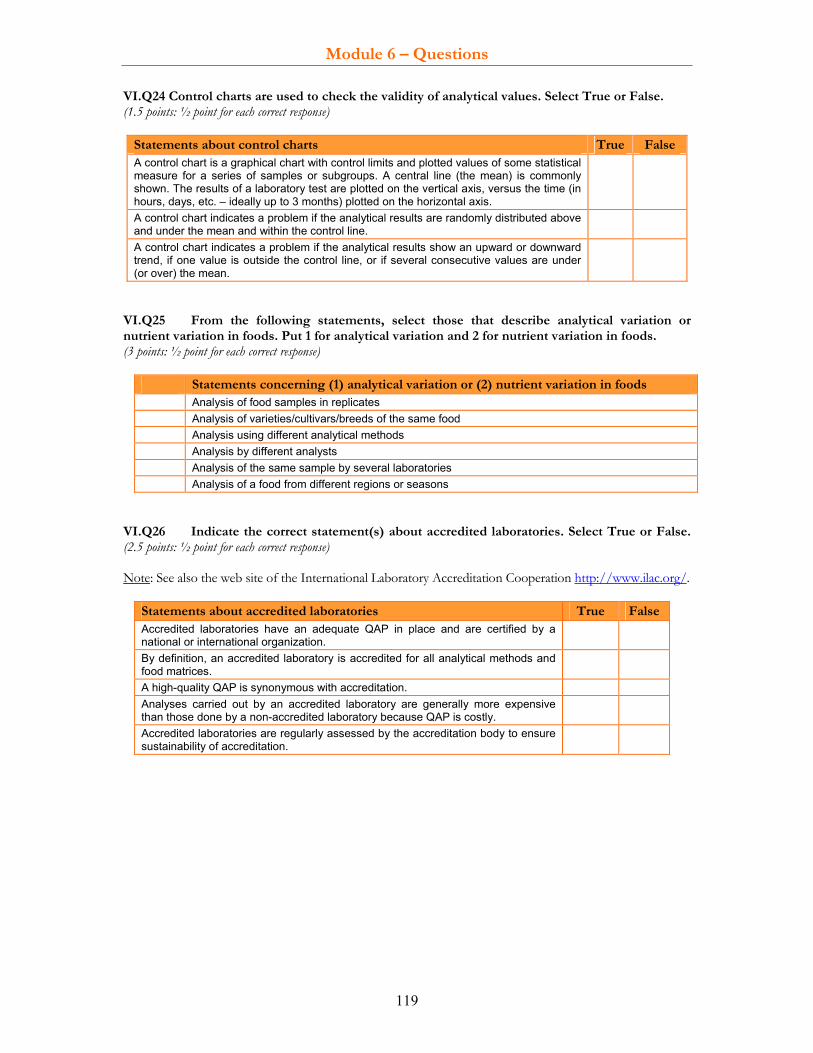
Module 6 – Questions
119
VI.Q24 Control charts are used to check the validity of analytical values. Select True or False. (1.5 points: ½ point for each correct response)
Statements about control charts True False A control chart is a graphical chart with control limits and plotted values of some statistical measure for a series of samples or subgroups. A central line (the mean) is commonly shown. The results of a laboratory test are plotted on the vertical axis, versus the time (in hours, days, etc. – ideally up to 3 months) plotted on the horizontal axis.
A control chart indicates a problem if the analytical results are randomly distributed above and under the mean and within the control line.
A control chart indicates a problem if the analytical results show an upward or downward trend, if one value is outside the control line, or if several consecutive values are under (or over) the mean.
VI.Q25 From the following statements, select those that describe analytical variation or nutrient variation in foods. Put 1 for analytical variation and 2 for nutrient variation in foods. (3 points: ½ point for each correct response)
Statements concerning (1) analytical variation or (2) nutrient variation in foods Analysis of food samples in replicates Analysis of varieties/cultivars/breeds of the same food Analysis using different analytical methods Analysis by different analysts Analysis of the same sample by several laboratories Analysis of a food from different regions or seasons
VI.Q26 Indicate the correct statement(s) about accredited laboratories. Select True or False. (2.5 points: ½ point for each correct response) Note: See also the web site of the International Laboratory Accreditation Cooperation http://www.ilac.org/.
Statements about accredited laboratories True False Accredited laboratories have an adequate QAP in place and are certified by a national or international organization.
By definition, an accredited laboratory is accredited for all analytical methods and food matrices.
A high-quality QAP is synonymous with accreditation. Analyses carried out by an accredited laboratory are generally more expensive than those done by a non-accredited laboratory because QAP is costly.
Accredited laboratories are regularly assessed by the accreditation body to ensure sustainability of accreditation.
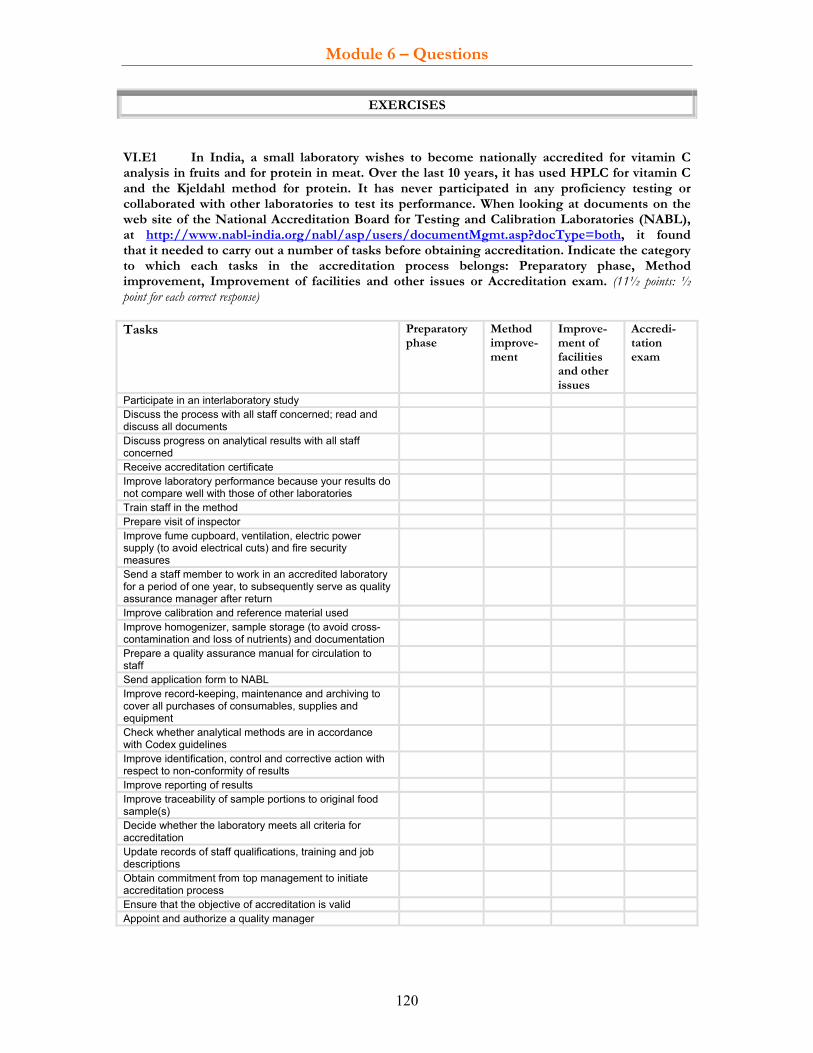
Module 6 – Questions
120
EXERCISES
VI.E1 In India, a small laboratory wishes to become nationally accredited for vitamin C analysis in fruits and for protein in meat. Over the last 10 years, it has used HPLC for vitamin C and the Kjeldahl method for protein. It has never participated in any proficiency testing or collaborated with other laboratories to test its performance. When looking at documents on the web site of the National Accreditation Board for Testing and Calibration Laboratories (NABL), at http://www.nabl-india.org/nabl/asp/users/documentMgmt.asp?docType=both, it found that it needed to carry out a number of tasks before obtaining accreditation. Indicate the category to which each tasks in the accreditation process belongs: Preparatory phase, Method improvement, Improvement of facilities and other issues or Accreditation exam. (11½ points: ½ point for each correct response) Tasks Preparatory
phase Method improve-ment
Improve-ment of facilities and other issues
Accredi- tation exam
Participate in an interlaboratory study Discuss the process with all staff concerned; read and discuss all documents
Discuss progress on analytical results with all staff concerned
Receive accreditation certificate Improve laboratory performance because your results do not compare well with those of other laboratories
Train staff in the method Prepare visit of inspector Improve fume cupboard, ventilation, electric power supply (to avoid electrical cuts) and fire security measures
Send a staff member to work in an accredited laboratory for a period of one year, to subsequently serve as quality assurance manager after return
Improve calibration and reference material used Improve homogenizer, sample storage (to avoid cross-contamination and loss of nutrients) and documentation
Prepare a quality assurance manual for circulation to staff
Send application form to NABL Improve record-keeping, maintenance and archiving to cover all purchases of consumables, supplies and equipment
Check whether analytical methods are in accordance with Codex guidelines
Improve identification, control and corrective action with respect to non-conformity of results
Improve reporting of results Improve traceability of sample portions to original food sample(s)
Decide whether the laboratory meets all criteria for accreditation
Update records of staff qualifications, training and job descriptions
Obtain commitment from top management to initiate accreditation process
Ensure that the objective of accreditation is valid Appoint and authorize a quality manager

Module 6 – Questions
121
VI.E2 Draw four arrows into each target to demonstrate:
a) a precise but not accurate method; b) an accurate but not precise method; c) a method that is neither precise nor accurate; d) a precise and accurate method (= reliable).
(4 points: 1 point for each correct response)
a) b) c) d)


Module 7 – Questions
123
Module 7 RESOURCES FOR FOOD COMPOSITION PUBLISHING FOOD COMPOSITION DATA
LEARNING OBJECTIVES By the end of this module the student will:
know where to locate resources for food composition, e.g. for data, standards, and other technical documents;
be able to judge the quality of different categories of publications; be aware of the requirements to write and submit a scientific article and to apply them when writing
articles. REQUIRED READING • Greenfield, H. & Southgate, D.A.T. 2003. Food composition data – production, management and use. FAO. Rome. Chapters 10 (pp. 171-173 of the book and not of the PDF file). Available at: ftp://ftp.fao.org/docrep/fao/008/y4705e/y4705e00.pdf EXERCISE MATERIAL • Guide for Authors. Journal of Food Composition and Analysis (JFCA). Available at http://www.elsevier.com/wps/find/journaldescription.cws_home/622878/authorinstructions# • Some of the resources indicated RELEVANCE FOR VARIOUS USERS (ON A SCALE OF + TO +++++) • Compilers/ professional users +++++ • Analysts +++++ ESTIMATED TIME TO COMPLETE TASKS • Required reading: 1–2 hours • Answering the questions: 1–2 hours • Completing the exercises: 1–2 hours RESOURCES Websites and books • Greenfield, H. & Southgate, D.A.T. 2003. Food composition data – production, management and use. FAO,
Rome. Available at: ftp://ftp.fao.org/docrep/fao/008/y4705e/y4705e00.pdf • INFOODS website: http://www.fao.org/infoods/index_en.stm • EuroFIR website: http://www.eurofir.net/ Note: EuroFIR’s websites are not stable and the indicated
addresses can change or can no more be accessible to the general public. • United States Department of Agriculture website:
http://www.ars.usda.gov/AboutUs/AboutUs.htm?modecode=12-35-45-00 Food composition tables and databases • Global repository
○ by region, including older ones: http://www.fao.org/infoods/directory_en.stm ○ in alphabetic order, with web links:
http://www.langual.org/langual_linkcategory.asp?CategoryID=4&Category=Food+Composition • European databases:
○ EuroFIR partners and other European databases: http://www.eurofir.net/eurofir_knowledge/european_databases
○ Schlotke, F & Moeller, A. 2000. Inventory of European Food Composition Databases and Tables. Available at: ftp://ftp.fao.org/ag/agn/infoods/42867747.pdf
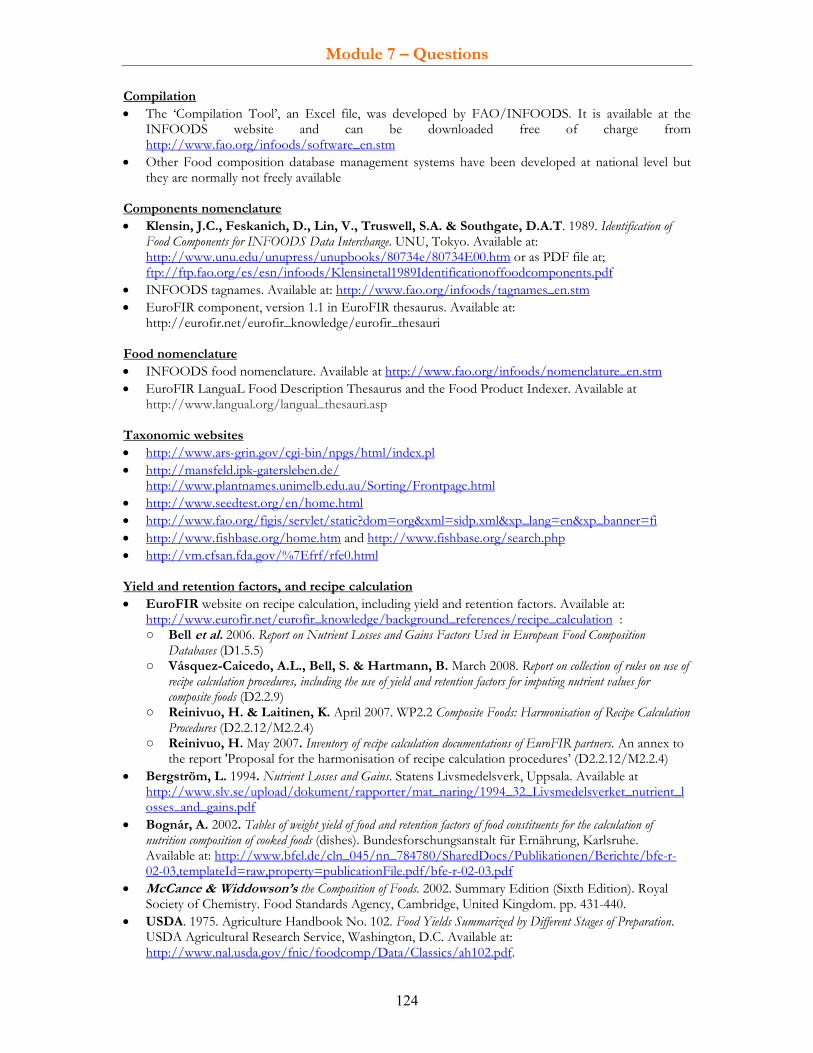
Module 7 – Questions
124
Compilation • The ‘Compilation Tool’, an Excel file, was developed by FAO/INFOODS. It is available at the
INFOODS website and can be downloaded free of charge from http://www.fao.org/infoods/software_en.stm
• Other Food composition database management systems have been developed at national level but they are normally not freely available
Components nomenclature • Klensin, J.C., Feskanich, D., Lin, V., Truswell, S.A. & Southgate, D.A.T. 1989. Identification of
Food Components for INFOODS Data Interchange. UNU, Tokyo. Available at: http://www.unu.edu/unupress/unupbooks/80734e/80734E00.htm or as PDF file at; ftp://ftp.fao.org/es/esn/infoods/Klensinetal1989Identificationoffoodcomponents.pdf
• INFOODS tagnames. Available at: http://www.fao.org/infoods/tagnames_en.stm • EuroFIR component, version 1.1 in EuroFIR thesaurus. Available at:
http://eurofir.net/eurofir_knowledge/eurofir_thesauri Food nomenclature • INFOODS food nomenclature. Available at http://www.fao.org/infoods/nomenclature_en.stm • EuroFIR LanguaL Food Description Thesaurus and the Food Product Indexer. Available at
http://www.langual.org/langual_thesauri.asp
Taxonomic websites • http://www.ars-grin.gov/cgi-bin/npgs/html/index.pl • http://mansfeld.ipk-gatersleben.de/
http://www.plantnames.unimelb.edu.au/Sorting/Frontpage.html • http://www.seedtest.org/en/home.html • http://www.fao.org/figis/servlet/static?dom=org&xml=sidp.xml&xp_lang=en&xp_banner=fi • http://www.fishbase.org/home.htm and http://www.fishbase.org/search.php • http://vm.cfsan.fda.gov/%7Efrf/rfe0.html Yield and retention factors, and recipe calculation • EuroFIR website on recipe calculation, including yield and retention factors. Available at:
http://www.eurofir.net/eurofir_knowledge/background_references/recipe_calculation : ○ Bell et al. 2006. Report on Nutrient Losses and Gains Factors Used in European Food Composition
Databases (D1.5.5) ○ Vásquez-Caicedo, A.L., Bell, S. & Hartmann, B. March 2008. Report on collection of rules on use of
recipe calculation procedures, including the use of yield and retention factors for imputing nutrient values for composite foods (D2.2.9)
○ Reinivuo, H. & Laitinen, K. April 2007. WP2.2 Composite Foods: Harmonisation of Recipe Calculation Procedures (D2.2.12/M2.2.4)
○ Reinivuo, H. May 2007. Inventory of recipe calculation documentations of EuroFIR partners. An annex to the report 'Proposal for the harmonisation of recipe calculation procedures’ (D2.2.12/M2.2.4)
• Bergström, L. 1994. Nutrient Losses and Gains. Statens Livsmedelsverk, Uppsala. Available at http://www.slv.se/upload/dokument/rapporter/mat_naring/1994_32_Livsmedelsverket_nutrient_losses_and_gains.pdf
• Bognár, A. 2002. Tables of weight yield of food and retention factors of food constituents for the calculation of nutrition composition of cooked foods (dishes). Bundesforschungsanstalt für Ernährung, Karlsruhe. Available at: http://www.bfel.de/cln_045/nn_784780/SharedDocs/Publikationen/Berichte/bfe-r-02-03,templateId=raw,property=publicationFile.pdf/bfe-r-02-03.pdf
• McCance & Widdowson’s the Composition of Foods. 2002. Summary Edition (Sixth Edition). Royal Society of Chemistry. Food Standards Agency, Cambridge, United Kingdom. pp. 431-440.
• USDA. 1975. Agriculture Handbook No. 102. Food Yields Summarized by Different Stages of Preparation. USDA Agricultural Research Service, Washington, D.C. Available at: http://www.nal.usda.gov/fnic/foodcomp/Data/Classics/ah102.pdf.
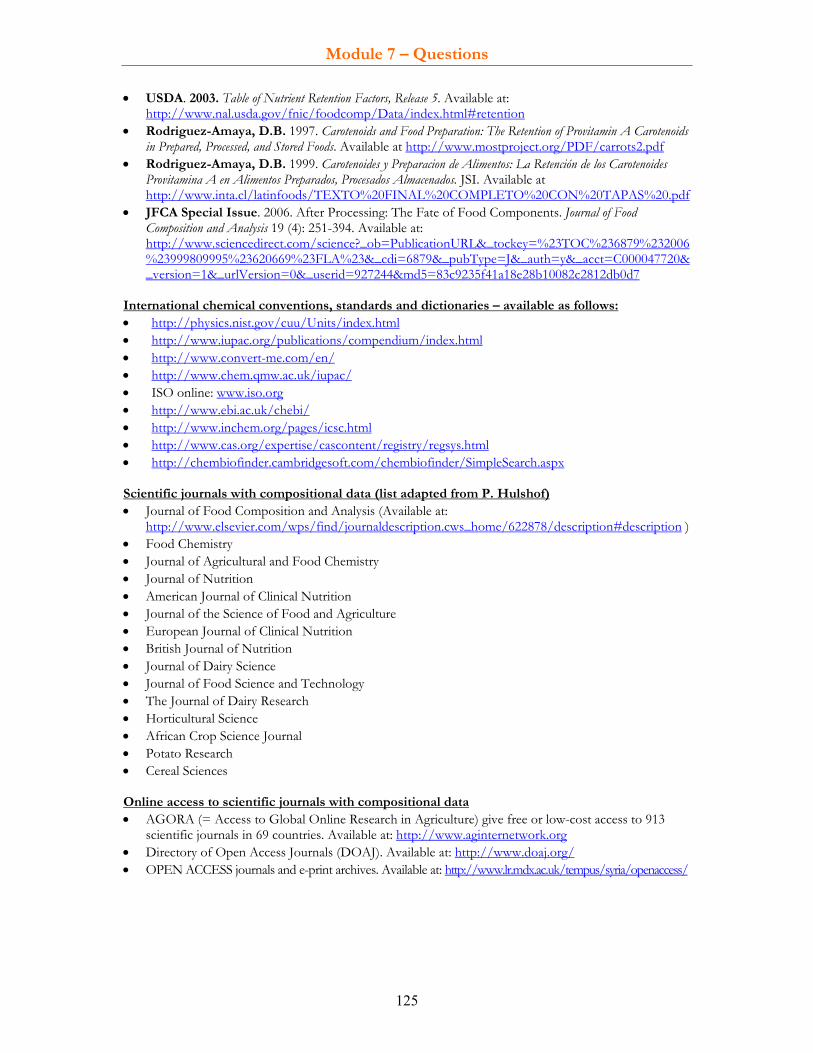
Module 7 – Questions
125
• USDA. 2003. Table of Nutrient Retention Factors, Release 5. Available at: http://www.nal.usda.gov/fnic/foodcomp/Data/index.html#retention
• Rodriguez-Amaya, D.B. 1997. Carotenoids and Food Preparation: The Retention of Provitamin A Carotenoids in Prepared, Processed, and Stored Foods. Available at http://www.mostproject.org/PDF/carrots2.pdf
• Rodriguez-Amaya, D.B. 1999. Carotenoides y Preparacion de Alimentos: La Retención de los Carotenoides Provitamina A en Alimentos Preparados, Procesados Almacenados. JSI. Available at http://www.inta.cl/latinfoods/TEXTO%20FINAL%20COMPLETO%20CON%20TAPAS%20.pdf
• JFCA Special Issue. 2006. After Processing: The Fate of Food Components. Journal of Food Composition and Analysis 19 (4): 251-394. Available at: http://www.sciencedirect.com/science?_ob=PublicationURL&_tockey=%23TOC%236879%232006%23999809995%23620669%23FLA%23&_cdi=6879&_pubType=J&_auth=y&_acct=C000047720&_version=1&_urlVersion=0&_userid=927244&md5=83c9235f41a18e28b10082c2812db0d7
International chemical conventions, standards and dictionaries – available as follows: • http://physics.nist.gov/cuu/Units/index.html • http://www.iupac.org/publications/compendium/index.html • http://www.convert-me.com/en/ • http://www.chem.qmw.ac.uk/iupac/ • ISO online: www.iso.org • http://www.ebi.ac.uk/chebi/ • http://www.inchem.org/pages/icsc.html • http://www.cas.org/expertise/cascontent/registry/regsys.html • http://chembiofinder.cambridgesoft.com/chembiofinder/SimpleSearch.aspx Scientific journals with compositional data (list adapted from P. Hulshof) • Journal of Food Composition and Analysis (Available at:
http://www.elsevier.com/wps/find/journaldescription.cws_home/622878/description#description ) • Food Chemistry • Journal of Agricultural and Food Chemistry • Journal of Nutrition • American Journal of Clinical Nutrition • Journal of the Science of Food and Agriculture • European Journal of Clinical Nutrition • British Journal of Nutrition • Journal of Dairy Science • Journal of Food Science and Technology • The Journal of Dairy Research • Horticultural Science • African Crop Science Journal • Potato Research • Cereal Sciences Online access to scientific journals with compositional data • AGORA (= Access to Global Online Research in Agriculture) give free or low-cost access to 913
scientific journals in 69 countries. Available at: http://www.aginternetwork.org • Directory of Open Access Journals (DOAJ). Available at: http://www.doaj.org/ • OPEN ACCESS journals and e-print archives. Available at: http://www.lr.mdx.ac.uk/tempus/syria/openaccess/

Module 7 – Questions
126
Scientific search engines • Abstracting databases
o CAB o FSTA o Science Direct
• For scientific/primary literature o Scirus: http://www.scirus.com o Google Scholar: http://scholar.google.com o Scopus: http://www.scopus.com
• For scientific/primary and secondary literature o FAO virtual library, also books, reports, etc. Available at:
http://www.fao.org/waicent/portal/Virtualibrary_en.asp o The NAL Catalogue (AGRICOLA) on agricultural literature. Available at:
http://agricola.nal.usda.gov/ o AGRIS. Available at: http://www.fao.org/Agris/ o google: google.com
Bioactive components • EuroFIR BASIS database. Available at: http://ebasis.eurofir.org/Default.asp • USDA for phytoestogenes (isoflavones, flavonoids, cholines and proanthocyanidin):
http://www.ars.usda.gov/Services/docs.htm?docid=6382 Contaminants • Codex Alimentarius: Maximum permitted levels, maximum residue levels:
http://www.codexalimentarius.net/mrls/pestdes/jsp/pest_q-e.jsp and http://www.codexalimentarius.net/mrls/vetdrugs/jsp/vetd_q-e.jsp
• WHO, 2009. GEMS/FOOD database. Available at: http://www.who.int/foodsafety/chem/gems/en/index.html
• National or regional contaminants databases. Examples: o Europe (http://ec.europa.eu/food/food/chemicalsafety/contaminants/index_en.htm ) o Total Diet Studies. Examples:
Australia: http://www.foodstandards.gov.au/monitoringandsurveillance/australiantotaldiets1914.cfm
France: http://www.afssa.fr/Documents/RapportEAT1EN.pdf New Zealand: http://www.nzfsa.govt.nz/science/research-projects/total-diet-
survey/ USA: http://vm.cfsan.fda.gov/~comm/tds-toc.html Cameroon (see article at
http://www.informaworld.com/smpp/content~content=a791515753~db=all~order=page )
Nutrition labelling • Codex Alimentarius. 2001. Food Labelling - Complete Texts - Revised. FAO, Rome. Available at:
http://www.fao.org/docrep/005/y2770e/y2770e00.HTM • European Union. Available at:
http://ec.europa.eu/food/food/labellingnutrition/foodlabelling/index_en.htm • FDA: NLEA. 1990. Nutrition labelling of food. Available at: http://www.cfsan.fda.gov/~lrd/CFR101-
9.HTML
Module 7 – Questions
127
Interchange/ Database management • FAO, 2004. Report of the Technical Workshop on Standards for Food Composition Data Interchange. FAO,
Rome. Available at: ftp://ftp.fao.org/es/esn/infoods/interchange.pdf • Klensin, J.C. 1992. INFOODS food composition data interchange handbook. United Nations University
Press, Tokyo, Japan. Available at: http://www.unu.edu/unupress/unupbooks/80774e/80774E00.htm or as PDF file at ftp://ftp.fao.org/es/esn/infoods/Klensin%201992INFOODSDataInterchangeHandbook.pdf
• Schlotke, F., Becker, W., Ireland, J., Møller, A., Ovaskainen, M.L., Monspart, J. & Unwin, I. 2000. Eurofoods recommendations for food composition database management and data interchange. Report No. EUR 19538. Office for Official Publications of the European Communities, Luxembourg. Available at: ftp://ftp.fao.org/ag/agn/infoods/EurofoodsRecommendations.pdf
• EuroFIR technical website on Systems Development Task Group (WP1.8 TG3), several documents: http://eurofir.net/?q=node/94
• Compilation Tool version 1.2.1. Available at: http://www.fao.org/infoods/software_en.stm Training and conferences • INFOODS training website: http://www.fao.org/infoods/training_en.stm, on international food
data conferences: http://www.fao.org/infoods/food_data_conf_en.stm and on conferences related to food composition and nutrition: http://www.fao.org/infoods/meetings_en.stm
• United Nations University website on Capacity Development: http://unu.edu/capacitybuilding/index.htm and Capacity Development through E-learning Workshop: http://www.unu.edu/elearning/workshop_200811/ (this link needs to be copied into the internet address field)
Analytical methods • List of essential books for food composition databases (appendix 7, pp. 226-228 of Greenfield &
Southgate (2003) • AOAC homepage: www.aoac.org • AOAC: recent standard publications in AOAC methods, available at: http://eoma.aoac.org/ • CEN (European Committee for Standardization) standards. CEN/TC 275 Food analysis - Horizontal
methods, e.g. CEN TC 275 WG 9 – Vitamins and Carotenoids. Available at: http://www.nal.din.de/gremien/CEN%2FTC+275/en/54740484.html
• ‘IUPAC Compendium of Chemical Terminology - the Gold Book’. Available at: http://goldbook.iupac.org/index.html
Quality of analytical data • Codex Alimentarius. 2007. Report of the Twenty-eighth Session of the Codex Committee on Methods of
Analysis and Sampling (ALINORM 07/30/23), July 2007, Appendix V. pp.50-61. Available at: http://www.codexalimentarius.net/web/archives.jsp?lang=en
• EURACHEM/CITAC. 2000. Guide CG4. Quantifying uncertainty in analytical measurement. Second edition. QUAM: 2000.1:pp. 3–10. Available at: http://www.eurachem.org/guides/QUAM2000-1.pdf
• EURACHEM/CITAC Guide. 2003. Traceability in Chemical Measurement – A guide to achieving comparable results in chemical measurements. pp. 3–14 Available at: http://www.eurachem.org/
• EURACHEM. 1998. The Fitness for Purpose of Analytical Methods - A Laboratory Guide to Method Validation and Related Topics. Available at: http://www.eurachem.org/guides/valid.pdf.
• Elliot, J. ‘Laboratory Quality Systems Assuring Quality in Laboratory Performance – Introduction and Overview.’ A power point presentation available at: http://wwwn.cdc.gov/dls/ila/cd/guam/files/Module%201-QS%20Overview.ppt#1
• Website of the International Laboratory Accreditation Cooperation: http://www.ilac.org/ • ISO/IEC. 2005. ISO/IEC 17025. General requirements for the competence of testing and calibration
laboratories. Edition 2. Available at: http://www.iso.org/iso/Catalogue_detail?csnumber=39883

Module 7 – Questions
128
Questions VII.Q1. Match the terms below with the corresponding description and advantages/disadvantages. (4 points: ½ point for each correct response)
Terms: 1. Primary publications 2. Secondary publications 3. Unpublished reports 4. Analytical reports
Term Description
They usually contain data from analyses carried out specifically for a food composition programme, or for other purposes.
They comprise scientific, peer-reviewed articles. They comprise documents ranging from analytical records to reports prepared for internal use only
(e.g. reports of companies, institutes or organizations). Examples are reviews or published compilations, food composition tables and databases, non-
peer reviewed literature or books. Some resources in this category are not available through the usual bibliographic databases or indexes and are called ‘gray literature’ (e.g. technical reports, fact sheets, newsletters, bulletins, working papers, posters, proceedings or thesis).
Term Advantages/disadvantages
May represent a large collection of food compositional data compiled in accordance with international standards (e.g. food composition databases), but the full documentation is not always available to the public.
Published food compositional data reviewed by experts. These are not always relevant to or adequate for a national food composition database because the data might be generated for another purpose than representing the compositional data in foods in a given country.
Published food compositional data that is not reviewed by experts. They may be generated for food composition purposes or not. Data generated for other purposes makes them less relevant to or adequate for a national food composition database.
Include data that are not readily available to the public but may be relevant and include good-quality food composition data.
VII.Q2 Select the correct statement on the relationship between the data documentation found in resources and publications and their quality assessment. (1 point) Relationship between documentation found in resources and publications and quality
assessment criteria Formal quality criteria cannot be applied to food composition data from resources without
appropriate documentation. The application of formal quality criteria to food composition data from resources without appropriate
documentation will result in a poor score. Full documentation of food composition data is not necessary in order to evaluate their quality.
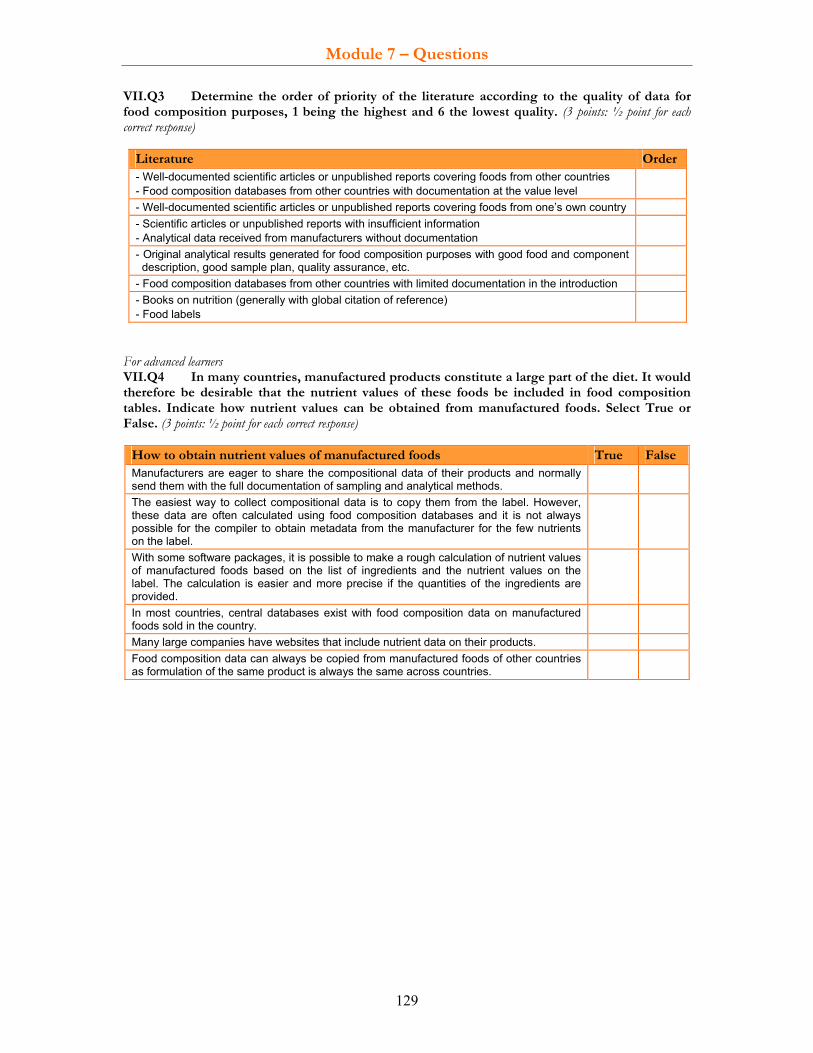
Module 7 – Questions
129
VII.Q3 Determine the order of priority of the literature according to the quality of data for food composition purposes, 1 being the highest and 6 the lowest quality. (3 points: ½ point for each correct response)
Literature Order- Well-documented scientific articles or unpublished reports covering foods from other countries - Food composition databases from other countries with documentation at the value level
- Well-documented scientific articles or unpublished reports covering foods from one’s own country - Scientific articles or unpublished reports with insufficient information - Analytical data received from manufacturers without documentation
- Original analytical results generated for food composition purposes with good food and component description, good sample plan, quality assurance, etc.
- Food composition databases from other countries with limited documentation in the introduction - Books on nutrition (generally with global citation of reference) - Food labels
For advanced learners VII.Q4 In many countries, manufactured products constitute a large part of the diet. It would therefore be desirable that the nutrient values of these foods be included in food composition tables. Indicate how nutrient values can be obtained from manufactured foods. Select True or False. (3 points: ½ point for each correct response)
How to obtain nutrient values of manufactured foods True False Manufacturers are eager to share the compositional data of their products and normally send them with the full documentation of sampling and analytical methods.
The easiest way to collect compositional data is to copy them from the label. However, these data are often calculated using food composition databases and it is not always possible for the compiler to obtain metadata from the manufacturer for the few nutrients on the label.
With some software packages, it is possible to make a rough calculation of nutrient values of manufactured foods based on the list of ingredients and the nutrient values on the label. The calculation is easier and more precise if the quantities of the ingredients are provided.
In most countries, central databases exist with food composition data on manufactured foods sold in the country.
Many large companies have websites that include nutrient data on their products. Food composition data can always be copied from manufactured foods of other countries as formulation of the same product is always the same across countries.

Module 7 – Questions
130
EXERCISES21
VII.E1 Read the Guide for Authors of the Journal of Food Composition and Analysis (available at: http://www.elsevier.com/wps/find/journaldescription.cws_home/622878/authorinstructions#) and answer the following questions. If indicated, strike through the incorrect answer(s). (33 points: 1 point for each correct response) Questions Responses Authors’ responsibilities (2 points)
1. 2.
Publishing language (1 point)
Names of chemicals (1 point)
Representation of number (2 points)
1. 2.
Unit of components in general and of energy in particular (2 points)
1. 2.
Reporting of calculations (1 point)
List two components that are discouraged (2 points)
1. 2.
Format and length of article (2 points)
1. 2.
Abstract: list two objectives (2 points)
1. 2.
Keywords: minimum number and objective (2 points)
• Minimum number: • Objective:
Introduction: list two objectives (2 points)
1. 2.
Material and methods: list two elements described in this section (2 points)
1. 2.
Results: list two elements described in this section (2 points)
1. 2.
21 Individual correct answers may vary.

Module 7 – Questions
131
Questions Responses Special reporting requirement for study results using (and citing) food composition databases (1 point)
Conclusion: list two elements described here (2 points)
1. 2.
Citation: from each pair, select correct response. Strike through incorrect one (2 points)
Order of references in text: chronologically or alphabetically In final publication, citations “submitted” are allowed or not allowed
List of references/reference style: from each pair, select correct response. Strike through incorrect one (2 points)
Name: O. P. Miller or Miller, O. P. Year of publication: in parentheses after authors or at end after comma Journal name: abbreviated or full name Special information for book: cite editor(s), publisher name/city/country or cite publisher name/city/country
Number of peer reviewers (1 point)
List two rejection criteria for the manuscript (2 points)
1. 2.

Module 7 – Questions
132
VII.E2 Indicate the answer to the following questions. Consult the list of resources at the beginning of this module. If indicated, strike through the incorrect answer(s). (11 points: 1 point for each correct response)
Questions Responses Indicate the resource where retention and yield factors are reported, as used in Europe (1 point)
What is the range of nutrient retention factors for vitamin C in boiled potatoes in Europe? See Bell et al., 2006 (1 point)
Which nutrient retention factor is proposed by EuroFIR for vitamin C in boiled potatoes? See Vásquez-Caicedo et al., 2007 (1 point)
Which recipe calculation system is proposed for Europe by EuroFIR? Strike through incorrect one(s) (2 points)
Yield factor to be applied: at ingredient level or at recipe level or not at all Nutrient retention factors to be applied: at ingredient level or at recipe level or not at all
Name two websites where links are found to published food composition tables and databases from the entire world (2 points)
1. 2.
List two scientific journals that frequently contain food composition data (no web link) (2 points)
1. 2.
Indicate the website where you can find data on heavy metal contamination of foods for France (1 point)
List one database on bioactive components being accessible to the general public without password (1 point)

Module 8 – Questions
133
Module 8 RECIPE AND OTHER CALCULATIONS
LEARNING OBJECTIVES By the end of this module the student will:
understand the principles of recipe calculation and know how to calculate them; understand the influence of yield and nutrient retention factors, and know how to apply them when
calculating recipes; be able to present recipes and their metadata in reference and user databases22; know how to complete missing values.
REQUIRED READING • Charrondière, U.R. Recipe and other calculations. PowerPoint Presentation. Available at:
http://www.fao.org/infoods/presentations_en.stm and if possible: • Greenfield, H. & Southgate, D.A.T. 2003. Food composition data – production, management and use. FAO,
Rome. Chapters 1 (pp. 7-9), 10 (p.181), 11 (pp. 191-192) and appendix 6 (p. 225)23. Available at: ftp://ftp.fao.org/docrep/fao/008/y4705e/y4705e00.pdf
• Rand, W.M., Pennington, J.A.T., Murphy, S.P. & Klensin, J.C. 1991. Compiling Data for Food Composition Data Bases. United Nations University, Tokyo. Sections 4-6 (Data from other sources, Estimation from data on similar foods; Calculation for multi-ingredient foods) pp. 30-62 in the PDF file. Available at http://www.unu.edu/unupress/unupbooks/80772e/80772E00.htm or PFD file at ftp://ftp.fao.org/es/esn/infoods/Randeal1991CompFCDBases.pdf
EXERCISE MATERIAL • FAO/INFOODS Compilation Tool version 1.2.124, an Excel file available at
http://www.fao.org/infoods/software_en.stm RECOMMENDATION It may be helpful to complete modules 2 (Use of food composition data), 3 (Selection and nomenclature of foods in food composition databases) and 4.b (Component nomenclature) before starting on the present module. RESOURCES Yield and retention factors, and recipe calculation • EuroFIR website on recipe calculation, including yield and retention factors. Available at:
http://www.eurofir.net/eurofir_knowledge/background_references/recipe_calculation : • Bell et al. 2006. Report on Nutrient Losses and Gains Factors Used in European Food Composition
Databases (D1.5.5). • Vásquez-Caicedo, A.L, Bell, S. & Hartmann, B. April 2007. Report on collection of rules on use of
recipe calculation procedures, including the use of yield and retention factors for imputing nutrient values for composite foods (D2.2.9).
• Reinivuo, H. & Laitinen, K. April 2007. WP2.2 Composite Foods: Harmonisation of Recipe Calculation Procedures (D2.2.12/M2.2.4)
• Reinivuo, H May 2007. Inventory of recipe calculation documentations of EuroFIR partners. An annex to the report 'Proposal for the harmonisation of recipe calculation procedures’ (D2.2.12/M2.2.4)
22 For an explanation of these terms, see pp. 10-12 of Greenfield & Southgate (2003). 23 The page numbers indicated correspond to the page numbers of the book (top of the page), and not to those of the PDF file. 24 This Excel file was developed by FAO/INFOODS and is freely available at the INFOODS website. Users are invited to
change the nutrient retention factors according to their needs and to add more factors if they need them. When changing factors or adding lines, care should be taken that the formulas continue to point to the right cells and it should be borne in mind that nutrient values of recipes already calculated might change.
Module 8 – Questions
134
• Bergström, L. 1994. Nutrient Losses and Gains. Statens Livsmedelsverk, Uppsala. Available at http://www.slv.se/upload/dokument/rapporter/mat_naring/1994_32_Livsmedelsverket_nutrient_losses_and_gains.pdf
• Bognár, A. 2002. Tables of weight yield of food and retention factors of food constituents for the calculation of nutrition composition of cooked foods (dishes). Bundesforschungsanstalt für Ernährung, Karlsruhe. Available at: http://www.bfel.de/cln_045/nn_784780/SharedDocs/Publikationen/Berichte/bfe-r-02-03,templateId=raw,property=publicationFile.pdf/bfe-r-02-03.pdf
• McCance & Widdowson’s the Composition of Foods. 2002. Summary Edition (Sixth Edition). Royal Society of Chemistry. Food Standards Agency, Cambridge, United Kingdom. pp. 431-440.
• USDA. 1975. Agriculture Handbook No. 102. Food Yields Summarized by Different Stages of Preparation. USDA Agricultural Research Service, Washington, D.C. Available at: http://www.nal.usda.gov/fnic/foodcomp/Data/Classics/ah102.pdf.
• USDA. 2003. Table of Nutrient Retention Factors, Release 5. Available at: http://www.nal.usda.gov/fnic/foodcomp/Data/index.html#retention
• Rodriguez-Amaya, D.B. 1997. Carotenoids and Food Preparation: The Retention of Provitamin A Carotenoids in Prepared, Processed, and Stored Foods. Available at http://www.mostproject.org/PDF/carrots2.pdf
• Rodriguez-Amaya, D.B. 1999. Carotenoides y Preparacion de Alimentos: La Retención de los Carotenoides Provitamina A en Alimentos Preparados, Procesados Almacenados. JSI. Available at http://www.inta.cl/latinfoods/TEXTO%20FINAL%20COMPLETO%20CON%20TAPAS%20.pdf
• JFCA Special Issue. 2006. After Processing: The Fate of Food Components. Journal of Food Composition and Analysis 19 (4): 251-394. Available at: http://www.sciencedirect.com/science?_ob=PublicationURL&_tockey=%23TOC%236879%232006%23999809995%23620669%23FLA%23&_cdi=6879&_pubType=J&_auth=y&_acct=C000047720&_version=1&_urlVersion=0&_userid=927244&md5=83c9235f41a18e28b10082c2812db0d7
RELEVANCE FOR VARIOUS USERS (ON A SCALE OF + TO +++++) • Compilers/ professional users +++++ • Analysts + ESTIMATED TIME TO COMPLETE TASKS • Required reading: 1-2 hours • Answering the questions: 1-3 hours • Completing the exercises: 2-5 hours
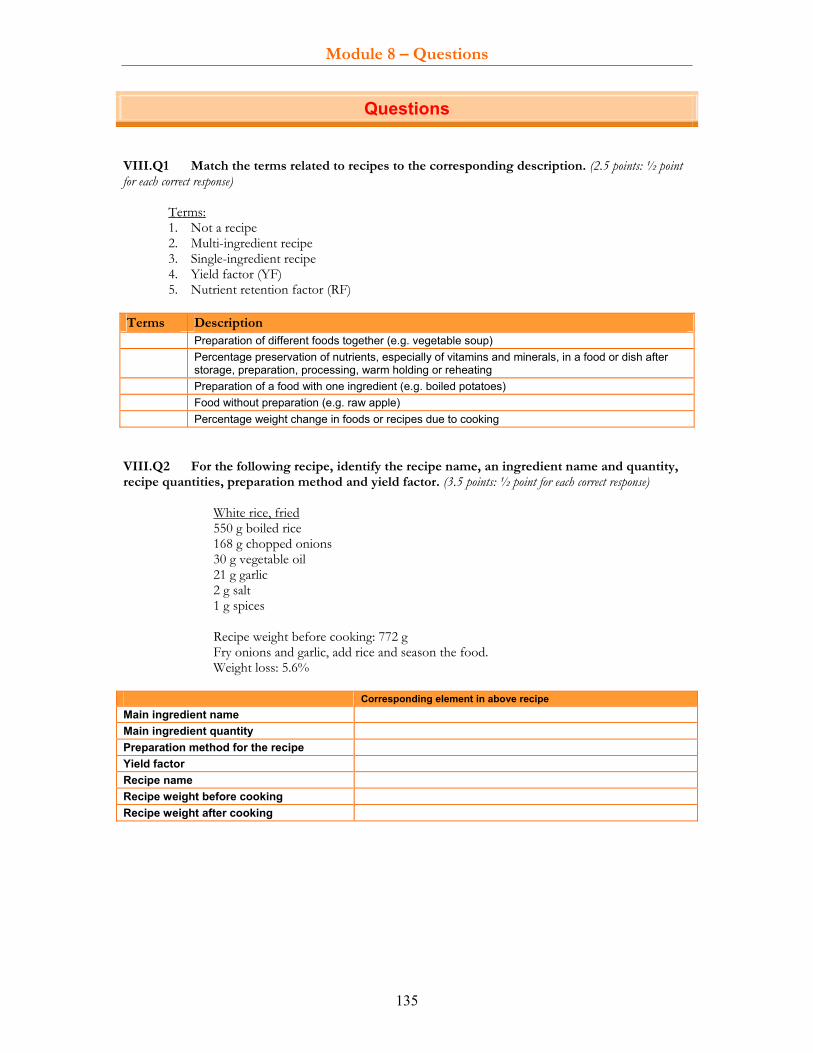
Module 8 – Questions
135
Questions VIII.Q1 Match the terms related to recipes to the corresponding description. (2.5 points: ½ point for each correct response)
Terms: 1. Not a recipe 2. Multi-ingredient recipe 3. Single-ingredient recipe 4. Yield factor (YF) 5. Nutrient retention factor (RF)
Terms Description
Preparation of different foods together (e.g. vegetable soup) Percentage preservation of nutrients, especially of vitamins and minerals, in a food or dish after
storage, preparation, processing, warm holding or reheating Preparation of a food with one ingredient (e.g. boiled potatoes) Food without preparation (e.g. raw apple) Percentage weight change in foods or recipes due to cooking
VIII.Q2 For the following recipe, identify the recipe name, an ingredient name and quantity, recipe quantities, preparation method and yield factor. (3.5 points: ½ point for each correct response)
White rice, fried 550 g boiled rice 168 g chopped onions 30 g vegetable oil 21 g garlic 2 g salt 1 g spices Recipe weight before cooking: 772 g Fry onions and garlic, add rice and season the food. Weight loss: 5.6%
Corresponding element in above recipe Main ingredient name Main ingredient quantity Preparation method for the recipe Yield factor Recipe name Recipe weight before cooking Recipe weight after cooking

Module 8 – Questions
136
VIII.Q3 Select the least-effective means of collecting recipe information and ingredients. (1 point) Least-effective way to collect recipe information and ingredients
Recipe books Focal group discussions, especially in developing countries Own preferred recipe Internet Quantitative list of ingredients on the label/from manufacturer
VIII.Q4 Determine the correct order of steps for creating and calculating nutrient values of recipes for a food composition table or database, 1 being the first step and 5 the last. (2.5 points: ½ point for each correct response)
Order Steps for creating and calculating nutrient values for recipes Make sure all ingredients have a complete set of nutrient values (no missing data) Include in the user database: (1) a recipe catalogue listing for each recipe, the ingredients and
their quantities, a short description of the preparation, and the yield factor used; (2) a list of nutrient retention factors (per food or food group)
- Select recipes to be included in the food composition table and database - Collect recipes, and list all ingredients and their quantities and the preparation method - Transform all ingredient quantities into gram edible portion - Collect and/or analyse yield and nutrient retention factors - Decide on recipe calculation system; enter all yield and nutrient retention factors necessary
Check results of recipe calculation and copy them into the reference databases - Run the calculation programme
- Document data (source of recipes and of yield and nutrient retention factors; recipe calculation system)
VIII.Q5 In many recipe books, the ingredients are not listed in grams but in units (e.g. one onion, two tablespoons of oil, half a cup of flour). Select the correct response to indicate how ideally, if not already existing for the country, weights of units and edible coefficients of ingredients should be obtained. (1 point)
Weight of units and edible coefficients of ingredients should be obtained as follows: copy them from other national databases (e.g. USDA) because they are the same in most countries.
sample (e.g. ten) food samples of each ingredient, weigh them with and without inedible part, record the dimensions and calculate the average weight and edible coefficient.
estimate them based on own judgment.
VIII.Q6 Recipes can be calculated using different methods, depending if and where yield and nutrient retention factors are applied. Factors can be applied at ingredient level (i.e. to the nutrient values of each ingredient) or recipe level (i.e. after summing the nutrient values of all ingredients). Match the method to the corresponding concept or definition. (2 points: ½ point for each correct response)

Module 8 – Questions
137
Methods: 1. Raw ingredient method, i.e. summing nutrient values of raw ingredients without applying any factors; 2. Ingredient method, i.e. yield and nutrient retention factors are applied at ingredient level; 3. Recipe method, i.e. yield and nutrient retention factors are applied at recipe level; 4. Mixed method, i.e. yield factor is applied at recipe level and nutrient retention factors at ingredient level.
Corresponding definition and concept
Ingredient 1: NV x RF Ingredient 2: NV x RF Ingredient 3: NV x RF ----------------------------------------------------- Recipe: Sum of above x 1/YF
Ingredient 1: NV Ingredient 2: NV Ingredient 3: NV -------------------------------------------------------- Recipe: Sum of above
Ingredient 1: NV Ingredient 2: NV Ingredient 3: NV -------------------------------------------------------------- Recipe: Sum of above x 1/YF x RF
Ingredient 1: NV x 1/YF x RF Ingredient 2: NV x 1/YF x RF Ingredient 3: NV x 1/YF x RF ------------------------------------------------------- Recipe: Sum of above
NV= nutrient values, YF = yield factor, RF = nutrient retention factor VIII.Q7 Indicate the correct response(s) to show whether nutrient retention factors exist for all foods, recipes and food/recipe groups. Select True or False. (2 points: ½ point for each correct response)
Nutrient retention factors exist for: True False all food groups all foods and ingredients all recipes all recipe groups
VIII.Q8 How should yield and nutrient retention factors ideally be obtained? Determine the correct order of the responses to obtain high-quality data; 1 being of the highest quality and 4 the lowest. (2 points: ½ point for each correct response) Order Yield and nutrient retention factors can be obtained by:
calculating the yield factor of a recipe based on the yield factors of its ingredients, which can only be done if the yield factors of all ingredients are known, or by copying yield factors from the literature while prioritizing factors deriving from similar recipes.
estimating them based on own judgment. weighing the food or recipe before and after cooking, or by analysing the nutrient content of the recipe before and
after cooking. copying factors from more or less similar foods and recipes, with the aim of having a complete set of factors.

Module 8 – Questions
138
VIII.Q9 It may happen that nutrient values are missing for some ingredients. Select the correct response to indicate how to deal with this problem in recipe calculations. (1 point) Dealing with missing nutrient values in ingredients when calculating recipes Build the sum of the nutrient values of all ingredients, irrespective of whether values are missing for any of
the ingredients. Build the sum of the nutrient values of all ingredients only if there are no missing values for any ingredient,
or if a missing value belongs to a minor ingredient, or if the missing value is expected to make only a small nutrient contribution to the recipe.
Build the sum of the nutrient values of all ingredients, irrespective of whether values are missing for main ingredients.
VIII.Q10 In any given country, recipes may be named differently even with the same ingredients; or may have the same name but contain different ingredients depending on the region; or there may be differences in the recipe composition for selected ingredients. Select the correct response to indicate how to deal with this problem. (1 point) Dealing with different names and ingredients for same recipe State the same recipe name but change the ingredients. Add the altering ingredient to the recipe name and change the ingredients accordingly. It is not necessary to add
the region to the name as people will be able to identify the regional-specific recipe through the list of ingredients. Add the varying ingredients and/or region to the recipe name (and probably the synonym name) and change the
ingredients accordingly. VIII.Q11 List four of the possible sources of error in recipe calculations. (4 points: 1 point for each correct response) 1. 2. 3. 4. VIII.Q12 The nutrient values of recipes can be either calculated or analysed. It is very expensive to analyse recipes but their nutrient values are precise. The calculation of nutrient values of recipes is cheap and provides a great deal of flexibility, but results in a lower quality compared with original analytical data. There are other advantages and disadvantages to these approaches. Select from the following statements the reasons why compilers of food composition tables and databases would calculate component values using recipes and other calculation/estimation procedures as opposed to analysing them. Select True or False. (3 points: ½ point for each correct response) Reasons why compilers of food composition tables and databases should calculate and estimate component values for recipes
True False
Recipe calculations are needed because recipes cannot be analysed with a good degree of precision.
It is better to have lower quality values (through recipes and estimations) than missing values.
Because the intra- and interpersonal variation in the preparation of recipes is greater than the precision of calculated or analysed nutrient values of recipes, it is appropriate to calculate the nutrient values of recipes consumed by the population.

Module 8 – Questions
139
Reasons why compilers of food composition tables and databases should calculate and estimate component values for recipes
True False
Most users need data on recipes, especially in countries where recipes represent a high proportion of the total food intake. Compilers can make these calculations more easily and normally at a higher quality than the users. Therefore, it would be preferable to publish calculated recipes in food composition tables and databases.
Recipe calculation methods are also used to calculate the nutrient composition of cooked foods (i.e. single-ingredient recipe calculation). But as the nutrient composition of cooked foods is the same as that of raw foods, there is no need to calculate the nutrient values of cooked foods.
Missing nutrient values (e.g. missing vitamin C value of a fruit stew) are not important because they do not influence nutrient intake estimations. All missing values can be estimated as zero.
VIII.Q13 In the following text, strike through the options that are incorrect. (4.5 points: ½ point for each correct response) Recipes are analysed because these data are of low/high quality. The disadvantages when analysing a recipe are: (1) that in the analysed recipe, all ingredients and their quantities are fixed/flexible i.e. no/some ingredients can be changed without introducing changes in at least one of the analysed nutrient values; and (2) the preparation of the recipe often represents its preparation by one population/person. The nutrient values of a recipe can/cannot be calculated from a similar recipe that has been analysed. Recipes are little/highly variable in their composition of ingredients, depending on preferences and the availability of ingredients. The analysed nutrient values for a recipe are only applicable to the fixed quantity of all/some ingredients in the analysed recipe, which means that the analysis of recipes is cost-effective/not cost-effective. It is more/less cost-effective to analyse the raw ingredients of the recipes and then calculate the different recipes based on the analysed ingredients, rather than analysing each recipe separately. VIII.Q14 Data are missing in most food composition tables and databases. Match the correct expressions to the corresponding definition. (2 points: ½ point for each correct response)
Expressions: 1. Missing value 2. Missing food 3. Missing nutrient 4. Missing documentation
Corresponding definitions
A nutrient is missing for all foods. A value is missing for a food, (e.g. nutrient value, edible (or refuse) value, density value). Metadata are not available to explain the value. The food or recipe and its nutrient values are not reported.
VIII.Q15 List three approaches to complete missing values in a food composition database. (3 points: 1 point for each correct response) 1. 2. 3.
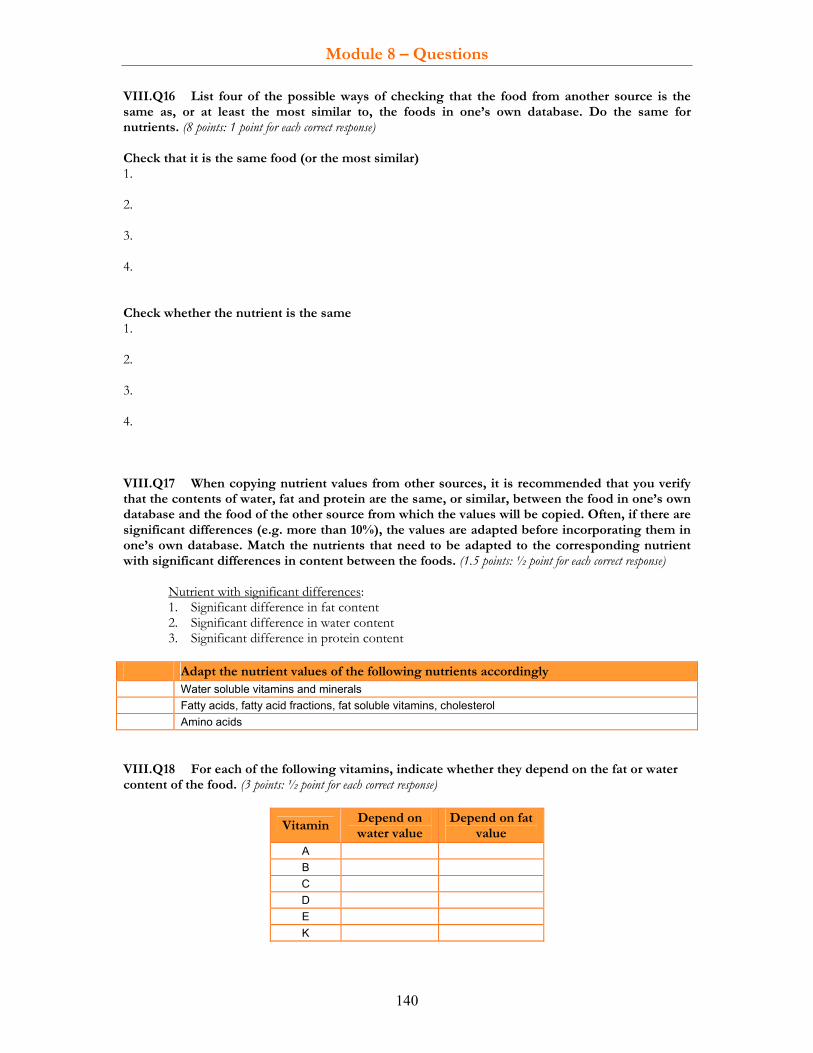
Module 8 – Questions
140
VIII.Q16 List four of the possible ways of checking that the food from another source is the same as, or at least the most similar to, the foods in one’s own database. Do the same for nutrients. (8 points: 1 point for each correct response) Check that it is the same food (or the most similar) 1. 2. 3. 4. Check whether the nutrient is the same 1. 2. 3. 4. VIII.Q17 When copying nutrient values from other sources, it is recommended that you verify that the contents of water, fat and protein are the same, or similar, between the food in one’s own database and the food of the other source from which the values will be copied. Often, if there are significant differences (e.g. more than 10%), the values are adapted before incorporating them in one’s own database. Match the nutrients that need to be adapted to the corresponding nutrient with significant differences in content between the foods. (1.5 points: ½ point for each correct response)
Nutrient with significant differences: 1. Significant difference in fat content 2. Significant difference in water content 3. Significant difference in protein content
Adapt the nutrient values of the following nutrients accordingly
Water soluble vitamins and minerals Fatty acids, fatty acid fractions, fat soluble vitamins, cholesterol Amino acids
VIII.Q18 For each of the following vitamins, indicate whether they depend on the fat or water content of the food. (3 points: ½ point for each correct response)
Vitamin Depend on water value
Depend on fat value
A B C D E K
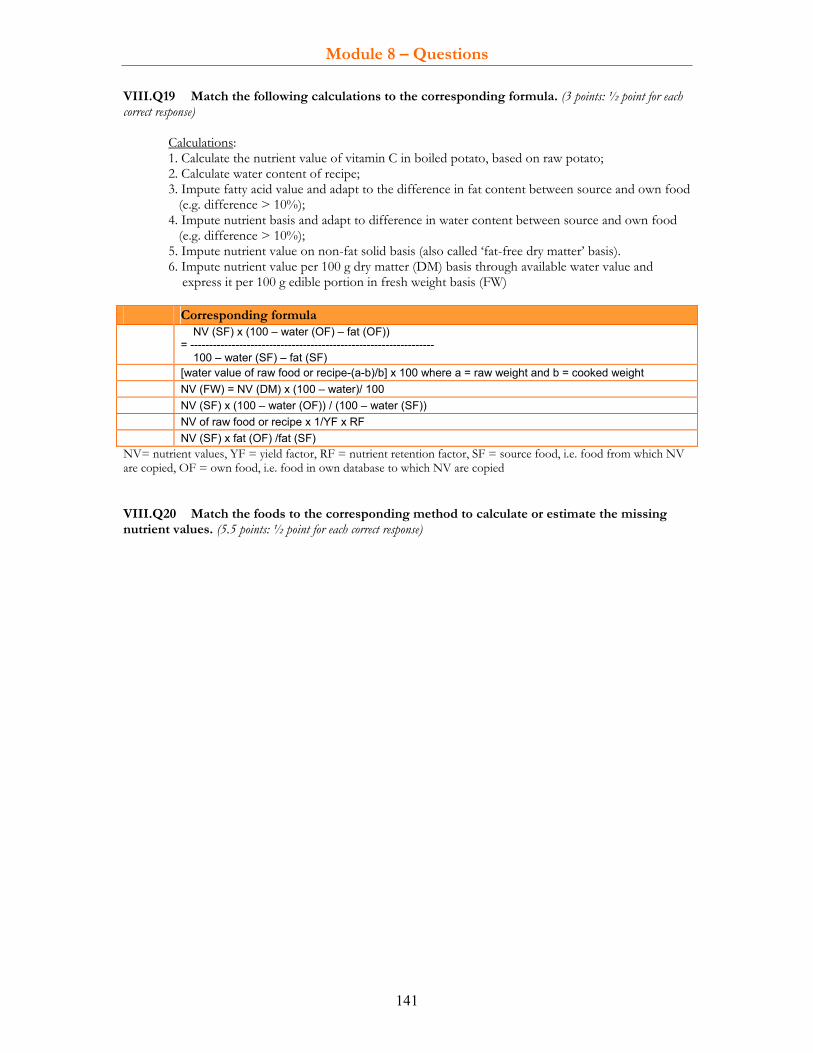
Module 8 – Questions
141
VIII.Q19 Match the following calculations to the corresponding formula. (3 points: ½ point for each correct response)
Calculations: 1. Calculate the nutrient value of vitamin C in boiled potato, based on raw potato; 2. Calculate water content of recipe; 3. Impute fatty acid value and adapt to the difference in fat content between source and own food (e.g. difference > 10%); 4. Impute nutrient basis and adapt to difference in water content between source and own food (e.g. difference > 10%); 5. Impute nutrient value on non-fat solid basis (also called ‘fat-free dry matter’ basis). 6. Impute nutrient value per 100 g dry matter (DM) basis through available water value and express it per 100 g edible portion in fresh weight basis (FW)
Corresponding formula
NV (SF) x (100 – water (OF) – fat (OF)) = ----------------------------------------------------------------- 100 – water (SF) – fat (SF)
[water value of raw food or recipe-(a-b)/b] x 100 where a = raw weight and b = cooked weight NV (FW) = NV (DM) x (100 – water)/ 100 NV (SF) x (100 – water (OF)) / (100 – water (SF)) NV of raw food or recipe x 1/YF x RF NV (SF) x fat (OF) /fat (SF)
NV= nutrient values, YF = yield factor, RF = nutrient retention factor, SF = source food, i.e. food from which NV are copied, OF = own food, i.e. food in own database to which NV are copied VIII.Q20 Match the foods to the corresponding method to calculate or estimate the missing nutrient values. (5.5 points: ½ point for each correct response)
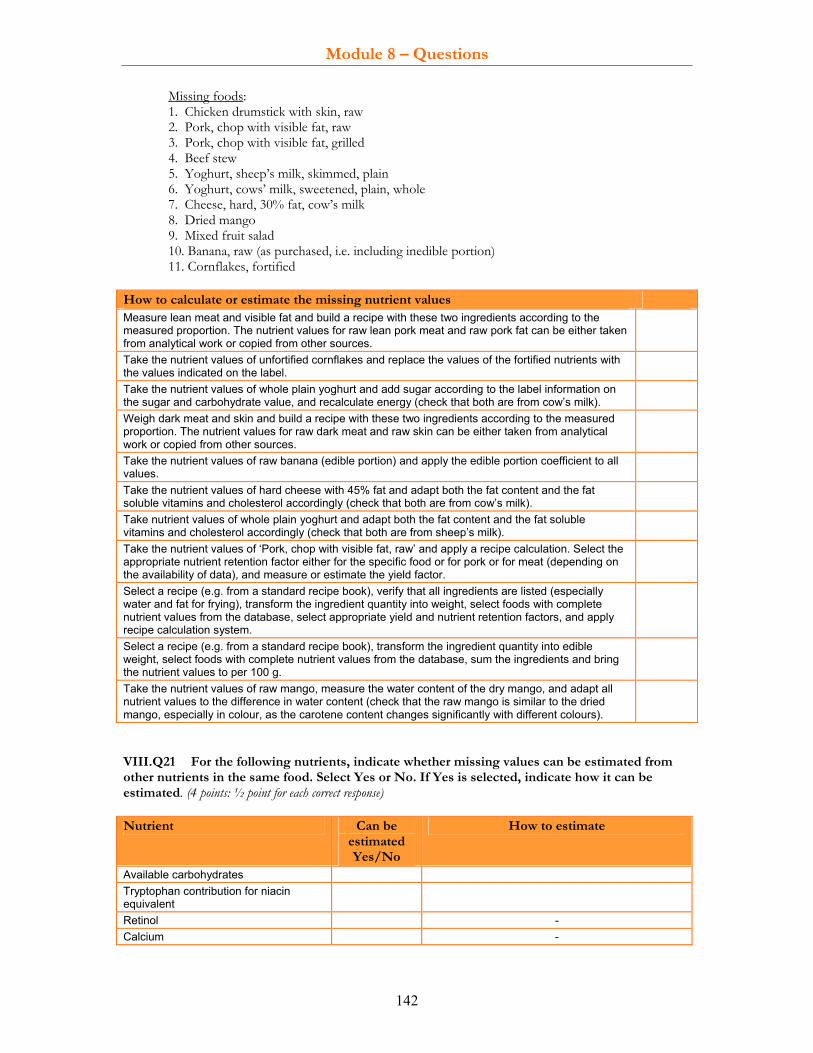
Module 8 – Questions
142
Missing foods: 1. Chicken drumstick with skin, raw 2. Pork, chop with visible fat, raw 3. Pork, chop with visible fat, grilled 4. Beef stew 5. Yoghurt, sheep’s milk, skimmed, plain 6. Yoghurt, cows’ milk, sweetened, plain, whole 7. Cheese, hard, 30% fat, cow’s milk 8. Dried mango 9. Mixed fruit salad 10. Banana, raw (as purchased, i.e. including inedible portion) 11. Cornflakes, fortified
How to calculate or estimate the missing nutrient values Measure lean meat and visible fat and build a recipe with these two ingredients according to the measured proportion. The nutrient values for raw lean pork meat and raw pork fat can be either taken from analytical work or copied from other sources.
Take the nutrient values of unfortified cornflakes and replace the values of the fortified nutrients with the values indicated on the label.
Take the nutrient values of whole plain yoghurt and add sugar according to the label information on the sugar and carbohydrate value, and recalculate energy (check that both are from cow’s milk).
Weigh dark meat and skin and build a recipe with these two ingredients according to the measured proportion. The nutrient values for raw dark meat and raw skin can be either taken from analytical work or copied from other sources.
Take the nutrient values of raw banana (edible portion) and apply the edible portion coefficient to all values.
Take the nutrient values of hard cheese with 45% fat and adapt both the fat content and the fat soluble vitamins and cholesterol accordingly (check that both are from cow’s milk).
Take nutrient values of whole plain yoghurt and adapt both the fat content and the fat soluble vitamins and cholesterol accordingly (check that both are from sheep’s milk).
Take the nutrient values of ‘Pork, chop with visible fat, raw’ and apply a recipe calculation. Select the appropriate nutrient retention factor either for the specific food or for pork or for meat (depending on the availability of data), and measure or estimate the yield factor.
Select a recipe (e.g. from a standard recipe book), verify that all ingredients are listed (especially water and fat for frying), transform the ingredient quantity into weight, select foods with complete nutrient values from the database, select appropriate yield and nutrient retention factors, and apply recipe calculation system.
Select a recipe (e.g. from a standard recipe book), transform the ingredient quantity into edible weight, select foods with complete nutrient values from the database, sum the ingredients and bring the nutrient values to per 100 g.
Take the nutrient values of raw mango, measure the water content of the dry mango, and adapt all nutrient values to the difference in water content (check that the raw mango is similar to the dried mango, especially in colour, as the carotene content changes significantly with different colours).
VIII.Q21 For the following nutrients, indicate whether missing values can be estimated from other nutrients in the same food. Select Yes or No. If Yes is selected, indicate how it can be estimated. (4 points: ½ point for each correct response) Nutrient Can be
estimated Yes/No
How to estimate
Available carbohydrates Tryptophan contribution for niacin equivalent
Retinol - Calcium -

Module 8 – Questions
143
EXERCISES
VIII.E1 A food consumption survey was carried out in South Africa and the recipe ‘omelette with onions and tomatoes’ was reported. The ingredients and their quantities were taken from a standard recipe book. Transform the ingredient quantities into gram edible portions of the recipe and round the weights so that they end with 0 or 5 g. For example, 111.5 g butter to be rounded down to 110 g. (5 points: 1 point for each correct response) Available data: 1 extra large egg = 58 g (USDA) 1 small egg = 38 g (USDA) 1 egg = 50 g (McCance and Widdowson’s tables – United Kingdom) 1 egg = 45 g (measured in South Africa) 1 cup of chopped onions = 160 g (USDA) 1 onion = 170 g (South Africa) 1 large tomato = 182 g (USDA) 1 medium tomato = 123 g (USDA) 1 small tomato = 91 g (USDA) 1 medium tomato = 100 g (South Africa) 1 small tomato = 80 g (South Africa) 1 tablespoon = 15 mL (own measurement) 1 teaspoon = 5 mL (own measurement) Density of milk = 1.03g/mL (McCance and Widdowson’s tables – United Kingdom) Density of butter = 0.96g/mL (own measurement) Edible coefficient of onion = 0.9 (own measurement) Edible coefficient of egg = 0.95 (own measurement) Edible coefficient of tomato = 0.91 (own measurement) Volume in mL x density factor = weight in g
‘Omelette with onions and tomatoes’, with the ingredients shown in the recipe book
Ingredient weight in edible portion
2 eggs
2 tablespoons milk
1 teaspoon butter
1 large onion
2 small tomatoes
VIII.E2 Answer the following questions. (7 points: 1 point for each correct response) Questions Responses A raw steak of 200 g is fried and thereafter has a weight of 150 g. How much is the yield factor?
In the above raw steak, there is 20 g protein per 100 g. How much protein is in fried steak?
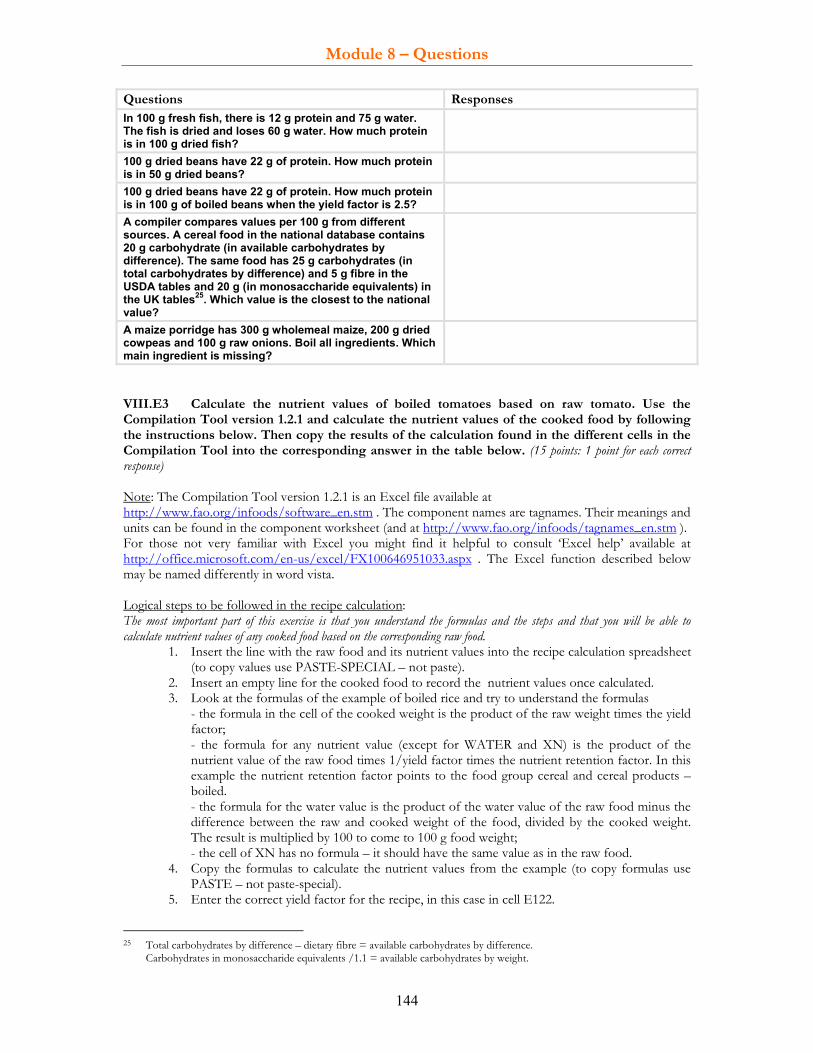
Module 8 – Questions
144
Questions Responses In 100 g fresh fish, there is 12 g protein and 75 g water. The fish is dried and loses 60 g water. How much protein is in 100 g dried fish?
100 g dried beans have 22 g of protein. How much protein is in 50 g dried beans?
100 g dried beans have 22 g of protein. How much protein is in 100 g of boiled beans when the yield factor is 2.5?
A compiler compares values per 100 g from different sources. A cereal food in the national database contains 20 g carbohydrate (in available carbohydrates by difference). The same food has 25 g carbohydrates (in total carbohydrates by difference) and 5 g fibre in the USDA tables and 20 g (in monosaccharide equivalents) in the UK tables25. Which value is the closest to the national value?
A maize porridge has 300 g wholemeal maize, 200 g dried cowpeas and 100 g raw onions. Boil all ingredients. Which main ingredient is missing?
VIII.E3 Calculate the nutrient values of boiled tomatoes based on raw tomato. Use the Compilation Tool version 1.2.1 and calculate the nutrient values of the cooked food by following the instructions below. Then copy the results of the calculation found in the different cells in the Compilation Tool into the corresponding answer in the table below. (15 points: 1 point for each correct response) Note: The Compilation Tool version 1.2.1 is an Excel file available at http://www.fao.org/infoods/software_en.stm . The component names are tagnames. Their meanings and units can be found in the component worksheet (and at http://www.fao.org/infoods/tagnames_en.stm ). For those not very familiar with Excel you might find it helpful to consult ‘Excel help’ available at http://office.microsoft.com/en-us/excel/FX100646951033.aspx . The Excel function described below may be named differently in word vista. Logical steps to be followed in the recipe calculation: The most important part of this exercise is that you understand the formulas and the steps and that you will be able to calculate nutrient values of any cooked food based on the corresponding raw food.
1. Insert the line with the raw food and its nutrient values into the recipe calculation spreadsheet (to copy values use PASTE-SPECIAL – not paste).
2. Insert an empty line for the cooked food to record the nutrient values once calculated. 3. Look at the formulas of the example of boiled rice and try to understand the formulas
- the formula in the cell of the cooked weight is the product of the raw weight times the yield factor; - the formula for any nutrient value (except for WATER and XN) is the product of the nutrient value of the raw food times 1/yield factor times the nutrient retention factor. In this example the nutrient retention factor points to the food group cereal and cereal products – boiled. - the formula for the water value is the product of the water value of the raw food minus the difference between the raw and cooked weight of the food, divided by the cooked weight. The result is multiplied by 100 to come to 100 g food weight; - the cell of XN has no formula – it should have the same value as in the raw food.
4. Copy the formulas to calculate the nutrient values from the example (to copy formulas use PASTE – not paste-special).
5. Enter the correct yield factor for the recipe, in this case in cell E122.
25 Total carbohydrates by difference – dietary fibre = available carbohydrates by difference. Carbohydrates in monosaccharide equivalents /1.1 = available carbohydrates by weight.

Module 8 – Questions
145
6. Adapt the formula to calculate the nutrient values to point to the correct yield and nutrient retention factors and the correct cells containing the nutrient value of the raw food (in this case of raw tomato) and copy the adapted formula to all values except for WATER and XN. - in the formula for the nutrient value for energy (R123) change the number of the cell of the retention factor so that it points to the one of the food group ‘Vegetables and vegetable products’ – boiled; and change the number of the yield factor to point always to the yield factor of this recipe (i.e. E121 for boiled tomato). The $ sign in front of E and 121 is necessary to indicate to the computer to always point to this one specific cell, when the formula is copied to calculate other nutrient values for the remaining nutrients; - copy the formula to the other nutrients, except to WATER and XN - the formula of water remains unchanged - copy in the cell of XN the value of XN of the raw food (raw tomato)
7. Check that you have made the calculation correctly and that no 0 value was generated by accident (if no value exists for raw tomato and the formula is entered, Excel will generate a 0 value for cooked tomato).
8. Copy the newly-generated nutrient values to the inserted line (see step 2) for boiled tomato (with PASTE-SPECIAL) and then copy the line from the recipe calculation spreadsheet to the reference database spreadsheet where you also should document the new values.
Specific instructions for the Excel file exercise: Please remember that working with Excel calls for a very careful work – any error in a formula or in copying and pasting (paste-special for values or paste for formulas) or inserting results in wrong calculations. Therefore, always check that formulas point to the appropriate cells and think before using ‘paste’, ’paste special’ or ‘insert’ if this is the correct function you need to apply.
1. Copy line 21 (tomato, ripe, raw – final record) from the worksheet ‘reference database’ and paste it into the worksheet ‘recipe calculations’ at line 120. Use the function PASTE SPECIAL – VALUES.
2. Copy line 23 (tomato, boiled) from the worksheet ‘reference database’ and paste it into the worksheet ‘recipe calculations’ into line 119.
Then in worksheet ‘recipe calculation’ do the following:
1. Copy lines 37-40 into lines 121-124 (i.e. copy all formulas for single-ingredient recipe calculation from the example of boiled rice to calculate the nutrient values of boiled tomato based on raw tomato).
2. Put 100 (for 100 g) into cell E120 and 1 for edible factor for boiled tomato (cell Q123) as boiled tomato is 100% edible.
3. Enter the yield factor of 0.8 (Bergström, 1994) into E122 and the system will calculate the cooked weight (see change in cell E121 – the cooked weight becomes 80 g, calculated from 100 g raw tomato by applying the yield factor of 0.8).
4. Now, you need to adjust the formula so that it points to the nutrient retention factor for boiled vegetables and to the yield factor of boiled tomato. Change the formula in the first nutrient (ENERC-kJ original) in cell R123. The formula should read: =R120*1/$E$122*R63 (Do not forget = at the beginning of the formula, if not the system does not recognize that the cell contains a formula.)
5. Except for WATER and XN copy this formula to all cells in line 123 which have a nutrient value in line 120 (if you apply the formula to a cell which does not have a nutrient value in raw tomato Excel will create a zero value for boiled tomato. This would be a major error. So care should be taken to avoid creating zero values for boiled tomato).
6. For XN, take the same value as in the raw food (XN does not change with cooking). 7. For WATER, there is a special formula. The system automatically calculates the water content for
100 g of cooked dish based on the entered formula. 8. Check that you have calculated a nutrient value for boiled tomato only if there was a value in line
120 of raw tomato (delete the 0 if there were no values in the line of raw tomato - if not you are creating zero values for missing values which, as said before, would be a major error!!).

Module 8 – Questions
146
9. Copy with PASTE SPECIAL - VALUE (if you do just PASTE you would copy the formulas) the nutrient values of line 123 into line 119 of 100 g ‘Tomato, boiled’ and then copy the entire line 119 into the worksheet ‘reference database’ into line 23 of boiled tomato.
Congratulations Now verify that you have made the calculation correctly by answering the following questions. Please copy the numbers or formulas from the Compilation Tool into the corresponding answer. Questions Responses (copy the corresponding figure
or formula from the Compilation Tool) Cooked weight Formula to calculate water (in cell V123) Chosen food category for nutrient retention factors Formula to calculate fat content (FAT standardized) of boiled tomato is =AB120*1/$E$122*AB63. What is $E$122?
Values of boiled tomato ------------ • Edible coefficient
• XN (two decimal places)
• WATER (one decimal place)
• Standardized fat (two decimal places)
• Standardized carbohydrates (two decimal places)
• Standardized dietary fibre (two decimal places)
• Standardized vitamin A (two decimal places)
• Riboflavin (three decimal places)
• Fatty acid 4:0, undifferentiated (two decimal places)
• Lysine (two decimal places) Would the calculated nutrient values be different if the ingredient or recipe method would be applied? Select yes or no.
VIII.E4 Calculate the nutrient values of the recipe ‘Fried rice with tomato’ using the mixed recipe method. Use the Compilation Tool version 1.2.1 and calculate the nutrient values of the recipe by following the instructions below. Then answer the following questions based on the calculations made in the Excel spreadsheet. (15 points: 1 point for each correct response)
Fried rice with tomato 200 g boiled white rice 150 g raw tomatoes 30 g margarine Cooking Instructions: fry the tomatoes with the margarine, add the boiled rice and fry for some minutes.
Water loss: 10%
Logical steps to be followed in the recipe calculation: The most important part of this exercise is that you understand the formulas and the steps and that you will be able to calculate any nutrient values of any recipe based on the corresponding raw ingredients.
1. Insert the lines with the raw foods and their nutrient values into the recipe calculation spreadsheet (to copy values use PASTE-SPECIAL – not paste). They have nutrient values per 100 g.
2. Insert an empty line for the recipe to record the nutrient values once calculated.
Module 8 – Questions
147
3. Create for each ingredient a line and adapt the weight of each ingredient according to their edible weight in the recipe.
4. Choose a recipe calculation system (recipe or ingredient or mixed method). 5. Look at the formulas of the recipe example and try to understand the formulas.
- the formula in the cell of the cooked weight of the recipe is the product of the raw weight times the yield factor. No adaptation of the formula is needed; - the formula in every nutrient value of the ingredients is constructed in the same way (except for XN and WATER): it is the product of the nutrient value of the raw food times its proportion in the recipe, times the nutrient retention factor of the food group and the corresponding cooking method. In this example, energy of 200 g white boiled rice is calculated with the formula ‘=R126*($E$131/100)*R33’ pointing to the nutrient value of raw white rice for 100 g (R126) which is multiplied (*) by the weight of rice in the recipe (E131) divided by 100 to indicate the proportion of cooked rice in the recipe; then it is multiplied by the nutrient retention factor of the food group cereal and cereal products – boiled (R33). The $ sign in front of E and 131 is necessary to indicate to the computer to always point to this one specific cell (weight of rice in the recipe), also when the formula is copied to calculate other nutrient values for the remaining nutrients - the formula of the sum of the nutrient values of all ingredients in the recipe indicates the sum of the nutrient value in the recipe. Example: =SUM(R131:R133) indicates that the sum is calculated from the nutrient values of energy from the three ingredients in the recipe. An adaptation is necessary if a different number of ingredients is included. E.g., if there are 4 ingredients, the sum must include all four ingredients. - the formula of the nutrient values of the recipe in 100 g is constructed in the same way (except for WATER and XN): it is the product of the sum of nutrient values of the ingredients divided (/) by the weight of the cooked recipe and multiplied by 100 to come to nutrient values per 100 g recipe. Example: ‘=R134/$E$135*100’ means that the sum of energy values of the ingredients (R134) is divided (/) by the weight of the cooked recipe (E135) and multiplied by 100 to come to nutrient values per 100 g recipe. The $ sign in front of E and 135 is necessary to indicate to the computer to always point to this one specific cell (weight of the cooked recipe), also when the formula is copied to calculate other nutrient values for the remaining nutrients; - the formula for the water value is the product of the water value of the raw food minus the difference between the raw and cooked weight of the food, divided by the cooked weight. The result is multiplied by 100 to come to 100 g food weight. No adaptation should be done to the formula; - the formula of the cell of XN is the product of the protein value divided (/) by the nitrogen value. Example: ‘=Y137/X137’ means that the protein value (Y137) is divided by the nitrogen value (X137). No adaptation should be done to the formula.
6. Copy the formulas to calculate the nutrient values from the example (to copy formulas use PASTE – not paste-special).
7. Enter the correct yield factor for the recipe, in this case in cell E136. 8. Adapt the formula to calculate the nutrient values to point to the correct yield and nutrient
retention factors and the correct cells containing the nutrient value of the raw foods and copy the adapted formula to all values except for WATER and XN.
- No adaptation should be done to the formula in the cells for the cooked weight of the recipe, WATER and XN; - In this example, adapt energy of 200 g white boiled rice which is calculated with the formula ‘=R126*($E$131/100)*R33’ pointing to the nutrient value of raw while rice for 100 g (R126) which is multiplied (*) by the weight of rice in the recipe (E131) divided by 100 to indicate the proportion of cooked rice in the recipe; then it is multiplied by the nutrient retention factor of the food group ‘cereal and cereal products – boiled’ (R33). The $ sign in front of E and 131 is necessary to indicate to the computer to always point to this one specific cell (weight of rice in the recipe), also when the formula is copied to calculate other nutrient values for the remaining nutrients. Do the same for the energy values for tomatoes and margarine, which should point to the retention factors of the groups ‘vegetables – frying’ and ‘fats and oil – frying’, respectively.

Module 8 – Questions
148
- Adapt for example: =SUM(R131:R133) which indicates that the sum is calculated from the nutrient values of energy from the three ingredients in the recipe. In this case, no adaptation is necessary as the recipe has three ingredients. However, an adaptation is necessary if a different number of ingredients is included. E.g., if there are 4 ingredients, the sum must include all four ingredients. Do not forget to adapt also the sum of the weights of the ingredients in the recipe (E134), if necessary. - Adapt for example: ‘=R134/$E$135*100’ which means that the sum of energy values of the ingredients (R134) is divided (/) by the weight of the cooked recipe (E135) and multiplied by 100 to come to nutrient values per 100 g recipe. The $ sign in front of E and 135 is necessary to indicate to the computer to always point to this one specific cell (weight of the cooked recipe), also when the formula is copied to calculate other nutrient values for the remaining nutrients. - In this example, copy all adapted cells for energy (R131 to R137) and paste them into the corresponding cells of the other nutrients (except for WATER and XN).
9. Check that you have made the calculation correctly and that no 0 value was generated by accident (if no value exists for all ingredients and the formula is entered, Excel will generate a 0 value for recipe).
10. Copy the newly-generated nutrient values to the inserted line (see step 2) for the recipe (with PASTE-SPECIAL) and then copy the line from the recipe calculation spreadsheet to the reference database spreadsheet where you also should document the new values.
Specific instructions for the Excel file exercise: Please remember that working with Excel calls for a very careful work – any error in a formula or in copying and pasting (paste-special for values or paste for formulas) or inserting results in wrong calculations. Therefore, always check that formulas point to the appropriate cells and think before using ‘paste’, ’paste special’ or ‘insert’ if this is the correct function you need to apply.
1. In the ‘reference database’ worksheet, create a new record in line 33: enter the recipe name, the food code 0101015, R for recipe (into cell D33), the record number 1, and the source (‘calc. with mixed method’). Then copy this line to the worksheet ‘recipe calculation’ into line 130.
2. From the worksheet ‘reference database’, copy lines 8 (Rice, white, short-grain, boiled), 21 (Tomato, ripe, raw – final record), and 25 (Margarine, 80% fat, vegetable fat) and paste them into the worksheet ‘recipe calculation’ into lines 126, 127 and 128, respectively. Use the function PASTE SPECIAL – VALUES. Put 100 into cells E126-E128 and E130 to indicate that the nutrient values are per 100 g.
Then in the recipe calculation worksheet do the following:
1. Copy lines 126-128 to lines 131-133, respectively. 2. Put the above-mentioned weight of the ingredients into cells E131-E133 (200, 150 and 30
respectively). 3. Except for XN, adapt all nutrient values of the ingredients (lines 131-133) to the ingredient
weights in the recipe and to the corresponding nutrient retention factor. For example, in cell R131 put formula =R126*($E$131/100)*R32 (adaptation of nutrient value to different weight of ingredient in recipe, and pointing to nutrient retention factors for baked cereals and cereal products). In cell R132 put formula =R127*($E$132/100)*R64 (pointing to weight of tomato and nutrient retention factors for fried vegetable and vegetable products); and in cell R133 put formula =R128*($E$133/100)*R74 (pointing to weight of margarine and to nutrient retention factors for fried fat and oils). Do not forget to put = in front of the formula and the $ signs in front of E and 131 – if not the formulas do not work. Then copy the formula to all cells where there are nutrient values in the corresponding food with values per 100 g. In this way, the nutrient retention factors are applied at ingredient level.
4. Copy lines 87-91 into lines 134-138 (i.e. to copy the formulas of the mixed recipe calculation method to our recipe).
5. Enter the correct yield factor (0.9) into cell E136 and the system will calculate the cooked weight automatically (if this is not done automatically you have to copy lines 87-91 again and paste them into 134-138; pay attention not to use PASTE SPECIAL – values).

Module 8 – Questions
149
6. Verify that, for the first nutrient, the sum of the nutrient values captures all ingredients of the recipe. For example, in cell R134, the formula should be =SUM(R131:R133). Then copy the formula to all nutrients of the recipe (including WATER but excluding XN).
7. Calculate the nutrient values per 100 g recipe (except for WATER and XN). The formula corresponds to the nutrient values of 100 g cooked dish = (sum raw nutrient values including retention factor/cooked weight) x 100 (e.g. in cell R137, the formula should be =R134/$E$135*100 which means that the sum of energy values of the ingredients (R134) is divided (/) by the weight of the cooked recipe (E135) and multiplied by 100 to come to nutrient values per 100 g recipe. The $ sign in front of E and 135 is necessary to indicate to the computer to always point to this one specific cell (weight of the cooked recipe), also when the formula is copied to calculate other nutrient values for the remaining nutrients. In this way, the nutrient yield factors are applied at recipe level.
8. The system automatically calculates the water content for 100 g cooked dish based on the entered formula. 9. The system automatically calculates the value of XN by dividing the protein value by the nitrogen value: XN = PROCNT (PROT)/ NT. 10. Check that you have calculated the nutrient values only for those nutrients which have a value in the line of the ingredients with 100 g ingredient (delete the 0 if there were no values in the ingredient - if not, you are creating zero values for all missing values, which would be a major error!!). 11. Enter edible coefficient 1. 12. Copy with PASTE SPECIAL - VALUE (if you do just PASTE, you would copy the formulas) the nutrient values of line 137 (starting edible coefficient) into line 130 of 100 g fried rice with tomato and then copy the entire line 130 into line 33 of the worksheet ‘reference database’. 13. To check your calculation enter the formula of the ‘sum of proximates (own DB)’ (DB stands for database) into cell O33 (copy the formula e.g. from cell O31).
Congratulations Now verify that you have made the calculation correctly by answering the following questions. Please copy the numbers or formulas from the Compilation Tool into the corresponding answer. Questions Responses Cooked weight Formula to calculate XN (in cell W123) Chosen food categories for nutrient retention factors Formula to calculate the standardized fat content of fried rice with tomato
Values of fried rice with tomato ------------------ • Edible coefficient
• XN (two decimal places
• Water (one decimal place)
• Standardized Fat (two decimal places)
• Standardized carbohydrates (two decimal places)
• Standardized dietary fibre (two decimal places)
• Iron (one decimal place)
• Riboflavin (three decimal places)
• fatty acid 18:1 N-9 (two decimal places)
• Lysine (two decimal places) Would the calculated nutrient values be different if the ingredient or recipe method were applied? Select yes or no

Module 8 – Questions
150
VIII.E5 Impute the calcium and retinol content of ‘Low-fat yoghurt, plain’ from ‘Whole yoghurt, plain’, and adapt the imputed values if the difference in fat or water is greater than 10%. Use the formulas of VIII.Q19. (4 points: 1 point for each correct response)
Note: Data are per 100 g edible portion
Water in g Fat in g Calcium in mg Retinol in mcg Whole yoghurt, plain 81.9 3.0 200 28 Low-fat yoghurt, plain (calculate by adapting for differences in water or fat content)
87.2 1.0
Low-fat yoghurt, plain (calculate on the basis of fat-free dry matter)
87.2 1.0
VIII.E6 When imputing or calculating missing values, a number of decisions have to be taken. For each question, select the most accurate answer and strike through the other(s). (8 points: 1 point for each correct response)
Questions Responses Estimate missing ash value (1 point)
• Sum up all minerals • Copy the ash value of the same food from the preferred FCDB • Copy from the preferred FCDB the ash value of a similar food
If the compilation is done in an Excel spreadsheet, is it possible to document nutrient values at the value level? (1 point)
• Yes, documentation is possible at food level (default for all data) and at value level (e.g. enter row below each line with nutrient values and document the value in cell below if default is not applicable and through the other worksheets) • No, documentation is only possible at food level • No, documentation is not possible
‘Orange, raw’ has a missing AOAC (Prosky) dietary fibre value in the Kenyan FCDB. Which food should be chosen to copy dietary fibre value from? (1 point)
• ‘Orange, raw’ from USDA (Prosky fibre) • ‘Orange, raw’ from British table (Englyst fibre) • ‘Orange, raw’ from FAO FCDB for Africa (crude fibre)
Boiled pasta is missing in the FCDB, while values for raw pasta exist. How can values for boiled pasta best be obtained? (1 point)
• Copy from British table as they have the same food • Calculate them in own FCDB by applying the mixed method • Calculate them in own FCDB by applying the raw ingredient method
Kellogg’s Cornflakes is not yet in the national FCDB in Thailand. It is a highly-consumed, non-fortified product and can be imported from the USA or Europe. How can values be obtained? (1 point)
• Ask the manufacturer in Thailand to provide data • Copy from USDA from same food • Copy from UK FCDB
Raw dark orange-flesh sweet potato has missing carotene values in Australia. Select the most appropriate way to obtain carotene values. (1 point)
• Copy NV from raw, orange-flesh sweet potato (USDA) • Copy NV from raw, orange-flesh sweet potato (UK) • Copy NV from raw sweet potato (New Zealand) • Average NV of all of them • Select the highest carotene values between USDA and UK
A compiler is looking for vitamin A values (in RAE) and finds data with different vitamin A definitions. Which data should be selected? (1 point)
• Take only data in RAE • Take data in RAE and data in RE if there are little or no carotenes • Take all vitamin A data
Dried lean beef is missing in the FCDB while NV for raw lean beef exists. How can values be obtained? (1 point)
• Measure/estimate water content of dried lean meat and calculate other nutrient values • Copy NV from other FCDB of dried fatty beef and change fat value • Copy NV from other FCDB of dried lean mutton
FCDB = food composition database; NV = nutrient values

Module 9 – Questions
151
Module 9 FOOD COMPOSITION DATABASE MANAGEMENT SYSTEMS AND DATA
INTERCHANGE
LEARNING OBJECTIVES By the end of this module the student will be able to:
understand the principles of database management and different options for managing food composition data;
discuss database management issues with developers and computer specialists; understand the principles of data interchange and its relation to documentation and database
management; appreciate the complexity of database management for food composition because of the great amount
of metadata. REQUIRED READING • Charrondière, U.R. Food composition database management systems and interchange. PowerPoint
Presentation. Available at: http://www.fao.org/infoods/presentations_en.stm and if possible: • Greenfield, H. & Southgate, D.A.T. 2003. Food composition data – production, management and use. FAO,
Rome. Chapter 1 (pp. 10-12 of the book, not of the PDF file). Available at: ftp://ftp.fao.org/docrep/fao/008/y4705e/y4705e00.pdf
• Klensin, J.C. 1992. INFOODS food composition data interchange handbook. United Nations University, Tokyo. Part I (Introduction to the interchange system, Technical overview, and Introduction to reference material) pp. 5-25 and Glossary pp. 143-148; these page numbers are of the PDF file. Available at: http://www.unu.edu/unupress/unupbooks/80774e/80774E00.htm or as PDF file at ftp://ftp.fao.org/es/esn/infoods/Klensin%201992INFOODSDataInterchangeHandbook.pdf
• FAO. 2004. Report of the Technical workshop on Standards for food composition data interchange, FAO, Rome. pp. 1-4. Available at: ftp://ftp.fao.org/es/esn/infoods/interchange.pdf
• Møller, A. & Christensen, T. in collaboration with Unwin, I., Roe, M., Pakkala, H. & Nørby, E. 2008. EuroFIR Web Services - Food Data Transport Package, Version 1.3. Danish Food Information. EuroFIR D1.8.20. pp. 5-6, 14-24. Available at: http://www.eurofir.net/?q=node/94
• EuroFIR, 2007. Proposal for structure and detail of a EuroFIR standard on food composition data. Prepared by Becker et al. pp. 5-11, 19-21, 26, 36-37 (other pages are suggested for further reading). Available at: http://www.eurofir.net/?q=node/94
EXERCISE MATERIAL • Compilation Tool version 1.2.1. Available at: http://www.fao.org/infoods/software_en.stm • FAO. 2004. Report of the Technical Workshop on Standards for food composition data interchange. FAO, Rome.:
schema (at ftp://ftp.fao.org/es/esn/infoods/schema.pdf) and ‘Set of files, elements and definitions’ at ftp://ftp.fao.org/es/esn/infoods/definitions.pdf
RELEVANCE FOR VARIOUS USERS (ON A SCALE OF + TO +++++) • Compilers/ professional users +++++ • Analysts +
Module 9 – Questions
152
ESTIMATED TIME TO COMPLETE TASKS • Required reading: 1–4 hours • Answering the questions: 1–2 hours • Completing the exercises: 1–2 hours SUGGESTED ADDITIONAL READING Food composition database management system and interchange • Schlotke, F., Becker, W., Ireland, J., Møller, A., Ovaskainen, M.L., Monspart, J. & Unwin, I.
2000. Eurofoods recommendations for food composition database management and data interchange. Report No. EUR 19538. Office for Official Publications of the European Communities, Luxembourg. Available at: ftp://ftp.fao.org/ag/agn/infoods/EurofoodsRecommendations.pdf
• EuroFIR technical website on Systems Development Task Group (WP1.8 TG3) http://eurofir.net/?q=node/94
• Møller, A. & Christensen, T. in collaboration with Unwin, I. & Roe, M. 2008. EuroFIR XML Food Data Transport Package Specifications - Draft Report 2006-08-20. Available at: http://eurofir.net/?q=node/94
• Møller, A., Unwin, M., Ireland, J., Roe, M., Becker, W. & Colombani, P. 2008. The EuroFIR Thesauri 2008. Danish Food Information. EuroFIR D1.8.22. Available at: http://eurofir.net/eurofir_knowledge/eurofir_thesauri
• Burlingame, B., Cook, F., Duxfield, G. & Milligan, G. 1995. Food Data: Numbers, Words and Images. In: Quality and Accessibility of Food-Related Data - Proceedings of the First International Food Data Base Conference. AOAC International - The Scientific Association Dedicated to Analytical Excellence, Second edition. Greenfield (ed)
Database management systems (in general) • http://dbis.ucdavis.edu/courses/sqltutorial/tutorial.pdf • MySQL
• http://oreilly.com/catalog/9780596514013/ • http://oreilly.com/catalog/9780596514334/ • http://oreilly.com/mysql/
• Entity-relationship (ER) models and diagrams: • http://www.csc.lsu.edu/~chen/pdf/erd-5-pages.pdf • http://citeseer.ist.psu.edu/old/519283.html • http://www.vocw.edu.vn/content/m10538/latest/ • http://channel9.msdn.com/shows/Going+Deep/Dr-Peter-Chen-Entity-Relationship-Model-Past-Present-and-Future/
• Relational databases • Klensin, J. & Romberg, R. Statistical Data Management Requirements and the SQL Standards:
An Evolving Comparison', in Rafanelli, M., Klensin, J. & Svensson, P. 1989. Statistical and Scientific Database Management: Fourth International Working Conference on Statistical and Scientific Database Management, Rome, Italy, June 1988, Proceedings. Springer-Verlag, Berlin/Heidelberg (Lecture Notes in Computer Science #339).
• http://www.amazon.com/Database-Depth-Relational-Theory-Practitioners/dp/0596100124/ref=sr_1_4?ie=UTF8&s=books&qid=1244151342&sr=1-4
• http://www.amazon.com/Database-Systems-Complete-Book-2nd/dp/0131873253/ref=sr_1_1?ie=UTF8&s=books&qid=1244153221&sr=1-1
• Scientific and Statistical Database Management: see Greenfield & Southgate, 2003, proceedings of annual conferences. Available at: http://www.ssdbm.org/
• XML (Extensible Markup Language) • http://www.w3.org/XML/ • http://www.w3schools.com/xml/xml_syntax.asp • http://www.xmlgrrl.com/publications/DSDTD/go01.html • http://www.xml.com/ • http://xml.sys-con.com/node/40070 • http://oreilly.com/catalog/9780596007645/ • http://www.xml.com/pub/a/axml/axmlintro.html
Module 9 – Questions
153
Questions IX.Q1 Match the terms to the corresponding objectives. (2 points: ½ point for each correct response)
Terms: 1. Documentation 2. Food composition database management system 3. Data interchange
Term Objectives
To provide the technical means for importing and exporting food composition data together with their metadata from and into one’s own database
To explain data by providing additional information (metadata) to be able to both evaluate them and trace their values back to the origins
To communicate food composition data to others in an precise and understandable manner To enable compilers to collect, document, compile and manage food composition data using
standard procedures, codes, symbols, thesauri, etc. IX.Q2 As documentation is crucial for food composition, every database management system should be able to handle data documentation. Indicate the data/metadata that are mandatory to understand food composition values and those that provide useful information. Indicate 1 for mandatory documentation, and 2 for documentation that provides additional useful information on the data. (7 points: ½ point for each correct response) Food composition documentation – mandatory (1) or optional (2)
Analytical method if the value is method-dependent, i.e. different analytical methods generate significantly different values (empirical methods)
Analytical method if the value is method-independent, i.e. all analytical methods provide similar results (rational method)
Authority and sender of data Bibliographic references or source of data Recipe calculation, including method, yield and nutrient retention factors, as well as the recipe with its
ingredients Component group Component name and definition, e.g. INFOODS tagnames26 Food name and description Food group Denominator (also called matrix unit, basis, base quantity, base unit) Portion size Sampling size, plan and handling Contributing values for mean or calculated values Unit
26 See module 4.b

Module 9 – Questions
154
IX.Q3 Match the data support to the corresponding advantages/disadvantages for data documentation. Multiple answers are possible. (3 points: ½ point for each correct response)
Data support: 1. Electronic files, e.g. Excel files or other spreadsheets 2. Compilers’ memory 3. Relational databases such MySQL, SQL, MS Access, ORACLE (as stand-alone
software in one computer, or network of different workstations, or web-based hyperlinks)
4. Paper documents 5. XML data files or equivalents
Term Advantages/disadvantages for data documentation
It is least prone to errors and allows for data entry and management of multidimensional documentation, even of large data sets.
It allows for very detailed data documentation but is rarely put into electronic format (e.g. because of lack of time); in most cases, it is archived in a storeroom and may ends up in a paper bin.
It allows data to be documented in electronic format and be exported for data interchange, but requires software proficiency and technical skills.
It allows data to be documented in electronic format, but multidimensional documentation is difficult. It calls for some technical skill and meticulous attention to managing the data.
It allows data to be documented in electronic format, but is very expensive and takes a long time to develop, customize and optimize.
It is not written anywhere, which makes it difficult to retrieve or trace the documentation and it is usually lost when people relocate or retire.
IX.Q4 Match the forms of relational databases to the corresponding advantages and disadvantages. In one case, multiple responses are possible. (2.5 points: ½ point for each correct response)
Relational databases: 1. Stand-alone software in one computer 2. Network of different workstations 3. Web-based
Advantages/disadvantages of different forms of relational databases
Several persons with Internet and user access can work on the database simultaneously Several persons linked to the same server can work on the database simultaneously Link to the database is independent of location Only one person can work on the database at a given time An efficient security system is needed to prevent viruses, unwanted access, etc.
IX.Q5 Determine the order of quality of database management system supports, from highest (1) to lowest (4). (2 points: ½ point for each correct response)
Rank Quality of database management system supports Electronic files, such as Excel Compilers’ memory Relational databases such MySQL, SQL, Access, ORACLE Paper documents
Module 9 – Questions
155
IX.Q6 List three files that are part of a food composition database management system (FCDBMS). (3 points: 1 point for each correct response) Note: It may be helpful to consult the Report (FAO, 2004) of the Technical Workshop on Standards for Food Composition Data Interchange, Rome, 19-22 January 2004: schema (at ftp://ftp.fao.org/es/esn/infoods/schema.pdf) and ‘Set of files, elements and definitions’ at ftp://ftp.fao.org/es/esn/infoods/definitions.pdf 1. 2. 3. IX.Q7 Interchange of food composition data can be done in an informal manner or in a given format. Select True or False. (4 points: ½ point for each correct response) Correct statements about interchange True False Interchange of food composition data permits data holders to share their data with other users.
Data interchange normally occurs without the consent of either the sender or the receiver. Data interchange requires that all types of data be packaged into a single file. A prerequisite for interchange of food composition data is the unambiguous identification of food components. Therefore, INFOODS published the food component identifiers (also called tagnames) and EuroFIR the component thesaurus.
Informal data interchange includes sending a simple food list of a food composition database without any compositional data because food names and descriptions are part of food composition data.
The INFOODS proposition on interchange of food composition data was not widely implemented, until recently, because SGML27 (and its profile XML28) was not fully understood by most compilers and computer specialist working on food composition and because of the lack of appropriate software tools. In addition, there were calls for a more formal and detailed list of elements to be included in data interchange.
The EuroFIR proposal on interchange of food composition data is based on XML and is implemented among their partners.
Interchange is facilitated by copyright restrictions.
27 Standard Generalised Markup Language, the language for structuring text upon which the Interchange Format
was designed. It is specified in International Standard ISO 8879. 28 Extensible Markup Language.

Module 9 – Questions
156
IX.Q8 XML is often used for data interchange. In order to be able to read an XML file, some basic definitions should be understood. Therefore, in the table below, write the correct term next to the corresponding section of the interchange file in XML. (3 points: ½ point for each correct response) Note: Explanations with regard to XML may be found at http://www.w3.org/XML/ and definitions of terms at http://www.w3schools.com/xml/xml_syntax.asp and http://www.xmlgrrl.com/publications/DSDTD/go01.html
Terms and definitions: • Element is defined by ISO 8879 as “A component of the hierarchical structure defined by a
document type definition; it is identified in a document instance by descriptive markup, usually a start-tag and end-tag.”
• Start tag is defined by ISO 8879: “Descriptive markup that identifies the start of an element and specifies its generic identifier and attributes.”
• End tag is defined by ISO 8879: “Descriptive markup that identifies the end of an element.” Start and end tags must have exactly the same name.
• Content is defined as the data or information provided between start and end tag. It can be a text content or an element content – the latter is also called nested or child element.
• Attribute is defined by ISO 8879 as “A characteristic quality, other than type or content”. An attribute is the information associated with an element. For example, if you think of an element as a noun, the attribute is an adjective. Attribute information for an element is stored in its start tag. An attribute consists of an attribute name and an attribute value. The attribute values are enclosed in quotes.
• Nested element is defined as an element directly contained by another element; the first is said to be a child of the second. It is also called child element.
Extraction of an interchange file in XML (from EuroFIR Food Data Transport Package29)
<FoodNames> <FoodName language="en" kind="preferred">Butter, salted</FoodName> <FoodName language="en" kind="synonym">BUTTER,WITH SALT</FoodName>
</FoodNames> Terms Corresponding section of an interchange file in XML language="en"
</FoodNames>
FoodNames
Butter, salted
<FoodName language="en" kind="preferred">Butter, salted</FoodName>
<FoodNames>
29 http://usda.foodcomp.info/Get_USDASR20_Food_Data_XML.asp?FoodId=01001,01002,01003

Module 9 – Questions
157
EXERCISES
IX.E1 Data documentation, which is important for data evaluation and interchange, is also possible with simple compilation tools. INFOODS and FAO have developed a simple compilation tool in Excel to allow compilers, in the absence of a sophisticated food composition database management system, to store, manage, document and publish food composition data. The Compilation Tool version 1.2.1 together with its user guide is freely available at http://www.fao.org/infoods/software_en.stm. Open the Compilation Tool version 1.2.1 (and the user guide) and look at the entered example data in the different worksheets. Indicate which documentation could be introduced into the different worksheets of this Excel spreadsheet. Select True or False. (5.5 points: ½ point for each correct response) True False Documentation that can be introduced into the Compilation Tool
Bibliographic documentation of sources of data and other references used Portion size Documentation of analytical methods Yield and nutrient retention factors with their sources, the recipe calculation method and the
nutrient values of calculated foods and recipes The main source of nutrient values at food level The specific source of nutrient values at value level to supplement the default documentation
at food level Meaning of confidence and quality codes Value documentation, e.g. value type, SE, SD, mean, date of analysis Faceted food description, e.g. LanguaL Information on food samples Ingredients and their quantities, with a short description of the preparation method
IX.E2 Many compilers have developed their own relational food composition database management system (FCDBMS) specific to their needs. Unfortunately, despite many attempts, no universal FCDBMS exists as yet. This would have been helpful for compiling, managing and interchanging food composition data in a harmonized manner. The ‘Set of files, elements and definitions’ and the ‘data schema structure’ (see ER30 diagram below from FAO, 2004) could be used as guidance when developing one’s own FCDBMS. Another example is the EuroFIR Food Data Transport Package (Møller and Christensen, 2008). Note: The objective of this exercise is to appreciate the complexity of a FCDBMS due to multiple links among most files and the high amount of metadata. The intention of this exercise is not to fully understand ER models or to know how to construct them.
30 Entity-relationship diagram
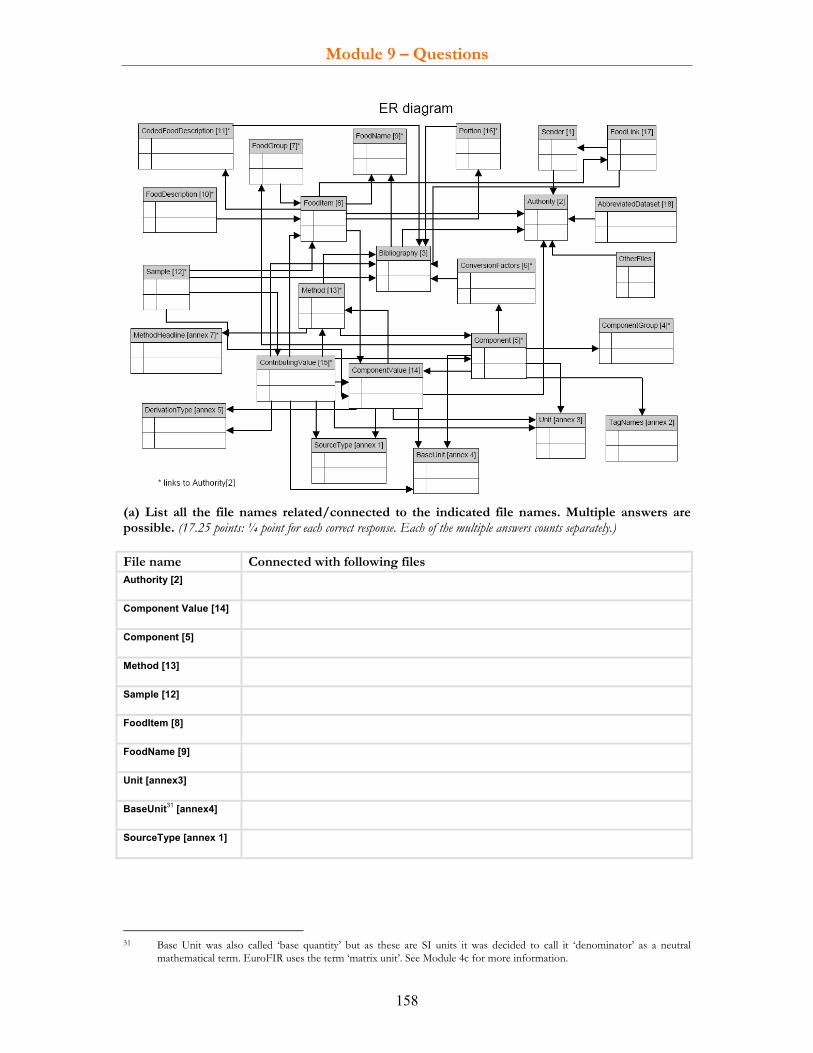
Module 9 – Questions
158
(a) List all the file names related/connected to the indicated file names. Multiple answers are possible. (17.25 points: ¼ point for each correct response. Each of the multiple answers counts separately.) File name Connected with following files Authority [2]
Component Value [14]
Component [5]
Method [13]
Sample [12]
FoodItem [8]
FoodName [9]
Unit [annex3]
BaseUnit31 [annex4]
SourceType [annex 1]
31 Base Unit was also called ‘base quantity’ but as these are SI units it was decided to call it ‘denominator’ as a neutral
mathematical term. EuroFIR uses the term ‘matrix unit’. See Module 4c for more information.

Module 9 – Questions
159
(b) Open the file ‘Data Interchange Files, elements and definitions’ (FAO, 2004) at ftp://ftp.fao.org/es/esn/infoods/definitions.pdf. Search the files where the following elements are mentioned and write the corresponding file name (same as in the ER diagram above) for the elements indicated in the table below. Multiple answers are possible. (17 points: 1 point for each correct response. Each of the multiple answers counts separately.)
Element in file File name email
ISBN
componentid
unit
sampplan
methcode
sourcetype
portiondesc
g
W (per 100g edible portion)
(c) Select the correct response, indicating whether the schema and the listed files take account of the difference between archival, reference and user database. (1 point)
The schema and listed files take account of the difference between archival, reference and user database
Yes, because all keys and data fields are the same in archival, reference and user database. No, because an additional layer is missing to indicate whether the data are stored and managed in
the archival, reference and user database. IX.E3 From the XML Food Data Transport Package, indicate the data content corresponding to the requested data in the table below. (10 points: 1 point for each correct response) Example from the EuroFIR XML Food Data Transport Package (see http://usda.foodcomp.info/Get_USDASR20_Food_Data_XML.asp?FoodId=01001,01002,01003) <Food> <FoodDescription> <FoodIdentifiers> <FoodIdentifier system="origfdcd"> <Identifier>01001</Identifier>
</FoodIdentifier> <FoodIdentifier system="LanguaL"> <Identifier>A0148</Identifier> <Identifier>B1201</Identifier> <Identifier>C0179</Identifier> <Identifier>E0119</Identifier> <Identifier>F0018</Identifier> <Identifier>G0003</Identifier> <Identifier>H0001</Identifier> <Identifier>J0135</Identifier>

Module 9 – Questions
160
<Identifier>K0003</Identifier> <Identifier>M0001</Identifier> <Identifier>N0001</Identifier> <Identifier>P0024</Identifier>
</FoodIdentifier> </FoodIdentifiers>
<FoodClasses> <FoodClass system="origfdgp">0100</FoodClass>
</FoodClasses> <FoodNames> <FoodName language="en" kind="preferred">Butter, salted</FoodName> <FoodName language="en" kind="synonym">BUTTER,WITH SALT</FoodName>
</FoodNames> </FoodDescription>
<Components> <Component> <ComponentIdentifiers> <ComponentIdentifier system="origcpcd">203</ComponentIdentifier> <ComponentIdentifier system="origcpnm">Protein</ComponentIdentifier> <ComponentIdentifier system="ecompid">PROT</ComponentIdentifier> <ComponentIdentifier system="INFOODS">PROCNT</ComponentIdentifier>
</ComponentIdentifiers> <Values> <Value unit="g" matrixunit="W" methodtype="A" methodindicator="MI0123" methodparameter="6.38"> <SelectedValue valuetype="MN" acquisitiontype="D">0.85</SelectedValue> <Mean>0.85</Mean> <StandardError>0.074</StandardError> <NumberOfAnalyticalPortions>16</NumberOfAnalyticalPortions> <MethodSpecification> <MethodId>1</MethodId> <OfficialMethod>Jones (1941)</OfficialMethod> <GeneralDescription>The values for protein were calculated from the level of total nitrogen (N) in the food,
using the conversion factors recommended by Jones (1941). The general factor of 6.25 is used to calculate protein in items that do not have a specific factor.</GeneralDescription>
<Remarks>N x Jones factor</Remarks> </MethodSpecification> </Value> </Values> </Component>
</Food>
Data requested Corresponding data content Food code (identifier)
Preferred food name
Component name
INFOODS component identifier (tagname)
EuroFIR component identifier (ecompid)
Unit
Denominator (matrix unit)
Value
Calculation method
n (number of independent analytical food samples)

Module 9 – Questions
161
IX.E4 A famous researcher generated compositional data for some foods and sent them to the national food composition compilers, thereby allowing them to incorporate the new data into the food composition database. List 10 additional information that the compilers should request from the researcher. From these 10 information, select the four mandatory ones that are essential to understand the data. (14 points: 1 point for each correct response and 4 points for selecting the most important information correctly)
Vitamin C Folate Carbohydrates Fibre Energy Iron vitamin A Spinach 28.1 194 3.63 2.2 97 2.71 9311 Fig 1 9 48.6 7.5 889 4.2 10 Lentil soup
1 4 12.7 3.8 413 1.2 36
Antelope 0 150 2.1 Sweet potato
70 5.35 189 19.35 875
Additional information requested on Most important


Module 10 – Questions
163
Module 10 COMPILATION AND DOCUMENTATION
LEARNING OBJECTIVES By the end of this module the student will:
understand the principles of compiling, maintaining and updating food composition tables; be aware of the tasks to be undertaken when compiling archival, reference and user databases; be able to compile a simple food composition database, separated into archival, reference and user
databases; know how to incorporate compositional data from different sources; understand the principles and importance of documentation; know how to document data at the value and food levels; be capable of managing food composition data (aggregate, document, complete).
REQUIRED READING • Charrondiere, U.R. PowerPoint presentation on ‘Basic principles for assembling, managing and
updating food composition databases’, available at: http://www.fao.org/infoods/presentations_en.stm and if possible: • Greenfield, H. & Southgate, D.A.T. 2003. Food composition data – production, management and use. FAO.
Rome. Chapters 1 (pp. 6-12 of the book, not of the PDF file), chapter 2 (pp. 24-29), chapter 9 (pp. 163-166) and chapter 10 (pp. 175-182). Available at: ftp://ftp.fao.org/docrep/fao/008/y4705e/y4705e00.pdf
• Rand, W.M., Pennington, J.A.T., Murphy, S.P. & Klensin, J.C. 1991. Compiling Data for Food Composition Data Bases. United Nations University, Tokyo. Section 1 (Data Base Considerations) pp. 6-18 and sections 3-5 (Calculating representative data; Data from other sources; Estimation of data on similar foods) pp. 24-43. Available as PFD file at ftp://ftp.fao.org/es/esn/infoods/Randeal1991CompFCDBases.pdf
EXERCISE MATERIAL • FAO/INFOODS Compilation Tool version 1.2.1 (an Excel file available at
http://www.fao.org/infoods/software_en.stm) • USDA SR 22 abbreviated food composition database and nutrient definition file at the United States
Department of Agriculture (USDA) website http://www.ars.usda.gov/services/docs.htm?docid=8964 • From the Danish food composition website http://www.foodcomp.dk/v7/fcdb_default.asp, the
Excel file of the Danish food composition database version 7.01 and the documentation • FAO. 2004. Report of the Technical Workshop on Standards for Food Composition Data
Interchange, Rome. 19-22 January 2004. FAO, Rome. Available at: ftp://ftp.fao.org/es/esn/infoods/interchange.pdf
REFERENCE MATERIAL • Excel help available at http://office.microsoft.com/en-us/excel/FX100646951033.aspx RECOMMENDATION Data compilation requires knowledge of component and food selection and nomenclature; basics of analytical methods and their quality; documentation and calculation. Therefore, it is highly recommended that students complete modules 1 and 3-8 before starting on the present module. RELEVANCE FOR VARIOUS USERS (ON A SCALE OF + TO +++++) • Compilers/ professional users +++++ • Analysts + ESTIMATED TIME TO COMPLETE TASKS • Required reading: 1-3 hours • Answering the questions: 1-3 hours • Completing the exercises: 3-8 hours

Module 10 – Questions
164
Questions X.Q1 Match the three compilation methods of food composition databases to the corresponding description and select the most frequently-used method. (2 points: ½ point for each correct response)
Compilation methods: 1. Direct method 2. Indirect method 3. Combined method
Method Mostly
used Description
All data are taken from the published or unpublished literature (e.g. scientific articles, laboratory reports), or are calculated or imputed.
All values are analysed, either specifically for the database or for other purposes. Data for the compilation are derived from analyses and are complemented by data from,
for example, the literature or calculations. X.Q2 Match the types of food composition data to the corresponding definition and identify the type, which, in general, is of the highest quality. (3.5 points: ½ point for each correct response)
Type of food composition data: 1. Presumed values, e.g. zero values 2. Calculated values 3. (Original) analytical values 4. Imputed values 5. Borrowed values 6. Trace values 7. Missing values
Types definitions Number Highest quality
They are estimated from similar foods. The constituent is present in a food but cannot be quantified with the method used. In printed tables it is often recorded as T or tr.
They are derived from recipe or other calculations (e.g. through arithmetic or weighted averaging of several data points).
They are gathered from other sources (e.g. taken from other tables or the literature).
They are based on laboratory measurements. A value is not available and is therefore not recorded in the database. Often, these values are represented by -, N, ND, or are simply left blank.
Their content is according to current knowledge of the contents of foods or regulations (e.g. no alcohol in cereals; no vitamin B12 or cholesterol in plant foods; no dietary fibre in animal foods; or iodine content in iodized salt according to regulated level of fortification).
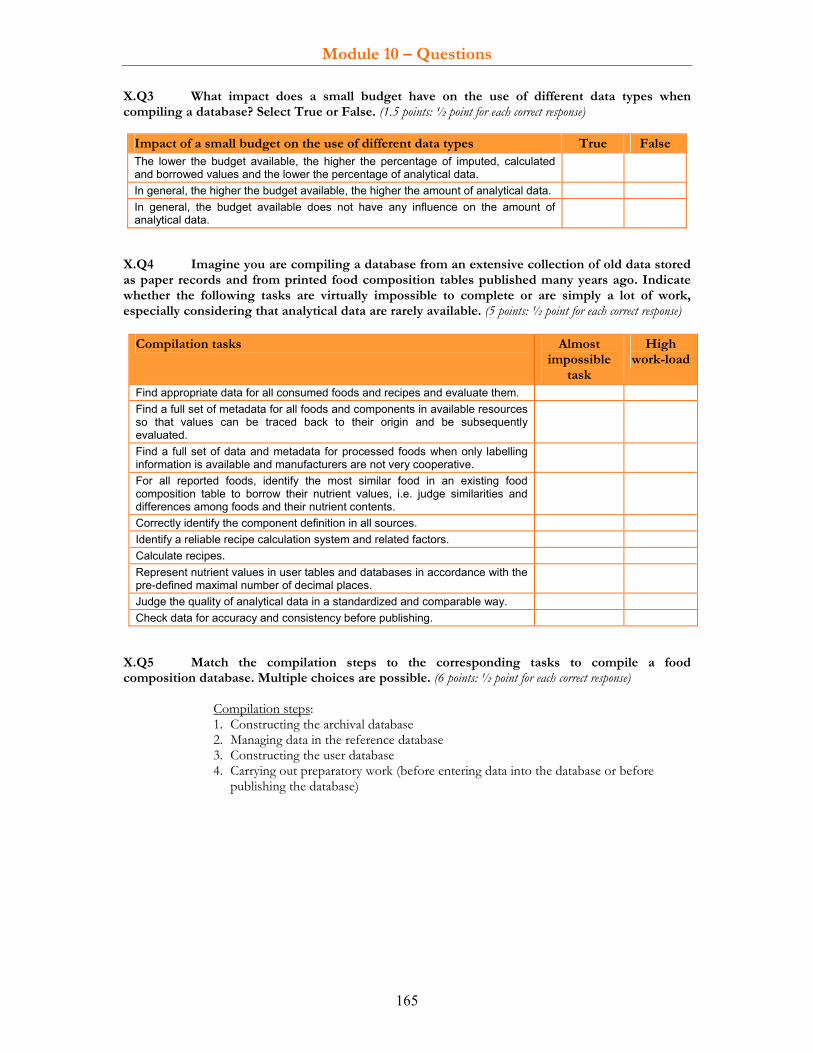
Module 10 – Questions
165
X.Q3 What impact does a small budget have on the use of different data types when compiling a database? Select True or False. (1.5 points: ½ point for each correct response)
Impact of a small budget on the use of different data types True False The lower the budget available, the higher the percentage of imputed, calculated and borrowed values and the lower the percentage of analytical data.
In general, the higher the budget available, the higher the amount of analytical data. In general, the budget available does not have any influence on the amount of analytical data.
X.Q4 Imagine you are compiling a database from an extensive collection of old data stored as paper records and from printed food composition tables published many years ago. Indicate whether the following tasks are virtually impossible to complete or are simply a lot of work, especially considering that analytical data are rarely available. (5 points: ½ point for each correct response)
Compilation tasks Almost impossible
task
High work-load
Find appropriate data for all consumed foods and recipes and evaluate them. Find a full set of metadata for all foods and components in available resources so that values can be traced back to their origin and be subsequently evaluated.
Find a full set of data and metadata for processed foods when only labelling information is available and manufacturers are not very cooperative.
For all reported foods, identify the most similar food in an existing food composition table to borrow their nutrient values, i.e. judge similarities and differences among foods and their nutrient contents.
Correctly identify the component definition in all sources. Identify a reliable recipe calculation system and related factors. Calculate recipes. Represent nutrient values in user tables and databases in accordance with the pre-defined maximal number of decimal places.
Judge the quality of analytical data in a standardized and comparable way. Check data for accuracy and consistency before publishing.
X.Q5 Match the compilation steps to the corresponding tasks to compile a food composition database. Multiple choices are possible. (6 points: ½ point for each correct response)
Compilation steps: 1. Constructing the archival database 2. Managing data in the reference database 3. Constructing the user database 4. Carrying out preparatory work (before entering data into the database or before publishing the database)

Module 10 – Questions
166
Tasks to compile a food composition database Step - Set up a steering committee composed of stakeholders and users - Obtain training in food composition (e.g. distance learning and/or classroom courses) - Network with compilers, analysts and users from other countries and with international networks or organizations - Prepare a budget proposal, and approach potential donors - Obtain information on users’ needs - Select a database management system
- Enter a food code for each food when incorporating the nutrient values into the database - Incorporate the newly-generated analytical data - Document sources of original data in one’s own database
Calculate nutrient values of recipes and document data source - Collect and review existing information - Decide on component definitions and units - Select foods, nutrients and food groups - Collect recipes, including ingredients - Collect published and unpublished literature containing analytical and other compositional data
- Develop (or provide input into) sampling plans and analytical programmes - Supervise the analytical programme (in some cases) - Evaluate analytical reports
Enter the original data of the selected literature in electronic format - Complete missing values and document data sources - Estimate and impute data - Scrutinize, standardize and aggregate data
- Prepare data to be published and disseminated - Incorporate introduction, index and other information for publishing
Maintain and update the data in the reference database - Develop guidelines for disseminating data to users (e.g. fees to be paid by commercial users, research institutes, others) - Select the support for publishing the data (e.g. printed or via the Internet)
Standardize decimal places and significant figures for each nutrient in the database to be published
Create a strong institutional framework including obtaining an authorization (e.g. from the government) to be designated as the responsible organisation to develop and maintain the national food composition programme
X.Q6 From the list below, select the least important task involved in successfully compiling and maintaining a food composition database. (1 point)
Least important task for food composition database compilation and maintenance
Least important
Documenting all data Searching scientific literature for compositional data Creating a strong institutional framework including obtaining an authorization (e.g. from the government) to be designated as the responsible organisation to develop and maintain the national food composition programme
Selecting food groups - Creating a steering committee composed of stakeholders and users - Training in food composition (e.g. by distance learning and/or classroom courses) - Networking with compilers, analysts and users from other countries and with international networks or organizations - Preparing a budget proposal, and approaching potential donors - Collecting information on users’ needs

Module 10 – Questions
167
X.Q7 A researcher needs to compile a food composition database for a certain research purpose, including calculation of composite dishes. Select the correct response describing the way the researcher might compile a high-quality database. (1 point)
Correct way of compiling a high-quality database Researchers should develop their own compilation procedures because the food composition
database is for a specific purpose. This ensures that the database is adapted to local requirements and that the results are of high quality.
Researchers should consult international literature and authoritive websites to search for existing standards, so that the food composition database is developed in accordance with international recommendations, thus assuring good quality.
Researchers should ensure that recipe calculations are in accordance with international standards and procedures because they represent the major part of the food composition database to be constructed. Other database issues can be dealt with in accordance with local requirements.
X.Q8 List five guidelines that may need to be elaborated before a database can be compiled and scrutinized. (5 points: 1 point for each correct response) 1. 2. 3. 4. 5. X.Q9 Select the criteria for selecting sources for compositional data for a food composition database. Select True or False. (4.5 points: ½ point for each correct response) Criteria to choose sources for compositional data True False Documentation should be available to judge values and their quality. Data should be of high quality. Data should be readily available (e.g. in the public domain, on the Internet, in scientific literature or in published laboratory reports).
Data should solely come from areas of geographical proximity. Component definition and methods should always be the same as in one’s own database.
All types of values (analytical, calculated, imputed, presumed, borrowed) are acceptable.
Food description should be unambiguous. Data is acceptable only if it is in one’s own language. Data is acceptable if they are expressed in the same units.
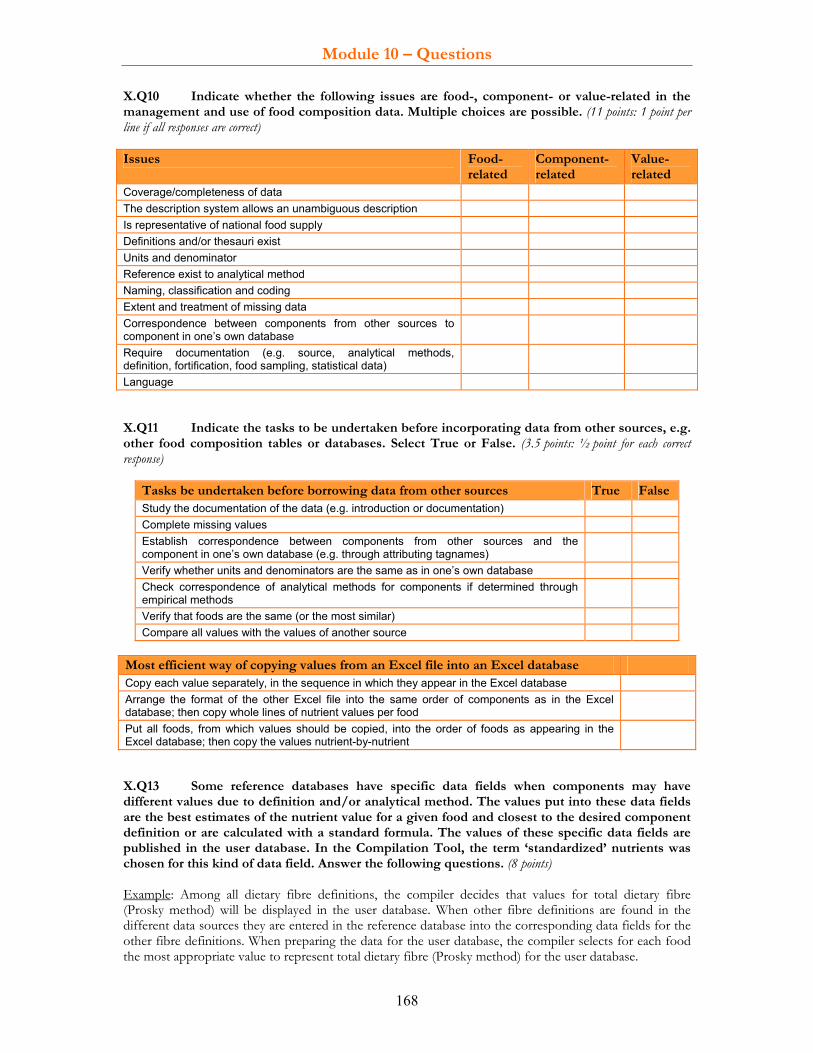
Module 10 – Questions
168
X.Q10 Indicate whether the following issues are food-, component- or value-related in the management and use of food composition data. Multiple choices are possible. (11 points: 1 point per line if all responses are correct) Issues Food-
related Component-related
Value-related
Coverage/completeness of data The description system allows an unambiguous description Is representative of national food supply Definitions and/or thesauri exist Units and denominator Reference exist to analytical method Naming, classification and coding Extent and treatment of missing data Correspondence between components from other sources to component in one’s own database
Require documentation (e.g. source, analytical methods, definition, fortification, food sampling, statistical data)
Language X.Q11 Indicate the tasks to be undertaken before incorporating data from other sources, e.g. other food composition tables or databases. Select True or False. (3.5 points: ½ point for each correct response)
Tasks be undertaken before borrowing data from other sources True FalseStudy the documentation of the data (e.g. introduction or documentation) Complete missing values Establish correspondence between components from other sources and the component in one’s own database (e.g. through attributing tagnames)
Verify whether units and denominators are the same as in one’s own database Check correspondence of analytical methods for components if determined through empirical methods
Verify that foods are the same (or the most similar) Compare all values with the values of another source
Most efficient way of copying values from an Excel file into an Excel database Copy each value separately, in the sequence in which they appear in the Excel database Arrange the format of the other Excel file into the same order of components as in the Excel database; then copy whole lines of nutrient values per food
Put all foods, from which values should be copied, into the order of foods as appearing in the Excel database; then copy the values nutrient-by-nutrient
X.Q13 Some reference databases have specific data fields when components may have different values due to definition and/or analytical method. The values put into these data fields are the best estimates of the nutrient value for a given food and closest to the desired component definition or are calculated with a standard formula. The values of these specific data fields are published in the user database. In the Compilation Tool, the term ‘standardized’ nutrients was chosen for this kind of data field. Answer the following questions. (8 points) Example: Among all dietary fibre definitions, the compiler decides that values for total dietary fibre (Prosky method) will be displayed in the user database. When other fibre definitions are found in the different data sources they are entered in the reference database into the corresponding data fields for the other fibre definitions. When preparing the data for the user database, the compiler selects for each food the most appropriate value to represent total dietary fibre (Prosky method) for the user database.

Module 10 – Questions
169
Note: It would be useful to consult the worksheet ‘reference database’ and ‘component’ of the Compilation Tool (available at http://www.fao.org/infoods/software_en.stm ). ‘Standardized’ nutrients are shaded in yellow. Questions Responses Select the purposes of ‘standardized’ nutrients. Strike through the incorrect one. (1 point)
- To calculate nutrient values in a standardized manner - To select from existing data the most appropriate nutrient value for publication in the user database - To avoid incorporating errors from other sources when copying their calculated values - To compare the different values for the nutrient depending on definition or analytical method
List three nutrients with ‘standardized’ nutrients (3 points)
Indicate the criteria for selecting the component to represent the standardized component. Strike through the incorrect one(s). (2 points)
- Availability of data - State of the art on component definition and analytical method - language - unit
Where are the nutrient values of ‘standardized’ nutrients completed? Select the correct response. (1 point)
Archival database Reference database User database
Select the correct reason why all contributing components for energy should have values. Select the correct response. (1 point)
The standardized energy value would be too high if contributing values were missing
The standardized energy value would be too low if contributing values were missing
The standardized energy value would be too low or too high, depending on the missing component
X.Q14 It is important for compilers to know whether certain assignments are finalized before working further with the data. Normally, the incorporation, completion and checking of values are done per food. Once this process has been completed, values are checked for consistency and completeness per component and food group. Metadata are also checked for consistency and completeness. Match the tasks to the checks that need to be done before the tasks can start. Multiple answers are possible. (2.5 points: ½ point for each correct response)
Checks: a. Check all values for consistency and completeness (could be done per food, food group, per component and for metadata); b. Check that missing values were completed (ideally, there should be no missing data); c. Verify that all steps in the recipe calculation are correct and that no errors occurred (e.g. production of zero values for missing values in all ingredients or too low values because of missing values for some ingredients) .
Tasks Finalization of assignment
Calculate nutrient values for recipes Publish user database Aggregate nutrient values of different foods Transfer data from the recipe calculation to the reference database Calculate ‘standardized’ nutrient values Transfer the data from the different sources to the archival database

Module 10 – Questions
170
X.Q15 Indicate whether the analytical methods and/or definitions listed in the introduction or documentation are always applicable to all values for this nutrient. Select True or False. (2.5 points: ½ point for each correct response) Analytical methods and/or definitions, as indicated in the general data documentation, are applicable to all values in the database
True False
By definition, if a method is indicated in the general documentation, it is applicable for all values for this nutrient. Therefore, all nutrient values are determined by means of the analytical method indicated.
All nutrient values should correspond to the definitions indicated in the general documentation if they are calculated within this database (e.g. energy).
When a compiler is unable to find a nutrient value with the desired analytical method or definition, a nutrient value not exactly corresponding to the desired analytical method or definition may be incorporated to minimize missing values. Therefore, not all nutrient values correspond necessarily to the indicated analytical method and/or definition.
Only documentation at the value level allows users to know the analytical method and/or definition for each value.
Some food composition databases have not stored the formula or any contributing values and conversion factors for the calculated values. This prevents nutrient values being recalculated in the event component definitions change. In these databases, all nutrient values are calculated in accordance with the new definition indicated.
X.Q16 How is variability in nutrient values expressed in food composition tables and databases? Select True or False. (2.5 points: ½ point for each correct response)
Expression of variability in nutrient values True False Standard derivation (SD) Standard error (SE) Mean value Median value Nutrient ranges (minimum and maximum value)
X.Q17 Select the correct responses as to whether the statistical variability of nutrient values should be published in user tables and databases. Select True or False. (2 points: ½ point for each correct response)
Statistical variability of nutrient values to be published in user tables and databases
True False
No, because no user is interested in such information. No, because it is too complicated to publish such information. Yes, it is useful to indicate the range of nutrient values for each food, especially if the number of analysed samples is listed.
Yes, it is useful to indicate the range of nutrients which were calculated using mean values.
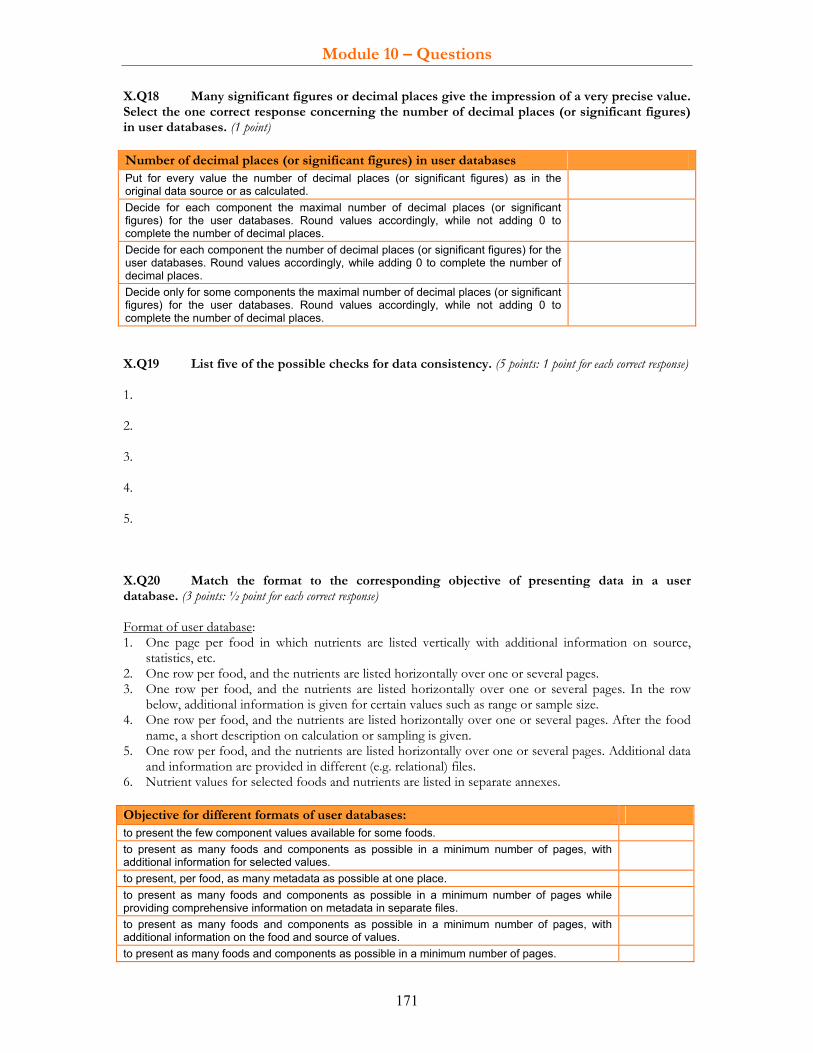
Module 10 – Questions
171
X.Q18 Many significant figures or decimal places give the impression of a very precise value. Select the one correct response concerning the number of decimal places (or significant figures) in user databases. (1 point) Number of decimal places (or significant figures) in user databases Put for every value the number of decimal places (or significant figures) as in the original data source or as calculated.
Decide for each component the maximal number of decimal places (or significant figures) for the user databases. Round values accordingly, while not adding 0 to complete the number of decimal places.
Decide for each component the number of decimal places (or significant figures) for the user databases. Round values accordingly, while adding 0 to complete the number of decimal places.
Decide only for some components the maximal number of decimal places (or significant figures) for the user databases. Round values accordingly, while not adding 0 to complete the number of decimal places.
X.Q19 List five of the possible checks for data consistency. (5 points: 1 point for each correct response) 1. 2. 3. 4. 5. X.Q20 Match the format to the corresponding objective of presenting data in a user database. (3 points: ½ point for each correct response) Format of user database: 1. One page per food in which nutrients are listed vertically with additional information on source, statistics, etc. 2. One row per food, and the nutrients are listed horizontally over one or several pages. 3. One row per food, and the nutrients are listed horizontally over one or several pages. In the row below, additional information is given for certain values such as range or sample size. 4. One row per food, and the nutrients are listed horizontally over one or several pages. After the food name, a short description on calculation or sampling is given. 5. One row per food, and the nutrients are listed horizontally over one or several pages. Additional data and information are provided in different (e.g. relational) files. 6. Nutrient values for selected foods and nutrients are listed in separate annexes. Objective for different formats of user databases: to present the few component values available for some foods. to present as many foods and components as possible in a minimum number of pages, with additional information for selected values.
to present, per food, as many metadata as possible at one place. to present as many foods and components as possible in a minimum number of pages while providing comprehensive information on metadata in separate files.
to present as many foods and components as possible in a minimum number of pages, with additional information on the food and source of values.
to present as many foods and components as possible in a minimum number of pages.

Module 10 – Questions
172
X.Q21 List five of the possible reasons for updating a food composition database. (5 points: 1 point for each correct response) 1. 2. 3. 4. 5.

Module 10 – Questions
173
EXERCISES
X.E1 Open the Compilation Tool version 1.2.1 and look at the data and documentation in the different worksheets. Match the documentation listed in the table below to the worksheets where the documentation is introduced. (4.5 points: ½ point for each correct response) Note: The Compilation Tool is available at http://www.fao.org/infoods/software_en.stm.
Worksheet: 1. Codes 2. Recipe calculation 3. Recipe + ingredients 4. Archival database 5. Reference database 6. Bibliography 7. Value documentation 8. Sampling 9. Methods
Worksheet Documentation introduced
Bibliographic documentation of data sources and other references can be entered into one field or it can be dispatched into the different fields, e.g. title, creatorpersonal, ISBN, etc.
Documentation of the analytical methods can be added here. In many cases, only the identity of the analytical method is known, especially when the value is derived from another food composition table or database. More information can be extracted and documented from scientific articles.
Documentation can be entered concerning yield and nutrient retention factors with their sources, the recipe calculation method and nutrient values of calculated foods and recipes.
The main source of nutrient values is entered at the food level (e.g. for aggregated and calculated foods). For single values, which are calculated, imputed or estimated, the source (with food code) is entered at the value level to supplement the default documentation at the food level.
Documentation is entered on the meaning of codes and abbreviations used in the different worksheets.
Extensive documentation (e.g. value type, SE, SD, mean, date of analysis, etc.) of values is entered here for a component-food pair (keys are entered to identify food and component).
Documentation at food level can be entered on the source of nutrient values. A food code is also attributed to all new foods. This worksheet contains only original data. No values are calculated or estimated here.
Documentation can be entered on information on sampling and food samples. Documentation can be entered on ingredients and their quantities and a short description of the
recipe preparation. This information should be published in the user food composition table or database.

Module 10 – Questions
174
X.E2 Open the worksheets ‘reference database’ and ‘recipe calculation’ of the Compilation Tool version 1.2.1 and match the following data to the documentation listed in table below. In the last column of the table, indicate whether the documentation is at the food or value level; put 1 for food level and 2 for value level. (7 points: ½ point for each correct response) Data found in the worksheets ‘reference database’ or ‘recipe calculation’: 1. EDIBLE value of final record of ‘Tomato, ripe, raw’ 2. Final record of ‘Tomato, ripe, raw’ (except if indicated otherwise for specific values) 3. Omelette, with tomato 4. ‘Flour, wheat, white’ record 2 5. FASAT value for final record of ‘Flour, wheat, white’ 6. ALC value for final record of ‘Flour, wheat, white’ 7. Retention factors baked for EGG AND EGG PRODUCTS. Corresponding documentation found in the worksheets
Data Documentation at the food or value level (put 1 for food and 2 for value level)
calc. with mixed method UK 6th average of record 1-3 DK7.01-0531 own sampling S1 US21-11529 calc DK7.01-0531*0.8 X.E3 A compiler is starting to enter compositional data for some foods into the archival database. The table below represents an extract of the archival database. For the foods highlighted in yellow, enter a food code, decide if the nutrient values will be borrowed from the food composition database below or be calculated. Then enter the documentation of the selected data sources. (18 points: 1 point if all entries for the food are correct) Note: Take the completed data for some foods in the table as examples. Complete the missing data using the following instructions: • Enter a food code into the column ‘food codes/food groups’: The first two numbers of the food
code represent the food group, the third and forth numbers food subgroup, and last three numbers the code of the food within the group.
• Enter the type of food into the column ‘type’: put R for recipes (meaning that their nutrient values will be calculated using the mixed recipe calculation, which applies also for cooked foods when calculated) and F for food.
• If it is a food, match the food to the most similar one in the Danish food composition database version 7.01 and enter the corresponding documentation:
o the corresponding abbreviated source into column ‘source’; o the food number into column ‘food number in source’; o the food name as in the source into column ‘food name in source’.
• In the event that no food is similar enough, put ‘-’ into the corresponding cells. • If it is a recipe, enter ‘calc. with mixed method’ (calc. stands for calculated) into the column ‘source’. • Indicate whether the food match is exact (put 1) or similar (put 2) in the column ‘match’. The food
match is exact if the food names, including all descriptors, are exactly the same. A number of additional checks are needed for some foods before being able to decide if the match is exact or similar, e.g. for meat cuts, to ascertain whether the foods are really the same (in many countries the names of meat cut are the same even though they come from different part of the animal – see module 3 for more information) . A food match is similar if the food name or at least one food descriptor are different.

Module 10 – Questions
175
Foods from the Danish food composition database version 7.01 (to be indicated as DK7.01) with food codes and English names: [0224] Rice, polished, raw [1253] Margarine, 80% fat, for frying/baking, vegetable fat [0340] Egg, chicken, whole, raw [0659] Sweet potato, raw [0821] Potato, old (February to June), raw [0115] Potato, raw [1275] Lentils, brown, dried, raw [0147] Lentils, dried [0682] Lentils, sprouted, raw [0010] Aubergine (eggplant), raw [0790] Tomato, Danish, ripe, raw [0791] Tomato, imported, ripe, raw [0306] Tomato, ripe, raw, origin unknown [0523] Mangos, raw [0451] Chocolate, fancy and filled [0038] Chocolate, milk [0154] Sugar, sucrose, white [1112] Sugar, Demerara [0927] Pork, loin, lean, raw [5020] Pork, loin with rind, raw [5016] Pork, chop, raw [5004] Pork, tenderloin, trimmed, raw [0284] Pork, meat, approx. 32% fat, raw [0285] Pork, meat, approx. 10% fat, raw [0098] Chicken, hen, flesh and skin, raw [0097] Chicken, hen, flesh only [1035] Chicken, flesh and skin, grilled [0132] Chicken, flesh and skin, raw [0131] Chicken, flesh only, raw [0319] Tuna, in oil, canned [0318] Tuna, in water, canned [0321] Tuna, raw [0170] Milk, partly skimmed, 1.5% fat [1473] Milk, partly skimmed, 1.5% fat, organic [0750] Milk, whole, cultured [5030] Milk, 0.5% fat [0366] Milk, dry, skimmed, powder [0367] Milk, dry, whole, powder [0304] Tea, leaves [0305] Tea, ready-to-drink [0327] Water, tap, drinking, average values [0333] Yoghurt [0866] Cream yoghurt, 9% fat, with fruit [0334] Yoghurt, low fat, with fruit juice [0153] Corn oil [0482] Olive oil [0271] Soya bean oil, refined [0386] Bouillon, beef, concentrated, cube [1055] Bouillon, beef, cube, prepared

Module 10 – Questions
176
Food codes/food group codes
Type R = recipe F = food
Foods/food groups Match 1=exact 2=similar
Source Food number in source
Food name in source
1. Cereals and cereal products 01001 F Rice, white, raw 1 DK7.01 0224 Rice, polished, raw 01002 R Rice, white, boiled calc. with
mixed method
01003 R Rice, white, fried with tomato
calc. with mixed method
2. Starchy roots and tubers and their products
02001 R Potato, without skin, boiled 3. Legumes and their products 03001 R Lentils, boiled 4. Vegetables and their
products
04001 R Aubergine, fried calc. with mixed method
04002 F Tomato, raw 2 DK7.01 0790 (or 0791 or 0306 or average of all)
Tomato, Danish, ripe, raw (Tomato, imported, ripe, raw OR Tomato, ripe, raw, origin unknown OR best would be average)
04003 R Tomato, boiled calc. with mixed method
5. Fruits and their products 05001 F Mango, raw 1 6. Sugar, sweets and syrup 06001 F Chocolate bar 2 06002 F Sugar, white 1 DK7.01 0154 Sugar, sucrose, white 7. Meat and poultry and their
products
7.1 Red meat 0701001
R Pork, fatty, boiled
0701002
F Pork, lean, raw 2
7.2 Poultry 0702001 F Chicken, whole, raw 1 0702002 F Chicken, whole, grilled 1 8. Eggs and their products 08001 F Egg, chicken, raw 1 DK7.01 0340 Egg, chicken, whole,
raw 08002 R Omelette, with tomato 9. Fish and their products 09001 F Tuna, canned in oil 1
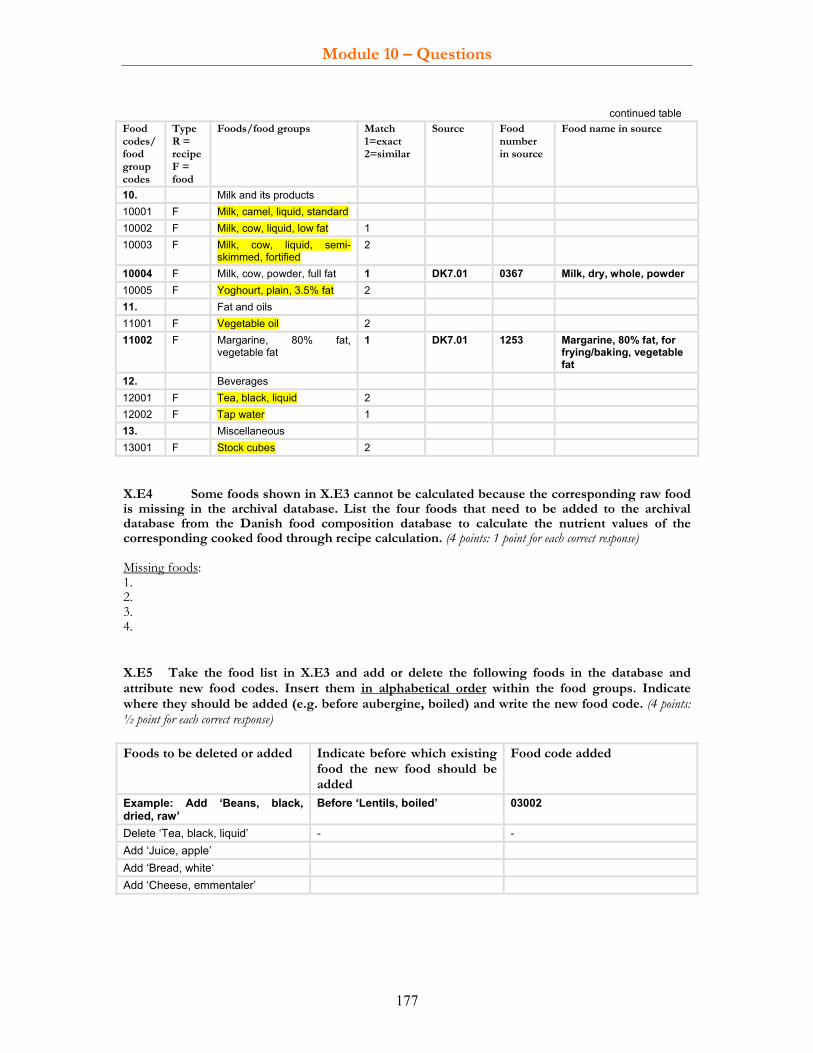
Module 10 – Questions
177
continued table Food codes/food group codes
Type R = recipe F = food
Foods/food groups Match 1=exact 2=similar
Source Food number in source
Food name in source
10. Milk and its products 10001 F Milk, camel, liquid, standard 10002 F Milk, cow, liquid, low fat 1 10003 F Milk, cow, liquid, semi-
skimmed, fortified 2
10004 F Milk, cow, powder, full fat 1 DK7.01 0367 Milk, dry, whole, powder 10005 F Yoghourt, plain, 3.5% fat 2 11. Fat and oils 11001 F Vegetable oil 2 11002 F Margarine, 80% fat,
vegetable fat 1 DK7.01 1253 Margarine, 80% fat, for
frying/baking, vegetable fat
12. Beverages 12001 F Tea, black, liquid 2 12002 F Tap water 1 13. Miscellaneous 13001 F Stock cubes 2 X.E4 Some foods shown in X.E3 cannot be calculated because the corresponding raw food is missing in the archival database. List the four foods that need to be added to the archival database from the Danish food composition database to calculate the nutrient values of the corresponding cooked food through recipe calculation. (4 points: 1 point for each correct response) Missing foods: 1. 2. 3. 4. X.E5 Take the food list in X.E3 and add or delete the following foods in the database and attribute new food codes. Insert them in alphabetical order within the food groups. Indicate where they should be added (e.g. before aubergine, boiled) and write the new food code. (4 points: ½ point for each correct response) Foods to be deleted or added Indicate before which existing
food the new food should be added
Food code added
Example: Add ‘Beans, black, dried, raw’
Before ‘Lentils, boiled’ 03002
Delete ‘Tea, black, liquid’ - - Add ‘Juice, apple’ Add ‘Bread, white‘ Add ‘Cheese, emmentaler’
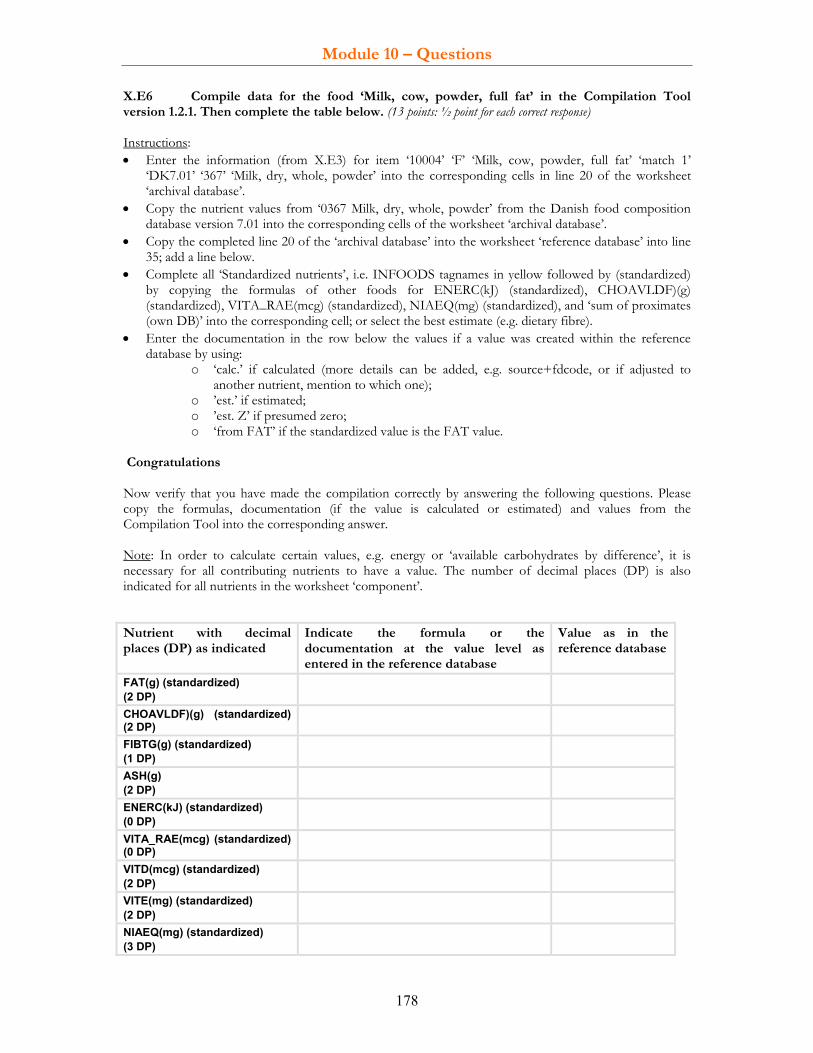
Module 10 – Questions
178
X.E6 Compile data for the food ‘Milk, cow, powder, full fat’ in the Compilation Tool version 1.2.1. Then complete the table below. (13 points: ½ point for each correct response) Instructions: • Enter the information (from X.E3) for item ‘10004’ ‘F’ ‘Milk, cow, powder, full fat’ ‘match 1’
‘DK7.01’ ‘367’ ‘Milk, dry, whole, powder’ into the corresponding cells in line 20 of the worksheet ‘archival database’.
• Copy the nutrient values from ‘0367 Milk, dry, whole, powder’ from the Danish food composition database version 7.01 into the corresponding cells of the worksheet ‘archival database’.
• Copy the completed line 20 of the ‘archival database’ into the worksheet ‘reference database’ into line 35; add a line below.
• Complete all ‘Standardized nutrients’, i.e. INFOODS tagnames in yellow followed by (standardized) by copying the formulas of other foods for ENERC(kJ) (standardized), CHOAVLDF)(g) (standardized), VITA_RAE(mcg) (standardized), NIAEQ(mg) (standardized), and ‘sum of proximates (own DB)’ into the corresponding cell; or select the best estimate (e.g. dietary fibre).
• Enter the documentation in the row below the values if a value was created within the reference database by using:
o ‘calc.’ if calculated (more details can be added, e.g. source+fdcode, or if adjusted to another nutrient, mention to which one);
o ’est.’ if estimated; o ’est. Z’ if presumed zero; o ‘from FAT’ if the standardized value is the FAT value.
Congratulations Now verify that you have made the compilation correctly by answering the following questions. Please copy the formulas, documentation (if the value is calculated or estimated) and values from the Compilation Tool into the corresponding answer. Note: In order to calculate certain values, e.g. energy or ‘available carbohydrates by difference’, it is necessary for all contributing nutrients to have a value. The number of decimal places (DP) is also indicated for all nutrients in the worksheet ‘component’. Nutrient with decimal places (DP) as indicated
Indicate the formula or the documentation at the value level as entered in the reference database
Value as in the reference database
FAT(g) (standardized) (2 DP)
CHOAVLDF)(g) (standardized) (2 DP)
FIBTG(g) (standardized) (1 DP)
ASH(g) (2 DP)
ENERC(kJ) (standardized) (0 DP)
VITA_RAE(mcg) (standardized) (0 DP)
VITD(mcg) (standardized) (2 DP)
VITE(mg) (standardized) (2 DP)
NIAEQ(mg) (standardized) (3 DP)
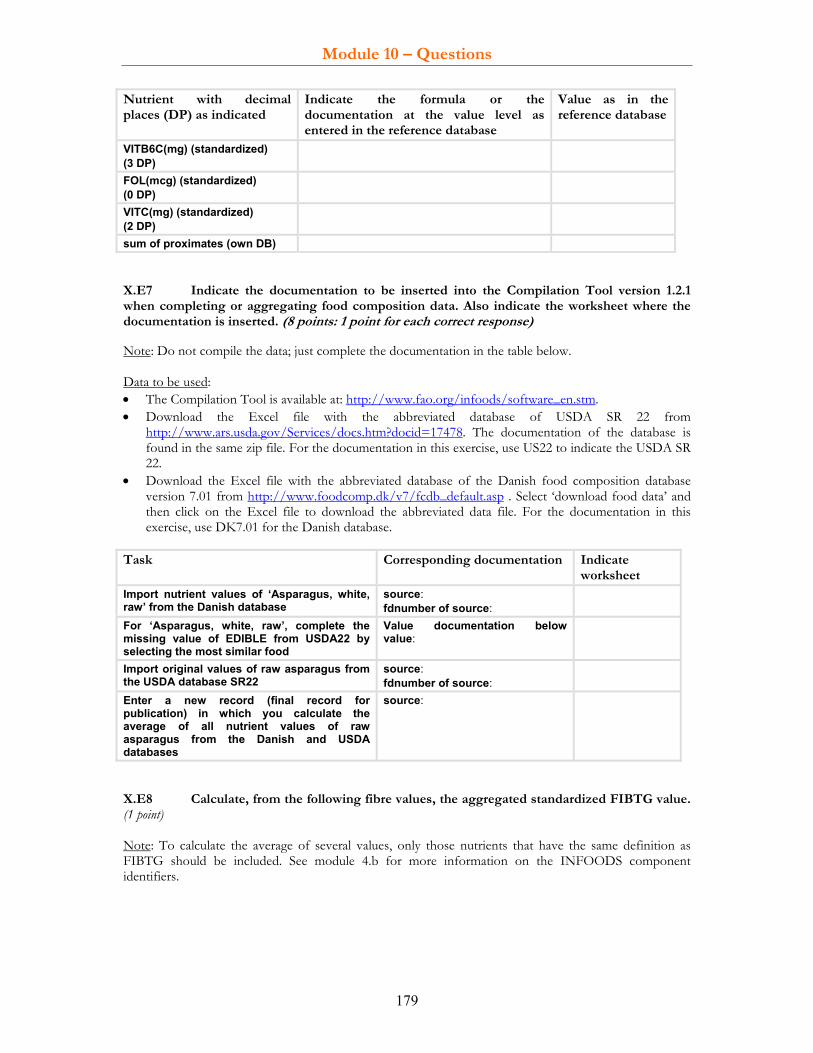
Module 10 – Questions
179
Nutrient with decimal places (DP) as indicated
Indicate the formula or the documentation at the value level as entered in the reference database
Value as in the reference database
VITB6C(mg) (standardized) (3 DP)
FOL(mcg) (standardized) (0 DP)
VITC(mg) (standardized) (2 DP)
sum of proximates (own DB) X.E7 Indicate the documentation to be inserted into the Compilation Tool version 1.2.1 when completing or aggregating food composition data. Also indicate the worksheet where the documentation is inserted. (8 points: 1 point for each correct response) Note: Do not compile the data; just complete the documentation in the table below. Data to be used: • The Compilation Tool is available at: http://www.fao.org/infoods/software_en.stm. • Download the Excel file with the abbreviated database of USDA SR 22 from
http://www.ars.usda.gov/Services/docs.htm?docid=17478. The documentation of the database is found in the same zip file. For the documentation in this exercise, use US22 to indicate the USDA SR 22.
• Download the Excel file with the abbreviated database of the Danish food composition database version 7.01 from http://www.foodcomp.dk/v7/fcdb_default.asp . Select ‘download food data’ and then click on the Excel file to download the abbreviated data file. For the documentation in this exercise, use DK7.01 for the Danish database.
Task Corresponding documentation Indicate
worksheet Import nutrient values of ‘Asparagus, white, raw’ from the Danish database
source: fdnumber of source:
For ‘Asparagus, white, raw’, complete the missing value of EDIBLE from USDA22 by selecting the most similar food
Value documentation below value:
Import original values of raw asparagus from the USDA database SR22
source: fdnumber of source:
Enter a new record (final record for publication) in which you calculate the average of all nutrient values of raw asparagus from the Danish and USDA databases
source:
X.E8 Calculate, from the following fibre values, the aggregated standardized FIBTG value. (1 point) Note: To calculate the average of several values, only those nutrients that have the same definition as FIBTG should be included. See module 4.b for more information on the INFOODS component identifiers.

Module 10 – Questions
180
Mango, raw FIBTG(g)
(standardized) FIBTG(g) AOAC
FIBTS(g) Southgate
PSACNS (g) NSP
FIBC(g) crude
FIB- (g)
Record 1 1.9 Record 2 1.3 Record 3 2.3 Record 4 1.1 Record 5 2.0 Average records 1-5
X.E9 In November 2008, a compiler received a laboratory report (no. 146) from LabTec on data for a traditional, unleavened bread made of white wheat flour, together with the sampling information. Located in city X, LabTec is accredited for analysis in the specific food matrix. In October 2008, ten breads (of 500 g each) had been sampled from local bakery stores in each of the major cities of the country’s three main regions: In the North: cities A, B and C; in the South: cities D, E and X; and in the costal region: cities F, G and H). They were transported to the laboratory. Between 20 and 30 October 2008, the laboratory quartered and homogenized the samples, put into one composite sample per region, and analysed them in duplicates. The results are as follows: Nutrient Unit* Value
North Value South plus capital
Value Costal region
Method used
Water g 32.7 33.9 31.3 Air oven drying at 100ºC Fat g 1.8 2.0 1.6 Acid hydrolysis and
capillary GLC Protein g 7.5 7.1 7.4 Kjeldahl Ash g 1.9 2.1 2.2 Dry ashing Dietary fibre g 2.1 2.3 2.2 AOAC, Prosky Sodium mg 522 533 544 AAS with electrothermal
furnace Vitamin E mg 0.32 0.29 0.36 HPLC Folate mcg 21 20 24 Microbiological assay * per 100g edible portion Compile these data into the Compilation Tool version 1.2.1 by using the food codes 1002001-3 for the Northern, Southern and Costal region, respectively. Then aggregate the data under ‘traditional, unleavened bread made of white wheat flour, average’ and give the food code 1002004. Thereafter, complete the table below with the information that was inserted in the Compilation Tool. (27 points) Note: It would be helpful to consult the Report of the Technical workshop on Standards for food composition data interchange (FAO, 2004) for an explanation of field names in the table below (available at ftp://ftp.fao.org/es/esn/infoods/interchange.pdf). For the calculation of mean, SD and median, use http://www.physics.csbsju.edu/stats/cstats_NROW_form.html

Module 10 – Questions
181
Questions Responses
(State the information inserted in the Compilation Tool)
How many records for the traditional bread will be in the archival database? (1 point)
How many records for the traditional bread will be in the reference database? (1 point)
Using the abbreviation ‘LabTec 146’ as biblioid, indicate the information put into the field ‘consolidated’ and indicate the worksheet in parenthesis. (2 points)
Indicate the sample documentation under code S4 of the food sample from the North region to be inserted into the sample worksheet in the different fields. If no information is available, put ‘-‘. The sampling ID for the South is S5 and of the costal region S6. (7.5 points: ½ point for each correct response)
sampleid: fooditemid or name in source: sampplan: sampdate: sampdesc: sampcoll: sampfdnr: sampwght: sampanr: sampanrep: samphand: samparriv: sampstor: sampreason: biblioid:
Indicate the value documentation for water of the aggregated food sample from all regions to be inserted into the value documentation worksheet in the different fields. If no information is available put ‘-‘. (13.5 points: ½ point for each correct response)
biblioid: fooditemid or name in source: sampleid: S4, S5, S6 componentid: value: unit: baseunit: n: methodid of entire method: QC (quality control): valtype (look in code worksheet): sourcetype: derivtype: sd: se (=sd/n): min: max: mean: median: lowerror: higherror: qi: analysedate: prepsampl in lab: prepanadt: sepanadt: qtanadt:
List the two nutrients for which additional information is required before the data can be incorporated into the database. (2 points)

Module 10 – Questions
182
X.E10 A compiler wishes to incorporate the carotene values of bananas (Fi’s banana; Musa troglodytarum L.) found in the International Journal of Food Composition (IJFC), volume 1 (1), p. 1-20 of 2008. The author is K. L. Miller and the title is ‘Carotene content of local banana varieties in Wonderland’, a small island with 100,000 inhabitants. The method and material section provides the following description: The variety names were identified by key informants and market surveys, and then identified by their scientific name by the International Botanic Organization (IBO). In 2007, 20 bananas of each variety were collected from different markets. The dimensions and edible portion were measured, digital photos were taken, and the colour of the flesh was visually assessed (and classified in five categories) as well as by DSM detector (detecting 15 segments of yellow-to-orange). The peeled bananas were halved and one half was analysed raw and the other half boiled (10 minutes in a stainless steel pot) before analysing. The samples were deep-frozen at -80°C and shipped to an oversees laboratory for analysis. An HPLC method was used for the carotene analysis and the extraction, separation, identification and quantification are described by Smith et al. (2007). Samples were analysed in duplicates (variation under 8%) and an internal standard (β-apo-8’-carotenal) was used with a recovery of 97%. Riboflavin, ascorbic acid and α-tocopherol were also determined by HPLC. The results are as follows: Banana variety and preparation
Number of analysed samples
Colour Edible coefficient
β-carotene (mcg*)
α- carotene (mcg*)
β-crypto-xanthin (mcg*)
Water (g*)
Jammy, raw 3 3 (yellow) 0.63 432 ND ND Than, raw 4 4 (yellow) 0.67 806 360 ND 76 Than, boiled 4 4 (yellow) 0.67 960 355 ND 76 Khan, raw 3 8 (yellow-
orange) 0.65 2588 1236 31 ND
Canot, raw 6 15 (orange)
0.72 8455 ND ND 70
* per 100g edible portion ND = not determined Compile all these data in the Compilation Tool version 1.2.1 using the food codes 04001–04005. Then answer the questions in the table below. (19.5 points)

Module 10 – Questions
183
Questions Responses How many records for the banana varieties will be in the archival database? (1 point)
Is there a need to change units for any of the components? (1 point)
Yes No
Using the abbreviation ‘Miller2008’ as biblioid, indicate the information put into the field ‘consolidated’ in the worksheet ‘bibliography’’. (1 point)
Indicate the sample documentation for ‘Khan, raw’ under sampleID S10 to be inserted into the worksheet ‘sampling’ in the different fields. If no information is available, put ‘-’. (4.5 points – ½ point for each correct response)
sampleid: fooditemid or name in source (put food codes only): sampplan: sampdate: sampdesc: sampcoll: sampfdnr: sampwght: biblioid:
Indicate the documentation for ‘Khan, raw’. If no information is available, insert ‘-’. (4.5 points)
foodname in English: source: methodid of entire method for β-carotene: methodid of entire method for water: n: sd (Khan for β-carotene): min (Khan for β-carotene): mean (Khan for β-carotene):
Indicate the tagnames of the analysed components in the bananas. (2.5 points)
edible coefficient: α-carotene: β–carotene: β-crypto-xanthin: Water:
Calculate VITA_RAE for the five foods in mcg (without decimal places) using retinol + CARTBEQ/12 (5 points)
Banana, Jammy, yellow, raw:) Banana, Than, yellow, raw: Banana, Than, yellow, boiled: Banana, Khan, yellow-orange, raw: Banana, Canot, orange, raw:

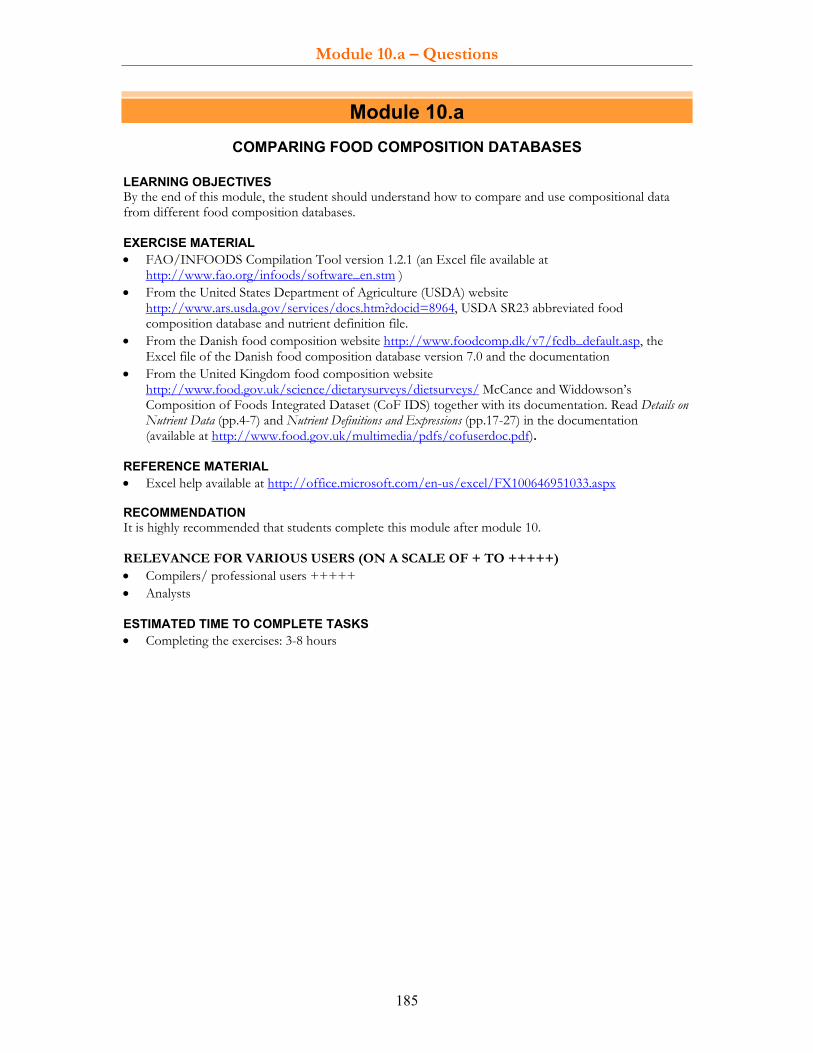
Module 10.a – Questions
185
Module 10.a COMPARING FOOD COMPOSITION DATABASES
LEARNING OBJECTIVES By the end of this module, the student should understand how to compare and use compositional data from different food composition databases. EXERCISE MATERIAL • FAO/INFOODS Compilation Tool version 1.2.1 (an Excel file available at
http://www.fao.org/infoods/software_en.stm ) • From the United States Department of Agriculture (USDA) website
http://www.ars.usda.gov/services/docs.htm?docid=8964, USDA SR23 abbreviated food composition database and nutrient definition file.
• From the Danish food composition website http://www.foodcomp.dk/v7/fcdb_default.asp, the Excel file of the Danish food composition database version 7.0 and the documentation
• From the United Kingdom food composition website http://www.food.gov.uk/science/dietarysurveys/dietsurveys/ McCance and Widdowson’s Composition of Foods Integrated Dataset (CoF IDS) together with its documentation. Read Details on Nutrient Data (pp.4-7) and Nutrient Definitions and Expressions (pp.17-27) in the documentation (available at http://www.food.gov.uk/multimedia/pdfs/cofuserdoc.pdf).
REFERENCE MATERIAL • Excel help available at http://office.microsoft.com/en-us/excel/FX100646951033.aspx RECOMMENDATION It is highly recommended that students complete this module after module 10. RELEVANCE FOR VARIOUS USERS (ON A SCALE OF + TO +++++) • Compilers/ professional users +++++ • Analysts ESTIMATED TIME TO COMPLETE TASKS • Completing the exercises: 3-8 hours

Module 10.a – Questions
186
EXERCISES
Xa.E1 Compare the components in the Compilation Tool version 1.2.1 with those appearing in the USDA SR23 comprehensive database and in the USDA abbreviated table. You will also need to consult the documentation of SR23. Then answer the following questions. (20 points) Note: 1. From the USDA website http://www.ars.usda.gov/services/docs.htm?docid=8964 download the
USDA SR23 abbreviated food composition database (click on ‘download’ and select ‘Excel’), the documentation and the Nutrient definition file. The Nutrient definition file lists the tagnames and units for all components of the comprehensive database.
2. The Compilation Tool version 1.2.1 can be found at http://www.fao.org/infoods/software_en.stm. The component names in the Compilation Tool are tagnames. Their meanings and units can be found in the component worksheet (and are available at http://www.fao.org/infoods/tagnames_en.stm) and are explained in detail in module 4.b.
Questions Responses Number of components that have different units between the SR23 abbreviated table and nutrients in the Compilation Tool (2 points)
Number of components that have different units between the USDA SR23 comprehensive database (as listed in the Nutrient definition file) and the corresponding components in the Compilation Tool (2 points)
Indicate the components that are in both the USDA SR23 comprehensive database and in the Compilation Tool but are not in the abbreviated USDA table. (3.5 points)
ENERC (kJ) Individual sugars FIBTG NA Individual amino acids Individual fatty acids FAMS
What should be done to access the additional components of the comprehensive database with their values? List two options. (2 points)
Select the components that are not in the USDA SR23 comprehensive database but are in the Compilation Tool. (3.5 points)
NT FAT CHOAVLDF ADSUGAR CA ID VITD (mcg)
Where is the information about the number of decimal places located in the USDA nutrient definition file? (1 point)
Where are the nutrient definitions indicated for the USDA SR23? (1 point)
For the USDA SR23, where are the analytical methods for the components indicated? (1 point)
For some of the fatty acids of USDA SR23, it is difficult to decide whether or not they are the same as those in the Compilation Tool. For example: Is 22:5 n-3) in USDA SR23 the same as F22D5CN3? What should a user do to know if they really are the same? Select the correct answer by striking through those that are wrong. (1 point)
- Assume that they are the same because there is no trans form - Assume that they are different because there is a trans form - Write and ask USDA
List two of the nutrients in the USDA database that could cause problems for untrained users because of their name, definition or unit. (2 points)
Which database should be downloaded by a compiler interested in individual fatty acids and amino acids: the abbreviated or the comprehensive database of USDA SR23? Strike though the incorrect one. (1 point)
Abbreviated/comprehensive database
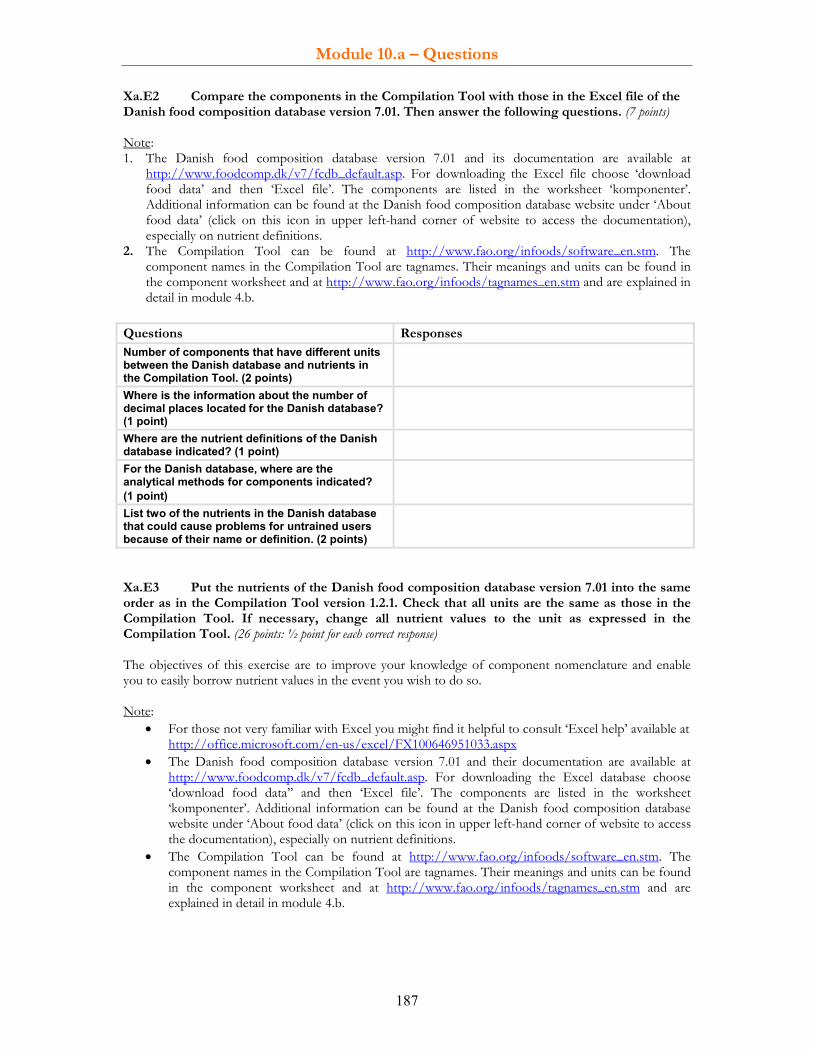
Module 10.a – Questions
187
Xa.E2 Compare the components in the Compilation Tool with those in the Excel file of the Danish food composition database version 7.01. Then answer the following questions. (7 points) Note: 1. The Danish food composition database version 7.01 and its documentation are available at
http://www.foodcomp.dk/v7/fcdb_default.asp. For downloading the Excel file choose ‘download food data’ and then ‘Excel file’. The components are listed in the worksheet ‘komponenter’. Additional information can be found at the Danish food composition database website under ‘About food data’ (click on this icon in upper left-hand corner of website to access the documentation), especially on nutrient definitions.
2. The Compilation Tool can be found at http://www.fao.org/infoods/software_en.stm. The component names in the Compilation Tool are tagnames. Their meanings and units can be found in the component worksheet and at http://www.fao.org/infoods/tagnames_en.stm and are explained in detail in module 4.b.
Questions Responses Number of components that have different units between the Danish database and nutrients in the Compilation Tool. (2 points)
Where is the information about the number of decimal places located for the Danish database? (1 point)
Where are the nutrient definitions of the Danish database indicated? (1 point)
For the Danish database, where are the analytical methods for components indicated? (1 point)
List two of the nutrients in the Danish database that could cause problems for untrained users because of their name or definition. (2 points)
Xa.E3 Put the nutrients of the Danish food composition database version 7.01 into the same order as in the Compilation Tool version 1.2.1. Check that all units are the same as those in the Compilation Tool. If necessary, change all nutrient values to the unit as expressed in the Compilation Tool. (26 points: ½ point for each correct response) The objectives of this exercise are to improve your knowledge of component nomenclature and enable you to easily borrow nutrient values in the event you wish to do so. Note:
• For those not very familiar with Excel you might find it helpful to consult ‘Excel help’ available at http://office.microsoft.com/en-us/excel/FX100646951033.aspx
• The Danish food composition database version 7.01 and their documentation are available at http://www.foodcomp.dk/v7/fcdb_default.asp. For downloading the Excel database choose ‘download food data’’ and then ‘Excel file’. The components are listed in the worksheet ‘komponenter’. Additional information can be found at the Danish food composition database website under ‘About food data’ (click on this icon in upper left-hand corner of website to access the documentation), especially on nutrient definitions.
• The Compilation Tool can be found at http://www.fao.org/infoods/software_en.stm. The component names in the Compilation Tool are tagnames. Their meanings and units can be found in the component worksheet and at http://www.fao.org/infoods/tagnames_en.stm and are explained in detail in module 4.b.

Module 10.a – Questions
188
Instructions to change the order of nutrients in the Excel file of the Danish food composition database: 1. Attribute tagnames to all components of the Danish database. 2. Open in two Excel applications (not in two windows of the same Excel application) the two files
‘Compilation Tool version 1.2.1.xls’ and the Danish food composition database version 7.01. Minimize them. Then arrange the two windows so that you can see them together on the screen (one above the other).
3. Cut and insert (not paste!! as paste would overwrite existing data) the different columns into the right order.
a. Insert a line before the first line in the Danish file. Copy the English component names from the worksheet ‘Komponenter’ and paste them with ‘past special’ and ‘transpose’ into this line.
b. Move columns with same nutrient definition to the corresponding column in the Compilation Tool
c. Insert a blank column when the nutrient is not available in the Danish file. d. Move the columns with those components not present in the Compilation Tool to the
end of the file (do not delete them as you might wish to use them at a later stage). 4. You can use button F4 to repeat the last task, e.g. to insert a column. 5. Check whether you have put the columns in the right place:
a. insert into the Danish file a row before row 1 b. copy the tagnames (e.g. from reference database worksheet) starting with DEN until the
last tagname c. paste the copied tagnames into the inserted row in the Danish file d. Change order if necessary and check again.
6. Create a new worksheet and put all unused components into it together with the columns ‘food codes’ and ‘food names’. Pay attention that the food names and codes are on the same lines as their corresponding values.
Congratulations Now verify that you have made the transformation correctly by putting into the table below the English and Danish component names corresponding to the listed component names of the Compilation Tool. If there is no correspondence, put a dash ‘-’. Component name in Compilation Tool
Corresponding English component name in Danish database
Corresponding Danish component name in Danish database
ENERC(kcal) (standardized)
WATER(g)
XN
PROCNT/PROT(g)
FASAT(g)
CHOAVLDF(g)
CHOAVLM(g)
FIBTG(g) AOAC
PSACNS(g) NSP
FIB – (g)
ASH(g)
CA(mg)

Module 10.a – Questions
189
SE(mcg)
ID(mcg)
VITA_RAE(mcg) (standardized)
VITA_RAE(mcg)
VITA(mcg)
CARTBEQ(mcg)
CARTB(mcg)
VITD(mcg)
FOL(mcg) (standardized)
FOL
FOLFD(mcg)
NIAEQ(mg)
F18D1CN7(g)
LEU(mg)
Xa.E4 Compare the components in the Compilation Tool with those in the British food composition database ‘McCance and Widdowson’s Composition of Foods Integrated Dataset’ (CoF IDS). Then answer the following questions (6 points) Note:
• The ‘McCance and Widdowson’s Composition of Foods Integrated Dataset’ (CoF IDS) is available at http://www.food.gov.uk/science/dietarysurveys/dietsurveys/ together with its documentation. Read the sections Details on Nutrient Data (pp.4-7) and Nutrient Definitions and Expressions (pp.17-27) in the documentation (available at http://www.food.gov.uk/multimedia/pdfs/cofuserdoc.pdf). Some of the nutrients were already matched to tagnames in IVb.E4.
• The Compilation Tool is available at http://www.fao.org/infoods/software_en.stm. The component names in the Compilation Tool are tagnames; their meanings and units can be found in the component worksheet and at http://www.fao.org/infoods/tagnames_en.stm and are explained in detail in module 4.b.
Questions Responses Number of units that are different between the British table and the nutrients in the Compilation Tool (2 points)
Where are the nutrient definitions indicated for the British database? (1 point)
For the British database, where are the analytical methods for the components indicated? (1 point)
List two of the nutrients in the British database that could cause problems for untrained users because of their name or definition. (2 points)


Module 10.b – Questions
191
Module 10.b CASE STUDY - TRANSLATING FOOD INTAKE INTO NUTRIENT INTAKES
LEARNING OBJECTIVES By the end of this module, the student will be able to calculate nutrient intake estimations and appreciate difficulties in selecting appropriate foods from a food composition database or table to obtain high-quality results. RECOMMENDATION This is a case study to apply the newly acquired knowledge in food composition. The learner will choose a diet and a food composition database to translate the food into nutrient intakes. This exercise is like a real-life situation where the most suitable food records have to be identified and then be applied. The learner will encounter many difficulties and may have to go back to some modules or learning material. It is however highly recommended that this exercise be completed in groups and results discussed among learners. This module should be completed after module 10 and 10.a. RELEVANCE FOR VARIOUS USERS (ON A SCALE OF + TO +++++) • Compilers/ professional users +++++ • Analysts ESTIMATED TIME TO COMPLETE TASKS • Completing the exercises: 3-10 hours ANSWERS TO THE EXERCISES There are no answers to the exercises as all results depend on individual choices of foods and the food composition database. Guidance for responses Pay attention when: • describing your foods (see module 3)
Be comprehensive in the food description. For example, ‘low fat milk’ is too vague. ‘Milk, cow, low fat, 1.5 % fat, pasteurized’ is better.
• matching foods (see modules 3 and 10) Be careful to select the closest foods in the food composition tables to yours. Food matching is key to the quality of the nutrient intake estimations.
• copying values to match correct component and unit plus denominator (see modules 4.b, 4.c, and 10) • calculating recipes (see module 8) • compiling data (see modules 10, 10.a and 11)
Frequently re-check your values for consistency and errors. Errors are easy to introduce.

Module 10.b – Questions
192
EXERCISES
Xb.E1 Calculate the nutrient intake estimations for the selected diet following the instructions below. 1. The diets below represent the results of a national food consumption survey carried out with a food frequency questionnaire (FFQ). Select one. European diet Rice-based diet Maize-based diet Foods Consump-
tion in g per day
Foods Consump-tion in g per day
Foods Consump-tion in g per day
-Pasta or rice -Mixed-grain bread -White bread (buns, rolls, etc) - Wholemeal bread -Potatoes -Vegetables (fresh or as a side dish) -Fruit, fresh -Stewed fruit, fruit sauce, etc -Milk, and other milk drinks -Milk products (e.g. cheese, yoghurt) -Beef or pork -Poultry -Processed meats (sausages, etc.) -Fish -Eggs -Pulses (beans, lentils, etc.) -Almonds, peanuts or nuts -Butter, vegetable oils -Pastries -Chocolate, confectionery -Savoury snacks (e.g. chips) -Fruit or vegetable juices -Soft drinks etc -Tee (black, fruit, green tea) -Coffee -Water -Alcoholic beverages
60 50 50 20 50 100 80 20 300 40 100 50 80 30 50 10 20 50 50 30 30 150 250 20 20 200 20
-Rice -Potatoes -Vegetables (fresh or as a side dish) -Fruit, fresh -Stewed fruit, fruit sauce, etc -Milk, and other milk drinks -Milk products (cheese, yoghurt, etc.) -Beef or pork -Poultry -Fish -Eggs -Pulses (beans, lentils, etc.)) -Almonds, peanuts or nuts -Butter, vegetable oils-Pastries -Chocolate, confectionery -Savoury snacks (e.g. Chips) -Fruit or vegetable juices -Soft drinks etc -Tee (black, fruit, green tea) -Water -Alcoholic beverages
200 20 200 80 5 30 5 20 30 50 30 60 50 30 10 10 30 20 20 200 300 20
-Maize (porridge, etc) -Bread (maize, wheat etc.) -Potatoes and other tuber (cassava, taro etc) -Vegetables (fresh or as a side dish) -Fruit, fresh -Stewed fruit, fruit sauce, etc -Milk, and other milk drinks -Milk products (cheese, yoghurt, etc.) -Beef or pork -Poultry -Fish -Eggs -Pulses (beans, lentils, etc.)) -Almonds, peanuts or nuts -Butter, vegetable oils -Pastries -Chocolate, confectionery -Savoury snacks (e.g. Chips) -Fruit or vegetable juices -Soft drinks etc -Tee (black, fruit, green tea) -Coffee -Water -Alcoholic beverages
80 50 100 100 80 5 30 30 30 50 30 20 50 20 40 10 5 10 20 200 100 20 300 50
2. For the chosen diet, select for each reported food the three foods that best represent the FFQ foods. Later on these three foods will be matched with foods in food composition tables (i.e. to borrow their nutrient values) and then to calculate nutrient intake estimations. For example: for the FFQ food ‘Pasta or rice’, the foods ‘boiled white spaghetti’, ‘baked lasagne with meat sauce’ and ‘boiled white rice’ were chosen to best represent the FFQ food.

Module 10.b – Questions
193
3. Select a food composition database as the primary source of data (preferably the national food composition database) and decide which other databases or literature sources to use in case the data are not found in the primary source. 4. Decide which nutrients and components to include in your food composition database. Select nutrient definition, unit and denominator for all components. Match them to tagnames. You may also decide to take all components indicated in the Compilation Tool version 1.2.1 for your database. See module 4.a for more information. 5. Match components from the different compositional data sources to INFOODS tagnames. 6. Decide on a food grouping system and classify all FFQ foods with their three corresponding foods (e.g. ‘boiled white spaghetti’) within the system. See module 3 for more information. 7. Copy the Compilation Tool version 1.2.1 from the INFOODS website (http://www.fao.org/infoods/SOFTWARE/compilation%20tool%20version1.2.xls) and save it on to your computer. Do not delete or change the order of components. If you need to add components, do so at the end of the list. In the user database, you can insert them into the position you wish. 8. In the worksheet ‘archival database’, enter all FFQ foods and corresponding foods within the food groups. Add a code, a record number and type. See module 10 for more information. 9. In the worksheet ‘archival database’ of the Compilation Tool, match the foods (e.g. ‘boiled white spaghetti’) to foods in the food composition database. Allocate 1 for exact match, and 2 for similar match. Document the data by indicating ‘source’ and ‘fdnumber of source’ in the corresponding fields. (Option for those with limited time availability: select three FFQ foods and their corresponding nine foods and continue the remaining tasks with them.) 10. In the worksheet ‘archival database’, copy the nutrient values of the foods from the data source into the corresponding fields of the foods representing the FFQ foods. See in module 10.a how to change the order of components in the source documents and to compare them to an existing set of components. 11. Copy all completed lines from the ‘archival database’ into the worksheet ‘reference database’. Add a line below each food to add additional documentation. Now aggregate data, complete missing data, estimate or impute data, calculate energy and other equivalents, etc. Complete the ‘standardized’ nutrients. Check data for consistency and plausibility. See modules 8 and 10 for more information. 12. If necessary, calculate the nutrient values of recipes or cooked foods in the worksheet ‘recipe calculation’. If necessary, in the worksheet ‘recipe+ingredients’, transform weights of raw foods with inedible parts into the weight of the raw edible food. Recipe calculation should start only when all ingredients have a complete set of nutrient values which were also checked for consistency. If any recipe ingredient is missing in the database, add it first in the ‘archival database’ then into the ‘reference database’ and complete and check all values of the ingredient (as listed under points 9-11). Once the recipe calculation has been completed and the values checked, copy the final nutrient values of the recipe into the ‘reference database’. See module 8 for more information. 13. Decide on a weighing factor for the three foods per FFQ food. For example: For the FFQ food ‘Pasta or rice’ (60 g/d), the equal weighing factors were chosen because an similar consumption is assumed in the population: 33% (=20 g/d) ‘boiled white spaghetti’, 33% (=20 g/d) ‘baked lasagne with meat sauce’, and 33% (=20 g/d) ‘boiled white rice’. 14. Calculate the nutrient intake estimations for the selected nutrients.

Module 11 – Questions
195
Module 11 QUALITY CONSIDERATIONS IN DATA COMPILATION
LEARNING OBJECTIVES By the end of this module the student will be able to:
understand the principles of quality assessment and their importance in the compilation process; apply them when collecting and compiling compositional data for food composition databases.
REQUIRED READING • Greenfield, H. & Southgate, D.A.T. 2003. Food composition data – production, management and use. FAO,
Rome. Chapter 10 (pp. 174-178, 183-186 of the book, not of the PDF file). The PDF file of this book is available at the INFOODS website: ftp://ftp.fao.org/docrep/fao/008/y4705e/y4705e00.pdf
• EuroFIR. October 2009. EuroFIR Workpackage 1.3, Task group 4. Guidelines for quality index attribution to original data from scientific literature or reports for EuroFIR data interchange. Draft document. Available at: http://www.eurofir.net/policies/activities/quality_framework or http://www.eurofir.net/sites/default/files/Deliverables/EuroFIR_Quality_Index_Guidelines.pdf
EXERCISE MATERIAL • Westenbrink, S., Oseredczuk, M., Castanheira, I. & Roe, M. 2008. Food composition databases:
The EuroFIR approach to develop tools to assure the quality of the data compilation process. Food Chemistry, doi:10.1016/j.foodchem.2008.05.112. The article may be ordered though http://www.sciencedirect.com/science?_ob=ArticleURL&_udi=B6T6R-4SRCJVP-5&_user=6718006&_rdoc=1&_fmt=&_orig=search&_sort=d&view=c&_acct=C000055286&_version=1&_urlVersion=0&_userid=6718006&md5=91eda33285385a8161457319abba68be
• Holden, J.M., Bhagwat, S.A. & Patterson, K.Y. 2002. Development of a multinutrient data quality evaluation system. Journal of Food Composition and Analysis 15(4), pp. 339–348. Available at: http://www.sciencedirect.com/science?_ob=PublicationURL&_tockey=%23TOC%236879%232002%23999849995%23341462%23FLP%23&_cdi=6879&_pubType=J&_auth=y&_acct=C000055286&_version=1&_urlVersion=0&_userid=6718006&md5=c50ea9203aa7a0b2dce40ca403eaf868
LITERATURE QUOTED IN QUESTIONS AND EXERCISES • Klensin J., Feskanich, D., Lin, V., Truswell, S.A. & Southgate, D.A.T. 1989. Identification of Food
Components for INFOODS Data Interchange. UNU, Tokyo. Available at: http://www.unu.edu/unupress/unupbooks/80734e/80734E00.htm or as PDF at ftp://ftp.fao.org/es/esn/infoods/Klensinetal1989Identificationoffoodcomponents.pdf
• Truswell, S.A., Bateson, D.J., Madafiglio, K.C., Pennigton, J.A.T., Rand, W.M. & Klensin, J.C. 1991. Committee Report: INFOODS - Guidelines for describing Foods: A Systematic Approach to Describing Foods to Facilitate International Exchange of Food Composition Data. Journal of food composition and analysis 4, 18-38. Available at: http://www.fao.org/wairdocs/AD069E/AD069E00.HTM
• Schlotke, F., Becker, W., Ireland, J., Møller, A., Ovaskainen, M.L., Monspart, J. & Unwin, I. 2000. Eurofoods recommendations for food composition database management and data interchange. Report No. EUR 19538. Office for Official Publications of the European Communities, Luxembourg. Available at: ftp://ftp.fao.org/ag/agn/infoods/EurofoodsRecommendations.pdf
• The LanguaL food description system http://www.langual.org/: its use, thesaurus, and further literature.
• Castanheira, I., Robb, P., Owen, L., den Boer, H., Schmit, J., Ent, H., Calhau, M.A. 2007. A proposal to demonstrate a harmonized quality approach to analytical data production by EuroFIR. Journal of Food Composition and Analysis, 20, pp. 725-732. Available at http://www.sciencedirect.com/science?_ob=PublicationURL&_cdi=6879&_pubType=J&_acct=C000055286&_version=1&_urlVersion=0&_userid=6718006&md5=025a00d3fb8e5e6666bdc4983483ca9c&jchunk=20#20

Module 11 – Questions
196
RECOMMENDATION It is highly recommended that students complete modules 1 and 3-10 before starting on the present module. RELEVANCE FOR VARIOUS USERS (ON A SCALE OF + TO +++++) • Compilers/ professional users +++++ • Analysts ++ ESTIMATED TIME TO COMPLETE TASKS • Required reading: 1-3 hours • Answering the questions: 1-3 hour • Completing the exercises: 1-3 hour SUGGESTED ADDITIONAL READING • Castanheira, I., Roe, M., Westenbrink, S., Ireland, J., Møller, A., Salvini, S., Beernaert, H.,
Oseredczuk, M. & Calhau, M.A. 2009. Establishing quality management systems for European food composition databases. Food Chemistry Volume 113, Issue 3, 1 April, pp. 776-780. doi:10.1016/j.foodchem.2008.05.091. The article may be ordered though http://www.sciencedirect.com/science?_ob=ArticleURL&_udi=B6T6R-4SNGMB7-B&_user=6718006&_rdoc=1&_fmt=&_orig=search&_sort=d&view=c&_acct=C000055286&_version=1&_urlVersion=0&_userid=6718006&md5=336901caae408d852ad71afbfdc1ff3f
• Burlingame, B. 2004. Fostering quality data in food composition databases: visions for the future. Journal of Food Composition and Analysis Volume 17, Issues 3-4, pp. 251-258. Available at http://www.sciencedirect.com/science/article/B6WJH-4CG7FR0-2/2/1ba833ea69c95f2c70b26cdd1a429d98
• Harrison, G.G. 2004. Fostering data quality in food composition databases: applications and implications for public health. Journal of Food Composition and Analysis Volume 17, Issues 3-4, pp. 259-265. Available as above.

Module 11 – Questions
197
Questions XI.Q1 What is the purpose of assigning quality codes to food composition data? Select True or False. (4 points: ½ point for each correct response) Quality codes are assigned to food composition data in order to: True False indicate the overall quality of analytical data points, including for data interchange. assess the quality of data obtained from the scientific literature and laboratory reports. assess the quality of data that are borrowed, imputed, calculated or estimated in the food composition database.
provide a formalized approach to assist compilers to accept or reject data for inclusion in a food composition database.
assist compilers revising low-quality data. show users which data points are more reliable than others. motivate compilers to adopt high-quality compilation procedures. provide information to data generators and compilers for prioritizing foods and nutrients for new analysis.
XI.Q2 Data quality can be assessed in a meaningful manner only when certain requirements are fulfilled (e.g. data documentation). Otherwise, all or most data would receive a low-quality score. From the following list, select those elements needed to assess the quality of food composition data. Select True or False. (4 points: ½ point for each correct response) Elements needed to assess the quality of the food composition data True False Value documentation Comprehensive information on the food and component nomenclature used Compilation software that has features to support documentation and facilitates the quality assessment of data
Written guidelines on the data quality assessment procedure, including criteria and/or advice for compilers to decide on the inclusion or exclusion of data
Food consumption data Written guidelines on laboratory quality assurance schemes Metadata of food composition data Staff time XI.Q3 Match the definitions with the corresponding terms. (3.5 points: ½ point for each correct response)
Terms: 1. Confidence code (CC) 2. Evaluation category 3. Evaluation criteria 4. Quality index (QI) 5. Data quality assessment (evaluation) system 6. Quality 7. Source code

Module 11 – Questions
198
Definitions Term
number It is a systematic approach to evaluating data quality in accordance with common guidelines and criteria, and subsequently expressing data quality in a standardized and coherent manner.
It corresponds to one topic or theme divided into a series of criteria. It indicates the origin/source of the data point, which is sufficient to indicate the quality of the calculated or estimated data. It can be used as an indicator of data quality.
It represents the totality of characteristics of an entity (product or service) that are able to satisfy stated and implied needs.
It is expressed in numerical values used to judge whether a component value is likely to represent the real content in a food (e.g. in a given country). These values derive from the points achieved in the evaluation process and which the compiler will transform into the confidence codes for users.
This expresses the overall trust that the compiler has in the data. It is usually in letter form, and is intended to guide users of food composition databases on the quality of their data. For example, A = high; B = moderate; C = low.
These are specific topics (often formulated as questions) used to assess the data quality within a category. Ideally, they should be clear and objective and accompanied by possible answers such as: yes, no, unknown or non applicable. Sometimes they are broad statements with answers such as: well done, less clear, no information or incorrect application. Points can be achieved through the answers and will be summarized to build the confidence codes and then the quality index.
XI.Q4 For each of the four data scrutiny considerations or quality assessment systems given below, select the evaluation criteria included. (22 points: ½ point for each correct response) Criteria Confidence
codes (Exler, 1982)*
USDA data evaluation system (Holden et al., 2002)*
Data scrutiny considerations (Greenfield and Southgate, 2003)
EuroFIR quality index (EuroFIR, 2007)
Food identification Component identification
Unit and denominator Sampling plan Number of independent analytical samples
Sample handling in laboratory
Validity of analytical method
Analytical quality control/assurance
Uses broad statements per criteria
Uses specific questions per criteria
* cited in Greenfield and Southgate, 2003
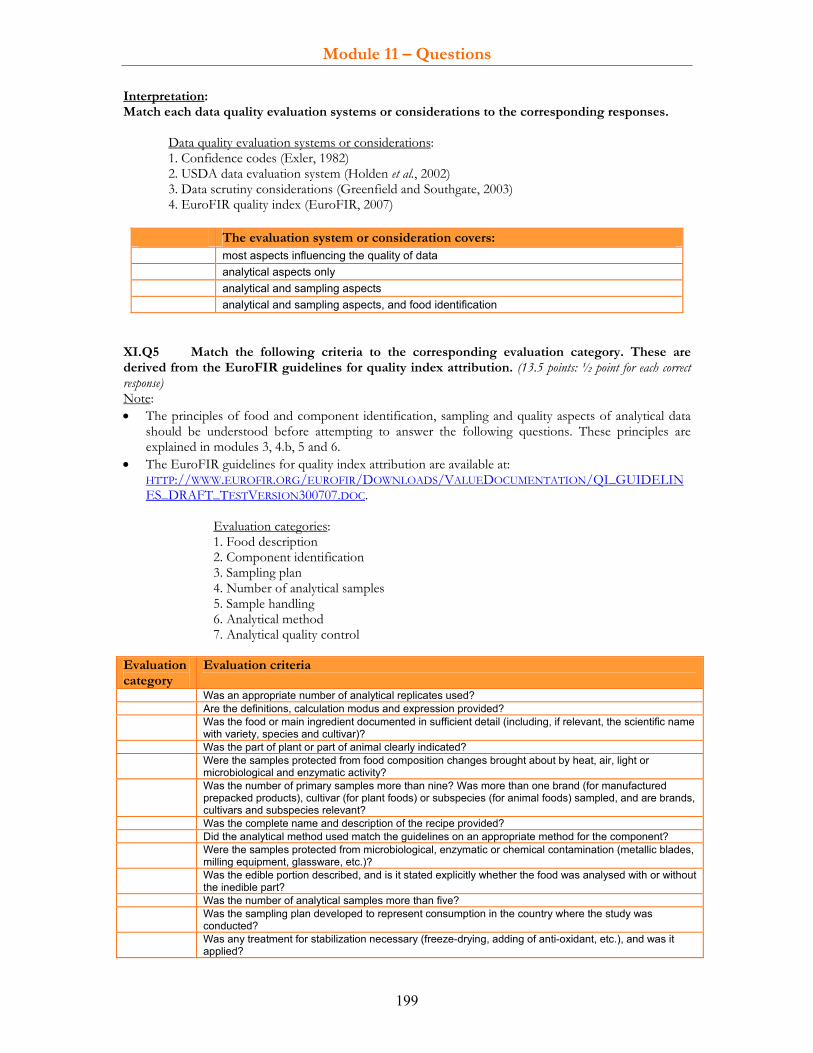
Module 11 – Questions
199
Interpretation: Match each data quality evaluation systems or considerations to the corresponding responses.
Data quality evaluation systems or considerations: 1. Confidence codes (Exler, 1982) 2. USDA data evaluation system (Holden et al., 2002) 3. Data scrutiny considerations (Greenfield and Southgate, 2003) 4. EuroFIR quality index (EuroFIR, 2007)
The evaluation system or consideration covers:
most aspects influencing the quality of data analytical aspects only analytical and sampling aspects analytical and sampling aspects, and food identification
XI.Q5 Match the following criteria to the corresponding evaluation category. These are derived from the EuroFIR guidelines for quality index attribution. (13.5 points: ½ point for each correct response) Note: • The principles of food and component identification, sampling and quality aspects of analytical data
should be understood before attempting to answer the following questions. These principles are explained in modules 3, 4.b, 5 and 6.
• The EuroFIR guidelines for quality index attribution are available at: HTTP://WWW.EUROFIR.ORG/EUROFIR/DOWNLOADS/VALUEDOCUMENTATION/QI_GUIDELINES_DRAFT_TESTVERSION300707.DOC.
Evaluation categories: 1. Food description 2. Component identification 3. Sampling plan 4. Number of analytical samples 5. Sample handling 6. Analytical method 7. Analytical quality control
Evaluation category
Evaluation criteria
Was an appropriate number of analytical replicates used? Are the definitions, calculation modus and expression provided? Was the food or main ingredient documented in sufficient detail (including, if relevant, the scientific name
with variety, species and cultivar)? Was the part of plant or part of animal clearly indicated? Were the samples protected from food composition changes brought about by heat, air, light or
microbiological and enzymatic activity? Was the number of primary samples more than nine? Was more than one brand (for manufactured
prepacked products), cultivar (for plant foods) or subspecies (for animal foods) sampled, and are brands, cultivars and subspecies relevant?
Was the complete name and description of the recipe provided? Did the analytical method used match the guidelines on an appropriate method for the component? Were the samples protected from microbiological, enzymatic or chemical contamination (metallic blades,
milling equipment, glassware, etc.)? Was the edible portion described, and is it stated explicitly whether the food was analysed with or without
the inedible part? Was the number of analytical samples more than five? Was the sampling plan developed to represent consumption in the country where the study was
conducted? Was any treatment for stabilization necessary (freeze-drying, adding of anti-oxidant, etc.), and was it
applied?

Module 11 – Questions
200
Evaluation category
Evaluation criteria
Was the physical state, shape or form indicated (solid, semi-solid, liquid, ground, with pulp, etc.)? Was the laboratory accredited for this method, or was the method validated by performance testing? If the food was cooked, were full details of the cooking method provided? Was the number of analytical samples more than one and fewer than five? If so, which number? Were storage and transportation times adequate to preserve the level of the analyte? Was an appropriate certified reference material or a standard reference material used? Was the moisture content of the sample measured and the result given? Does the component, as described in the publication, match the component as described in the
databank? Were samples taken during more than one season? Is (are) the season(s) of sampling relevant? Were samples taken from more than one geographical location and/or sales outlet? Was the number of analytical samples one? Were the samples homogenized? Were the unit and the denominator (i.e. matrix unit) unequivocal? Were the key method steps appropriate to describe the analytical method?
XI.Q6 Data scrutiny and quality assessment schemes should be robust, i.e. different users applying the same criteria to the same data should come to the same (or similar) results. Select the procedure that is the most robust data scrutiny and quality assessment scheme. (1 point) Robustness of data scrutiny and quality assessment scheme Most robust Quality is established based on subjective allocation of points per criteria (e.g. 2-9 points, depending on details of food description).
Quality is established based on criteria with objective questions and a well-defined, standardized way of allocating points, i.e. each criterion is accompanied both by a set of specified conditions to attribute points and by a thesaurus for terms.
Quality is established based on objective questions with a subjective allocation for overall scoring per question.
Quality is established based on criteria with questions that may be interpreted in different ways by different users.
XI.Q7 Some quality assessment systems explicitly exclude data obtained from the calculation, borrowing, imputation and estimation. Indicate from the following list the elements which should be included in a data quality assessment system to assess the quality of data derived from recipe calculations, borrowing, imputation and estimation. Select True or False. (7.5 points: ½ point for each correct response) Elements needed for data quality assessment of recipe calculations True False Quantity and description of all ingredients Quality indication of yield and nutrient retention factors for cooked recipes Recipe name and brief description of preparation steps that have an impact on nutrient values
All detailed cooking instructions as provided in recipe book (e.g. cut into 2 cm strips and leave to cool for two hours)
Quality indication of nutrient values of ingredients Standardized application of yield and nutrient retention factors for cooked recipes Bibliographic reference of the recipe (e.g. recipe book) Written procedure on analytical methods Sampling of ingredients Written guidelines on the quality assessment scheme for data derived from recipe calculations

Module 11 – Questions
201
Elements needed for data quality assessment for borrowing, imputation and estimation of values
True False
Assurance that foods are the same or as similar as possible Assurance that laboratory quality assurance schemes are applied to calculated data Assurance that the food composition data from foreign food do not represent the food composition of local food
Assurance that fortification is taken into account Assurance that components have the same definition, mode of expression and units Assurance that correction factors are applied to relevant nutrient values when there are significant differences in water, protein and/or fat values between the food in one’s own database and the food(s) from which values are copied
Assurance that values are copied from other sources only in the event there is no significant difference in water, protein and/or fat values between one’s own food and the foods from which values are copied
Assurance that the analytical methods of the foreign source generate similar values for the food as required for one’s own database in order to obtain high-quality scores
XI.Q8 Determine the correct order of usefulness of different data quality identifications for users: 1 being the most useful and 4 the least useful. (2 points: ½ point for each correct response) Usefulness of data quality identifications for users
Each component value in the user database is accompanied by a confidence code: A, B or C - with explanations, e.g. A = good confidence in value; B = some confidence but with limitations, C = low confidence but best estimate. If required, further information may be obtained from the compiler.
Confidence codes A, B, C are provided at the food level with explanations, e.g. A = confidence in values; B = some confidence but with limitations, C = low confidence but best estimates. If required, further information may be obtained from the compiler.
No quality codes are given. Each component value is accompanied by a confidence code: A, B, C with explanations, e.g. A =
confidence in value; B = some confidence but with limitations, C = low confidence but best estimate. No additional information may be obtained from the compiler.
XI.Q9 The principles of Hazard Analysis Critical Control Points (HACCP), as used in food safety, may be also applied to quality assurance when compiling food composition data. The purpose is to identify potential risks and the critical control points (CCP) where preventive or corrective measures can be applied. Standard operating procedures (SOP) describe the tasks to be undertaken to prevent, decrease or eliminate the occurrence of risk. EuroFIR has used the HACCP approach in describing the compilation process and have identified CCPs and described SOPs for critical points in the data compilation (Westenbrink et al., 2008). Match the following tasks to the line of the corresponding possible risk, consequence and preventive/corrective measures in the database. (9 points: ½ point for each correct response) Note: The tasks, possible risks, consequences and preventive/corrective measures are adapted from Westenbrink et al., (2008). FCDB: food composition database. FCDBMS: food composition database management system.

Module 11 – Questions
202
Tasks: 1. Selection of foods and components 2. Identification of relevant foods, components, values and meta data in other sources for incorporation into one’s own database 3. Attribution of quality index to all original data to be incorporated into the database by taking account of food and component identification, sampling and analysis 4. Incorporation of original data and their storage in the archival database (e.g. manual data entry or import of data sets) 5. Selection of data to produce aggregated or calculated values 6. Selection of algorithms and factors, such as yield and retention factors, to calculate values (e.g. means, recipes, derived nutrients) 7. Calculation of nutrient values through recipe calculations 8. Validation of aggregated, calculated and otherwise compiled data, and correction of identified errors 9. Selection of data for the user database and dissemination of the latter.
Task Possible risks for FCDB Consequences for FCDB Preventive/corrective measures
Incorrect application of one or more steps in the recipe calculation
Errors in published values which are calculated
- Use a well-designed FCDBMS with good recipe calculation program - Train compiler - Document data - Check and validate all calculated data
- Data entry incomplete or inaccurate - Incomplete data documentation
- Insufficient or erroneous data entered into archival database - Loss of traceability - Error in published data
- A well-designed FCDBMS generates automatic error messages - Check that data have been copied/imported both correctly and completely - Check documentation
Incorrect selection of food and components for FCDB
Important foods and/or components are not included in the FCDB and are therefore not available to users
Involve users to assure user satisfaction and coverage of their needs
Inadequate data selected and published
Complaints are received from dissatisfied users and data suppliers
- Define criteria - Develop standardized extraction system - Involve users to assure user satisfaction and coverage of their needs
- Inappropriate search for relevant data - Incomplete or insufficiently described data sets - Criteria for data inclusion insufficiently described
- Inappropriate data unintentionally included in FCDB - Errors in published data through wrong selection of data
- Develop criteria or preferably use internationally-recognized criteria for data search and selection - Solicit additional information from data owner, if required - Document data
- No validation - Non-systematic or inaccurate validation - No special attention paid to high-risk data
Errors in published data through non-detection of errors
- Develop validation system or preferably use internationally recognized validation system with defined criteria and procedures - Document data
Incorrect selection of nutrient values to be included in calculations and aggregations
- Errors in published values which are calculated - Data are not representative
- Develop criteria or preferably use internationally recognized criteria for data selection - Document data
No or poorly defined data quality assessment system that allows for different interpretations
Data assessment neither repeatable nor comparable
- Develop a data assessment system or preferably use an internationally recognized system - Train compiler on data assessment - Document data
Errors in calculation algorithms, or in selection of yield and/or retention factors
- Errors in published values which are calculated - Data are not representative
- Develop a calculation system and factors, or preferably use an internationally recognized system and factors - Document data
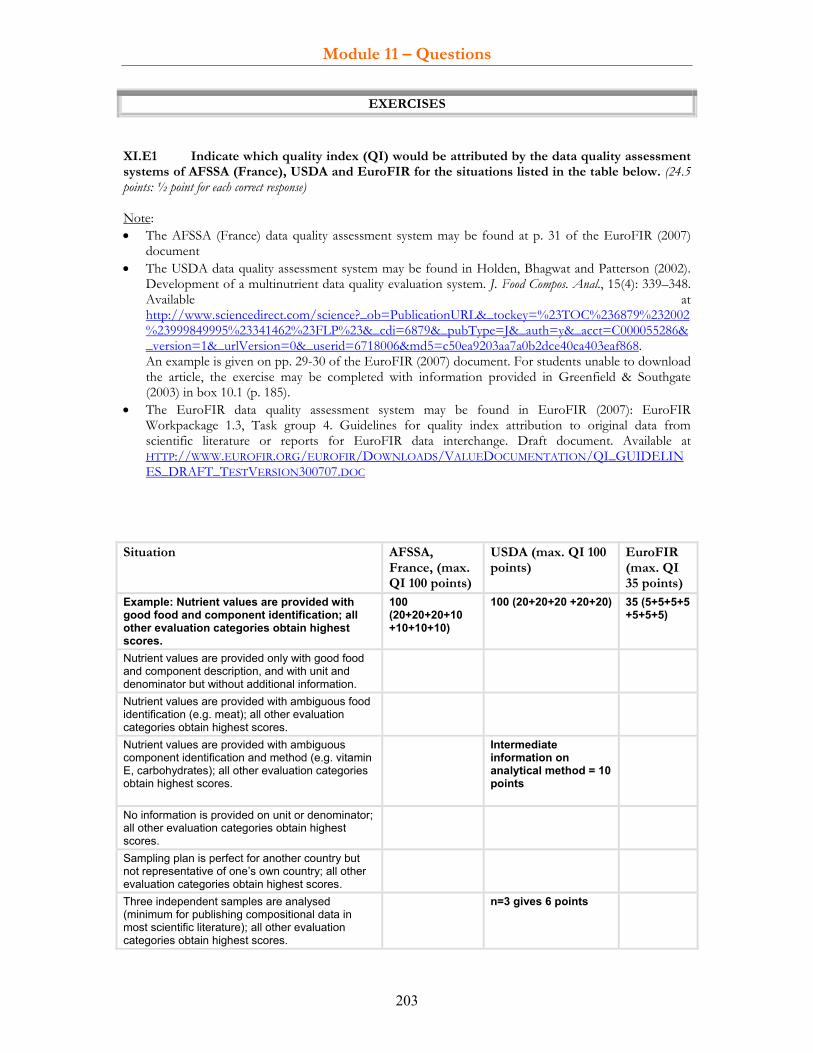
Module 11 – Questions
203
EXERCISES
XI.E1 Indicate which quality index (QI) would be attributed by the data quality assessment systems of AFSSA (France), USDA and EuroFIR for the situations listed in the table below. (24.5 points: ½ point for each correct response) Note: • The AFSSA (France) data quality assessment system may be found at p. 31 of the EuroFIR (2007)
document • The USDA data quality assessment system may be found in Holden, Bhagwat and Patterson (2002).
Development of a multinutrient data quality evaluation system. J. Food Compos. Anal., 15(4): 339–348. Available at http://www.sciencedirect.com/science?_ob=PublicationURL&_tockey=%23TOC%236879%232002%23999849995%23341462%23FLP%23&_cdi=6879&_pubType=J&_auth=y&_acct=C000055286&_version=1&_urlVersion=0&_userid=6718006&md5=c50ea9203aa7a0b2dce40ca403eaf868. An example is given on pp. 29-30 of the EuroFIR (2007) document. For students unable to download the article, the exercise may be completed with information provided in Greenfield & Southgate (2003) in box 10.1 (p. 185).
• The EuroFIR data quality assessment system may be found in EuroFIR (2007): EuroFIR Workpackage 1.3, Task group 4. Guidelines for quality index attribution to original data from scientific literature or reports for EuroFIR data interchange. Draft document. Available at HTTP://WWW.EUROFIR.ORG/EUROFIR/DOWNLOADS/VALUEDOCUMENTATION/QI_GUIDELINES_DRAFT_TESTVERSION300707.DOC
Situation AFSSA,
France, (max. QI 100 points)
USDA (max. QI 100 points)
EuroFIR (max. QI 35 points)
Example: Nutrient values are provided with good food and component identification; all other evaluation categories obtain highest scores.
100 (20+20+20+10 +10+10+10)
100 (20+20+20 +20+20) 35 (5+5+5+5 +5+5+5)
Nutrient values are provided only with good food and component description, and with unit and denominator but without additional information.
Nutrient values are provided with ambiguous food identification (e.g. meat); all other evaluation categories obtain highest scores.
Nutrient values are provided with ambiguous component identification and method (e.g. vitamin E, carbohydrates); all other evaluation categories obtain highest scores.
Intermediate information on analytical method = 10 points
No information is provided on unit or denominator; all other evaluation categories obtain highest scores.
Sampling plan is perfect for another country but not representative of one’s own country; all other evaluation categories obtain highest scores.
Three independent samples are analysed (minimum for publishing compositional data in most scientific literature); all other evaluation categories obtain highest scores.
n=3 gives 6 points

Module 11 – Questions
204
Situation AFSSA, France, (max. QI 100 points)
USDA (max. QI 100 points)
EuroFIR (max. QI 35 points)
For a vitamin C value, no information is provided on sample handling in the laboratory or during transportation; all other evaluation categories obtain highest scores.
If proper storage is essential but not described minus 4 points
No information is provided on quality assurance; all other evaluation categories obtain highest scores.
Analytical method is described well, but component is obsolete (e.g. crude fibre); all other evaluation categories obtain highest scores.
Analytical quality control/assurance is absent; all other evaluation categories obtain highest scores.
Calculated data for well-described food within the database (e.g. energy in kJ/100 g edible food).
Information on an analysed recipe is good (name, description, qualitative and quantitative information on ingredients); all other evaluation categories obtain highest scores.
Information on an analysed recipe is good (name, description, qualitative and quantitative information of ingredients); ingredients are sampled from the local shop; all other evaluation categories obtain highest scores.
The name of an analysed recipe is given; no qualitative or quantitative information on ingredients is available; all other evaluation categories obtain highest scores.
The recipe is calculated. Recipe name and description is given; good qualitative and quantitative information is provided on ingredients, adequate yield and nutrient retention factors. Components, unit and denominator are described well.
Interpretation: Select True or False. True False Interpretation
The EuroFIR and USDA systems work well when only one of the categories is not adequately described.
The French system is the only one that allows for data to be rejected in the event an essential description is missing.
The USDA system is the only one that attributes quality indexes accurately for sampling.
All systems are well equipped to differentiate between different calculation methods in terms of the quality of calculated data.
Module 12 – Questions
205
Module 12 FOOD BIODIVERSITY
LEARNING OBJECTIVES By the end of this module the student will be able to:
understand the concept of food biodiversity and its links to food and nutrition and health; understand the importance of food biodiversity for food composition databases and dietary
assessment; generate, manage and use food composition data for food biodiversity purposes.
REQUIRED READING • Charrondiere, U.R. PowerPoint presentation on ‘Food Biodiversity and Food Composition’,
available at: http://www.fao.org/infoods/presentations_en.stm and if possible: • FAO. 2008. Expert Consultation on Nutrition Indicators for Biodiversity – 1. Food Composition. FAO, Rome.
Available at: ftp://ftp.fao.org/docrep/fao/010/a1582e/a1582e00.pdf • FAO. 2005. Support for countries to generate, compile and disseminate cultivar-specific nutrient composition data, and
the relative priority of obtaining cultivar-specific dietary consumption data. Commission on Genetic Resources for Food and Agriculture - Working Group on Plant Genetic Resources for Food and Agriculture. CGFRA/WG-PGR-3/05/5. Available at: http://www.fao.org/waicent/FaoInfo/Agricult/AGP/AGPS/pgr/ITWG3rd/pdf/p3w5E.pdf
• Toledo, A. & Burlingame, B. 2006. Biodiversity and nutrition: a common Path Toward Global Food Security and Sustainable Development. Journal of Food Composition and Analysis 19(6-7): 477-483. Available at: http://www.sciencedirect.com/science/issue/6879-2006-999809993-625152
• FAO. 2008a. Climate change and biodiversity for food and agriculture. Technical background document from expert consultation, February 2008. FAO, Rome. pp. 1-8. Available at:
ftp://ftp.fao.org/docrep/fao/meeting/013/ai784e.pdf
LITERATURE QUOTED IN QUESTIONS AND EXERCISES • Ceballos, H., Sanchez, T., Chávez, A.L., Iglesias, C. & Debouck, D. 2006. Variation in crude
protein content in cassava (Manihot esculenta Crantz) roots. Journal of Food Composition and Analysis 19(6-7): 589-593. Available at: http://www.sciencedirect.com/science/issue/6879-2006-999809993-625152
• Commission of the European Communities. 1997. Commission recommendation of 29 July 1997 concerning the scientific aspects and presentation of information necessary to support applications for the placing on the market of novel foods and novel food ingredients and the preparation of initial assessment reports under regulation (EC) No 258/97 of the European Parliament and of the Council; Official Journal of the European Communities L253/1-36. Available at: http://ec.europa.eu/food/food/biotechnology/novelfood/initiatives_en.htm
• CBD. 2006. COP 8 Decision VIII/23 on Cross-cutting initiative on biodiversity for food and nutrition. Accessed in 2010 at: http://www.cbd.int/decision/cop/?id=11037
• Englberger, L., Schierle, J., Aalbersberg, W., Hofmann, P., Humphries, J., Huang, A., Lorens, A., Levendusky, A., Daniells, J., Marks, G.C. &. Fritzgerald M.H. 2006. Carotenoid and vitamin content of Karat and other Micronesian banana cultivars. International Journal of Food Sciences and Nutrition. Aug-Sep; 57(5-6): 399-418
• FAO/WHO. 2001. Safety assessment of foods derived from genetically modified microorganisms. Report of a Joint FAO/WHO Expert Consultation on Foods Derived from Biotechnology held in September 2001, Geneva, Switzerland. WHO and FAO, Geneva and Rome. Available at:
http://www.who.int/foodsafety/publications/biotech/en/ec_sept2001.pdf • Kennedy, G., Islam, O., Eyzaguirre, P. & Kennedy, S. 2005. Field testing of plant genetic
diversity indicators for nutrition surveys: rice-based diet of rural Bangladesh as a model. Journal of Food Composition and Analysis 18(4): 255-268
Module 12 – Questions
206
• Talpur, F.N., Bhanger, M.I., & Khunawar, M.Y. 2006. Comparison of fatty acids and cholesterol content in the milk of Pakistani cow breeds. Journal of Food Composition and Analysis 19(6-7): 698-703. Available at: http://www.sciencedirect.com/science/issue/6879-2006-999809993-625152
RESOURCES Compositional data • CINE's Arctic Nutrient File. Available at:
http://www.mcgill.ca/files/cine/Traditional_Food_Composition_Nutribase.pdf Taxonomic websites • Plants
o http://www.ars-grin.gov/cgi-bin/npgs/html/index.pl o http://mansfeld.ipk-gatersleben.de/ o http://www.plantnames.unimelb.edu.au/Sorting/Frontpage.html o http://www.seedtest.org/en/home.html o http://plants.usda.gov/
• Fish o http://www.fao.org/figis/servlet/static?dom=org&xml=sidp.xml&xp_lang=en&xp_banner=fi o http://www.fao.org/fi/website/FISearch.do?dom=species o http://www.fishbase.org/home.htm o http://vm.cfsan.fda.gov/%7Efrf/rfe0.html o http://www.nativefish.asn.au/taxonomy.html o http://www.nativefish.asn.au/fish.html
• Plants, animals, fish o http://www.ncbi.nlm.nih.gov/sites/entrez?db=Taxonomy o http://www.cbif.gc.ca o http://www.sp2000.org/ o http://www.itis.gov/index.html
Gene bank databases o http://www.informatik.uni-leipzig.de/~tkirsten/GenBankManagement.html o http://www.bioversityinternational.org/Information_Sources/Species_Databases/Species_C
ompendium/default.asp RECOMMENDATION Sampling aspects for food biodiversity are dealt with in module 5 on Sampling RELEVANCE FOR VARIOUS USERS (ON A SCALE OF + TO +++++) • Compilers/ professional users +++++ • Analysts +++++ ESTIMATED TIME TO COMPLETE TASKS • Required reading: 1-3 hours • Answering the questions: 1-3 hour • Completing the exercises: 1-3 hour SUGGESTED ADDITIONAL READING • FAO. 2010. Expert Consultation on Nutrition Indicators for Biodiversity – 2. Food Consumption. FAO, Rome.
Available at: http://www.fao.org/infoods/biodiversity/index_en.stm • Kuhnlein, H.V., Erasmus, B. & Spigelski, D. (eds.). 2009. Indigenous peoples’ food systems: the many
dimensions of culture, diversity and environment for nutrition and health. FAO, Centre for Indigenous Peoples’ Nutrition and Environment. Rome, FAO. Available at http://www.fao.org/docrep/012/i0370e/i0370e00.htm ).
• INFOODS webpage on biodiversity. Available at: http://www.fao.org/infoods/biodiversity/index_en.stm

Module 12 – Questions
207
• Bioversity International web page on biodiversity and nutrition. Available at: http://www.bioversityinternational.org/Themes/Nutrition/index.asp
• AVRDC. 2002. Vegetables are vital: healthy diets, productive farmers, strong economies. Asian Vegetable Research and Development Center, Shanhua, Taiwan. 29 pp. Available at: http://www.avrdc.org/pdf/vitalveg.pdf
• UNESCO. 2008. Promoting the Development of Industrial Crops in Maputaland through Capacity Building. Available at: http://www.unesco.org/csi/pub/papers2/mapp17.htm

Module 12 – Questions
208
Questions XII.Q1 Match the terms with the corresponding definition. (5 points: ½ point for each correct response) Note: See FAO, 2008, Expert Consultation on Nutrition Indicators for Biodiversity – 1. Food Composition. Available at: ftp://ftp.fao.org/docrep/fao/010/a1582e/a1582e00.pdf
Terms: 1. Underutilized foods 2. Species 3. Food biodiversity 4. Variety 5. Breed 6. Ecosystem 7. Cultivar 8. Subspecies 9. Genus 10. Family
Term Definition It is a specific group of animal species, within a single zoological taxon of the lowest known rank, with definable
and identifiable external characteristics that enable it to be separated by visual appraisal from other similarly defined groups within the same species.
They are population(s) of organisms sharing certain characteristics that are not present in other populations of the same species; the taxonomic naming convention is to append to the species name “ssp.” or “subspec.” and the Latin name is in italics.
It is a dynamic complex of plant, animal and micro-organism communities and their non-living environment interacting as a functional unit.
It is a class of potentially interbreeding individuals, below the level of genus, that are reproductively isolated from other such groups having many characteristics in common. Their classifications are subject to review and change as new genomic and other scientific evidence is considered. By convention, the name is formed of two Latin words where the genus is listed first. The name is italicized with the initial letter capitalized; e.g. apple is Malus domestica.
It is the first component of an organism's binomial scientific nomenclature, classifying an organism with like organisms. The generic name is written with an initial upper-case letter; the species name is in lower case, e.g. Canis lupus is the grey wolf's scientific name, Canis (dog) and lupus (wolf).
The diversity of plants, animals and other organisms used for food, covering the genetic resources within species, between species and provided by ecosystems.
It is defined as species with underexploited potential for contributing to food security, health and nutrition, income generation and environmental services. However, it is not a well-defined term; it depends on geographical, social, economic and temporal aspects, and includes a wide range of wild, traditional, indigenous and local foods. Often, taxonomic identification is not complete, especially below species level.
It is a taxomonic rank intermediate between order and genus. Their names are formed by adding the ending -idae (animals) or -aceae (plants) to the stem of the genus name.
It is a naturally-occurring subdivision of a plant species, within a single botanical taxon of the lowest known rank, with distinct morphological characteristics. It is given a Latin name according to the rules of the International Code of Nomenclature. Its name is known by the first validly published name applied to it. In zoological nomenclature, the term is not generally used (except for fish) and in bacteriological nomenclature it is used interchangeably with “subspecies”.
It is a category of plants below the level of a subspecies taxonomically and equivalent taxonomically to variety, and found only in cultivation. It is an international term denoting certain cultivated plants that are clearly distinguishable from others by stated characteristics and that retain their distinguishing characteristics when reproduced under specific conditions. It is named with an epithet, a word or words in a vernacular language (unless published prior to 1959), or a botanical (Latin) epithet which is printed in Roman characters, not italics. It takes a capital first letter and is enclosed in single quotation marks, for example, Hosta kikutii ‘Green Fountain’ (hosta leaves). They have generally been registered with an appropriate body in order to associate that name with a particular population and, usually, to claim rights over it.

Module 12 – Questions
209
XII.Q2 The taxonomic identification of foods is important, especially for those working in biodiversity and food composition. Complete the blanks using the following words: (2.5 points: ½ point for each correct response) Variety – Species – Cultivar – Breed - Family
Animals
Rank Example ...─ Family Bovidae └─ Genus Bos └─ Bos taurus (cow) └─ Bos taurus Bruna alpina
Plants
Rank Example ...─ Rosaceae └─ Species Malus domestica × M. sylvestris (apple) └─ Malus domestica × M. sylvestris 'Granny Smith'
Plants
Rank Example ...─ Family Cruciferae └─ Species Brassica cretica
└─ Brassica cretica var. cauliflora (DC.) Schwarz (cauliflower)
XII. Q3 Taxonomic names are not always easy to interpret as the authors’ names can be mistaken as variety, cultivar or breed name. Indicate for the following names whether they are at species, variety, cultivar or breed level. (2.5 points: ½ point for each correct response)
Taxonomic name Species Variety Cultivar Breed Ipomoea batatas (L.) Lam. [sweet potato] Prunus domestica ‘Cacak’s Beauty’ [plum]
Sus scrofa domestica Danish Landrace [pig]
Brassica oleracea L. var. gemmifera DC. [Brussels sprouts]
Vigna umbellata (Thunb.) Ohwi and H. Ohashi [rice bean]
XII.Q4 The cross-cutting initiative on biodiversity for food and nutrition, led by FAO in collaboration with Bioversity International, was formally established by decision VIII/23 A of the Conference of the Parties to the Convention on Biological Diversity (CBD) in March 2006. Select the correct statements on food biodiversity and nutrition by indicating True or False. (7.5 points: ½ point for each correct response) Note: See document ‘Support for countries to generate, compile and disseminate cultivar-specific nutrient composition data, and the relative priority of obtaining cultivar-specific dietary consumption data’ of the Commission on Genetic Resources for Food and Agriculture - Working Group on Plant Genetic Resources for Food and Agriculture. CGFRA/WG-PGR-3/05/5”:

Module 12 – Questions
210
http://www.fao.org/waicent/FaoInfo/Agricult/AGP/AGPS/pgr/ITWG3rd/pdf/p3w5E.pdf or the CBD website http://www.cbd.int/decision/cop/?id=11037 Statements True False Differences in nutrient composition between foods may be significant. Food composition and consumption data exclusively at the food level will form the evidence base for the relationship between nutrition and food biodiversity.
Food biodiversity is of particular significance for indigenous communities and for poor and vulnerable communities, especially in times of food shortages.
Food biodiversity data should be collected for important bioactive non-nutrients only (e.g. antioxidant phytochemicals).
Generic food composition data are considered sufficient for most purposes; composition data on varieties/cultivars/breeds are a luxury and are not considered useful, especially for developing countries.
Differences in nutrient composition may be significant between foods and among varieties/cultivars/breeds of the same food. Food composition and consumption data at the variety/cultivar/breed level will form the evidence base for the relationship between nutrition and food biodiversity.
In the past, generic food composition data were considered sufficient for most purposes. However, the usefulness of composition data at the variety/cultivar/breed level is increasingly acknowledged and it is therefore recommended that they be included in food composition databases.
The International Rice Commission recommended that: (1) the existing biodiversity of rice varieties and their nutritional composition should be explored before engaging in transgenic research; (2) nutrient content should be one of the criteria used in cultivar promotion; and (3) cultivar-specific nutrient analysis and data dissemination should be undertaken systematically.
Food biodiversity is only important for developing countries. Respondents to food consumption surveys may be capable of reporting intakes of species and selected varieties/cultivars/breeds by local names for certain foods, e.g. frequently consumed foods.
Integrating food biodiversity and nutrition can contribute to achieving the Millennium Development Goals.
Because developing countries and countries in transition find it difficult to devote resources to strengthening laboratory capabilities, they should not undertake nutrient analyses of individual varieties/cultivars/breeds.
Knowledge of composition and consumption of intra-species diversity may be useful in the development of food-based dietary guidelines and nutrition education programmes.
The absence of composition and consumption data at the variety/cultivar/breed level limits our ability to assess the value of varieties/cultivars/breeds and their importance to individual, household and national food security, as well as to trade and the environment sector.
Food biodiversity data should be collected and analysed for all components, including energy, proteins and amino acids, fats and fatty acids, minerals, vitamins, pro-vitamins as well as bioactive non-nutrients (e.g. antioxidant phytochemicals).
Food biodiversity has no particular role to play in addressing micronutrient deficiencies or the poverty- and urbanization-related problems of undernutrition and obesity.
XII.Q5 In countries where rice is the major staple food, many rice cultivars exist but no data are available on their consumption or composition. However, from the literature it may be assumed that cultivars have a wide range of nutrient values for many vitamins and for protein. How are estimates of vitamin and protein intakes and of dietary adequacy influenced when the average value of the national database for rice is applied to all cultivars compared with when compositional and consumption data are available for each cultivar and are applied to calculate the nutrient intake? Select the correct responses indicating whether the impact is due to the availability of only the average values or of the major cultivars. (2.5 points: ½ point for each correct response)

Module 12 – Questions
211
Impact on nutrient intake estimations, dietary
adequacy and nutrition education When only average nutrient values of rice are available
When food composition and consumption data
are available for all major rice cultivars
As rice is a staple food, the bias on nutrient intake estimations is more significant compared to foods consumed infrequently and in small quantifies.
Nutrient intake estimations reflect more accurately what different people consume.
The application of correct nutrient values for varieties or cultivars can make the difference between dietary adequacy and inadequacy for the population group.
Bias is introduced in dietary adequacy estimations. Nutrition education programmes can promote the cultivars with the nutrient composition which are most adequate to combat existing nutrient deficiencies.
XII.Q6 There is a traditional belief that one of the rice cultivars is better for people with diabetes than other rice cultivars. As no compositional data were available for this cultivar, this tradition was rarely followed and was forgotten. One researcher came to know about this belief, analysed the rice cultivar and discovered that its Glycemic Index was much lower than that of other rice cultivars. Once these results were published, the rice cultivar was recommended by the National Institute of Nutrition for patients with diabetes. Which lessons can be learned from this anecdote? Select True or False. (2 points: ½ point for each correct response) Lessons learned True False Traditional beliefs without scientific background should be neglected in modern societies and not be investigated.
Compositional (and corresponding consumption) data are useful to verify traditional beliefs.
Compositional (and corresponding consumption) data on specific foods and/or on variety/cultivar/breed levels will allow researchers to investigate the relationship between food biodiversity, nutrition and health.
Compositional (and corresponding consumption) data at the variety/cultivar/breed level are not essential. Therefore, they do not need to be included in national food composition databases.
XII.Q7 The concept of substantial equivalence was developed by FAO, WHO and OECD. The concept ‘embodies the idea that existing organisms used as food, or as a source of food, can be used as the basis for comparison when assessing the safety of human consumption of a food or food component that has been modified or is new.’ The concept of substantial equivalence involves a targeted analysis of the composition of the genetically-modified organisms (GMO) compared with their conventional counterparts. The major limitation of profiling is the need to document the background of normal variation and to interpret the significance of any differences detected. Several steps must be taken before the full potential of these techniques can be realized in routine safety assessments. First, the methodologies must be validated to ensure their reproducibility and robustness, and then agreement must be reached regarding assessing their performance. That is, what is the range of differences in a given food or profile that will be considered as ‘normal variation’? Any profile differences considered not to be within this natural variation must be evaluated from a safety perspective. The concept of substantial equivalence is also applied in the European Union to novel foods, novel food ingredients and GMOs (FAO/WHO, 2001; CEU, 1997). What role could food composition databases play in this respect? Select True or False. (2 points: ½ point for each correct response)

Module 12 – Questions
212
Role of food composition databases in relation to the concept of substantial equivalence
True False
Better coverage of the nutritional composition of conventional foods (existing varieties/cultivars/breeds) in published food composition databases would facilitate the conducting of safety assessments of GMOs and novel foods and ingredients.
Better coverage of the nutritional composition of only the most commercialized varieties/cultivars/breeds in published food composition databases would make it possible to conduct safety assessments of all GMOs and novel foods and ingredients.
Better coverage of the nutritional composition of existing varieties/cultivars/breeds in published food composition databases can identify varieties/cultivars/breeds with high nutritional quality covering the nutritional needs of the population. Discovery of existing biodiversity could render expensive research on new GMOs with improved composition unnecessary.
Better knowledge of the nutritional composition of conventional foods would facilitate the conduct of safety assessments of corresponding GMO foods.
XII.Q8 A survey in Bangladesh (Kennedy et al., 2005) showed that more than 80% of households were able to identify rice by cultivar, and 38 different cultivars were named. What lessons can be learned for future food consumption surveys? Select True or False. (2 points: ½ point for each correct response) Possible lessons learned for future food consumption surveys True False This was a pilot study and results cannot be transferred to other settings. Participants in food consumption surveys are not able to identify or name varieties/cultivars/breeds.
Current food consumption survey tools can be improved to reflect the biodiversity of selected foods, e.g. of foods highly consumed by the population.
For selected foods, additional questions could be asked about the variety/cultivar/breed and local names.
Food consumption data on variety/cultivar/breed level would encourage food composition compilers to generate compositional data for these foods. These consumption data, combined with a comprehensive database on food biodiversity, would allow for more precise nutrient intake estimations of the people surveyed.
XII.Q9 In the Marshall Islands, the population suffers from vitamin A deficiency. A study (Englberger et al., 2006) showed that only two of the three commonly consumed varieties of Pandanus fruits are rich in carotenoids. Another study in Pakistan (Talpur et al., 2006) showed that the milk of two Pakistani cow breeds had significantly different fatty acid contents under the same housing and feeding conditions: the White Thari breed produces milk with a significantly higher amount of saturated fatty acids, but lower amounts of mono-unsaturated fatty acids, polyunsaturated fatty acids and conjugated linoleic acid as compared with the Red Sindhi cows. What are the implications that these results might have for agricultural research and programmes? Select True or False. (2.5 points: ½ point for each correct response) Possible implications for agricultural research and programmes True False Agricultural research and programmes could use these results because agriculture should provide nutritionally-adequate foods for the population to combat existing dietary deficiencies.
Agricultural research and programmes should ignore these results because they should take account only of agricultural parameters, such as yield or pest resistance, without considering the nutritional content or the dietary deficiencies of the population.
Higher nutrient value products could be commercialized and traded as foods with added value, which may achieve similar or higher prices and a wider distribution. This is most likely to happen if the yield and other agricultural factors are similar to those of the nutritionally lower-quality food.
Food biodiversity will enter the market only if the producer is able to achieve a similar or higher income with the new crop compared with other crops.
Release of improved varieties and breed improvement programmes should be associated with improved nutrient content, not just productivity and/or insect/pest/disease resistance.

Module 12 – Questions
213
For those with advanced knowledge XII.Q10 Why is food biodiversity neglected? Select True or False. (4 points: ½ point for each correct response) Possible reasons why food biodiversity is neglected True False Lack of awareness of its importance for nutrition, health and agriculture. Even if compositional data at the variety/cultivar/breed level were generated they are not widely disseminated, e.g. in scientific literature, national food composition tables and databases, or reports. Therefore, farmers and consumers are not aware of the higher nutrient values of specific varieties and do not grow or consume these foods.
The selection of foods to be analysed using the key food approach32 rarely identifies foods at the variety/cultivar/breed levels. Therefore, these foods are not analysed and farmers and consumers are not aware of the higher nutrient values of specific varieties and do not grow or consume these foods.
Lack of funds for chemical analysis of foods in general and for varieties/cultivars/breeds in particular for the determination of their contents.
Development of GMO foods with improved nutrient composition is less expensive than investigating food biodiversity.
Food consumption data are not usually compiled at the variety/cultivar/breed level – also because few compositional data on them exist.
National food composition databases already contain a substantial amount of compositional data at the variety/cultivar/breed levels, or data relating to different regions or seasons.
Lack of support from major donors (e.g. governments, international organizations) for the generation of compositional data specifically on varieties/cultivars/breeds level.
XII.Q11 Biodiversity is closely linked to climate change. Indicate the correct statements in this regard. Select True or False. (3 points: ½ point for each correct response)
Statements about biodiversity and climate change True False Climate change will be one of the major drivers of biodiversity loss. Extreme climatic events will increase disturbance of agro-ecosystems, which can be buffered through the sustainable use of agricultural biodiversity. Good management of agricultural biodiversity allows production systems to adapt to changing conditions while maintaining productivity. Sustainable use of agricultural biodiversity has a huge potential for developing win-win strategies with multiple benefits, such as coping with climate change, conserving biodiversity and improving human well-being.
Increased air and water temperatures will not affect the migration of species because they are bound to the existing ecosystem in the specific location.
Genetic diversity, which is currently underutilized, may become more attractive to farmers and policy-makers as a result of climate change. Maintaining and using a wide basket of genetic diversity at a time of climate change will be an essential insurance policy for the food and agriculture sectors and will form the basis of adaptation strategies required in food and agriculture.
Climate change is likely to affect the composition of foods. National inventories on biodiversity include all relevant spatial information to assess threats caused by climate change to species, populations or genotypes of relevance to food and agriculture.
32 See module 3 for details on the key food approach.

Module 12 – Questions
214
EXERCISES
XII.E1 A study (Ceballos, et al., 2006) on the protein content of cassava roots showed significant variations across countries and varieties. The range was 0.95 g to 6.42 g protein/100g food with a mean of 3.24 g protein/100 g food. Calculate the protein intake from cassava roots in the Democratic Republic of the Congo using the minimum, the maximum and the mean value of the protein content; compare it to the recommended daily intake (RDI) for an adult; and calculate the proportion of protein covered by cassava root in the three cases. Complete the table below. Then select the correct statement(s) for interpreting the results. (8 points: 1 point for each correct calculation and ½ point for each correct response in the interpretation) Note: • The RDI for proteins is 0.75 g per kilogram of body weight. This results in a RDI for protein of 45
g/d for an adult weighing 60 kg. • In the Democratic Republic of the Congo, the food supply33 of cassava is 286 g per capita per day
(year 2000, as published in CD from FAOSTAT, 2005). Protein
content in g/100 g
Cassava intake in g/d/person
Protein intake through cassava in g/d/person
RDI for protein for an adult of 60 kg in g/d
Part of the RDI for protein covered by cassava intake, in %
Average protein content 3.24 286 45
Minimum protein content 0.95 286 45
Maximum protein content 6.42 286 45
Interpretation of results: True False Interpretation of protein intake and adequacy
Food biodiversity may have a major impact on both macro- and micronutrient intakes and dietary adequacy.
The nutrient contents of foods, and therefore nutrient intake, may be significantly different when different cultivars/varieties/breeds are consumed. In addition, nutrient contents can be influenced by the environment.
The impact on the protein intake is small because the protein content of cassava is low. Food biodiversity should be taken more into account in food consumption studies and in food
composition databases to allow for a better estimation of dietary adequacy or inadequacy.
33 Food supply = food available for human consumption

Module 12 – Questions
215
XII.E2 Banana varieties/cultivars may have different nutrient compositions. The USDA database (Standard Release 21) indicates a β-carotene content of 26 mcg/100 g for banana (Musa X paradisiaca); the Philippine food composition table indicates 360 mcg/100 g for the banana variety Lacatan; and in Micronesia, Englberger et al. (2006) found 8508 mcg/100 g for the banana variety Utin Iap. Calculate for the Philippine population the β-carotene intakes from banana using the β-carotene values from USDA, Lacatan and Utin Iap; compare them to the RDI for an adult male; and calculate the proportion of the RDI for an adult male for β-carotene covered by banana in the three cases. Complete the table below. Then select the correct statement(s) for interpretation of the results. (11.5 points: 1 point for each correct calculation and ½ point for each correct response in the interpretation) Information: • The consumption of bananas in the Philippines in 2003 was 93 g/day per capita. • The RDI for vitamin A is 600 mcg retinol equivalents (RE) for an adult male. • 6 mcg of β-carotene provide the vitamin activity of 1 RE34. Banana β-carotene
content in mcg/100 g
Banana intake in g/d/p
β-carotene intake through banana in mcg/d/p
Vitamin A intake through banana in mcg RE/d/p
Part of the RDI for vitamin A covered by banana intake, in %
USDA 26 93 Lacatan 360 93 Utin Iap 8508 93 Interpretation of results: True False Interpretation of β-carotene intake from banana and dietary adequacy
Macronutrient contents (e.g. protein content in cassava) vary more than micronutrients among different cultivars/varieties/breeds.
Food biodiversity may determine dietary adequacy or inadequacy, especially for micronutrients Copying the micronutrient contents from other sources to the national food composition table,
especially without verifying the cultivar/variety of the plant, may introduce errors in nutrient values and consequently in the estimation of nutrient intake and dietary adequacy.
Wrong decisions might have been taken in nutrition and health programmes because of inadequate micronutrient values in the food composition table that did not reflect the composition of the varieties consumed by the population.
Food biodiversity should be taken more into account in food consumption studies and in food composition databases to allow for a better estimation of nutrient intakes and dietary adequacy/inadequacy.
XII.E3 The Nutrition Indicator for Biodiversity concerning food composition will be used to demonstrate trends in the availability of compositional data on food biodiversity in the published and unpublished literature. In a given country, the main foods consumed are rice, potatoes, legumes, tomatoes, onions, mango, beef, buffalo and fish. Some groups gather and consume insects, aquatic animals, fruits and vegetables. Select the foods that would count for the Nutrition Indicator for Biodiversity concerning food composition by using the criteria of the Expert Consultation report (see ftp://ftp.fao.org/docrep/fao/010/a1582e/a1582e00.pdf). Write Yes or No. (9 points: ½ point for each correct response) Note: A more detailed list of criteria was developed and should be used when deciding which foods count for the Nutrition Indicator for Biodiversity. It is found at: http://www.fao.org/infoods/biodiversity/foods%20counting%20for%20Nutritional%20indicator.pdf. In
34 More information on expressions of vitamin A is given in modules 4.b and 4.c.

Module 12 – Questions
216
addition, a list of underutilized foods counting for biodiversity is available at http://www.fao.org/infoods/biodiversity/INFOODSUpdatedGFU-list.xls. Counts for Nutrition Indicator for Biodiversity Yes/No
Food names Scientific names
Rice, white, polished, raw Oryza sativa Kohlrabi Brassica oleracea var. gongylodes
L. Tomato, raw Lycopersicon esculentum Wild dark green leaves - Banana, pink banana Musa sapientum Teod var. violacea Banana, silver bluggoe Musa sp., 'Hug-mook' Mango, pimsen-mun, unripe Mangifera indica, 'pimsen-mun' Mango, pimsen-mun, ripe Mangifera indica, 'pimsen-mun' Saba, fruit, gathered, raw - Buffalo, lean (loin), raw Bubalua buffelus Carabeef, lean, raw Bubalus bubalis Canada goose, raw (wild) Branta Canadensis Canada goose, roasted (wild) Branta Canadensis Carp fish, common, raw Cyprinus carpio Linn. Water spinach Ipomea aquatica Red ant (gathered) Solenopis Invicta Bamboo caterpillar worm
(gathered) -
Yoghurt, traditional -


uestions
Manuel d’étude sur la com
position des aliments – questions &
exercises
exercises
VoL. 1
Vo
l. 1FA
O
C
M
Y
CM
MY
CY
CMY
K
Vol-1-F back coverx.pdf 1/7/11 11:40:27