Executive Summary Report - otp.go.th · Executive Summary Report III Transport Data and Model...
115
Transcript of Executive Summary Report - otp.go.th · Executive Summary Report III Transport Data and Model...
Executive Summary Report I
Transport Data and Model integrated with Multimodal Transport and Logistics (TDL)
PCBK / SEA-CONSULT / PTL
Contents Page
1 Introduction 1.1 Introdution 1-1 1.2 Background 1-1 1.3 Project Objectives 1-2 1.4 Structure of the Report 1-3
2 Data Collection, Review and Analysis 2.1 Preface 2-1 2.2 Collecting and updating data of commodity flow data 2-1 2.3 Survey and data collection of commodity flow 2-1 2.4 Traffic and transportation survey for the National Model (NAM) 2-9 2.5 Traffic and transportation survey for the Extended Bangkok Urban Model (eBUM) 2-14 2.6 Traffic and transportation survey for the Provincial Transport Model (PTM) 2-19
3 Development and Maintenance of the Database of Transportation and Traffic Information 3.1 Preface 3-1 3.2 Improvement and Maintenance of Management Information Systems and 3-4
geographic information systems (MIS / GIS) 3.3 Development of Information Systems to Support Information Exchange Standard 3-8
with XML File Format 3.4 Development of Management Information System (MIS) and Geographic Information 3-24 Systems (GIS) using Executive Information System (EIS) 3.5 Management System for Internet and Intranet of the OTP 3-25 3.6 Improvement of Computer Systems and Networks 3-27
4 GIS Database System Development 4.1 Preface 4-1 4.2 Review of GIS Related Projects 4-1 4.3 GIS Database Development and Update 4-2 4.4 Web-based GIS Application Development 4-5 4.5 GIS Data Integration with the Ministry of Transport’s GIS Service System 4-7 4.6 Map Data Support for MIS/EIS 4-8

Executive Summary Report II
Transport Data and Model integrated with Multimodal Transport and Logistics (TDL)
PCBK / SEA-CONSULT / PTL
Contents (Continued) Page
5 Transportation and Traffic Model Improvements and Maintenances 5.1 Preface 5-1 5.2 Review of the Transport Model Developments 5-1 5.3 National Model (NAM) 5-3 5.4 Extended Bangkok Urban Model (eBUM) 5-9 5.5 Development of Provincial Transport Model 5-20 5.6 Traffic Simulation Model 5-27 5.7 Manual for Transportation Model Analysis 5-30
6 Database System and Transport Model Applications and Human Resource Capacity Development
6.1 Preface 6-1
6.2 Analysis and Appraisal of Transportation Project 6-1 6.3 Technical Consultation 6-2 6.4 Seminars 6-3 6.5 GIS and MIS Training 6-3 6.6 Technology Transfer 6-3
Executive Summary Report III
Transport Data and Model integrated with Multimodal Transport and Logistics (TDL)
PCBK / SEA-CONSULT / PTL
List of Tables Page
Table 2.3-1 Transportation Mode Selection by Product 2-3 Table 2.3-2 Transportation cost by product 2-5 Table 2.4-1 Traffic Volume at Screenlines for the past 2 years 2-13 Table 2.6-1 TMC 03 Intersection of Highways. 2042 intersects with Highway 212 (Bypass) 2-20
in the north. Table 2.6-2 An Example of Traffic Signal Data Collection (Intersection: Highway No. 212 2-23 and Highway Table 3.2-1 The list of project which related to TDL 3-4 Table 3.3-1 The list of group and data related with import process in TDL 3-8 Table 3.3-2 The list of report which were improved and developed in TDL 3-13 Table 5.3-1 Freight Volumes for Year 2010, 2011, 2017, 2022, 2027, 2032 and 2037 5-5
(in Thousand Ton per Year) Table 5.3-2 Results of Passenger Trips from NAM (in thousand Trips per Day) 5-8 Table 5.3-3 Results of Freight Transportation from NAM (in Tons per Day) 5-8
Table 5.3-4 NAM Results 5-8 Table 5.3-5 Freight Transport from NAM (Million Tons-Km./Year) 5-9 Table 5.4-1 Population and Employment Data in Bangkok and its vicinties 5-13 Table 5.4-2 Results of eBUM (AM Peak) 5-15 Table 5.4-3 eBUM Results (PM Peak) 5-16 Table 5.4-4 eBUM Results (Daily) 5-16 Table 5.4-5 Proportion of Main Transportation Mode in the Public Transportation 5-18 (in Thousand Person Trips per Day) Table 5.4-6 Proportion of Main Transportation Mode in the Public Transportation including 5-18
Transfer Trips (in Thousand Person Trips per Day) Table 5.4-7 Main Public Transportation by transportation mode (in Thousand Person Trips 5-18
per Day) Table 5.4-8 Public Transportation by transportation mode including Transfer Trips 5-19 (in Thousand Person Trips per Day) Table 5.4-9 Average Speed 5-19 Table 5.4-10 Daily Traffic volume (Person Trip) in each area 5-20
Executive Summary Report IV
Transport Data and Model integrated with Multimodal Transport and Logistics (TDL)
PCBK / SEA-CONSULT / PTL
List of Tables (Continued) Page
Table 5.5-1 Mid-Block Traffic Volume (PCU) 5-21 Table 5.5-2 Mid-Block Traffic Volume at Mittraphap Border Control (PCU) 5-22 Table 5.5-3 Results from Mukdahan PTM 5-26 Table 5.6-1 Result from the Traffic Simulation Model for Multi Intersection 5-28 Table 5.6-1 Result from the Traffic Simulation Model for Single Intersection (AM Peak) 5-28
Executive Summary Report V
Transport Data and Model integrated with Multimodal Transport and Logistics (TDL)
PCBK / SEA-CONSULT / PTL
List of Figures Page
Figure 2.3-1 NVOCC provides a Door-to-Door service in the Global Supply Chain 2-2 Figure 2.3-2 Growth of NVOCC 2-2 Figure 2.3-3 Value Added in Transportation Logistics 2-3 Figure 2.3-4 One Stop for All Your Logistics Solution 2-8
Figure 2.3-5 Cluster of industrial 2-8
Figure 2.4-1 Roadside Interview Location 2-9
Figure 2.4-2 Number of trips transporting goods based on Survey Data at Four Screenlines 2-11
Figure 2.4-3 Traffic Volume of Screenline No. 1 and No. 2 2-12
Figure 2.4-4 Traffic Volume of Screenline No. 3 and No. 4 2-12
Figure 2.4-5 Traffic Volume of Screenline No. 1 and No. 2 2-13
Figure 2.4-6 Traffic Volume of Screenline No. 3 and No. 4 2-13
Figure 2.5-1 Roadside Interview at Three Truck Terminals of Bangkok 2-14
Figure 2.5-2 The eBUM Survey Locations 2-15
Figure 2.5-3 Traffic Volume of East – West Screenline of eBUM 2-17
Figure 2.5-4 Traffic Volume of East – West Screenline of eBUM 2-18
Figure 2.6-1 Traffic Volume Count at Mukdahan Intersection 2-19
Figure 2.6-2 Percentage of each Vehicle Type at Mukdahan Border Crossing 2-21
Figure 2.6-3 The Desired Line of Mukdahan Municipality for In-Home Survey 2-22
Figure 2.6-4 Roadside Interview Survey of Mukdahan Municipality 2-22
Figure 2.6-5 The Desired Line of Mukdahan Municipality from Roadside Survey 2-23
Figure 2.6-6 Average Travel Speed of Main Roads in Mukdahan Municipality 2-24
Figure 3.1-1 Tasks involved in the Development and Maintenance of the Transportation 3-2 and Traffic Information Database
Figure 3.2-1 Existing Database System of TDL 3-5
Executive Summary Report VI
Transport Data and Model integrated with Multimodal Transport and Logistics (TDL)
PCBK / SEA-CONSULT / PTL
List of Figures (Continued) Page
Figure 3.2-2 Data Exchange Standard in TDL and related projects 3-6
Figure 3.2-3 Main Screen of XML Generator 3-7
Figure 3.2-4 The Header of XML file 3-7
Figure 3.3-1 Transaction sheet of New Vehicle Registration 3-10
Figure 3.3-2 Description sheet of New Vehicle Registration 3-10
Figure 3.3-3 Back-Office System 3-11
Figure 3.3-4 Transportation and Traffic Information System 3-12
Figure 3.3-5 Overview section of Vehicle Registration report 3-15
Figure 3.3-6 Detail section of Vehicle Registration report 3-16
Figure 3.3-7 Top Order’s Graph of Vehicle Registration report 3-17
Figure 3.3-8 Trend & Comparing’s Graph of Vehicle Registration report 3-17
Figure 3.3-9 Trend by Type’s Graph of Vehicle Registration report 3-18
Figure 3.3-10 Transportation and traffic data public distribution system 3-19
Figure 3.3-11 Cover of Final Report’s E-book 3-21
Figure 3.3-12 Table of contents of Final Report’s E-book 3-21
Figure 3.3-13 Cover of Executive Summary Report – Thai ’s E-book 3-22
Figure 3.3-14 Table of contents of Executive Summary Report – Thai ’s E-book 3-22
Figure 3.3-15 Cover of Executive Summary Report – English ’s E-book 3-23
Figure 3.3-16 Table of contents of Executive Summary Report – English’s E-book 3-23
Figure 3.4-1 Main Page of Executive Information System (EIS) 3-24
Figure 3.5-1 Main page OTP’s website 3-26
Figure 3.5-2 Intranet system of OTP 3-26
Figure 3.6-1 Main page of Kiosk 3-27
Executive Summary Report VII
Transport Data and Model integrated with Multimodal Transport and Logistics (TDL)
PCBK / SEA-CONSULT / PTL
List of Figures (Continued) Page
Figure 3.6-2 E-Book Page 3-28
Figure 4.3-1 Customized tool for viewing GIS 4-3
Figure 4.3-2 Environmental Data Set 4-3
Figure 4.3-3 Vehicle Inventory Data Set 4-4
Figure 4.4-1 Accident rate in 2010 4-6
Figure 4.4-2 Land use in 2010 4-6
Figure 4.5-1 3-D model of OTP’s buiding 4-7
Figure 4.5-2 3-D model of BTS skytrain 4-7
Figure 4.6-1 Number of private households inside/outside municipalities 4-8
Figure 4.6-2 Number of new vehicle inventory and accumulated number of vehicle inventory 4-8
Figure 5.2-1 Transport Model Development and Maintenance Process 5-2
Figure 5.3-1 Thailand’s Transportation Network 5-4
Figure 5.4-1 BMR Zoning System in eBUM 5-9
Figure 5.4-2 Trip Assignment Improvement 5-11
Figure 5.4-3 Intersection Data Improvement 5-11
Figure 5.4-4 Trips Application 5-12
Figure 5.4-5 Voyager Application 5-12
Figure 5.4-6 Mass Rapid Transit Network in 2017 5-14
Figure 5.4-7 Mass Rapid Transit Network in 2032 5-15
Figure 5.4-8 Traffic volume across the Choaphraya rivers 5-17
Figure 5.4-9 Traffic volume across North-South Screenline 5-17
Figure 5.5-1 Road Network Geographic Database and Mukdahan PTM Zoning System 5-21
Figure 5.5-2 Relationship between Modules in the Land Use Model 5-23
Executive Summary Report VIII
Transport Data and Model integrated with Multimodal Transport and Logistics (TDL)
PCBK / SEA-CONSULT / PTL
List of Figures (Continued) Page
Figure 5.5-3 Model Structure 5-24
Figure 5.5-4 Mukdahan PTM Data Input Screen 5-24
Figure 5.5-5 Demand in 2017 5-25
Figure 5.5-6 Demand in 2027 5-25
Figure 5.5-7 Demand in 2037 5-26
Figure 5.6-1 Single vs Multi Intersection 5-27
Figure 5.6-2 Multi Intersection Model at TMC 10- TMC11 in 2-D 5-29
Figure 5.6-3 Multi Intersection Model at TMC 10- TMC11 in 3-D 5-29
Figure 5.7-1 Macroscopic Level 5-30
Figure 5.7-2 Mesoscopic Level 5-31
Figure 5.7-3 Microscopic Level 5-31
Figure 5.7-4 Intersection analysis 5-32
Figure 5.7-5 Dynasim parking simulation 5-32
Figure 5.7-6 Sugar Network Editor’s Example 5-33

CCHHAAPPTTEERR 11 IINNTTRROODDUUCCTTIIOONN
Executive Summary Report Page 1-1
Transport Data and Model integrated with Multimodal Transport and Logistics (TDL)
PCBK / SEA-CONSULT / PTL
CCHHAAPPTTEERR 11 IINNTTRROODDUUCCTTIIOONN
1.1 Introduction 1.2 Background 1.3 Project Objectives 1.4 Structure of the Report
1.1 Introduction
The study of information system development, improvement and maintenance is used to improve the transportation system, multimodal transport system and Transportation, Distribution and Logistics system. The Office of Transportation and Traffic Policy and Planning (OTP) has managed the project between February 2553 and March 2554. The projects under study include the UTDM project, the TDMC I-VI projects, and the TDML I-II projects.
1.2 Background
The Office of Transportation and Traffic Policy and Planning (OTP) is an intermediate representing the Ministry of Transport in setting the national transportation policies and plans. The OTP also coordinates with other institutes and organizations in order to effectively manage the policies, plans, projects, and measures for land, water and air transportations.
OTP has been working on improving, developing and maintaining the database and transportation information and models for the UTDM project, TDMC I-VI projects, and TDML I-II projects. OTP also developed information systems for multimodal transport systems in order to facilitate the logistic system. The development of information systems is used as a tool in improving efficiency in setting transportation policies, project plans, and measures. The development of information systems includes inputting data, updating data, and transmitting data into the Geographic Information System (GIS). This information is used for analyzing transportation data as well as improving planning efficiency and strategic decision making process.
According to the past data collections, the transportation statistics data and other basic data collected from various government agencies have discrepancies. This is because the data are collected and recorded for the specific usage of each entity. The discrepancies can be found in the time period when the data is collected, the frequency of data collection, the level of detail of the
Executive Summary Report Page 1-2
Transport Data and Model integrated with Multimodal Transport and Logistics (TDL)
PCBK / SEA-CONSULT / PTL
data collected (Amphur level, province level and station level), the type of commodity, differences in measurement units (tons and containers), the way the data is recorded, and so on. This results in the OTP being unable to integrate data and use the data immediately. The data gathering needs to be conducted continuously in order to have a consistent and updated database to respond to government policies and OTP assignments.
1.3 Project Objectives
The OTP has hired a consultant for the Transport Data and Model Center (TDL) project. The project has the following objectives :
1) To improve and maintain the transportation & traffic database and information system. In addition, freight data by land by water and by air and infrastructure data are added in order to enhance and standardize the logistics system. This is to be used for national policies making and strategic plan for transportation and logistics. This also helps support planning and decision making process of private enterprises and potentially increases the ability to compete in the world market.
2) To conduct a study about the commodity flow that is significant to the economic system and input the data into a standardized GIS database.
3) To improve and maintain the transportation database, information system and GIS that is necessary in planning and operating a project to be a standardized structure of data arrangement. The Open Geospatial Web Service (OWS) allows the public to view the information through the website. This can also be shared and presented to the governmental network, private enterprise and the general public.
4) To improve and maintain the OTP’s transportation & traffic models at the National level, the Bangkok Metropolitan Region level, the Local Area level and the Regional City level to be used as a tool for planning, managing transportation & traffic projects, and to support the development of Transport Logistics for the Nation. Especially to improve and develop models for freight transportation, a small local traffic and a city traffic, and to create a manual for model users in order to meet international standards and allow users to be able to use the model and apply it to different scenarios.
5) To help making decisions on setting policies for public transportation by applying the model and using the database. As well as, to help enhance utilization capabilities of OTP’s employees and other agencies in using the traffic database.
Executive Summary Report Page 1-3
Transport Data and Model integrated with Multimodal Transport and Logistics (TDL)
PCBK / SEA-CONSULT / PTL
1.4 Structure of the Report
The Executive Summary report is composed of six chapters as follows :
Chapter 1 : Introduction
Chapter 2 : Data Collection, Review and Analysis
Chapter 3 : Development and Maintenance of the transportation and Traffic Information Database
Chapter 4 : GIS Database System Development
Chapter 5 : Transportation and Traffic Model Improvements and Maintenance
Chapter 6 : Database System and Transport Model Applications and Human Resource Development
CCHHAAPPTTEERR 22 DDAATTAA CCOOLLLLEECCTTIIOONN,, RREEVVIIEEWW AANNDD AANNAALLYYSSIISS

Executive Summary Report Page 2-1
Transport Data and Model integrated with Multimodal Transport and Logistics (TDL)
PCBK / SEA-CONSULT / PTL
CHAPTER 2 DATA COLLECTION, REVIEW AND ANALYSIS 2.1 Preface 2.2 Collecting and updating commodity flow data 2.3 Survey and data collection of commodity flow
2.4 Traffic and transportation survey for the National Model (NAM) 2.5 Traffic and transportation survey for the extended Bangkok Urban Model (eBUM) 2.6 Traffic and transportation survey for the Provincial Transport Model (PTM)
2.1 Preface
For this section, the consultant has reviewed, surveyed, studied, and analyzed the latest data available, which include transport and logistics of commodity flow, as follows.
2.2 Collecting and updating commodity flow data
The consultant has gathered statistical data used to update commodity flow data which is important to the traffic and transportation plan and policy, by collecting the latest secondary data from the public and private agencies in the following fields:
1) Demand 2) Commodity Flow 3) OD Report 4) Logistic Nodes
2.3 Survey and data collection of commodity flow
Various products were sampled for the study. Some of the products were difficult to sample such as steel and some were easy to sample such as rice and sugar. As a result, the sampling process was classified into sections as follows: 1) industrial products; 2) transportation and distribution characteristics (i.e. rail, road, air, and barge) and 3) product value. In addition, upstream and downstream of the product line were taken into consideration in the study.
According to statistic principals, the repeated samples collected need to be the ones that have an impact on the general structure of the commodity flow. Therefore, three highest volume products of each product type were selected. The study was conducted by handling out a questionnaire on-site.
Executive Summary Report Page 2-2
Transport Data and Model integrated with Multimodal Transport and Logistics (TDL)
PCBK / SEA-CONSULT / PTL
In addition, the consultant had to analyze the collected information in order to understand the flow of commodities under study, inventory, transportation and distribution, model shift and multimodal transportation including rail road barge and air-transportation totaling 52 export products. The transportation cost is included.
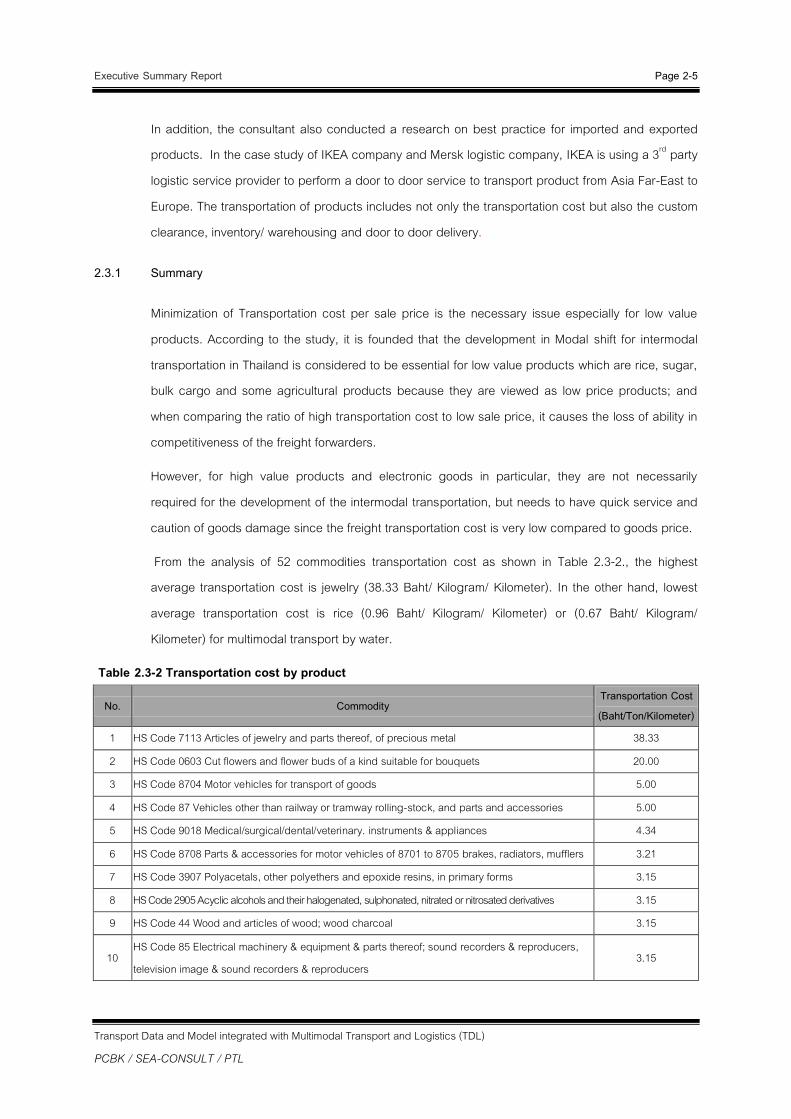
This study found that most of manufacturers prefer to select a service from a 3rd party service provider, who provides a service as a global supply solution (as shown in figure 2.3-1). Most of these service providers are Non-vessel Owned Common Carriers (NVOCC), which have dramatically grown during the past five years (as shown in figure 2.3-2). Their services are comprised of custom clearance, transportation, warehousing, and a door-to-door service. The service mentioned introduces New Incoterms Rules which are 1) Delivered at Terminal (DAT); 2) Delivered at Place (DAP).
Figure 2.3-1 NVOCC provides a Door-to-Door service in the Global Supply Chain
Source: PIERS Consulting, Jan 2011
Figure 2.3-2 Growth of NVOCC

Executive Summary Report Page 2-3
Transport Data and Model integrated with Multimodal Transport and Logistics (TDL)
PCBK / SEA-CONSULT / PTL
Moreover, 3rd party service providers also serve other services including warehouse management and inventory management. This, in turns, allows a value added in the transportation logistic system by not having to have the manufacturers be involved in the warehousing and product distribution as they are not part of the business core as show in figure 2.3–3.
Figure 2.3-3 Value Added in Transportation Logistics
The factors affecting the decision in choosing a transportation mode for products are shown in
Table 2.3-1. The consultant conducted studies for both the same product going through different routes and different products going through the same route.
Table 2.3-1 Transportation Mode Selection by Product
Product Type Transportation Requirement Transportation Mode
Group 1 : Garment, Textile and Fiber
- High Value Added Products - Need timely delivery for products related to
fashion
- High speed delivery - Door-to-Door delivery - Transported by truck
Group 2 : Seafood - High Value Added Products - Need timely delivery for perishable
products
- High speed delivery - Door-to-Door delivery - Transported by truck
Group 3 : Fruit - High Value Added Products - Need timely delivery for perishable
products
- High speed delivery - Door-to-Door delivery - Transported by truck
Group 4 : Agricultural Products - Low value products - Timely delivery is not required
- Low cost transportation is preferable and ability to shift transportation mode to rail or water

Executive Summary Report Page 2-4
Transport Data and Model integrated with Multimodal Transport and Logistics (TDL)
PCBK / SEA-CONSULT / PTL
Table 2.3-1 Transportation Mode Selection by Product (Cont’) Product Type Transportation Requirement Transportation Mode
Group 5 : Fertilizer, mineral and Cement
- Low value products - Timely delivery is not required
- Low cost transportation is preferable and ability to shift transportation mode to rail or water
Group 6 : Plastics and Chemical - High Value products
- High speed delivery - Door to Door delivery - Transported by truck
Group 7 : Rubber, paper and furniture
- Transportation cost has an impact on product price
- Product condition needs to be maintained
- Door to Door delivery - Transported by truck
Group 8 : Steel and Aluminum - High Value products - High weigh imposes limitation to
transportation
- Truck can be used but rail is preferable for long distance due to its loading capacity
Group 9 : Engine, automotive
die and auto-parts - High value products - Require door to door service - Product condition needs to be maintained
- Transported by truck
Group 10 : Computer, computer parts and adapters
- High value products - Require door to door service - Product condition needs to be maintained
- Transported by truck
Group 11 : Medical equipment, electrical circuit, diamond and natural stones
- High value products - Require door to door service - Product condition needs to be maintained
- Transported by truck
Group 12 : Oil, Petroleum and Fuel
- High value products - Require door to door service - Product condition needs to be maintained - The transportation cost affects the product
price
- Truck can be used but rail is preferable for long distance due to its loading capacity
Group 13 : Fresh Orchid - High value products - Require door to door service - Product condition needs to be maintained
- Transported by truck
Group 14 : Transit Cargo General Transportation - Many transportation modes are available, depending on the customer preferences
Executive Summary Report Page 2-5
Transport Data and Model integrated with Multimodal Transport and Logistics (TDL)
PCBK / SEA-CONSULT / PTL
In addition, the consultant also conducted a research on best practice for imported and exported products. In the case study of IKEA company and Mersk logistic company, IKEA is using a 3rd party logistic service provider to perform a door to door service to transport product from Asia Far-East to Europe. The transportation of products includes not only the transportation cost but also the custom clearance, inventory/ warehousing and door to door delivery.
2.3.1 Summary
Minimization of Transportation cost per sale price is the necessary issue especially for low value products. According to the study, it is founded that the development in Modal shift for intermodal transportation in Thailand is considered to be essential for low value products which are rice, sugar, bulk cargo and some agricultural products because they are viewed as low price products; and when comparing the ratio of high transportation cost to low sale price, it causes the loss of ability in competitiveness of the freight forwarders.
However, for high value products and electronic goods in particular, they are not necessarily required for the development of the intermodal transportation, but needs to have quick service and caution of goods damage since the freight transportation cost is very low compared to goods price.
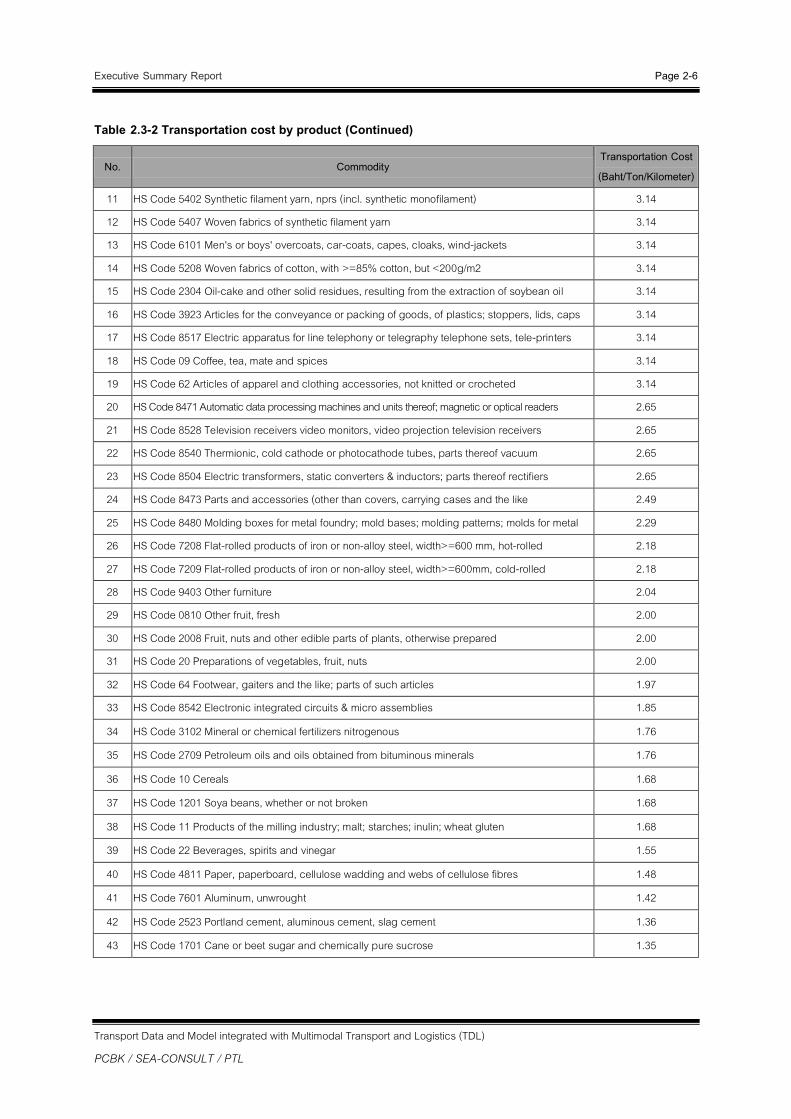
From the analysis of 52 commodities transportation cost as shown in Table 2.3-2., the highest average transportation cost is jewelry (38.33 Baht/ Kilogram/ Kilometer). In the other hand, lowest average transportation cost is rice (0.96 Baht/ Kilogram/ Kilometer) or (0.67 Baht/ Kilogram/ Kilometer) for multimodal transport by water.
Table 2.3-2 Transportation cost by product
No. Commodity Transportation Cost (Baht/Ton/Kilometer)
1 HS Code 7113 Articles of jewelry and parts thereof, of precious metal 38.33
2 HS Code 0603 Cut flowers and flower buds of a kind suitable for bouquets 20.00
3 HS Code 8704 Motor vehicles for transport of goods 5.00
4 HS Code 87 Vehicles other than railway or tramway rolling-stock, and parts and accessories 5.00
5 HS Code 9018 Medical/surgical/dental/veterinary. instruments & appliances 4.34
6 HS Code 8708 Parts & accessories for motor vehicles of 8701 to 8705 brakes, radiators, mufflers 3.21
7 HS Code 3907 Polyacetals, other polyethers and epoxide resins, in primary forms 3.15
8 HS Code 2905 Acyclic alcohols and their halogenated, sulphonated, nitrated or nitrosated derivatives 3.15
9 HS Code 44 Wood and articles of wood; wood charcoal 3.15
10 HS Code 85 Electrical machinery & equipment & parts thereof; sound recorders & reproducers, television image & sound recorders & reproducers
3.15
Executive Summary Report Page 2-6
Transport Data and Model integrated with Multimodal Transport and Logistics (TDL)
PCBK / SEA-CONSULT / PTL
Table 2.3-2 Transportation cost by product (Continued)
No. Commodity Transportation Cost (Baht/Ton/Kilometer)
11 HS Code 5402 Synthetic filament yarn, nprs (incl. synthetic monofilament) 3.14
12 HS Code 5407 Woven fabrics of synthetic filament yarn 3.14
13 HS Code 6101 Men's or boys' overcoats, car-coats, capes, cloaks, wind-jackets 3.14
14 HS Code 5208 Woven fabrics of cotton, with >=85% cotton, but <200g/m2 3.14
15 HS Code 2304 Oil-cake and other solid residues, resulting from the extraction of soybean oil 3.14
16 HS Code 3923 Articles for the conveyance or packing of goods, of plastics; stoppers, lids, caps 3.14
17 HS Code 8517 Electric apparatus for line telephony or telegraphy telephone sets, tele-printers 3.14
18 HS Code 09 Coffee, tea, mate and spices 3.14
19 HS Code 62 Articles of apparel and clothing accessories, not knitted or crocheted 3.14
20 HS Code 8471 Automatic data processing machines and units thereof; magnetic or optical readers 2.65
21 HS Code 8528 Television receivers video monitors, video projection television receivers 2.65
22 HS Code 8540 Thermionic, cold cathode or photocathode tubes, parts thereof vacuum 2.65
23 HS Code 8504 Electric transformers, static converters & inductors; parts thereof rectifiers 2.65
24 HS Code 8473 Parts and accessories (other than covers, carrying cases and the like 2.49
25 HS Code 8480 Molding boxes for metal foundry; mold bases; molding patterns; molds for metal 2.29
26 HS Code 7208 Flat-rolled products of iron or non-alloy steel, width>=600 mm, hot-rolled 2.18
27 HS Code 7209 Flat-rolled products of iron or non-alloy steel, width>=600mm, cold-rolled 2.18
28 HS Code 9403 Other furniture 2.04
29 HS Code 0810 Other fruit, fresh 2.00
30 HS Code 2008 Fruit, nuts and other edible parts of plants, otherwise prepared 2.00
31 HS Code 20 Preparations of vegetables, fruit, nuts 2.00
32 HS Code 64 Footwear, gaiters and the like; parts of such articles 1.97
33 HS Code 8542 Electronic integrated circuits & micro assemblies 1.85
34 HS Code 3102 Mineral or chemical fertilizers nitrogenous 1.76
35 HS Code 2709 Petroleum oils and oils obtained from bituminous minerals 1.76
36 HS Code 10 Cereals 1.68
37 HS Code 1201 Soya beans, whether or not broken 1.68
38 HS Code 11 Products of the milling industry; malt; starches; inulin; wheat gluten 1.68
39 HS Code 22 Beverages, spirits and vinegar 1.55
40 HS Code 4811 Paper, paperboard, cellulose wadding and webs of cellulose fibres 1.48
41 HS Code 7601 Aluminum, unwrought 1.42
42 HS Code 2523 Portland cement, aluminous cement, slag cement 1.36
43 HS Code 1701 Cane or beet sugar and chemically pure sucrose 1.35

Executive Summary Report Page 2-7
Transport Data and Model integrated with Multimodal Transport and Logistics (TDL)
PCBK / SEA-CONSULT / PTL
Table 2.3-2 Transportation cost by product (Continued)
No. Commodity Transportation Cost (Baht/Ton/Kilometer)
44 HS Code 0303 Fish, frozen, excluding fish fillets and other fish meat of heading No.0304 1.33
45 HS Code 1605 Crustaceans, molluscs and other aquatic invertebrates, prepared 1.33
46 HS Code 0306 Crustaceans, whether in shell or ot, live, fresh, chilled, frozen, dried, salted 1.33
47 HS Code 8414 Air or vacuum pumps, air or other gas compressors & fans; ventilating 1.33
48 HS Code 8207 Interchangeable tools for handtools or machinetools for pressing 1.33
49 HS Code 4001 Natural rubber, balata, gutta-percha, guayule, chicle and similar natural gums 1.16
50 HS Code 4011 New pneumatic tyres, of rubber 1.15
51 HS Code 0714 Manioc, arrowroot, salep, Jerusalem artichokes, sweet potatoes and similar roots 0.98
52 HS Code 1006 Rice 0.96/0.67* * Remark: Multimodal transport by water
Recommendations and findings
1) The research found that transportation cost can be fluctuated depending on the market
demand, degree of competition and the ability to provide services of the 3rd party service
providers. Nowadays, the decision on using a transportation service provider does not only
depend on price but also depend on other services available such as door to door delivery
and custom clearance service. In order to be able to compete with international transportation
service provider, a Thai transportation service provider should have a “ONE STOP FOR ALL
YOUR LOGISTICS SOLUTION” shown in figure 2.3-4, as follows;
Global supply chain management service
Customs brokerage & clearance management
Logistics services
Air/ Ocean/ Road/ Rail transportation
Executive Summary Report Page 2-8
Transport Data and Model integrated with Multimodal Transport and Logistics (TDL)
PCBK / SEA-CONSULT / PTL
Figure 2.3-4 One Stop for All Your Logistics Solution
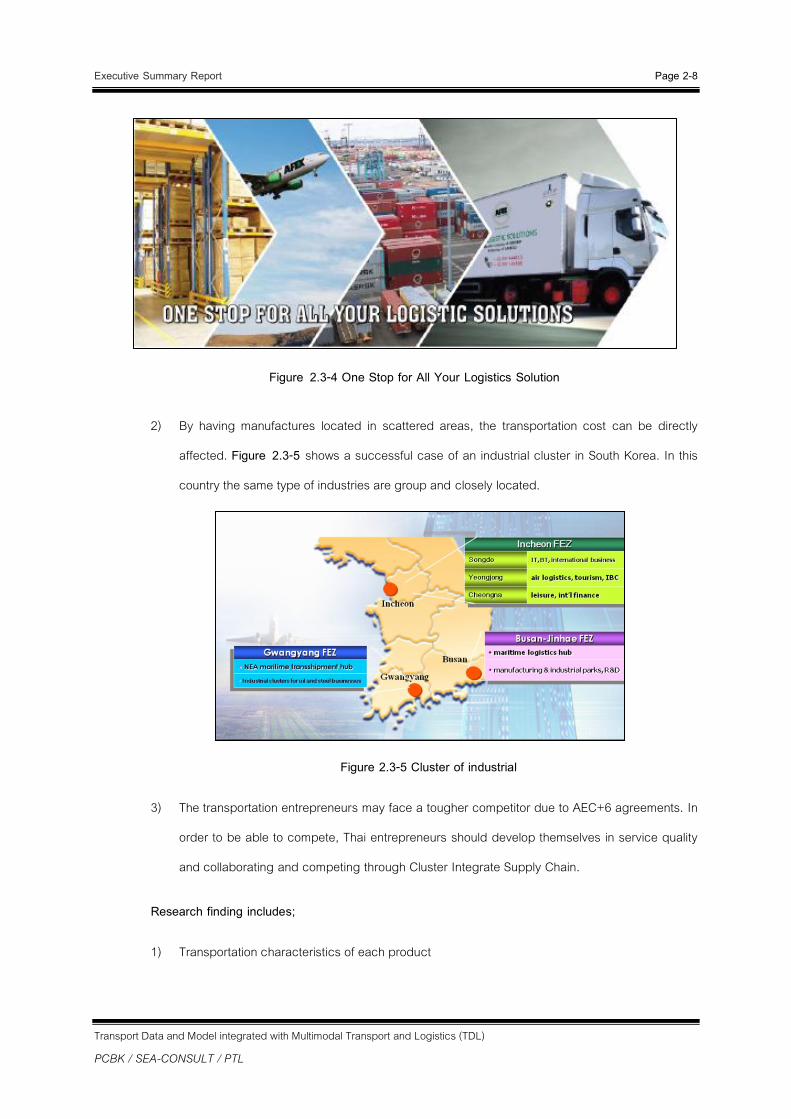
2) By having manufactures located in scattered areas, the transportation cost can be directly
affected. Figure 2.3-5 shows a successful case of an industrial cluster in South Korea. In this
country the same type of industries are group and closely located.
Figure 2.3-5 Cluster of industrial
3) The transportation entrepreneurs may face a tougher competitor due to AEC+6 agreements. In
order to be able to compete, Thai entrepreneurs should develop themselves in service quality
and collaborating and competing through Cluster Integrate Supply Chain.
Research finding includes;
1) Transportation characteristics of each product

Executive Summary Report Page 2-9
Transport Data and Model integrated with Multimodal Transport and Logistics (TDL)
PCBK / SEA-CONSULT / PTL
2) Product movement characteristics such as volume according to the seasonality, origin-
destination according to the seasonality
3) Transportation cost should be represented in the price not the cost due to outsourcing service
provider and one stop service (OSS)
4) Price of transportation depends on demand and supply according to item 3 above
5) External factors influence decisions related to transportation and industrial sector such as FTA,
AEC+6
2.4 Traffic and Transportation Survey for the National Model (NAM)
2.4.1 Roadside Interview Survey for the National Model (NAM)
This study conducted a roadside interview (21 locations) along the four screenlines. The interview included questions concerning general characteristics of travellers, origin-destination of each trip, objectives of each trip, number of passengers in each vehicle, and type and amount of goods transported. The survey was conducted between the 23rd of August 2010 and the 25th of September 2010. Figure 2.4-1 shows 21 roadside interview locations.
Figure 2.4-1 Roadside Interview Location
Executive Summary Report Page 2-10
Transport Data and Model integrated with Multimodal Transport and Logistics (TDL)
PCBK / SEA-CONSULT / PTL
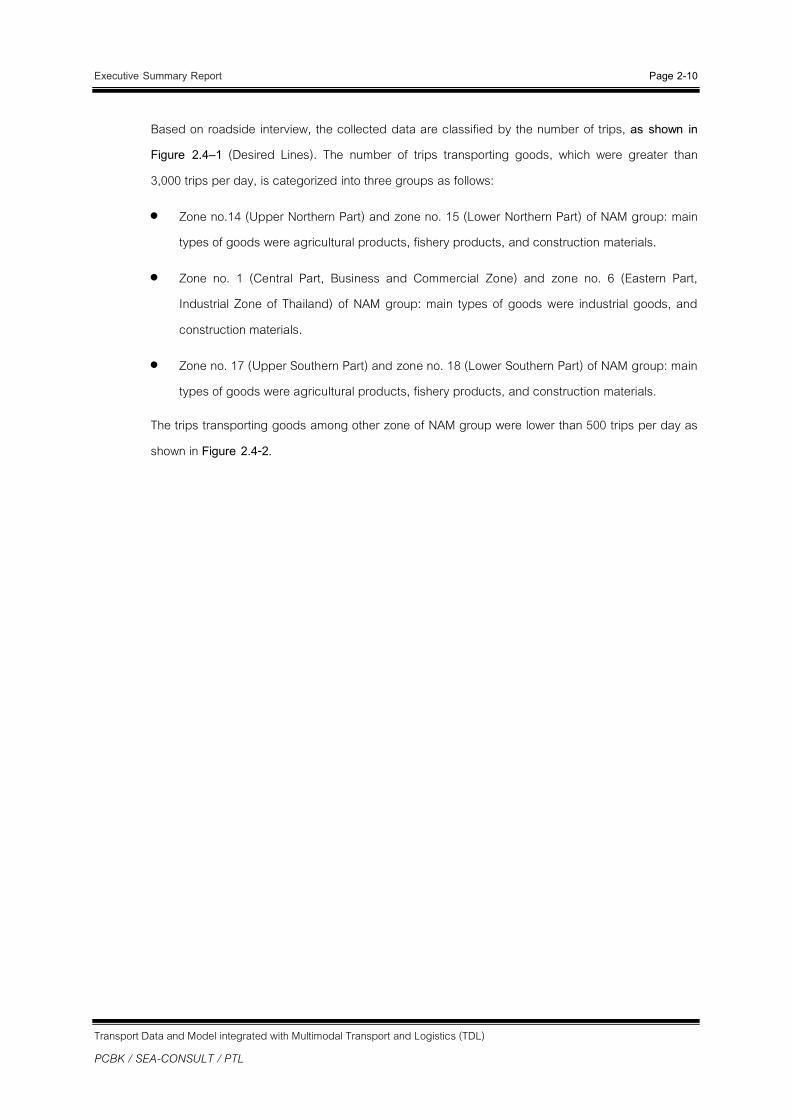
Based on roadside interview, the collected data are classified by the number of trips, as shown in
Figure 2.4–1 (Desired Lines). The number of trips transporting goods, which were greater than 3,000 trips per day, is categorized into three groups as follows:
Zone no.14 (Upper Northern Part) and zone no. 15 (Lower Northern Part) of NAM group: main types of goods were agricultural products, fishery products, and construction materials.
Zone no. 1 (Central Part, Business and Commercial Zone) and zone no. 6 (Eastern Part, Industrial Zone of Thailand) of NAM group: main types of goods were industrial goods, and construction materials.
Zone no. 17 (Upper Southern Part) and zone no. 18 (Lower Southern Part) of NAM group: main types of goods were agricultural products, fishery products, and construction materials.
The trips transporting goods among other zone of NAM group were lower than 500 trips per day as shown in Figure 2.4-2.
Executive Summary Report Page 2-11
Transport Data and Model integrated with Multimodal Transport and Logistics (TDL)
PCBK / SEA-CONSULT / PTL
Figure 2.4-2 Number of trips transporting goods based on Survey Data at Four Screenlines
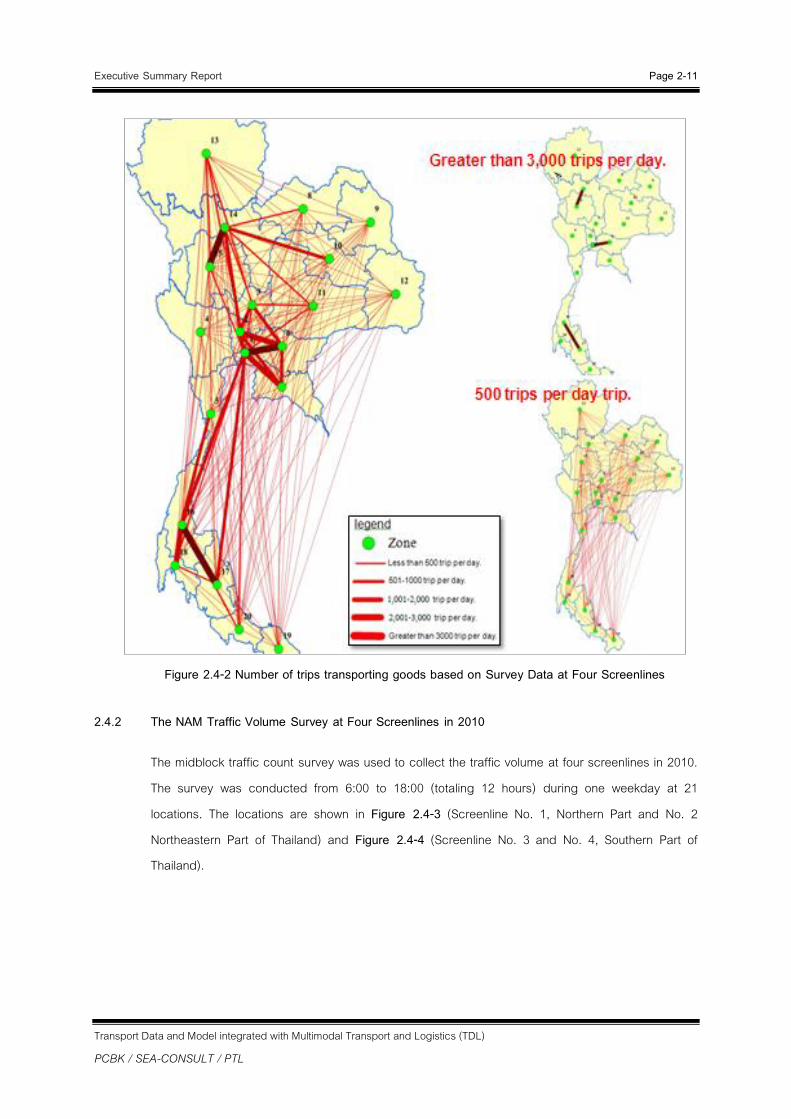
2.4.2 The NAM Traffic Volume Survey at Four Screenlines in 2010
The midblock traffic count survey was used to collect the traffic volume at four screenlines in 2010. The survey was conducted from 6:00 to 18:00 (totaling 12 hours) during one weekday at 21 locations. The locations are shown in Figure 2.4-3 (Screenline No. 1, Northern Part and No. 2 Northeastern Part of Thailand) and Figure 2.4-4 (Screenline No. 3 and No. 4, Southern Part of Thailand).
Executive Summary Report Page 2-12
Transport Data and Model integrated with Multimodal Transport and Logistics (TDL)
PCBK / SEA-CONSULT / PTL
Figure 2.4-3 Traffic Volume at Screenline No. 1 and No. 2
Figure 2.4-4 Traffic Volume at Screenline No. 3 and No. 4
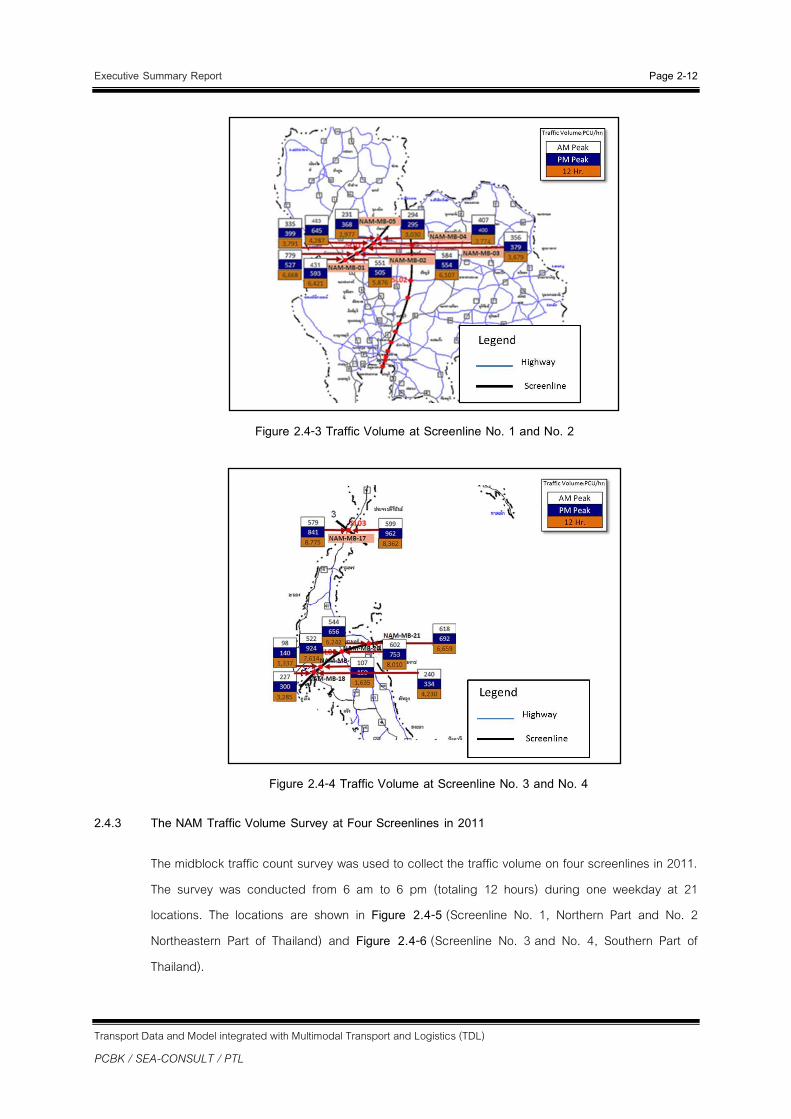
2.4.3 The NAM Traffic Volume Survey at Four Screenlines in 2011
The midblock traffic count survey was used to collect the traffic volume on four screenlines in 2011. The survey was conducted from 6 am to 6 pm (totaling 12 hours) during one weekday at 21 locations. The locations are shown in Figure 2.4-5 (Screenline No. 1, Northern Part and No. 2 Northeastern Part of Thailand) and Figure 2.4-6 (Screenline No. 3 and No. 4, Southern Part of Thailand).
Executive Summary Report Page 2-13
Transport Data and Model integrated with Multimodal Transport and Logistics (TDL)
PCBK / SEA-CONSULT / PTL
Figure 2.4-5 Traffic Volume at Screenline No. 1 and No. 2
Figure 2.4-6 Traffic Volume at Screenline No. 3 and No. 4
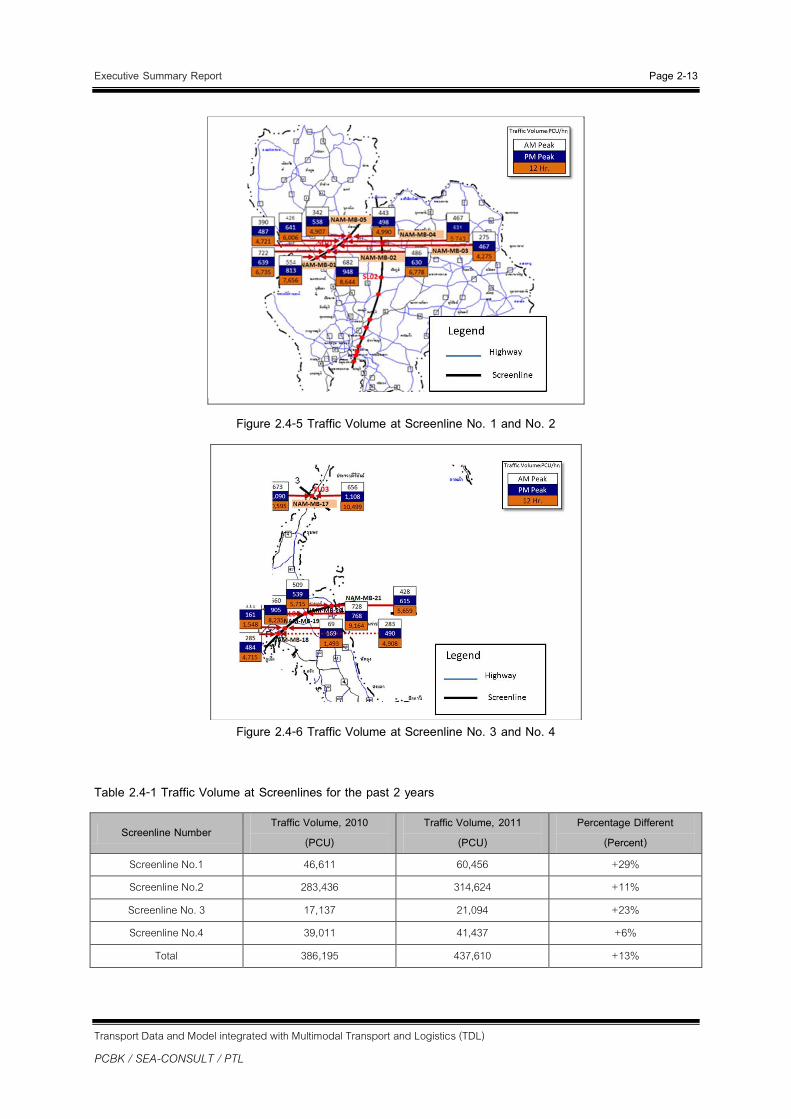
Table 2.4-1 Traffic Volume at Screenlines for the past 2 years
Screenline Number Traffic Volume, 2010
(PCU) Traffic Volume, 2011
(PCU) Percentage Different
(Percent) Screenline No.1 46,611 60,456 +29% Screenline No.2 283,436 314,624 +11%
Screenline No. 3 17,137 21,094 +23% Screenline No.4 39,011 41,437 +6%
Total 386,195 437,610 +13%

Executive Summary Report Page 2-14
Transport Data and Model integrated with Multimodal Transport and Logistics (TDL)
PCBK / SEA-CONSULT / PTL
As shown in Table 2.4-1, the total traffic volume at four screenlines (Screenline No.1, 2, 3, and 4) in 2011 was higher than 2010 by about 13 percent.
2.5 Traffic and Transportation survey for the Extended Bangkok Urban Model (eBUM)
2.5.1 Roadside Interview for the Extended Bangkok Urban Model (eBUM)
Three truck terminals of Bangkok and vicinity were selected as locations for the interview which were Khlong Luang truck terminal, Buddhamonthon truck terminal, and Latkrabang truck terminal. The survey was conducted between the 15th and 18th of June, 2010. Figure 2.5-1 represents the desired lines that were developed from the survey data. The routes that has the highest number of trips transporting goods (greater than 750 trips per day) were:
The desired line from zone No. 15 (Nakornprathom province) and zone No. 18 (Samutprakarn province) of eBUM group: main types of goods were industrial goods, and construction materials.
The desired line from zone No. 15 (Nakornprathom province) and zone No. 7 (Chachoengsao province) of eBUM group: main types of goods were industrial goods, and construction materials.
The trips transporting goods among other zone of the eBUM group were lower than 250 trips per day as shown in Figure 2.5-1.
Figure 2.5-1 Roadside Interview at Three Truck Terminals of Bangkok

Executive Summary Report Page 2-15
Transport Data and Model integrated with Multimodal Transport and Logistics (TDL)
PCBK / SEA-CONSULT / PTL
2.5.2 eBUM Traffic Survey in 2010
The traffic volume survey was conducted for developing the eBUM model at 19 locations along the Chaopraya river or North – South screenline of Bangkok as shown in Figure 2.5-2 (starting from Pathumthani province to Samutprakarn province). The midblock traffic count was used to collect the traffic volume in 2010. The traffic count was conducted from 6 am to 6 pm (totaling 12 hours) during one weekday.
The results show that four bridges of Bangkok had a traffic volume to capacity ratio of greater than 1.0 (Level of service F) were Krungthon bridge, Pokklao bridge, Rama III bridge (new), and Rama IX bridge. Rama IV bridge, Phra Nangklao bridge (new), Rama V bridge, Industrial Ring Road bridge had a traffic volume to capacity ratio lower than 0.6 (Level of service A).
Figure 2.5-2 The eBUM Survey Locations

Executive Summary Report Page 2-16
Transport Data and Model integrated with Multimodal Transport and Logistics (TDL)
PCBK / SEA-CONSULT / PTL
2.5.3 The eBUM Traffic Volume Survey in 2011
The traffic volume survey was conducted for developing the eBUM model at 37 locations along the Sansaeb Canal or East – West screenline of Bangkok as shown in Figure 2.5-3 and 2.5-4 (starting from Eastbound to Westbound Outer Ring Road). The midblock traffic count was used to collect the traffic volume in 2010. The traffic count was conducted from 6 am to 6 pm (totaling 12 hours) during one weekday. The traffic volume survey was conducted between the18th and 20th of January, 2011.
As shown in Figure 2.5-3 and Figure 2.5-4, the results show that three bridges of East – West screen line that had a volume to capacity ratio of about 0.80 – 0.89 (level of service D) were Lumsalee Bridge (MB04), Petchburi Road. Bridge (MB 14), and Praditmanutham (MB 15).

Executive Summary Report Page 2-17
Transport Data and Model integrated with Multimodal Transport and Logistics (TDL)
PCBK / SEA-CONSULT / PTL
Figure 2.5-3 Traffic Volume at East – West Screenline of eBUM

Executive Summary Report Page 2-18
Transport Data and Model integrated with Multimodal Transport and Logistics (TDL)
PCBK / SEA-CONSULT / PTL
Figure 2.5-4 Traffic Volume at East – West Screenline of eBUM
Executive Summary Report Page 2-19
Transport Data and Model integrated with Multimodal Transport and Logistics (TDL)
PCBK / SEA-CONSULT / PTL
2.6 Traffic and Transportation Survey for the Provincial Transport Model (PTM) Development
2.6.1 The Intersection Count for the PTM Development
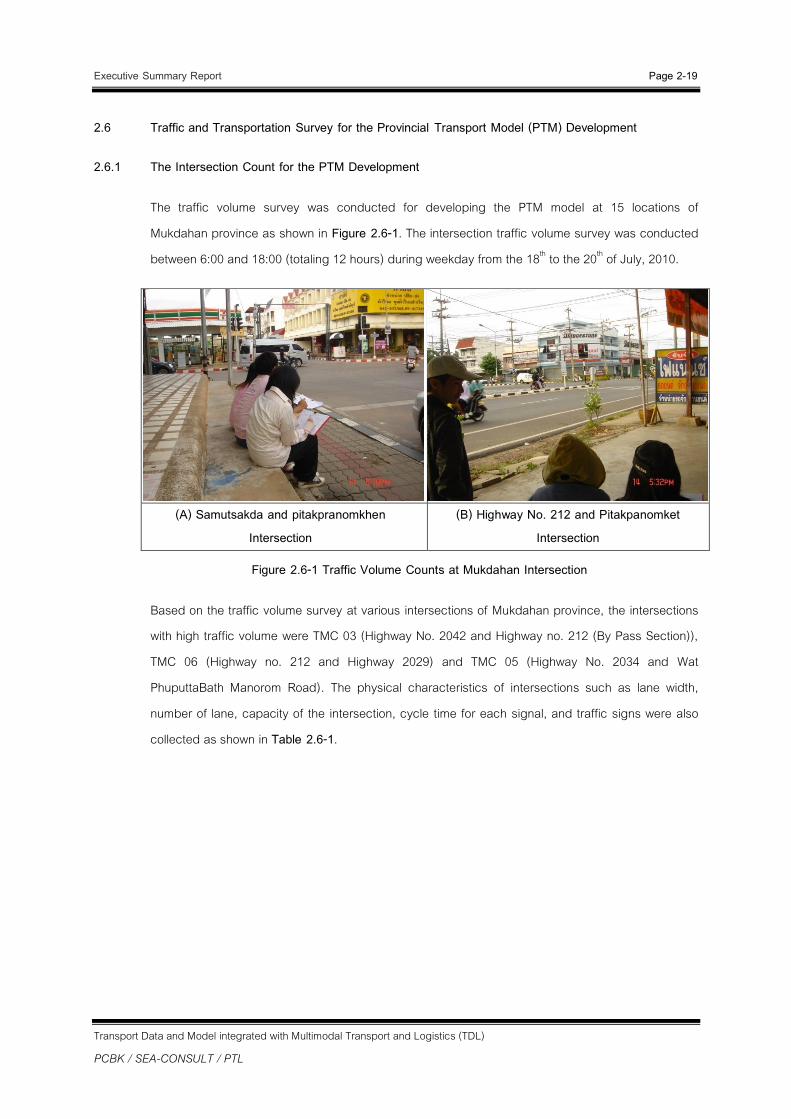
The traffic volume survey was conducted for developing the PTM model at 15 locations of Mukdahan province as shown in Figure 2.6-1. The intersection traffic volume survey was conducted between 6:00 and 18:00 (totaling 12 hours) during weekday from the 18th to the 20th of July, 2010.
(A) Samutsakda and pitakpranomkhen
Intersection (B) Highway No. 212 and Pitakpanomket
Intersection
Figure 2.6-1 Traffic Volume Counts at Mukdahan Intersection
Based on the traffic volume survey at various intersections of Mukdahan province, the intersections with high traffic volume were TMC 03 (Highway No. 2042 and Highway no. 212 (By Pass Section)), TMC 06 (Highway no. 212 and Highway 2029) and TMC 05 (Highway No. 2034 and Wat PhuputtaBath Manorom Road). The physical characteristics of intersections such as lane width, number of lane, capacity of the intersection, cycle time for each signal, and traffic signs were also collected as shown in Table 2.6-1.
Executive Summary Report Page 2-20
Transport Data and Model integrated with Multimodal Transport and Logistics (TDL)
PCBK / SEA-CONSULT / PTL
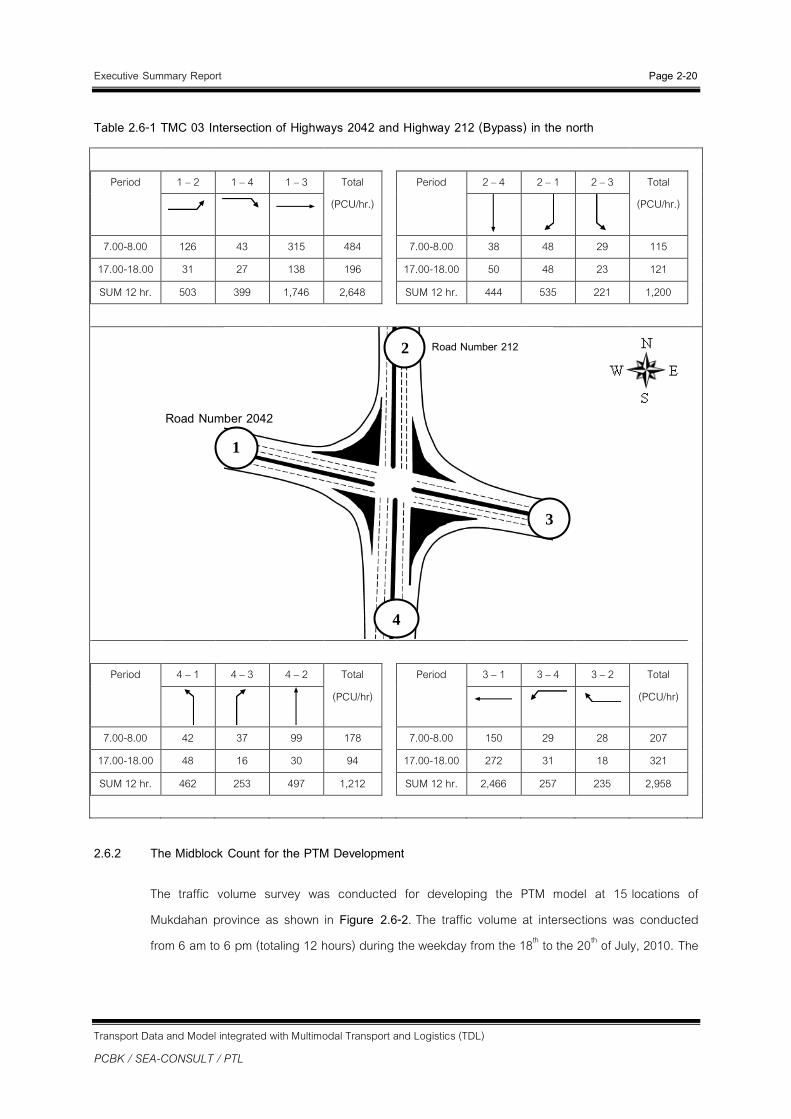
Table 2.6-1 TMC 03 Intersection of Highways 2042 and Highway 212 (Bypass) in the north
Period 1 – 2 1 – 4 1 – 3 Total (PCU/hr.)
Period 2 – 4 2 – 1 2 – 3 Total (PCU/hr.)
7.00-8.00 126 43 315 484 7.00-8.00 38 48 29 115 17.00-18.00 31 27 138 196 17.00-18.00 50 48 23 121
SUM 12 hr. 503 399 1,746 2,648 SUM 12 hr. 444 535 221 1,200
Period 4 – 1 4 – 3 4 – 2 Total
(PCU/hr) Period 3 – 1 3 – 4 3 – 2 Total
(PCU/hr)
7.00-8.00 42 37 99 178 7.00-8.00 150 29 28 207 17.00-18.00 48 16 30 94 17.00-18.00 272 31 18 321
SUM 12 hr. 462 253 497 1,212 SUM 12 hr. 2,466 257 235 2,958
2.6.2 The Midblock Count for the PTM Development
The traffic volume survey was conducted for developing the PTM model at 15 locations of Mukdahan province as shown in Figure 2.6-2. The traffic volume at intersections was conducted from 6 am to 6 pm (totaling 12 hours) during the weekday from the 18th to the 20th of July, 2010. The
1
2
3
4
Road Number 212
Road Number 2042

Executive Summary Report Page 2-21
Transport Data and Model integrated with Multimodal Transport and Logistics (TDL)
PCBK / SEA-CONSULT / PTL
volume to capacity ratio of all road networks in Mukdahan province was between 0.079 and 0.36 (representing good conditions).
2.6.3 The Traffic Volume Counts at Mukdahan Border Crossing
The traffic volume count survey was conducted at Mukdahan border crossing from 6 am to 10 pm on 13-15 July, 2010. The survey was conducted during one weekday and one weekend. Figure 2.6-2
shows the percentage of each type of vehicles that was used at Mukdahan border crossing. The highest percentage of vehicle crossing was by passenger car (67 percent of the total) crossing for visiting purposes. The percentage of crossings by truck was about 10 percent of the total crossings.
Traffic volume in - out at Dan Mukdahan
Figure 2.6-2 Percentage of each Vehicle Type at Mukdahan Border Crossing
2.6.4 In-Home Interview for the PTM Development
The In-home interview was used to study the travelling behavior of Mukdahan people for developing the activity based model. Mukdahan Municipality was divided into 60 zones. The survey questionnaires (totaling 1,000 set) were distributed among the 60 zones. The collected data were classified by the number of trips among pairs of zone (desired line) as shown in Figure 2.6-3. The zones that had the highest number of trips were zone 1 to zone 6 because they were the central business district of Mukdahan province.
Executive Summary Report Page 2-22
Transport Data and Model integrated with Multimodal Transport and Logistics (TDL)
PCBK / SEA-CONSULT / PTL
Figure 2.6-3 The Desired Line of Mukdahan Municipality for In-Home Survey
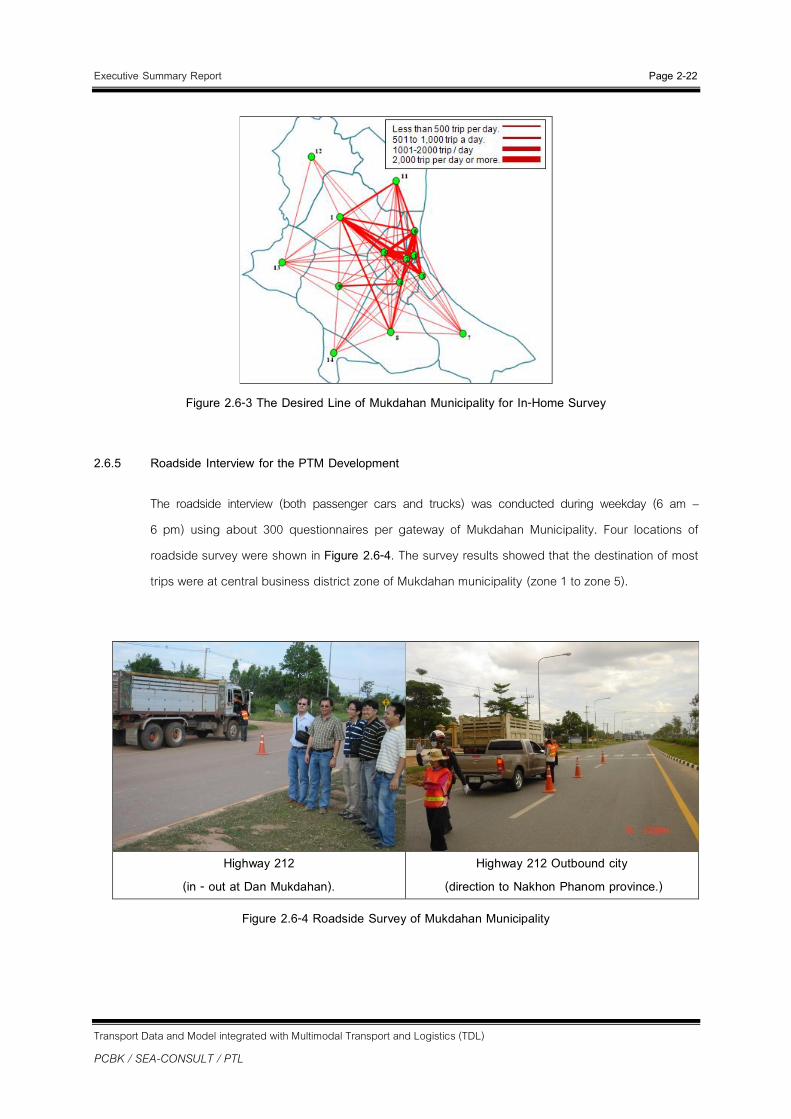
2.6.5 Roadside Interview for the PTM Development
The roadside interview (both passenger cars and trucks) was conducted during weekday (6 am – 6 pm) using about 300 questionnaires per gateway of Mukdahan Municipality. Four locations of roadside survey were shown in Figure 2.6-4. The survey results showed that the destination of most trips were at central business district zone of Mukdahan municipality (zone 1 to zone 5).
Highway 212
(in - out at Dan Mukdahan). Highway 212 Outbound city
(direction to Nakhon Phanom province.)
Figure 2.6-4 Roadside Survey of Mukdahan Municipality

Executive Summary Report Page 2-23
Transport Data and Model integrated with Multimodal Transport and Logistics (TDL)
PCBK / SEA-CONSULT / PTL
Figure 2.6-5 The Desired Line of Mukdahan Municipality from Roadside Survey
2.6.6 Traffic Signal Data Collection for the PTM Development
The existing traffic signal of the selected intersections (15 intersections) were collected including cycle time, and phasing pattern and time as shown in Table 2.6-2.
Table 2.6-2 Example of Traffic Signal Data Collection (Intersection: Highway No. 212 and Highway No. 2042)
Cycle length :122 S
1 2 3 4
Green light 20 20 35 35
Yellow light. 3 3 3 3
Red light 90 90 75 75
Executive Summary Report Page 2-24
Transport Data and Model integrated with Multimodal Transport and Logistics (TDL)
PCBK / SEA-CONSULT / PTL
2.6.7 Traffic Delay and Queue for the PTM Development
Maximum queue lengths of all selected intersections (all directions) in Mukdahan municipality were measured to confirm the simulation results of micro simulation program for both the morning peak and the afternoon peak. The longest queue occurred at TMC – 06 (Highway no. 212 and Wiwitsurakarn Rd. intersection) which had 11 vehicles per one cycle.
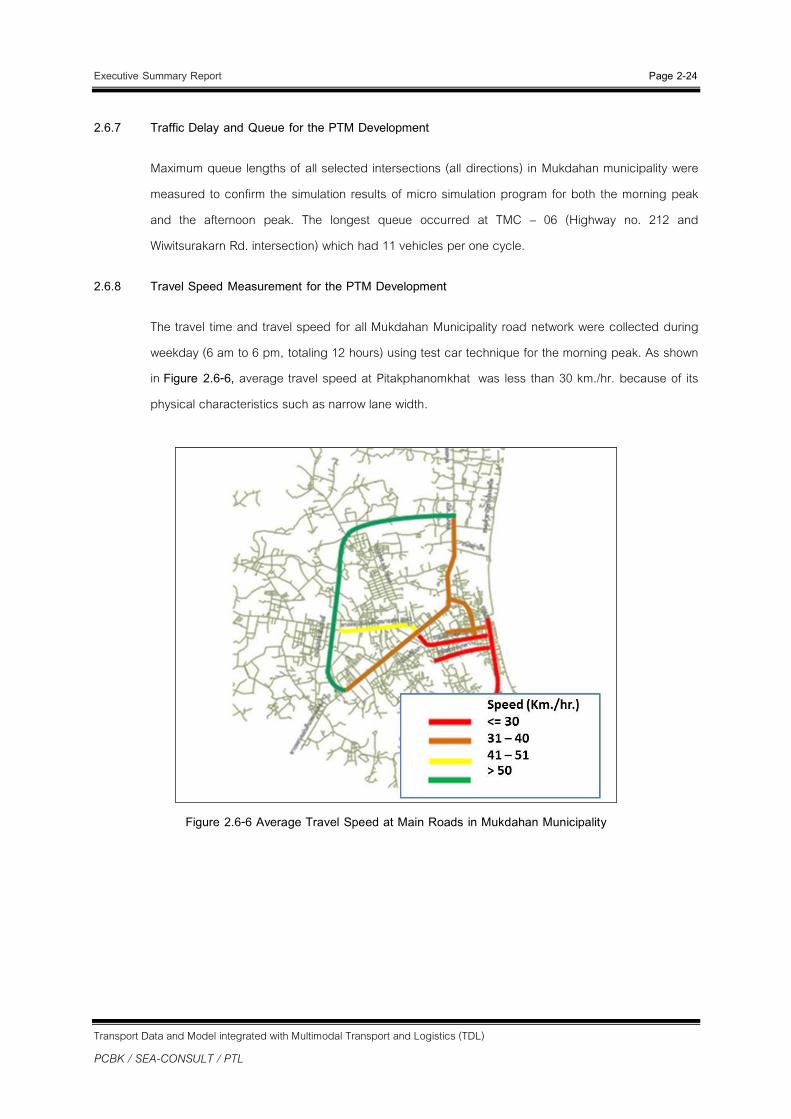
2.6.8 Travel Speed Measurement for the PTM Development
The travel time and travel speed for all Mukdahan Municipality road network were collected during weekday (6 am to 6 pm, totaling 12 hours) using test car technique for the morning peak. As shown in Figure 2.6-6, average travel speed at Pitakphanomkhat was less than 30 km./hr. because of its physical characteristics such as narrow lane width.
Figure 2.6-6 Average Travel Speed at Main Roads in Mukdahan Municipality
CCHHAAPPTTEERR 33 DDEEVVEELLOOPPMMEENNTT AANNDD MMAAIINNTTEENNAANNCCEE OOFF TTHHEE
DDAATTAABBAASSEE OOFF TTRRAANNSSPPOORRTTAATTIIOONN AANNDD TTRRAAFFFFIICC IINNFFOORRMMAATTIIOONN
Executive Summary Report Page 3-1
Transport Data and Model integrated with Multimodal Transport and Logistics (TDL)
PCBK / SEA-CONSULT / PTL
CCHHAAPPTTEERR 33 DDEEVVEELLOOPPMMEENNTT AANNDD MMAAIINNTTEENNAANNCCEE OOFF TTHHEE
TTRRAANNSSPPOORRTTAATTIIOONN AANNDD TTRRAAFFFFIICC IINNFFOORRMMAATTIIOONN DDAATTAABBAASSEE
3.1 Preface 3.2 Improvement and maintenance of management information systems and geographic information systems
(MIS / GIS) 3.3 Development of Information Systems to Support Information Exchange Standard with XML File Format 3.4 Development of Management Information System (MIS) and Geographic Information Systems (GIS) using
Executive Information System (EIS) 3.5 Management System for Internet and Intranet of the OTP 3.6 Improvement of Computer Systems and Networks
3.1 Preface
In order to respond to the government plan of action, strategy of the OTP and provide support on information technology for the OTP efficiently and effectively, the information technology systems have been developed and improved by consultants during operational projects and projects related to the TDL which were acquired in the past. The tasks of development and maintenance of the transportation and traffic information database in TDL have been divided into five sections which include:
1) Study and review process for developing the database and information.
2) Improvement and maintenance of management information systems and geographic information systems (MIS/GIS).
3) Development of Management Information System (MIS) and Geographic Information Systems (GIS) using Executive Information System (EIS).
4) Improvement of computer systems and networks.
5) Management system for internet and intranet of the OTP.
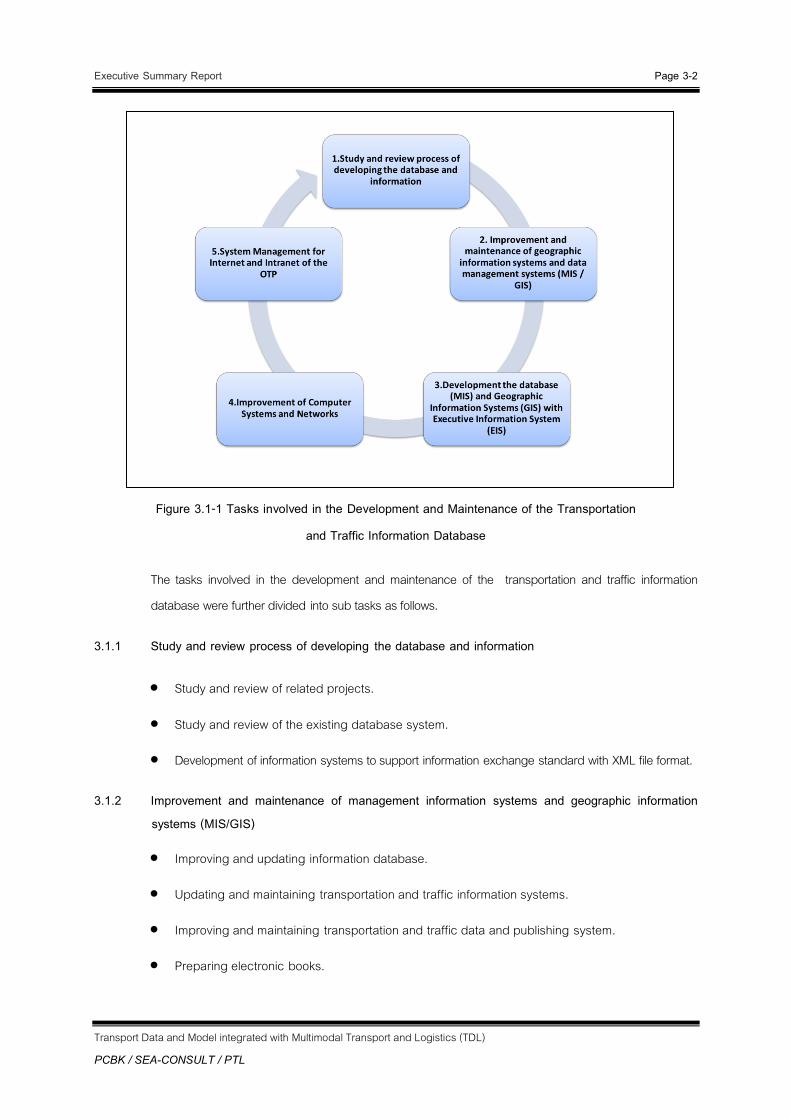
The overall process involved in developing and maintaining the transportation and traffic information database is depicted in Figure 3.1-1
Executive Summary Report Page 3-2
Transport Data and Model integrated with Multimodal Transport and Logistics (TDL)
PCBK / SEA-CONSULT / PTL
Figure 3.1-1 Tasks involved in the Development and Maintenance of the Transportation
and Traffic Information Database
The tasks involved in the development and maintenance of the transportation and traffic information database were further divided into sub tasks as follows.
3.1.1 Study and review process of developing the database and information
Study and review of related projects.
Study and review of the existing database system.
Development of information systems to support information exchange standard with XML file format.
3.1.2 Improvement and maintenance of management information systems and geographic information systems (MIS/GIS)
Improving and updating information database.
Updating and maintaining transportation and traffic information systems.
Improving and maintaining transportation and traffic data and publishing system.
Preparing electronic books.

Executive Summary Report Page 3-3
Transport Data and Model integrated with Multimodal Transport and Logistics (TDL)
PCBK / SEA-CONSULT / PTL
3.1.3 Development of Management Information System (MIS) and Geographic Information Systems (GIS) using Executive Information System (EIS)
Requirement gathering.
System analysis & design and prototype development.
System development and system testing.
System installation & configuration and user training.
3.1.4 Improvement of Computer Systems and Networks
Kiosk for public procurement.
Software tool to develop EIS procurement.
3.1.5 Management System for Internet and Intranet of the OTP
OTP’s main website promotion over the internet
Training administrator to update OTP’s main website.
Update and maintain OTP’s intranet system.
Over the course of the project, the consultants has operated with full capacity commitment. The project has progressed following each task in the order presented above and was completed in the period of the project. The details of the operations presented above are discussed in the next chapter.
Executive Summary Report Page 3-4
Transport Data and Model integrated with Multimodal Transport and Logistics (TDL)
PCBK / SEA-CONSULT / PTL
3.2 Improvement and maintenance of management information systems and geographic information systems (MIS/GIS)
This task consists of subtasks study and review of related projects, study and review of the existing database system and development of information systems to support information exchange standard with XML file format. A detailed discussion of each subtask is provided in the following sections.
3.2.1 Study and review of related projects
This subtask aims at making all parts of the development and maintenance of the transportation and traffic information database more efficient. The consultants have studied and reviewed the projects related to TDL. The results of the review process are to be used as guidelines in developing and applying a new system or improve the existing system to be more effective. It can also provide appropriate operational guidance to current and future enhancements or changes that may occur in the future. Above all else, it aims at responding directly to the goals and performance of the OTP. The results of this study are as follows.
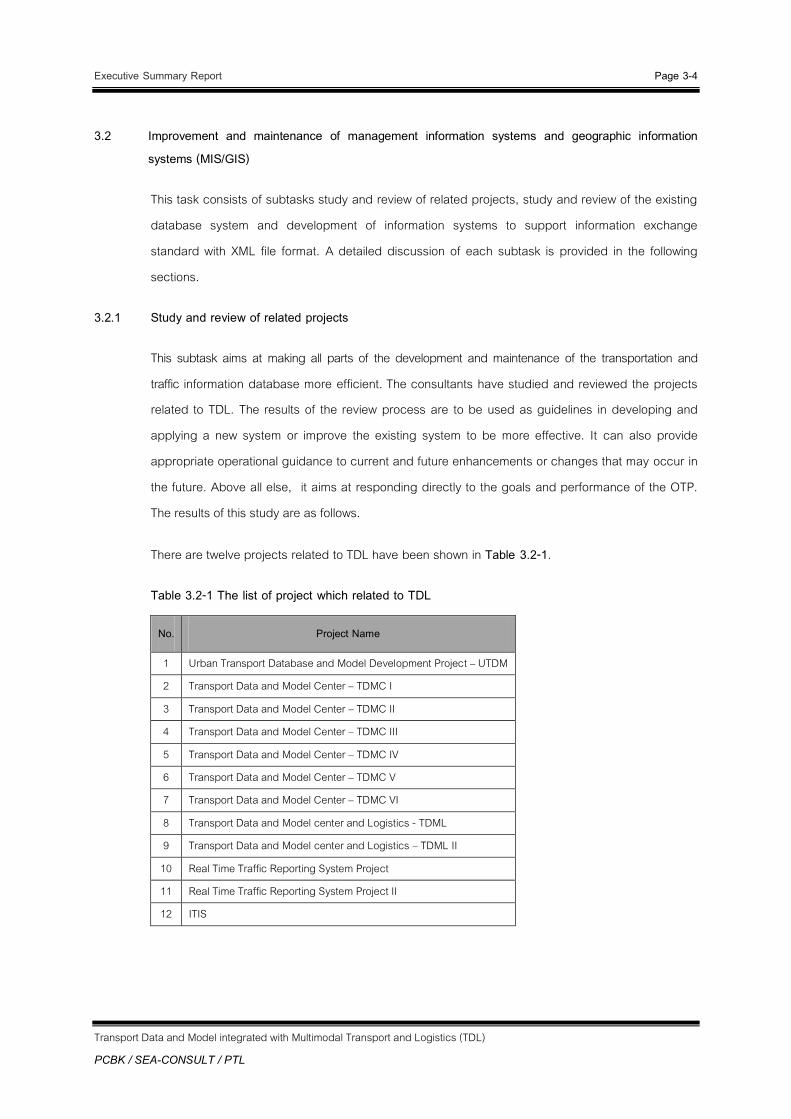
There are twelve projects related to TDL have been shown in Table 3.2-1.
Table 3.2-1 The list of project which related to TDL
No. Project Name
1 Urban Transport Database and Model Development Project – UTDM 2 Transport Data and Model Center – TDMC I
3 Transport Data and Model Center – TDMC II 4 Transport Data and Model Center – TDMC III
5 Transport Data and Model Center – TDMC IV 6 Transport Data and Model Center – TDMC V 7 Transport Data and Model Center – TDMC VI
8 Transport Data and Model center and Logistics - TDML 9 Transport Data and Model center and Logistics – TDML II
10 Real Time Traffic Reporting System Project 11 Real Time Traffic Reporting System Project II 12 ITIS

Executive Summary Report Page 3-5
Transport Data and Model integrated with Multimodal Transport and Logistics (TDL)
PCBK / SEA-CONSULT / PTL
3.2.2 Study and review of the existing database system
The consultants have studied and reviewed the database system from TDMC VI, TDML, and TDML II. The results are summarized as shown in Figure 3.2-1
Figure 3.2-1 Existing Database System of TDL
In TDML, the consultants have integrated MIS data from TDMC VI, Logistics data and Cube for reporting and data storage in database portal server.
Over the course of TDML II, the consultants have improved and developed inquiry system and public data system to reduce the workload on the MIS server machine that provides information to the inquiry system. The name of inquiry system was also changed to Transport and Traffic Information System. The Public data system was named Transportation and traffic data publishing system.

Executive Summary Report Page 3-6
Transport Data and Model integrated with Multimodal Transport and Logistics (TDL)
PCBK / SEA-CONSULT / PTL
3.2.3 Development of information systems to support information exchange standard with XML file format
Over the course of TDML II, the tools used to generate XML files have been developed based on two standards including a standard framework for data statXML and national standards for sharing information (Thailand e-Government Interoperability Framework : TH e-GIF). The standards enable the exchange of information between governmental organizations. To improve the XML generator features, the consultants have studied the standards for transportation and traffic data exchange from NECTEC called Traffic Information Service and Exchange Standard in TDL. The data exchange standards in TDL and related projects are shown in Figure 3.2-2.
Figure 3.2-2 Data Exchange Standards in TDL and related projects
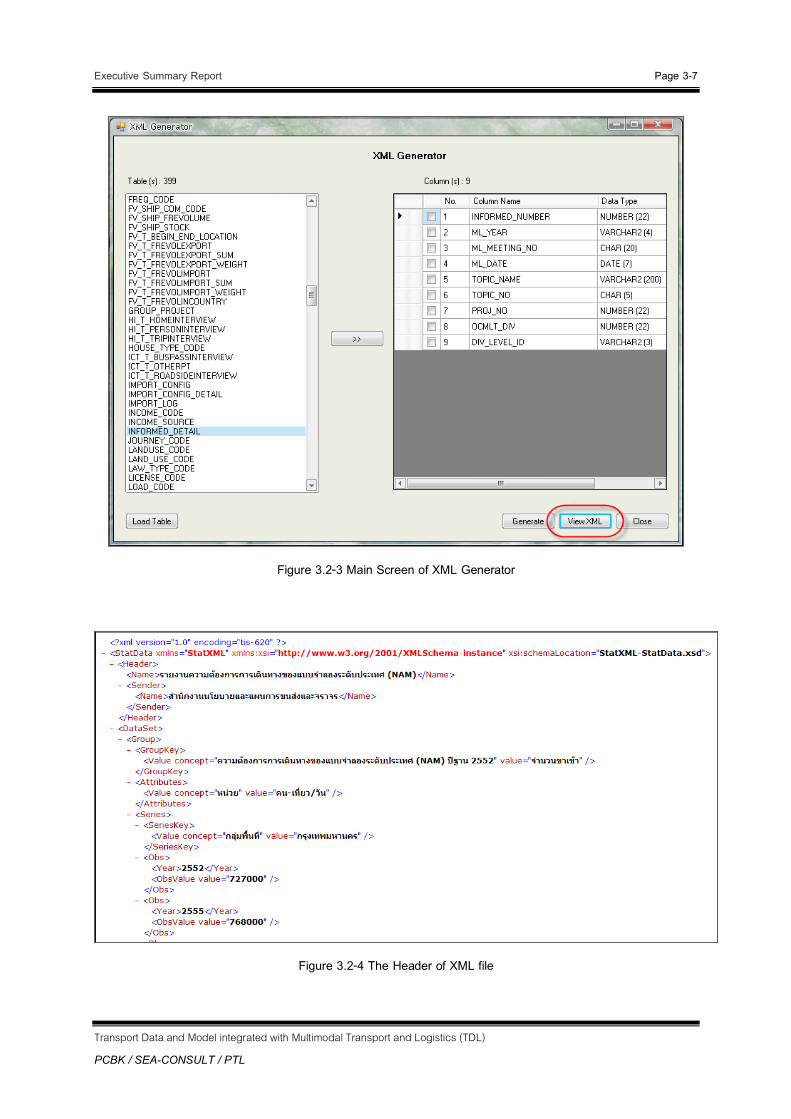
Based on the results of the study, the consultants have developed and improved the XML generator (XML Engine) used to distribute and exchange data between the organizations. The example screen and output file of the XML generator are shown in Figure 3.2-3 and Figure 3.2-4, respectively.
Executive Summary Report Page 3-7
Transport Data and Model integrated with Multimodal Transport and Logistics (TDL)
PCBK / SEA-CONSULT / PTL
Figure 3.2-3 Main Screen of XML Generator
Figure 3.2-4 The Header of XML file

Executive Summary Report Page 3-8
Transport Data and Model integrated with Multimodal Transport and Logistics (TDL)
PCBK / SEA-CONSULT / PTL
3.3 Development of Information Systems to Support Information Exchange Standard with XML File Format
3.3.1 Improving and updating information database
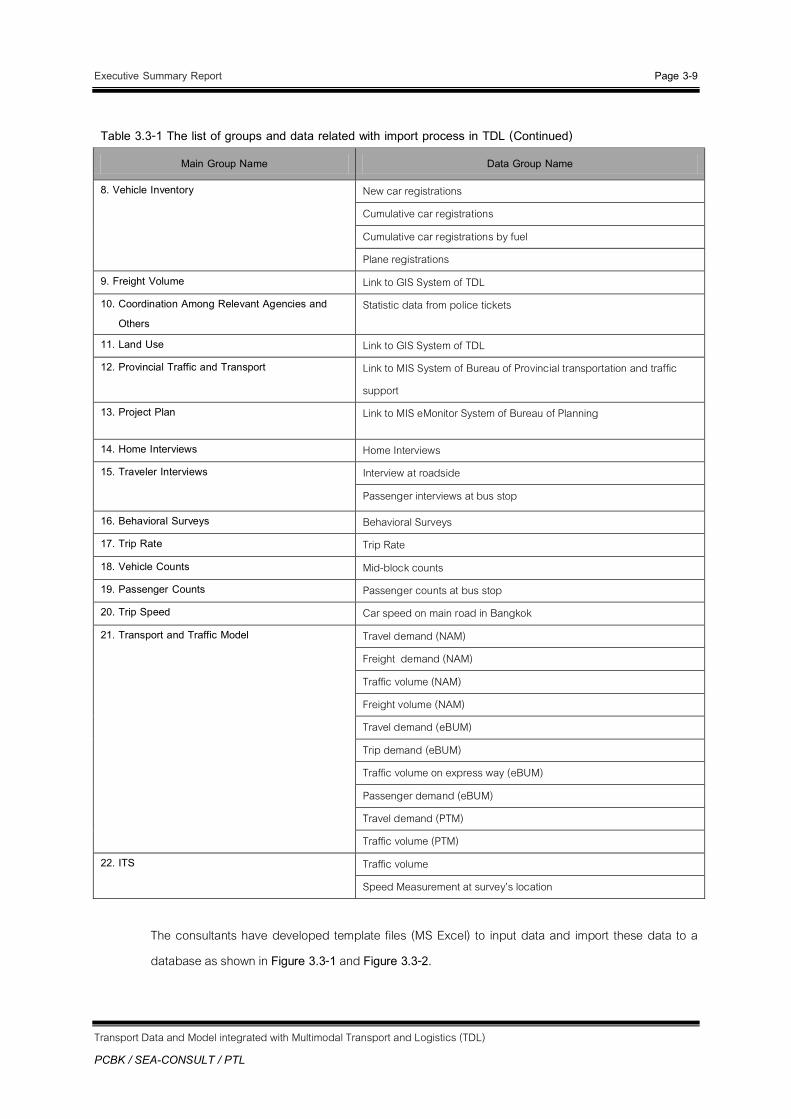
This task consists in updating the data and information contained in the database along with updating and maintaining information systems for transportation and traffic tasks. In TDL , the consultants have improved reports of the Transport and Traffic Information System which deal with data import process. The list of groups and data related with import process are shown in Table 3.3-1.
Table 3.3-1 The list of groups and data related with import process in TDL
Main Group Name Data Group Name
1. Fixed infrastructure Inventory Express way information Railway route and station information
Sky train route and station information (BTS) Subway route and station information (MRT)
General in formation of ground transport station Airport information
2. Schedule of Services Bus travel information (Link to http://www.bmta.co.th)
Coach Bus travel information (Link to http://www.transport.co.th) Train travel information (Link to http://www.railway.co.th)
Plane travel information (Link to http://www.airportthai.co.th) 3. Tourism Tourist accommodation information
International Tourist arrivals in Thailand 4. Accidents Statistics on road traffic accidents
Statistics on road traffic accidents by cause
Information on traffic regulations 5. Socio - Economics Census information
Employment information Average income per household
6. Transport Economics Total petroleum products consumption by economic sector Energy consumption for transport sector by mode
Gross National Product (GDP)
Gross Regional Product (GRP) Gross Provincial Product (GPP)
7. Environment Air pollution
Noise pollution
Executive Summary Report Page 3-9
Transport Data and Model integrated with Multimodal Transport and Logistics (TDL)
PCBK / SEA-CONSULT / PTL
Table 3.3-1 The list of groups and data related with import process in TDL (Continued)
Main Group Name Data Group Name
8. Vehicle Inventory New car registrations Cumulative car registrations
Cumulative car registrations by fuel Plane registrations
9. Freight Volume Link to GIS System of TDL 10. Coordination Among Relevant Agencies and
Others Statistic data from police tickets
11. Land Use Link to GIS System of TDL 12. Provincial Traffic and Transport Link to MIS System of Bureau of Provincial transportation and traffic
support 13. Project Plan Link to MIS eMonitor System of Bureau of Planning
14. Home Interviews Home Interviews 15. Traveler Interviews Interview at roadside
Passenger interviews at bus stop
16. Behavioral Surveys Behavioral Surveys 17. Trip Rate Trip Rate 18. Vehicle Counts Mid-block counts 19. Passenger Counts Passenger counts at bus stop 20. Trip Speed Car speed on main road in Bangkok 21. Transport and Traffic Model Travel demand (NAM)
Freight demand (NAM)
Traffic volume (NAM) Freight volume (NAM) Travel demand (eBUM)
Trip demand (eBUM) Traffic volume on express way (eBUM)
Passenger demand (eBUM) Travel demand (PTM) Traffic volume (PTM)
22. ITS Traffic volume Speed Measurement at survey’s location
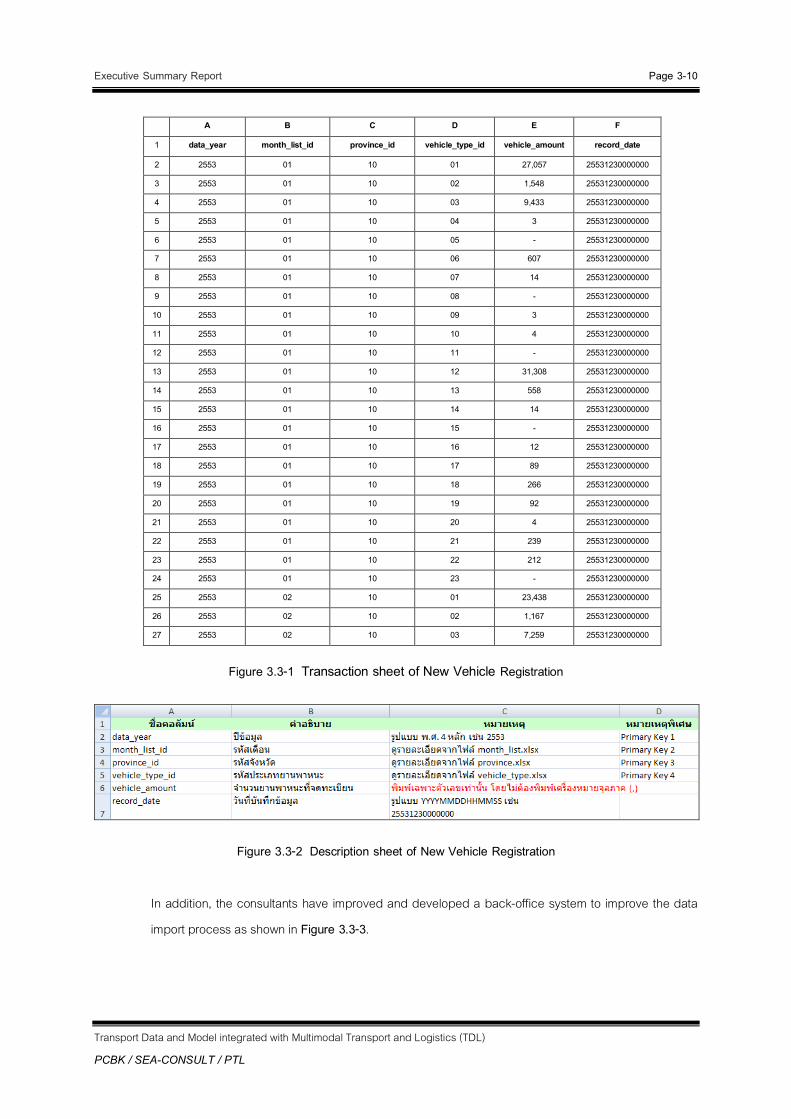
The consultants have developed template files (MS Excel) to input data and import these data to a database as shown in Figure 3.3-1 and Figure 3.3-2.
Executive Summary Report Page 3-10
Transport Data and Model integrated with Multimodal Transport and Logistics (TDL)
PCBK / SEA-CONSULT / PTL
Figure 3.3-1 Transaction sheet of New Vehicle Registration
Figure 3.3-2 Description sheet of New Vehicle Registration
In addition, the consultants have improved and developed a back-office system to improve the data import process as shown in Figure 3.3-3.
A B C D E F
1 data_year month_list_id province_id vehicle_type_id vehicle_amount record_date
2 2553 01 10 01 27,057 25531230000000
3 2553 01 10 02 1,548 25531230000000
4 2553 01 10 03 9,433 25531230000000
5 2553 01 10 04 3 25531230000000
6 2553 01 10 05 - 25531230000000
7 2553 01 10 06 607 25531230000000
8 2553 01 10 07 14 25531230000000
9 2553 01 10 08 - 25531230000000
10 2553 01 10 09 3 25531230000000
11 2553 01 10 10 4 25531230000000
12 2553 01 10 11 - 25531230000000
13 2553 01 10 12 31,308 25531230000000
14 2553 01 10 13 558 25531230000000
15 2553 01 10 14 14 25531230000000
16 2553 01 10 15 - 25531230000000
17 2553 01 10 16 12 25531230000000
18 2553 01 10 17 89 25531230000000
19 2553 01 10 18 266 25531230000000
20 2553 01 10 19 92 25531230000000
21 2553 01 10 20 4 25531230000000
22 2553 01 10 21 239 25531230000000
23 2553 01 10 22 212 25531230000000
24 2553 01 10 23 - 25531230000000
25 2553 02 10 01 23,438 25531230000000
26 2553 02 10 02 1,167 25531230000000
27 2553 02 10 03 7,259 25531230000000

Executive Summary Report Page 3-11
Transport Data and Model integrated with Multimodal Transport and Logistics (TDL)
PCBK / SEA-CONSULT / PTL
Figure 3.3-3 Back-Office System
Executive Summary Report Page 3-12
Transport Data and Model integrated with Multimodal Transport and Logistics (TDL)
PCBK / SEA-CONSULT / PTL
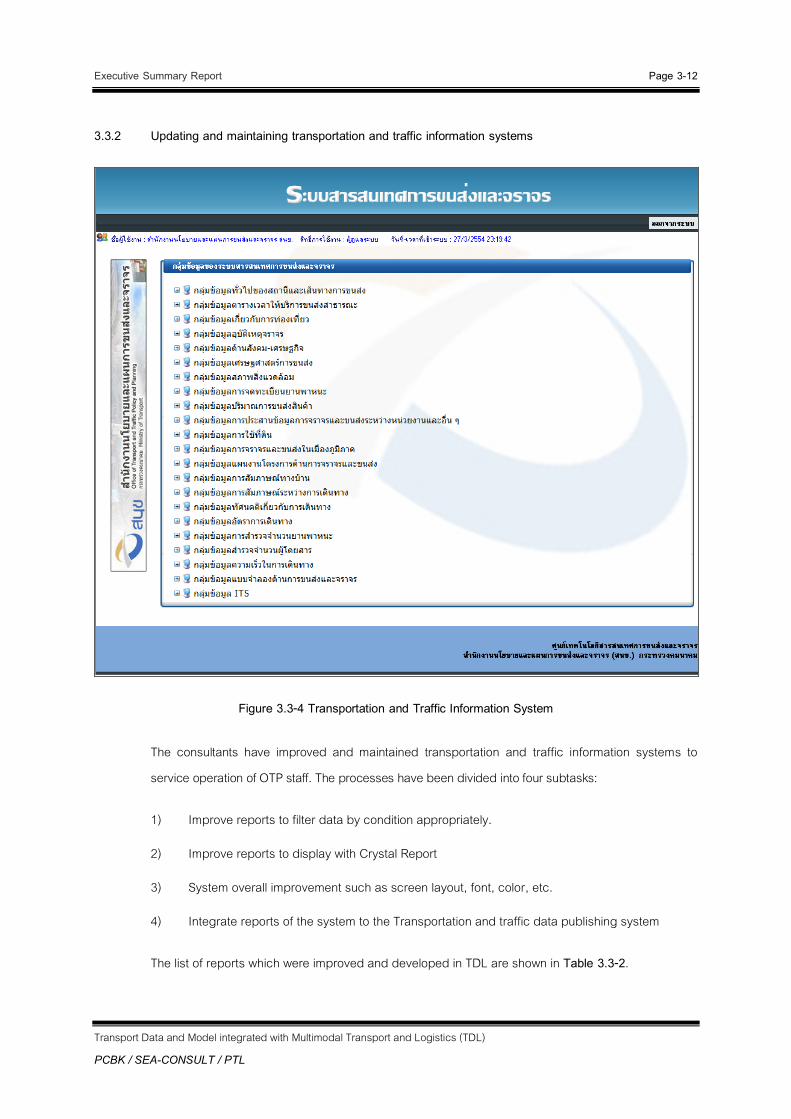
3.3.2 Updating and maintaining transportation and traffic information systems
Figure 3.3-4 Transportation and Traffic Information System
The consultants have improved and maintained transportation and traffic information systems to service operation of OTP staff. The processes have been divided into four subtasks:
1) Improve reports to filter data by condition appropriately.
2) Improve reports to display with Crystal Report
3) System overall improvement such as screen layout, font, color, etc.
4) Integrate reports of the system to the Transportation and traffic data publishing system
The list of reports which were improved and developed in TDL are shown in Table 3.3-2.

Executive Summary Report Page 3-13
Transport Data and Model integrated with Multimodal Transport and Logistics (TDL)
PCBK / SEA-CONSULT / PTL
Table 3.3-2 The list of reports which were improved and developed in TDL
Main Group Name Repot Name
1. Fixed infrastructure Inventory Express way information Railway route and station information
Sky train route and station information (BTS) Subway route and station information (MRT)
General in formation of ground transport station Airport information
2. Schedule of Services Bus travel information (Link to http://www.bmta.co.th)
Coach Bus travel information (Link to http://www.transport.co.th)
Train travel information (Link to http://www.railway.co.th) Plane travel information (Link to http://www.airportthai.co.th)
3. Tourism Tourist accommodation information
International Tourist arrivals in Thailand 4. Accidents Statistics on road traffic accidents
Statistics on road traffic accidents by cause
Information on traffic regulations 5. Socio - Economics Census information
Employment information Average income per household
6. Transport Economics Total petroleum products consumption by economic sector Energy consumption for transport sector by mode
Gross National Product (GDP)
Gross Regional Product (GRP) Gross Provincial Product (GPP)
7. Environment Air pollution
Noise pollution 8. Vehicle Inventory New car registrations
Cumulative car registrations Cumulative car registrations by fuel Plane registrations
9. Freight Volume Link to GIS System of TDL 10. Coordination Among Relevant Agencies and Others Statistic data from police tickets 11. Land Use Link to GIS System of TDL 12. Provincial Traffic and Transport Link to MIS System of Bureau of Provincial transportation and traffic support

Executive Summary Report Page 3-14
Transport Data and Model integrated with Multimodal Transport and Logistics (TDL)
PCBK / SEA-CONSULT / PTL
Table 3.3-2 The list of reports which were improved and developed in TDL (Continued)
Main Group Name Repot Name
13. Project Plan Link to MIS eMonitor System of Bureau of Planning
14. Home Interviews Home Interviews 15. Traveler Interviews Interview at roadside
Passenger interviews at bus stop
16. Behavioral Surveys Behaviroal Surveys 17. Trip Rate Trip Rate 18. Vehicle Counts Mid-block counts 19. Passenger Counts Passenger counts at bus stop 20. Trip Speed Car speed on main road in Bangkok 21. Transport and Traffic Model Travel demand (NAM)
Freight demand (NAM)
Traffic volume (NAM) Freight volume (NAM) Travel demand (eBUM)
Trip demand (eBUM) Traffic volume on express way (eBUM)
Passenger demand (eBUM) Travel demand (PTM) Traffic volume (PTM)
22. ITS Traffic volume Speed Measurement at survey’s location
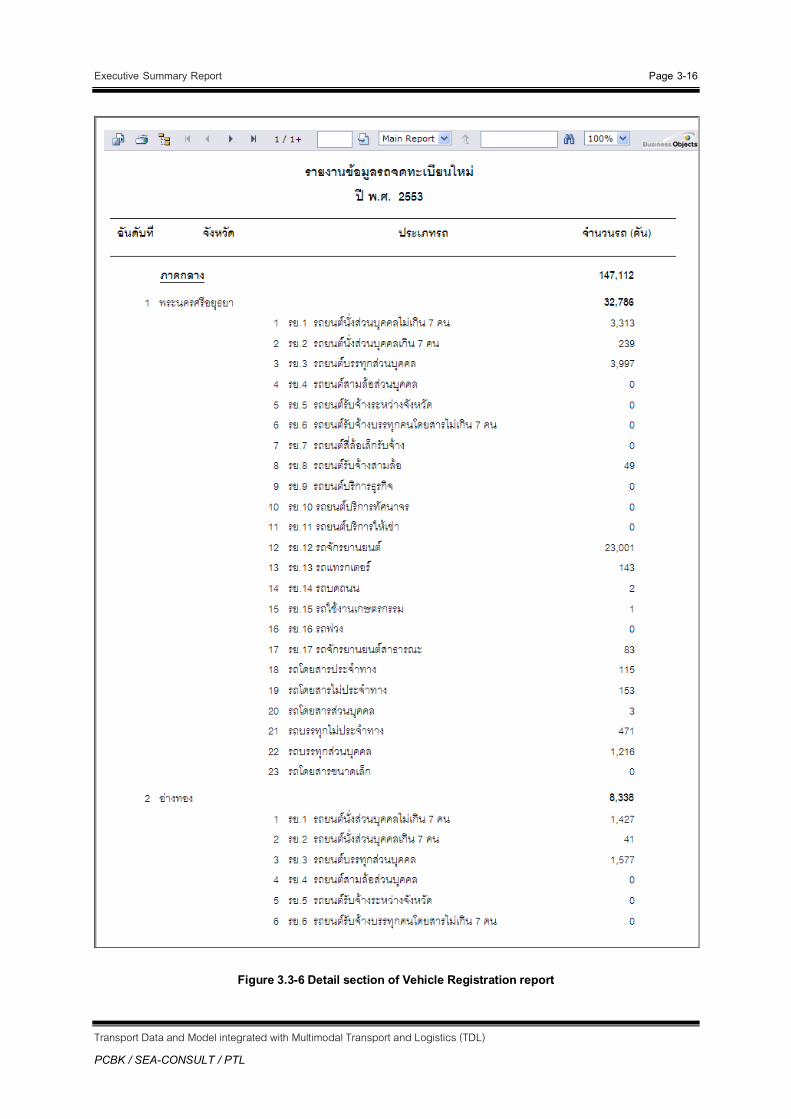
An example of reports which were improved and developed in TDL is presented below.

Executive Summary Report Page 3-15
Transport Data and Model integrated with Multimodal Transport and Logistics (TDL)
PCBK / SEA-CONSULT / PTL
Group 8 : Vehicle Registration report
Figure 3.3-5 Overview section of Vehicle Registration report
Executive Summary Report Page 3-16
Transport Data and Model integrated with Multimodal Transport and Logistics (TDL)
PCBK / SEA-CONSULT / PTL
Figure 3.3-6 Detail section of Vehicle Registration report

Executive Summary Report Page 3-17
Transport Data and Model integrated with Multimodal Transport and Logistics (TDL)
PCBK / SEA-CONSULT / PTL
Figure 3.3-7 Top Order’s Graph of Vehicle Registration report
Figure 3.3-8 Trend & Comparison Graph of Vehicle Registration report
Executive Summary Report Page 3-18
Transport Data and Model integrated with Multimodal Transport and Logistics (TDL)
PCBK / SEA-CONSULT / PTL
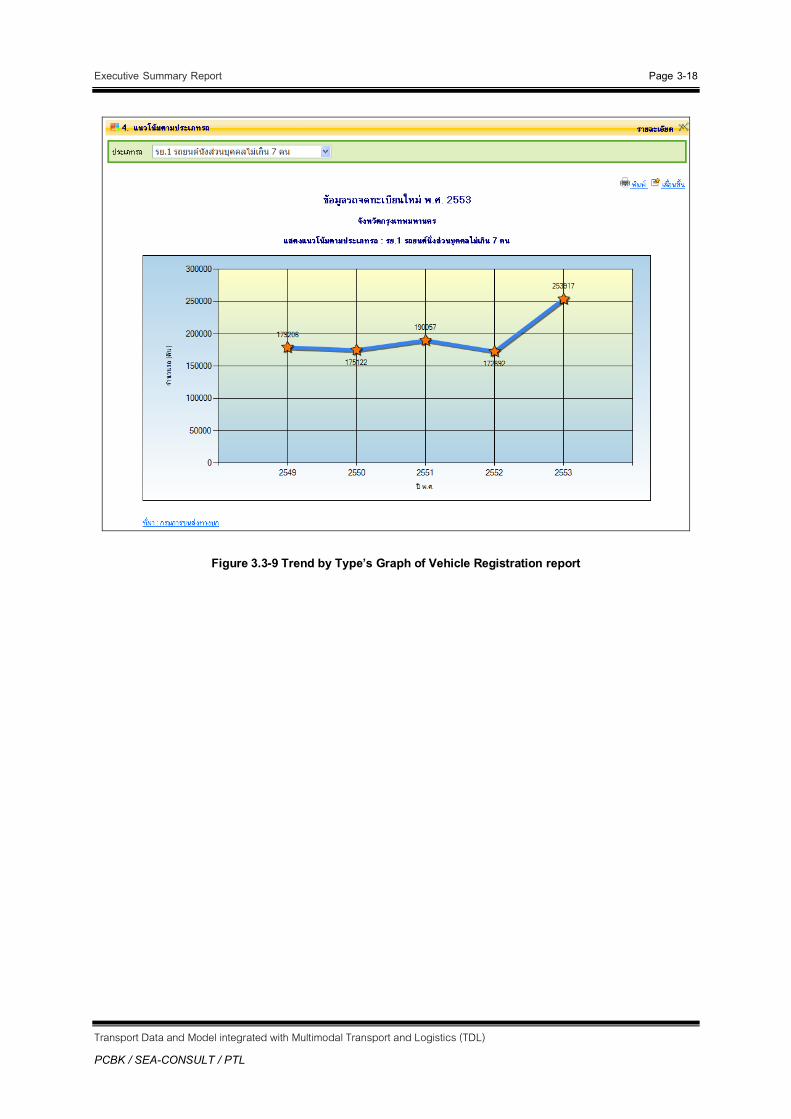
Figure 3.3-9 Trend by Type’s Graph of Vehicle Registration report

Executive Summary Report Page 3-19
Transport Data and Model integrated with Multimodal Transport and Logistics (TDL)
PCBK / SEA-CONSULT / PTL
3.3.3 Improvement and maintenance of the Transportation and traffic data publishing system
Figure 3.3-10 Transportation and traffic data publishing system
The consultants have collected reports and data files to be distributed in the transportation and traffic data publishing system including TDL’s final report, Annual Report, eBook and other knowledge files related to transportation and traffic. Files or data in server can be downloaded by users for studies regarding transportation and traffic.
Executive Summary Report Page 3-20
Transport Data and Model integrated with Multimodal Transport and Logistics (TDL)
PCBK / SEA-CONSULT / PTL
3.3.4 Preparation of electronic books
The consultants has prepared and created eBooks in the format that can be executed without other
support software installation (*.EXE). The tools to develop eBooks is Desktop Author which is procured
in TDML II.
Once the process of developing eBooks was completed, the consultants have distributed them in the transportation and traffic data publishing system. The list of reports which were converted to eBook are shown below.
Final Report
Executive Summary Report - Thai
Executive Summary Report - English
Information Technology for Executive
Summary of Transportation and Traffic Information
Executive Summary Report Page 3-21
Transport Data and Model integrated with Multimodal Transport and Logistics (TDL)
PCBK / SEA-CONSULT / PTL
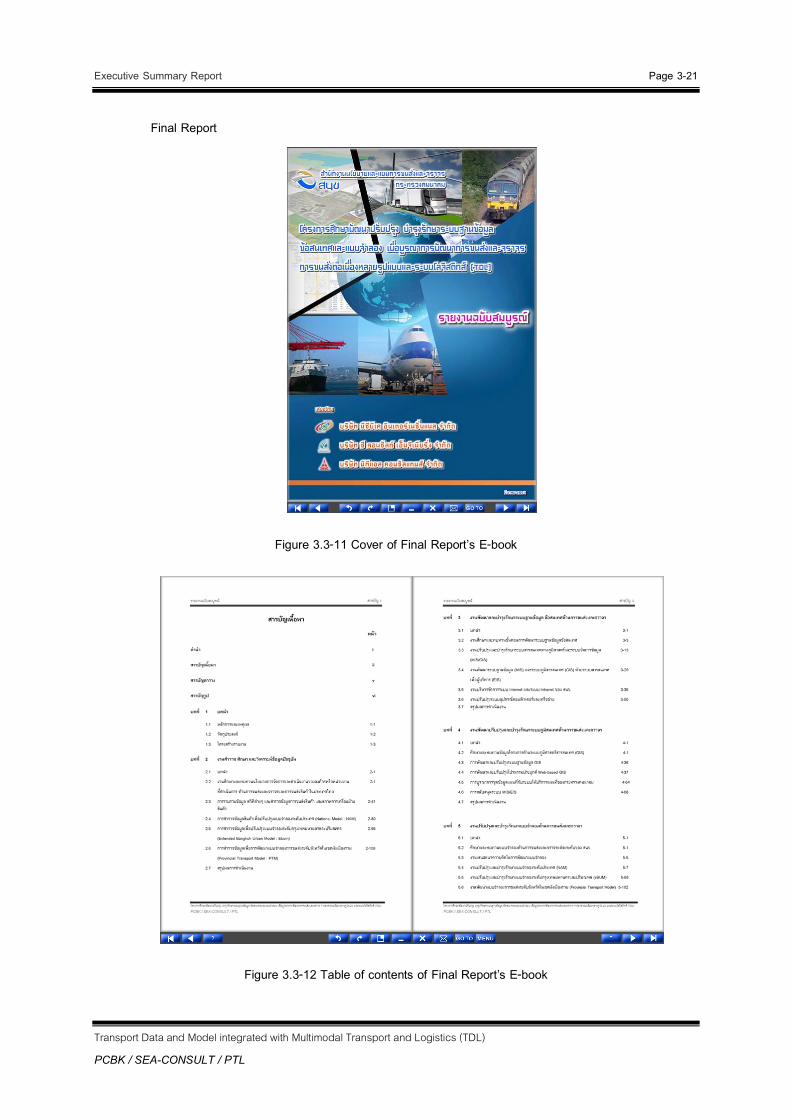
Final Report
Figure 3.3-11 Cover of Final Report’s E-book
Figure 3.3-12 Table of contents of Final Report’s E-book
Executive Summary Report Page 3-22
Transport Data and Model integrated with Multimodal Transport and Logistics (TDL)
PCBK / SEA-CONSULT / PTL
Executive Summary Report - Thai
Figure 3.3-13 Cover of Executive Summary Report – Thai ’s E-book
Figure 3.3-14 Table of contents of Executive Summary Report – Thai ’s E-book
Executive Summary Report Page 3-23
Transport Data and Model integrated with Multimodal Transport and Logistics (TDL)
PCBK / SEA-CONSULT / PTL
Executive Summary Report - English
Figure 3.3-15 Cover of Executive Summary Report – English ’s E-book
Figure 3.3-16 Table of contents of Executive Summary Report – English’s E-book

Executive Summary Report Page 3-24
Transport Data and Model integrated with Multimodal Transport and Logistics (TDL)
PCBK / SEA-CONSULT / PTL
3.4 Development of Management Information System (MIS) and Geographic Information Systems (GIS) using Executive Information System (EIS)
Figure 3.4-1 Main Page of Executive Information System (EIS)
In the TDL project, the Executive Information System or ‚EIS‛ is an important system to develop since the EIS has the purpose of serving the executive’s need of special information by summarizing and synthesizing the input from management information systems and other operational information systems. In the executive information system development process, the consultant has used ‚Pentaho‛, one of the most popular open-source softwares for EIS development, to develop and implement the project.
The consultant has developmented processes as follows:
1) Requirement gathering.
2) Requirement analysis and system design.
3) System implementation.
4) System testing and training.

Executive Summary Report Page 3-25
Transport Data and Model integrated with Multimodal Transport and Logistics (TDL)
PCBK / SEA-CONSULT / PTL
To ensure that the system can serve the executive’s need, the consultant and OTP representatives plan and conduct an executive interview to get the best results and feedbacks. After analyzing the feedbacks, the consultant develops the system and provides presentations to OTP representatives to ensure that all functions and designs are set up in a way that provides efficiency to the project.
Even though, the EIS in TDL is set as a pilot project, the consultant has developed most of the important and necessary functions to best serve future projects. The data import module has been built to cope with many data formats from each department. The report, display, and design are developed by focusing on the user‘s requirements. Therefore, the system will be able to operate in real-time and serve more and special needs if all information from all departments are integrated in an appropriate way of system design and development.
3.5 Management System for Internet and Intranet of the OTP
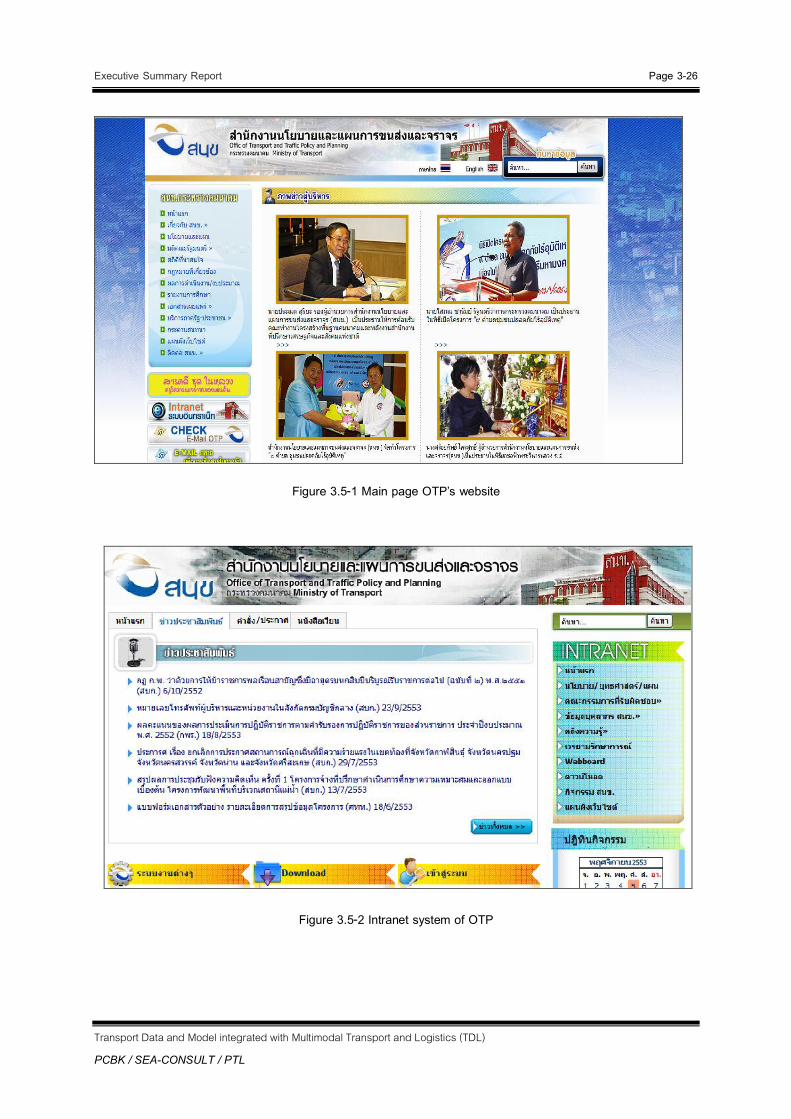
In order for visitors to be able to most easily access the OTP’s website, the consultant has customized the website to meet the visitors’ requirements. In the development process, the consultant has restructured the template for a new look and display as well as redesigned banners for information access purposes. For advertising process, the consultant has used a ‚Search Engine Optimization‛ process to attract visitors from Google using 19 keywords of the top 10 rank which also provides increasing visitors and trust to the website.
Intranet has been implemented to serve OTP’s executives’ and officers’ needs in their daily assignments. The consultant has developed intranet using a ‚Content Management System‛ in order to have the system administrator manage the system easily and effectively.
Executive Summary Report Page 3-26
Transport Data and Model integrated with Multimodal Transport and Logistics (TDL)
PCBK / SEA-CONSULT / PTL
Figure 3.5-1 Main page OTP’s website
Figure 3.5-2 Intranet system of OTP

Executive Summary Report Page 3-27
Transport Data and Model integrated with Multimodal Transport and Logistics (TDL)
PCBK / SEA-CONSULT / PTL
3.6 Improvement of Computer Systems and Networks
The consultant has also improved the computer and network systems with the following tasks:
1) Implement an intelligent kiosk for advertising.
The consultant has provided the intelligent kiosk with management software since July 20th, 2010. All requirements in terms of context and content are developed and deployed after OTP’s approval.
2) Acquire a software and hardware to develop OTP executive information system.
The consultant has provided software and hardware to develop and support OTP executive information system and management information system as follows:
3) A set of Microsoft Visual Studio 2010.
4) 16 pieces of 2.5‛ external hard disk with 1 TB
5) Set up the intelligent kiosk.
The consultant already installed the kiosk on July 20th, 2010.
Figure 3.6-1 Main page of Kiosk

Executive Summary Report Page 3-28
Transport Data and Model integrated with Multimodal Transport and Logistics (TDL)
PCBK / SEA-CONSULT / PTL
Figure 3.6-2 E-Book Page
CCHHAAPPTTEERR 44
GGIISS DDAATTAABBAASSEE SSYYSSTTEEMM DDEEVVEELLOOPPMMEENNTT
Executive Summary Report Page 4-1
Transport Data and Model Integrated with Multimodal Transport and Logistics (TDML II) PCBK / SEA-CONSULT
CCHHAAPPTTEERR 44 GGIISS DDAATTAABBAASSEE SSYYSSTTEEMM DDEEVVEELLOOPPMMEENNTT
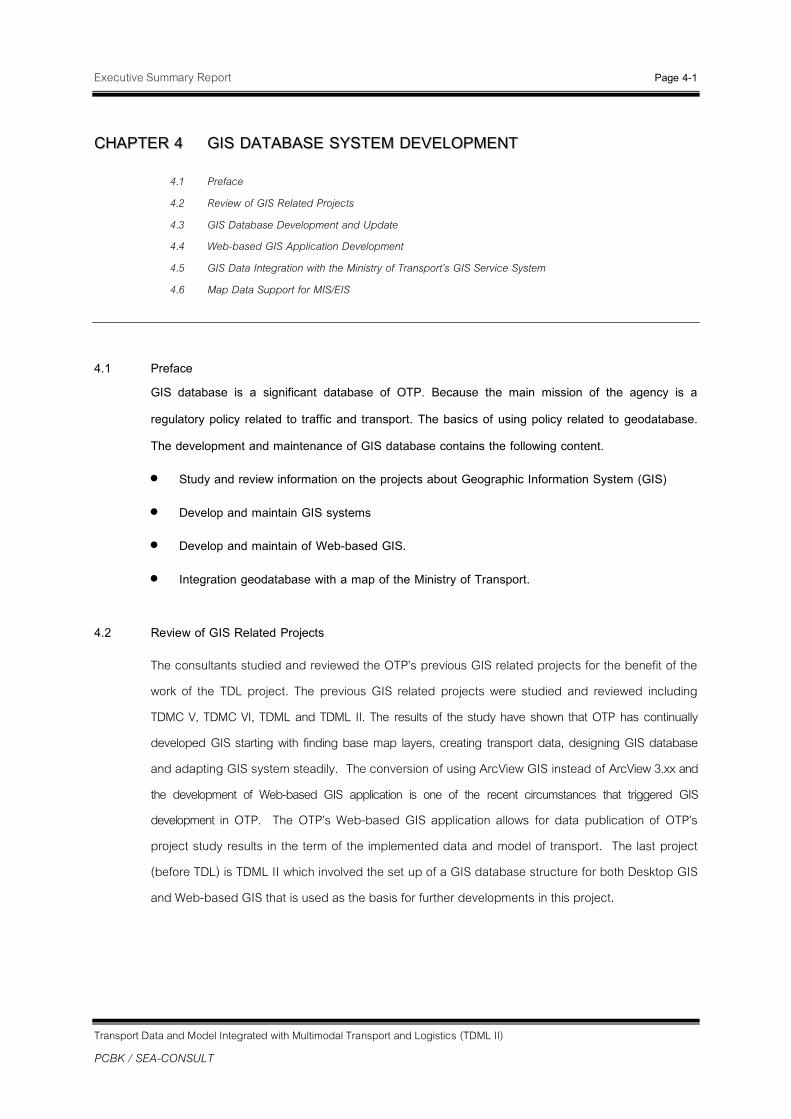
4.1 Preface 4.2 Review of GIS Related Projects 4.3 GIS Database Development and Update 4.4 Web-based GIS Application Development 4.5 GIS Data Integration with the Ministry of Transport’s GIS Service System 4.6 Map Data Support for MIS/EIS
4.1 Preface
GIS database is a significant database of OTP. Because the main mission of the agency is a
regulatory policy related to traffic and transport. The basics of using policy related to geodatabase.
The development and maintenance of GIS database contains the following content.
Study and review information on the projects about Geographic Information System (GIS)
Develop and maintain GIS systems
Develop and maintain of Web-based GIS.
Integration geodatabase with a map of the Ministry of Transport.
4.2 Review of GIS Related Projects
The consultants studied and reviewed the OTP’s previous GIS related projects for the benefit of the work of the TDL project. The previous GIS related projects were studied and reviewed including TDMC V, TDMC VI, TDML and TDML II. The results of the study have shown that OTP has continually developed GIS starting with finding base map layers, creating transport data, designing GIS database and adapting GIS system steadily. The conversion of using ArcView GIS instead of ArcView 3.xx and the development of Web-based GIS application is one of the recent circumstances that triggered GIS development in OTP. The OTP’s Web-based GIS application allows for data publication of OTP’s project study results in the term of the implemented data and model of transport. The last project (before TDL) is TDML II which involved the set up of a GIS database structure for both Desktop GIS and Web-based GIS that is used as the basis for further developments in this project.
Executive Summary Report Page 4-2
Transport Data and Model Integrated with Multimodal Transport and Logistics (TDML II) PCBK / SEA-CONSULT
4.3 GIS Database Development and Update
The consultants have developed and updated a GIS database which was created from TDML II. Such database, which is updated through this project, consists of 13 data sets:
1) Fixed Infrastructure Inventory
2) Schedule of Services
3) Accident Rate Data
4) Socio-Economic Data
5) Transport Economics
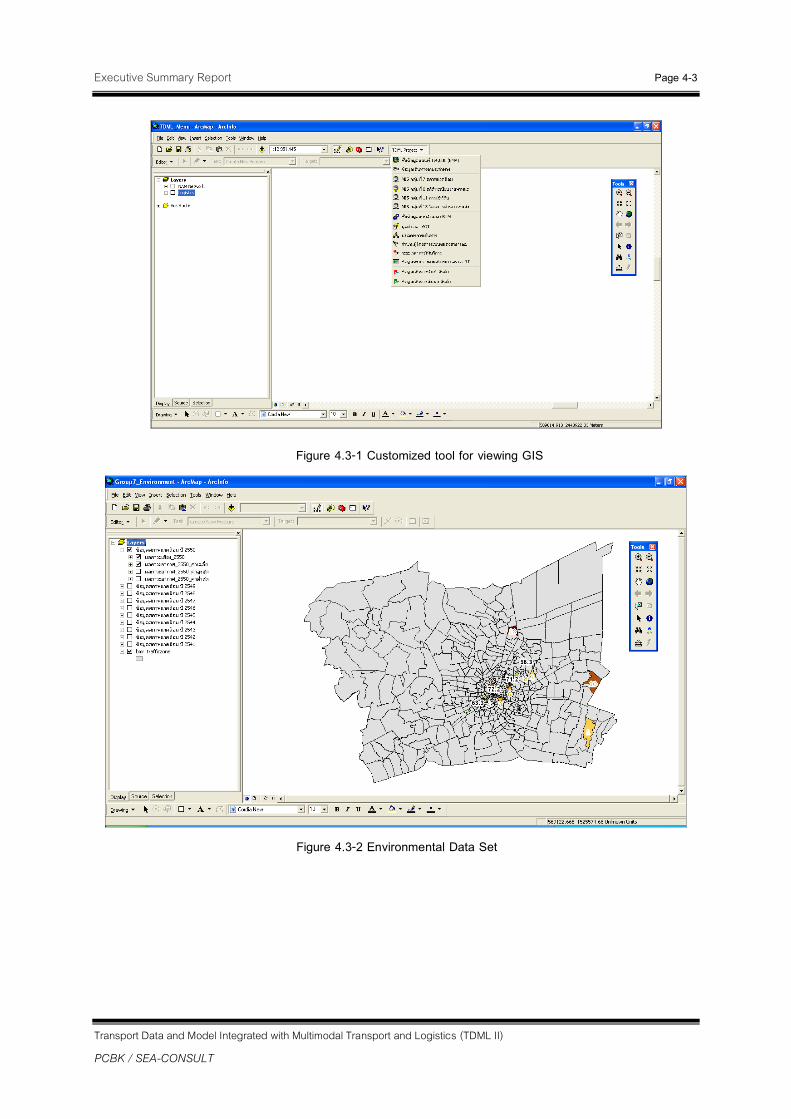
6) Environmental Data
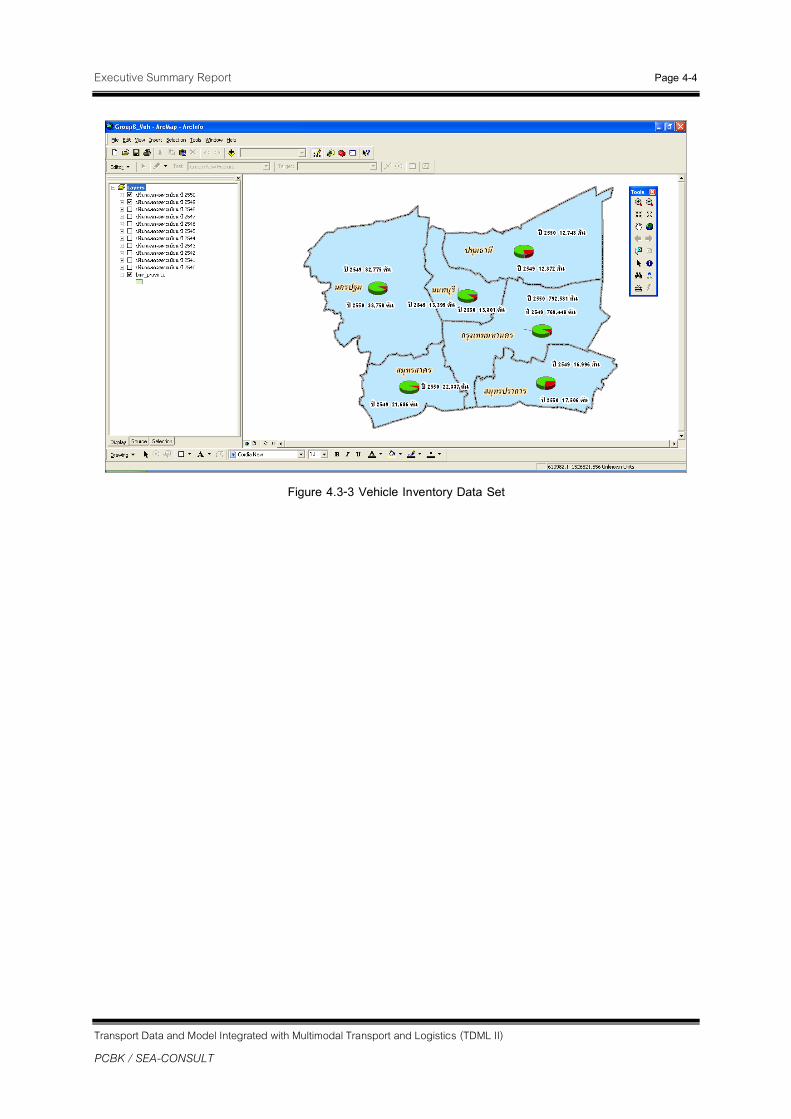
7) Vehicle Inventory Data
8) Land Use
9) Transport Programs and Projects
10) Trip Rate
11) Vehicle Count
12) Passenger Car Count
13) Travel Time / Delay
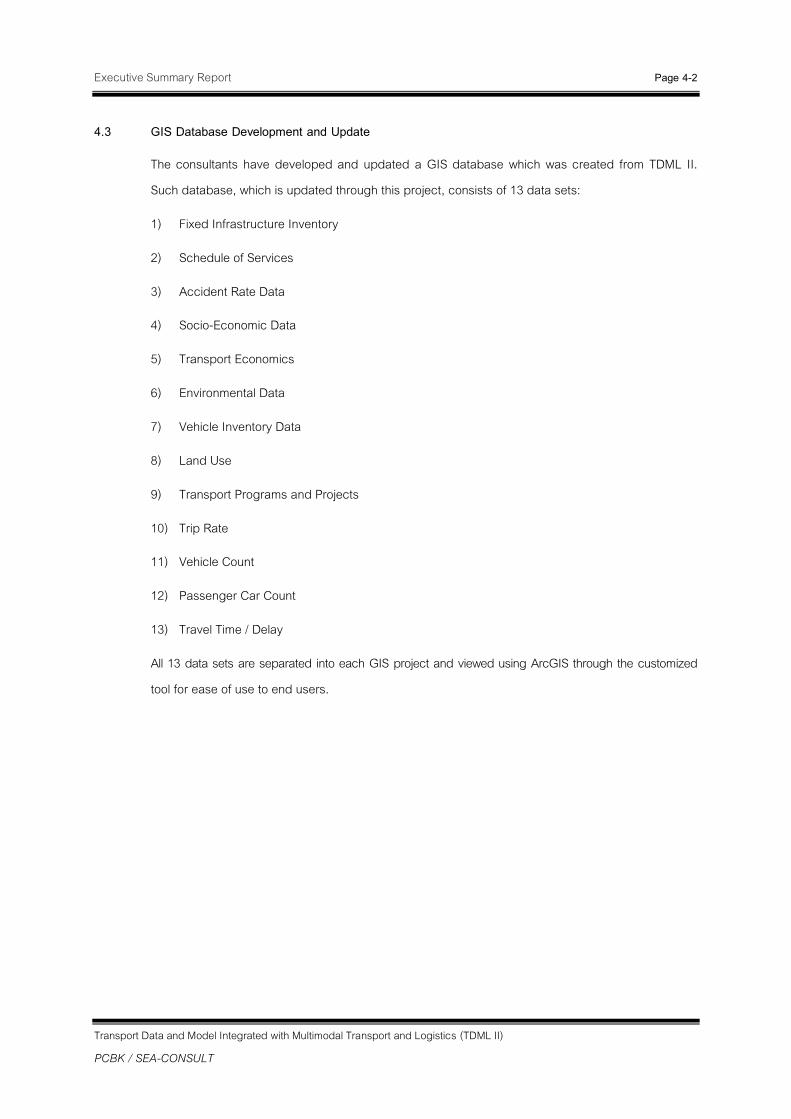
All 13 data sets are separated into each GIS project and viewed using ArcGIS through the customized tool for ease of use to end users.
Executive Summary Report Page 4-3
Transport Data and Model Integrated with Multimodal Transport and Logistics (TDML II) PCBK / SEA-CONSULT
Figure 4.3-1 Customized tool for viewing GIS
Figure 4.3-2 Environmental Data Set
Executive Summary Report Page 4-4
Transport Data and Model Integrated with Multimodal Transport and Logistics (TDML II) PCBK / SEA-CONSULT
Figure 4.3-3 Vehicle Inventory Data Set
Executive Summary Report Page 4-5
Transport Data and Model Integrated with Multimodal Transport and Logistics (TDML II) PCBK / SEA-CONSULT
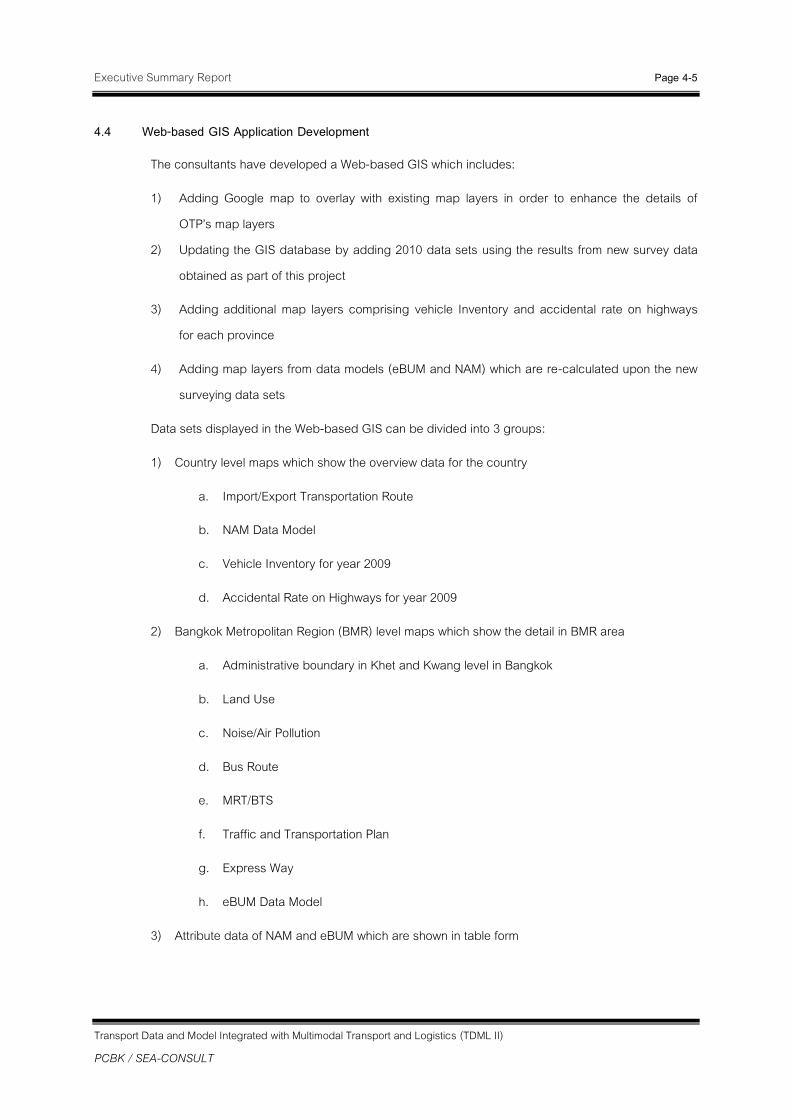
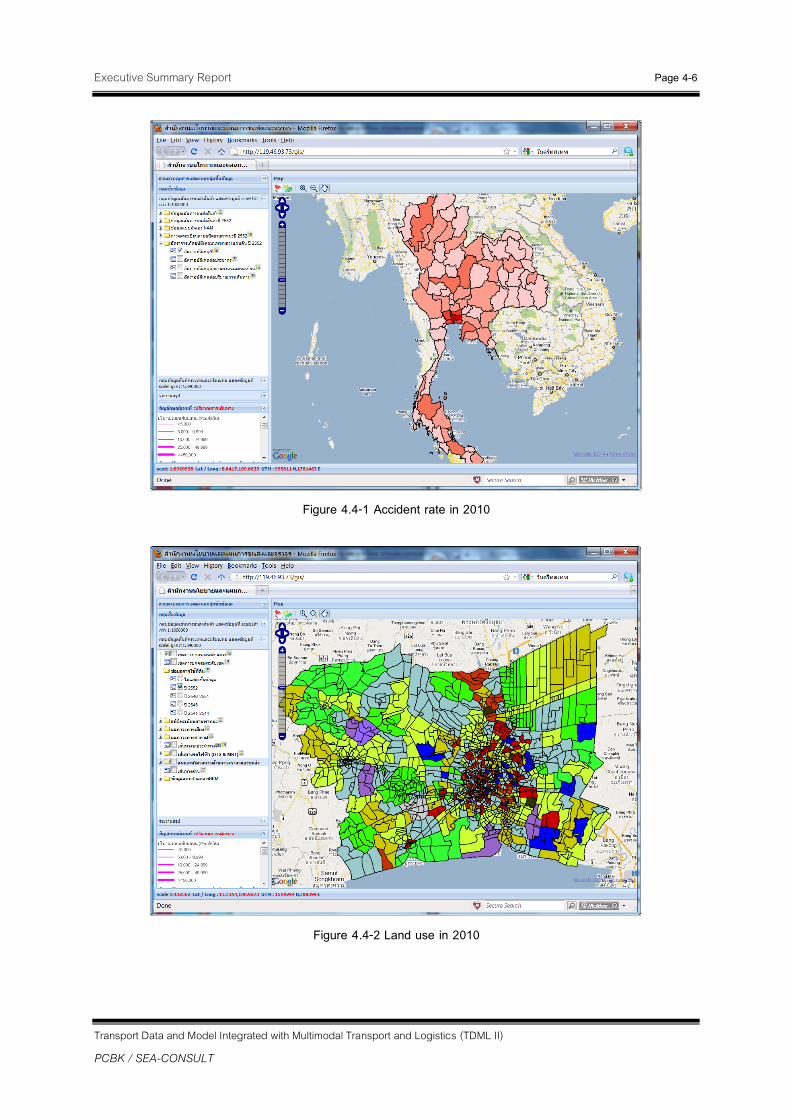
4.4 Web-based GIS Application Development
The consultants have developed a Web-based GIS which includes:
1) Adding Google map to overlay with existing map layers in order to enhance the details of OTP’s map layers
2) Updating the GIS database by adding 2010 data sets using the results from new survey data obtained as part of this project
3) Adding additional map layers comprising vehicle Inventory and accidental rate on highways for each province
4) Adding map layers from data models (eBUM and NAM) which are re-calculated upon the new surveying data sets
Data sets displayed in the Web-based GIS can be divided into 3 groups:
1) Country level maps which show the overview data for the country
a. Import/Export Transportation Route
b. NAM Data Model
c. Vehicle Inventory for year 2009
d. Accidental Rate on Highways for year 2009
2) Bangkok Metropolitan Region (BMR) level maps which show the detail in BMR area
a. Administrative boundary in Khet and Kwang level in Bangkok
b. Land Use
c. Noise/Air Pollution
d. Bus Route
e. MRT/BTS
f. Traffic and Transportation Plan
g. Express Way
h. eBUM Data Model
3) Attribute data of NAM and eBUM which are shown in table form
Executive Summary Report Page 4-6
Transport Data and Model Integrated with Multimodal Transport and Logistics (TDML II) PCBK / SEA-CONSULT
Figure 4.4-1 Accident rate in 2010
Figure 4.4-2 Land use in 2010

Executive Summary Report Page 4-7
Transport Data and Model Integrated with Multimodal Transport and Logistics (TDML II) PCBK / SEA-CONSULT
4.5 GIS Data Integration with GIS Service System of Ministry of Transport’s GIS Service System
The Consultants have studied and developed data to be integrated in the GIS system of the Office of the Permanent Secretary, Ministry of transport. ArcGIS Explorer is used for viewing shared data sets. The supporting data sharing to ArcGIS Explorer consist of 1) 3D model of OTP’s office building and 2) BTS routes. Besides, the consultants have also developed a WMS to distribute mapping data sets which reside in the Web-based GIS.
Figure 4.5-1 3-D model of OTP’s building
Figure 4.5-2 3-D model of BTS skytrain
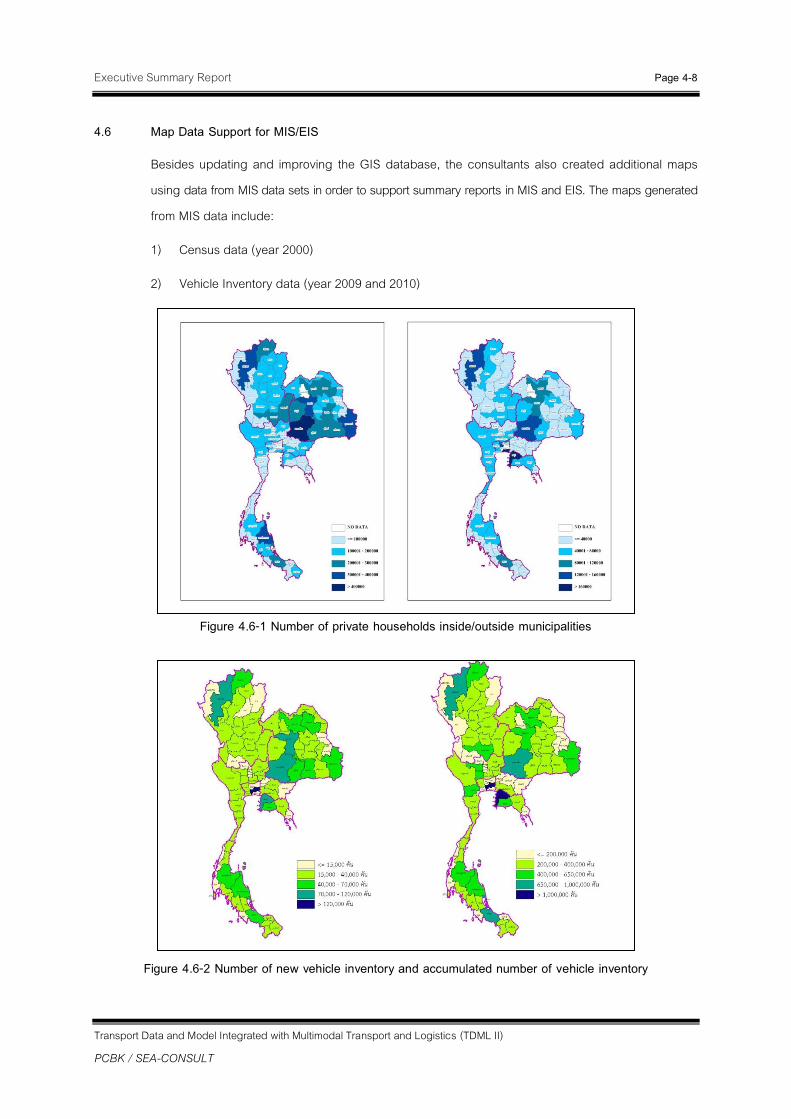
Executive Summary Report Page 4-8
Transport Data and Model Integrated with Multimodal Transport and Logistics (TDML II) PCBK / SEA-CONSULT
4.6 Map Data Support for MIS/EIS
Besides updating and improving the GIS database, the consultants also created additional maps using data from MIS data sets in order to support summary reports in MIS and EIS. The maps generated from MIS data include:
1) Census data (year 2000)
2) Vehicle Inventory data (year 2009 and 2010)
Figure 4.6-1 Number of private households inside/outside municipalities
Figure 4.6-2 Number of new vehicle inventory and accumulated number of vehicle inventory
CCHHAAPPTTEERR 55 TTRRAANNSSPPOORRTTAATTIIOONN AANNDD TTRRAAFFFFIICC MMOODDEELL
IIMMPPRROOVVEEMMEENNTT AANNDD MMAAIINNTTEENNAANNCCEE
Executive Summary Report Page 5-1
Transport Data and Model integrated with Multimodal Transport and Logistics (TDL)
PCBK / SEA-CONSULT / PTL
CCHHAAPPTTEERR 55 TTRRAANNSSPPOORRTTAATTIIOONN AANNDD TTRRAAFFFFIICC MMOODDEELL IIMMPPRROOVVEEMMEENNTTSS AANNDD
MMAAIINNTTEENNAANNCCEE
5.1 Preface 5.2 Review of the Transportation Model Developments 5.3 National Model (NAM) 5.4 Extended Bangkok Urban Model (eBUM) 5.5 Development of the Provincial Transportation Model 5.6 Traffic Simulation Model 5.7 Manual for Transportation Model Analysis
5.1 Preface
A review on the procedures used in model development for all modeling levels is required in order to improve and maintain OTP’s transportation and traffic models,. The capabilities of such models will also be assessed in order to develop an action plan and criteria for the model development and maintenance to allow for more efficient transportation and traffic analyses. The recommendations will therefore be made to improve the main structure of the transportation and traffic models.
5.2 Review of Transportation Model Developments
The consultant has reviewed OTP’s existing transportation and traffic models including the National Model (NAM), the extended Bangkok Urban Model (eBUM), and the Provincial Transportation Model (PTM), developed by OTP. The models have been reviewed in three areas as follows:
1) The operating mechanism and process of the models
2) Data used in the models, such as demographic, employment, travel expenses data, etc., need to be cross checked for consistency before inputing into the model. Before proceeding to the result, the model needs a reality check to ensure that the model actually represents the actual conditions.
3) The arithmetic parameters and relationships used in the models, such as Mode Choice Model, need to be checked if they correspond to the current situation and reflect the results of the model. Also the parameters need to be adjusted for an appropriate result.

Executive Summary Report Page 5-2
Transport Data and Model integrated with Multimodal Transport and Logistics (TDL)
PCBK / SEA-CONSULT / PTL
Figure 5.2-1 Transportation Model Development and Maintenance Process
The Extended Transport Model
NAM
eBUM
PTM
Transport Model
NAM
eBUM
PTM
Secondary Data from related
agencies
Transport Model Efficiency Assessment
Traffic Forecast Accuracy
Modeling Efficiency
User-friendliness
Review the Transport Model Development
Review the Transport Model Application Process
Review Inputs
Review Parameters and Relationships
Laying appropriate plans and principles in developing and maintaining the transport model
Additional Traffic Surveys

Executive Summary Report Page 5-3
Transport Data and Model integrated with Multimodal Transport and Logistics (TDL)
PCBK / SEA-CONSULT / PTL
5.3 National Model (NAM)
The National Model (NAM) has been initially developed as part of the Urban Transport Database and Model Development Project (UTDM), which was aimed at forecasting passenger trips and freight volumes between provinces and analyzing the volume of trips made by different modes (by car, train, air, and water). The results can be used by related agencies to plan and to conduct analyses and assessments of the traffic, and by OTP to plan for transportation related projects at the national level.
The consultant has collected, reviewed, and checked the planning data through the study of the previous projects, from TDMC II untill TDMLII, which are the latest studies, and then gathered more data to ensure up-to-date status and make the National Model more accurate. The following steps have been used for model improvement purposes.
5.3.1 Improvement of the Transportation Network
The consultant has improved the transportation network of all transportation modes to be up-to-date. The existing database has been inspected and updated using the gathered data from all agencies involved. Thailand’s transportation network is shown in Figure 5.3-1.

Executive Summary Report Page 5-4
Transport Data and Model integrated with Multimodal Transport and Logistics (TDL)
PCBK / SEA-CONSULT / PTL
Figure 5.3-1 Thailand’s Transportation Network
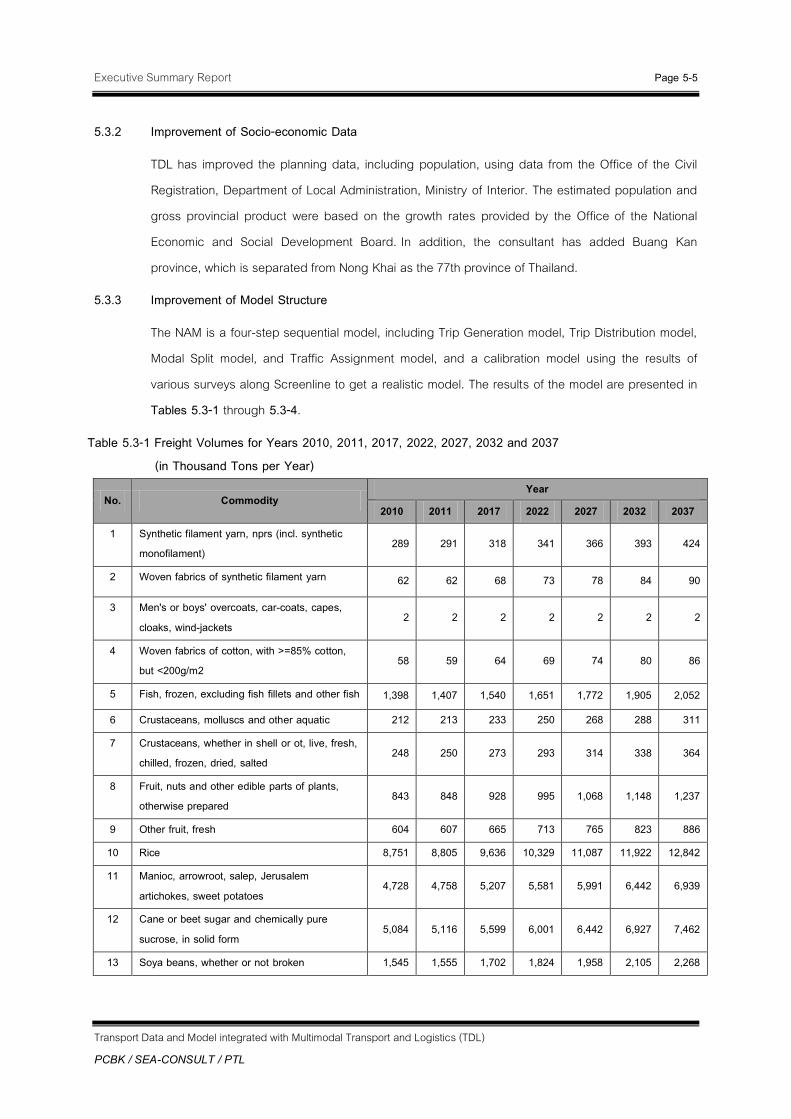
Executive Summary Report Page 5-5
Transport Data and Model integrated with Multimodal Transport and Logistics (TDL)
PCBK / SEA-CONSULT / PTL
5.3.2 Improvement of Socio-economic Data
TDL has improved the planning data, including population, using data from the Office of the Civil Registration, Department of Local Administration, Ministry of Interior. The estimated population and gross provincial product were based on the growth rates provided by the Office of the National Economic and Social Development Board. In addition, the consultant has added Buang Kan province, which is separated from Nong Khai as the 77th province of Thailand.
5.3.3 Improvement of Model Structure
The NAM is a four-step sequential model, including Trip Generation model, Trip Distribution model, Modal Split model, and Traffic Assignment model, and a calibration model using the results of various surveys along Screenline to get a realistic model. The results of the model are presented in Tables 5.3-1 through 5.3-4.
Table 5.3-1 Freight Volumes for Years 2010, 2011, 2017, 2022, 2027, 2032 and 2037 (in Thousand Tons per Year)
No. Commodity Year
2010 2011 2017 2022 2027 2032 2037 1 Synthetic filament yarn, nprs (incl. synthetic
monofilament) 289 291 318 341 366 393 424
2 Woven fabrics of synthetic filament yarn 62 62 68 73 78 84 90
3 Men's or boys' overcoats, car-coats, capes, cloaks, wind-jackets
2 2 2 2 2 2 2
4 Woven fabrics of cotton, with >=85% cotton, but <200g/m2
58 59 64 69 74 80 86
5 Fish, frozen, excluding fish fillets and other fish 1,398 1,407 1,540 1,651 1,772 1,905 2,052
6 Crustaceans, molluscs and other aquatic 212 213 233 250 268 288 311
7 Crustaceans, whether in shell or ot, live, fresh, chilled, frozen, dried, salted
248 250 273 293 314 338 364
8 Fruit, nuts and other edible parts of plants, otherwise prepared
843 848 928 995 1,068 1,148 1,237
9 Other fruit, fresh 604 607 665 713 765 823 886
10 Rice 8,751 8,805 9,636 10,329 11,087 11,922 12,842
11 Manioc, arrowroot, salep, Jerusalem artichokes, sweet potatoes
4,728 4,758 5,207 5,581 5,991 6,442 6,939
12 Cane or beet sugar and chemically pure sucrose, in solid form
5,084 5,116 5,599 6,001 6,442 6,927 7,462
13 Soya beans, whether or not broken 1,545 1,555 1,702 1,824 1,958 2,105 2,268
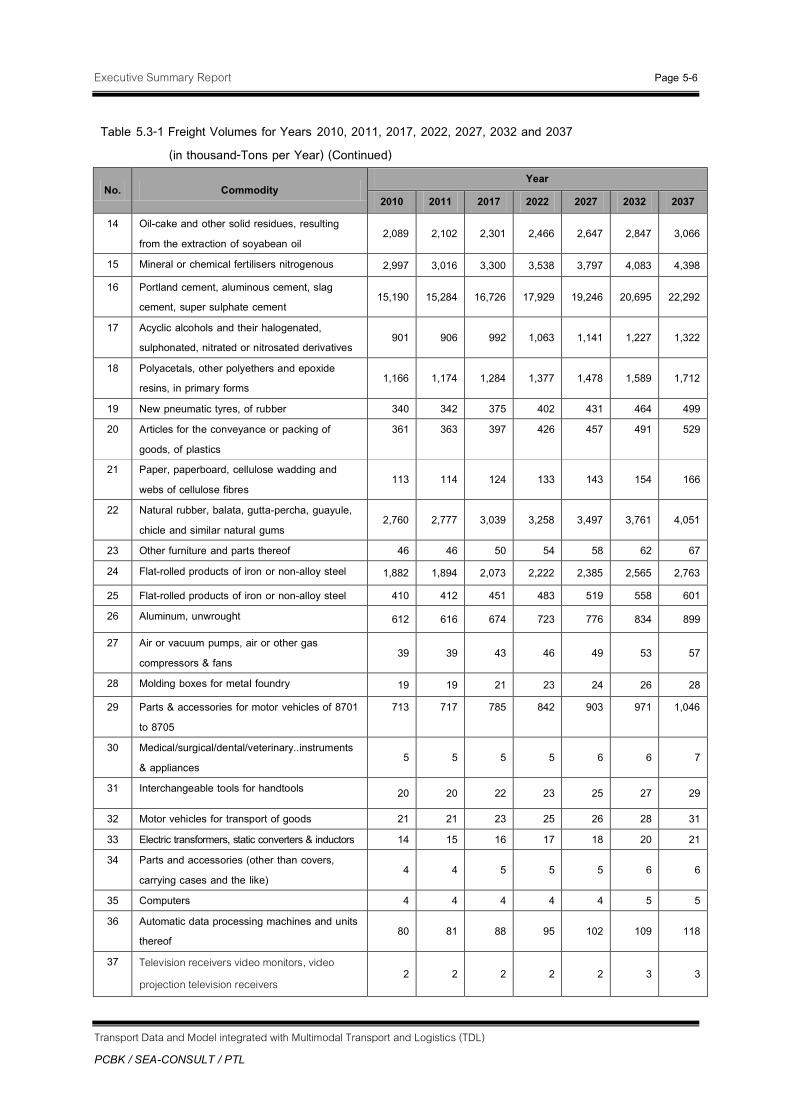
Executive Summary Report Page 5-6
Transport Data and Model integrated with Multimodal Transport and Logistics (TDL)
PCBK / SEA-CONSULT / PTL
Table 5.3-1 Freight Volumes for Years 2010, 2011, 2017, 2022, 2027, 2032 and 2037 (in thousand-Tons per Year) (Continued)
No. Commodity Year
2010 2011 2017 2022 2027 2032 2037 14 Oil-cake and other solid residues, resulting
from the extraction of soyabean oil 2,089 2,102 2,301 2,466 2,647 2,847 3,066
15 Mineral or chemical fertilisers nitrogenous 2,997 3,016 3,300 3,538 3,797 4,083 4,398 16 Portland cement, aluminous cement, slag
cement, super sulphate cement 15,190 15,284 16,726 17,929 19,246 20,695 22,292
17 Acyclic alcohols and their halogenated, sulphonated, nitrated or nitrosated derivatives
901 906 992 1,063 1,141 1,227 1,322
18 Polyacetals, other polyethers and epoxide resins, in primary forms
1,166 1,174 1,284 1,377 1,478 1,589 1,712
19 New pneumatic tyres, of rubber 340 342 375 402 431 464 499 20 Articles for the conveyance or packing of
goods, of plastics 361 363 397 426 457 491 529
21 Paper, paperboard, cellulose wadding and webs of cellulose fibres
113 114 124 133 143 154 166
22 Natural rubber, balata, gutta-percha, guayule, chicle and similar natural gums
2,760 2,777 3,039 3,258 3,497 3,761 4,051
23 Other furniture and parts thereof 46 46 50 54 58 62 67 24 Flat-rolled products of iron or non-alloy steel 1,882 1,894 2,073 2,222 2,385 2,565 2,763
25 Flat-rolled products of iron or non-alloy steel 410 412 451 483 519 558 601 26 Aluminum, unwrought 612 616 674 723 776 834 899
27 Air or vacuum pumps, air or other gas compressors & fans
39 39 43 46 49 53 57
28 Molding boxes for metal foundry 19 19 21 23 24 26 28 29 Parts & accessories for motor vehicles of 8701
to 8705 713 717 785 842 903 971 1,046
30 Medical/surgical/dental/veterinary..instruments & appliances
5 5 5 5 6 6 7
31 Interchangeable tools for handtools 20 20 22 23 25 27 29
32 Motor vehicles for transport of goods 21 21 23 25 26 28 31 33 Electric transformers, static converters & inductors 14 15 16 17 18 20 21 34 Parts and accessories (other than covers,
carrying cases and the like) 4 4 5 5 5 6 6
35 Computers 4 4 4 4 4 5 5 36 Automatic data processing machines and units
thereof 80 81 88 95 102 109 118
37 Television receivers video monitors, video projection television receivers
2 2 2 2 2 3 3

Executive Summary Report Page 5-7
Transport Data and Model integrated with Multimodal Transport and Logistics (TDL)
PCBK / SEA-CONSULT / PTL
Table 5.3-1 Freight Volumes for Years 2010, 2011, 2017, 2022, 2027, 2032 and 2037 (in thousand-Tons per Year) (Continued)
No. Commodity Year
2010 2011 2017 2022 2027 2032 2037 38 Thermionic, cold cathode or photocathode
tubes 3 4 4 4 4 5 5
39 Electronic integrated circuits & microassemblies; parts thereof
8 8 9 9 10 11 12
40 Articles of jewellery and parts thereof 2 2 2 2 2 2 2 41 Petroleum oils and oils obtained from
bituminous minerals 19,097 19,215 21,028 22,541 24,197 26,019 28,026
42 Cut flowers and flower buds of a kind suitable for bouquets or for ornamental purposes
31 31 34 36 39 42 45
43 Coffee, Tea And Spices 122 123 134 144 154 166 179 44 Wood and articles of wood 3,746 3,769 4,125 4,422 4,747 5,104 5,498 45 Articles of apparel and clothing accessories,
not knitted 24 24 27 29 31 33 35
46 Footwear, gaiters and the like; parts of such articles
6 6 7 7 8 8 9
47 Preparations of vegetables, fruit, nuts or other parts of plants
701 706 772 828 889 956 1,029
48 Vehicles other than railway or tramway rolling-stock, and parts and accessories thereof
158 159 174 187 200 216 232
49 Beverages, spirits and vinegar 4 4 4 4 5 5 6 50 Product Ion Of Milling Industry: Malt, Starches,
Inulin And Wheat Gluten 2,338 2,352 2,572 2,758 2,965 3,187 3,434
51 Cereals 2,580 2,593 2,841 3,045 3,269 3,515 3,784 52 Electronic Machinery, Electronic Devices And
Parts 516 519 568 609 654 703 757
Total 52 goods 82,948 83,461 91,336 97,908 105,098 113,013 121,732
Import-Export others than 52 goods 93,486 94,884 104,550 112,074 120,305 129,365 139,344
Inland freight goods 334,081 339,588 370,911 397,602 426,802 458,944 494,349
Total 510,515 517,933 566,797 607,584 652,205 701,322 755,425

Executive Summary Report Page 5-8
Transport Data and Model integrated with Multimodal Transport and Logistics (TDL)
PCBK / SEA-CONSULT / PTL
Table 5.3-2 Results of Passenger Trips from NAM (in thousand Trips per Day)
Mode 2010 2011 2017 2022 2027 2032 2037
Passenger Car 1,244 1,258 1,376 1,595 1,964 2,568 3,576
Bus 938 949 1,038 1,204 1,481 1,939 2,699
Train 147 152 166 193 237 310 432
Air Transportation 88 91 100 116 143 187 260
Total 2,417 2,450 2,680 3,108 3,825 5,004 6,967
Table 5.3-3 Results of Freight Transportation from NAM (in Tons per Day)
Mode 2010 2011 2017 2022 2027 2032 2037
Road 429,295 433,184 474,050 508,140 545,485 586,553 631,807
Train 11,007 12,995 14,222 15,244 16,364 17,601 18,955
Water 70,149 71,690 78,454 84,122 90,270 97,073 104,557
Air 64 64 71 78 86 95 106
Total 510,515 517,933 566,797 607,584 652,205 701,322 755,425
Table 5.3-4 NAM Results
Year Mil. Veh/Km. Mil. Veh/Hr. Speed (Kms./hr.)
2010 331.84 4.17 79.53
2011 335.50 4.23 79.37
2017 362.38 4.54 79.89
2022 404.93 5.17 78.36
2027 472.09 6.20 76.10
2032 577.82 7.96 72.61
2037 749.51 11.08 67.63
Note: Veh/Km. = Vehicles x Distance Veh/Hr = Vehicles x Travel Time
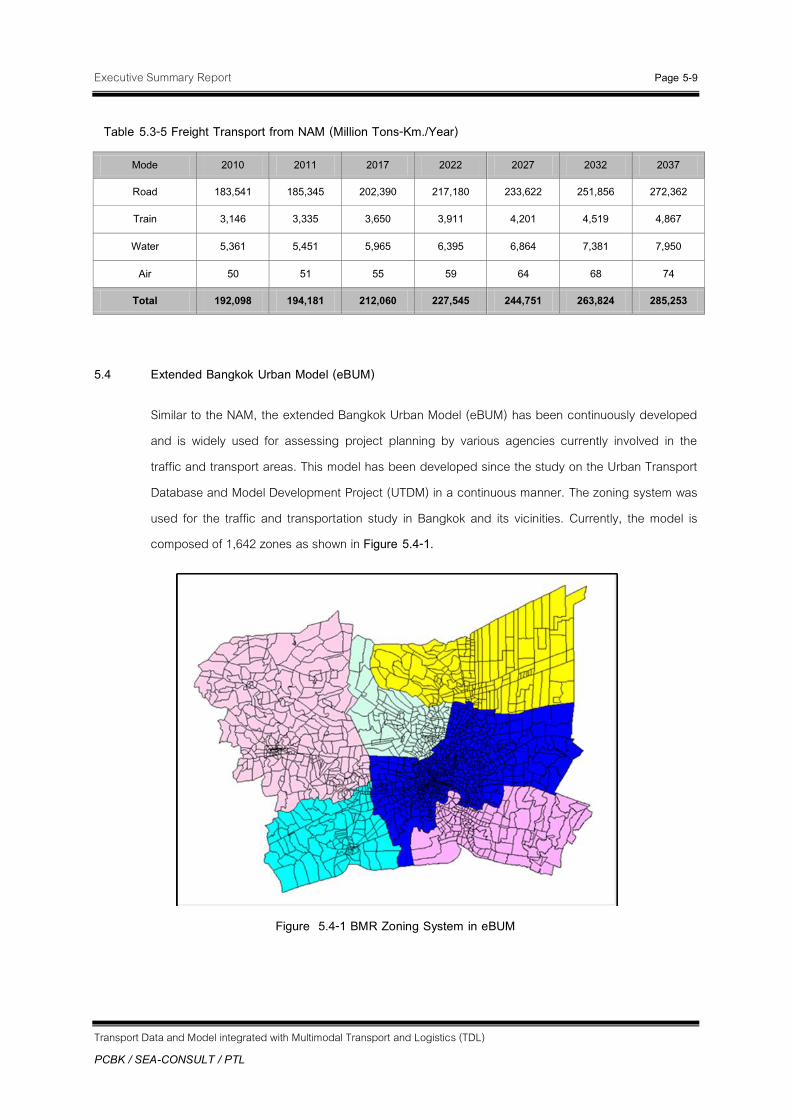
Executive Summary Report Page 5-9
Transport Data and Model integrated with Multimodal Transport and Logistics (TDL)
PCBK / SEA-CONSULT / PTL
Table 5.3-5 Freight Transport from NAM (Million Tons-Km./Year)
Mode 2010 2011 2017 2022 2027 2032 2037
Road 183,541 185,345 202,390 217,180 233,622 251,856 272,362
Train 3,146 3,335 3,650 3,911 4,201 4,519 4,867
Water 5,361 5,451 5,965 6,395 6,864 7,381 7,950
Air 50 51 55 59 64 68 74
Total 192,098 194,181 212,060 227,545 244,751 263,824 285,253
5.4 Extended Bangkok Urban Model (eBUM)
Similar to the NAM, the extended Bangkok Urban Model (eBUM) has been continuously developed and is widely used for assessing project planning by various agencies currently involved in the traffic and transport areas. This model has been developed since the study on the Urban Transport Database and Model Development Project (UTDM) in a continuous manner. The zoning system was used for the traffic and transportation study in Bangkok and its vicinities. Currently, the model is composed of 1,642 zones as shown in Figure 5.4-1.
Figure 5.4-1 BMR Zoning System in eBUM

Executive Summary Report Page 5-10
Transport Data and Model integrated with Multimodal Transport and Logistics (TDL)
PCBK / SEA-CONSULT / PTL
5.4.1 Guideline for Improvement and Maintenance of the Extended Bangkok Urban Model (eBUM)
The consultant has inspected and improved the model from the TDMLII study using the following guideline for model improvement and maintenance.
1) Improvement of transport and service network
The consultant has improved the highway network and the public transportation network by updating TDMLII and adding the Metrobus into the public transportation network which provides coverage for Bangkok and its vicinities by gathering data from relevant agencies.
5.4.2 Improvement of the eBUM Model Structure
eBUM has been improved through a four–step process:
Trip Generation
Trip Distribution
Modal Split
Trip Assignment
Model improvements covering the first three steps were conducted as part of the last project (TDMLII). In this project, the Trip Assignment improvement process was based on a new assignment method from cube voyager. The Trip Assignment process used to improve the model is shown in Figure 5.4-2.
In addition, the consultant also added the main intersection data in the Bangkok area to the model's structure. The Trip Assignment process was restructured to support Intersection's analysis as shown in the example in Figure 5.4-3. Moreover, The consultant has already changed the model’s structure from Trips application as shown in Figure 5.4-4 to Voyager application as in Figure 5.4-5.
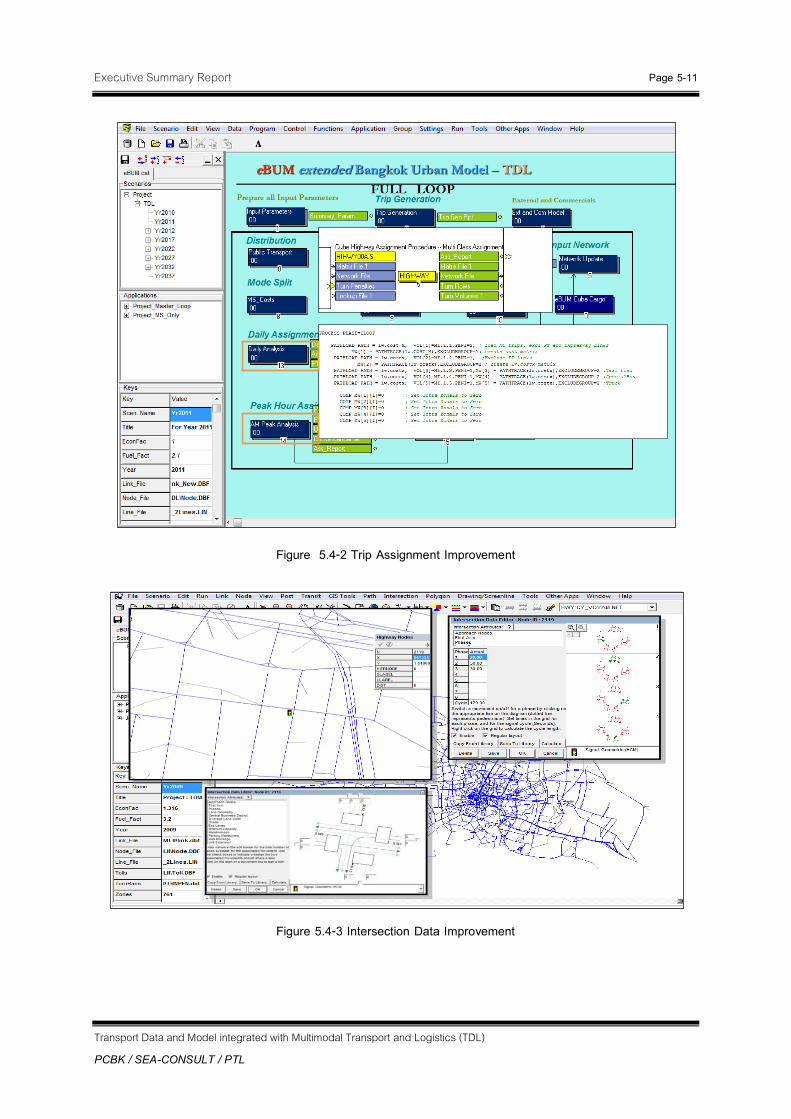
Executive Summary Report Page 5-11
Transport Data and Model integrated with Multimodal Transport and Logistics (TDL)
PCBK / SEA-CONSULT / PTL
Figure 5.4-2 Trip Assignment Improvement
Figure 5.4-3 Intersection Data Improvement
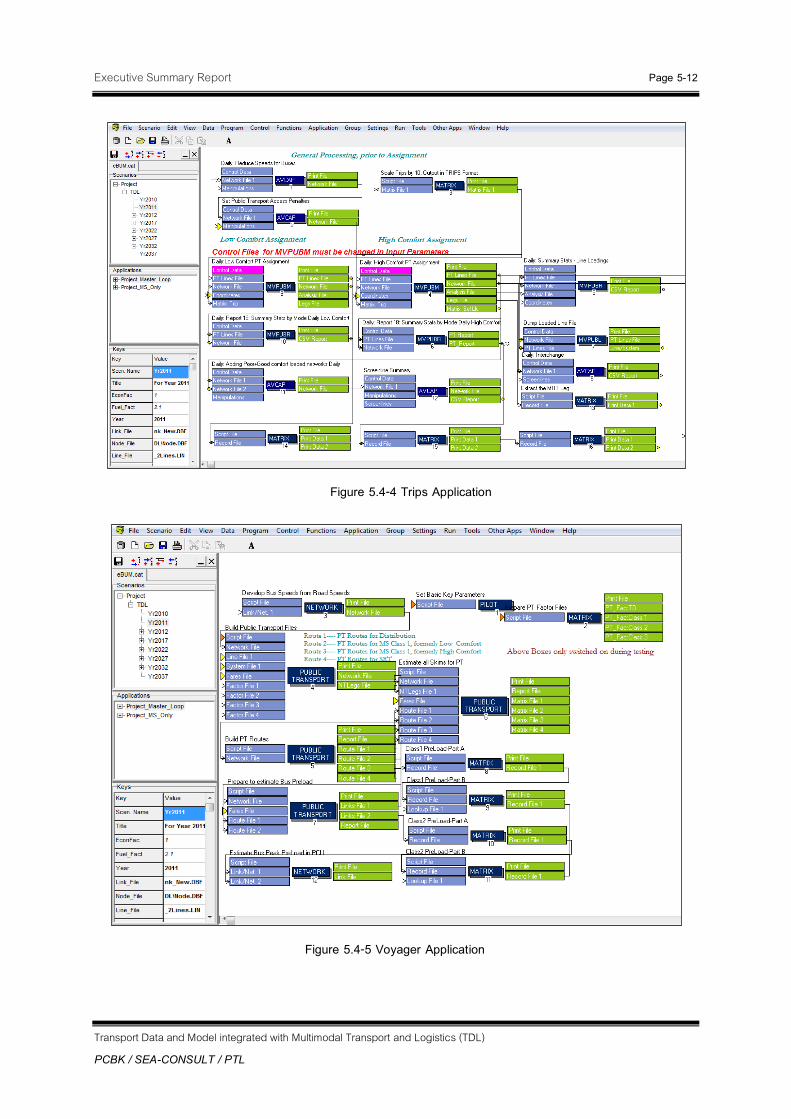
Executive Summary Report Page 5-12
Transport Data and Model integrated with Multimodal Transport and Logistics (TDL)
PCBK / SEA-CONSULT / PTL
Figure 5.4-4 Trips Application
Figure 5.4-5 Voyager Application

Executive Summary Report Page 5-13
Transport Data and Model integrated with Multimodal Transport and Logistics (TDL)
PCBK / SEA-CONSULT / PTL
5.4.3 Socioeconomic Data for eBUM
The consultant has improved the eBUM using population and employment data for five-year periods as follows: 2010, 2011, 2017, 2022, 2027, 2032 and 2037.
The projected population and employment levels from the IMAC project, which is considered the most recent forecast, were added to the model. The socioeconomic data have been adapted to suit the eBUM zoning system of 1,642 zones, which was continuously developed through the TDML project.
Table 5.4-1 Population and Employment Data in Bangkok and its vicinities
Data Year
2010 2011 2017 2022 2027 2032 2037
Population (in Millions) 10.84 11.54 12.29 12.99 13.86 14.94 16.10 Households (in Millions) 3.61 3.85 4.18 4.48 4.83 5.28 5.75
Avg. size of household (person) 3.00 2.99 2.94 2.89 2.86 2.83 2.80 Avg. income per month per household (in 2011 Baht)
27,778 27,799 33,927 38,378 42,616 47,044 51,932
Employment (in Millions) 5.86 6.27 6.71 7.20 7.81 8.36 8.94
Note: Estimated by consultant
5.4.6 Base Year 2011 eBUM Validation
In validating the model, the consultant has checked the accuracy of the eBUM forecasting results compared with data for the base year 2011 using fuel cost at 31.8 baht per liter, which is a weighted average of the total oil consumption in the Bangkok metropolitan areas in the year 2011. In addition, type and capacity of roads network and traffic volume per capacity data were used in the model to better represent the actual values.
The comparison of the results showed that the model can accurately simulate the existing conditions and has consistent results. In conclusion, the model has been validated for the base year 2011.
After the improvements and validation process, the eBUM results for the base year 2011 can be summarized as follows:
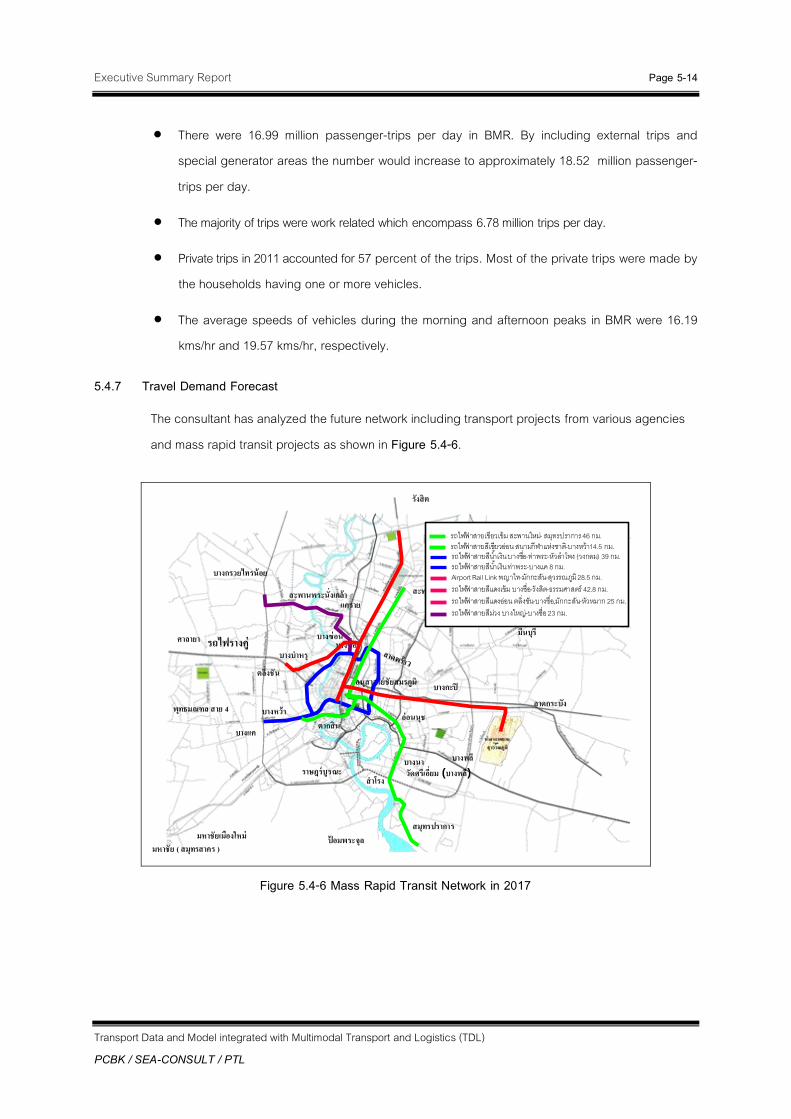
Executive Summary Report Page 5-14
Transport Data and Model integrated with Multimodal Transport and Logistics (TDL)
PCBK / SEA-CONSULT / PTL
There were 16.99 million passenger-trips per day in BMR. By including external trips and special generator areas the number would increase to approximately 18.52 million passenger-trips per day.
The majority of trips were work related which encompass 6.78 million trips per day.
Private trips in 2011 accounted for 57 percent of the trips. Most of the private trips were made by the households having one or more vehicles.
The average speeds of vehicles during the morning and afternoon peaks in BMR were 16.19 kms/hr and 19.57 kms/hr, respectively.
5.4.7 Travel Demand Forecast
The consultant has analyzed the future network including transport projects from various agencies and mass rapid transit projects as shown in Figure 5.4-6.
Figure 5.4-6 Mass Rapid Transit Network in 2017
( )
- - ( ) 39 - 8 Airport Rail Link - - 28.5 - - 42.8 - , - 25 - 23
- 14.5 - 46

Executive Summary Report Page 5-15
Transport Data and Model integrated with Multimodal Transport and Logistics (TDL)
PCBK / SEA-CONSULT / PTL
Figure 5.4-7 Mass Rapid Transit Network in 2032
Table 5.4-2 eBUM Results (AM Peak)
AM Peak
Year Veh/Km. Veh/Hr. Speed
(Kms./Hr.) 2010 13,600,900 816,600 16.7
2011 14,002,000 864,800 16.2
2017 14,853,100 874,200 17.0
2022 16,314,900 987,300 16.5
2027 18,055,500 1,194,900 15.1
2032 20,053,100 1,460,200 13.7
2037 22,148,400 1,751,800 12.6
Note: Veh/Km. = Vehicle x Distance, Veh/Hr. = Vehicle xTravel Time
( )
- - ( ) 39 - 4 16 Airport Rail Link - - 36.4 - - 80.8 - 48 - - 41.8
- 15.5 - 64.5
37.5 36 30.4 9.5 26
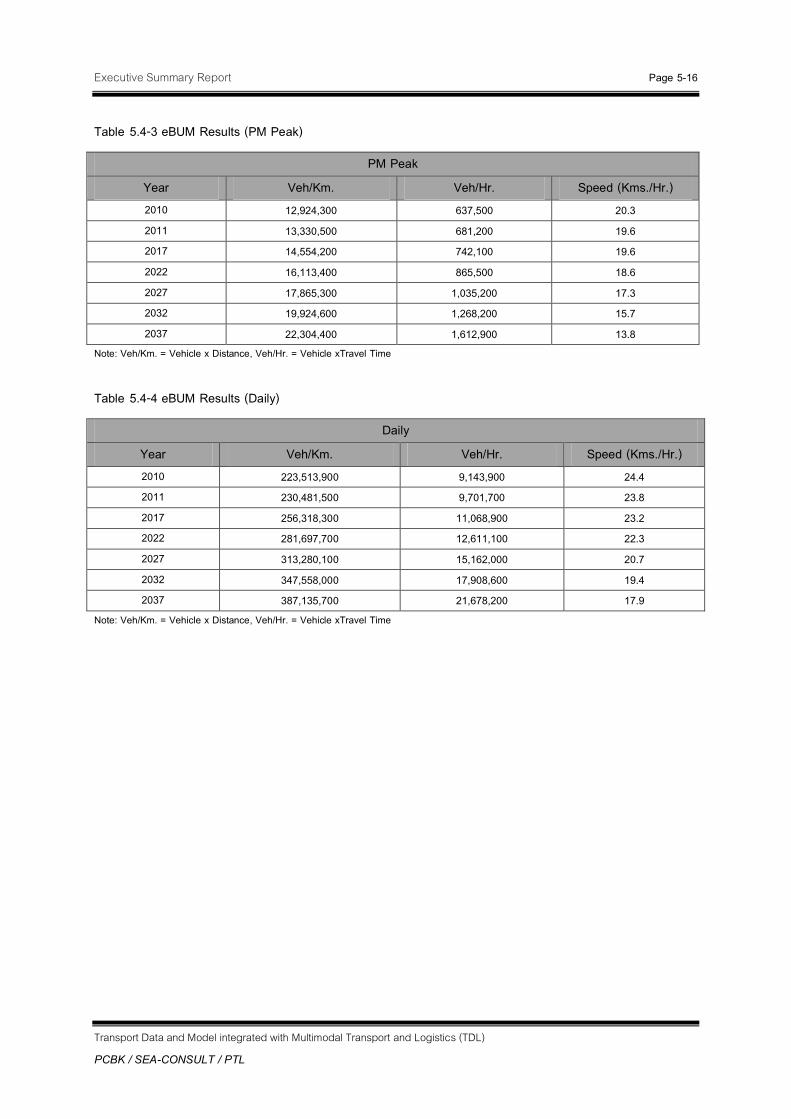
Executive Summary Report Page 5-16
Transport Data and Model integrated with Multimodal Transport and Logistics (TDL)
PCBK / SEA-CONSULT / PTL
Table 5.4-3 eBUM Results (PM Peak)
PM Peak Year Veh/Km. Veh/Hr. Speed (Kms./Hr.) 2010 12,924,300 637,500 20.3 2011 13,330,500 681,200 19.6 2017 14,554,200 742,100 19.6 2022 16,113,400 865,500 18.6 2027 17,865,300 1,035,200 17.3 2032 19,924,600 1,268,200 15.7 2037 22,304,400 1,612,900 13.8
Note: Veh/Km. = Vehicle x Distance, Veh/Hr. = Vehicle xTravel Time
Table 5.4-4 eBUM Results (Daily)
Daily Year Veh/Km. Veh/Hr. Speed (Kms./Hr.) 2010 223,513,900 9,143,900 24.4 2011 230,481,500 9,701,700 23.8 2017 256,318,300 11,068,900 23.2 2022 281,697,700 12,611,100 22.3 2027 313,280,100 15,162,000 20.7 2032 347,558,000 17,908,600 19.4 2037 387,135,700 21,678,200 17.9
Note: Veh/Km. = Vehicle x Distance, Veh/Hr. = Vehicle xTravel Time

Executive Summary Report Page 5-17
Transport Data and Model integrated with Multimodal Transport and Logistics (TDL)
PCBK / SEA-CONSULT / PTL
Figure 5.4-8 Traffic volume across the Chaophraya river
Figure 5.4-9 Traffic volume across North-South Screenline
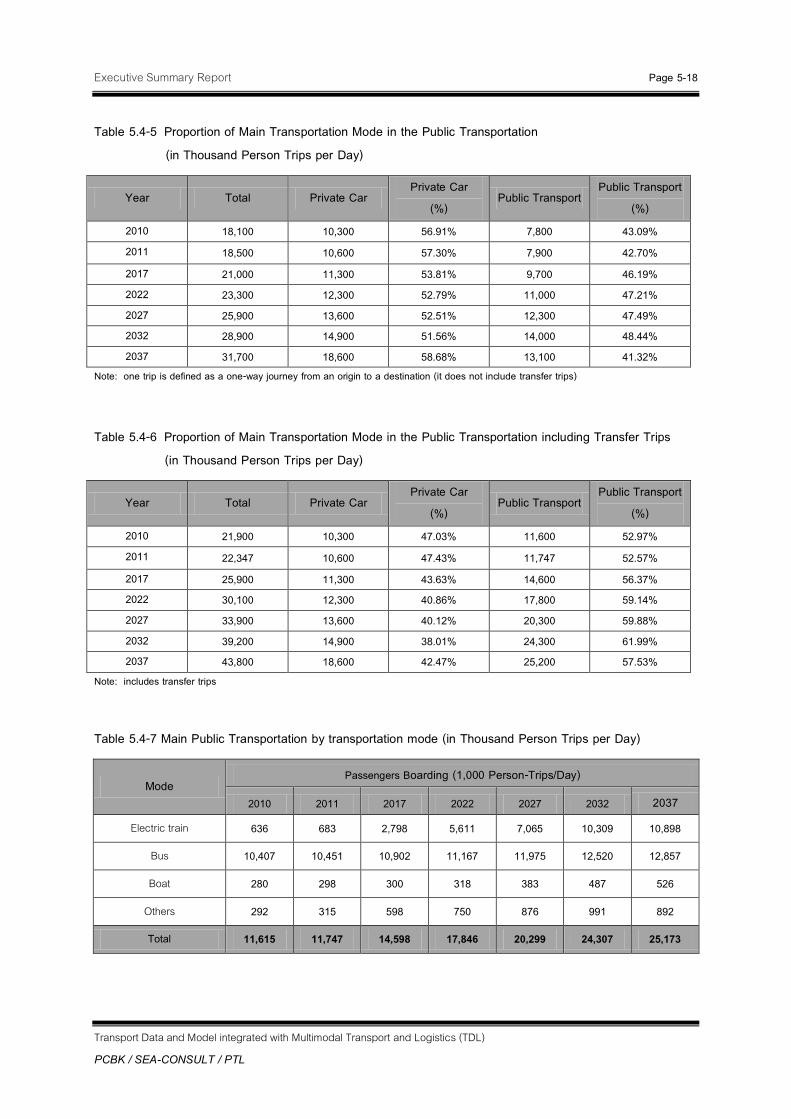
Executive Summary Report Page 5-18
Transport Data and Model integrated with Multimodal Transport and Logistics (TDL)
PCBK / SEA-CONSULT / PTL
Table 5.4-5 Proportion of Main Transportation Mode in the Public Transportation (in Thousand Person Trips per Day)
Year Total Private Car Private Car
(%) Public Transport
Public Transport (%)
2010 18,100 10,300 56.91% 7,800 43.09% 2011 18,500 10,600 57.30% 7,900 42.70% 2017 21,000 11,300 53.81% 9,700 46.19% 2022 23,300 12,300 52.79% 11,000 47.21% 2027 25,900 13,600 52.51% 12,300 47.49% 2032 28,900 14,900 51.56% 14,000 48.44% 2037 31,700 18,600 58.68% 13,100 41.32%
Note: one trip is defined as a one-way journey from an origin to a destination (it does not include transfer trips)
Table 5.4-6 Proportion of Main Transportation Mode in the Public Transportation including Transfer Trips (in Thousand Person Trips per Day)
Year Total Private Car Private Car
(%) Public Transport
Public Transport (%)
2010 21,900 10,300 47.03% 11,600 52.97% 2011 22,347 10,600 47.43% 11,747 52.57% 2017 25,900 11,300 43.63% 14,600 56.37% 2022 30,100 12,300 40.86% 17,800 59.14% 2027 33,900 13,600 40.12% 20,300 59.88% 2032 39,200 14,900 38.01% 24,300 61.99% 2037 43,800 18,600 42.47% 25,200 57.53%
Note: includes transfer trips
Table 5.4-7 Main Public Transportation by transportation mode (in Thousand Person Trips per Day)
Mode Passengers Boarding (1,000 Person-Trips/Day)
2010 2011 2017 2022 2027 2032 2037
Electric train 636 683 2,798 5,611 7,065 10,309 10,898
Bus 10,407 10,451 10,902 11,167 11,975 12,520 12,857
Boat 280 298 300 318 383 487 526
Others 292 315 598 750 876 991 892
Total 11,615 11,747 14,598 17,846 20,299 24,307 25,173
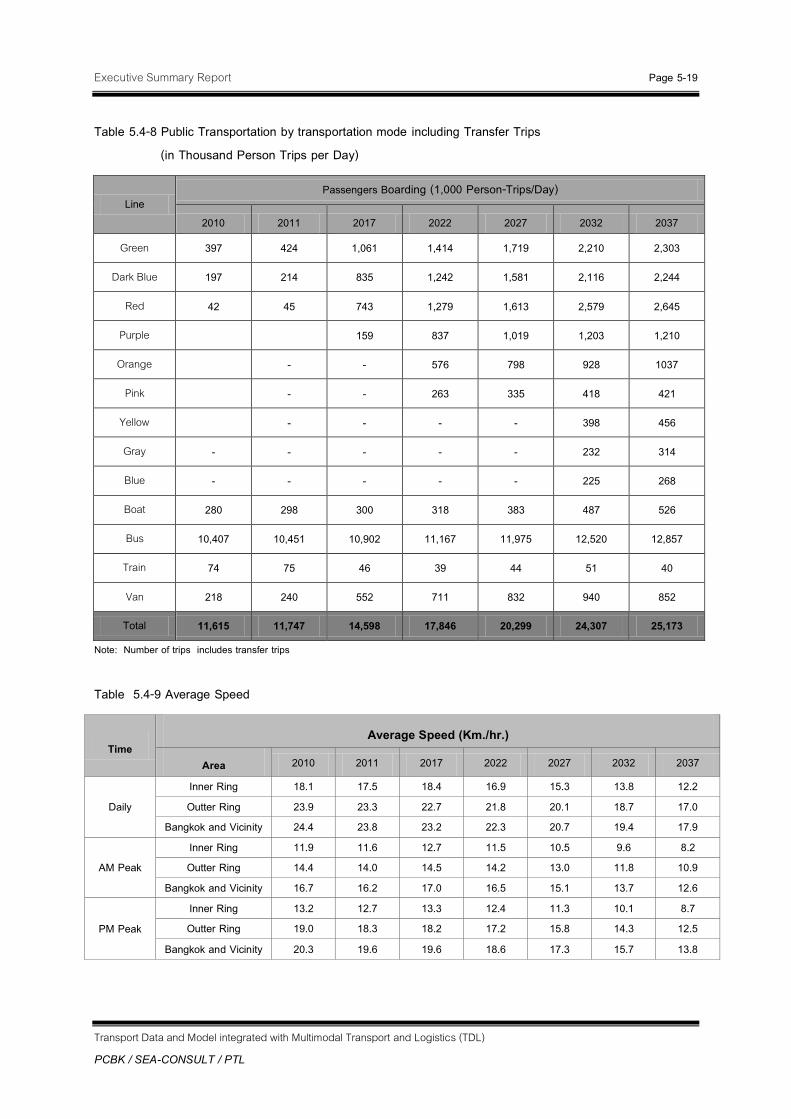
Executive Summary Report Page 5-19
Transport Data and Model integrated with Multimodal Transport and Logistics (TDL)
PCBK / SEA-CONSULT / PTL
Table 5.4-8 Public Transportation by transportation mode including Transfer Trips (in Thousand Person Trips per Day)
Line Passengers Boarding (1,000 Person-Trips/Day)
2010 2011 2017 2022 2027 2032 2037
Green 397 424 1,061 1,414 1,719 2,210 2,303
Dark Blue 197 214 835 1,242 1,581 2,116 2,244
Red 42 45 743 1,279 1,613 2,579 2,645
Purple 159 837 1,019 1,203 1,210
Orange - - 576 798 928 1037
Pink - - 263 335 418 421
Yellow - - - - 398 456
Gray - - - - - 232 314
Blue - - - - - 225 268
Boat 280 298 300 318 383 487 526
Bus 10,407 10,451 10,902 11,167 11,975 12,520 12,857
Train 74 75 46 39 44 51 40
Van 218 240 552 711 832 940 852
Total 11,615 11,747 14,598 17,846 20,299 24,307 25,173
Note: Number of trips includes transfer trips
Table 5.4-9 Average Speed
Time Average Speed (Km./hr.)
Area 2010 2011 2017 2022 2027 2032 2037
Daily Inner Ring 18.1 17.5 18.4 16.9 15.3 13.8 12.2 Outter Ring 23.9 23.3 22.7 21.8 20.1 18.7 17.0
Bangkok and Vicinity 24.4 23.8 23.2 22.3 20.7 19.4 17.9
AM Peak Inner Ring 11.9 11.6 12.7 11.5 10.5 9.6 8.2 Outter Ring 14.4 14.0 14.5 14.2 13.0 11.8 10.9
Bangkok and Vicinity 16.7 16.2 17.0 16.5 15.1 13.7 12.6
PM Peak Inner Ring 13.2 12.7 13.3 12.4 11.3 10.1 8.7 Outter Ring 19.0 18.3 18.2 17.2 15.8 14.3 12.5
Bangkok and Vicinity 20.3 19.6 19.6 18.6 17.3 15.7 13.8
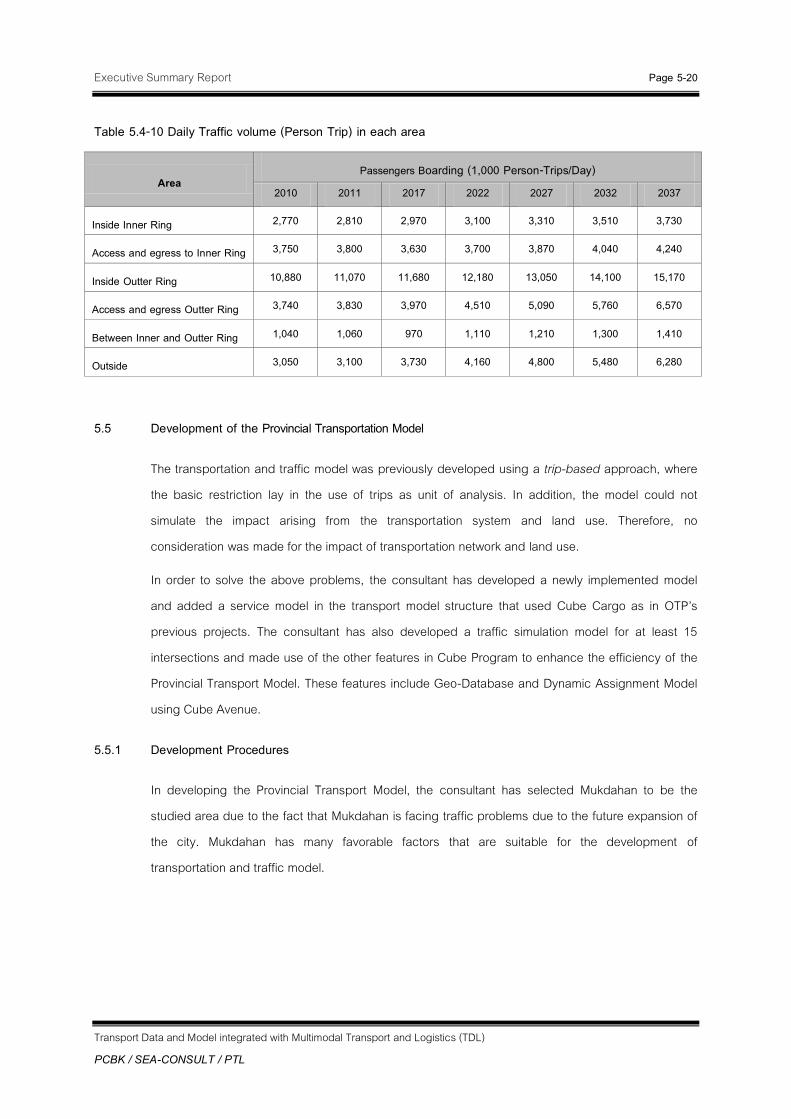
Executive Summary Report Page 5-20
Transport Data and Model integrated with Multimodal Transport and Logistics (TDL)
PCBK / SEA-CONSULT / PTL
Table 5.4-10 Daily Traffic volume (Person Trip) in each area
Area Passengers Boarding (1,000 Person-Trips/Day)
2010 2011 2017 2022 2027 2032 2037
Inside Inner Ring 2,770 2,810 2,970 3,100 3,310 3,510 3,730
Access and egress to Inner Ring 3,750 3,800 3,630 3,700 3,870 4,040 4,240
Inside Outter Ring 10,880 11,070 11,680 12,180 13,050 14,100 15,170
Access and egress Outter Ring 3,740 3,830 3,970 4,510 5,090 5,760 6,570
Between Inner and Outter Ring 1,040 1,060 970 1,110 1,210 1,300 1,410
Outside 3,050 3,100 3,730 4,160 4,800 5,480 6,280
5.5 Development of the Provincial Transportation Model
The transportation and traffic model was previously developed using a trip-based approach, where the basic restriction lay in the use of trips as unit of analysis. In addition, the model could not simulate the impact arising from the transportation system and land use. Therefore, no consideration was made for the impact of transportation network and land use.
In order to solve the above problems, the consultant has developed a newly implemented model and added a service model in the transport model structure that used Cube Cargo as in OTP’s previous projects. The consultant has also developed a traffic simulation model for at least 15 intersections and made use of the other features in Cube Program to enhance the efficiency of the Provincial Transport Model. These features include Geo-Database and Dynamic Assignment Model using Cube Avenue.
5.5.1 Development Procedures
In developing the Provincial Transport Model, the consultant has selected Mukdahan to be the studied area due to the fact that Mukdahan is facing traffic problems due to the future expansion of the city. Mukdahan has many favorable factors that are suitable for the development of transportation and traffic model.
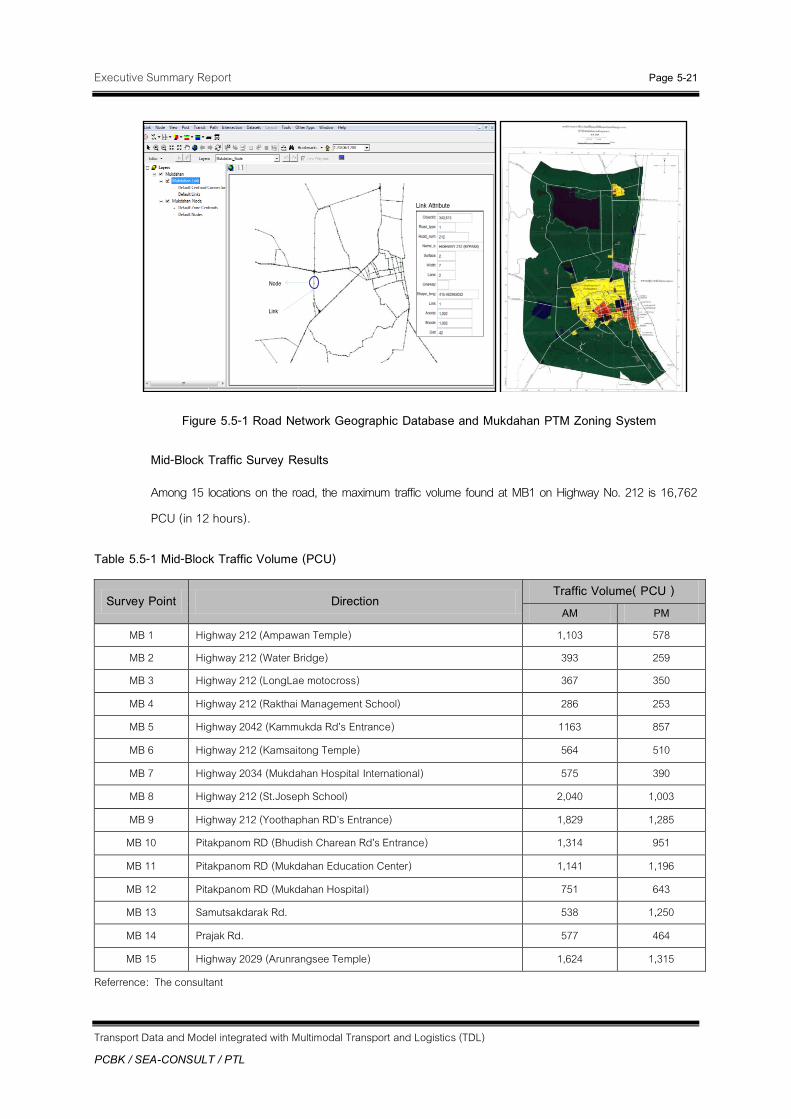
Executive Summary Report Page 5-21
Transport Data and Model integrated with Multimodal Transport and Logistics (TDL)
PCBK / SEA-CONSULT / PTL
Figure 5.5-1 Road Network Geographic Database and Mukdahan PTM Zoning System
Mid-Block Traffic Survey Results
Among 15 locations on the road, the maximum traffic volume found at MB1 on Highway No. 212 is 16,762 PCU (in 12 hours).
Table 5.5-1 Mid-Block Traffic Volume (PCU)
Survey Point Direction Traffic Volume( PCU )
AM PM
MB 1 Highway 212 (Ampawan Temple) 1,103 578 MB 2 Highway 212 (Water Bridge) 393 259 MB 3 Highway 212 (LongLae motocross) 367 350
MB 4 Highway 212 (Rakthai Management School) 286 253
MB 5 Highway 2042 (Kammukda Rd’s Entrance) 1163 857
MB 6 Highway 212 (Kamsaitong Temple) 564 510
MB 7 Highway 2034 (Mukdahan Hospital International) 575 390
MB 8 Highway 212 (St.Joseph School) 2,040 1,003
MB 9 Highway 212 (Yoothaphan RD’s Entrance) 1,829 1,285
MB 10 Pitakpanom RD (Bhudish Charean Rd’s Entrance) 1,314 951
MB 11 Pitakpanom RD (Mukdahan Education Center) 1,141 1,196
MB 12 Pitakpanom RD (Mukdahan Hospital) 751 643
MB 13 Samutsakdarak Rd. 538 1,250
MB 14 Prajak Rd. 577 464
MB 15 Highway 2029 (Arunrangsee Temple) 1,624 1,315
Referrence: The consultant
Node
Link
Link Attribute
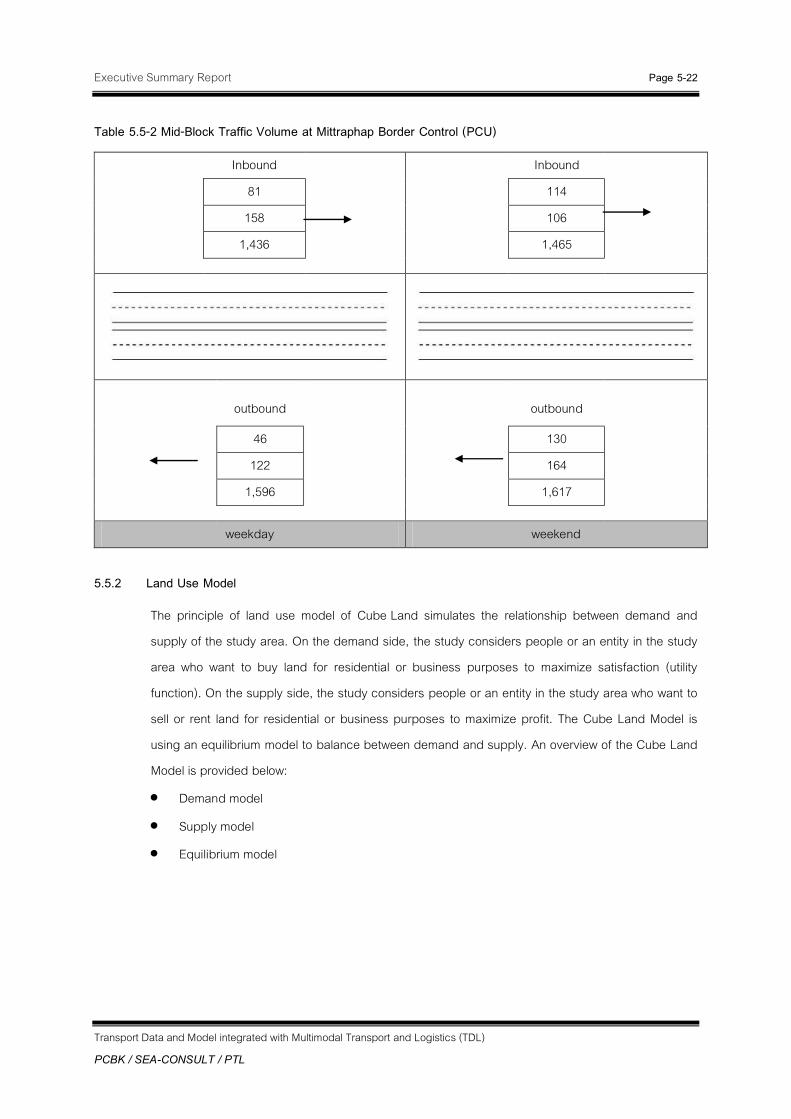
Executive Summary Report Page 5-22
Transport Data and Model integrated with Multimodal Transport and Logistics (TDL)
PCBK / SEA-CONSULT / PTL
Table 5.5-2 Mid-Block Traffic Volume at Mittraphap Border Control (PCU)
Inbound
Inbound
81 114
158 106 1,436 1,465
outbound
outbound
46 130
122 164 1,596 1,617
weekday weekend
5.5.2 Land Use Model
The principle of land use model of Cube Land simulates the relationship between demand and supply of the study area. On the demand side, the study considers people or an entity in the study area who want to buy land for residential or business purposes to maximize satisfaction (utility function). On the supply side, the study considers people or an entity in the study area who want to sell or rent land for residential or business purposes to maximize profit. The Cube Land Model is using an equilibrium model to balance between demand and supply. An overview of the Cube Land Model is provided below:
Demand model
Supply model
Equilibrium model

Executive Summary Report Page 5-23
Transport Data and Model integrated with Multimodal Transport and Logistics (TDL)
PCBK / SEA-CONSULT / PTL
Figure 5.5-2 Relationship between Modules in the Land Use Model
5.5.3 Activity-Based Model
The Activity-Based Model differs drastically from the Trip-based Model due to the foundation of its underlining principles. The model considers travel that occurs as a side effect of any activities (induced demand) distributed all over a city. The Activity-Based Model consists of the following components.
The pattern type model predicts the behavior of an individual traveler who will choose a travel pattern
The location choice model is a model used to predict the location traveled.
The mode choice model is a model used to predict the mode of transport chosen by a traveler.
The assignment model is a model used to assign the trip traveled, similar to trip-based model.
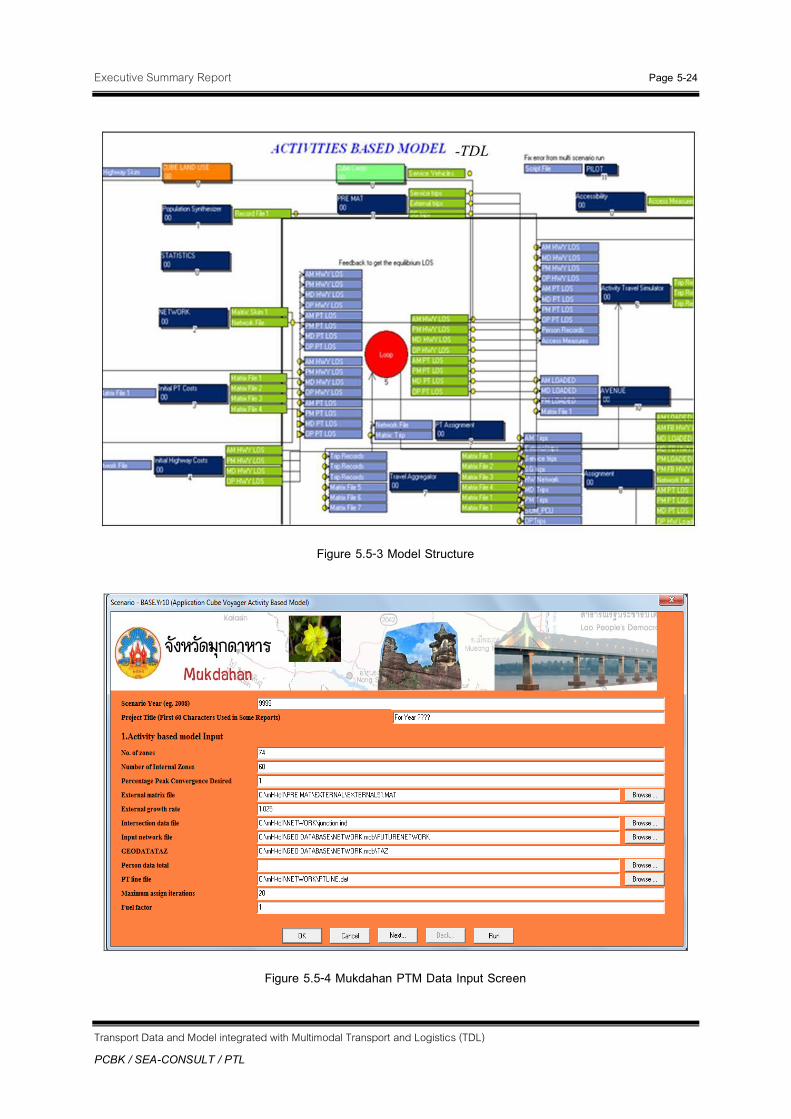
Executive Summary Report Page 5-24
Transport Data and Model integrated with Multimodal Transport and Logistics (TDL)
PCBK / SEA-CONSULT / PTL
Figure 5.5-3 Model Structure
Figure 5.5-4 Mukdahan PTM Data Input Screen
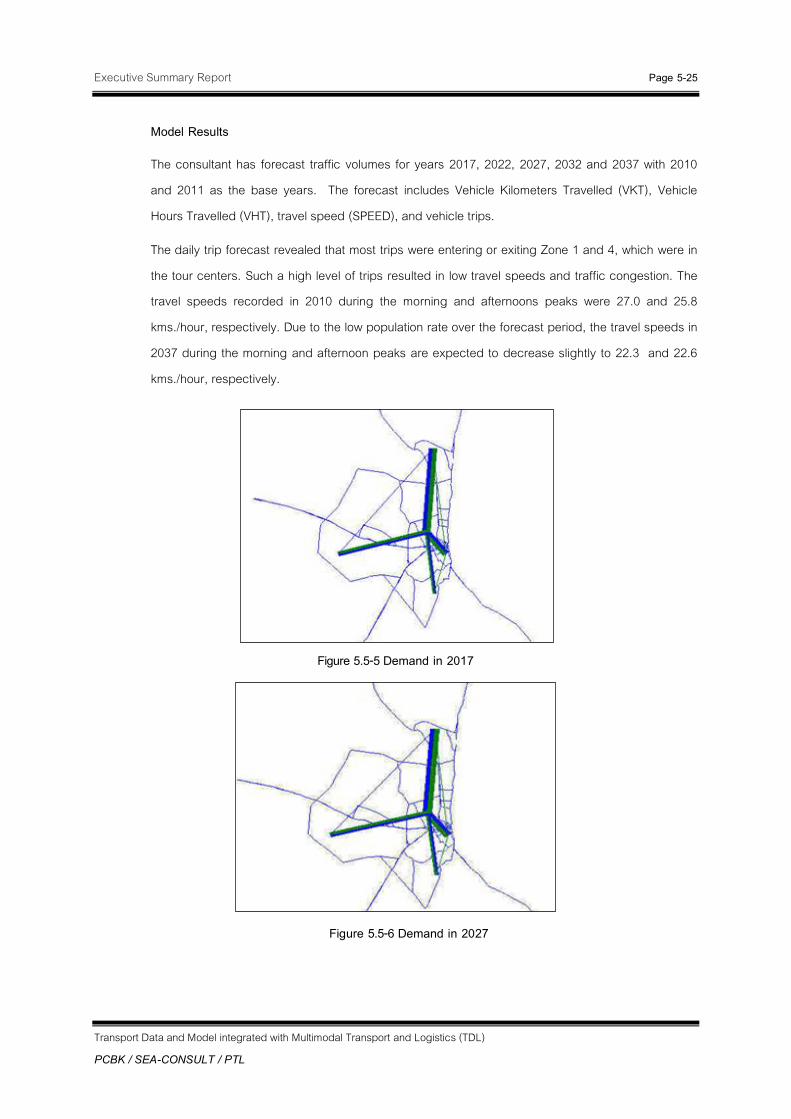
Executive Summary Report Page 5-25
Transport Data and Model integrated with Multimodal Transport and Logistics (TDL)
PCBK / SEA-CONSULT / PTL
Model Results
The consultant has forecast traffic volumes for years 2017, 2022, 2027, 2032 and 2037 with 2010 and 2011 as the base years. The forecast includes Vehicle Kilometers Travelled (VKT), Vehicle Hours Travelled (VHT), travel speed (SPEED), and vehicle trips.
The daily trip forecast revealed that most trips were entering or exiting Zone 1 and 4, which were in the tour centers. Such a high level of trips resulted in low travel speeds and traffic congestion. The travel speeds recorded in 2010 during the morning and afternoons peaks were 27.0 and 25.8 kms./hour, respectively. Due to the low population rate over the forecast period, the travel speeds in 2037 during the morning and afternoon peaks are expected to decrease slightly to 22.3 and 22.6 kms./hour, respectively.
Figure 5.5-5 Demand in 2017
Figure 5.5-6 Demand in 2027

Executive Summary Report Page 5-26
Transport Data and Model integrated with Multimodal Transport and Logistics (TDL)
PCBK / SEA-CONSULT / PTL
Figure 5.5-7 Demand in 2037
Table 5.5-3 Results from Mukdahan PTM
Year
Time of Day Morning Mid-Day Evening Overnight
VKT VHT SPEED VKT VHT SPEED VKT VHT SPEED VKT VHT SPEED
2011 115,328 2,869 40.2 116,242 3,046 38.17 69,460 1,363 50.96 60,073 1,076 55.82
2017 119,212 2,997 39.78 119,042 3,162 37.65 71,860 1,420 50.62 62,175 1,119 55.55
2022 121,365 3,084 39.35 123,016 3,253 37.82 73,362 1,449 50.63 63,668 1,150 55.36
2027 123,987 3,168 39.13 124,509 3,271 38.07 75,188 1,491 50.44 65,181 1,182 55.17
2032 125,236 3,201 39.12 125,017 3,333 37.5 76,765 1,533 50.09 66,865 1,217 54.94
2037 130,120 3,355 38.78 130,008 3,509 37.05 78,794 1,586 49.67 68,439 1,250 54.74
Note: 1. Period used in the analysis consists of 6 am – 9 am (Morning), 9 am – 4 pm (Mid-Day), 4 pm – 7 pm (Evening) and 7 pm 6 am (Overnight) 2. VKT: Vehicle/Kilometer/Hour., VHT: Vehicle/Hour. and SPEED: Kilometers/Hour.
5.5.3 Freight Model
The Freight Model uses Cube Cargo to calculate trip schedules from origin to destination (OD Matrix) in the form of annual weight (tons per annum) for different types of commodities, classified by transportation modes, including a trip table for different types of trucks. Cube Cargo can also create a trip table for cargo delivery in urban areas. All these elements help provide a complete forecast of goods transported by truck.

Executive Summary Report Page 5-27
Transport Data and Model integrated with Multimodal Transport and Logistics (TDL)
PCBK / SEA-CONSULT / PTL
5.6 Traffic Simulation Model
The Traffic Simulation Model simulates traffic flows at a microscopic level used for detailed analyses to evaluate the impact of traffic network improvements on travel demand. It can demonstrate the results in detail in both 2-D and 3-D.
In this study, the consultant has developed a Traffic Simulation Model in the provinces approved by OTP, using Cube Dynasim to simulate traffic flows at a microscopic level for 15 intersections.
Cube Dynasim simulates traffic situation in 2-D and 3-D of cars, trucks, buses, rails, bicycles, and pedestrians, using mathematic modeling to analyze the impact caused by the modifications of geometric design and traffic management schemes, as well as changes in land use and mode of travel.
The analysis of passenger and freight transportation in the network can be divided into 3 levels: macroscopic, mesoscopic, and microscopic levels.
In this study,the consultant has classified 15 intersections in Mukdahan in two categories as shown in Figure 5.6-1 ;
Single Intersection (13 intersections; TMC1, TMC2, TMC3, TMC4, TMC5, TMC6, TMC7, TMC8, TMC9, TMc12, TMC13, TMC14 and TMC15)
Multi Intersection defined by distance between intersections and high traffic volume through intersection(TMC 10 and TMC11).
Figure 5.6-1 Single vs Multi Intersection

Executive Summary Report Page 5-28
Transport Data and Model integrated with Multimodal Transport and Logistics (TDL)
PCBK / SEA-CONSULT / PTL
Table 5.6-1 Result from the Traffic Simulation Model for Multi Intersection
TMC 10
Direction Number of Lane
Traffic Volume through
Intersecton (veh/hr.)
Queue Length (meter)
Avg. Speed (Km./hr.)
Avg. Delay (second)
North 1 179 30 30 46
East 1 478 49 20 64 West 1 241 41 40 55 South 1 128 13 50 73
Avg. Speed = 35 Km./hr. Avg. Delay= 60 second
TMC 11
East 1 395 7 45 22 North 1 249 15 40 23 West 1 326 9 37 24
Avg. Speed = 41 Km./hr. Avg. Delay= 23 second
Table 5.6-2 Result from the Traffic Simulation Model for Single Intersection (AM Peak)
TMC 06
Direction Number of
Lane
Traffic Volume through
Intersecton (veh/hr.)
Queue Length (meter)
Avg. Speed (Km./hr.)
Avg. Delay (second)
North 2 1055 25 40 36 South 2 919 63 24 68 East 2 697 23 38 46
Avg. Speed = 34 Km./hr. Avg. Delay= 50 second
N
Road No. 212
Road No. 2029 (Wiwitsurakarn Road)
N
Road N0. 212
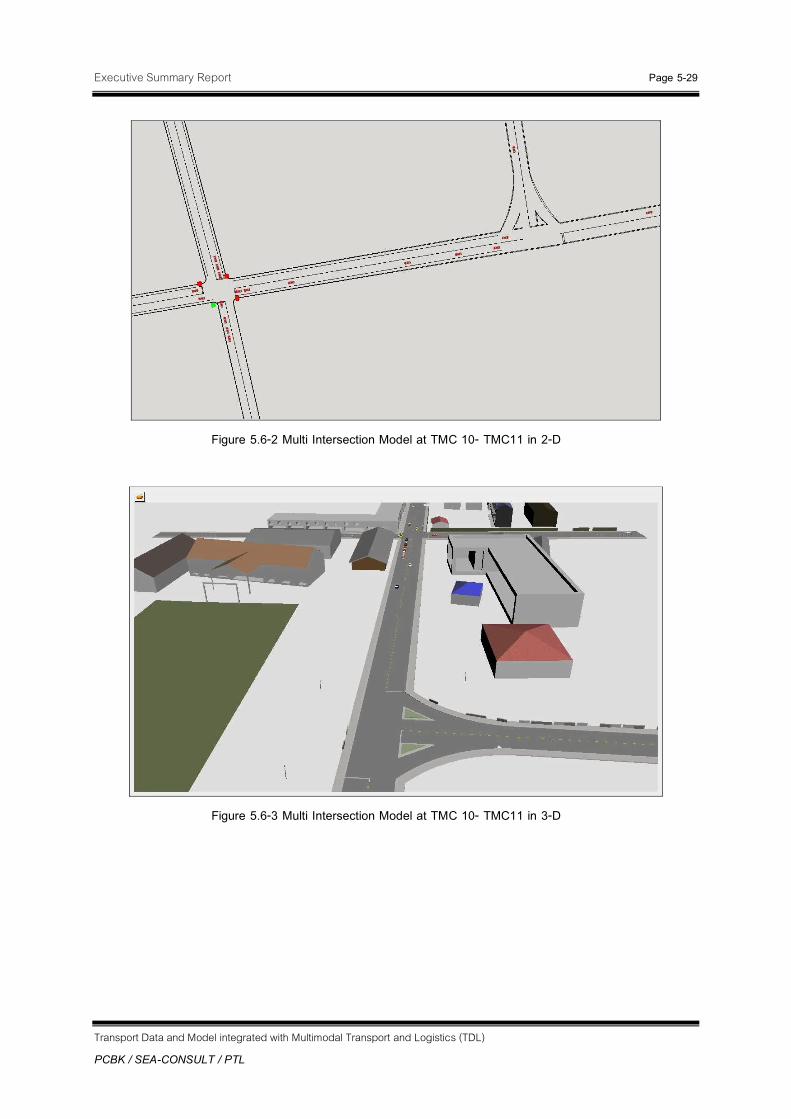
Executive Summary Report Page 5-29
Transport Data and Model integrated with Multimodal Transport and Logistics (TDL)
PCBK / SEA-CONSULT / PTL
Figure 5.6-2 Multi Intersection Model at TMC 10- TMC11 in 2-D
Figure 5.6-3 Multi Intersection Model at TMC 10- TMC11 in 3-D
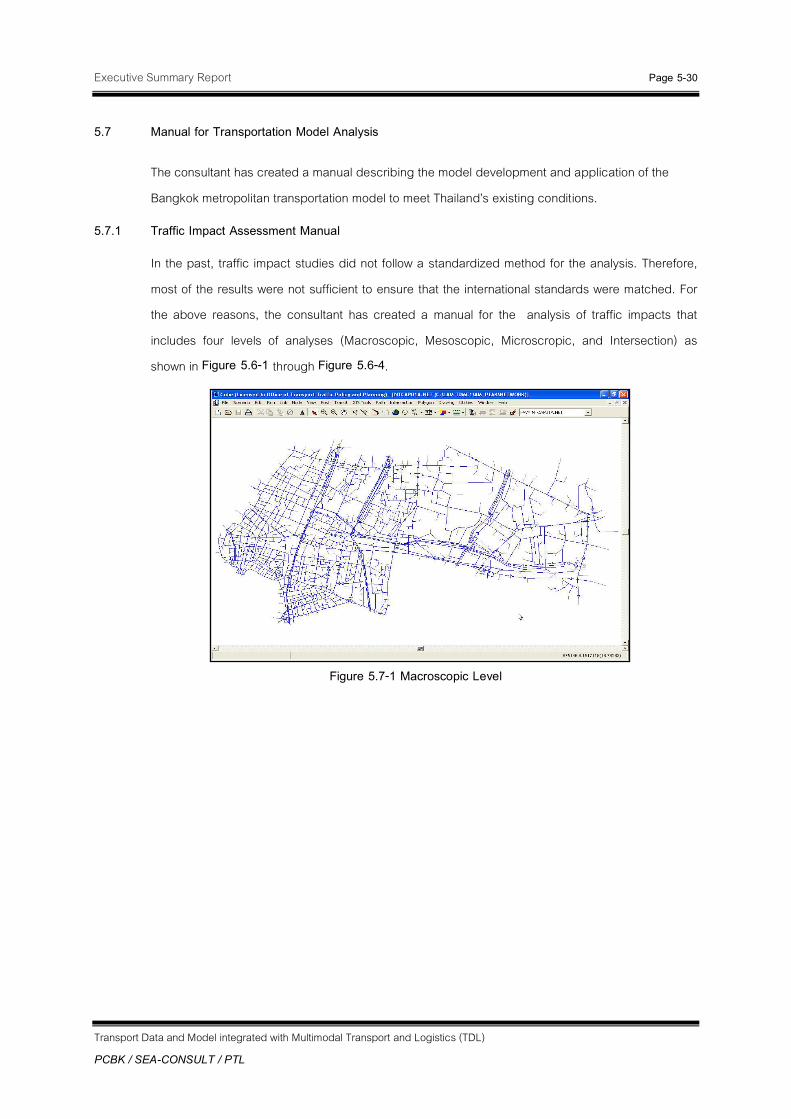
Executive Summary Report Page 5-30
Transport Data and Model integrated with Multimodal Transport and Logistics (TDL)
PCBK / SEA-CONSULT / PTL
5.7 Manual for Transportation Model Analysis
The consultant has created a manual describing the model development and application of the Bangkok metropolitan transportation model to meet Thailand’s existing conditions.
5.7.1 Traffic Impact Assessment Manual
In the past, traffic impact studies did not follow a standardized method for the analysis. Therefore, most of the results were not sufficient to ensure that the international standards were matched. For the above reasons, the consultant has created a manual for the analysis of traffic impacts that includes four levels of analyses (Macroscopic, Mesoscopic, Microscropic, and Intersection) as shown in Figure 5.6-1 through Figure 5.6-4.
Figure 5.7-1 Macroscopic Level

Executive Summary Report Page 5-31
Transport Data and Model integrated with Multimodal Transport and Logistics (TDL)
PCBK / SEA-CONSULT / PTL
Figure 5.7-2 Mesoscopic Level
Figure 5.7-3 Microscopic Level
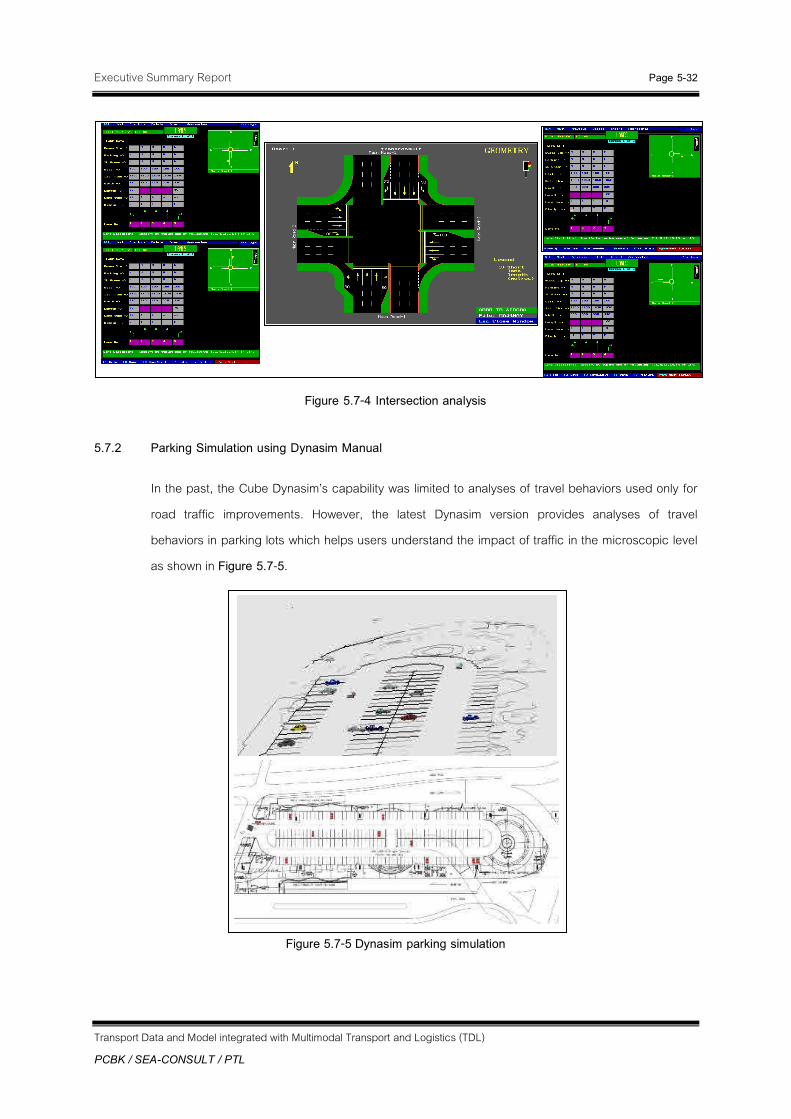
Executive Summary Report Page 5-32
Transport Data and Model integrated with Multimodal Transport and Logistics (TDL)
PCBK / SEA-CONSULT / PTL
Figure 5.7-4 Intersection analysis
5.7.2 Parking Simulation using Dynasim Manual
In the past, the Cube Dynasim’s capability was limited to analyses of travel behaviors used only for road traffic improvements. However, the latest Dynasim version provides analyses of travel behaviors in parking lots which helps users understand the impact of traffic in the microscopic level as shown in Figure 5.7-5.
Figure 5.7-5 Dynasim parking simulation

Executive Summary Report Page 5-33
Transport Data and Model integrated with Multimodal Transport and Logistics (TDL)
PCBK / SEA-CONSULT / PTL
So, the consultant has created a manual describing parking simulation using Dynasim that includes many steps such as built network, car movements, and model calibration. It also provides case studies as examples of applications and a step-by-step tutorial with sample files.
5.7.3 Sugar Network Editor
The Ministry of Transport has a policy that advises all agencies to use the GIS base map as a common standard. Therefore, OTP can continue to improve and maintain GIS in transportation and traffic projects such as TDMC IV through TDML II using the GIS base map recommended by the Ministry of Transport.
The Sugar Network Editor is an extension program from ArcGis developed for the users to create or edit road network intersections and public transport, that can be quick and easy to use with transportation models. An example is provided in Figure 5.7-6.
Figure 5.7-6 Sugar Network Editor’s Example

Executive Summary Report Page 5-34
Transport Data and Model integrated with Multimodal Transport and Logistics (TDL)
PCBK / SEA-CONSULT / PTL
The consultant has created a step-by-step manual describing the Sugar Network Editor used to create and edit network. This manual also provides case studies as examples of applications as well as a step-by-step tutorial with sample files.

CCHHAAPPTTEERR 66 DDAATTAABBAASSEE SSYYSSTTEEMM AANNDD TTRRAANNSSPPOORRTT
MMOODDEELL AAPPPPLLIICCAATTIIOONNSS AANNDD HHUUMMAANN RREESSOOUURRCCEE CCAAPPAACCIITTYY DDEEVVEELLOOPPMMEENNTT

Executive Summary Report Page 6-1
Transport Data and Model integrated with Multimodal Transport and Logistics (TDL)
PCBK / SEA-CONSULT / PTL
CCHHAAPPTTEERR 66 DDAATTAABBAASSEE SSYYSSTTEEMM AANNDD TTRRAANNSSPPOORRTT MMOODDEELL AAPPPPLLIICCAATTIIOONNSS AANNDD HHUUMMAANN RREESSOOUURRCCEE DDEEVVEELLOOPPMMEENNTT
6.1 Preface
6.2 Analysis and Appraisal of Transportation Project
6.3 Technical Consultation
6.4 Seminars
6.5 GIS and MIS Training
6.6 Technology Transfer
6.1 Preface
In this project, the consultant applied transportation model and database that had developed to analyze and solve the traffic and logistic problem. In addition, the consultant also publishes knowledge and technology from project to people who are interested.
6.2 Analysis and Appraisal of Transportation Project
The consultant has applied the transport database and model to the work plans or projects assigned by the Office of Transport and Traffic Policy and Planning (OTP). The model has three levels of application.
The National Model (NAM)
The extended Bangkok Urban Model (eBUM)
Provincial Transportation Model (PTM)
In applying the transport models, the consultant has carried out analyses and assessments of 10 transportation related plans or projects, as defined in the Term of Reference. The Local Area Model is used for projects where the consultant’s work covers urgent and specific traffic problems affecting small areas; for example, the construction of a flyover across an intersection, the management of a one-way traffic system, and the construction of a connecting road to solve super block problems. This is the traffic problem analysis model used in Bangkok and major rural cities. In the case of the models for the Greater Bangkok (eBUM) and/or provincial transport model in the city

Executive Summary Report Page 6-2
Transport Data and Model integrated with Multimodal Transport and Logistics (TDL)
PCBK / SEA-CONSULT / PTL
plan, the analysis and assessment will be carried out on projects focused on the metropolitan areas that affect the overall traffic situation; for example, the use of model for assessing the construction of a bridge across the Chao Phraya River to accommodate the traffic between the East and the West banks of Bangkok, the analysis and assessment of a mass transit rail extension project, etc. As regards to the model application at the national level, an example project is the construction of an inter-city motorway.
In applying the transport models, the consultant has carried out analyses and assessments of 10 work plans or projects, out of which three projects have been completed as follows :
1) Traffic Impact Assessments Analysis: Study area Ladkrabang district.
2) Analysis of travel and traffic patterns to accommodate trip from Suvarnabhumi Airport.
3) Site feasibility study for relocation of the new distribution center in Bangkok and vicinity.
4) Traffic Impact Assessments of closing a main intersection using Mesoscopic model in eBUM model.
5) Traffic Impact Assessments of Thailand’s new parliament using Mesoscopic model in eBUM model.
6) Accessibility analysis of Suvarnabhumi Airport Rail Link using eBUM model and GIS system.
7) Internal traffic analysis of Thailand’s new parliament using Microscopic Simulation.
8) Application of NAM model to analyze the change of transportation mode related to the change of transportation cost in the case study of chilled shrimp, fresh rubber, and orchids.
9) Application of GIS for detailed product information.
10) Traffic Impact Assessments of Mukdahan province.
6.3 Technical Consultation
As part of the consultation services provided on the improvement and maintenance of transport database and models for OTP, the consultant was pleased to cooperate with OTP in order to:
Provide in-house consultation to the OTP
Participate in the project meetings under OTP’s responsibility as delegated
Give academic opinion and justification on transportation and traffic as delegated by OTP
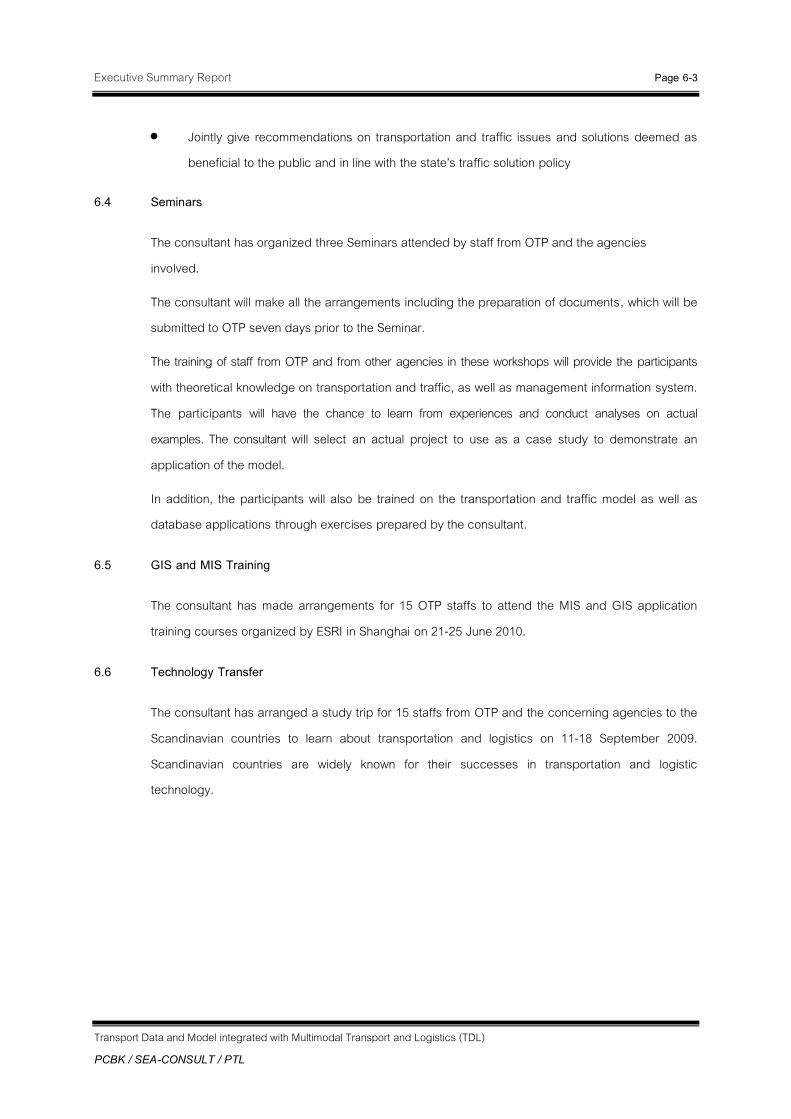
Executive Summary Report Page 6-3
Transport Data and Model integrated with Multimodal Transport and Logistics (TDL)
PCBK / SEA-CONSULT / PTL
Jointly give recommendations on transportation and traffic issues and solutions deemed as beneficial to the public and in line with the state’s traffic solution policy
6.4 Seminars
The consultant has organized three Seminars attended by staff from OTP and the agencies involved.
The consultant will make all the arrangements including the preparation of documents, which will be submitted to OTP seven days prior to the Seminar.
The training of staff from OTP and from other agencies in these workshops will provide the participants with theoretical knowledge on transportation and traffic, as well as management information system. The participants will have the chance to learn from experiences and conduct analyses on actual examples. The consultant will select an actual project to use as a case study to demonstrate an application of the model.
In addition, the participants will also be trained on the transportation and traffic model as well as database applications through exercises prepared by the consultant.
6.5 GIS and MIS Training
The consultant has made arrangements for 15 OTP staffs to attend the MIS and GIS application training courses organized by ESRI in Shanghai on 21-25 June 2010.
6.6 Technology Transfer
The consultant has arranged a study trip for 15 staffs from OTP and the concerning agencies to the Scandinavian countries to learn about transportation and logistics on 11-18 September 2009. Scandinavian countries are widely known for their successes in transportation and logistic technology.