Executive and director compensation 2014 - Hay - Hay … group executive director comp... · Study...
48
Data, trends and strategies Executive compensation year in review series Executive and director compensation 2014
Transcript of Executive and director compensation 2014 - Hay - Hay … group executive director comp... · Study...
Data, trends and strategiesExecutive compensation year in review series
Executive and director
compensation2014
2Executive and director compensation 2014 | Data, trends and strategies
Copyright © 2014, Hay Group. All rights reserved.
Contents
Executive and director compensation: 2014 year in review 3
CEO compensation 4
Short-term and long-term incentive plan performance measures 10
Performance-based stock options 15
Restricted stock and restricted stock unit prevalence 21
Executive perquisites: Prevalence 24
Director compensation and benefits survey 27
Lead director compensation 33
Director stock ownership guidelines and holding requirements 36
Non-CEO chairman compensation: Executive and non-executive positions 41
An experienced partner: Your Hay Group team 48
3Executive and director compensation 2014 | Data, trends and strategies
Copyright © 2014, Hay Group. All rights reserved.
During 2014, Hay Group conducted studies and analyses on various aspects of executive and director compensation for The Wall Street Journal. We began in May 2014 with an examination of CEO compensation at the 300 largest US companies that filed their final definitive proxy statement between May 1, 2013 and April 30, 2014 (“Hay Group 300”). This study furnished a snapshot of total compensation as disclosed in each company’s proxy statement and our findings appear in the first summary in this compilation.
As 2014 proceeded, we examined various other topics affecting executive or director compensation – whether as to amounts or prevalence – among the Hay Group 300. Hot topics such as performance measures and perquisites were reviewed as well as key aspects of director pay and roles. Together with the CEO compensation study, our analyses provide a coordinated picture of how the largest US public companies handle some of the most important issues in their relationships with their top executives and board members.
Executive and director compensation: 2014 year in review
4Executive and director compensation 2014 | Data, trends and strategies
Copyright © 2014, Hay Group. All rights reserved.
Study of 2014 Hay Group 300 CEO pay levels CEO compensation showed solid increases in 2013 for the first time since 2010 while shareholder perception remained “front and center” among compensation decision-makers. Overall the delivery of pay remained highly volatile and performance-based in a record year for companies and their shareholders.
A banner year for shareholders yields solid gains in pay levelsIn our annual study of CEO compensation, which we conducted with The Wall Street Journal, we analyzed CEO pay at the Hay Group 300 against last year’s record-breaking performance for shareholders. In determining a CEO’s pay we used his or her total direct compensation (TDC), which consists of salary, bonus or other annual incentives paid and any long-term incentive awards (long-term stock or cash) granted.
CEO compensation increased solidly during 2013, but its growth trailed stock market gains and a remarkable 33.8 percent total shareholder return (TSR). Companies were also more profitable in 2013, with a median net income growth of eight percent.
However, GDP growth in the US and globally was stagnant, most measures of productivity were down and inflation was modest, yielding very little top-line growth for most companies. Greater profitability instead was achieved through enhanced efficiency and low wage growth. After years of issuing debt to take advantage of historically low interest rates, companies reaped the benefits of having invested in their core businesses and managed to “do more with less.”
CEO compensation
5Executive and director compensation 2014 | Data, trends and strategies
Copyright © 2014, Hay Group. All rights reserved.
CEO compensation changes and values, 2013
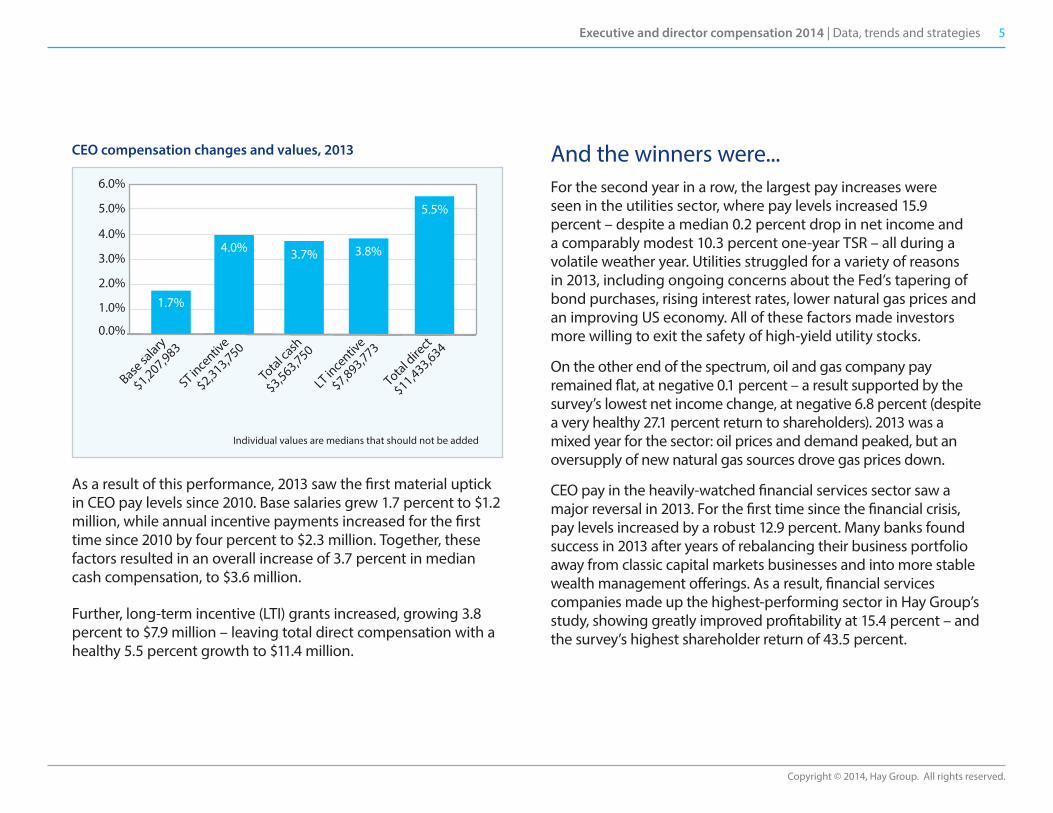
As a result of this performance, 2013 saw the first material uptick in CEO pay levels since 2010. Base salaries grew 1.7 percent to $1.2 million, while annual incentive payments increased for the first time since 2010 by four percent to $2.3 million. Together, these factors resulted in an overall increase of 3.7 percent in median cash compensation, to $3.6 million.
Further, long-term incentive (LTI) grants increased, growing 3.8 percent to $7.9 million – leaving total direct compensation with a healthy 5.5 percent growth to $11.4 million.
And the winners were...For the second year in a row, the largest pay increases were seen in the utilities sector, where pay levels increased 15.9 percent – despite a median 0.2 percent drop in net income and a comparably modest 10.3 percent one-year TSR – all during a volatile weather year. Utilities struggled for a variety of reasons in 2013, including ongoing concerns about the Fed’s tapering of bond purchases, rising interest rates, lower natural gas prices and an improving US economy. All of these factors made investors more willing to exit the safety of high-yield utility stocks.
On the other end of the spectrum, oil and gas company pay remained flat, at negative 0.1 percent – a result supported by the survey’s lowest net income change, at negative 6.8 percent (despite a very healthy 27.1 percent return to shareholders). 2013 was a mixed year for the sector: oil prices and demand peaked, but an oversupply of new natural gas sources drove gas prices down.
CEO pay in the heavily-watched financial services sector saw a major reversal in 2013. For the first time since the financial crisis, pay levels increased by a robust 12.9 percent. Many banks found success in 2013 after years of rebalancing their business portfolio away from classic capital markets businesses and into more stable wealth management offerings. As a result, financial services companies made up the highest-performing sector in Hay Group’s study, showing greatly improved profitability at 15.4 percent – and the survey’s highest shareholder return of 43.5 percent.
5.5%
1.7%
4.0% 3.8%3.7%
Individual values are medians that should not be added
0.0%
1.0%
2.0%
3.0%
4.0%
5.0%
6.0%
Base sa
lary
$1,207,983
ST ince
ntive
$2,313,750
Total c
ash
$3,563,750
LT in
centiv
e
$7,893,773
Total dire
ct
$11,433,634

6Executive and director compensation 2014 | Data, trends and strategies
Copyright © 2014, Hay Group. All rights reserved.
Realized long-term incentive (LTI) pay remained strongFor the third year in a row, CEOs realized significant compensation in the form of “realized” or take-home equity-based pay. After 2012, when realized pay increased to record levels, 2013 saw realized LTI nearly flat at $7.9 million. Take-home pay from stock option exercises declined as companies used fewer of them, while realized compensation from time-vested restricted stock and performance awards increased. These historically high levels of realized pay are reminders that today’s pay schemes provide CEOs with the potential for much more volatile pay outcomes than in the past.
Long-term performance plans continued their steep inclinePay designs in 2013 set CEOs up for increasingly volatile pay outcomes. For the third year in a row, long-term performance plans were the most heavily-weighted piece of the entire pay puzzle, making up 32.3 percent of the average CEO’s total compensation, up from 30.3 percent the year before. Performance awards outpaced bonuses – a similarly volatile element that ranked second in pay emphasis – making up 22 percent of the average CEO’s pay package.
Shareholders consider performance awards the most important element within a CEO’s pay package, as most of these plans only vest when a company achieves prescribed objectives. Some companies have implemented these plans as a way to appease their shareholders’ concerns about pay and performance, while other companies are using the plans to align the senior team around key long-term milestones.
Change in CEO LTI mix, 2012–2013
Includes only constant incumbents
0% 20% 40% 60% 80% 100%
2013 LTI
2012 LTI
Percentage of LTI
27%
28%
22%
23%
51%
49%
Stock options/SARs Restricted stock Performance awards
7Executive and director compensation 2014 | Data, trends and strategies
Copyright © 2014, Hay Group. All rights reserved.
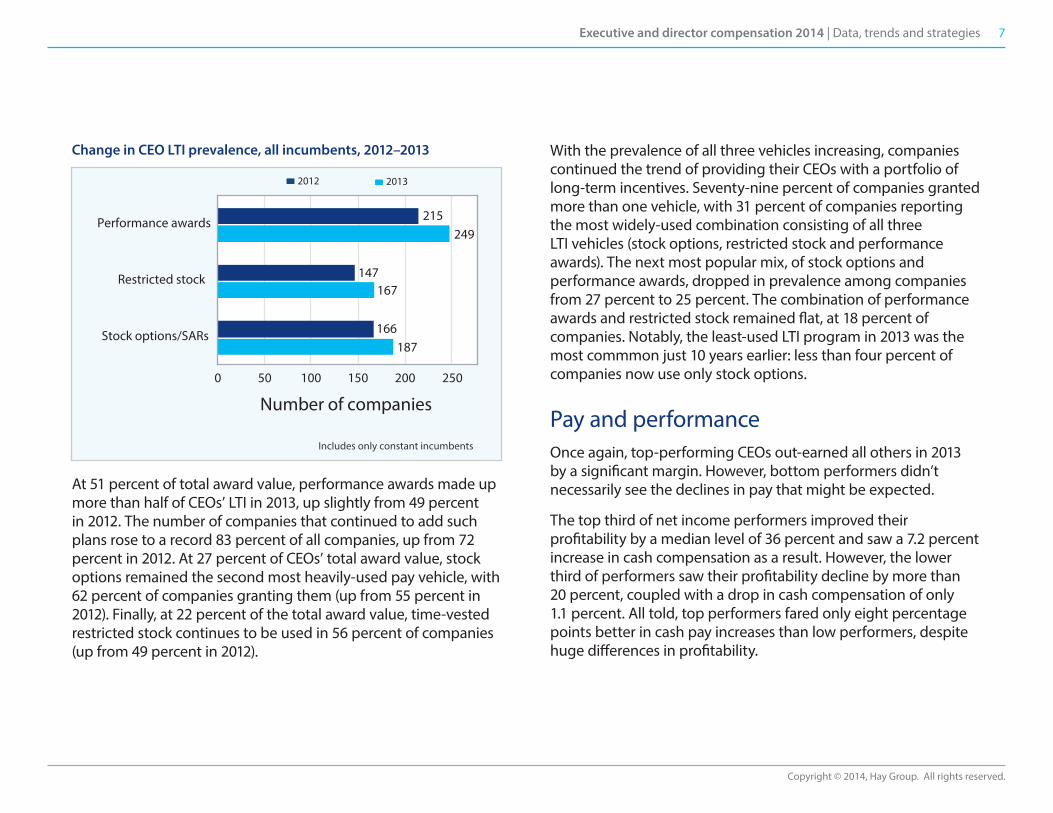
Change in CEO LTI prevalence, all incumbents, 2012–2013
At 51 percent of total award value, performance awards made up more than half of CEOs’ LTI in 2013, up slightly from 49 percent in 2012. The number of companies that continued to add such plans rose to a record 83 percent of all companies, up from 72 percent in 2012. At 27 percent of CEOs’ total award value, stock options remained the second most heavily-used pay vehicle, with 62 percent of companies granting them (up from 55 percent in 2012). Finally, at 22 percent of the total award value, time-vested restricted stock continues to be used in 56 percent of companies (up from 49 percent in 2012).
With the prevalence of all three vehicles increasing, companies continued the trend of providing their CEOs with a portfolio of long-term incentives. Seventy-nine percent of companies granted more than one vehicle, with 31 percent of companies reporting the most widely-used combination consisting of all three LTI vehicles (stock options, restricted stock and performance awards). The next most popular mix, of stock options and performance awards, dropped in prevalence among companies from 27 percent to 25 percent. The combination of performance awards and restricted stock remained flat, at 18 percent of companies. Notably, the least-used LTI program in 2013 was the most commmon just 10 years earlier: less than four percent of companies now use only stock options.
Pay and performanceOnce again, top-performing CEOs out-earned all others in 2013 by a significant margin. However, bottom performers didn’t necessarily see the declines in pay that might be expected.
The top third of net income performers improved their profitability by a median level of 36 percent and saw a 7.2 percent increase in cash compensation as a result. However, the lower third of performers saw their profitability decline by more than 20 percent, coupled with a drop in cash compensation of only 1.1 percent. All told, top performers fared only eight percentage points better in cash pay increases than low performers, despite huge differences in profitability.
0 50 100 150 200 250
Number of companies
Includes only constant incumbents
Stock options/SARs
Restricted stock
Performance awards
187166
167147
249215
2012 2013
8Executive and director compensation 2014 | Data, trends and strategies
Copyright © 2014, Hay Group. All rights reserved.
Over the longer term, when comparing realized LTI pay to three-year TSR, top performers outgained low-performing CEOs by a substantial margin, but did not outgain middle performers by a significant amount. The top third of TSR performers realized $12.1 million in 2013 for TSR performance of 29.1 percent, while the bottom third made only $3.2 million for 3.1 percent TSR. However, the middle third realized $8.1 million, despite TSR that was just more than half (at 16.5 percent) of the top performers.
Both results are likely diluted by the strong stock price performance for companies in 2013, which may have been enough to make both shareholders and compensation decision-makers less sensitive to pay outcomes for the year.
Where it’s all headedDespite progress in “bullet-proofing” pay programs in recent years, companies continued to keep the pressure on paying for performance in 2013. However, the jury’s still out on whether or not these programs will withstand scrutiny in a year when shareholders don’t win.
During the last four years of shareholder input (“say-on-pay”), a bull market provided ever-increasing returns to shareholders. Over that period, companies have continued to make more money, grow and create value for shareholders.
Looking back
In retrospect, the increasing performance volatility in today’s executive pay packages couldn’t have come at a better time for CEOs. They continue to realize more pay than at any point before – in large part because their equity stakes have vested at materially higher prices than when they were granted, and they’ve often vested at above-target levels. In addition, companies with four straight years of high say-on-pay approval outcomes may begin to feel that their pay programs aren’t at risk of negative shareholder sentiment.
However, the true test of these programs only will be seen during a period of contraction, when growth slows or reverses or shareholders lose value. Given the performance volatility inherent in today’s CEO pay packages, a contraction will yield realizable pay values that are far lower than what CEOs are seeing today.
In that year, pay programs will be put to the test. Will shareholders support a pay program at a 95 percent approval in a year when they’ve lost 15 percent of their value? Will compensation committees that see their executives’ realizable pay decline in that same year look to re-load them the next year, as happened in 2009?
9Executive and director compensation 2014 | Data, trends and strategies
Copyright © 2014, Hay Group. All rights reserved.
Looking ahead
For 2014, we expect companies to continue to close the narrowing gap between their pay programs and shareholder perception. We expect to see greater use of “realizable pay” disclosures that better align the intrinsic value of LTI awards with company performance, further movement to performance- vested equity plans and continued eliminations of perquisites. In short, we anticipate more “performance-based” pay – and even more volatility on potential pay outcomes.
The danger in this trend towards greater volatility is that it may not be right for every company. While pay has undoubtedly become more performance-based, not every company has the type of volatility inherent in their business outcomes to support extreme pay volatility. When the difference between a “poor” and “great” performance year lies in a relatively narrow range, does it make sense for a CEO’s incentives to range from zero to double a large target incentive?
This is the paradox of over-reliance on market practice. Companies want to know how their peers are doing things, and to keep abreast of industry trends and “best practices.” However, in that process, the opportunity for a company to create a misalignment with their business becomes dangerously real. Effective pay programs tailor to the strategic needs of the company while doing enough to head off shareholder concerns.
10Executive and director compensation 2014 | Data, trends and strategies
Copyright © 2014, Hay Group. All rights reserved.
As companies and boards have become increasingly interested in selecting the appropriate performance measures for incentive programs at their organizations, the Hay Group 300 companies were examined to determine which performance measures were used in short-term and long-term incentive plans.
Short-term incentive (STI) plan performance metricsAll (100 percent) of the Hay Group 300 companies that had a STI plan disclosed the performance measures used in 2013. The most common STI performance metric was some form of earnings metric (earnings, profits, net income, pre-tax net income, operating income, EBITDA or earnings per share (EPS)) mentioned by 91.6 percent of the 296 companies disclosing performance metrics.
Individually, the most common STI plan metrics were sales/revenues (44.9 percent), earnings per share (40.2 percent), operating income (39.5 percent), cash flow (30.7 percent), meeting strategic goals (29.7 percent), expense control/cost containment (19.9 percent), safety (18.2 percent), after-tax net income (16.9 percent), EBITDA (16.9 percent), return on investment (ROI)/return on invested capital (ROIC) (16.2 percent) and customer satisfaction (14.5 percent).
Short-term and long-term incentive plan performance measures

11Executive and director compensation 2014 | Data, trends and strategies
Copyright © 2014, Hay Group. All rights reserved.
Discretionary goals were disclosed at 12.5 percent of the sample versus 10.9 percent last year. Over one-half of the companies (50.7 percent) of the sample mentioned factoring individual performance into their review.
Multi-year STI plan performance metrics, 2012–2013
Other STI plan performance measures mentioned 10 or more times include:
� Leadership: 9.8 percent
� Environmental performance: 9.8 percent
� Pre-tax net income: 9.5 percent
� Return on equity (ROE): 9.1 percent
� Gross margin: 9.1 percent
� Operational goals: 9.1 percent
� Diversity: 7.8 percent
� Employee/management development: 7.4 percent
� Quality: 7.1 percent
� Earnings (not further defined): 5.7 percent
� Return on assets (ROA): 5.1 percent
� Acquisitions: 4.7 percent
� Total shareholder return (TSR): 4.4 percent
� New product/business development: 4.4 percent
� Unit/division goals: 4.1 percent
� Efficiency: 3.7 percent
� Succession planning: 3.7 percent
� Health performance: 3.4 percent
Almost three-quarters (72.3 percent) of the sample used four or more short-term incentive plan performance metrics in 2013, while only 4.7 percent of the sample used only one performance metric.
Multi-year prevalence: increases/decreases in prevalence of STI performance metrics During the last year, sales/revenues became the most common individual STI plan performance measure, increasing to 44.9 percent from 41.3 percent the prior year.
0%
20%
40%
60%
Customer s
atisfactio
n
Return
on investm
ent/ROIC
EBITDA
After-t
ax net inco
me
Safety
Expense co
ntrol/C
ost co
ntainment
Meeting st
rategic goals
Operating in
come
Earnings p
er share
Sales/Revenues
Cash �ow
20122013
12Executive and director compensation 2014 | Data, trends and strategies
Copyright © 2014, Hay Group. All rights reserved.
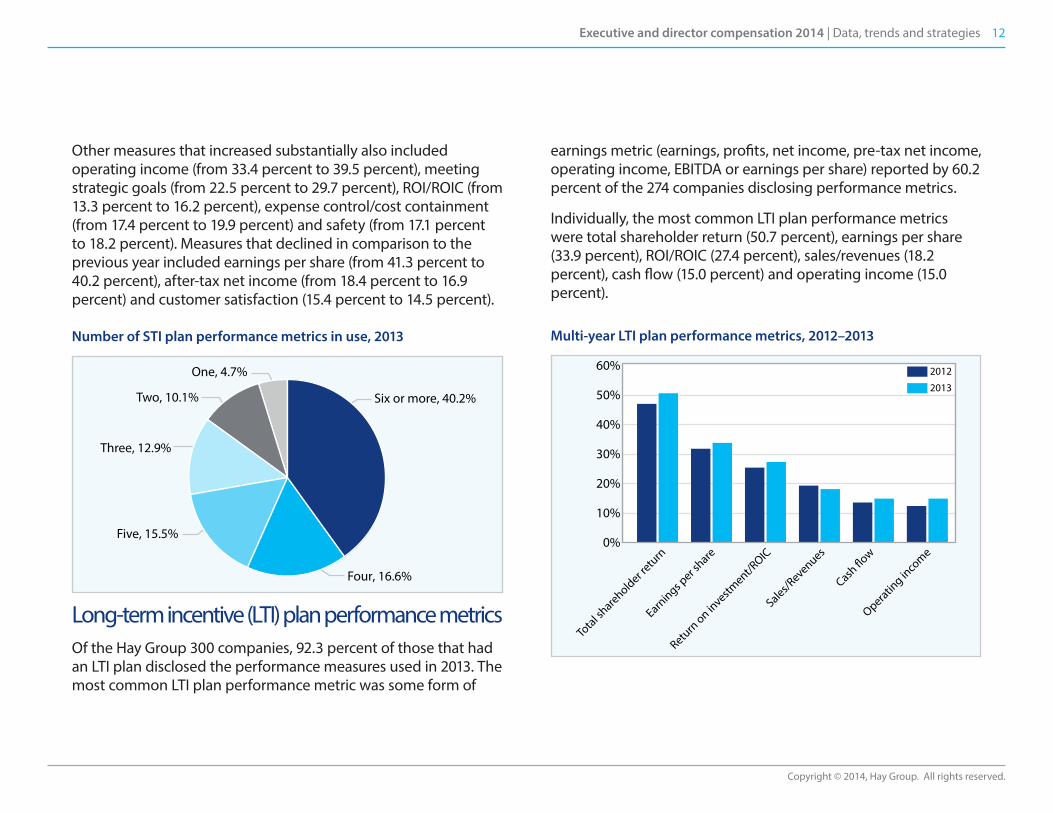
Other measures that increased substantially also included operating income (from 33.4 percent to 39.5 percent), meeting strategic goals (from 22.5 percent to 29.7 percent), ROI/ROIC (from 13.3 percent to 16.2 percent), expense control/cost containment (from 17.4 percent to 19.9 percent) and safety (from 17.1 percent to 18.2 percent). Measures that declined in comparison to the previous year included earnings per share (from 41.3 percent to 40.2 percent), after-tax net income (from 18.4 percent to 16.9 percent) and customer satisfaction (15.4 percent to 14.5 percent).
Number of STI plan performance metrics in use, 2013
Long-term incentive (LTI) plan performance metricsOf the Hay Group 300 companies, 92.3 percent of those that had an LTI plan disclosed the performance measures used in 2013. The most common LTI plan performance metric was some form of
earnings metric (earnings, profits, net income, pre-tax net income, operating income, EBITDA or earnings per share) reported by 60.2 percent of the 274 companies disclosing performance metrics.
Individually, the most common LTI plan performance metrics were total shareholder return (50.7 percent), earnings per share (33.9 percent), ROI/ROIC (27.4 percent), sales/revenues (18.2 percent), cash flow (15.0 percent) and operating income (15.0 percent).
Multi-year LTI plan performance metrics, 2012–2013
One, 4.7%
Two, 10.1%
Three, 12.9%
Five, 15.5%
Four, 16.6%
Six or more, 40.2%
0%
10%
20%
30%
40%
50%
60%
2013
2012
Operating in
come
Sales/Revenues
Cash �ow
Return
on investm
ent/ROIC
Earnings p
er share
Total sh
areholder retu
rn

13Executive and director compensation 2014 | Data, trends and strategies
Copyright © 2014, Hay Group. All rights reserved.
Other LTI plan performance measures mentioned ten or more times include:
� Return on equity: 9.9 percent
� EBITDA: 9.1 percent
� After-tax net income: 6.6 percent
� Pre-tax net income: 5.5 percent
� Stock price: 5.1 percent
� Return on assets: 4.4 percent
� Gross margin: 4.4 percent
� Expense control/cost containment: 3.6 percent
Only 17.4 percent of the sample used four or more LTI plan performance metrics in 2013; over one-quarter (27.1 percent) of the sample used only one performance metric.
Multi-year prevalence: Increases/decreases in prevalence of LTI performance metrics The goals that changed the most include TSR (which increased from 47.1 percent to 50.7 percent), operating income (up from 12.5 percent to 15.0 percent), EPS (rose from 31.9 percent to 33.9 percent), ROIC (up from 25.5 percent to 27.4 percent) and sales/revenues (down from 19.4 percent to 18.2 percent).
Number of LTI plan performance metrics in use in 2013
Relative performance measures are here to stayDuring the last year, the disclosure of relative performance measures has gained more interest as most plans that use total shareholder return as a metric employ a relative comparison to peer groups. Typically, the peer group was a defined sample of a specific number of comparable companies, the S&P 500 (or some other large defined index) and/or an industry peer group index (such as a defined S&P 500 industry comparison like the S&P 500 Electric Utilities, the S&P 500 Health Care companies or some other group such as the Philadelphia Utility Index).
For STI plan performance metrics, only 4.4 percent of the companies disclosed TSR as a performance metric and all of them reported the use of relative performance metrics; only one company specifically also mentioned using an absolute TSR
Four or more
Three
One
Two
Four or more, 17.4%
Three, 22.1%
One, 27.1%
Two, 33.4%
14Executive and director compensation 2014 | Data, trends and strategies
Copyright © 2014, Hay Group. All rights reserved.
measure. However, some companies also mentioned using other relative performance measures such as net income, EPS, sales/revenues and ROIC.
For LTI plan performance metrics, 50.7 percent of the companies disclosed TSR as a performance metric, with 97.8 percent of these companies reporting use of a relative performance metric; only seven companies specifically mentioned using an absolute TSR measure. Similar to the STI plan performance metrics, some companies also disclosed using other relative performance measures such as EPS, ROE and ROCE.
These findings suggest that relative performance measures are here to stay.
What does the future hold for STI and LTI plan performance metrics?The multi-year prevalence data for STI demonstrates continued growth in many financial and non-financial performance measures such as sales, operating income, meeting strategic goals, ROI/ROIC, expense control/cost containment and safety. Some of the financial and non-financial performance measures that declined in prevalence include earnings per share, after-tax net income and customer satisfaction.
The multi-year prevalence data for long-term incentives shows the largest growth in TSR and operating income, while the largest decline was in sales.
Looking ahead
We expect more companies will add non-financial performance metrics to their STI performance plans. At the same time companies likely will continue and add to their use of financial performance metrics.
We don’t anticipate seeing LTI plan performance metrics change much in the near future.
15Executive and director compensation 2014 | Data, trends and strategies
Copyright © 2014, Hay Group. All rights reserved.
Prompted by the focus in recent years on “performance” criteria in structuring executive pay arrangements, we examined the use of performance-based stock options among the Hay Group 300. To date, performance-based stock options – which for purposes of our study included performance-based stock appreciation rights (SARs) – have not constituted a prevalent form of executive reward. Nevertheless, we found that, while stock option grants declined in prevalence among the Hay Group 300 in each of the past five years except 2013, performance-based stock options rose each of the past five years except 2013.
Stock option definitionsThe typical “plain vanilla” stock option is a time-vesting vehicle where the individual is granted the right to purchase a defined number of shares at a specified price – typically fair market value – over a defined period of time. Often the option is exercisable only after a waiting period (commonly one year); the optionee then can exercise the option in full (cliff vesting) or in a set number of installments (ratable vesting, with typically three or four equal annual installments tied to anniversaries of the grant date).
Performance-based stock options
16Executive and director compensation 2014 | Data, trends and strategies
Copyright © 2014, Hay Group. All rights reserved.
Stock options are either:
Non-qualified: the optionee owes no income tax when granted but must pay ordinary income tax on the spread between the exercise (strike) price and the market price of the stock when exercised; or
Incentive: the optionee owes no income tax at grant or on exercise of an incentive stock option (ISO), as the taxation is deferred until the stock is sold. At that time, the option gain is taxed at long-term capital gains rates if the sale is at least two years after grant and one year after exercise. However, unlike a non-qualified stock option, an ISO award is not deductible by the company (unless it later is disqualified). In addition, ISOs are an income tax preference item for purposes of the alternative minimum tax and have a number of other potential complications that in recent years have limited their use outside of certain types of companies (e.g., start-ups), industries (e.g., tech) and locales (e.g., Silicon Valley).
Other forms of stock options evolved over time, including premium stock options, discount stock options, indexed stock options and performance-based stock options.
Premium stock options: The stock option exercise price is set at greater than market value, so the market value of a share must rise a specified percentage or to a specific price before the stock option is in the money. Where used, we often see a 10 percent, 15 percent or 25 percent premium.
Discount stock options: The stock option exercise price is set at lower than the market value of a share at grant, which means that a discount option’s market value is already in the money at grant. Such options have largely disappeared due to accounting, income tax, governance and exchange listing rule changes and requirements.
Indexed stock options: The stock option exercise price is linked to the performance of an index, such as the S&P 500 or a peer group index. Thus the exercise price of the option can fluctuate above and below market value as the index’s value fluctuates; for the indexed option to have value, the company’s performance must outperform the index. Indexed options have had limited usage to date.
17Executive and director compensation 2014 | Data, trends and strategies
Copyright © 2014, Hay Group. All rights reserved.
Performance-based stock options: The stock option is not exercisable until certain specific conditions are met (e.g., the share price must attain a specific level or the company must meet certain goals). Performance-based stock options are commonly categorized in one of two buckets:
Performance-contingent stock options: The stock option may only be exercised if certain specified goals are attained.
Performance-accelerated stock options: The stock option exercise schedule may be accelerated if certain specified goals are attained. For example, stock options may be exercised after a defined long period of time (e.g., five years to 9.5 years) whether or not goals are met. If the goals (which may be market-based or financial-based, with differing accounting considerations) are satisfied, the vesting accelerates to a shorter time period.
One other form of stock option – the performance-granted stock option – is not captured here as a performance-based stock option because its exercise is not conditioned upon meeting performance goals. Rather, the company sets a short-term period (often one year) over which certain goals must be met for the stock option to be granted. The award vehicle actually is more like a performance share that has a one-year performance cycle, with payment (after meeting the targets) made in the form of stock options.
Stock option growthStock options grew in popularity during the 1970s and 1980s, and were the leading LTI vehicle through the 1990s. But stock options had their share of controversy even then, especially increasingly large awards. “Mega-grants” of stock options at times were awarded to CEOs as an inducement to lure them to a new company. CEOs whose stock option mega-grants made the most noise include Lee Iacocca at Chrysler and Michael Eisner at Disney. At one point, Mr. Eisner had many hundreds of millions of dollars of potential option gains. In fact, he exercised options on over seven million shares, reaping a gain of almost $600 million.
Soon shareholders, shareholder activists and the press began criticizing the continuing growth in option mega-grants. Ultimately, accounting and securities regulators took actions that diminished the attractiveness of stock options. After years of debate among interested parties, the Financial Accounting Standards Board (FASB) announced a shift in the financial treatment of stock options in March 2004 when it released a draft accounting statement (whose principles subsequently were adopted by FASB) titled Share-Based Payment, providing for the grant date value of a stock option to be expensed over the vesting period of the option. The Securities and Exchange Commission acted in 2006 by adopting new reporting requirements that included performance information.
In reaction to these regulatory changes and to shareholders’ growing desire for performance criteria in executive awards, companies reduced or even eliminated stock option programs while adding performance-based programs (e.g., performance shares or units, performance restricted stock or units, performance units or performance cash).
18Executive and director compensation 2014 | Data, trends and strategies
Copyright © 2014, Hay Group. All rights reserved.
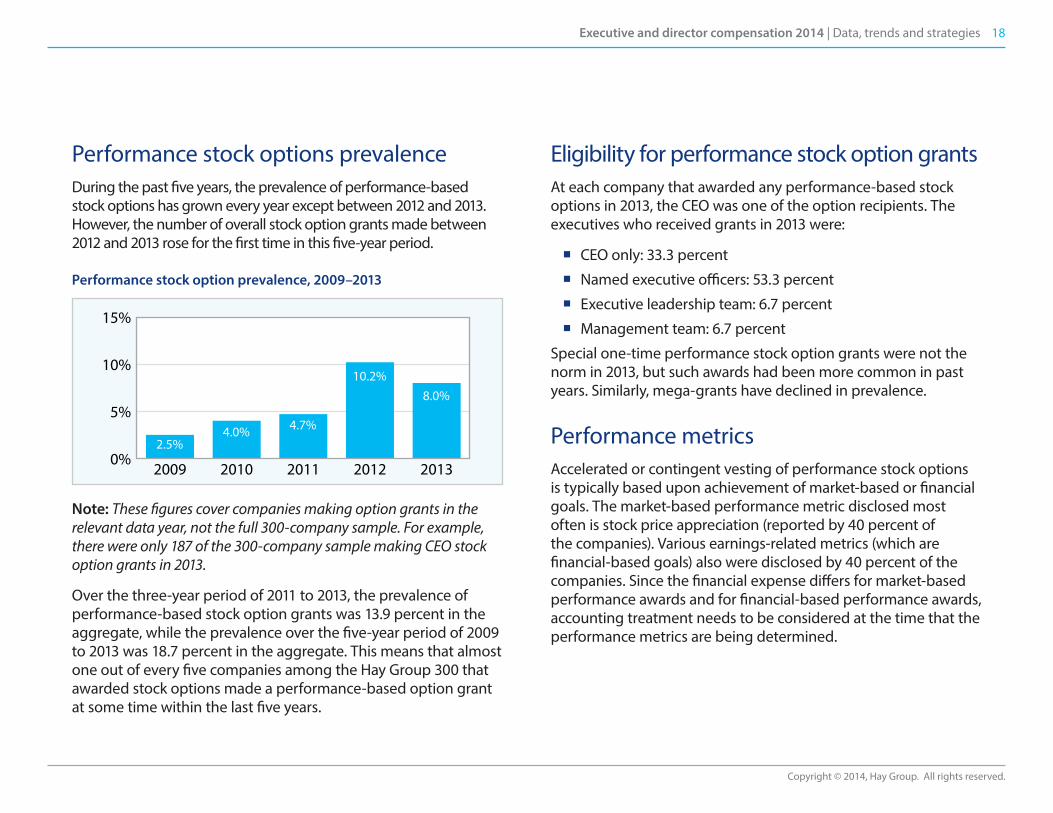
Performance stock options prevalenceDuring the past five years, the prevalence of performance-based stock options has grown every year except between 2012 and 2013. However, the number of overall stock option grants made between 2012 and 2013 rose for the first time in this five-year period.
Performance stock option prevalence, 2009–2013
Note: These figures cover companies making option grants in the relevant data year, not the full 300-company sample. For example, there were only 187 of the 300-company sample making CEO stock option grants in 2013.
Over the three-year period of 2011 to 2013, the prevalence of performance-based stock option grants was 13.9 percent in the aggregate, while the prevalence over the five-year period of 2009 to 2013 was 18.7 percent in the aggregate. This means that almost one out of every five companies among the Hay Group 300 that awarded stock options made a performance-based option grant at some time within the last five years.
Eligibility for performance stock option grantsAt each company that awarded any performance-based stock options in 2013, the CEO was one of the option recipients. The executives who received grants in 2013 were:
� CEO only: 33.3 percent
� Named executive officers: 53.3 percent
� Executive leadership team: 6.7 percent
� Management team: 6.7 percent
Special one-time performance stock option grants were not the norm in 2013, but such awards had been more common in past years. Similarly, mega-grants have declined in prevalence.
Performance metricsAccelerated or contingent vesting of performance stock options is typically based upon achievement of market-based or financial goals. The market-based performance metric disclosed most often is stock price appreciation (reported by 40 percent of the companies). Various earnings-related metrics (which are financial-based goals) also were disclosed by 40 percent of the companies. Since the financial expense differs for market-based performance awards and for financial-based performance awards, accounting treatment needs to be considered at the time that the performance metrics are being determined.
0%
5%
10%
15%
20132012201120102009
8.0%10.2%
4.7%4.0%2.5%
19Executive and director compensation 2014 | Data, trends and strategies
Copyright © 2014, Hay Group. All rights reserved.
Below is a list of the performance measures disclosed in the proxy statements; since a number of companies mentioned multiple performance metrics, the totals exceed 100 percent:
� Stock price appreciation: 40.0 percent
� Earnings-related metrics: 40.0 percent
− Earnings per share: 20.0 percent
− Earnings: 6.7 percent
− EBITDA: 6.7 percent
− Operating income: 6.7 percent
� Total shareholder return: 3.3 percent
� Revenues: 6.7 percent
� Return on assets: 6.7 percent
� Free cash flow: 6.7 percent
� Individual performance goals: 6.7 percent
Among the companies that use stock price appreciation as a performance measure, the median amount of appreciation over market value on grant date that was required for the options to become fully exercisable was 40 percent; stock price appreciation ranged from a low of 15 percent to a high of 153 percent.
The use of stock price appreciation as a performance measure is interesting because the share price is already a determinant of the option’s value to the optionee. As is the case for any stock option, the executive profits only to the extent that the stock price increases. With a performance stock option whose exercisability is based on stock price appreciation, the executive receives the same profit as from a regular option, but the profit is delayed until specific stock price hurdles are achieved; if not achieved, performance-contingent stock options will be forfeited.
Performance cycleSimilar to regular stock option awards, the typical performance stock option grant has a three-year performance cycle. Performance cycles disclosed in company proxy statements were (all figures rounded to the nearest 0.1 percent):
� 3 years: 60.0 percent
� 1 year: 13.3 percent
� 4 years: 6.7 percent
� 5 years: 6.7 percent
� 7 years: 6.7 percent
� 8 years: 6.7 percent
20Executive and director compensation 2014 | Data, trends and strategies
Copyright © 2014, Hay Group. All rights reserved.
Performance stock options versus performance stock appreciation rightsThe performance-based stock option grants made in 2013 were primarily based on stock options (rather than SARs) as follows:
� Performance stock options: 66.7 percent
� Performance stock appreciation rights: 33.3 percent
Performance-contingent versus performance-acceleratedNot that many years ago performance-accelerated stock options were far more common than performance-contingent stock options. However, times have changed and performance-contingent stock options have become the favored approach. In fact, 80 percent of the performance-based grants are now performance-contingent and 20 percent are performance-accelerated.
The main reason for this change related to accounting considerations. Before the accounting changes that resulted in the expensing of all stock options, performance-accelerated stock options could avoid the variable (liability) accounting treatment which applied to performance-contingent stock options. Once the new accounting rules took effect, such acceleration no longer was needed for the more favorable accounting treatment and performance-contingent stock options then overtook their performance-accelerated brethren.
What is the future for performance-based stock option grants? Are they here to stay?Performance-based stock option awards have been around for many years and we expect to see them continue to be used by more companies, especially as an inducement to attract and retain new CEOs.
21Executive and director compensation 2014 | Data, trends and strategies
Copyright © 2014, Hay Group. All rights reserved.
According to our research on the Hay Group 300 companies, restricted stock/RSUs together constitute one of the most widely used incentives used.
Restricted stock and RSU definitionsThe typical restricted stock grant to an executive applies to a specific number of shares that are nontransferable and subject to forfeiture until one or more conditions are satisfied. In most cases, one condition is continued employment for a defined period of time (often three or four years). During this restriction period the individual has certain ownership rights but cannot dispose of the shares until the restrictions lapse. However, recipients of restricted shares can receive, if so provided in the governing documents, earnings/dividends on the shares and can vote the shares.
RSU grants carry similar restrictions, but the award does not have any such ownership type benefits such as receiving earnings/dividends or being able to vote the shares. In this situation, the compensation committee can still elect to provide the individual “dividend equivalent rights” which may be paid in shares and/or in cash.
Restricted stock and restricted stock unit prevalence
22Executive and director compensation 2014 | Data, trends and strategies
Copyright © 2014, Hay Group. All rights reserved.
Besides time-based vesting, other vesting conditions may include meeting certain performance-based goals:
� Performance-contingent goals: awards carry performance-based restrictions that can only be removed if the performance conditions are met
� Performance-accelerated goals: awards contain performance-based restrictions that accelerate the removal of the restrictions if the performance conditions are satisfied
� Performance-granted goals: awards include a short performance period, typically one year, during which performance-based goals must be met in order for restricted stock or RSUs to be granted.
Restricted stock and RSU prevalenceIn order to determine the actual prevalence of restricted stock and RSUs, it was necessary to combine the prevalence of the following vehicles:
Short-term/annual incentives
� Restricted stock as an annual incentive payment vehicle
� RSUs as an annual incentive payment vehicle
Long-term incentives
� Restricted stock grants
� RSU grants
� Performance restricted stock grants
� Performance RSU grants
� Performance-granted restricted stock awards
� Performance-granted RSU awards
After consolidating the prevalence of the types of restricted stock and RSU grants listed above, we found that 82.3 percent (247 companies) of the Hay Group 300 awarded some form of restricted stock or RSUs in 2013. Clearly, restricted stock and/or RSUs are one of the most widely used incentives across the 300-company sample.
Here is a breakout of the type of restricted stock/RSU grants made to executives in this year’s Hay Group 300 companies (note that the totals on this page and the next exceed 100 percent as some companies employ more than one approach).
Short-term/annual incentives
� Restricted stock as an annual incentive payment vehicle: 1 company (0.3 percent)
� RSUs as an annual incentive payment vehicle: 13 companies (4.3 percent)
Long-term incentives
� Restricted stock grants: 53 companies (17.7 percent)
� RSU grants: 147 companies (49.0 percent)
� Performance restricted stock grants: 20 companies (6.7 percent)
� Performance RSU grants: 80 companies (26.7 percent)
� Performance-granted restricted stock awards: 3 companies (1.0 percent)
� Performance-granted RSU awards: 6 companies (2.0 percent)
23Executive and director compensation 2014 | Data, trends and strategies
Copyright © 2014, Hay Group. All rights reserved.
Restricted stock or RSUsWhile restricted stock has been an incentive vehicle far longer than RSUs, in recent years RSUs have become much more popular. Reasons for the attractiveness of RSUs include that, for an RSU grant, (1) company stock is not issued at the time of the grant, (2) tax deferral can be obtained through timely elections that accord with Internal Revenue Code section 409A and (3) when the restrictions are satisfied, the company can elect to distribute shares or their cash equivalent to the recipient if so permitted in the governing documents. Obviously, the RSU grant provides the company with additional choices that are unavailable when making restricted stock grants.
For this year’s Hay Group 300, 65 companies (21.7 percent) made some form of restricted stock grant and 192 companies (64.0 percent) made some form of RSU grant. Thus, RSU awards were almost three times more popular than restricted stock grants.
Restricted stock taxation versus RSU taxationRestricted stock grants and RSU grants are not taxed at the time of award; rather, in most cases, they are taxed at vesting.
For restricted stock grants, the entire amount of the vested stock is ordinary income in the year of vesting. If the individual does not sell the stock at vesting and disposes of it at a later date, then the difference between the sale price and the fair market value on the vesting date will be reported as a capital gain or loss.
If the individual has made a “section 83(b) election” (which, if timely made, allows the fair market value of the shares to be taxed as ordinary income at grant date rather than at the vesting date), then capital gains treatment starts at the time of grant and not at vesting. While this election can reduce income taxes substantially if the stock price at vesting is higher than at date of grant, the pros and cons of such an election requires careful analysis before proceeding.
For RSU grants, there can be no section 83(b) election because no actual stock is issued at date of grant. Thus the value of the stock is reported as ordinary income in the year it vests, unless the plan allows the employee the ability to defer receipt of the payment until some future specified date.
24Executive and director compensation 2014 | Data, trends and strategies
Copyright © 2014, Hay Group. All rights reserved.
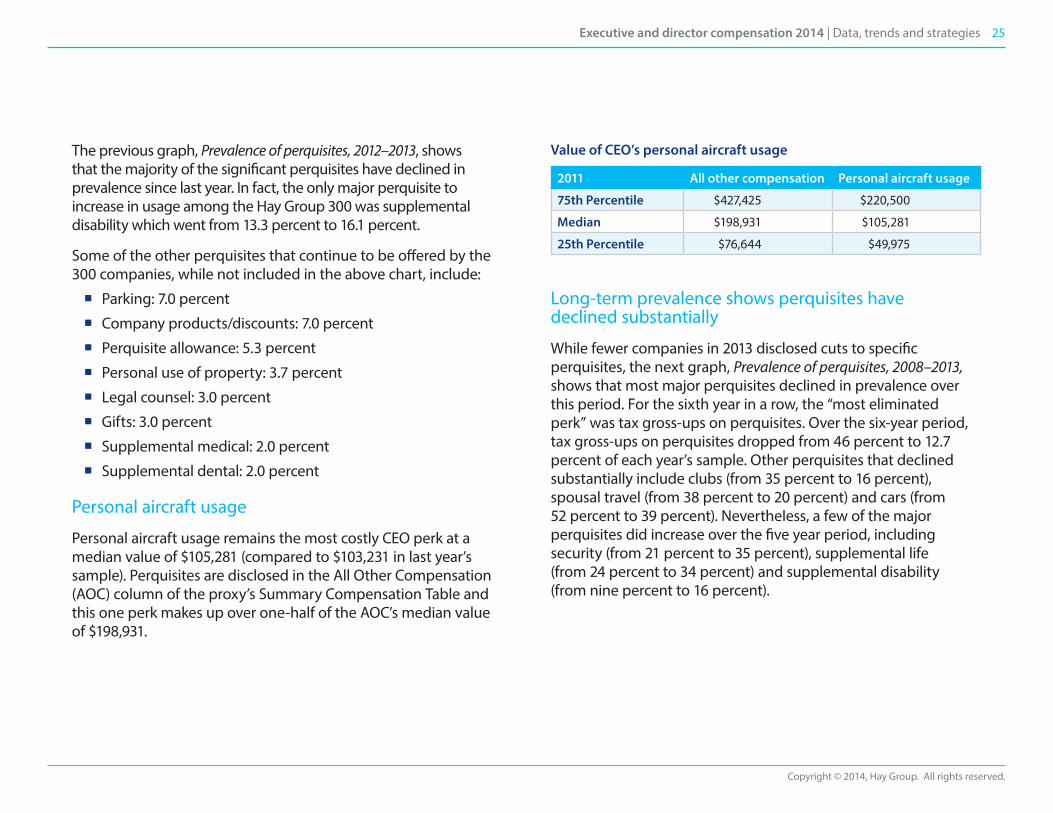
In an examination of executive perquisites among the Hay Group 300 companies for the 2014 proxy season, the most common perk continued to be the personal use of corporate aircraft (disclosed by 65 percent of the sample), followed by financial (tax/estate) planning (offered by 48 percent), company cars (39 percent), security (35 percent), supplemental life (34 percent) and physical exams (34 percent).
Prevalence of perquisites, 2012–2013
Executive perquisites: Prevalence
0%
10%
20%
30%
40%
50%
60%
Personal airc
raft
Financial p
lanning Car
Security
Supplemental life
Physical exams
Spousal travel
Clubs
Supplemental disa
bility
Tax gross-up
Matching gifts
Entertainment ti
ckets
20122013
70%
25Executive and director compensation 2014 | Data, trends and strategies
Copyright © 2014, Hay Group. All rights reserved.
The previous graph, Prevalence of perquisites, 2012–2013, shows that the majority of the significant perquisites have declined in prevalence since last year. In fact, the only major perquisite to increase in usage among the Hay Group 300 was supplemental disability which went from 13.3 percent to 16.1 percent.
Some of the other perquisites that continue to be offered by the 300 companies, while not included in the above chart, include:
� Parking: 7.0 percent
� Company products/discounts: 7.0 percent
� Perquisite allowance: 5.3 percent
� Personal use of property: 3.7 percent
� Legal counsel: 3.0 percent
� Gifts: 3.0 percent
� Supplemental medical: 2.0 percent
� Supplemental dental: 2.0 percent
Personal aircraft usage
Personal aircraft usage remains the most costly CEO perk at a median value of $105,281 (compared to $103,231 in last year’s sample). Perquisites are disclosed in the All Other Compensation (AOC) column of the proxy’s Summary Compensation Table and this one perk makes up over one-half of the AOC’s median value of $198,931.
Value of CEO’s personal aircraft usage
2011 All other compensation Personal aircraft usage
75th Percentile $427,425 $220,500
Median $198,931 $105,281
25th Percentile $76,644 $49,975
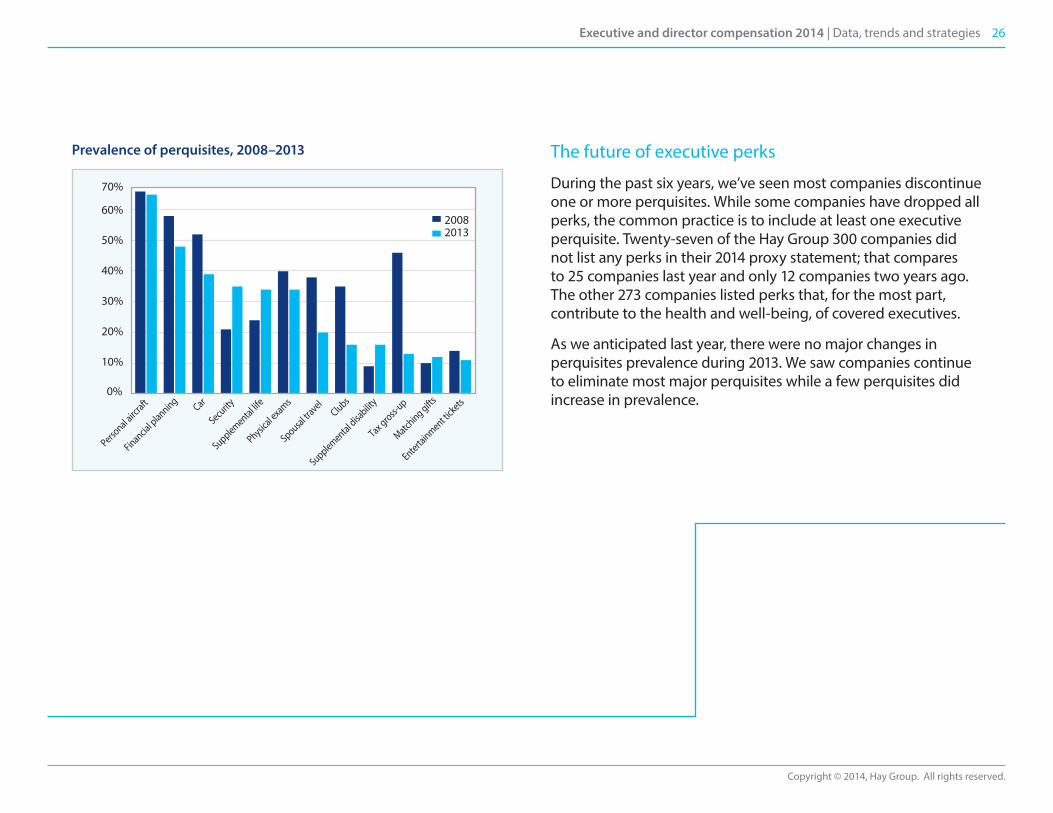
Long-term prevalence shows perquisites have declined substantially
While fewer companies in 2013 disclosed cuts to specific perquisites, the next graph, Prevalence of perquisites, 2008–2013, shows that most major perquisites declined in prevalence over this period. For the sixth year in a row, the “most eliminated perk” was tax gross-ups on perquisites. Over the six-year period, tax gross-ups on perquisites dropped from 46 percent to 12.7 percent of each year’s sample. Other perquisites that declined substantially include clubs (from 35 percent to 16 percent), spousal travel (from 38 percent to 20 percent) and cars (from 52 percent to 39 percent). Nevertheless, a few of the major perquisites did increase over the five year period, including security (from 21 percent to 35 percent), supplemental life (from 24 percent to 34 percent) and supplemental disability (from nine percent to 16 percent).
26Executive and director compensation 2014 | Data, trends and strategies
Copyright © 2014, Hay Group. All rights reserved.
Prevalence of perquisites, 2008–2013 The future of executive perks
During the past six years, we’ve seen most companies discontinue one or more perquisites. While some companies have dropped all perks, the common practice is to include at least one executive perquisite. Twenty-seven of the Hay Group 300 companies did not list any perks in their 2014 proxy statement; that compares to 25 companies last year and only 12 companies two years ago. The other 273 companies listed perks that, for the most part, contribute to the health and well-being, of covered executives.
As we anticipated last year, there were no major changes in perquisites prevalence during 2013. We saw companies continue to eliminate most major perquisites while a few perquisites did increase in prevalence.
0%
10%
20%
30%
40%
50%
60%
70%
Personal airc
raft
Financial p
lanning Car
Security
Supplemental life
Physical exams
Spousal travel
Clubs
Supplemental disa
bility
Tax gross-up
Matching gifts
Entertainment ti
ckets
20082013
27Executive and director compensation 2014 | Data, trends and strategies
Copyright © 2014, Hay Group. All rights reserved.
In 2014, we reviewed proxy disclosures of the Hay Group 300 to access director compensation and benefits, lead director pay, director stock ownership guidelines and holding requirements, and non-CEO chairman compensation for both executive and non-executive positions.
OverviewAt a high-level, the big news was that director retainers climbed, while fewer companies paid fees to their directors for attending board meetings.
From a long-term incentive perspective, director stock options have faded away almost completely, with full-value awards taking their place.
In the past, being a director might have been an ancillary job that provided some supplemental income. With the continual imposition of regulatory requirements and the constant scrutiny by investors and governance watch-dogs, directors are taking on more and more responsibility and pay levels are following suit.
Annual compensationThe annual compensation of a typical non-employee director includes an annual retainer for board service, meeting fees for board and committee service and an annual retainer for chairing a committee or serving as a member of a committee. In this section, we review details about each type of compensation.
Director compensation and benefits survey
28Executive and director compensation 2014 | Data, trends and strategies
Copyright © 2014, Hay Group. All rights reserved.
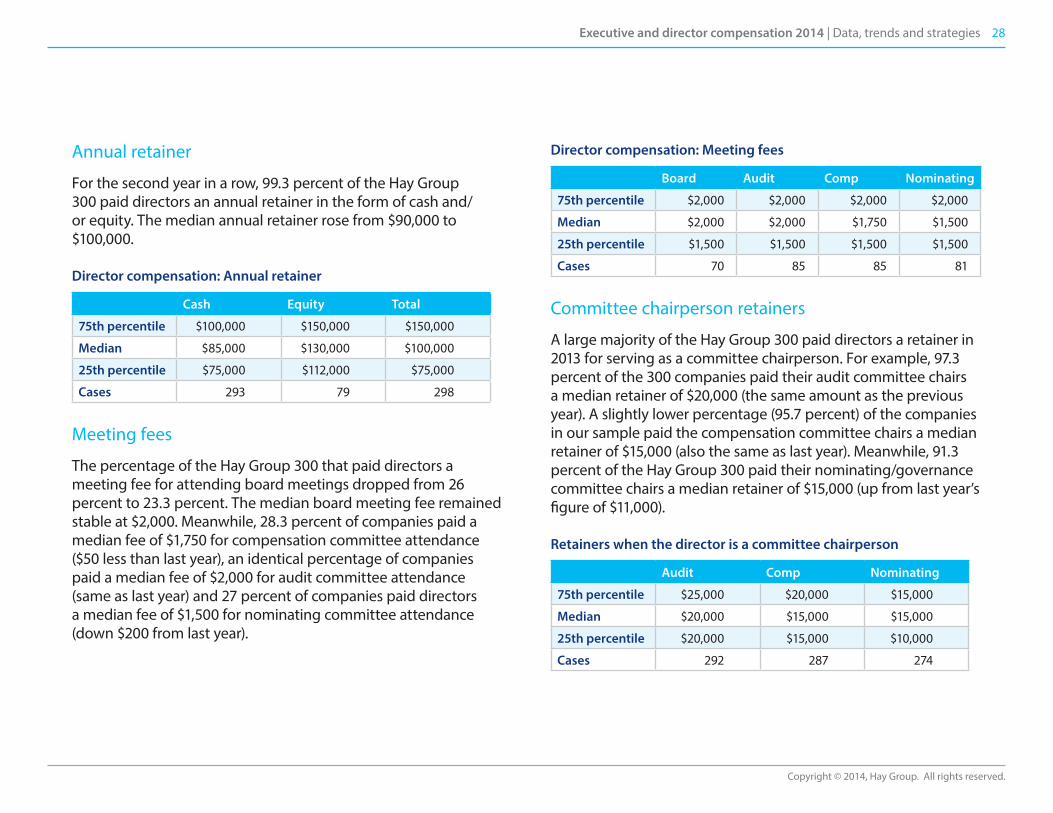
Annual retainer
For the second year in a row, 99.3 percent of the Hay Group 300 paid directors an annual retainer in the form of cash and/or equity. The median annual retainer rose from $90,000 to $100,000.
Director compensation: Annual retainer
Cash Equity Total
75th percentile $100,000 $150,000 $150,000
Median $85,000 $130,000 $100,000
25th percentile $75,000 $112,000 $75,000
Cases 293 79 298
Meeting fees
The percentage of the Hay Group 300 that paid directors a meeting fee for attending board meetings dropped from 26 percent to 23.3 percent. The median board meeting fee remained stable at $2,000. Meanwhile, 28.3 percent of companies paid a median fee of $1,750 for compensation committee attendance ($50 less than last year), an identical percentage of companies paid a median fee of $2,000 for audit committee attendance (same as last year) and 27 percent of companies paid directors a median fee of $1,500 for nominating committee attendance (down $200 from last year).
Director compensation: Meeting fees
Board Audit Comp Nominating
75th percentile $2,000 $2,000 $2,000 $2,000
Median $2,000 $2,000 $1,750 $1,500
25th percentile $1,500 $1,500 $1,500 $1,500
Cases 70 85 85 81
Committee chairperson retainers
A large majority of the Hay Group 300 paid directors a retainer in 2013 for serving as a committee chairperson. For example, 97.3 percent of the 300 companies paid their audit committee chairs a median retainer of $20,000 (the same amount as the previous year). A slightly lower percentage (95.7 percent) of the companies in our sample paid the compensation committee chairs a median retainer of $15,000 (also the same as last year). Meanwhile, 91.3 percent of the Hay Group 300 paid their nominating/governance committee chairs a median retainer of $15,000 (up from last year’s figure of $11,000).
Retainers when the director is a committee chairperson
Audit Comp Nominating
75th percentile $25,000 $20,000 $15,000
Median $20,000 $15,000 $15,000
25th percentile $20,000 $15,000 $10,000
Cases 292 287 274
29Executive and director compensation 2014 | Data, trends and strategies
Copyright © 2014, Hay Group. All rights reserved.
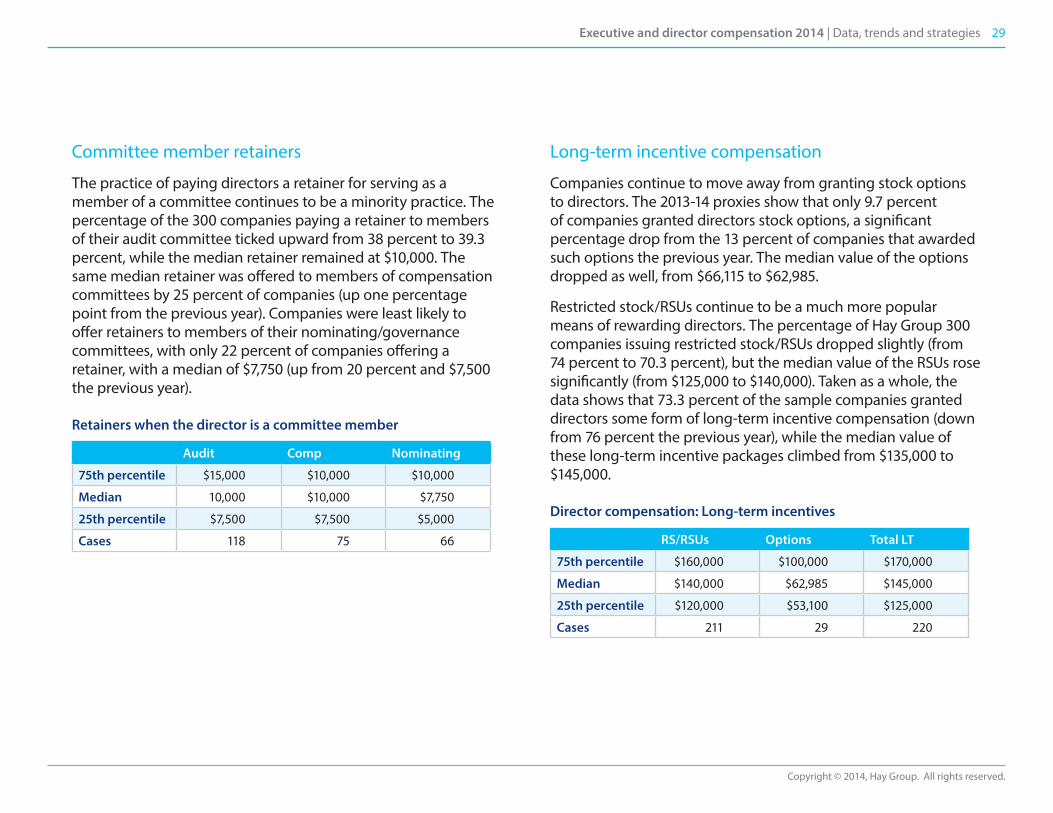
Committee member retainers
The practice of paying directors a retainer for serving as a member of a committee continues to be a minority practice. The percentage of the 300 companies paying a retainer to members of their audit committee ticked upward from 38 percent to 39.3 percent, while the median retainer remained at $10,000. The same median retainer was offered to members of compensation committees by 25 percent of companies (up one percentage point from the previous year). Companies were least likely to offer retainers to members of their nominating/governance committees, with only 22 percent of companies offering a retainer, with a median of $7,750 (up from 20 percent and $7,500 the previous year).
Retainers when the director is a committee member
Audit Comp Nominating
75th percentile $15,000 $10,000 $10,000
Median 10,000 $10,000 $7,750
25th percentile $7,500 $7,500 $5,000
Cases 118 75 66
Long-term incentive compensation
Companies continue to move away from granting stock options to directors. The 2013-14 proxies show that only 9.7 percent of companies granted directors stock options, a significant percentage drop from the 13 percent of companies that awarded such options the previous year. The median value of the options dropped as well, from $66,115 to $62,985.
Restricted stock/RSUs continue to be a much more popular means of rewarding directors. The percentage of Hay Group 300 companies issuing restricted stock/RSUs dropped slightly (from 74 percent to 70.3 percent), but the median value of the RSUs rose significantly (from $125,000 to $140,000). Taken as a whole, the data shows that 73.3 percent of the sample companies granted directors some form of long-term incentive compensation (down from 76 percent the previous year), while the median value of these long-term incentive packages climbed from $135,000 to $145,000.
Director compensation: Long-term incentives
RS/RSUs Options Total LT
75th percentile $160,000 $100,000 $170,000
Median $140,000 $62,985 $145,000
25th percentile $120,000 $53,100 $125,000
Cases 211 29 220
30Executive and director compensation 2014 | Data, trends and strategies
Copyright © 2014, Hay Group. All rights reserved.
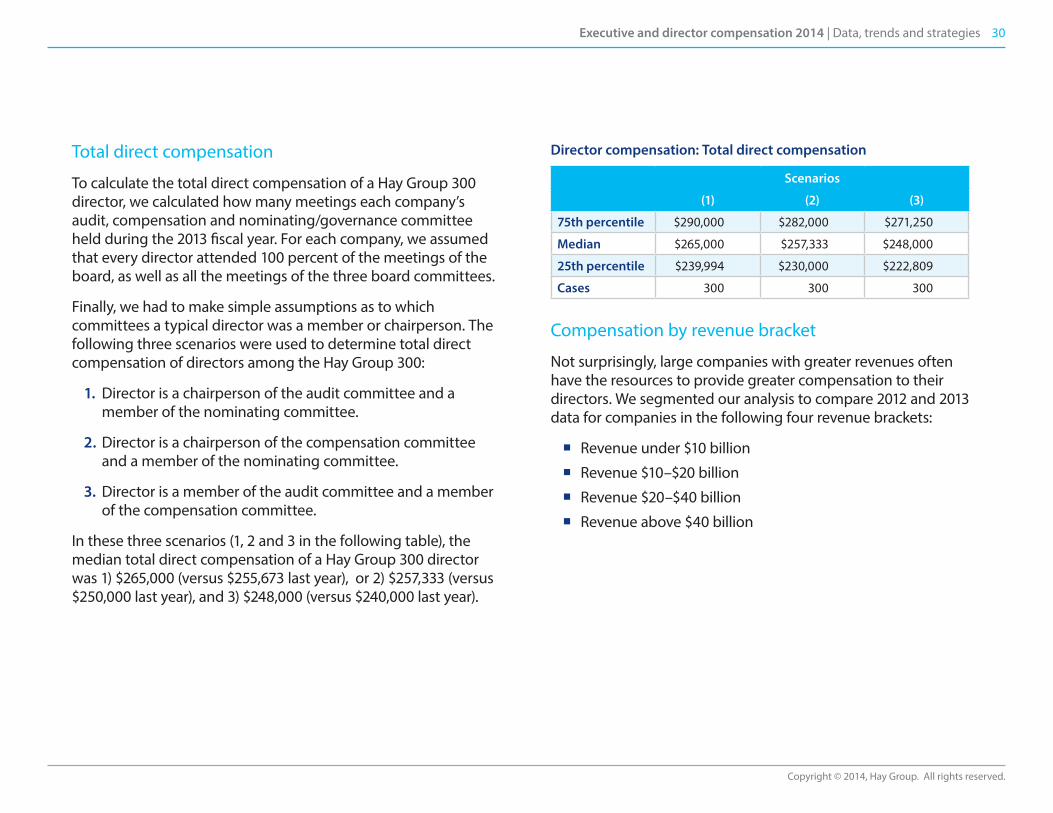
Total direct compensation
To calculate the total direct compensation of a Hay Group 300 director, we calculated how many meetings each company’s audit, compensation and nominating/governance committee held during the 2013 fiscal year. For each company, we assumed that every director attended 100 percent of the meetings of the board, as well as all the meetings of the three board committees.
Finally, we had to make simple assumptions as to which committees a typical director was a member or chairperson. The following three scenarios were used to determine total direct compensation of directors among the Hay Group 300:
1. Director is a chairperson of the audit committee and a member of the nominating committee.
2. Director is a chairperson of the compensation committee and a member of the nominating committee.
3. Director is a member of the audit committee and a member of the compensation committee.
In these three scenarios (1, 2 and 3 in the following table), the median total direct compensation of a Hay Group 300 director was 1) $265,000 (versus $255,673 last year), or 2) $257,333 (versus $250,000 last year), and 3) $248,000 (versus $240,000 last year).
Director compensation: Total direct compensation
Scenarios
(1) (2) (3)
75th percentile $290,000 $282,000 $271,250
Median $265,000 $257,333 $248,000
25th percentile $239,994 $230,000 $222,809
Cases 300 300 300
Compensation by revenue bracket
Not surprisingly, large companies with greater revenues often have the resources to provide greater compensation to their directors. We segmented our analysis to compare 2012 and 2013 data for companies in the following four revenue brackets:
� Revenue under $10 billion
� Revenue $10–$20 billion
� Revenue $20–$40 billion
� Revenue above $40 billion

31Executive and director compensation 2014 | Data, trends and strategies
Copyright © 2014, Hay Group. All rights reserved.
2013 median TDC scenarios
Scenarios
Revenues (1) (2) (3)
Under $10B (33 cos.) $253,000 $240,500 $227,500
$10–$20B (137 cos.) $255,000 $242,000 $237,000
$20–$40B (63 cos.) $265,000 $262,500 $250,000
Above $40B (67 cos.) $280,000 $275,000 $260,000
Note the difference between the 2013 TDC using the defined scenarios versus 2012 TDC using the same scenarios:
2012 median TDC scenarios
Scenarios
Revenues (1) (2) (3)
Under $10B (67 cos.) $235,000 $230,000 $225,000
$10–$20B (108 cos.) $245,745 $240,000 $230,000
$20–$40B (63 cos.) $250,000 $250,000 $235,000
Above $40B (67 cos.) $280,000 $272,750 $260,000
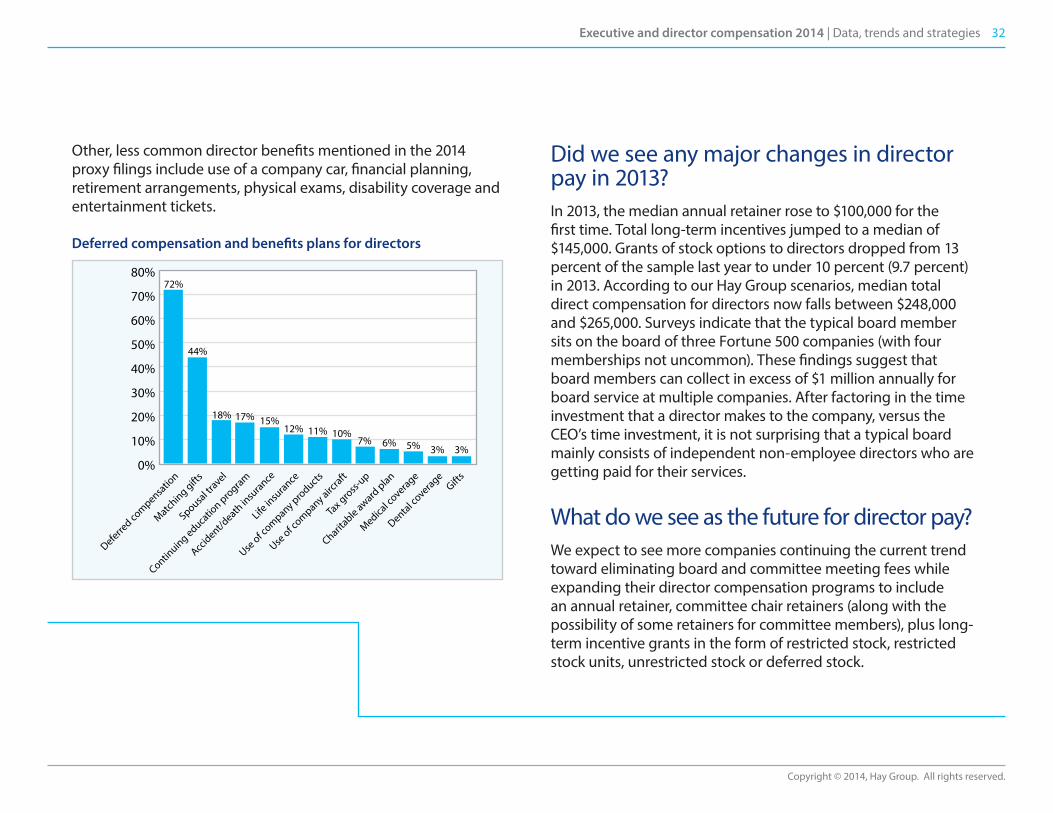
Deferred compensation and benefit programsNearly all of the Hay Group 300 (96.3 percent versus 94 percent the previous year) disclosed either some form of deferred compensation or at least one type of director benefit. On the other hand, only 67.3 percent of the companies disclosed at least one type of director benefit arrangement, which represents a slight decrease from the 69.3 percent that disclosed such arrangements the previous year.
Most common types of deferred compensation or benefit
2011 2012 2013
Deferred compensation 60% 73% 72%
Matching gifts 43% 43% 44%
Spousal travel 16% 18% 18%
Continuing education program
16% 18% 17%
Accident/death insurance 16% 15% 15%
Life insurance 12% 13% 12%
Use of company products 11% 13% 11%
Use of company aircraft 8% 12% 10%
32Executive and director compensation 2014 | Data, trends and strategies
Copyright © 2014, Hay Group. All rights reserved.
Other, less common director benefits mentioned in the 2014 proxy filings include use of a company car, financial planning, retirement arrangements, physical exams, disability coverage and entertainment tickets.
Deferred compensation and benefits plans for directors
Did we see any major changes in director pay in 2013? In 2013, the median annual retainer rose to $100,000 for the first time. Total long-term incentives jumped to a median of $145,000. Grants of stock options to directors dropped from 13 percent of the sample last year to under 10 percent (9.7 percent) in 2013. According to our Hay Group scenarios, median total direct compensation for directors now falls between $248,000 and $265,000. Surveys indicate that the typical board member sits on the board of three Fortune 500 companies (with four memberships not uncommon). These findings suggest that board members can collect in excess of $1 million annually for board service at multiple companies. After factoring in the time investment that a director makes to the company, versus the CEO’s time investment, it is not surprising that a typical board mainly consists of independent non-employee directors who are getting paid for their services.
What do we see as the future for director pay?We expect to see more companies continuing the current trend toward eliminating board and committee meeting fees while expanding their director compensation programs to include an annual retainer, committee chair retainers (along with the possibility of some retainers for committee members), plus long-term incentive grants in the form of restricted stock, restricted stock units, unrestricted stock or deferred stock.
0%
10%
20%
30%
40%
50%
60%
70%
80%
Dental coverage
Gifts
Charitable award
plan
Medical c
overage
Tax gro
ss-up
Use of c
ompany aircraft
Use of c
ompany products
Life in
surance
Accident/d
eath in
surance
Continuing educa
tion pro
gram
Spousal tr
avel
Matching gift
s
Deferred co
mpensatio
n
44%
72%
18% 17% 15%12% 11% 10%
7% 6% 5% 3% 3%

33Executive and director compensation 2014 | Data, trends and strategies
Copyright © 2014, Hay Group. All rights reserved.
The evolution of the lead director positionNot long ago, only a few boards had a “Lead Director” position. In the last decade, more US public companies have begun appointing lead (or presiding) directors of their boards. The increased prevalence of lead directors at US public companies largely was a consequence of two developments.
1. In the wake of corporate scandals (e.g., Enron and WorldCom), shareholders began pushing in earnest for large US corporations to follow the lead of their European counterparts in separating the positions of chairman and CEO. These shareholders rallied around the idea that having an independent chairman could act as a safety check against misguided management teams.
2. The need for an independent chairman or a lead director became a practical necessity when the 2002 Sarbanes-Oxley Act (and associated rules issued by the Securities and Exchange Commission and the stock exchanges) required the full board of directors at US public companies to meet separately from management and non-independent directors.
Motivated by these two factors, most US public companies have either added a lead director position or split the chairman and CEO responsibilities between two separate individuals.
Lead director compensation
34Executive and director compensation 2014 | Data, trends and strategies
Copyright © 2014, Hay Group. All rights reserved.
Duties and responsibilities of a lead directorThe lead director reports to and assists the board of directors, especially the chairman of the board of directors. The lead director works closely with the chairman and the remainder of the board to ensure that the board of directors maintains its proper organization, functions effectively and operates independently from management. In addition to the usual duties expected of all board members, the lead director has additional responsibilities, including:
� Working with the board to ensure that directors have necessary decision-making resources
� Consulting with the chairman and other board members upon request on issues relating to corporate governance
� Serving as a liaison between the chairman and the non-executive directors
� Advising the chairman as to board meeting schedules, assisting in setting agendas for these meetings and ensuring sufficient time has been allotted to cover all agenda items
� Chairing board meetings when the chairman is unavailable to do so
� Chairing meetings of independent directors to discuss issues relating to company business without the presence of management and the CEO
� Working closely with committee chairs to coordinate coverage of board responsibilities
� Serving as the spokesperson for the company in the absence of the chairman or the CEO
� Reviewing and assessing director attendance, performance, compensation, size and composition of the board and its committees
� Supporting effective shareholder communications.
Lead director compensationGiven these additional responsibilities, many companies pay their lead directors an additional fee above and beyond standard board member compensation. For the third year in a row, lead directors who received supplemental compensation were awarded a median fee of $25,000. While the fee has stayed the same, the percentage of the Hay Group 300 that reported paying lead directors an additional fee for their services has risen each year – climbing from 51.3 percent of companies in 2011 to 59 percent in 2012 and then inching higher to 60.7 percent in 2013.
35Executive and director compensation 2014 | Data, trends and strategies
Copyright © 2014, Hay Group. All rights reserved.
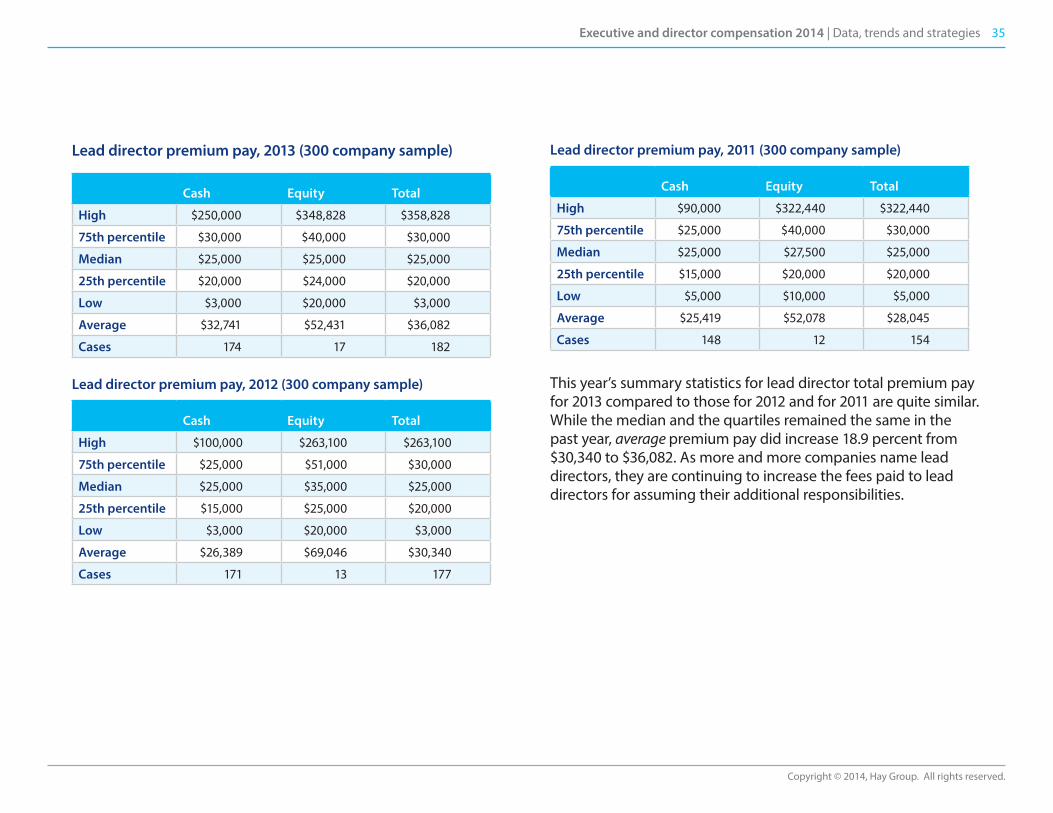
Lead director premium pay, 2013 (300 company sample)
Cash Equity Total
High $250,000 $348,828 $358,828
75th percentile $30,000 $40,000 $30,000
Median $25,000 $25,000 $25,000
25th percentile $20,000 $24,000 $20,000
Low $3,000 $20,000 $3,000
Average $32,741 $52,431 $36,082
Cases 174 17 182
Lead director premium pay, 2012 (300 company sample)
Cash Equity Total
High $100,000 $263,100 $263,100
75th percentile $25,000 $51,000 $30,000
Median $25,000 $35,000 $25,000
25th percentile $15,000 $25,000 $20,000
Low $3,000 $20,000 $3,000
Average $26,389 $69,046 $30,340
Cases 171 13 177
Lead director premium pay, 2011 (300 company sample)
Cash Equity Total
High $90,000 $322,440 $322,440
75th percentile $25,000 $40,000 $30,000
Median $25,000 $27,500 $25,000
25th percentile $15,000 $20,000 $20,000
Low $5,000 $10,000 $5,000
Average $25,419 $52,078 $28,045
Cases 148 12 154
This year’s summary statistics for lead director total premium pay for 2013 compared to those for 2012 and for 2011 are quite similar. While the median and the quartiles remained the same in the past year, average premium pay did increase 18.9 percent from $30,340 to $36,082. As more and more companies name lead directors, they are continuing to increase the fees paid to lead directors for assuming their additional responsibilities.
36Executive and director compensation 2014 | Data, trends and strategies
Copyright © 2014, Hay Group. All rights reserved.
Historical backgroundStock ownership guidelines for directors have been growing in prevalence since the early 1990s. As a result of adopting such programs for executives, companies became interested in developing programs that encouraged longer term stock ownership for directors.
The development of stock ownership guidelines helped to ensure that directors held a certain amount of company stock, and more importantly, maintained that ownership. While such programs started in the larger companies, programs at smaller companies also have become more prevalent.
The typical stock ownership guideline for directors requires that the director own and hold stock equal to a specific multiple of annual retainer by a defined period of time (i.e., the “accumulation period”). The next most popular approach is that the director must own a stated dollar-denominated amount in shares by the end of the accumulation period.
Stock holding requirements started out as a way to require directors to retain stock acquired upon a stock option exercise for a defined period of time after exercise. To motivate directors to exercise their options and to hold the acquired shares, companies offered them an “exercise and hold” incentive such as partial payment of resulting taxes or a tax gross-up. Soon thereafter, the holding requirements were extended to other long-term incentives such as restricted stock and restricted stock units.
By the year 2000, the majority of larger companies had ownership guidelines for directors and holding requirements were becoming more common.
Director stock ownership guidelines and holding requirements
37Executive and director compensation 2014 | Data, trends and strategies
Copyright © 2014, Hay Group. All rights reserved.
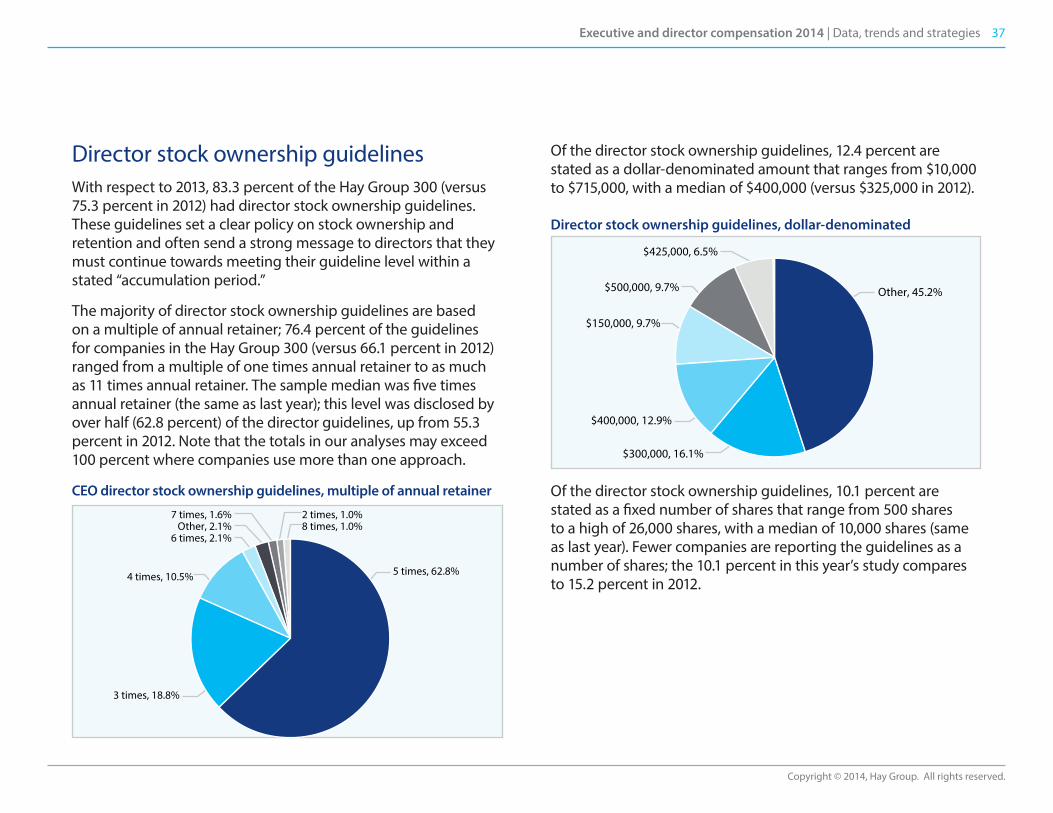
Director stock ownership guidelinesWith respect to 2013, 83.3 percent of the Hay Group 300 (versus 75.3 percent in 2012) had director stock ownership guidelines. These guidelines set a clear policy on stock ownership and retention and often send a strong message to directors that they must continue towards meeting their guideline level within a stated “accumulation period.”
The majority of director stock ownership guidelines are based on a multiple of annual retainer; 76.4 percent of the guidelines for companies in the Hay Group 300 (versus 66.1 percent in 2012) ranged from a multiple of one times annual retainer to as much as 11 times annual retainer. The sample median was five times annual retainer (the same as last year); this level was disclosed by over half (62.8 percent) of the director guidelines, up from 55.3 percent in 2012. Note that the totals in our analyses may exceed 100 percent where companies use more than one approach.
CEO director stock ownership guidelines, multiple of annual retainer
Of the director stock ownership guidelines, 12.4 percent are stated as a dollar-denominated amount that ranges from $10,000 to $715,000, with a median of $400,000 (versus $325,000 in 2012).
Director stock ownership guidelines, dollar-denominated
Of the director stock ownership guidelines, 10.1 percent are stated as a fixed number of shares that range from 500 shares to a high of 26,000 shares, with a median of 10,000 shares (same as last year). Fewer companies are reporting the guidelines as a number of shares; the 10.1 percent in this year’s study compares to 15.2 percent in 2012.
8 times, 1.0% 2 times, 1.0%7 times, 1.6%
Other, 2.1%6 times, 2.1%
4 times, 10.5%
3 times, 18.8%
5 times, 62.8%
$425,000, 6.5%
$500,000, 9.7%
$150,000, 9.7%
$400,000, 12.9%
$300,000, 16.1%
Other, 45.2%
38Executive and director compensation 2014 | Data, trends and strategies
Copyright © 2014, Hay Group. All rights reserved.
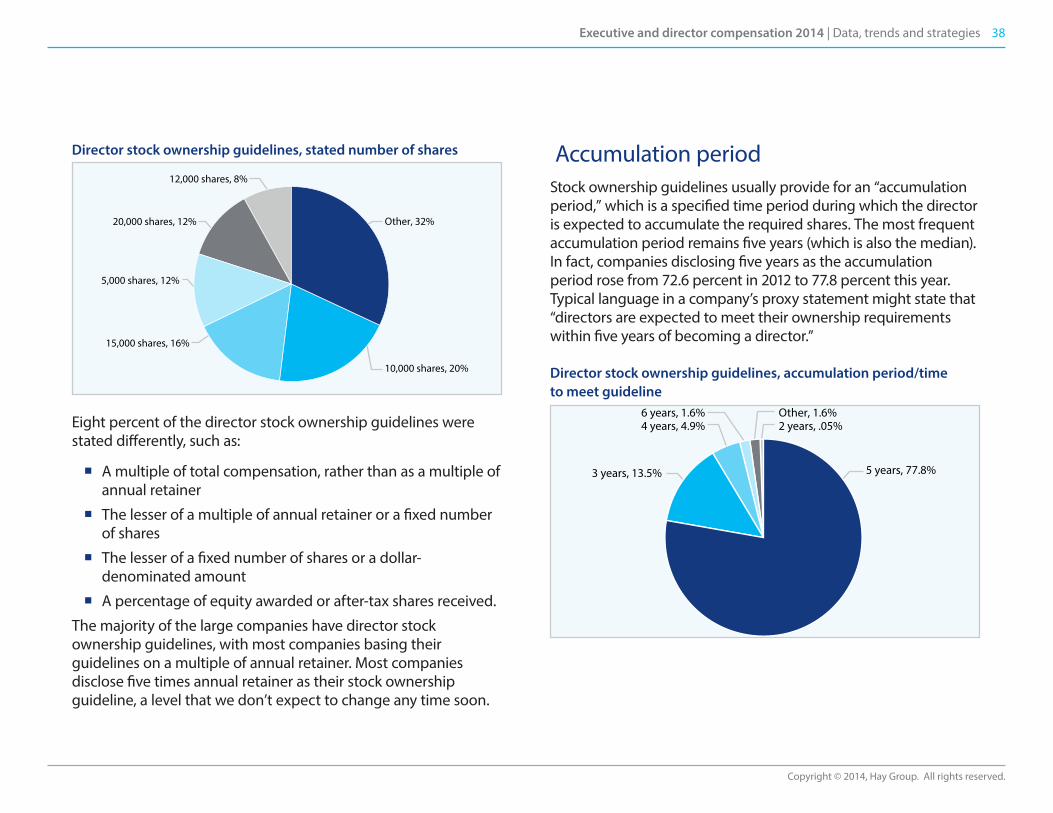
Director stock ownership guidelines, stated number of shares
Eight percent of the director stock ownership guidelines were stated differently, such as:
� A multiple of total compensation, rather than as a multiple of annual retainer
� The lesser of a multiple of annual retainer or a fixed number of shares
� The lesser of a fixed number of shares or a dollar-denominated amount
� A percentage of equity awarded or after-tax shares received.
The majority of the large companies have director stock ownership guidelines, with most companies basing their guidelines on a multiple of annual retainer. Most companies disclose five times annual retainer as their stock ownership guideline, a level that we don’t expect to change any time soon.
Accumulation periodStock ownership guidelines usually provide for an “accumulation period,” which is a specified time period during which the director is expected to accumulate the required shares. The most frequent accumulation period remains five years (which is also the median). In fact, companies disclosing five years as the accumulation period rose from 72.6 percent in 2012 to 77.8 percent this year. Typical language in a company’s proxy statement might state that “directors are expected to meet their ownership requirements within five years of becoming a director.”
Director stock ownership guidelines, accumulation period/time to meet guideline
12,000 shares, 8%
20,000 shares, 12%
5,000 shares, 12%
15,000 shares, 16%
10,000 shares, 20%
Other, 32%
2 years, .05%Other, 1.6%6 years, 1.6%
4 years, 4.9%
3 years, 13.5% 5 years, 77.8%
39Executive and director compensation 2014 | Data, trends and strategies
Copyright © 2014, Hay Group. All rights reserved.
Pay incentives in stockTo help directors accumulate stock so that they can meet their guidelines within the stated period of time, companies established programs to encourage stock ownership. One way of producing stock ownership for directors is to pay annual retainers and/or other forms of annual compensation partially in stock or better yet, restricted stock or restricted stock units (RSUs). Restricted stock carries restrictions that bar the disposition of the stock prior to the end of the restriction period. Another alternative might be to provide the director with the opportunity to elect to receive restricted stock in lieu of their annual retainer, and if so, receive a premium restricted stock grant as well.
Since the 1990s, restricted stock as a long-term incentive vehicle for directors has also been growing. The restrictions are often one year, with such grants fitting nicely into a stock ownership program and as a means to grow stock ownership.
Paying other long-term incentives in stock can work as well. There are companies that pay all of their long-term incentives in stock or pay 50 percent of their long-term incentives in stock or option gains in stock.
Stock retention and holding requirementsCompanies rushed to put in stock ownership guidelines but really didn’t consider how they would react if the guidelines were not met. Soon thereafter, companies developed stock retention programs that require retention of stock for a defined period of time or until the guideline is met.
Some approaches include paying 100 percent of long-term incentives in stock until the guideline is met or paying one-half of long-term incentives in stock that cannot be sold until the director leaves the company.
Holding requirements can often be found in a stand-alone agreement or as part of a stock ownership guideline. As part of the ownership guideline, the language in the proxy might read: “Following the exercise of options, a director subject to the ownership guidelines who has not met his or her guideline is expected to retain at least 50 percent of the net value of the shares of stock received.”
Over one-fifth of the Hay Group 300 (21.3 percent versus 17.7 percent in 2012) now disclose some form of director stock holding requirement. Where a holding period is used to enforce an ownership guideline, it typically runs until the guideline is met.
The majority (65 percent) of the sample’s companies that disclose a stand-alone holding requirement or a post-guideline holding requirement have until retirement from the board as the holding period; 10 percent have a one year holding period. A number of the companies actually require that the holding period extend beyond retirement by six months to one year.
40Executive and director compensation 2014 | Data, trends and strategies
Copyright © 2014, Hay Group. All rights reserved.
Which shares count towards the ownership guideline?Companies often include the following types of shares towards meeting their director stock ownership guidelines:
� Shares held directly or beneficially owned by the director
� Deferred compensation share holdings
� Vested restricted stock and restricted stock units (RSUs).
Companies disclosed that they include the following share types in their definition of covered shares:
� Restricted stock or RSUs: 23.6 percent
� Stock options: 0.4 percent (only nine companies)
� Shares held or beneficially owned: 29.6 percent
� Deferred compensation plan shares: 15.6 percent.
Most companies do not count the following types of shares towards meeting their stock ownership guidelines:
� Unexercised stock options, vested stock options, unvested stock options
� Unvested restricted stock and RSUs.
Since some companies do include the above share types in meeting the ownership guidelines, it is important to study each company’s proxy disclosure to determine which shares are counted as disclosed by the company.
Monitoring complianceDirectors who are subject to a stock ownership guideline must show progress towards meeting the guideline. Often, companies disclose that they monitor compliance on an annual basis. If the guideline is not met during the accumulation period or if annual progress is not met, then penalties can be triggered.
Of the companies in the sample, 24.4 percent disclosed that they monitor compliance regularly or on an annual basis.
41Executive and director compensation 2014 | Data, trends and strategies
Copyright © 2014, Hay Group. All rights reserved.
The chairman positionThe chairman of the board is typically responsible for management of the activities of the board of directors. Among other responsibilities, this individual sets board agendas, oversees director evaluations and appointments, chairs board meetings and the annual shareholders’ meeting, and provides advice and counsel to the chief executive officer (CEO).
Until recently, the vast majority of US public corporations had a chairman who was also the CEO of the organization. As an executive officer of the company, the chairman/CEO fulfills the responsibilities of managing the board as well as the CEO’s responsibilities of managing the business of the company. In recent years, governance watch-dogs and some institutional shareholders have questioned whether these dual responsibilities should be lodged in one individual. They have proposed a split between the chairman and CEO positions to provide a check and balance on the CEO and his management team.
The Sarbanes-Oxley Act (followed by new rules and listing standards issued by the Securities and Exchange Commission and the stock exchanges) required that directors of a US public company meet not only as members of the full board but also separately from management and non-independent directors. Since then, most companies have either added a lead director position or split the chairman and CEO responsibilities between two individuals.
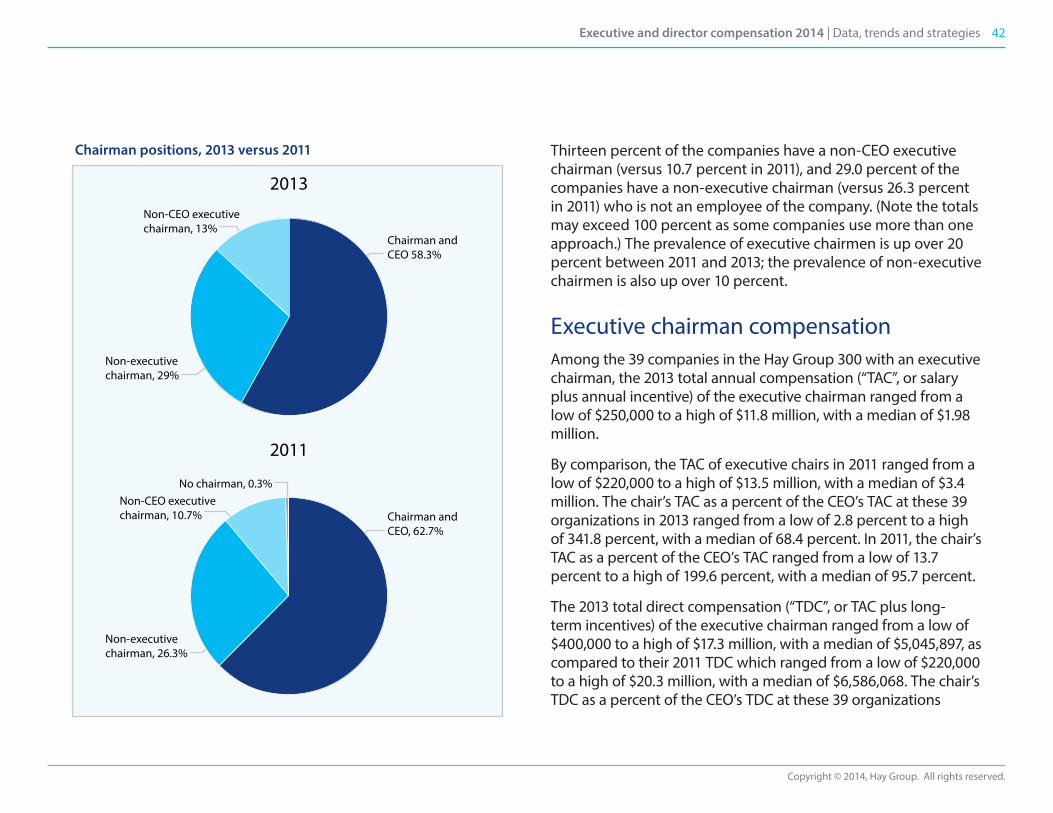
Among our Hay Group 300 sample, most companies in 2013 still maintained a governance structure led by a CEO with a chairman’s responsibilities, but the prevalence has continued to fall. Boards with CEOs as chairmen constituted less than 60 percent (58.3 percent) of the sample, down from 62.7 percent in 2011.
Non-CEO chairman compensation: Executive and non-executive positions
42Executive and director compensation 2014 | Data, trends and strategies
Copyright © 2014, Hay Group. All rights reserved.
Chairman positions, 2013 versus 2011 Thirteen percent of the companies have a non-CEO executive chairman (versus 10.7 percent in 2011), and 29.0 percent of the companies have a non-executive chairman (versus 26.3 percent in 2011) who is not an employee of the company. (Note the totals may exceed 100 percent as some companies use more than one approach.) The prevalence of executive chairmen is up over 20 percent between 2011 and 2013; the prevalence of non-executive chairmen is also up over 10 percent.
Executive chairman compensationAmong the 39 companies in the Hay Group 300 with an executive chairman, the 2013 total annual compensation (“TAC”, or salary plus annual incentive) of the executive chairman ranged from a low of $250,000 to a high of $11.8 million, with a median of $1.98 million.
By comparison, the TAC of executive chairs in 2011 ranged from a low of $220,000 to a high of $13.5 million, with a median of $3.4 million. The chair’s TAC as a percent of the CEO’s TAC at these 39 organizations in 2013 ranged from a low of 2.8 percent to a high of 341.8 percent, with a median of 68.4 percent. In 2011, the chair’s TAC as a percent of the CEO’s TAC ranged from a low of 13.7 percent to a high of 199.6 percent, with a median of 95.7 percent.
The 2013 total direct compensation (“TDC”, or TAC plus long-term incentives) of the executive chairman ranged from a low of $400,000 to a high of $17.3 million, with a median of $5,045,897, as compared to their 2011 TDC which ranged from a low of $220,000 to a high of $20.3 million, with a median of $6,586,068. The chair’s TDC as a percent of the CEO’s TDC at these 39 organizations
No chairman, 0.3%Non-CEO executive chairman, 10.7%
Non-CEO executive chairman, 13%
Non-executive chairman, 26.3%
Non-executivechairman, 29%
Chairman and CEO, 62.7%
Chairman and CEO 58.3%
2011
2013
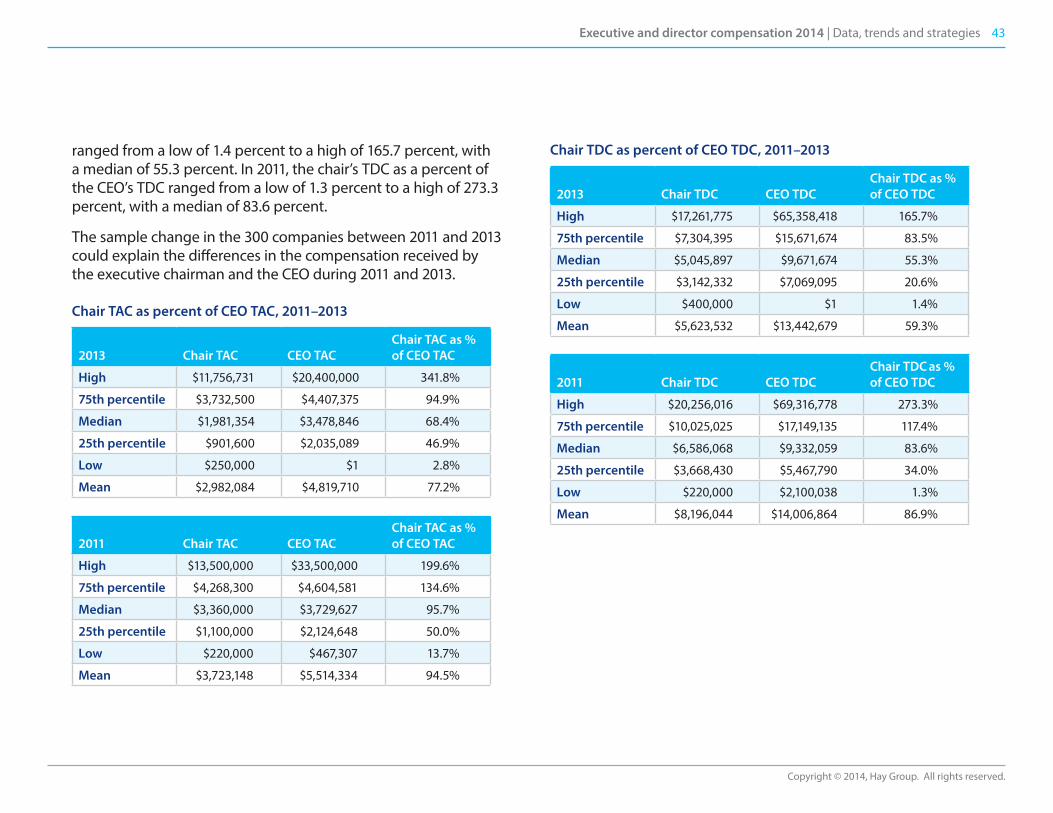
43Executive and director compensation 2014 | Data, trends and strategies
Copyright © 2014, Hay Group. All rights reserved.
ranged from a low of 1.4 percent to a high of 165.7 percent, with a median of 55.3 percent. In 2011, the chair’s TDC as a percent of the CEO’s TDC ranged from a low of 1.3 percent to a high of 273.3 percent, with a median of 83.6 percent.
The sample change in the 300 companies between 2011 and 2013 could explain the differences in the compensation received by the executive chairman and the CEO during 2011 and 2013.
Chair TAC as percent of CEO TAC, 2011 –2013
2013 Chair TAC CEO TACChair TAC as % of CEO TAC
High $11,756,731 $20,400,000 341.8%
75th percentile $3,732,500 $4,407,375 94.9%
Median $1,981,354 $3,478,846 68.4%
25th percentile $901,600 $2,035,089 46.9%
Low $250,000 $1 2.8%
Mean $2,982,084 $4,819,710 77.2%
2011 Chair TAC CEO TACChair TAC as % of CEO TAC
High $13,500,000 $33,500,000 199.6%
75th percentile $4,268,300 $4,604,581 134.6%
Median $3,360,000 $3,729,627 95.7%
25th percentile $1,100,000 $2,124,648 50.0%
Low $220,000 $467,307 13.7%
Mean $3,723,148 $5,514,334 94.5%
Chair TDC as percent of CEO TDC, 2011–2013
2013 Chair TDC CEO TDCChair TDC as % of CEO TDC
High $17,261,775 $65,358,418 165.7%
75th percentile $7,304,395 $15,671,674 83.5%
Median $5,045,897 $9,671,674 55.3%
25th percentile $3,142,332 $7,069,095 20.6%
Low $400,000 $1 1.4%
Mean $5,623,532 $13,442,679 59.3%
2011 Chair TDC CEO TDCChair TDC as % of CEO TDC
High $20,256,016 $69,316,778 273.3%
75th percentile $10,025,025 $17,149,135 117.4%
Median $6,586,068 $9,332,059 83.6%
25th percentile $3,668,430 $5,467,790 34.0%
Low $220,000 $2,100,038 1.3%
Mean $8,196,044 $14,006,864 86.9%
44Executive and director compensation 2014 | Data, trends and strategies
Copyright © 2014, Hay Group. All rights reserved.
The data indicates that non-CEO executive chairmen of the 300 largest companies are paid:
� Annual compensation that has not kept pace with what the current CEO is paid, creating a larger pay gap between the executive chairman’s pay and the CEO’s pay, and
� Long-term incentive compensation that is significantly less than the current CEO receives, creating a larger pay gap between the executive chairman’s TDC and the CEO’s TDC. This makes some sense as many of the executive chairmen are founders, members of the founding family of the company or a prior CEO of the company; thus the individual already has a large stock ownership in company stock.
Executive chairman is often a founder of the company or a prior CEO
The non-CEO executive chairman is often one of the following:
� A founder of the company
� A member of the family of the founder of the company
� A recent CEO of the company who relinquished theCEO position to serve as chairman and then as executive chairman.
Forty-four percent (17 of the companies) of the 39 executive chairmen are either founders of the company or a member of the founder’s family.
Seventy-three percent (16 of the companies) of the remaining 22 companies have an executive chairman who was a prior CEO of the company.
Non-executive chairman compensationEighty-seven (29.0 percent) of the Hay Group 300 companies (versus 79 companies or 26.3 percent in 2011) have a non-executive chairman. In all cases, the compensation of the non-executive chairman was disclosed in the company’s most recent proxy statement.
The 2013 annual retainer of the non-executive chairman ranged from a low of $0 to a high of $1.45 million, with a median of $265,000; the 2011 annual retainer of the non-executive chairman ranged from a low of $0 to a high of $2.2 million, with a median of $230,000. The chair’s 2013 annual retainer as a percent of the CEO’s 2013 annual salary at these 87 organizations had a low of zero percent and a high of 453.1 percent, with a median of 25.6 percent; the chair’s 2011 annual retainer as a percent of the CEO’s 2011 annual salary at these 79 organizations extended from a low of zero percent to a high of 69.7 percent, with a median of 21.9 percent. Note that the medians have risen between 2011 and 2013.
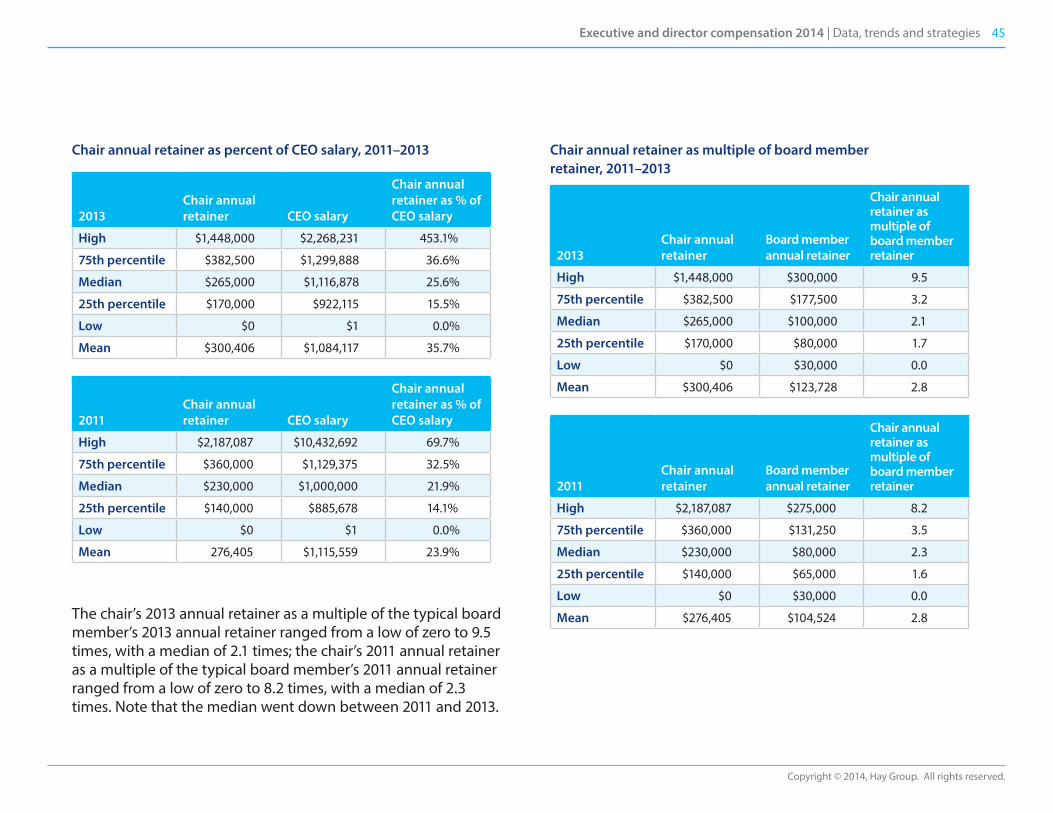
45Executive and director compensation 2014 | Data, trends and strategies
Copyright © 2014, Hay Group. All rights reserved.
Chair annual retainer as percent of CEO salary, 2011–2013
2013Chair annual retainer CEO salary
Chair annual retainer as % of CEO salary
High $1,448,000 $2,268,231 453.1%
75th percentile $382,500 $1,299,888 36.6%
Median $265,000 $1,116,878 25.6%
25th percentile $170,000 $922,115 15.5%
Low $0 $1 0.0%
Mean $300,406 $1,084,117 35.7%
2011Chair annual retainer CEO salary
Chair annual retainer as % of CEO salary
High $2,187,087 $10,432,692 69.7%
75th percentile $360,000 $1,129,375 32.5%
Median $230,000 $1,000,000 21.9%
25th percentile $140,000 $885,678 14.1%
Low $0 $1 0.0%
Mean 276,405 $1,115,559 23.9%
The chair’s 2013 annual retainer as a multiple of the typical board member’s 2013 annual retainer ranged from a low of zero to 9.5 times, with a median of 2.1 times; the chair’s 2011 annual retainer as a multiple of the typical board member’s 2011 annual retainer ranged from a low of zero to 8.2 times, with a median of 2.3 times. Note that the median went down between 2011 and 2013.
Chair annual retainer as multiple of board member retainer, 2011–2013
2013Chair annual retainer
Board member annual retainer
Chair annual retainer as multiple of board member retainer
High $1,448,000 $300,000 9.5
75th percentile $382,500 $177,500 3.2
Median $265,000 $100,000 2.1
25th percentile $170,000 $80,000 1.7
Low $0 $30,000 0.0
Mean $300,406 $123,728 2.8
2011Chair annual retainer
Board member annual retainer
Chair annual retainer as multiple of board member retainer
High $2,187,087 $275,000 8.2
75th percentile $360,000 $131,250 3.5
Median $230,000 $80,000 2.3
25th percentile $140,000 $65,000 1.6
Low $0 $30,000 0.0
Mean $276,405 $104,524 2.8
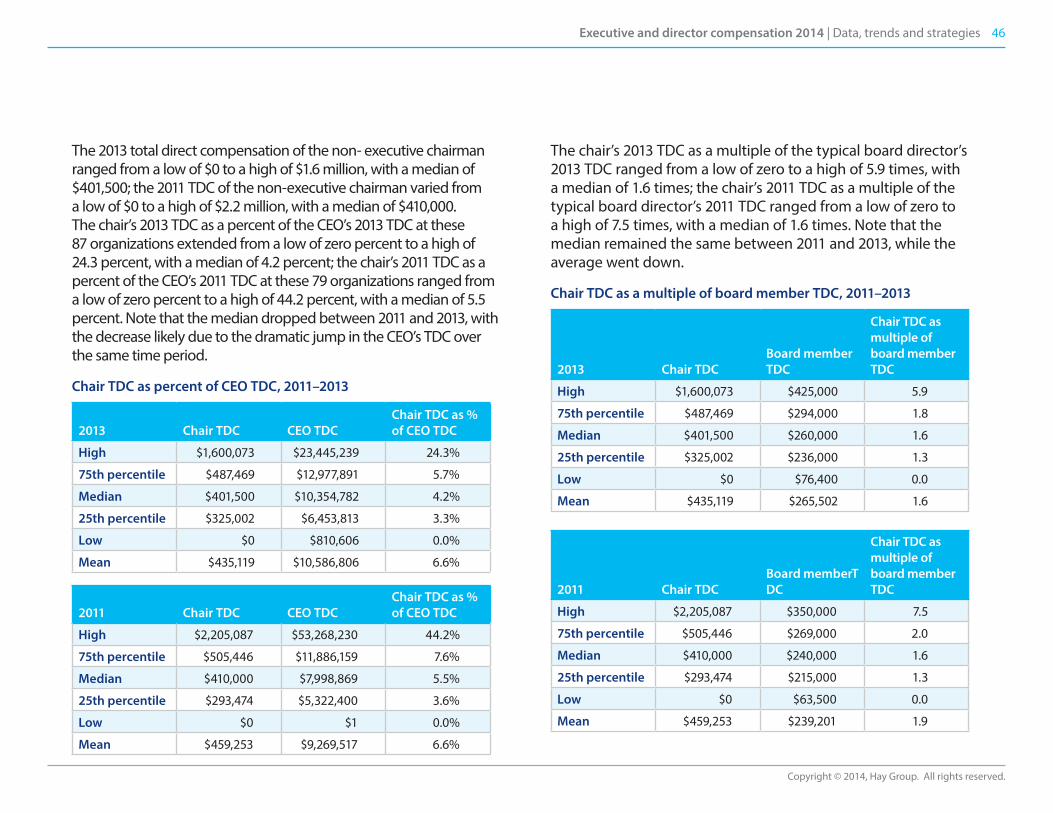
46Executive and director compensation 2014 | Data, trends and strategies
Copyright © 2014, Hay Group. All rights reserved.
The 2013 total direct compensation of the non- executive chairman ranged from a low of $0 to a high of $1.6 million, with a median of $401,500; the 2011 TDC of the non-executive chairman varied from a low of $0 to a high of $2.2 million, with a median of $410,000. The chair’s 2013 TDC as a percent of the CEO’s 2013 TDC at these 87 organizations extended from a low of zero percent to a high of 24.3 percent, with a median of 4.2 percent; the chair’s 2011 TDC as a percent of the CEO’s 2011 TDC at these 79 organizations ranged from a low of zero percent to a high of 44.2 percent, with a median of 5.5 percent. Note that the median dropped between 2011 and 2013, with the decrease likely due to the dramatic jump in the CEO’s TDC over the same time period.
Chair TDC as percent of CEO TDC, 2011–2013
2013 Chair TDC CEO TDCChair TDC as % of CEO TDC
High $1,600,073 $23,445,239 24.3%
75th percentile $487,469 $12,977,891 5.7%
Median $401,500 $10,354,782 4.2%
25th percentile $325,002 $6,453,813 3.3%
Low $0 $810,606 0.0%
Mean $435,119 $10,586,806 6.6%
2011 Chair TDC CEO TDCChair TDC as % of CEO TDC
High $2,205,087 $53,268,230 44.2%
75th percentile $505,446 $11,886,159 7.6%
Median $410,000 $7,998,869 5.5%
25th percentile $293,474 $5,322,400 3.6%
Low $0 $1 0.0%
Mean $459,253 $9,269,517 6.6%
The chair’s 2013 TDC as a multiple of the typical board director’s 2013 TDC ranged from a low of zero to a high of 5.9 times, with a median of 1.6 times; the chair’s 2011 TDC as a multiple of the typical board director’s 2011 TDC ranged from a low of zero to a high of 7.5 times, with a median of 1.6 times. Note that the median remained the same between 2011 and 2013, while the average went down.
Chair TDC as a multiple of board member TDC, 2011–2013
2013 Chair TDC Board member TDC
Chair TDC as multiple of board member TDC
High $1,600,073 $425,000 5.9
75th percentile $487,469 $294,000 1.8
Median $401,500 $260,000 1.6
25th percentile $325,002 $236,000 1.3
Low $0 $76,400 0.0
Mean $435,119 $265,502 1.6
2011 Chair TDC Board memberT DC
Chair TDC as multiple of board member TDC
High $2,205,087 $350,000 7.5
75th percentile $505,446 $269,000 2.0
Median $410,000 $240,000 1.6
25th percentile $293,474 $215,000 1.3
Low $0 $63,500 0.0
Mean $459,253 $239,201 1.9
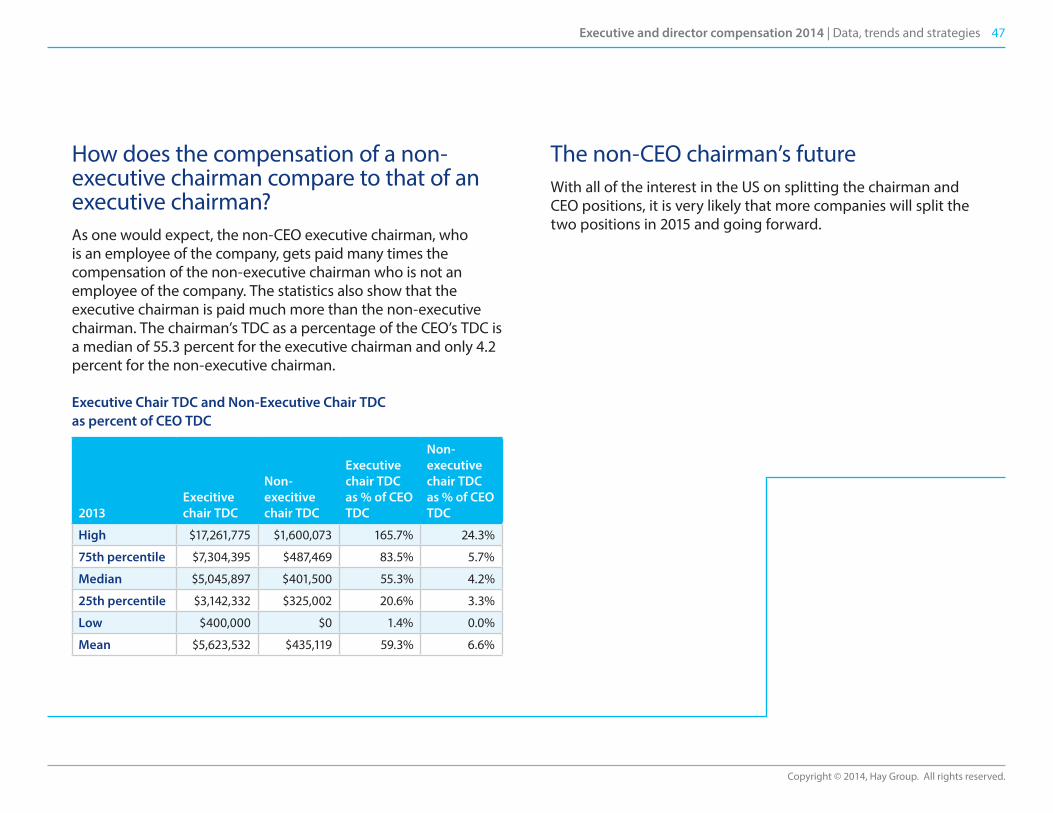
47Executive and director compensation 2014 | Data, trends and strategies
Copyright © 2014, Hay Group. All rights reserved.
How does the compensation of a non-executive chairman compare to that of an executive chairman?As one would expect, the non-CEO executive chairman, who is an employee of the company, gets paid many times the compensation of the non-executive chairman who is not an employee of the company. The statistics also show that the executive chairman is paid much more than the non-executive chairman. The chairman’s TDC as a percentage of the CEO’s TDC is a median of 55.3 percent for the executive chairman and only 4.2 percent for the non-executive chairman.
Executive Chair TDC and Non-Executive Chair TDC as percent of CEO TDC
2013Execitive chair TDC
Non-execitive chair TDC
Executive chair TDC as % of CEO TDC
Non-executive chair TDC as % of CEO TDC
High $17,261,775 $1,600,073 165.7% 24.3%
75th percentile $7,304,395 $487,469 83.5% 5.7%
Median $5,045,897 $401,500 55.3% 4.2%
25th percentile $3,142,332 $325,002 20.6% 3.3%
Low $400,000 $0 1.4% 0.0%
Mean $5,623,532 $435,119 59.3% 6.6%
The non-CEO chairman’s futureWith all of the interest in the US on splitting the chairman and CEO positions, it is very likely that more companies will split the two positions in 2015 and going forward.
48Executive and director compensation 2014 | Data, trends and strategies
Copyright © 2014, Hay Group. All rights reserved.
Irv BeckerUS leader, board solutions 215.861.2495 [email protected]
Bill GerekRegulatory expertise leader Board solutions – US 312.228.1814 [email protected]
Steve SabowDirector of research Board solutions – US 201.557.8409 [email protected]
Jim OttoSoutheast regional leader Board solutions – Atlanta 404.575.8740 [email protected]
Brian TobinMidwest regional leader Board solutions – Chicago 312.228.1847 [email protected]
Cory MorrowSouthwest regional leader Board solutions – Dallas 469.232.3826 [email protected]
Brian HolmenWest coast regional leader Board solutions – Los Angeles 949.251.5440 [email protected]
Greg KoppNortheast/Mid-Atlantic regional leader Board solutions – NY Metro/ DC Metro 703.841.3118 [email protected]
Christine RiversBoard solutions – Boston 617.425.4545 [email protected]
Dana MartinBoard solutions – Chicago 312.228.1824 [email protected]
Tim BartlettBoard solutions – Kansas City 816.329.4956 [email protected]
Dan MoynihanBoard solutions – NY Metro 201.557.8423 [email protected]
Marty SomelofskeBoard solutions – NY Metro 201.557.8405 [email protected]
Dave WiseBoard solutions – NY Metro 201.557.8406 [email protected]
Matt KlegerBoard solutions – Philadelphia 215.861.2341 [email protected]
Brandon CherryBoard solutions – San Francisco 415.644.3737 Brandon.Cherry@haygroupcom
An experienced partner: Your Hay Group team