
Exceptional oxidation activity with size-controlled ... · NATURE CHEMISTRY | . 1. SUPPLEMENTARY...
32
NATURE CHEMISTRY | www.nature.com/naturechemistry 1 SUPPLEMENTARY INFORMATION DOI: 10.1038/NCHEM.1721 Exceptional oxidation activity with size-controlled supported gold clusters of low atomicity Avelino Corma, 1,* Patricia Concepción, 1 Mercedes Boronat, 1 Maria J. Sabater, 1 Javier Navas, 1 Miguel José Yacaman, 2 Eduardo Larios, 2,3 Alvaro Posadas, 2 M. Arturo López- Quintela, 4 David Buceta, 4 Ernest Mendoza, 5 Gemma Guilera, 6 Alvaro Mayoral 7 1 Instituto de Tecnología Química, Universidad Politécnica de Valencia-Consejo Superior de Investigaciones Científicas (UPV-CSIC), Av. de los Naranjos s/n, 46022 Valencia, Spain. 2 Department of Physics University of Texas at San Antonio One 1604 circle San Antonio Texas 78249 Texas, USA. 3 On Leave from the University of Sonora. 4 Dept. Physical Chemistry, Faculty of Chemistry, Lab of Nanotechnology and Magnetism (NANOMAG) Research Technological Institute, University of Santiago de Compostela, E-15782 Santiago de Compostela, Spain. 5 Grup de Nanomaterials Aplicats, Centre de Recerca en Nanoenginyeria, Universitat Politècnica de Catalunya, c/ Pascual i Vila 15, 08028 Barcelona, Spain. 6 ALBA Synchrotron, Experiments Division, Crta. BP 1413, de Cerdanyola del Vallès a Sant Cugat del Vallès, 08290 Cerdanyola del Vallès, Barcelona, Spain. 7 Laboratorio de Microscopias Avanzadas, Instituto de Nanociencia de Aragon, Universidad de Zaragoza, Mariano Esquillor Edificio I+D, 50018, Zaragoza, Spain. © 2013 Macmillan Publishers Limited. All rights reserved.
Transcript of Exceptional oxidation activity with size-controlled ... · NATURE CHEMISTRY | . 1. SUPPLEMENTARY...
NATURE CHEMISTRY | www.nature.com/naturechemistry 1
SUPPLEMENTARY INFORMATIONDOI: 10.1038/NCHEM.1721
Exceptional oxidation activity with size-controlled supported gold
clusters of low atomicity
Avelino Corma,1,* Patricia Concepción,1 Mercedes Boronat,1 Maria J. Sabater,1 Javier
Navas,1 Miguel José Yacaman,2 Eduardo Larios,2,3 Alvaro Posadas,2 M. Arturo López-
Quintela,4 David Buceta,4 Ernest Mendoza,5 Gemma Guilera,6 Alvaro Mayoral7
1 Instituto de Tecnología Química, Universidad Politécnica de Valencia-Consejo
Superior de Investigaciones Científicas (UPV-CSIC), Av. de los Naranjos s/n,
46022 Valencia, Spain.
2 Department of Physics University of Texas at San Antonio One 1604 circle San
Antonio Texas 78249 Texas, USA.
3 On Leave from the University of Sonora.
4 Dept. Physical Chemistry, Faculty of Chemistry, Lab of Nanotechnology and
Magnetism (NANOMAG) Research Technological Institute, University of Santiago de
Compostela, E-15782 Santiago de Compostela, Spain.
5 Grup de Nanomaterials Aplicats, Centre de Recerca en Nanoenginyeria, Universitat
Politècnica de Catalunya, c/ Pascual i Vila 15, 08028 Barcelona, Spain.
6 ALBA Synchrotron, Experiments Division, Crta. BP 1413, de Cerdanyola del Vallès a
Sant Cugat del Vallès, 08290 Cerdanyola del Vallès, Barcelona, Spain.
7 Laboratorio de Microscopias Avanzadas, Instituto de Nanociencia de Aragon,
Universidad de Zaragoza, Mariano Esquillor Edificio I+D, 50018, Zaragoza, Spain.
© 2013 Macmillan Publishers Limited. All rights reserved.
NATURE CHEMISTRY | www.nature.com/naturechemistry 2
SUPPLEMENTARY INFORMATIONDOI: 10.1038/NCHEM.1721
Supplementary information
This supplementary information includes:
1. Catalyst synthesis.
2. HAADF-STEM characterization of the as-prepared catalyst
3. XPS characterization of the as-prepared catalyst
4. Raman and IR spectroscopic studies of the evolution of the gold species under
synthesis conditions.
5. HAADF-STEM characterization of the evolution of the catalyst under reaction
conditions
6. X-ray Absorption Spectroscopy (XAS) measurements
7. UV/Vis spectroscopy
8. Synthesis and characterization of size controlled gold clusters
9. Catalytic activity of 0.8 and 1.2 nm gold nanoparticles supported on MWCNTs
10. DFT results
11. Analysis of H2O2 and H2O formed, and O2 consumed during the reaction.
12. References
© 2013 Macmillan Publishers Limited. All rights reserved.
NATURE CHEMISTRY | www.nature.com/naturechemistry 3
SUPPLEMENTARY INFORMATIONDOI: 10.1038/NCHEM.1721
1. Catalyst synthesis.
The synthetic route to obtain isolated gold atoms supported on Thin Multiwalled
Carbon Nanotubes (MWCNT) starts by wrapping the CNTs with the polyelectrolyte
polyallylamine hydrochloride (PAH). For this purpose, multiwalled CNTs are
dispersed in a 1 wt.% aqueous solution of PAH (Sigma-Aldrich) at pH = 9 to a
concentration of 1 mg/mL. A combination of rapid stirring and ultrasonication is used to
ensure the presence of dispersed individual nanotubes. Excess PAH is removed by
vacuum filtration and successive washing with ultra pure water. Then, the CNTs are
resuspended in water at pH = 9. The reaction to synthesize isolated gold atoms consists
of adding to 50 ml of CNT – PAH solution the adequate amount of HAuCl4 aqueous
solution to yield a 0,1wt% metallic gold content. Finally, sodium citrate aqueous
solution (citrate:Au molar ratio 1700) is added. After 3 days aging at room temperature,
citrate ions are removed by centrifugation at the following conditions: 1h at 6000 rpm
10°C followed by 1 h at 8000 rpm 10°C. Finally the sample is dried by lyophylization.
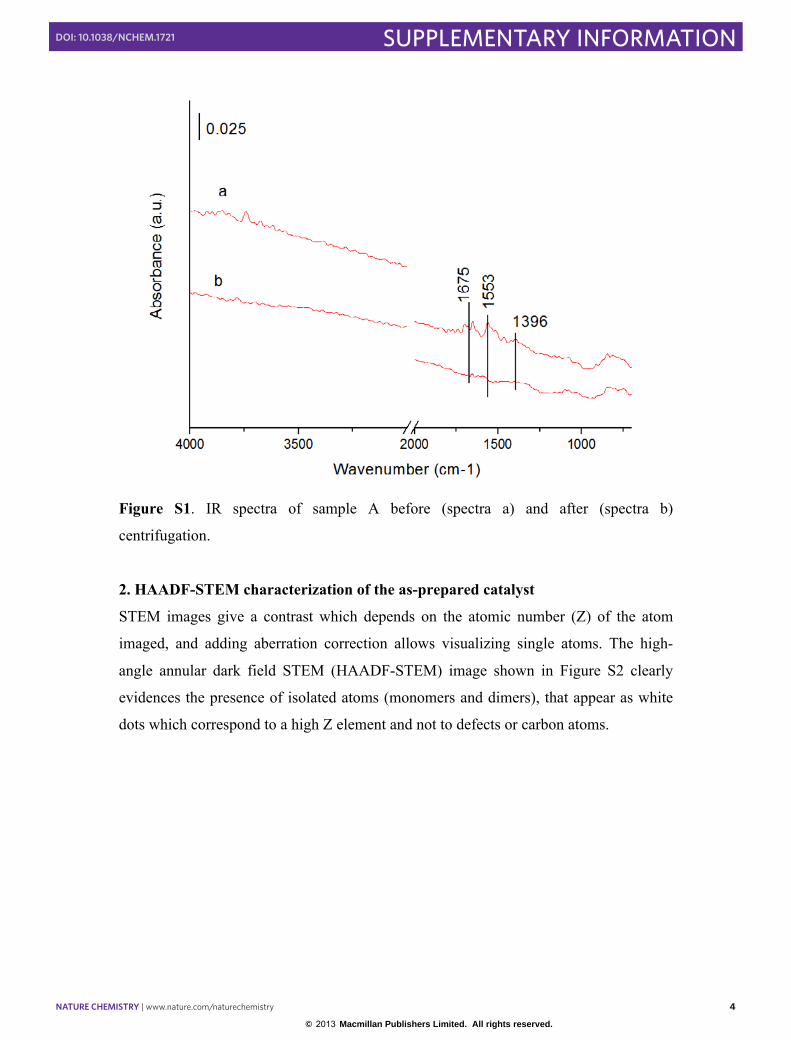
The removal of the citrate ions has been followed by IR spectroscopy. Fig. S1 shows the
IR spectra of sample A prior to centrifugation (with excess of citrate ions, spectra a) and
after centrifugation (spectra b). IR bands at 1675, 1553 and 1396 observed on the
sample prior to centrifugation are associated to citrate ions. The weak intensity of the IR
bands is due to the low amount of citrate ions (due to the low gold loading of the
sample). After centrifugation of sample A no IR bands are observed in the 1690-1350
cm-1 IR range, in accordance with the effective removal of non interacting citrate ions.
© 2013 Macmillan Publishers Limited. All rights reserved.
NATURE CHEMISTRY | www.nature.com/naturechemistry 4
SUPPLEMENTARY INFORMATIONDOI: 10.1038/NCHEM.1721
Figure S1. IR spectra of sample A before (spectra a) and after (spectra b)
centrifugation.
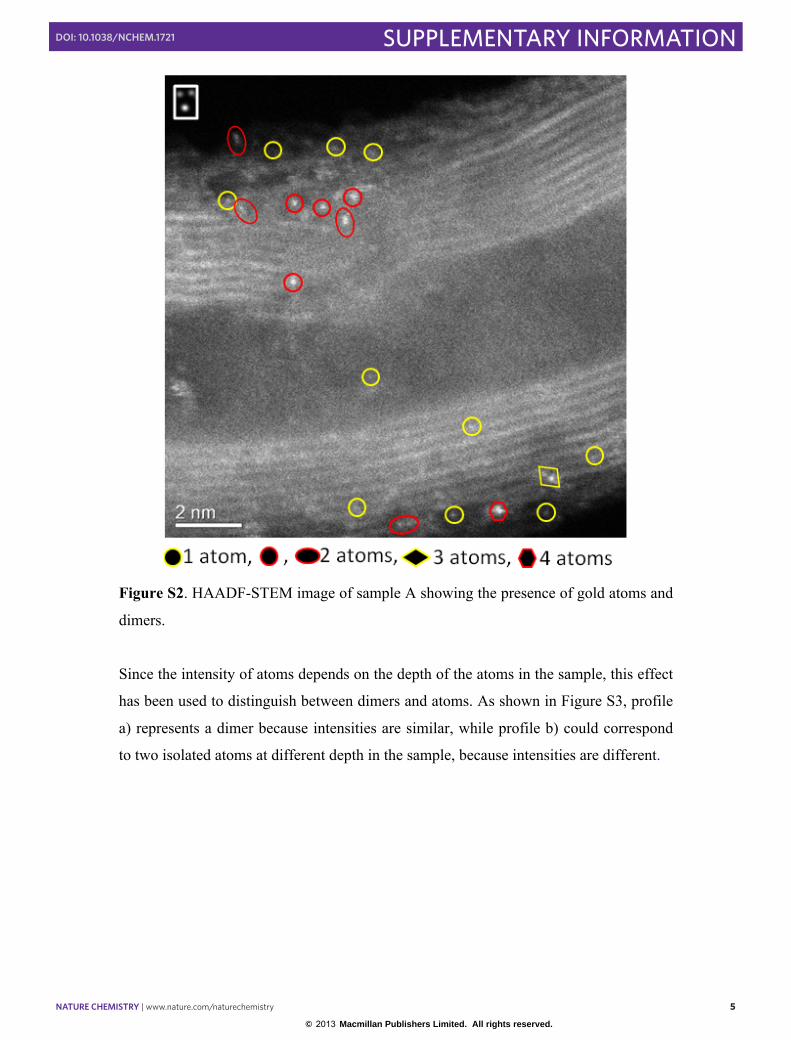
2. HAADF-STEM characterization of the as-prepared catalyst
STEM images give a contrast which depends on the atomic number (Z) of the atom
imaged, and adding aberration correction allows visualizing single atoms. The high-
angle annular dark field STEM (HAADF-STEM) image shown in Figure S2 clearly
evidences the presence of isolated atoms (monomers and dimers), that appear as white
dots which correspond to a high Z element and not to defects or carbon atoms.
© 2013 Macmillan Publishers Limited. All rights reserved.
NATURE CHEMISTRY | www.nature.com/naturechemistry 5
SUPPLEMENTARY INFORMATIONDOI: 10.1038/NCHEM.1721
Figure S2. HAADF-STEM image of sample A showing the presence of gold atoms and
dimers.
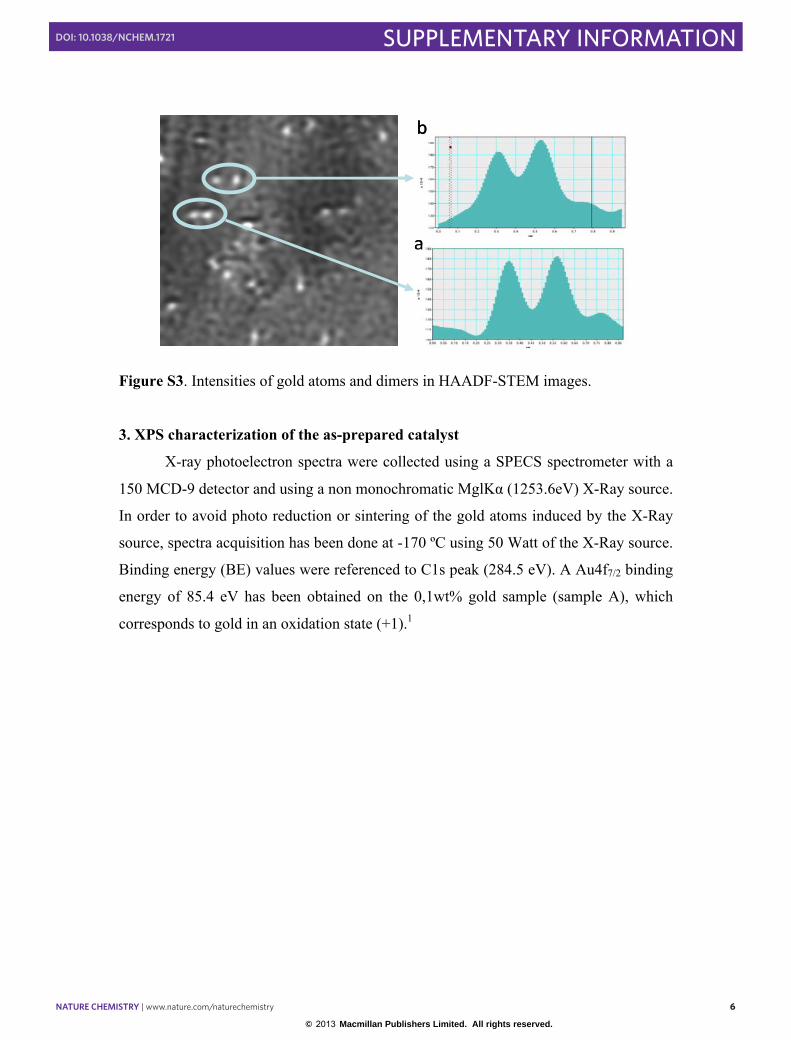
Since the intensity of atoms depends on the depth of the atoms in the sample, this effect
has been used to distinguish between dimers and atoms. As shown in Figure S3, profile
a) represents a dimer because intensities are similar, while profile b) could correspond
to two isolated atoms at different depth in the sample, because intensities are different.
© 2013 Macmillan Publishers Limited. All rights reserved.
NATURE CHEMISTRY | www.nature.com/naturechemistry 6
SUPPLEMENTARY INFORMATIONDOI: 10.1038/NCHEM.1721
a
ba
1
2
a
ba
1
2
Figure S3. Intensities of gold atoms and dimers in HAADF-STEM images.
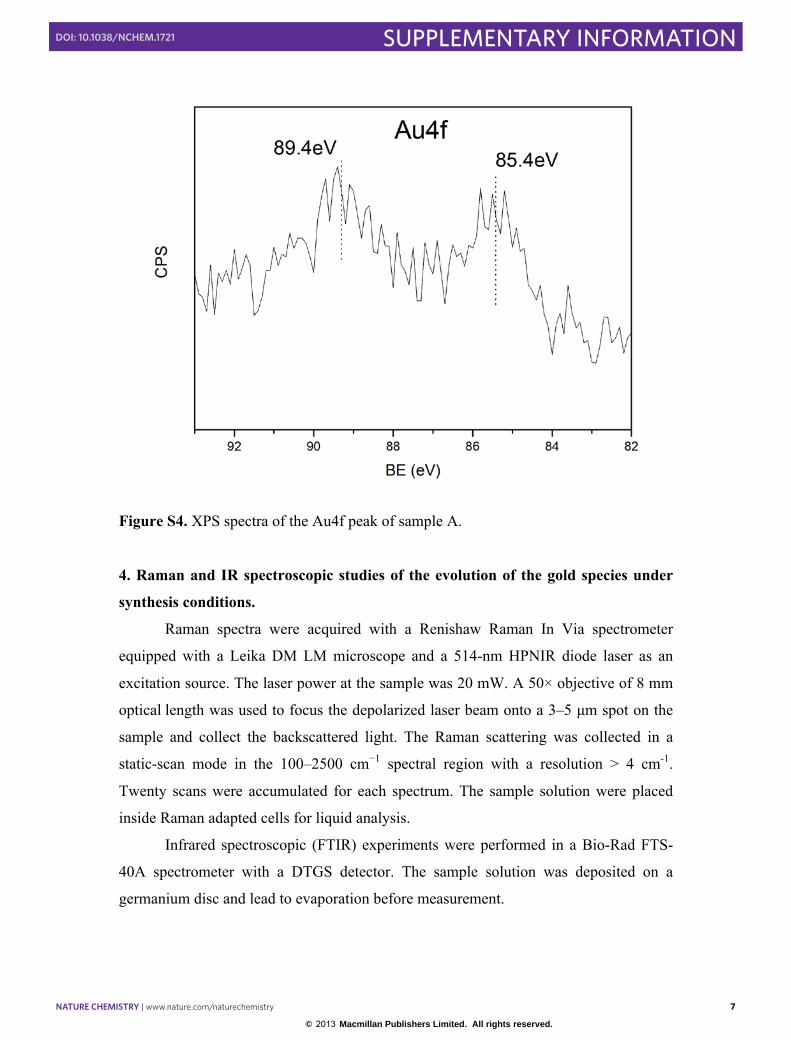
3. XPS characterization of the as-prepared catalyst
X-ray photoelectron spectra were collected using a SPECS spectrometer with a
150 MCD-9 detector and using a non monochromatic MglKα (1253.6eV) X-Ray source.
In order to avoid photo reduction or sintering of the gold atoms induced by the X-Ray
source, spectra acquisition has been done at -170 ºC using 50 Watt of the X-Ray source.
Binding energy (BE) values were referenced to C1s peak (284.5 eV). A Au4f7/2 binding
energy of 85.4 eV has been obtained on the 0,1wt% gold sample (sample A), which
corresponds to gold in an oxidation state (+1).1
© 2013 Macmillan Publishers Limited. All rights reserved.
NATURE CHEMISTRY | www.nature.com/naturechemistry 7
SUPPLEMENTARY INFORMATIONDOI: 10.1038/NCHEM.1721
Figure S4. XPS spectra of the Au4f peak of sample A.
4. Raman and IR spectroscopic studies of the evolution of the gold species under
synthesis conditions.
Raman spectra were acquired with a Renishaw Raman In Via spectrometer
equipped with a Leika DM LM microscope and a 514-nm HPNIR diode laser as an
excitation source. The laser power at the sample was 20 mW. A 50× objective of 8 mm
optical length was used to focus the depolarized laser beam onto a 3–5 µm spot on the
sample and collect the backscattered light. The Raman scattering was collected in a
static-scan mode in the 100–2500 cm−1 spectral region with a resolution > 4 cm-1.
Twenty scans were accumulated for each spectrum. The sample solution were placed
inside Raman adapted cells for liquid analysis.
Infrared spectroscopic (FTIR) experiments were performed in a Bio-Rad FTS-
40A spectrometer with a DTGS detector. The sample solution was deposited on a
germanium disc and lead to evaporation before measurement.
© 2013 Macmillan Publishers Limited. All rights reserved.
NATURE CHEMISTRY | www.nature.com/naturechemistry 8
SUPPLEMENTARY INFORMATIONDOI: 10.1038/NCHEM.1721
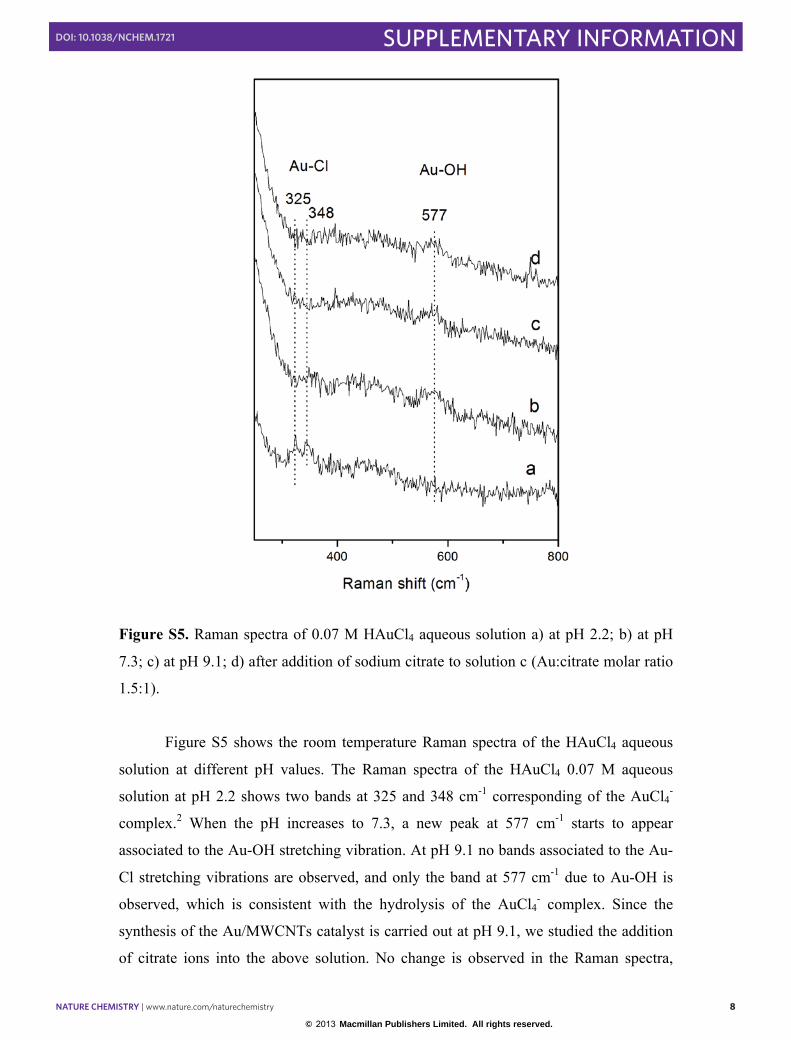
Figure S5. Raman spectra of 0.07 M HAuCl4 aqueous solution a) at pH 2.2; b) at pH
7.3; c) at pH 9.1; d) after addition of sodium citrate to solution c (Au:citrate molar ratio
1.5:1).
Figure S5 shows the room temperature Raman spectra of the HAuCl4 aqueous
solution at different pH values. The Raman spectra of the HAuCl4 0.07 M aqueous
solution at pH 2.2 shows two bands at 325 and 348 cm-1 corresponding of the AuCl4-
complex.2 When the pH increases to 7.3, a new peak at 577 cm-1 starts to appear
associated to the Au-OH stretching vibration. At pH 9.1 no bands associated to the Au-
Cl stretching vibrations are observed, and only the band at 577 cm-1 due to Au-OH is
observed, which is consistent with the hydrolysis of the AuCl4- complex. Since the
synthesis of the Au/MWCNTs catalyst is carried out at pH 9.1, we studied the addition
of citrate ions into the above solution. No change is observed in the Raman spectra,
© 2013 Macmillan Publishers Limited. All rights reserved.
NATURE CHEMISTRY | www.nature.com/naturechemistry 9
SUPPLEMENTARY INFORMATIONDOI: 10.1038/NCHEM.1721
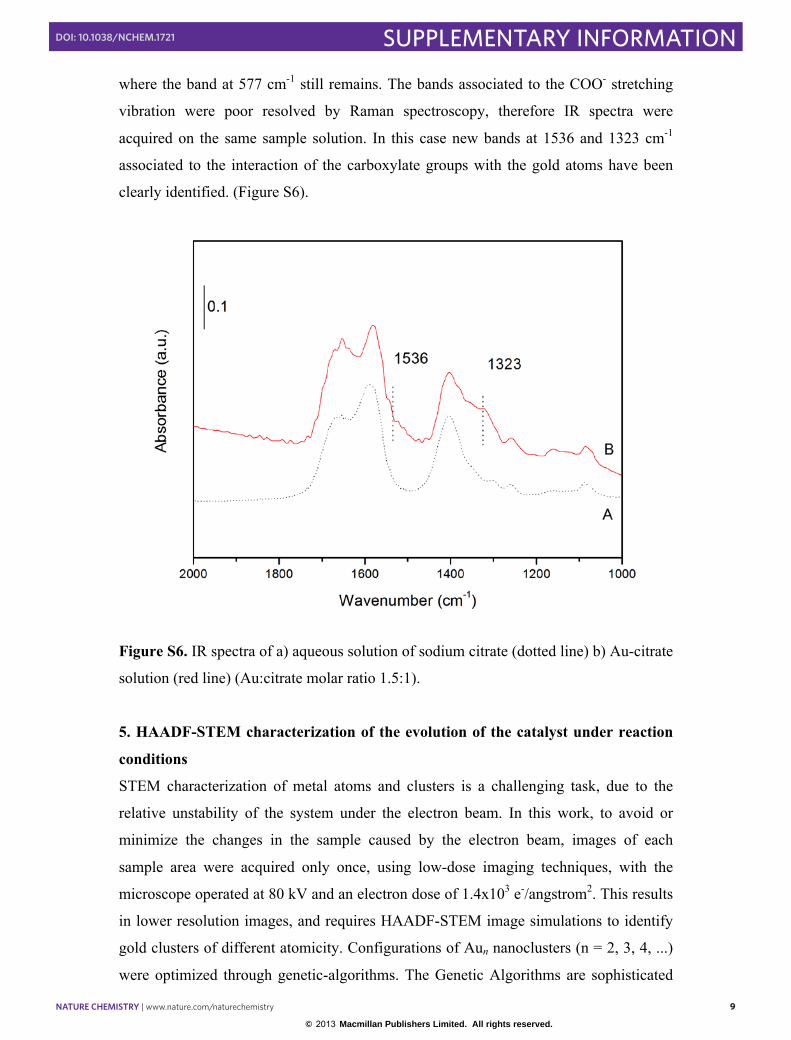
where the band at 577 cm-1 still remains. The bands associated to the COO- stretching
vibration were poor resolved by Raman spectroscopy, therefore IR spectra were
acquired on the same sample solution. In this case new bands at 1536 and 1323 cm-1
associated to the interaction of the carboxylate groups with the gold atoms have been
clearly identified. (Figure S6).
Figure S6. IR spectra of a) aqueous solution of sodium citrate (dotted line) b) Au-citrate
solution (red line) (Au:citrate molar ratio 1.5:1).
5. HAADF-STEM characterization of the evolution of the catalyst under reaction
conditions
STEM characterization of metal atoms and clusters is a challenging task, due to the
relative unstability of the system under the electron beam. In this work, to avoid or
minimize the changes in the sample caused by the electron beam, images of each
sample area were acquired only once, using low-dose imaging techniques, with the
microscope operated at 80 kV and an electron dose of 1.4x10³ e-/angstrom2. This results
in lower resolution images, and requires HAADF-STEM image simulations to identify
gold clusters of different atomicity. Configurations of Aun nanoclusters (n = 2, 3, 4, ...)
were optimized through genetic-algorithms. The Genetic Algorithms are sophisticated
© 2013 Macmillan Publishers Limited. All rights reserved.
NATURE CHEMISTRY | www.nature.com/naturechemistry 10
SUPPLEMENTARY INFORMATIONDOI: 10.1038/NCHEM.1721
strategies of global search that have proven to be efficient in the search of global
minima with regard to other methods involving derivatives. This is a search technique
based on the principles of natural evolution; the operators used in the search resemble
the evolutionary processes of genetic crossover, natural selection and mutation to
explore potential energy hyper surfaces. We used the BCGA code3 which incorporates
the semi-empiric Gupta potential to model interatomic interaction of transition and
noble metal atoms. The set of parameters this model potential requires for gold atoms
were taken from Cleri et al.4 and the initial configurations for all cluster sizes were
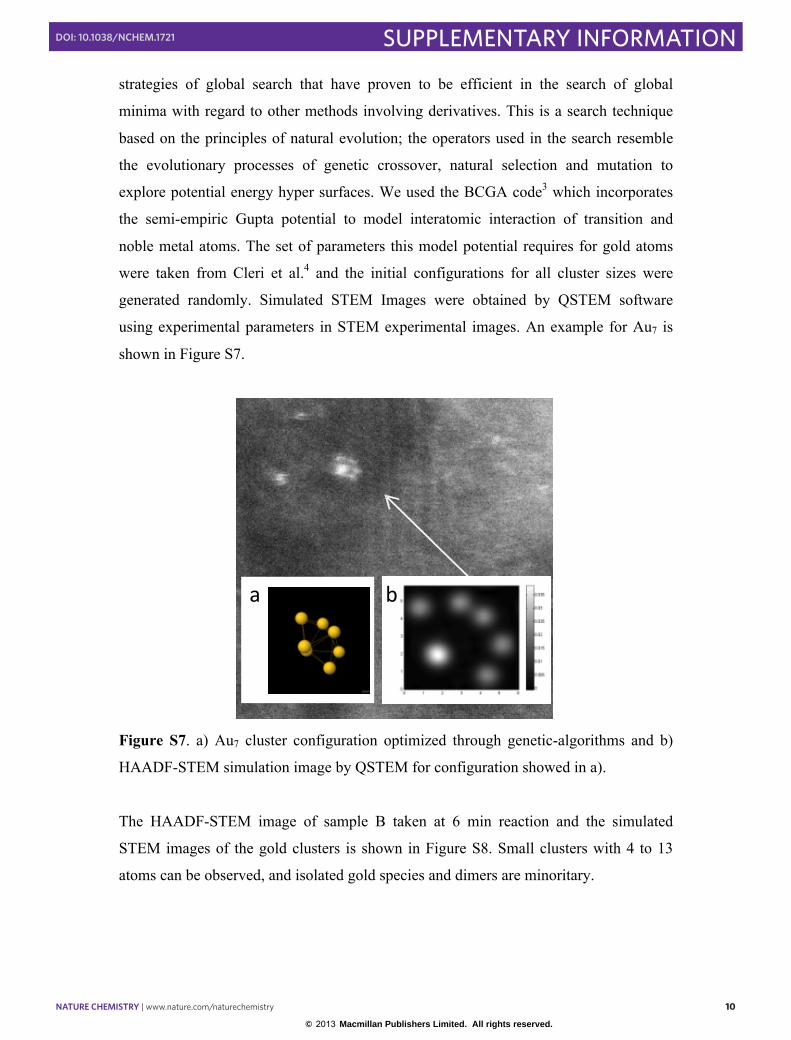
generated randomly. Simulated STEM Images were obtained by QSTEM software
using experimental parameters in STEM experimental images. An example for Au7 is
shown in Figure S7.
a ba b
Figure S7. a) Au7 cluster configuration optimized through genetic-algorithms and b)
HAADF-STEM simulation image by QSTEM for configuration showed in a).
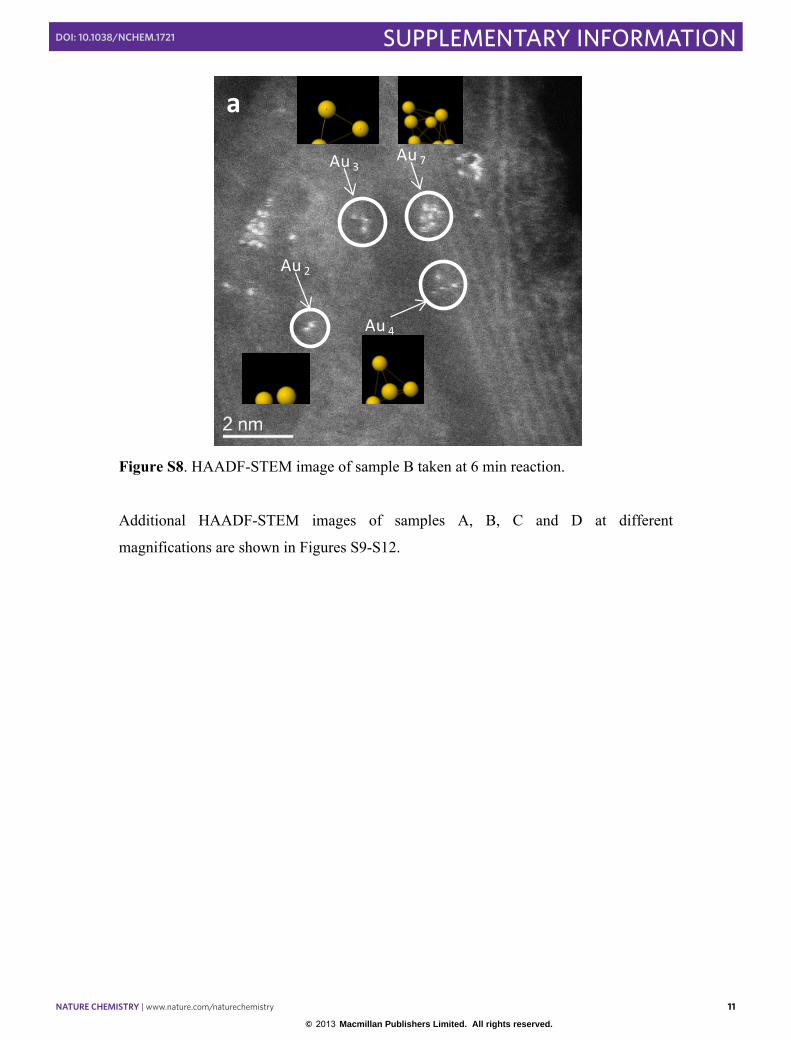
The HAADF-STEM image of sample B taken at 6 min reaction and the simulated
STEM images of the gold clusters is shown in Figure S8. Small clusters with 4 to 13
atoms can be observed, and isolated gold species and dimers are minoritary.
© 2013 Macmillan Publishers Limited. All rights reserved.
NATURE CHEMISTRY | www.nature.com/naturechemistry 11
SUPPLEMENTARY INFORMATIONDOI: 10.1038/NCHEM.1721
Au 3 Au 7
Au 4
Au 2
a
Figure S8. HAADF-STEM image of sample B taken at 6 min reaction.
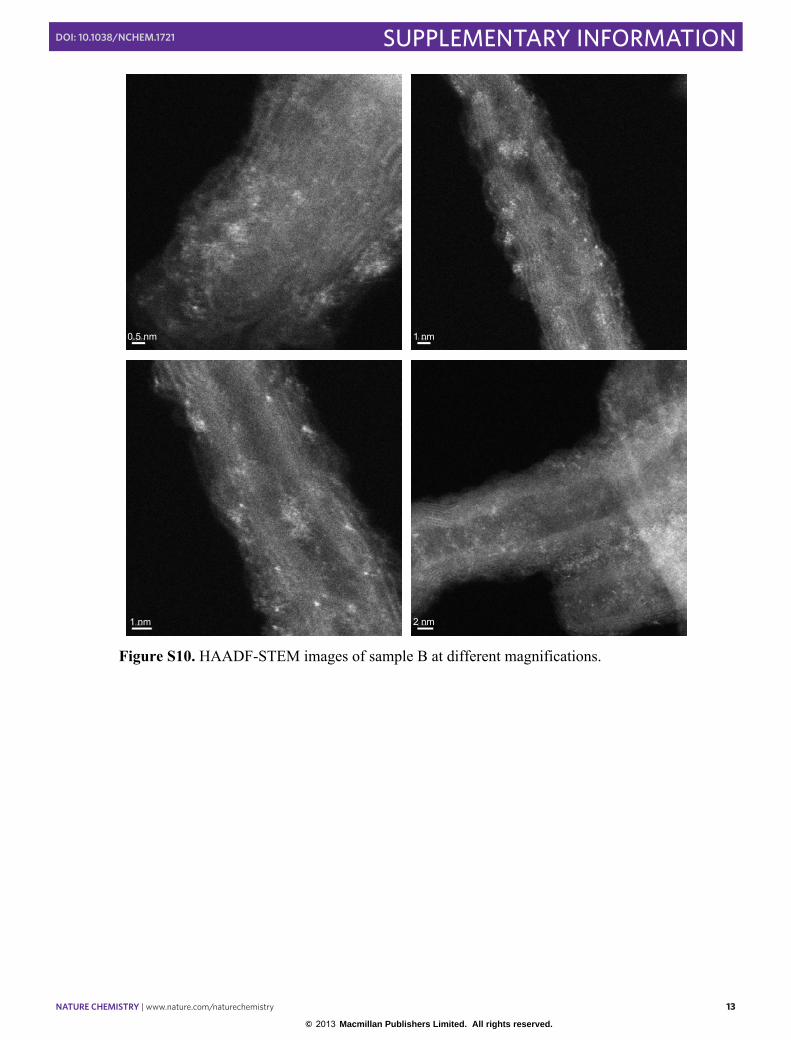
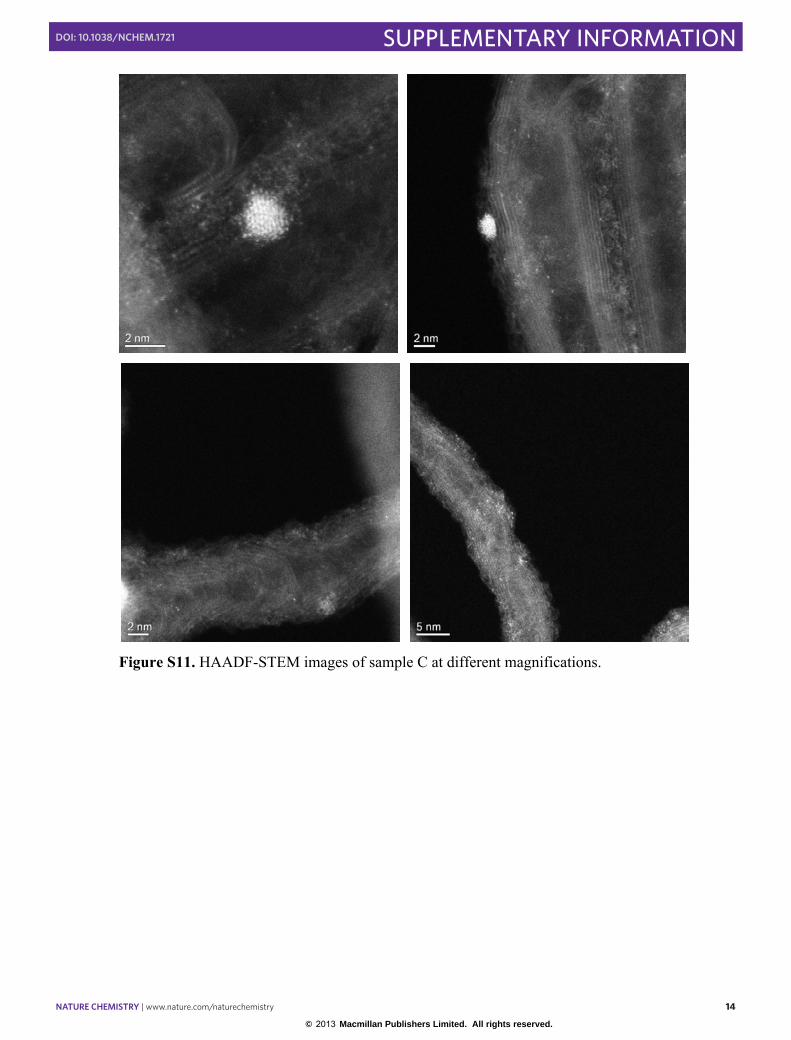
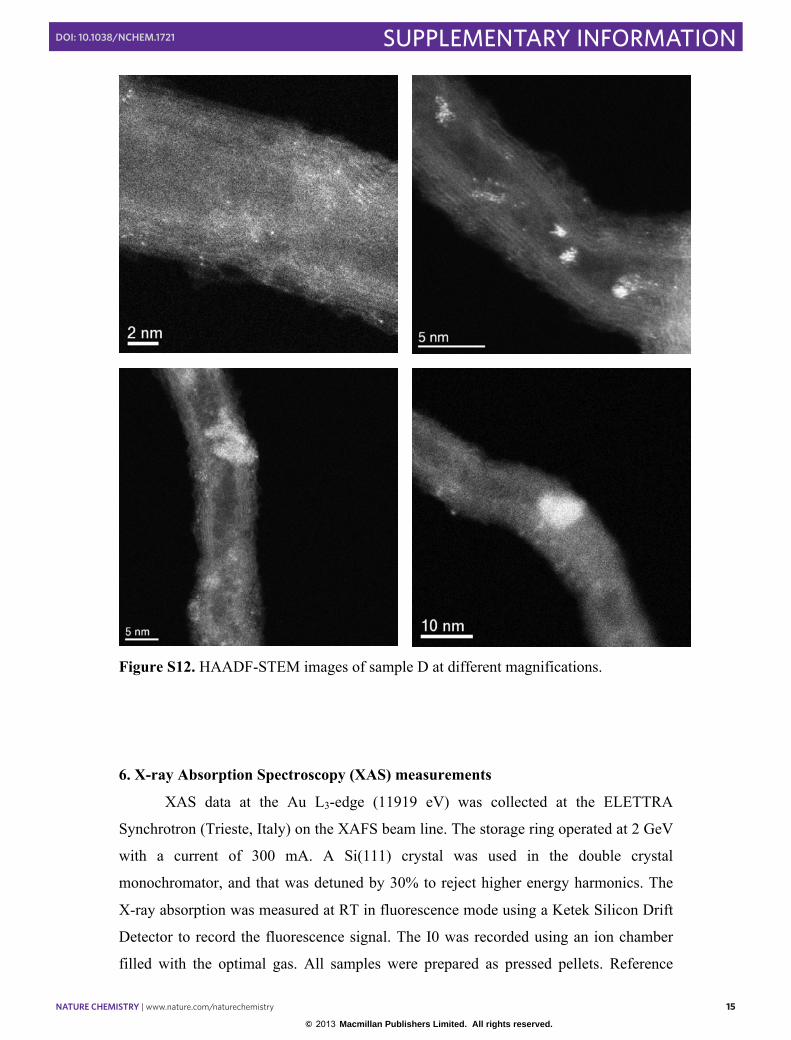
Additional HAADF-STEM images of samples A, B, C and D at different
magnifications are shown in Figures S9-S12.
© 2013 Macmillan Publishers Limited. All rights reserved.
NATURE CHEMISTRY | www.nature.com/naturechemistry 12
SUPPLEMENTARY INFORMATIONDOI: 10.1038/NCHEM.1721
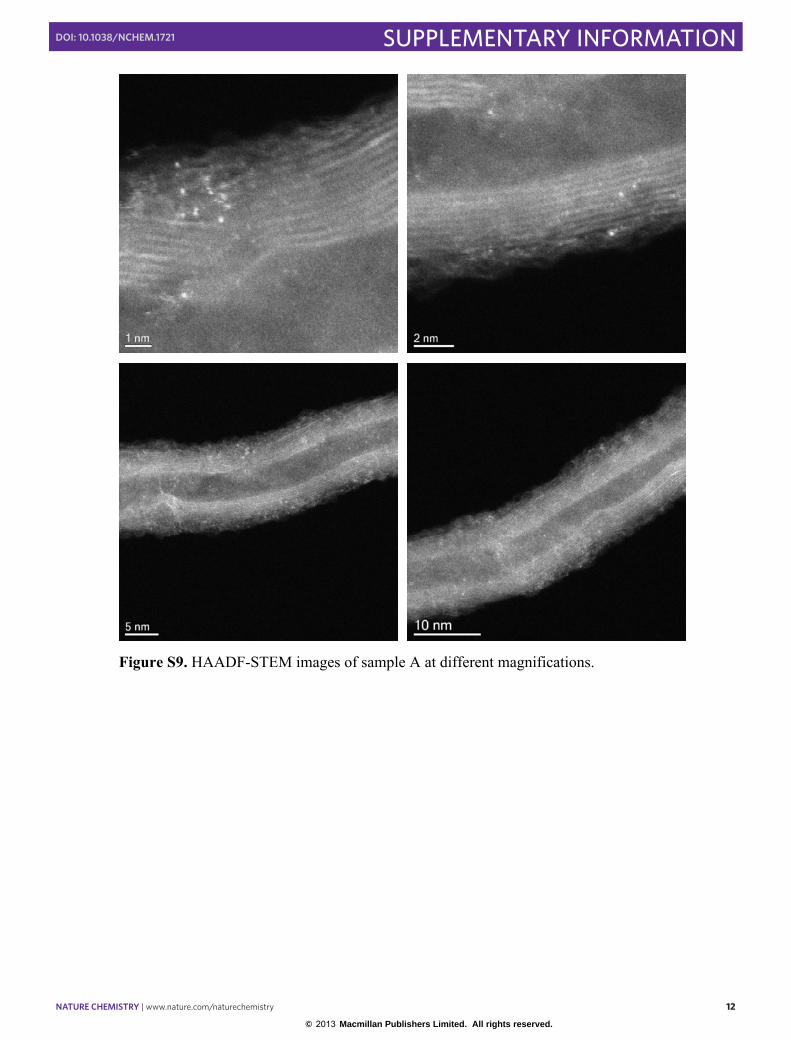
Figure S9. HAADF-STEM images of sample A at different magnifications.
© 2013 Macmillan Publishers Limited. All rights reserved.
NATURE CHEMISTRY | www.nature.com/naturechemistry 13
SUPPLEMENTARY INFORMATIONDOI: 10.1038/NCHEM.1721
2 nm1 nm
1 nm0.5 nm
2 nm1 nm
1 nm0.5 nm
Figure S10. HAADF-STEM images of sample B at different magnifications.
© 2013 Macmillan Publishers Limited. All rights reserved.
NATURE CHEMISTRY | www.nature.com/naturechemistry 14
SUPPLEMENTARY INFORMATIONDOI: 10.1038/NCHEM.1721
Figure S11. HAADF-STEM images of sample C at different magnifications.
© 2013 Macmillan Publishers Limited. All rights reserved.
NATURE CHEMISTRY | www.nature.com/naturechemistry 15
SUPPLEMENTARY INFORMATIONDOI: 10.1038/NCHEM.1721
Figure S12. HAADF-STEM images of sample D at different magnifications.
6. X-ray Absorption Spectroscopy (XAS) measurements
XAS data at the Au L3-edge (11919 eV) was collected at the ELETTRA
Synchrotron (Trieste, Italy) on the XAFS beam line. The storage ring operated at 2 GeV
with a current of 300 mA. A Si(111) crystal was used in the double crystal
monochromator, and that was detuned by 30% to reject higher energy harmonics. The
X-ray absorption was measured at RT in fluorescence mode using a Ketek Silicon Drift
Detector to record the fluorescence signal. The I0 was recorded using an ion chamber
filled with the optimal gas. All samples were prepared as pressed pellets. Reference
© 2013 Macmillan Publishers Limited. All rights reserved.
NATURE CHEMISTRY | www.nature.com/naturechemistry 16
SUPPLEMENTARY INFORMATIONDOI: 10.1038/NCHEM.1721
samples of Au2O3, Au(OH)3 AuCl, (PPh3)AuCH3, Au foil and 3wt% of 4 nm Au NPs
were also measured in transmission mode. Fluorescence measurements of Au/MWCNT
samples took about 9 h each. Despite the long measurements the data quality of these
very demanding samples was not of the quality required for EXAFS data quantification.
For this reason, the analysis was addressed from a qualitative point of view and the
EXAFS signal was inspected within a wave number range of k=3.6-9.6 Å-1. Data
reduction was performed using the VIPER program and following the standard
procedures.5,6
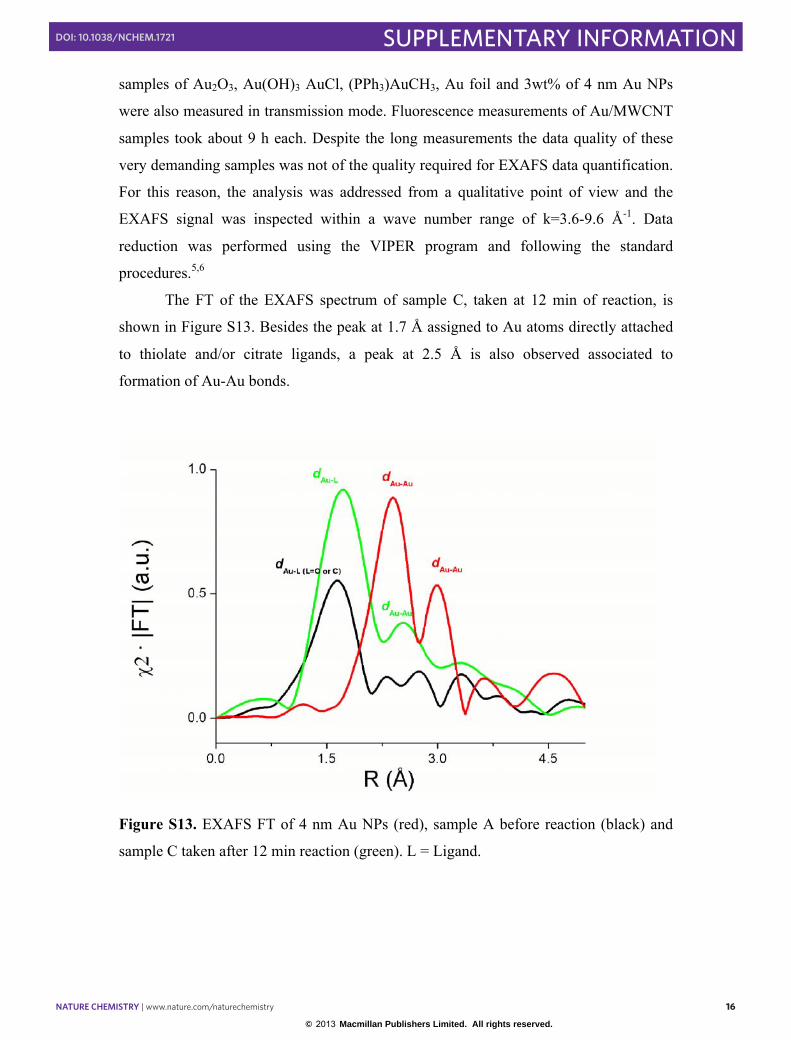
The FT of the EXAFS spectrum of sample C, taken at 12 min of reaction, is
shown in Figure S13. Besides the peak at 1.7 Å assigned to Au atoms directly attached
to thiolate and/or citrate ligands, a peak at 2.5 Å is also observed associated to
formation of Au-Au bonds.
Figure S13. EXAFS FT of 4 nm Au NPs (red), sample A before reaction (black) and
sample C taken after 12 min reaction (green). L = Ligand.
© 2013 Macmillan Publishers Limited. All rights reserved.
NATURE CHEMISTRY | www.nature.com/naturechemistry 17
SUPPLEMENTARY INFORMATIONDOI: 10.1038/NCHEM.1721
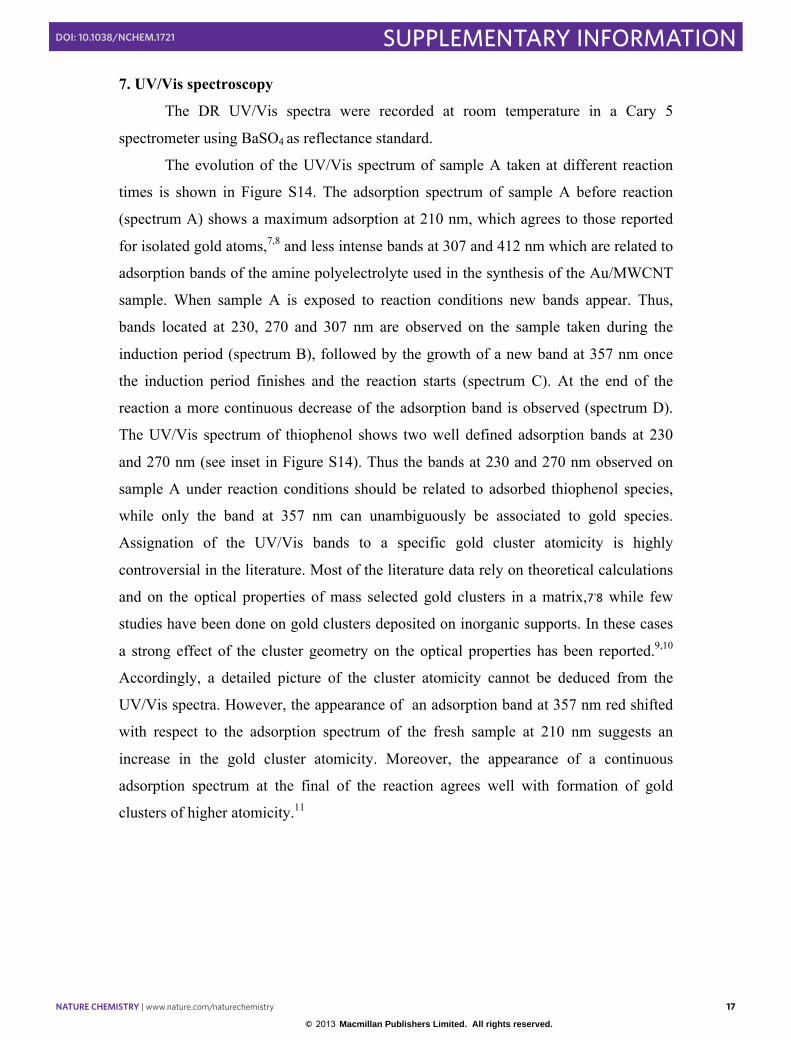
7. UV/Vis spectroscopy
The DR UV/Vis spectra were recorded at room temperature in a Cary 5
spectrometer using BaSO4 as reflectance standard.
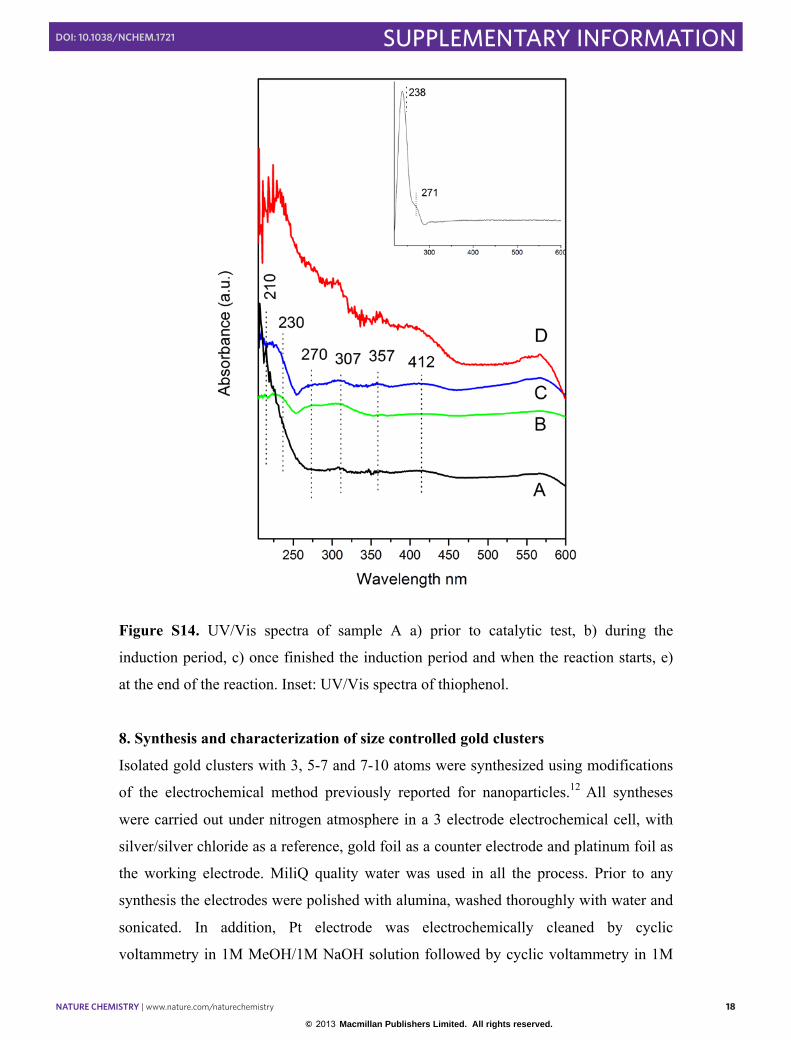
The evolution of the UV/Vis spectrum of sample A taken at different reaction
times is shown in Figure S14. The adsorption spectrum of sample A before reaction
(spectrum A) shows a maximum adsorption at 210 nm, which agrees to those reported
for isolated gold atoms,7,8 and less intense bands at 307 and 412 nm which are related to
adsorption bands of the amine polyelectrolyte used in the synthesis of the Au/MWCNT
sample. When sample A is exposed to reaction conditions new bands appear. Thus,
bands located at 230, 270 and 307 nm are observed on the sample taken during the
induction period (spectrum B), followed by the growth of a new band at 357 nm once
the induction period finishes and the reaction starts (spectrum C). At the end of the
reaction a more continuous decrease of the adsorption band is observed (spectrum D).
The UV/Vis spectrum of thiophenol shows two well defined adsorption bands at 230
and 270 nm (see inset in Figure S14). Thus the bands at 230 and 270 nm observed on
sample A under reaction conditions should be related to adsorbed thiophenol species,
while only the band at 357 nm can unambiguously be associated to gold species.
Assignation of the UV/Vis bands to a specific gold cluster atomicity is highly
controversial in the literature. Most of the literature data rely on theoretical calculations
and on the optical properties of mass selected gold clusters in a matrix,7,8 while few
studies have been done on gold clusters deposited on inorganic supports. In these cases
a strong effect of the cluster geometry on the optical properties has been reported.9,10
Accordingly, a detailed picture of the cluster atomicity cannot be deduced from the
UV/Vis spectra. However, the appearance of an adsorption band at 357 nm red shifted
with respect to the adsorption spectrum of the fresh sample at 210 nm suggests an
increase in the gold cluster atomicity. Moreover, the appearance of a continuous
adsorption spectrum at the final of the reaction agrees well with formation of gold
clusters of higher atomicity.11
© 2013 Macmillan Publishers Limited. All rights reserved.
NATURE CHEMISTRY | www.nature.com/naturechemistry 18
SUPPLEMENTARY INFORMATIONDOI: 10.1038/NCHEM.1721
Figure S14. UV/Vis spectra of sample A a) prior to catalytic test, b) during the
induction period, c) once finished the induction period and when the reaction starts, e)
at the end of the reaction. Inset: UV/Vis spectra of thiophenol.
8. Synthesis and characterization of size controlled gold clusters
Isolated gold clusters with 3, 5-7 and 7-10 atoms were synthesized using modifications
of the electrochemical method previously reported for nanoparticles.12 All syntheses
were carried out under nitrogen atmosphere in a 3 electrode electrochemical cell, with
silver/silver chloride as a reference, gold foil as a counter electrode and platinum foil as
the working electrode. MiliQ quality water was used in all the process. Prior to any
synthesis the electrodes were polished with alumina, washed thoroughly with water and
sonicated. In addition, Pt electrode was electrochemically cleaned by cyclic
voltammetry in 1M MeOH/1M NaOH solution followed by cyclic voltammetry in 1M
© 2013 Macmillan Publishers Limited. All rights reserved.
NATURE CHEMISTRY | www.nature.com/naturechemistry 19
SUPPLEMENTARY INFORMATIONDOI: 10.1038/NCHEM.1721
H2SO4. Sample Au3 was synthesized in MiliQ water at 35ºC fixing the potential at -8V
during 6200 s. Sample Au5-7 was synthesized in MiliQ water at 25ºC fixing the current
density in four steps: 1420 s at -20mA, 6200 s at -25 mA, 3600 s at -35 mA and 10000 s
at -45 mA. Sample Au7-10 was synthesized in 0.1M KNO3 at 25ºC fixing the current
density in two steps: 10000s at -30 mA and 10000 s at -40 mA.
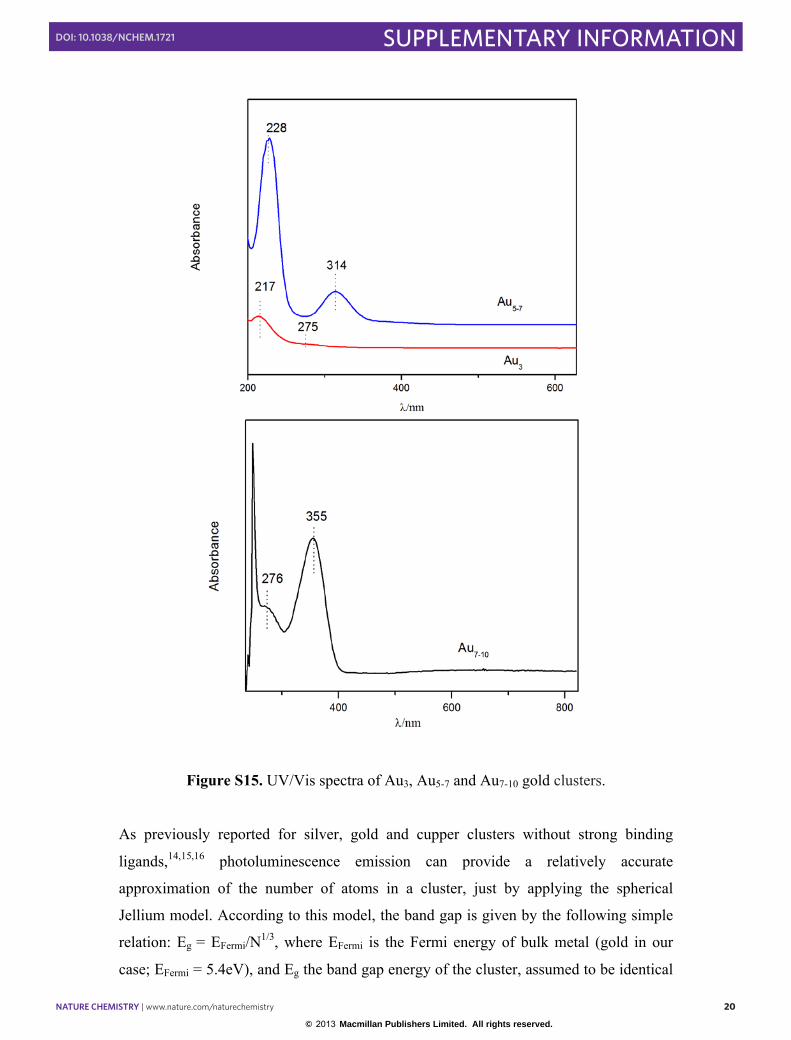
The atomicity of size controlled gold clusters in solution was characterized by
combining several spectroscopic techniques. Figure S15 shows the UV/Vis absorption
spectra of the gold clusters synthesized electrochemically. The absence of Plasmon band
at ~520 nm, indicates that particles are smaller than ~ 1.5-2.0 nm. Moreover, the
presence of only discrete, molecule-like bands in the UV region indicates that clusters
are very small, in the size range: Aun, n < ~ 20 atoms.13
© 2013 Macmillan Publishers Limited. All rights reserved.
NATURE CHEMISTRY | www.nature.com/naturechemistry 20
SUPPLEMENTARY INFORMATIONDOI: 10.1038/NCHEM.1721
Figure S15. UV/Vis spectra of Au3, Au5-7 and Au7-10 gold clusters.
As previously reported for silver, gold and cupper clusters without strong binding
ligands,14,15,16 photoluminescence emission can provide a relatively accurate
approximation of the number of atoms in a cluster, just by applying the spherical
Jellium model. According to this model, the band gap is given by the following simple
relation: Eg = EFermi/N1/3, where EFermi is the Fermi energy of bulk metal (gold in our
case; EFermi = 5.4eV), and Eg the band gap energy of the cluster, assumed to be identical
© 2013 Macmillan Publishers Limited. All rights reserved.
NATURE CHEMISTRY | www.nature.com/naturechemistry 21
SUPPLEMENTARY INFORMATIONDOI: 10.1038/NCHEM.1721
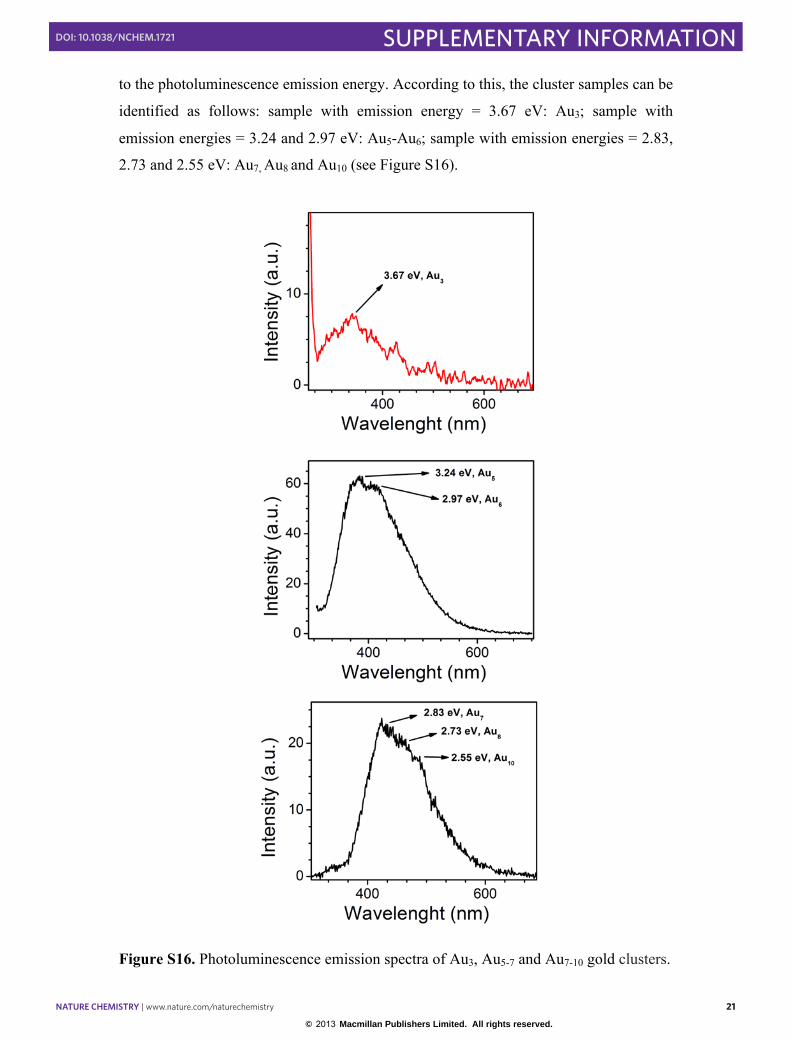
to the photoluminescence emission energy. According to this, the cluster samples can be
identified as follows: sample with emission energy = 3.67 eV: Au3; sample with
emission energies = 3.24 and 2.97 eV: Au5-Au6; sample with emission energies = 2.83,
2.73 and 2.55 eV: Au7, Au8 and Au10 (see Figure S16).
Figure S16. Photoluminescence emission spectra of Au3, Au5-7 and Au7-10 gold clusters.
© 2013 Macmillan Publishers Limited. All rights reserved.
NATURE CHEMISTRY | www.nature.com/naturechemistry 22
SUPPLEMENTARY INFORMATIONDOI: 10.1038/NCHEM.1721
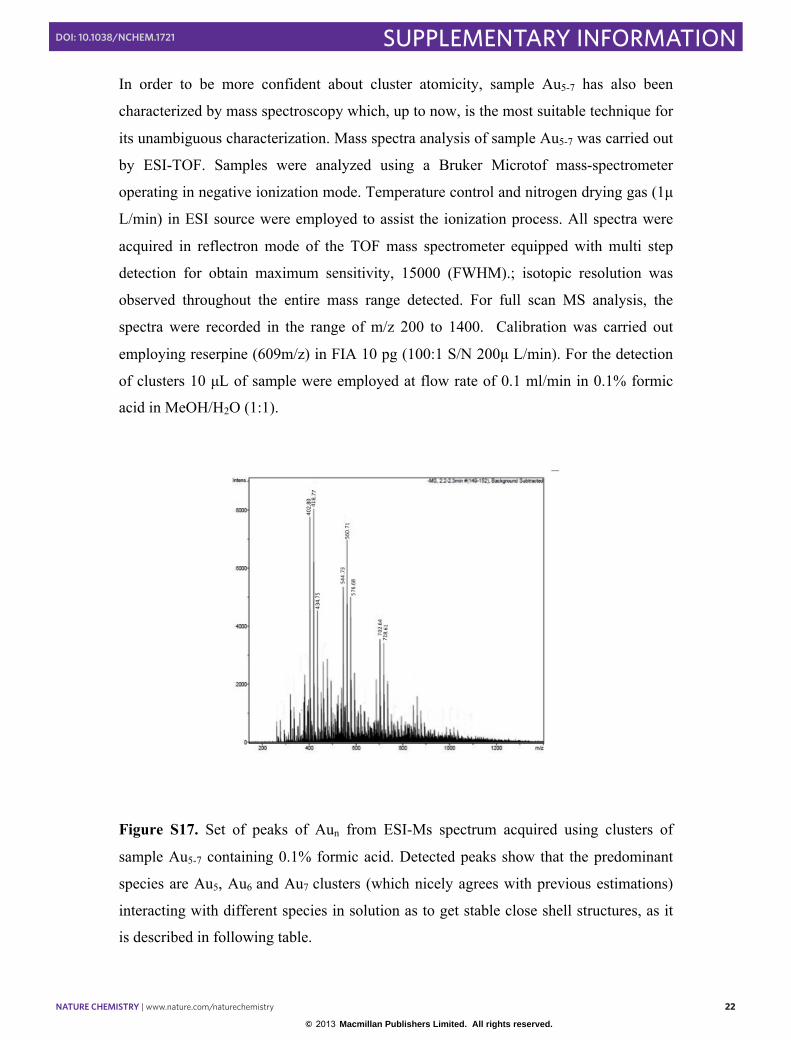
In order to be more confident about cluster atomicity, sample Au5-7 has also been
characterized by mass spectroscopy which, up to now, is the most suitable technique for
its unambiguous characterization. Mass spectra analysis of sample Au5-7 was carried out
by ESI-TOF. Samples were analyzed using a Bruker Microtof mass-spectrometer
operating in negative ionization mode. Temperature control and nitrogen drying gas (1µ
L/min) in ESI source were employed to assist the ionization process. All spectra were
acquired in reflectron mode of the TOF mass spectrometer equipped with multi step
detection for obtain maximum sensitivity, 15000 (FWHM).; isotopic resolution was
observed throughout the entire mass range detected. For full scan MS analysis, the
spectra were recorded in the range of m/z 200 to 1400. Calibration was carried out
employing reserpine (609m/z) in FIA 10 pg (100:1 S/N 200µ L/min). For the detection
of clusters 10 µL of sample were employed at flow rate of 0.1 ml/min in 0.1% formic
acid in MeOH/H2O (1:1).
Figure S17. Set of peaks of Aun from ESI-Ms spectrum acquired using clusters of
sample Au5-7 containing 0.1% formic acid. Detected peaks show that the predominant
species are Au5, Au6 and Au7 clusters (which nicely agrees with previous estimations)
interacting with different species in solution as to get stable close shell structures, as it
is described in following table.
© 2013 Macmillan Publishers Limited. All rights reserved.
NATURE CHEMISTRY | www.nature.com/naturechemistry 23
SUPPLEMENTARY INFORMATIONDOI: 10.1038/NCHEM.1721
m/z (exp) formula m/z (theor)
402.80 [Au7 (OH)5 (H2O)8 ]-4 402.72
418.77 [Au7 (O2)2 (OH)5 (H2O)8 ]-4 418.71
434.75 [Au7 (O2)2 (OH)5 (H2O)8 (CH3OH)2]-4 434.73
544.73 [Au5 (OH)5 (H2O) ]-2 544.43
560.71 [Au5 (OH)5 (H2O) (CH3OH)]-2 560.44
576.68 [Au5 O2 (OH)5 (H2O) (CH3OH)]-2 576.44
702.64 [Au6 (O) (OH)2 (H2O)6 (CH3OH)2]-2 702.46
718.61 [Au6 (O) (OH)2 (H2O)6 (CH3OH)3]-2 718.47
Previous studies done with these and other clusters of different metals and sizes have
shown that the clusters remain stable after deposition onto a support.17,18
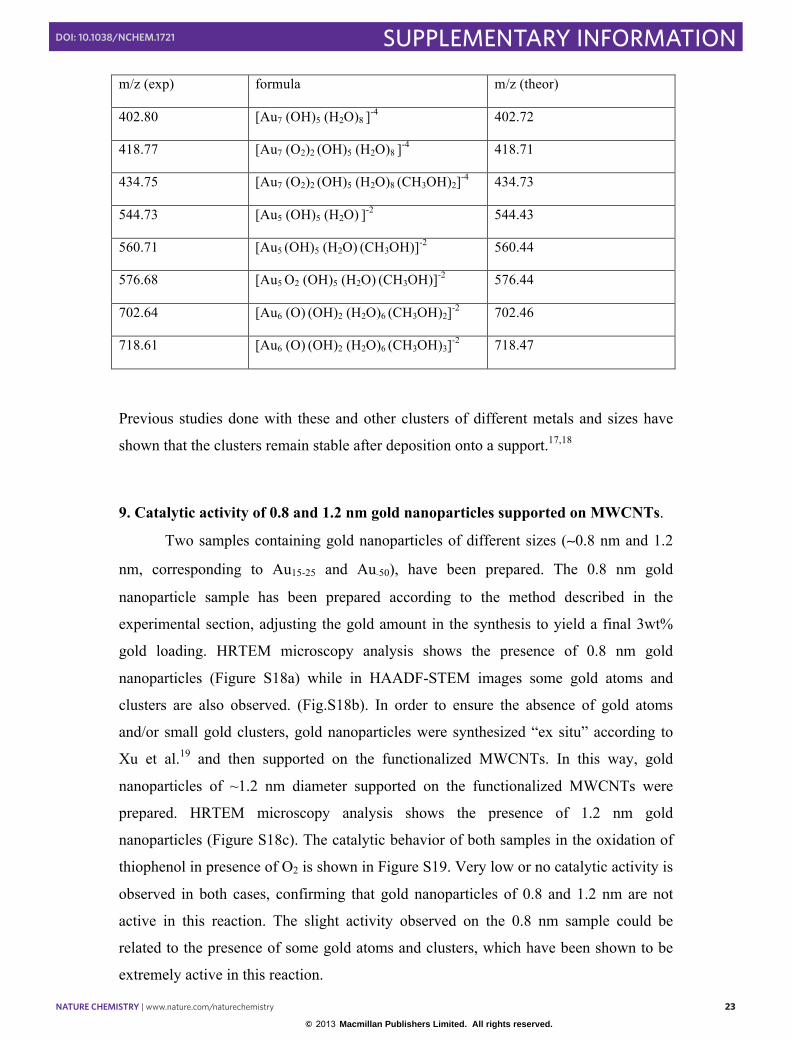
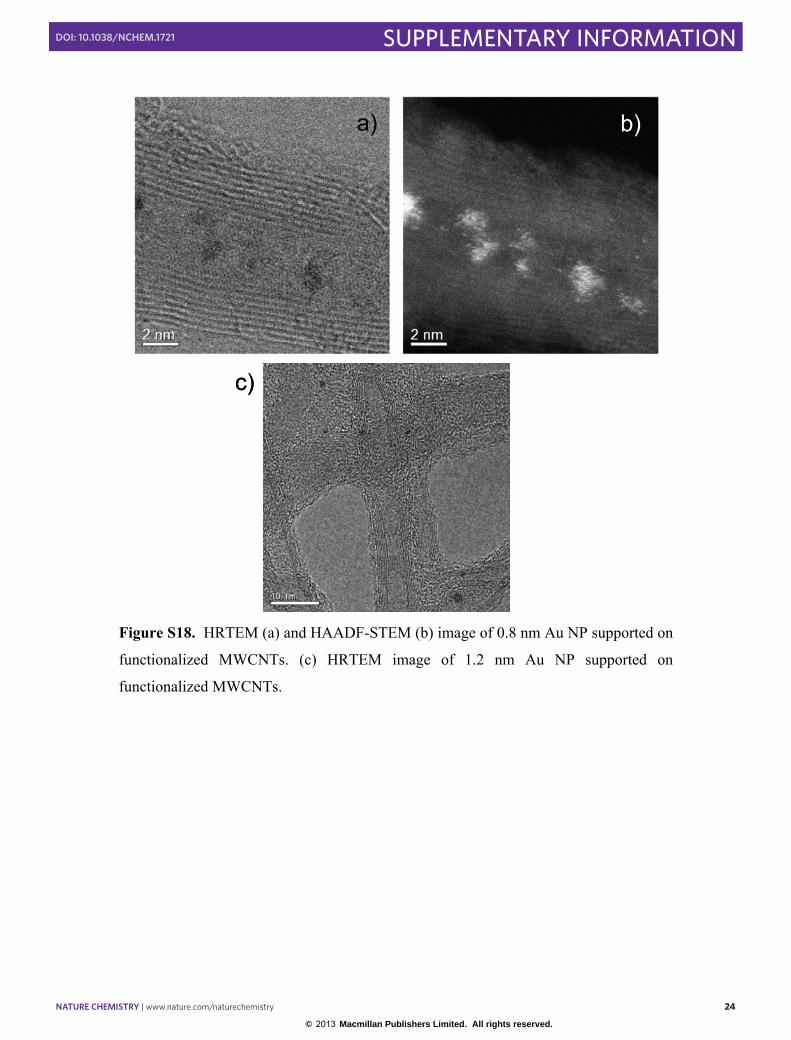
9. Catalytic activity of 0.8 and 1.2 nm gold nanoparticles supported on MWCNTs.
Two samples containing gold nanoparticles of different sizes (∼0.8 nm and 1.2
nm, corresponding to Au15-25 and Au∼50), have been prepared. The 0.8 nm gold
nanoparticle sample has been prepared according to the method described in the
experimental section, adjusting the gold amount in the synthesis to yield a final 3wt%
gold loading. HRTEM microscopy analysis shows the presence of 0.8 nm gold
nanoparticles (Figure S18a) while in HAADF-STEM images some gold atoms and
clusters are also observed. (Fig.S18b). In order to ensure the absence of gold atoms
and/or small gold clusters, gold nanoparticles were synthesized “ex situ” according to
Xu et al.19 and then supported on the functionalized MWCNTs. In this way, gold
nanoparticles of ~1.2 nm diameter supported on the functionalized MWCNTs were
prepared. HRTEM microscopy analysis shows the presence of 1.2 nm gold
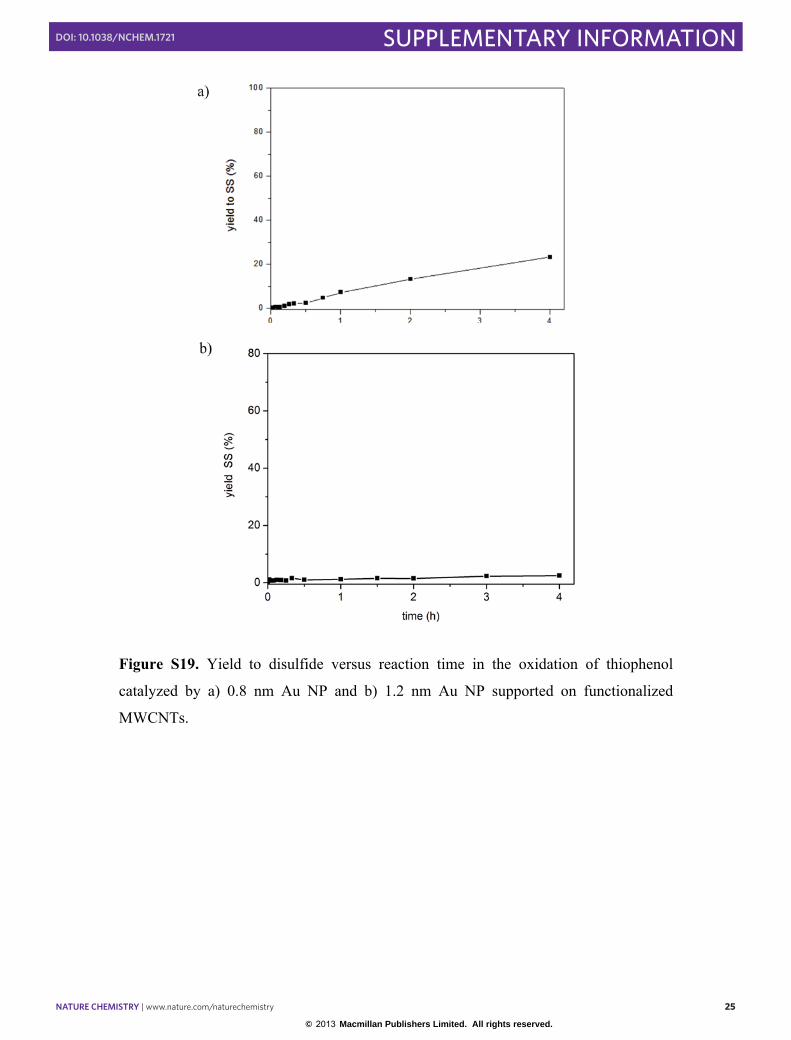
nanoparticles (Figure S18c). The catalytic behavior of both samples in the oxidation of
thiophenol in presence of O2 is shown in Figure S19. Very low or no catalytic activity is
observed in both cases, confirming that gold nanoparticles of 0.8 and 1.2 nm are not
active in this reaction. The slight activity observed on the 0.8 nm sample could be
related to the presence of some gold atoms and clusters, which have been shown to be
extremely active in this reaction.
© 2013 Macmillan Publishers Limited. All rights reserved.
NATURE CHEMISTRY | www.nature.com/naturechemistry 24
SUPPLEMENTARY INFORMATIONDOI: 10.1038/NCHEM.1721
a) b)
c)
a) b)
c)
Figure S18. HRTEM (a) and HAADF-STEM (b) image of 0.8 nm Au NP supported on
functionalized MWCNTs. (c) HRTEM image of 1.2 nm Au NP supported on
functionalized MWCNTs.
© 2013 Macmillan Publishers Limited. All rights reserved.
NATURE CHEMISTRY | www.nature.com/naturechemistry 25
SUPPLEMENTARY INFORMATIONDOI: 10.1038/NCHEM.1721
Figure S19. Yield to disulfide versus reaction time in the oxidation of thiophenol
catalyzed by a) 0.8 nm Au NP and b) 1.2 nm Au NP supported on functionalized
MWCNTs.
© 2013 Macmillan Publishers Limited. All rights reserved.
NATURE CHEMISTRY | www.nature.com/naturechemistry 26
SUPPLEMENTARY INFORMATIONDOI: 10.1038/NCHEM.1721
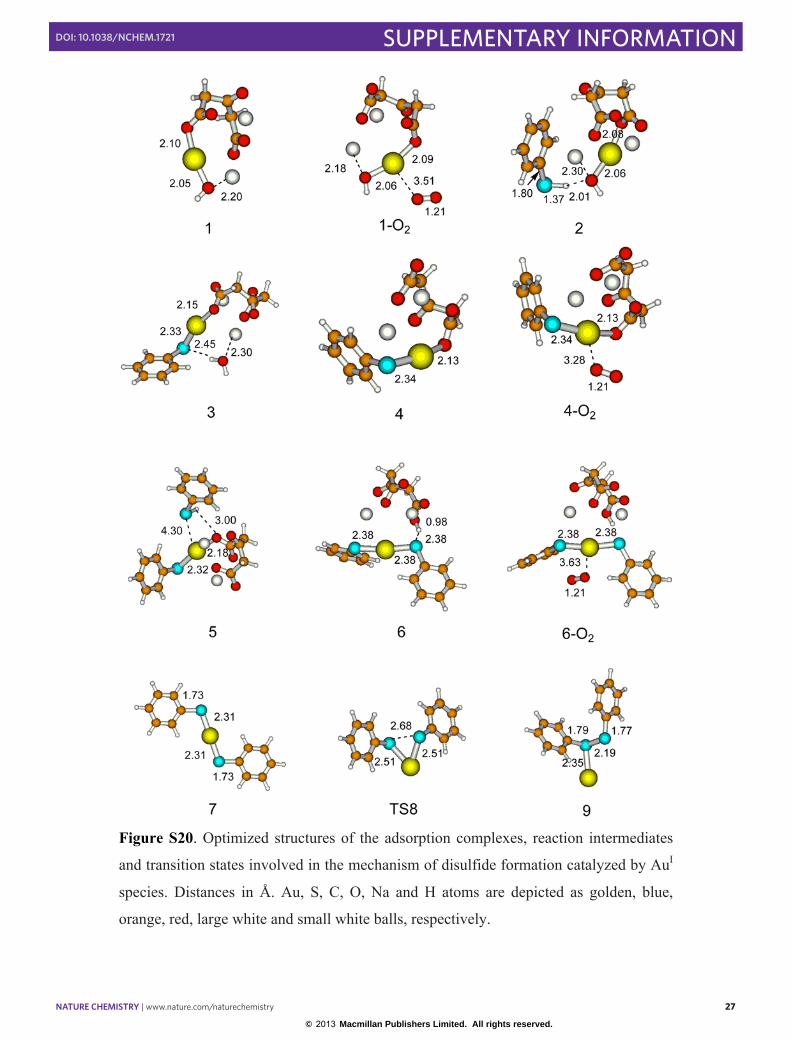
10. DFT results
The optimized geometries of the most stable structures obtained by interaction of
thiophenol and O2 with isolated AuI species and with small Au3, Au5, Au6 and Au7
clusters are depicted in Figures S20 and S21, respectively.
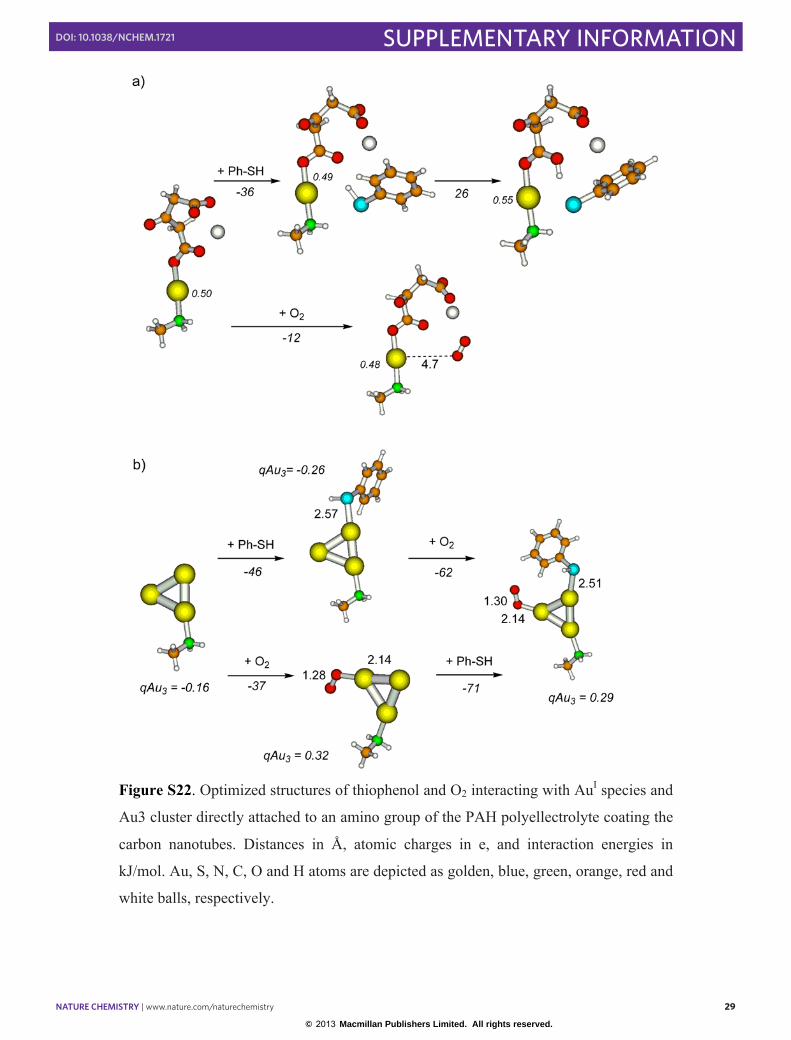
In order to determine the influence of the the gold-support interface on the activation of
reactants, the interaction of thiophenol and O2 with a AuI species and a Au3 cluster
directly attached to an amino group of the PAH polyelectrolyte coating the carbon
nanotubes have been calculated and compared with those discussed in the manuscript.
The optimized geometries, calculated energies and net atomic charges shown in Figure
S22 indicate that the amino groups do not participate directly in the activation of
reactants. Moreover, their presence does not modify significatively the charge
distribution of the gold atoms and clusters, and does not influence the interaction of
gold with O2 and thiophenol, demonstrating the validity the reaction mechanism
described in the manuscript.
© 2013 Macmillan Publishers Limited. All rights reserved.
NATURE CHEMISTRY | www.nature.com/naturechemistry 27
SUPPLEMENTARY INFORMATIONDOI: 10.1038/NCHEM.1721
Figure S20. Optimized structures of the adsorption complexes, reaction intermediates
and transition states involved in the mechanism of disulfide formation catalyzed by AuI
species. Distances in Å. Au, S, C, O, Na and H atoms are depicted as golden, blue,
orange, red, large white and small white balls, respectively.
© 2013 Macmillan Publishers Limited. All rights reserved.
NATURE CHEMISTRY | www.nature.com/naturechemistry 28
SUPPLEMENTARY INFORMATIONDOI: 10.1038/NCHEM.1721
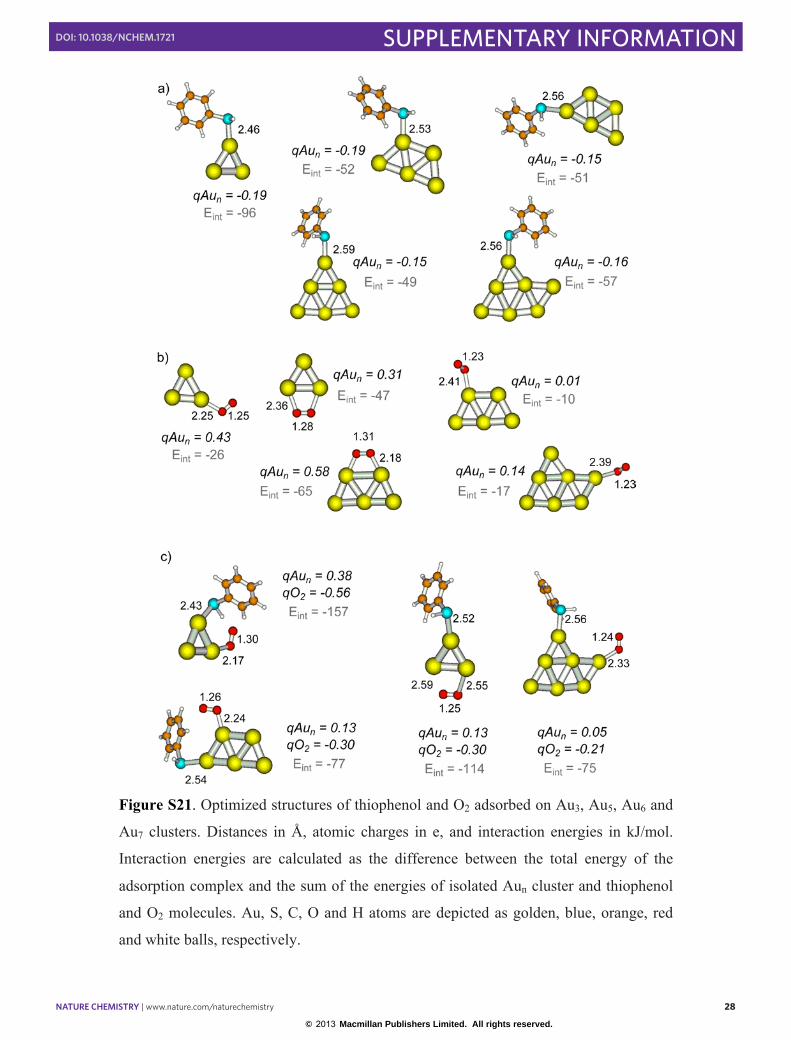
Figure S21. Optimized structures of thiophenol and O2 adsorbed on Au3, Au5, Au6 and
Au7 clusters. Distances in Å, atomic charges in e, and interaction energies in kJ/mol.
Interaction energies are calculated as the difference between the total energy of the
adsorption complex and the sum of the energies of isolated Aun cluster and thiophenol
and O2 molecules. Au, S, C, O and H atoms are depicted as golden, blue, orange, red
and white balls, respectively.
© 2013 Macmillan Publishers Limited. All rights reserved.
NATURE CHEMISTRY | www.nature.com/naturechemistry 29
SUPPLEMENTARY INFORMATIONDOI: 10.1038/NCHEM.1721
Figure S22. Optimized structures of thiophenol and O2 interacting with AuI species and
Au3 cluster directly attached to an amino group of the PAH polyellectrolyte coating the
carbon nanotubes. Distances in Å, atomic charges in e, and interaction energies in
kJ/mol. Au, S, N, C, O and H atoms are depicted as golden, blue, green, orange, red and
white balls, respectively.
© 2013 Macmillan Publishers Limited. All rights reserved.
NATURE CHEMISTRY | www.nature.com/naturechemistry 30
SUPPLEMENTARY INFORMATIONDOI: 10.1038/NCHEM.1721
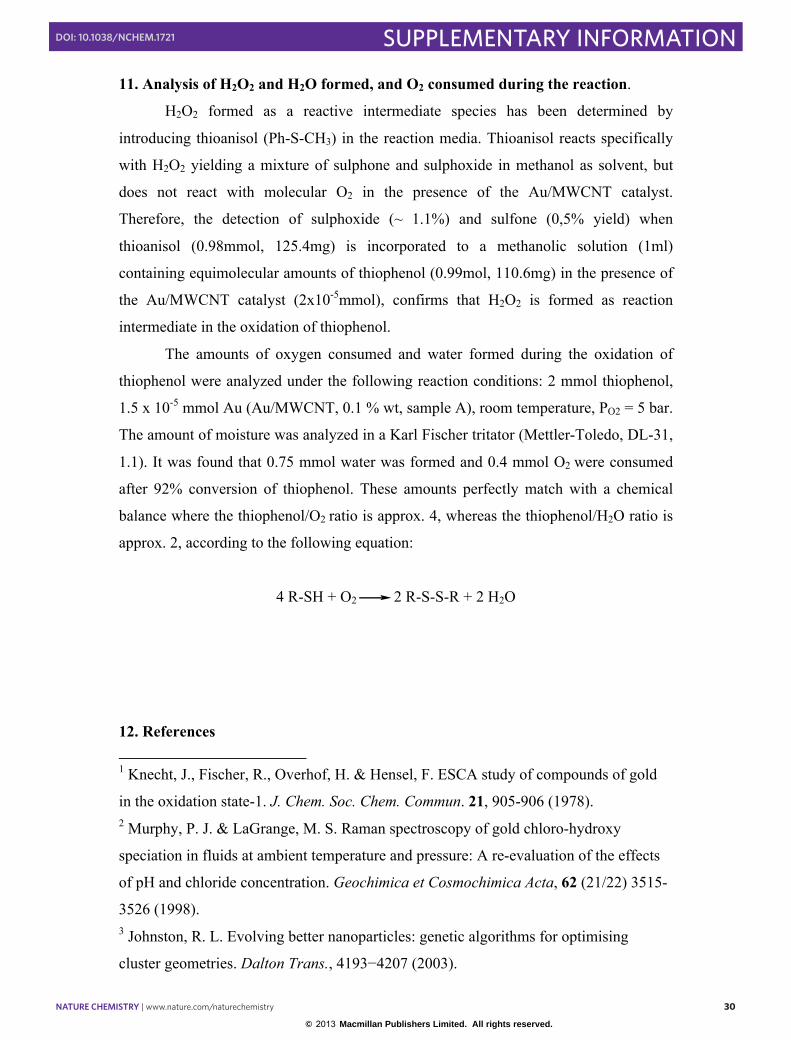
11. Analysis of H2O2 and H2O formed, and O2 consumed during the reaction.
H2O2 formed as a reactive intermediate species has been determined by
introducing thioanisol (Ph-S-CH3) in the reaction media. Thioanisol reacts specifically
with H2O2 yielding a mixture of sulphone and sulphoxide in methanol as solvent, but
does not react with molecular O2 in the presence of the Au/MWCNT catalyst.
Therefore, the detection of sulphoxide (~ 1.1%) and sulfone (0,5% yield) when
thioanisol (0.98mmol, 125.4mg) is incorporated to a methanolic solution (1ml)
containing equimolecular amounts of thiophenol (0.99mol, 110.6mg) in the presence of
the Au/MWCNT catalyst (2x10⁻⁵mmol), confirms that H2O2 is formed as reaction
intermediate in the oxidation of thiophenol.
The amounts of oxygen consumed and water formed during the oxidation of
thiophenol were analyzed under the following reaction conditions: 2 mmol thiophenol,
1.5 x 10⁻⁵ mmol Au (Au/MWCNT, 0.1 % wt, sample A), room temperature, PO2 = 5 bar.
The amount of moisture was analyzed in a Karl Fischer tritator (Mettler-Toledo, DL-31,
1.1). It was found that 0.75 mmol water was formed and 0.4 mmol O2 were consumed
after 92% conversion of thiophenol. These amounts perfectly match with a chemical
balance where the thiophenol/O2 ratio is approx. 4, whereas the thiophenol/H2O ratio is
approx. 2, according to the following equation:
4 R-SH + O2 2 R-S-S-R + 2 H2O
12. References 1 Knecht, J., Fischer, R., Overhof, H. & Hensel, F. ESCA study of compounds of gold
in the oxidation state-1. J. Chem. Soc. Chem. Commun. 21, 905-906 (1978). 2 Murphy, P. J. & LaGrange, M. S. Raman spectroscopy of gold chloro-hydroxy
speciation in fluids at ambient temperature and pressure: A re-evaluation of the effects
of pH and chloride concentration. Geochimica et Cosmochimica Acta, 62 (21/22) 3515-
3526 (1998). 3 Johnston, R. L. Evolving better nanoparticles: genetic algorithms for optimising
cluster geometries. Dalton Trans., 4193−4207 (2003).
© 2013 Macmillan Publishers Limited. All rights reserved.
NATURE CHEMISTRY | www.nature.com/naturechemistry 31
SUPPLEMENTARY INFORMATIONDOI: 10.1038/NCHEM.1721
4 Cleri, F. & Rosato, V. Tight-binding potentials for transition metals and alloys. Phys.
Rev. B, 48, 22−33 (1993). 5 Klementiev, K. V. VIPER, freeware. 6 Klementev, K. V. Extraction of the fine structure from x-ray adsorption spectra. J.
Phys. D: Appl. Phys. 34, 209-17 (2001). 7 Harbich, W., Fedrigo, S. & Buttet, J. Deposition of mass selected gold clusters in solid
krypton. J. Chem. Phys. 96 (11), 8104-8108 (1992). 8 Fedrigo, S., Harbich, W. & Buttet, J. Optical response of Ag2, Ag3, Au2 and Au3 in
argon matrices. J. Chem. Phys. 99(8), 5712-5717 (1993). 9 Tran, M. L., Zvyagin, A. V. & Plakhotnik, T. Synthesis and spectroscopic observation
of dendrimer-encapsulated gold nanoclusters. Chem. Commun. 2400-2401 (2006). 10 Shichibu, Y., Kamei, Y. & Konishi, K. Unique [core+two] structure and optical
property of a dodeca-ligated undecagold cluster: critical contribution of the exo gold
atoms to the electronic structure. Chem. Commun. 48, 7559-7561 (2012). 11 Calvo-Fuentes, J., Rivas-Rey, J. & López-Quintela, M. A. Synthesis of
subnanometric metal nanoparticles, Encyclopedia of Nanotechnology, Bhushan, Bharat
(Ed.), Springer Verlag, (2011). 12 Santiago-González, B., Rodríguez, M.J., Blanco, M.C., Rivas, J., López-Quintela,
M.A. & Gaspar-Martinho, J.M. One Step Synthesis of the Smallest Photoluminescent
and Paramagnetic PVP-Protected Gold Atomic Clusters. Nano Letters 10, 4217-4221
(2010). 13 Calvo- Fuentes, J. et al., Encyclopedia of Nanotechnology, Bhushan, Bharat (Ed.),
Springer Verlag, 2639-2648, (2012). 14 Vilar-Vidal N., Rivas J. & López-Quintela, M.A. Size dependent catalytic activity of
Reusable subnanometer Copper (0) clusters. ACS Catal. 2, 1693-1697 (2012). 15 Santiago-González B., et al. Nanoscale 2012, in press 16 Selva, J., Martínez, S. E., Buceta, D., Rodríguez-Vázquez, M. J., Blanco, M. C.,
López-Quintela, M. A. & Egea, G. J. Am. Chem. Soc., 132, 6947-6954 (2010). 17 Vilar-Vidal, N., Blanco, M. C., López-Quintela, M. A., Rivas, J., Serra, C.
Electrochemical synthesis of very stable photoluminiscent copper clusters, J. Phys.
Chem. C, 114 (38), 15924-15930 (2010). 18 Lei, Y., Mehmood, F., Lee S., Greeley, J., Lee, B., Seifert, S., Winans, R. E., Elam, J.
W., Meyer, R. J., Redfern, P. C., Teschner, D., Schlögl, R., Pellin, M. J., Curtiss, L. A.
© 2013 Macmillan Publishers Limited. All rights reserved.

NATURE CHEMISTRY | www.nature.com/naturechemistry 32
SUPPLEMENTARY INFORMATIONDOI: 10.1038/NCHEM.1721
& Vajda, S. Increased Silver Activity for the direct propylene epoxidation via
subnanometer size effects, Science 9, 224-228 (2010). 19 Xu, H. & Suslick K. S. Sonochemical Synthesis of Highly Fluorescent Ag
Nanoclusters. ACS Nano, 4 (6), 3209-3214 (2010).
© 2013 Macmillan Publishers Limited. All rights reserved.