Exam 3 review
191
Microeconomics Exam 3 Review
-
Upload
gale-pooley -
Category
Business
-
view
3.175 -
download
4
Transcript of Exam 3 review

Microeconomics
Exam 3 Review
Rules

Rulespencil
calculatorright classon time

Chapters
Chapters
7, 8, 9
0
10
20
30
40
50
60
70
80
90
100
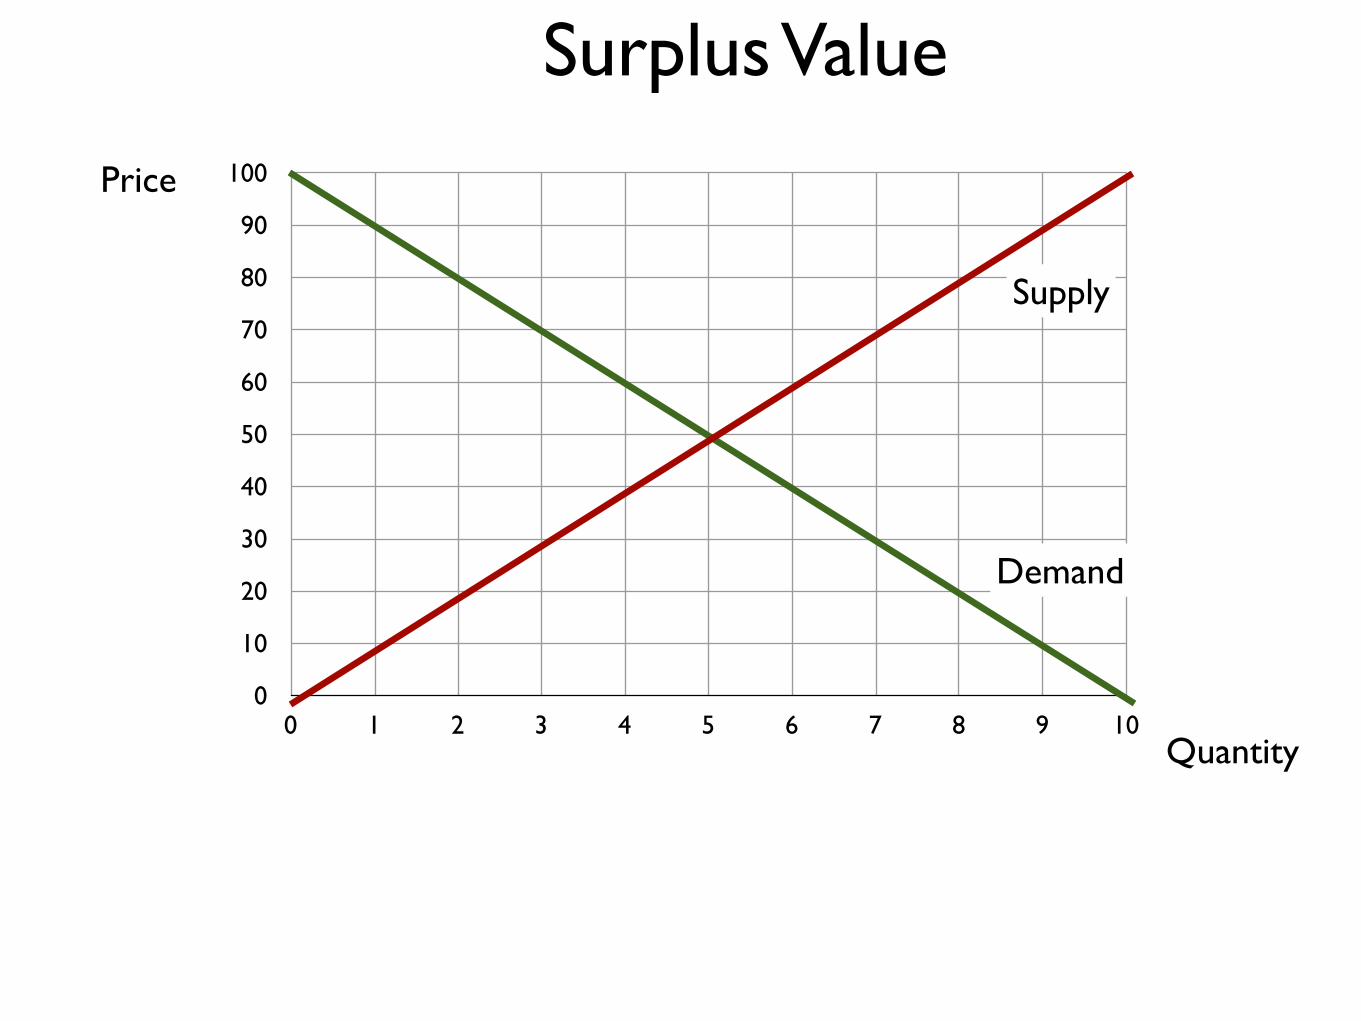
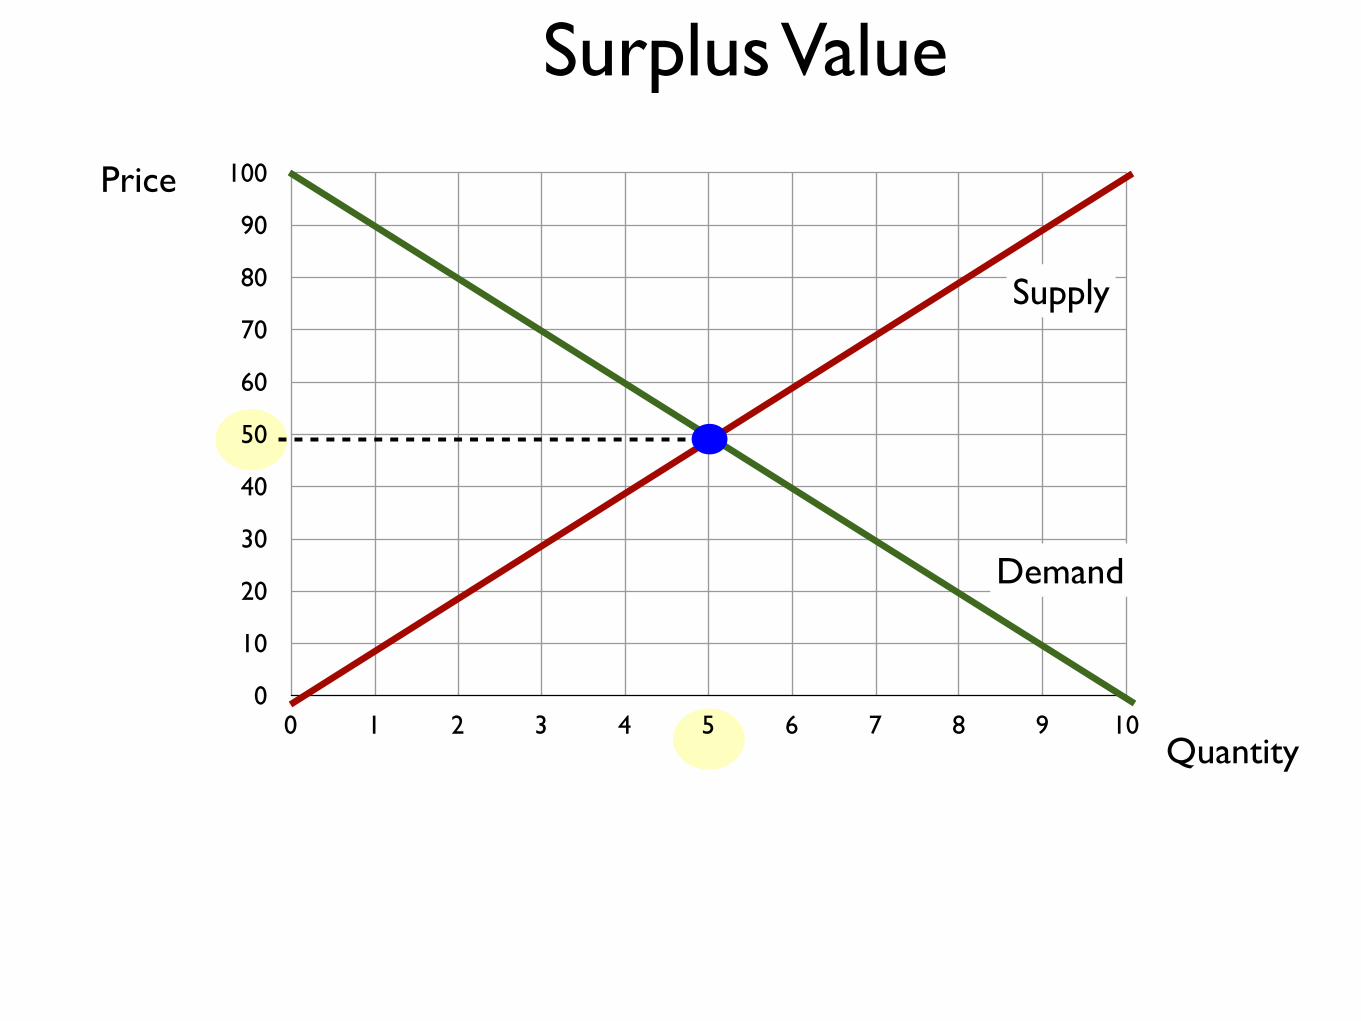
0 1 2 3 4 5 6 7 8 9 10
Price
Quantity
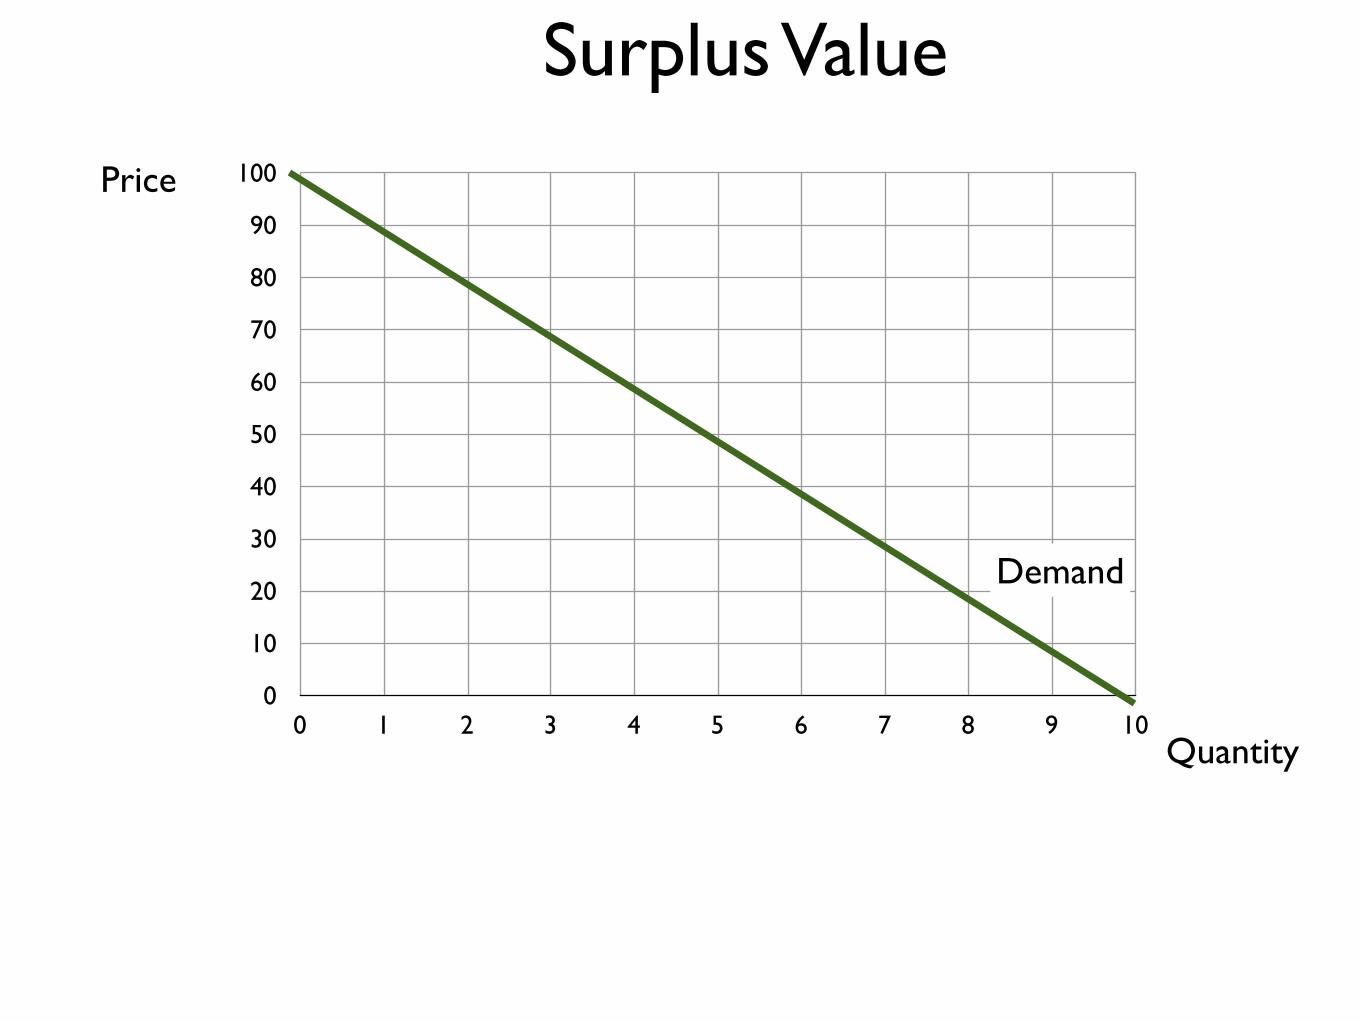
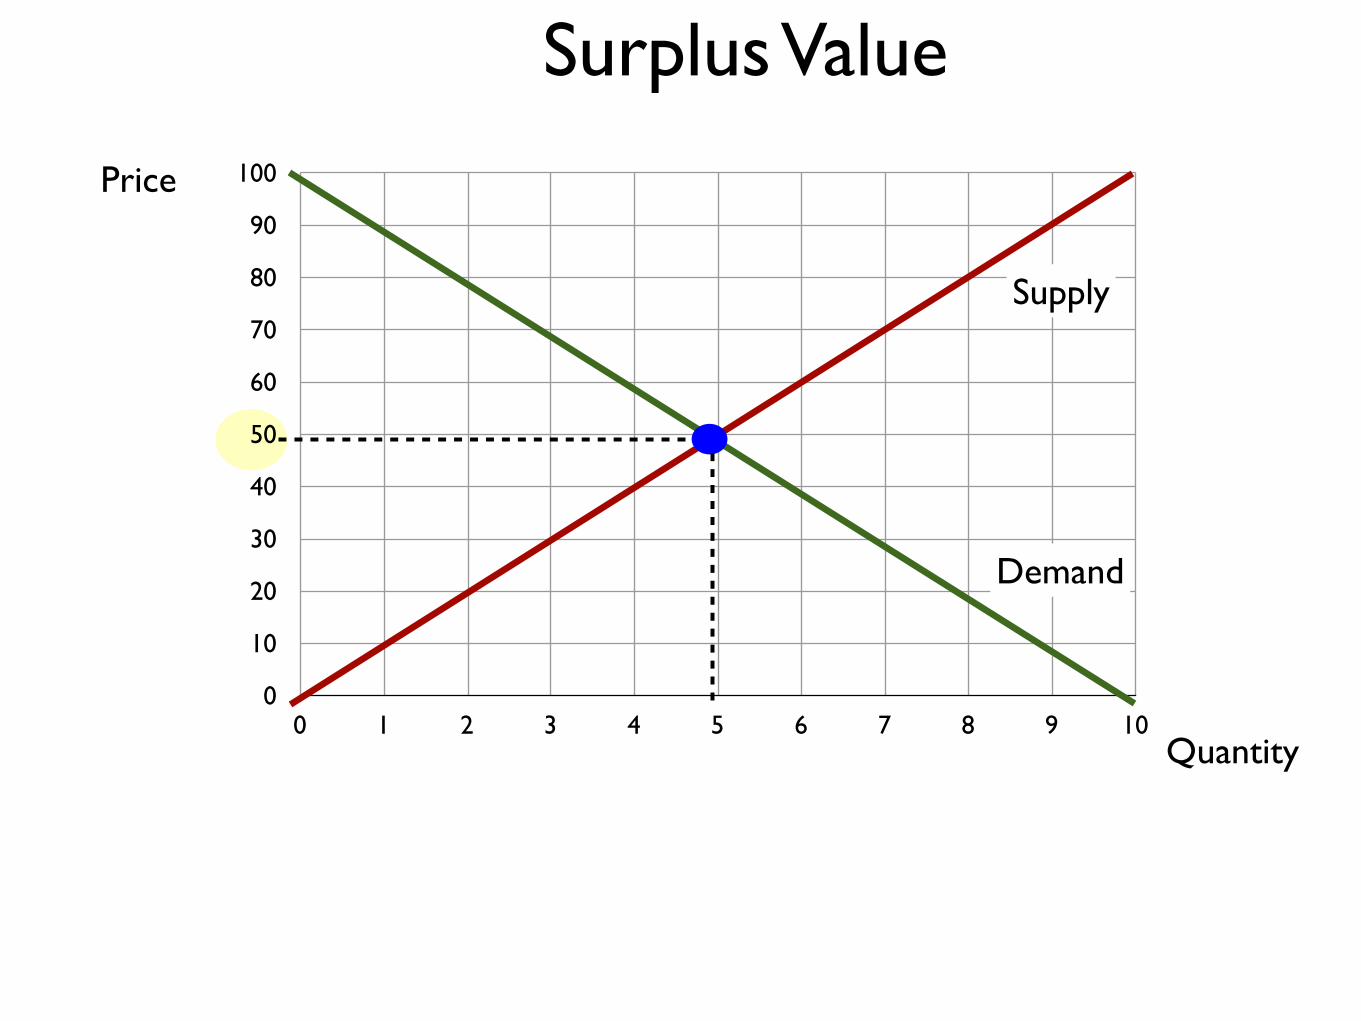
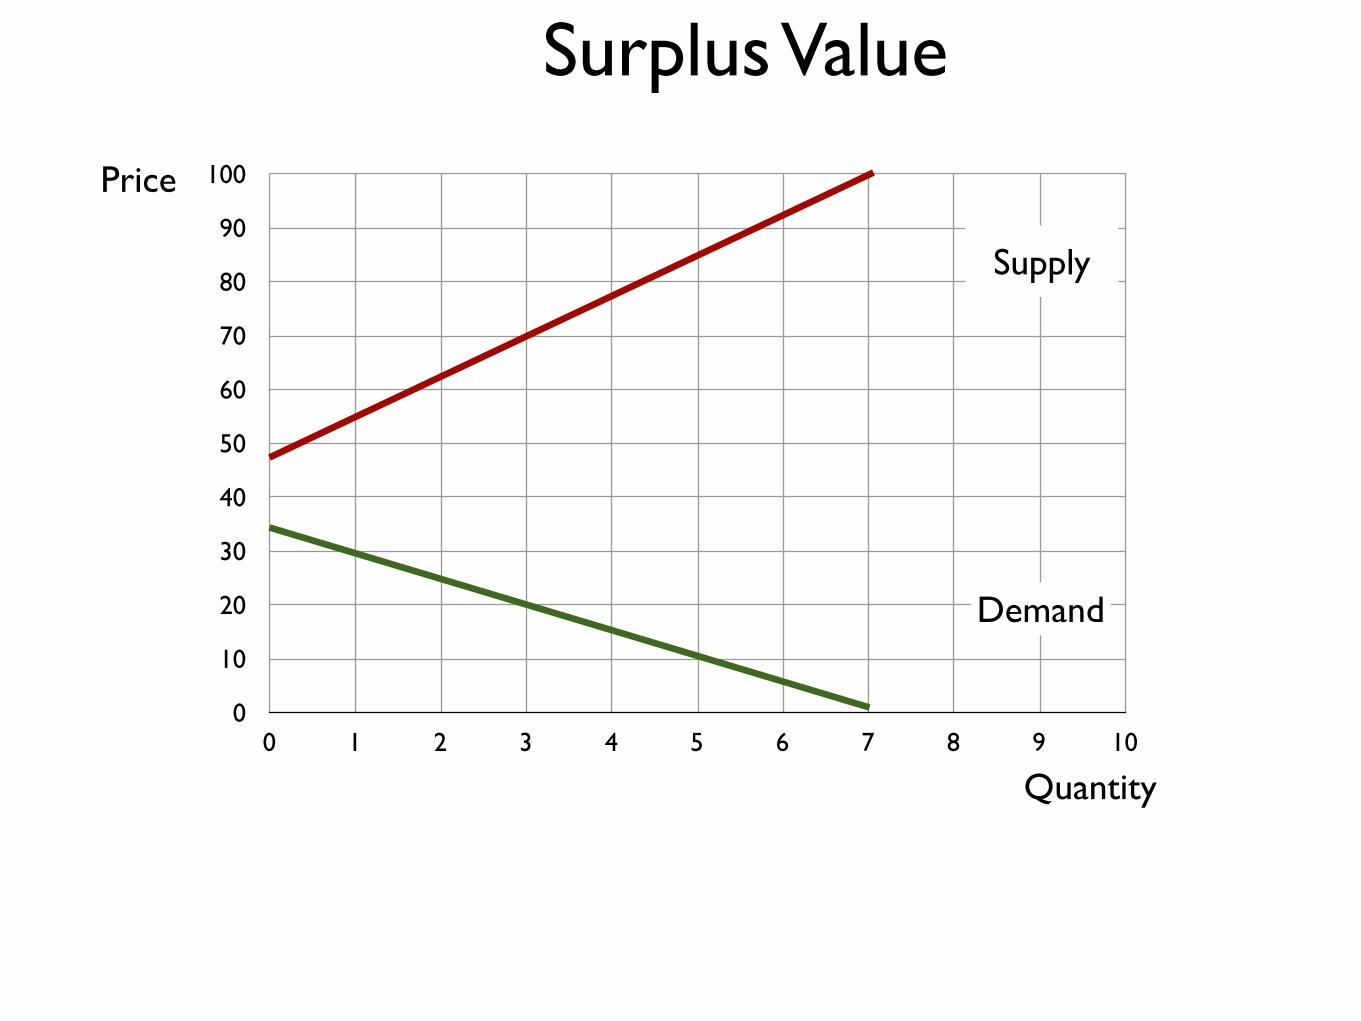
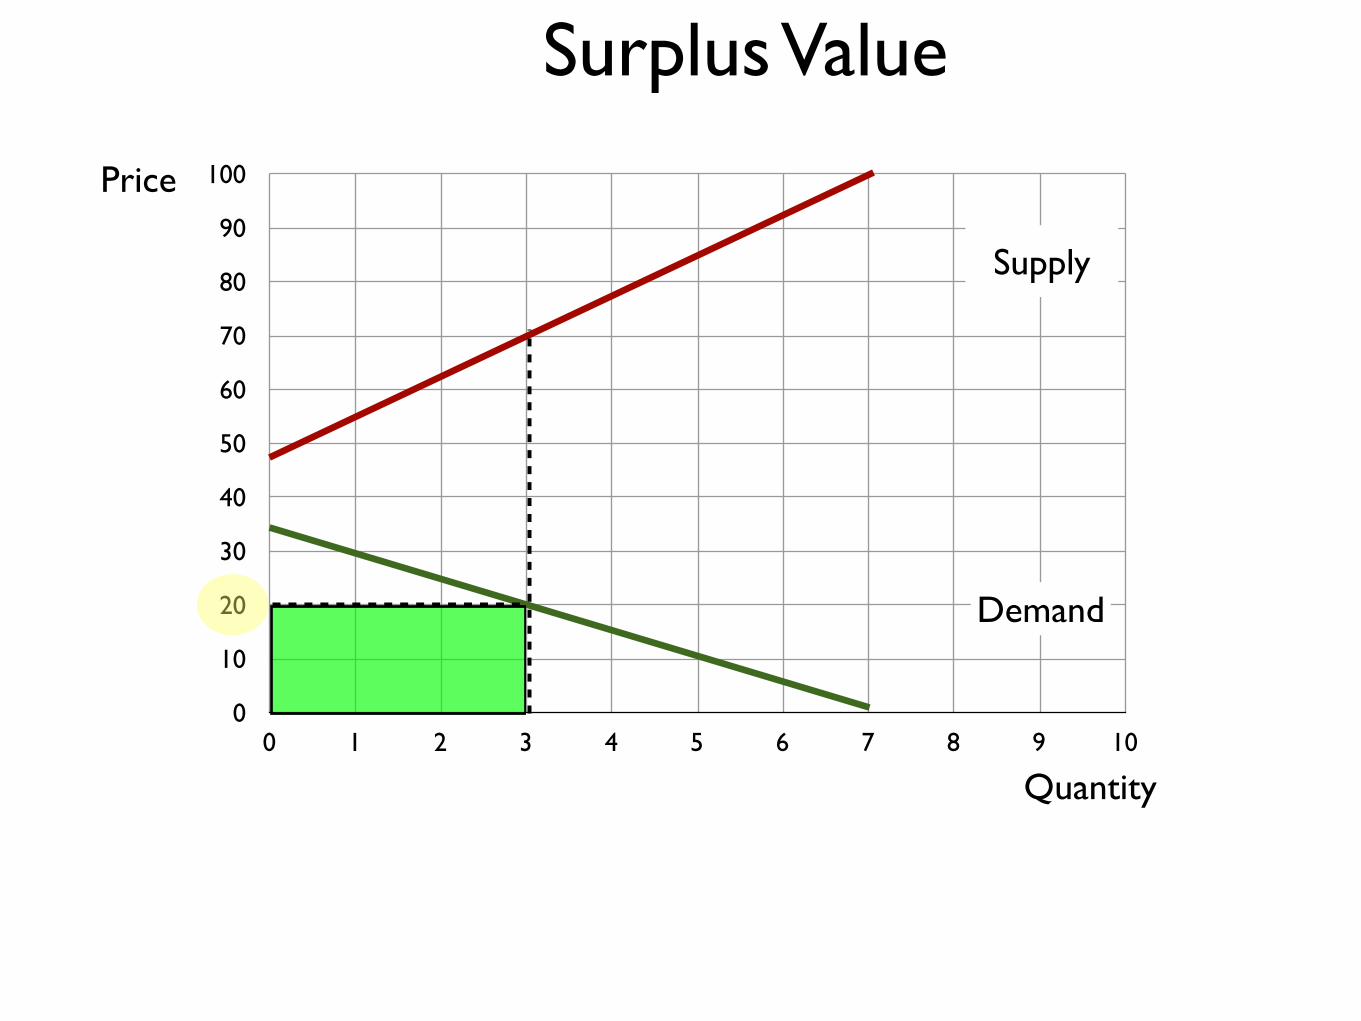
Surplus Value
0
10
20
30
40
50
60
70
80
90
100
0 1 2 3 4 5 6 7 8 9 10
Price
Quantity
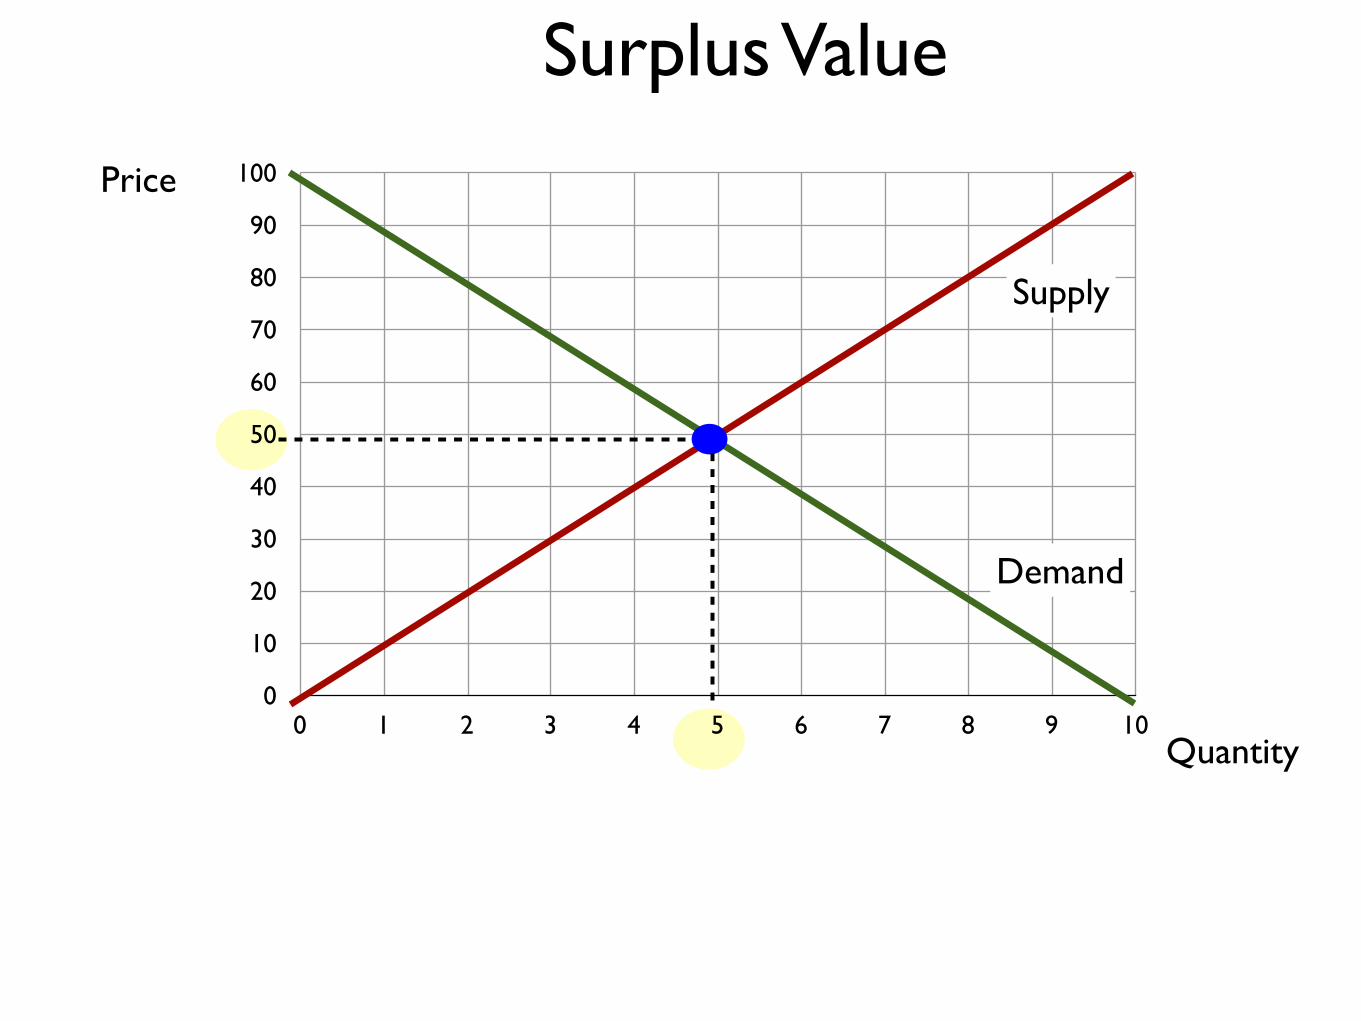
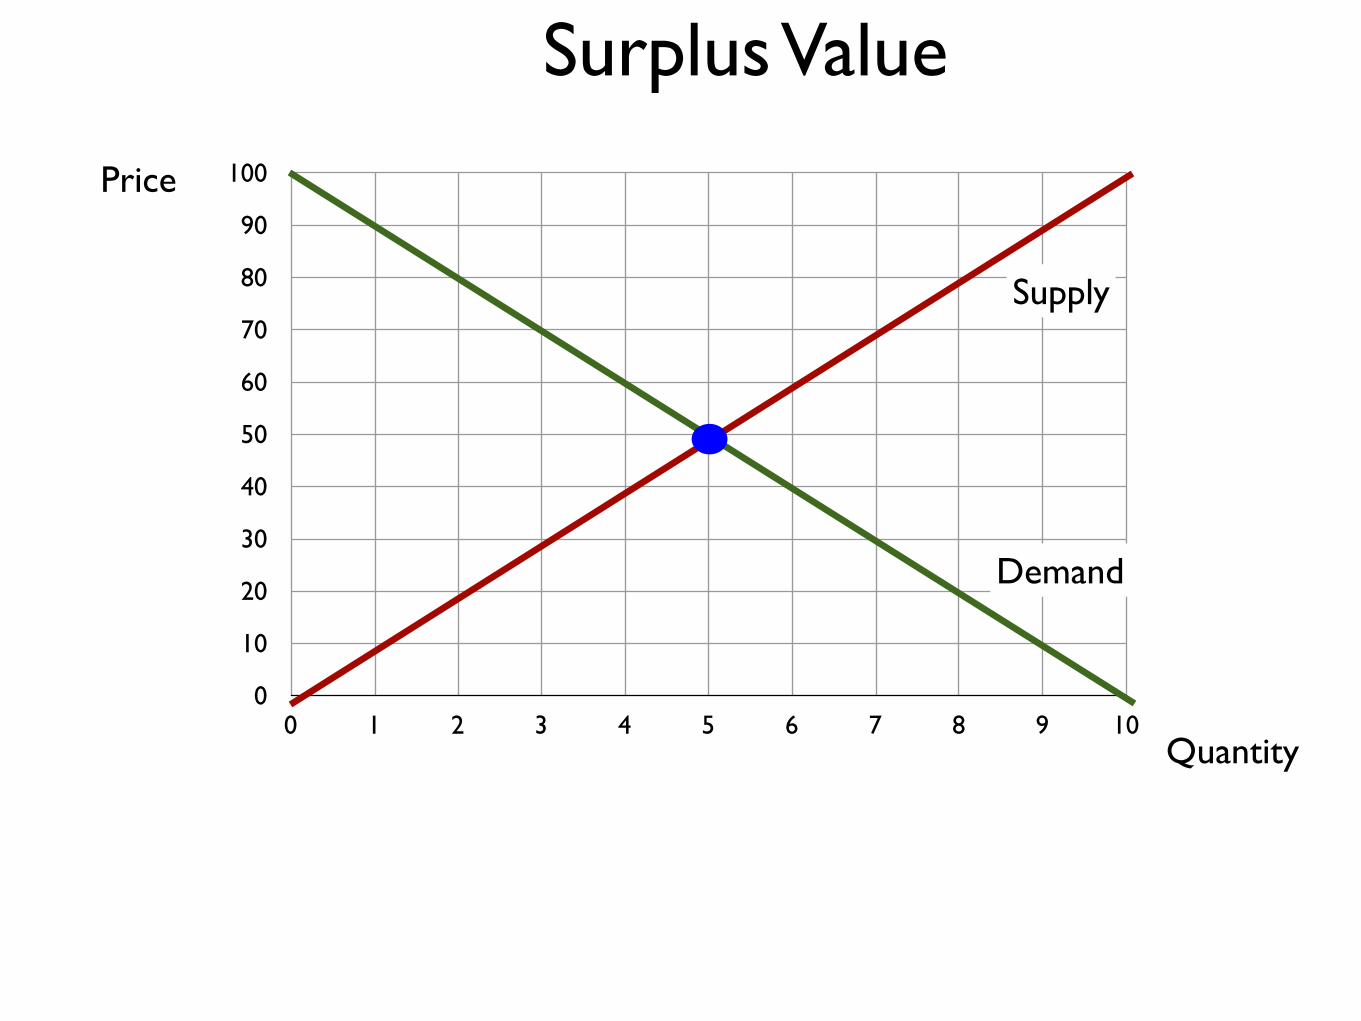
Surplus Value
Demand
0
10
20
30
40
50
60
70
80
90
100
0 1 2 3 4 5 6 7 8 9 10
Price
Quantity
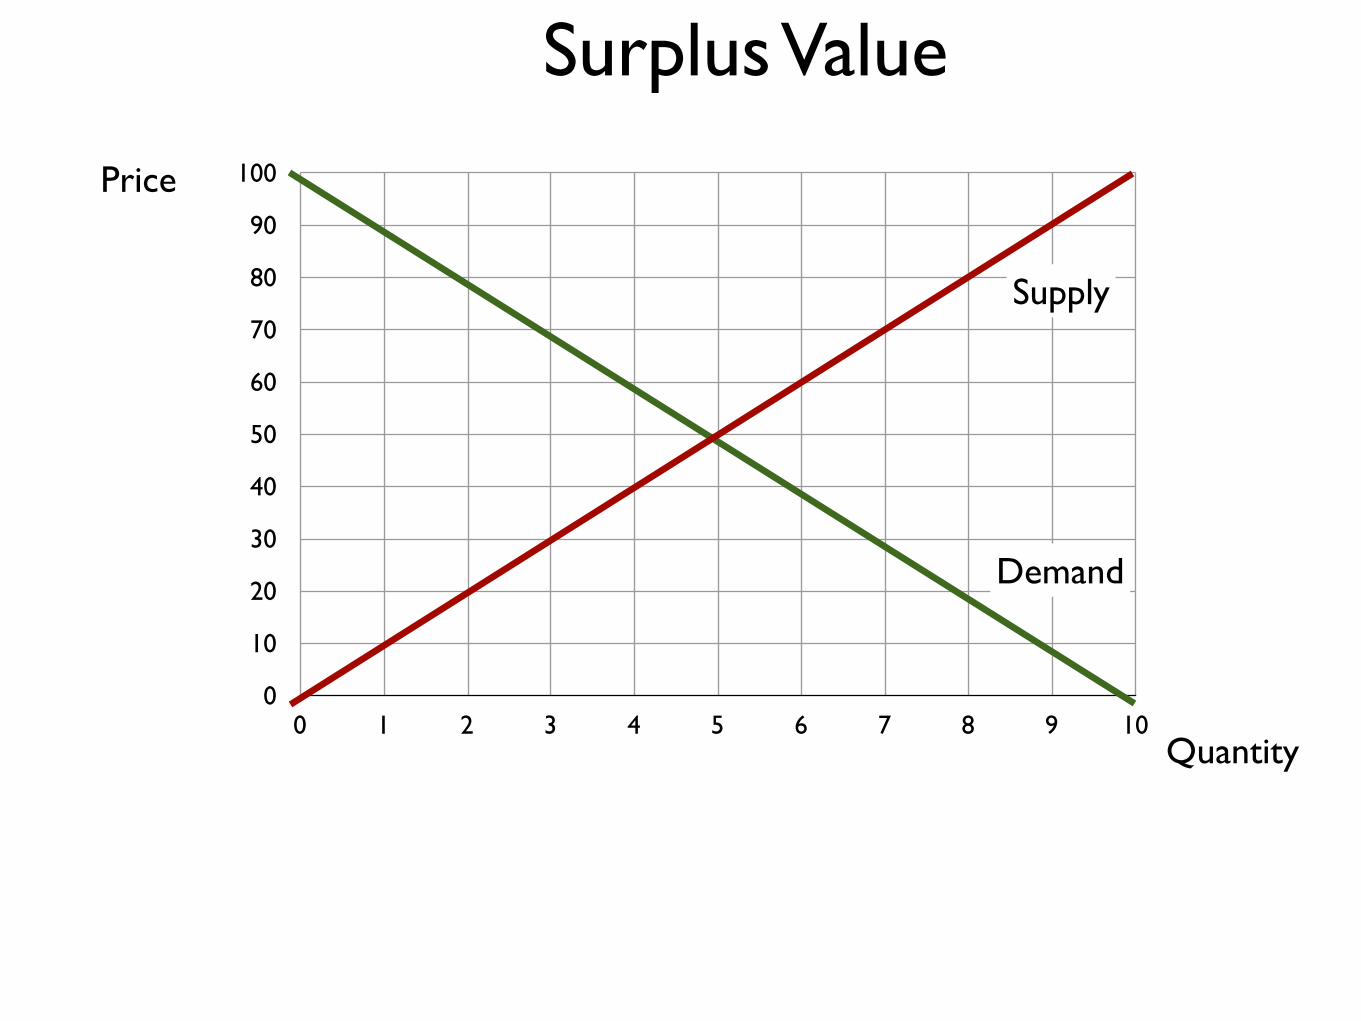
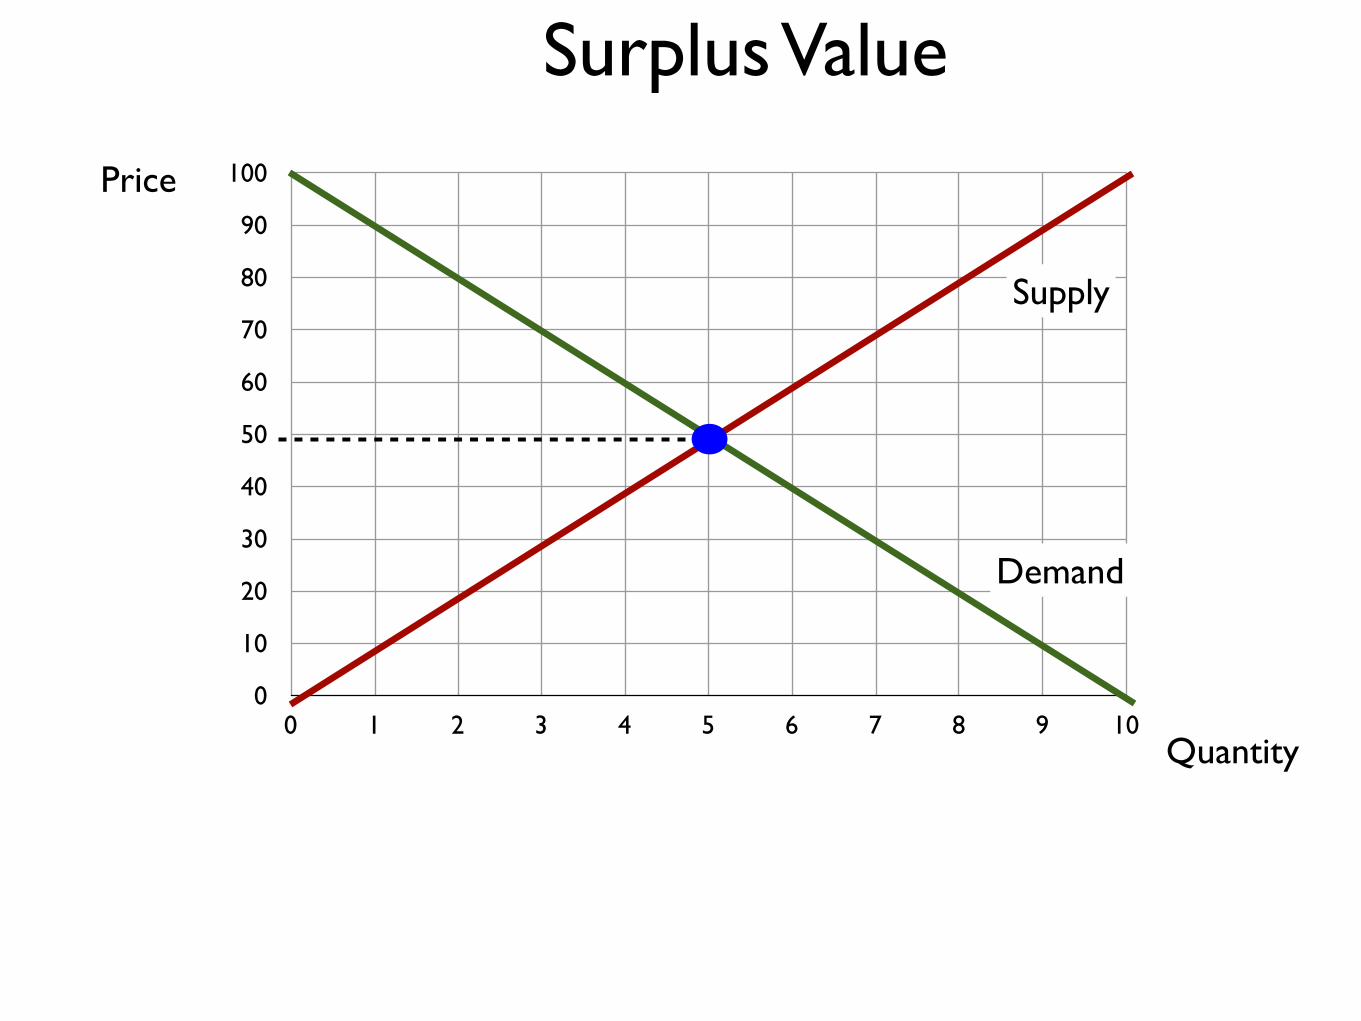
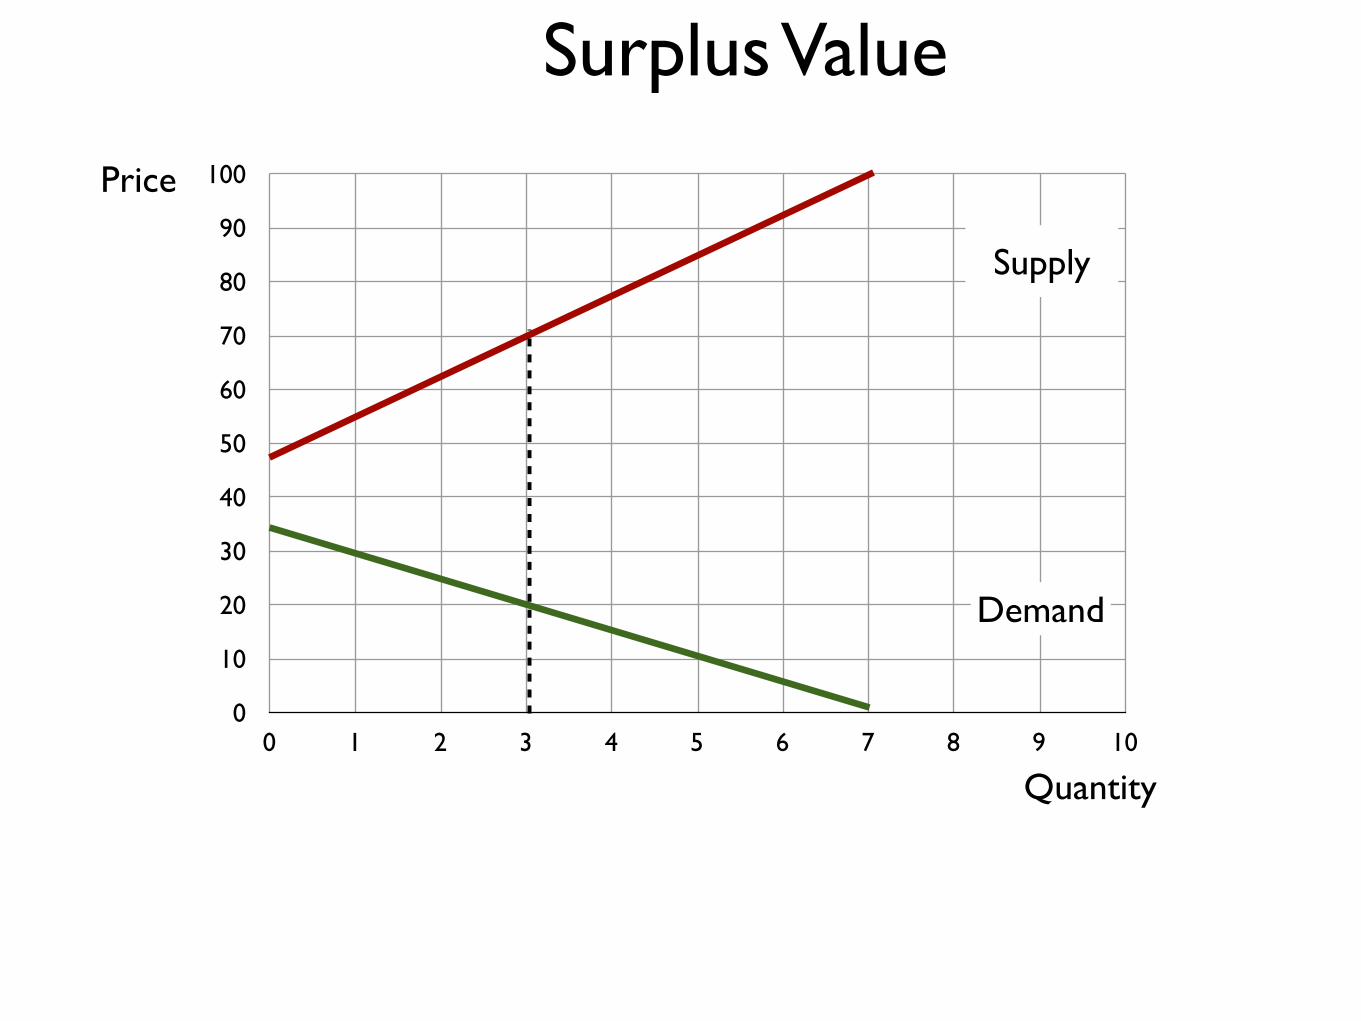
Surplus Value
Demand
Supply
0
10
20
30
40
50
60
70
80
90
100
0 1 2 3 4 5 6 7 8 9 10
Price
Quantity
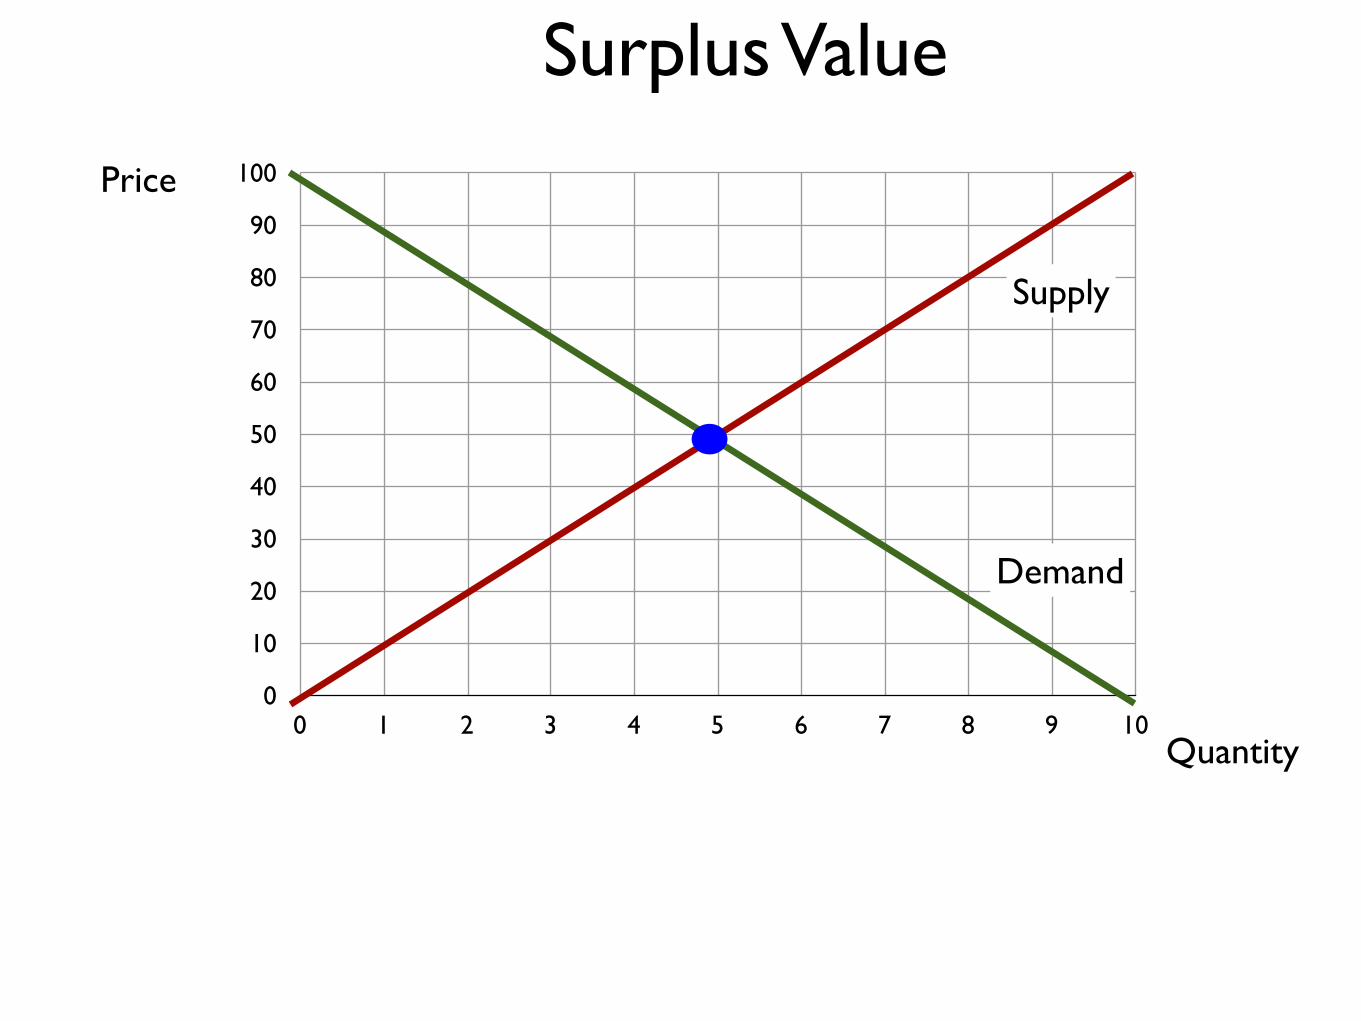
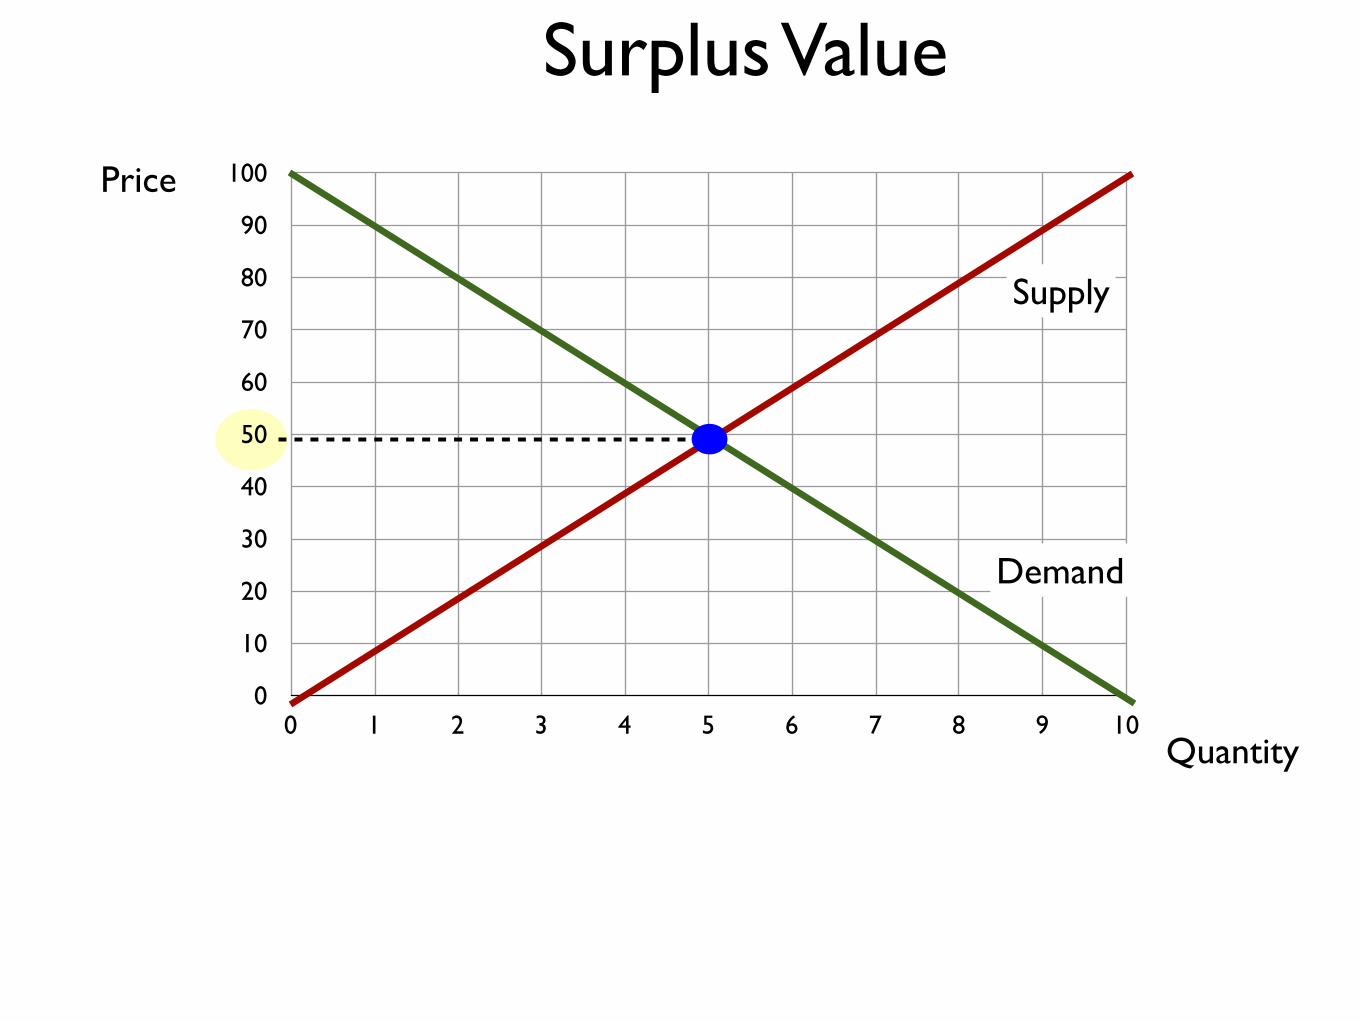
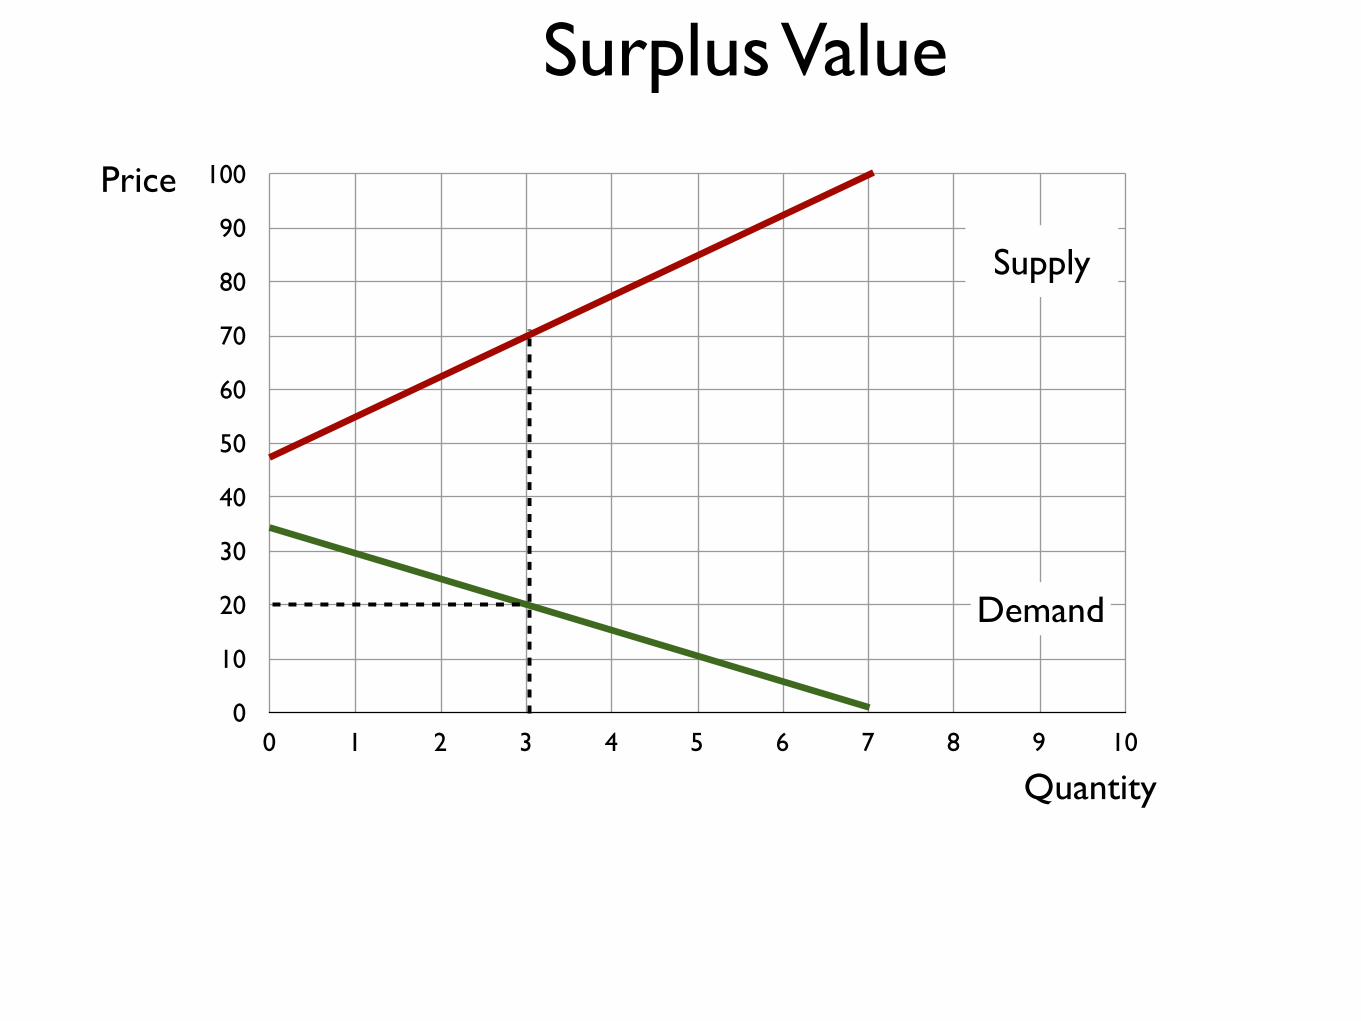
Surplus Value
Demand
Supply

0
10
20
30
40
50
60
70
80
90
100
0 1 2 3 4 5 6 7 8 9 10
Price
Quantity
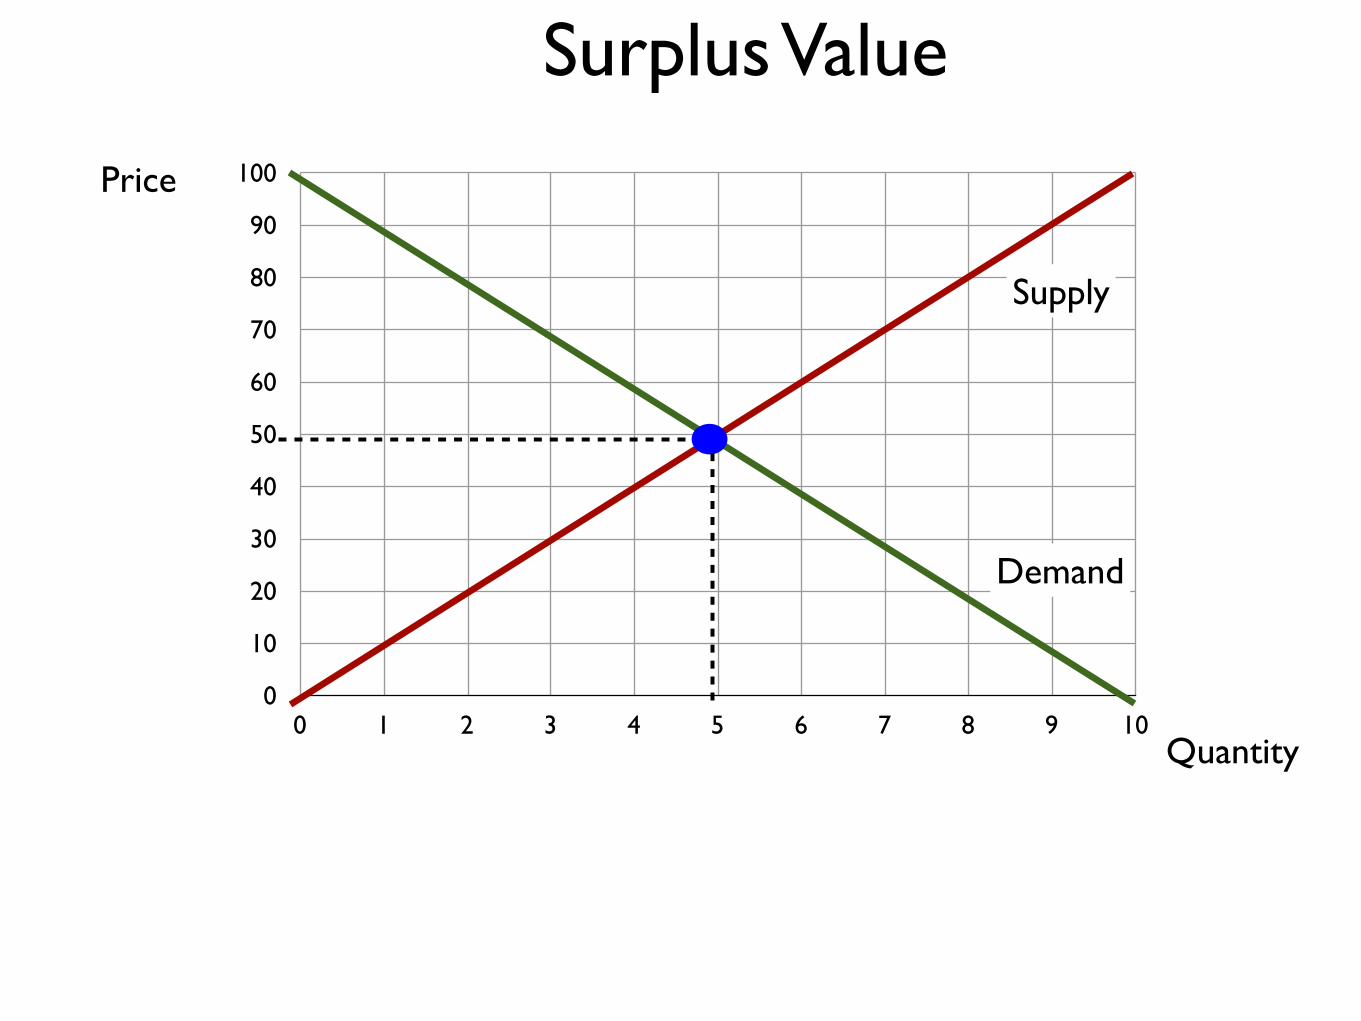
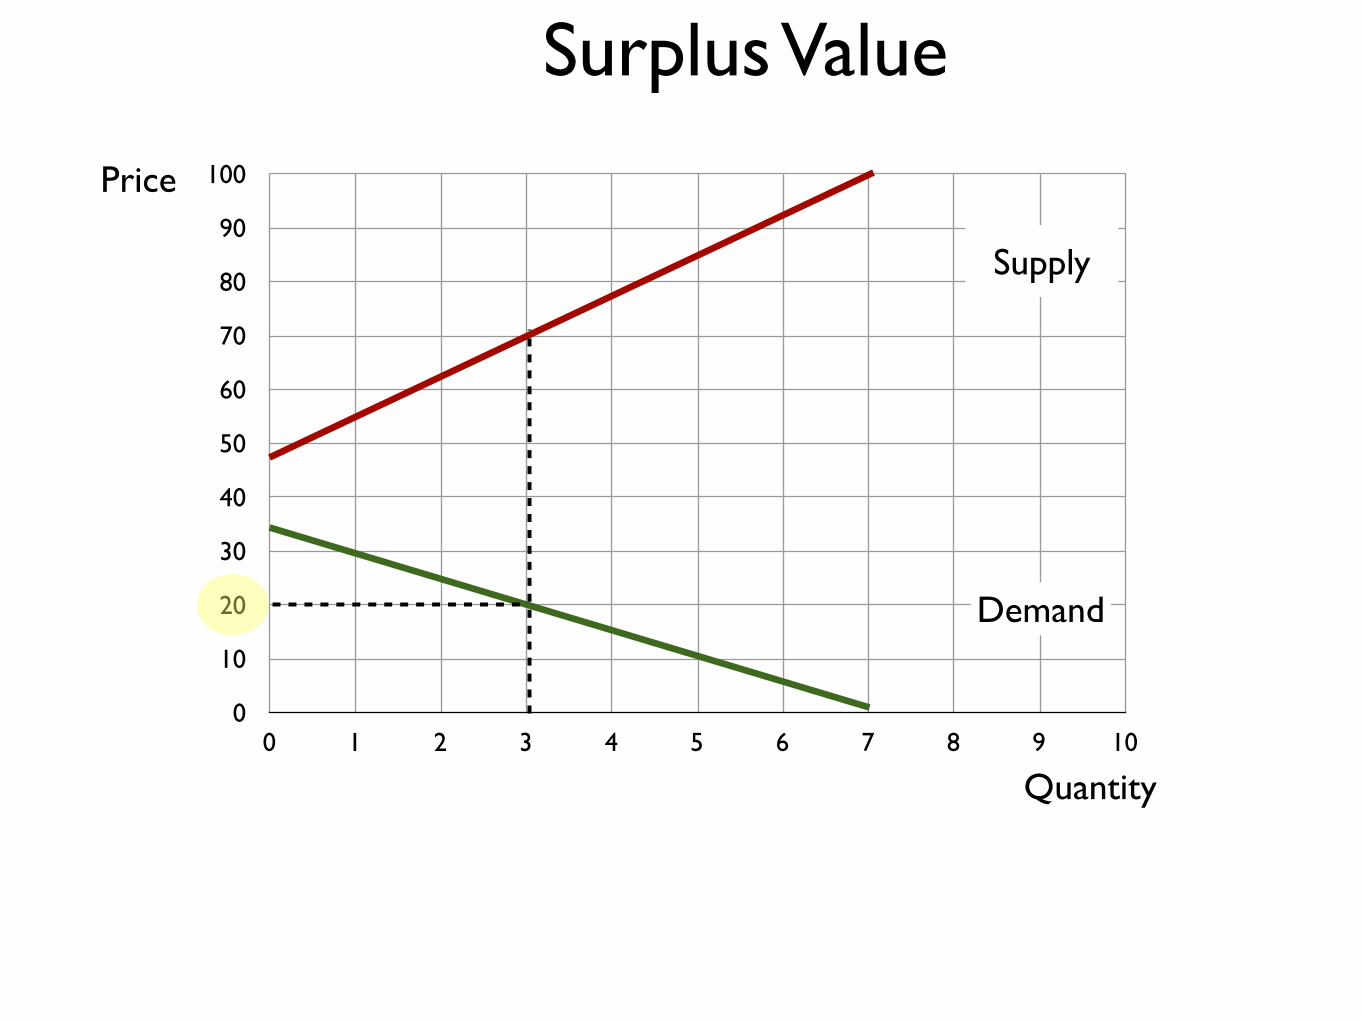
Surplus Value
Demand
Supply
0
10
20
30
40
50
60
70
80
90
100
0 1 2 3 4 5 6 7 8 9 10
Price
Quantity
Surplus Value
Demand
Supply
0
10
20
30
40
50
60
70
80
90
100
0 1 2 3 4 5 6 7 8 9 10
Price
Quantity
Surplus Value
Demand
Supply
0
10
20
30
40
50
60
70
80
90
100
0 1 2 3 4 5 6 7 8 9 10
Price
Quantity
Surplus Value
Demand
Supply
0
10
20
30
40
50
60
70
80
90
100
0 1 2 3 4 5 6 7 8 9 10
Price
Quantity
Surplus Value
Demand
Supply

0
10
20
30
40
50
60
70
80
90
100
0 1 2 3 4 5 6 7 8 9 10
Price
Quantity
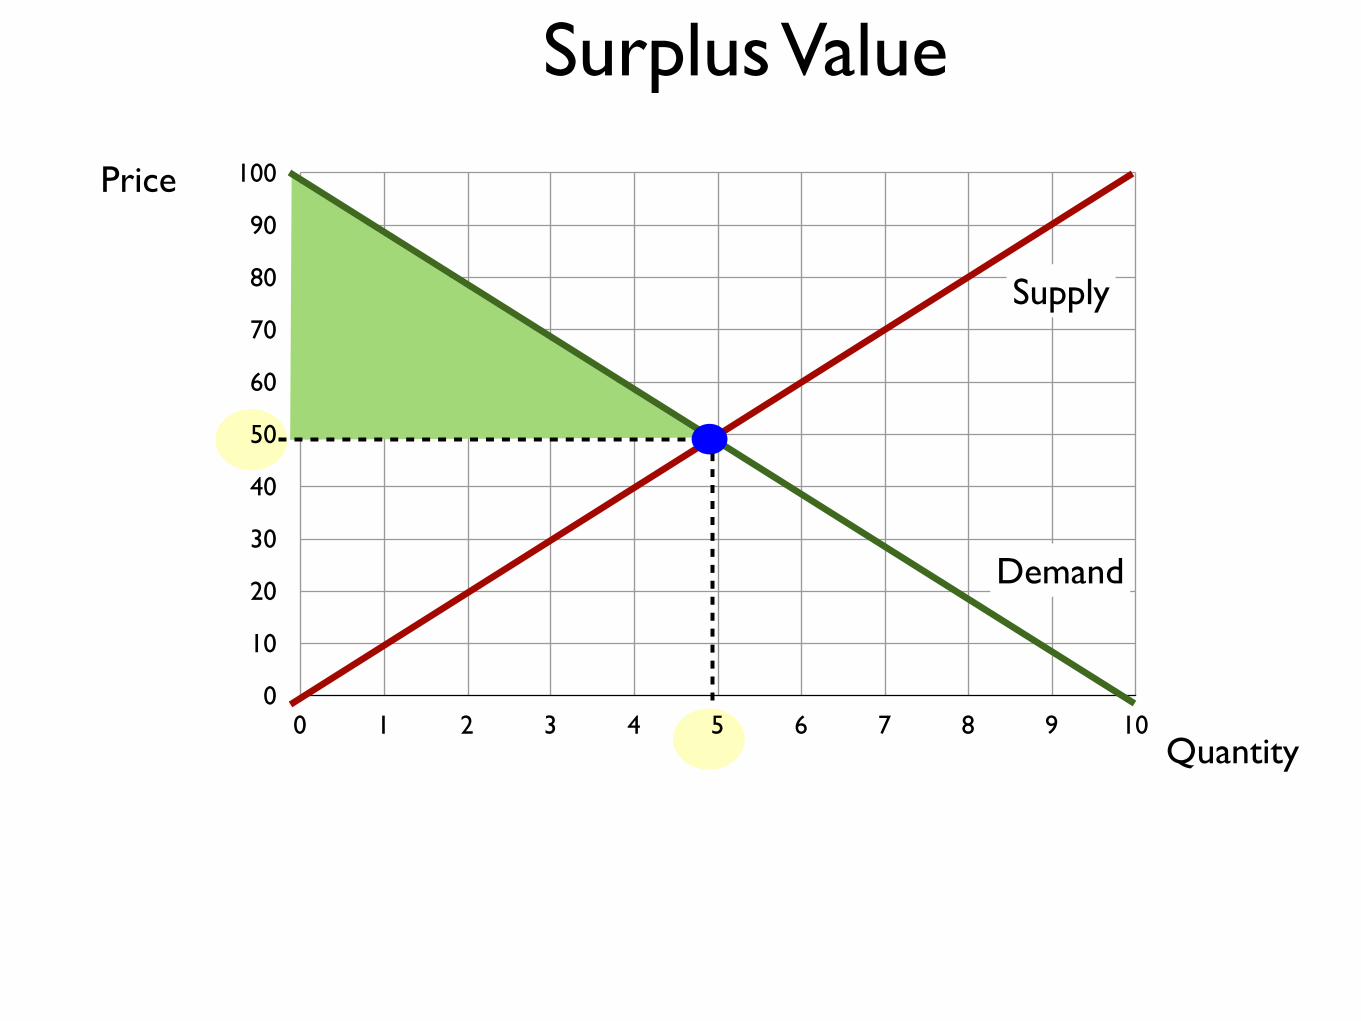
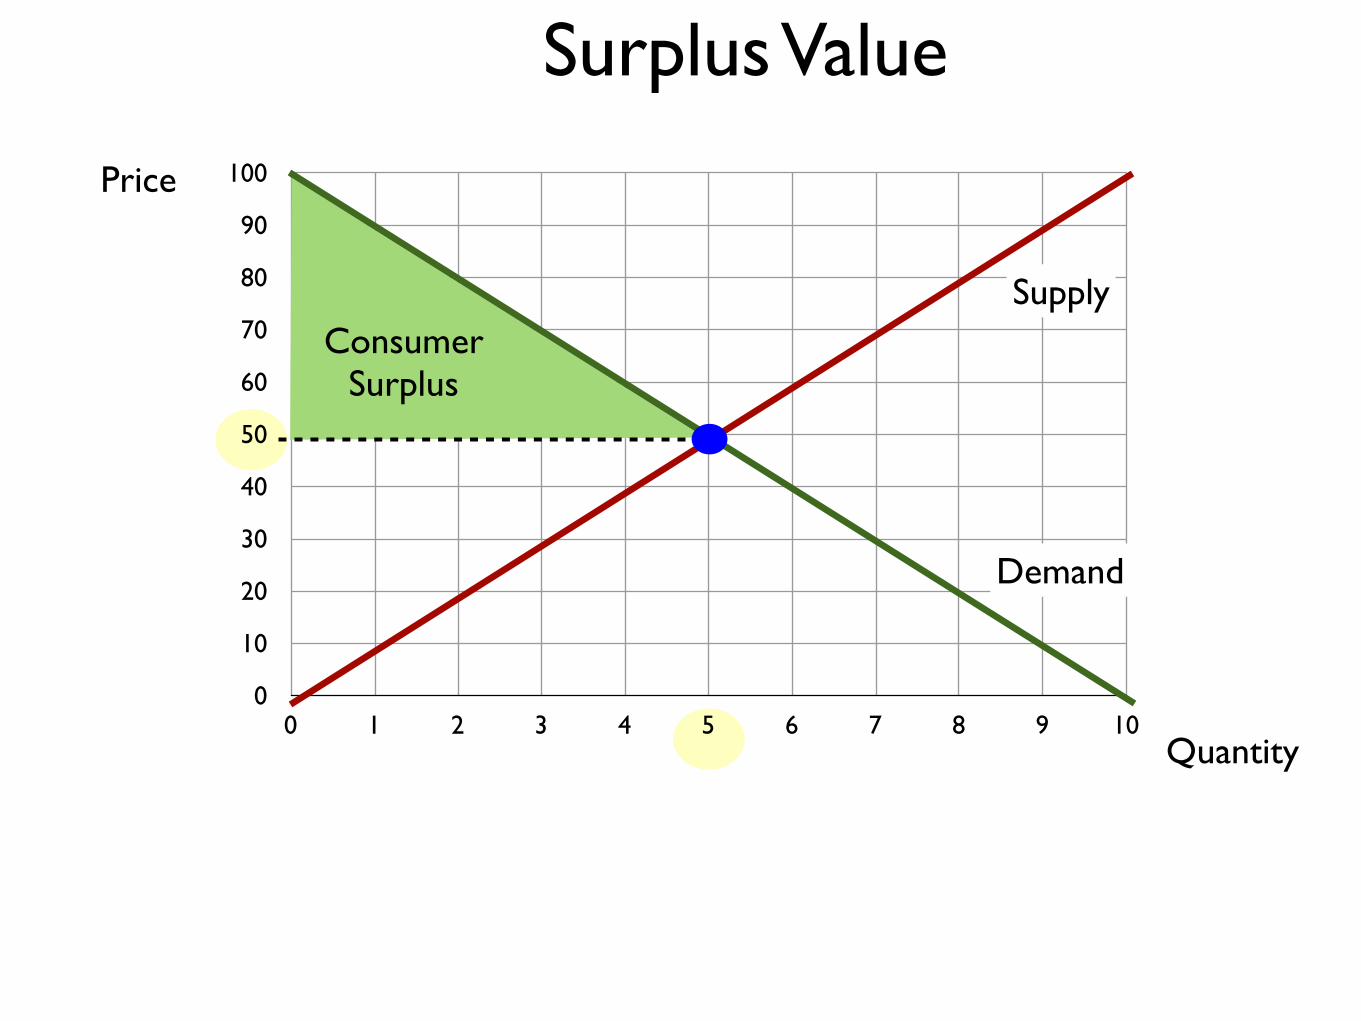
Surplus Value
Demand
SupplyConsumer
Surplus

0
10
20
30
40
50
60
70
80
90
100
0 1 2 3 4 5 6 7 8 9 10
Price
Quantity
Surplus Value
Demand
SupplyConsumer
Surplus

0
10
20
30
40
50
60
70
80
90
100
0 1 2 3 4 5 6 7 8 9 10
Price
Quantity
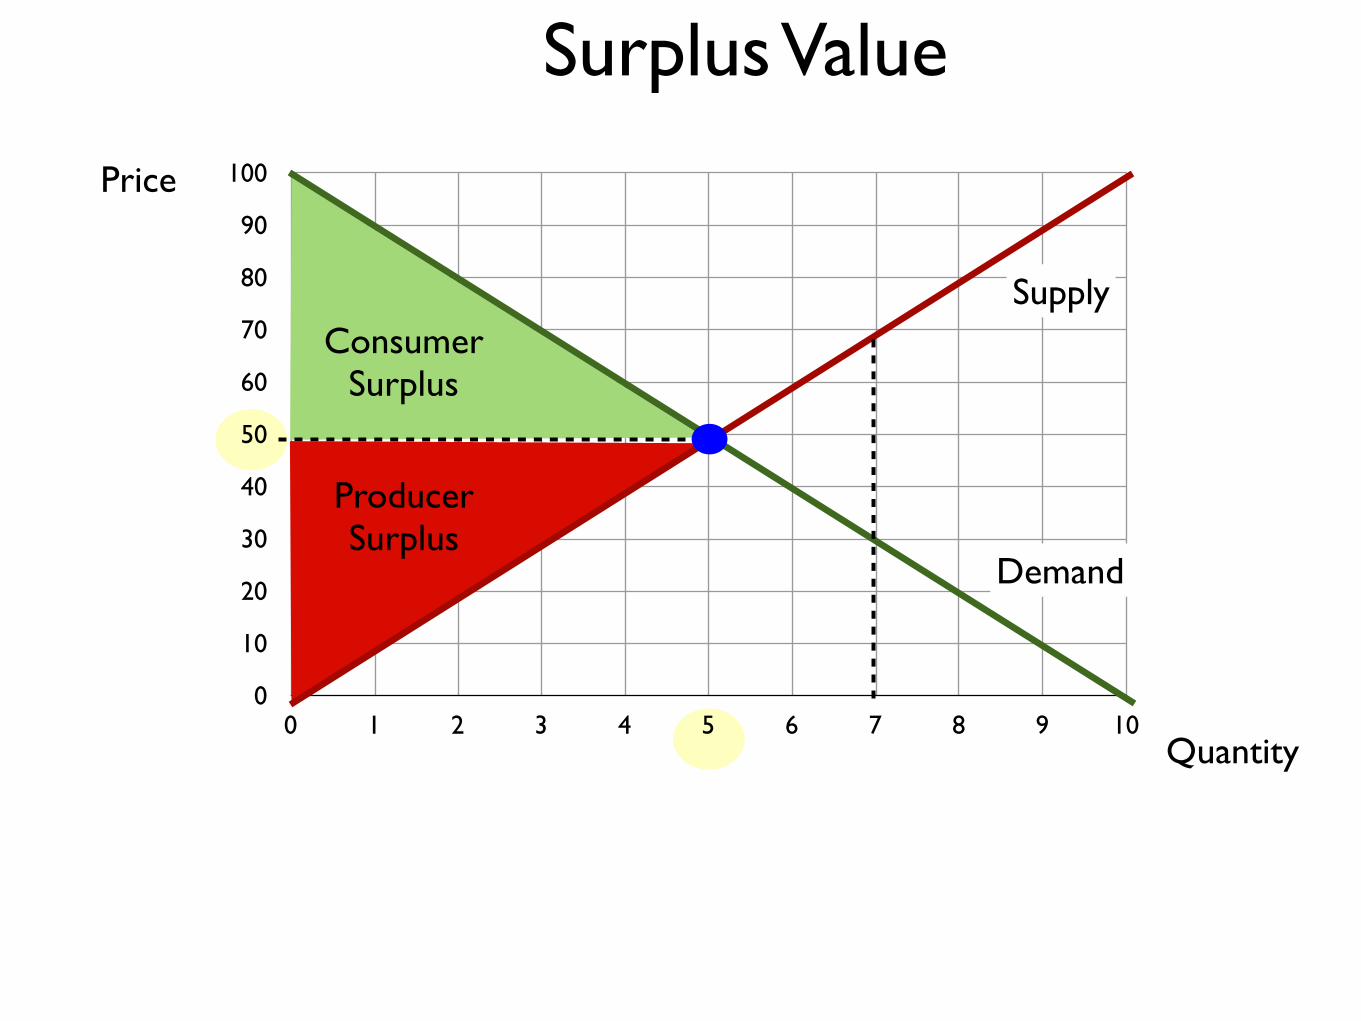
Surplus Value
Demand
SupplyConsumer
Surplus
ProducerSurplus

0
10
20
30
40
50
60
70
80
90
100
0 1 2 3 4 5 6 7 8 9 10
Price
Quantity
Surplus Value
0
10
20
30
40
50
60
70
80
90
100
0 1 2 3 4 5 6 7 8 9 10
Price
Quantity
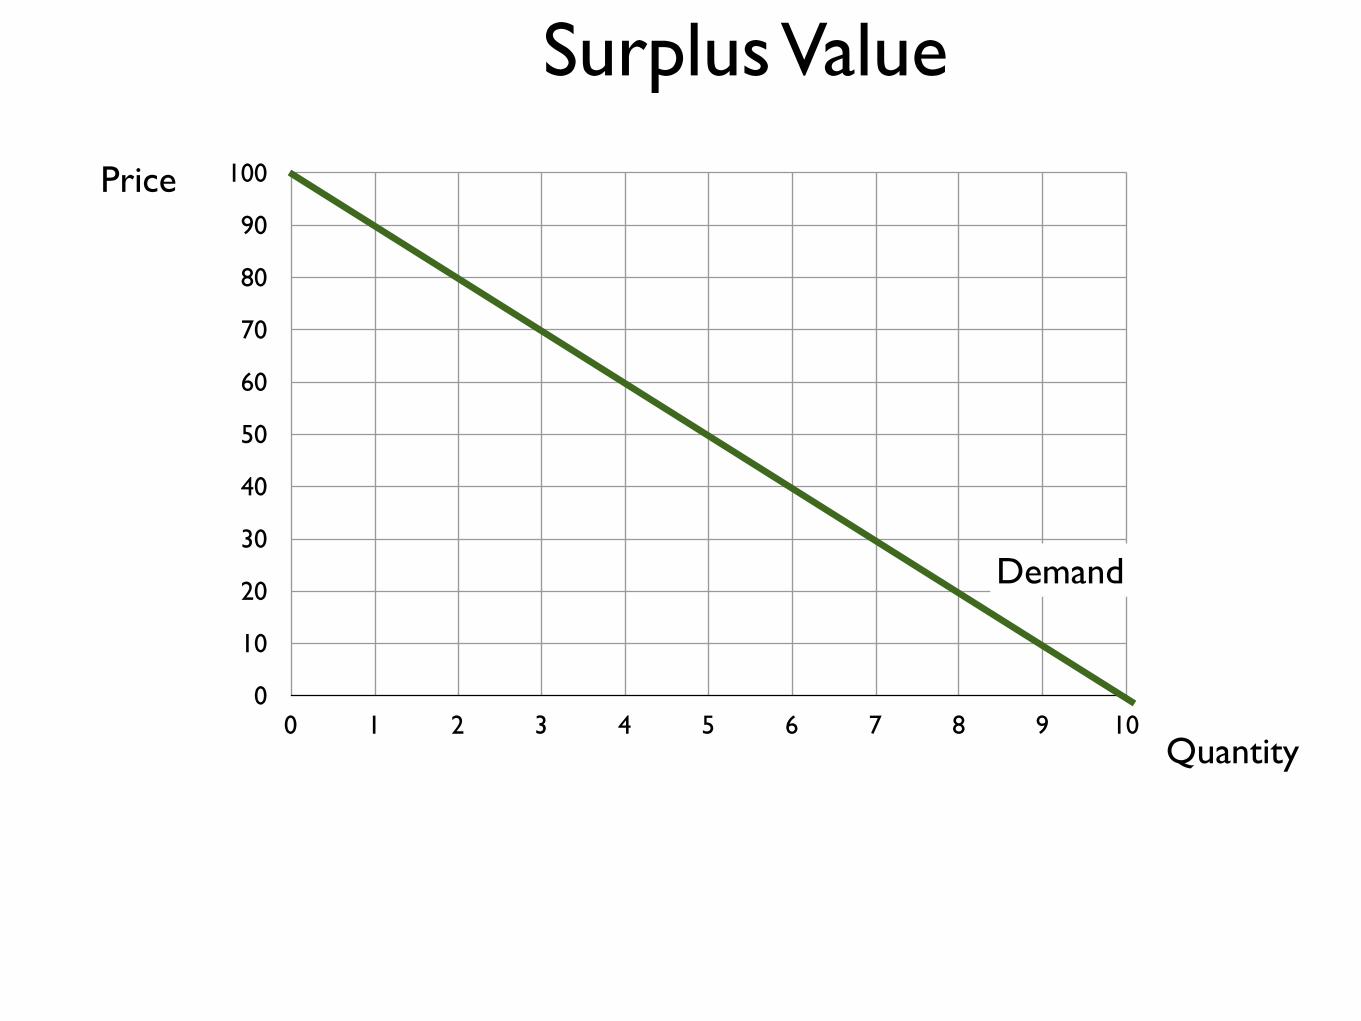
Surplus Value
Demand
0
10
20
30
40
50
60
70
80
90
100
0 1 2 3 4 5 6 7 8 9 10
Price
Quantity
Surplus Value
Demand
Supply
0
10
20
30
40
50
60
70
80
90
100
0 1 2 3 4 5 6 7 8 9 10
Price
Quantity
Surplus Value
Demand
Supply
0
10
20
30
40
50
60
70
80
90
100
0 1 2 3 4 5 6 7 8 9 10
Price
Quantity
Surplus Value
Demand
Supply
0
10
20
30
40
50
60
70
80
90
100
0 1 2 3 4 5 6 7 8 9 10
Price
Quantity
Surplus Value
Demand
Supply
0
10
20
30
40
50
60
70
80
90
100
0 1 2 3 4 5 6 7 8 9 10
Price
Quantity
Surplus Value
Demand
Supply

0
10
20
30
40
50
60
70
80
90
100
0 1 2 3 4 5 6 7 8 9 10
Price
Quantity
Surplus Value
Demand
Supply
0
10
20
30
40
50
60
70
80
90
100
0 1 2 3 4 5 6 7 8 9 10
Price
Quantity
Surplus Value
Demand
SupplyConsumer
Surplus

0
10
20
30
40
50
60
70
80
90
100
0 1 2 3 4 5 6 7 8 9 10
Price
Quantity
Surplus Value
Demand
SupplyConsumer
Surplus

0
10
20
30
40
50
60
70
80
90
100
0 1 2 3 4 5 6 7 8 9 10
Price
Quantity
Surplus Value
Demand
SupplyConsumer
Surplus
ProducerSurplus
0
10
20
30
40
50
60
70
80
90
100
0 1 2 3 4 5 6 7 8 9 10
Price
Quantity
Surplus Value
Demand
SupplyConsumer
Surplus
ProducerSurplus
0
10
20
30
40
50
60
70
80
90
100
0 1 2 3 4 5 6 7 8 9 10
Price
Quantity
Surplus Value
Demand
SupplyConsumer
Surplus
ProducerSurplus

0
10
20
30
40
50
60
70
80
90
100
0 1 2 3 4 5 6 7 8 9 10
Price
Quantity
Surplus Value
Demand
SupplyConsumer
Surplus
ProducerSurplus

0
10
20
30
40
50
60
70
80
90
100
0 1 2 3 4 5 6 7 8 9 10
Price
Quantity
Surplus Value
Demand
SupplyConsumer
Surplus
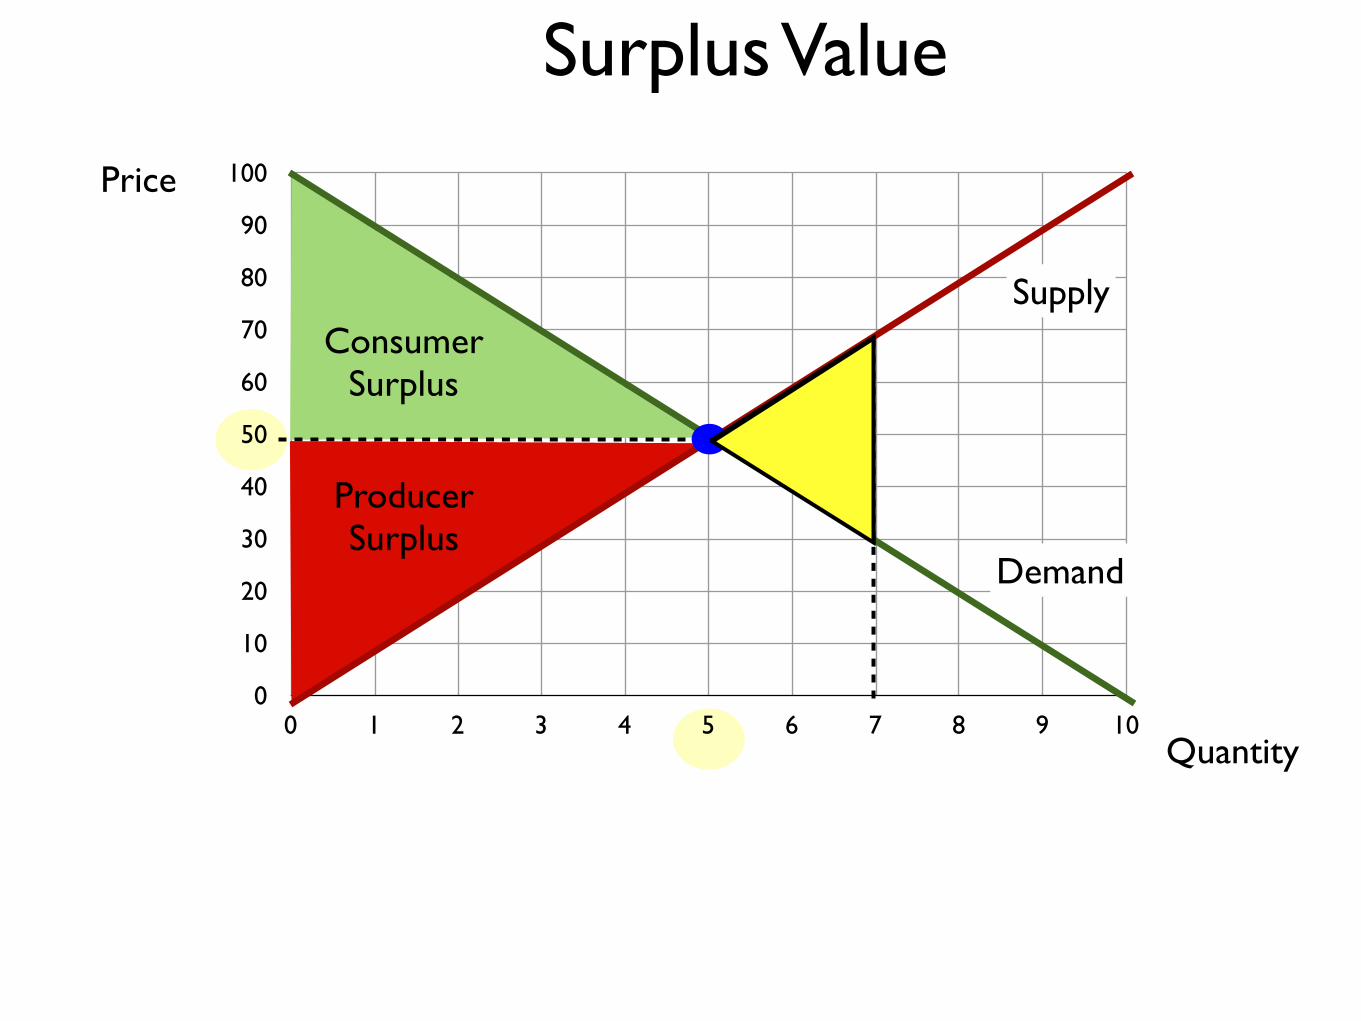
ProducerSurplus
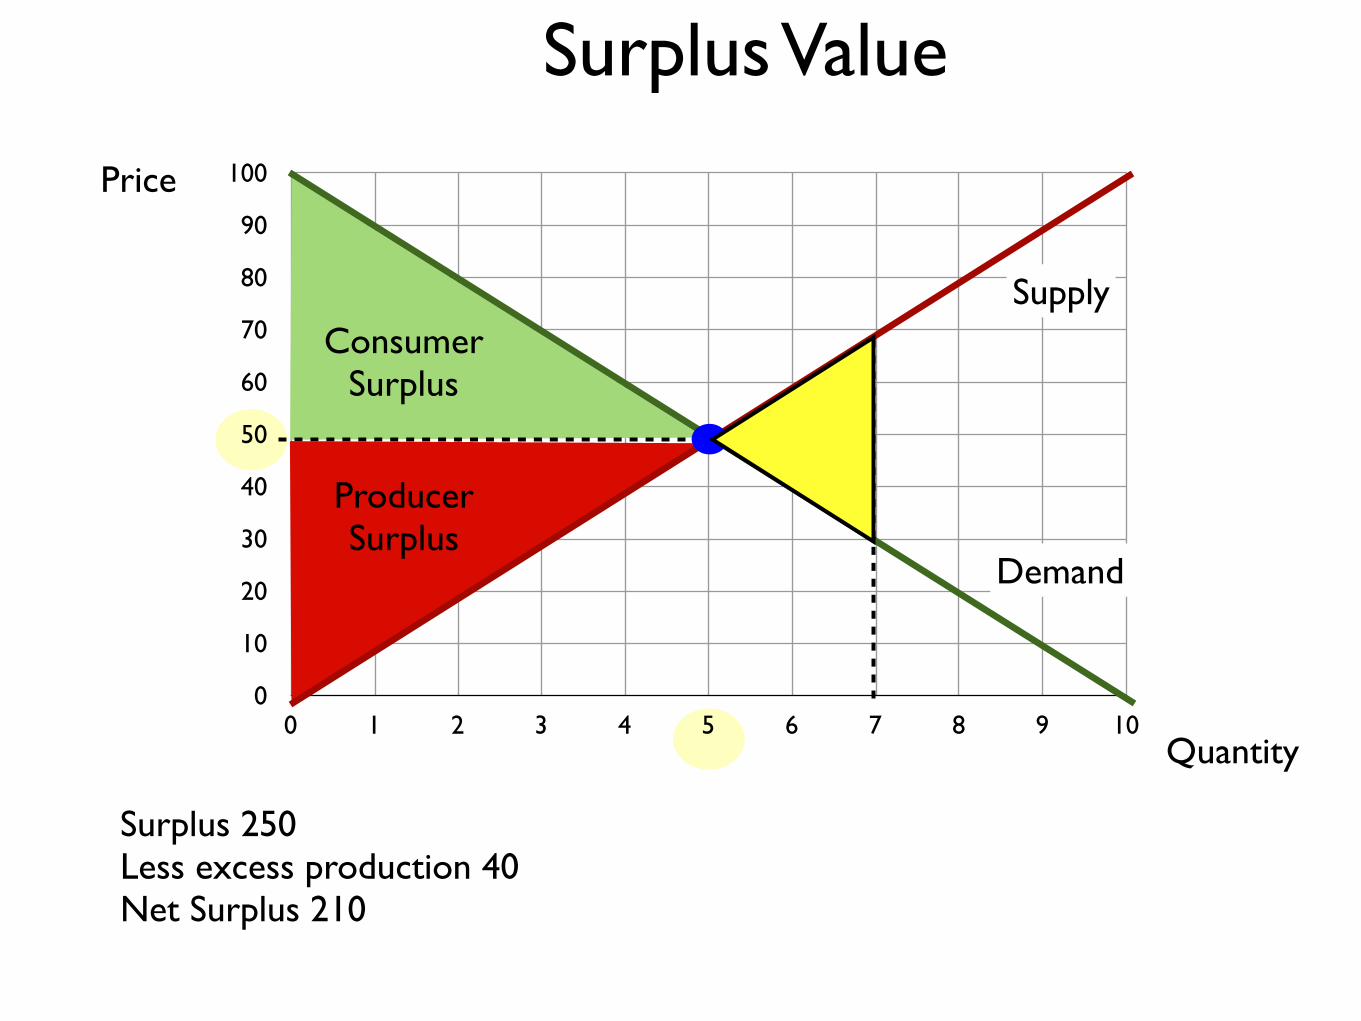
Surplus 250

0
10
20
30
40
50
60
70
80
90
100
0 1 2 3 4 5 6 7 8 9 10
Price
Quantity
Surplus Value
Demand
SupplyConsumer
Surplus
ProducerSurplus
Surplus 250 Less excess production 40
0
10
20
30
40
50
60
70
80
90
100
0 1 2 3 4 5 6 7 8 9 10
Price
Quantity
Surplus Value
Demand
SupplyConsumer
Surplus
ProducerSurplus
Surplus 250 Less excess production 40Net Surplus 210
0
10
20
30
40
50
60
70
80
90
100
0 1 2 3 4 5 6 7 8 9 10
Price
Quantity
Surplus Value
Demand
SupplyConsumer
Surplus
ProducerSurplus
0
10
20
30
40
50
60
70
80
90
100
0 1 2 3 4 5 6 7 8 9 10
Price
Quantity
Surplus Value
0
10
20
30
40
50
60
70
80
90
100
0 1 2 3 4 5 6 7 8 9 10
Price
Quantity
Surplus Value
Supply
0
10
20
30
40
50
60
70
80
90
100
0 1 2 3 4 5 6 7 8 9 10
Price
Quantity
Surplus Value
Demand
Supply
0
10
20
30
40
50
60
70
80
90
100
0 1 2 3 4 5 6 7 8 9 10
Price
Quantity
Surplus Value
Demand
Supply
0
10
20
30
40
50
60
70
80
90
100
0 1 2 3 4 5 6 7 8 9 10
Price
Quantity
Surplus Value
Demand
Supply
0
10
20
30
40
50
60
70
80
90
100
0 1 2 3 4 5 6 7 8 9 10
Price
Quantity
Surplus Value
Demand
Supply
0
10
20
30
40
50
60
70
80
90
100
0 1 2 3 4 5 6 7 8 9 10
Price
Quantity
Surplus Value
Demand
Supply
0
10
20
30
40
50
60
70
80
90
100
0 1 2 3 4 5 6 7 8 9 10
Price
Quantity
Surplus Value
Demand
Supply
0
10
20
30
40
50
60
70
80
90
100
0 1 2 3 4 5 6 7 8 9 10
Price
Quantity
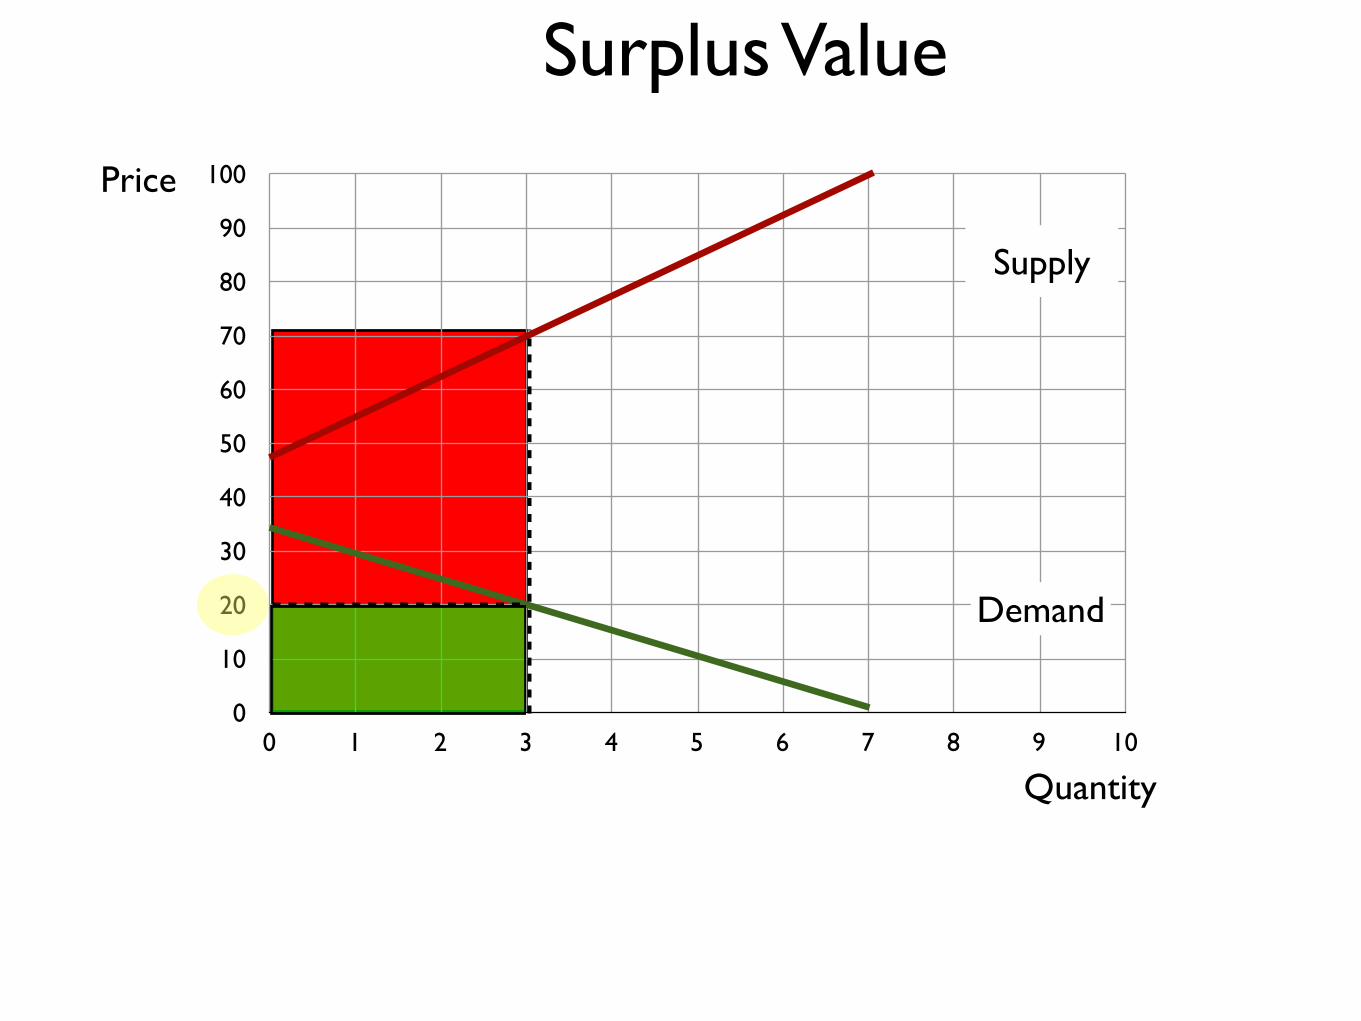
Surplus Value
Demand
Supply
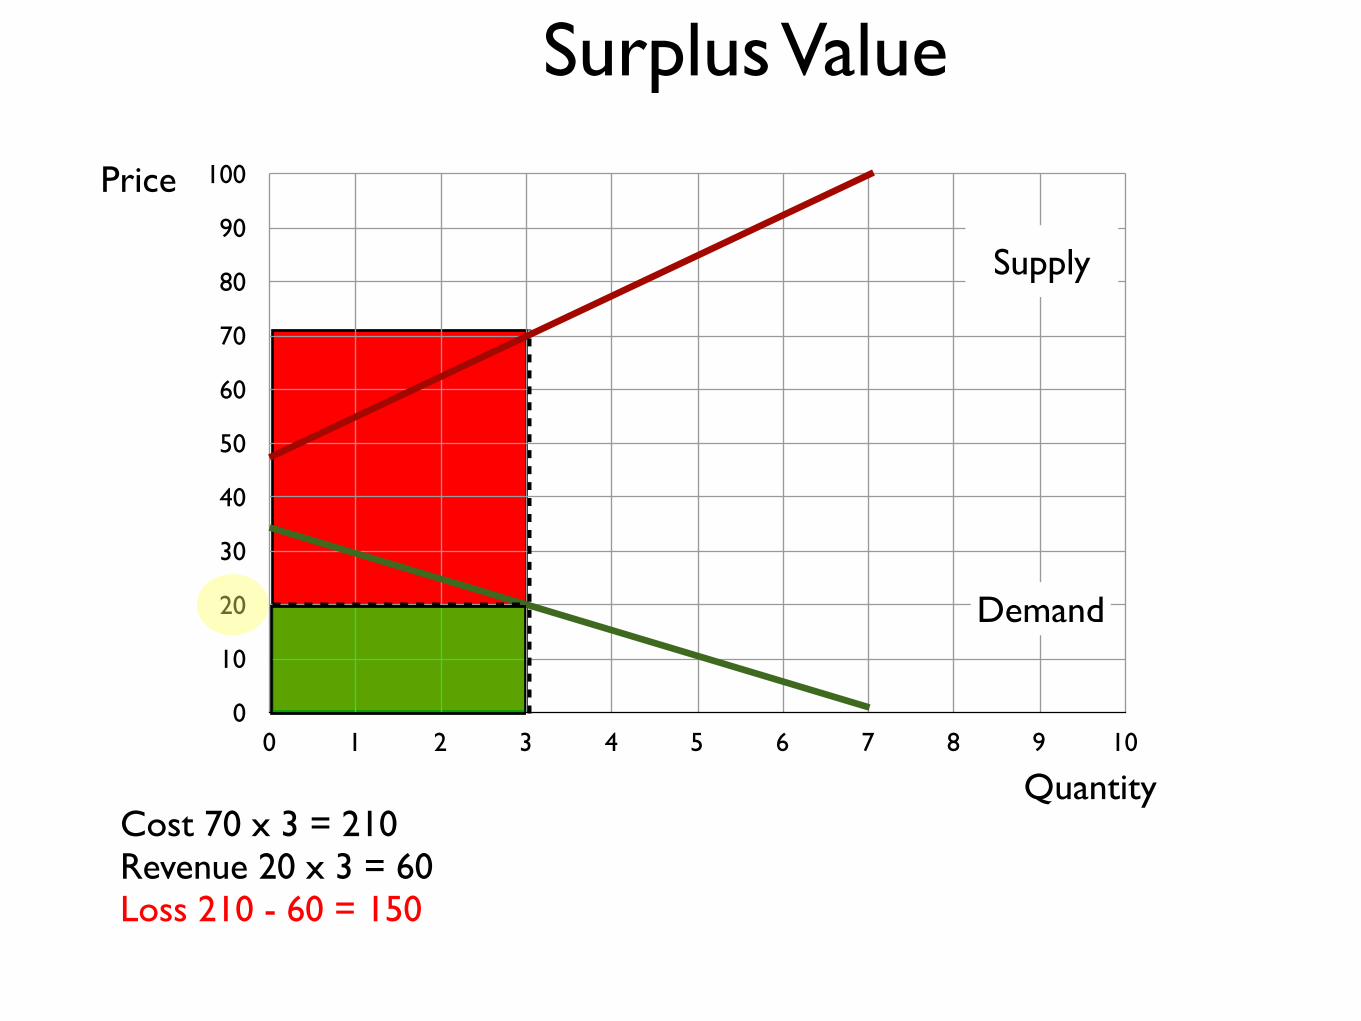
Cost 70 x 3 = 210
0
10
20
30
40
50
60
70
80
90
100
0 1 2 3 4 5 6 7 8 9 10
Price
Quantity
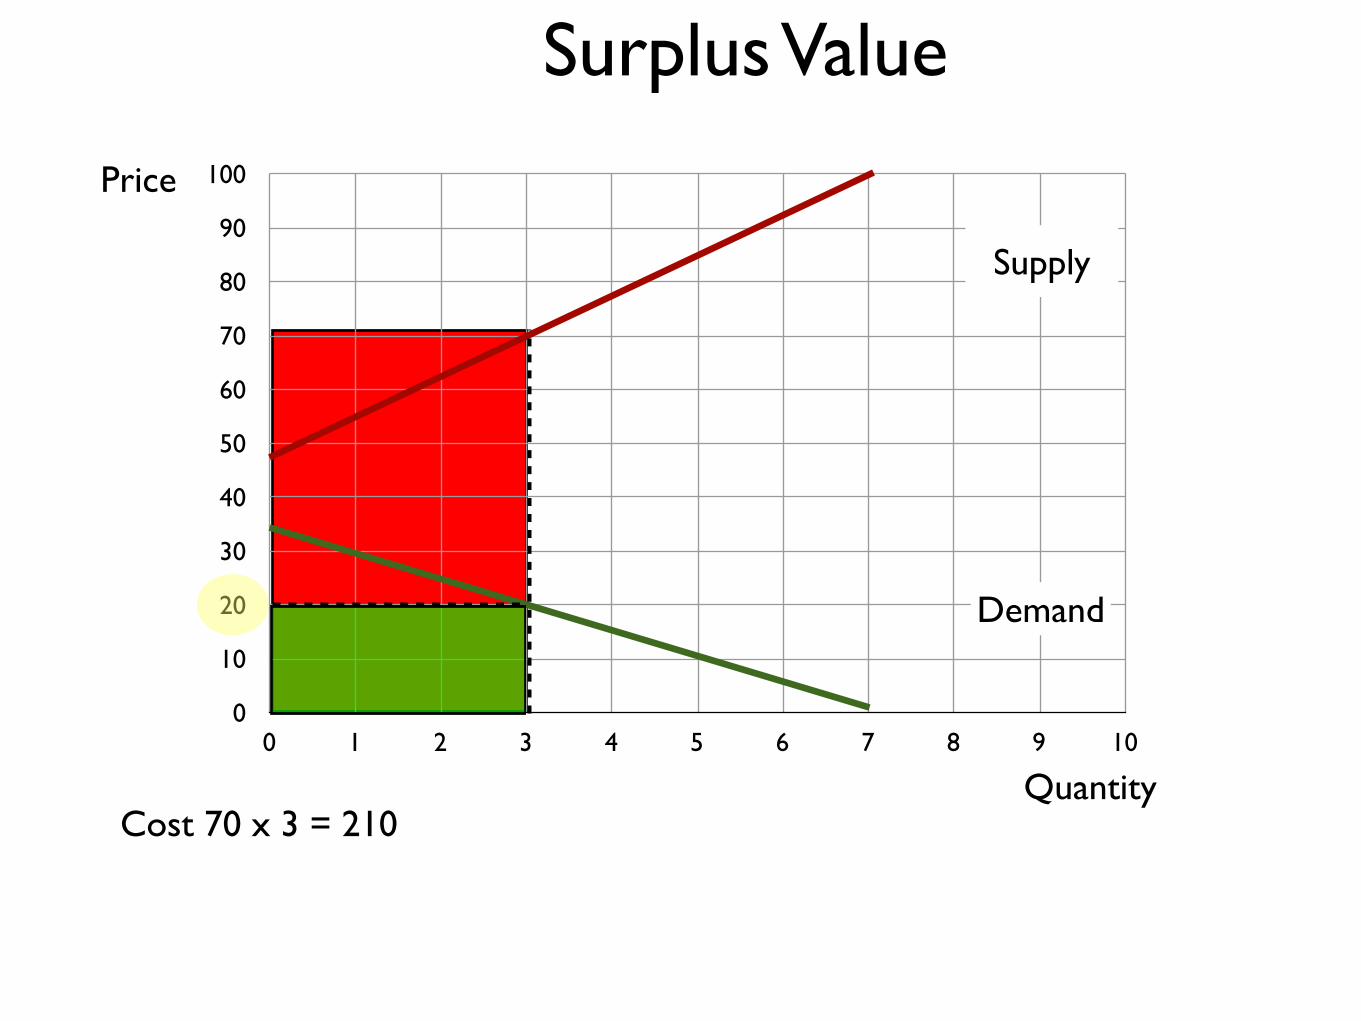
Surplus Value
Demand
Supply
Cost 70 x 3 = 210Revenue 20 x 3 = 60
0
10
20
30
40
50
60
70
80
90
100
0 1 2 3 4 5 6 7 8 9 10
Price
Quantity
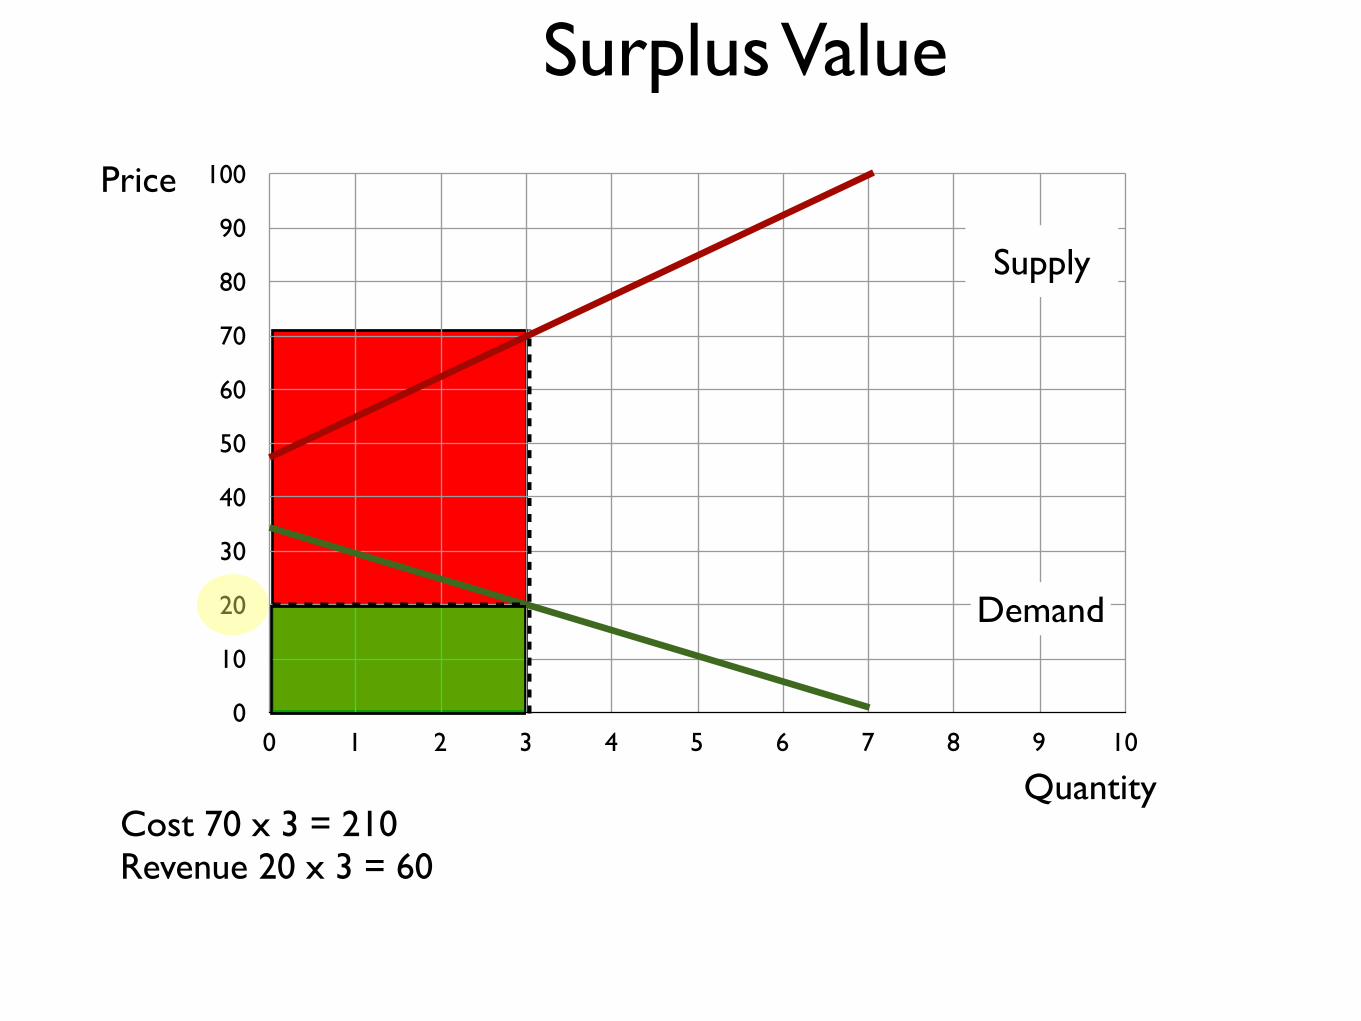
Surplus Value
Demand
Supply
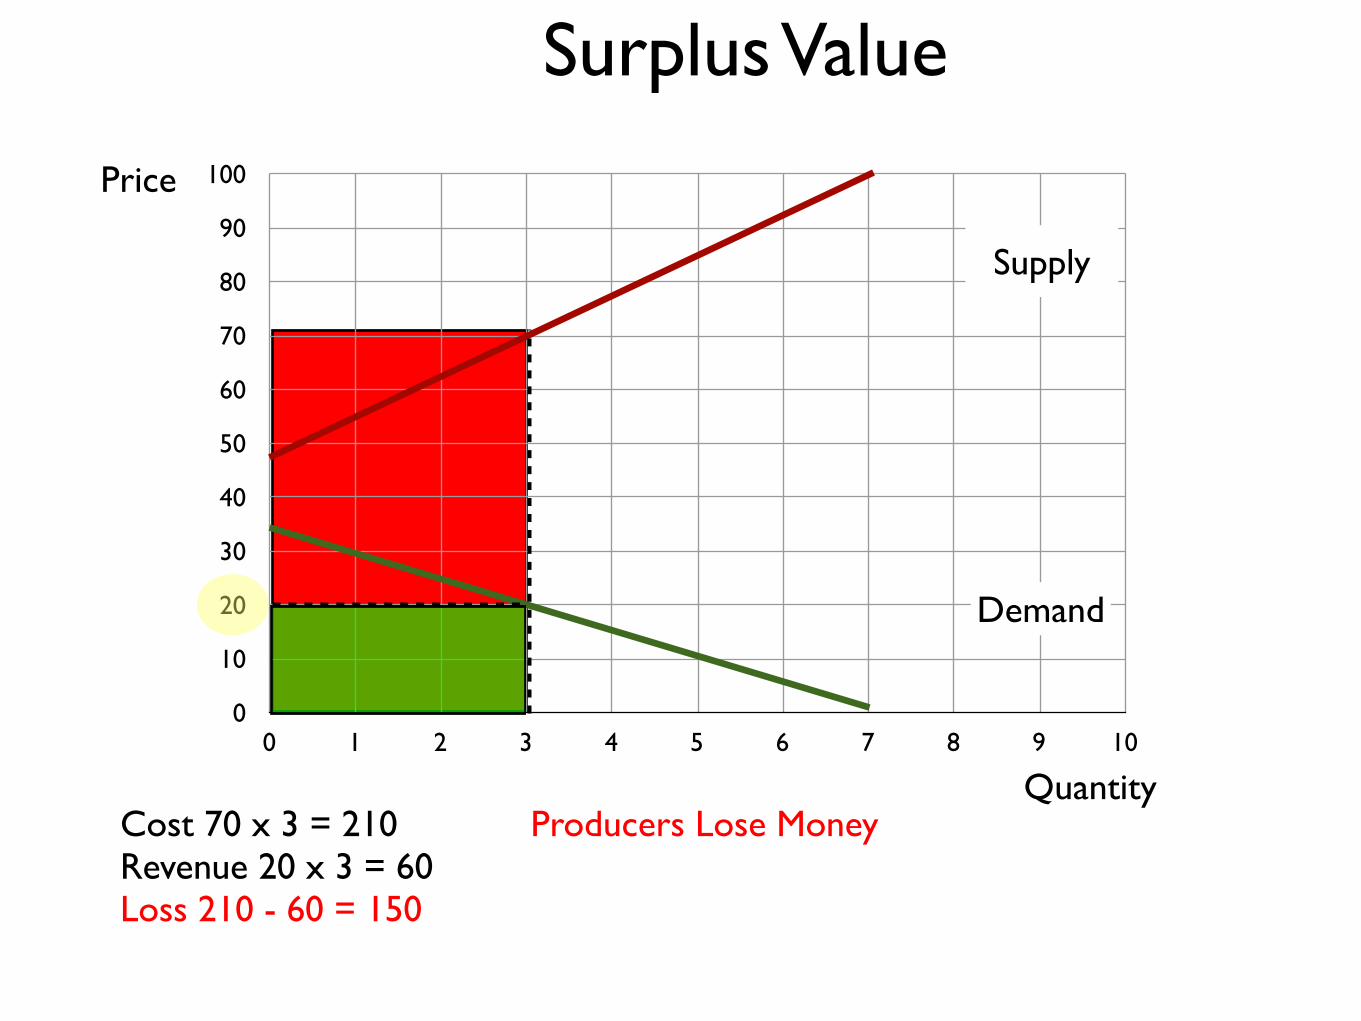
Cost 70 x 3 = 210Revenue 20 x 3 = 60Loss 210 - 60 = 150
0
10
20
30
40
50
60
70
80
90
100
0 1 2 3 4 5 6 7 8 9 10
Price
Quantity
Surplus Value
Demand
Supply
Cost 70 x 3 = 210Revenue 20 x 3 = 60Loss 210 - 60 = 150
Producers Lose Money
0
10
20
30
40
50
60
70
80
90
100
0 1 2 3 4 5 6 7 8 9 10
Price
Quantity
Surplus Value
Demand
Supply
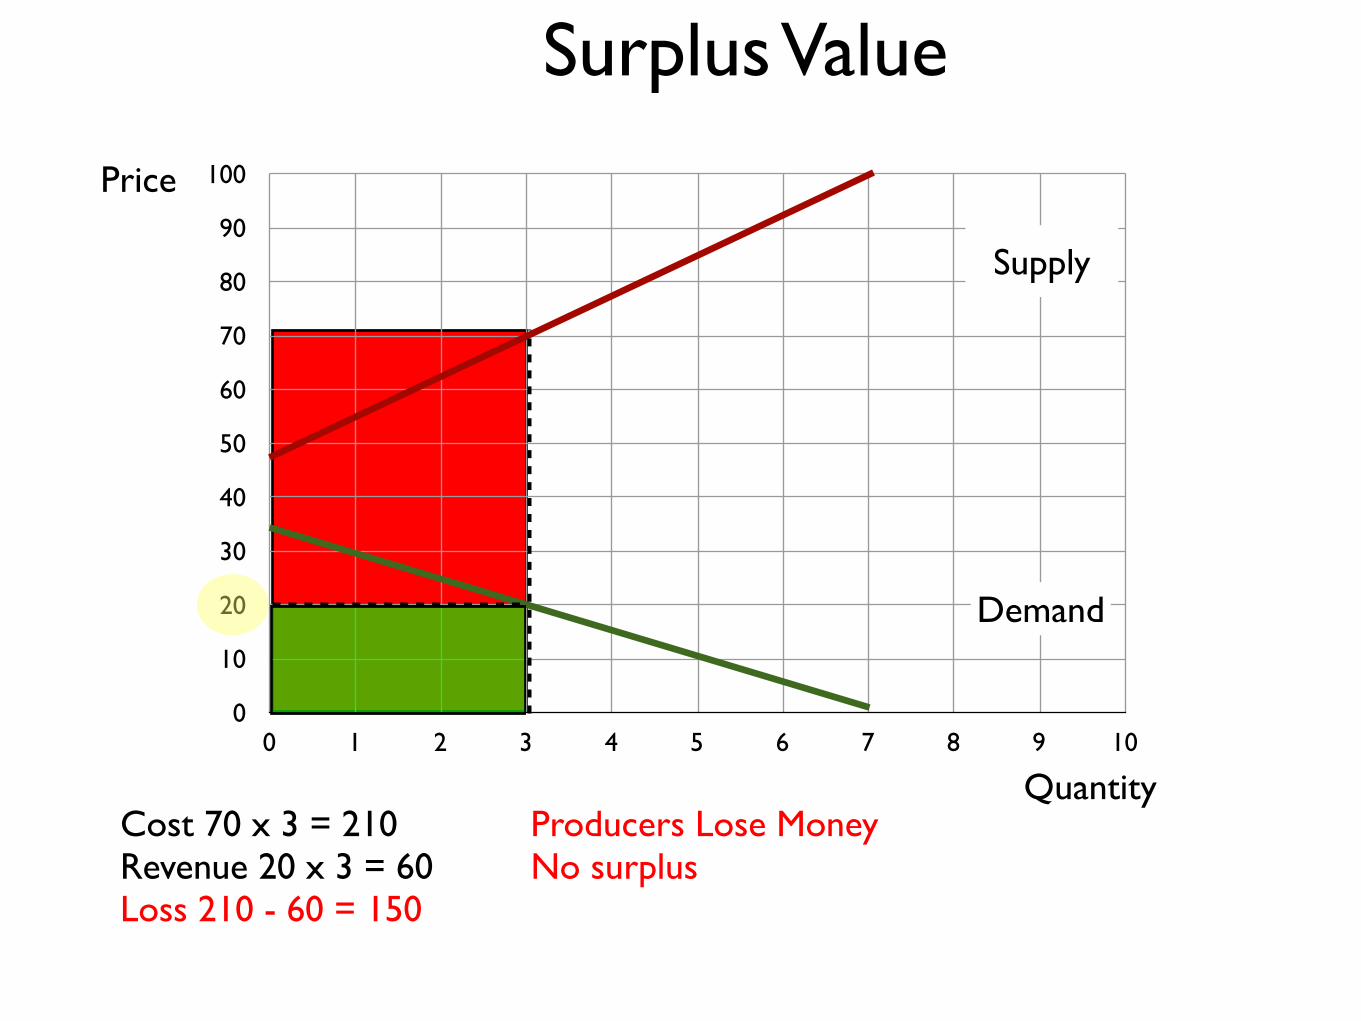
Cost 70 x 3 = 210Revenue 20 x 3 = 60Loss 210 - 60 = 150
Producers Lose MoneyNo surplus
0
10
20
30
40
50
60
70
80
90
100
0 1 2 3 4 5 6 7 8 9 10
Price
Quantity
Surplus Value
Demand
Supply
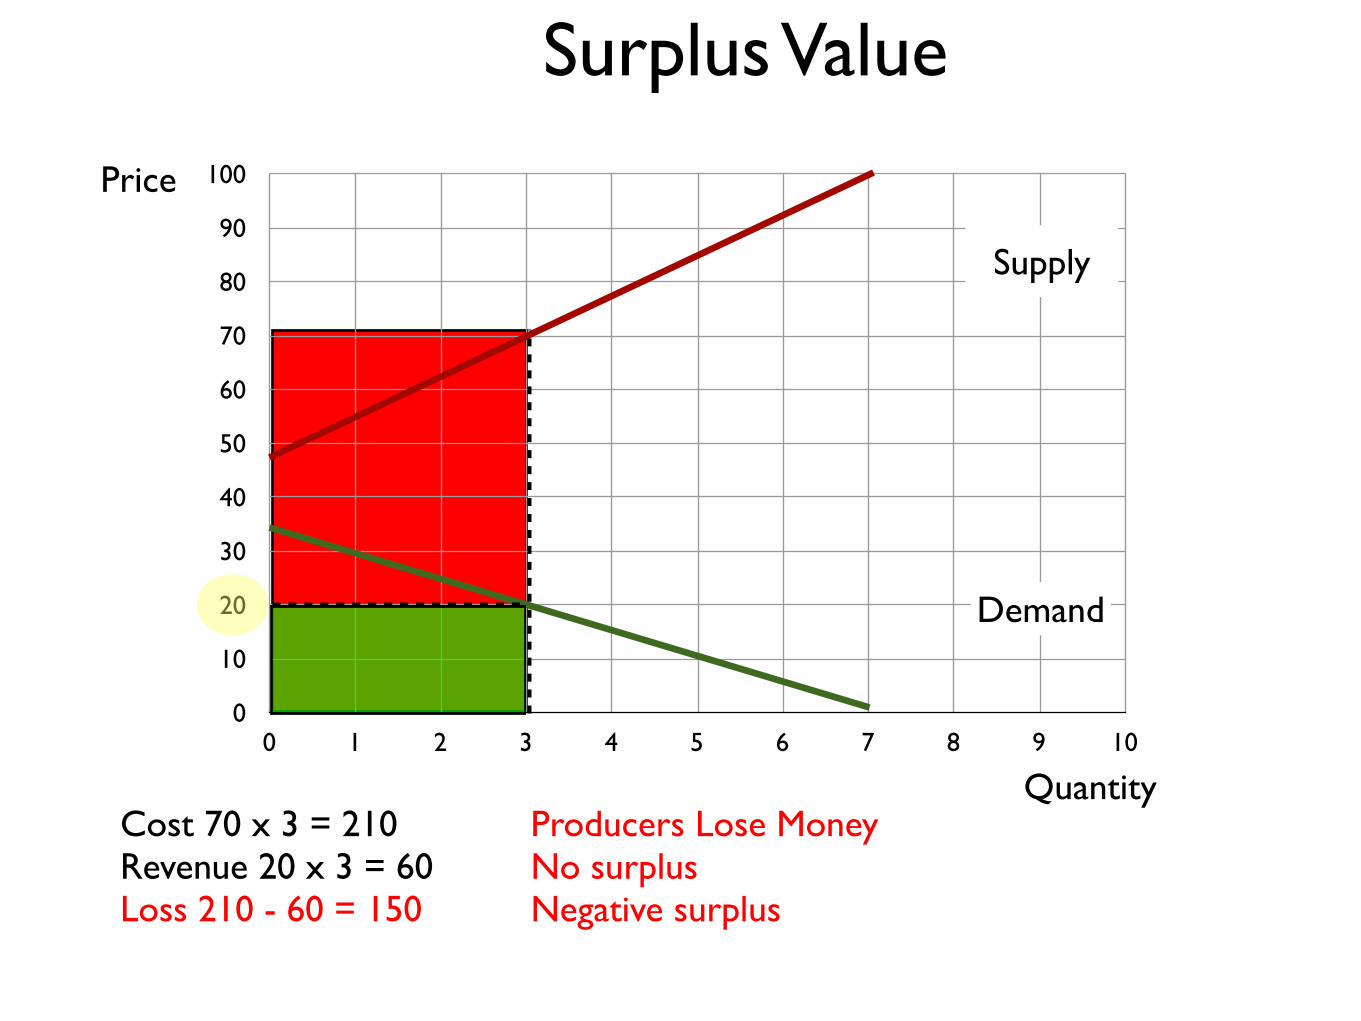
Cost 70 x 3 = 210Revenue 20 x 3 = 60Loss 210 - 60 = 150
Producers Lose MoneyNo surplusNegative surplus
0
10
20
30
40
50
60
70
80
90
100
0 1 2 3 4 5 6 7 8 9 10
Price
Quantity
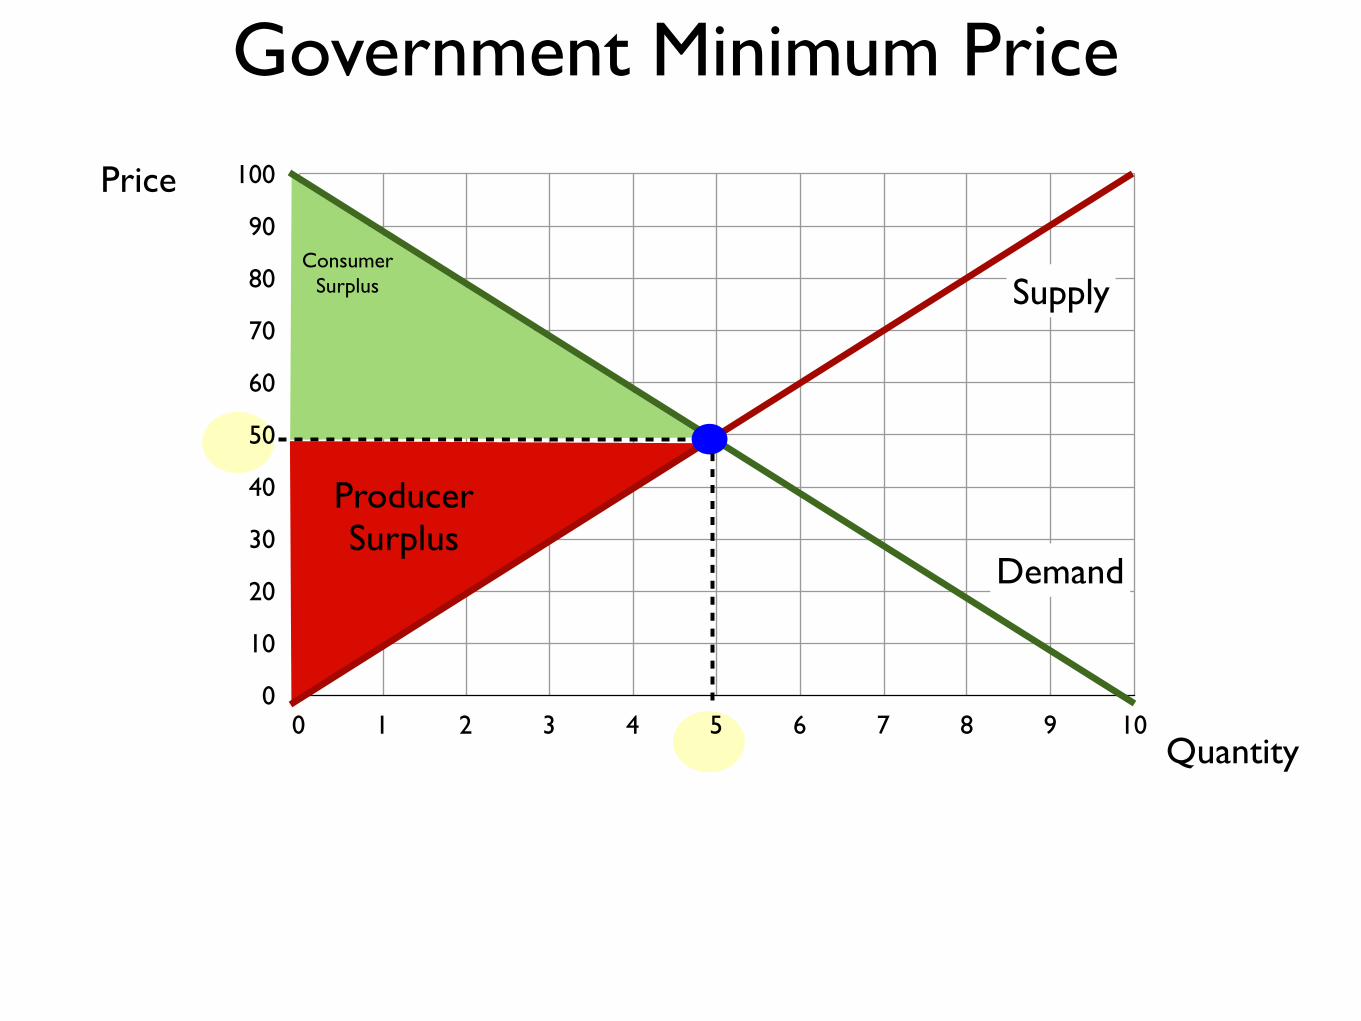
Government Minimum Price
Demand
SupplyConsumer
Surplus
ProducerSurplus

0
10
20
30
40
50
60
70
80
90
100
0 1 2 3 4 5 6 7 8 9 10
Price
Quantity
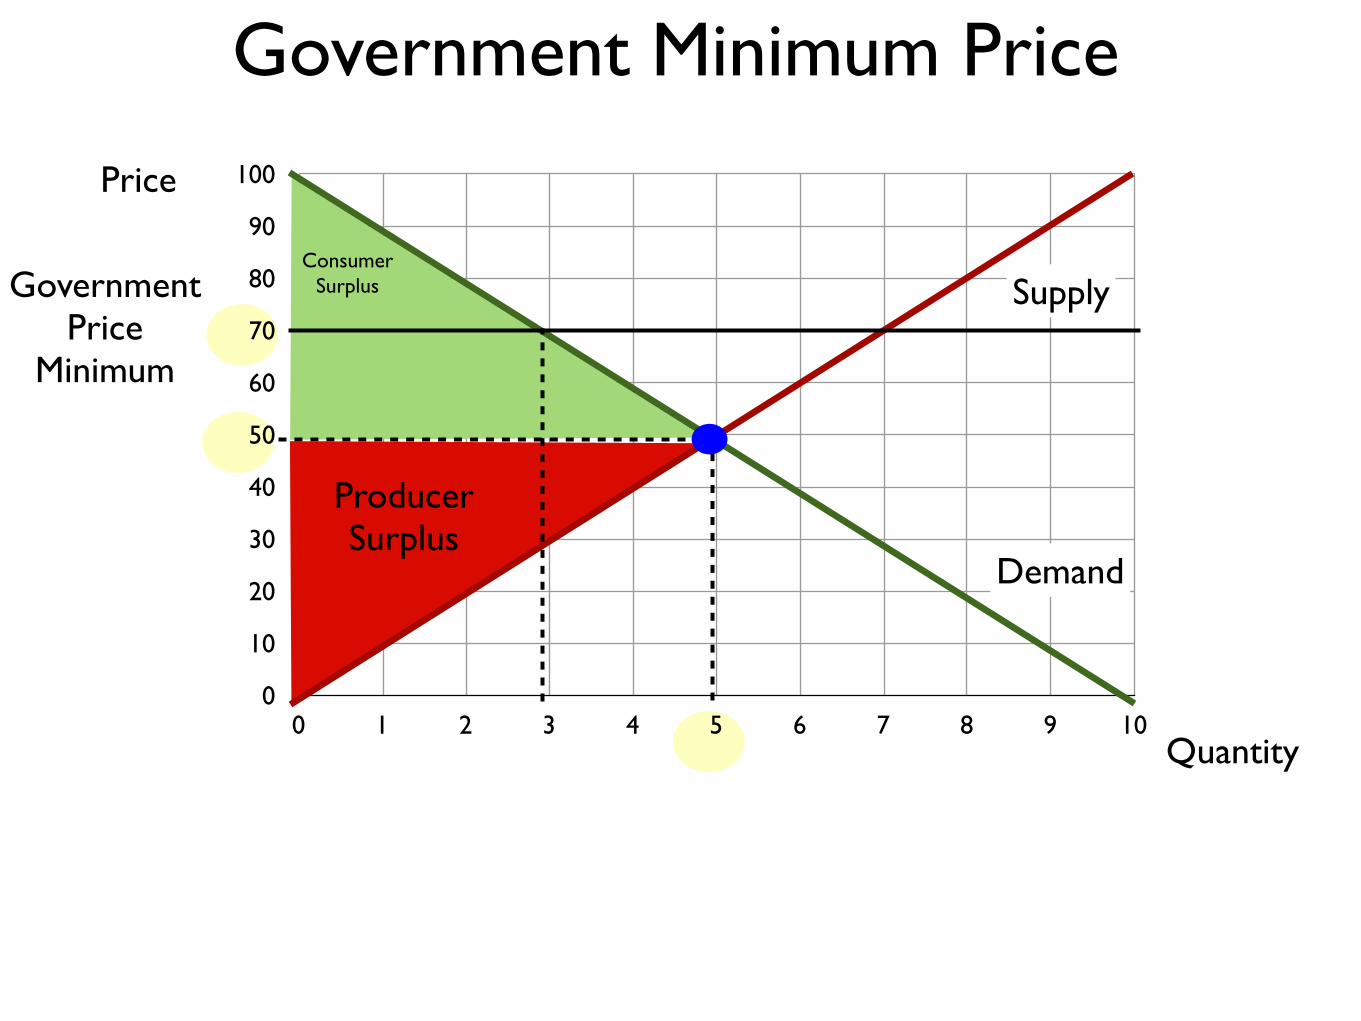
Government Minimum Price
Demand
SupplyConsumer
Surplus
ProducerSurplus
GovernmentPrice
Minimum
0
10
20
30
40
50
60
70
80
90
100
0 1 2 3 4 5 6 7 8 9 10
Price
Quantity
Government Minimum Price
Demand
SupplyConsumer
Surplus
ProducerSurplus
GovernmentPrice
Minimum

0
10
20
30
40
50
60
70
80
90
100
0 1 2 3 4 5 6 7 8 9 10
Price
Quantity
Government Minimum Price
Demand
SupplyConsumer
Surplus
ProducerSurplus
GovernmentPrice
Minimum

0
10
20
30
40
50
60
70
80
90
100
0 1 2 3 4 5 6 7 8 9 10
Price
Quantity
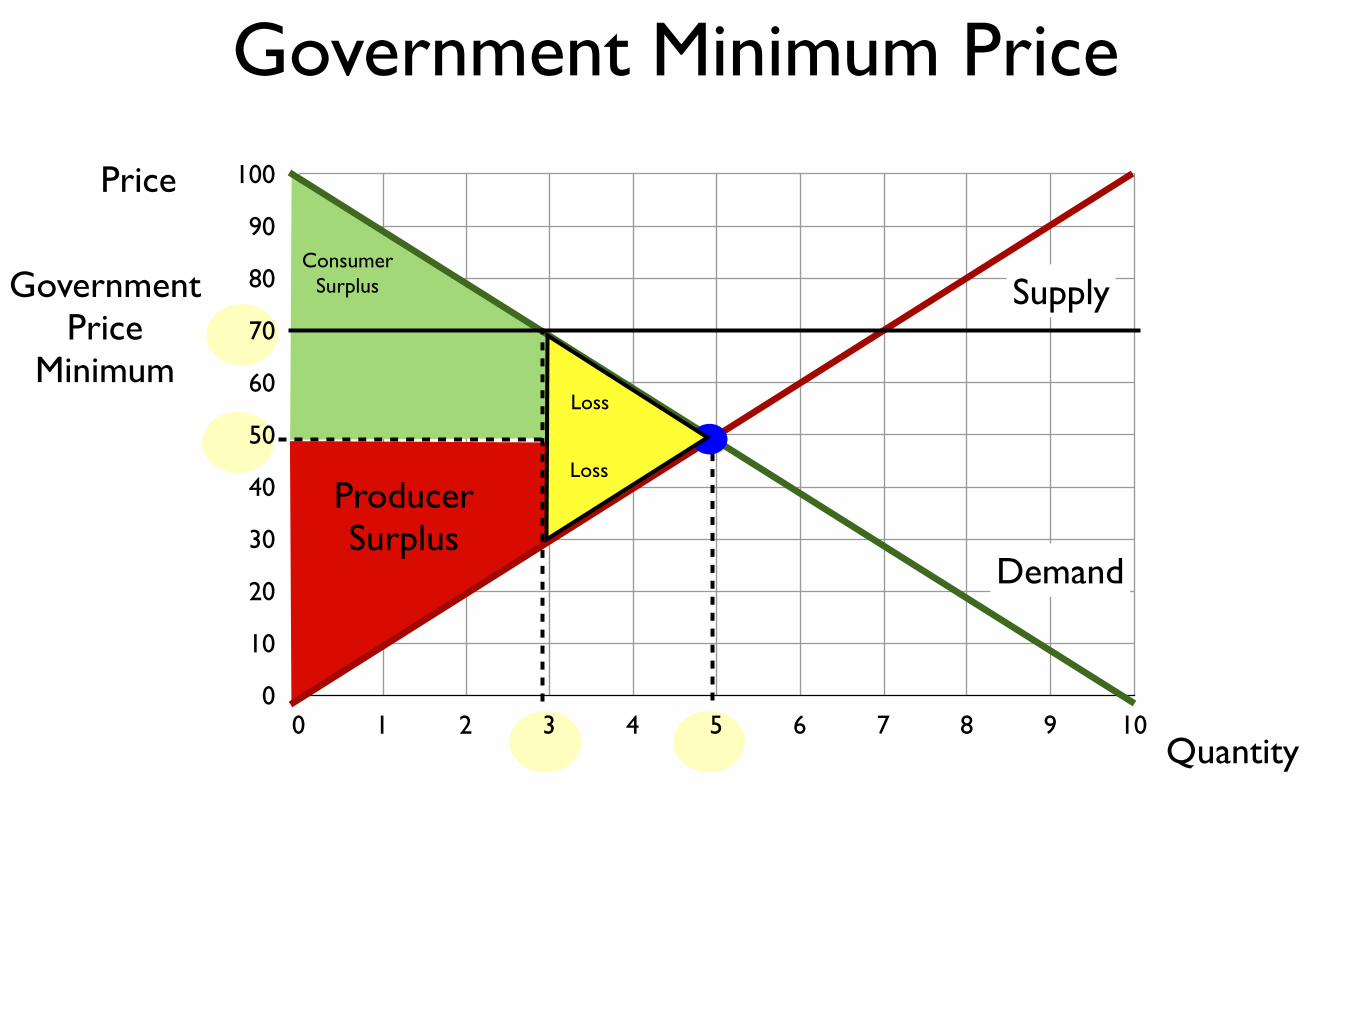
Government Minimum Price
Demand
SupplyConsumer
Surplus
ProducerSurplus
GovernmentPrice
MinimumLoss

0
10
20
30
40
50
60
70
80
90
100
0 1 2 3 4 5 6 7 8 9 10
Price
Quantity
Government Minimum Price
Demand
SupplyConsumer
Surplus
ProducerSurplus
GovernmentPrice
MinimumLoss
Loss
0
10
20
30
40
50
60
70
80
90
100
0 1 2 3 4 5 6 7 8 9 10
Price
Quantity
Government Minimum Price
Demand
SupplyConsumer
Surplus
ProducerSurplus
GovernmentPrice
MinimumLoss
Loss

0
10
20
30
40
50
60
70
80
90
100
0 1 2 3 4 5 6 7 8 9 10
Price
Quantity
Government Minimum Price
Demand
SupplyConsumer
Surplus
ProducerSurplus
GovernmentPrice
MinimumLoss
Loss

0
10
20
30
40
50
60
70
80
90
100
0 1 2 3 4 5 6 7 8 9 10
Price
Quantity
Government Minimum Price
Demand
SupplyConsumer
Surplus
ProducerSurplus
GovernmentPrice
MinimumLoss
Loss

0
10
20
30
40
50
60
70
80
90
100
0 1 2 3 4 5 6 7 8 9 10
Price
Quantity
Government Minimum Price
Demand
SupplyConsumer
Surplus
ProducerSurplus
GovernmentPrice
MinimumLoss
Loss
0
10
20
30
40
50
60
70
80
90
100
0 1 2 3 4 5 6 7 8 9 10
Price
Quantity
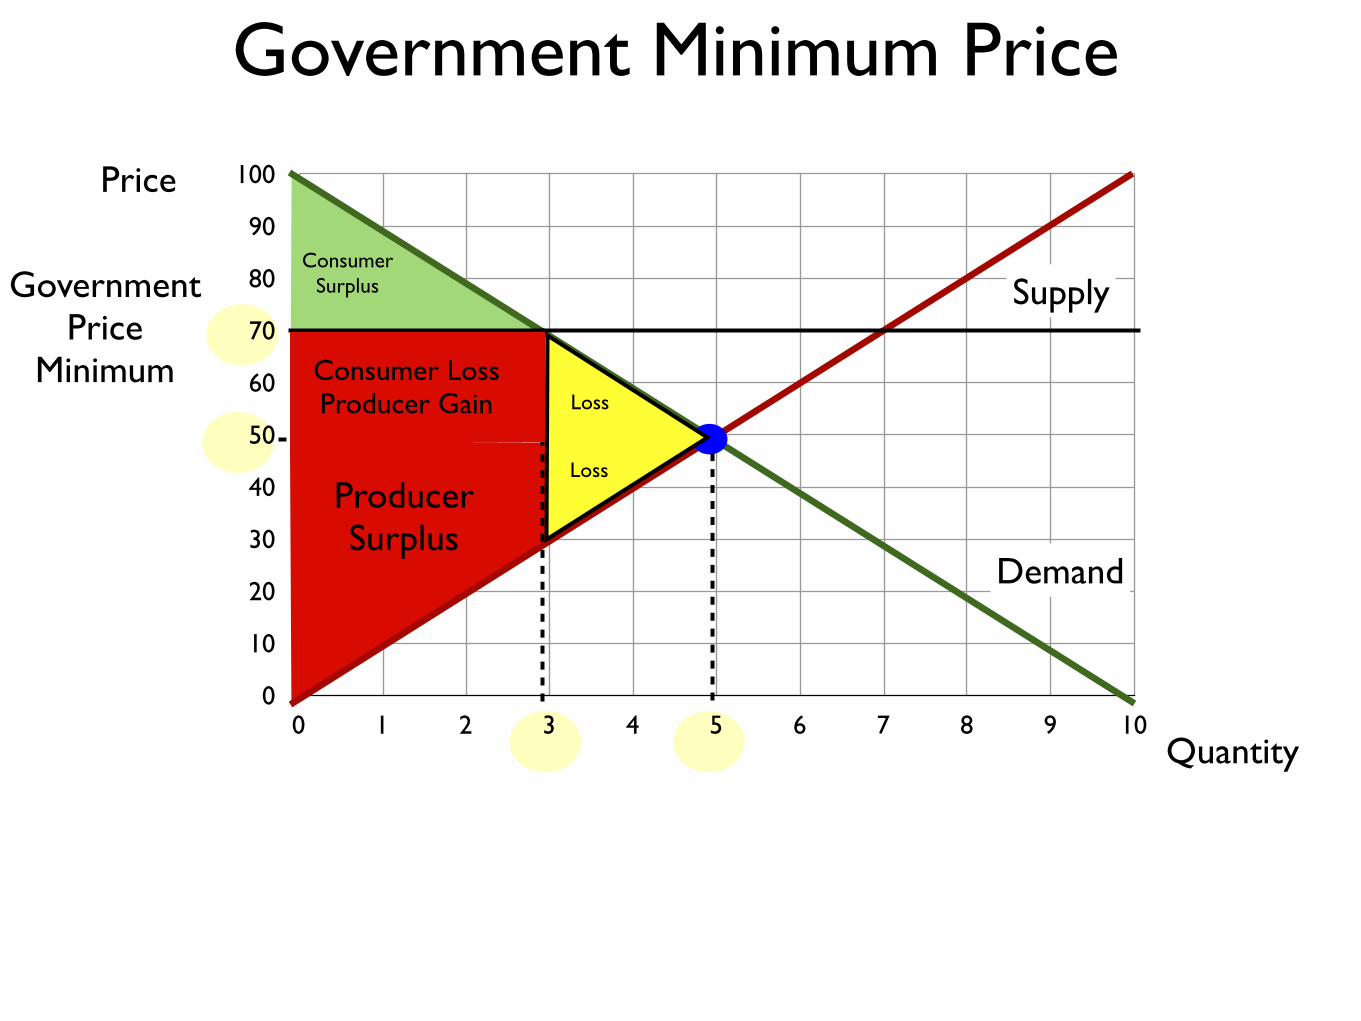
Government Minimum Price
Demand
SupplyConsumer
Surplus
ProducerSurplus
GovernmentPrice
Minimum Consumer LossProducer Gain Loss
Loss
0
10
20
30
40
50
60
70
80
90
100
0 1 2 3 4 5 6 7 8 9 10
Price
Quantity
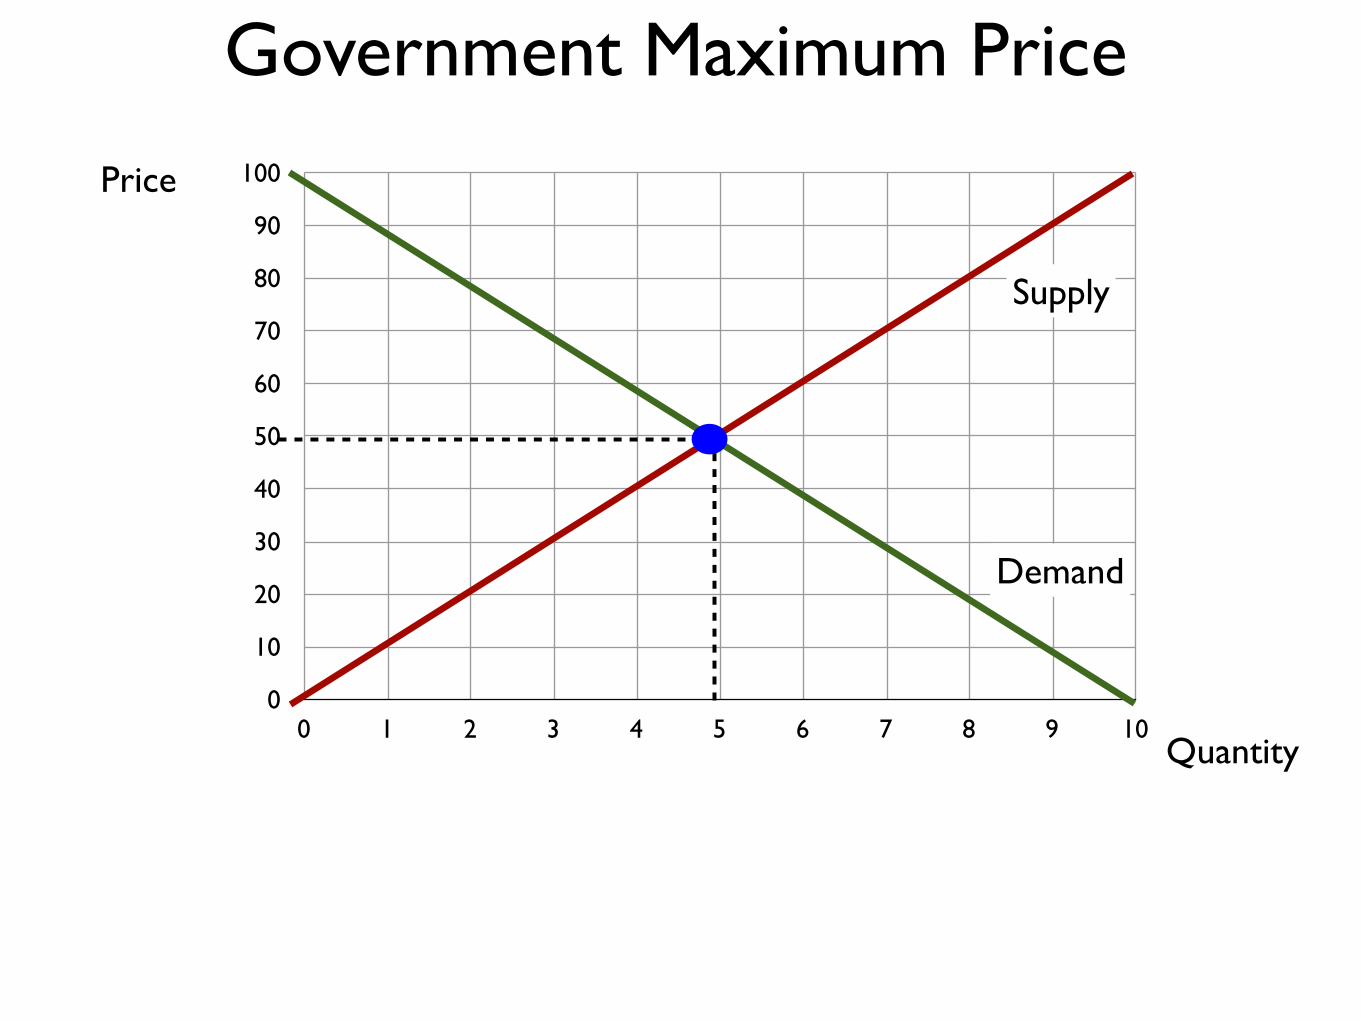
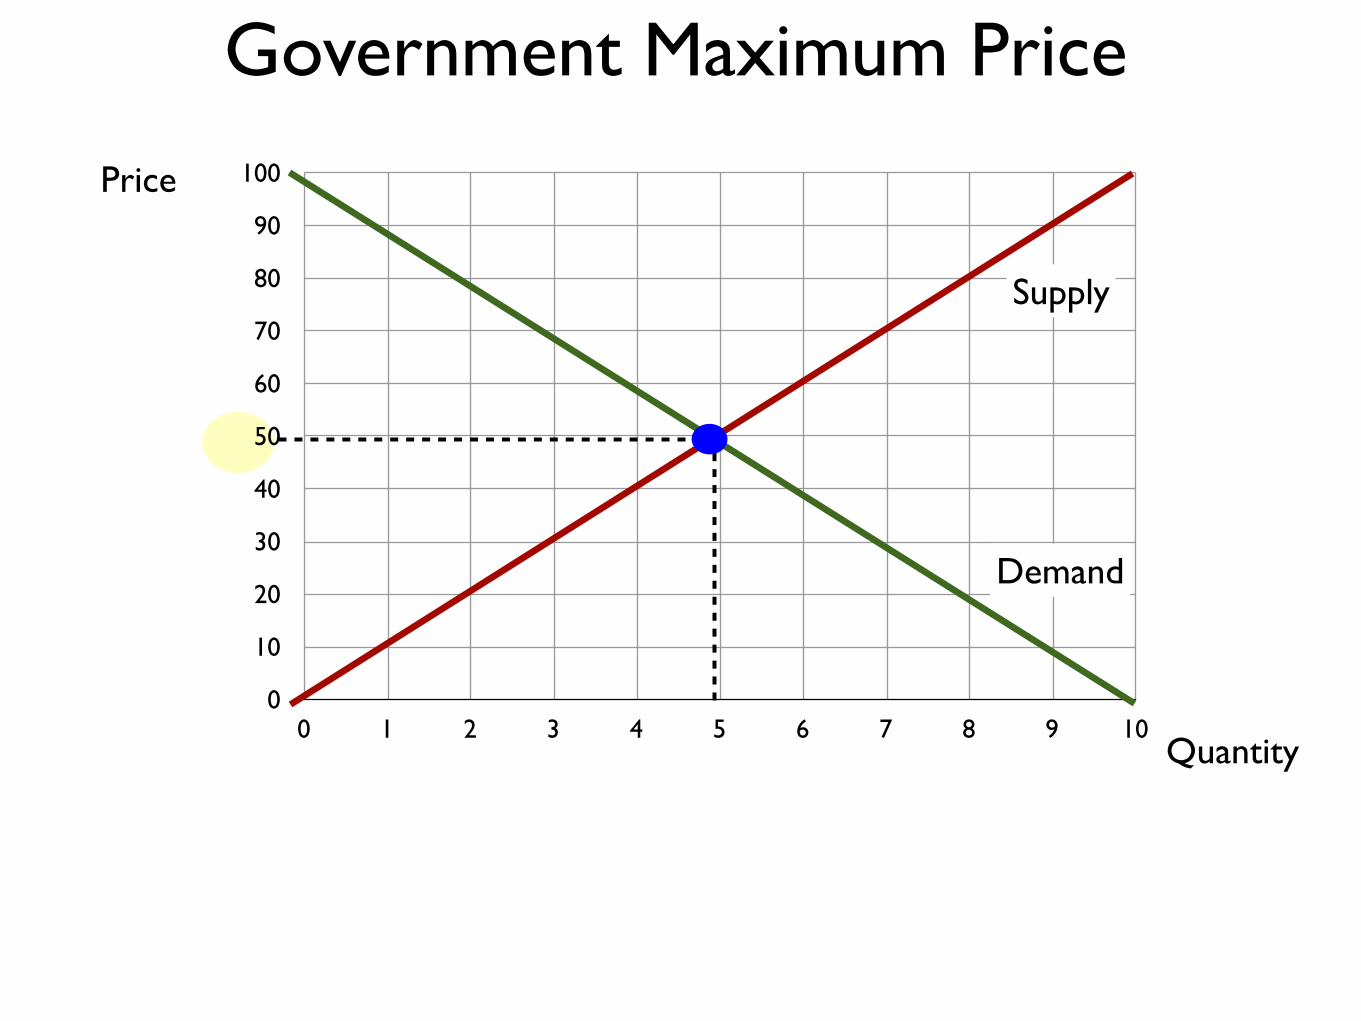
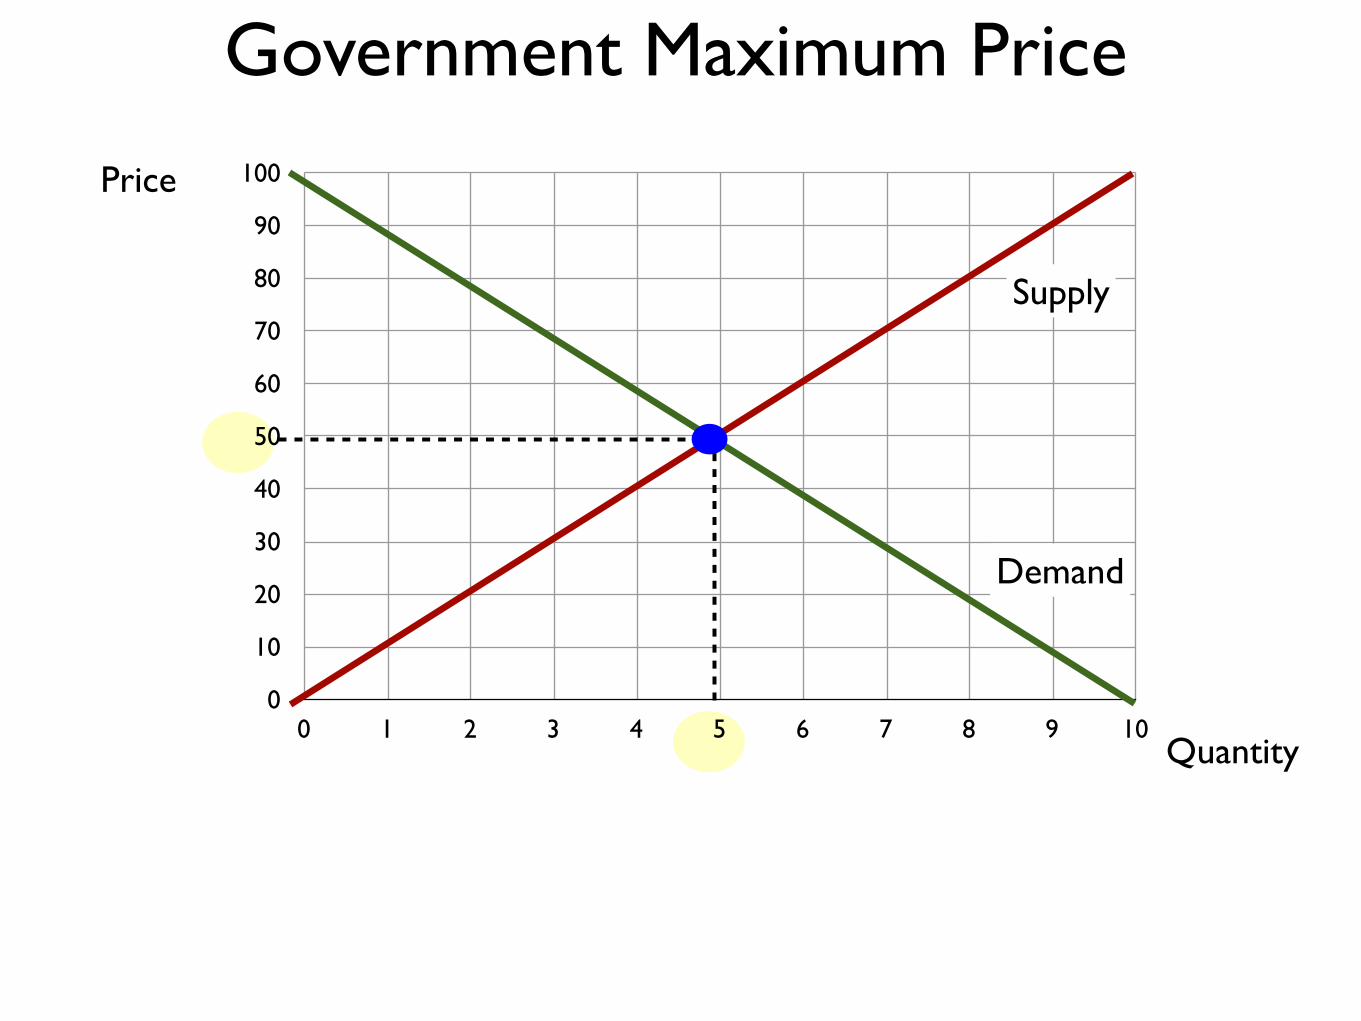
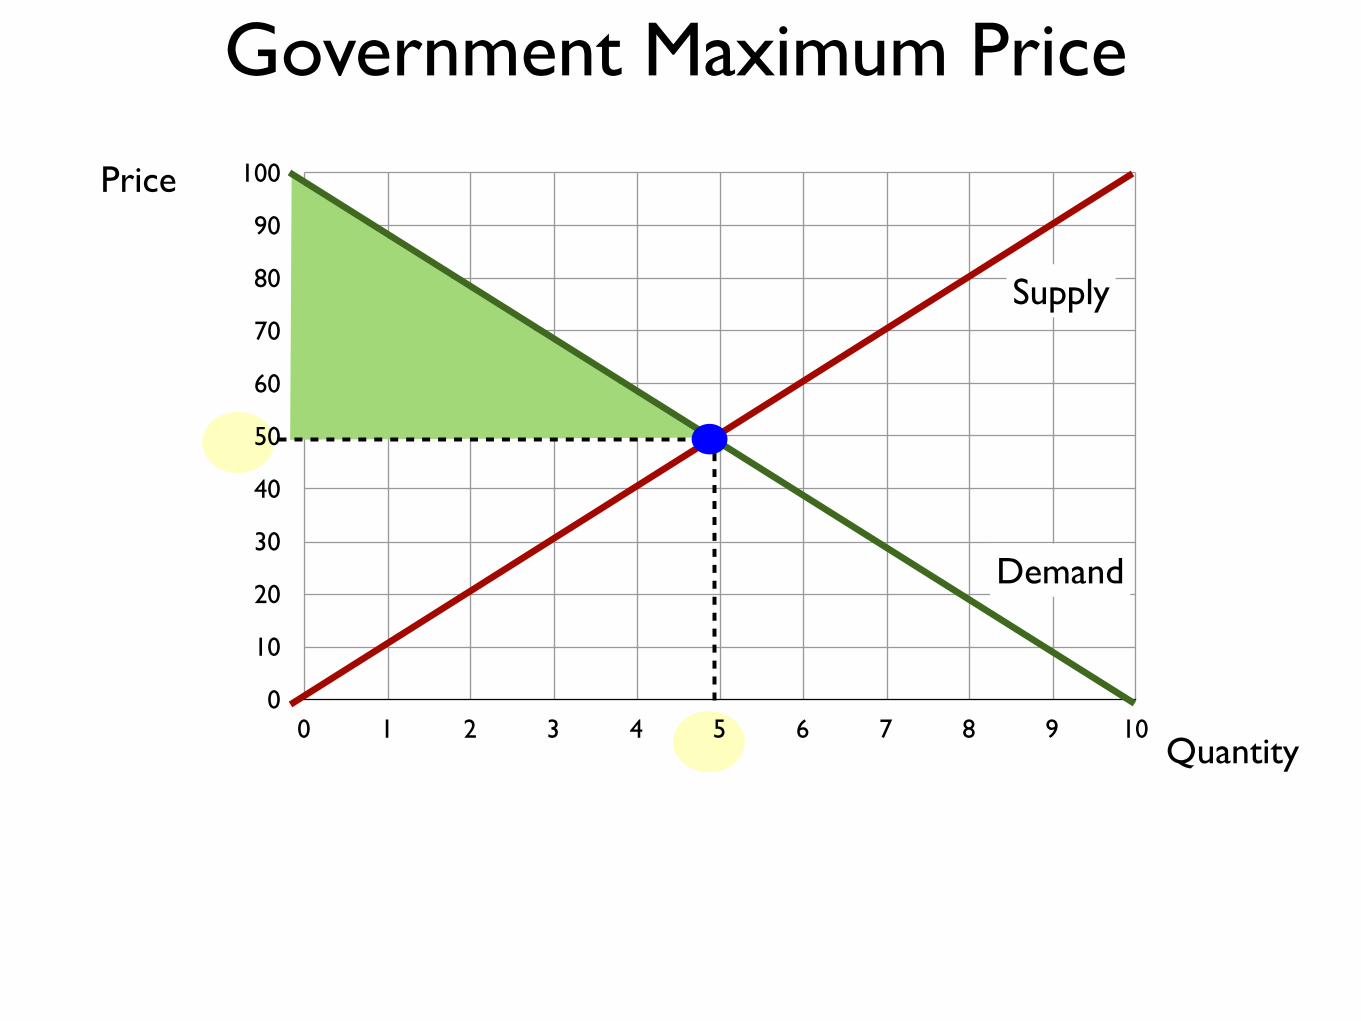
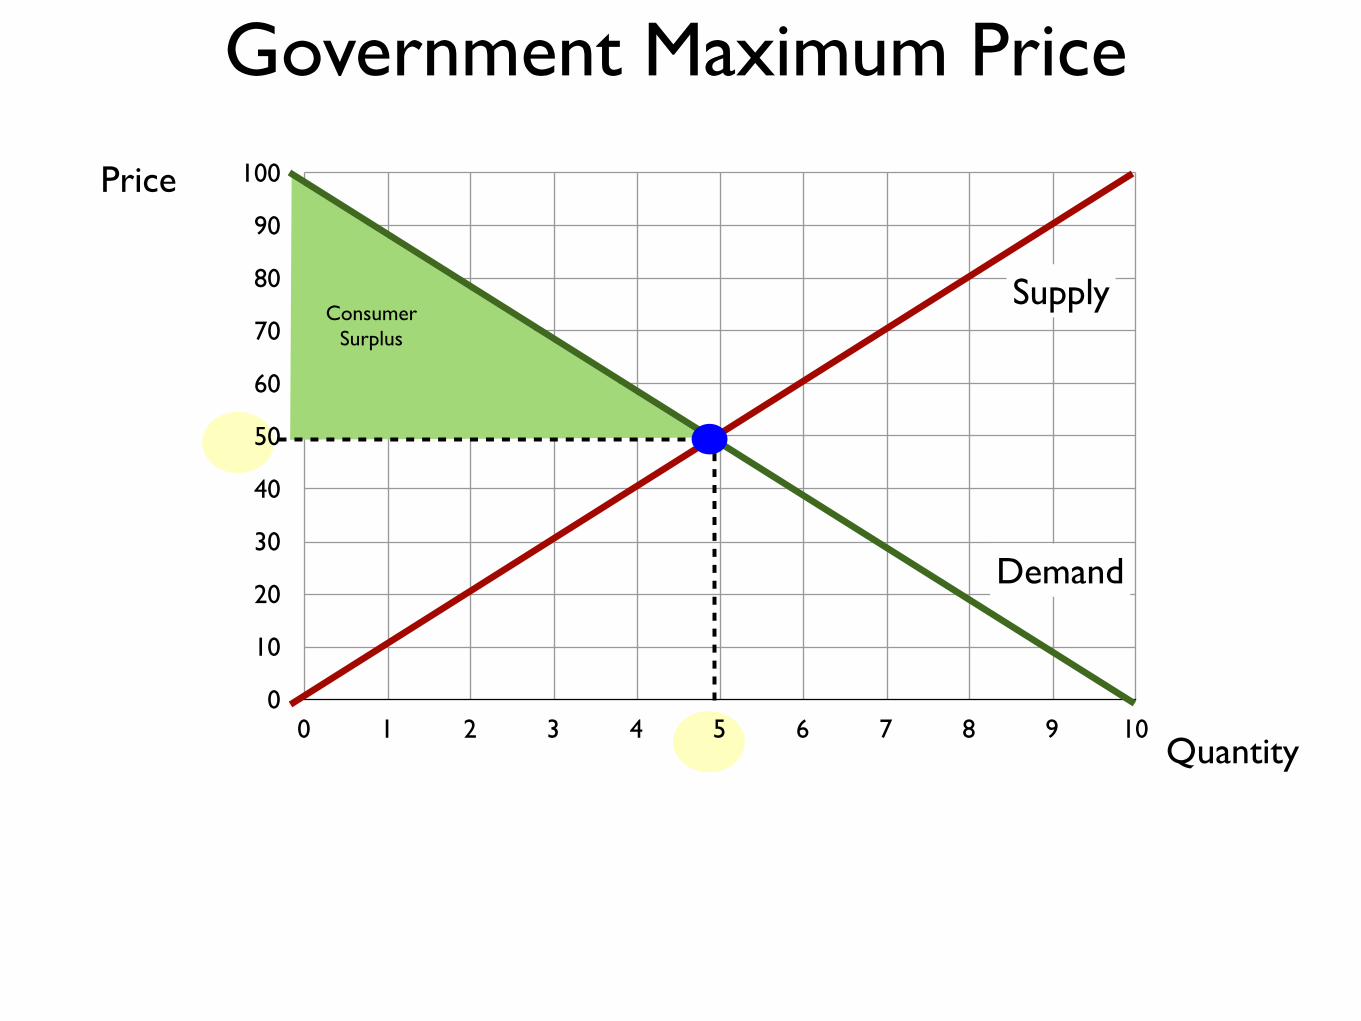
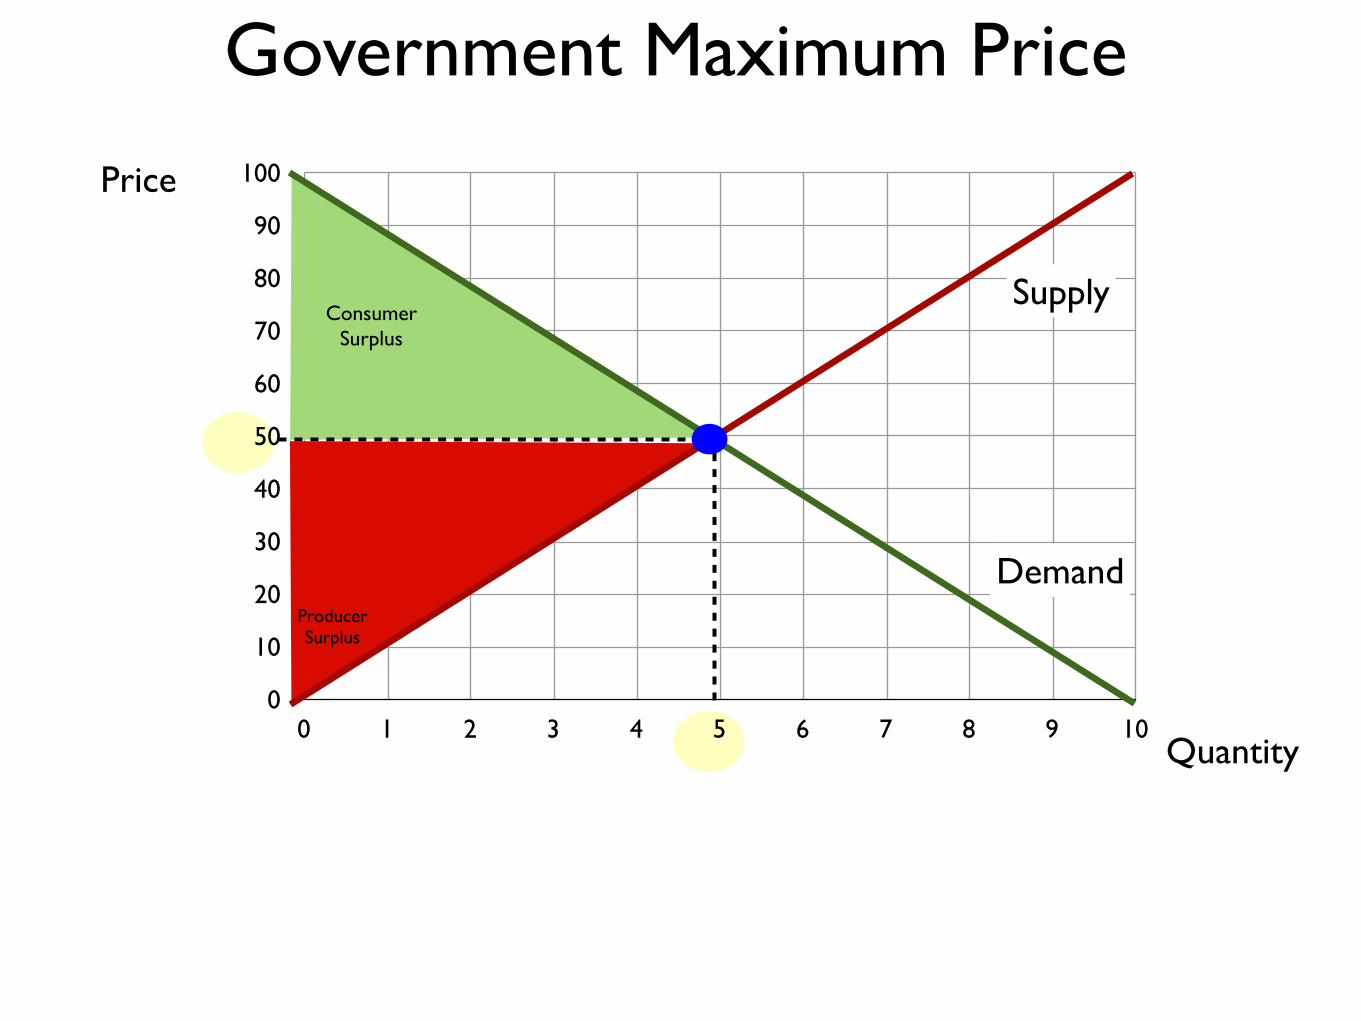
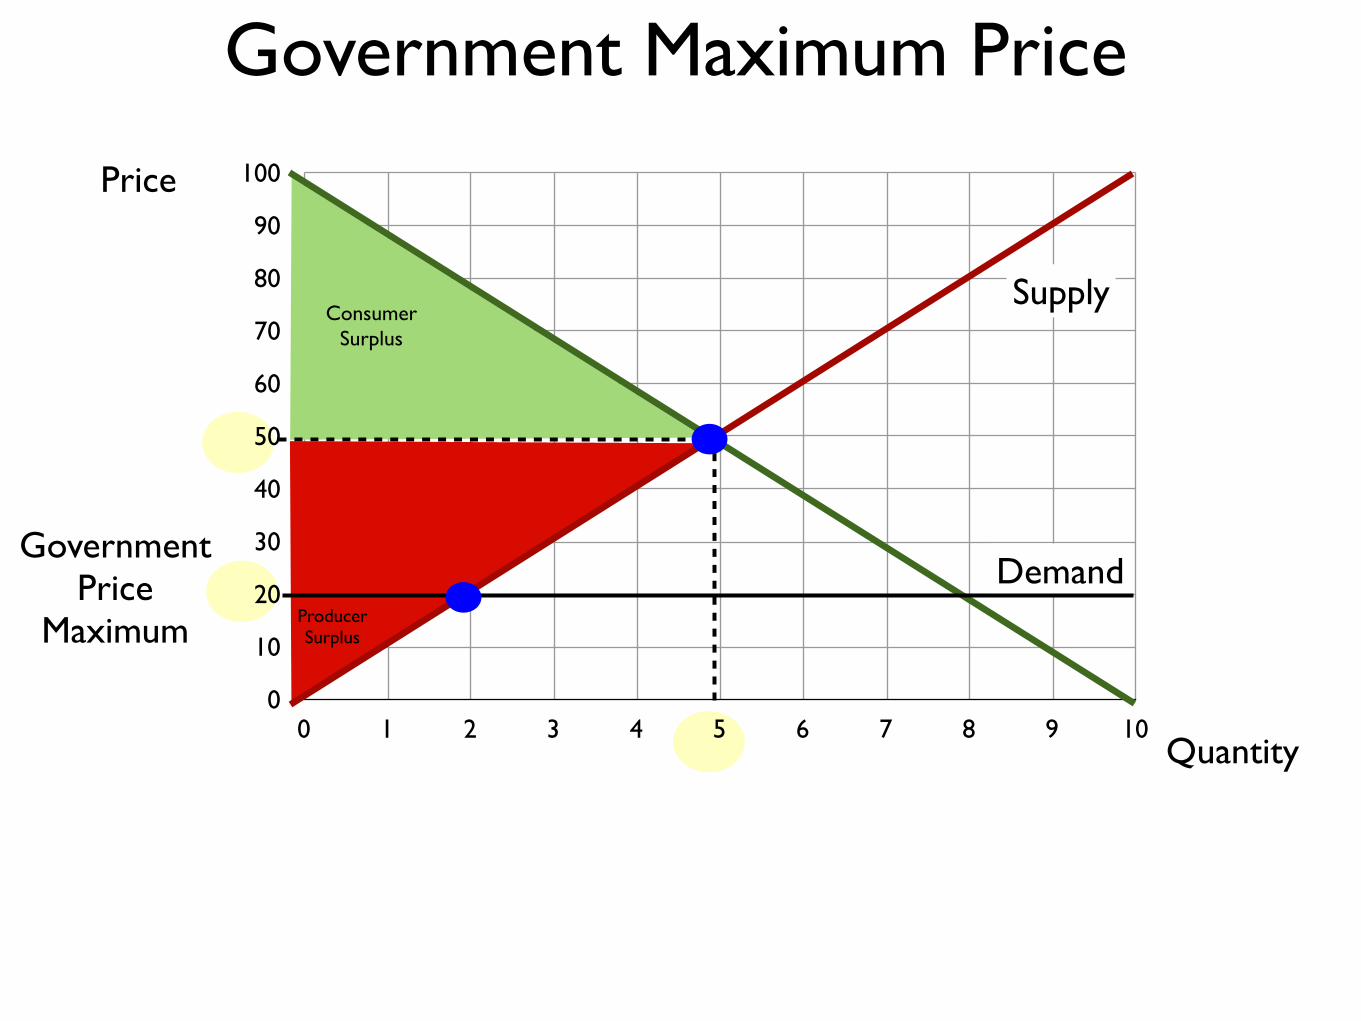
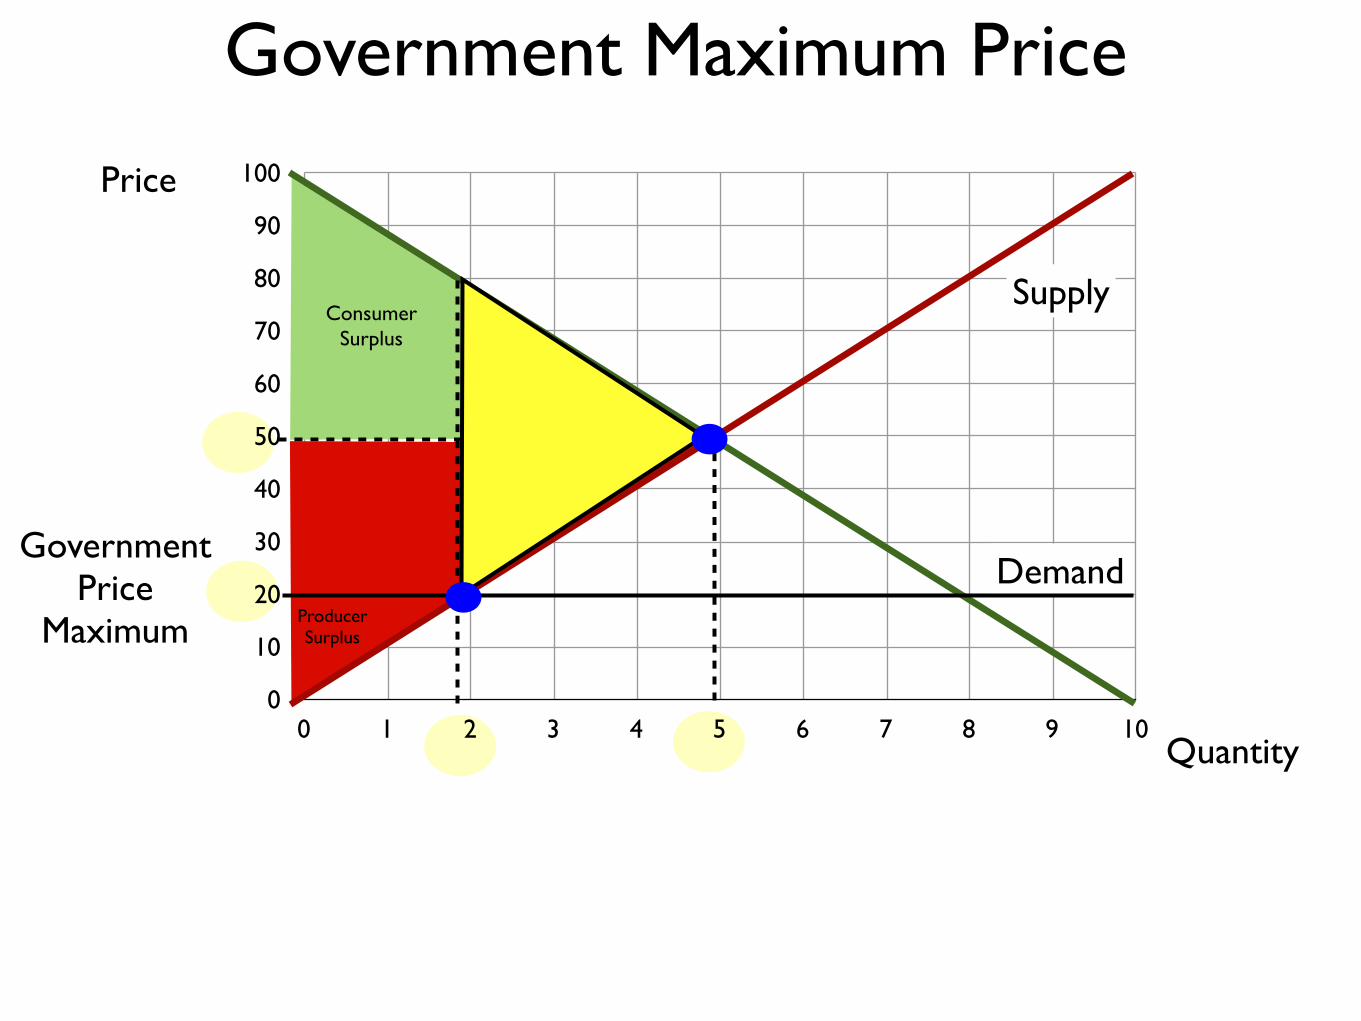
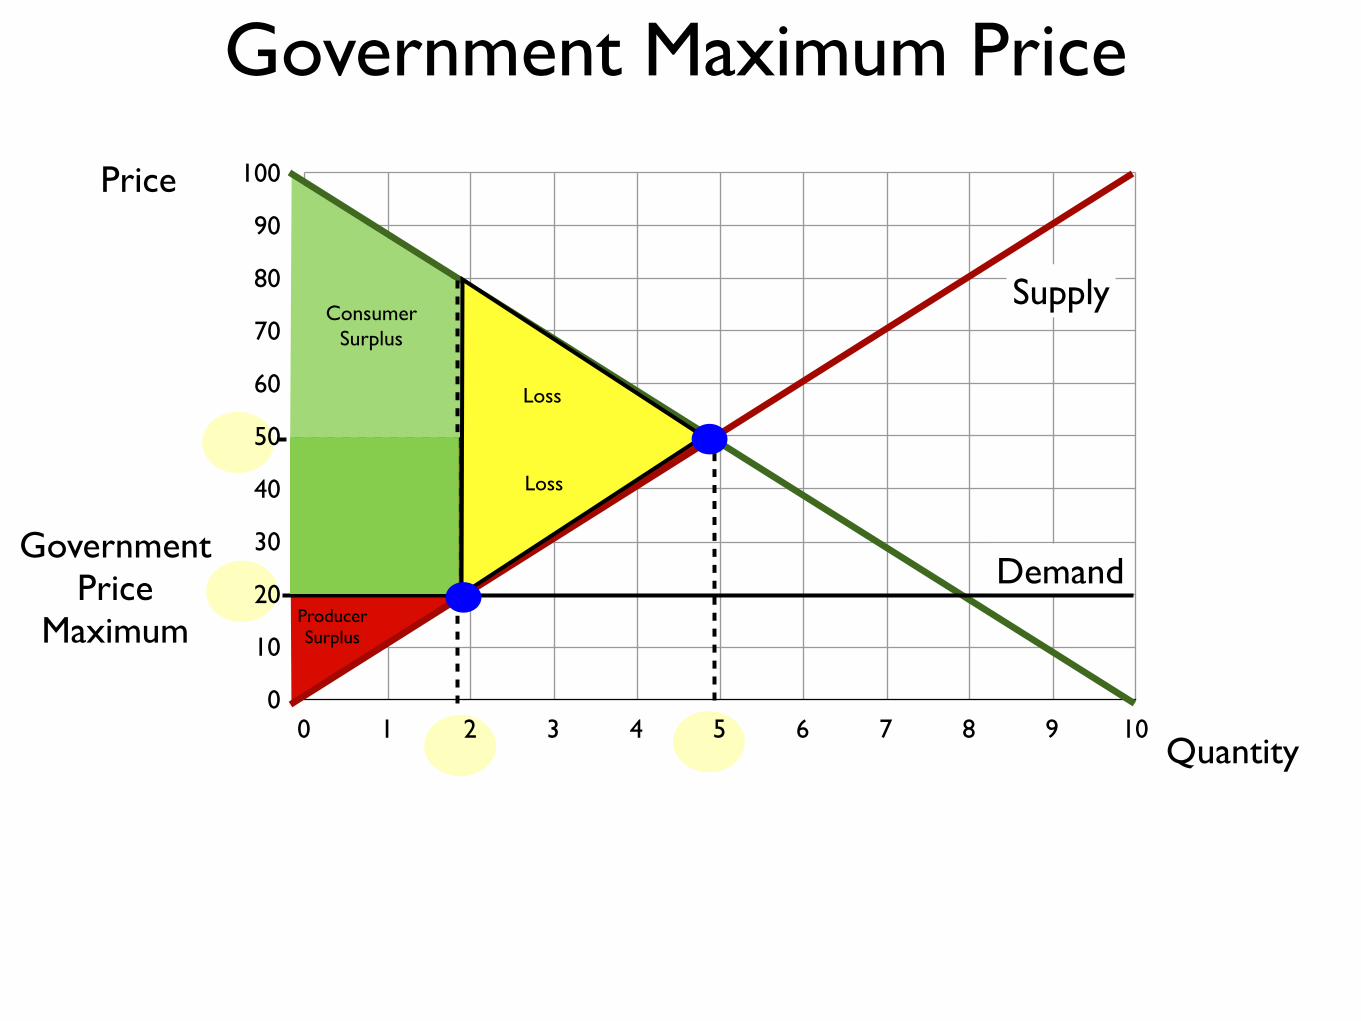
Government Maximum Price
0
10
20
30
40
50
60
70
80
90
100
0 1 2 3 4 5 6 7 8 9 10
Price
Quantity
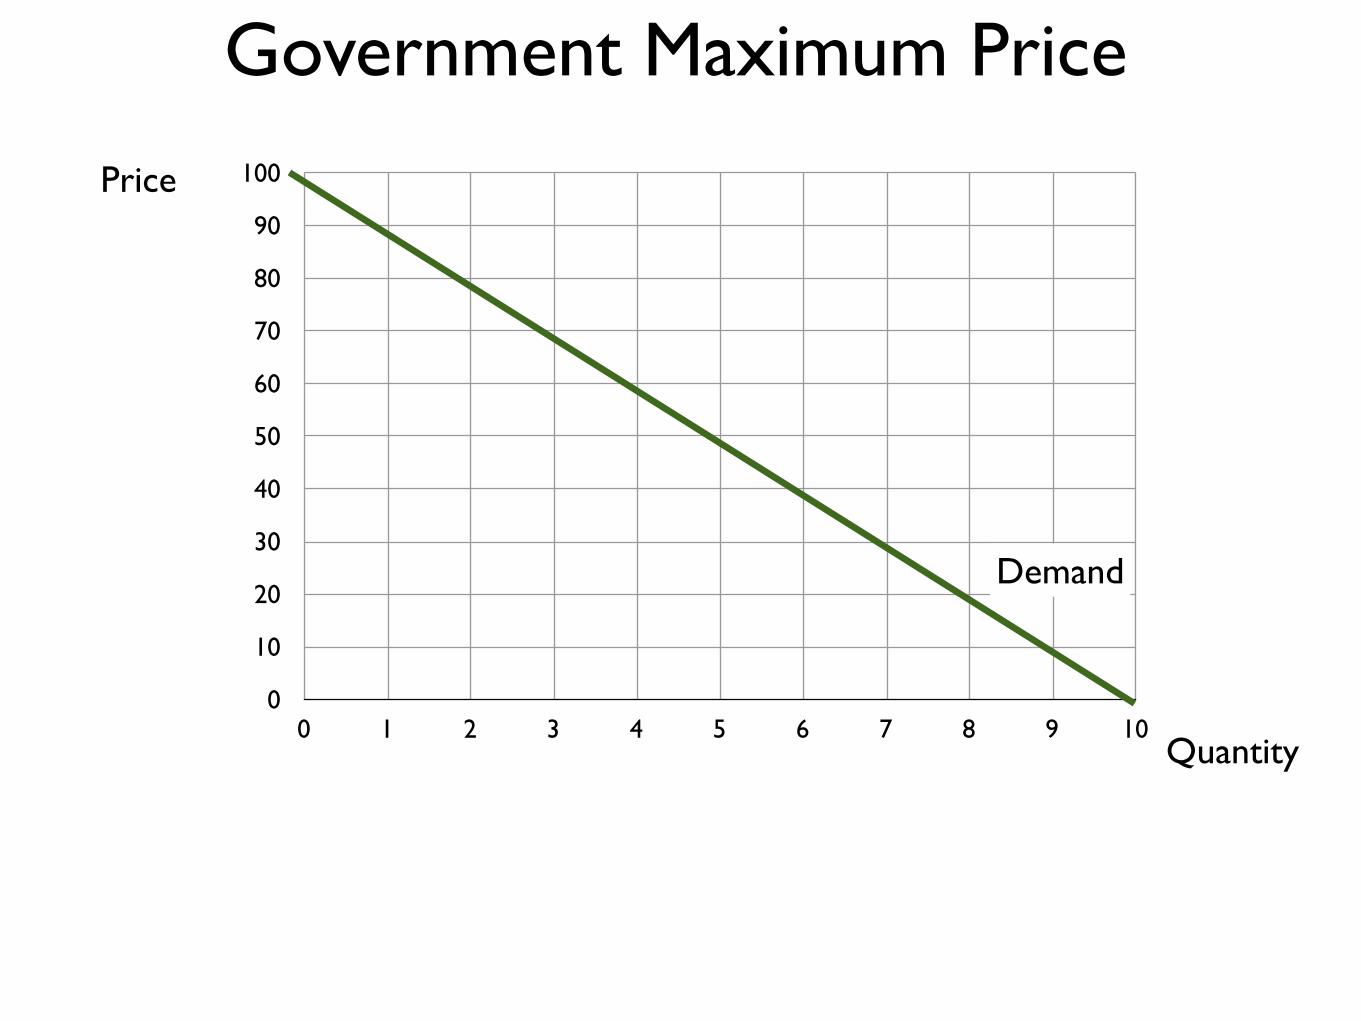
Demand
Government Maximum Price
0
10
20
30
40
50
60
70
80
90
100
0 1 2 3 4 5 6 7 8 9 10
Price
Quantity
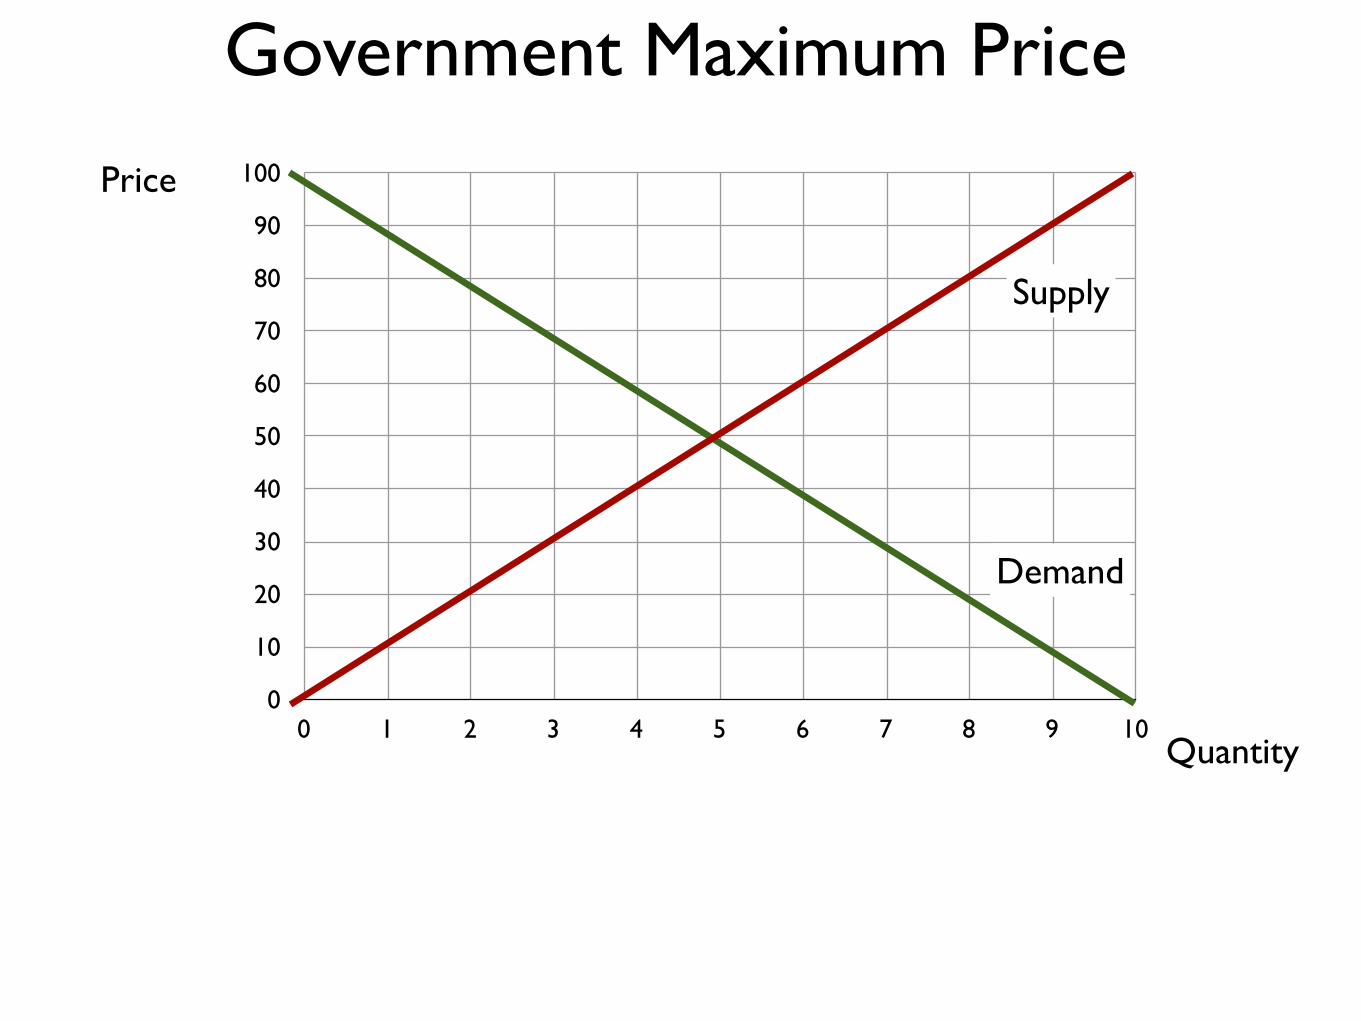
Demand
Supply
Government Maximum Price
0
10
20
30
40
50
60
70
80
90
100
0 1 2 3 4 5 6 7 8 9 10
Price
Quantity
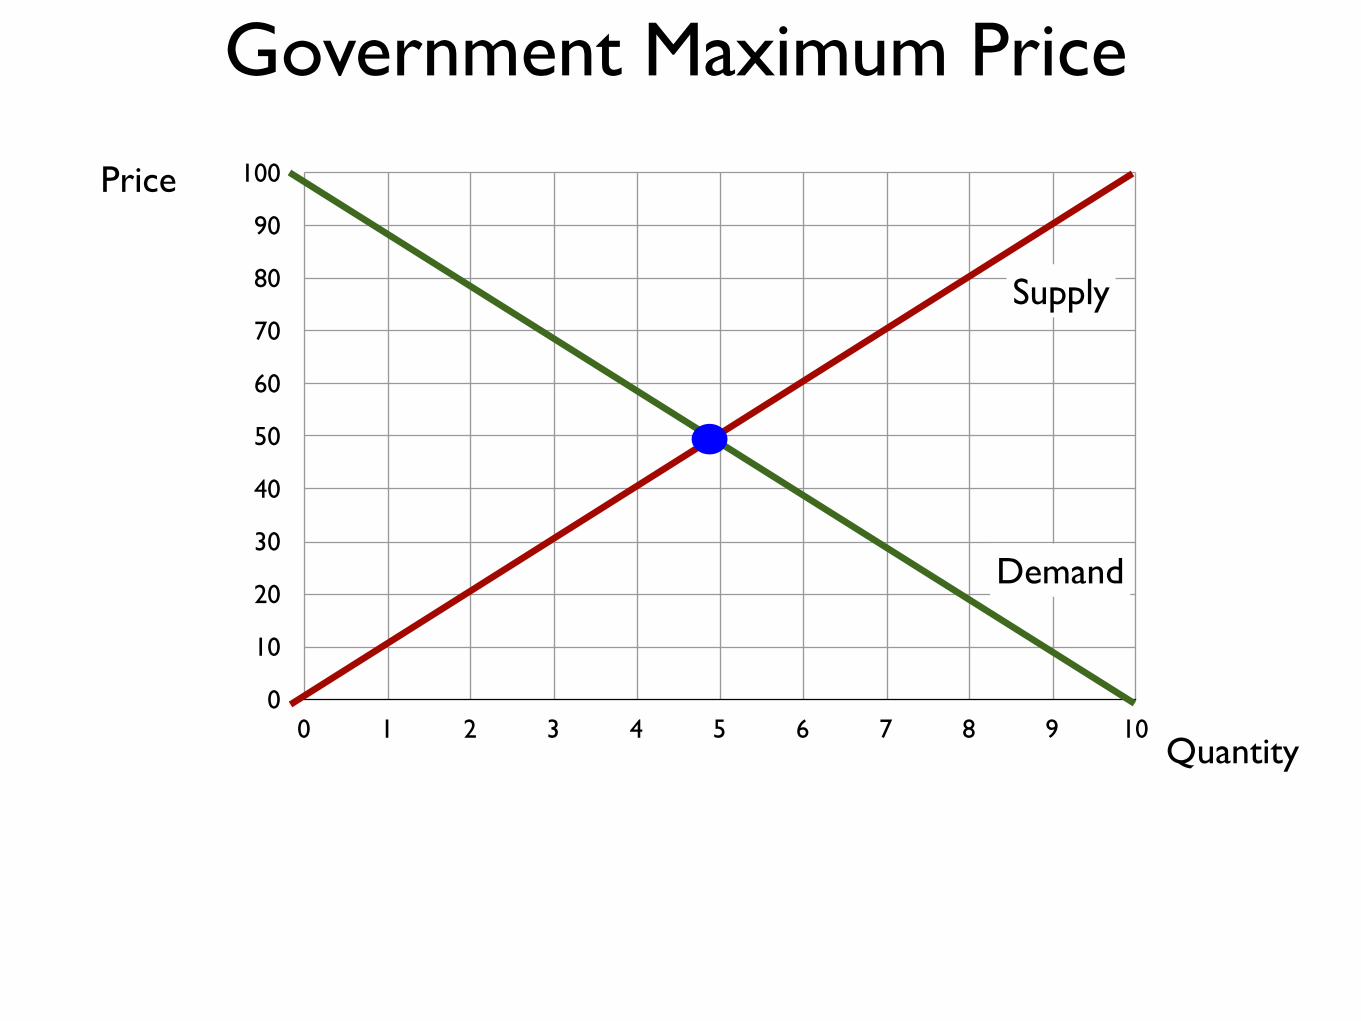
Demand
Supply
Government Maximum Price

0
10
20
30
40
50
60
70
80
90
100
0 1 2 3 4 5 6 7 8 9 10
Price
Quantity
Demand
Supply
Government Maximum Price
0
10
20
30
40
50
60
70
80
90
100
0 1 2 3 4 5 6 7 8 9 10
Price
Quantity
Demand
Supply
Government Maximum Price
0
10
20
30
40
50
60
70
80
90
100
0 1 2 3 4 5 6 7 8 9 10
Price
Quantity
Demand
Supply
Government Maximum Price
0
10
20
30
40
50
60
70
80
90
100
0 1 2 3 4 5 6 7 8 9 10
Price
Quantity
Demand
Supply
Government Maximum Price
0
10
20
30
40
50
60
70
80
90
100
0 1 2 3 4 5 6 7 8 9 10
Price
Quantity
Demand
Supply
Government Maximum Price
0
10
20
30
40
50
60
70
80
90
100
0 1 2 3 4 5 6 7 8 9 10
Price
Quantity
Demand
SupplyConsumer
Surplus
Government Maximum Price

0
10
20
30
40
50
60
70
80
90
100
0 1 2 3 4 5 6 7 8 9 10
Price
Quantity
Demand
SupplyConsumer
Surplus
Government Maximum Price
0
10
20
30
40
50
60
70
80
90
100
0 1 2 3 4 5 6 7 8 9 10
Price
Quantity
Demand
SupplyConsumer
Surplus
ProducerSurplus
Government Maximum Price

0
10
20
30
40
50
60
70
80
90
100
0 1 2 3 4 5 6 7 8 9 10
Price
Quantity
Demand
SupplyConsumer
Surplus
ProducerSurplus
GovernmentPrice
Maximum
Government Maximum Price
0
10
20
30
40
50
60
70
80
90
100
0 1 2 3 4 5 6 7 8 9 10
Price
Quantity
Demand
SupplyConsumer
Surplus
ProducerSurplus
GovernmentPrice
Maximum
Government Maximum Price

0
10
20
30
40
50
60
70
80
90
100
0 1 2 3 4 5 6 7 8 9 10
Price
Quantity
Demand
SupplyConsumer
Surplus
ProducerSurplus
GovernmentPrice
Maximum
Government Maximum Price
0
10
20
30
40
50
60
70
80
90
100
0 1 2 3 4 5 6 7 8 9 10
Price
Quantity
Demand
SupplyConsumer
Surplus
ProducerSurplus
GovernmentPrice
Maximum
Government Maximum Price

0
10
20
30
40
50
60
70
80
90
100
0 1 2 3 4 5 6 7 8 9 10
Price
Quantity
Demand
SupplyConsumer
Surplus
ProducerSurplus
GovernmentPrice
Maximum
Loss
Government Maximum Price

0
10
20
30
40
50
60
70
80
90
100
0 1 2 3 4 5 6 7 8 9 10
Price
Quantity
Demand
SupplyConsumer
Surplus
ProducerSurplus
GovernmentPrice
Maximum
Loss
Loss
Government Maximum Price

0
10
20
30
40
50
60
70
80
90
100
0 1 2 3 4 5 6 7 8 9 10
Price
Quantity
Demand
SupplyConsumer
Surplus
ProducerSurplus
GovernmentPrice
Maximum
Loss
Loss
Government Maximum Price

0
10
20
30
40
50
60
70
80
90
100
0 1 2 3 4 5 6 7 8 9 10
Price
Quantity
Demand
SupplyConsumer
Surplus
ProducerSurplus
GovernmentPrice
Maximum
Loss
Loss
Government Maximum Price
0
10
20
30
40
50
60
70
80
90
100
0 1 2 3 4 5 6 7 8 9 10
Price
Quantity
Demand
SupplyConsumer
Surplus
ProducerSurplus
GovernmentPrice
Maximum
Loss
Loss
Government Maximum Price
0
10
20
30
40
50
60
70
80
90
100
0 1 2 3 4 5 6 7 8 9 10
Price
Quantity
Demand
SupplyConsumer
Surplus
ProducerSurplus
GovernmentPrice
Maximum
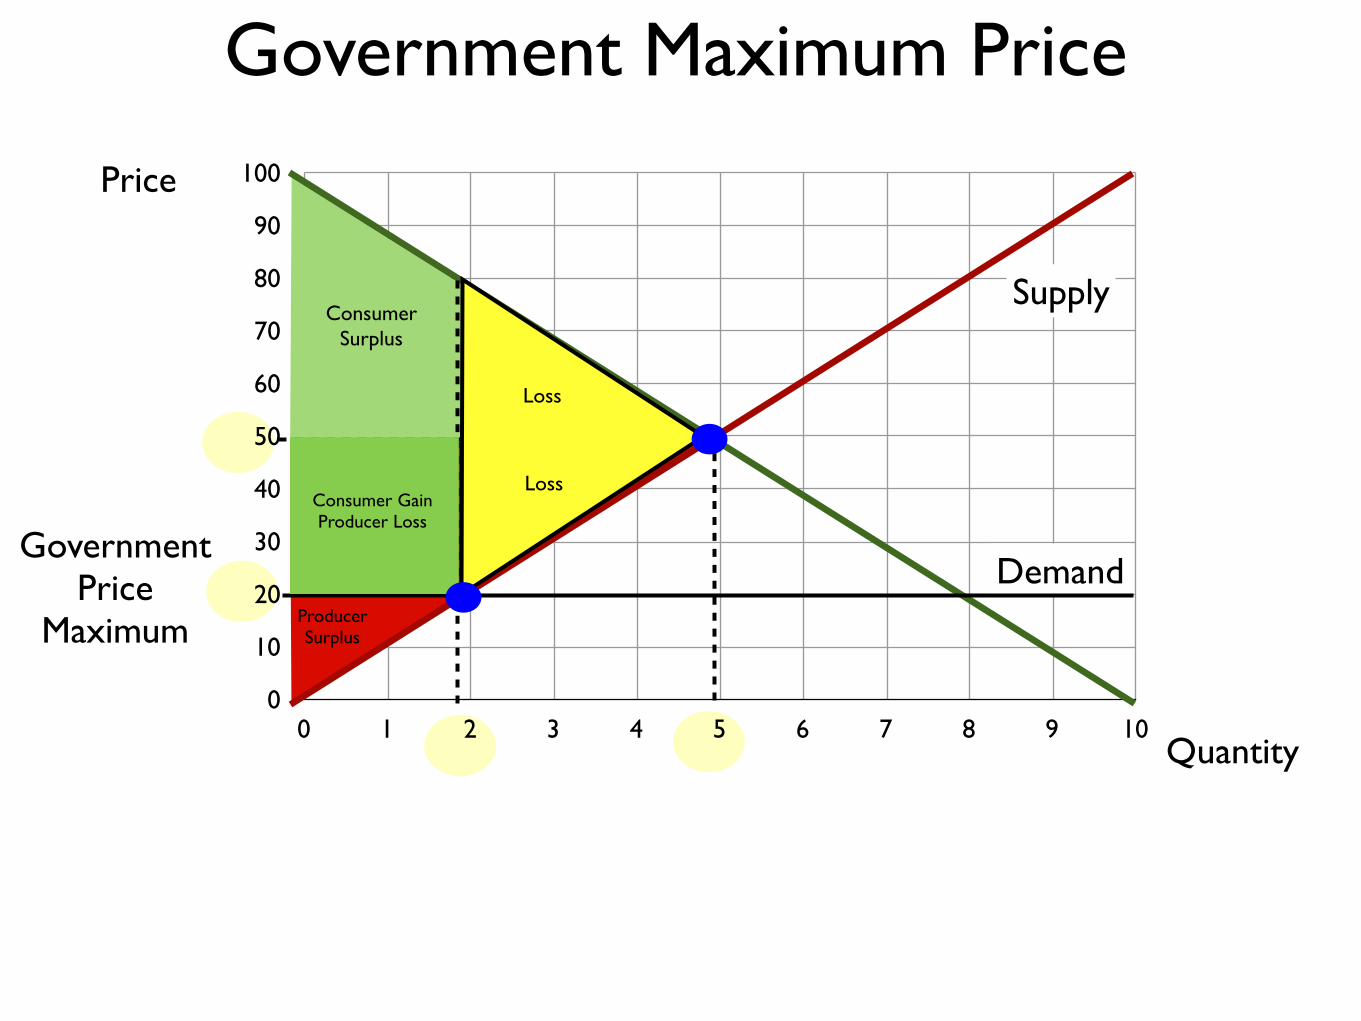
Consumer GainProducer Loss
Loss
Loss
Government Maximum Price
0
10
20
30
40
50
60
70
80
90
100
0 1 2 3 4 5 6 7 8 9 10
Demand
Supplywith no tax
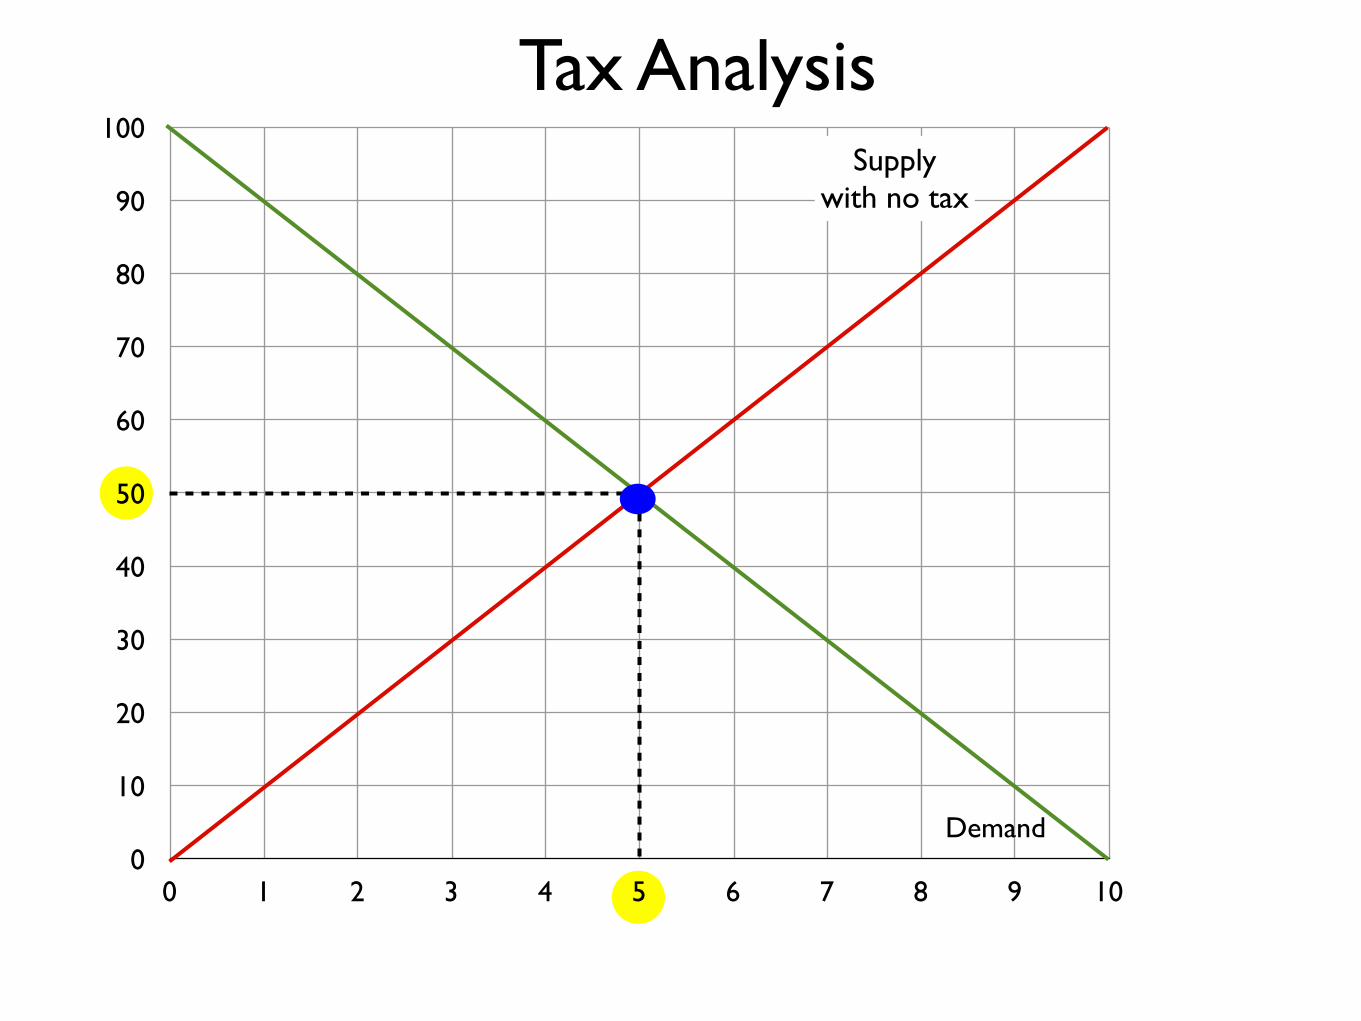
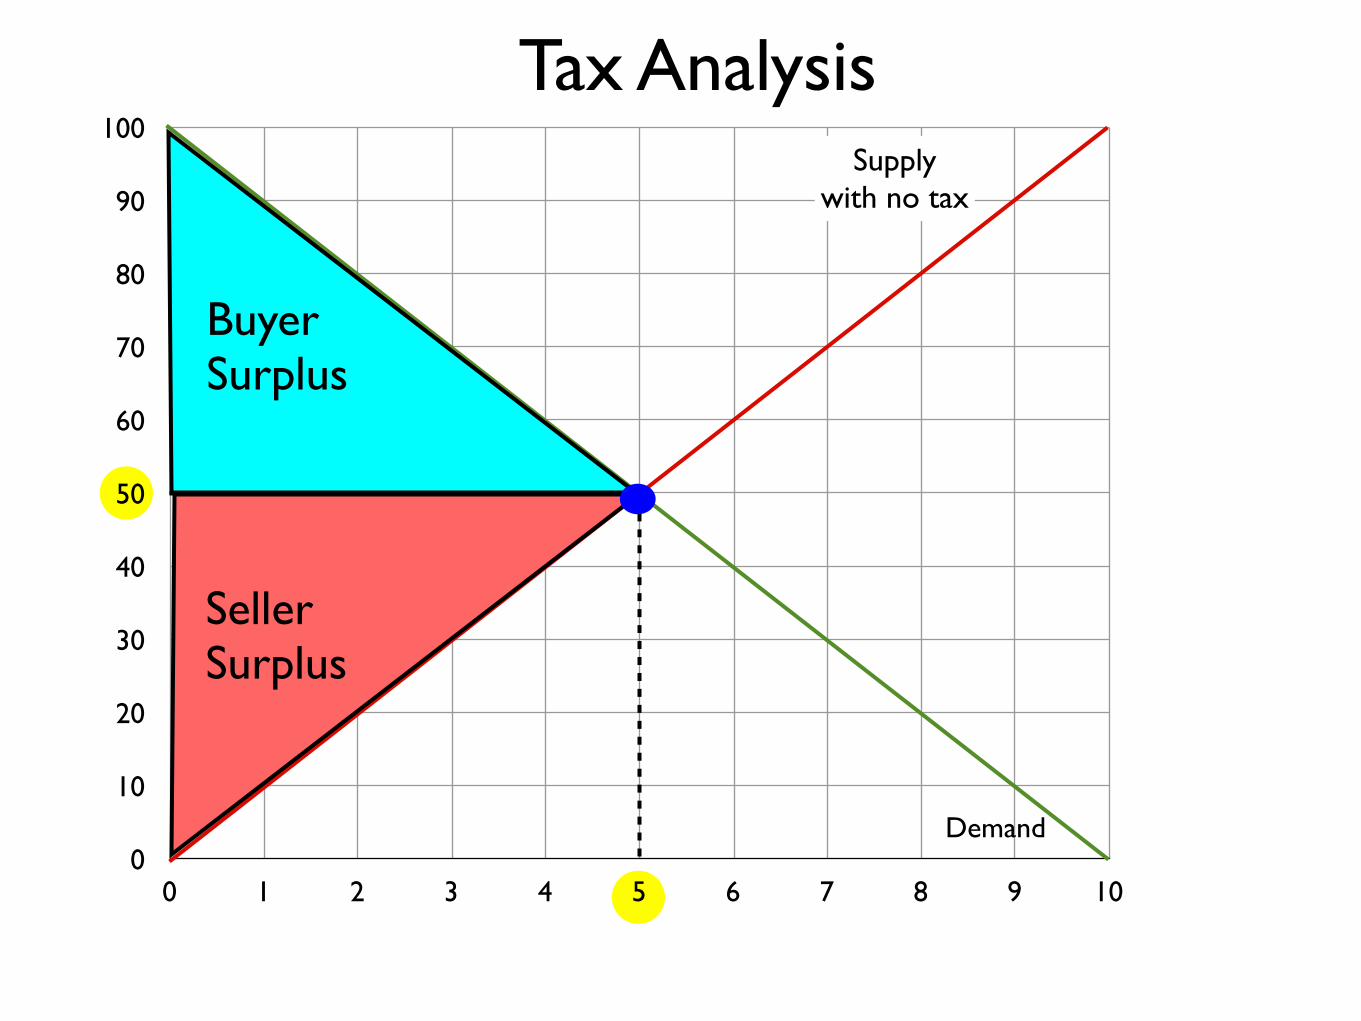
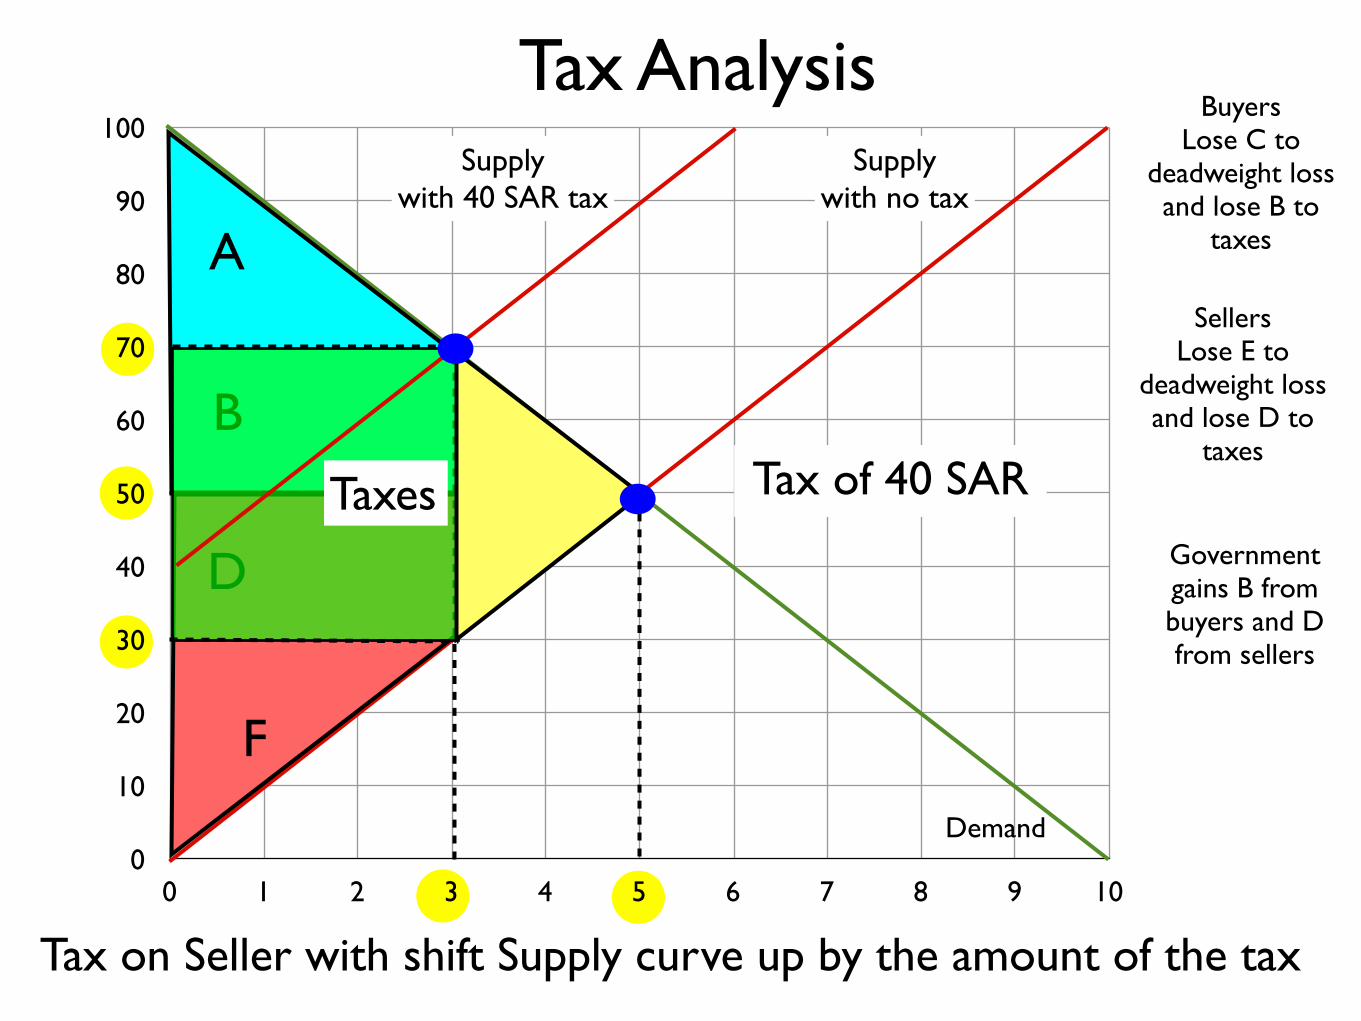
Tax Analysis
0
10
20
30
40
50
60
70
80
90
100
0 1 2 3 4 5 6 7 8 9 10
Demand
Supplywith no tax
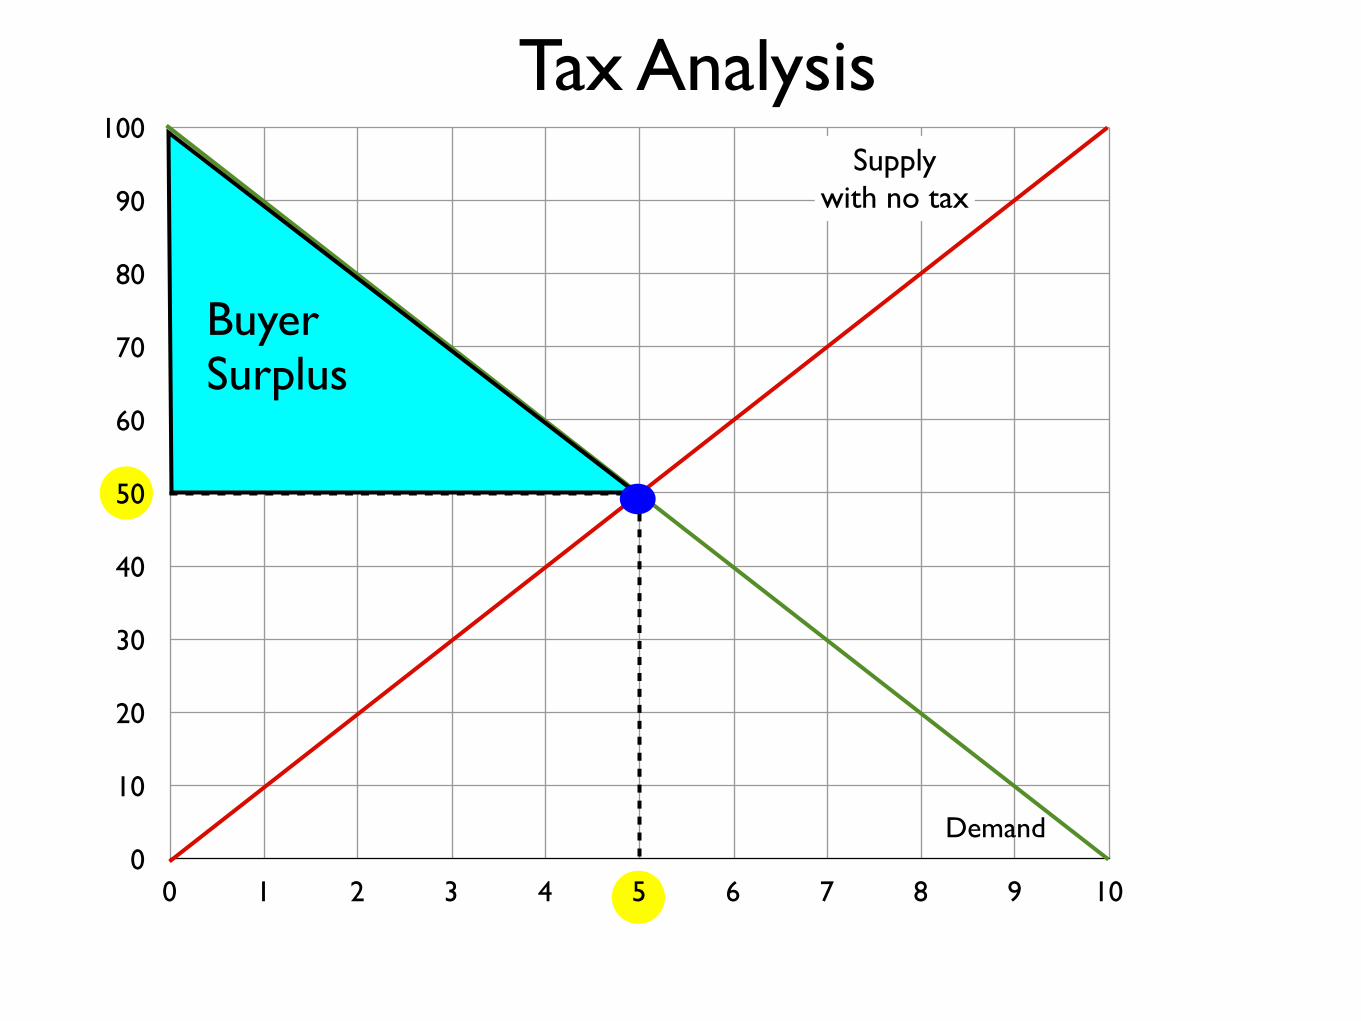
BuyerSurplus
Tax Analysis
0
10
20
30
40
50
60
70
80
90
100
0 1 2 3 4 5 6 7 8 9 10
Demand
Supplywith no tax
BuyerSurplus
SellerSurplus
Tax Analysis
0
10
20
30
40
50
60
70
80
90
100
0 1 2 3 4 5 6 7 8 9 10
Demand
Supplywith no tax
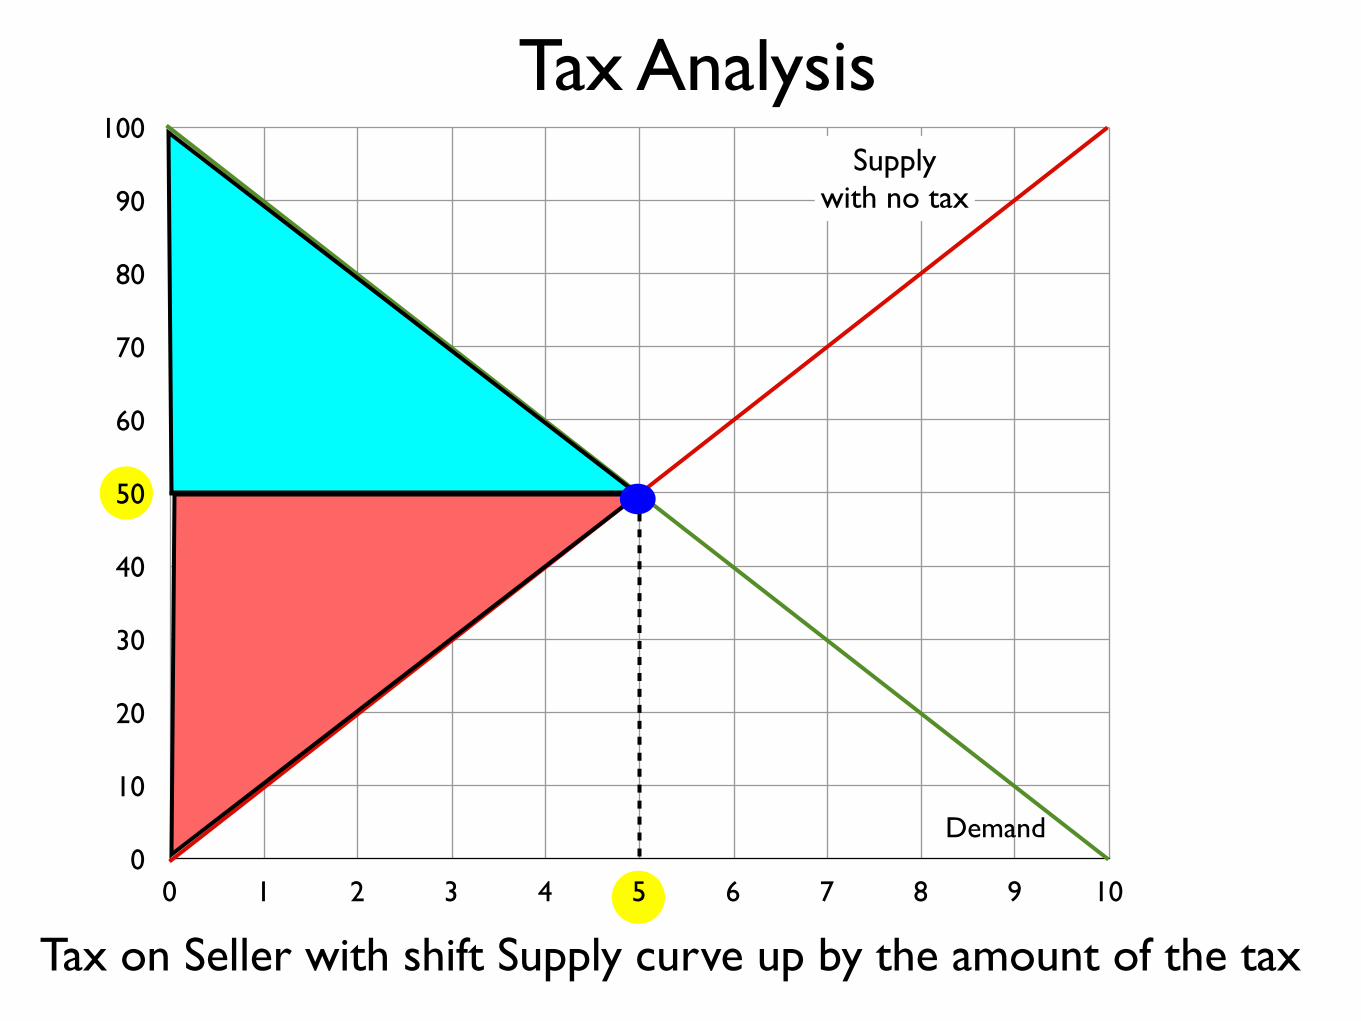
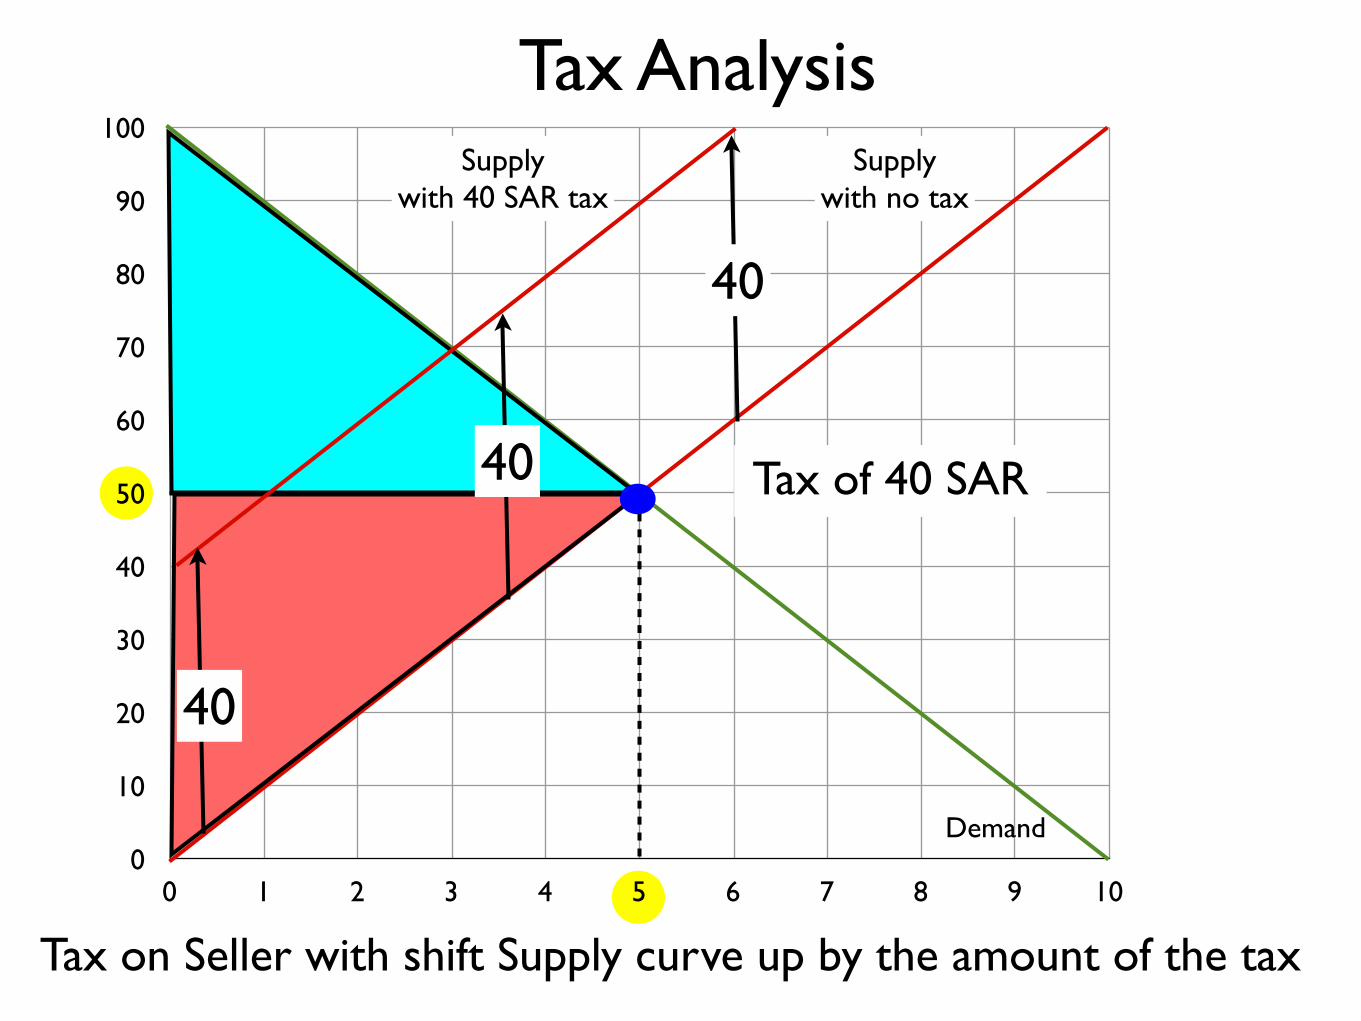
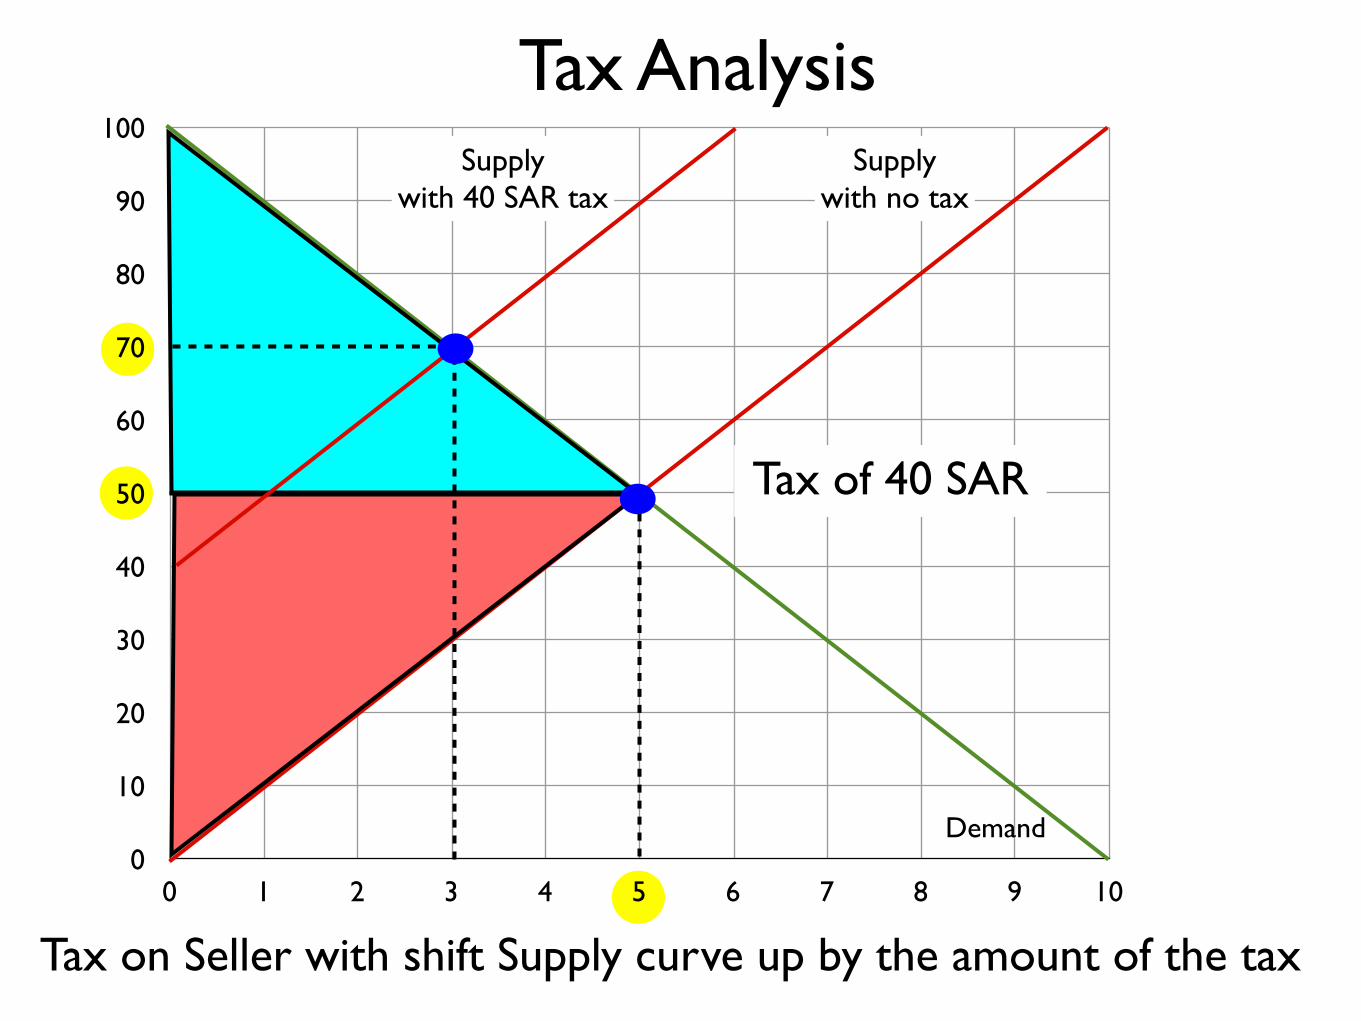
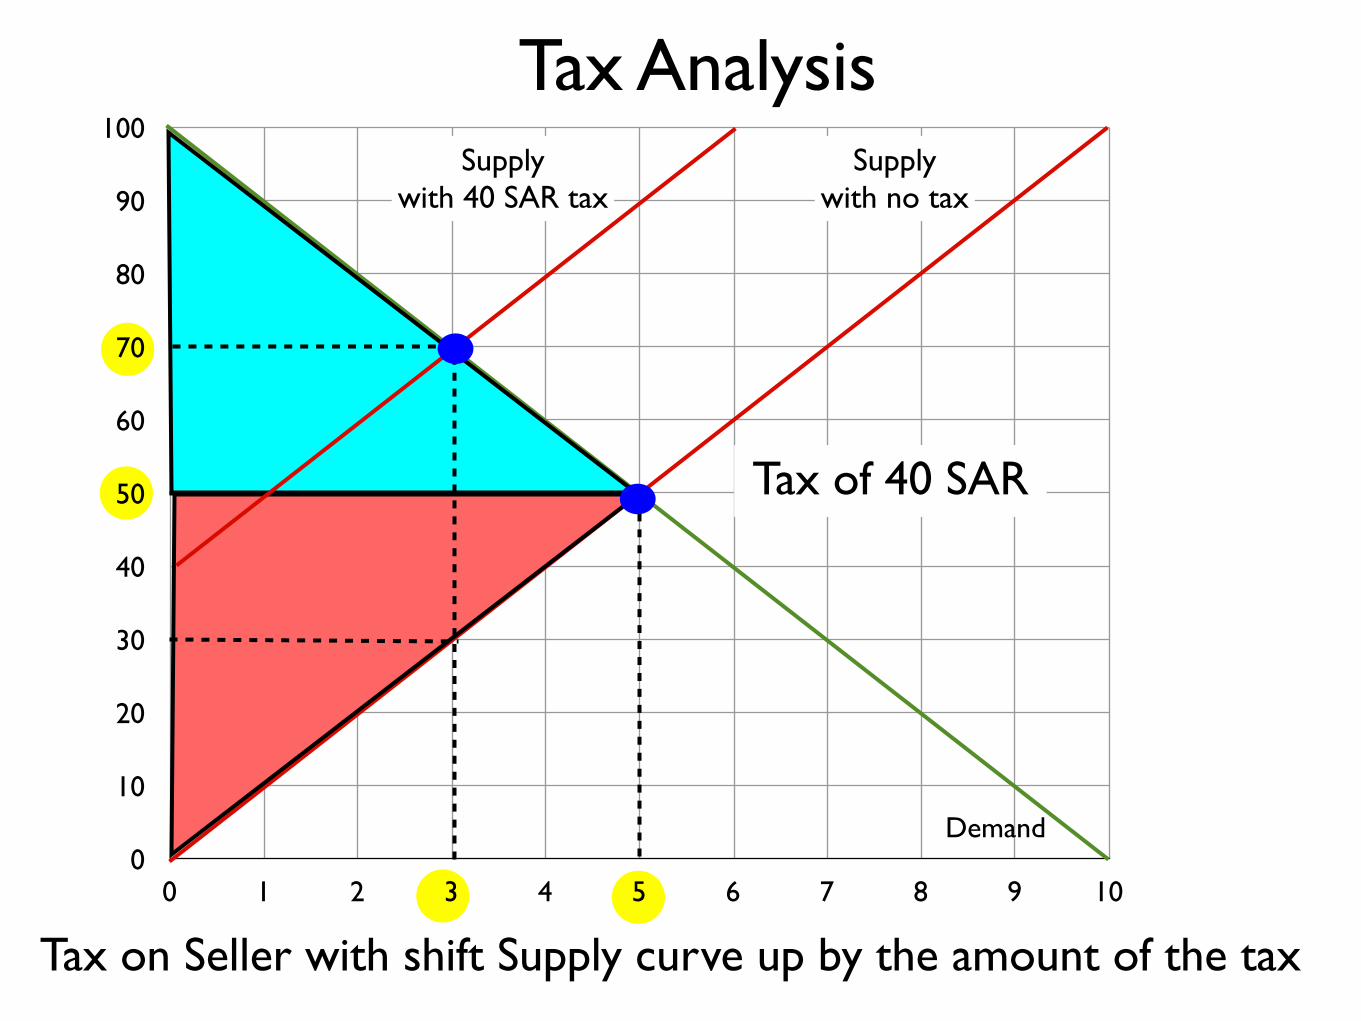
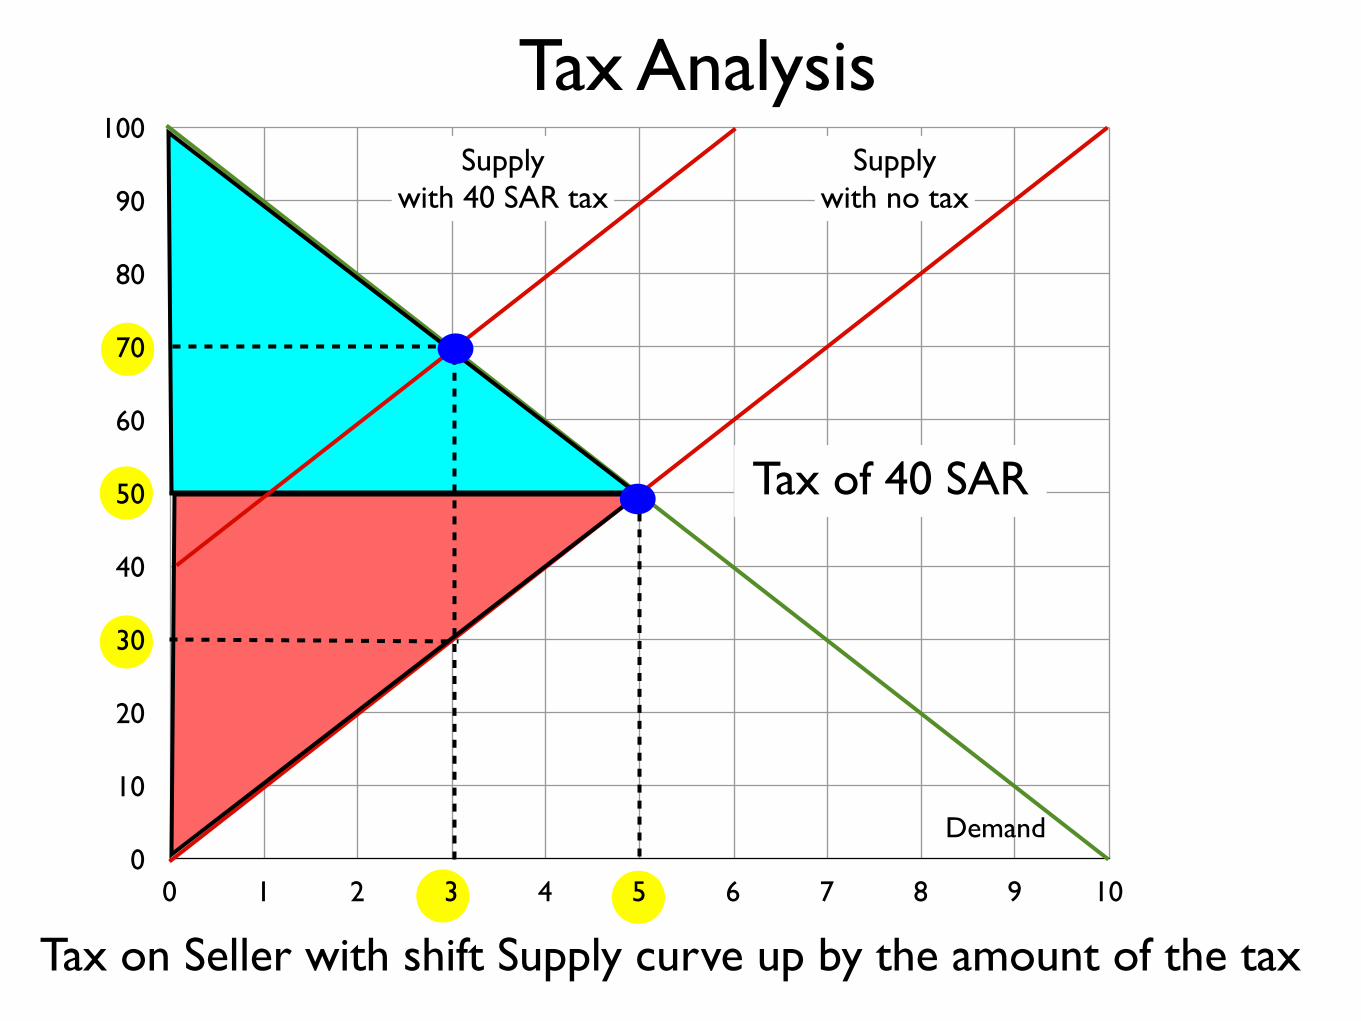
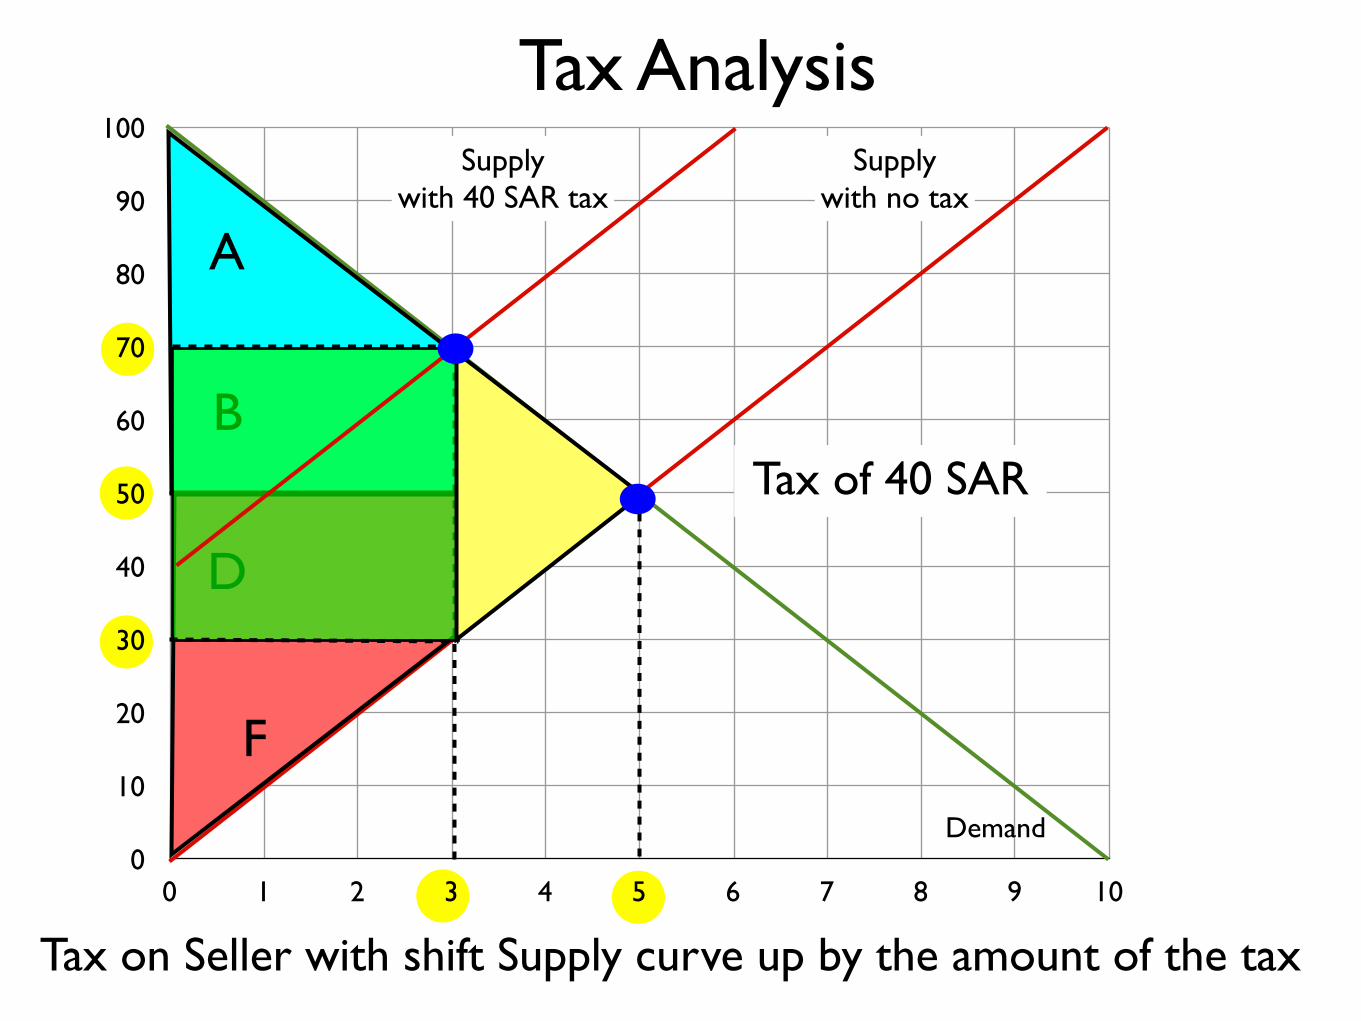
Tax Analysis
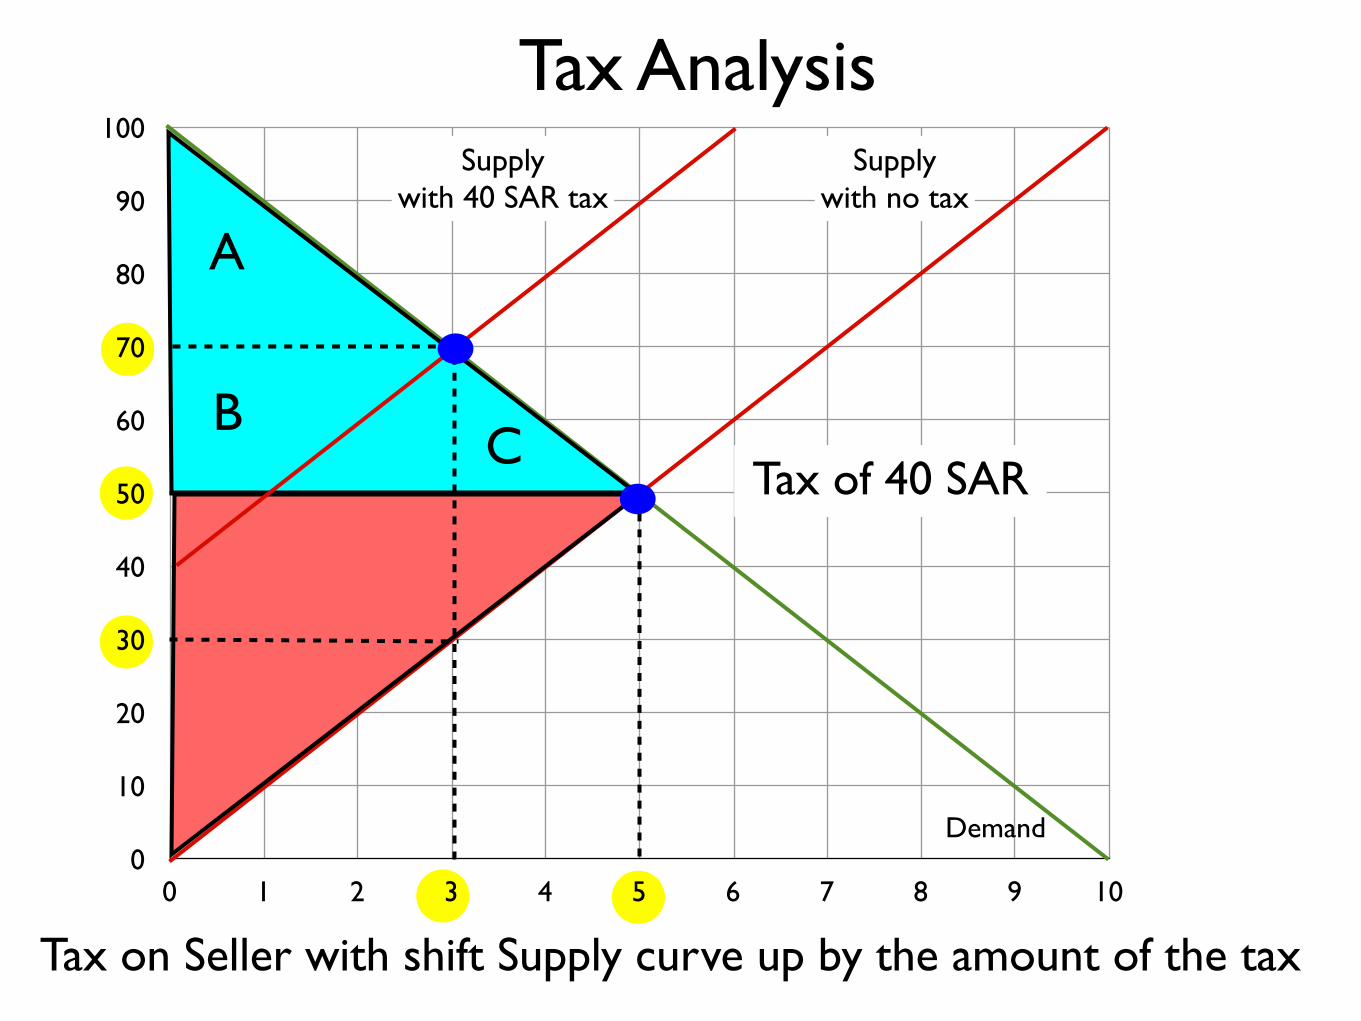
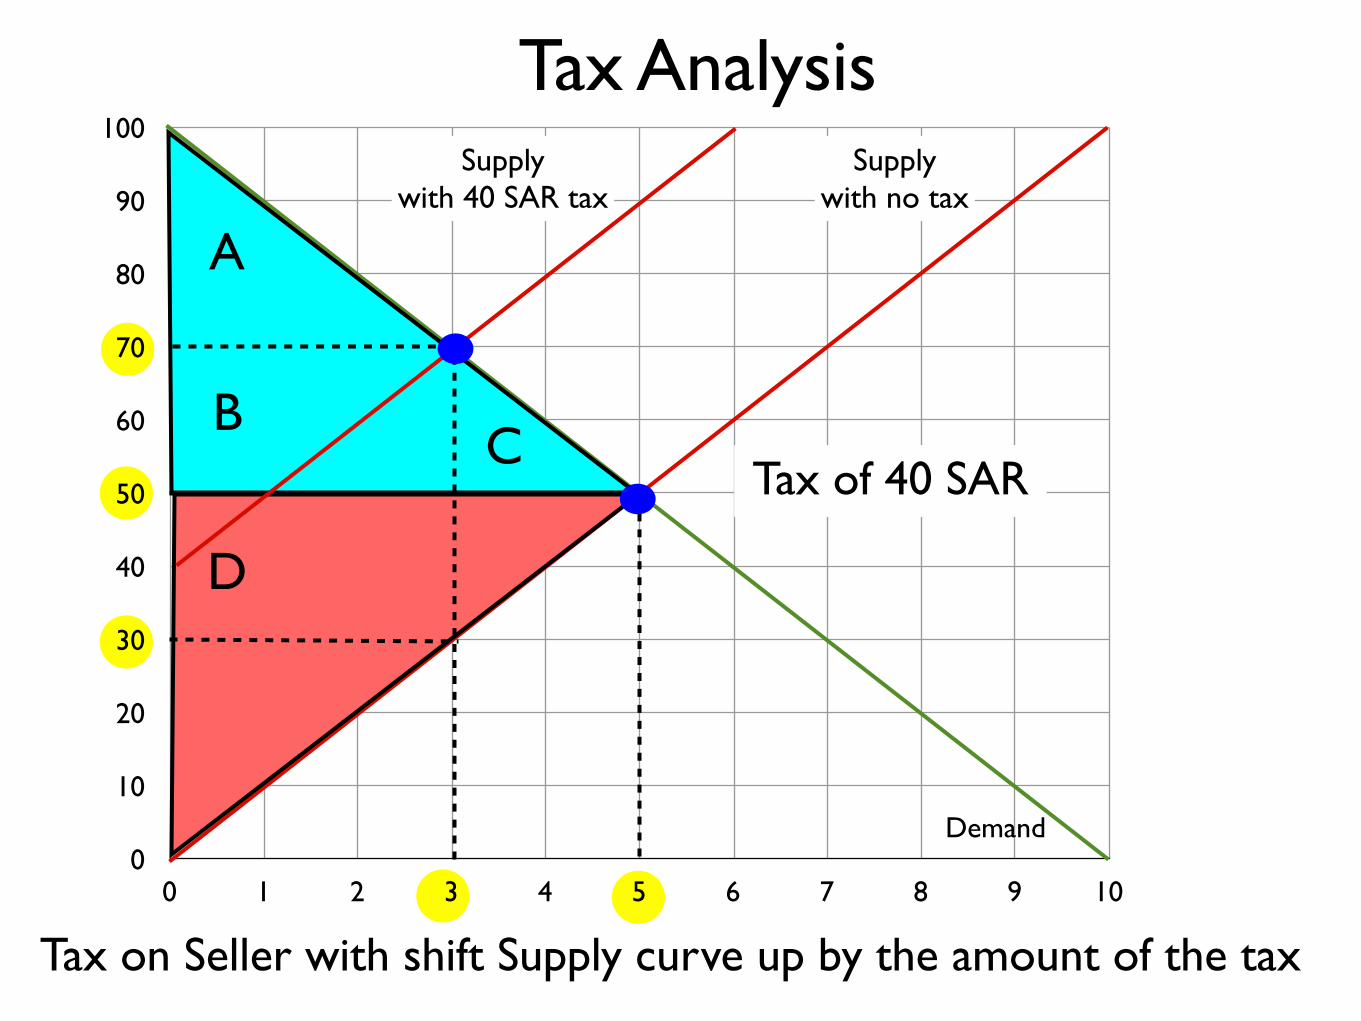
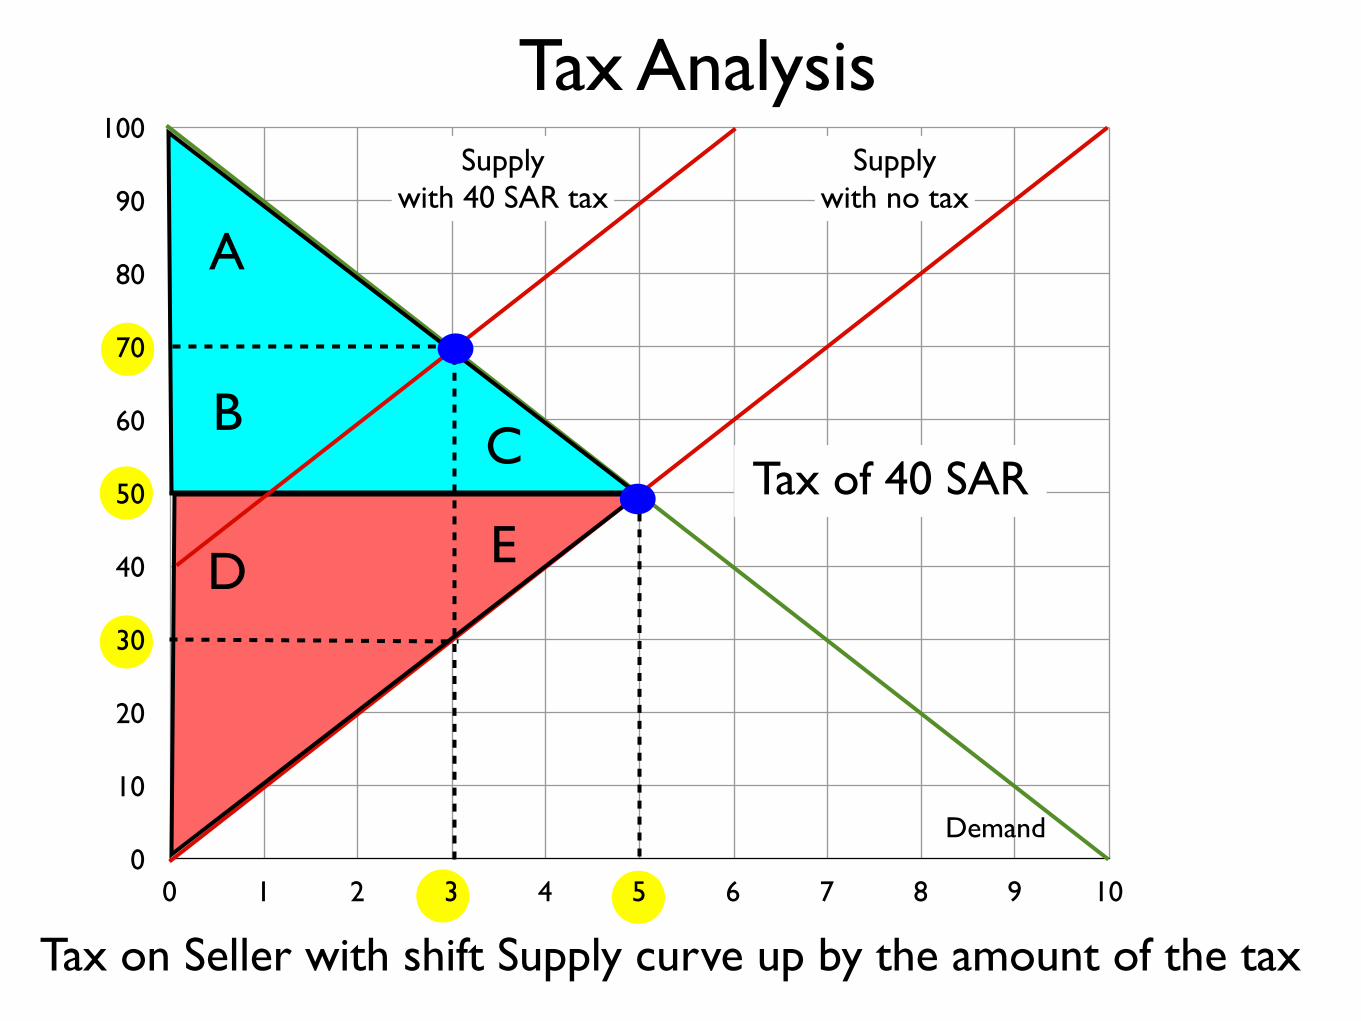
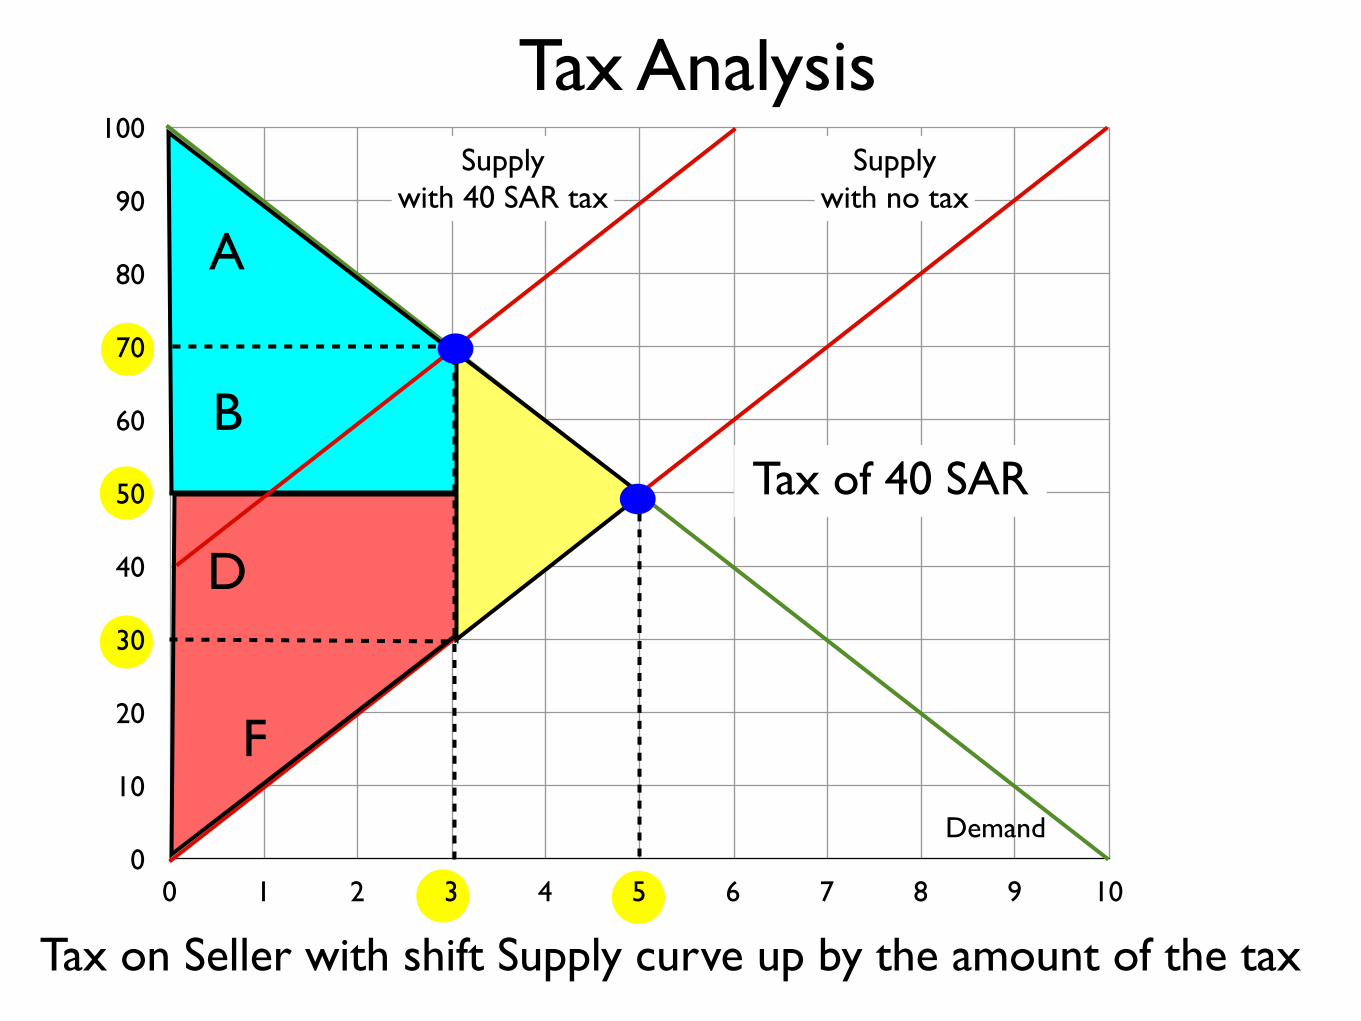
Tax on Seller with shift Supply curve up by the amount of the tax
0
10
20
30
40
50
60
70
80
90
100
0 1 2 3 4 5 6 7 8 9 10
Demand
Supplywith no tax
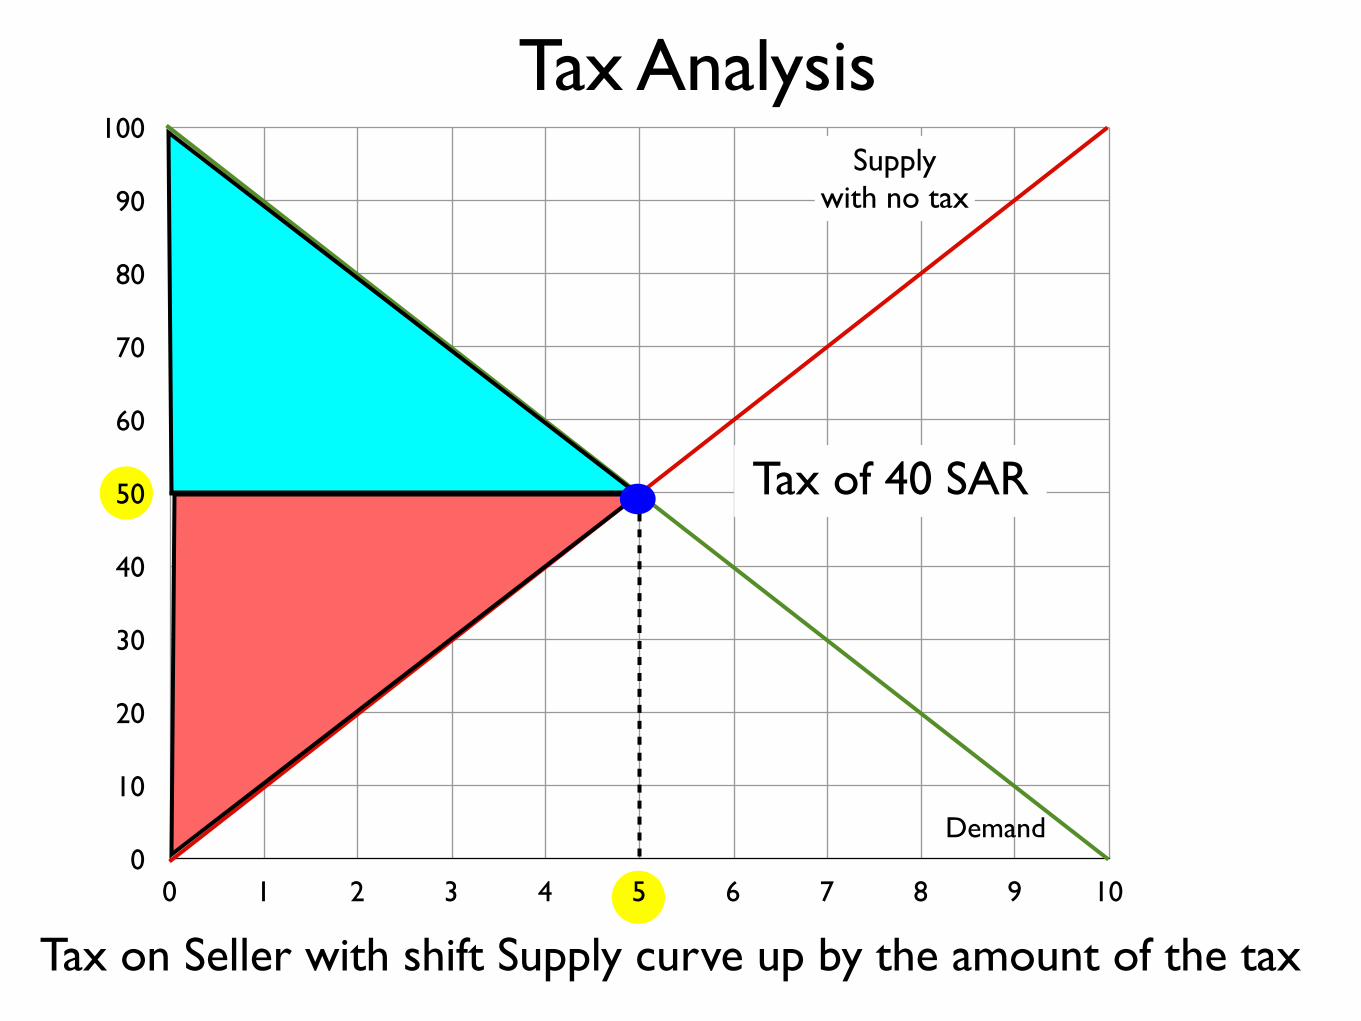
Tax Analysis
Tax on Seller with shift Supply curve up by the amount of the tax
Tax of 40 SAR
0
10
20
30
40
50
60
70
80
90
100
0 1 2 3 4 5 6 7 8 9 10
Demand
Supplywith no tax
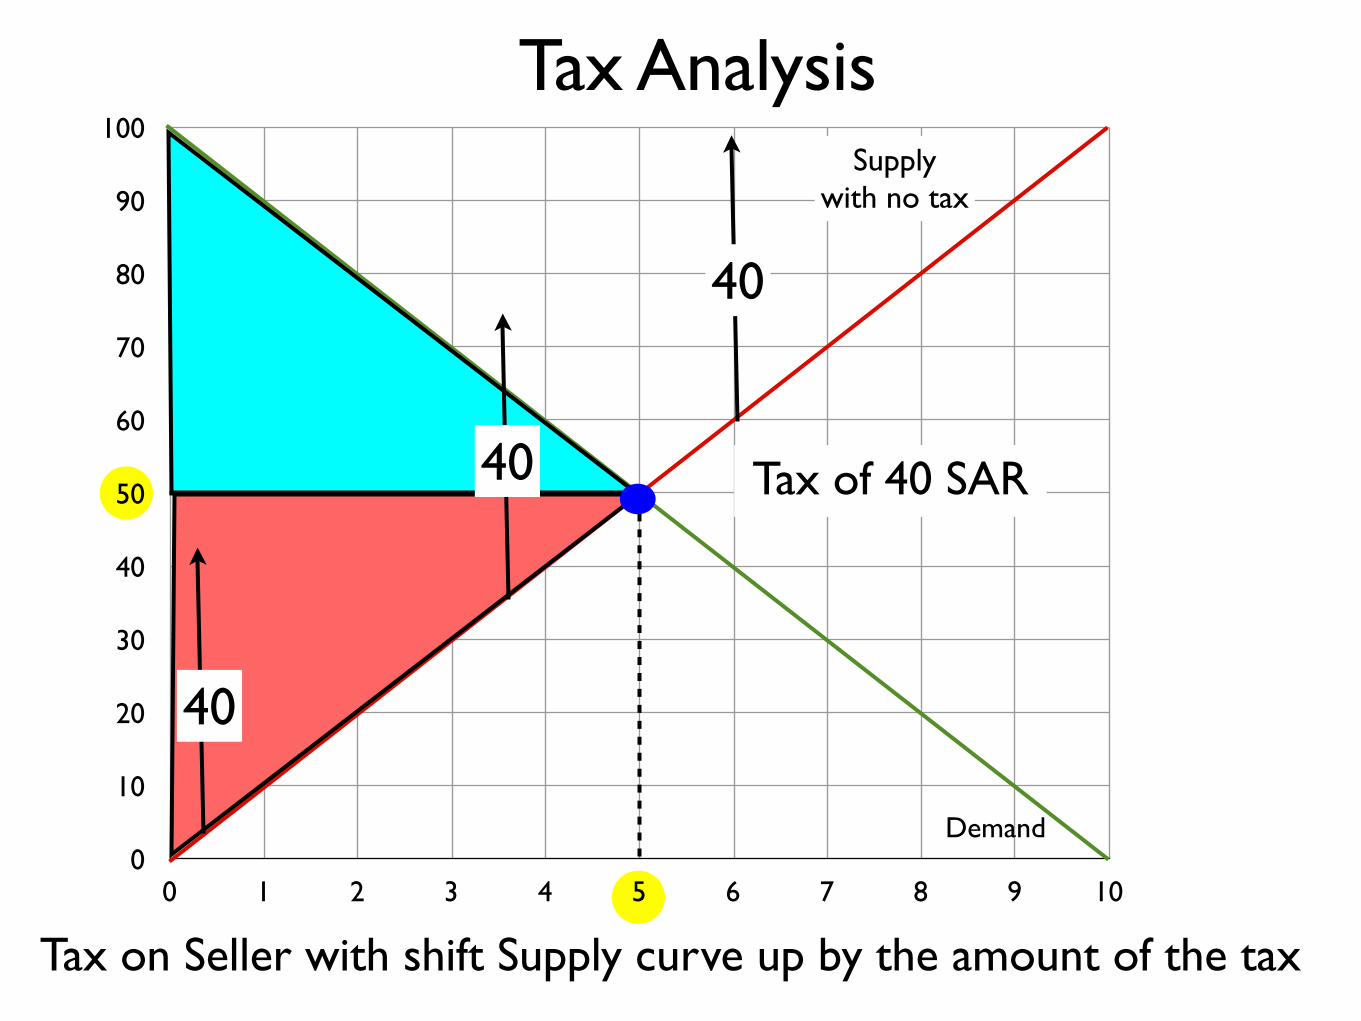
Tax Analysis
Tax on Seller with shift Supply curve up by the amount of the tax
Tax of 40 SAR
40
40
40
0
10
20
30
40
50
60
70
80
90
100
0 1 2 3 4 5 6 7 8 9 10
Demand
Supplywith no tax
Tax AnalysisSupply
with 40 SAR tax
Tax on Seller with shift Supply curve up by the amount of the tax
Tax of 40 SAR
40
40
40

0
10
20
30
40
50
60
70
80
90
100
0 1 2 3 4 5 6 7 8 9 10
Demand
Supplywith no tax
Tax AnalysisSupply
with 40 SAR tax
Tax on Seller with shift Supply curve up by the amount of the tax
Tax of 40 SAR

0
10
20
30
40
50
60
70
80
90
100
0 1 2 3 4 5 6 7 8 9 10
Demand
Supplywith no tax
Tax AnalysisSupply
with 40 SAR tax
Tax on Seller with shift Supply curve up by the amount of the tax
Tax of 40 SAR

0
10
20
30
40
50
60
70
80
90
100
0 1 2 3 4 5 6 7 8 9 10
Demand
Supplywith no tax
Tax AnalysisSupply
with 40 SAR tax
Tax on Seller with shift Supply curve up by the amount of the tax
Tax of 40 SAR

0
10
20
30
40
50
60
70
80
90
100
0 1 2 3 4 5 6 7 8 9 10
Demand
Supplywith no tax
Tax AnalysisSupply
with 40 SAR tax
Tax on Seller with shift Supply curve up by the amount of the tax
Tax of 40 SAR
0
10
20
30
40
50
60
70
80
90
100
0 1 2 3 4 5 6 7 8 9 10
Demand
Supplywith no tax
Tax AnalysisSupply
with 40 SAR tax
Tax on Seller with shift Supply curve up by the amount of the tax
Tax of 40 SAR

0
10
20
30
40
50
60
70
80
90
100
0 1 2 3 4 5 6 7 8 9 10
Demand
Supplywith no tax
Tax AnalysisSupply
with 40 SAR tax
Tax on Seller with shift Supply curve up by the amount of the tax
Tax of 40 SAR
0
10
20
30
40
50
60
70
80
90
100
0 1 2 3 4 5 6 7 8 9 10
Demand
Supplywith no tax
Tax AnalysisSupply
with 40 SAR tax
Tax on Seller with shift Supply curve up by the amount of the tax
Tax of 40 SAR
0
10
20
30
40
50
60
70
80
90
100
0 1 2 3 4 5 6 7 8 9 10
Demand
Supplywith no tax
Tax AnalysisSupply
with 40 SAR tax
Tax on Seller with shift Supply curve up by the amount of the tax
Tax of 40 SAR

0
10
20
30
40
50
60
70
80
90
100
0 1 2 3 4 5 6 7 8 9 10
Demand
Supplywith no tax
A
Tax AnalysisSupply
with 40 SAR tax
Tax on Seller with shift Supply curve up by the amount of the tax
Tax of 40 SAR

0
10
20
30
40
50
60
70
80
90
100
0 1 2 3 4 5 6 7 8 9 10
Demand
Supplywith no tax
A
B
Tax AnalysisSupply
with 40 SAR tax
Tax on Seller with shift Supply curve up by the amount of the tax
Tax of 40 SAR
0
10
20
30
40
50
60
70
80
90
100
0 1 2 3 4 5 6 7 8 9 10
Demand
Supplywith no tax
A
BC
Tax AnalysisSupply
with 40 SAR tax
Tax on Seller with shift Supply curve up by the amount of the tax
Tax of 40 SAR
0
10
20
30
40
50
60
70
80
90
100
0 1 2 3 4 5 6 7 8 9 10
Demand
Supplywith no tax
A
BC
D
Tax AnalysisSupply
with 40 SAR tax
Tax on Seller with shift Supply curve up by the amount of the tax
Tax of 40 SAR
0
10
20
30
40
50
60
70
80
90
100
0 1 2 3 4 5 6 7 8 9 10
Demand
Supplywith no tax
A
BC
D E
Tax AnalysisSupply
with 40 SAR tax
Tax on Seller with shift Supply curve up by the amount of the tax
Tax of 40 SAR

0
10
20
30
40
50
60
70
80
90
100
0 1 2 3 4 5 6 7 8 9 10
Demand
Supplywith no tax
A
BC
D E
F
Tax AnalysisSupply
with 40 SAR tax
Tax on Seller with shift Supply curve up by the amount of the tax
Tax of 40 SAR

0
10
20
30
40
50
60
70
80
90
100
0 1 2 3 4 5 6 7 8 9 10
Demand
Supplywith no tax
A
BC
D E
F
Tax AnalysisSupply
with 40 SAR tax
Tax on Seller with shift Supply curve up by the amount of the tax
Tax of 40 SAR
0
10
20
30
40
50
60
70
80
90
100
0 1 2 3 4 5 6 7 8 9 10
Demand
Supplywith no tax
A
BC
D E
F
Tax AnalysisSupply
with 40 SAR tax
Tax on Seller with shift Supply curve up by the amount of the tax
Tax of 40 SAR
0
10
20
30
40
50
60
70
80
90
100
0 1 2 3 4 5 6 7 8 9 10
Demand
Supplywith no tax
A
BC
D E
F
Tax AnalysisSupply
with 40 SAR tax
Tax on Seller with shift Supply curve up by the amount of the tax
Tax of 40 SAR
0
10
20
30
40
50
60
70
80
90
100
0 1 2 3 4 5 6 7 8 9 10
Demand
Supplywith no tax
A
BC
D E
F
Tax AnalysisSupply
with 40 SAR tax
Tax on Seller with shift Supply curve up by the amount of the tax
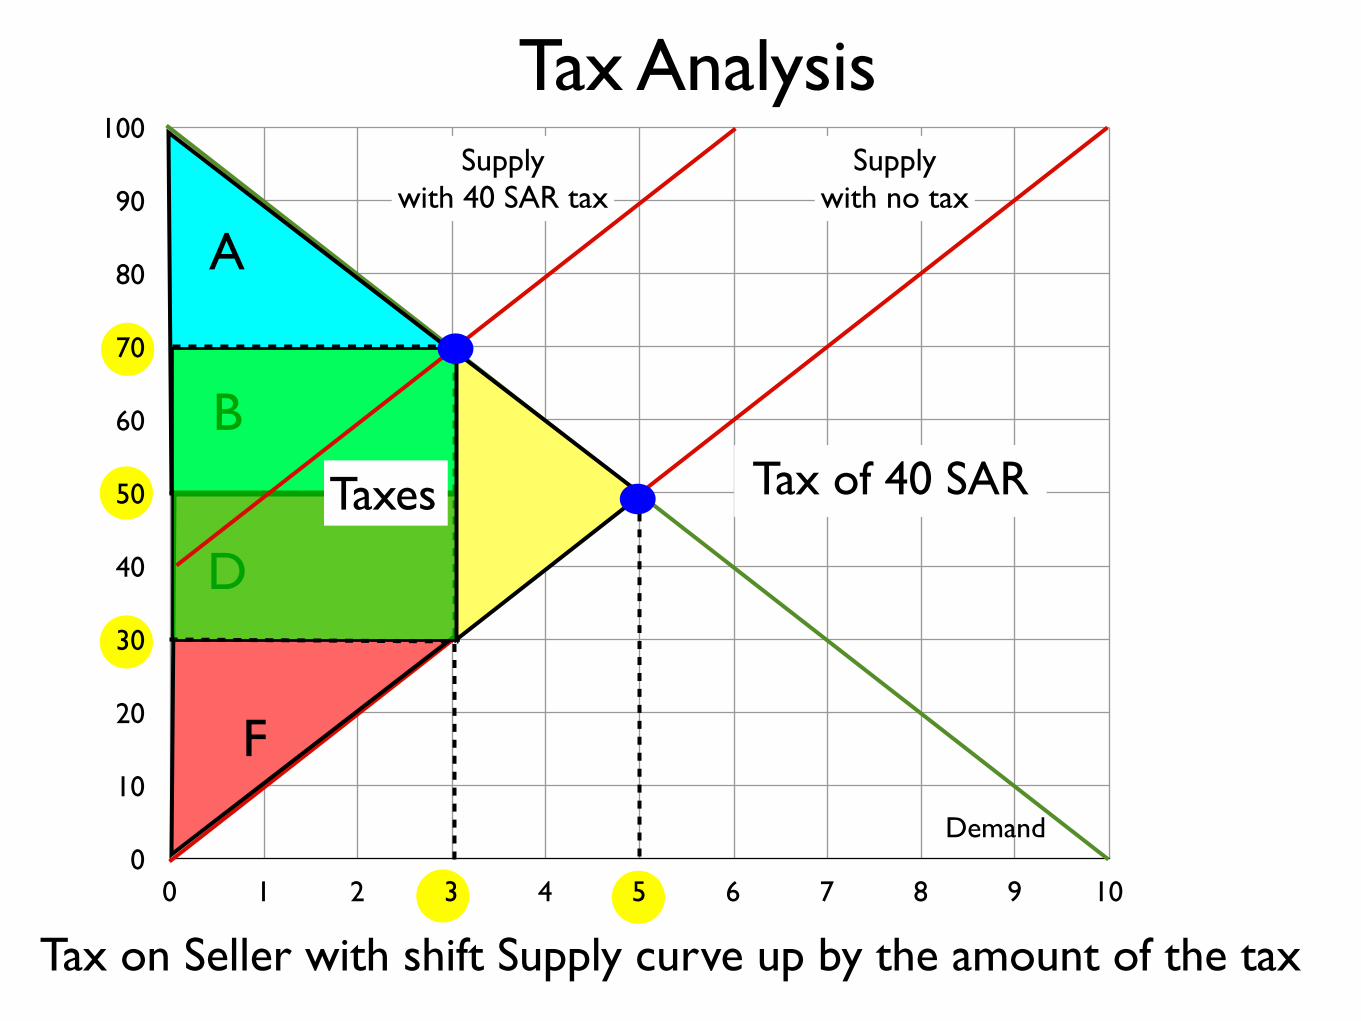
Taxes Tax of 40 SAR
0
10
20
30
40
50
60
70
80
90
100
0 1 2 3 4 5 6 7 8 9 10
Demand
Supplywith no tax
A
BC
D E
F
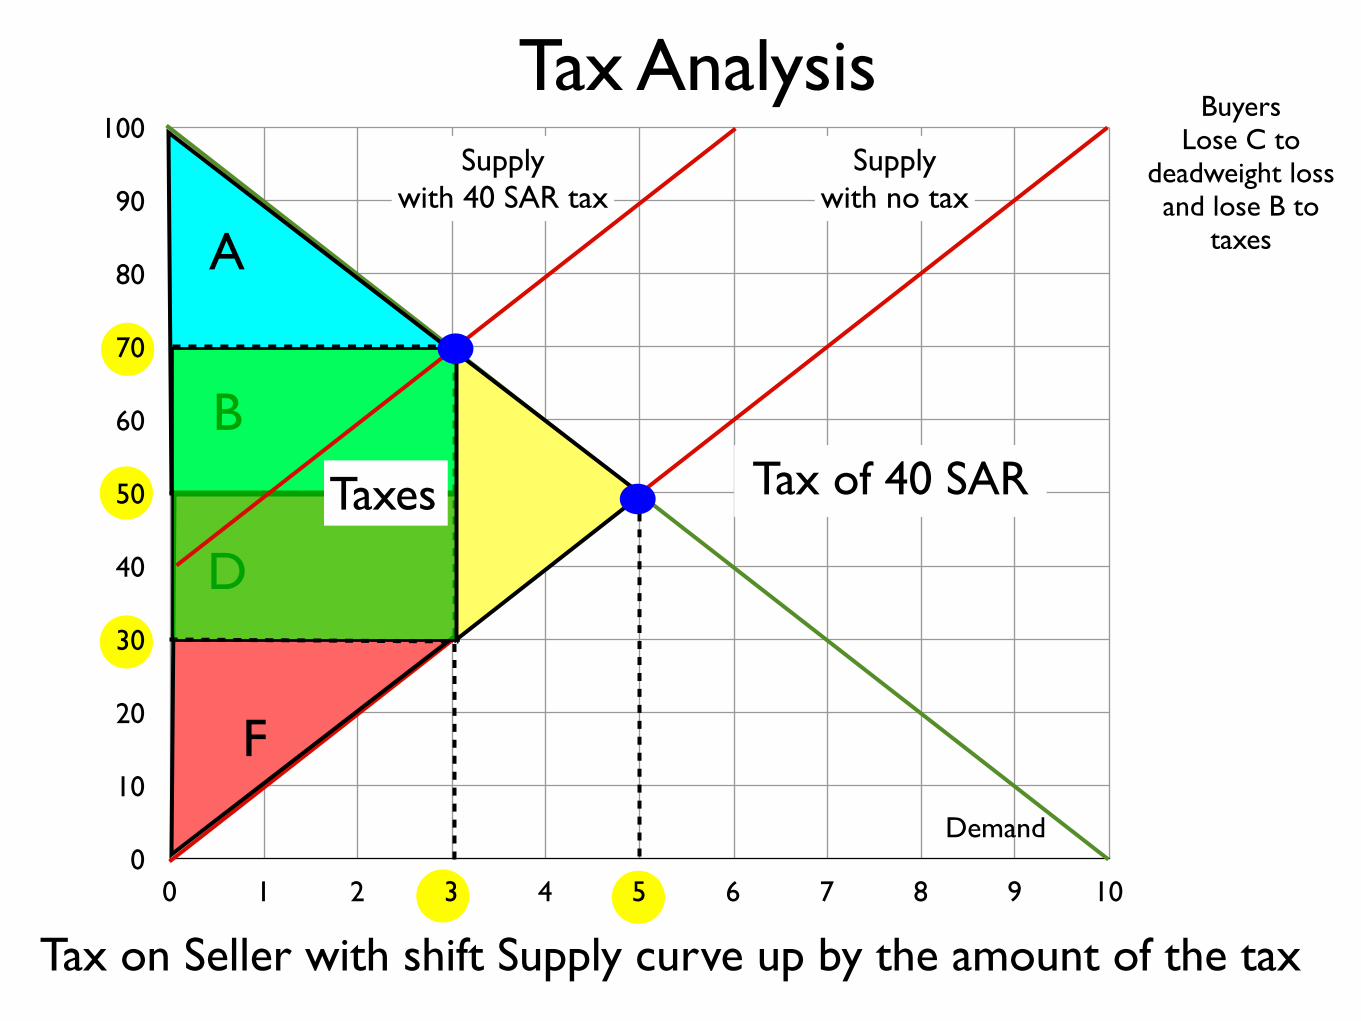
BuyersLose C to
deadweight lossand lose B to
taxes
Tax AnalysisSupply
with 40 SAR tax
Tax on Seller with shift Supply curve up by the amount of the tax
Taxes Tax of 40 SAR
0
10
20
30
40
50
60
70
80
90
100
0 1 2 3 4 5 6 7 8 9 10
Demand
Supplywith no tax
A
BC
D E
F
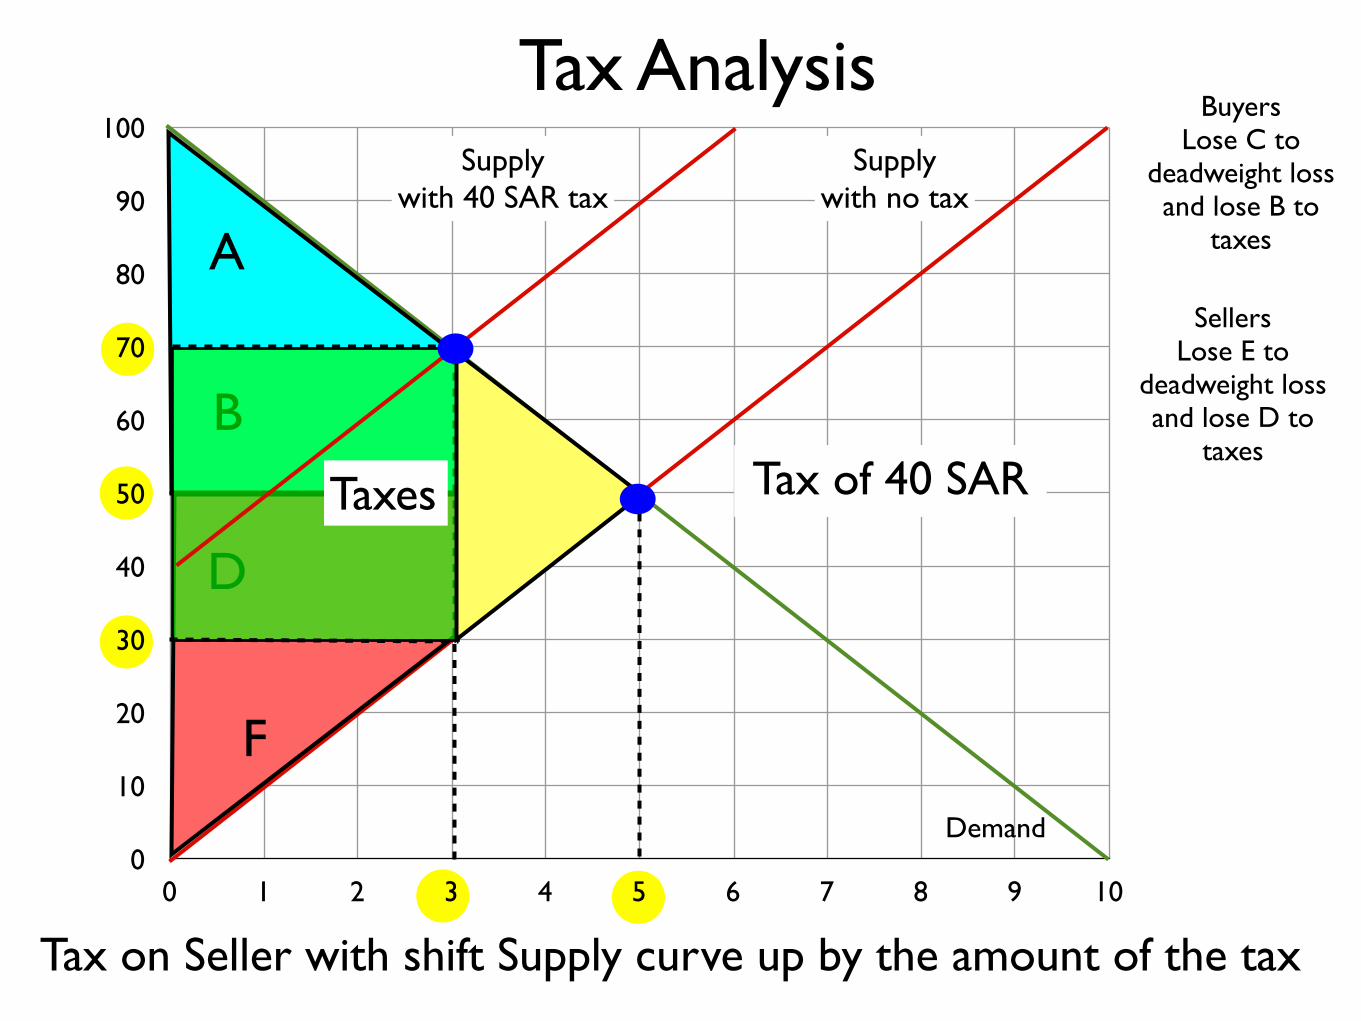
BuyersLose C to
deadweight lossand lose B to
taxes
SellersLose E to
deadweight lossand lose D to
taxes
Tax AnalysisSupply
with 40 SAR tax
Tax on Seller with shift Supply curve up by the amount of the tax
Taxes Tax of 40 SAR
0
10
20
30
40
50
60
70
80
90
100
0 1 2 3 4 5 6 7 8 9 10
Demand
Supplywith no tax
A
BC
D E
F
BuyersLose C to
deadweight lossand lose B to
taxes
SellersLose E to
deadweight lossand lose D to
taxes
Tax AnalysisSupply
with 40 SAR tax
Tax on Seller with shift Supply curve up by the amount of the tax
TaxesGovernmentgains B from buyers and D from sellers
Tax of 40 SAR
0
10
20
30
40
50
60
70
80
90
100
0 1 2 3 4 5 6 7 8 9 10
Demand
Supplywith no tax
A
BC
D E
F
BuyersLose C to
deadweight lossand lose B to
taxes
SellersLose E to
deadweight lossand lose D to
taxes
Tax AnalysisSupply
with 40 SAR tax
Tax on Seller with shift Supply curve up by the amount of the tax
TaxesGovernmentgains B from buyers and D from sellers
Tax of 40 SAR
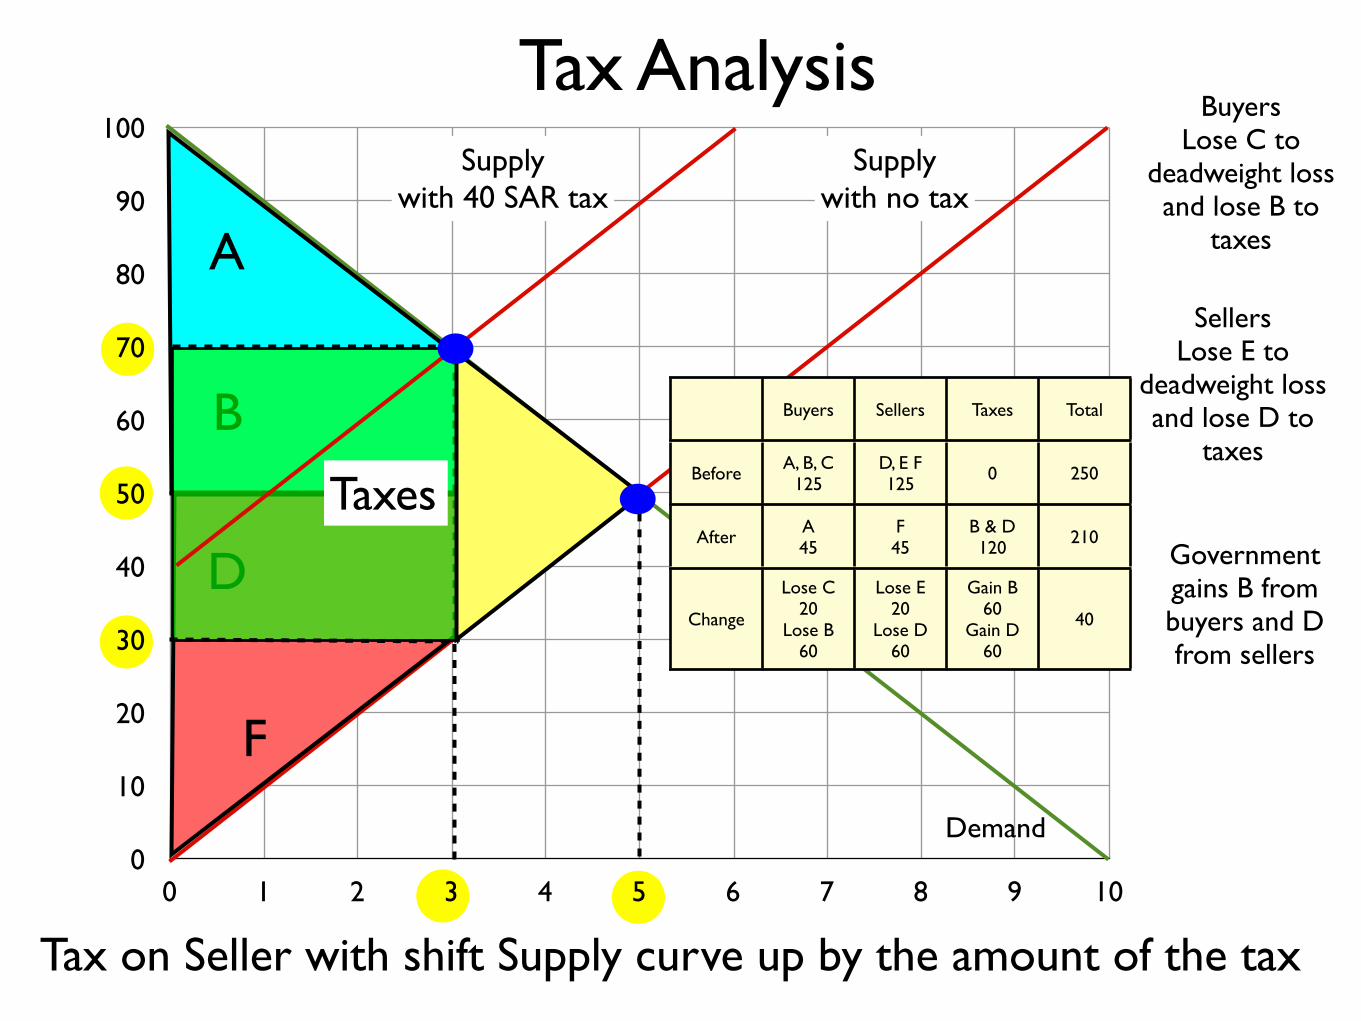
Buyers Sellers Taxes Total
Before A, B, C125
D, E F125 0 250
After A45
F45
B & D120 210
Change
Lose C20
Lose B60
Lose E20
Lose D60
Gain B60
Gain D60
40
0
10
20
30
40
50
60
70
80
90
100
0 1 2 3 4 5 6 7 8 9 10
Demand
DomesticSupply
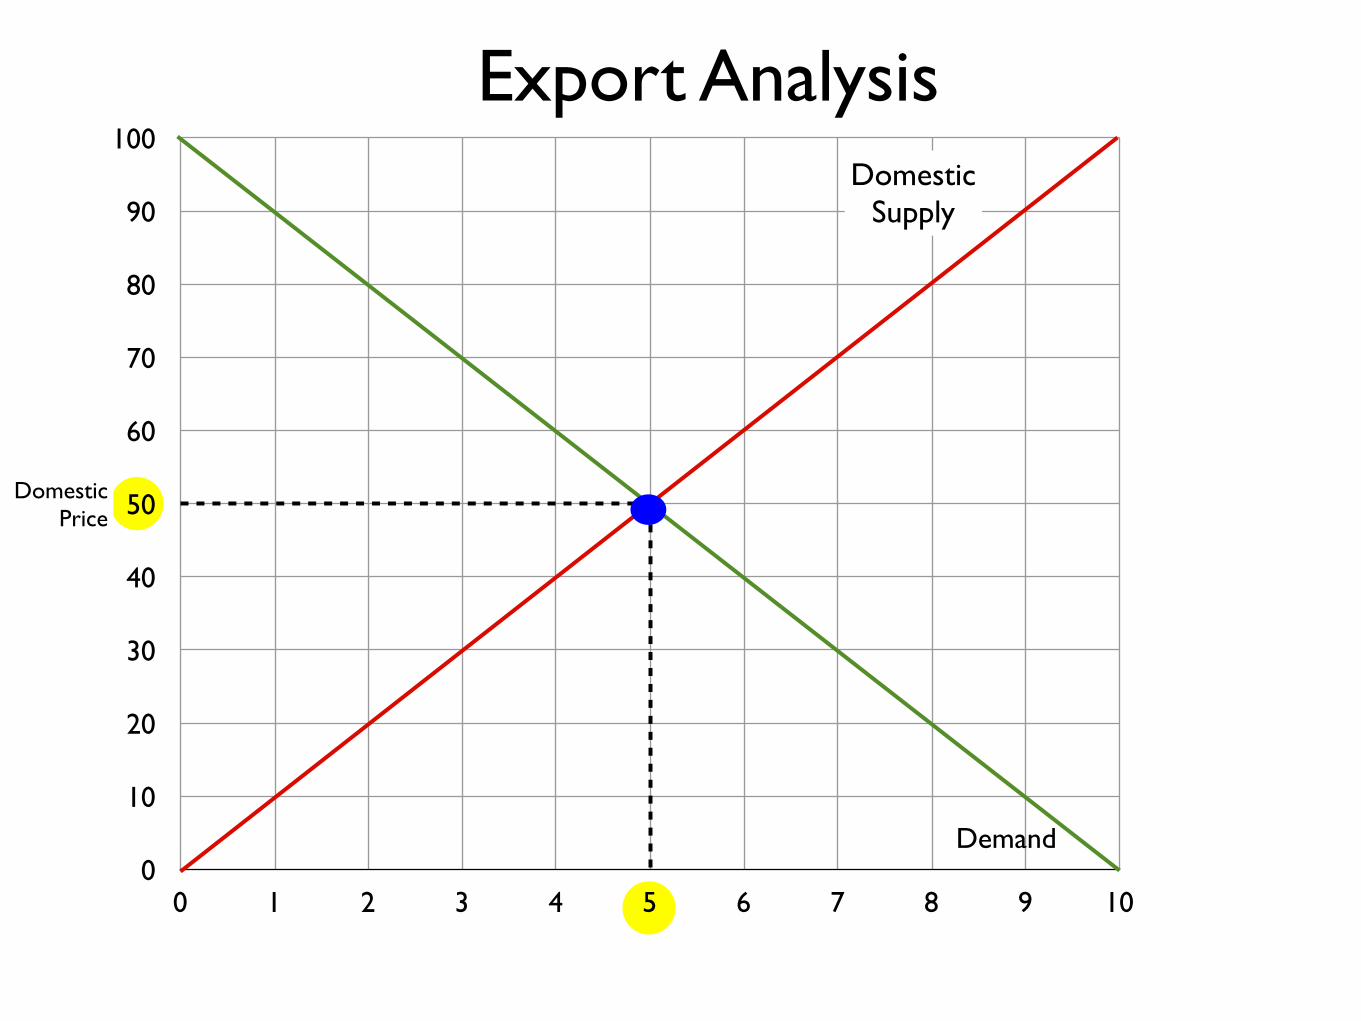
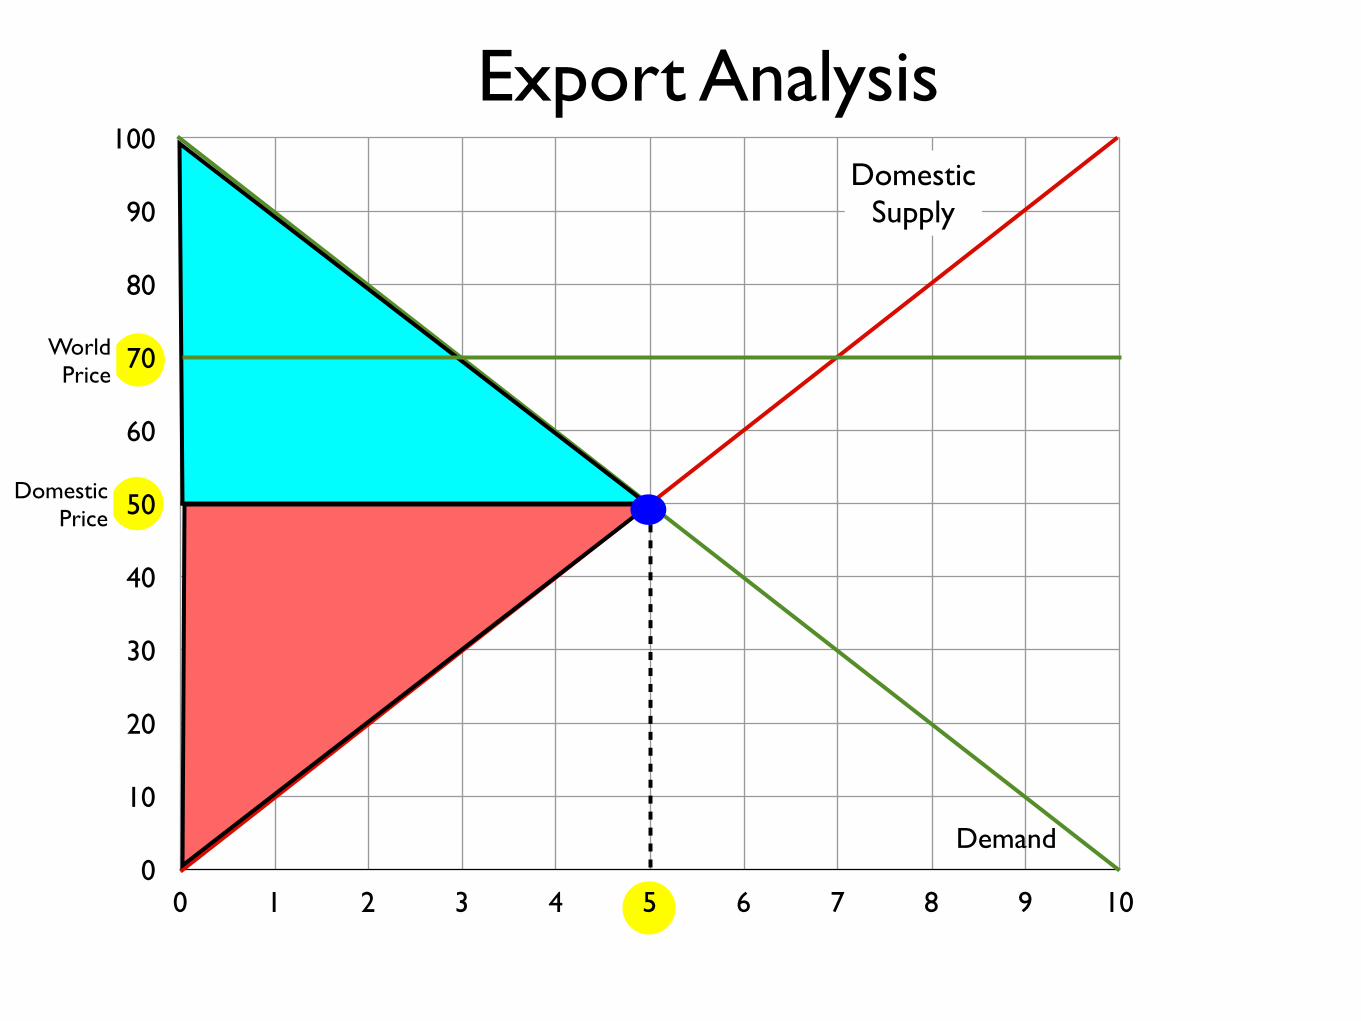
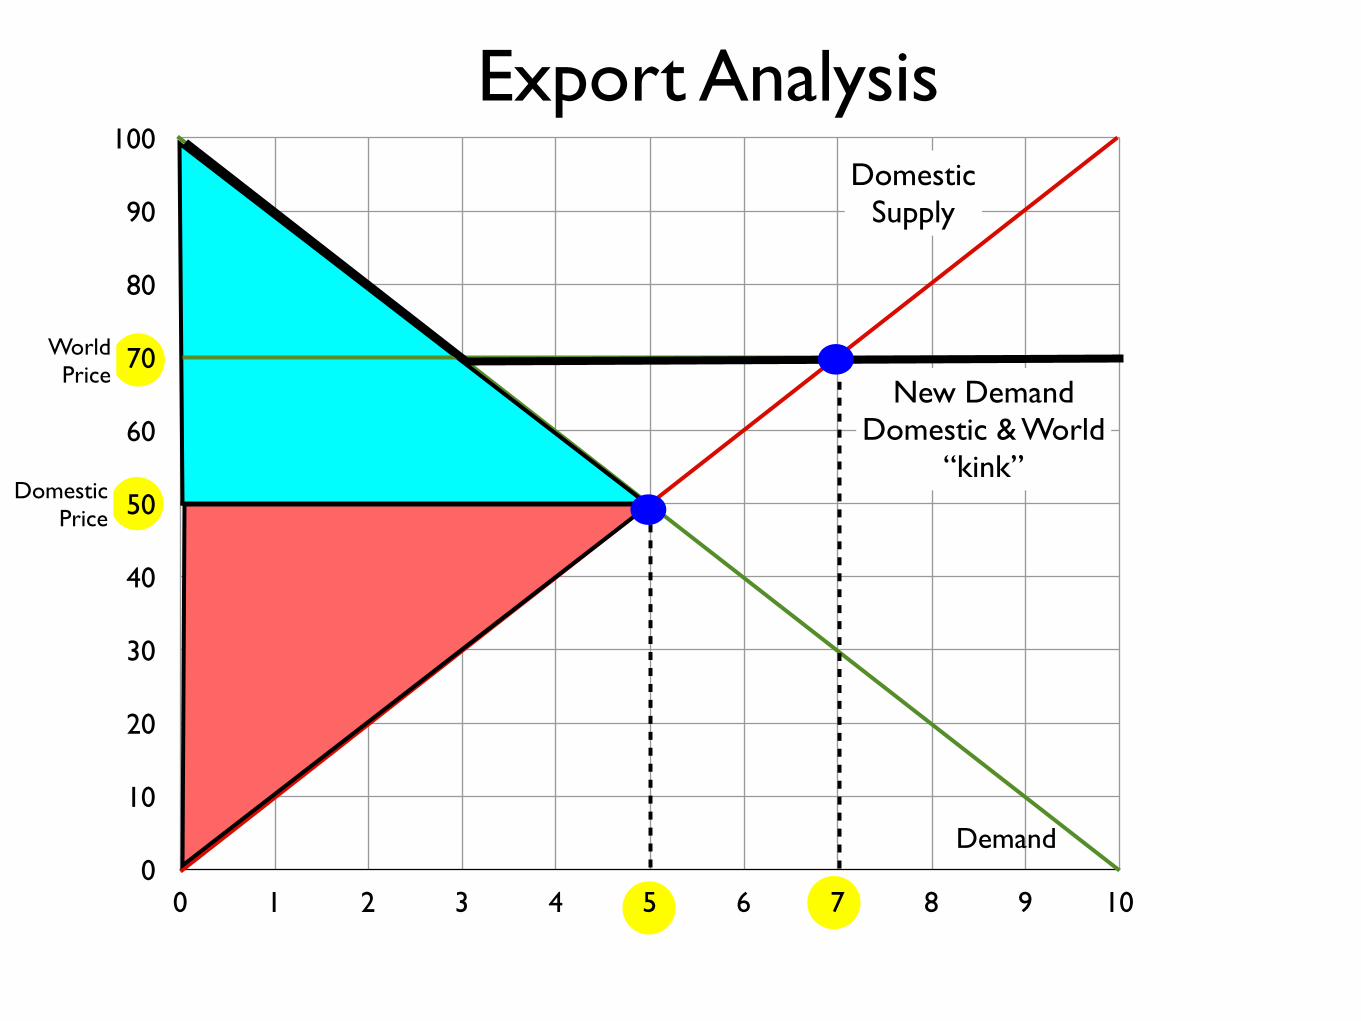
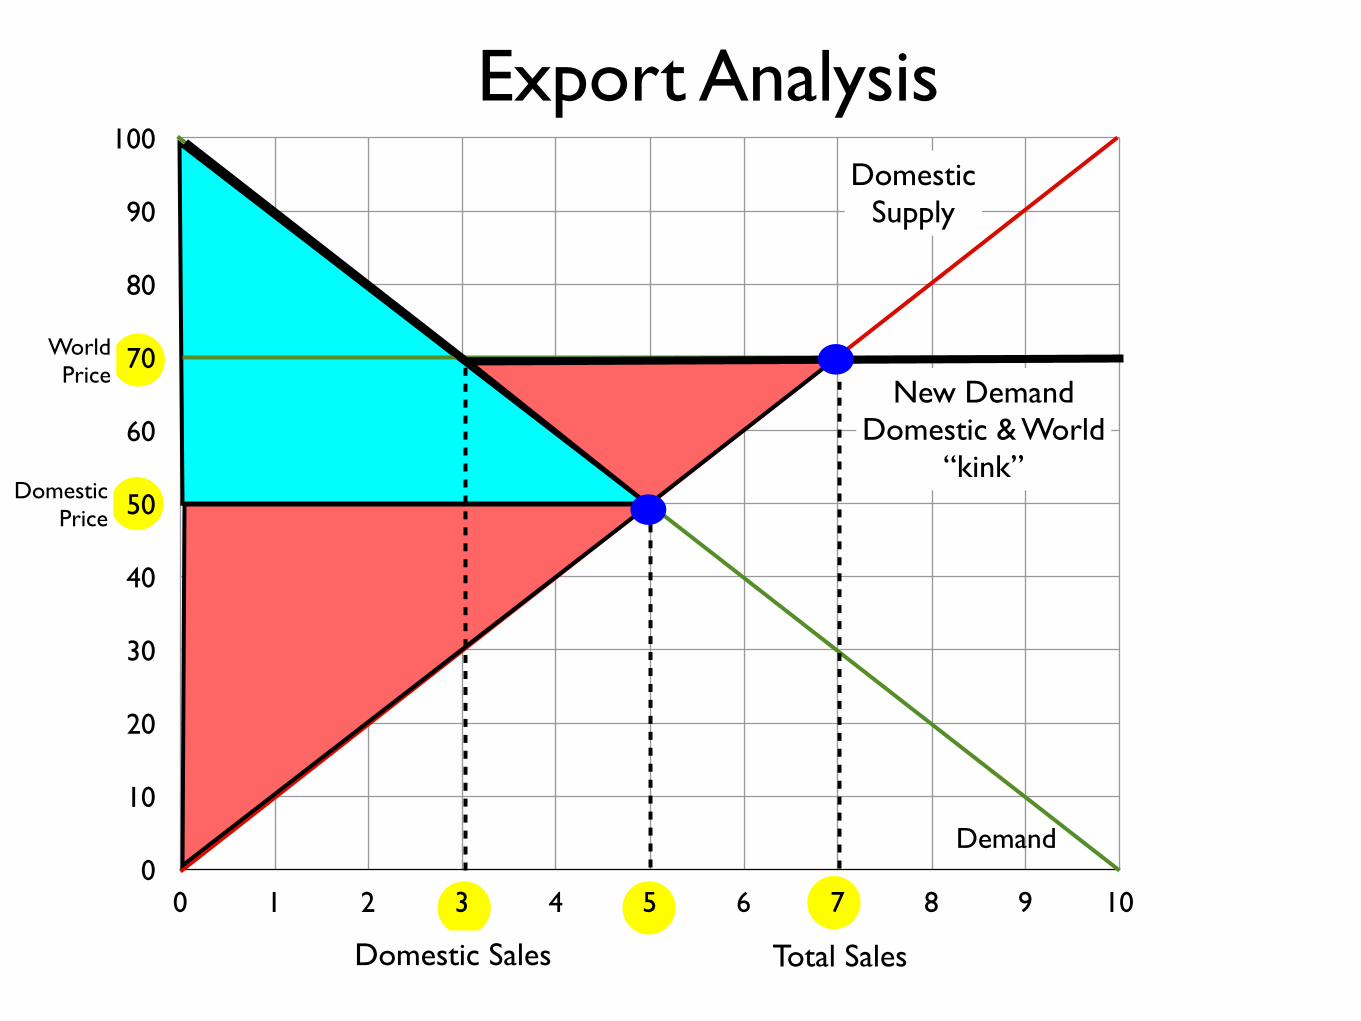
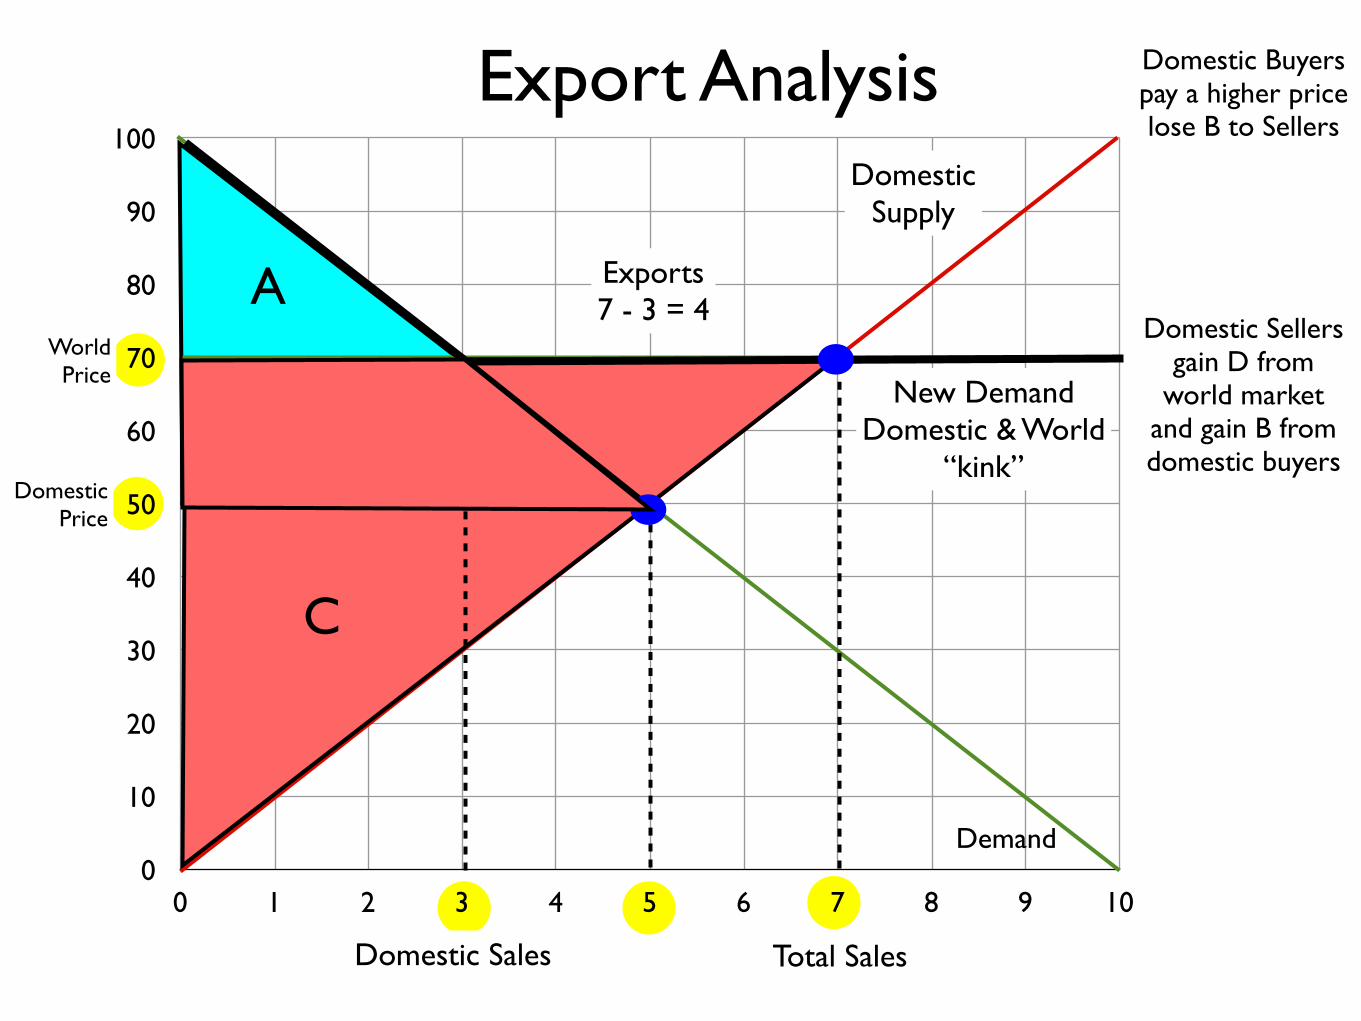
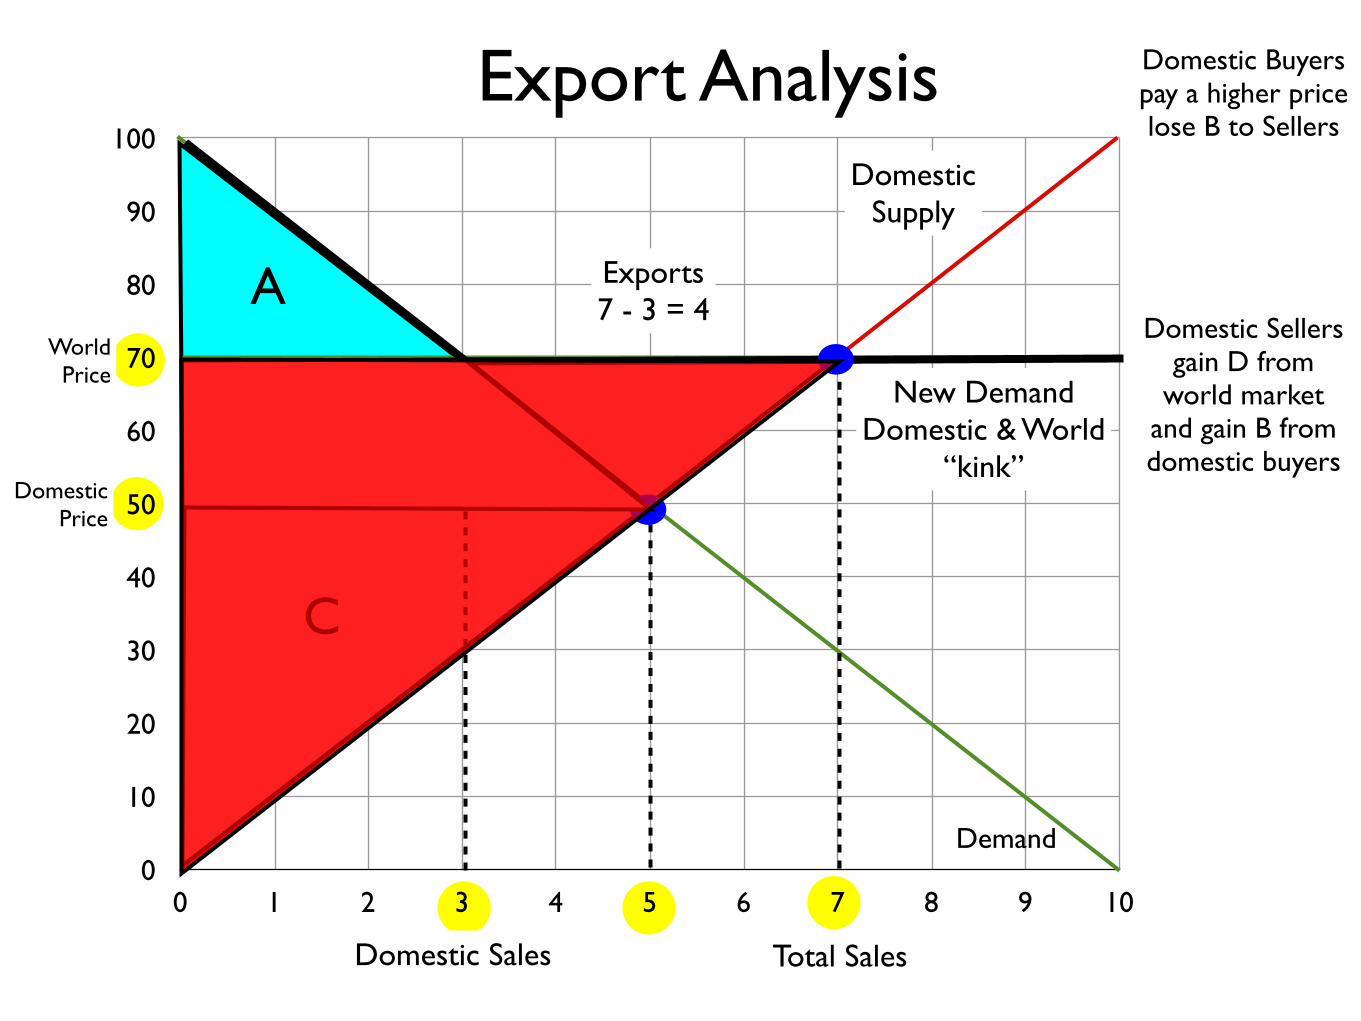
Export Analysis
DomesticPrice
0
10
20
30
40
50
60
70
80
90
100
0 1 2 3 4 5 6 7 8 9 10
Demand
DomesticSupply
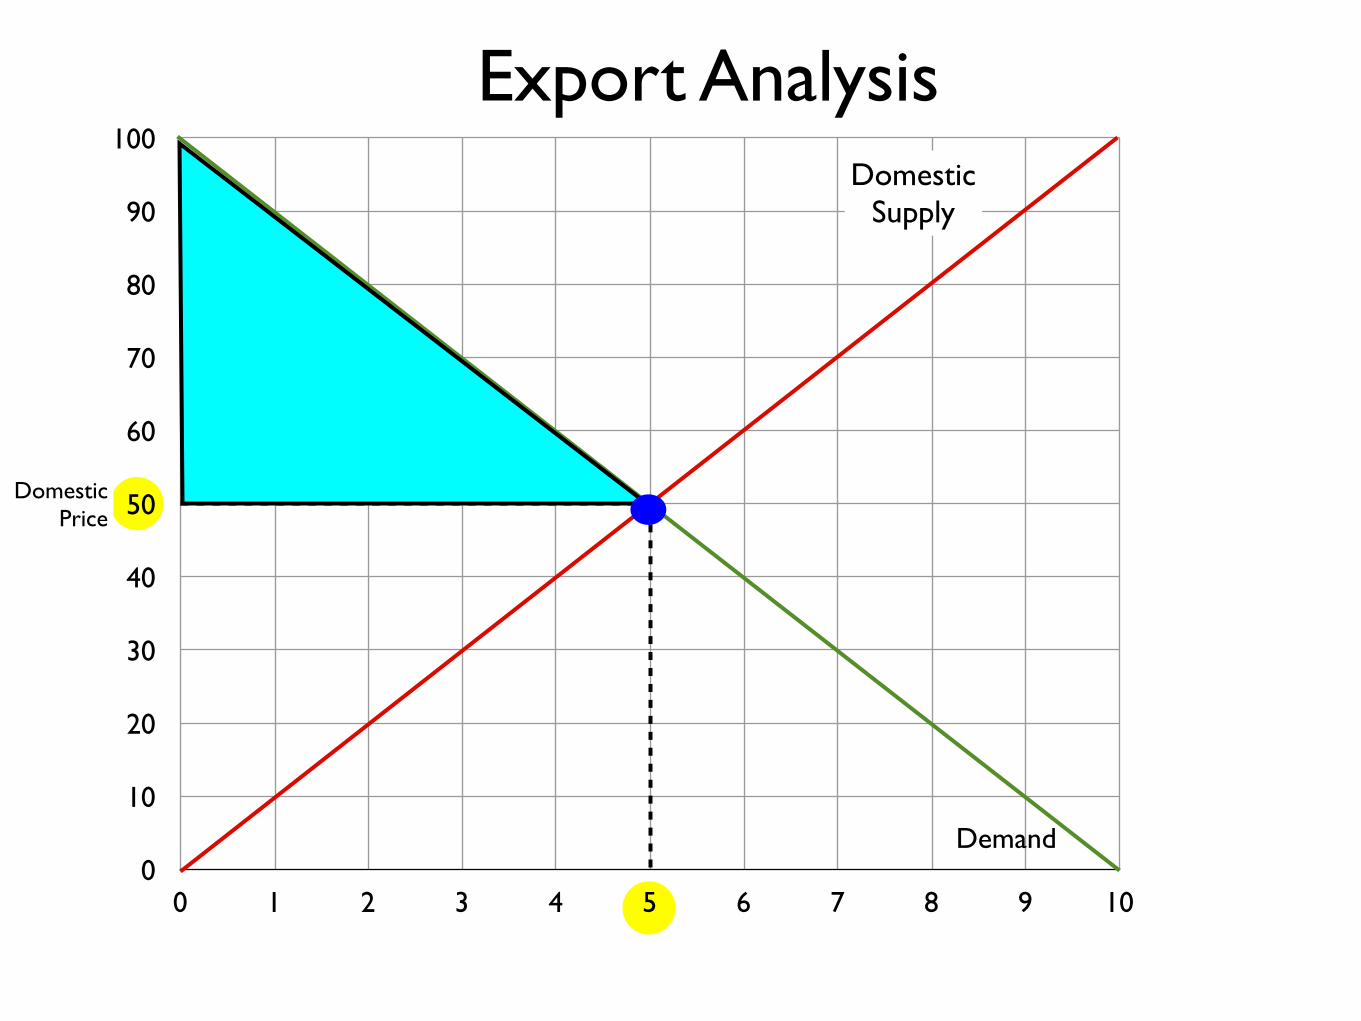
Export Analysis
DomesticPrice

0
10
20
30
40
50
60
70
80
90
100
0 1 2 3 4 5 6 7 8 9 10
Demand
DomesticSupply
Export Analysis
DomesticPrice

0
10
20
30
40
50
60
70
80
90
100
0 1 2 3 4 5 6 7 8 9 10
Demand
DomesticSupply
Export Analysis
DomesticPrice
WorldPrice

0
10
20
30
40
50
60
70
80
90
100
0 1 2 3 4 5 6 7 8 9 10
Demand
DomesticSupply
Export Analysis
DomesticPrice
WorldPrice
0
10
20
30
40
50
60
70
80
90
100
0 1 2 3 4 5 6 7 8 9 10
Demand
DomesticSupply
Export Analysis
DomesticPrice
WorldPrice
0
10
20
30
40
50
60
70
80
90
100
0 1 2 3 4 5 6 7 8 9 10
Demand
DomesticSupply
Export Analysis
DomesticPrice
WorldPrice
0
10
20
30
40
50
60
70
80
90
100
0 1 2 3 4 5 6 7 8 9 10
Demand
DomesticSupply
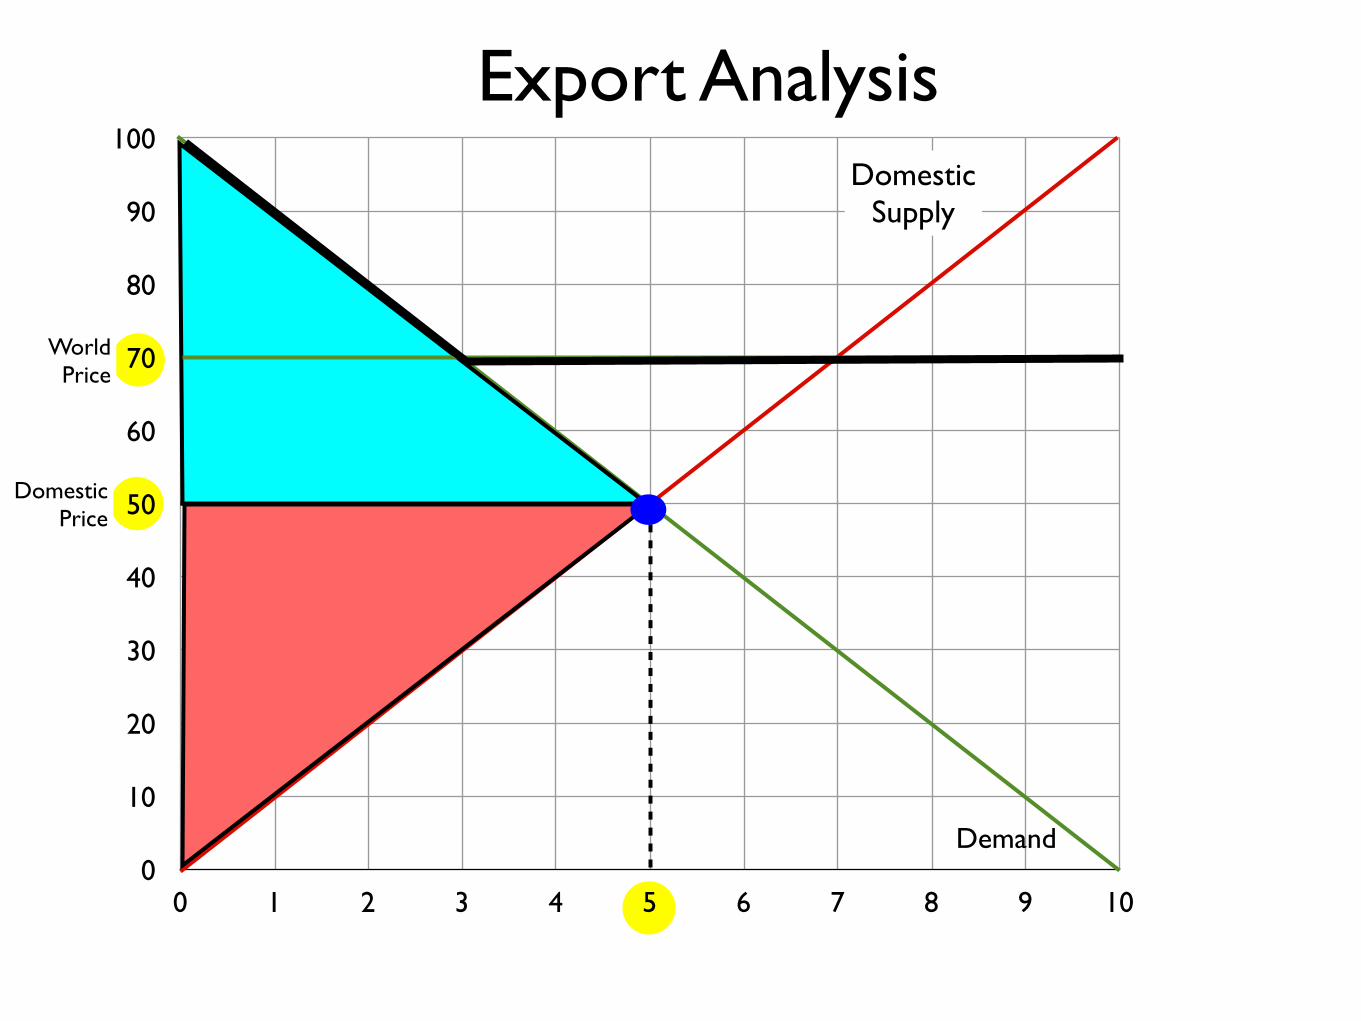
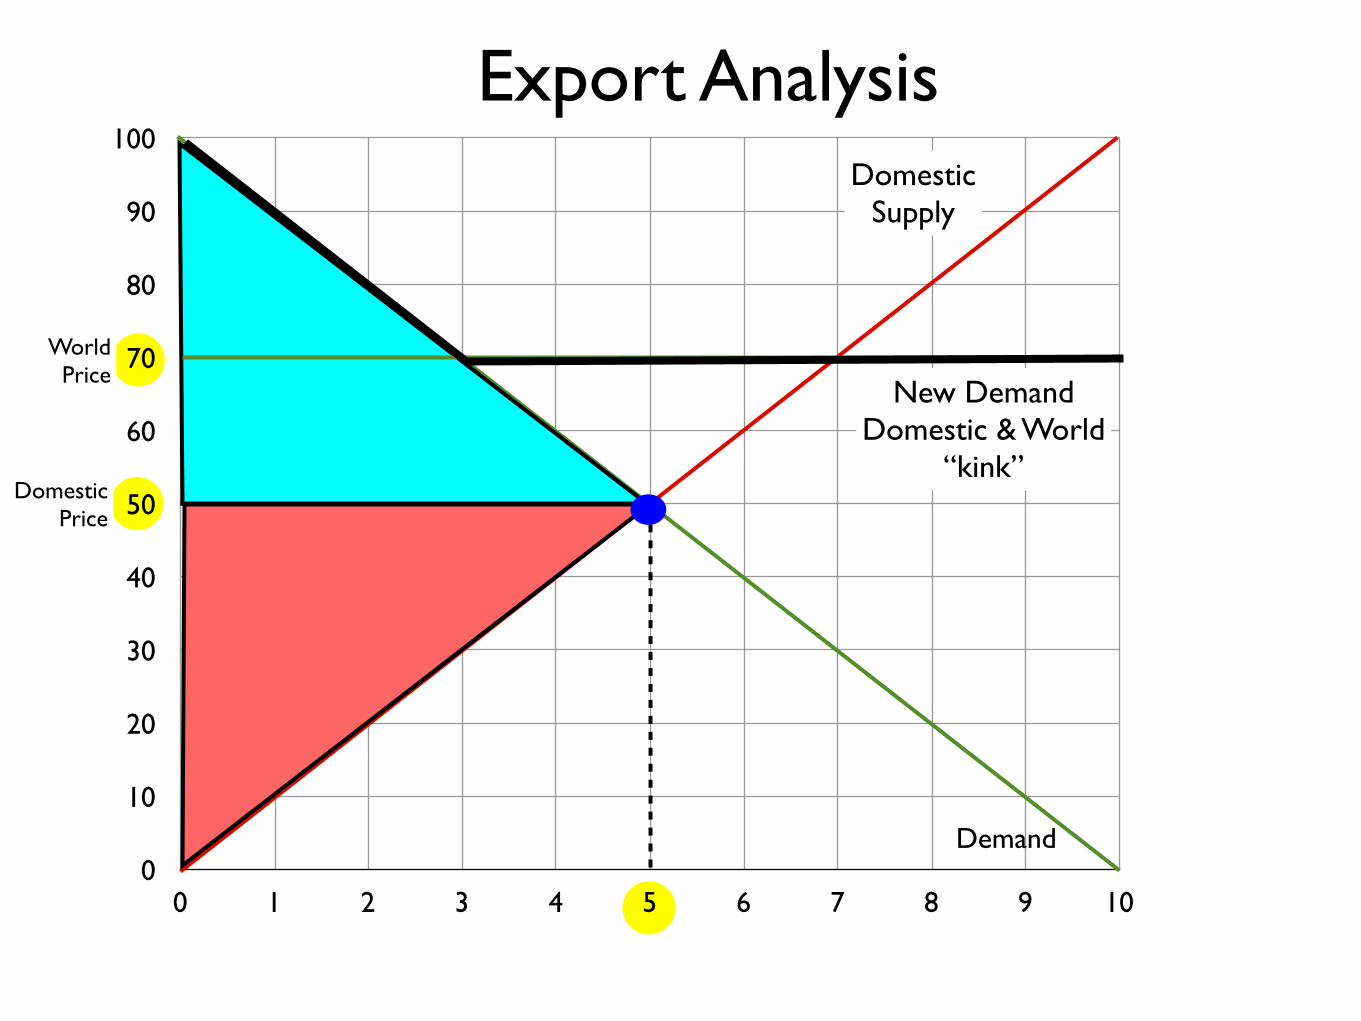
Export Analysis
DomesticPrice
WorldPrice
New DemandDomestic & World
“kink”
0
10
20
30
40
50
60
70
80
90
100
0 1 2 3 4 5 6 7 8 9 10
Demand
DomesticSupply
Export Analysis
DomesticPrice
WorldPrice
New DemandDomestic & World
“kink”

0
10
20
30
40
50
60
70
80
90
100
0 1 2 3 4 5 6 7 8 9 10
Demand
DomesticSupply
Export Analysis
DomesticPrice
WorldPrice
New DemandDomestic & World
“kink”
0
10
20
30
40
50
60
70
80
90
100
0 1 2 3 4 5 6 7 8 9 10
Demand
DomesticSupply
Export Analysis
DomesticPrice
WorldPrice
New DemandDomestic & World
“kink”
0
10
20
30
40
50
60
70
80
90
100
0 1 2 3 4 5 6 7 8 9 10
Demand
DomesticSupply
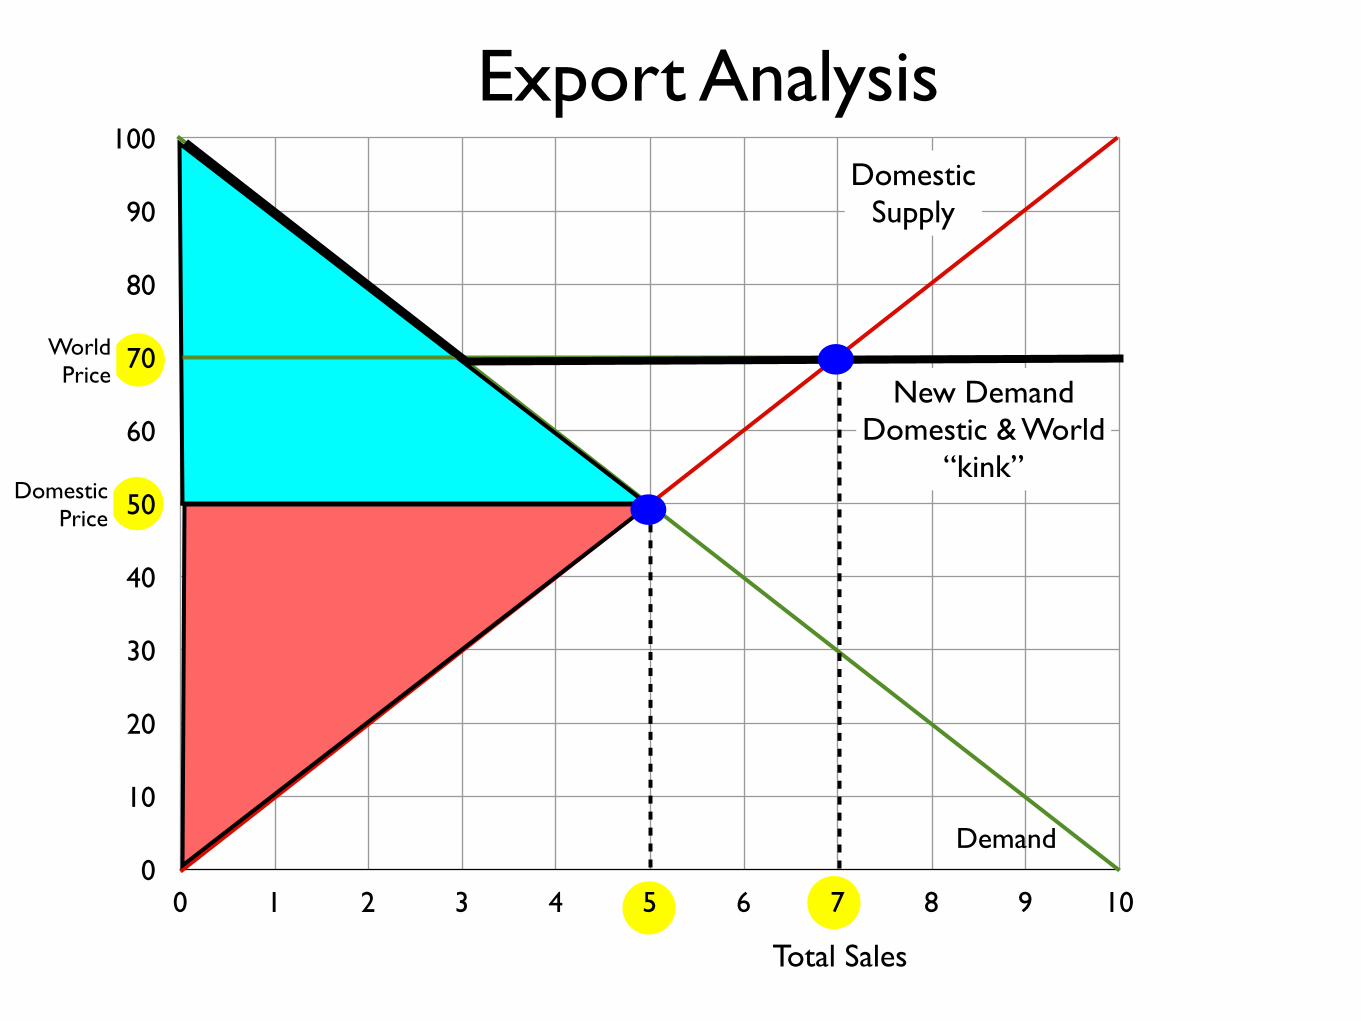
Export Analysis
DomesticPrice
WorldPrice
New DemandDomestic & World
“kink”
Total Sales

0
10
20
30
40
50
60
70
80
90
100
0 1 2 3 4 5 6 7 8 9 10
Demand
DomesticSupply
Export Analysis
DomesticPrice
WorldPrice
New DemandDomestic & World
“kink”
Total Sales
0
10
20
30
40
50
60
70
80
90
100
0 1 2 3 4 5 6 7 8 9 10
Demand
DomesticSupply
Export Analysis
DomesticPrice
WorldPrice
New DemandDomestic & World
“kink”
Total Sales
0
10
20
30
40
50
60
70
80
90
100
0 1 2 3 4 5 6 7 8 9 10
Demand
DomesticSupply
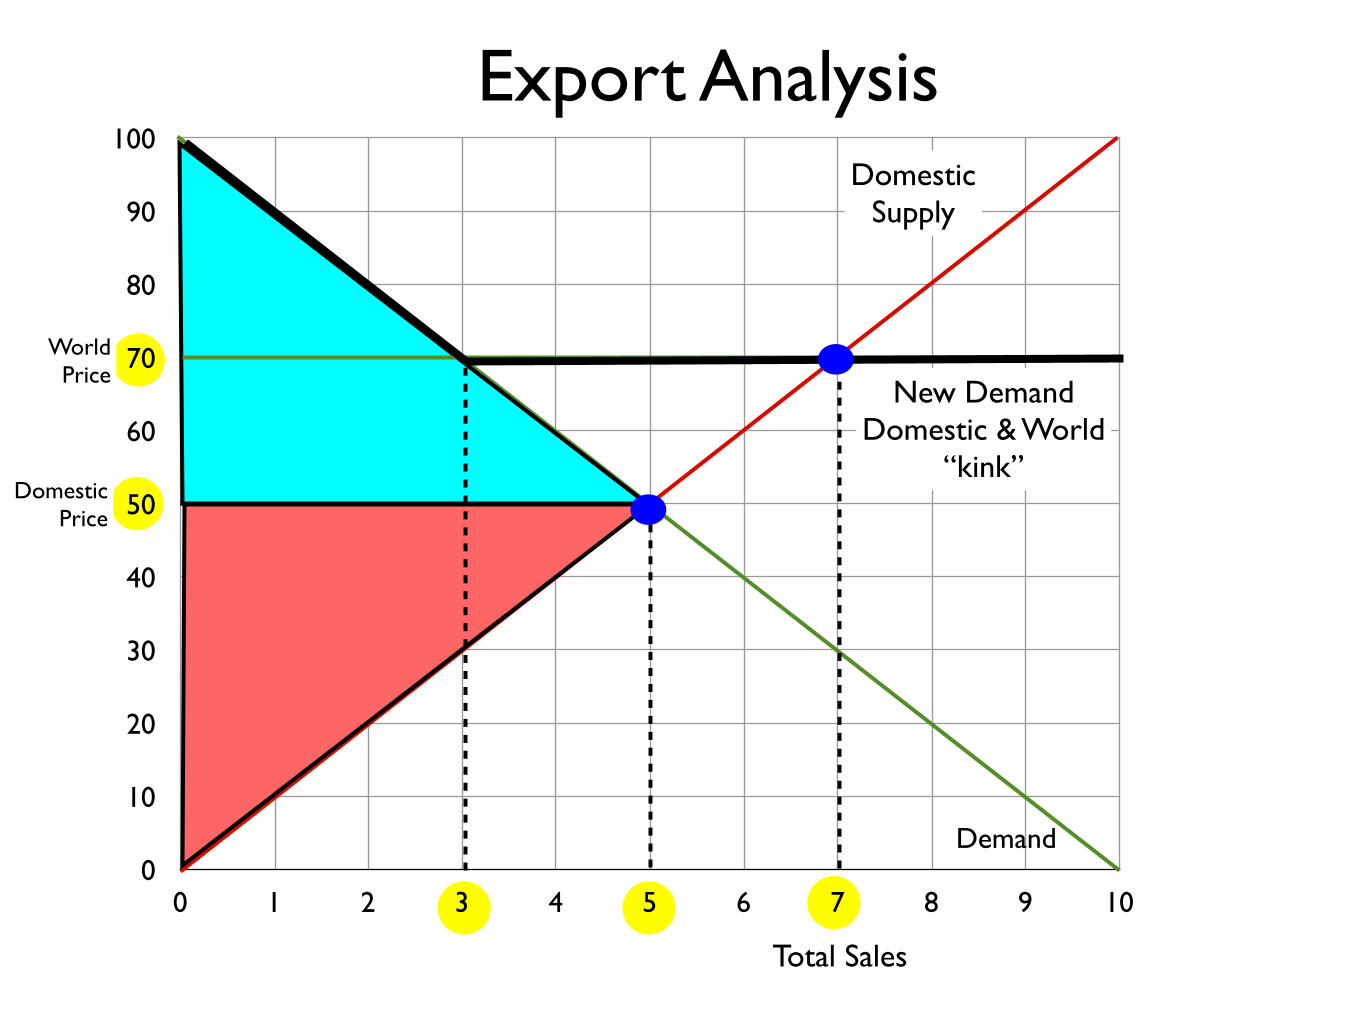
Export Analysis
DomesticPrice
WorldPrice
New DemandDomestic & World
“kink”
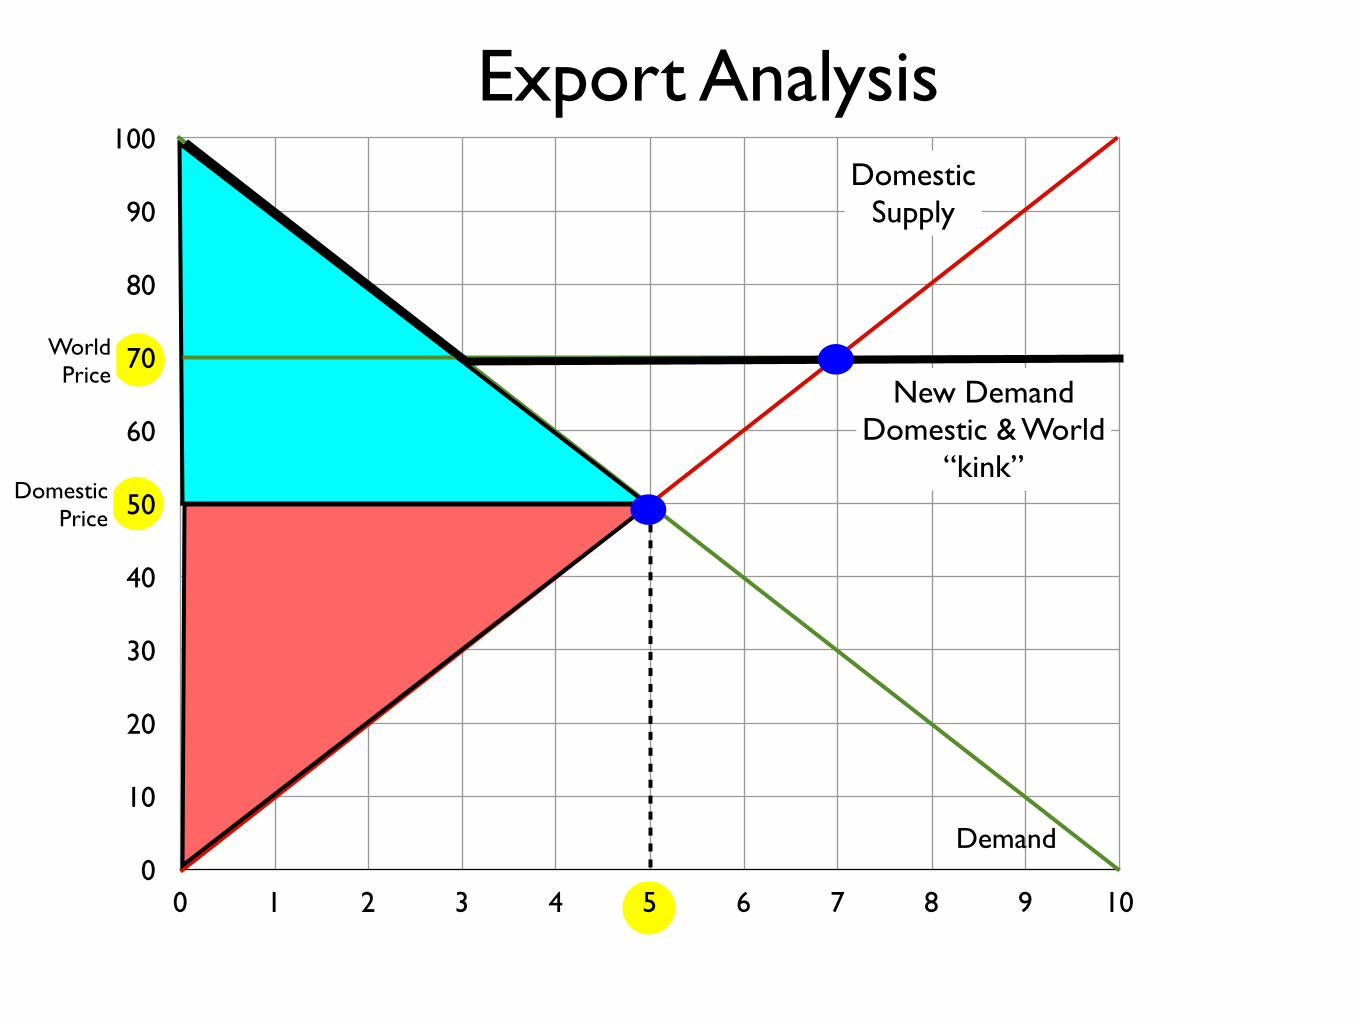
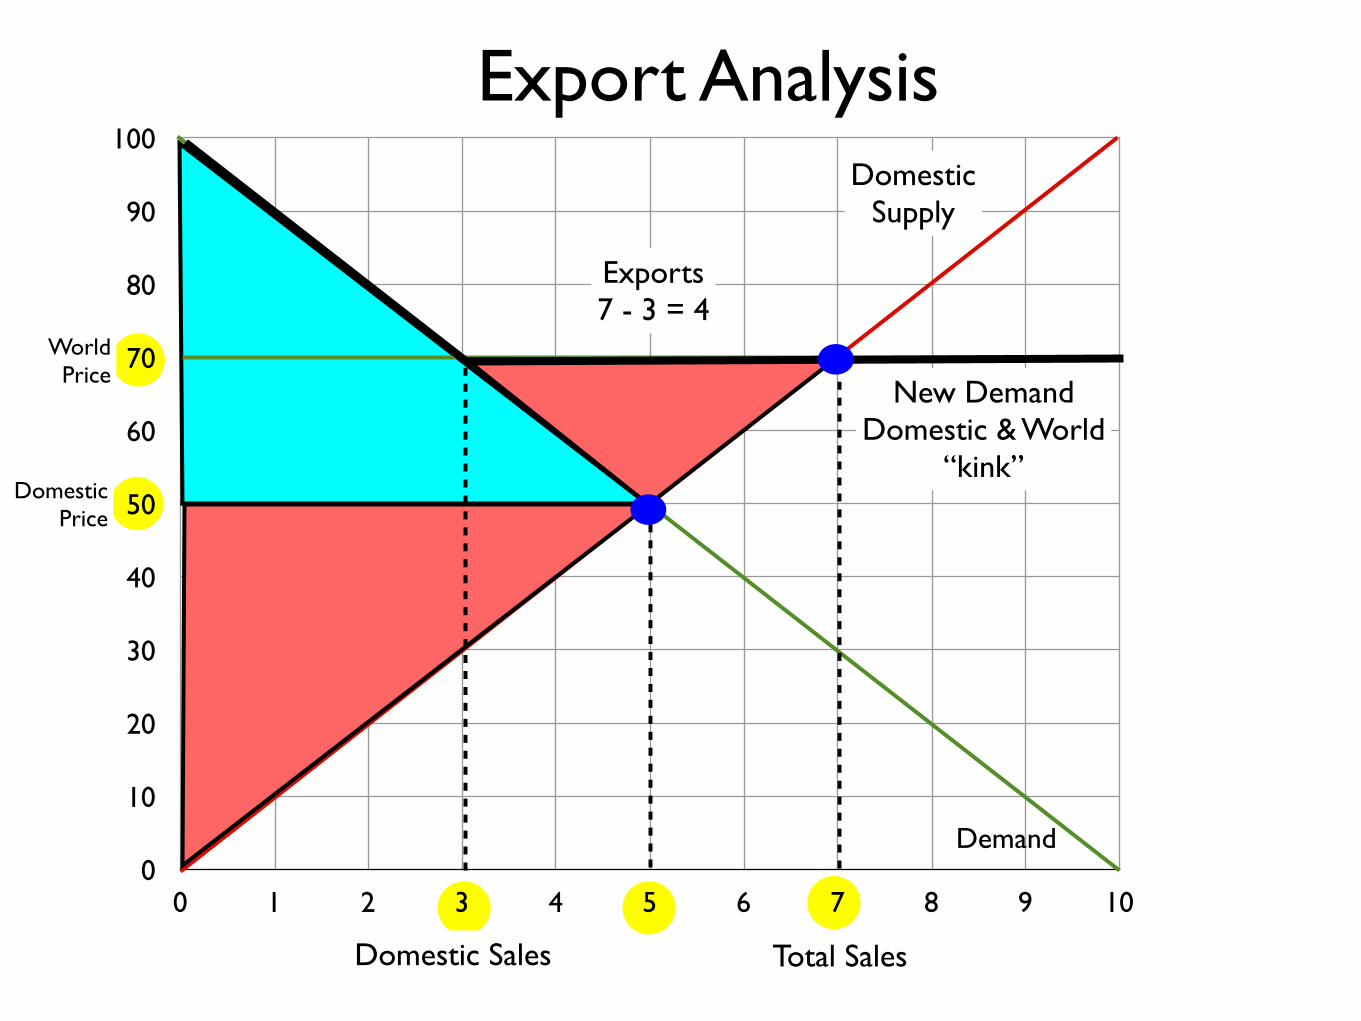
Domestic Sales Total Sales
0
10
20
30
40
50
60
70
80
90
100
0 1 2 3 4 5 6 7 8 9 10
Demand
DomesticSupply
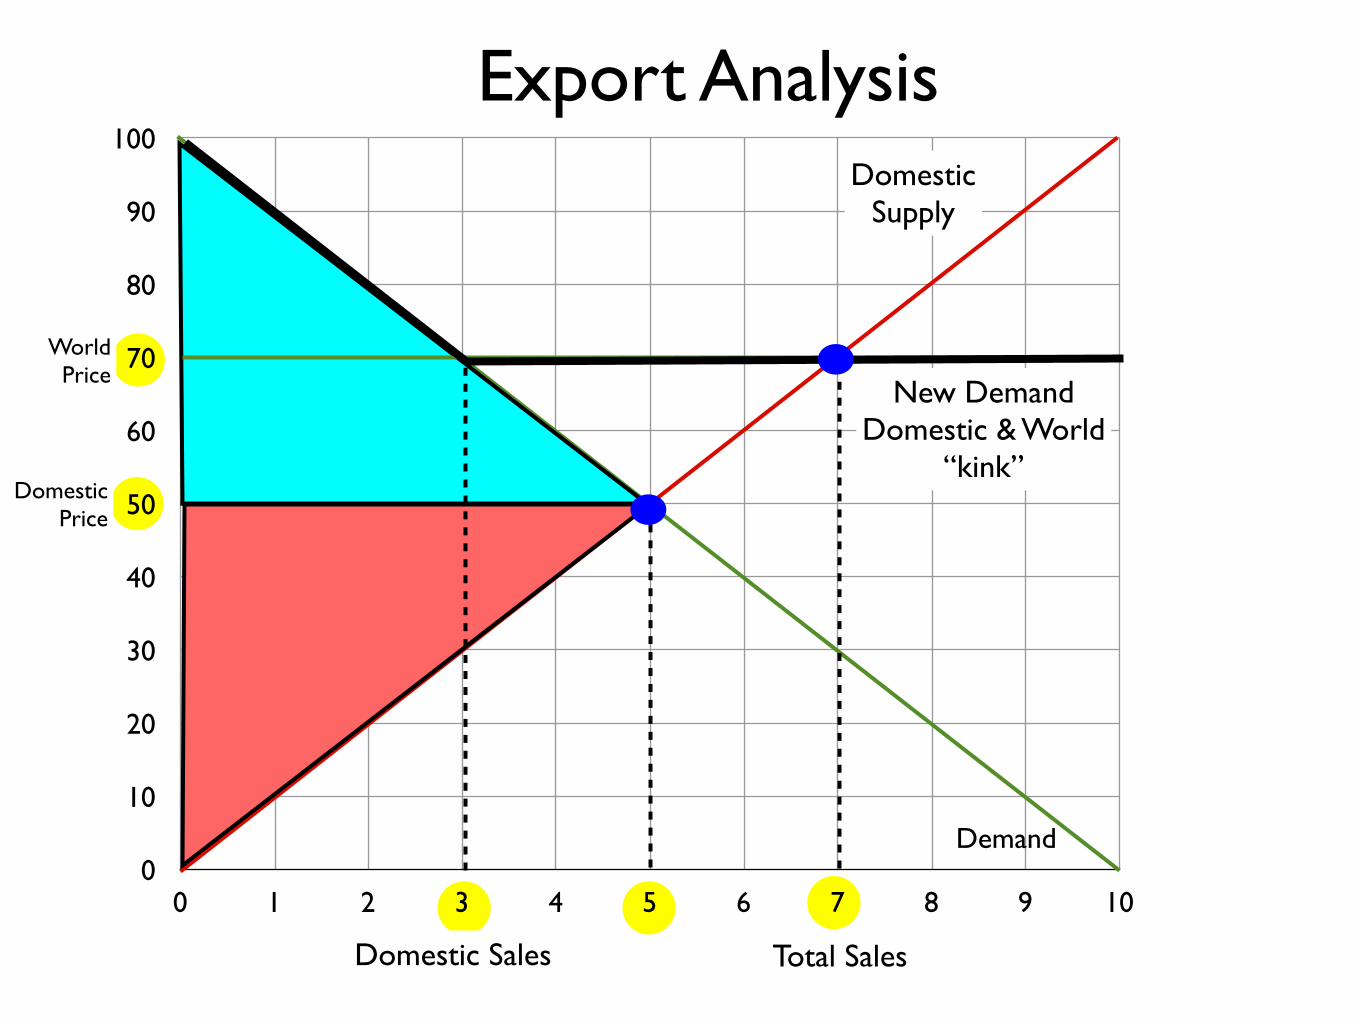
Export Analysis
DomesticPrice
WorldPrice
New DemandDomestic & World
“kink”
Domestic Sales Total Sales
0
10
20
30
40
50
60
70
80
90
100
0 1 2 3 4 5 6 7 8 9 10
Demand
DomesticSupply
Export Analysis
DomesticPrice
WorldPrice
New DemandDomestic & World
“kink”
Domestic Sales Total Sales
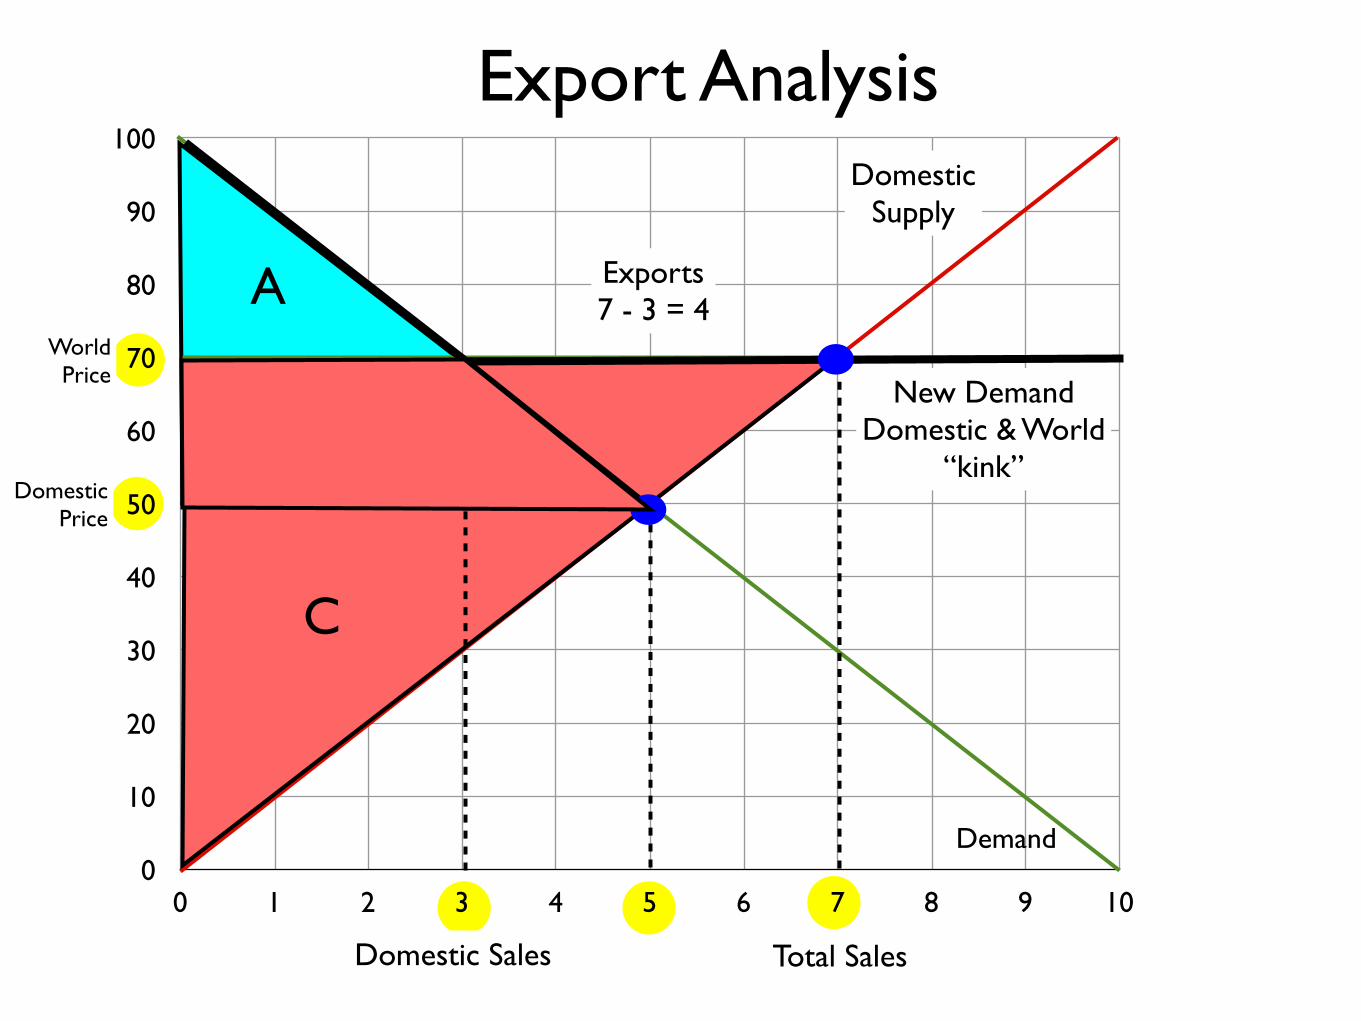
Exports7 - 3 = 4

0
10
20
30
40
50
60
70
80
90
100
0 1 2 3 4 5 6 7 8 9 10
Demand
DomesticSupply
A
Export Analysis
DomesticPrice
WorldPrice
New DemandDomestic & World
“kink”
Domestic Sales Total Sales
Exports7 - 3 = 4

0
10
20
30
40
50
60
70
80
90
100
0 1 2 3 4 5 6 7 8 9 10
Demand
DomesticSupply
A
B
Export Analysis
DomesticPrice
WorldPrice
New DemandDomestic & World
“kink”
Domestic Sales Total Sales
Exports7 - 3 = 4

0
10
20
30
40
50
60
70
80
90
100
0 1 2 3 4 5 6 7 8 9 10
Demand
DomesticSupply
A
B
C
Export Analysis
DomesticPrice
WorldPrice
New DemandDomestic & World
“kink”
Domestic Sales Total Sales
Exports7 - 3 = 4

0
10
20
30
40
50
60
70
80
90
100
0 1 2 3 4 5 6 7 8 9 10
Demand
DomesticSupply
A
B
C
D
Export Analysis
DomesticPrice
WorldPrice
New DemandDomestic & World
“kink”
Domestic Sales Total Sales
Exports7 - 3 = 4
0
10
20
30
40
50
60
70
80
90
100
0 1 2 3 4 5 6 7 8 9 10
Demand
DomesticSupply
A
B
C
D
Export Analysis
DomesticPrice
WorldPrice
New DemandDomestic & World
“kink”
Domestic Sales Total Sales
Exports7 - 3 = 4
0
10
20
30
40
50
60
70
80
90
100
0 1 2 3 4 5 6 7 8 9 10
Demand
DomesticSupply
A
B
C
D
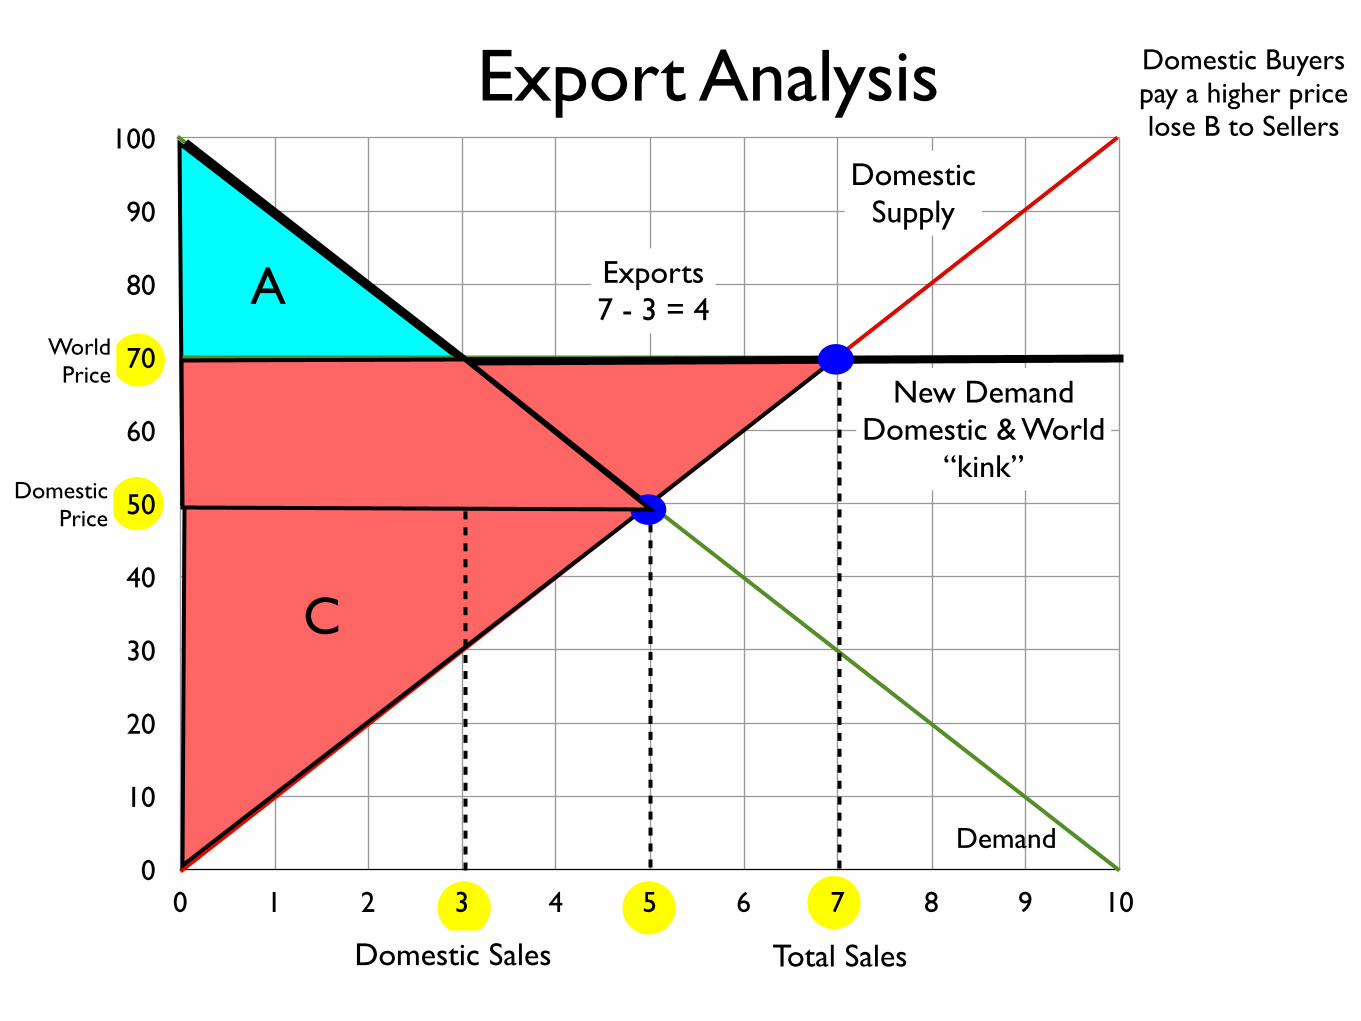
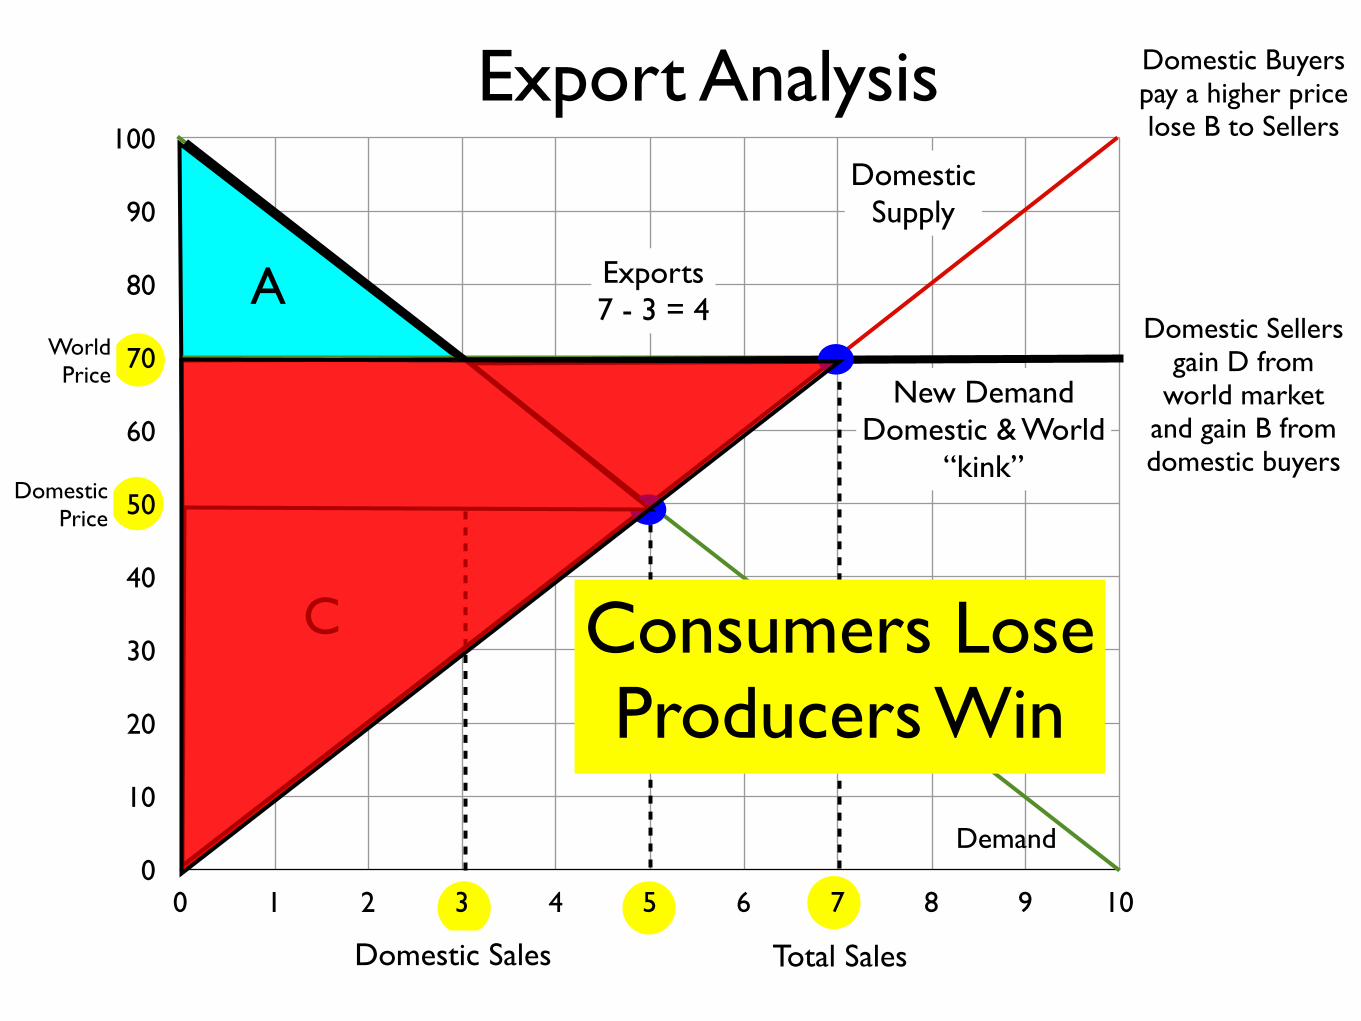
Domestic Buyerspay a higher pricelose B to Sellers
Export Analysis
DomesticPrice
WorldPrice
New DemandDomestic & World
“kink”
Domestic Sales Total Sales
Exports7 - 3 = 4
0
10
20
30
40
50
60
70
80
90
100
0 1 2 3 4 5 6 7 8 9 10
Demand
DomesticSupply
A
B
C
D
Domestic Buyerspay a higher pricelose B to Sellers
Domestic Sellersgain D from
world marketand gain B from domestic buyers
Export Analysis
DomesticPrice
WorldPrice
New DemandDomestic & World
“kink”
Domestic Sales Total Sales
Exports7 - 3 = 4
Consumers LoseProducers Win
0
10
20
30
40
50
60
70
80
90
100
0 1 2 3 4 5 6 7 8 9 10
Demand
DomesticSupply
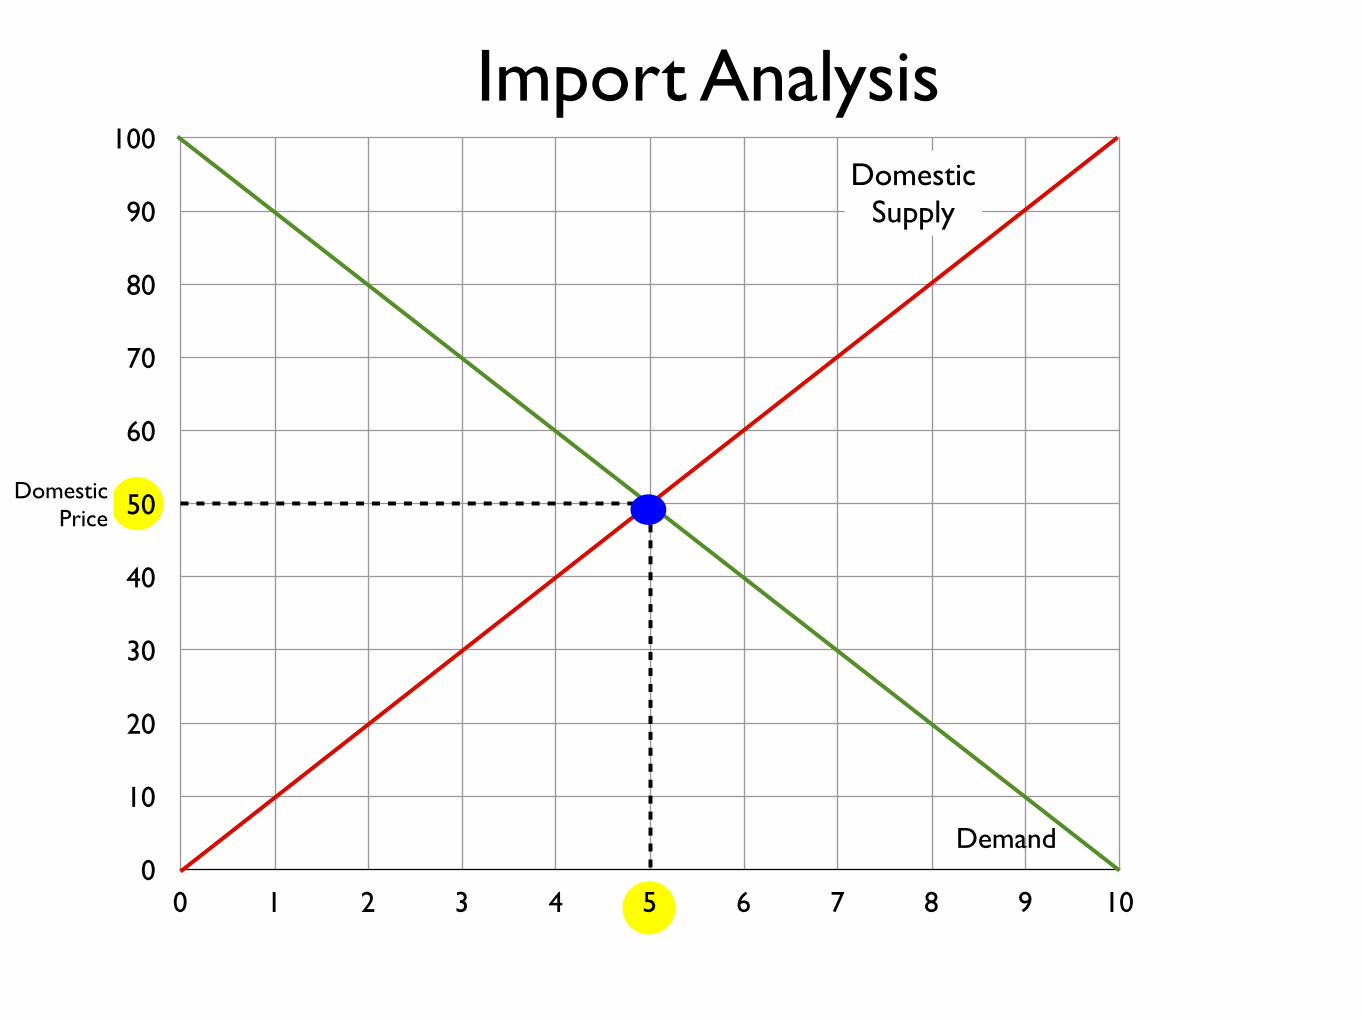
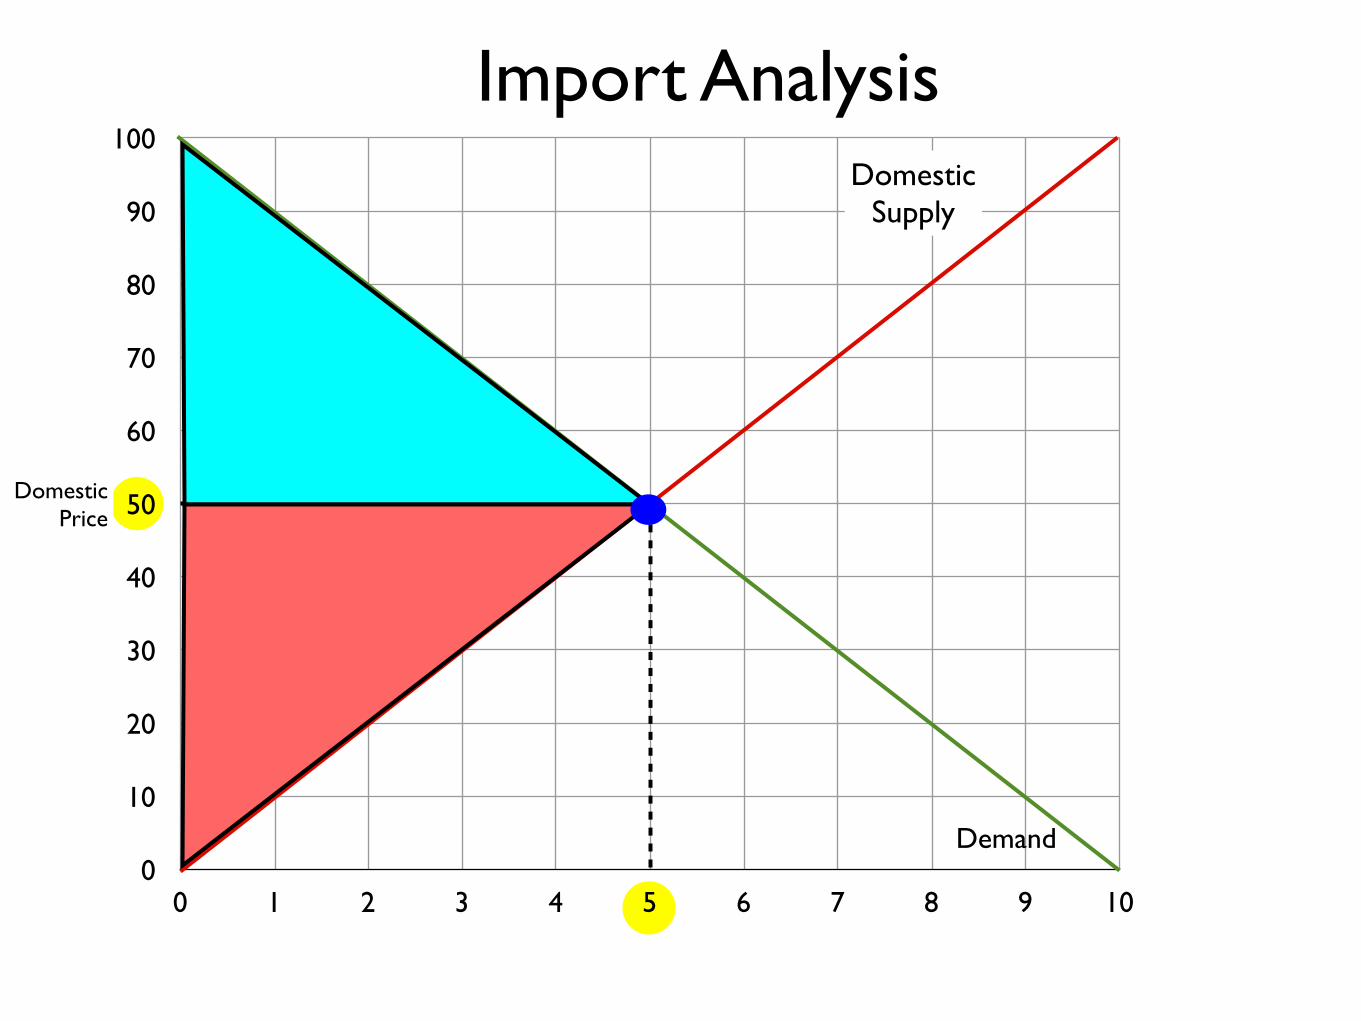
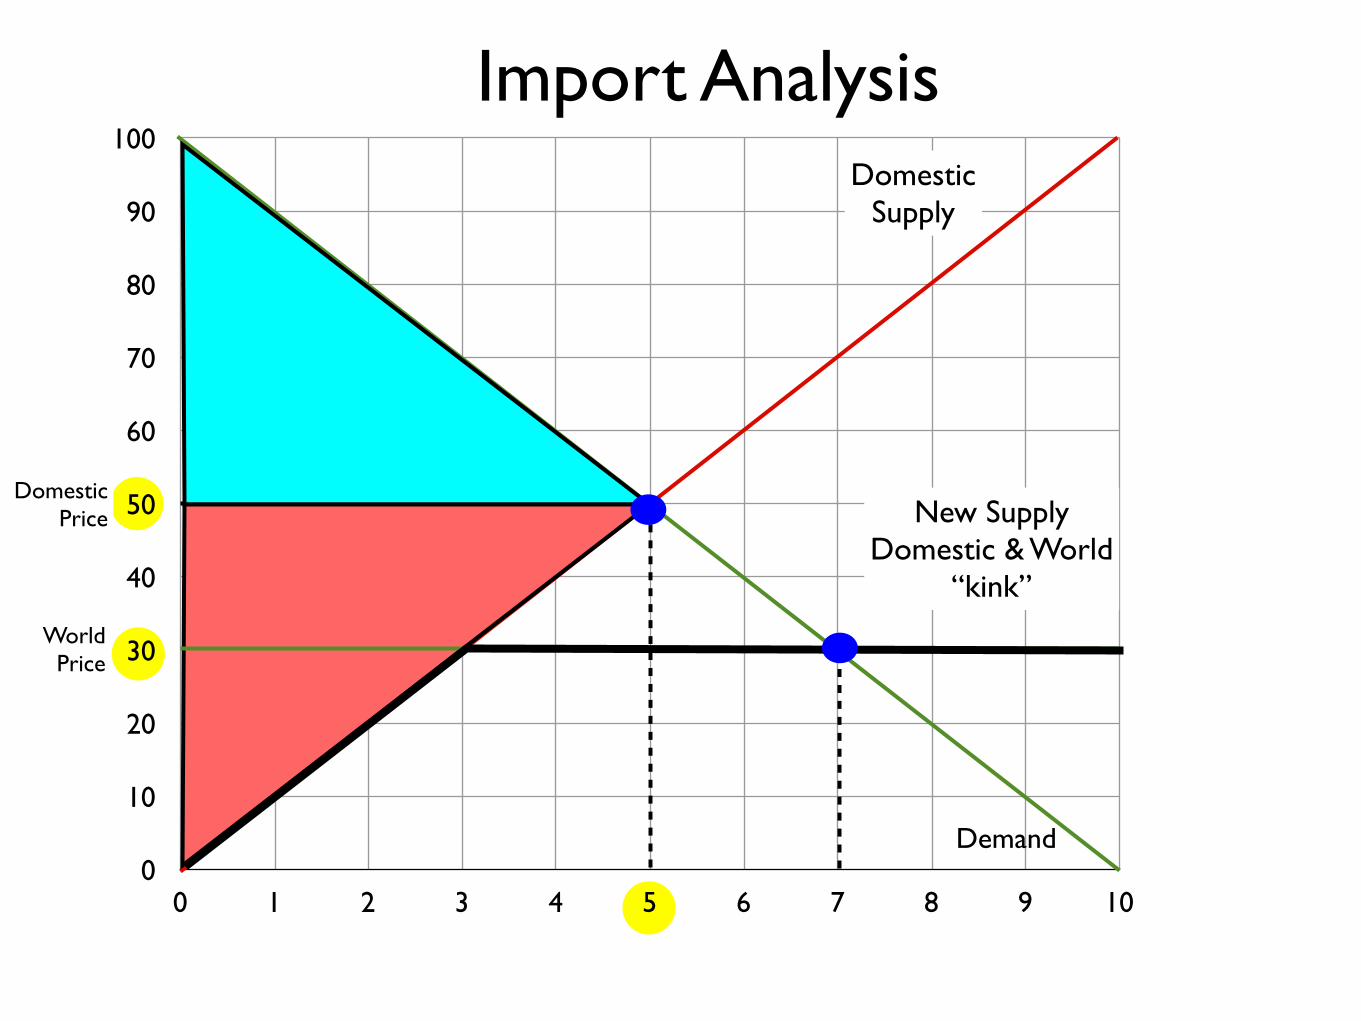
Import Analysis
DomesticPrice

0
10
20
30
40
50
60
70
80
90
100
0 1 2 3 4 5 6 7 8 9 10
Demand
DomesticSupply
Import Analysis
DomesticPrice
0
10
20
30
40
50
60
70
80
90
100
0 1 2 3 4 5 6 7 8 9 10
Demand
DomesticSupply
Import Analysis
DomesticPrice

0
10
20
30
40
50
60
70
80
90
100
0 1 2 3 4 5 6 7 8 9 10
Demand
DomesticSupply
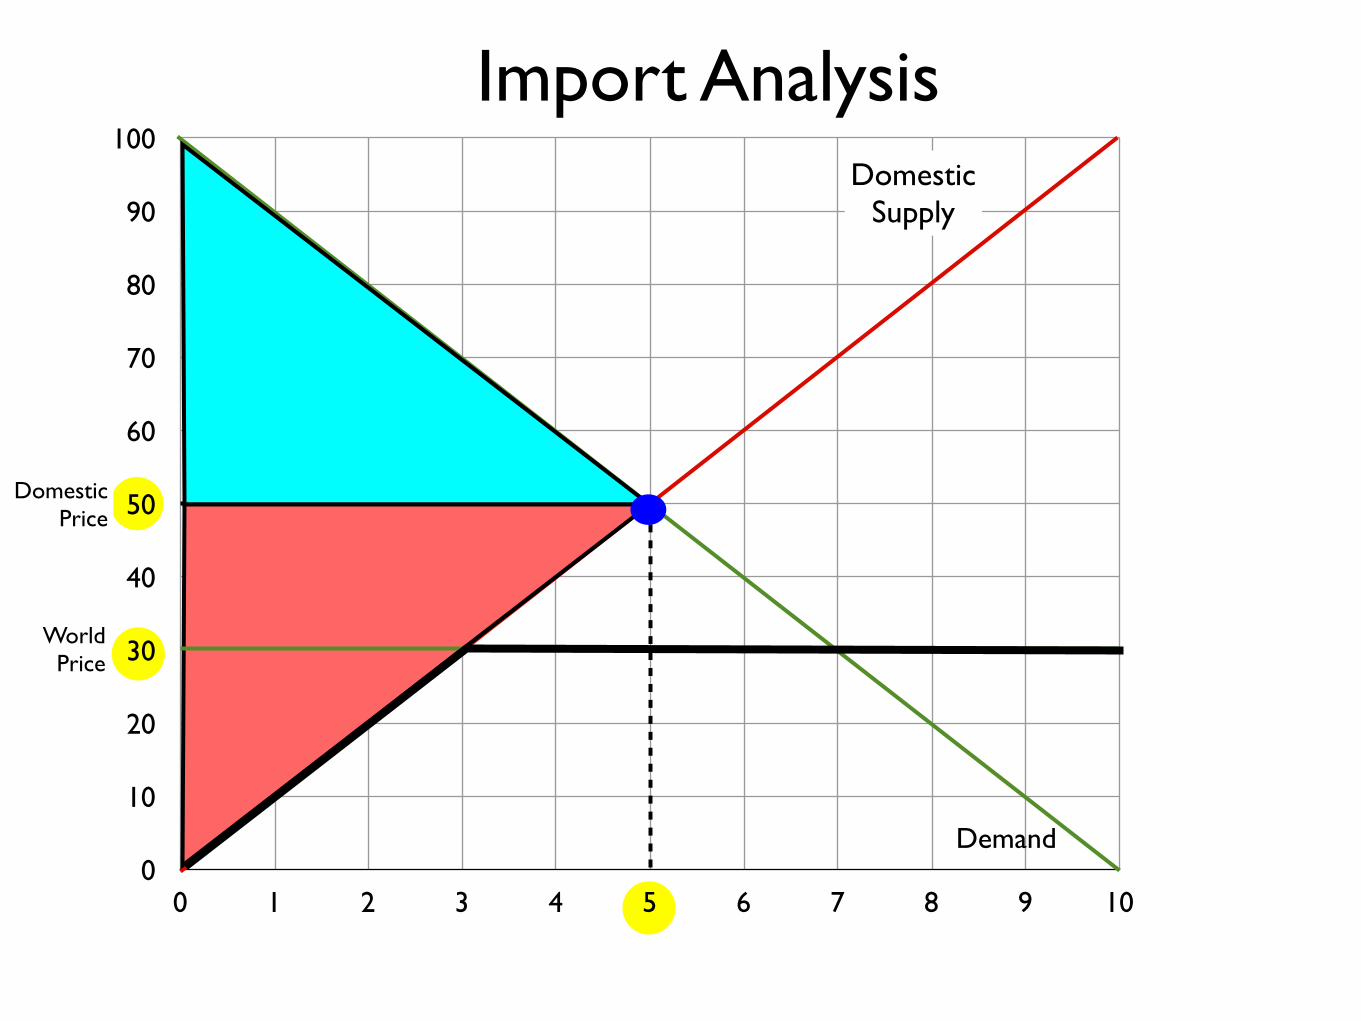
Import Analysis
DomesticPrice
WorldPrice

0
10
20
30
40
50
60
70
80
90
100
0 1 2 3 4 5 6 7 8 9 10
Demand
DomesticSupply
Import Analysis
DomesticPrice
WorldPrice

0
10
20
30
40
50
60
70
80
90
100
0 1 2 3 4 5 6 7 8 9 10
Demand
DomesticSupply
Import Analysis
DomesticPrice
WorldPrice
0
10
20
30
40
50
60
70
80
90
100
0 1 2 3 4 5 6 7 8 9 10
Demand
DomesticSupply
Import Analysis
DomesticPrice
WorldPrice
0
10
20
30
40
50
60
70
80
90
100
0 1 2 3 4 5 6 7 8 9 10
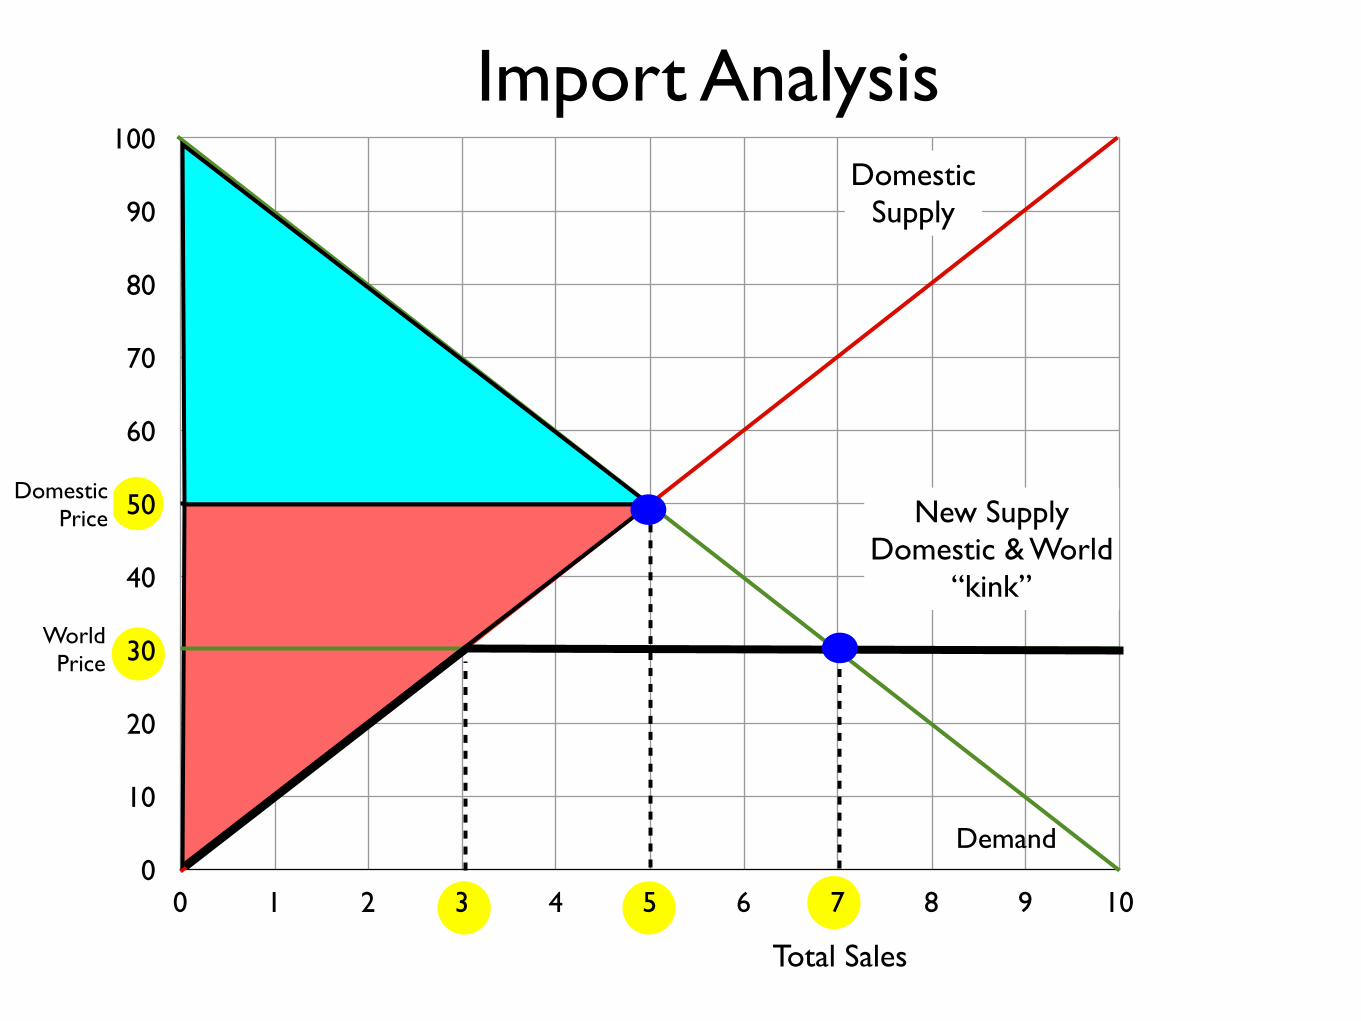
Demand
DomesticSupply
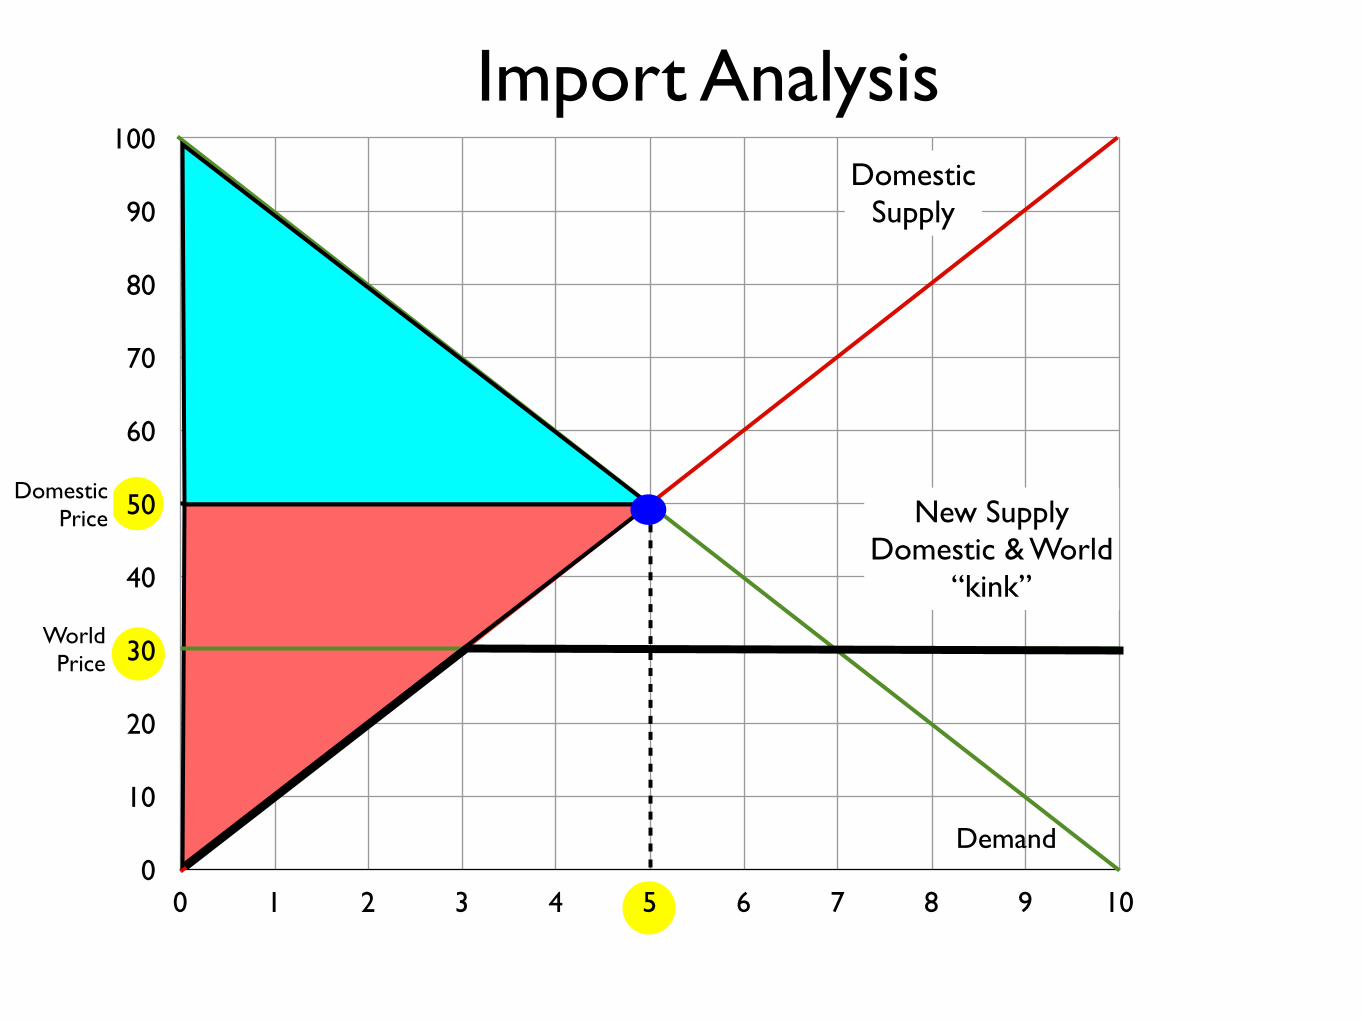
Import Analysis
DomesticPrice
WorldPrice
New SupplyDomestic & World
“kink”
0
10
20
30
40
50
60
70
80
90
100
0 1 2 3 4 5 6 7 8 9 10
Demand
DomesticSupply
Import Analysis
DomesticPrice
WorldPrice
New SupplyDomestic & World
“kink”
0
10
20
30
40
50
60
70
80
90
100
0 1 2 3 4 5 6 7 8 9 10
Demand
DomesticSupply
Import Analysis
DomesticPrice
WorldPrice
New SupplyDomestic & World
“kink”
0
10
20
30
40
50
60
70
80
90
100
0 1 2 3 4 5 6 7 8 9 10
Demand
DomesticSupply
Import Analysis
DomesticPrice
WorldPrice
New SupplyDomestic & World
“kink”
0
10
20
30
40
50
60
70
80
90
100
0 1 2 3 4 5 6 7 8 9 10
Demand
DomesticSupply
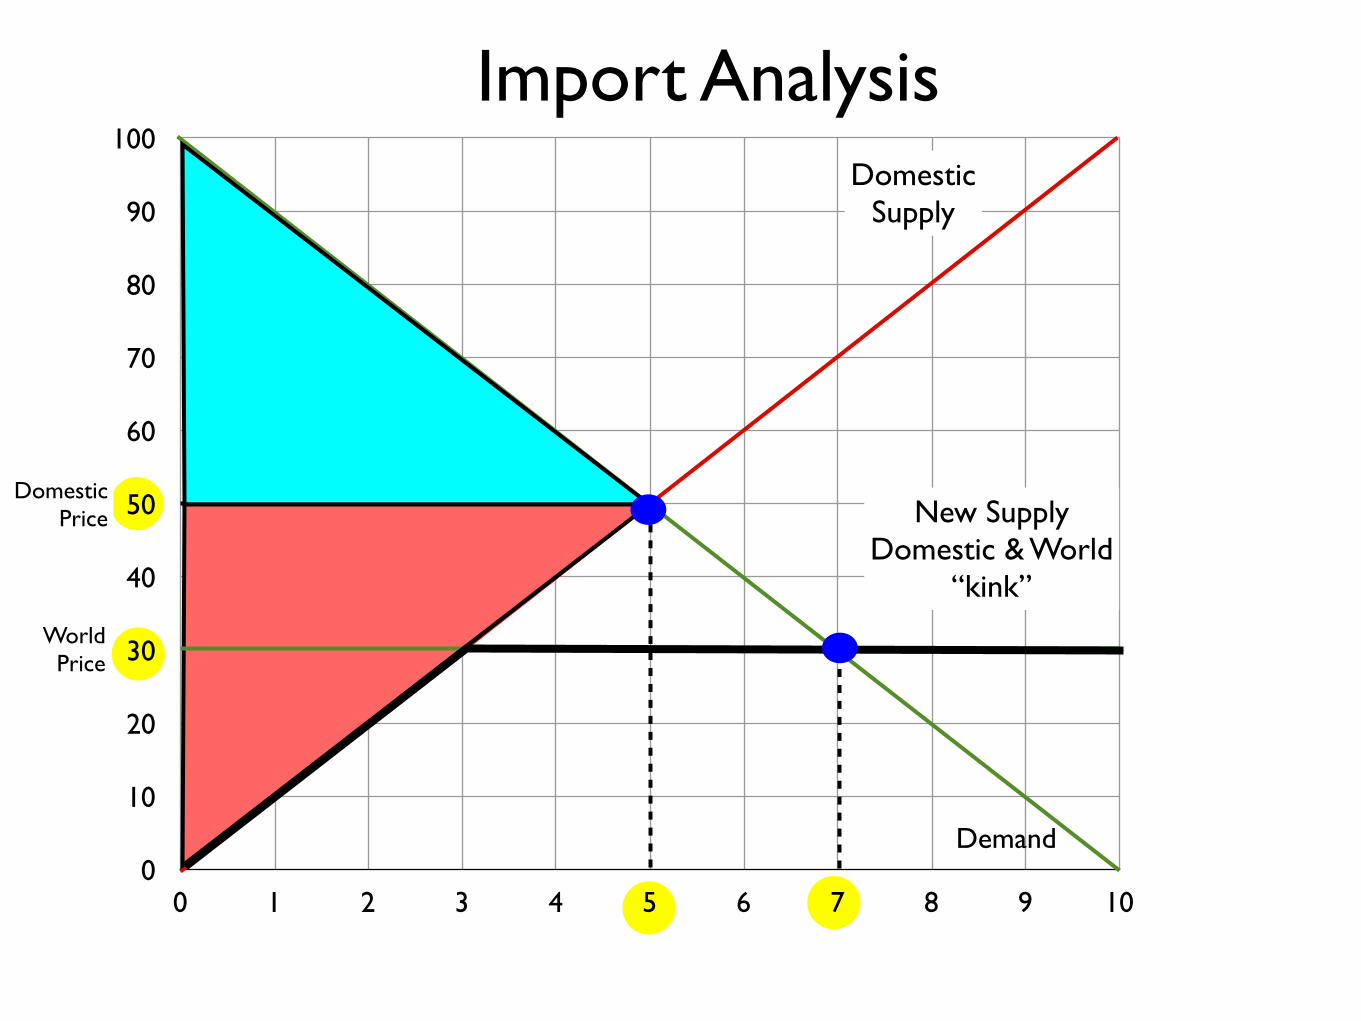
Import Analysis
DomesticPrice
WorldPrice
New SupplyDomestic & World
“kink”
Total Sales
0
10
20
30
40
50
60
70
80
90
100
0 1 2 3 4 5 6 7 8 9 10
Demand
DomesticSupply
Import Analysis
DomesticPrice
WorldPrice
New SupplyDomestic & World
“kink”
Total Sales
0
10
20
30
40
50
60
70
80
90
100
0 1 2 3 4 5 6 7 8 9 10
Demand
DomesticSupply
Import Analysis
DomesticPrice
WorldPrice
New SupplyDomestic & World
“kink”
Total Sales
0
10
20
30
40
50
60
70
80
90
100
0 1 2 3 4 5 6 7 8 9 10
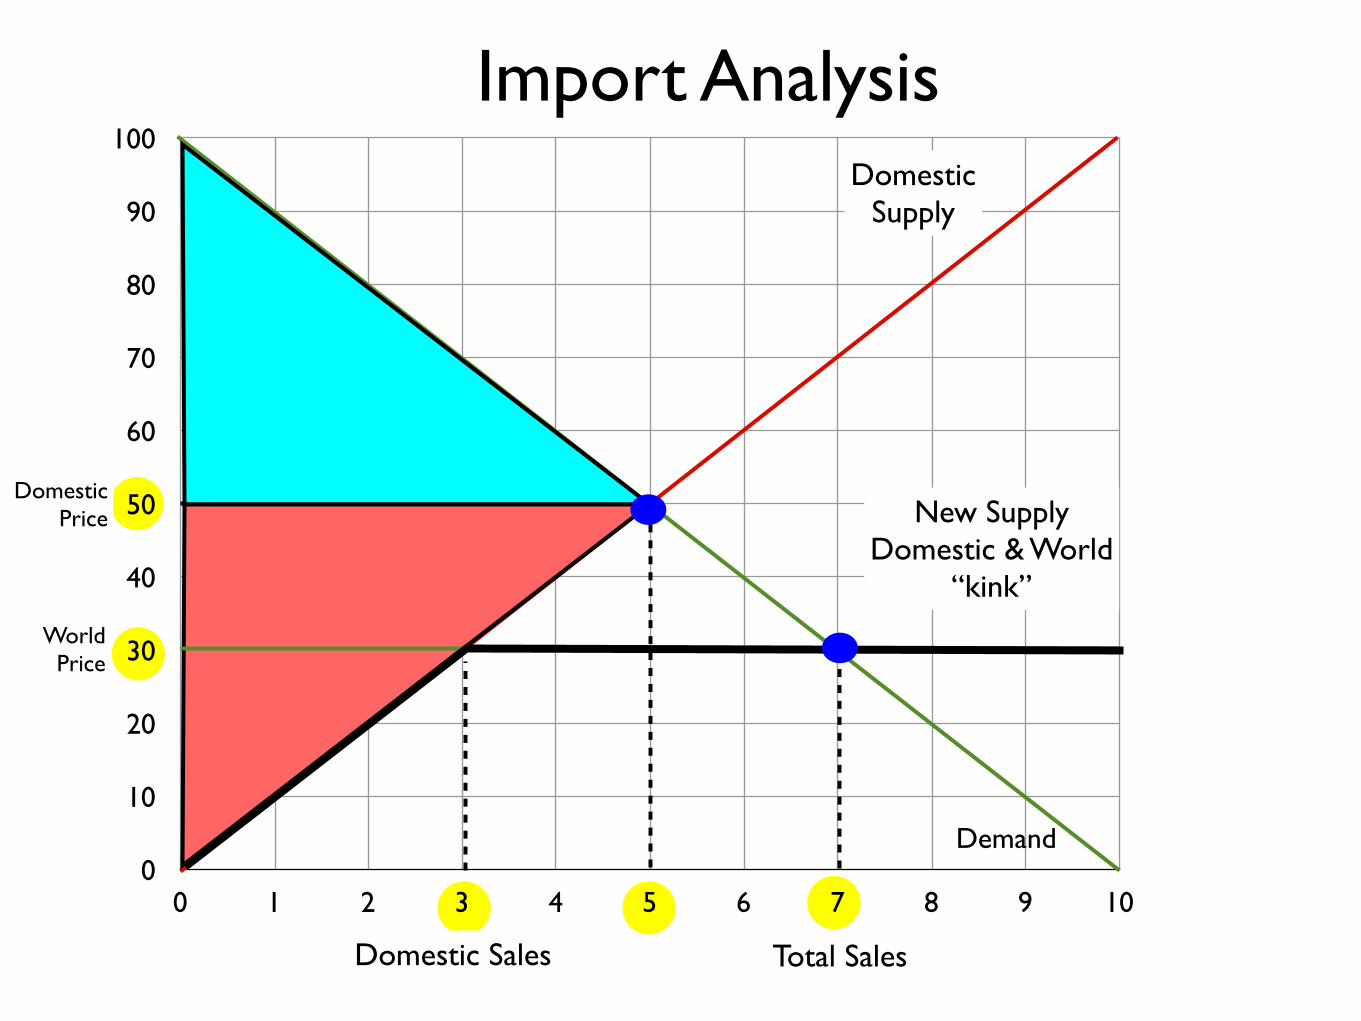
Demand
DomesticSupply
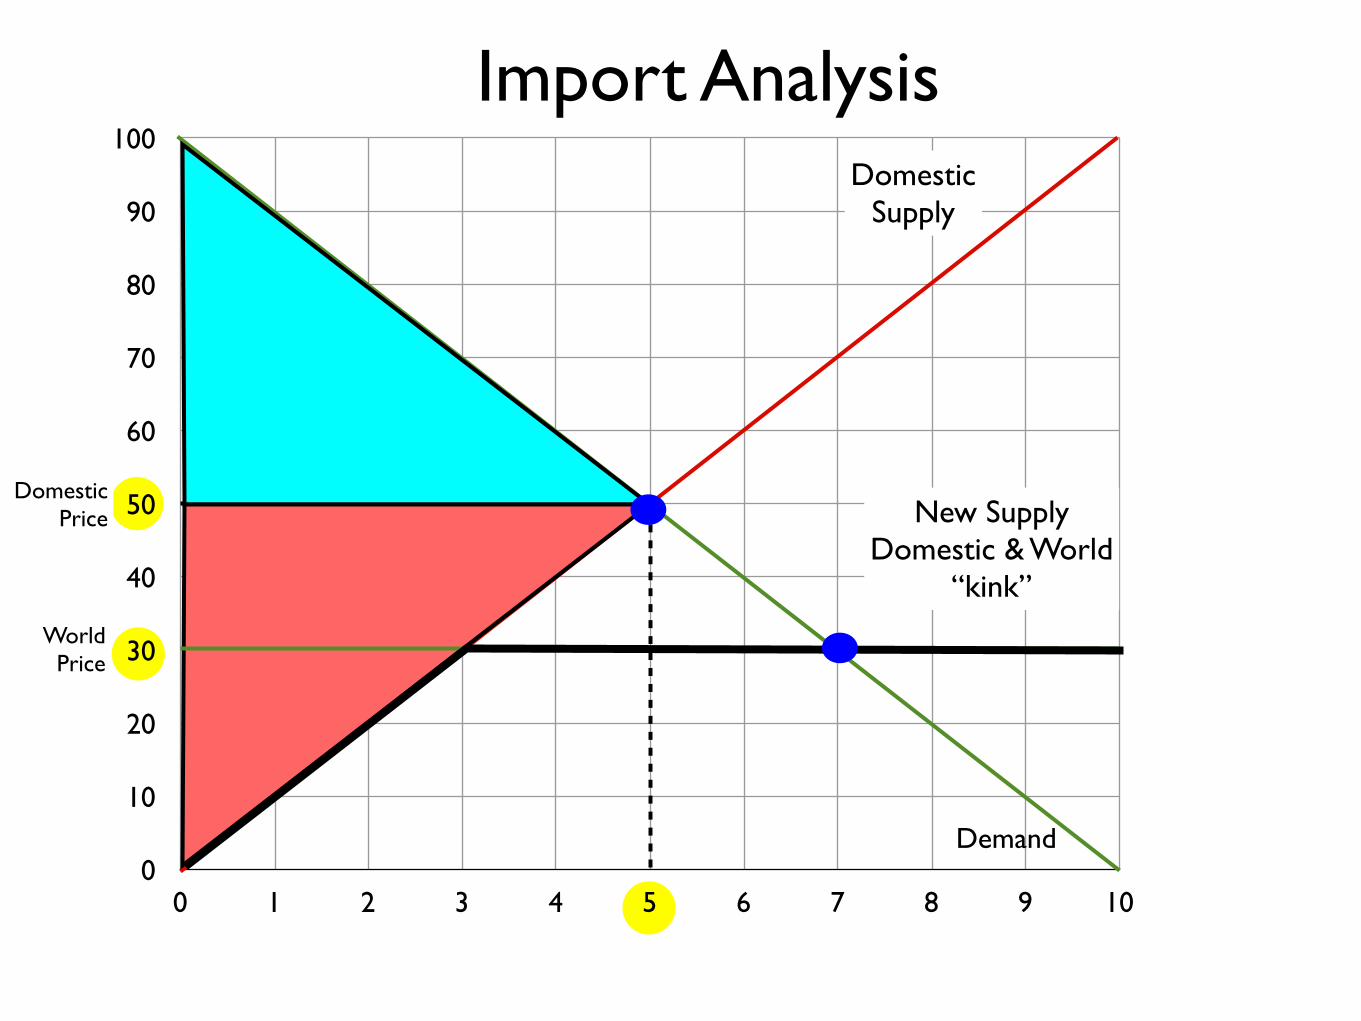
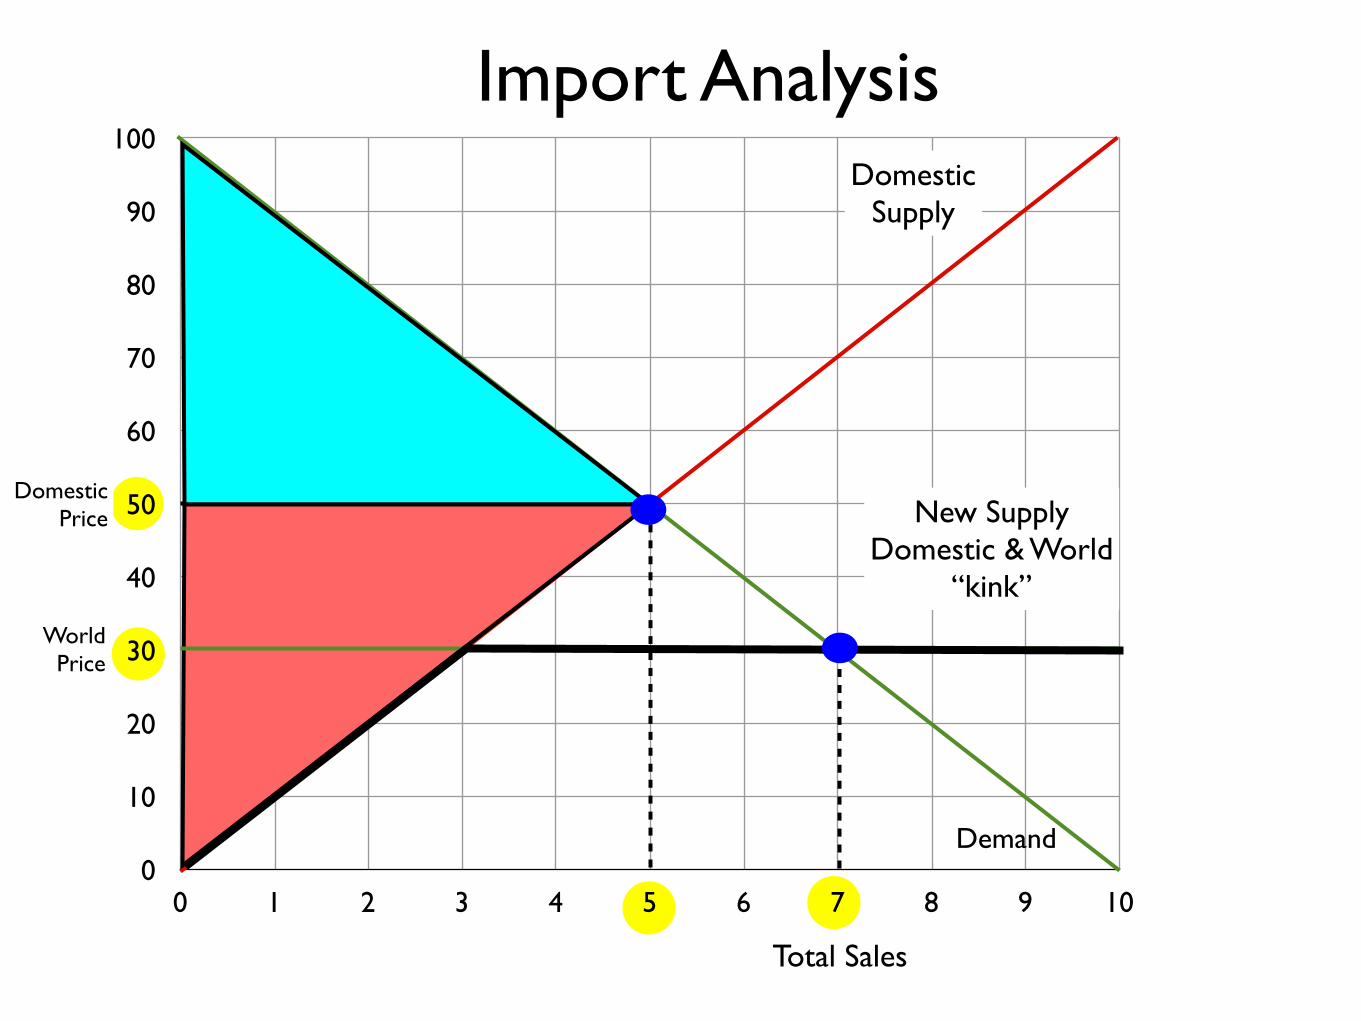
Import Analysis
DomesticPrice
WorldPrice
New SupplyDomestic & World
“kink”
Domestic Sales Total Sales
0
10
20
30
40
50
60
70
80
90
100
0 1 2 3 4 5 6 7 8 9 10
Demand
DomesticSupply
Import Analysis
DomesticPrice
WorldPrice
New SupplyDomestic & World
“kink”
Domestic Sales Total Sales
0
10
20
30
40
50
60
70
80
90
100
0 1 2 3 4 5 6 7 8 9 10
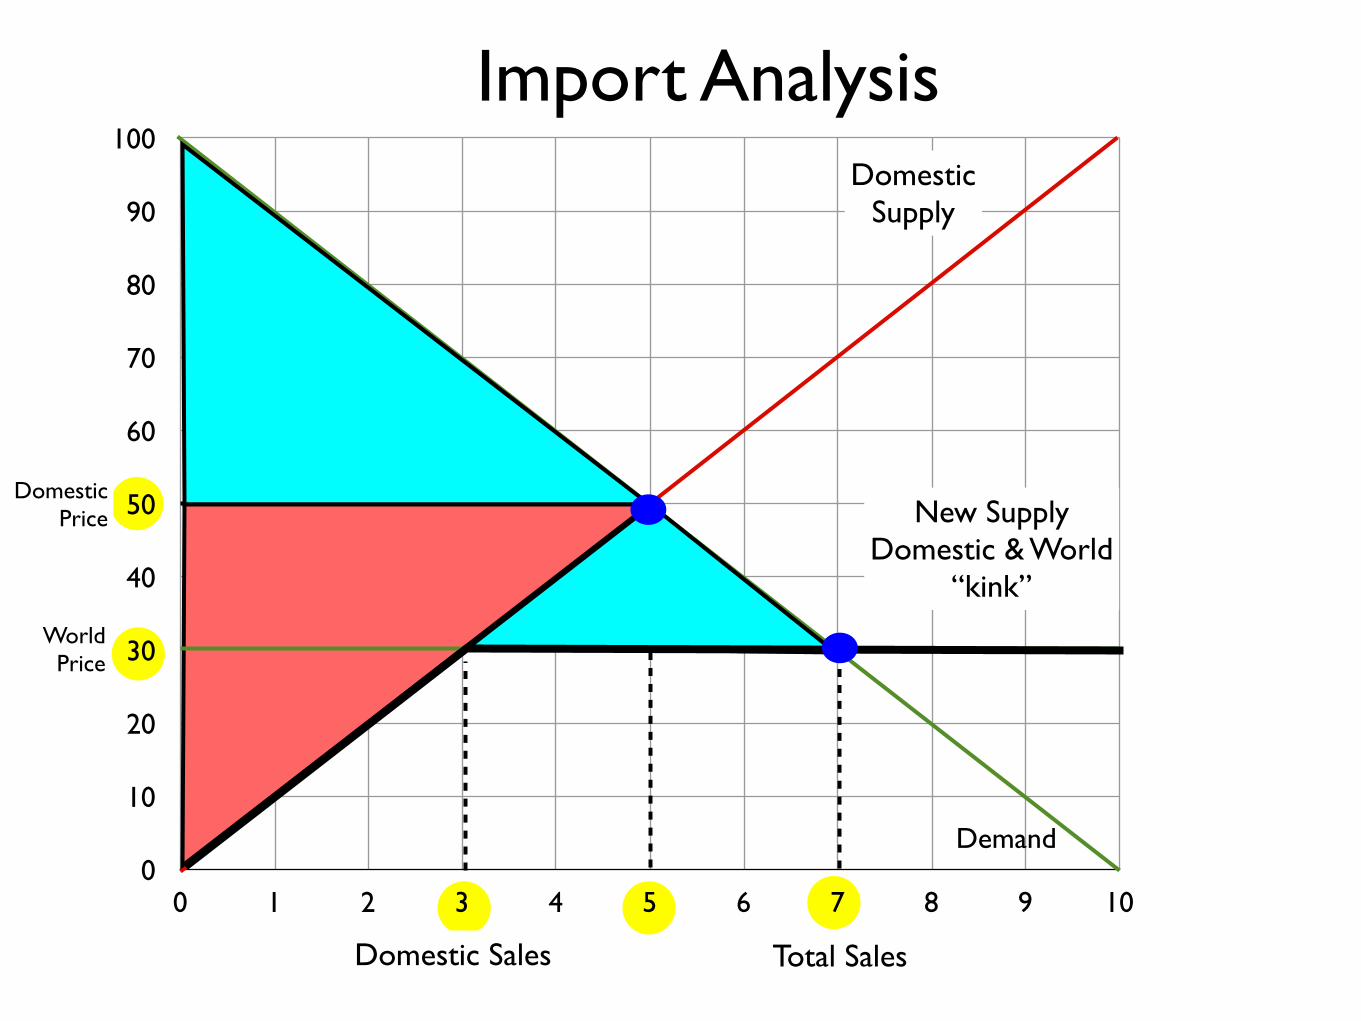
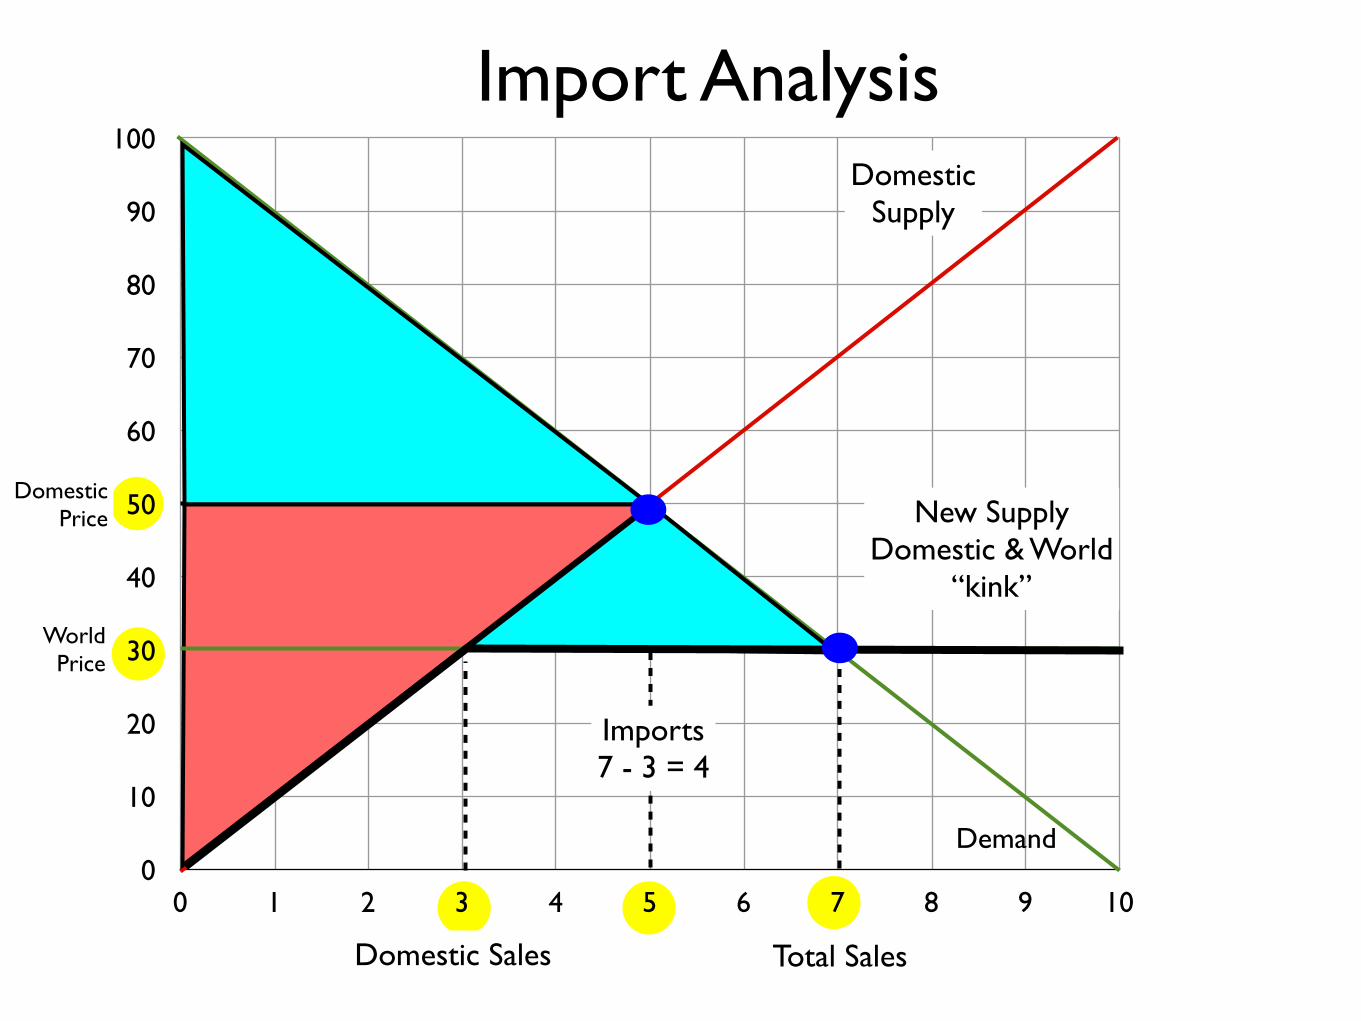
Demand
DomesticSupply
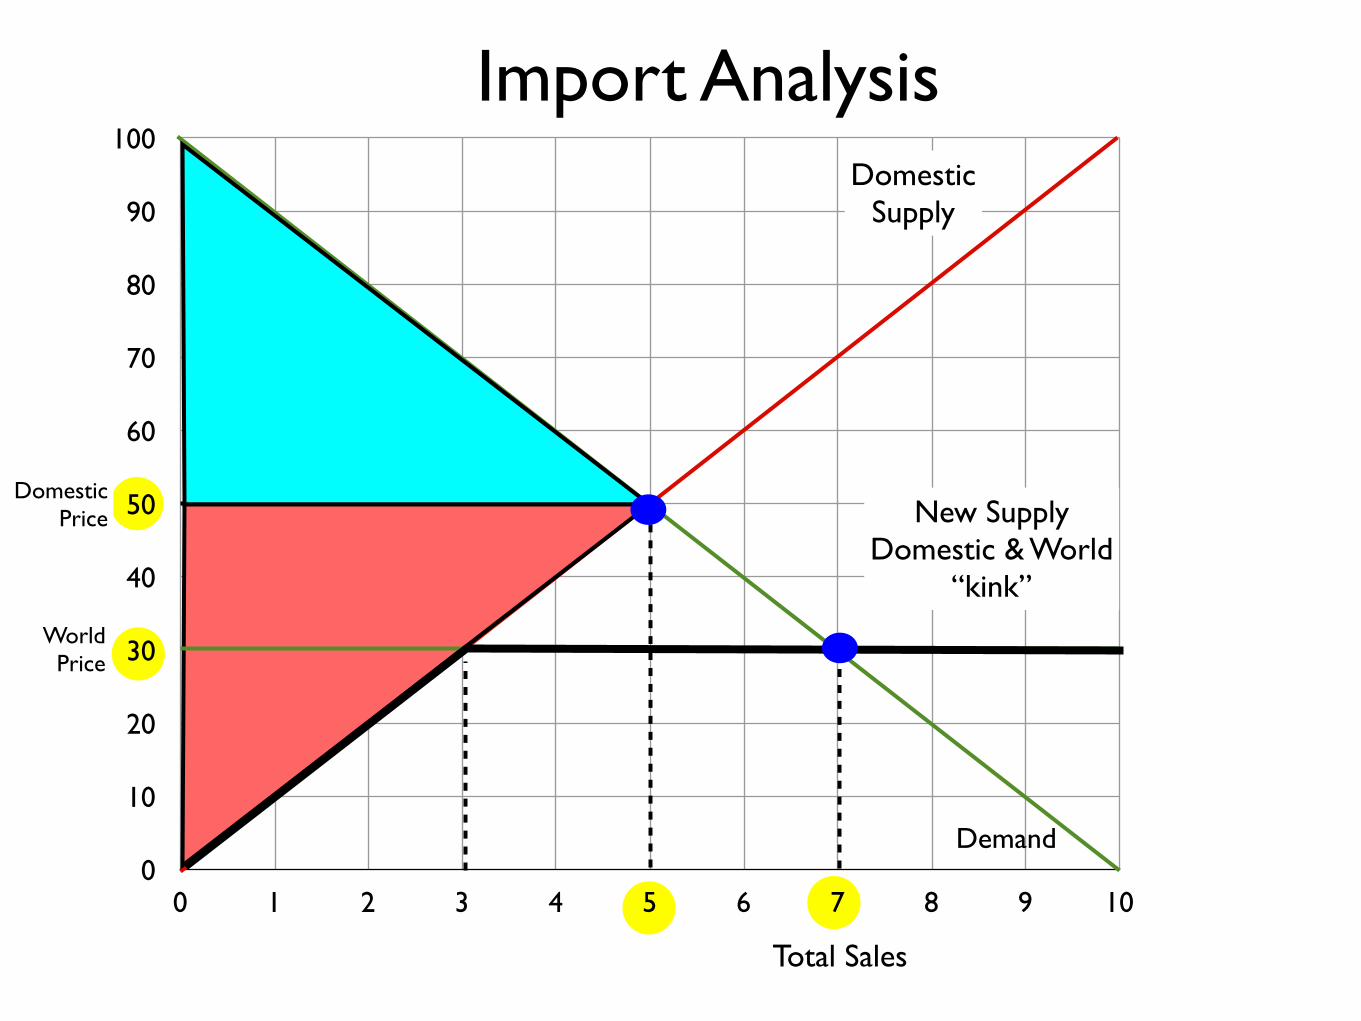
Import Analysis
DomesticPrice
WorldPrice
New SupplyDomestic & World
“kink”
Domestic Sales Total Sales
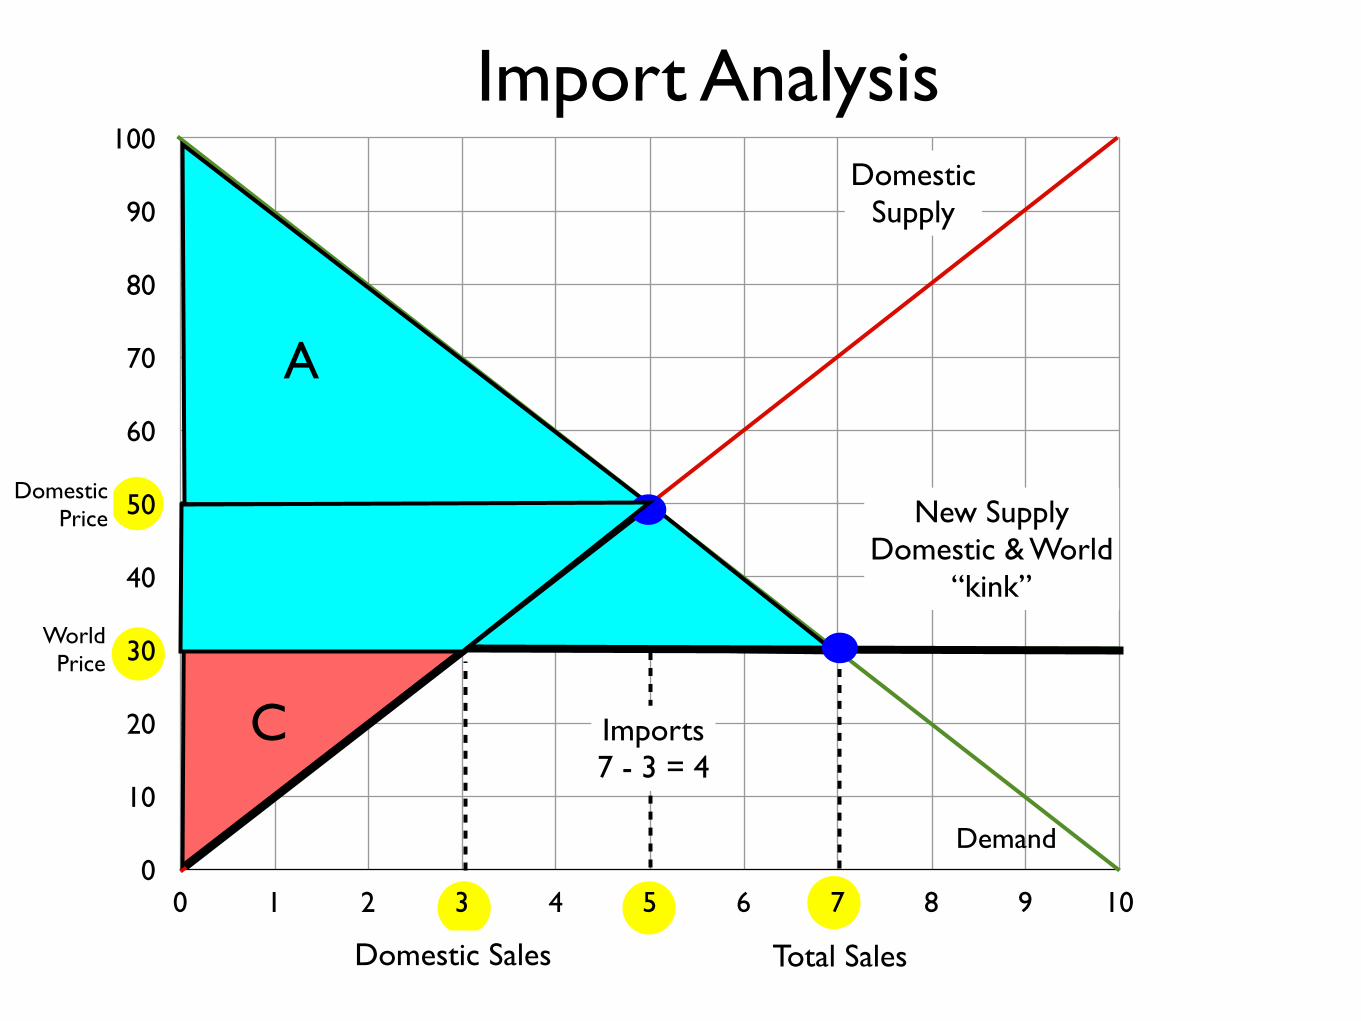
Imports7 - 3 = 4

0
10
20
30
40
50
60
70
80
90
100
0 1 2 3 4 5 6 7 8 9 10
Demand
DomesticSupply
A
Import Analysis
DomesticPrice
WorldPrice
New SupplyDomestic & World
“kink”
Domestic Sales Total Sales
Imports7 - 3 = 4

0
10
20
30
40
50
60
70
80
90
100
0 1 2 3 4 5 6 7 8 9 10
Demand
DomesticSupply
A
B
Import Analysis
DomesticPrice
WorldPrice
New SupplyDomestic & World
“kink”
Domestic Sales Total Sales
Imports7 - 3 = 4

0
10
20
30
40
50
60
70
80
90
100
0 1 2 3 4 5 6 7 8 9 10
Demand
DomesticSupply
A
B
C
Import Analysis
DomesticPrice
WorldPrice
New SupplyDomestic & World
“kink”
Domestic Sales Total Sales
Imports7 - 3 = 4

0
10
20
30
40
50
60
70
80
90
100
0 1 2 3 4 5 6 7 8 9 10
Demand
DomesticSupply
A
B
C
D
Import Analysis
DomesticPrice
WorldPrice
New SupplyDomestic & World
“kink”
Domestic Sales Total Sales
Imports7 - 3 = 4
0
10
20
30
40
50
60
70
80
90
100
0 1 2 3 4 5 6 7 8 9 10
Demand
DomesticSupply
A
B
C
D
Import Analysis
DomesticPrice
WorldPrice
New SupplyDomestic & World
“kink”
Domestic Sales Total Sales
Imports7 - 3 = 4
0
10
20
30
40
50
60
70
80
90
100
0 1 2 3 4 5 6 7 8 9 10
Demand
DomesticSupply
A
B
C
D
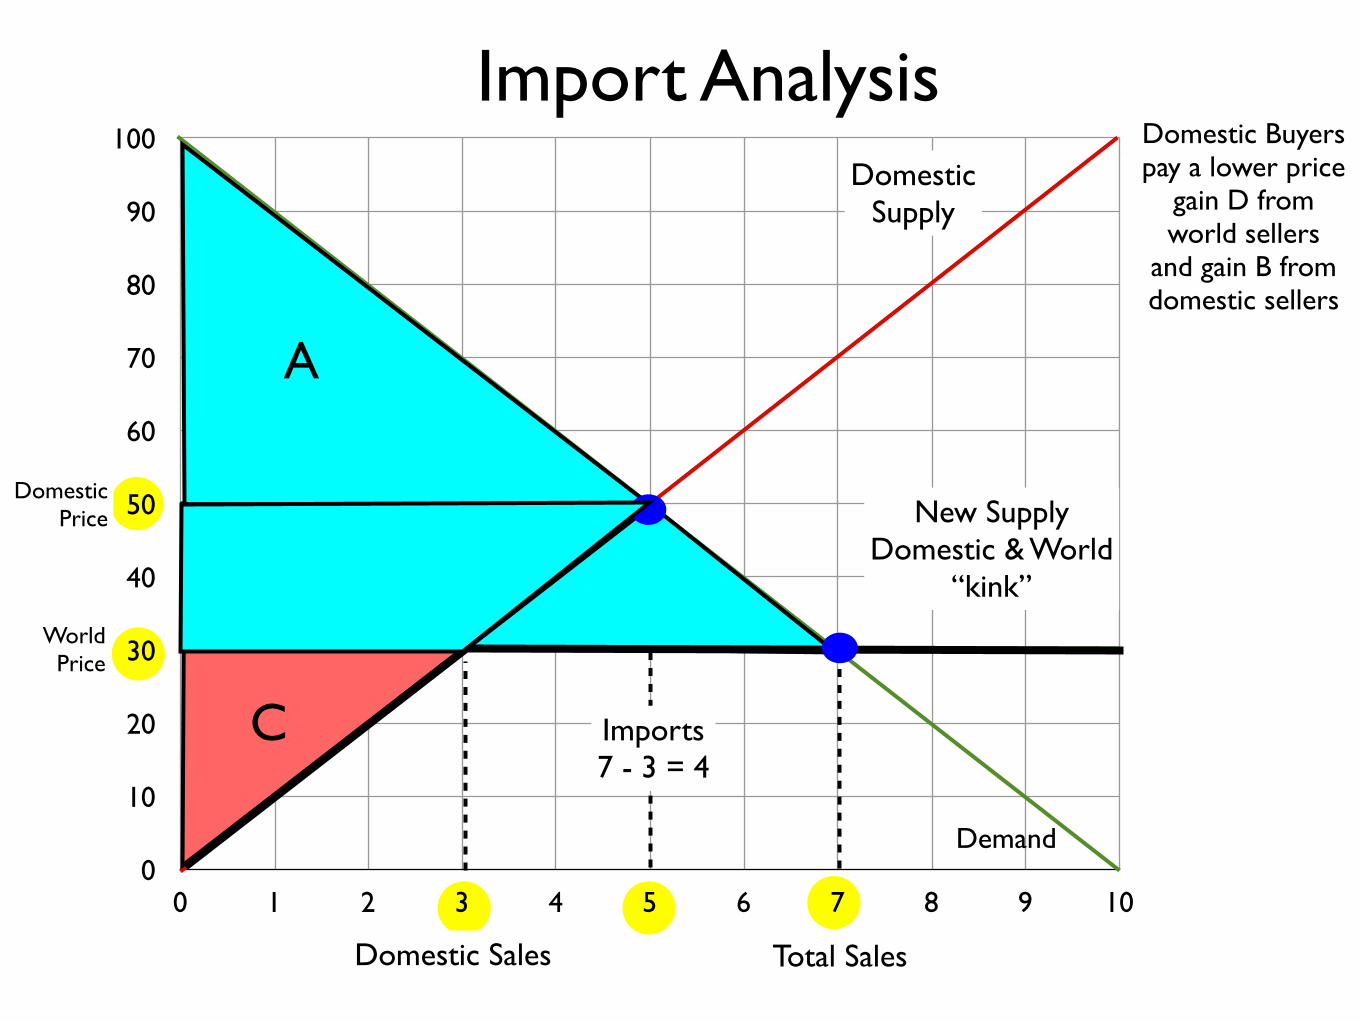
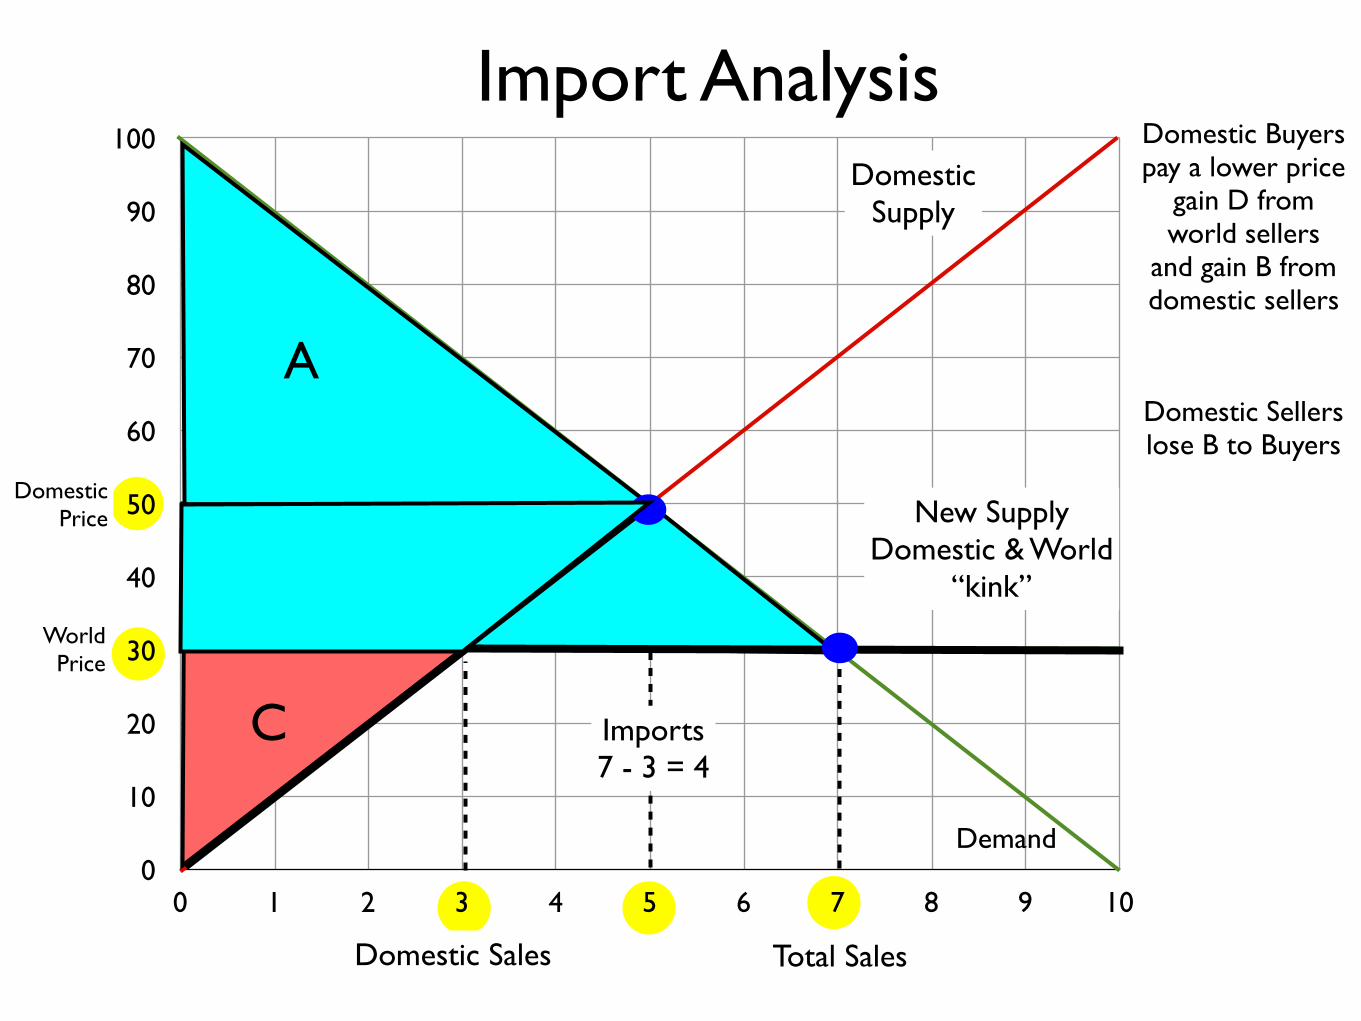
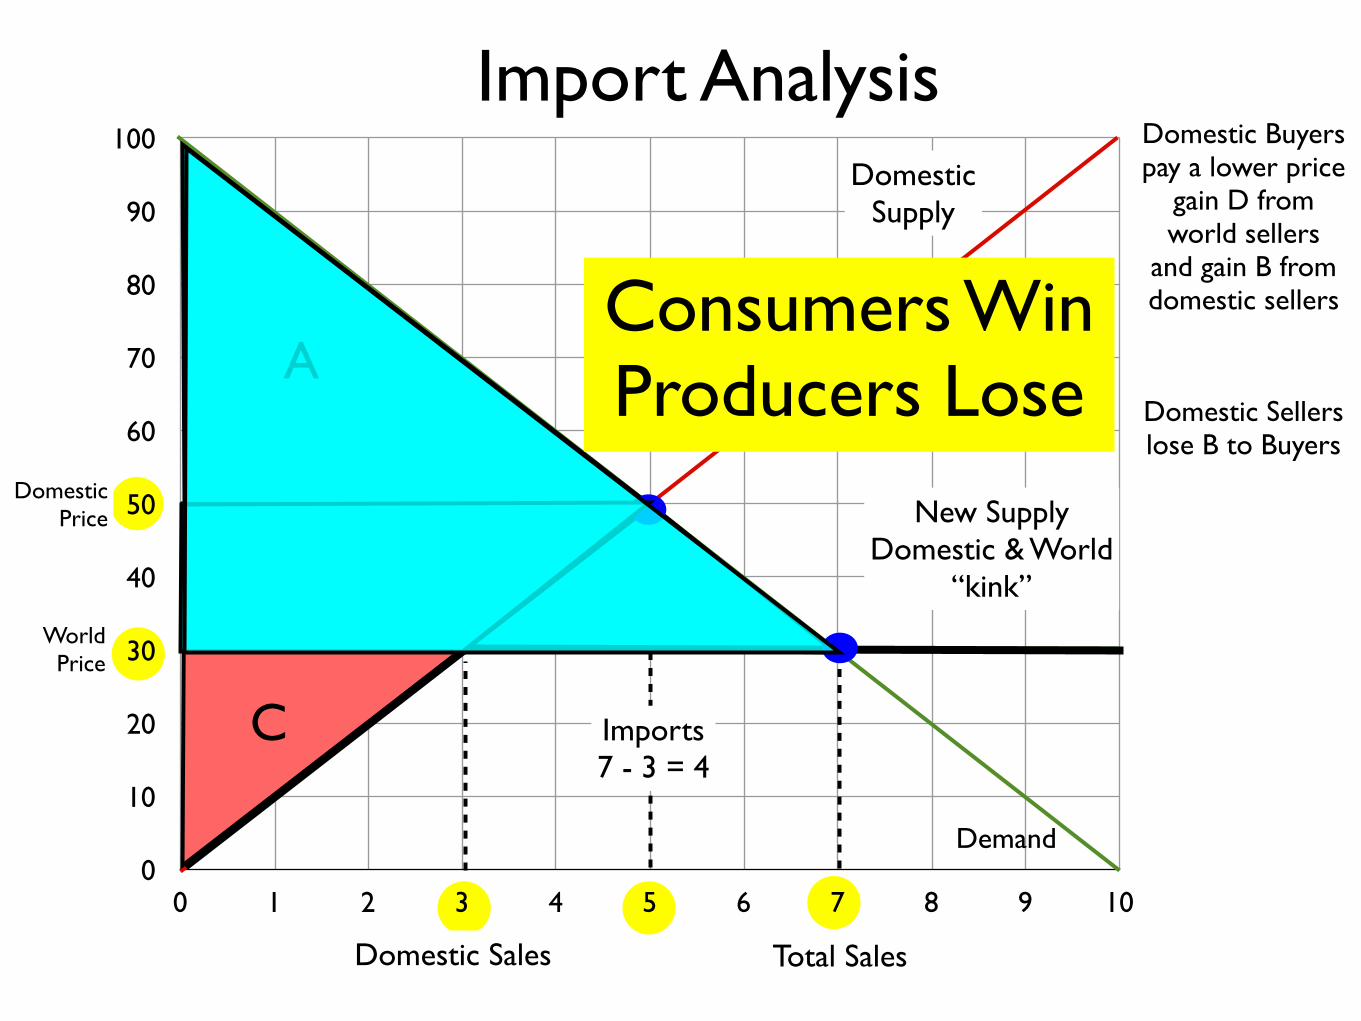
Domestic Buyerspay a lower price
gain D from world sellers
and gain B from domestic sellers
Import Analysis
DomesticPrice
WorldPrice
New SupplyDomestic & World
“kink”
Domestic Sales Total Sales
Imports7 - 3 = 4
0
10
20
30
40
50
60
70
80
90
100
0 1 2 3 4 5 6 7 8 9 10
Demand
DomesticSupply
A
B
C
D
Domestic Buyerspay a lower price
gain D from world sellers
and gain B from domestic sellers
Domestic Sellerslose B to Buyers
Import Analysis
DomesticPrice
WorldPrice
New SupplyDomestic & World
“kink”
Domestic Sales Total Sales
Imports7 - 3 = 4
0
10
20
30
40
50
60
70
80
90
100
0 1 2 3 4 5 6 7 8 9 10
Demand
DomesticSupply
A
B
C
D
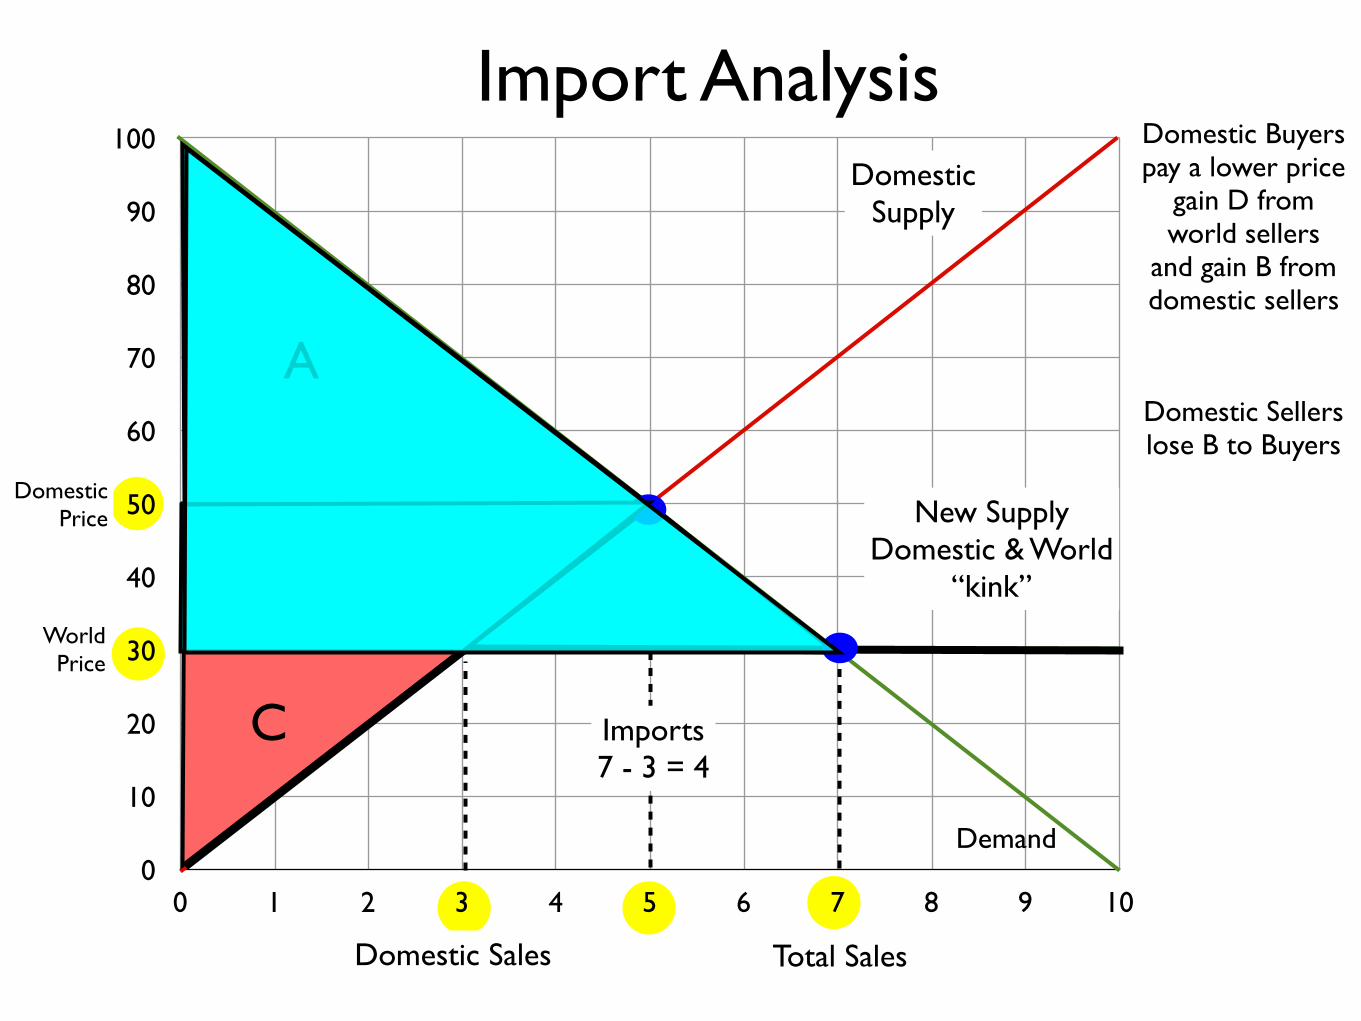
Domestic Buyerspay a lower price
gain D from world sellers
and gain B from domestic sellers
Domestic Sellerslose B to Buyers
Import Analysis
DomesticPrice
WorldPrice
New SupplyDomestic & World
“kink”
Domestic Sales Total Sales
Imports7 - 3 = 4
Consumers WinProducers Lose
0
10
20
30
40
50
60
70
80
90
100
0 1 2 3 4 5 6 7 8 9 10
Demand
DomesticSupply
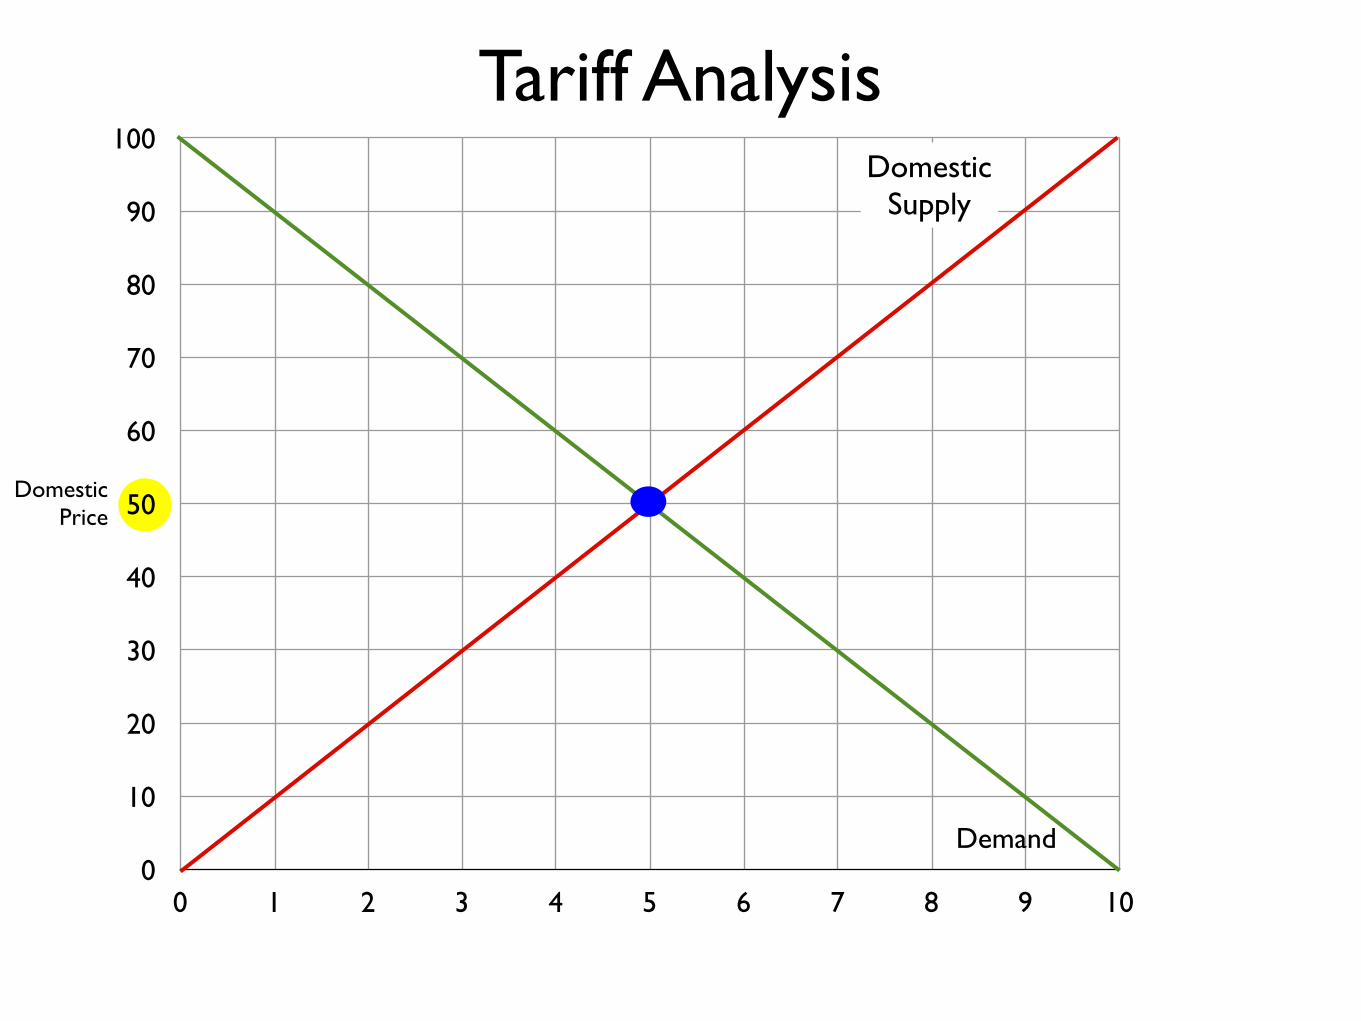
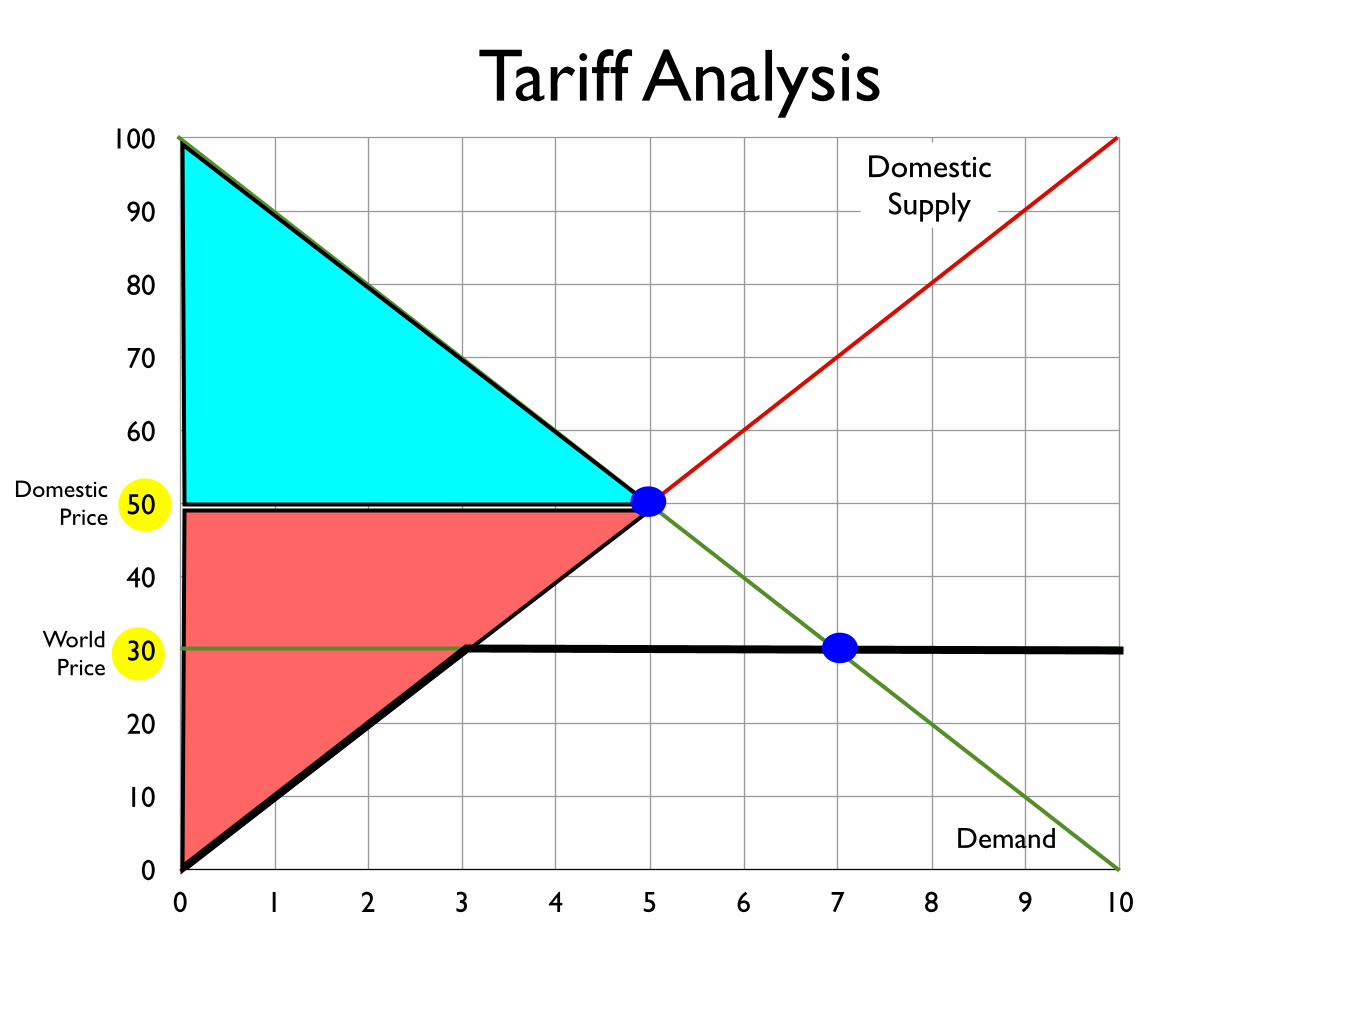
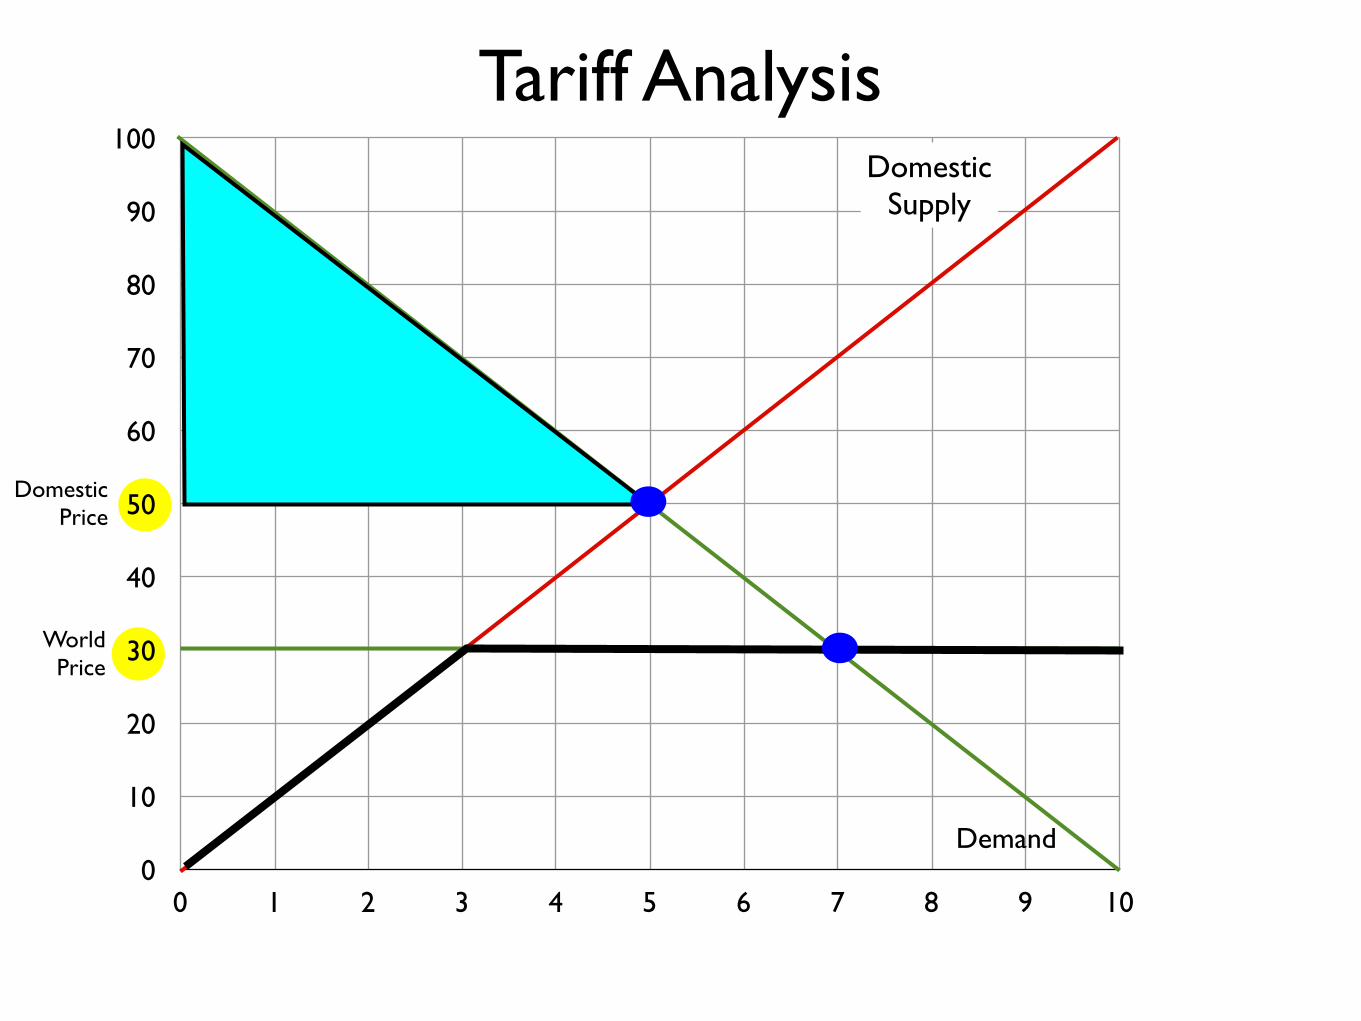
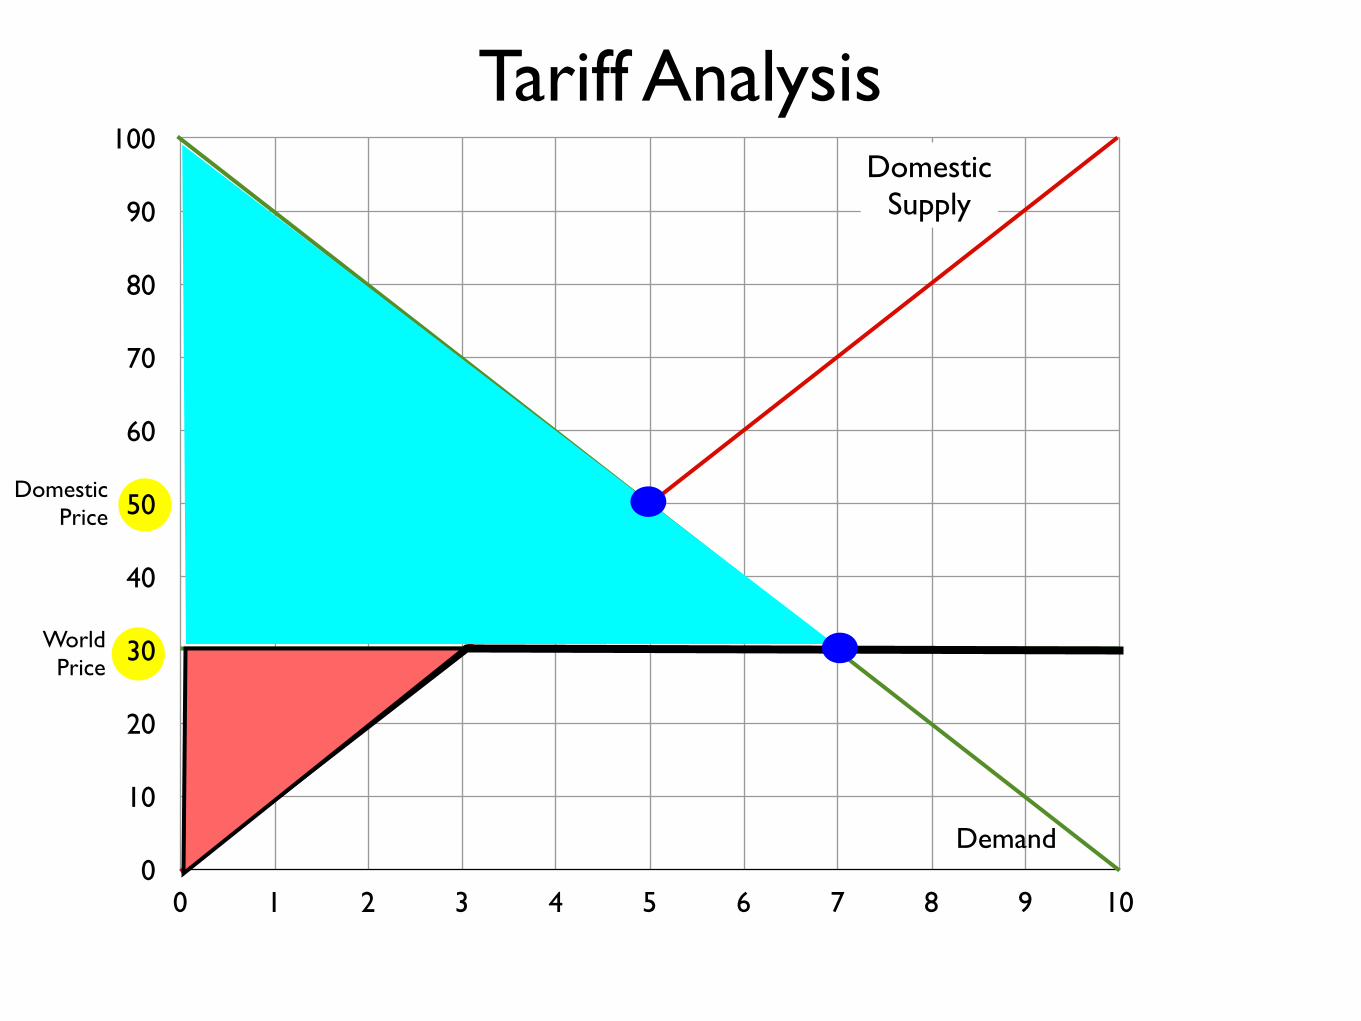
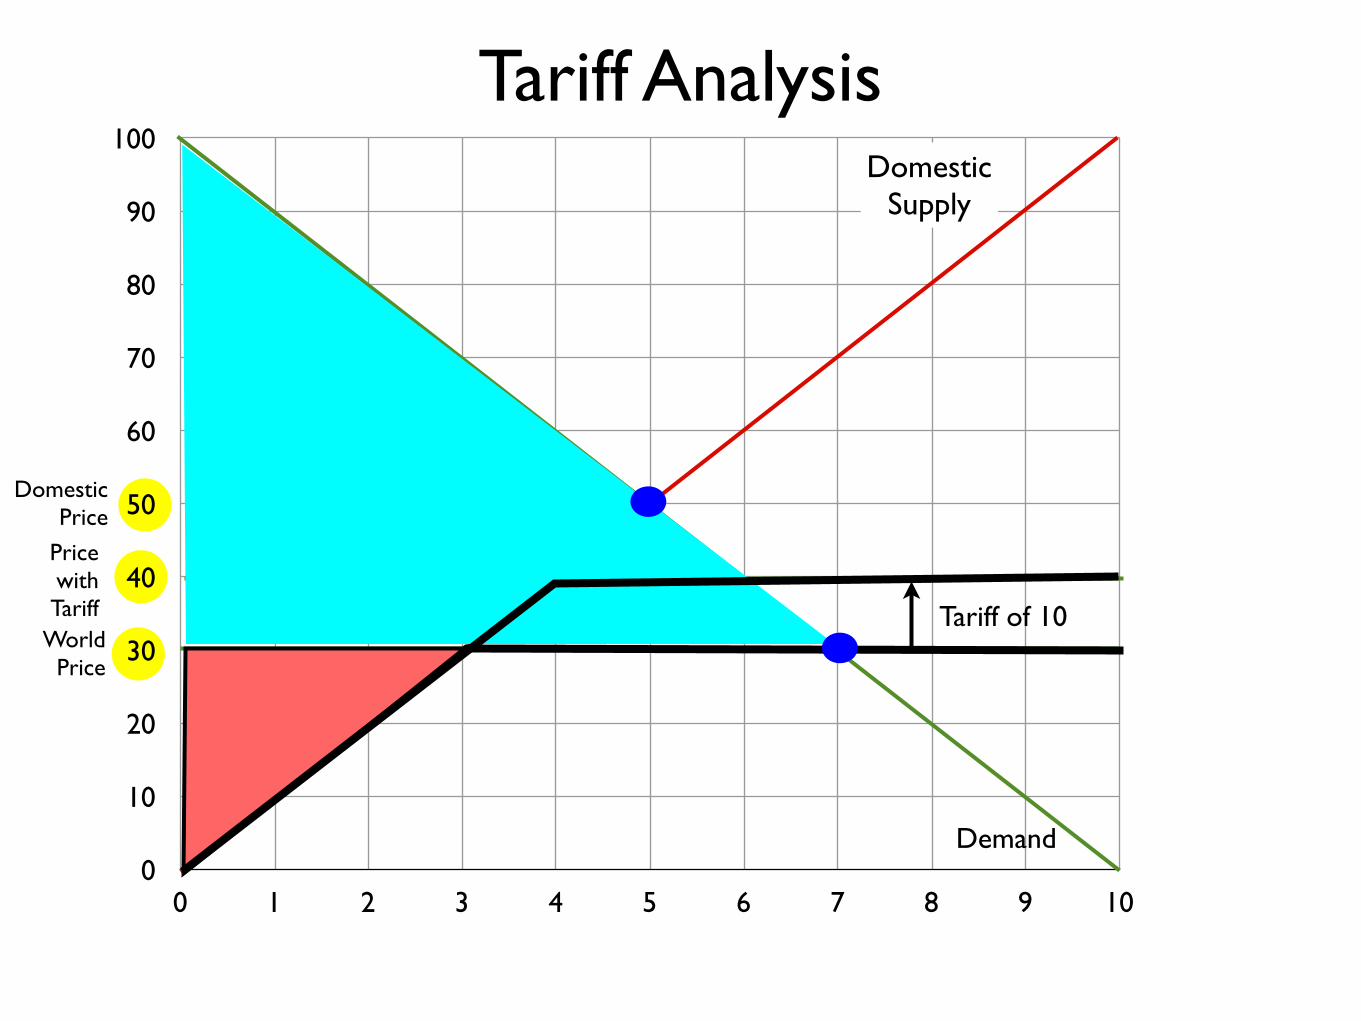
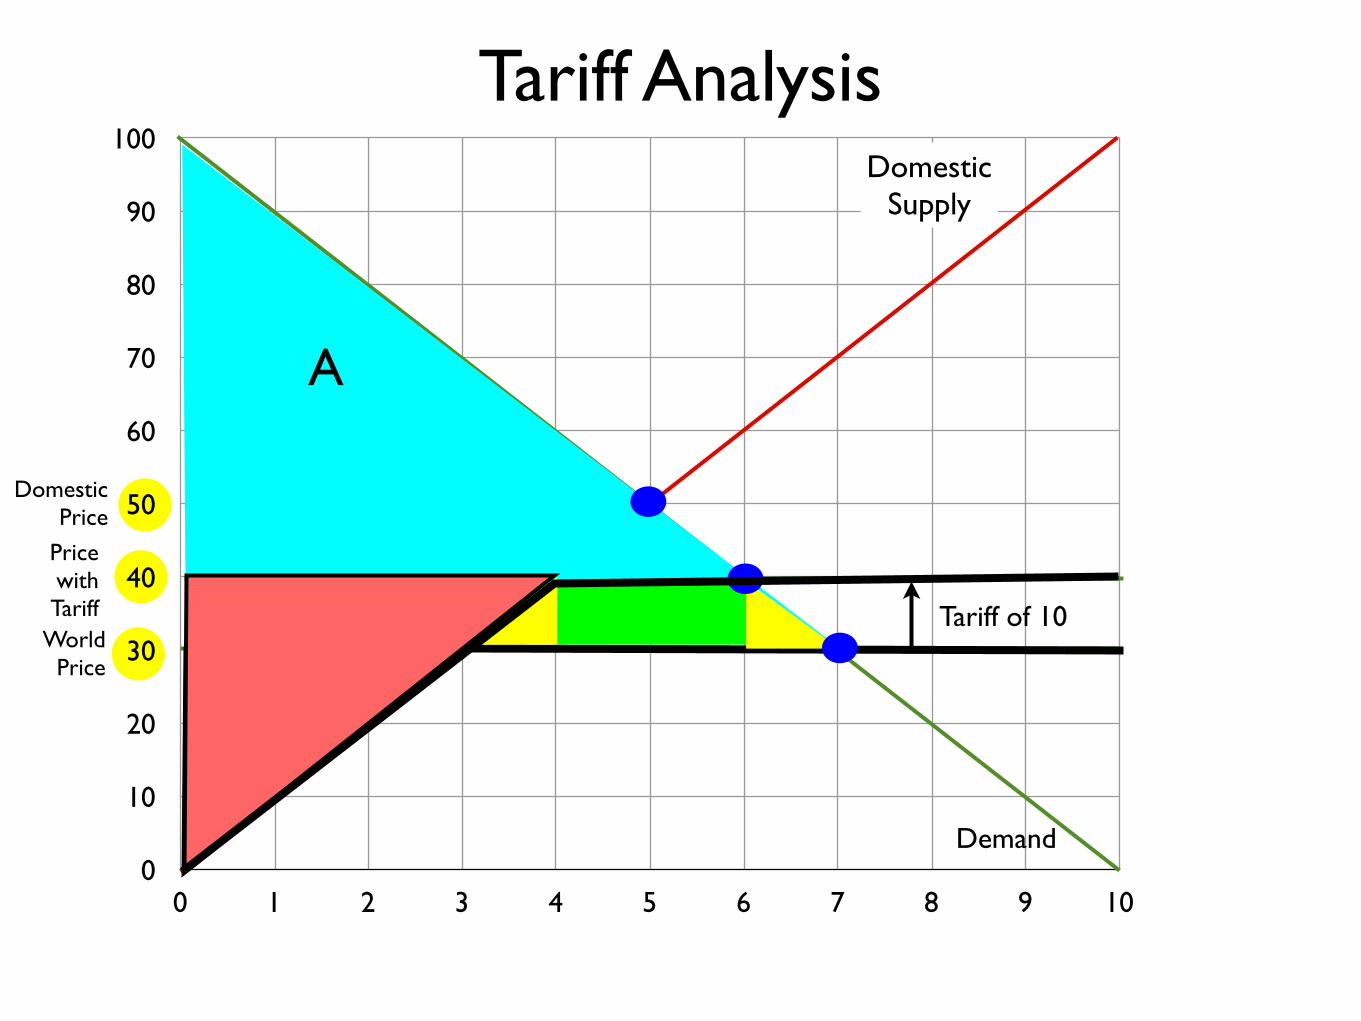
Tariff Analysis
DomesticPrice
0
10
20
30
40
50
60
70
80
90
100
0 1 2 3 4 5 6 7 8 9 10
Demand
DomesticSupply
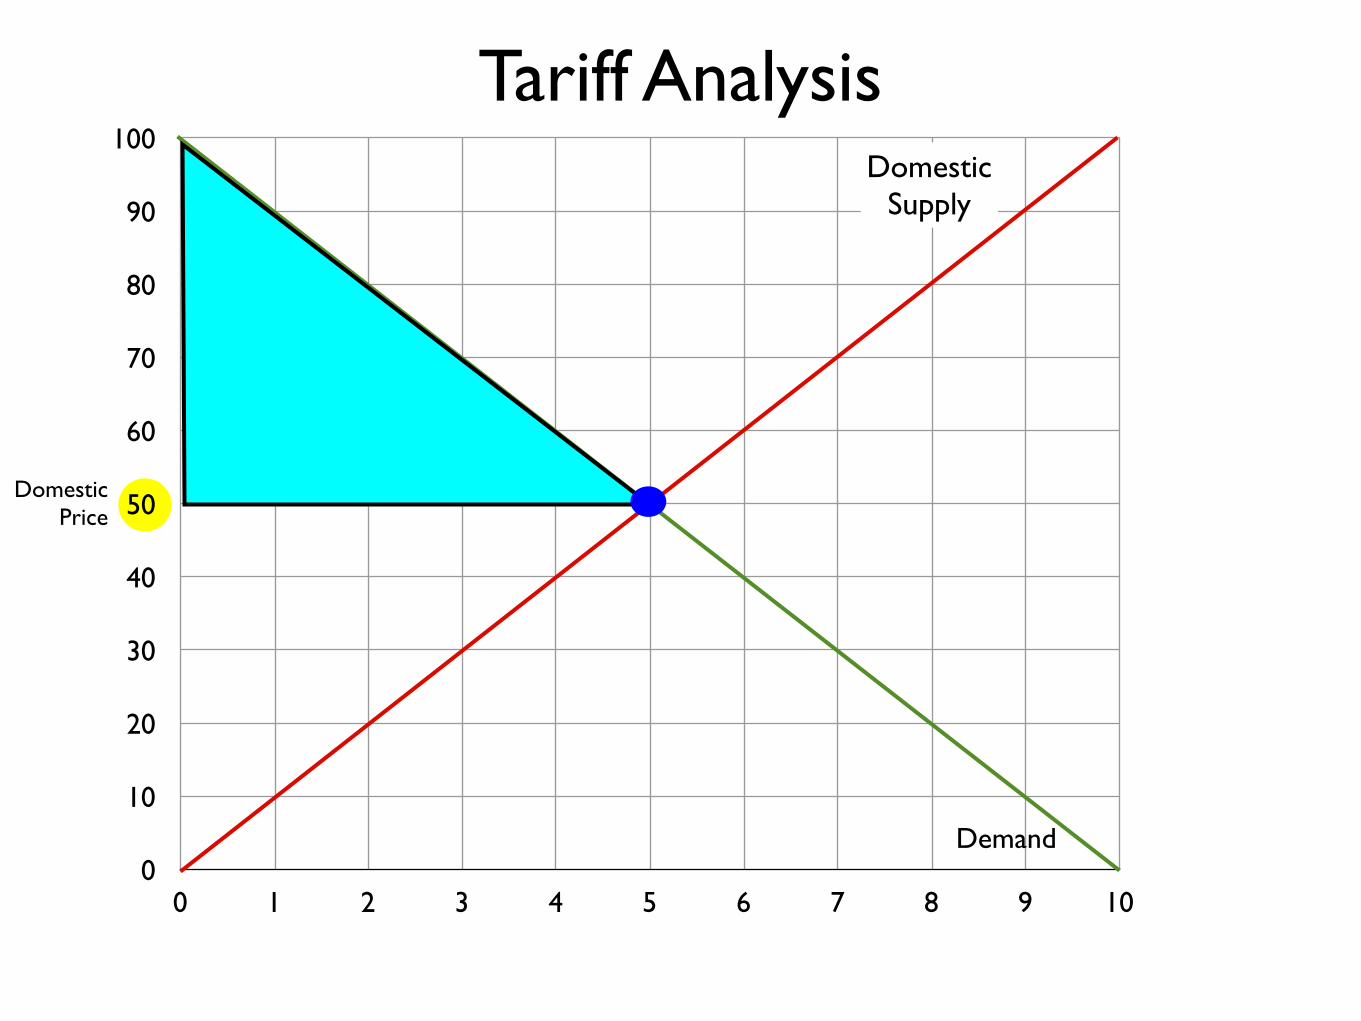
Tariff Analysis
DomesticPrice

0
10
20
30
40
50
60
70
80
90
100
0 1 2 3 4 5 6 7 8 9 10
Demand
DomesticSupply
Tariff Analysis
DomesticPrice

0
10
20
30
40
50
60
70
80
90
100
0 1 2 3 4 5 6 7 8 9 10
Demand
DomesticSupply
Tariff Analysis
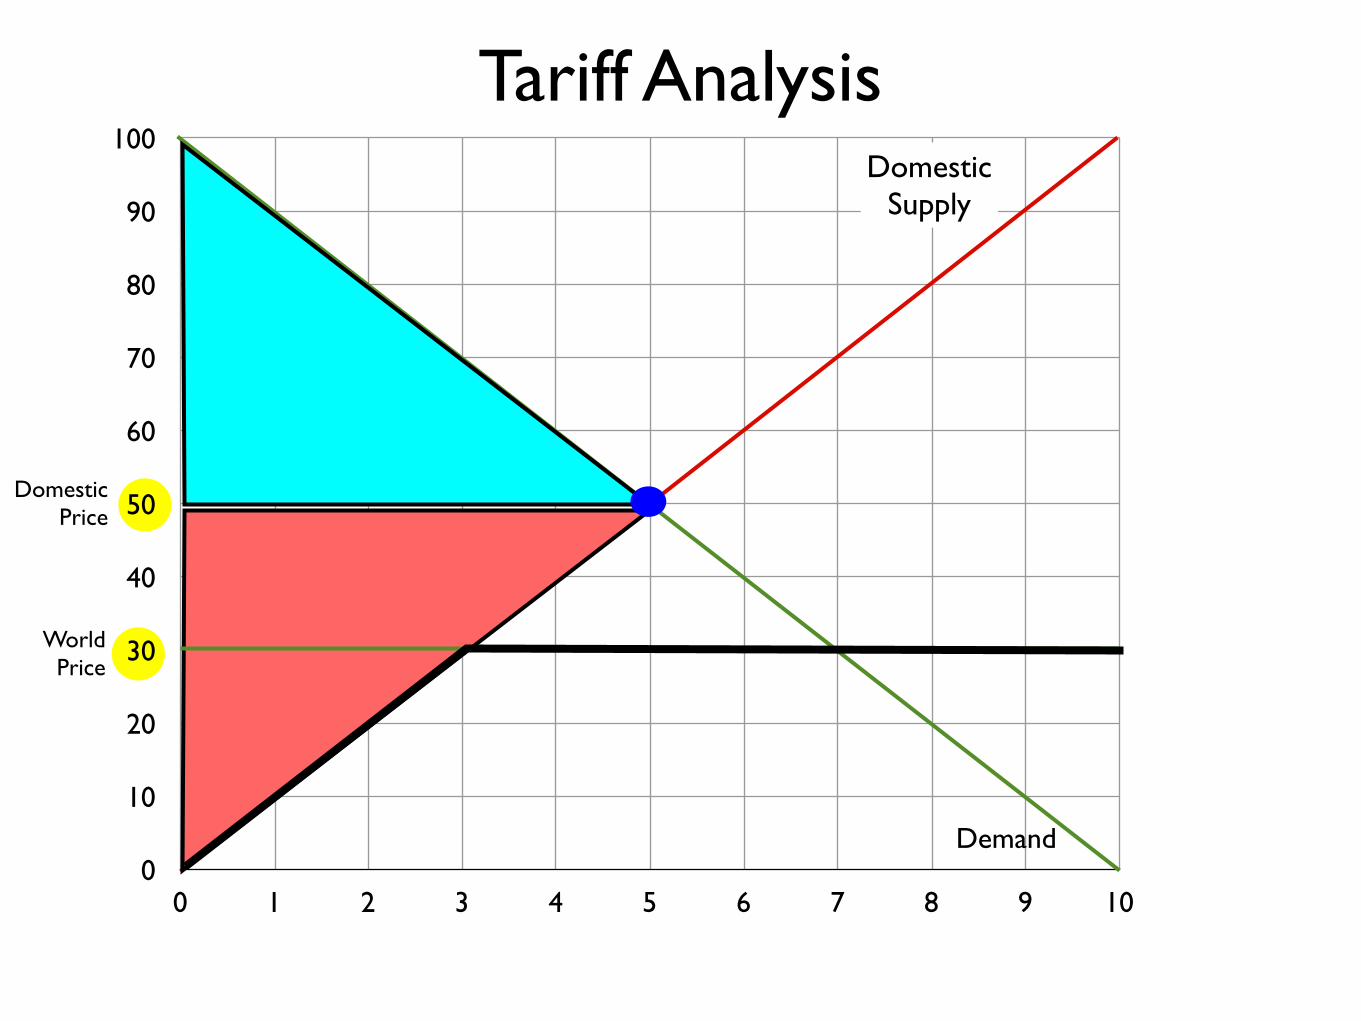
WorldPrice
DomesticPrice
0
10
20
30
40
50
60
70
80
90
100
0 1 2 3 4 5 6 7 8 9 10
Demand
DomesticSupply
Tariff Analysis
WorldPrice
DomesticPrice
0
10
20
30
40
50
60
70
80
90
100
0 1 2 3 4 5 6 7 8 9 10
Demand
DomesticSupply
Tariff Analysis
WorldPrice
DomesticPrice
0
10
20
30
40
50
60
70
80
90
100
0 1 2 3 4 5 6 7 8 9 10
Demand
DomesticSupply
Tariff Analysis
WorldPrice
DomesticPrice
0
10
20
30
40
50
60
70
80
90
100
0 1 2 3 4 5 6 7 8 9 10
Demand
DomesticSupply
Tariff Analysis
WorldPrice
DomesticPrice

0
10
20
30
40
50
60
70
80
90
100
0 1 2 3 4 5 6 7 8 9 10
Demand
DomesticSupply
Tariff Analysis
WorldPrice
DomesticPrice
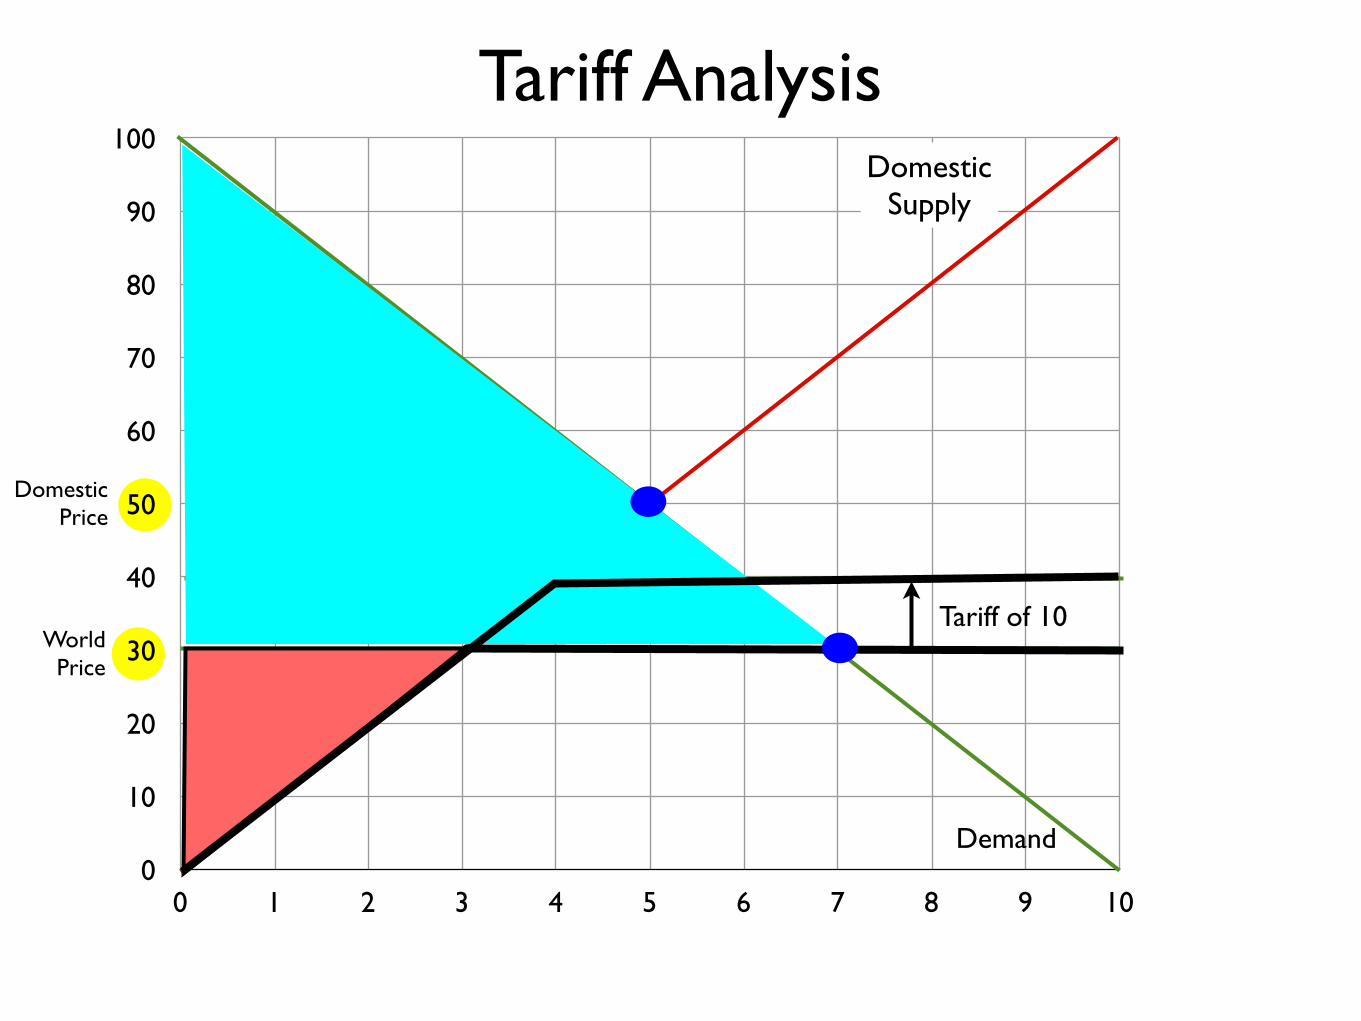
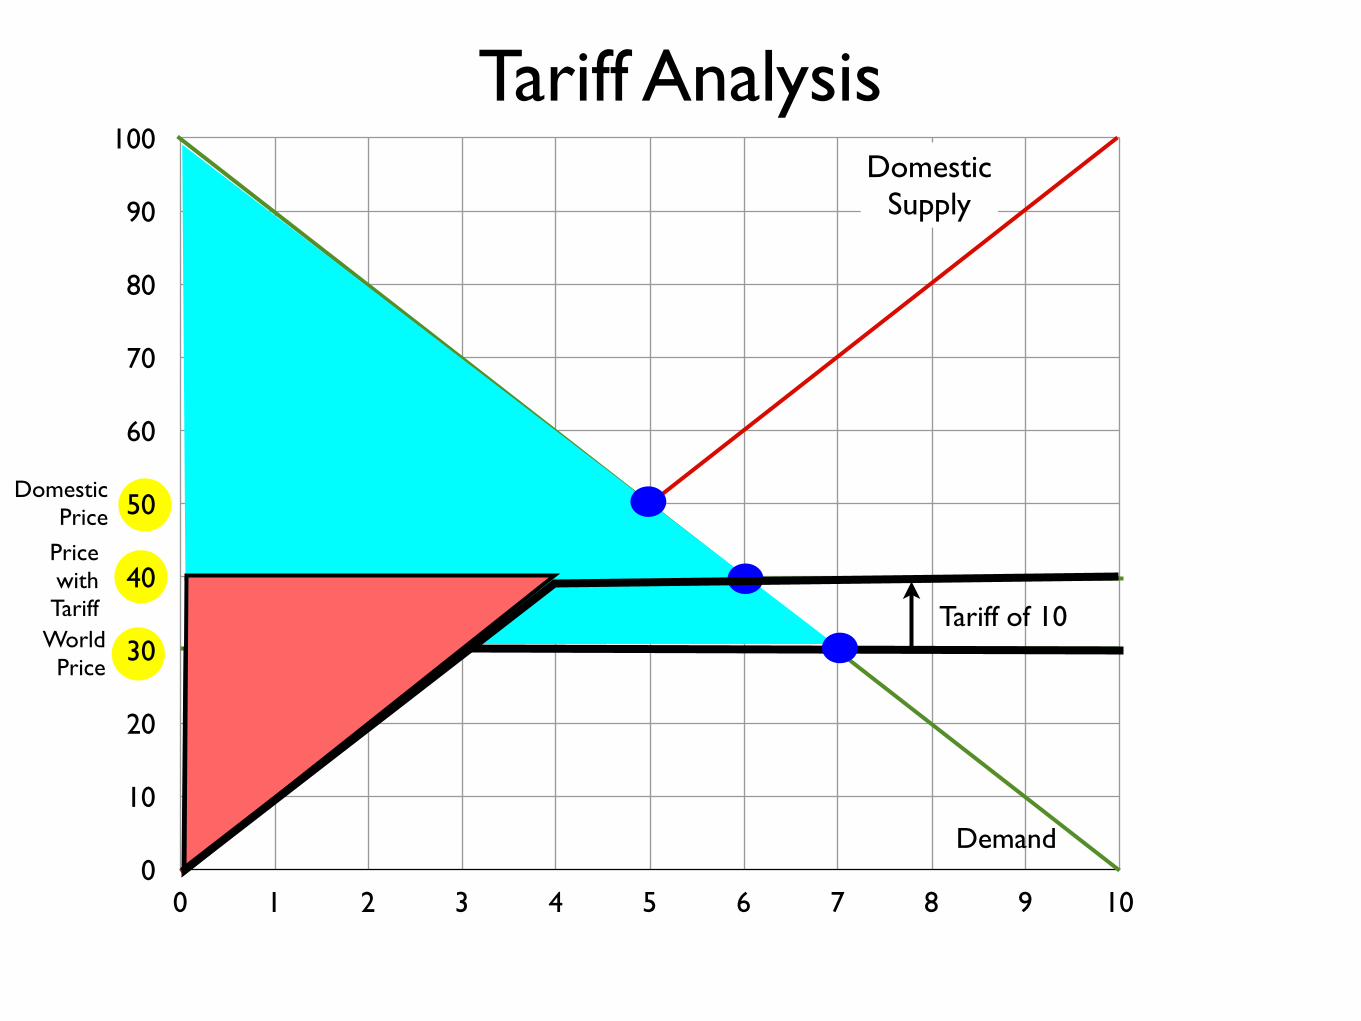
Tariff of 10

0
10
20
30
40
50
60
70
80
90
100
0 1 2 3 4 5 6 7 8 9 10
Demand
DomesticSupply
Tariff Analysis
WorldPrice
DomesticPrice
Tariff of 10
0
10
20
30
40
50
60
70
80
90
100
0 1 2 3 4 5 6 7 8 9 10
Demand
DomesticSupply
Tariff Analysis
WorldPrice
DomesticPrice
Tariff of 10

0
10
20
30
40
50
60
70
80
90
100
0 1 2 3 4 5 6 7 8 9 10
Demand
DomesticSupply
Tariff Analysis
PricewithTariff
WorldPrice
DomesticPrice
Tariff of 10
0
10
20
30
40
50
60
70
80
90
100
0 1 2 3 4 5 6 7 8 9 10
Demand
DomesticSupply
Tariff Analysis
PricewithTariff
WorldPrice
DomesticPrice
Tariff of 10

0
10
20
30
40
50
60
70
80
90
100
0 1 2 3 4 5 6 7 8 9 10
Demand
DomesticSupply
Tariff Analysis
PricewithTariff
WorldPrice
DomesticPrice
Tariff of 10
0
10
20
30
40
50
60
70
80
90
100
0 1 2 3 4 5 6 7 8 9 10
Demand
DomesticSupply
Tariff Analysis
PricewithTariff
WorldPrice
DomesticPrice
Tariff of 10
0
10
20
30
40
50
60
70
80
90
100
0 1 2 3 4 5 6 7 8 9 10
Demand
DomesticSupply
Tariff Analysis
PricewithTariff
WorldPrice
DomesticPrice
Tariff of 10
0
10
20
30
40
50
60
70
80
90
100
0 1 2 3 4 5 6 7 8 9 10
Demand
DomesticSupply
Tariff Analysis
PricewithTariff
WorldPrice
DomesticPrice
Tariff of 10

0
10
20
30
40
50
60
70
80
90
100
0 1 2 3 4 5 6 7 8 9 10
Demand
DomesticSupply
Tariff Analysis
PricewithTariff
WorldPrice
DomesticPrice
Tariff of 10
0
10
20
30
40
50
60
70
80
90
100
0 1 2 3 4 5 6 7 8 9 10
Demand
DomesticSupply
Tariff Analysis
PricewithTariff
WorldPrice
DomesticPrice
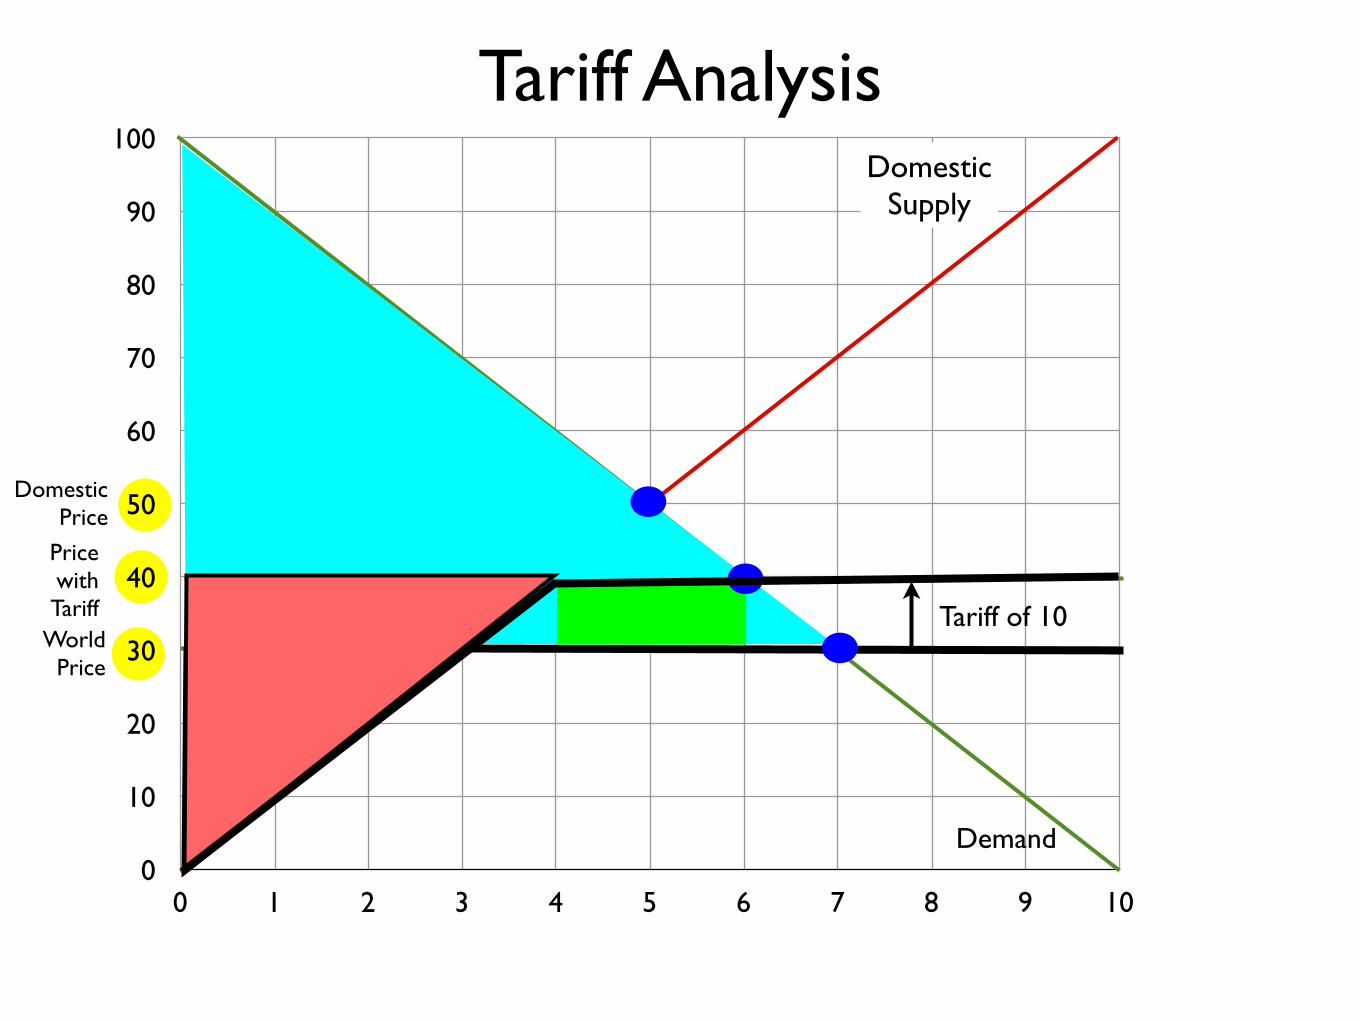
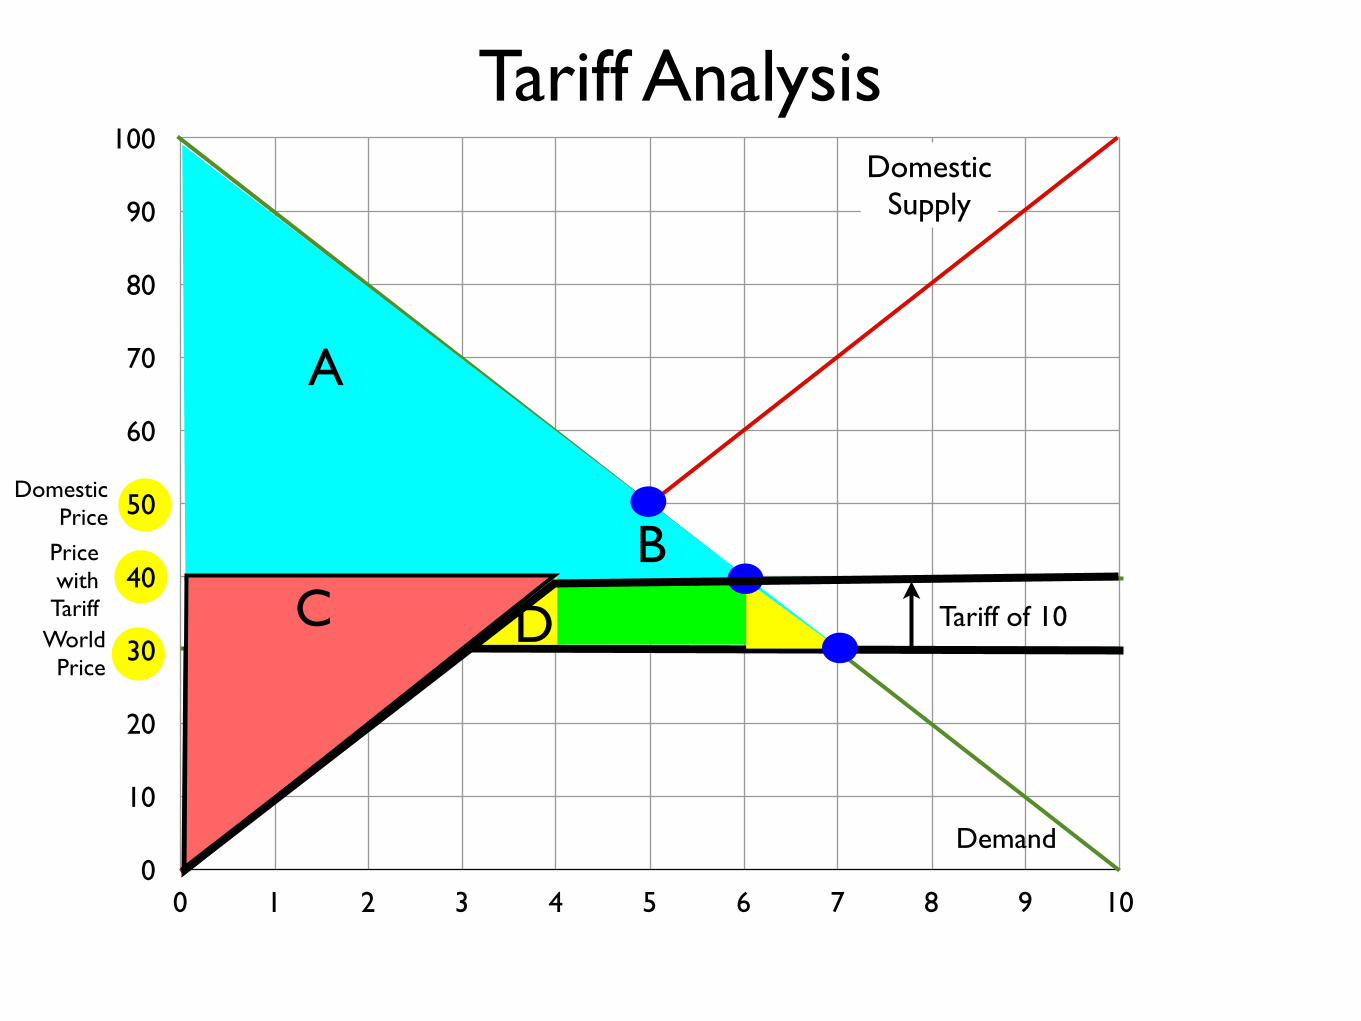
A
Tariff of 10

0
10
20
30
40
50
60
70
80
90
100
0 1 2 3 4 5 6 7 8 9 10
Demand
DomesticSupply
Tariff Analysis
PricewithTariff
WorldPrice
DomesticPrice
A
BTariff of 10

0
10
20
30
40
50
60
70
80
90
100
0 1 2 3 4 5 6 7 8 9 10
Demand
DomesticSupply
Tariff Analysis
PricewithTariff
WorldPrice
DomesticPrice
A
BC Tariff of 10
0
10
20
30
40
50
60
70
80
90
100
0 1 2 3 4 5 6 7 8 9 10
Demand
DomesticSupply
Tariff Analysis
PricewithTariff
WorldPrice
DomesticPrice
A
BC D Tariff of 10

0
10
20
30
40
50
60
70
80
90
100
0 1 2 3 4 5 6 7 8 9 10
Demand
DomesticSupply
Tariff Analysis
PricewithTariff
WorldPrice
DomesticPrice
A
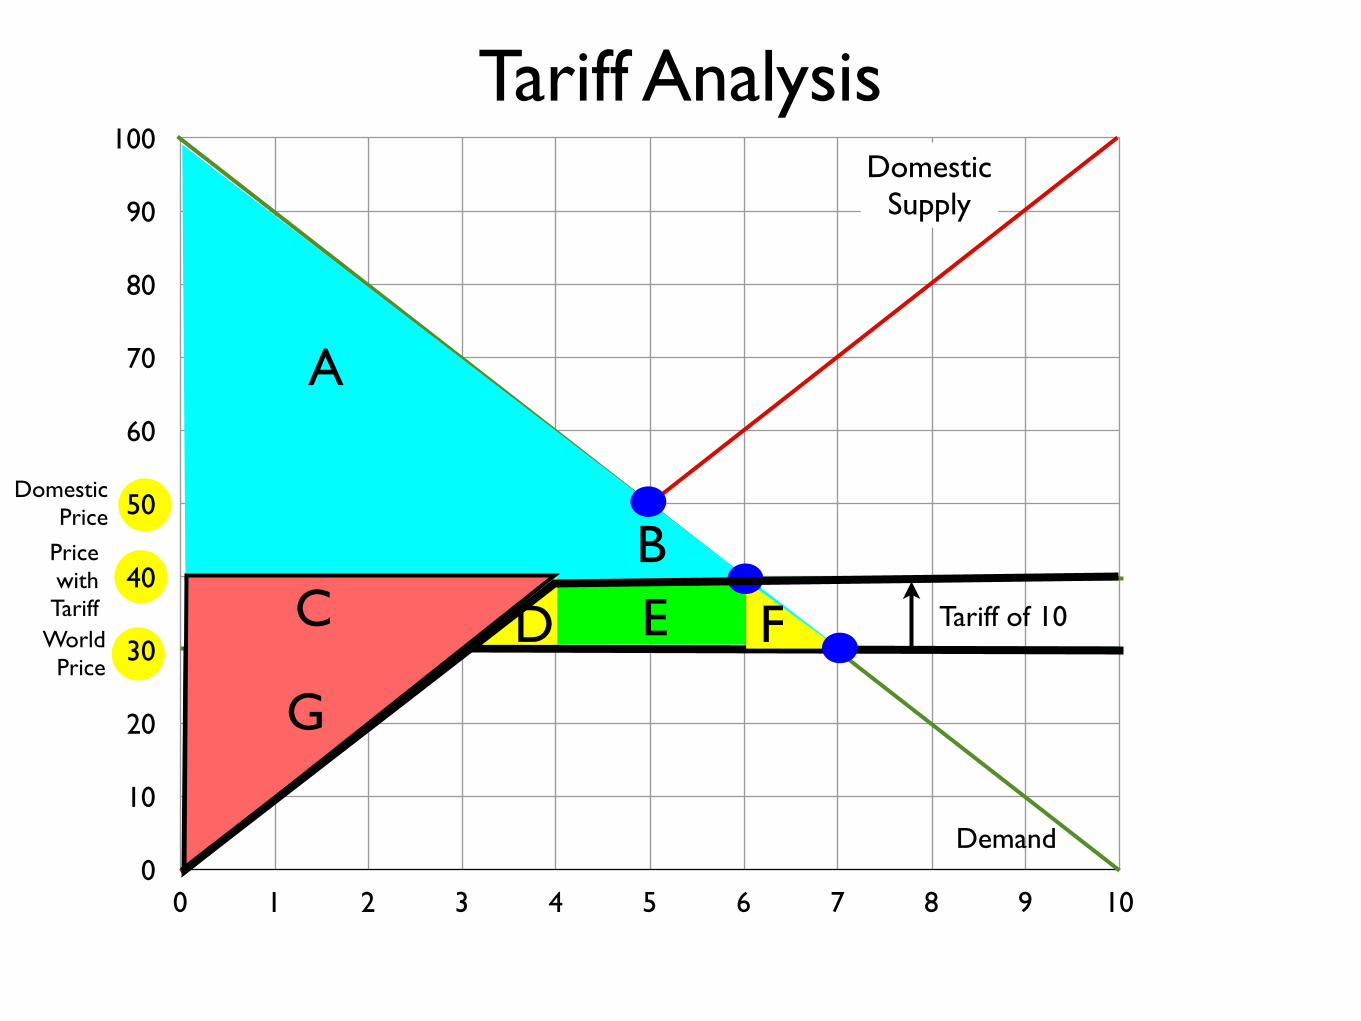
BC D E Tariff of 10

0
10
20
30
40
50
60
70
80
90
100
0 1 2 3 4 5 6 7 8 9 10
Demand
DomesticSupply
Tariff Analysis
PricewithTariff
WorldPrice
DomesticPrice
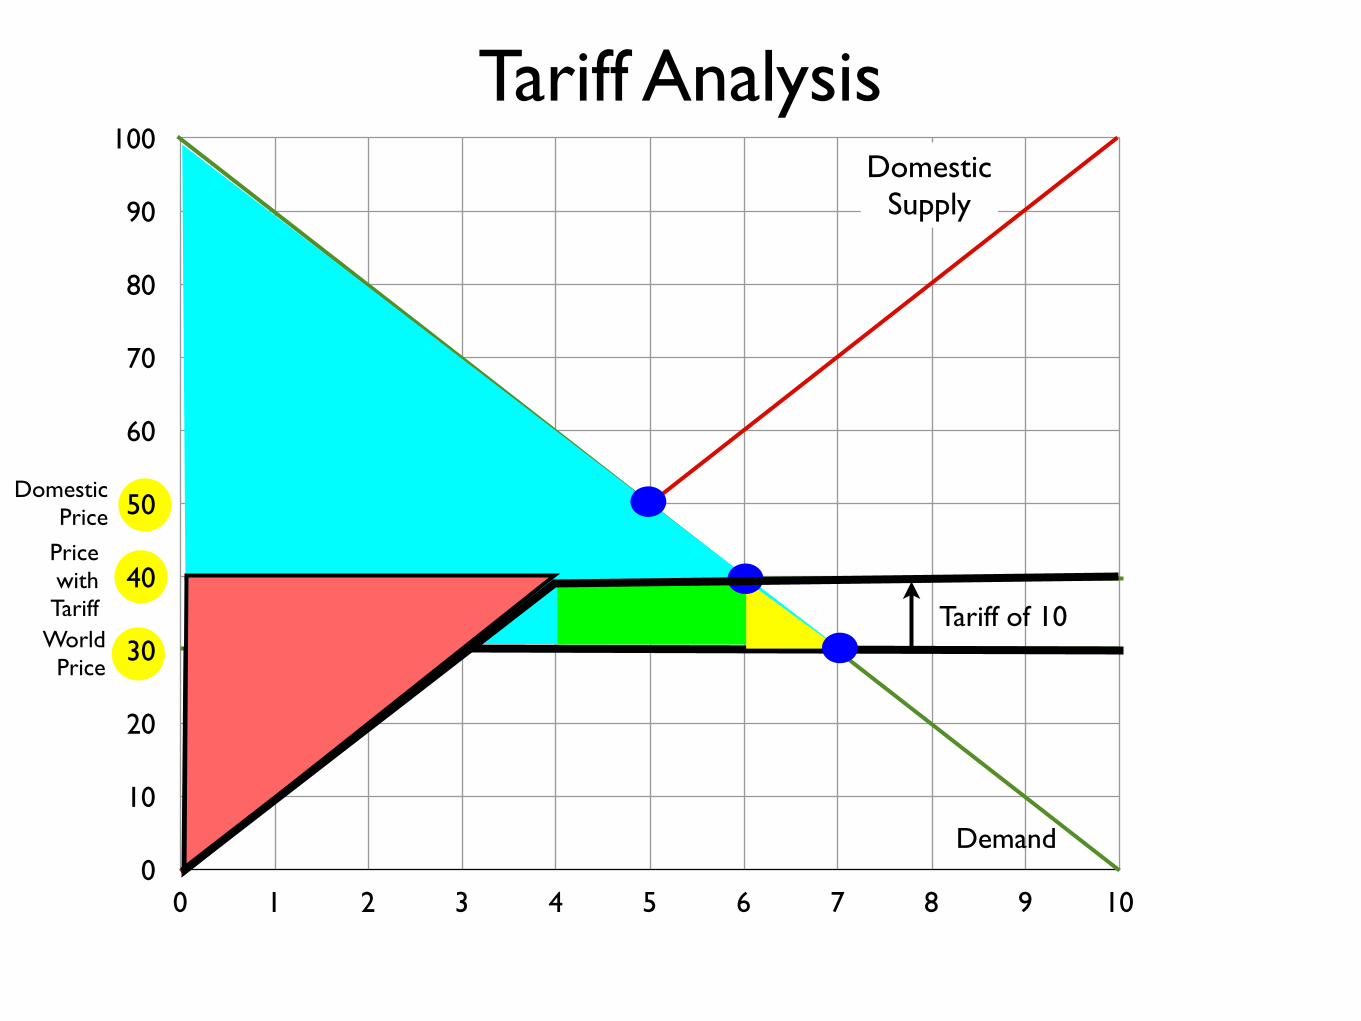
A
BC D E F Tariff of 10
0
10
20
30
40
50
60
70
80
90
100
0 1 2 3 4 5 6 7 8 9 10
Demand
DomesticSupply
Tariff Analysis
PricewithTariff
WorldPrice
DomesticPrice
A
BC D E F
G
Tariff of 10
0
10
20
30
40
50
60
70
80
90
100
0 1 2 3 4 5 6 7 8 9 10
Demand
DomesticSupply
Tariff Analysis
PricewithTariff
WorldPrice
DomesticPrice
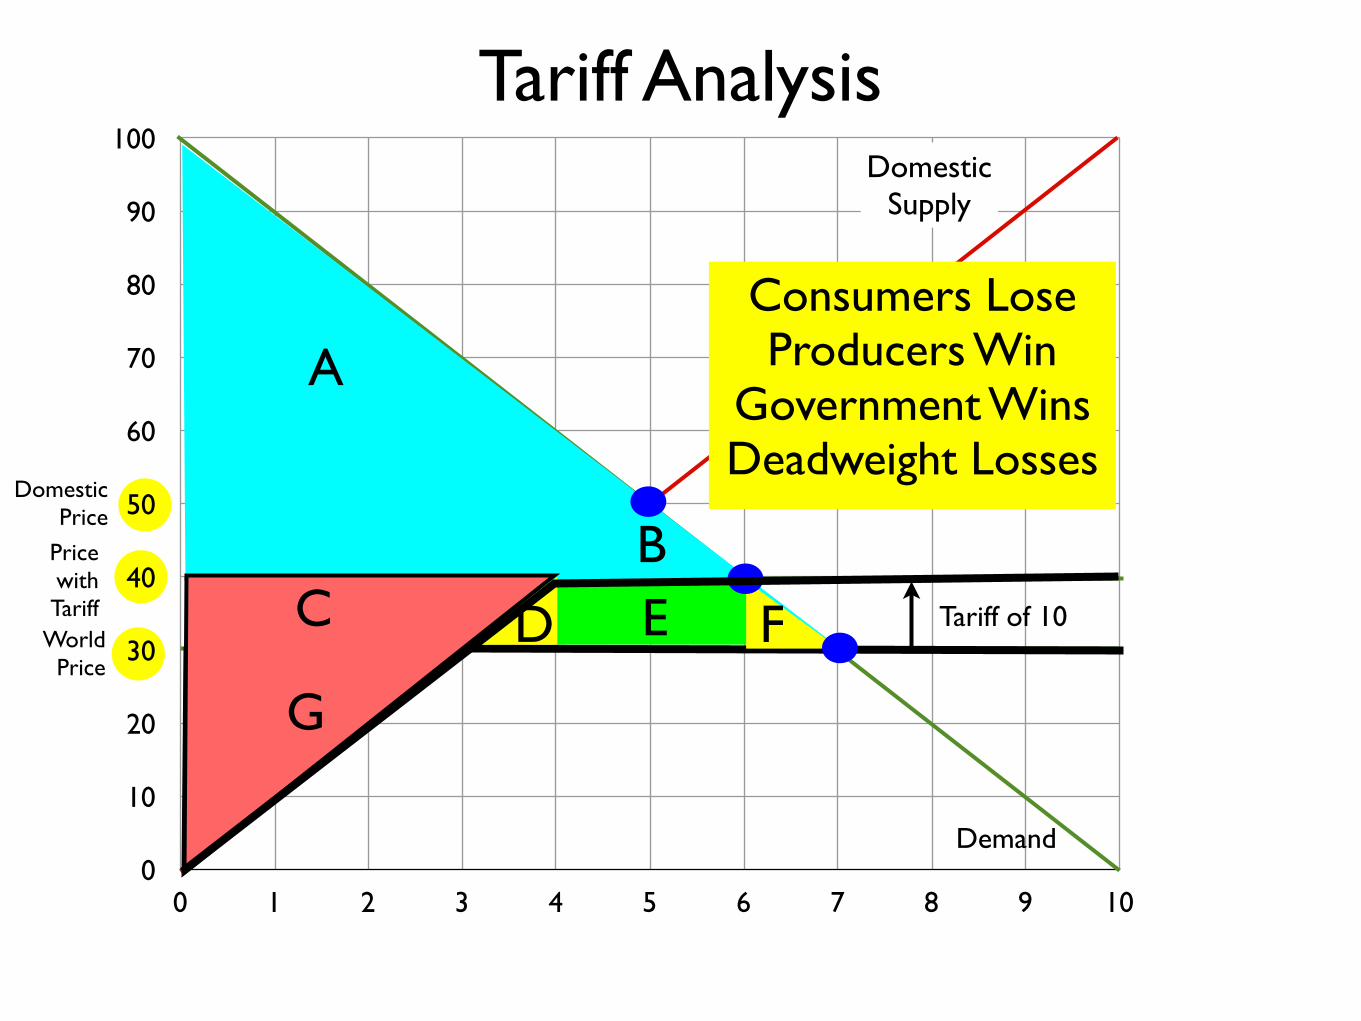
A
BC D E F
G
Tariff of 10
Consumers LoseProducers Win
Government WinsDeadweight Losses

Laissez Faire

Laissez Faire
Page 152