Exam 1 Review - Western Michigan University
61
Exam 1 Review Dr. Bradley J. Bazuin Associate Professor Department of Electrical and Computer Engineering College of Engineering and Applied Sciences Department of Electrical and Computer Engineering
Transcript of Exam 1 Review - Western Michigan University
Exam 1 Review
Dr. Bradley J. BazuinAssociate Professor
Department of Electrical and Computer EngineeringCollege of Engineering and Applied Sciences
Department of Electrical and Computer Engineering

In Class Exam
• Wednesday 6 October– Open book, open notes – paper only, print what you need.
– Calculators allowed. No cell phones, no laptops, no wireless connections
– The exam is long, you will not have time to “discover” something you have not studied.
• Exam #1 from 2020 is on the password web site
• Likely problems:– Sketch a time limited waveform, perform the Fourier transform, and
sketch the resulting spectrum
– Communication path gains and losses• Free space path lost and Friis equation (watch linear vs. dB)
– Butterworth Filter passband and stopband specification
– Sketch message and then the AM and DSB waveforms
– One or two of the exam prep homework problems (chap. 4)
ECE 4600/5640
2
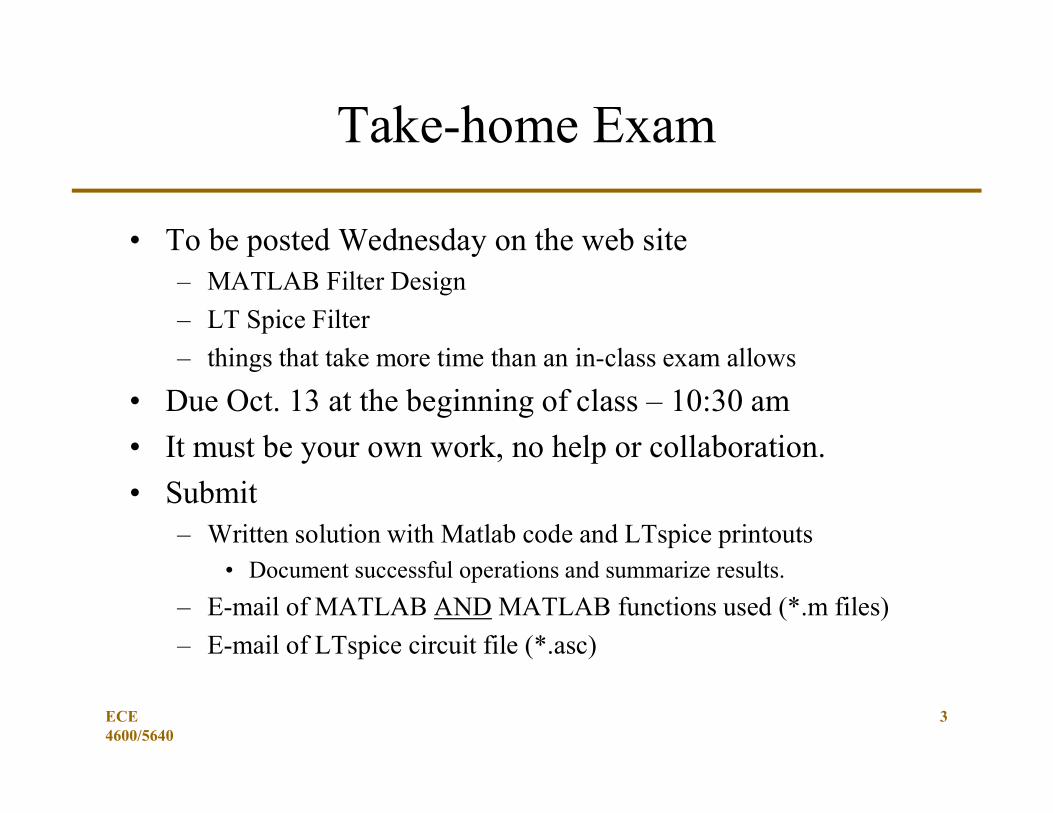
Take-home Exam
• To be posted Wednesday on the web site– MATLAB Filter Design
– LT Spice Filter
– things that take more time than an in-class exam allows
• Due Oct. 13 at the beginning of class – 10:30 am
• It must be your own work, no help or collaboration.
• Submit– Written solution with Matlab code and LTspice printouts
• Document successful operations and summarize results.
– E-mail of MATLAB AND MATLAB functions used (*.m files)
– E-mail of LTspice circuit file (*.asc)
ECE 4600/5640
3
Exam #1 Material (1)
• Chapter 1: Introduction – Elements and limitations
– Modulation and coding
– Electromagnetic wave propagation over a wireless channel
– Emerging developments
– Societal impact and historical perspective
• Chapter 2: Signals and Spectra – Line spectra and Fourier series
– Fourier transforms
– Time and frequency relations
– Convolution
– Impulses and transforms in the limit
– Discrete Fourier Transform
ECE 4600/5640
4

Exam #1 Material (2)
• Chapter 3: Signal Transmission and Filtering– Response of LTI systems
– Signal distortion
– Transmission Loss and decibels
– Filters and filtering
– Quadrature filters and Hilbert transform
– Correlation and spectral density
• Chapter 4: Linear CW Modulation – Bandpass signals and systems
– Double-sideband amplitude modulation
– Modulation and transmitters
– Suppressed-sideband amplitude modulation
– Frequency conversion and demodulation
• Exam #1ECE 4600/5640
5
Chapter 1: Introduction
• Chapter 1: Introduction– Elements and limitations
– Modulation and coding
– Electromagnetic wave propagation over a wireless channel
– Emerging developments
– Societal impact and historical perspective
ECE 4600/5640
6

ECE 4600/5640
7
Sinusoidal Signal Modulation
• Message 1: Amplitude Modulation (AM)
• Message 2: Phase Modulation (PM)
• Message 3: Frequency Modulation (FM)
t
3f2p01 dm2tmtf2costm1Ats
“Carrier” waveforms besides a sinusoid may be used– Pulse Train, Pulse Position, Chaos, etc.

Complex Modulation
• Using a complex phasor instead of a real sin or cos.– Perform signal processing in the complex domain (real and
imaginary or in-phase and quadrature-phase).
ECE 4600/5640
8
t
fp dmjtmjjtfjtmAts 3201 22exp1
Note: Both real and complex signals and signal notations exist and will be used in this class!
ECE 4600/5640
9
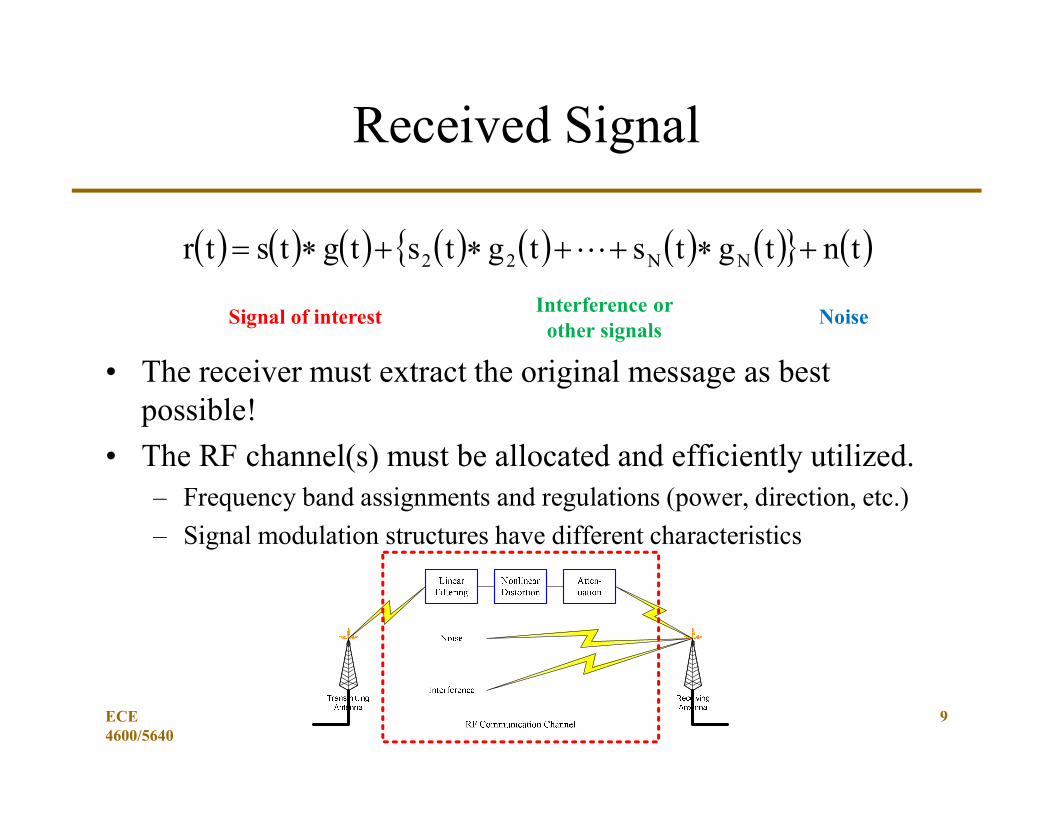
Received Signal
• The receiver must extract the original message as best possible!
• The RF channel(s) must be allocated and efficiently utilized. – Frequency band assignments and regulations (power, direction, etc.)
– Signal modulation structures have different characteristics
tntgtstgtstgtstr NN22
Signal of interestInterference or
other signalsNoise

Signals and Spectra(Reviewing mathematics relevant to communications)
• Chapter 2: Signals and Spectra– Line spectra and Fourier series
– Fourier transforms
– Time and frequency relations
– Convolution
– Impulses and transforms in the limit
– Discrete Fourier Transform
10Copyright © The McGraw-Hill Companies, Inc. Permission required for reproduction or display.
ECE 4600/5640

11
Complex Phasor Notation
• Complex Signal Representation
• Euler’s theorem and related equalities
tf2cosAtv 0
tf2sinjtf2costf2jexp
jtf2jexpARetv 0
tf2jexp2
1tf2jexp
2
1tf2cos
tf2jexp2
1jtf2jexp
2
1jtf2sin
ECE 4600/5640
12
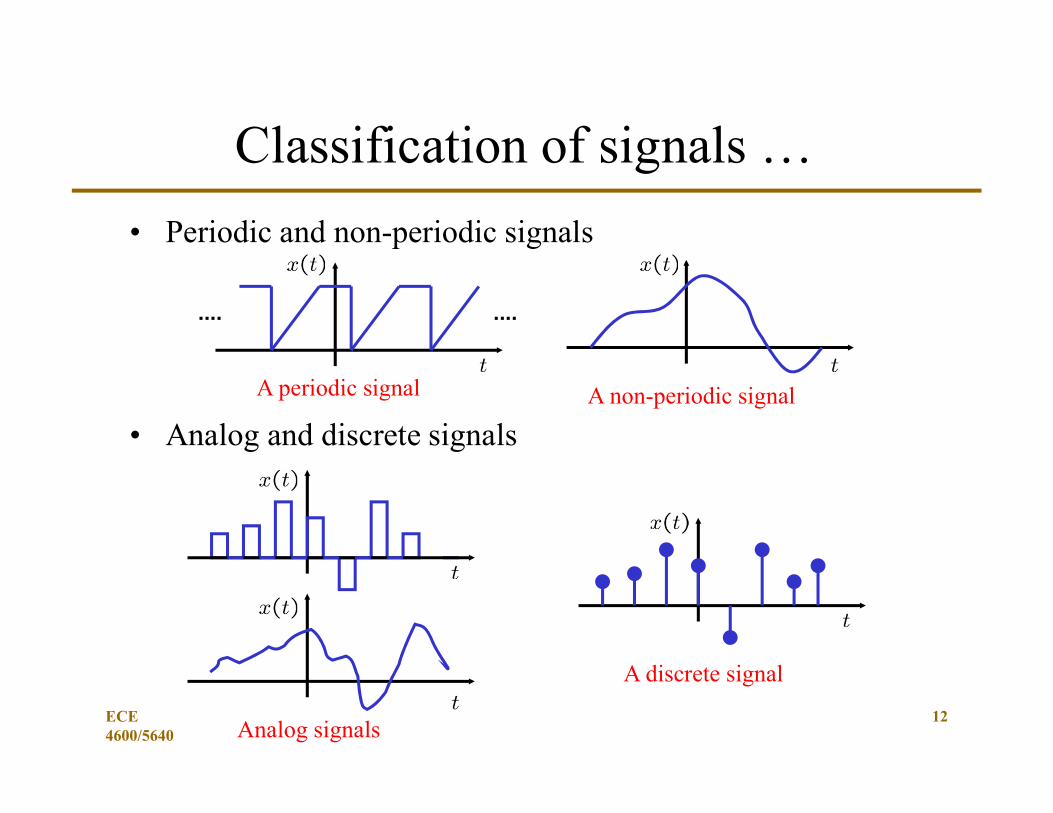
Classification of signals …
• Periodic and non-periodic signals
• Analog and discrete signals
A discrete signal
Analog signals
A non-periodic signalA periodic signal
ECE 4600/5640
13
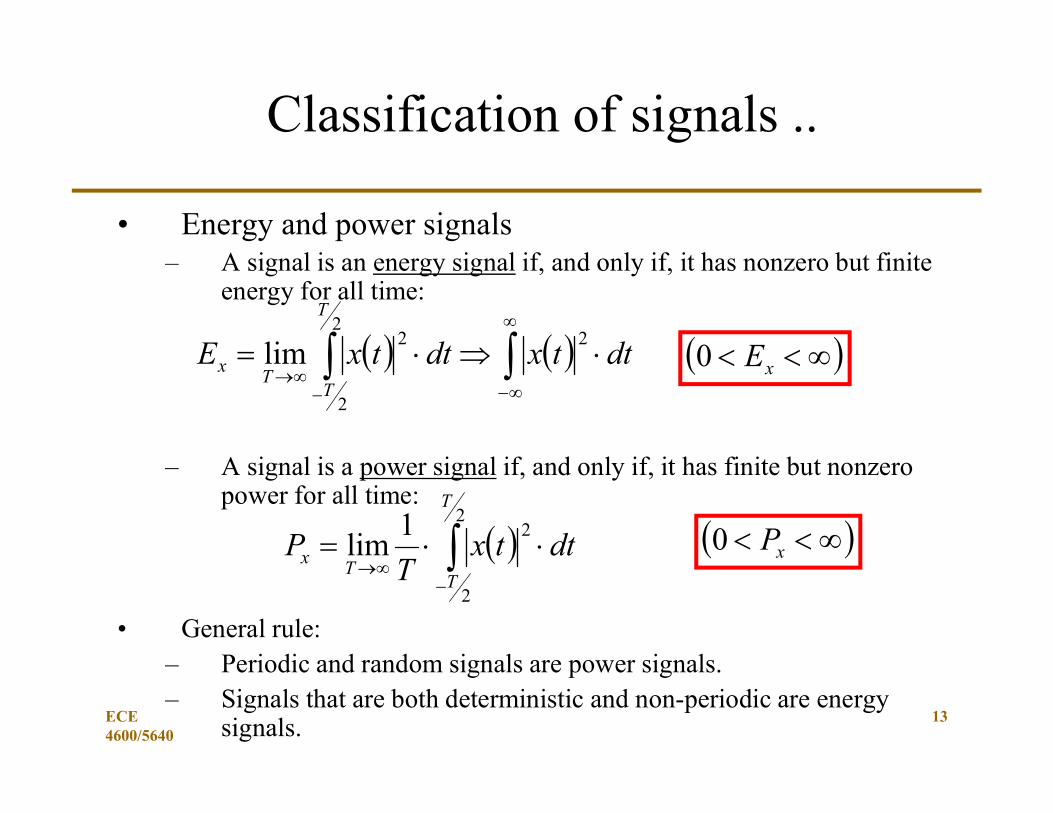
Classification of signals ..
• Energy and power signals– A signal is an energy signal if, and only if, it has nonzero but finite
energy for all time:
– A signal is a power signal if, and only if, it has finite but nonzero power for all time:
• General rule: – Periodic and random signals are power signals. – Signals that are both deterministic and non-periodic are energy
signals.
dttxdttxE
T
TT
x
22
2
2lim xE0
2
2
21lim
T
TT
x dttxT
P xP0
ECE 4600/5640

14
Fourier Transform
• Time to frequency domain
• Frequency to time domain
• Condition … finite energy (finite power signals use “Fourier Series”)
dttf2jexptvfV
dftf2jexpfVtv
dttvE02
ECE 4600/5640

15
Fourier Transform Properties
• Linearity• Superposition• Time Shifting• Scale Change• Conjugation• Duality• Frequency Translation• Convolution• Multiplication• Modulation
Table T.1 on pages 780-780
Section 2.3, pp. 44-52
Section 2.4, pp. 52-58
ECE 4600/5640
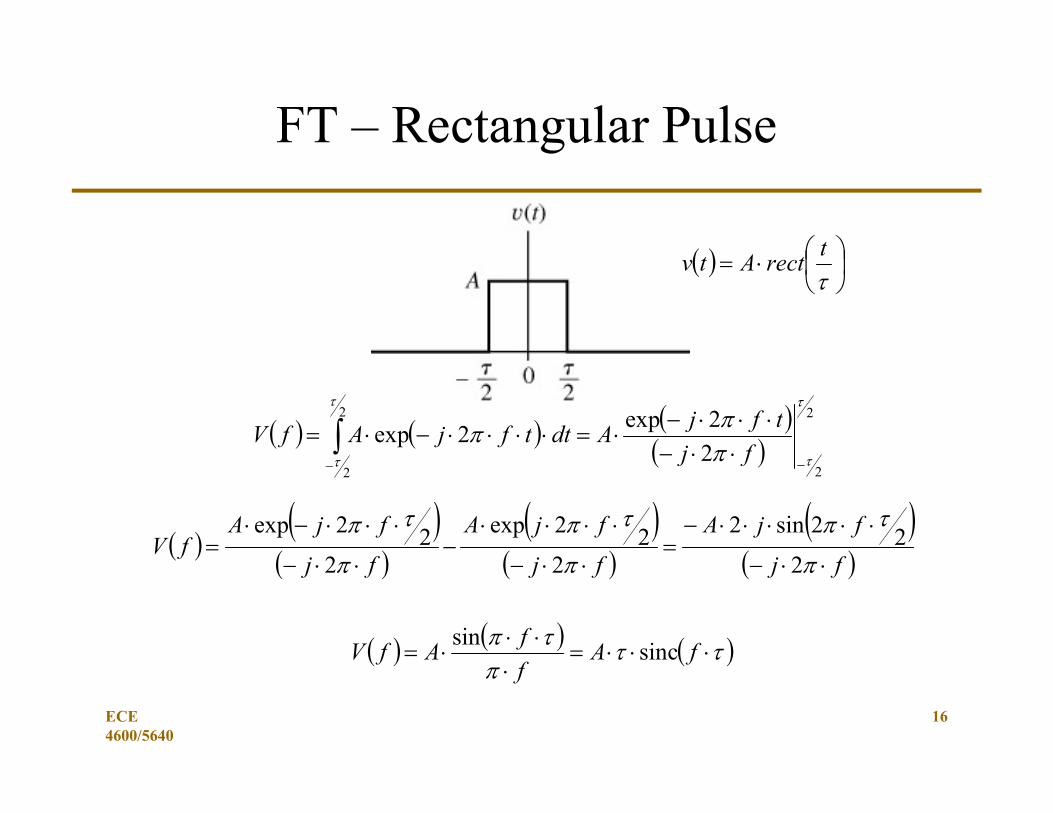
FT – Rectangular Pulse
16
2
2
2
22
2exp2exp
fj
tfjAdttfjAfV
fj
fjA
fj
fjA
fj
fjAfV
222sin2
222exp
222exp
fAf
fAfV sinc
sin
t
rectAtv
ECE 4600/5640
17
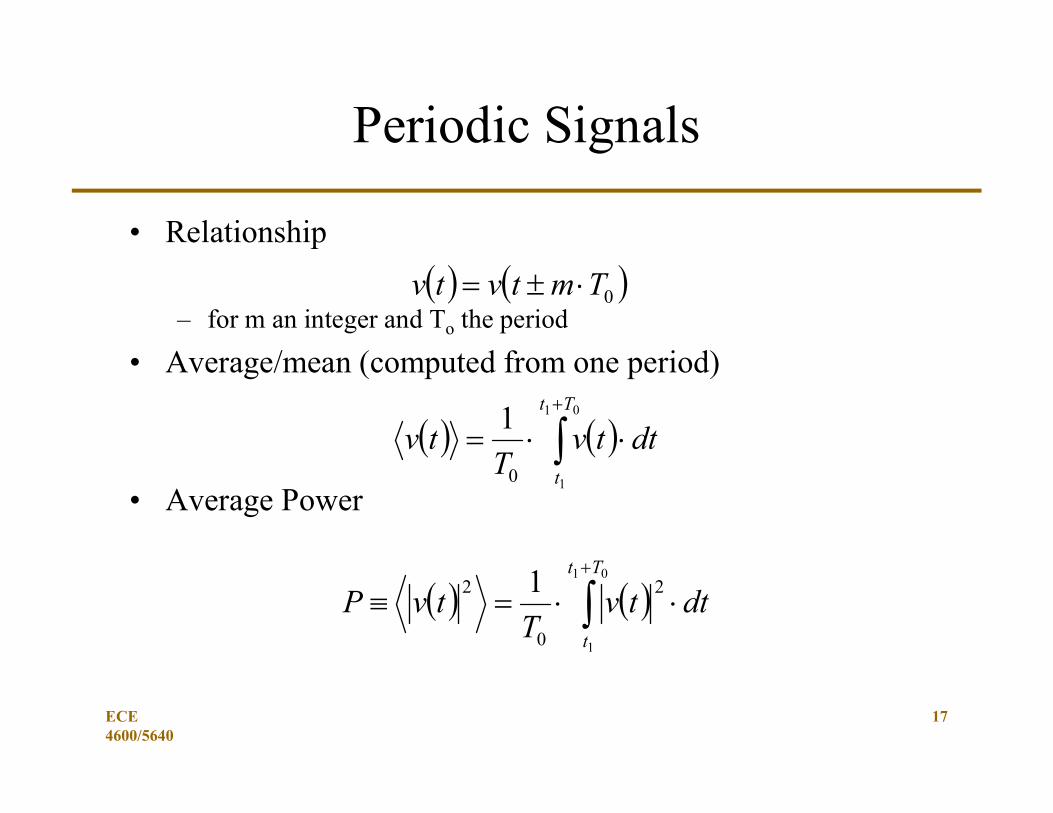
Periodic Signals
• Relationship
– for m an integer and To the period
• Average/mean (computed from one period)
• Average Power
0Tmtvtv
01
10
1Tt
t
dttvT
tv
01
1
2
0
2 1Tt
t
dttvT
tvP
ECE 4600/5640

18
Fourier Series (Periodic Signals with Finite Power)
• Fourier Series Coefficients
• Signal Representation
dttfn2jexptvT
1c 0
T
0n
0
n
0n tfn2jexpctv
00 T
1fwhere
n
n fnfcfV 0
ECE 4600/5640

Fourier Transforms and Series
• For a periodic signal:– Take the Fourier Transform of one period of the waveform and
plot the spectrum• This is the “envelope” of the Fourier Series spectrum
– The Fourier Series spectrum is then a “line spectrum” with coefficients spaced at n x f0
19ECE 4600/5640

20
Useful Signal Properties: Symmetry
• Symmetry (even)
• Anti-Symmetry (odd)
• Conjugate (real is even, imag is odd)
tvtv
tvtv
*tvtv
ECE 4600/5640
21
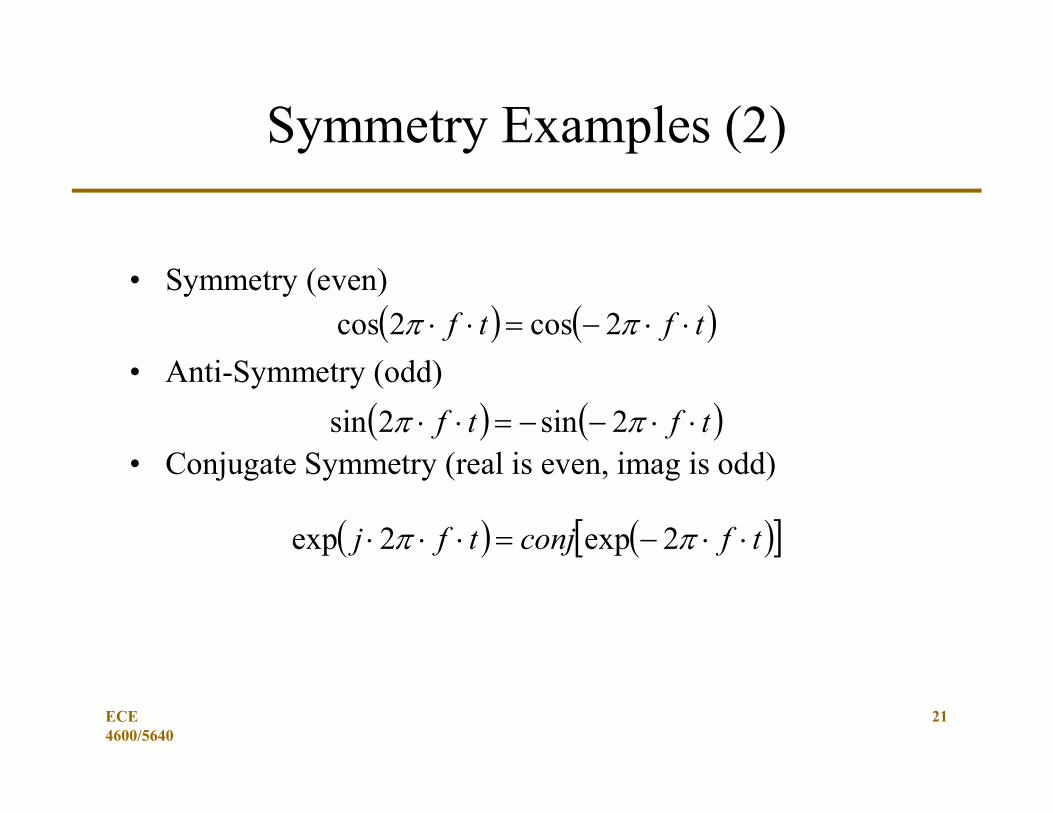
Symmetry Examples (2)
• Symmetry (even)
• Anti-Symmetry (odd)
• Conjugate Symmetry (real is even, imag is odd)
tftf 2cos2cos
tftf 2sin2sin
tfconjtfj 2exp2exp
ECE 4600/5640

22
Rayleigh’s Energy Theorem
• Energy in the time domain is equal to energy in the frequency domain!
dttvtvdttvE *2
dffVdtetvdttvdfefVE tfjtfj 2**2
dffVfVdffVdtetvconjE tfj *2
dffVdttvE22
ECE 4600/5640

23
Causality and Filtering
• Convolution Form
– The filter, h, can be defined for positive time only
– The signal, x, is defined for all past time up to time t
• Then, when limited by the filter impulse response:
dtxhtz
T
0
dtxhtz
ECE 4600/5640
24
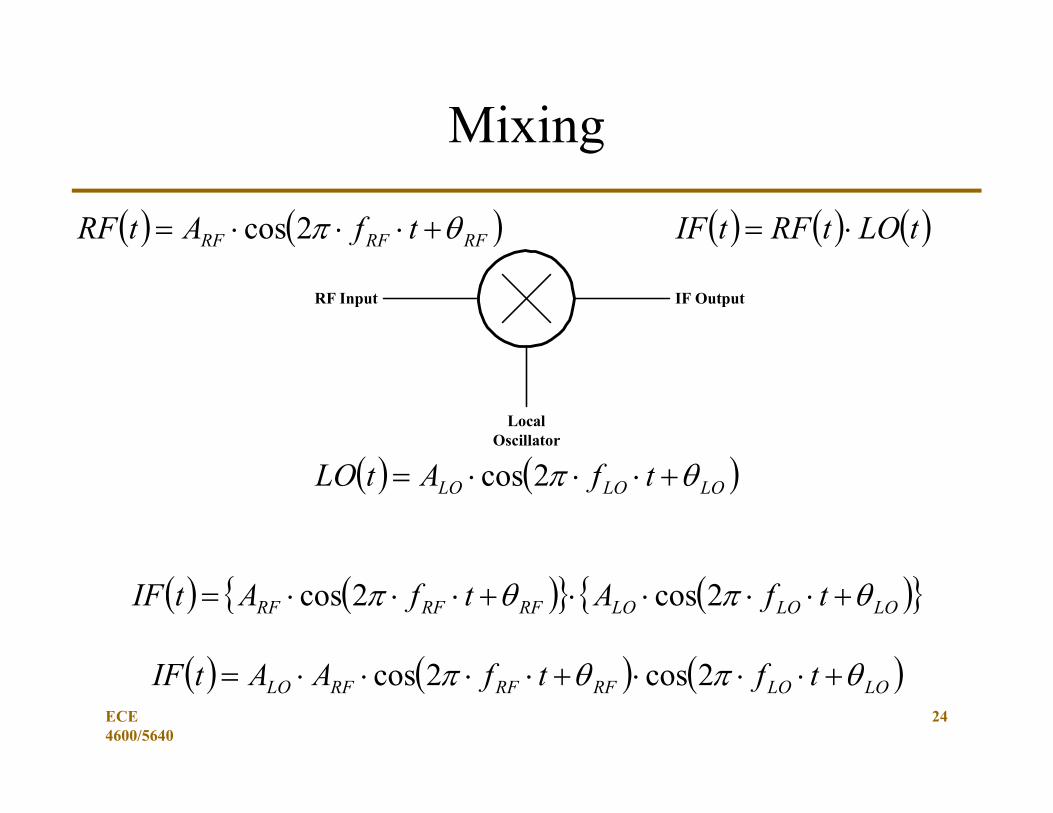
Mixing
RF Input IF Output
LocalOscillator
tLOtRFtIF
LOLOLO tfAtLO 2cos
RFRFRF tfAtRF 2cos
LOLOLORFRFRF tfAtfAtIF 2cos2cos
LOLORFRFRFLO tftfAAtIF 2cos2cosECE 4600/5640

25
Mixing (2)
LOLORFRFRFLO tftfAAtIF 2cos2cos
LORFLORFRFLO
LORFLORFRFLO
tffAA
tffAAtIF
2cos2
1
2cos2
1
LORFLORFRFLO tffAAtIF 2cos2
1
• Restating
• Using an Identity
• Low Pass Filtering
ECE 4600/5640

Signal Transmission and Filtering
• Chapter 3: Signal Transmission and Filtering– Response of LTI systems
– Signal distortion
– Transmission Loss and decibels
– Filters and filtering
– Quadrature filters and Hilbert transform
– Correlation and spectral density
26ECE 4600/5640
Linear Time Invariant (LTI) Systems
• Principle of Superposition– Summed input create transformed summed outputs
• Time-invariant– invariant result if shifted in time
• Homogeneity– Constant multiplication of input results in identical constant
multiplication of the output
• Transfer Functions – input to output relationship
• Expected for “lumped-parameter” elements (R, L, C)
27ECE 4600/5640

Transfer Function Methods
• For continuous-time systems, the Laplace transform is used to define the filter transfer function
– Frequency Response
– or
28
11
11
011
1
sss
sss
sX
sYsH
nn
nn
nn
mm
1222
222
11
1
011
1
fjfjfj
fjfjfj
fX
fYfH n
nn
n
nn
mm
fXj
fYj
efX
efY
fX
fYfH
arg
arg
ECE 4600/5640

29
Power Gain
• Gain is defined as the power out divided by the power in
2
in
out 0HP
Pg
• Cascaded gain is the gain of the receiver chain
in
out10dB P
Plog10g
321 GGGG 1in
3out
3in
3out
2in
2out
1in
1out
P
P
P
P
P
P
P
PG
dB3dB2dB1dB GGGG ECE 4600/5640

30
Noise Figure
• The Noise Figure Described the expected output noise power reflected to the input of the device. Thus, it defines the additional “equivalent input” noise contribution.
0
device
0
device0
N
N1
N
NNF
• Cascaded noise figure is effected by the gain
21
3
1
21 GG
1F
G
1FFF
ECE 4600/5640

31
Free-Space Loss
• As an RF signal propagates, there is path loss.
tPtG rG
f
R
rP
𝐿𝑜𝑠𝑠 =4𝜋 ⋅ 𝑅
𝜆=
4𝜋 ⋅ 𝑓 ⋅ 𝑅
𝑐
• As shown above
𝑐 = 𝜆 ⋅ 𝑓
ECE 4600/5640
32
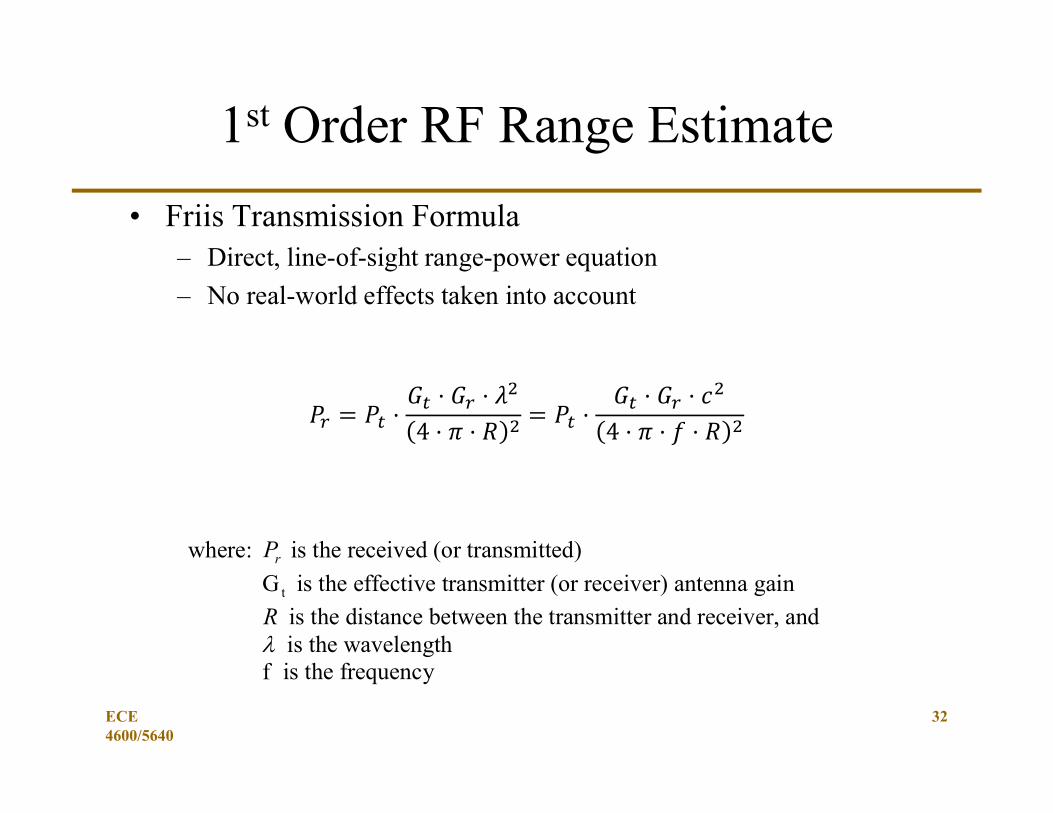
1st Order RF Range Estimate
• Friis Transmission Formula– Direct, line-of-sight range-power equation
– No real-world effects taken into account
where: rP is the received (or transmitted)
tG is the effective transmitter (or receiver) antenna gain
R is the distance between the transmitter and receiver, and is the wavelength f is the frequency
ECE 4600/5640
33
Copyright © The McGraw-Hill Companies, Inc. Permission required for reproduction or display.
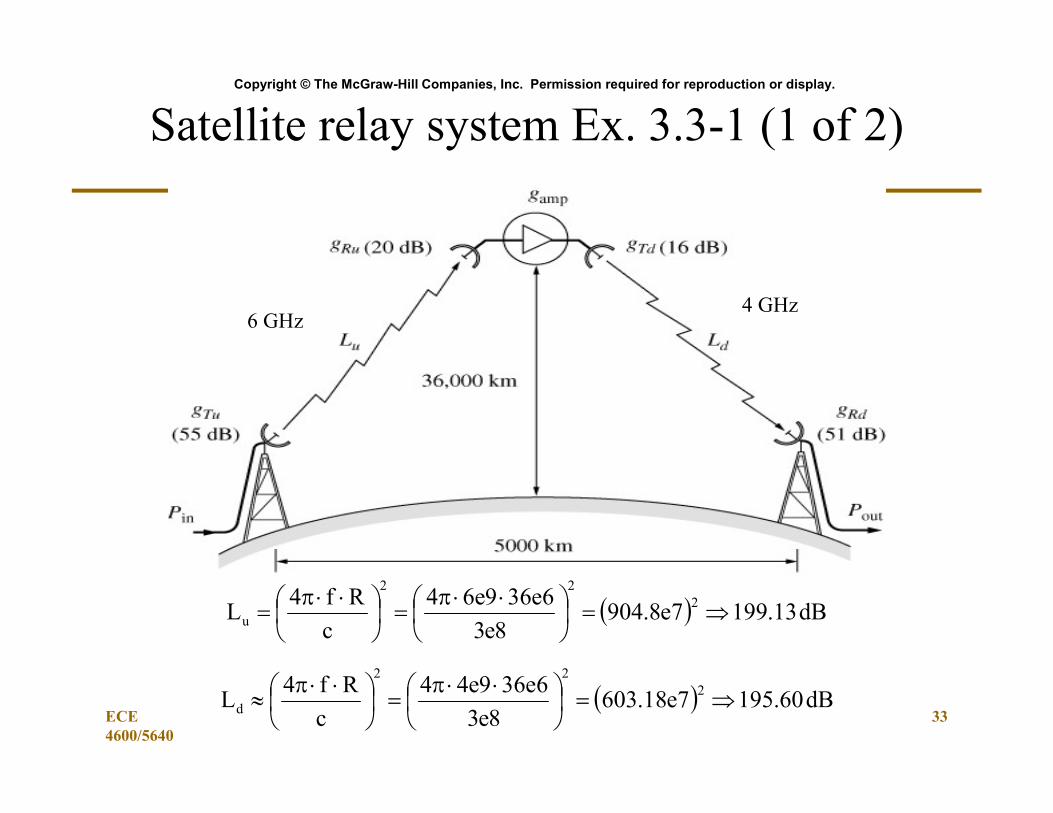
6 GHz4 GHz
dB13.1997e8.9048e3
6e369e64
c
Rf4L 2
22
u
dB60.1957e18.6038e3
6e369e44
c
Rf4L 2
22
d
Satellite relay system Ex. 3.3-1 (1 of 2)
ECE 4600/5640

34
Copyright © The McGraw-Hill Companies, Inc. Permission required for reproduction or display.
dBWdBdBdBdBWP rcvsat 1.89201.1995535_
dBW6.110dB51dB6.195dB16dBW18Pout
22
rtt
rttr
R4
GGP
L
GGPP
dB1.107dBW1.89dBW18gamp
Satellite relay system (2 of 2)
Pt=35 dBW
Pt=18 dBW
ECE 4600/5640
Frequency Selective Filtering
• Filters are intended to remove noise and interference– Maximize the amount that is removed
• Filters will modified the spectrum of the signal of interest in some way– Minimize any signal distortion that may be caused by the filter.
• The above restrictions can usually not both be performed!– Compromise between the two!!
See Figure 3.1-7 on p. 85.
See Matlab Example35ECE
4600/5640

Filter Terminology
• Passband– Frequencies where signal is
meant to pass
• Stopband– Frequencies where some defined
level of attenuation is desired
• Transition-band– The transitions frequencies
between the passband and the stopband
• Filter Shape Factor– The ratio of the stopband
bandwidth to the passband bandwidth
PB
SB
BW
BWSF
PBBW
SBBW
36ECE 4600/5640

37
Copyright © The McGraw-Hill Companies, Inc. Permission required for reproduction or display.
Typical amplitude ratio of a real bandpass filter
Real Bandpass Filter
The -3 dB or half-power bandwidth is shown
ECE 4600/5640

38
Butterworth Low Pass Filter
• Maximally Flat, Smooth Roll-off, Constant 3dB point for all orders
𝐻 𝑗𝑤 ⋅ 𝐻 −𝑗𝑤 = 𝐻𝑗𝑤 =1
1 + 𝑤𝑤
𝐻 𝑠 =1
1 + 𝑠𝑗 ⋅ 𝑤
=1
1 + −𝑗 ⋅ 𝑠𝑤
=1
1 + −1 𝑠𝑤
M.E. Van Valkenburg, Analog Filter Design, Oxford Univ. Press, 1982. SBN: 0-19-510734-9
10-1
100
101
102
103
-120
-100
-80
-60
-40
-20
0
Butterworth Filter Family
Frequency (normalized)
Att
enua
tion
(dB
)
1st order
2nd order
3rd order4th order
5th order
ECE 4600/5640

39
Pulse Response and Risetime
• Low Pass Filters cause sharp signal edges to be smoothed.
• The amount of smoothing is based on the bandwidth of the filter– More smoothing smaller bandwidth
• Fourier relationship:– a narrow rect function in time results in a broad (wide bandwidth)
sinc function in frequency
– a wide rect function in time results in a narrow (small bandwidth) sinc function in frequency
ECE 4600/5640

40
Hilbert Transform
• It is a useful mathematical tool to describe the complex envelope of a real-valued carrier modulated signal in communication theory.
• The precise definition is as follows:
http://en.wikipedia.org/wiki/Hilbert_transform
dt
x1
t
1txtx̂
t
1thQ
f0j
0f,0
0f,j
fsgnjfHQ
ECE 4600/5640

41
Hilbert Transform Real to Complex Conversion
• Original Real
• Hilbert Transform Complex
fXtx
fXfjjfXtxjtxthtc sgnˆ
fXffXtxjtxthtc sgnˆ
0,0
0,2ˆ
ffor
fforfXtxjtxthtc
The Hilbert Transform can be used to create a single sided spectrum! The complex representation of a real signal.ECE
4600/5640

Linear CW Modulation
• Chapter 4: Linear CW Modulation– Bandpass signals and systems
– Double-sideband amplitude modulation
– Modulation and transmitters
– Suppressed-sideband amplitude modulation
– Frequency conversion and demodulation
ECE 4600/5640
42

MATLAB AM
• AM= Ac * (1+μ*m(t))*cos(2π*fc*t)
• DSB= Ac * m(t)*cos(2π*fc*t)
43
0 0.2 0.4 0.6 0.8 1 1.2 1.4 1.6 1.8-1
-0.8
-0.6
-0.4
-0.2
0
0.2
0.4
0.6
0.8
1Message
Time (sec)
Am
plitu
de
0 0.2 0.4 0.6 0.8 1 1.2 1.4 1.6 1.8-1.5
-1
-0.5
0
0.5
1
1.5AM Waveform
Time (sec)
Am
plitu
de
message AMECE 4600/5640

44
A family of AM Waveforms
• Double-Sideband, Carrier (AM in text, AM radios)
• Double-Sideband, Suppressed Carrier (DSB in text)
tf2costAtv c
tmAtA c
tm1AtA c
ECE 4600/5640

45
Conventional AM
• Baseband
• Bandpass
• Fourier Domain
tm1AtA c
tf2costmAtf2cosA
tf2costm1Atv
cccc
cc
ccc
ccc ffMffM
2
Affff
2
AfV
carrier message
ECE 4600/5640

46
AM Sidebands
• Assume that the message is a cosine wave– messages are typically bounded by +/- 1.0
• The spectral response becomes
tf2costm m
mcmcc
mcmcc
ccc
ffffff4
A
ffffff4
A
ffff2
AfV
mm ffff2
1fM
carrier
sidebands
sidebandsECE 4600/5640

47
AM Positive Frequencies
• For the positive frequency segment of the spectrum
mcc
cc
mcc fff
4
Aff
2
Afff
4
AfV
Signal carrier with two sidebands
Lower sideband Upper sidebandCarrier
Ma
gcfmc ff mc ff
2Ac
4Ac
4Ac
ECE 4600/5640

48
AM Modulation index
• For normalized message signals, the magnitude of the modulation index , , defines whether there is a “phase reversal” of the carrier wave.– =1, 100% modulation index, if the message ever becomes -1, the
baseband signal will become zero
– <1, 0-99.9% modulation index, if the message is bounded by +/-1, the baseband signal is always greater than zero
– >1, the baseband signal will have regions that are negative; thereby, causing a phase reversal of the carrier for the negative values. Envelope distortion will occur.
tm1AtA c
ECE 4600/5640

49
DSB (with Suppressed Carrier)
• Baseband
• Bandpass
• Fourier Domain
tmAtA c
tf2costmAtv cc
ccc ffMffM
2
AfV
Message only no carrier !ECE 4600/5640

50
DSB Positive Frequencies
• For the positive frequency segment of the spectrum
mcc
mcc fff
4
Afff
4
AfV
No signal carrier, two sidebands
Lower sideband Upper sideband
Ma
g
cfmc ff mc ff
4Ac
4Ac
ECE 4600/5640

51
Phasor Analysis AM
• Given a tone message …
• A positive frequency phasor can be defined and drawn
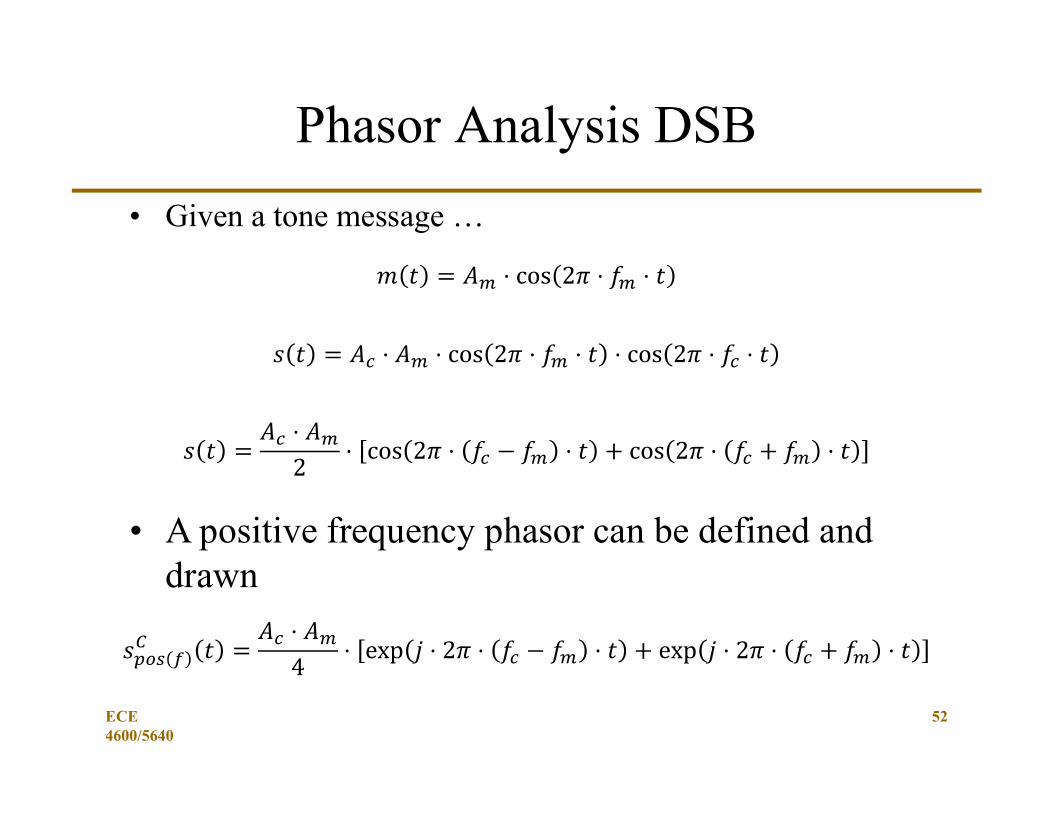
𝑠 𝑡 =𝐴
2⋅ exp 𝑗 ⋅ 2𝜋 ⋅ 𝑓 ⋅ 𝑡 +
𝐴
2⋅ 𝜇 ⋅ exp 𝑗 ⋅ 2𝜋 ⋅ 𝑓 − 𝑓 ⋅ 𝑡 +
𝐴
2⋅ 𝜇 ⋅ exp 𝑗 ⋅ 2𝜋 ⋅ 𝑓 + 𝑓 ⋅ 𝑡
𝑠 𝑡 = 𝐴 ⋅ cos 2𝜋 ⋅ 𝑓 ⋅ 𝑡 +𝐴
2⋅ 𝜇 ⋅ cos 2𝜋 ⋅ 𝑓 − 𝑓 ⋅ 𝑡 +
𝐴
2⋅ 𝜇 ⋅ cos 2𝜋 ⋅ 𝑓 + 𝑓 ⋅ 𝑡
ECE 4600/5640
52
Phasor Analysis DSB
• Given a tone message …
• A positive frequency phasor can be defined and drawn
ECE 4600/5640
53
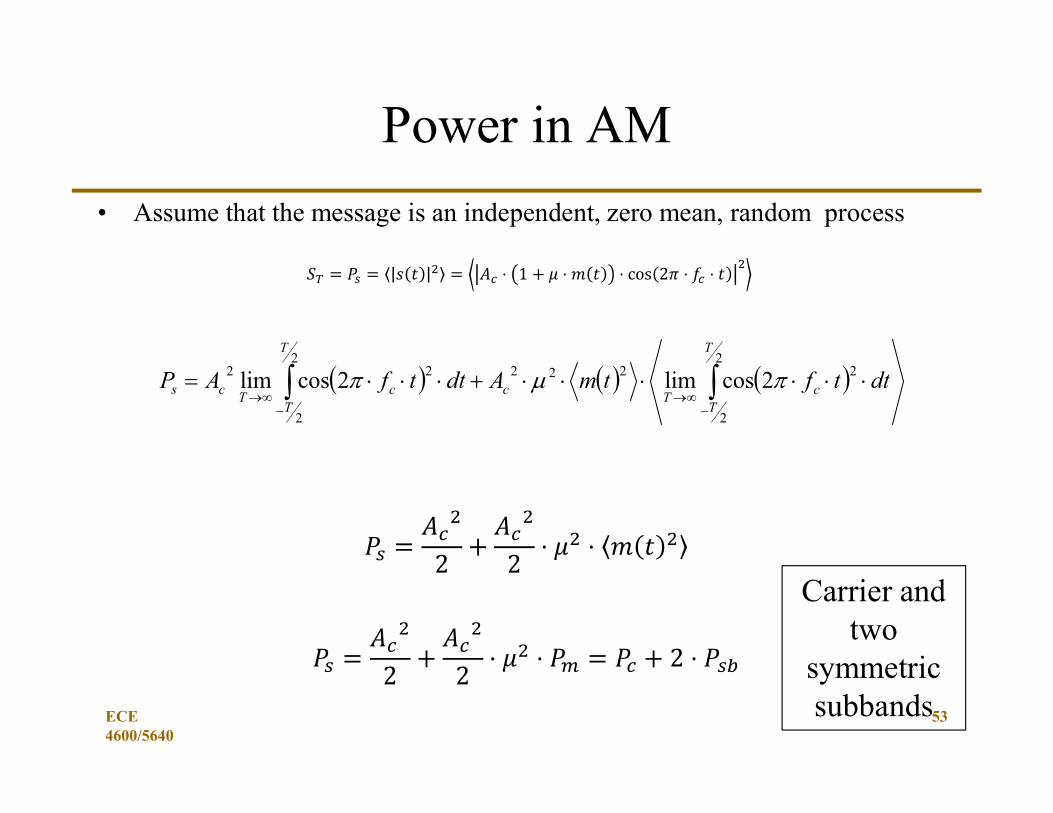
Power in AM
• Assume that the message is an independent, zero mean, random process
2
2
22222
2
22 2coslim2coslim
T
Tc
Tc
T
Tc
Tcs dttftmAdttfAP
Carrier and two
symmetric subbands
𝑆 = 𝑃 = 𝑠 𝑡 = 𝐴 ⋅ 1 + 𝜇 ⋅ 𝑚 𝑡 ⋅ cos 2𝜋 ⋅ 𝑓 ⋅ 𝑡
ECE 4600/5640

54
DSB Power Levels
• All the power is in the message subbands
ECE 4600/5640

Linear CW Radios
Modulation
• Conventional AM– Multiply and sum
– Nonlinearity
• DSB– Multiply
– AM sum and difference
Demodulation
• Conventional AM– Noncoherent Envelope
Detector
– Coherent Multiply and highpass filter
– Complex Mix & HPF
• DSB– Coherent Multiply
55ECE 4600/5640

56
Frequency Demodulation
• Non-Coherent Demodulation– An unknown phase, find another way …
– Envelope detection, lose ½ the signal power
– Advanced version, use a diode bridge rectifier instead of a single diode
• Coherent Demodulation– A known phase, filter and your done.
– The carrier frequency can be used to provide a local oscillator, after very narrowband filtering
ECE 4600/5640

57
Copyright © The McGraw-Hill Companies, Inc. Permission required for reproduction or display.
(a) Circuit; (b) Waveforms
Envelope detection
In-class example for homework
- Picking R’s and C’s
AM signal spectrum centered at an intermediate frequency
ECE 4600/5640
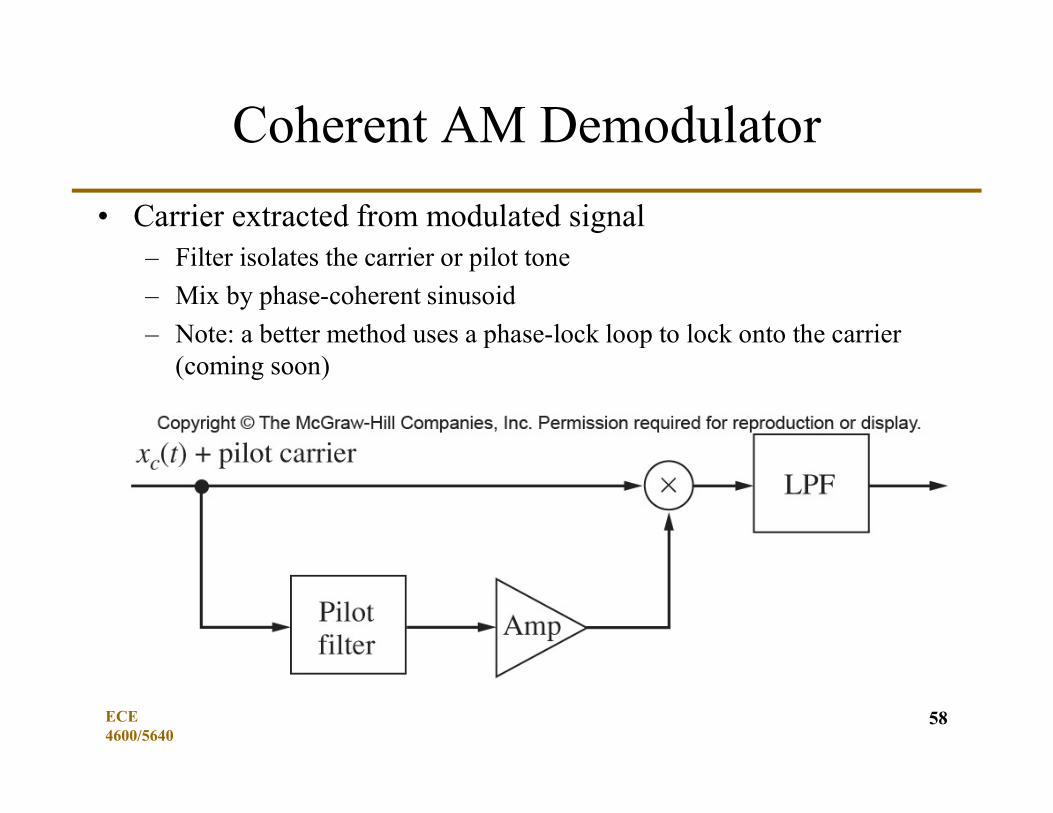
Coherent AM Demodulator
• Carrier extracted from modulated signal– Filter isolates the carrier or pilot tone
– Mix by phase-coherent sinusoid
– Note: a better method uses a phase-lock loop to lock onto the carrier (coming soon)
58ECE 4600/5640

Second MethodWeaver’s SSB modulator
59
Copyright © The McGraw-Hill Companies, Inc. Permission required for reproduction or display.
𝑥 𝑡 = cos 2𝜋 ⋅ 𝑓 ⋅ 𝑡 ⋅ ℎ 𝑡 ∗ 𝑥 𝑡 ⋅ cos 2𝜋 ⋅ 𝑓 ⋅ 𝑡
𝑥 𝑡 = sin 2𝜋 ⋅ 𝑓 ⋅ 𝑡 ⋅ ℎ 𝑡 ∗ 𝑥 𝑡 ⋅ sin 2𝜋 ⋅ 𝑓 ⋅ 𝑡

60
Equivalent Complex Operation
• Complex Mixing of signal band to “zero” intermediate frequency (IF)
• LPF replaces IF LPF or HPF at IF frequency
• Complex up conversion from “zero” IF to RF
tf2jexp 1
tx
tf2jexp 2
tx c
𝑥 𝑡 = exp −𝑗 ⋅ 2𝜋 ⋅ 𝑓 + 𝑓 ⋅ 𝑡 ⋅ ℎ 𝑡 ∗ 𝑥 𝑡 ⋅ exp 𝑗 ⋅ 2𝜋 ⋅ 𝑓 ⋅ 𝑡

Weaver Modulator Spectrum
• Complex Mix
• Baseband LPF
• Complex Mix – then keep the real part
61