EWF QUARTERLY FORECAST
34
WWW.ELLIOTTWAVE-FORECAST.COM EWF QUARTERLY FORECAST _______________________________________________ 10/18/2021
Transcript of EWF QUARTERLY FORECAST
WWW.ELLIOTTWAVE-FORECAST.COM
EWF QUARTERLY FORECAST _______________________________________________ 10/18/2021

SPX Correction Should End This Quarter Scenario 1: Wave ((4)) completed
The SPX (S&P 500) is correcting cycle from September 2020 low in Wave ((4)). As FTSE and some Yen crosses have already broken September highs so the more aggressive view suggests wave ((4)) completed and after completing 5 waves up from 10.04.2021 low, Index will pull back in 3 waves and continue higher within wave (3) of ((5)). The correction should end this quarter at the 100% - 161.8% extension area (4081 – 4228). From there, a new bullish cycle should start and SPX may see a new all-time high in wave ((5)). A minimum of 3 waves rally should be seen from the area.

Scenario 2: Wave ((4)) still in progress with a FLAT from 09.20.2021
Scenario 2 suggests SPX (S&P 500) is still correcting cycle from September 2020 low in Wave ((4)). Since it failed to reach 100% extension of the decline from 09.03.2021 peak to 09.20.2021 low so the rally from 10.04.2021 low could be part of a FLAT from 09.20.2021 low and complete wave (X). Under this scenario, bounce should fail for another 3 waves extension lower to complete a double correction in wave ((4)) during this quarter. Correction should end this quarter at the 100% - 161.8% extension area of (W)-(X) cycles and then a new bullish cycle should start and SPX is expected to see a new all-time high in wave ((5)). A minimum of 3 waves rally should be seen in either case from 100% - 161.8% extension area of (W)-(X) cycles.

EWF Q4 Forecast | 2021 4
SPX Larger Degree Cycle from March 2020 Low May End This Quarter
SPX could potentially resume higher and reach a new all-time high in wave ((5)) before the end of the year. This will also complete larger degree cycle which started from March 2020 low and then the Index can see larger pullback. Thus overall expect a volatile market in the fourth quarter. Once SPX fully completes the 5 waves up from March 2020 low, it should end wave I and see larger wave II pullback in 3, 7, or 11 swing to correct cycle from March 2020 low before the next bullish cycle starts.
EWF Q4 Forecast | 2021 5
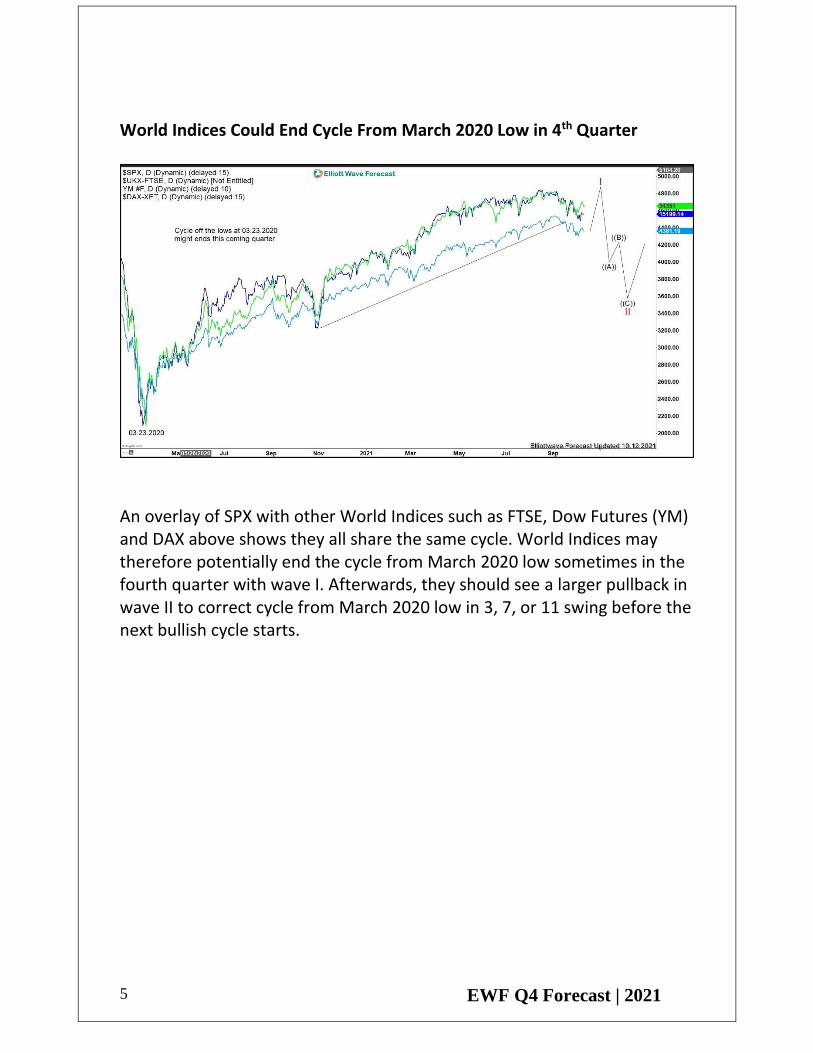
World Indices Could End Cycle From March 2020 Low in 4th Quarter
An overlay of SPX with other World Indices such as FTSE, Dow Futures (YM) and DAX above shows they all share the same cycle. World Indices may therefore potentially end the cycle from March 2020 low sometimes in the fourth quarter with wave I. Afterwards, they should see a larger pullback in wave II to correct cycle from March 2020 low in 3, 7, or 11 swing before the next bullish cycle starts.

EWF Q4 Forecast | 2021 6
Eurostoxx (SX5E) Looking to End Cycle From March 2020 Low This Quarter
Daily Elliott Wave Chart in Eurostoxx (SX5E) above shows the Index rallies as a 5 waves impulsive structure from March 16, 2020 low. Similar to other world indices, wave ((4)) pullback may have already ended or it could still do a double correction from the peak. Afterwards, the Index should do 1 more final push higher in wave ((5)) to complete wave I and end cycle from March 2020 low. It should then see a larger pullback in wave II in 3, 7, or 11 swing to correct that cycle before the next bullish cycle begins.
EWF Q4 Forecast | 2021 7
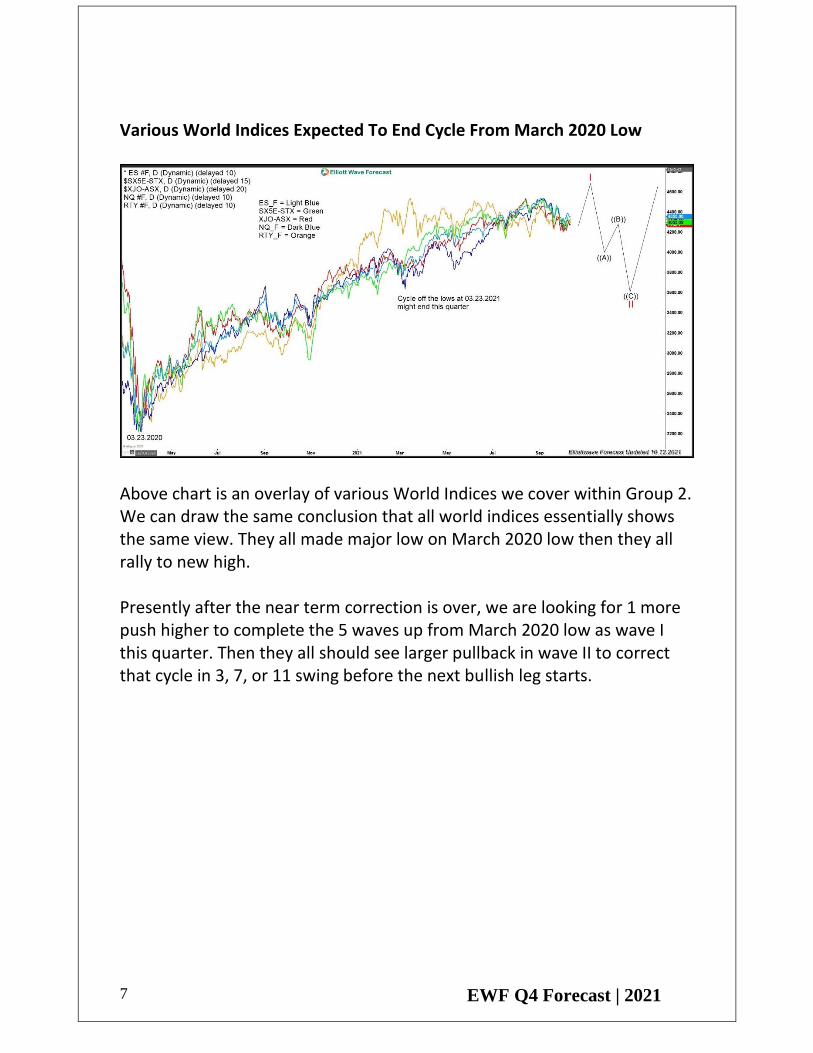
Various World Indices Expected To End Cycle From March 2020 Low
Above chart is an overlay of various World Indices we cover within Group 2. We can draw the same conclusion that all world indices essentially shows the same view. They all made major low on March 2020 low then they all rally to new high. Presently after the near term correction is over, we are looking for 1 more push higher to complete the 5 waves up from March 2020 low as wave I this quarter. Then they all should see larger pullback in wave II to correct that cycle in 3, 7, or 11 swing before the next bullish leg starts.

EWF Q4 Forecast | 2021 8
AAPL Correction Should Start a new cycle higher this quarter Scenario 1:
AAPL wave ((4)) may have ended already and after it completes 5 waves up from October low, there should be a 3 waves pull back followed by extension higher in wave (3) of ((5)). We expect a new cycle higher to start this quarter.

EWF Q4 Forecast | 2021 9
Scenario 2: A FLAT in wave (X)
AAPL is correcting the cycle from 5/13/2021 lows in wave ((4)) pullback. While the short term cycle from 9/07/2021 high looks incomplete to the downside & missing the 100% extension area of (W)-(X). The Correction is expected to end this quarter at the100%-161.8% Fibonacci extension area of (W)-(X).From there, a new cycle higher is expected to take place in wave ((5)) or a minimum 3 wave bounce should happen.

EWF Q4 Forecast | 2021 10
Tech Stocks larger degree cycle from December 2018 May End this Quarter
An overlay of tech stocks such as AAPL, XLK, NVDA, Google & NVDA should see another new all time high before cycle from December 2018 low ends & a bigger pullback can take place.Currently, SPY & other world indices are also missing 1 more push higher within the cycle from March 2020 lows favoring the same side.

EWF Q4 Forecast | 2021 11
SPY Cycle From March 2020 low May end this quarter
SPY can potentially see a new high this quarter looking for new all time highs in wave ((5)). This will also complete the bigger cycle started from 3.23.2020 lows in 5 waves structure and then index can start the larger degree pullback. Once SPY completes it’s 5 waves structure it should end wave I & see a larger pullback in wave II, which is expected to take place in 3, 7 or 11 swings before the next bullish cycle starts.
EWF Q4 Forecast | 2021 12
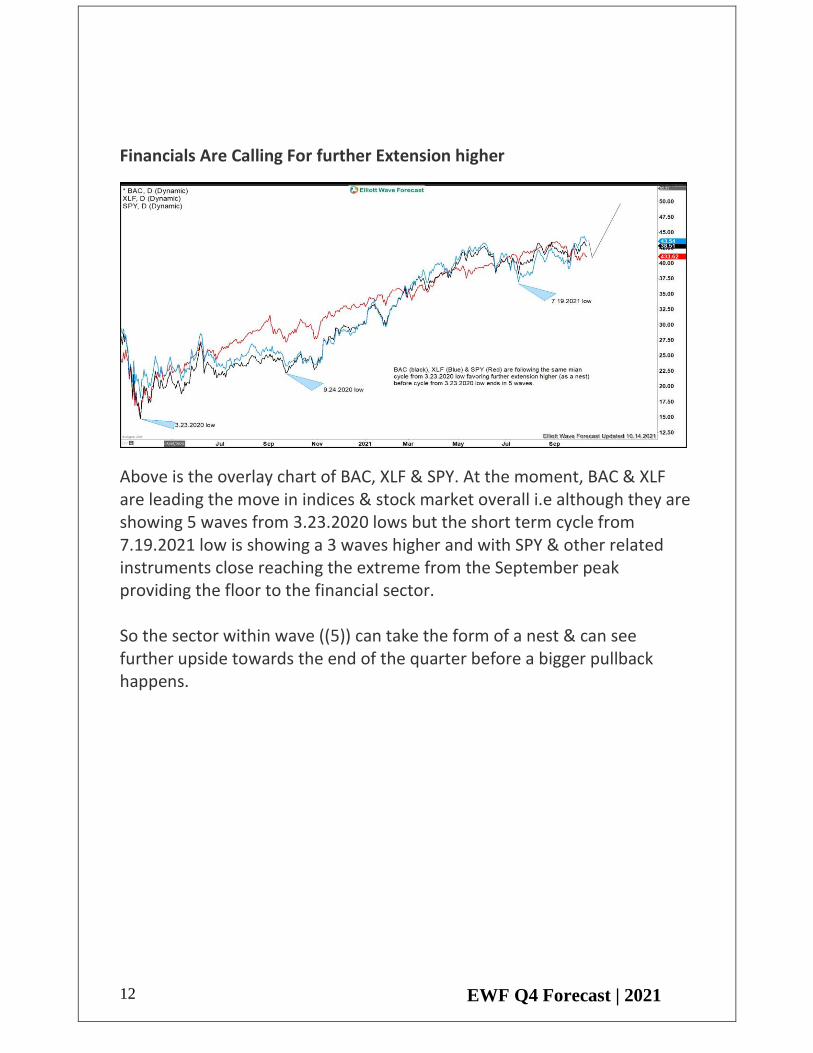
Financials Are Calling For further Extension higher
Above is the overlay chart of BAC, XLF & SPY. At the moment, BAC & XLF are leading the move in indices & stock market overall i.e although they are showing 5 waves from 3.23.2020 lows but the short term cycle from 7.19.2021 low is showing a 3 waves higher and with SPY & other related instruments close reaching the extreme from the September peak providing the floor to the financial sector. So the sector within wave ((5)) can take the form of a nest & can see further upside towards the end of the quarter before a bigger pullback happens.

EWF Q4 Forecast | 2021 13
Energy Stocks Might End the cycle from March last year low this quarter
Energy instruments such as XLE & OIL both are showing 5 waves sequence from March or April last year lows. While XOM is still lagging but as far as they remain above 8/19/2021 lows they are expected to extend higher based on indices & rest of the stock market missing the last push higher within the same cycle from March last year lows. But the cycle from March 2020 lows can be ending the cycle by the end of the quarter & they should see a bigger pullback in 3, 7 or 11 swings.

EWF Q4 Forecast | 2021 14
Metal & Miners May See A Low this Quarter
Above is the overlay chart of XME & GDX, in which both instruments have ended the cycle from March 2020 lows & are now doing a pullback against that cycle. The pullback from the peak in GDX looks incomplete to the downside favoring another leg lower into the $24.98- $21.40 equal legs area is expected to happen during this quarter. And similarly XME can see $37.16- $31.42 equal legs area. From there, both metals are expected to resume the upside this quarter & start the next bullish cycle or should produce a minimum 3 wave reaction higher at least.

EWF Q4 Forecast | 2021 15
SPX and Ten Year Notes (ZN) Show Inverse Correlation
An overlay between S&P 500 (SPX) and Ten Year Notes (ZN) chart above show they have an inverse correlation. SPX formed a major low on March 9, 2020 low while Ten Year Notes formed a major high at the same period. SPX then continues to rally higher while ten year notes continues to slide lower. Due to this dynamic, expect Ten Year Notes (ZN) to end the cycle from March 9, 2020 high when S&P 500 (SPX) ends cycle from March 9, 2020 low this quarter. Once cycle from March 9, 2020 high ends, Ten Year Notes (ZN) should see at least a 3 waves rally.

EWF Q4 Forecast | 2021 16
Ten Year Notes (ZN) May End Cycle from March 2020 High This Quarter
Ten Year Notes (ZN) shows a 5 swing decline from March 9, 2020 peak. We label this as a diagonal. The 5 waves decline may end this fourth quarter and the Notes can then see larger 3 waves rally. Down from March 9, 2020 high, wave ((1)) ended at 133’2 and rally in wave ((2)) ended at 140’13. The Notes then extends lower in wave ((3)) towards 130’25 and rally in wave ((4)) ended at 135’13. Near term, while below 135’13, expect Notes to extend lower further. The entire 5 waves and cycle from March 9, 2020 high may complete this quarter before a larger 3 waves rally afterwards.

EWF Q4 Forecast | 2021 17
AUDJPY Looks to have ended Cycle from March 2020 Low
AUDJPY chart above shows that the pair broke below the rising channel from March 18, 2020 low and has been in consolidation for several months. Based in Indices and other Yen crosses, we expect AUDJPY to ideally make a new high during this quarter to end cycle from Marcy 202. This quarter, we expect sideways to higher direction in AUDJPY. AUDJPY can see a retest of the May 2021 high while World Indices finish wave ((5)) of I from March 2020 low. Then when World Indices start the bigger pullback in wave II to correct cycle from March 2020 low, AUDJPY may see a double correction and turn lower to correct the cycle from March 2020 low further.

EWF Q4 Forecast | 2021 18
Most Yen Pairs Have Ended Cycle from March 2020 Low
An overlay of AUDJPY and other Yen pairs (GBPJPY, EURJPY, CADJPY) above shows a clear correlation among them. We therefore expect the same sideways to higher move within Yen group in the fourth quarter. Similar to AUDJPY, most Yen pairs have ended cycle from March 18, 2020 low. The Yen pairs likely go sideways to higher waiting for Indices to end wave ((5)) of I from March 2020 low. Then when world indices start to do the larger pullback in wave II, yen pairs should turn lower and see a double correction to correct cycle from March 18, 2020 low further.

EWF Q4 Forecast | 2021 19
CHFJPY Looking For Further Upside
CHFJPY shows a 7 swing structure from 12.31.2018 and should see 1 more push higher this quarter to end 9 swing structure. The rally is unfolding as a diagonal 5 waves, and presently the pair is in wave ((5)) of I. Near term, while pullback stays above wave ((4)) low at 117.54, expect further upside in the pair. We do like buying the dips in 3, 7, or 11 swing in the shorter cycle this quarter. The pair should end wave ((5)) of I sometimes this quarter together with the Indices, then they should all see a larger degree correction in wave II in 3, 7, or 11 swing.

EWF Q4 Forecast | 2021 20
GBPUSD Needs Another Leg Lower
GBPUSD currently shows an incomplete 9 swing sequence from June 1, 2021 peak favoring more downside. The pair is still missing another leg lower to complete the cycle from June 1, 2021 peak as an ABC zigzag structure (11 swing). The pair ideally reaches the 100% - 161.8% Fibonacci extension area from June 1, 2021 peak towards 1.287 – 1.33 area. This area is indicated with the blue box above. From the blue box area, the pair can resume to a new high or at least rally in 3 waves. This suggests then that in the near term, we might still see $USDX strength to allow GBPUSD to reach the blue box area. But once GBPUSD reaches the blue box and turns higher, $USDX should turn lower.
EWF Q4 Forecast | 2021 21
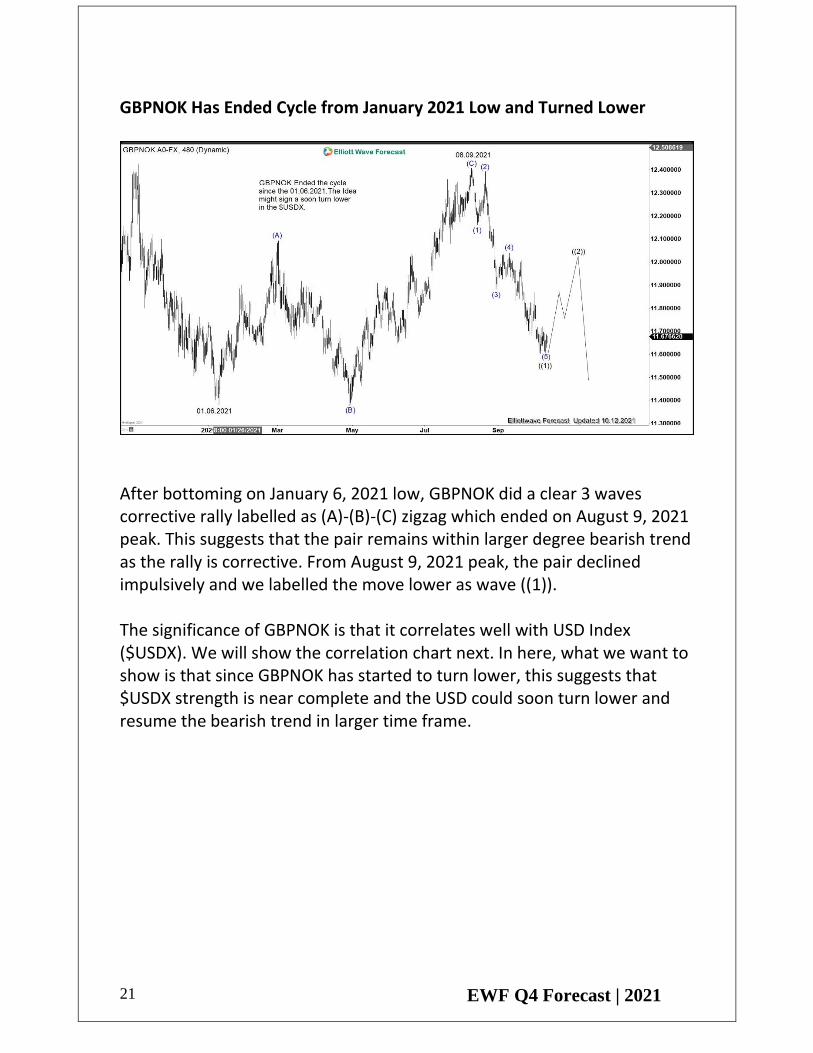
GBPNOK Has Ended Cycle from January 2021 Low and Turned Lower
After bottoming on January 6, 2021 low, GBPNOK did a clear 3 waves corrective rally labelled as (A)-(B)-(C) zigzag which ended on August 9, 2021 peak. This suggests that the pair remains within larger degree bearish trend as the rally is corrective. From August 9, 2021 peak, the pair declined impulsively and we labelled the move lower as wave ((1)). The significance of GBPNOK is that it correlates well with USD Index ($USDX). We will show the correlation chart next. In here, what we want to show is that since GBPNOK has started to turn lower, this suggests that $USDX strength is near complete and the USD could soon turn lower and resume the bearish trend in larger time frame.

EWF Q4 Forecast | 2021 22
GBPNOK and USDX Positive Correlation
Above is an overlay chart of GBPNOK and USDX. USDX chart is denoted with the red color while GBPNOK chart is denoted with the blue color. As we have previously mentioned, these two instrument have positive correlation. They both formed significant low on January 2021. GBPNOK has ended that cycle from January 2021 low and started to turn lower impulsively while $USDX hasn’t started to turn lower. GBPNOK in this case is leading the USDX. GBPNOK still needs to rally to correct the 5 waves decline from August 9, 2021 peak which may allow $USDX to extend a little bit further due to the positive correlation. Afterwards, once GBPNOK finishes the 3 waves corrective rally and starts the next leg lower, we expect $USDX to end cycle from January 6, 2021 low and start to turn lower as well.
EWF Q4 Forecast | 2021 23
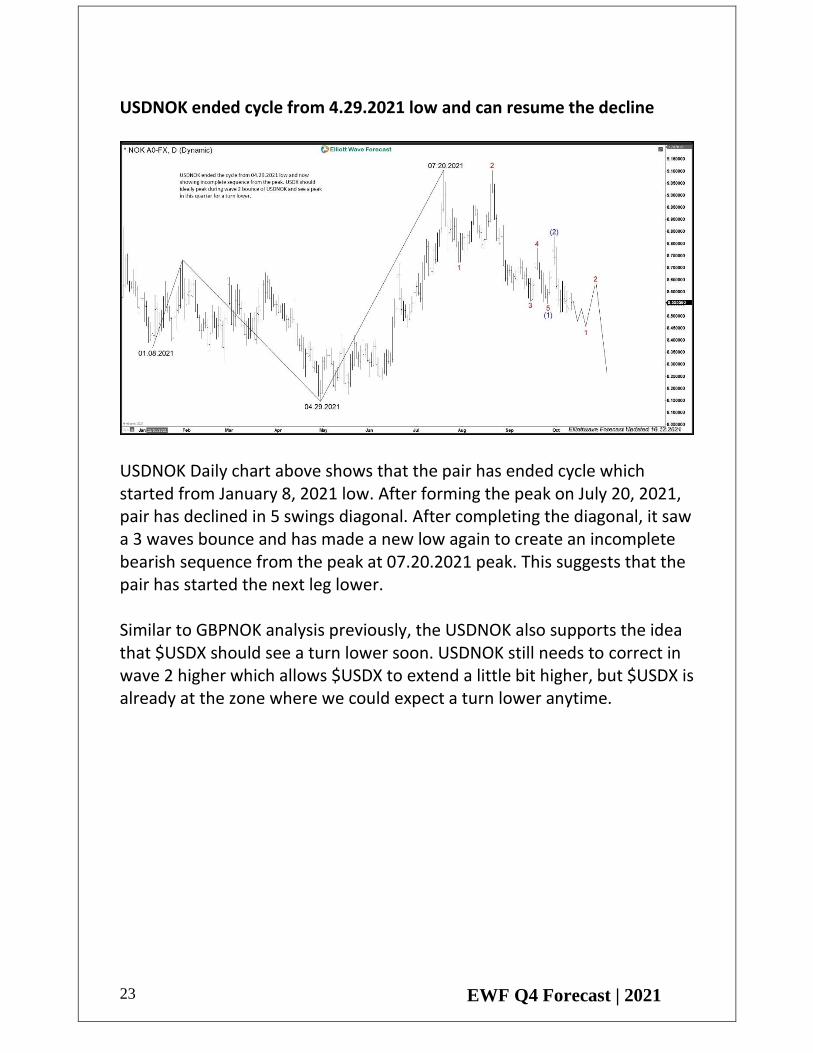
USDNOK ended cycle from 4.29.2021 low and can resume the decline
USDNOK Daily chart above shows that the pair has ended cycle which started from January 8, 2021 low. After forming the peak on July 20, 2021, pair has declined in 5 swings diagonal. After completing the diagonal, it saw a 3 waves bounce and has made a new low again to create an incomplete bearish sequence from the peak at 07.20.2021 peak. This suggests that the pair has started the next leg lower. Similar to GBPNOK analysis previously, the USDNOK also supports the idea that $USDX should see a turn lower soon. USDNOK still needs to correct in wave 2 higher which allows $USDX to extend a little bit higher, but $USDX is already at the zone where we could expect a turn lower anytime.

EWF Q4 Forecast | 2021 24
USDNOK and USDX Show Positive Correlation
An overlay of USDNOK and USDX charts above show they both share the same cycle and have positive correlation. They both formed major low on January 8, 2021 and April 29, 2021. Interestingly, the positive correlation somewhat diverged in the last month or so, but USDNOK could be leading the USDX in this case. The overall positive correlation between the two instrument gives a warning sign for USDX that the time is near for the Index to turn lower.

EWF Q4 Forecast | 2021 25
Oil Should End Cycle from April 2021 low this Quarter
Oil chart above shows a 5 waves rally from April 21, 2021 low. The entire 5 waves rally should end sometimes this quarter and Oil should then see a larger 3 waves pullback. Near term, Oil can see further upside while above wave ((4)) low at 61.55. Oil can continue to be supported and extends higher as far as World Indices haven’t completed wave ((5)) of I. Once world Indices ended cycle from March 2020 low with wave I, indices and oil should turn lower together in larger degree pullback.

EWF Q4 Forecast | 2021 26
Indices, Oil, and Yen pairs Show the Same Cycle
An overlay chart of SPX (Green), Oil (Blue), and CADJPY (red) above show they share the same cycle. They all formed major low on April 21, 2021 low and rally higher from there. This suggests that we should expect all of them to continue higher but also end the cycle from March/April 2020 low likely sometimes this quarter. They all should complete wave ((5)) of I then see larger pullback in wave II to correct cycle from March/April 2020 low in 3, 7, or 11 swing before the next bullish leg.
EWF Q4 Forecast | 2021 27
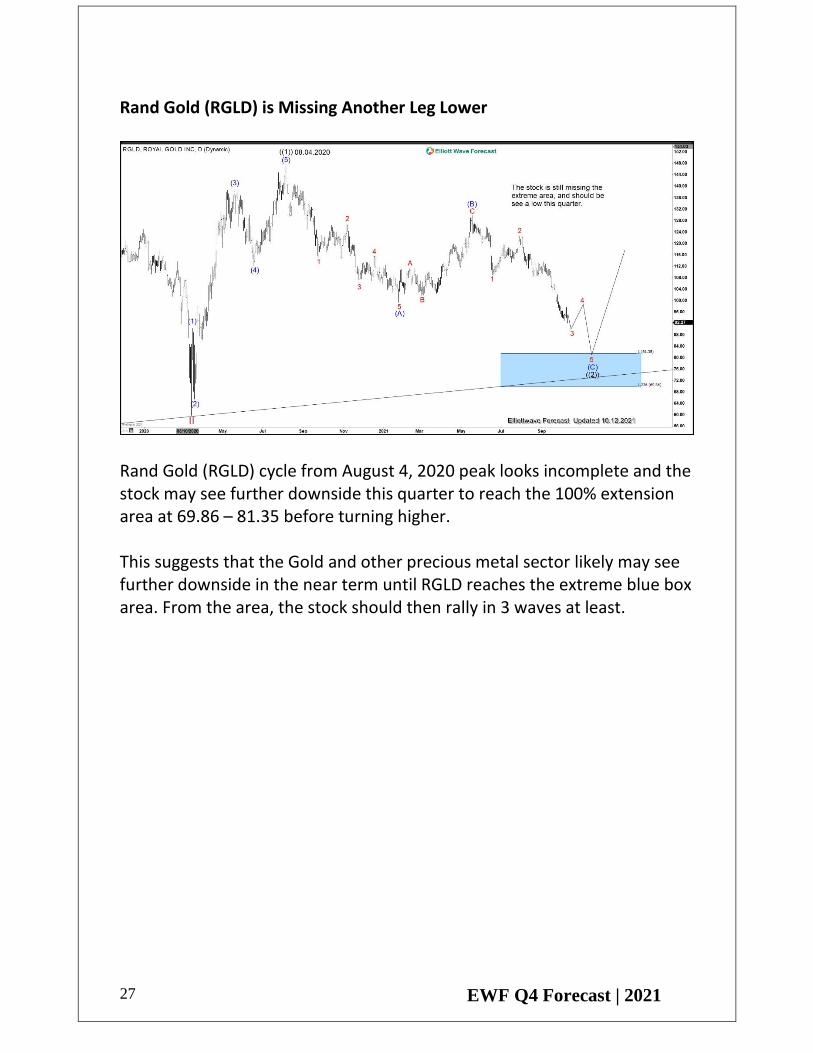
Rand Gold (RGLD) is Missing Another Leg Lower
Rand Gold (RGLD) cycle from August 4, 2020 peak looks incomplete and the stock may see further downside this quarter to reach the 100% extension area at 69.86 – 81.35 before turning higher. This suggests that the Gold and other precious metal sector likely may see further downside in the near term until RGLD reaches the extreme blue box area. From the area, the stock should then rally in 3 waves at least.
EWF Q4 Forecast | 2021 28
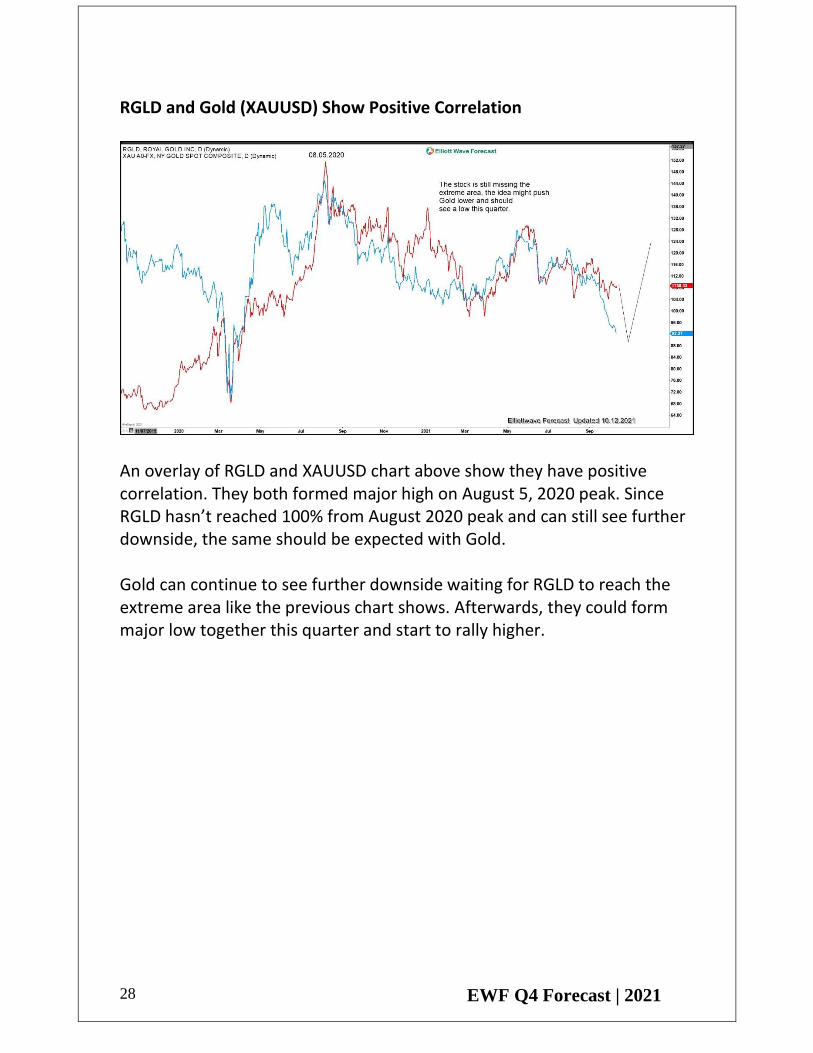
RGLD and Gold (XAUUSD) Show Positive Correlation
An overlay of RGLD and XAUUSD chart above show they have positive correlation. They both formed major high on August 5, 2020 peak. Since RGLD hasn’t reached 100% from August 2020 peak and can still see further downside, the same should be expected with Gold. Gold can continue to see further downside waiting for RGLD to reach the extreme area like the previous chart shows. Afterwards, they could form major low together this quarter and start to rally higher.

EWF Q4 Forecast | 2021 29
Silver Miners ETF (SIL) Has Reached Extreme Area
Silver Miners ETF (SIL) has reached 100% extreme area from August 2020 peak suggesting it’s close to turn higher. Near term, further downside can’t be ruled out to allow RGLD and GBPUSD to reach the 100% area. The ETF can see a low sometimes this quarter and see a new bullish cycle or at least a 3 waves rally from blue box area of $26.45 – 35.51.

EWF Q4 Forecast | 2021 30
Silver ETF (SLV) Has Reached Extreme Area from February 2021
Similar to Silver Miners ETF (SIL), Silver ETF (SLV) has also reached 100% extreme area from February 1, 2021 peak at 16.59 – 20.35, denoted in blue box. This indicates that Silver is close to turn higher as well. Near term, we can’t rule out further downside within the blue box to allow RGLD and GBPUSD to reach the 100% extreme area. Regardless, Silver likely starts to turn higher in 3 waves at least sometimes this quarter.

EWF Q4 Forecast | 2021 31
Soybean Should See Further Downside To End Cycle From May 2021 Peak
Daily chart of Soybean above shows cycle from May 12, 2021 high remains incomplete as it has not reached the extreme area. Expect further downside this quarter to reach the 100% - 161.8% area towards 919 – 1133.6 before it resumes higher or rally in 3 waves at least. As commodities are priced in US Dollar, in a way this also tells us information about the state of the US Dollar. When Soybean starts to turn higher from the area above, USDX should also start to turn lower.

EWF Q4 Forecast | 2021 32
Soybean Inversely Correlated with USDX
As previously mentioned, Soybean and USDX should have somewhat negative correlation as commodities like Soybean is priced in US Dollar. The chart above is an overlay of Soybean and USDX. Near term, expect Soybean to extend lower to the target 919 – 1133 area, allowing USDX to extend a little bit further. Then when Soybean starts to turn higher from the area, expect USDX to start turning lower due to the inverse correlation.
EWF Q4 Forecast | 2021 33
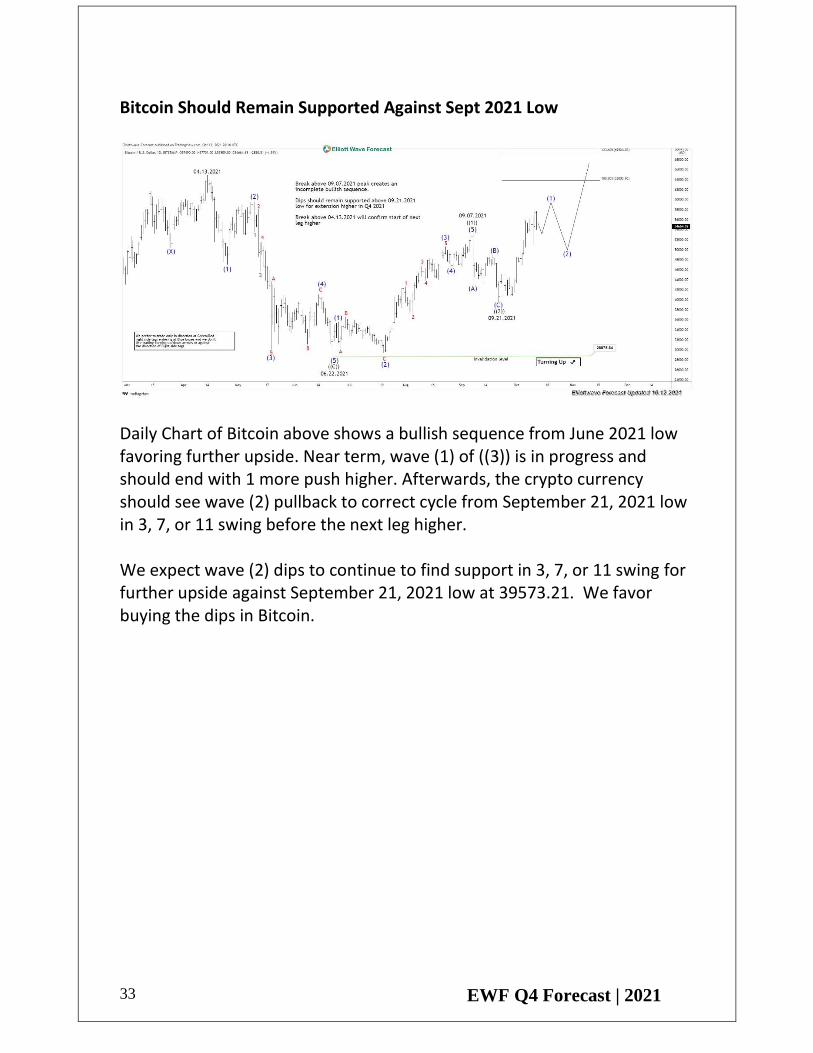
Bitcoin Should Remain Supported Against Sept 2021 Low
Daily Chart of Bitcoin above shows a bullish sequence from June 2021 low favoring further upside. Near term, wave (1) of ((3)) is in progress and should end with 1 more push higher. Afterwards, the crypto currency should see wave (2) pullback to correct cycle from September 21, 2021 low in 3, 7, or 11 swing before the next leg higher. We expect wave (2) dips to continue to find support in 3, 7, or 11 swing for further upside against September 21, 2021 low at 39573.21. We favor buying the dips in Bitcoin.
EWF Q4 Forecast | 2021 34
Conclusion: We expecting the Word Indices to trade into new highs during the quarter and possibly see a peak and end the cycle since the lows at 03.2020. As of right now, we are calling the wave ((4)) completed within the cycle, but it can get complex in which case the Indices will still trade higher during the quarter but they will not see a peak during the quarter. In Yen pairs, we are expecting new highs within the cycle since the lows in 2020, and possibly a peak at the end of the quarter. In the YEN pairs, we are calling the wave ((4)) completed, and should remain above the lows. Crude Oil is showing the same cycle as YEN pairs and Indices and we are expecting extensions within wave ((5)) and possible peak at the end of the quarter depending on the Indices. The USDX might see a top during the quarter as it is trading in the Blue Box since the lows at 01.06.2021. The Commodities crosses are showing the idea and presenting a balance in favor of the commodities currencies against the USDX.