Evidence on a Social Demand Theory of Corporate Social ... · We examine how local stakeholder...
55
1 Evidence on a Social Demand Theory of Corporate Social Responsibility Lixiong Guo † and Zhiyan Wang ‡ Culverhouse College of Business University of Alabama October 2018 ABSTRACT We examine how local stakeholder demand for CSR revealed by nonprofit organizations’ annual spending is associated with firms’ CSR policy and the relation between CSR and firm value. Using a novel data on nonprofit organizations in the U.S., we find that CSR ratings of firms vary positively with local nonprofit sector spending in their headquarters’ metropolitan statistical areas (MSAs) over time. This relation holds for both the overall CSR rating and CSR rating in each dimension. Our results are not driven by geographic or firm heterogeneity. Futher tests show that the association is unlikely to be driven by time-varying local omitted variables either. We also find that local nonprofit spending alters the relation between firm value and CSR in the positive direction, and CSR ratings of well-governed firms are more responsive to changes in local nonprofit spending than that of poorly-governed firms. Overall, our paper provides important evidence on a social demand-driven explanation of CSR which reconciles several mixed findings in the CSR literature. Our findings also suggest that the nonprofit sector plays a crucial role in revealing social demand on CSR and that shareholders benefit from responding to revealed social demand. Keywords: Nonprofit, Corporate Social Responsibility, Societal Demand, Firm Value, Institutional Impact JEL Classification: G30, G34, H40, M14 † Lixiong Guo is an Assistant Professor of Finance with the University of Alabama. Address: Culverhouse College of Commerce, University of Alabama, 222 Alston Hall, 361 Stadium Drive, Tuscaloosa, Alabama, 35487-0224. Office Phone: 205.348.2912. Email: [email protected]. ‡ Zhiyan Wang is a Ph.D. student of Finance at the University of Alabama. Email: [email protected]
Transcript of Evidence on a Social Demand Theory of Corporate Social ... · We examine how local stakeholder...

1
Evidence on a Social Demand Theory of Corporate Social Responsibility
Lixiong Guo† and Zhiyan Wang‡
Culverhouse College of Business
University of Alabama
October 2018
ABSTRACT
We examine how local stakeholder demand for CSR revealed by nonprofit organizations’
annual spending is associated with firms’ CSR policy and the relation between CSR and firm
value. Using a novel data on nonprofit organizations in the U.S., we find that CSR ratings of
firms vary positively with local nonprofit sector spending in their headquarters’ metropolitan
statistical areas (MSAs) over time. This relation holds for both the overall CSR rating and
CSR rating in each dimension. Our results are not driven by geographic or firm heterogeneity.
Futher tests show that the association is unlikely to be driven by time-varying local omitted
variables either. We also find that local nonprofit spending alters the relation between firm
value and CSR in the positive direction, and CSR ratings of well-governed firms are more
responsive to changes in local nonprofit spending than that of poorly-governed firms. Overall,
our paper provides important evidence on a social demand-driven explanation of CSR which
reconciles several mixed findings in the CSR literature. Our findings also suggest that the
nonprofit sector plays a crucial role in revealing social demand on CSR and that shareholders
benefit from responding to revealed social demand.
Keywords: Nonprofit, Corporate Social Responsibility, Societal Demand, Firm Value,
Institutional Impact
JEL Classification: G30, G34, H40, M14
† Lixiong Guo is an Assistant Professor of Finance with the University of Alabama. Address: Culverhouse College of Commerce,
University of Alabama, 222 Alston Hall, 361 Stadium Drive, Tuscaloosa, Alabama, 35487-0224. Office Phone: 205.348.2912.
Email: [email protected]. ‡ Zhiyan Wang is a Ph.D. student of Finance at the University of Alabama. Email: [email protected]

2
“The opinions and actions of International NGOs, Charities, Think Tanks and
Foundations are driving the CSR and sustainability agenda across the world.”
― Ipsos MORI
1. Introduction
Should companies have social responsibilities? The debate on this question has ebbed and
flowed over decades. Proponents of Friedman’s view assert that the only legitimate objective of
companies is to make profits for shareholders (e.g., Berle and Means, 1932; Friedman, 1970;
Sundaram and Inkpen, 2004). Yet, recent trend shows that businesses, especially large
corporations, are increasingly allocate significant portion of company resources to a variety of
sustainability3 , philanthropy4 , and corporate social initiatives5 . Many companies report their
corporate social responsibilities (CSR) engagements in their annual report and advertise them on
their corporate websites. Why do more and more companies voluntarily spend on stakeholder
interests? Do CSR activities add value to shareholders or are they simply a new form of managerial
private benefits? These are questions of intensive research and debate in the current CSR literature.
Several explanations are offered in the existing CSR literature. The “doing-well-by-doing-
good” view argues that firms engage in CSR to increase profitability and firm value (e.g. El Ghoul
et al., 2011; Albuquerque, Durnev and Koskinen, 2013; Flammer, 2015). The agency view argues
that CSR is a form of managerial private benefits. These two explanations have opposite value
3 The US spending on 29 sustainability initiatives will double to $60bn in 2014 from $28bn in 2010, according to a new
report from Verdantix. See at https://www.businesswire.com/news/home/20101006005109/en/ Verdantix-Forecasts-Sustainable-
Business-Spending-Double-60. 4 National Philanthropic Trust reports that US corporations donated 20.77 billion to charity – an increase of 8.0 % from
2016. See at https:// www.nptrust.org/philanthropic-resources/charitable-giving-statistics/. 5 According to the 2017 KPMG International Survey of Corporate Responsibility Reporting, nearly 93% of Global Fortune
250 companies and 75% of the largest 100 companies published CSR reports. See at https://assets.kpmg.com/
content/dam/kpmg/be/pdf/2017/kpmg-survey-of-corporate-responsibility-reporting-2017.pdf

3
implications for CSR. Other papers leave out the value question and explain CSR from legal
original or local culture norms. All these explanations have some shortcomings in explaining two
important observations about CSR. The first is that there is a recent rise in CSR engagements. The
second is that empirical evidence on the relation between CSR and firm value is at most mixed
(Margolis and Walsh, 2003). For example, the agency view is inconsistent with the time trend in
CSR because corporate governance is improving in the recent time periods. The “doing-well-by-
doing-good” view begs the question of what have changed so it is more valuable to engage in CSR
now than before. The legal original view obviously cannot explain the time trend in CSR because
firms’ legal origins in general do not change over time. The local norm view although can
potentially explain the time trend but they mainly focus on the impact on the supply of CSR. These
papers either do not give predictions on the value impact or provide inconclusive empirical
evidence on it.
In this paper, we provide a framework to understand CSR based on local demand for CSR.
Fundamentally, CSR is a “social good” that firms supply to stakeholders and thus the supply of
profit-maximizing CSR should essentially hinge on stakeholder demands. We argue and most
importantly provide evidence that local demand not only can explain cross-sectional and time-
series variations in CSR activities but also can reconcile the mixed evidence on the relation
between CSR and firm value. Since CSR activities consume corporate resources that could
otherwise be put into direct productive use, we expect that firms with an aim to maximize
shareholder value would vary their CSR engagements with local social demand. Similarly, the
relation between CSR and firm value also depends on local social demand. CSR initiatives are
more likely to add to firm value when the social demand for CSR is high and vice versa.
4
The key to our paper, this is also what distinguishes our paper from other papers, is how to
measure local social demand for CSR. Stakeholders’ demand on social issues are multidimensional
and diffused. We require a measure that aggregates diffused demand and also is most likely to be
felt and sensed by a firm’s decision makers. Binding to local society, firms are likely to seek and
acquire demand information revealed by local community and institutions, such as local nonprofits.
Local nonprofits can unite and reveal stakeholder demands on corporate social responsibility for
several reasons. First, the nonprofit sector is formed to serve the public interests (Hansmann, 1980)
and to advance social causes for population with broad interests. Therefore, their preferences and
demands are closely aligned with stakeholders. For instance, environment nonprofit prevents
environmental degradation for local community, employee nonprofit promotes welfare for
employees, consumer nonprofit protects the interests of customers, etc. Second, seeking to meet
various societal demands, the nonprofit sector unites groups with shared demands, publicize their
demands to the public, mobilizes all social constitutes, especially corporations, to engage in those
social causes. A 2015 report by Urban Institute showed that in 2013, US nonprofit sector spent
2.10 trillion to promote social causes. As a response in 2014, corporations donated 17.77 billion
to the nonprofit sector 6 and spent 60 billion on sustainability management 7 to meet societal
demands on CSR. Third, the nonprofit sector reveals demands on CSR separately for different
stakeholders, as CSR spans multiple categories that benefit different stakeholders.
Prior research suggests the importance of connections between local nonprofits and firms,
which facilitates the spread of information on both sides of CSR (Galaskiewicz, 1985; Marquis,
6 For the information on U.S. nonprofit sector, See https://www.urban.org/research/publication/
nonprofit-sector-brief-2015-public-charities-giving-and-volunteering 7 The US spending on 29 sustainability initiatives will double to $60bn in 2014 from $28bn in 2010, according to a new
report from Verdantix. See at https://www.businesswire.com/news/home/20101006005109/en/ Verdantix-Forecasts-Sustainable-
Business-Spending-Double-60.
5
Glynn and Davis, 2007), especially when firms have nonprofit-connected firm decision makers
(Ostrower, 1995), collaborative relationship (Wymer and Samu, 2003), partnership (Seitanidi and
Crane, 2009). Firms can also acquire demand-side information on CSR from nonprofit activities,
such as fundraising campaign, advocacy, and media coverage, and then incorporate these demand
information into CSR supply. Marquis, Glynn and Davis (2007) claim that local nonprofits serve
to put corporations directly in touch with social needs and thus the connectedness between local
nonprofits and corporations induces higher levels of corporate social actions. Similarly, Campbell
(2007) argue that the nonprofits deliver stakeholder demands directly to corporations by many
tactics (e.g., appealing to corporations, organizing demonstrations against corporations, and
mobilizing media campaigns).
Based on the previous work, we use local nonprofits spending as the proxy for local social
demand for CSR. Since nonprofit organizations play the role of aggregating stakeholder demands
and disseminating demand information for corporate social responsibility, their spending is a more
tangible measure of local social demand for CSR that can be relatively more easily sensed and felt
by local firm top executives than other local measures of social norm or prosocial attitude used in
existing studies.
Using a novel data on US nonprofit organizations, we find that firms’ annual overall CSR
ratings vary positively with annual spending of nonprofit organizations in the firms’ headquarter
metropolitan statistical area (MSA) 8 . When we further divide nonprofit organizations into
subgroups whose social causes best match a particular CSR dimension, we find that nonprofit
spending in a particular CSR dimension mainly affects firms’ CSR ratings in that dimension. In
8 The metropolitan statistical area hs been used as a unit of analysis to capture community-based geographical heterogeneity in
many existant studies (See Marquis, 2003; Stuart and Sorenson, 2003; Marquis, Glynn and Davis, 2007; Brown et al., 2008;
McGuire et al., 2012; Dougal, Parsons and Titman 2015; Cohen, Gurun and Malloy, 2017).

6
all our regressions, we control for MSA, industry and year fixed effects. Our results are also robust
to controlling for firm and year fixed effects. Hence, our findings are not driven by time-invariant
geographic, industry or firm differences. These findings provide strong support to our main
hypothesis that local social demand for CSR drives local firms’ CSR supply.
However, an important empirical challenge in interpreting this relation as evidence of
social demand drives changes in CSR supply remains because a time-varying omitted variable at
the MSA level could still drive our result. To overcome this concern, we take several approaches.
First, we group MSAs into CSAs (Combined Statistical Areas9) and control for CSA*Year fixed
effects. The reasoning is that neighbouring MSAs are likely to share similar social and economic
conditions, by controlling for CSA*Year fixed effects, we mitigate endogeneity concern over a
time-varying omitted variable that is related to local social and economics conditions. We find our
results remain significant after including the CSA*Year fixed effects. Second, we estimate an
instrumental variable regression. The instrument we choose is local nonprofit organizations’
investment income. It is reasonable to assume that nonprofit organizations hold diversified
portfolios of investments as sophisticated investors should do. Under this assumption, variations
in nonprofit organizations’ investment income should mostly be exogenous to changes in local
social and economic conditions and thus satisfy the exclusion condition of a valid instrument. On
the other hand, nonprofit spending is likely to be positively related to their spending. Our IV
regression results continue to show a statistically significant relation between local firms’ CSR
ratings and local nonprofit spending. Third, we break up MSAs into states and re-estimate our
models. Given that many MSAs spin multiple states, our approach could potentially break up the
9 Combined statistical areas (CSA) consist of two or more adjacent metropolitan and micropolitan statistical areas that have
substantial employment interchange. The metropolitan and micropolitan statistical areas that combine to create a CSA retain
separate identities within the larger CSA. See https://www.census.gov/geo/reference/webatlas/csa.html

7
chain between geographical omitted variables and nonprofit spending and firm’s CSR policy.
Lastly, we show that spending by nonprofit organizations on social causes related to a particular
CSR dimension mainly affects local firms’ CSR ratings in that dimension. For example, spending
by the environmental nonprofit group in a year is only positively assocaited with local firms’ CSR
performance in the environmental category in that year. It is difficult to reconcile this level of
precision in the relation between nonprofit spending and local firms’ CSR activities with an omittd
MSA level variable driving the relation we document. It is easier to conceive a local omitted
variable that would drive the overall level of nonprofit spending and local firms’ overall CSR
rating but obviously such a variable cannot explain our CSR subcategory results.
Our argument for the role of local social demand in affecting CSR also has implications
for the relation between CSR and firm value. In theory, meeting social demand can help increase
employee and customer satisfaction and build valuable social capital (Lins, Servaes and Tamayo,
2017). Hence, changes in firms’ CSR policy driven by the desire to meet stakeholder demand for
CSR are likely to indirectly benefit shareholders. To allow for the possibility that not all CSR
engagements are initiated to meet social demand, for example, some could be driven by managerial
preferences, we include both a firm’s CSR and its interaction with nonprofit spending in a
regression of the firm’s Tobin’s Q on explanatory variables. The coefficeint on CSR iteself is
negative and statistically significant, suggesting that CSR engagements that are not initiated to
meet social demand decrese firm value. However, the coefficeint on the interaction term is positive
and statistically significant, suggesting that high local demand as proxied by high local nonprofit
spending alters the negative relation between firm value and CSR in the positvie direction. In
unreported results, we find that a firm’s CSR rating is positively related to its Tobin’s Q in a
regression without the interaction of CSR and nonprofit spending. Our result shows that nonprofit

8
spending is an important variable that distinguishes good CSRs and bad CSRs from the
shareholders’ point of view. This result also suggests that social demand cannot explain all CSR
engagements in all firms. If CSR engagements during periods of high social demand are value
increasing, then we expect firms with better governance to be more likely to increase their CSR
rating during these periods. Consistent with this, we find that well-governed firms’ CSR policy is
more sensitive to local demand changes than that of poorly-governed firms even though the former
on average spend less on CSR than the latter.
Our paper provides novel and important evidence on a demand-side explanation of CSR
activities. Our findings suggest that firms’ CSR supply is partially driven by social demand
revealed by local nonprofits. Although not all CSR spending seems to create value for shareholders,
suggesting that some CSR activities are probably a form of managers’ private benefits of control,
local demand-induced CSR spending seems to benefit shareholders and well-governed firms are
more likely to choose to meet this demand as a way to maximize shareholder wealth.
In addition, we also provide important evidence on how stakeholder demand on CSR
subcategories revealed by local nonprofits drive firms CSR performance in those ratings. Prior
studies have not been able to explain why the same firm supply differently in different CSR
subcategory and adjust those subcategory ratings differently over time. For instance, why
democratic firms spend significantly more in environment, but not human rights, community and
so on (Di Giuli and Kostovetsky, 2014). Our detailed measure of nonprofit spending allows us to
link specific stakeholder demand to firms’ performance in the corresponding CSR subcategory.
Two recent studies also examine local determinants of CSR. Attig and Brockman (2017)
find that local prosocial attitude as proxied by the fraction of residents in the firm’s headquarter
state making charitable donations are positively associated with the CSR rating of firms

9
headquartered in that state. Jha and Cox (2015) find that altruism inclination in a firm’s headquarter
state is positively correlated with the firm’s CSR ratings. Since these papers do not control for
state fixed effects, the relation they document could be driven by omitted geographic differences
other than the main explanatory variable they try to proxy. Our paper is also related to Servaes and
Tamayo (2013) in that we both argue that the relation between CSR and firm value is conditional.
We also control for the proper fixed effects to address model misspecification issues in other
existing studies. However, Servaes and Tamayo (2013) use stakeholder awareness of firms’ CSR
engagements as the conditional variable and thus implicitly assume uniform demand for CSR. In
contrast, we conditional on local demand and provide evidence that demand for CSR is not uniform.
Lastly, this paper also complements the literature that examines social and economic
impacts of the nonprofit sector.
The remainder of this paper proceeds as follows. Section 2 discusses related literature and
institutional background. Section 3 describes the data, variables and empirical methods. Section 4
presents our main results, robustness tests, CSA time varying specification, state-level results, and
sub-category results. Section 5 shows details on nonprofit functions and effects. Section 6
discusses potential mechanisms on our main results. Section 7 concludes.
2. Related Literature and Institutional Background
2.1. Related Literature
With the rising attention of academics, business, and policymakers on corporate social
responsibility (Carroll, 2009), several fundamental questions of intense debates are that why
companies engage in corporate social responsibility and whether CSR engagements are in
shareholders’ interests.

10
Several explanations are offered in the existing CSR literature. The traditional view
(“doing-well-by-doing-good” view) argues that firms engage in CSR to increase profitability and
firm value (e.g. El Ghoul et al., 2011; Albuquerque, Durnev and Koskinen, 2013; Flammer, 2015).
The agency view argues that CSR is a reflection of managerial social preferences (Cronqvist and
Yu, 2017) or a form of managerial private benefits (Masulis and Reza, 2015). The normative
arguments leave out the value question and explain CSR from normative roots, such as legal origin
(Liang and Renneboog, 2017), social norms (Dyck et al., 2015) and prosocial attitudes (Attig and
Brockman, 2017). Although these explanations have some success in explaining CSR, they eschew
three important observations about CSR. The first is that there is a recent rise in CSR engagements.
The second is that empirical evidence on the relation between CSR and firm value is at most mixed
(Margolis and Walsh, 2003). The third is that CSR engagement levels differ among firms. For
example, the traditional view suffers from mixed evidence on the relation between CSR and firm
value. The agency view is inconsistent with the time trend in CSR because corporate governance
is improving recently. The legal origin view obviously cannot explain the time trend in CSR
because firms’ legal origins in general do not change over time. The local norm view although can
potentially explain the time trend but they mainly focus on the impact on the supply of CSR. These
papers either do not give predictions on the value impact or provide inconclusive empirical
evidence on it.
To investigate the rational and recent trend of CSR, we provide a framework to understand
CSR based on local stakeholder demand for CSR. We argue and most importantly provide
evidence that local stakeholder demand not only can explain cross-sectional and time-series
variations in CSR activities but also can reconcile the mixed evidence on the relation between CSR
and firm value. Since we study how local stakeholder demand proxied by local nonprofit spending

11
affect CSR and the relation between CSR and firm value, our study seem to be relevant to several
recent studies (e.g., Jha and Cox, 2015; Husted, Jamali and Saffar, 2016), especially Attig and
Brockman’s work (2017). However, our study differs in many ways.
First, they study how state-based norms affect CSR. Given that social norms evolve
incrementally, they find cross-states evidence. While our work studies how the nonprofit sector
affect corporations’ CSR policy through social demand channel. To separate institutional effects
from location-based factors, we control for MSA fixed effects in all our tests. Second, their results
neither have identifications on the relation, nor control for state fixed effects and state
fundamentals such as state GDP. We apply a series of plausible identification strategies to ensure
the direction going from nonprofit spending to CSR. Third, neither prosocial attitude nor social
norms have explicit explanations on CSR subcategories, while nonprofit spending has a consistent
and separate explanation on each category. Fourth, their results on firm value implications are self-
conflicting, while our results are consistent with conditional effect on firm value (Servaes and
Tamayo, 2013) that well explain the mixed findings in prior literature. Lastly, we investigate how
corporate governance react to stakeholder demand on CSR and the implication on the relation
between CSR and firm value.
2.2. Institutional Background
The nonprofit sector is formed to serve the public benefit other than the pursuit or
accumulation of profits for owners or members (Hansmann, 1980; Zimmer, 1993; Adelino,
Lewellen and Sundaram, 2015). It has long been documented that the nonprofit, as the third largest
sector in U.S. economy, plays a crucial role in the social and economic well-being of the United
States. A 2015 report by Urban Institute showed that in 2013, US nonprofit sector employed over

12
14.4 million people or 10.6 percent of total employment and contributed 905.9 billion or 5.4
percent of the total GDP to the economy. More importantly, the nonprofit sector spent a total of
2.10 trillion to provide public goods, advocate social causes, advance social welfare, and inspire
civic involvement. As a response, the general public of the U.S. donated 358.38 billion to the
nonprofit sector and volunteered 8.7 billion hours in the nonprofit sector in 201410. Meantime,
corporations donated 17.77 billion to the nonprofit sector and spent 60 billion on sustainability
management to advance a variety of environmental and social causes in line with the nonprofit
sector.
Given the amount of attention and money corporations give to social initiatives under such
a social context, it is natural to ask whether and how the nonprofit sector drives a firm’s CSR
policy. According to a 2014 IPSOS MORI global online survey, most respondents view that the
opinions of NGOs can directly shape how a company, and its activities, are perceived by the
broader stakeholder community and the public, shape how an organization’s sustainability strategy
is received and directly influence their wider corporate reputation11. Nonprofit organizations can
drive CSR through direct and indirect channels. The direct way is to impose pressure on
corporations to behave socially responsible. Campbell (2007) argue that “corporations will be
more likely to act in socially responsible ways if there are any private and independent nonprofit
in their environment who monitor their behaviors and, when necessary mobilize to change it.” The
indirect way is to influence corporations through primary stakeholders in local community.
Salamon et al. (2000) point out that nonprofit organizations potentially perform an expressive and
10 For the information on U.S. nonprofit sector, See https://www.urban.org/research/publication/
nonprofit-sector-brief-2015-public-charities-giving-and-volunteering 11 Ipsos MORI run a global online survey to ask adults their views on the relationship between large corporations and global
Non-Government Organizations. See https://www.ipsos.com/ipsos-mori/en-uk/delicate-relationship-between-worlds-biggest-
ngos-and-multinational-corporations

13
representational role for community constituents to express their interests and values. In line with
this representational role, both anecdotal evidence and empirical evidence show that nonprofit
organizations work on behalf of stakeholders and influence corporate social performance through
delivering stakeholder demands to corporations (e.g., Doh and Teegen, 2002; Vasi and King, 2012;
Helmig, Spraul and Ingenhoff, 2016).
3. Data and Methodology
To examine the effects of nonprofit organizations on local firms’ CSR policy, we construct
a data set that links nonprofit spending to their local firms’ CSR activities. In this section, we
describe our sample and outline our empirical methods and identification strategies.
3.1. CSR Data
Our sample consists of an unbalanced panel of the largest 3,000 publicly traded U.S.
companies, during the period 2003 – 2009. We start with CSR ratings over the period 2003 – 2009
from the MSCI ESG Database, previously known as the KLD STATS database. This database
contains annual ratings on 13 dimensions in the largest 3,000 publicly traded companies since
2003. Within each dimension, KLD provides a number of strength indicators and concern
indicators. If a firm has particular strength or concern in the area represented by the indicator, the
strength or concern indicator gets a value of one and zero otherwise. We only count community,
diversity, employee relations, environment, human rights, and product as components of CSR, as
other dimensions are widely considered to be outside the domain of CSR (Di Giuli and
Kostovetsky, 2014; Cronqvist and Yu, 2017). The six dimensions totally contain 56 different
indicators. For each firm-year observation in our sample, we calculate CSR raw score for each
dimension by subtracting total concerns from total strengths within each dimension, then we sum

14
up CSR raw scores across six dimensions to yield the aggregate CSR raw score. We further
standardize CSR raw scores to CSR indexes ranging from -1 to 1 for each dimension and from -6
to 6 for total six dimensions. Accordingly, a higher CSR index indicates a higher performance in
CSR and vice versa.
3.2. Nonprofit Data
Nonprofit organizations refer to 501(c) organizations or nongovernmental organizations.
They are formed to serve the public benefit other than the pursuit or accumulation of profits for
owners or members (Hansmann, 1980; Zimmer, 1993; Adelino, Lewellen and Sundaram, 2015).
Therefore, we utilize annual disclosure information required by Internal Revenue Service on all
U.S. 501(c) organizations from National Center for Charitable Statistics Database. According
to Title 26 of the United States Code § 501, there are 29 types of 501(c) organizations. For the
purpose of this study, we only include 501(c)(3) organizations and 501(c)(4) organizations, which
are public charity/interest organizations and social advocacy/welfare organizations, respectively.
The reason that we include these two types of organizations is that they both aim to serve
the general public through similar approaches such as public education, awareness, advocacy,
lobbying and so on. The only difference between the two is that 501(c)(3) organizations are limited
by IRS to political donation, but 501(c)(4) organizations are not. Considering political donation is
outside scope of nonprofit impact on corporations, we view the two types of organizations as the
same entity to influence corporations concerning corporate social performance.
The NCCS database was produced annually since 1989 and combine descriptive
information and financial variables of all 501(c) organizations with more than $25,000 in gross
receipts. All 501(c) organizations with less than $25,000 in gross receipts are not required to file

15
reports to IRS due to their small volume, short longevity, and negligible impact. As a result, our
sample consists of all 501(c)(3) and 501(c)(4) organizations that have more than $25,000 annual
income and operate on a regular basis.
To investigate whether and how these nonprofit groups affect the sub-category ratings of
corporate social responsibility, we match each sub-category rating to the corresponding nonprofit
group. To do so, first, we primarily follow National Taxonomy of Exempt Entities Core Codes
(NTTE-CC) system12 commonly used by IRS, NCSS and academic papers (e.g., Kelly and Lewis,
2009) to classify all 501(c)(3) and 501(c)(4) organizations into nonprofit subgroups. Second, since
NTEE-CC system doesn’t specify employee-related groups, we complement our procedures by
searching nonprofit organization’s name with a list of keywords.
Category “Community” comprises of two aspects of corporate socioeconomic performance.
The first is corporate donations to the nonprofit sector such as general cash giving, innovative
giving programs and other giving activities, which is influenced by active philanthropy and
volunteer nonprofit group. The second is the community economic impact, which is related to the
community development group. Thus, we include “Philanthropy and Volunteering” group (NTEE-
T) and “Community Improvement” group (NTEE-S). Category “Environment” contains a bunch
of environment externalities indicators such as pollution, recycling, and waste, so we use the entire
“Environment” group (NTEE-C), which includes pollution control subgroup, clean energy
subgroup and other environment protection subgroups. Category “Human Rights” covers a number
of human rights compliance indicators inside and outside the United States. As a result, we include
both “International Human Rights” group (NTEE-Q70) and “Civil Rights” group (NTEE-R).
12 For the information on NTEE system, See at http://nccs.urban.org/classification/national-taxonomy-exempt-entities

16
Category “Product” consists of two major aspects of the product. The first is a firm’s
compliance with industrial standards, including marketing/contracting compliance, marketplace
trust and other compliances, which largely hinge on industry associations and business leagues.
The second is product issues such as product quality, safety, fraud and so on, which is directly
related to consumer interests. Based on these two aspects of product category, we include
“Business and Industry” group (NTEE-S40), which contain all business industry-related nonprofit
organizations such as chambers of commerce, business leagues, industry association and so on.
We also include “Consumer Protection” group (NTEE-W90), which include all kinds of consumer
protection organizations such as consumer watch, consumer union, etc.
Category “Diversity” gauges a firm’s social actions in recruitment, employee
promotion/benefits and supply chain to address equality rights of four population groups: women,
minority, disabled and LGBTQ. Corporations should have more awareness and demand pressure
if they reside in a region with more nonprofit organizations that advocate those equality rights. We
thus include all women groups, minority groups, disabled groups and LGBTQ groups in human
service (NTEE-P), international human rights (NTEE-Q), and civil rights (NTEE- R).
Category “Employee” includes a series of employee welfare indicators such as profit
sharing, retirement benefits, health and safety improvement and so forth. It is well-documented
that labor unions (commonly known as 501(c)(5) organizations) have longstanding effects on firms
concerning employee rights and benefits (e.g. Freeman, 1981, 1982, 1984; Buchmueller, Dinardo
and Valletta, 2002; Budd and McCall, 2004). Distinguishing from the literature on labor union,
this paper studies the effects of public charity (501(c)(3)) and advocacy (501(c)(4)) nonprofit on
local firms’ employee benefits performance through channels like public awareness, education,
advocacy and other community-wide impacts. Given that there is no classified employee group in

17
NTEE-CC system, we apply keyword searching methods, which have been used in many studies
of finance literature (e.g. Ahern and Sosyura, 2015; Hwang and Kim, 2017). We construct a list of
keywords indicating employee-related public charity and advocacy organizations as follows:
“employee”, “labor”, “laborer”, “worker”, “work”, “working” and “workplace” compounding
with “right”, “benefit”, “welfare”, “justice”, “assistance”, and “alliance”. To further provide more
details on our sample nonprofit organizations, we sort our sample nonprofit organizations in each
category by total spending and list the top 10 organizations in Table 1.
[Insert TABLE 1 Here]
Using location identifiers of each nonprofit organization, we classify all sample nonprofit
organizations both at the state level and at metropolitan statistical area (MSA) level. We then
aggregate all nonprofit financial data at MSA level and State level to construct a measure of
nonprofit group impact in each MSA and State. More specifically, we use aggregated total expense,
program expense, fundraising expense, special-events expense, and legislative expense of a local
nonprofit group to proxy the group’s impact on the corresponding category of CSR in the local
area.
3.3. Control Variables
Using CUSIP and Ticker identifiers, we match firm-level CSR data with other firm-level
accounting data that is from Compustat. We obtain zip code identifier of firm headquarters from
Compustat and then associate them with MSA identifier13 . CEO characteristics data is from
13 United States Department of Labor provides the link files between geographical identifiers, like ZIP and MSA. See at
https://www.dol.gov/owcp/regs/feeschedule/fee/fee11/fs11_gpci_by_msa-ZIP.xls

18
Execucomp, and board characteristics are from ISS. Annual estimates of GDP at both MSA level
and state level are from Federal Reserve Economic Data (FRED).
3.4. Descriptive Statistics and Univariate Tests
After merging firm-level CSR data, local nonprofit data and control variables, we obtain a
sample of 4196 unique firms located in 282 metropolitan statistical areas and 51 states. Panel A of
Table 2 presents summary statistics on our nonprofit variables, CSR variables, firm characteristics
and other control variables. The average CSR-related nonprofit groups spend $ 1.43 billion across
MSAs per year and $ 2.5 billion across states per year to advance social causes in our sample.
MSAs in our sample have a median GDP growth rate of 2 percent per year while states in our
sample have a median GDP growth rate of 4 percent per year. Our CSR score has a mean of -0.187
and a median of -0.2 while subcategory CSR scores are centered at zero and exhibit less variation.
Panel B of Table 2 shows results of univariate analysis of CSR score. We split our sample
into subsamples by our independent variables: state-level nonprofit total expense and MSA-level
nonprofit total expense. The t-statistics for differences indicate that firms headquartered in areas
where CSR-related nonprofit groups spending is above the sample median have higher CSR scores
than firms located in areas where CSR-related nonprofit groups spending is below the sample
median. These findings provide preliminary support to our main hypothesis.
[Insert TABLE 2 Here]
3.5. Empirical Strategies
19
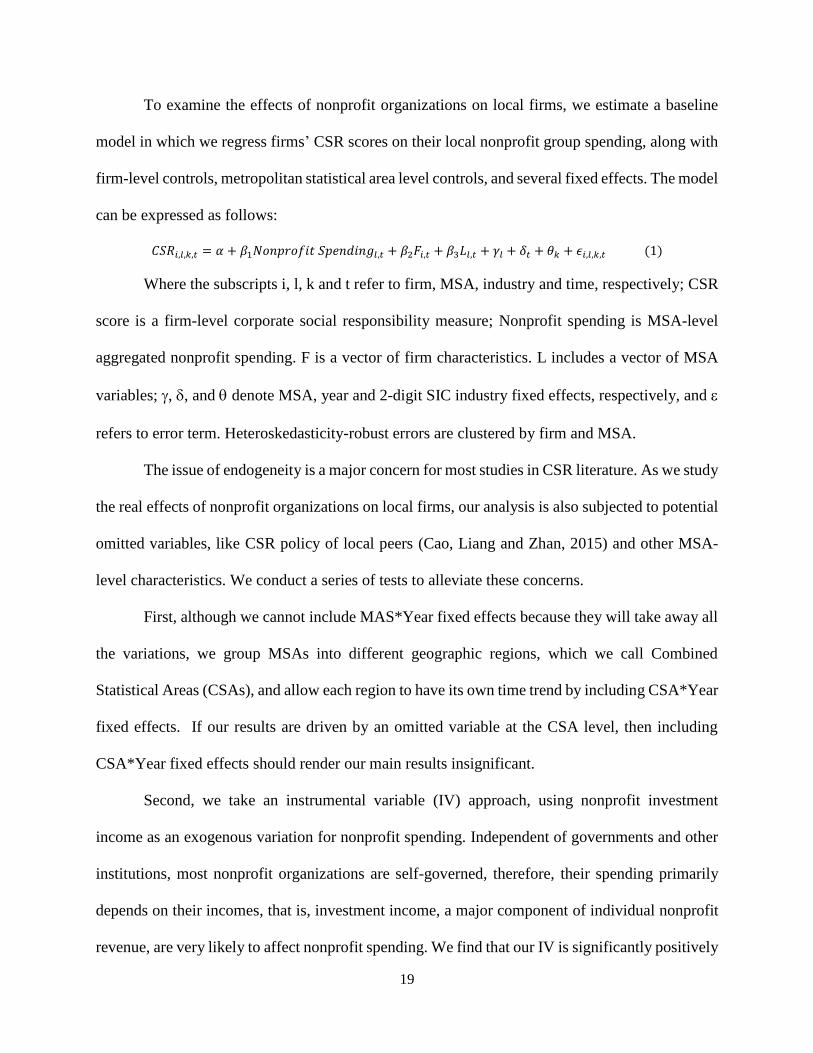
To examine the effects of nonprofit organizations on local firms, we estimate a baseline
model in which we regress firms’ CSR scores on their local nonprofit group spending, along with
firm-level controls, metropolitan statistical area level controls, and several fixed effects. The model
can be expressed as follows:
𝐶𝑆𝑅𝑖,𝑙,𝑘,𝑡 = 𝛼 + 𝛽1𝑁𝑜𝑛𝑝𝑟𝑜𝑓𝑖𝑡 𝑆𝑝𝑒𝑛𝑑𝑖𝑛𝑔𝑙,𝑡 + 𝛽2𝐹𝑖,𝑡 + 𝛽3𝐿𝑙,𝑡 + 𝛾𝑙 + 𝛿𝑡 + 𝜃𝑘 + 𝜖𝑖,𝑙,𝑘,𝑡 (1)
Where the subscripts i, l, k and t refer to firm, MSA, industry and time, respectively; CSR
score is a firm-level corporate social responsibility measure; Nonprofit spending is MSA-level
aggregated nonprofit spending. F is a vector of firm characteristics. L includes a vector of MSA
variables; , , and denote MSA, year and 2-digit SIC industry fixed effects, respectively, and
refers to error term. Heteroskedasticity-robust errors are clustered by firm and MSA.
The issue of endogeneity is a major concern for most studies in CSR literature. As we study
the real effects of nonprofit organizations on local firms, our analysis is also subjected to potential
omitted variables, like CSR policy of local peers (Cao, Liang and Zhan, 2015) and other MSA-
level characteristics. We conduct a series of tests to alleviate these concerns.
First, although we cannot include MAS*Year fixed effects because they will take away all
the variations, we group MSAs into different geographic regions, which we call Combined
Statistical Areas (CSAs), and allow each region to have its own time trend by including CSA*Year
fixed effects. If our results are driven by an omitted variable at the CSA level, then including
CSA*Year fixed effects should render our main results insignificant.
Second, we take an instrumental variable (IV) approach, using nonprofit investment
income as an exogenous variation for nonprofit spending. Independent of governments and other
institutions, most nonprofit organizations are self-governed, therefore, their spending primarily
depends on their incomes, that is, investment income, a major component of individual nonprofit
revenue, are very likely to affect nonprofit spending. We find that our IV is significantly positively
20
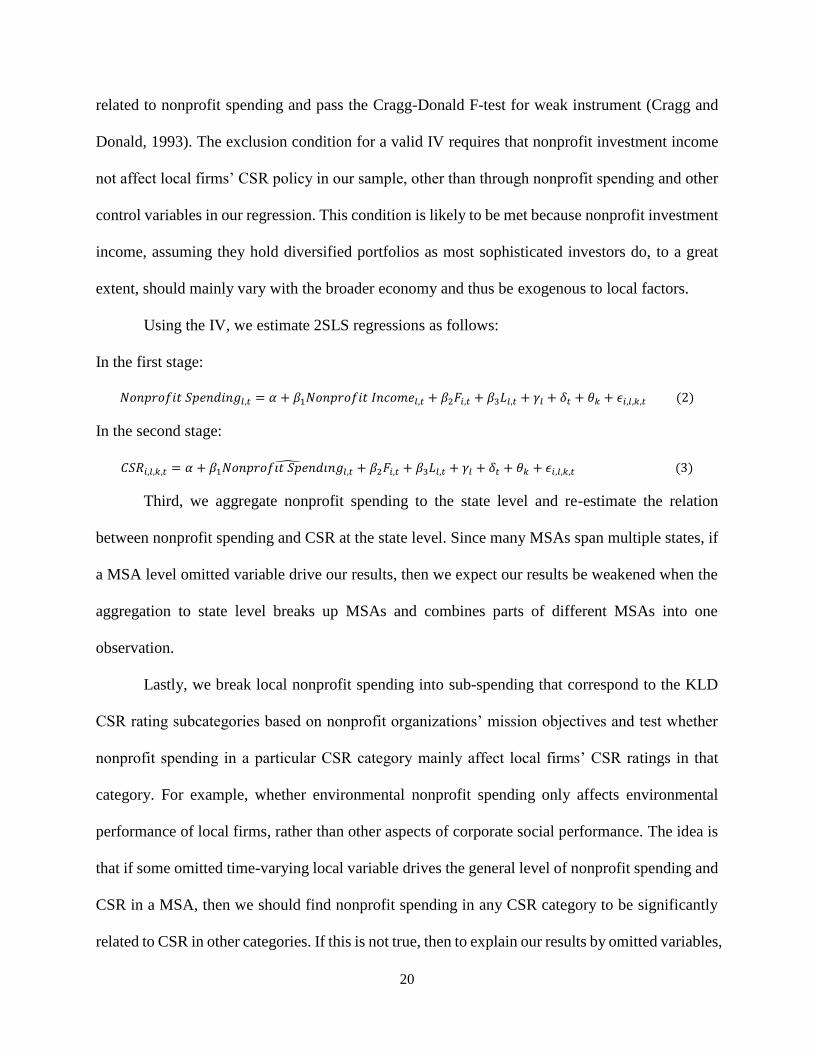
related to nonprofit spending and pass the Cragg-Donald F-test for weak instrument (Cragg and
Donald, 1993). The exclusion condition for a valid IV requires that nonprofit investment income
not affect local firms’ CSR policy in our sample, other than through nonprofit spending and other
control variables in our regression. This condition is likely to be met because nonprofit investment
income, assuming they hold diversified portfolios as most sophisticated investors do, to a great
extent, should mainly vary with the broader economy and thus be exogenous to local factors.
Using the IV, we estimate 2SLS regressions as follows:
In the first stage:
𝑁𝑜𝑛𝑝𝑟𝑜𝑓𝑖𝑡 𝑆𝑝𝑒𝑛𝑑𝑖𝑛𝑔𝑙,𝑡 = 𝛼 + 𝛽1𝑁𝑜𝑛𝑝𝑟𝑜𝑓𝑖𝑡 𝐼𝑛𝑐𝑜𝑚𝑒𝑙,𝑡 + 𝛽2𝐹𝑖,𝑡 + 𝛽3𝐿𝑙,𝑡 + 𝛾𝑙 + 𝛿𝑡 + 𝜃𝑘 + 𝜖𝑖,𝑙,𝑘,𝑡 (2)
In the second stage:
𝐶𝑆𝑅𝑖,𝑙,𝑘,𝑡 = 𝛼 + 𝛽1𝑁𝑜𝑛𝑝𝑟𝑜𝑓𝑖𝑡 𝑆𝑝𝑒𝑛𝑑𝑖𝑛𝑔𝑙,𝑡̂ + 𝛽2𝐹𝑖,𝑡 + 𝛽3𝐿𝑙,𝑡 + 𝛾𝑙 + 𝛿𝑡 + 𝜃𝑘 + 𝜖𝑖,𝑙,𝑘,𝑡 (3)
Third, we aggregate nonprofit spending to the state level and re-estimate the relation
between nonprofit spending and CSR at the state level. Since many MSAs span multiple states, if
a MSA level omitted variable drive our results, then we expect our results be weakened when the
aggregation to state level breaks up MSAs and combines parts of different MSAs into one
observation.
Lastly, we break local nonprofit spending into sub-spending that correspond to the KLD
CSR rating subcategories based on nonprofit organizations’ mission objectives and test whether
nonprofit spending in a particular CSR category mainly affect local firms’ CSR ratings in that
category. For example, whether environmental nonprofit spending only affects environmental
performance of local firms, rather than other aspects of corporate social performance. The idea is
that if some omitted time-varying local variable drives the general level of nonprofit spending and
CSR in a MSA, then we should find nonprofit spending in any CSR category to be significantly
related to CSR in other categories. If this is not true, then to explain our results by omitted variables,

21
the omitted variable has to only affect one CSR category but not others and each MSA needs to
have several such omitted variables that are independent of each other. Obviously, a very
complicated theory is needed to rationalize the existence of these omitted variables, which casts
seriously doubt on the omitted variable explanation.
4. Results
In this section, we present our results on the effects of nonprofit spending on local firms’
CSR policy as well as other firm-level and MSA-level characteristics, and we employ several
identification strategies to confirm the causality of the effects.
4.1. Main Results
Panel A of Table 3 reports the results from OLS regressions of local firms’ CSR policy on
CSR-related nonprofit expense. Column (1) performs a univariate regression. In column (2), we
control for firm size, cash flow, firm leverage and payout policy as proven to be important
determinants of firm’s CSR policy in prior studies (Udayasankar, 2008; Kubik, Scheinkman and
Hong, 2011; Cheung, Hu and Schwiebert, 2016); In column (3), we add return on asset and market
to book value to capture firm value and profitability characteristics, which could account for
economic incentives of CSR policy. In column (4), we add MSA level GDP growth to capture
MSA economic fundamental. In column (5), we control for firm fixed effects and year fixed effects
to address firm heterogeneity. Most specifications include Fama-French 49 industry fixed effects,
metropolitan statistical areas fixed effects and year fixed effects.
In Panel B of Table 3, we estimate OLS models with alternative industry definitions
including 2-digit SIC industry classification in Column (1), 3-digit SIC industry classification in

22
Column (2), and 4-digit SIC industry classification in Column (3), with clustering standard errors
on MSA level in Column (4), and with double clustering standard errors on MSA level and firm
level in Column (5), and aggregating nonprofit spending on state level in column (6). All
specifications control for firm characteristics, MSA-level characteristics, industry fixed effects,
MSA fixed effects, and year fixed effects. Panel C shows the results from OLS regressions
controlling CSA*Year Fixed effects. Panel D of Table 3 estimates 2SLS IV regression using
nonprofit investment income as an instrument variable for nonprofit spending and report the results
of the first stage in column (1) and the results of the second stage in column (2).
[Insert TABLE 3 Here]
Two notes stand out in our baseline results. First, all coefficient estimates of nonprofit
expense on CSR score in all specifications are positive and statistically significant, ranging from
0.042 to 0.047. This effect is three times larger than firm size effect, that is, 1% increase in
nonprofit expense leads to an approximate 12 % standard deviation increase in CSR score. Second,
our models control for time fixed effects, MSA fixed effects, firm fixed effects, alternative industry
definitions and standard errors clustering and obtain consistent positive relation between local
nonprofit spending and CSR. This suggests that our results are not driven by MSA level, industry
level and firm level heterogeneity, thereby strongly supporting our hypothesis that local nonprofit
spending drives CSR. To further alleviate endogeneity concerns, we take several the following
actions.
4.2. Controlling Combined Statistical Areas Time Trend

23
Considering that our results could be driven by some time-varying omitted variables, we
group MSAs into CSAs (Combined Statistical Areas) and control for CSA*Year fixed effects. The
reasoning is that neighbouring MSAs are likely to share similar social and economic conditions,
by controlling for CSA*Year fixed effects, we mitigate endogeneity concern over a time-varying
omitted variable that is related to local social and economics conditions. In Panel C, we control for
year and CSA fixed effects, CSA*year fixed effects and CSR*year fixed effects and industry fixed
effects. The relation between local nonprofit spending and CSR is still positively significant, while
the coefficient estimates decrease from 0.047 (column 4 of Panel A) to 0.009 (column 2 of Panel
C). The decrease of the estimates is a result of extracting large amount of nonprofit spending
variation. In short, after controlling for time-varying fixed effects, our results are still consistent
with our hypothesis that local nonprofit spending drives CSR. This suggests that our results are
not driven by some MSA-level time-varying omitted variables.
4.3. IV Estimation Results
In Panel D, we take an instrumental variable (IV) approach, using nonprofit investment
income as an exogenous variation for nonprofit spending. For the relevance condition, nonprofit
spending is likely to be positively related to their spending. In column 1 of Panel D, we find that
the Cragg-Donald F-tests statistics is 668.866, which reject the null hypothesis of weak instruments
and suggest that our IV is strongly correlated with our endogenous variable. On the other hand,
although there is no test for exclusion condition, it is reasonable to assume that nonprofit
organizations hold diversified portfolios of investments as sophisticated investors should do.
Under this assumption, variations in nonprofit organizations’ investment income should mostly be
exogenous to changes in local social and economic conditions and thus satisfy the exclusion

24
condition of a valid instrument. In column 2 of Panel D reports a positive association between
local nonprofit spending and CSR with a coefficient estimate of 0.066, which is consistent with
our baseline OLS result with a coefficient estimate of 0.047 (column 4 of Panel A). These results
further identify the relation is going from local nonprofit spending to CSR.
4.4. State Level Results
Given the fact that many MSAs cross multiple states, we are able to cross-verify the results
on MSA level with the results on state level. The idea is that if our results are caused by some
MSA level omitted variables, then we are unlikely to obtain the consistent results on state level.
In column (6) of Panel B, the relation between state-level nonprofit spending and CSR is positive
and statistically significant and the coefficient estimate of state-level nonprofit expense is 0.043.
These results are consistent with our predictions and mitigates concerns that our results are driven
by omitted variables at a given geographical level.
4.5. CSR Sub-Category Results
Corporate social responsibility spans many aspects of corporate environmental/social
performance, but most nonprofit organizations specialize in one type of social cause. Therefore,
presumably, a specific type of nonprofit organizations should only affect the corresponding aspect
of CSR. In this section, we exploit our detailed nonprofit organization data and test this hypothesis.
In Table 4, we estimate baseline specifications by replacing the dependent variable “CSR score”
with six sub-dimension scores and independent variable “nonprofit expense” with six sub-group
nonprofit spending, respectively.

25
[Insert TABLE 4 Here]
Table 4 reports the results from OLS regressions of separate effects of nonprofit expense
on subcategories of CSR. From column (1) to column (6), the dependent variables are community
score, diversity score, employee relation score, environment score, human rights score and product
score, respectively. It is worth noting that a specific nonprofit group only has positive and
statistically significant effect on the corresponding ratings of CSR. For example, community-
related nonprofit group only has positive and statistically significant effect on community score of
CSR. This effect is also larger than firm size effect, that is, a 1% increase in community-related
nonprofit spending leads to an 12% standard deviation increase in community index. The
explanation is intuitive that community-related nonprofit group, like Gifts in Kind International,
Silicon Valley Community Foundation and others, is a major advocate of social philanthropy and
community involvement, and it can stimulate corporate community engagement through activities
such as advocacy, fundraising campaign, partnership, etc.
Similarly, employee-related nonprofit group only affects employ relation score of KLD
CSR. Distinguishing from the well-documented effects of labor unions (commonly known as
501(c)(5) organizations) on employers’ stakeholder engagement (e.g. Freeman, 1981, 1982, 1984;
Buchmueller, Dinardo and Valletta, 2002; Budd and McCall, 2004), this effect captures how
501(c)(3) and 501(c)(4) organizations shape community-wide expectations, isomorphism and
pressure (Marquis, Glynn and Davis, 2007) on local firms’ employee welfare through a variety of
advocacy activities. The similar results are found on separate effects of nonprofit expense on
diversity performance, environment preservation, human rights protection and product quality.

26
Taken together, all our main results are consistent with the hypothesis that local firms’ CSR
policy is partially driven by local nonprofit spending, rather than geographical, industry, firm
heterogeneity and other omitted variables.
5. Nonprofit Functions and Effects
5.1. Nonprofit Sub-Spending Results
So far, we have shown that the nonprofit sector can affect local firms’ CSR policy, but
through which social functions are still not clear. The nonprofit sector advances social causes,
shapes societal preferences and reveals social demand on CSR through a variety of social activities
such as program/service, education, advocacy, campaigns, lobbying, and litigation and so on. To
provide evidence on these nonprofit sub-expense effects, we split nonprofit total expense into
several parts. Specifically, we use special-event expense and fundraising expense to proxy
“advocacy effect”, since both special-events and fundraising campaigns serve the same purpose of
improving public awareness and inducing public support as advocacy usually is defined. We use
program expense to represent “service and education effect”. We finally use legislative expense to
proxy “lobbying effect”.
[Insert TABLE 5 Here]
Panel A of Table 5 shows the results from OLS regressions of CSR score on different
expense proxies. All sub-expenses have statistically significant and positive effects on CSR.
Notably, advocacy (fundraising and special-events) drives the main part of nonprofit effects, with
27
program service effect and lobbying effect at the second places. This finding is consistent with
Salamon, Hems and Chinnock's work (2000), which claims that among all functions of the
nonprofit sector, few are more critical than advocacy to represent alternative perspectives and press
them on public and private decision makers. More importantly, this advocacy effect suggests that
local nonprofit organizations can affect CSR by increasing public awareness, affecting societal
preferences and revealing social demand. In addition, political expense has no effect on CSR,
which is not surprising because political expense is used for political campaigns, not to advance
social causes and reveal social demand. This exactly supports our conjecture that local nonprofit
affect CSR through social preferences and demand channel.
5.2. The Realization of Nonprofit Effects
In our main tests, we use the contemporaneous spending by nonprofit organizations to
examine its effect on local firms’ CSR performance. We essentially assume that nonprofit
spending has an immediate effect on firms. However, in some cases, it may take the firms some
time implement changes in their CSR policy. In Panel B of Table 5, we estimate the relation
between nonprofit spending and local firms’ CSR performance over different lags. In column (5),
the point estimate of nonprofit expense from OLS regressions is 0.044 in the current year and
attenuates to 0.023 in the following year. The results are consistent with prior studies that some
CSR ratings are flexible to adjust while some are not. For example, ratings in community
involvement, employee welfare and human rights can be adjusted immediately when firms face an
increase of demand pressure. However, ratings in environment may need more time to adjust when
firms need to upgrade or replace equipment, production line and so on.

28
6. Channels
6.1. Revealed social demand for CSR
Local nonprofit organizations can arouse societal awareness and preferences on social
causes, likely revealing social demand for CSR. Meeting such social demand could bring indirect
benefits to firms and hence enhances firm value. To test this channel, we interact nonprofit
spending and firm’s CSR performance and see whether adjusting CSR to the variation of nonprofit
spending has positive effects on firm value, measured by Tobin’s q.
[Insert TABLE 6 Here]
Our results are reported in Table 6. Two results are worth looking at. First, we find a
significant and negative relation between CSR ratings and firm performance, measured by Tobin’s
q, Industry-adjusted Tobin's q and MSA-adjusted Tobin's q. Our results show that CSR on average
is costly and hurts firm value at the expense of shareholders, but when social demand on CSR
increases, responding this call enhances firm performance, which is consistent with the view that
CSR enhances firm value only under certain conditions in several recent studies (e.g., Servaes and
Tamayo, 2013; Lins, Servaes and Tamayo, 2017). The effect of nonprofit spending on the CSR-
value relation is also economically significant. In column (1), for firms located in MSAs with
nonprofit spending 15.815 (1% quantile of the distribution), increasing CSR by one standard
deviation (0.38) leads to a decrease of 0.02 in Tobin’s Q. For firms located in MSAs with nonprofit
spending 19.967 (the median of the distribution), increasing CSR by one standard deviation (0.38)
leads to an increase of 0.07 in Tobin’s Q. The overall difference is 0.09, which is substantial given
the mean of Tobin’s Q is 2.06.

29
6.2 Governance on institutional impact for CSR
Given the significantly economic effects of nonprofit expense on the relation between CSR
and firm value, it is crucial to see what kind of companies are responsive to this institutional call
on CSR. Previous literature provides some conflicting views on the relation between corporate
governance and CSR. For example, Masulis and Reza (2015) argue that corporate philanthropy is
a result of weak governance and thus is an agency problem. On the contrary, Ferrell, Liang and
Renneboog (2016) show that well governed firms engage more in CSR. To join this conversation,
we employ a number of entrenchment and governance indices and investigate whether well-
governed firms are more responsive to CSR call.
Our results are reported in Table 7. We include CEO ownership and CEO duality as
measures of CEO entrenchment and contain G-index, E-index, staggered board, board
independence as measures of board governance. Two important points stand out. First, the
significant coefficients on these indices indicate that better governed and less entrenched firms
invest significantly less in CSR. For example, higher CEO ownership, dual CEO, higher G-index,
higher E-index, staggered board, lower board independence leads to higher engagement of CSR.
Second, the interaction between governance measures and nonprofit expense indicate that when
face an increase in institutional pressure on CSR, better-governed firms increase engagement in
CSR. The magnitudes of these joint effects are large. For example, based on model (3), for firms
in MSAs with nonprofit spending 15.815 (1% quantile of the distribution), increasing E-index by
one standard deviation (1.094) on average leads to an increase in 0.06 in CSR score. For firms in
MSAs with nonprofit spending 19.967 (the median of the distribution), increasing E-index by one

30
standard deviation (1.094) on average leads to an increase of 0.02 in CSR score. The overall
difference is 0.04 and this is relatively large given the mean of CSR is -0.187.
These results are particularly consistent with the relations between CSR and firm value in
table 6. That is, in general, in line with shareholder interests, better-governed firms invest less in
CSR because CSR alone decreases firm value. However, when facing an increase in social demand
on CSR, better-governed firms are more responsive to meet this call given investing CSR adds
value to firm performance. Overall, our results indicate that CSR, as a public good, is provided by
private sector (corporations) through a financially strategic mechanism, which is based on varying
social demand on CSR, measure by nonprofit spending. Our findings explain the “agency view”
(e.g., Cheng, Hong and Shue, 2013; Masulis and Reza, 2015) that poorly-governed firms on
average invest more in CSR. Also, it provides new evidence on the “good-governed view” (Ferrell,
Liang and Renneboog, 2016), showing that better-governed firms engage CSR under certain
conditions.
6.3. Managerial Social Preferences on CSR
A number of recent studies show that CEOs influenced by personal experience in social
life formalize particular preferences that possibly affect corporate outcomes. For example, CEOs
imprint personal leverage preference on the firms they manage (Cronqvist, Makhija and Yonker,
2012), pilot CEOs employ risky corporate policy (Cain and McKeon, 2016) and enhance
innovation (Sunder, Sunder and Zhang, 2017), military CEOs manage their firms with better ethics
(Benmelech and Frydman, 2015), CEOs shaped by their daughters engage more in corporate social
responsibility (Cronqvist and Yu, 2017) and so on. Residing in an area with high nonprofit impact,
managers are exposed more to civic life, obtain more education on social causes, face more

31
demand on social initiatives, and therefore are more likely to formalize strong social preference in
their utility functions. On the other hand, under the same community isomorphism (Marquis,
Glynn and Davis, 2007), important corporate insiders, such as employees, creditors, investors, and
customers are very likely to share the similar views and demand on CSR, and thus managers are
likely to face lower resistance and maybe greater support for CSR spending when local nonprofit
organizations are pushing for more social changes.
7. Conclusion
In this paper, we test how local demand for CSR revealed by local nonprofit organizations’
spending drives a firm’s CSR policy and its effect on shareholder wealth. Using nonprofit
organization data in the U.S. and KLD CSR data, we find local demand for CSR can explain the
time-series variations in firms’ CSR ratings overtime with each MSA area and reconcile the mixed
findings on the relation between CSR and firm performance. Specifically, we find that CSR ratings
of firms headquartered in a MSA vary positively with local nonprofit organizations’ spending. The
results hold for both the overall CSR ratings and CSR ratings by subcategory. Our results are
robust to controlling for year, MSA industry or firm fixed effects and various time-varying firm
and MSA characteristics. We also control for CSA*year fixed effects and use nonprofit investment
income as an IV for nonprofit spending confirms the relation between nonprofit spending and CSR
goes from nonprofit spending to CSR. Additional tests for addressing the endogeneity concern
also confirm the causal relation. We further find that increases in firm CSR ratings with local
nonprofit spending are positively related to firm value. Well-governed firms are more responsive
to local demand than poorly-governed firms in their CSR policy. Our results suggest that local
social demand for CSR revealed by local nonprofit organizations is an important determinant of a

32
firm’ CSR policy. Not all CSR spending increases firm value, only those that are done to meet
stakeholders’ demand do. Our paper provides important empirical evidence that is consistent with
a body of prior theoretical studies (e.g., McWilliams and Siegel, 2001; Campbell, 2007; Marquis,
Glynn and Davis, 2007; Benabou and Tirole, 2010), suggesting that local nonprofit sector plays a
crucial role in increasing societal awareness, shaping societal preferences and revealing social
demand on corporate social responsibility.

33
References
Adelino, M., Lewellen, K. and Sundaram, A. (2015) ‘Investment Decisions of Nonprofit Firms:
Evidence from Hospitals’, The Journal of Finance. Wiley/Blackwell (10.1111), 70(4), pp. 1583–
1628. doi: 10.1111/jofi.12234.
Ahern, K. R. and Sosyura, D. (2015) ‘Rumor Has It: Sensationalism in Financial Media’, The
Review of Financial Studies. Oxford University Press, 28(7), pp. 2050–2093. doi:
10.1093/rfs/hhv006.
Albuquerque, R. A., Durnev, A. and Koskinen, Y. (2013) ‘Corporate Social Responsibility and
Firm Risk: Theory and Empirical Evidence’. Available at:
https://papers.ssrn.com/sol3/papers.cfm?abstract_id=2291334 (Accessed: 23 June 2018).
Attig, N. and Brockman, P. (2017) ‘The Local Roots of Corporate Social Responsibility’,
Journal of Business Ethics. Springer Netherlands, 142(3), pp. 479–496. doi: 10.1007/s10551-
015-2757-3.
Benabou, R. and Tirole, J. (2010) ‘Individual and corporate social responsibility’, Economica.
doi: 10.1111/j.1468-0335.2009.00843.x.
Benmelech, E. and Frydman, C. (2015) ‘Military CEOs’, Journal of Financial Economics.
North-Holland, 117(1), pp. 43–59. doi: 10.1016/J.JFINECO.2014.04.009.
Berle, A. A. and Means, G. C. (1932) The Modern Corporation and Private Property, New York
Macmillan. doi: 10.2307/3475545.
Brown, J. R. et al. (2008) ‘Neighbors Matter: Causal Community Effects and Stock Market
Participation’, The Journal of Finance. Wiley/Blackwell (10.1111), 63(3), pp. 1509–1531. doi:
10.1111/j.1540-6261.2008.01364.x.
Buchmueller, T. C., Dinardo, J. and Valletta, R. G. (2002) ‘Union Effects on Health Insurance
Provision and Coverage in the United States’, ILR Review. SAGE PublicationsSage CA: Los
Angeles, CA, 55(4), pp. 610–627. doi: 10.1177/001979390205500403.
Budd, J. W. and McCall, B. P. (2004) ‘Unions and Unemployment Insurance Benefits Receipt:
Evidence from the Current Population Survey’, Industrial Relations. Wiley/Blackwell (10.1111),
43(2), pp. 339–355. doi: 10.1111/j.0019-8676.2004.00332.x.
Cain, M. D. and McKeon, S. B. (2016) ‘CEO Personal Risk-Taking and Corporate Policies’,
Journal of Financial and Quantitative Analysis. Cambridge University Press, 51(01), pp. 139–
164. doi: 10.1017/S0022109016000041.
Campbell, J. L. (2007) ‘Why would corporations behave in socially responsible ways? an
institutional theory of corporate social responsibility’, Academy of Management Review.
Academy of Management Briarcliff Manor, NY 10510 , 32(3), pp. 946–967. doi:
10.5465/amr.2007.25275684.
Cao, J., Liang, H. and Zhan, X. (2015) ‘Peer Effects of Corporate Social Responsibility’, SSRN
Electronic Journal. doi: 10.2139/ssrn.2634100.

34
Carroll, A. B. (2009) A History of Corporate Social Responsibility. Edited by A. Crane et al.
Oxford University Press. doi: 10.1093/oxfordhb/9780199211593.003.0002.
Cheng, I.-H., Hong, H. and Shue, K. (2013) Do Managers Do Good with Other People’s
Money? Cambridge, MA. doi: 10.3386/w19432.
Cheung, A. W., Hu, M. and Schwiebert, J. (2016) ‘Corporate social responsibility and dividend
policy’, Accounting & Finance. Edited by T. Smith. Wiley/Blackwell (10.1111). doi:
10.1111/acfi.12238.
Clarkson, M. E. (1995) ‘A Stakeholder Framework for Analyzing and Evaluating Corporate
Social Performance’, Academy of Management Review. Academy of Management Briarcliff
Manor, NY 10510 , 20(1), pp. 92–117. doi: 10.5465/amr.1995.9503271994.
Cohen, L., Gurun, U. G. and Malloy, C. (2017) ‘Resident Networks and Corporate Connections:
Evidence from World War II Internment Camps’, The Journal of Finance. Wiley/Blackwell
(10.1111), 72(1), pp. 207–248. doi: 10.1111/jofi.12407.
Cragg, J. G. and Donald, S. G. (1993) ‘Testing Identifiability and Specification in Instrumental
Variable Models’, Econometric Theory. Cambridge University Press, 9(02), p. 222. doi:
10.1017/S0266466600007519.
Cronqvist, H., Makhija, A. K. and Yonker, S. E. (2012) ‘Behavioral consistency in corporate
finance: CEO personal and corporate leverage’, Journal of Financial Economics. North-Holland,
103(1), pp. 20–40. doi: 10.1016/J.JFINECO.2011.08.005.
Cronqvist, H. and Yu, F. (2017) ‘Shaped by their daughters: Executives, female socialization,
and corporate social responsibility’, Journal of Financial Economics. North-Holland, 126(3), pp.
543–562. doi: 10.1016/J.JFINECO.2017.09.003.
Doh, J. P. and Guay, T. R. (2006) ‘Corporate Social Responsibility, Public Policy, and NGO
Activism in Europe and the United States: An Institutional-Stakeholder Perspective’, Journal of
Management Studies. Wiley/Blackwell (10.1111), 43(1), pp. 47–73. doi: 10.1111/j.1467-
6486.2006.00582.x.
Doh, J. P. and Teegen, H. (2002) ‘Nongovernmental organizations as institutional actors in
international business: theory and implications’, International Business Review. Pergamon,
11(6), pp. 665–684. doi: 10.1016/S0969-5931(02)00044-6.
Dougal, C., Parsons, C. A. and Titman, S. (2015) ‘Urban Vibrancy and Corporate Growth’, The
Journal of Finance. Wiley/Blackwell (10.1111), 70(1), pp. 163–210. doi: 10.1111/jofi.12215.
Dyck, I. J. A. et al. (2015) ‘Do Institutional Investors Drive Corporate Social Responsibility?
International Evidence’, SSRN Electronic Journal. doi: 10.2139/ssrn.2708589.
Ferrell, A., Liang, H. and Renneboog, L. (2016) ‘Socially responsible firms’, Journal of
Financial Economics. North-Holland, 122(3), pp. 585–606. doi: 10.1016/j.jfineco.2015.12.003.
Flammer, C. (2015) ‘Does Corporate Social Responsibility Lead to Superior Financial
Performance? A Regression Discontinuity Approach’, Management Science. INFORMS ,
61(11), pp. 2549–2568. doi: 10.1287/mnsc.2014.2038.
35
Freeman, R. B. (1981) ‘The Effect of Unionism on Fringe Benefits’, ILR Review. SAGE
PublicationsSage CA: Los Angeles, CA, 34(4), pp. 489–509. doi:
10.1177/001979398103400401.
Freeman, R. B. (1982) ‘Union Wage Practices and Wage Dispersion within Establishments’, ILR
Review. SAGE PublicationsSage CA: Los Angeles, CA, 36(1), pp. 3–21. doi:
10.1177/001979398203600101.
Freeman, R. B. (1984) ‘Longitudinal Analyses of the Effects of Trade Unions’, Journal of Labor
Economics. University of Chicago Press , 2(1), pp. 1–26. doi: 10.1086/298021.
Friedman, M. (1970) ‘The social responsibility of business is to increase its profit’, New York
Times Magazine.
Galaskiewicz, J. (1985) Social organization of an urban grants economy : a study of business
philanthropy and nonprofit organizations. Academic Press.
Galaskiewicz, J. (1997) ‘An Urban Grants Economy Revisited: Corporate Charitable
Contributions in the Twin Cities, 1979-81, 1987-89’, Administrative Science Quarterly. Sage
Publications, Inc.Johnson Graduate School of Management, Cornell University, 42(3), p. 445.
doi: 10.2307/2393734.
Gao, W., Ng, L. and Wang, Q. (2011) ‘Does Corporate Headquarters Location Matter for Firm
Capital Structure?’, Financial Management. Wiley/Blackwell (10.1111), 40(1), pp. 113–138.
doi: 10.1111/j.1755-053X.2010.01136.x.
El Ghoul, S. et al. (2011) ‘Does corporate social responsibility affect the cost of capital?’,
Journal of Banking & Finance. North-Holland, 35(9), pp. 2388–2406. doi:
10.1016/J.JBANKFIN.2011.02.007.
Di Giuli, A. and Kostovetsky, L. (2014) ‘Are red or blue companies more likely to go green?
Politics and corporate social responsibility’, Journal of Financial Economics. North-Holland,
111(1), pp. 158–180. doi: 10.1016/J.JFINECO.2013.10.002.
Hansmann, H. B. (1980) ‘The Role of Nonprofit Enterprise’, The Yale Law Journal. The Yale
Law Journal Company, Inc., 89(5), p. 835. doi: 10.2307/796089.
Helmig, B., Spraul, K. and Ingenhoff, D. (2016) ‘Under Positive Pressure’, Business & Society.
SAGE PublicationsSage CA: Los Angeles, CA, 55(2), pp. 151–187. doi:
10.1177/0007650313477841.
Henderson, D. and Institute of Economic Affairs (Great Britain) (2001) Misguided virtue : false
notions of corporate social responsibility. Institute of Economic Affairs. Available at:
https://iea.org.uk/publications/research/misguided-virtue-false-notions-of-corporate-social-
responsibility (Accessed: 22 June 2018).
Hill, C. W. L. and Jones, T. M. (1992) ‘STAKEHOLDER-AGENCY THEORY’, Journal of
Management Studies. Wiley/Blackwell (10.1111), 29(2), pp. 131–154. doi: 10.1111/j.1467-
6486.1992.tb00657.x.

36
Husted, B. W., Jamali, D. and Saffar, W. (2016) ‘Near and dear? The role of location in CSR
engagement’, Strategic Management Journal. Wiley-Blackwell, 37(10), pp. 2050–2070. doi:
10.1002/smj.2437.
Hwang, B.-H. and Kim, H. H. (2017) ‘It pays to write well’, Journal of Financial Economics.
North-Holland, 124(2), pp. 373–394. doi: 10.1016/J.JFINECO.2017.01.006.
Jha, A. and Cox, J. (2015) ‘Corporate social responsibility and social capital’, Journal of
Banking & Finance, 60, pp. 252–270. doi: 10.1016/j.jbankfin.2015.08.003.
Kelly, D. and Lewis, A. (2009) ‘Human service sector nonprofit organization’s social impact’,
Business Strategy Series. Emerald Group Publishing Limited, 10(6), pp. 374–382. doi:
10.1108/17515630911005664.
Kubik, J. D., Scheinkman, J. A. and Hong, H. G. (2011) ‘Financial Constraints on Corporate
Goodness’, SSRN Electronic Journal. doi: 10.2139/ssrn.1784357.
Liang, H. and Renneboog, L. (2017) ‘On the Foundations of Corporate Social Responsibility’,
The Journal of Finance. Wiley/Blackwell (10.1111), 72(2), pp. 853–910. doi:
10.1111/jofi.12487.
Lins, K. V., Servaes, H. and Tamayo, A. (2017) ‘Social Capital, Trust, and Firm Performance:
The Value of Corporate Social Responsibility during the Financial Crisis’, The Journal of
Finance. Wiley/Blackwell (10.1111), 72(4), pp. 1785–1824. doi: 10.1111/jofi.12505.
Margolis, J. D., Elfenbein, H. A. and Walsh, J. P. (2009) ‘Does it Pay to Be Good...And Does it
Matter? A Meta-Analysis of the Relationship between Corporate Social and Financial
Performance’, SSRN Electronic Journal. doi: 10.2139/ssrn.1866371.
Margolis, J. D. and Walsh, J. P. (2003) ‘Misery Loves Companies: Rethinking Social Initiatives
by Business’, Administrative Science Quarterly. SAGE Publications, 48(2), p. 268. doi:
10.2307/3556659.
Marquis, C. (2003) ‘The Pressure of the Past: Network Imprinting in Intercorporate
Communities’, Administrative Science Quarterly. SAGE Publications, 48(4), p. 655. doi:
10.2307/3556640.
Marquis, C., Glynn, M. A. and Davis, G. F. (2007) ‘Community isomorphism and corporate
social action’, Academy of Management Review. Academy of Management Briarcliff Manor,
NY 10510 , 32(3), pp. 925–945. doi: 10.5465/amr.2007.25275683.
Masulis, R. W. and Reza, S. W. (2015) ‘Agency Problems of Corporate Philanthropy’, Review of
Financial Studies. Oxford University Press, 28(2), pp. 592–636. doi: 10.1093/rfs/hhu082.
McGuire, S. T. et al. (2012) ‘Does Local Religiosity Impact Corporate Social Responsibility?’,
SSRN Electronic Journal. doi: 10.2139/ssrn.1926387.
McWilliams, A. and Siegel, D. (2001) ‘Corporate Social Responsibility: A Theory of the Firm
Perspective’, The Academy of Management Review. Academy of Management, 26(1), p. 117.
doi: 10.2307/259398.

37
Orlitzky, M., Schmidt, F. L. and Rynes, S. L. (2003) ‘Corporate Social and Financial
Performance: A Meta-Analysis’, Organization Studies, 24(3), pp. 403–441. doi:
10.1177/0170840603024003910.
Ostrower, F. (1995) Why the wealthy give : the culture of elite philanthropy. Princeton
University Press. Available at: https://press.princeton.edu/titles/5769.html (Accessed: 18
September 2018).
Pirinsky, C. and Wang, Q. (2006) ‘Does Corporate Headquarters Location Matter for Stock
Returns?’, The Journal of Finance. Wiley/Blackwell (10.1111), 61(4), pp. 1991–2015. doi:
10.1111/j.1540-6261.2006.00895.x.
Porter, M. E. and Kramer, M. R. (2002) ‘The competitive advantage of corporate philanthropy.’,
Harvard business review, 80(12), pp. 56–68, 133. Available at:
http://www.ncbi.nlm.nih.gov/pubmed/12510538 (Accessed: 21 October 2018).
Salamon, L. M. et al. (2000) The nonprofit sector : for what and for whom? Johns Hopkins
Center for Civil Society Studies. Available at:
https://www.researchgate.net/publication/241118600_The_Nonprofit_Sector_For_What_and_for
_Whom (Accessed: 26 October 2018).
Salamon, L. M., Hems, L. C. and Chinnock, K. (2000) ‘THE JOHNS HOPKINS
COMPARATIVE NONPROFIT SECTOR PROJECT The Nonprofit Sector: For What and for
Whom?’ Available at: https://www.sociedadenaccion.cl/wp-content/uploads/2015/06/Salamon-
L.-Hems-L.-Chinnock-K.-2000.-The-Non-Profit-Sector.-For-What-and-for-Whom.pdf
(Accessed: 22 June 2018).
Seitanidi, M. M. and Crane, A. (2009) ‘Implementing CSR Through Partnerships: Understanding
the Selection, Design and Institutionalisation of Nonprofit-Business Partnerships’, Journal of
Business Ethics. Springer Netherlands, 85(S2), pp. 413–429. doi: 10.1007/s10551-008-9743-y.
Servaes, H. and Tamayo, A. (2013) ‘The Impact of Corporate Social Responsibility on Firm
Value: The Role of Customer Awareness’, Management Science. INFORMS , 59(5), pp. 1045–
1061. doi: 10.1287/mnsc.1120.1630.
Shleifer, A. and Vishny, R. W. (1997) ‘A survery of Corporate Governace’, The Journal of
Finance. doi: 10.1111/j.1540-6261.1997.tb04820.x.
Shubham, Charan, P. and Murty, L. S. (2018) ‘Secondary stakeholder pressures and
organizational adoption of sustainable operations practices: The mediating role of primary
stakeholders’, Business Strategy and the Environment. Wiley-Blackwell. doi: 10.1002/bse.2041.
Stuart, T. and Sorenson, O. (2003) ‘The geography of opportunity: spatial heterogeneity in
founding rates and the performance of biotechnology firms’, Research Policy. North-Holland,
32(2), pp. 229–253. doi: 10.1016/S0048-7333(02)00098-7.
Sundaram, A. K. and Inkpen, A. C. (2004) ‘The Corporate Objective Revisited’, Organization
Science. INFORMS , 15(3), pp. 350–363. doi: 10.1287/orsc.1040.0068.
Sunder, J., Sunder, S. V. and Zhang, J. (2017) ‘Pilot CEOs and corporate innovation’, Journal of
Financial Economics. North-Holland, 123(1), pp. 209–224. doi:
10.1016/J.JFINECO.2016.11.002.

38
Udayasankar, K. (2008) ‘Corporate social responsibility and firm size’, Journal of Business
Ethics, 83(2), pp. 167–175. doi: 10.1007/s10551-007-9609-8.
Vasi, I. B. and King, B. G. (2012) ‘Social Movements, Risk Perceptions, and Economic
Outcomes’, American Sociological Review. SAGE PublicationsSage CA: Los Angeles, CA,
77(4), pp. 573–596. doi: 10.1177/0003122412448796.
Waddock, S. A. and Graves, S. B. (1997) ‘THE CORPORATE SOCIAL PERFORMANCE-
FINANCIAL PERFORMANCE LINK’, Strategic Management Journal. Wiley-Blackwell,
18(4), pp. 303–319. doi: 10.1002/(SICI)1097-0266(199704)18:4<303::AID-SMJ869>3.0.CO;2-
G.
Wymer, W. W. and Samu, S. (2003) ‘Dimensions of Business and Nonprofit Collaborative
Relationships’, Journal of Nonprofit & Public Sector Marketing. Taylor & Francis Group ,
11(1), pp. 3–22. doi: 10.1300/J054v11n01_02.
Zadek, S. (2001) The civil corporation : the new economy of corporate citizenship. Earthscan.
Available at:
https://books.google.com/books/about/The_Civil_Corporation.html?id=IFojgSCA638C
(Accessed: 25 October 2018).
Zimmer, R. by: A. (1993) ‘Review’, Voluntas: International Journal of Voluntary and Nonprofit
Organizations. Springer, pp. 399–406. doi: 10.2307/27927395.

39
Table 1
Top 10 501(c)(3) / 501(c)(4) Spenders
This table lists the top 10 501(c)(3) or 501(c)(4) nonprofit spenders that corresponds to each category of KLD CSR
data in our sample period. All these organizations are classified by IRS with NTEE-CC system and matched to
corresponding category of corporate social responsibility. Category "Community" matches group NTEE-S
(Community) and group NTEE-T (Philanthropy). Category "Diversity" matches several subgroups in NTEE-P, NTEE-
Q70 and NTEE-R. Category "Employee Relations" matches employee-related group by keyword search. Category
"Environment" matches group NTEE-C (Environment). Category "Human Rights" matches group NTEE-Q70
(International Human Rights) and group NTEE-R (Civil Rights). Category "Product" matches group NTEE-S40
(Business and Industry) and group NTEE-W90 (Consumer Protection).
Rank Community Diversity Employee
Relation Environment Human Rights Product
1 Gifts In Kind
International
National
Women’s Law
Center
Consortium For
Worker
Education Inc
Nature
Conservancy
Inc
The Carter
Center Inc
Underwriters
Laboratories
Inc
2
Vanguard
Charitable
Endowment
Program
Ms. Foundation
For Women Inc Workplace Inc
Trust For
Public Land
American Civil
Liberties Union
Foundation Inc
Consumers
Union Of
United States
Inc
3
Silicon Valley
Community
Foundation
Disability
Rights
California
Education &
Research Fund
Of Employee
Benefit
Research
Conservation
International
Foundation
Anti-
Defamation
League
American
National
Standards
Institute
4
New York City
Economic
Development
Corporation
National
Association For
The
Advancement
Of Colored
People
United Labor
Agency Inc
Ducks
Unlimited Inc
Human Rights
Watch Inc
American
Society For
Testing And
Materials
5 United Way Of
New York City
Human Rights
Campaign
Foundation
The AFL-CIO
Working For
America
Institute
National
Audubon
Society Inc
Amnesty
International
USA Inc
Consumer
Education
Services Inc
6 Rotary
International
National
Organization
For Women Inc
Concern
Employee
Assistance
Program
Sierra Club AARP
International
Accreditation
Service
7
International
Association Of
Lions Clubs
Equality For
California
FAMILIES
Alliance For
Retired
Americans
League Of
Conservation
Voters Inc
National
Association For
The
Advancement
Of Colored
People
Greater
Baltimore
Committee Inc
8
The Louisiana
Association Of
Community
Action
Partnerships
Human Rights
Campaign Inc
American
Rights At Work
Environmental
Defense Fund
Inc
Californians To
Protect Our
Right To Vote
International
Municipal
Signal
Association

40
9
Campaign For
Community
Change
National
Council Of La
Raza
National
Alliance For
Worker And
Employer
Rights Inc
Greenpeace Inc Humanity
United
Citizen Action
Coalition Inc
10 Columbia
Association Inc
People First Of
Ohio
Jobs With
Justice
Environment
America Inc
Human Rights
Campaign Inc
Washington
State Public
Interest
Research
Group

41
Table 2 Summary Statistics and Univariate Tests
This table displays summary statistics for the main variables (See Appendix for variable definitions) used in this study and univariate tests on CSR score
by nonprofit characteristics. The data are from Russell 3000 firms for the period 2003–2009. The data on U.S. nonprofit organizations are from National
Center for Charitable Statistics. The data on corporate social responsibility are from the Kinder, Lydenberg, and Domini Research & Analytics (KLD)
database. The accounting data are from Compustat. CEO and board characteristics are from Execucomp and ISS database. The data on state/MSA gross
domestic product and population are from Federal Reserve Economic Data (FRED). All variables from Compustat and ExecuComp databases are
winsorized at 1% and 99%. *, **, and *** denote significance at the 10%, 5%, and 1% level, respectively.
Panel A: Summary Statistics
Variable N Mean Median S.D. 1% 99%
A. MSA-level nonprofit characteristics
Log total expense 22225 20.012 19.967 1.649 15.815 22.689
Log fundraising expense 19935 16.539 16.576 1.988 11.201 19.659
Log special event expense 22179 15.871 16.019 1.745 10.846 18.673
Log legislative expense 17169 12.751 13.055 2.637 1.386 16.530
Log program expense 22225 19.720 19.669 1.663 15.420 22.374
Log investment income 22205 17.344 17.502 1.774 12.203 19.922
B. State-level nonprofit characteristics
Log total expense 23363 21.216 21.247 0.995 18.621 22.756
Log fundraising expense 21676 17.628 17.750 1.492 12.633 19.673
Log special event expense 23363 17.238 17.280 1.133 14.050 18.721
Log legislative expense 20230 13.896 13.886 1.703 9.211 16.545
Log program expense 23363 20.918 20.955 1.007 18.261 22.462
Log investment income 23363 18.586 18.846 1.063 15.585 20.174
C. Corporate social responsibility measures
CSR score 16806 -0.187 -0.200 0.380 -1.262 0.817
Environment score 16806 -0.012 0.000 0.093 -0.429 0.200
Diversity score 16806 0.034 0.000 0.153 -0.500 0.400
Community score 16806 -0.002 0.000 0.097 -0.333 0.333
Employee relations score 16806 -0.057 0.000 0.156 -0.433 0.333
Human rights score 16806 -0.013 0.000 0.062 -0.250 0.000
Product score 16806 -0.044 0.000 0.146 -0.500 0.250
D. Firm characteristics
Log assets($MIL) 23317 6.825 6.742 1.875 2.839 11.759
Cash Flow (over assets) 21862 0.010 0.063 0.682 -0.937 0.320
Dividends (over assets) 23202 0.014 0.000 0.101 0.000 0.164
Leverage (over assets) 23239 0.188 0.118 0.239 0.000 0.920
Sales growth 22271 0.393 0.078 25.062 -0.629 2.265
Capital expenditures 21460 -3.275 -3.375 1.362 -6.451 0.656
ROA 22417 0.058 0.094 0.641 -0.828 0.417
Market-to-book 23259 2.817 2.066 37.060 -10.752 22.749
Tobin's q 21100 2.058 1.469 3.311 0.689 8.825
Industry-adjusted Tobin's q 21100 0.440 0.000 3.250 -1.334 6.667
MSA-adjusted Tobin's q 21100 0.472 0.000 3.117 -1.202 6.922

42
E. CEO and Board characteristics
CEO ownership 11882 0.035 0.013 0.067 0.002 0.341
G index 2659 9.076 9.000 2.585 3.000 15.000
E index 5965 2.720 3.000 1.094 0.000 5.000
Duality 7930 0.612 1.000 0.487 0.000 1.000
Staggered board 6327 0.556 1.000 0.497 0.000 1.000
Board independence 7918 0.736 0.750 0.136 0.364 0.923
F. Other variables
State GDP growth (%) 23373 0.042 0.046 0.036 -0.062 0.109
MSA GDP growth (%) 22496 1.740 2.000 3.539 -7.700 9.200
Panel B: Univariate Tests
Average CSR score for firm headquartered in
High (>
Median)
Low
(Median) Test of Difference
MSA-level: nonprofit total expense -0.188 -0.213 -0.026
State-level: nonprofit total expense -0.185 -0.205 -0.020
High (>
95th %)
Low
(95th %) Test of Difference
MSA-level: nonprofit total expense -0.179 -0.201 -0.022
State-level: nonprofit total expense -0.127 -0.207 -0.080

43
Table 3
Corporate social responsibility and nonprofit expense.
The table shows the results from OLS regressions of KLD CSR scores on CSR-matched nonprofit expense. The CSR-
matched nonprofit expense is defined as the annual expense of CSR-matched nonprofit groups aggregated at metropolitan
statistical areas level. The other variables are defined in the Appendix. In Panel A, column 1 performs a univariate
regression while column 2, 3 and 4 include firm characteristics and MSA level control as controls. Column 5 include
firm fixed effects and year fixed effects. Panel B includes regressions with alternative industry definitions, with clustering
standard errors at MSA level, with two-way clustering at firm level and MSA level, and with aggregating nonprofit
spending on state level. Panel C shows results on controlling combined statistical areas time varying characteristics.
Panel D performs 2SLS IV regression using nonprofit investment income as the IV variable. The nonprofit investment
income is the total annual proceeds from dividends and interests for MSA level CSR-matched nonprofit groups. The
dependent variables in the first stage (column 1 of panel D) are CSR-matched nonprofit expense. The Cragg-Donald F-
test statistics is reported for the first stage. The data are from Russell 3000 firms for the period 2003–2009. All
specifications include relevant fixed effects. Standard errors are clustered at the firm level and t statistics are shown in
parentheses. *, **, and *** denote significance at the 10%, 5%, and 1% level, respectively
Panel A: Regressions of KLD CSR scores on CSR-matched nonprofit expense.
Variable (1) (2) (3) (4) (5)
Nonprofit expense 0.042*** 0.046*** 0.045*** 0.047*** 0.042***
(3.64) (3.74) (3.64) (3.68) (3.56)
size 0.011* 0.011* 0.012* -0.016
(1.82) (1.79) (1.81) (-1.55)
csfl 0.063** -0.054 -0.053 -0.001
(2.41) (-1.62) (-1.59) (-0.08)
leverage -0.064** -0.073** -0.070** -0.030
(-2.11) (-2.39) (-2.27) (-1.22)
dividends 0.246*** 0.224*** 0.225*** -0.003
(4.18) (3.63) (3.57) (-0.07)
roa 0.148*** 0.145*** 0.045*
(3.09) (2.99) (1.65)
mtb 0.000 -0.000 -0.000
(0.00) (-0.11) (-1.37)
MSA GDP growth 0.000 0.001
(0.15) (0.76)
Year FE YES YES YES YES YES
MSA FE YES YES YES YES NO
Industry FE FF-49 FF-49 FF-49 FF-49 NO
Firm FE NO NO NO NO YES
Observations 15,832 14,709 14,680 14,138 13,931
R-squared 0.167 0.175 0.176 0.168 0.801
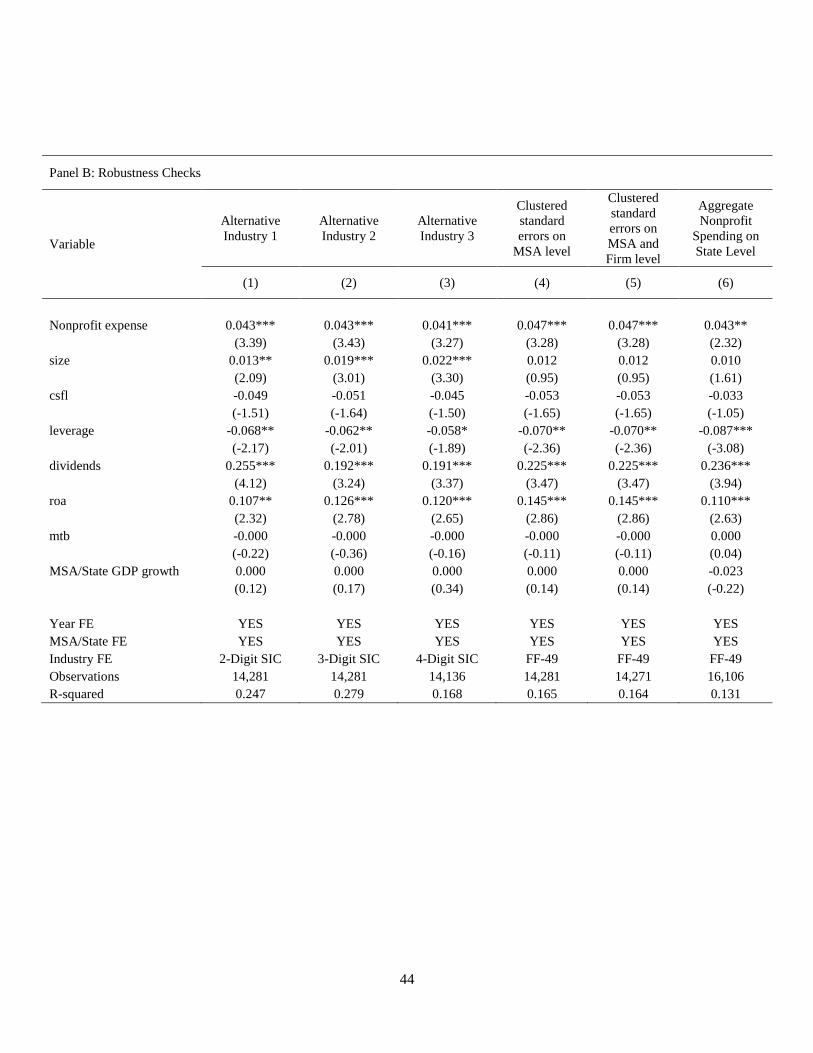
44
Panel B: Robustness Checks
Variable
Alternative
Industry 1
Alternative
Industry 2
Alternative
Industry 3
Clustered
standard
errors on
MSA level
Clustered
standard
errors on
MSA and
Firm level
Aggregate
Nonprofit
Spending on
State Level
(1) (2) (3) (4) (5) (6)
Nonprofit expense 0.043*** 0.043*** 0.041*** 0.047*** 0.047*** 0.043** (3.39) (3.43) (3.27) (3.28) (3.28) (2.32)
size 0.013** 0.019*** 0.022*** 0.012 0.012 0.010 (2.09) (3.01) (3.30) (0.95) (0.95) (1.61)
csfl -0.049 -0.051 -0.045 -0.053 -0.053 -0.033 (-1.51) (-1.64) (-1.50) (-1.65) (-1.65) (-1.05)
leverage -0.068** -0.062** -0.058* -0.070** -0.070** -0.087*** (-2.17) (-2.01) (-1.89) (-2.36) (-2.36) (-3.08)
dividends 0.255*** 0.192*** 0.191*** 0.225*** 0.225*** 0.236*** (4.12) (3.24) (3.37) (3.47) (3.47) (3.94)
roa 0.107** 0.126*** 0.120*** 0.145*** 0.145*** 0.110*** (2.32) (2.78) (2.65) (2.86) (2.86) (2.63)
mtb -0.000 -0.000 -0.000 -0.000 -0.000 0.000 (-0.22) (-0.36) (-0.16) (-0.11) (-0.11) (0.04)
MSA/State GDP growth 0.000 0.000 0.000 0.000 0.000 -0.023 (0.12) (0.17) (0.34) (0.14) (0.14) (-0.22)
Year FE YES YES YES YES YES YES
MSA/State FE YES YES YES YES YES YES
Industry FE 2-Digit SIC 3-Digit SIC 4-Digit SIC FF-49 FF-49 FF-49
Observations 14,281 14,281 14,136 14,281 14,271 16,106
R-squared 0.247 0.279 0.168 0.165 0.164 0.131

45
Panel C: Controlling for Combined Statistical Areas Time Varying Characteristics
Variable
CSA Fixed Effects CSA Time Varying
Effects
CSA Time Varying
Effects & Industry FE
(1) (2) (3)
Nonprofit expense 0.010** 0.009** 0.008*
(2.35) (2.10) (1.78)
size 0.015*** 0.009*** 0.016***
(5.25) (3.44) (5.44)
csfl -0.059* -0.058* -0.057*
(-1.78) (-1.71) (-1.68)
leverage -0.068*** -0.120*** -0.066***
(-3.98) (-7.25) (-3.84)
dividends 0.271*** 0.275*** 0.278***
(5.06) (5.30) (4.87)
roa 0.115*** 0.105*** 0.112***
(2.95) (2.78) (2.79)
mtb -0.000 -0.000 -0.000
(-0.27) (-0.43) (-0.18)
Year FE YES NO NO
CSA FE YES NO NO
Industry FE YES NO YES
CSA*Year FE NO YES YES
Observations 13,093 13,093 13,093
R-squared 0.132 0.092 0.146

46
Panel D: 2SLS IV Regression using nonprofit investment income as the IV
Variable 2SLS IV
(1) (2)
Nonprofit expense 0.066***
(3.18)
Nonprofit investment income 0.265***
(66.53)
size -0.000 0.012*
(-0.01) (1.83)
csfl -0.052*** -0.052
(-3.34) (-1.58)
leverage -0.004 -0.070**
(-0.55) (-2.28)
dividends 0.071*** 0.223***
(2.65) (3.58)
roa 0.042** 0.144***
(2.45) (3.01)
mtb -0.000 -0.000
(-1.09) (-0.10)
MSA GDP growth 0.010*** -0.000
(16.83) (-0.14)
Year FE YES YES
MSA FE YES YES
Industry FE FF-49 FF-49
Firm FE NO NO
Observations 14,136 14,136
R-squared 0.858 0.168
First-stage F-test statistics 668.866

47
Table 4
Matrix of Separate effects of nonprofit subgroups on CSR subcategories.
This table shows the combined results from OLS regressions of CSR subcategories on nonprofit subgroup expenses. The dependent
variables are community score, diversity score, employee relations score, environment score, human rights score, product score for
column 1 through column 6. The independent variables are community-, diversity-, employee relations-, environment-, human rights-
and product-matched nonprofit annual expenses, respectively. The data are from Russell 3000 firms for the period 2003–2009. All
specifications include firm controls, MSA level control, MSA dummies, Fama-French 49 industry dummies and year dummies. Standard
errors are clustered at the firm level and t statistics are shown in parentheses. *, **, and *** denote significance at the 10%, 5%, and
1% level, respectively.
Variable Community Diversity
Employee
Relations Environment Human Rights Product
(1) (2) (3) (4) (5) (6)
Community-related nonprofit expense 0.008* 0.014 0.006 0.005 0.001 -0.002
(1.93) (1.22) (0.64) (1.39) (0.66) (-0.25)
Diversity-related nonprofit expense 0.000 0.008** -0.005 -0.000 -0.001 0.003
(0.17) (1.97) (-1.12) (-0.09) (-0.64) (0.93)
Employee-related nonprofit expense -0.001 -0.001 0.005** 0.001 0.000 0.002
(-0.30) (-0.17) (2.16) (0.33) (0.34) (0.80)
Environment-related nonprofit expense 0.007* -0.007 0.010 0.011*** 0.002 0.008
(1.91) (-1.06) (1.16) (2.63) (0.52) (1.40)
Human rights-related nonprofit expense 0.002 0.000 -0.003 -0.000 0.001 0.004
(0.71) (0.02) (-1.14) (-0.38) (0.99) (1.34)
Product-related nonprofit expense 0.003 0.002 0.009 0.003 -0.001 0.013***
(0.94) (0.39) (1.61) (0.84) (-1.03) (3.10)
Firm Controls YES YES YES YES YES YES
MSA Control YES YES YES YES YES YES
Year FE YES YES YES YES YES YES
MSA FE YES YES YES YES YES YES
Industry FE YES YES YES YES YES YES

48
Table 5
Nonprofit sub-effects on corporate social responsibility
The table reports the results from OLS regressions of KLD CSR score on nonprofit sub-expenses and
lagged expenses. In Panel A, the independent variables are annual fundraising expense, annual special
event expense, annual program expense, annual legislative expense and annual political expense for
column 1 to column 5. In Panel B, the independent variables are total annual expense, one year lagged
total annual expense, two year lagged total annual expense, and three year lagged total annual expense
for column 1 to column 4 while all of them are included in column 5. The data are from Russell 3000
firms for the period 2003–2009. All specifications include firm controls, MSA level controls, MSA
dummies, Fama-French 49 industry dummies and year dummies. Standard errors are clustered at the firm
level and t statistics are shown in parentheses. *, **, and *** denote significance at the 10%, 5%, and
1% level, respectively.
Panel A: Nonprofit sub-spending effects
Variable (1) (2) (3) (4) (5)
Nonprofit fundraising expense 0.151***
(2.75)
Nonprofit special event expense 0.276***
(2.80)
Nonprofit program expense 0.058***
(3.18)
Nonprofit legislative expense 0.033***
(2.62)
Nonprofit political expense -0.001 (-0.82)
size 0.012* 0.012* 0.012* 0.015** 0.006 (1.92) (1.80) (1.83) (2.35) (0.81)
csfl -0.020 -0.058* -0.053 -0.035 -0.041
(-0.62) (-1.71) (-1.61) (-1.07) (-1.08)
lever -0.078** -0.070** -0.070** -0.072** -0.072* (-2.52) (-2.28) (-2.28) (-2.28) (-1.94)
dividends 0.186*** 0.233*** 0.223*** 0.181*** 0.125 (3.34) (3.73) (3.58) (2.85) (1.55)
roa 0.157*** 0.149*** 0.145*** 0.183*** 0.190*** (3.07) (3.07) (3.02) (3.49) (2.89)
mtb 0.000 -0.000 -0.000 -0.000 -0.000 (0.21) (-0.30) (-0.10) (-0.46) (-0.46)
MSA GDP growth -0.001 0.001 -0.000 0.003*** -0.001 (-1.00) (0.58) (-0.16) (2.61) (-0.36)
Year FE YES YES YES YES YES
MSA FE YES YES YES YES YES
Industry FE YES YES YES YES YES
Observations 12,439 14,111 14,136 10,734 6,268
R-squared 0.103 0.099 0.168 0.147 0.138

49
Panel B: The realization process of nonprofit impact on corporate social responsibility
Variable (1) (2) (3) (4) (5)
Nonprofit expense 0.047*** 0.044*** (3.68) (3.58)
Lagged + 1 Nonprofit expense 0.027** 0.023** (2.39) (2.12)
Lagged + 2 Nonprofit expense -0.004 -0.001 (-1.01) (-0.23)
Lagged + 3 Nonprofit expense -0.004 -0.001 (-1.33) (-0.59)
size 0.012* 0.012* 0.012*** 0.012*** 0.012* (1.81) (1.81) (5.53) (5.52) (1.81)
csfl -0.053 -0.054 -0.055* -0.055* -0.052
(-1.59) (-1.62) (-1.67) (-1.66) (-1.56)
lever -0.070** -0.071** -0.071*** -0.071*** -0.070** (-2.27) (-2.29) (-4.23) (-4.24) (-2.28)
dividends 0.225*** 0.228*** 0.229*** 0.229*** 0.225*** (3.57) (3.61) (4.07) (4.06) (3.56)
roa 0.145*** 0.146*** 0.147*** 0.147*** 0.144*** (2.99) (3.00) (4.02) (4.01) (2.97)
mtb -0.000 -0.000 -0.000 -0.000 -0.000 (-0.11) (-0.12) (-0.12) (-0.12) (-0.09)
MSA GDP growth 0.000 0.001 0.001 0.001 0.000 (0.15) (0.68) (0.64) (0.60) (0.02)
Year FE YES YES YES YES YES
MSA FE YES YES YES YES YES
Industry FE YES YES YES YES YES
Observations 14,138 14,138 14,138 14,138 14,138
R-squared 0.168 0.167 0.167 0.167 0.168

50
Table 6
Social demand channel: corporate social responsibility and firm value.
The table shows the results from OLS regressions of firm performance on KLD CSR score and nonprofit expense. Nonprofit expense is defined
as the annual expense of CSR-related nonprofit groups clustered at metropolitan statistical areas level. From column (1) to (6), the dependent
variables are Tobin's q at time t+1, Tobin's q at time t+2, industry-adjusted Tobin's q at time t+1, industry-adjusted Tobin's q at time t+2, MSA-
adjusted Tobin's q at time t+1, MSA-adjusted Tobin's q at time t+2. Tobin's q is defined as market value of total assets over book value of total
assets. Industry-adjusted Tobin's q is defined as Tobin's q minus the median of industry's Tobin's q. MSA-adjusted Tobin's q is defined as Tobin's
q minus the median of MSA's Tobin's q. The main interest of variable is the interaction of nonprofit expense times CSR score. The other variables
are defined in the Appendix. The data are from Russell 3000 firms for the period 2003–2009. All specifications include MSA dummies, Fama-
French 49 industry dummies and year dummies. Standard errors are clustered at the firm level and t statistics are shown in parentheses. *, **,
and *** denote significance at the 10%, 5%, and 1% level, respectively.
Variable Tobin's qt+1 Tobin's qt+2
Industry-
adjusted
Tobin's qt+1
Industry-
adjusted
Tobin's qt+2
MSA-adjusted
Tobin's qt+1
MSA-adjusted
Tobin's qt+2
(1) (2) (3) (4) (5) (6)
CSR score -0.948** -0.651 -1.001** -0.677 -1.078** -0.703
(-2.02) (-1.46) (-2.17) (-1.51) (-2.30) (-1.56)
Nonprofit expense -0.044 -0.030 -0.013 0.008 0.000 0.082**
(-1.22) (-0.83) (-0.29) (0.28) (0.01) (2.15)
CSR score * Nonprofit expense 0.057** 0.041* 0.060** 0.042* 0.064** 0.043*
(2.26) (1.75) (2.42) (1.79) (2.52) (1.83)
size -0.171*** -0.139*** -0.170*** -0.138*** -0.170*** -0.138***
(-6.58) (-6.05) (-6.62) (-6.02) (-6.47) (-5.98)
csfl -1.008** -1.163*** -0.996** -1.166*** -0.951** -1.153***
(-2.33) (-4.16) (-2.34) (-4.26) (-2.17) (-4.30)
lever -0.384** -0.251 -0.370** -0.245 -0.380** -0.247
(-2.46) (-1.44) (-2.36) (-1.39) (-2.41) (-1.39)
dividends 3.104*** 2.892*** 3.115*** 2.932*** 3.142*** 2.893***
(3.80) (3.72) (3.83) (3.62) (4.06) (3.76)
sgrw 0.000*** 0.000*** 0.000*** 0.000*** 0.000** 0.000***
(3.67) (4.17) (3.41) (3.81) (2.52) (3.95)
cpex 0.105*** 0.079*** 0.103*** 0.078*** 0.104*** 0.076***
(4.73) (3.94) (4.67) (3.87) (4.71) (3.82)
roa 1.349** 1.180* 1.323** 1.146* 1.287** 1.116*
(2.22) (1.83) (2.15) (1.76) (2.05) (1.71)
Year FE YES YES YES YES YES YES
MSA FE YES YES YES YES YES YES
Industry FE YES YES YES YES YES YES
Observations 12,381 11,840 12,379 11,823 12,379 11,823
R-squared 0.287 0.274 0.163 0.155 0.225 0.211
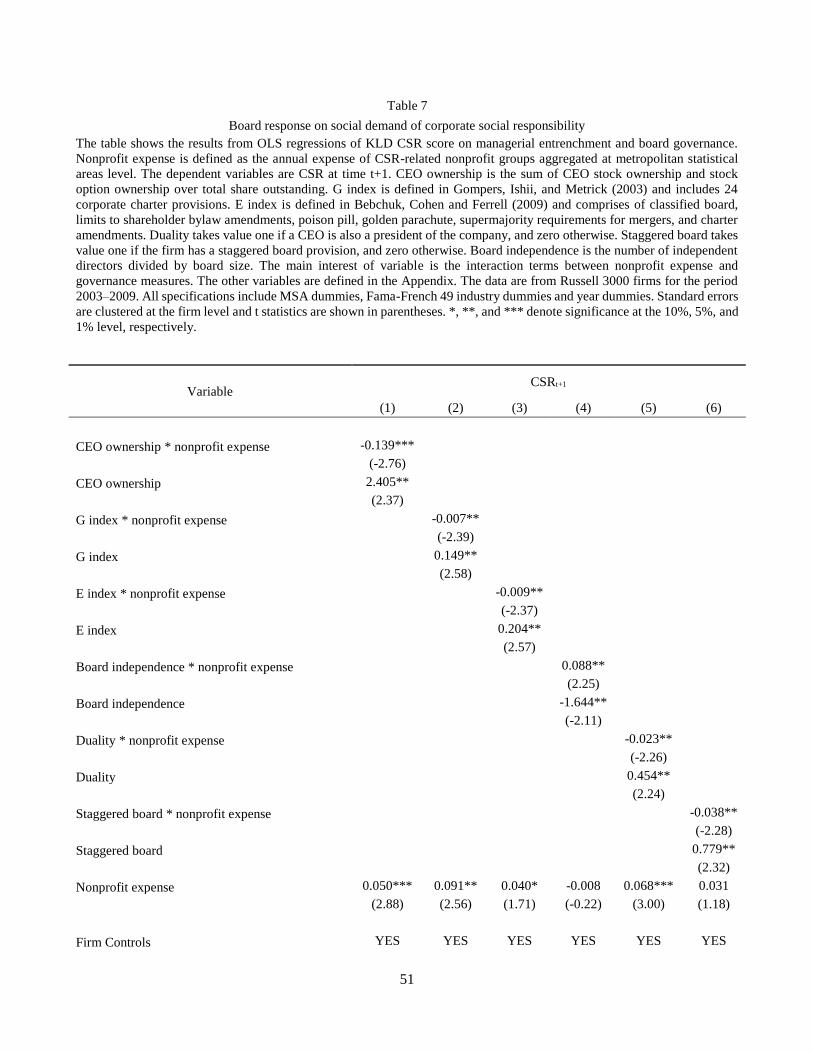
51
Table 7
Board response on social demand of corporate social responsibility
The table shows the results from OLS regressions of KLD CSR score on managerial entrenchment and board governance.
Nonprofit expense is defined as the annual expense of CSR-related nonprofit groups aggregated at metropolitan statistical
areas level. The dependent variables are CSR at time t+1. CEO ownership is the sum of CEO stock ownership and stock
option ownership over total share outstanding. G index is defined in Gompers, Ishii, and Metrick (2003) and includes 24
corporate charter provisions. E index is defined in Bebchuk, Cohen and Ferrell (2009) and comprises of classified board,
limits to shareholder bylaw amendments, poison pill, golden parachute, supermajority requirements for mergers, and charter
amendments. Duality takes value one if a CEO is also a president of the company, and zero otherwise. Staggered board takes
value one if the firm has a staggered board provision, and zero otherwise. Board independence is the number of independent
directors divided by board size. The main interest of variable is the interaction terms between nonprofit expense and
governance measures. The other variables are defined in the Appendix. The data are from Russell 3000 firms for the period
2003–2009. All specifications include MSA dummies, Fama-French 49 industry dummies and year dummies. Standard errors
are clustered at the firm level and t statistics are shown in parentheses. *, **, and *** denote significance at the 10%, 5%, and
1% level, respectively.
Variable CSRt+1
(1) (2) (3) (4) (5) (6)
CEO ownership * nonprofit expense -0.139***
(-2.76)
CEO ownership 2.405**
(2.37)
G index * nonprofit expense -0.007**
(-2.39)
G index 0.149**
(2.58)
E index * nonprofit expense -0.009**
(-2.37)
E index 0.204**
(2.57)
Board independence * nonprofit expense 0.088**
(2.25)
Board independence -1.644**
(-2.11)
Duality * nonprofit expense -0.023**
(-2.26)
Duality 0.454**
(2.24)
Staggered board * nonprofit expense -0.038**
(-2.28)
Staggered board 0.779**
(2.32)
Nonprofit expense 0.050*** 0.091** 0.040* -0.008 0.068*** 0.031
(2.88) (2.56) (1.71) (-0.22) (3.00) (1.18)
Firm Controls YES YES YES YES YES YES

52
Year FE YES YES YES YES YES YES
MSA FE YES YES YES YES YES YES
Industry FE YES YES YES YES YES YES
Observations 7,851 2,294 3,960 6,913 5,762 4,264
R-squared 0.232 0.270 0.279 0.264 0.268 0.270

53
Appendix A
Variable definitions
A.1. Nonprofit variables
Nonprofit expense
The logarithm of aggregated annual expense of CSR-related nonprofit on
MSA-level or on state-level. Annual expense is total yearly expense of
501(c)(3) or 501(c)(4) organization.
Nonprofit fundraising expense
The logarithm of aggregated annual fundraising expense of CSR-related
nonprofit on MSA-level or on state-level. Fundraising expense includes
professional fundraising expense and general fundraising expense.
Nonprofit special event expense
The logarithm of aggregated annual special-events expense of CSR-
related nonprofit on MSA-level or on state-level. Special-events expense
is total yearly special-events expense.
Nonprofit legislative expense
The logarithm of aggregated annual legislative expense of CSR-related
nonprofit on MSA-level or on state-level. Legislative expense includes
direct lobbying expense, grassroot lobbying expense and administrative
expense in connection with lobbying.
Nonprofit program expense
The logarithm of aggregated annual program expense of CSR-related
nonprofit on MSA-level or on state-level. Program expense is a major part
of total expense and accounts for services, programs, education and other
routine activities.
Nonprofit investment income
The logarithm of aggregated annual investment income of CSR-related
nonprofit on MSA-level or on state-level. 501(c)(3) and 501(c)(4)
organizations invest and receive proceeds from interests, dividends, and
other investment income.
A.2. Corporate social responsibility variables
CSR score Method 1: KLD total strengths minus KLD total concerns, normalized. Method 2:
Sum of Community score, Diversity score, Employee relations score, Employee
relations score, Environment score, Human rights score, and Product score.
Community score
(Number of KLD Community Strengths divided by total number of KLD
Community Strengths) minus (Number of KLD Community Concerns divided by
total number of KLD Community Concerns). KLD Community Strengths include:
Charitable Giving, Innovative Giving, Non-U.S. Charitable Giving, Support for
Housing, Support for Education, and Other Strength. KLD Community Concerns
include: Investment Controversies, Negative Economic, Tax Disputes, and Other
Concern.
Diversity score
(Number of KLD Diversity Strengths divided by total number of KLD Diversity
Strengths) minus (Number of KLD Diversity Concerns divided by total number of
KLD Diversity Concerns). KLD Diversity Strengths include: Promotion,
Work/Life Benefits, Women & Minority Contracting, Employment of the
Disabled, Gay & Lesbian Policies, and Other Strength. KLD Diversity Concerns
include: Controversies, and Other Concern.

54
Employee relations score
(Number of KLD Employee Relations Strengths divided by total number of KLD
Employee Relations Strengths) minus (Number of KLD Employee Relations
Concerns divided by total number of KLD Employee Relations Concerns). KLD
Employee Relations Strengths include: Union Relations, Cash Profit Sharing,
Employee Involvement, Retirement Benefits Strength, Health and Safety Strength,
and Other Strength. KLD Employee Relations Concerns include: Union Relations,
Health and Safety Concern, Workforce Reductions, Retirement Benefits Concern,
and Other Concern.
Environment score
(Number of KLD Environment Strengths divided by total number of KLD
Environment Strengths) minus (Number of KLD Environment Concerns divided
by total number of KLD Environment Concerns). KLD Environment Strengths
include: Beneficial Products and Services, Pollution Prevention, Recycling, Clean
Energy, and Other Strength. KLD Environment Concerns include: Hazardous
Waste, Regulatory Problems, Ozone Depleting Chemicals, Substantial Emissions,
Agricultural Chemicals, Climate Change, and Other Concern.
Human rights score
(Number of KLD Human Rights Strengths divided by total number of KLD
Human Rights Strengths) minus (Number of KLD Human Rights Concerns
divided by total number of KLD Human Rights Concerns). KLD Human Rights
Strengths include: Indigenous Peoples’ Relations, Labor Rights, and Other
Strength. KLD Human Rights Concerns include: Burma Concern, Labor Rights,
Indigenous Peoples’ Relations, and Other Concern.
Product score
(Number of KLD Product Strengths divided by total number of KLD Product
Strengths) minus (Number of KLD Product Concerns divided by total number of
KLD Product Concerns). KLD Product Strengths include: Quality,
R&D/Innovation, Benefits to Economically Disadvantaged, and Other Strength.
KLD Product Concerns include: Product Safety, Marketing/Contracting, Antitrust,
and Other Concern.
A.3. Firm characteristics
Size The logarithm of book value of total assets.
Cash Flow The ratio of (“IBC”+“DP”) over total assets.
Dividends The ratio of cash dividends (“DVC”+“DVP”) over total assets.
Leverage The ratio of long-term debt (“DLTT”) over total assets.
Sale growth The ratio of (salet - salet-1) -1
Capital expenditures Capital expenditures (“CAPX”) over total sales.
ROA Operating income (“OIBDP”) over total assets.
Market-to-book Market value of equity (“PRCC_F”) divided by book value of equity
(“BKVLPS”).
Tobin's q Market value of assets (book value of assets - book value of equity -
deferred taxes + market value of equity) over book value of total assets.
Industry-adjusted Tobin's q Tobin's q minus the median of Industry's Tobin's q
MSA-adjusted Tobin's q Tobin's q minus the median of MSA's Tobin's q
A.4. CEO and Board characteristics

55
CEO ownership The sum of CEO stock ownership and stock option ownership over total
share outstanding.
G index Defined in Gompers, Ishii, and Metrick (2003) and includes 24 corporate
charter provisions.
E index
Defined in Bebchuk, Cohen and Ferrell (2009) and comprises of classified
board, limits to shareholder bylaw amendments, poison pill, golden
parachute, supermajority requirements for mergers, and charter
amendments.
Duality Take value one if a CEO is also a president of the company, and zero
otherwise.
Staggered board Take value one if the firm has a staggered board provision, and zero
otherwise.
Board independence The number of independent directors divided by board size.
A.5. Other variables
State GDP growth (%) The annual estimated GDP growth rate in a state.
MSA GDP growth (%) The annual estimated GDP growth rate in a metropolitan statistical area.