Evidence from the World Bank’s Enterprise Survey … ANNUAL MEETINGS/2018... · 2018-03-15 ·...
47
Evidence from the World Bank’s Enterprise Survey SME Credit Availability Around the World: Evidence from the World Bank Enterprise Surveys Rebel A. Cole Dept. of Finance Florida Atlantic University Boca Raton, FL USA E-mail: [email protected] Phone: 561-297-4969 Andreas Dietrich Institute of Financial Services IFZ Lucerne University of Applied Sciences, Grafenauweg 10, 6304 Zug, Switzerland, E-mail: [email protected] DRAFT: Dec. 31, 2017
Transcript of Evidence from the World Bank’s Enterprise Survey … ANNUAL MEETINGS/2018... · 2018-03-15 ·...

Evidence from the World Bank’s Enterprise Survey
SME Credit Availability Around the World:
Evidence from the World Bank Enterprise Surveys
Rebel A. Cole
Dept. of Finance
Florida Atlantic University
Boca Raton, FL USA
E-mail: [email protected]
Phone: 561-297-4969
Andreas Dietrich
Institute of Financial Services IFZ
Lucerne University of Applied Sciences, Grafenauweg 10, 6304
Zug, Switzerland,
E-mail: [email protected]
DRAFT: Dec. 31, 2017

SME Credit Availability Around the World:
Evidence from the World Bank Enterprise Surveys
ABSTRACT:
In this study, we use data from the World Bank’s Enterprise Surveys of 133 countries
over the period from 2006 – 2014 to test the importance of governance to the availability of
credit. We model the credit-allocation process for SMEs into a sequence of three steps. Based
upon these three steps, we classify small businesses into four groups based upon their credit
needs. In a first step, we analyze which firms do, and do not, need credit. The No-Need firms
have received scant attention in the literature even though they typically account for more than
half of all small firms. We find that a No-Need firm is more likely to be owned by a foreigner;
and is more likely to be classified as a manufacturing or chemicals company, and that firms
located in developing, but not developed, countries with better governance are less likely to need
credit.
In a second step, we analyze Discouraged firms—those which reported a need for credit
but failed to apply because they feared being turned down or thought that interest rates and
collateral requirements were too unfavorable. Like No-Need firms, Discouraged firms have
received scant attention in the literature. Discouraged firms typically outnumber firms that apply
for and are denied credit. Among firms that need credit, we find that a Discouraged firm is both
younger and smaller; is much less likely to be organized as a corporation; and is less likely to run
by an experienced management team. We also find that firms located in countries with better
governance are less likely to report that they are Discouraged, both in developed and in
developing countries.
In our third step, we analyze firms that applied for credit and either were turned down
(Denied firms) or were extended credit (Approved firms). Among firms that apply for credit, we
find that a Denied firm is both younger and smaller; is less likely to be organized as a
corporation; and is less likely to be run by more experienced management team. We also find
that firms located in countries with better governance are less likely to report that they were
Denied credit, both in developed and in developing countries.
From this evidence, we conclude that country-level governance plays a critical role in the
availability of credit to SMEs in both developed and developing countries.
Key Words: availability of credit; denied credit; discrimination; discouraged firm;
entrepreneurship; governance; small business; WBES
JEL Classification: G21, G32, J71, L11, M13

- 1 -
SME Credit Availability Around the World:
Evidence from the World Bank Enterprise Surveys
1 Introduction
Among small and medium enterprises (“SMEs”) around the world, which ones need
credit and which ones get credit? The answer to this query is of great interest not only to
SMEs, but also to SME creditors, customers and suppliers, as well as to policymakers and to
the economies in which these firms operate. Also important is how country-level governance
affects the availability of credit to SMEs, as policy-makers can implement changes that
improve governance, thereby affecting the availability of credit. In this study, we analyze
data from a series of surveys conducted by the World Bank in 133 countries during 2006-
2014 to provide new evidence on how to answer these questions.
The availability of credit is one of the most fundamental issues facing a small
business; therefore, it has received much attention in the academic literature (see, e.g., early
work by Petersen and Rajan, 1994; Berger and Udell, 1995; and Cole, 1998). Since the Great
Financial Crisis began in 2008, the issue of credit constraints faced by SMEs has been a
major concern of policymakers seeking to increase employment and improve economic
growth.
However, many small firms indicate that they do not need credit (“no-need” firms)
while others indicate that they needed credit but did not apply for credit (“discouraged”
firms). With a few notable exceptions, starting with Cole (2009), Brown et al. (2011), and
most recently, Cole and Sokolyk (2016), the existing literature largely has ignored “no-need”
firms. “Discouraged” firms—those that do not apply for credit because they expect to be
turned down—have received somewhat more attention in the literature (see, e.g., Han et al.
2009) than “no-need” firms, but not nearly as much as firms that actually apply for credit.
Many of the studies that have analyzed “discouraged” firms (see, e.g., Gropp et al 1997;
Berkowitz and White, 2004; and Berger et al., 2011) pool them with firms that actually

- 2 -
applied for, but were denied credit, making it difficult to draw clear inferences from these
studies.
In this study, we analyze these four groups of firms to shed new light upon their
similarities and differences around the world. We utilize data from the World Bank’s
Enterprise Surveys (“WBES”) over the period from 2006 – 2014 to estimate a sequential set
of three logistic regression models. First, a firm first decides if it needs credit (“no-need”
firms versus “need” firms). Second, a “need” firm decides if it will apply for credit
(“discouraged” firms versus “applied” firms”). Finally, an “applied” firm applies for credit
and then learns from its prospective lender whether it is successful in obtaining credit
(“approved” firms versus “denied” firms).
Beginning in 2006, the World Bank implemented a “Global Methodology” for its
SME surveys, which was designed to ensure a consistent definition of the population, a
consistent methodology of implementation and a common core questionnaire. This
methodology enables researchers to compare the results of surveys across countries and
years.1 Hence, the results of our study provide politicians, policymakers, and regulators with
new insights on how to tailor macroeconomic policy and regulations to help small businesses
obtain credit when they need credit. An important caveat is that our results are descriptive—
based upon cross-sectional surveys—so our findings should not be interpreted as providing
the basis for causal inference.
Our main findings can be summarized as follows. Overall, we find that a “no-need”
firm is more likely to be owned by a foreigner; and is more likely to be classified as a
manufacturing or chemicals company, and that firms located in developing, but not
developed, countries with better governance are less likely to need credit.
1 In addition, we use a set of year dummies and a set of macro-economic variables to control
for differences across time and economic development.

- 3 -
Among firms that need credit, we find that a “discouraged” firm is both younger and
smaller; is much less likely to be organized as a corporation; and is less likely to run by an
experienced management team. We also find that firms located in countries with better
governance are less likely to report that they are discouraged, both in developed and in
developing countries.
Among firms that apply for credit, we find that a denied firm is both younger and
smaller; is less likely to be organized as a corporation; and is less likely to be run by more
experienced management team. We also find that firms located in countries with better
governance are less likely to report that they were denied credit, both in developed and in
developing countries.
Why are these issues of importance? Small businesses are critical to economic growth
and employment. In the U.S., for example, the government reports that small firms account
for over half of all private-sector employment and produce almost two-thirds of net job
growth.2 Outside the U.S., Ayyagari et al. (2011) analyze data from 99 countries surveyed
during 2006-2010 and find that small firms with less than 250 employees account for about
almost two-thirds of all employment and almost 90% of job creation.
The importance of small firms in less developed countries where publicly traded firms
are less prominent is all but certain to be even larger. Therefore, a better understanding of
who needs credit and who gets credit can help policymakers to take actions that will lead to
more jobs and faster economic growth.
We contribute to the literature in at least four important ways. First, we provide the
first rigorous analysis of the differences in our four types of firms—non-borrowers,
discouraged borrowers, denied borrowers and approved borrowers—for a large international
sample of countries around the world. So far, researchers only have analyzed SMEs in the
2 See, “Frequently Asked Questions,” Office of Advocacy, U.S. Small Business
Administration (2010). For research purposes, the SBA and Federal Reserve Board define
small businesses as independent firms with fewer than 500 employees.

- 4 -
U.S. (Cole, 2009) and Europe (Brown et al., 2011). Moreover, our analysis spans the period
before, during and after the GFC, so we can shed new light on how the crisis impacted the
availability of SME credit.
Second, we provide an analysis of credit availability that properly accounts for the
inherent self-selection mechanisms involved in the credit application process: who needs
credit, who applies for credit conditional upon needing credit, and who gets credit,
conditional upon applying for credit. Most previous researchers except for Cole (2009) and
Brown et al. (2011) have ignored firms that do not need credit, and many have pooled
discouraged and denied firms. We find significant differences across these groups around the
world. Hence, our results shed new light upon the credit-allocation process.
Third, we provide evidence from the 2006 – 2014 WBES on the availability of credit
to small businesses using the World Bank’s “global methodology.” This contributes to the
growing literature on SME finance that has emerged from the cross-country World Bank
surveys of SMEs, including Beck et al. (2005, 2006, 2008); Chakravarty and Xiang (2009);
De la Torre et al. (2010 ); Ayyagari et al. (2011); Brown et al. (2011); Hanedar et al. (2014)
and Love and Peria (2015). Our study, however, focuses only on countries surveyed using the
global methodology.
Fourth, we contribute to the literature on how governance affects the availability of
credit to SMEs (Beck et al., 2005, 2006, 2008; Love and Peria, 2015). We find that firms
located in countries with better governance are less likely to need credit; are less likely to be
discouraged from applying for credit when they need credit; and are less likely to be denied
credit when they apply for credit.
In section 2, we briefly review the literature on the availability of credit, followed by a
description of our data in section 3 and methodology and our variables in section 4. Our
results appear in section 5 and we provide a summary and conclusions in section 6.

- 5 -
2 Related Literature
The literature on availability of credit to SMEs dates back at least to Wendt (1947),
but really came into prominence following the release of a series of nationally representative
surveys of SMEs in the U.S. conducted by the Federal Reserve Board beginning in the late
1980s. More recently, international interest in this area has grown following the release of a
series of international surveys of SMEs conducted by the World Bank. In general, these
studies focus on how the opacity of SMEs affects their ability to obtain new financing when
they need credit to fund their existing operations or new projects.
2.1 Studies using the Federal Reserve’s Survey of Small Business Finances
In a seminal article, Petersen and Rajan (1994) analyzes data on loan rates from the
1987 iteration of the Survey of Small Business Finances (SSBF) for evidence on how
relationships influence the availability of credit to small firms. The authors find that the
length of a relationship between a borrower and her bank decreases the rate she is charged.
Berger and Udell (1995) also analyzes data on loan rates from the 1987 SSBF, but
focused on lines of credit at small business in order to provide more compelling evidence on
the importance of relationships. The authors also find that the length of a relationship
between a borrower and her bank lowers the spread charged by the bank on her credit line.
Cole (1998) is the first study to analyze data from the 1993 SSBF and is the first to
focus on determinants of the loan turndown decision rather than of loan rates. Cole finds that
a pre-existing relationship between a prospective borrower and her bank increases the
likelihood that her bank approves the loan application, but also finds that the length of that
relationship is not important.
Chakraborty and Hu (2006) also uses data from the 1993 SSBF to analyze how
relationships affect a lender’s decision to secure lines of credit and other types of loans with
collateral. These authors find that the length of relationship decreases the likelihood of

- 6 -
collateral for a line of credit, but not for other types of loans. Previously, Berger and Udell
(1995) had shown that longer relationships reduced the likelihood of collateral being required
for lines of credit, using data from the 1987 SSBF.
Cole (2009) is the first study to focus on “no-need” firms, and to separate firms into
the four categories that we also use. He analyzes data from the 1993, 1998 and 2003 iteration
of the SSBFs and finds that “no-need” firms look very much like “approved” firms and that
“discouraged” firms differ from “denied” firms in a number of significant ways.
Han et al. (2009) analyzes discouraged SMEs in the U.S., using data only from the
1998 SSBF. These authors find that both the demographics of the entrepreneur, such as age
and personal wealth, and of the business, such as size and use of financial products, influence
discouragement. They also find that riskier borrowers are more likely to be discouraged,
which they interpret as an “efficient self-rationing mechanism.”
Chakravarty and Yilmazer (2009) uses data from the SSBFs to provide evidence on
the availability of credit to “discouraged,” “denied” and “approved” firms, but ignore “no-
need” firms that constitute more than half of all SSBF firms. These authors find that various
measures of the strength of the relationship between a firm and its prospective borrower are
associated with a higher likelihood of applying for credit and, conditional upon applying a
higher likelihood of obtaining credit.
Cole and Sokolyk (2016) extend Cole (2009) by focusing on “no-need” and
“discouraged” firms. They find that about half of all small firms report no need for credit
even in times of recession, and, in a counterfactual exercise, that one in three discouraged
borrowers would have received credit had they applied for credit.

- 7 -
2.2 Studies using the World Bank’s SME Surveys
The World Bank has catalogued more than 350 studies that use data from its SME
surveys;3 consequently, we will review only some of the most prominent of published
studies.
Beck et al. (2005) uses data from World Bank surveys of more than 4,000 SMEs in 54
countries to analyze whether financial, legal and corruption obstacles affect firm growth
rates. These authors find that it is growth of the smallest of firms that are consistently most
affected by all three types of obstacles.
Beck et al. (2006) uses data on more than 10,000 firms in 80 countries to examine
financial obstacles faced by SMEs. This study finds that older, larger, and foreign-owned
firms report fewer financing obstacles; and that institutional development is the most
important factor in explaining cross-country differences in financing obstacles.
Beck et al. (2008) uses data on more than 3,000 firms from 48 countries to analyze
how financial and institutional development affects firm-level financing at SMEs. This study
finds that, in countries with poor institutions, firms use less finance, especially from banks;
and that small firms, in general, use less bank finance.
De la Torre et al. (2010) uses data from World Bank’s SME surveys to provide
evidence on bank involvement in SME finance. This study finds that all sizes of banks cater
to SMEs, and that large banks have comparative advantages in offering many products.
In the study closest to ours, Brown et al. (2011) follows the general methodology of
Cole (2009). Their firm-level data come from the 2004/2005 and 2008 waves of the Business
Environment and Enterprise Performance Survey (BEEPS). These authors look at 20
countries in Eastern and Western Europe prior to, whereas we look at 133 countries around
the world after, implementation of the “Global Methodology” that ensures consistency across
surveys. They find that small and financially opaque firms are less likely to apply for credit,
3 See http://www.enterprisesurveys.org//Research.
- 8 -
while firms with more financing needs are more likely to apply for credit. Most interestingly,
they also find that firms applying for credit rarely are denied credit.
Chakravarty and Xiang (2013) use data on more than 8,000 firms from ten countries
to analyze discouraged firms. Their firm-level data come from the 2002/2003 waves of the
Business Environment and Enterprise Performance Survey (BEEPS). These authors find that
discouraged firms differ across developed and developing countries; and that larger firms,
more transparent firms, and firms with stronger banking relationships are less likely to be
discouraged.
Hanedar et al. (2014) use data from the World Bank Business Environment and
Enterprise Performance Survey (BEEPS) to investigate what determines collateral
requirements for SMEs in less-developed countries. Not surprisingly, they find that firm-level
variables, especially measures of risk, are more important than country-level variables in
determining collateral requirements.
La Porta and Shleifer (2014) use data from the WBES and other sources to establish a
set of stylized facts about the informal economies in developing countries. They find that the
informal economies: are large, accounting for as much as half of the total economy in the
poorest countries; have low productivity as compared to the formal economies; are largely
disconnected from formal economies; and shrink as countries grow and develop.
Love and Peria (2015) uses data from the WBES to analyze how bank competition
affects the access of SMEs to finance. They find that low levels of competition reduce such
access, and that the impact depends upon the existence and coverage of mechanisms for
sharing credit information, such as public credit registries.
3 Data
To conduct this study, we use data from the World Bank’s Enterprise Surveys. The
World Bank conducted these surveys in 135 countries between 2006 and 2014 and provides

- 9 -
117,358 firm-year observations. In order to focus on SMEs and to be consistent with the
studies that analyze the SSBFs, we only use data from firms with less than 500 employees
according to the definition of SMEs in the U.S. We also delete data from two countries for
which we cannot obtain governance data. This reduces our final sample to 106,611 firm-year
observations from 133 countries over the 2006 – 2014 period. Appendix Table 1 identifies
the number of observations in our sample by country and shows the year of the WBES for
each country.
The WBESs collect information about the business environment, how it is perceived
by individual firms, how it changes over time, and about the various constraints to firm
performance and growth. In each country surveyed, the WBESs collect firm-level data on a
representative sample in the non-agricultural, formal private economy in the manufacturing,
services, transportation, and construction sectors; the surveys explicitly exclude firms in the
public-utilities, government-services, health-care, and the financial-services sectors.
Besides the consistent definition of the population, the methodology of
implementation and core questionnaire have served as foundation for the so-called “Global
Methodology” under which the various surveys have been conducted. Because the
standardized approach of the Global Methodology was implemented beginning in 2006, it is
possible to compare the surveys across countries and years.
The data collected through the surveys include quantitative as well as qualitative
information. World Bank representatives conducted face-to-face interviews with company
owners and managers in order to gather information on their firms and the business
environment in each country. The surveys address a broad range of topics, such as general
information on the company, infrastructure, services, crime, finance, and labor.
One key limitation of the WBESs is the fact that most of the data gathered in the
survey are based on subjective perceptions of the owners and managers of the firms, with the
exception of some company figures. Another is the fact that the WBESs do not provide some

- 10 -
key information about firms that typically are required by banks when a company applies for
a loan—performance indicators, such as the profitability, debt-equity-ratio, margins, etc. are
not included in the data. Even so, the WBESs provide detailed information about each firm's
most recent borrowing experience. This includes whether or not the firm applied for credit
and, if the firm did not apply, did it fail to apply because it feared its application would be
rejected (discouraged borrowers).
We also use data from the World Bank’s Worldwide Governance Indicators, which
provides annual country-level indicators of governance for 1996-2014.4 There are six
governance indicators: (1) voice and accountability, (2) political stability and absence of
violence/terrorism, (3) government effectiveness, (4) regulatory quality, (5) rule of law, and
(6) control of corruption. These six aggregate indicators are based on World Bank staff’s
analysis of hundreds of underlying variables that come from a numerous sources. Each
indicator is expressed in standard normal units ranging from -2.5 to +2.5. These six indicators
also are highly correlated within each country, with correlation coefficients greater than 0.6.
Consequently, we calculate an annual country-level average of the six, which we label
GovIndex.
Finally, we would like to control for country-level differences in the supply of credit.
To accomplish this, we gather data from the World Bank’s World Development Indicators
database on bank credit to the private sector as a percentage of GDP, which we label
PrivCredit.5
4 Methodology and Model Specification
4.1 Model Specification
In order to analyze characteristics of firms that need credit, apply for credit and get
credit, we follow the methodology of Cole (2009) and Cole and Sokolyk (2016). First, we
4 These data are available at www.govindicators.org 5 These data are available at http://data.worldbank.org/data-catalog/world-development-indicators.

- 11 -
classify firms into one of four categories based upon their responses to questions regarding
their most recent loan request during the previous years:
(1) “No-Need” Firms: the firm did not apply for credit during the previous three years
because the firm did not need credit.
(2) “Discouraged” Firms: the firm did not apply for credit during the previous year
because the firm feared rejection, even though it needed credit.
(3) “Denied” Firms: the firm did apply for credit during the previous three years but
was denied credit by its prospective lender(s).
(4) “Approved” Firms: the firm did apply for credit and was approved for credit by its
prospective lender.
Once we have classified our sample firms, we calculate descriptive statistics for each
group of firms and test for significant differences across categories, e.g. differences between
“no-need” firms and “need-credit” firms. We also conduct multivariate tests on the data,
estimating logistic regression models that explain the sequential selection of the loan
application and approval process. First, a firm decides whether it needs credit. We include
firms from all four groups in this analysis, and define Need Credit as equal to zero for “no-
need” firms and a value of one to all other firms (“discouraged”, “denied,” and “approved”
firms).
Second, a firm that needs credit decides whether to apply for credit. We exclude “no-
need” firms from this model and define Apply for Credit as equal to zero for “discouraged”
firms and equal to one for firms in one of the two groups that applied for credit (“denied” and
“approved” firms).
Third, a firm that decides to apply for credit is either approved or denied credit by its
prospective lender. In this stage of the model, we include only those firms that applied for
credit and define Get Credit as equal to zero for “denied” firms and equal to one for
“approved” firms.

- 12 -
We estimate this three-step sequential model using a set of three weighted logistic
regression models. We use logistic regression because our dependent variables are binary
(i.e., they take on a value of zero or one), so that ordinary least squares is inappropriate. We
use the sampling weights provided by the World Bank because the samples are stratified
random samples rather than simple random samples, so that certain types of firms were
oversampled and have different selection probabilities. We cluster robust standard errors at
the country level.
In addition to analyzing our full sample, we also analyze separately firms from
developing and developed countries. We categorize countries in developing and developed
countries based upon the World Bank income classification. Developing countries include the
countries classified as low-income and lower middle-income, while developed countries
include those in the categories of upper middle-income and high-income. In line with the
results of Beck et al. (2008), we expect firms in developed countries to face fewer difficulties
in obtaining a credit, as the financial sector in these countries is usually further developed.
4.2 Dependent variables
In this section, we explain in detail our classification criteria for each borrower type
with reference to specific WBES questions.
No-Need: We classify a firm as No-Need if (i) it reported that it did not apply for
credit during the last complete fiscal year and (ii) answered “No need for a loan -
establishment has sufficient capital” when asked about the main reason of absence of a credit
application on question K.17 of the WBES (2006-2014) questionnaire. All other firms are
classified as Need-Credit firms.
Discouraged: We classify a firm as Discouraged if (i) it is first classified above as
Need-Credit firm and (ii) it reported that it did not apply for credit during the last complete
fiscal year and (ii) it answered with

- 13 -
“Application procedures for loans or line of credit are complex,”
“Interest rates are not favorable,”
“Collateral requirements for loans or line of credit are unattainable,”
“Size of loan and maturity are insufficient,”
“Did not think it would be approved,” or
“Other,”
when asked about the main reason of absence of a credit application on question K.17 of the
WBES (2006-2014) questionnaire. We classify all other Need-Credit firms as Applied firms,
as they did apply for credit.
Denied: We classify a firm as Denied if (i) we classify it above as an Applied firm
because it reporting that it applied for credit during the last complete fiscal year and (ii) it did
not report having credit at the time of the interview. These firms are identified using
questions K.16 (application of credit during last complete fiscal year), K.8 (existence of
credit at this time), and K.10 (year of approval of existing credit) of the WBESs (2006 –
2014).
Approved: We classify a firm as Approved if (i) we classify it above as an Applied
firm because it reported that it applied for a loan during the last fiscal year, (ii) it reported that
it had credit at the time of the interview, and (iii) that it reported that a credit was granted to
the firm during the last complete fiscal year or in the current year by its prospective lender(s).
4.3 Independent variables
For explanatory variables, we generally follow the existing literature on the
availability of credit, which hypothesizes that a lender is more likely to extend credit to a firm
when that firm shares characteristics of other firms that historically have been most likely to
repay their credits. We expect that the same set of characteristics should explain no-need
firms relative to need firms; applied firms relative to discouraged firms; as well as approved

- 14 -
firms relative to denied firms. For No-Need firms, we assume that they do not apply for
additional credit because they are operating at their optimal capital structure. Consequently,
we look to the pecking-order theory (Myers and Majluf, 1984; Myers, 1984) and trade-off
theory (Kraus and Litzenberger, 1973) of capital structure to explain differences in No-Need
and Need-Credit firms.
4.3.1 Firm Characteristics
Firm characteristics include public reputation as proxied by firm age; firm size as
measured by the total number of employees; the legal form; and firm industrial classification
as measured by a set of dummy variables.
We expect that the age of a firm, measured by the number of years since the firm
started its operations, is a positive influence on the availability of credit. Older firms are
thought to be more creditworthy because they have survived the high-risk start-up period in a
firm’s life cycle and, over time, have developed a public track record that can be scrutinized
by a prospective lender. Hence, firm age can be used as a proxy for the firm’s reputation.
Beck et al. (2006) argue that older firms report fewer financing issues.
Larger firms, as measured by number of total employment, are thought to be more
creditworthy because they tend to be better established and typically are more diversified
than are smaller firms. Beck et al. (2006) and Aterido et al. (2007) find that micro and small
firms face more obstacles in accessing finance than do large firms. We use the logarithm of
the number of employees.
We also use information on legal form of organization to classify firms as
corporations, proprietorships and partnerships.
We classify firms by industry using a set of dummy variables: one each for
construction,6 food, textiles,7manufacturing,8 retail_wholesale trading companies, chemicals,
6 Construction includes firms classified in the construction and transportation industries.

- 15 -
metals, transport, services and other services. Firms in chemicals, construction,
manufacturing, metals and transport industries are thought to be more creditworthy because
they typically have more tangible assets that can be pledged as collateral than do firms in
more service-oriented industries.
4.3.2 Owner Characteristics
Our vector of owner characteristics includes variables such as the experience of the
top manager in this sector, the gender of the owner as measured by dummy variables for
female- or male-owned firms; and dummy variables for domestic-owned or foreign-owned
firms.
We include a variable measuring the experience of the top manager in this sector in
years. The more experienced is a top manager, the better is her track record and, thus, the
better is her creditworthiness expected to be.
The gender of the firm owner variable takes into account whether there are any
females amongst the owners of the firm. We have no expectations regarding indicators for
firms with female owners, even though Muravyev et al. (2009) argue that the probability that
female-managed firms obtain credit is lower than with male-managed firms. We include this
variable in an effort to ascertain whether minority-owned firms are experiencing disparate
outcomes in the credit markets relative to firms whose controlling owners are males.
Furthermore, we include a dummy variable regarding foreign and domestic
ownership. The company is “foreign-owned” if private foreign individuals, companies or
organizations own 50% or more of the firm. The results of this variable might heavily depend
on the country of the owner and the country in which the firm is acting. Generally, we expect
7 Textiles includes firms classified in the textiles, leather and garments industries.
8 Manufacturing includes firms classified in the metals & machinery, electronics, chemicals & pharmaceuticals,
wood & furniture, non-metallic & plastic materials, auto & auto components, and other manufacturing
industries.

- 16 -
that a lender perceives a domestic owner to be more creditworthy because it should be easier
for a lender to gather information on domestic than on foreign owners; in addition, it should
be easier to collect unsecured debt from a domestic owner.
4.3.3 Market/Environmental Characteristics
We include two country-level: govindex and bankcred, which we defined earlier. 9 We
expect that firms are more likely to be discouraged when governance, such as the level of
corruption, is worse, and we expect that firms are more likely to be denied when governance,
such as the rule of law, is worse. We have no a priori expectations about how governance
would affect the need for credit. We expect that credit supply as measured by bank credit to
the private sector as a percentage of GDP should positively affect the need for credit, and
reduce both discouragement and denials of credit. Table 1 gives a brief overview and
description of the variables used in our analysis.
5 Results
5.1 Descriptive Statistics and Univariate Results
Table 2 presents descriptive statistics for the full sample, and, separately, for firms
that need credit and for firms that have no need for credit, along with t-tests for differences in
means of these two groups. We first describe the full-sample means and then discuss the
differences in the means of the t-tests.
5.1.1 Full Sample
The averages for our full sample appear in column 2 of Table 2. The average firm in
our sample has been in business for 16.6 years. By employment size, the average firm in our
sample (median) has fewer than 20 employees. By legal form of organization, 47 percent of
9 We do not include GDP per capita (or other country-level governance variables) in our regressions because
these variables are highly correlated. For example, in our sample of countries, the governance index and GDP
per capita have a highly significant correlation of 0.65.

- 17 -
the firms organize as corporations while 54 percent organize as proprietorships (35%),
partnerships (16%), or “other” (3%)10.
By industry, 24 percent of the firms are each in manufacturing and services, 4 percent
are in chemicals, 8 percent are each in food, textiles and metals, 18 percent are in retail and
wholesale trade, 1 percent in each construction and transport and 4 percent in other services.
Regarding the owner characteristics, the top manager has, on average, 17.6 years of
experience in this sector. By ownership, 92 percent of the firms are domestic, while the
remaining 8 percent are foreign-owned. Foreign ownership refers to the nationality of the
shareholders. If the primary owner is a foreign national resident in the country, it is still a
foreign owned firm. At least one of the owners is a female at 29 percent of the firms.
The average Governance Index of the 133 countries in the sample is -0.394, while the
average Bank credit to GDP ratio is 38.9 percent. Looking at the distribution by survey year,
13 percent of the firm-year observations come from 2006, 8 percent from 2007, 3 percent
from 2008, 16 percent in 2009, 13 percent from 2010, 3 percent from 2011, 6 percent from
2012, 23 percent from 2013 and 15 percent from 2014. Because of the standardized approach
of the Global methodology implemented in 2006, it is possible to compare the various
indicator sets across various countries and different years.
10 The missing 3% answered “don’t know” and “other”

- 18 -
5.1.2 No-Need Firms versus Need Credit Firms
In columns 3 and 4 of Table 2 are the averages for our “No-Need” and “Need”
subsamples, respectively; the difference in mean appears in column 5, followed in column 6
with a t-statistic for a significance test on the difference in means shown in column 5. Most of
the firm characteristics are significantly different for the subsamples of firms that need credit
(“discouraged,” “denied,” and “approved”) and firms that have “no need” for credit.
Overall, 56 percent of all companies needed credit while 44 percent did not. This
result is very similar from the U.S., where Cole (2009) reports that 55 percent of all
companies needed credit.
When compared to a firm with no need for credit, a firm needing credit is less likely
to be organized as a corporation (46% vs. 47%) and a partnership (15% vs. 16%), and more
likely to organized as a proprietorship (34% vs. 36%). By industry, it is less likely to be in the
construction (10% vs. 11%), retail/wholesale trade (17% vs. 19%), services (23% vs. 26%)
and transport (1% vs. 2%) sectors, and more likely to be in the manufacturing (25% vs. 23%),
chemicals (5% vs. 4%), food (8% vs. 7%), metals (8.5% vs. 8%), and textiles sectors (8% vs.
6%).
By ownership characteristics, a firm in need of credit is more likely to be domestic-
owned (94% vs. 91%) and female-owned (30% vs. 27%), and has a less experienced
management (17.3 years vs. 17.9 years).
By market characteristics, a firm in need of credit is more likely to be located in a
country with a lower Governance Index (-0.41 vs. -0.38) and a lower ratio of Bank Credit to
GDP (37.8% vs. 40.3%).
5.1.3 Discouraged versus Applied Firms
Table 3 presents averages for all firms that need credit, and then, separately, for firms
that applied for a credit and for discouraged firms, i.e., for firms that needed credit but did not

- 19 -
apply because they feared rejection, along with a t-test for differences in means of these two
groups.
Overall, 53% of the 62,928 firms that needed credit were discouraged. This is
significantly more than in the U.S. (28%; Cole, 2009), Western Europe (17%; Brown et al.,
2011) and also Eastern Europe (40%; Brown et al., 2011).
Relative to a “discouraged” firm, an “applied” firm has significantly more employees,
is older (17.5 vs. 15.7 years), and more likely to be organized as a corporation (62% vs.
32%). By industry, an “applied” firm is more likely to be in the chemicals (5% vs. 4%), food
(9% vs. 8%), and services (24% vs. 23%) sectors, and less likely to be in the manufacturing
(24% vs. 25%), construction (0.6% vs. 1.3%), metals (7% vs. 9%), Retail_Wholesale (16%
vs. 17%), textiles (8% vs 9%) and transport (1% vs. 2%) sectors.
By owner characteristics, an “applied” firm has more experienced management (19 vs.
15.9 years), is more likely to be foreign-owned (7.2% vs. 5.7%), and is more likely to have a
female owner (35% vs. 26%).
By market characteristic, an “applied” firm is significantly more likely to be located in
a country with a higher Governance Index value (-0.26 vs. -0.53) and higher bank credit to
GDP ratio (42% vs. 35%).
5.1.4 Approved Firms versus Denied Firms
Table 4 presents descriptive statistics for firms that applied for a credit, and then,
separately, for firms that were turned down (“denied” firms), and for firms that received
credit (“approved” firms), along with the difference in these two means and a t-test for
significant differences in means.
Overall, 30% of the firms applying for credit were turned down by their prospective
lenders. By comparison, Cole (2009) reports that only 11% - 22% of the U.S. firms applying
for credit were turned down. Hence, credit around the world appears to be tighter than in the
U.S.

- 20 -
When compared with a “denied” firm, we find that an “approved” firm is significantly
older (18.1 vs. 16.3 years) and larger. Furthermore, approved firms are more likely to be
organized as corporations (66% vs. 51%) and less likely to be organized as Partner (11.4%
vs. 14.1%) and as Proprietorship (19% vs. 25%). By industry, firms that are granted a credit
are less likely to be in the manufacturing (23.5% vs. 25%), construction (0.5% vs. 0.9%),
services (23% vs. 26%), transports (0.7% vs. 0.9%) and retail/wholesale trade (16% vs. 17%)
sectors, and more likely to in the chemicals (6% vs. 4%), food (9% vs. 8%), textiles (8% vs.
7%) and metals (8% vs. 7%) sectors.
By owner characteristics, an “approved” firm has significantly more managerial
experience (19.7 vs. 17.5 years), is significantly more likely to be domestic-owned (9.3% vs.
9.2%) and is significantly more likely to have a female owner (36.8% vs. 31.0%).
By market characteristics, an “approved” firm is significantly more likely to be
located in a country with a higher Governance Index (-0.19 vs. -0.40), and a higher bank
credit to GDP ratio (43.6% vs. 36.6%).
5.2 Multivariate Results
5.2.1 Need-Credit Firms vs. Need-No-Credit Firms
In Table 5, we present our multivariate results from estimating the logistic regression
models explaining who needs credit, as described in section 4.2. The dependent variable No-
Need is equal to one if the firm indicated that it did not need credit and equal to zero for firms
indicating a need for credit (including “discouraged,” “denied,” and “approved” firms). In
column 2, we present results for the full sample, while in columns 3 and 4, we present results
for our developing and developed subsamples, respectively. Rather than present logit
coefficients, which are uninformative other than sign, we exponentiate these coefficients to
obtain the “odds ratios” associated with each variable. This enables us to talk about the
magnitude of effects. An odds ratio greater than 1.00 indicates that a firm with that

- 21 -
characteristic is more likely to need no credit, whereas an odds ratio less than 1.00 indicates
that a firm with that characteristic is less likely to need no credit. Alternatively, one divided
by the odds ratio for being a no-need firms gives the odds ratio of being a firm that needs
credit.
In Column 2, we show the results for firms that need credit versus firms that do not
need credit. Among the firm characteristics, only industry indicators for manufacturing and
chemical firms are statistically significant. Firms in these two industries are about 30% more
likely to need credit than are firms in other industries. Among the owner characteristics,
foreign-owned firms are about 35% less like to need credit than are domestic-owned firms.
Neither of our market characteristics is significantly different from zero at standard levels of
significance but the odds ratio of GovIndex is 1.21, indicating that firms located in countries
with better governance are less likely to need credit (p-value=0.12). Among our year
indicators, the odds ratios for 2008-2011 are in the range of 0.60-0.70 indicating that firms
were about 50% more likely to need credit during these crisis years, but only the coefficients
for 2008 and 2010 are statistically significant at the 10% level or better.
Column 3 presents the results for our developing country subsample. Among the firm
characteristics, the coefficient on the indicator for corporations is significant and its
associated odds ratio indicates that corporations are about 30% more likely to need credit
than firms with other legal forms of organization. This is consistent with the limited liability
provided by the corporate form of ownership. Six of the industry indicators are statistically
significant. Firms classified as manufacturing, chemicals, construction, metals, services and
textiles are more likely to need credit. For all but services, this result is consistent with the
greater amount of tangible assets in these industries; for services, this result is counter-
intuitive and suggests that factors other than tangibility of assets are driving the need for
credit at service firms. Among the owner characteristics, foreign-owned firms are much less
likely to need credit than are domestic-owned firms and female-owned firms are more likely

- 22 -
to need credit than are male-owned firms. Both of our market characteristics is significantly
different from zero at the 10% level of significance. The odds ratio of GovIndex is 1.36,
indicating that firms located in developing countries with better governance are less likely to
need credit (p-value=0.04). The odds ratio of BankCred indicates that firms located in
countries where banks provide more credit to the private sector are less likely to report a need
for credit, most probably because their credit needs already have been met.
Among our year indicators, the coefficients for 2008, 2013 and 2014 are highly
significant and the associated odds ratios are in the range of 1.60-3.1, indicating that firms
were much less likely to need credit during these years. This finding suggests that the
financial crisis had a very different impact on firms in developing countries as compared with
firms in developed countries.
Column 4 presents the results for our developed country subsample. Among the firm
characteristics, the coefficient on our firm size proxy is significant at the 10% level and its
associated odds ratio indicates that larger firms are significantly more likely to need credit
than are smaller firms. This finding is consistent with what Cole (2009) reports for SMEs in
the U.S. Only two of the industry indicators are statistically significant—the same as in the
full sample—manufacturing and chemicals. Among the owner characteristics, foreign-owned
firms are much less like to need credit than are domestic-owned firms and female-owned
firms are more likely to need credit than are male-owned firms.
Neither of our market characteristics is significantly different from zero at standard
levels of significance but the odds ratio of GovIndex is 1.15, indicating that firms located in
countries with better governance are less likely to need credit. Among our year indicators, the
odds ratios for 2008-2011 are in the range of 0.50-0.70 indicating that firms were about 50%
more likely to need credit during these crisis years, and the coefficients for these year
indicators are statistically significant at the 10% level or better. In combination with the
results for year dummies from the developing country subsample, this shows that the full-

- 23 -
sample results for the year dummies are driven almost entirely by the developed country sub-
sample.
5.2.2. Discouraged Firms vs. Applied Firms
In Table 6, we present our multivariate results from estimating the logistic regression
models explaining which firms reported being discouraged from applying for credit. The
dependent variable Discour is equal to one if the firm indicated that it needed credit but was
discouraged from applying and equal to zero if the firm indicated that it needed credit and
that it applied for credit (including “denied” and “approved” firms). In column 2, we present
results for the full sample, while in columns 3 and 4, we present results for our developing
and developed subsamples, respectively.
Among the firm characteristics, the coefficient on our firm size proxy is significant at
the 1% level. Its odds ratio of 0.55 indicates that larger firms are significantly less likely to be
discouraged from applying for a credit than smaller firms. Older firms are significantly more
likely to be discouraged to apply for a credit. This is in contrast to the opposite relation
reported by Cole (2009) for U.S. firms. The coefficient of our indicator for corporate legal
form of ownership is statistically significant and its associated odds ratio indicates that
corporations are about 40% less likely to be discouraged from applying for credit. Four of our
industry indicators are statistically significant. Firms classified as manufacturing,
construction, food and textiles are more likely to be discouraged from apply for credit.
Among our owner characteristics, firms with more experienced management are less likely to
be discouraged borrowers than firms with a management with less experience.
Among our market characteristics, GovIndex is statistically significant at better than
the 0.1% level. The associated odds ratio of 0.44 indicates that firms located in countries with
a better governance are much less likely to be discouraged from applying for a credit. A one

- 24 -
standard deviation improvement in governance reduces the odds of being discouraged by
about 55 percent.
Among our year indicators, the coefficients for 2007 and 2014 are highly significant,
and the odds ratios indicate that firms were much more likely to be discouraged from
applying for credit during these years.
Columns 3 and 4 of Table 6 present results for our regression model when we split
our sample into developed and developing countries, respectively. As in our full model, we
find a positive relation between firm size and “applying for a credit” in both subsamples, with
the odds ratio indicating a stronger relation in developed (0.54) than developing (0.63)
countries. Furthermore, the coefficient of the legal form of “corporations” is statistically
highly significant in the full model and in the separate estimations for developing and
developed countries with similar odds ratio between 0.56 and 0.61.
We find some differences between our subsample of developing and developed
countries for the industry indicators. In developing countries, firms classified as chemicals
and transport are less likely to be discouraged while firms classified as construction are more
likely to be discouraged to apply for a credit. In developed countries, industry indicators for
manufacturing, construction, food and textiles are statistically significant. Firms in these four
industries are more likely to be discouraged from applying for credit than are firms in other
industries.
Among the ownership characteristics, firms with a more experienced management are
less likely to be discouraged firms in developed countries. In developing countries, ownership
does not have an influence on whether a firm applies for a credit or if it was discouraged and
did not apply.
By market characteristics, we find a negative relation between the Governance index
variable and the discouraged firms in both developed and developing countries. The odds
ratios of 0.56 and 0.40 indicate that firms located in countries with better governance are

- 25 -
much less likely to be discouraged from applying for a credit. Furthermore, we see that the
results for the PrivCred variable are driven by developing countries as we find a statistically
highly significant negative relation between this variable and discouraged firms.
We find some differences between developed and developing countries in the year
dummies. For 2007, the relation between the year and discouraged borrowers is statistically
highly significant and negative for only developing countries. For 2008 and 2011, are
insignificant for developing countries but positive and significant for developing countries.
For 2012, the coefficients are negative and significant for developed countries. Only for 2014
are the coefficients negative and significant for both subsamples.
5.2.3. Approved firms vs. Denied Firms
In Table 7, we present our multivariate results from estimating the logistic regression
models explaining which firms reported being denied credit when applying for credit. The
dependent variable Denied is equal to one if the firm indicated that it needed credit, applied
for credit, but was denied credit and equal to zero if the firm indicated that it needed credit,
applied for credit, and was approved for credit. In column 2, we present results for the full
sample, while in columns 3 and 4, we present results for our developing and developed
subsamples, respectively.
Overall, our analyses suggest that many firms in our sample were experiencing limited
access to credit. As mentioned above, 70% of the firms applying for credit have their
applications approved. Given this substantial share of firms that are a credit, it is worthwhile
looking closer at the determinants of loan rejection.
Among firm characteristics, we see that larger firms are significantly less likely to be
denied credit. This result confirms, among others, the findings of Beck et al. (2006) that
financing obstacles are higher for small firms than for large firms. The reason for this
relationship is that information asymmetries are expected to be greater for smaller firms, for

- 26 -
which there is less information available. Furthermore, larger firms are thought to be more
creditworthy because they tend to be better established and typically are more diversified
than are smaller firms. We also find that firms organized as corporations are less likely to be
denied credit.
By industry, firms in the metals sector are less likely to be denied credit than are firms
in the omitted category. Among the owner characteristics, only managerial experience has a
positive and statistically significant effect on the likelihood of approval.
Among the market characteristics, we find that firms in countries with a higher
governance index and a higher bank credit to GDP ratio are more likely to be granted a credit.
From this evidence, we conclude that country-level governance plays a critical role in the
availability of credit to SMEs. Good governance helps that SME have better access to loans.
Not surprising, another crucial determinant of credit availability is the economic
environment as proxied by our set of year dummies. Companies applying in times of turmoil
(2007) were significantly more likely to be turned down than in the years before or after the
crisis.
Columns 3 and 4 of Table 7 present results for our regression model when we split our
sample into developed and developing countries, respectively. As in our full model, we find a
negative relation between firm size and loan denial in both subsamples. The odds ratios
indicate a strong relation in both developed and developing countries. Similar results hold for
firms organized as corporations, for which we also find significantly positive relations of
similar magnitude in both subsamples.
Among ownership characteristics, a firm with a more experienced manager is
significantly less likely to be denied credit, and this relation also holds for developed, but not
for developing, countries. A firm with a foreign owner is much more likely to be denied
credit in developed countries (odds ratio = 3.69), but not in developing countries.
- 27 -
Among market characteristics, we find that a firm located in a country with a higher
governance index and a higher ratio of bank credit to GDP is significantly less likely to be
denied credit. Within our subsamples, these relations are significant only in developed
countries.
6. Conclusions
In this study, we use data on more than 100,000 SMEs in 133 countries surveyed by
the World Bank to analyze the availability of credit around the world. Following Cole (2009),
we classify firms into one of four mutually exclusive groups: no-need, discouraged, denied
and approved. As compared with results for the U.S. reported by Cole (2009), we find that
firms around the world are just about as likely to report a need for credit (55% vs. 56%).
However, among firms that need credit, international firms are much more likely to be
discouraged from applying for credit, even though they need credit; and are much more likely
to be denied credit when they need and apply for credit. In our sample, more than 50% of the
firms that reported a need for credit also reported that they did not apply because they were
discouraged, whereas in the U.S., the corresponding figure is about 30%. When we split our
sample into developed and developing countries, we find that 48% of the firms in developed
countries are discouraged, while 62% of the firms in developing countries are discouraged.
Firms are discouraged not only by subjective feelings, but also by unfavorable interest
rates and collateral conditions. However, the reason why a firm is discouraged from applying
for a loan is not fully clear. High interest rates and large collateral requirements may reflect
true impediments of promising firms and projects. On the other hand, high interest rates and
large collateral requirement might also be due to financial difficulties of the discouraged firm.
The subjective “feeling” of discouragement can be the result of the fact that a firm knows that
the probability of success of the relevant project is low, or because of non-economic reasons
such as discrimination.

- 28 -
In our sample, about 30% of the firms that applied were turned down, whereas in
U.S., the corresponding figure is less than 20%. In other words, credit is much less
“available” around the world than in the U.S., so that policies to improve the availability of
credit are even more important. Not surprisingly, the turndown rate was significantly higher
in developing countries (41%) than in developed countries (26%).
Overall, we find that a “no-need” firm is more likely to be owned by a foreigner; and
is more likely to be classified as a manufacturing or chemicals company, and that firms
located in developing, but not developed, countries with better governance are less likely to
need credit.
Among firms that need credit, we find that a “discouraged” firm is both younger and
smaller; is much less likely to be organized as a corporation; and is less likely to run by an
experienced management team. We also find that firms located in countries with better
governance are less likely to report that they are discouraged, both in developed and in
developing countries.
Among firms that apply for credit, we find that a denied firm is both younger and
smaller; is less likely to be organized as a corporation; and is less likely to be run by more
experienced management team. We also find that firms located in countries with better
governance are less likely to report that they were denied credit, both in developed and in
developing countries.
Our results suggest to policy-makers that the need for policies to foster credit access is
still one of the key issues in many countries, especially measures related to country-level
governance. Policies that improve governance should improve the availability of credit,
which, in turn, should improve economic growth and employment. Policy measures should
promote credit access, as many small firms (above all in certain industries) are discouraged
from applying for credit. These credit constraints might limit product development and
innovation by some firms, possibly harming long-term economic growth (see Levine, 2005,

- 29 -
for an overview of the literature supporting this relationship). As our results reveal, a policy
to increase information sharing and transparency (for example by external auditors) seem to
be an effective way to improve credit availability, as it reduces informational asymmetries
and significantly improves the probability of getting a credit. Still, the question remains
whether this large fraction of discouraged and denied borrowers reflects missed growth
opportunities, or if it is the result of a useful screening of weak applicants and, thus, points to
a more efficient allocation of credit.
We contribute to the literature in at least four important ways. First, we provide the
first rigorous analysis of the differences in our four types of firms: non-borrowers,
discouraged borrowers, denied borrowers and approved borrowers, for a large international
sample of countries around the world. So far, researchers only have analyzed SMEs in the
U.S. (Cole, 2009) and Europe (Brown et al., 2011). We also separately consider developing
and developed countries. Even though our study reveals some differences between
developing and developed countries, it also shows a number of interesting similarities and
patterns between these two groups.
Second, we provide an analysis of credit availability that properly accounts for the
inherent self-selection mechanisms involved in the credit application process: who needs
credit, who applies for credit conditional upon needing credit, and who gets credit,
conditional upon applying for credit. Most previous researchers, except for Cole (2009) and
Brown et al. (2011), have ignored firms that do not need credit, and many have pooled
discouraged and denied firms. We find differences across these groups. Hence, our results
shed new light upon the credit-allocation process.
Third, we provide evidence from the 2006 – 2014 WBES on the availability of credit
to small businesses using the World Bank’s “global methodology.” This contributes to the
growing literature on SME finance that has emerged from these surveys, including
Beck et al. (2005, 2006, 2008); De la Torre et al. (2010); Brown et al, (2011); Chakravarty
- 30 -
and Xiang (2013); and Love and Peria (2015). Our study, however, analyzes only those
surveys conducted under the “Global Methodology” implemented by the World Bank in 2006
to ensure comparability of surveys across years and countries.
Fourth, we contribute to the literature on how country-level governance affects the
availability of credit to SMEs (Beck et al., 2005, 2006, 2008; Love and Peria, 2015). We find
that firms located in countries with better governance are less likely to need credit; are less
likely to be discouraged from applying for credit when they need credit; and are less likely to
be denied credit when they apply for credit.
References
Aterido, R., Hallward-Driemeier, M., Pagés, C. (2007). Investment climate and employment
growth: the impact of access to finance, corruption and regulations across firms. IZA
Discussion Paper No. 3138.
Ayyagari, M., Demirguc-Kunt, A., Maksimovic, V. 2011. Small vs. young firms across the world
contribution to employment, job creation, and growth. World Bank Research Working
Paper No. 5631.
Beck, T., Demirgüç-Kunt, A., Laeven, L., Maksimovic, V. (2005). Financial and legal constraints
on growth: Does firm size matter? The Journal of Finance 60, 137-177.
Beck, T., Demirgüç-Kunt, A., Laeven, L., Maksimovic, V. (2006). The determinants of financing
obstacles. Journal of International Money and Finance 25, 932-952.
Beck, T., Demirgüç-Kunt, A., Laeven, L., Maksimovic, V. (2008). Financing patterns around the
world: Are small firms different? Journal of Financial Economics 89, 467-487.
Berger, A., Udell, G. (1995). Relationship lending and lines of credit in small firm finance.
Journal of Business 68, 351-381.
Bernanke, B., Gertler, M. (1989). Agency Costs, Net Worth, and Business Fluctuations. The
American Economic Review 79 (1), 14-31.
Brown, M., Ongena, S., Popos, A., Yesin, P. (2011). Who needs credit and who gets credit in
Eastern Europe? Economic Policy 65, 93-130.
Cavalluzzo, K.S., Cavalluzzo, L.C., (1998). Market structure and discrimination: The case of
small businesses. Journal of Money, Credit and Banking 30, 771–792.

- 31 -
Chakraborty, A., Hu, C. (2006). Lending relationships in line-of-credit and non-line-of-credit
loans: Evidence from collateral use in small business. Journal of Financial Intermediation
15, 86-107.
Chakravarty, S., Yilmazer, T. (2009). A multi-stage model of loans and the role of relationships.
Financial Management (Winter), 781-816.
Chakravarty, S., Xiang, M. (2013). The international evidence on discouraged small businesses.
Journal of Empirical Finance 20, 63-82.
Claessens, S., Demirgüc-Kunt, A., Huizinga, H. (2001). How does foreign entry affect domestic
banking markets? Journal of Banking & Finance 25, 891-911.
Cole, R. (1998). The importance of relationships to the availability of credit. Journal of Banking
& Finance 22, 959-997.
Cole, R. (2009). Who needs credit and who gets credit? Evidence from the surveys of small
business finances. In Small Business in Focus: Finance. A Compendium of Research by
the Small Business Administration Office of Advocacy, July, 95-133.
Cole, R., Mehran, H. (2011). Gender and the availability of credit to privately held firms:
Evidence from the Surveys of Small Businesses. FRB-New York Staff Study No. 383.
Cole, R., Sokolyk, T. (2016). Who needs credit and who gets credit? Evidence from the surveys
of small business finances. Journal of Financial Stability 24, 40-60.
De la Torre, A., Martinez Peria, M., Schmukler, S. (2010). Bank involvement with SMEs: beyond
relationship lending. Journal of Banking & Finance 34, 2280-2293.
Greene, W. 1992. A statistical model for credit scoring. NYU Working Paper # EC-92-29.
Greene, W. 1996. Marginal effects in the bivariate probit model. Working paper available at
http://ssrn.com/abstract=1293106.
Han, L., Fraser, S., Storey, D. (2009). Are good or bad borrowers discouraged form applying for
loans? Evidence from US small business credit markes. Journal of Banking & Finance 33,
415-424.
Hanedar, E., Broccardo, E., Flavio, B. (2014). Collateral requirements of SMEs: The evidence
from less-developed countries. Journal of Banking & Finance 38, 106-121.
Hope, O., Thomas, W., Vyas, D. (2011). Financial credibility, ownership, and financing
constraints in private firms. Journal of International Business Studies 42, 935-957.

- 32 -
Keeton, W., Morris, C. (1988). Loan losses and bank risk-taking: is there a connection? No 88-
04, Research Working Paper, Federal Reserve Bank of Kansas City.
Kiyotaki, N., Moore, J. (1997). Credit Cycles. Journal of Political Economy 105 (2), 211–248.
Kon, Y., Storey, D. (2003). A theory of discouraged borrowers. Small Business Economics 21,
Kraus, A., Litzenberger, R.H. 1973. A State-Preference Model of Optimal Financial Leverage.
Journal of Finance 28, 911-922.37-49.
La Porta, R, Shleifer, A. 2014. Informality and development. Journal of Economic Perspectives
28, 109-126.
Levine, R. (2005). Finance and growth: theory and evidence. In Aghion/Durlauf (eds.):
Handbook of Economic Growth, New York, 865-934.
Love, I., Peria, S. (2015) How bank competition affects firms’ access to finance. World Bank
Economic Review 29, 413-448.
Muravyev, A., Talavera, O., Schäfer, D. (2009). Entrepreneurs’ gender and financial constraints:
Evidence from international data. Journal of Comparative Economics 37, 270-286.
Myers, S., 1984. The capital structure puzzle. The Journal of Finance 39, 575-592.
Myers, S., Majluf, N., 1984. Corporate financing and investment decisions when firms have
information that investors do not have. Journal of Financial Economics 13, 187-221.
Petersen, M., Rajan, R. (1994). The benefits of lending relationships: Evidence from small
business data. The Journal of Finance 46 (1), 3-37.
Sinkey, J., Greenawalt M. (1991). Loan-loss experience and risk-taking behavior at large
commercial banks. Journal of Financial Services Research 5 (1), 43-59.
Van de Ven, W., Van Praag, B., The demand for deductibles in private health insurance: A probit
model with sample selection. Journal of Econometrics 17, 229-252.
Wendt, P. (1947). The availability of capital to small businesses in California. The Journal of
Finance 2 (2), 43-54.

- 33 -
Table 1: Definitions of variables used to explain who needs credit and who gets credit around the
world
Variables Description
Dependent variables
NoNeed Binary variable which takes on a value of 0 if the firm indicated that it
needed credit, and 1 if the firm needs a credit.
Discouraged Binary variable which takes on a value of 0 if the firm applied for credit
and was extended or denied credit and a value of 1 if the firm needs a
credit but was discouraged and did not apply for credit.
Denied Binary variable which takes on a value of 0 if the firm applied for and
was extended credit and a value of 1 if the firm applied for and was
denied credit.
Independent variables
Firm characteristics
Total Employment Firm’s size measured by the ln of the total employment.
Age Number of years since the firm started its operations.
Corp Dummy variable for firms that are organized as corporations.
Partner Dummy variable for firms that are organized as partnerships.
Proprietorship Dummy variable for firms that are organized as proprietorships.
Economic Sector Dummy variables for the sectors in which a firm is operating (chemicals,
construction, food, manufacturing, metals, textiles, transport,
retail-wholesale, services, and other services).
Owner characteristics
Female Owner Dummy variable for female-managed firms.
Male Owner Dummy variable for male-managed firms.
Domestic Owner Dummy variable with a domestic owner.
Foreign Owner Dummy variable with a foreign owner.
Experience Mgt Experience of the top manager in this sector in years.
Market/Environmental characteristics
Gov Index
The Governance Indicators as reported by the World Bank and
aggregated for six dimensions of governance (Voice and Accountability,
Political Stability and Absence of Violence, Government Effectiveness,
Regulatory Quality, Rule of Law, Control of Corruption).
Bank Credit The World Bank development indicator variable for bank credit to the
private sector as percentage of GDP (%).
Year Dummy variable for the year in which the survey was conducted.

- 34 -
Table 2: Descriptive statistics for the full sample and, separately, for Need and No-Need firms
No-Need is a binary variable that takes on a value of 0 if the firm indicated that it needed credit
during the previous year (applied for credit and was extended or denied credit; or was
discouraged and did not apply for credit) and a value of 1 if the firm did not apply for credit
because it reported that it did not need additional credit during the previous year. For each
variable in column 1, column 2 presents the mean for the full sample, while columns 3 and 4
present the means for No-Need and Need firms, respectively. Column 5 presents the difference in
the means of Need and No-Need firms, and column 6 presents the results of t-tests for
significance of the differences in means of these two groups of firms. Variables are defined in
Table 1. Data are from the World Bank Enterprise Surveys, and include 106,611 firm-year
observations from 133 countries over the 2006 – 2014 period.
*, **, *** indicate statistical significance at the 0.10, 0.05 and 0.01 levels, respectively.
(1)
Variable
(2)
All
(3)
No Need
(4)
Need
(5)
Difference
(6)
t-Statistic
Observations 111,647 48,719 62,928
Firm Characteristics
Log Total Employment 3.174 3.174 3.173 0.001 0.12
Age 16.585 16.600 16.575 0.025 0.33
Corporation 0.462 0.465 0.459 0.006 1.90 **
Partner 0.157 0.162 0.153 0.009 4.11 ***
Proprietorship 0.353 0.344 0.360 -0.016 -5.49 ***
Manufacturing 0.240 0.231 0.246 -0.015 -5.83 ***
Chemicals 0.047 0.046 0.048 -0.002 -1.55 *
Construction 0.010 0.011 0.010 0.001 2.21 **
Food 0.079 0.074 0.083 -0.009 -5.87 ***
Metals 0.082 0.080 0.083 -0.003 -1.87 **
Retail-Wholesale 0.179 0.192 0.169 0.023 9.71 ***
Services 0.246 0.263 0.233 0.030 11.47 ***
Textiles 0.075 0.065 0.083 -0.018 -11.70 ***
Transport 0.016 0.020 0.013 0.007 9.21 ***
Other 0.037 0.032 0.042 -0.010 -8.62 ***
Owner Characteristics
Female Owner 0.288 0.271 0.301 -0.030 -10.88 ***
Male Owner 0.712 0.729 0.699 0.030 10.88 ***
Foreign Owner 0.076 0.092 0.064 0.028 17.15 ***
Domestic Owner 0.924 0.908 0.936 -0.028 -17.15 ***
Experience Mgmt 17.610 17.917 17.372 0.545 7.59 ***
Market Characteristics
Gov Index -0.394 -0.377 -0.406 0.029 7.59 ***
Bank Credit 38.948 40.339 37.871 2.468 15.14 ***
Year2006 0.126 0.108 0.140 -0.032 -16.25 ***
Year2007 0.078 0.065 0.087 -0.022 -14.01 ***
Year2008 0.034 0.029 0.037 -0.008 -7.18 ***
Year2009 0.167 0.151 0.179 -0.028 -12.68 ***
Year2010 0.126 0.113 0.136 -0.023 -11.84 ***
Year2011 0.026 0.019 0.032 -0.013 -13.70 ***
Year2012 0.062 0.064 0.061 0.003 2.19 **
Year2013 0.231 0.285 0.190 0.095 36.77 ***
Year2014 0.148 0.163 0.136 0.027 12.50 ***

- 35 -
Table 3: Descriptive statistics for Need-Credit firms, Applied firms and Discouraged firms
Applied is a binary variable that takes on a value of 1 if the firm applied for credit and was
extended or denied credit and a value of 0 if the firm needs a credit but was discouraged and did
not apply for credit. Discouraged is a binary variable that takes on a value of 0 if the firm applied
for credit and was extended or denied credit and a value of 1 if the firm needs a credit but was
discouraged and did not apply for credit. Need firms include all Applied and Discouraged firms.
For each variable in column 1, column 2 presents the mean for Need firms, and columns 3 and 4
present the means for Applied firms and Discouraged firms, respectively. Column 5 presents the
difference in the means of Discouraged and Applied firms, and column 6 presents the results of
t-tests for significance of the differences in means. Variables are defined in Table 1. Data are
from the World Bank Enterprise Surveys, and include 106,611 firm-year observations from 133
countries over the 2006 – 2014 period, of which 62,928 indicated a need for credit.
*, **, *** indicate statistical significance at the 0.10, 0.05 and 0.01 levels, respectively.
(1)
Variable
(2)
Need
(3)
Applied
(4)
Discouraged
(5)
Difference
(6)
t-Statistic
Observations 62,928 29,413 33,515
Firm Characteristics
Log total employment 3.174 3.510 2.878 -0.631 -70.01 ***
Age 16.600 17.552 15.716 -1.836 -18.06 ***
Corporation 0.465 0.615 0.323 -0.292 -76.53 ***
Partner 0.162 0.122 0.180 0.058 20.55 ***
Proprietorship 0.344 0.229 0.475 0.246 67.17 ***
Manufacturing 0.231 0.240 0.252 0.012 3.54 ***
Chemicals 0.046 0.054 0.042 -0.012 -6.86 ***
Construction 0.011 0.006 0.013 0.007 9.70 ***
Food 0.074 0.088 0.079 -0.008 -3.76 ***
Metals 0.080 0.072 0.093 0.021 9.38 ***
Retail-Wholesale 0.192 0.166 0.172 0.006 1.91 **
Services 0.263 0.237 0.230 -0.007 -2.12 **
Textiles 0.065 0.081 0.085 0.004 1.74 **
Transport 0.020 0.008 0.017 0.009 10.93 ***
Other 0.032 0.055 0.029 -0.026 -15.78 ***
Owner Characteristics
Female Owner 0.271 0.350 0.257 -0.093 -25.37 ***
Male Owner 0.729 0.650 0.743 0.093 25.37 ***
Foreign Owner 0.092 0.072 0.057 -0.015 -7.73 ***
Domestic Owner 0.908 0.928 0.943 0.015 7.73 ***
Experience Mgmt 17.917 19.036 15.913 -3.123 -34.50 ***
Market Characteristics
Gov Index -0.377 -0.257 -0.537 -0.279 -58.82 ***
Bank Credit 40.339 41.541 34.614 -6.928 -32.73 ***
Year2006 0.108 0.164 0.119 -0.045 -16.05 ***
Year2007 0.065 0.060 0.112 0.052 23.53 ***
Year2008 0.029 0.049 0.027 -0.022 -14.45 ***
Year2009 0.151 0.223 0.141 -0.082 -26.51 ***
Year2010 0.113 0.183 0.095 -0.088 -31.67 ***
Year2011 0.019 0.023 0.040 0.017 12.16 ***
Year2012 0.064 0.060 0.061 0.001 0.36
Year2013 0.285 0.182 0.198 0.016 5.05 ***
Year2014 0.163 0.056 0.207 0.151 58.54 ***

- 36 -
Table 4: Descriptive statistics for Applied firms and, separately, for Approved and Denied firms
The dependent variable Get Credit (getcredit) is a binary variable that takes on a value of 1 if the
firm applied for and was extended credit and a value of 0 if the firm applied for and was denied
credit. For each variable in column 1, column 2 presents the mean for firms indicating that they
applied for credit, and columns 3 and 4 present the means for “approved” firms and “denied”
firms, respectively. Column 5 presents the difference in the means of “approved” firms and
“denied” firms, and column 6 presents the results of t-tests for significance of the differences in
means. Variables are defined in Table 1. Data are from the World Bank Enterprise Surveys, and
include 106,611 firm-year observations from 133 countries over the 2006 – 2014 period.
*, **, *** indicate statistical significance at the 0.10, 0.05 and 0.01 levels, respectively.
(1)
Variable
(2)
Applied
(3)
Denied
(4)
Approved
(5)
Difference
(6)
t-Statistic
Observations 29,413 8,848 20,565
Firm Characteristics
Log total employment 3.510 3.148 3.665 0.517 35.56 ***
Age 17.552 16.288 18.096 1.807 11.08 ***
Corporation 0.615 0.511 0.660 0.149 23.78 ***
Partner 0.122 0.141 0.114 -0.027 -6.33 ***
Proprietorship 0.229 0.321 0.190 -0.131 -23.13 ***
Manufacturing 0.240 0.250 0.235 -0.014 -2.58 ***
Chemicals 0.054 0.043 0.058 0.016 5.89 ***
Construction 0.006 0.009 0.005 -0.004 -3.90 ***
Food 0.088 0.076 0.093 0.017 4.80 ***
Metals 0.072 0.067 0.075 0.008 2.56 ***
Retail-Wholesale 0.166 0.173 0.163 -0.010 -2.08 **
Services 0.237 0.255 0.229 -0.026 -4.82 ***
Textiles 0.081 0.075 0.084 0.008 2.43 ***
Transport 0.008 0.009 0.007 -0.001 -1.30 *
Other 0.055 0.050 0.057 0.007 2.47 ***
Owner Characteristics
Female Owner 0.350 0.310 0.368 0.058 9.71 ***
Male Owner 0.650 0.690 0.632 -0.058 -9.71 ***
Foreign Owned 0.072 0.076 0.071 -0.005 -1.40 *
Domestic Owned 0.928 0.924 0.929 0.005 1.40 *
Experience Mgmt 19.036 17.521 19.687 2.166 14.83 ***
Market Characteristics
Gov Index -0.257 -0.405 -0.194 0.211 26.73 ***
Bank Credit 41.541 36.659 43.600 6.941 20.86 ***
Year2006 0.164 0.153 0.169 0.015 3.32 ***
Year2007 0.060 0.086 0.048 -0.038 -11.32 ***
Year2008 0.049 0.040 0.053 0.013 4.97 ***
Year2009 0.223 0.167 0.246 0.079 15.85 ***
Year2010 0.183 0.158 0.193 0.035 7.38 ***
Year2011 0.023 0.037 0.017 -0.020 -9.28 ***
Year2012 0.060 0.064 0.059 -0.005 -1.77 **
Year2013 0.182 0.199 0.174 -0.024 -4.88 ***
Year2014 0.056 0.094 0.039 -0.054 -16.10 ***
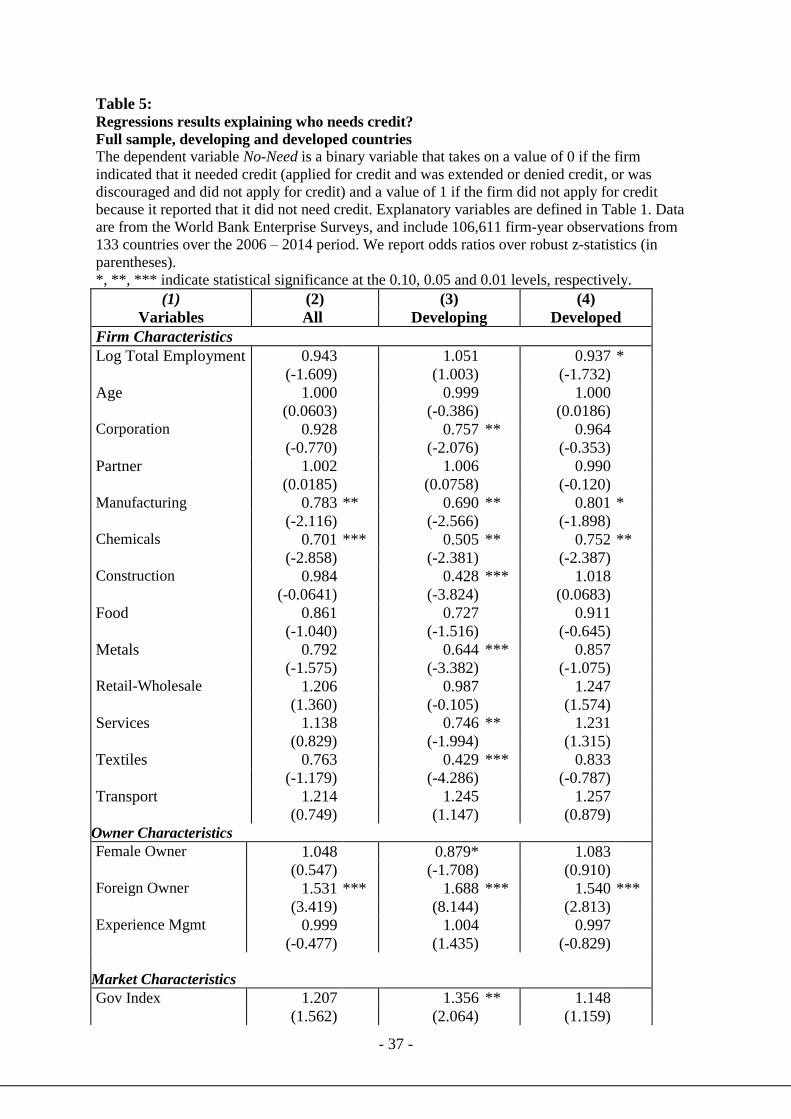
- 37 -
Table 5: Regressions results explaining who needs credit?
Full sample, developing and developed countries
The dependent variable No-Need is a binary variable that takes on a value of 0 if the firm
indicated that it needed credit (applied for credit and was extended or denied credit, or was
discouraged and did not apply for credit) and a value of 1 if the firm did not apply for credit
because it reported that it did not need credit. Explanatory variables are defined in Table 1. Data
are from the World Bank Enterprise Surveys, and include 106,611 firm-year observations from
133 countries over the 2006 – 2014 period. We report odds ratios over robust z-statistics (in
parentheses).
*, **, *** indicate statistical significance at the 0.10, 0.05 and 0.01 levels, respectively.
(1) (2)
All
(3)
Developing
(4)
Developed Variables
Firm Characteristics
Log Total Employment 0.943 1.051 0.937 *
(-1.609) (1.003) (-1.732)
Age 1.000 0.999 1.000
(0.0603) (-0.386) (0.0186) Corporation 0.928 0.757 ** 0.964
(-0.770) (-2.076) (-0.353)
Partner 1.002 1.006 0.990
(0.0185) (0.0758) (-0.120) Manufacturing 0.783 ** 0.690 ** 0.801 * (-2.116) (-2.566) (-1.898) Chemicals 0.701 *** 0.505 ** 0.752 **
(-2.858) (-2.381) (-2.387) Construction 0.984 0.428 *** 1.018
(-0.0641) (-3.824) (0.0683)
Food 0.861 0.727 0.911
(-1.040) (-1.516) (-0.645)
Metals 0.792 0.644 *** 0.857
(-1.575) (-3.382) (-1.075) Retail-Wholesale 1.206 0.987 1.247
(1.360) (-0.105) (1.574)
Services 1.138 0.746 ** 1.231
(0.829) (-1.994) (1.315)
Textiles 0.763 0.429 *** 0.833
(-1.179) (-4.286) (-0.787)
Transport 1.214 1.245 1.257
(0.749) (1.147) (0.879) Owner Characteristics
Female Owner 1.048 0.879* 1.083
(0.547) (-1.708) (0.910) Foreign Owner 1.531 *** 1.688 *** 1.540 ***
(3.419) (8.144) (2.813) Experience Mgmt 0.999 1.004 0.997
(-0.477) (1.435) (-0.829)
Market Characteristics
Gov Index 1.207 1.356 ** 1.148
(1.562) (2.064) (1.159)

- 38 -
Bank Credit 1.000 1.010 * 0.999
(-0.108) (1.878) (-0.365) Year2007 0.944 0.971 0.918 (-0.202) (-0.117) (-0.271) Year2008 0.568 * 2.452 *** 0.484 **
(-1.845) (2.602) (-2.193) Year2009 0.619 1.164 0.510 **
(-1.616) (0.689) (-2.150) Year2010 0.721 ** 0.911 0.660 ***
(-2.163) (-0.272) (-2.685) Year2011 0.594 1.132 0.501 *
(-1.428) (0.646) (-1.930) Year2012 0.988 0.897
(-0.0382) (-0.289) Year2013 1.377 1.650 ** 1.256
(1.051) (2.389) (0.679) Year2014 1.173 3.075 *** 1.022
(0.572) (4.115) (0.0726)
Developed 1.375
(1.569)
Constant 0.960 0.494 *** 1.487
(-0.119) (-3.275) (1.050)
Observations 106,611 33,644 72,967

- 39 -
Table 6: Regressions results explaining who applies for credit?
Full sample, developing and developed countries
The dependent variable Discouraged is a binary variable that takes on a value of 0 if the firm
applied for credit and was extended or denied credit and a value of 1 if the firm was discouraged
and did not apply for credit. Explanatory variables are defined in Table 1. Data are from the
World Bank Enterprise Surveys, and include 106,611 firm-year observations from 133 countries
over the 2006 – 2014 period. We report odds ratios over robust z-statistics (in parentheses).
*, **, *** indicate statistical significance at the 0.10, 0.05 and 0.01 levels, respectively.
(1)
All
(2)
Developing
(3)
Developed Variables
Firm Characteristics
Log Total Employment 0.553 *** 0.634 *** 0.540 ***
(-9.562) (-8.168) (-9.521)
Age 1.007 ** 1.001 1.008 **
(2.358) (0.338) (2.104) Corporation 0.596 *** 0.565 *** 0.609 ***
(-3.526) (-7.837) (-2.928)
Partner 0.694 0.747 0.685
(-1.611) (-1.165) (-1.537)
Manufacturing 1.506 *** 1.292 1.541 ***
(3.071) (1.144) (3.031) Chemicals 0.983 0.540 * 0.974
(-0.0984) (-1.934) (-0.156) Construction 1.776 *** 4.360 *** 1.783 ***
(3.204) (4.651) (3.050)
Food 1.655 *** 0.997 1.751 ***
(3.271) (-0.00974) (3.696)
Metals 1.129 1.034 1.125
(1.013) (0.0991) (1.068) Retail-Wholesale 1.308 1.303 1.313
(1.384) (0.858) (1.299)
Services 1.067 1.042 1.058
(0.410) (0.159) (0.329)
Textiles 1.682 ** 1.381 1.705 **
(2.445) (0.901) (2.434)
Transport 0.736 0.307 ** 0.726
(-1.127) (-2.238) (-1.125) Owner Characteristics
Female Owner 0.896 0.917 0.888
(-0.587) (-1.553) (-0.563) Foreign Owner 0.967 1.228 0.915
(-0.164) (1.509) (-0.353) Experience Mgmt 0.986 *** 0.998 0.985 ***
(-4.202) (-0.404) (-4.549) Market Characteristics
Gov Index 0.441 *** 0.563 *** 0.400 *** (-5.242) (-6.758) (-4.366) Bank Credit 0.992 0.980 *** 0.993
(-1.469) (-4.321) (-1.191) 2.778 *** 1.371 3.390 ***

- 40 -
Year2007
(3.212) (1.565) (3.068)
Year2008 0.573 0.433 ** 0.620
(-1.422) (-2.529) (-1.055)
Year2009 0.956 0.871 1.076
(-0.143) (-0.514) (0.187)
Year2010 0.798 1.318 0.720
(-1.270) (1.202) (-1.534) Year2011 0.843 0.438 *** 0.900
(-0.389) (-2.943) (-0.207) Year2012 3.367 3.438 *
(2.015) (1.881) Year2013 1.250 1.266 1.396
(0.679) (1.045) (0.734) Year2014 8.335 *** 1.819 * 10.32 ***
(6.621) (1.878) (6.343)
Developed 0.909
(-0.504)
Constant 6.584 *** 6.856 *** 5.534 ***
(6.137) (5.532) (4.425)
Observations 60,069 20,188 39,881

- 41 -
Table 7: Regressions results explaining who gets credit?
Full sample, developing and developed countries
The dependent variable Denied is a binary variable that takes on a value of 0 if the firm applied
for and was extended credit and a value of 1 if the firm applied for and was denied credit.
Explanatory variables are defined in Table 1. Data are from the World Bank Enterprise Surveys,
and include 106,611 firm-year observations from 133 countries over the 2006 – 2014 period. We
report odds ratios over robust z-statistics (in parentheses).
*, **, *** indicate statistical significance at the 0.10, 0.05 and 0.01 levels, respectively.
(1) (2)
All
(3)
Developing
(4)
Developed Variables
Firm Characteristics
Log Total Employment 0.675 *** 0.771 *** 0.658 ***
(-7.828) (-4.002) (-7.737)
Age 0.999 1.009 *** 0.996
(-0.228) (4.653) (-0.753) Corporation 0.766 ** 0.608 *** 0.789 *
(-2.244) (-3.529) (-1.858)
Partner 0.812 0.724 *** 0.819
(-0.878) (-3.958) (-0.753)
Manufacturing 0.969 1.553 0.894
(-0.173) (1.254) (-0.583) Chemicals 1.470 0.741 1.479
(0.811) (-0.797) (0.805) Construction 0.922 0.723 0.868
(-0.143) (-0.734) (-0.250)
Food 0.895 0.696 0.907
(-0.759) (-1.173) (-0.589)
Metals 0.598 *** 1.008 0.574 ***
(-2.970) (0.0212) (-3.016) Retail-Wholesale 0.871 1.265 0.829
(-0.832) (0.594) (-1.024)
Services 0.876 1.119 0.866
(-0.617) (0.332) (-0.596)
Textiles 1.188 1.617 1.155
(0.759) (1.251) (0.556)
Transport 1.066 41.69 *** 1.016
(0.474) (2.766) (0.120) Owner Characteristics
Female Owner 0.944 1.099 0.913
(-0.385) (0.881) (-0.556) Foreign Owner 2.940 0.934 3.688 *
(1.642) (-0.431) (1.774) Experience Mgmt 0.988 ** 0.994 0.988 **
(-2.389) (-0.899) (-2.131) Market Characteristics
Gov Index 0.698 ** 0.886 0.625 ** (-2.070) (-0.917) (-2.163) Bank Credit 0.991 *** 0.996 0.991 ***
(-3.319) (-0.759) (-3.245) 2.637 ** 1.022 3.468 ***

- 42 -
Year2007
(2.332) (0.101) (2.578)
Year2008 0.705 0.695 0.765
(-1.179) (-1.079) (-0.752)
Year2009 0.944 0.361 ** 1.091
(-0.206) (-2.514) (0.248)
Year2010 1.181 0.476 *** 1.404
(0.663) (-2.737) (1.489) Year2011 1.379 1.246 1.442
(0.345) (1.263) (0.394) Year2012 1.564 1.764
(1.417) (1.579) Year2013 1.429 1.074 1.383
(1.324) (0.343) (0.971) Year2014 4.798 *** 1.172 6.340 ***
(5.311) (0.598) (5.748)
Developed 0.980
(-0.121)
Constant 2.707 *** 1.821 * 2.714 **
(2.847) (1.775) (2.014)
Observations 28,245 7,742 20,503
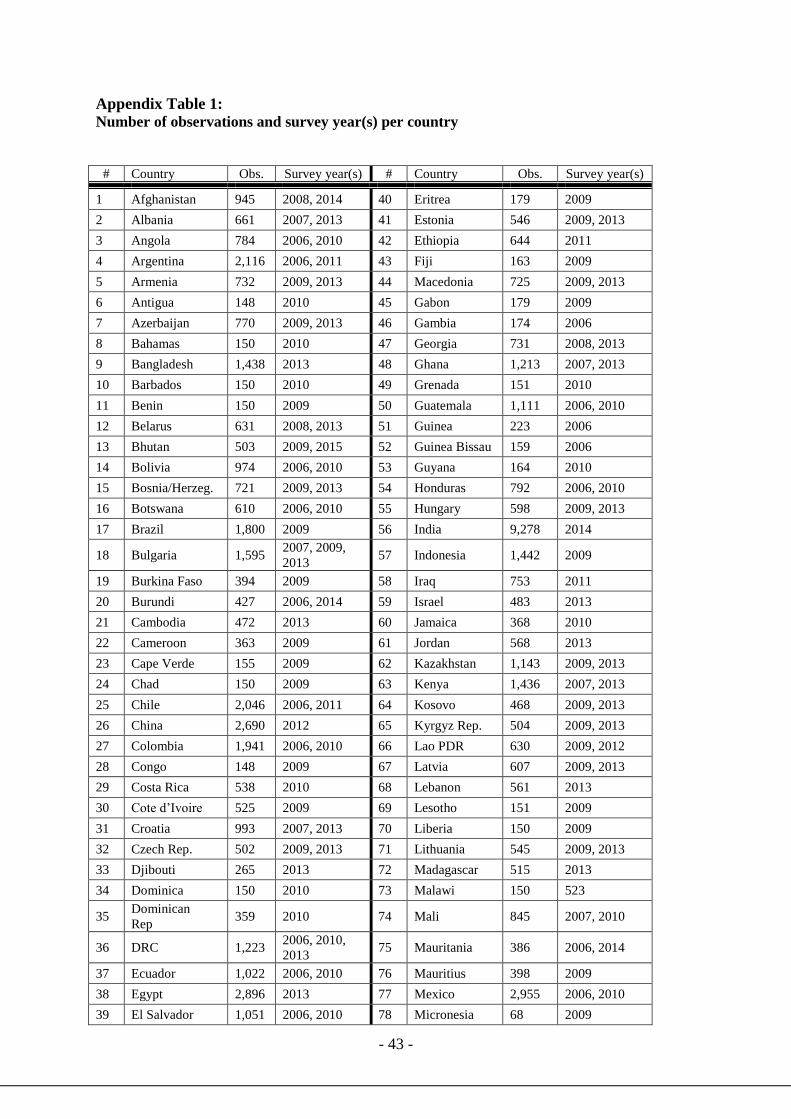
- 43 -
Appendix Table 1: Number of observations and survey year(s) per country
# Country Obs. Survey year(s) # Country Obs. Survey year(s)
1 Afghanistan 945 2008, 2014 40 Eritrea 179 2009
2 Albania 661 2007, 2013 41 Estonia 546 2009, 2013
3 Angola 784 2006, 2010 42 Ethiopia 644 2011
4 Argentina 2,116 2006, 2011 43 Fiji 163 2009
5 Armenia 732 2009, 2013 44 Macedonia 725 2009, 2013
6 Antigua 148 2010 45 Gabon 179 2009
7 Azerbaijan 770 2009, 2013 46 Gambia 174 2006
8 Bahamas 150 2010 47 Georgia 731 2008, 2013
9 Bangladesh 1,438 2013 48 Ghana 1,213 2007, 2013
10 Barbados 150 2010 49 Grenada 151 2010
11 Benin 150 2009 50 Guatemala 1,111 2006, 2010
12 Belarus 631 2008, 2013 51 Guinea 223 2006
13 Bhutan 503 2009, 2015 52 Guinea Bissau 159 2006
14 Bolivia 974 2006, 2010 53 Guyana 164 2010
15 Bosnia/Herzeg. 721 2009, 2013 54 Honduras 792 2006, 2010
16 Botswana 610 2006, 2010 55 Hungary 598 2009, 2013
17 Brazil 1,800 2009 56 India 9,278 2014
18 Bulgaria 1,595 2007, 2009,
2013 57 Indonesia 1,442 2009
19 Burkina Faso 394 2009 58 Iraq 753 2011
20 Burundi 427 2006, 2014 59 Israel 483 2013
21 Cambodia 472 2013 60 Jamaica 368 2010
22 Cameroon 363 2009 61 Jordan 568 2013
23 Cape Verde 155 2009 62 Kazakhstan 1,143 2009, 2013
24 Chad 150 2009 63 Kenya 1,436 2007, 2013
25 Chile 2,046 2006, 2011 64 Kosovo 468 2009, 2013
26 China 2,690 2012 65 Kyrgyz Rep. 504 2009, 2013
27 Colombia 1,941 2006, 2010 66 Lao PDR 630 2009, 2012
28 Congo 148 2009 67 Latvia 607 2009, 2013
29 Costa Rica 538 2010 68 Lebanon 561 2013
30 Cote d’Ivoire 525 2009 69 Lesotho 151 2009
31 Croatia 993 2007, 2013 70 Liberia 150 2009
32 Czech Rep. 502 2009, 2013 71 Lithuania 545 2009, 2013
33 Djibouti 265 2013 72 Madagascar 515 2013
34 Dominica 150 2010 73 Malawi 150 523
35 Dominican
Rep 359 2010 74 Mali 845 2007, 2010
36 DRC 1,223 2006, 2010,
2013 75 Mauritania 386 2006, 2014
37 Ecuador 1,022 2006, 2010 76 Mauritius 398 2009
38 Egypt 2,896 2013 77 Mexico 2,955 2006, 2010
39 El Salvador 1,051 2006, 2010 78 Micronesia 68 2009

- 44 -
79 Moldova 723 2009, 2013 125 Uruguay 1,228 2006, 2010
80 Mongolia 722 2009, 2013 126 Uzbekistan 756 2008, 2013
81 Montenegro 248 2009, 2013 127 Vanuatu 128 2009
82 Morocco 405 2013 128 Venezuela 318 2010
83 Mozambique 479 2007 129 Vietnam 1052 2009
84 Myanmar 632 2014 130 West Bank/Gaza 431 2013
85 Namibia 886 2006, 2014 131 Yemen 829 2010, 2013
86 Nepal 848 2009, 2013 132 Zambia 1,203 2007, 2013
87 Nicaragua 813 2006, 2010 133 Zimbabwe 596 2011
88 Niger 150 2009
89 Nigeria 4,541 2007, 2014
90 Pakistan 2,167 2007, 2013
91 Panama 966 2006, 2010
92 Paraguay 971 2006, 2010
93 Peru 1,632 2006, 2010
94 Philippines 1,322 2009
95 Poland 982 2009, 2013
96 Romania 1,542 2009, 2013
97 Russia 5,218 2009, 2012
98 Rwanda 450 2006, 2011
99 Samoa 108 2009
100 Senegal 1,107 2007, 2014
101 Serbia 746 2009, 2013
102 Sierra Leone 150 2009
103 Slovak Rep 540 2009, 2013
104 Slovenia 545 2009, 2013
105 South Africa 937 2007
106 South Sudan 738 2014
107 Sri Lanka 610 2011
108 St.Kitts & Nev 149 2010
109 St. Lucia 150 2010
110 St. Vincent 153 2010
111 Sudan 662 2014
112 Suriname 152 2010
113 Swaziland 304 2006
114 Sweden 598 2014
115 Tajikistan 718 2008, 2013
116 Tanzania 1,232 2006, 2013
117 Timor Leste 150 2009
118 Togo 155 2009
119 Tonga 150 2009
120 Tunisia 592 2013
121 Turkey 2,490 2008, 2013
122 Trinidad/Tobago 364 2010
123 Uganda 1,320 2006, 2013

- 45 -
124 Ukraine 1,849 2008, 2013