Every is Meaningful For a Sustainable · PDF fileFor a Sustainable Life Chain Every Mouthful...
48
Charoen Pokphand Foods Plc. 2 0 1 6 RESULTS BRIEFING February 2017 27, For a Sustainable Life Chain Every Mouthful is Meaningful
Transcript of Every is Meaningful For a Sustainable · PDF fileFor a Sustainable Life Chain Every Mouthful...
Charoen Pokphand Foods Plc.
2016 RESULTSBRIEFING
February 201727,
For a Sustainable Life Chain
Every Mouthful is Meaningful

2016 : Results Briefing
Contents 1
Business Overview
Y2016 Summary
Financial Status
Y2017 Outlook
E: Export Destination
Appendix
A: 3Yr Historical Results
B: Product & Raw Materials Price Trend
C: Product Sample & Retail Outlet Format
D: Highlights - 4Q16 Results
Kitchen o
f T
he W
orld
02
08
14
15
2016 : Results Briefing
CPF Investment Highlights 2
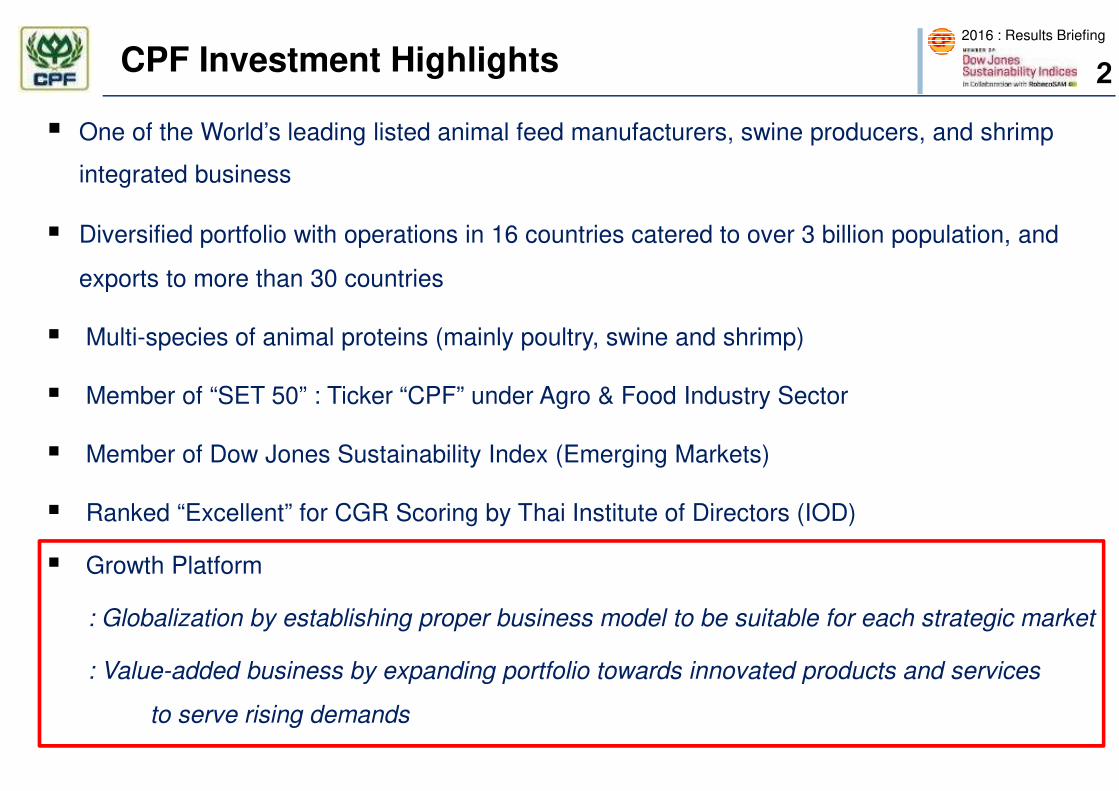
� One of the World’s leading listed animal feed manufacturers, swine producers, and shrimp
integrated business
� Diversified portfolio with operations in 16 countries catered to over 3 billion population, and
exports to more than 30 countries
� Multi-species of animal proteins (mainly poultry, swine and shrimp)
� Member of “SET 50” : Ticker “CPF” under Agro & Food Industry Sector
� Member of Dow Jones Sustainability Index (Emerging Markets)
� Ranked “Excellent” for CGR Scoring by Thai Institute of Directors (IOD)
� Growth Platform
: Globalization by establishing proper business model to be suitable for each strategic market
: Value-added business by expanding portfolio towards innovated products and services
to serve rising demands
2016 : Results Briefing
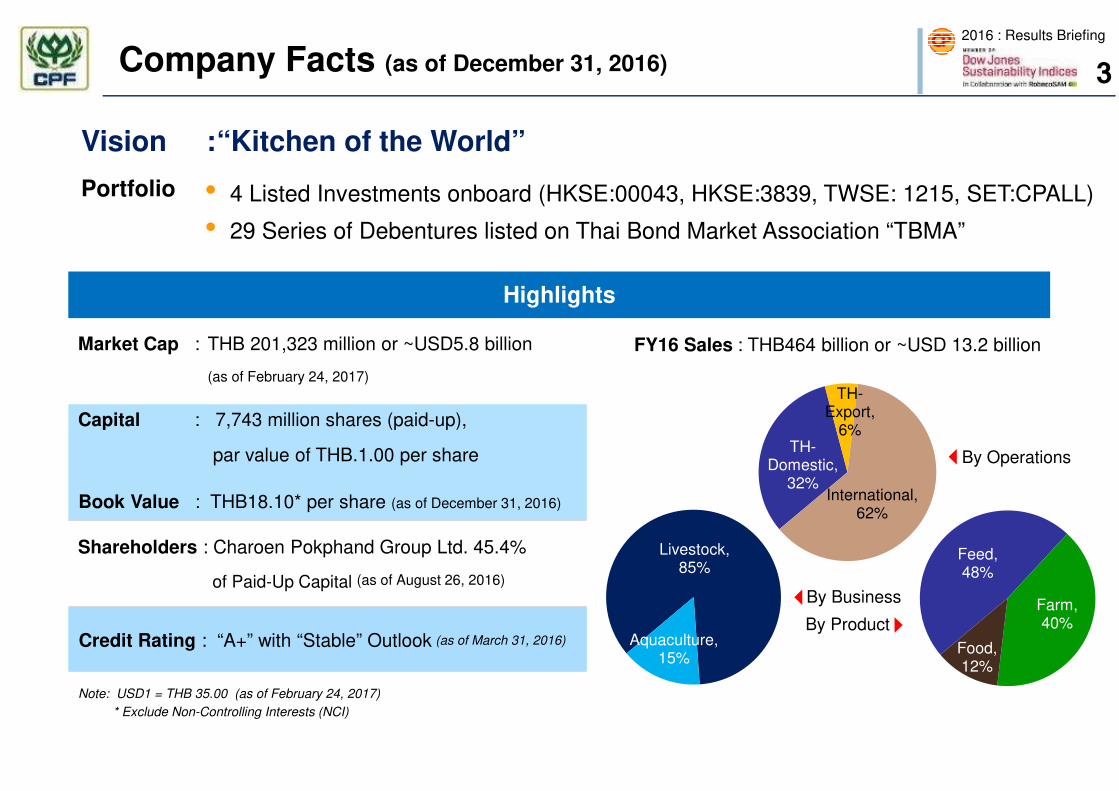
Company Facts (as of December 31, 2016)
Highlights
Market Cap : THB 201,323 million or ~USD5.8 billion
(as of February 24, 2017)
Capital : 7,743 million shares (paid-up),
par value of THB.1.00 per share
Shareholders : Charoen Pokphand Group Ltd. 45.4%
of Paid-Up Capital (as of August 26, 2016)
Note: USD1 = THB 35.00 (as of February 24, 2017)
• 4 Listed Investments onboard (HKSE:00043, HKSE:3839, TWSE: 1215, SET:CPALL)
• 29 Series of Debentures listed on Thai Bond Market Association “TBMA”
Credit Rating : “A+” with “Stable” Outlook (as of March 31, 2016)
Book Value : THB18.10* per share (as of December 31, 2016)
Vision :“Kitchen of the World”
Portfolio
* Exclude Non-Controlling Interests (NCI)
3
Livestock, 85%
Aquaculture, 15%
TH-Domestic,
32%
TH-Export,
6%
International, 62%
Feed, 48%
Farm, 40%
Food, 12%
By Operations
By Business
By Product
FY16 Sales : THB464 billion or ~USD 13.2 billion
2016 : Results Briefing
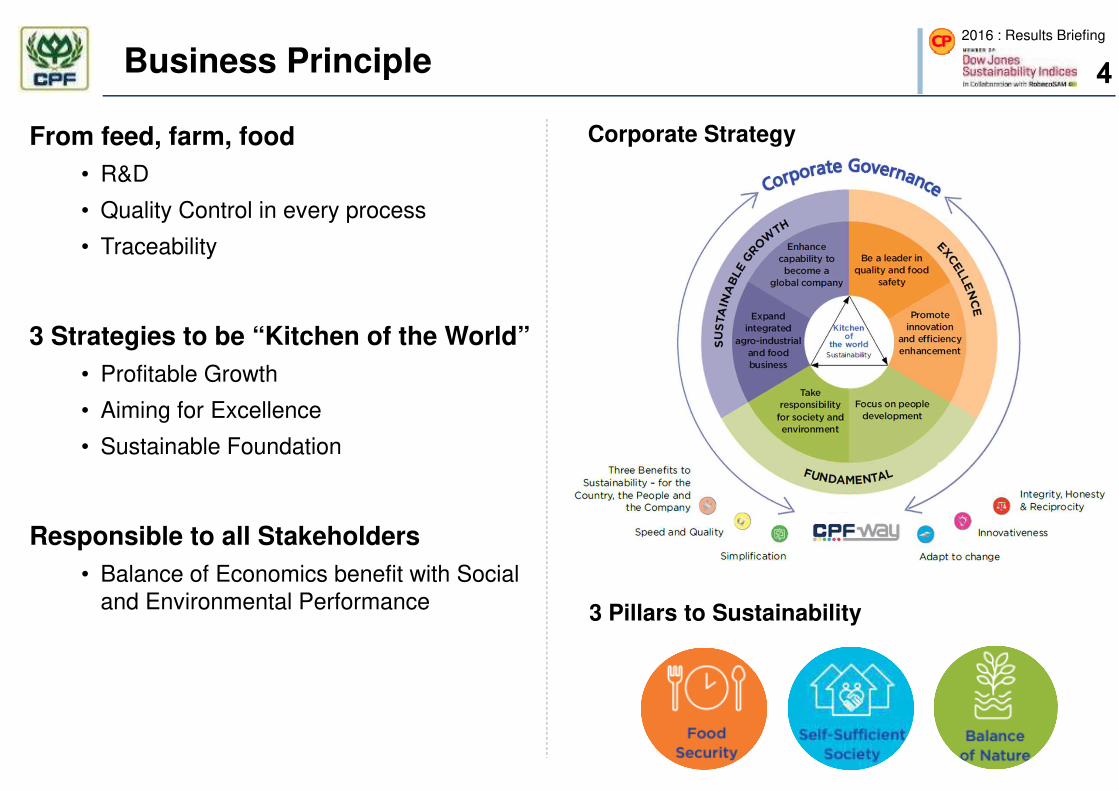
Business Principle
Corporate Strategy
3 Pillars to Sustainability
From feed, farm, food
• R&D
• Quality Control in every process
• Traceability
3 Strategies to be “Kitchen of the World”
• Profitable Growth
• Aiming for Excellence
• Sustainable Foundation
Responsible to all Stakeholders
• Balance of Economics benefit with Social
and Environmental Performance
4
2016 : Results Briefing
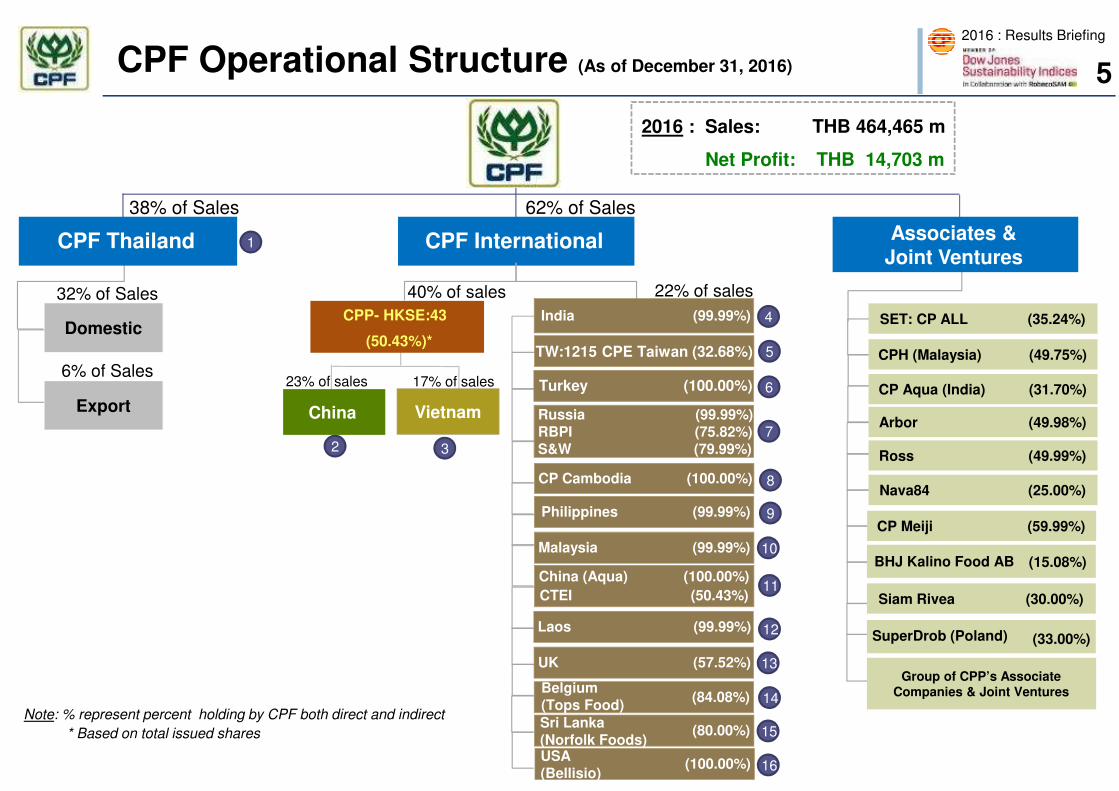
CPF Thailand CPF International
Domestic
Export Vietnam
17% of sales
22% of sales
38% of Sales 62% of Sales
Note: % represent percent holding by CPF both direct and indirect
* Based on total issued shares
CPP- HKSE:43
(50.43%)*
China
CPF Operational Structure (As of December 31, 2016)
2016 : Sales: THB 464,465 m
Net Profit: THB 14,703 m
India (99.99%)
32% of Sales
6% of SalesTurkey (100.00%)
SET: CP ALL (35.24%)
CPH (Malaysia) (49.75%)
CP Aqua (India) (31.70%)
Arbor (49.98%)
Ross (49.99%)
Nava84 (25.00%)
CP Meiji (59.99%)
Malaysia (99.99%)
UK (57.52%)
Laos (99.99%)
Philippines (99.99%)
(84.08%) Belgium(Tops Food)
Associates & Joint Ventures
TW:1215 CPE Taiwan (32.68%)
CP Cambodia (100.00%)
40% of sales
23% of sales
5
China (Aqua) (100.00%)
CTEI (50.43%)
Group of CPP’s Associate Companies & Joint Ventures
(80.00%) Sri Lanka(Norfolk Foods)
Russia (99.99%)RBPI (75.82%)S&W (79.99%)
(100.00%) USA(Bellisio)
Siam Rivea (30.00%)
BHJ Kalino Food AB (15.08%)
(33.00%)SuperDrob (Poland)
16
1
2 3
4
5
6
7
8
9
10
11
12
13
14
15
2016 : Results Briefing
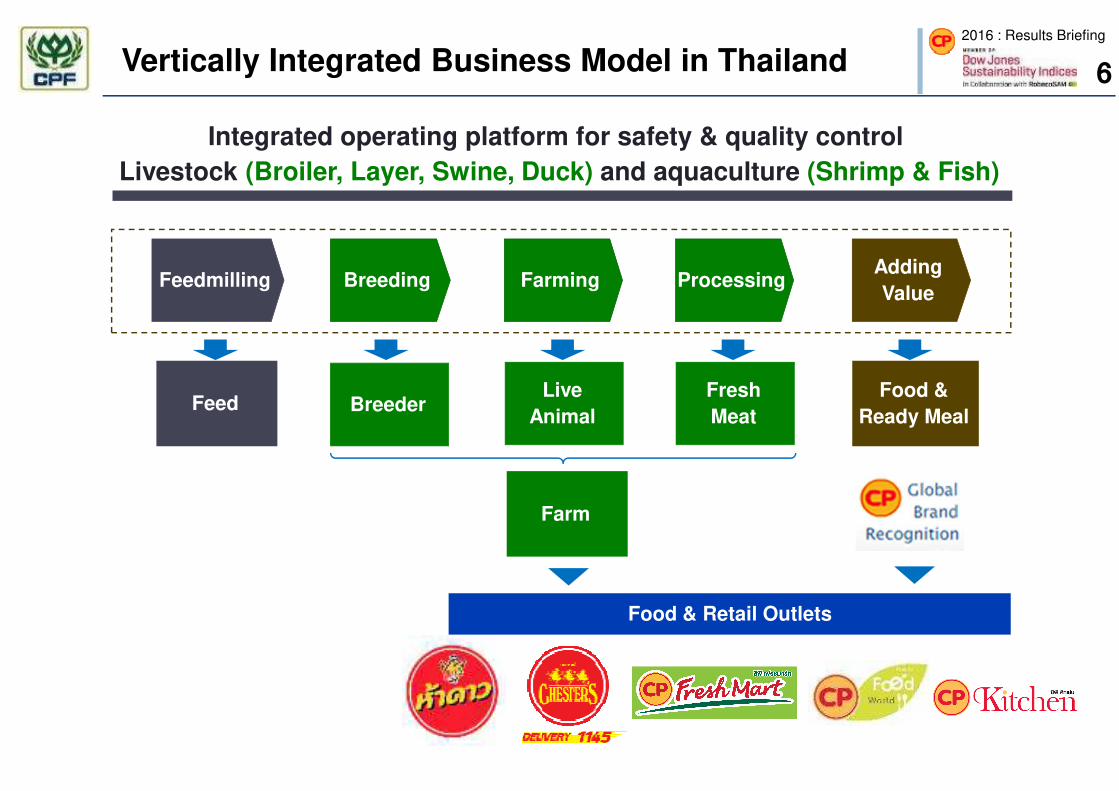
Vertically Integrated Business Model in Thailand
Feedmilling Breeding Farming ProcessingAdding
Value
Food & Retail Outlets
Feed BreederLive
Animal
Fresh
Meat
Food &
Ready Meal
Farm
Integrated operating platform for safety & quality control
Livestock (Broiler, Layer, Swine, Duck) and aquaculture (Shrimp & Fish)
6
2016 : Results Briefing
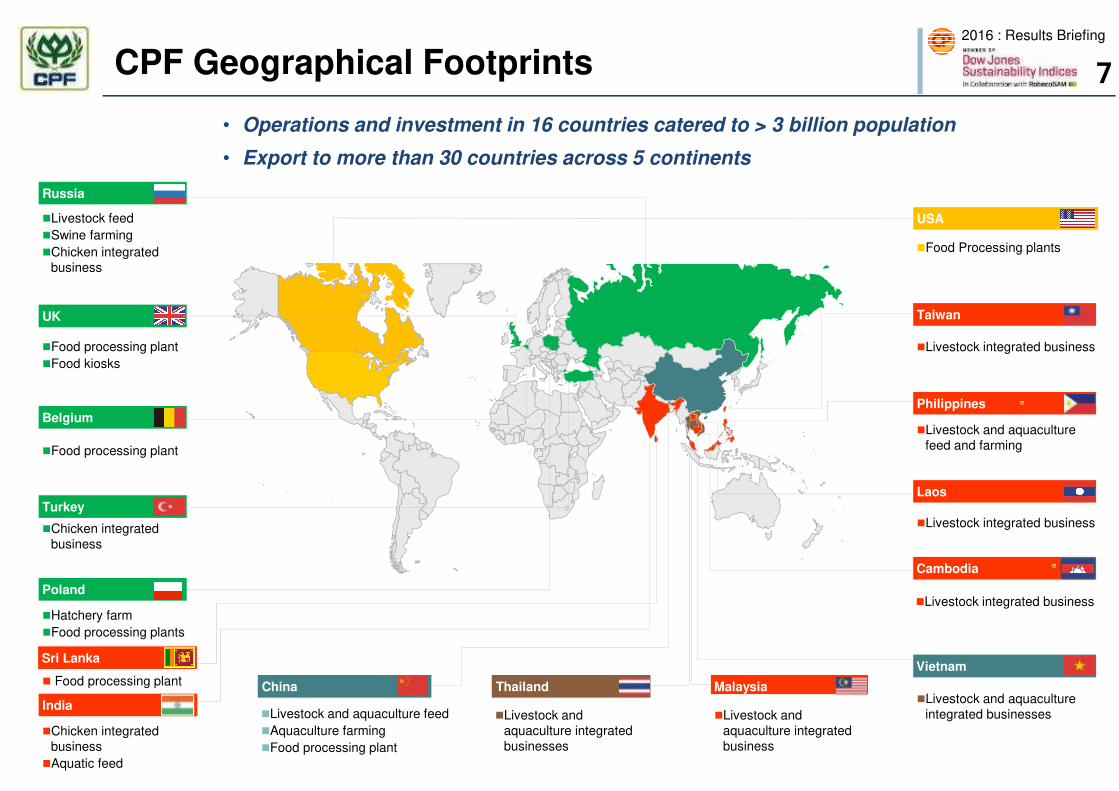
� Food processing plant
�Hatchery farm
�Food processing plants
UK
�Food processing plant
�Food kiosks
Belgium
�Food processing plant
Turkey
�Chicken integrated business
Poland
�Chicken integrated business
�Aquatic feed
�Livestock and aquaculture integrated businesses
Thailand
�Livestock and aquaculture feed
�Aquaculture farming
�Food processing plant
China Malaysia
�Livestock and aquaculture integrated business
Russia
�Livestock feed
�Swine farming
�Chicken integrated business
�Livestock and aquaculture integrated businesses
Vietnam
Cambodia
�Livestock integrated business
Laos
�Livestock integrated business
Philippines
�Livestock and aquaculture feed and farming
Taiwan
�Livestock integrated business
CPF Geographical Footprints
• Operations and investment in 16 countries catered to > 3 billion population
• Export to more than 30 countries across 5 continents
India
Sri Lanka
�Food Processing plants
USA
7
2016 : Results Briefing
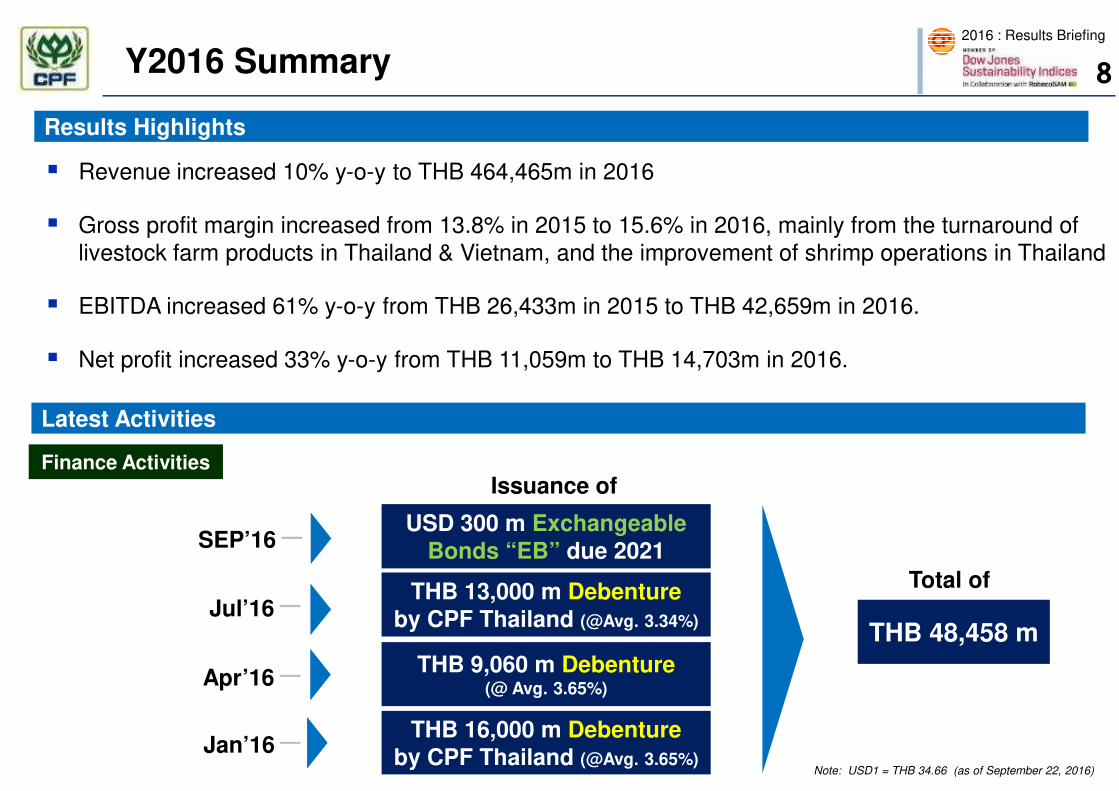
Y2016 Summary
Results Highlights
Latest Activities
Finance Activities
8
� Revenue increased 10% y-o-y to THB 464,465m in 2016
� Gross profit margin increased from 13.8% in 2015 to 15.6% in 2016, mainly from the turnaround of
livestock farm products in Thailand & Vietnam, and the improvement of shrimp operations in Thailand
� EBITDA increased 61% y-o-y from THB 26,433m in 2015 to THB 42,659m in 2016.
� Net profit increased 33% y-o-y from THB 11,059m to THB 14,703m in 2016.
THB 16,000 m Debentureby CPF Thailand (@Avg. 3.65%)
THB 9,060 m Debenture(@ Avg. 3.65%)
THB 13,000 m Debentureby CPF Thailand (@Avg. 3.34%)
USD 300 m Exchangeable Bonds “EB” due 2021SEP’16
Jan’16
Jul’16
Apr’16
THB 48,458 m
Note: USD1 = THB 34.66 (as of September 22, 2016)
Issuance of
Total of

2016 : Results Briefing
Y2016 Summary
M&A Activities
Norfolk FoodsReady-to-eat food
80%THB 141 m
Food FellasFood service
60%THB 538 m
BellisioFrozen food
100%THB 38,161 m
SuperDrobAgro & Food
33%THB 1,872 m
Hubei Chia TaiAgro & Food
100%THB 561 m
Banner Infant DairyMilk powder
30%THB 3,080 m
Qingdao Yi BangAnimal vaccine
12%THB 1,405 m
Fujian Sumpo FoodsIntegrated chicken
70%THB 1,688 m
Ningxia Xiao MingLayer chicken
16.54%THB 753m
COFCO MeatFarm & Food
100%THB 976 m
Jul’16 Oct’16 Dec’16May’16 Jun’16 Nov’16
By CPP
9

2016 : Results Briefing
Thai-Livestock Thai-Aqua Overseas-Livestock Overseas-Aqua TOTAL
140,116
26,931
218,401
35,907
421,355
146,545
32,037
249,278
36,605
464,465
Y2016: Sales & Gross Profit Margin by Business
12.7% 15.3%GPM 6.0% 12.3% 15.6% 16.9% 12.7% 11.5% 13.8% 15.6%
+10%
In THB, m
2016
2015
OPM 3.1% 6.3% -6.1% 4.3% 5.9% 7.7% 5.9% 4.2% 4.2% 6.8%
+14%
+5%
+19%
10
+2%
2016 : Results Briefing
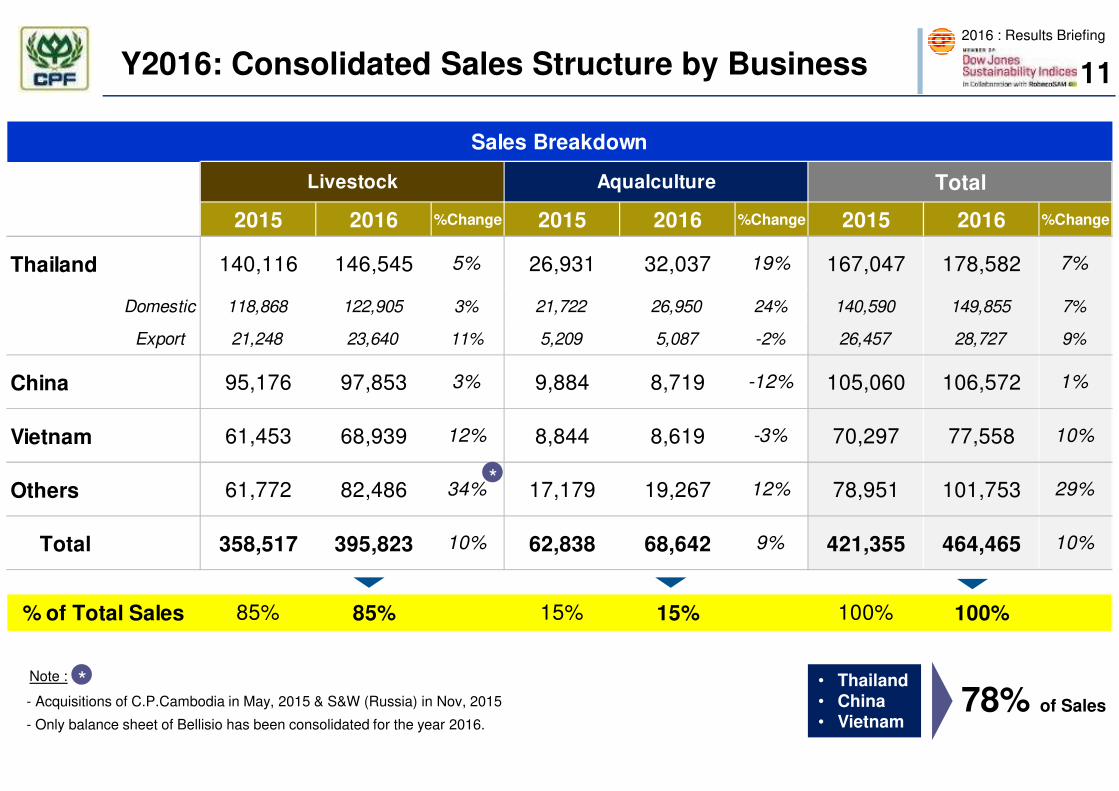
Y2016: Consolidated Sales Structure by Business 11
2015 2016 %Change 2015 2016 %Change 2015 2016 %Change
Thailand 140,116 146,545 5% 26,931 32,037 19% 167,047 178,582 7%
Domestic 118,868 122,905 3% 21,722 26,950 24% 140,590 149,855 7%
Export 21,248 23,640 11% 5,209 5,087 -2% 26,457 28,727 9%
China 95,176 97,853 3% 9,884 8,719 -12% 105,060 106,572 1%
Vietnam 61,453 68,939 12% 8,844 8,619 -3% 70,297 77,558 10%
Others 61,772 82,486 34% 17,179 19,267 12% 78,951 101,753 29%
Total 358,517 395,823 10% 62,838 68,642 9% 421,355 464,465 10%
85% 85% 15% 15% 100% 100%% of Total Sales
Sales Breakdown
TotalLivestock Aqualculture
• Thailand• China• Vietnam
78% of Sales- Acquisitions of C.P.Cambodia in May, 2015 & S&W (Russia) in Nov, 2015
- Only balance sheet of Bellisio has been consolidated for the year 2016.
Note :
*
*

2016 : Results Briefing
Feed, 48%
Farm, 40%
Food, 12%
Feed, 95%
Farm, 1%
Food, 4%
2016: Consolidated Sales by Products
Feed, 38%
Farm, 55%
Food, 7%
Feed, 40%
Farm, 57%
Food,3%
12
Feed, 28%
Farm, 48%
Food, 24%
Thailand China Vietnam Others
Total
2015 2016 %Change 2015 2016 %Change 2015 2016 %Change 2015 2016 %Change
Thailand 50,287 49,165 -2% 74,686 86,255 15% 42,074 43,162 3% 167,047 178,582 7%
Domestic 50,032 49,010 -2% 68,583 78,862 15% 21,976 21,983 0% 140,591 149,855 7%
Export 255 155 -39% 6,103 7,393 21% 20,098 21,179 5% 26,456 28,727 9%
China 105,000 101,818 -3% 0 791 100% 60 3,963 6505% 105,060 106,572 1%
Vietnam 28,775 31,248 9% 39,458 44,409 13% 2,064 1,901 -8% 70,297 77,558 10%
Others 33,234 38,249 15% 39,700 56,128 41% 6,018 7,377 23% 78,951 101,754 29%
217,295 220,480 1% 153,844 187,582 22% 50,216 56,403 12% 421,355 464,465 10%Total
Sales Breakdown by Products
Feed Farm Food Total

2016 : Results Briefing
2015 2016 2015 2016 2015 2016 2015 2016 %Chg. 2015 2016 %Chg.
Net sales 96,224 105,513 103,678 116,776 111,877 122,549 109,576 119,626 9% 421,355 464,465 10%
Gross Profit Margin (%) 12.6% 15.6% 13.5% 17.4% 15.0% 16.5% 13.8% 13.1% 13.8% 15.6%
EBITDA 5,029 10,075 5,542 13,106 8,618 12,308 7,244 7,171 -1% 26,433 42,659 61%
EBITDA Margin 5.2% 9.5% 5.3% 11.2% 7.7% 10.0% 6.6% 6.0% 6.3% 9.2%
EBIT 2,467 6,930 2,772 9,715 5,667 8,985 4,020 3,780 -6% 14,926 29,410 97%
EBIT Margin 2.6% 6.6% 2.7% 8.3% 5.1% 7.3% 3.7% 3.2% 3.5% 6.3%
Share in Profit of
Associates1,267 1,553 1,230 1,665 1,238 1,689 1,486 1,605 8% 5,221 6,512 25%
Financial Costs (2,174) (2,600) (2,364) (2,587) (2,836) (2,558) (2,239) (2,856) 28% (9,614) (10,601) 10%
Income Taxes Expense (612) (1,695) (757) (3,120) (1,216) (1,728) (1,069) (669) -37% (3,654) (7,212) 97%
NET PROFIT 2,956 3,764 2,983 4,016 3,571 5,184 1,549 1,739 12% 11,059 14,703 33%
EPS (THB) 0.40 0.51 0.40 0.54 0.48 0.70 0.21 0.24 1.50 1.99
# of capital shares 7,388 7,388 7,388 7,388 7,388 7,388 7,388 7,388 7,388 7,388
Paid-Up Capital 7,743 7,743 7,743 7,743 7,743 7,743 7,743 7,743 7,743 7,743
Dividend (THB/Share) 0.75 0.95
Quarter 4 FY 2016Quarter 1 Quarter 2 Quarter 3
2016: Consolidated Income Statement Highlight
Note: (1) # of capital shares = No. of the Weighted-avg. shares
(2) Including adjustment from the change in tax calculation of 2010-2015 of THB 1,245 m. Please see more detail in Note 17 to Financial statements of Y2016
13
(1)
(2)

2016 : Results Briefing
Financial Status (As of 31 December 2016)
Net Debt to Equity
163,966 173,725 193,706
162,377 221,690278,628
0.99
1.28
1.44
2014 2015 2016
Total Equity
Net Debt
Net Debt to Equity
Unit : THB, M
Remark : Net Debt = Interest Bearing Debt - Cash and Cash Equivalents
Bond Rating “A+” with “Stable” Outlook
by Tris Rating Co., Ltd
Bond, 38%
L/T Loan, 19%
S/T Loan, 36%
Current Portion,
7%
Cost of Debts
2014 2015 2016
4.41% 4.14% 3.87%
Interest Bearing Debt : THB 312,728 m
14
2016 : Results Briefing
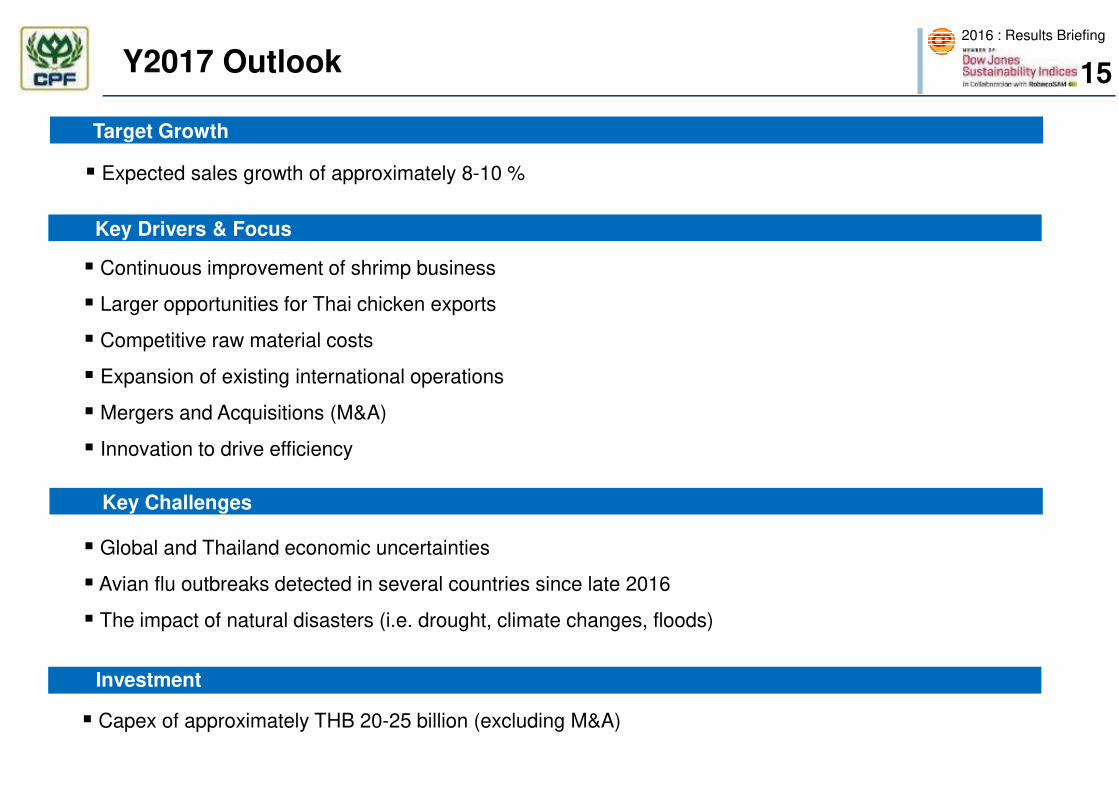
Y2017 Outlook
Target Growth
Key Drivers & Focus
� Continuous improvement of shrimp business
� Larger opportunities for Thai chicken exports
� Competitive raw material costs
� Expansion of existing international operations
� Mergers and Acquisitions (M&A)
� Innovation to drive efficiency
Investment
15
� Capex of approximately THB 20-25 billion (excluding M&A)
� Global and Thailand economic uncertainties
� Avian flu outbreaks detected in several countries since late 2016
� The impact of natural disasters (i.e. drought, climate changes, floods)
� Expected sales growth of approximately 8-10 %
Key Challenges

Appendix A: Highlights : 3Yr Historical Results

2016 : Results Briefing
Full Year
2014 2015 % Change 2016 % Change
Net sales 426,039 421,355 -1% 464,465 10%
Gross Profit Margin (%) 13.4% 13.8% 15.6%
Gain on fair value adjustment - - - - -
EBITDA 27,513 26,433 -4% 42,659 61%
EBIT 17,548 14,926 -15% 29,410 97%
Share in Profit of Associates 4,869 5,221 7% 6,512 25%
Financial Costs (8,903) (9,614) 8% (10,601) 10%
Income Taxes Expense (3,649) (3,654) 0% (7,212) 97%
Gain / (Loss) from FX (356) 1,348 479% 388 -71%
NET PROFIT 10,562 11,059 5% 14,703 33%
EPS (THB) 1.43 1.50 1.99
# of capital shares ** 7,388 7,388 7,388
Paid-Up Capital 7,743 7,743 7,743
Dividend (THB/Share) 0.75 0.75 0.95
Consolidated Income Statement Highlight
Note: ** # of capital shares = No. of the Weighted-avg. shares
17
2016 : Results Briefing
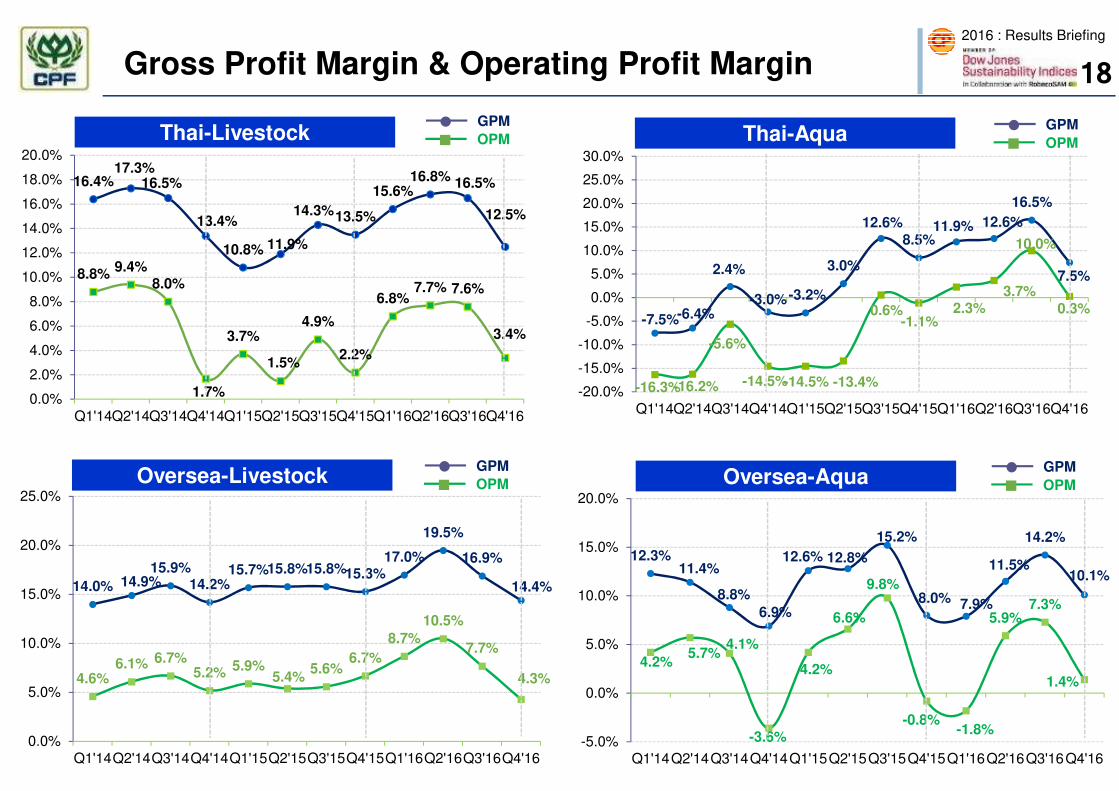
Gross Profit Margin & Operating Profit Margin
16.4%17.3%
16.5%
13.4%
10.8% 11.9%
14.3%13.5%
15.6%16.8% 16.5%
12.5%
8.8%9.4%
8.0%
1.7%
3.7%
1.5%
4.9%
2.2%
6.8%7.7% 7.6%
3.4%
0.0%
2.0%
4.0%
6.0%
8.0%
10.0%
12.0%
14.0%
16.0%
18.0%
20.0%
Q1'14Q2'14Q3'14Q4'14Q1'15Q2'15Q3'15Q4'15Q1'16Q2'16Q3'16Q4'16
OPM
GPM
-7.5%-6.4%
2.4%
-3.0%-3.2%
3.0%
12.6%8.5%
11.9% 12.6%
16.5%
7.5%
-16.3%-16.2%
-5.6%
-14.5%-14.5% -13.4%
0.6%-1.1%
2.3%3.7%
10.0%
0.3%
-20.0%
-15.0%
-10.0%
-5.0%
0.0%
5.0%
10.0%
15.0%
20.0%
25.0%
30.0%
Q1'14Q2'14Q3'14Q4'14Q1'15Q2'15Q3'15Q4'15Q1'16Q2'16Q3'16Q4'16
14.0% 14.9%15.9%
14.2%15.7%15.8%15.8%15.3%
17.0%
19.5%
16.9%
14.4%
4.6%6.1% 6.7%
5.2% 5.9%5.4%
5.6%6.7%
8.7%
10.5%
7.7%
4.3%
0.0%
5.0%
10.0%
15.0%
20.0%
25.0%
Q1'14Q2'14Q3'14Q4'14Q1'15Q2'15Q3'15Q4'15Q1'16Q2'16Q3'16Q4'16
12.3%11.4%
8.8%
6.9%
12.6% 12.8%
15.2%
8.0% 7.9%
11.5%
14.2%
10.1%
4.2%5.7%
4.1%
-3.6%
4.2%
6.6%
9.8%
-0.8%-1.8%
5.9%7.3%
1.4%
-5.0%
0.0%
5.0%
10.0%
15.0%
20.0%
Q1'14Q2'14Q3'14Q4'14Q1'15Q2'15Q3'15Q4'15Q1'16Q2'16Q3'16Q4'16
Thai-Livestock Thai-Aqua
Oversea-Livestock Oversea-Aqua
OPM
GPM
OPM
GPM
OPM
GPM
18
2016 : Results Briefing
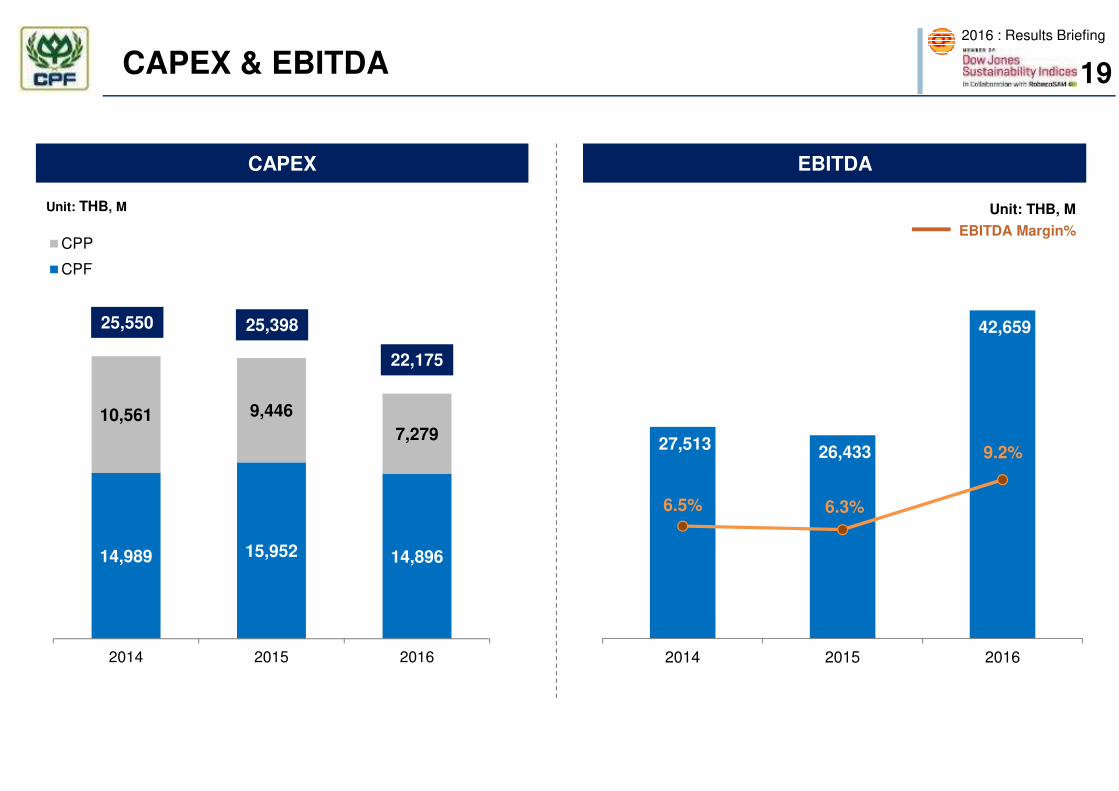
14,989 15,952 14,896
10,561 9,446
7,279
2014 2015 2016
CPP
CPF
CAPEX & EBITDA
CAPEX EBITDA
Unit: THB, M
EBITDA Margin%
Unit: THB, M
25,39825,550
19
22,175
27,513 26,433
42,659
6.5% 6.3%
9.2%
0.0%
2.0%
4.0%
6.0%
8.0%
10.0%
12.0%
14.0%
16.0%
18.0%
20.0%
-
5,000
10,000
15,000
20,000
25,000
30,000
35,000
40,000
45,000
2014 2015 2016
2016 : Results Briefing
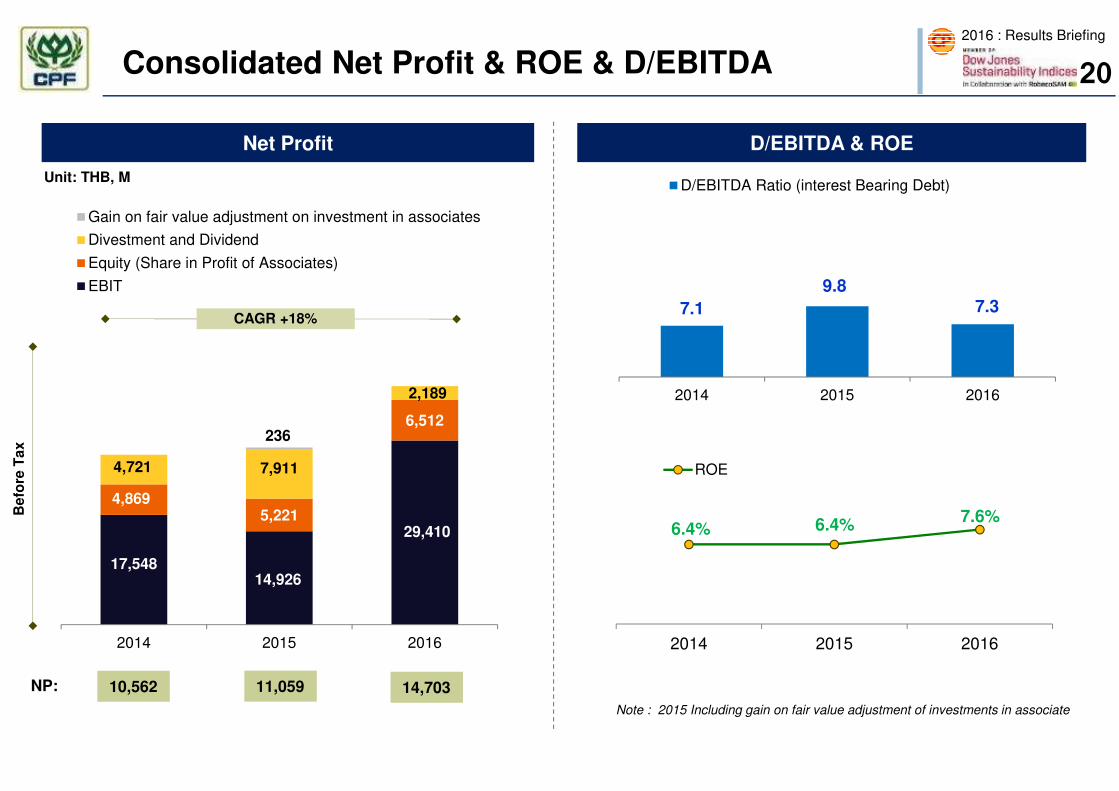
6.4% 6.4%7.6%
2014 2015 2016
ROE
Consolidated Net Profit & ROE & D/EBITDA
Net Profit D/EBITDA & ROE
Unit: THB, M
Note : 2015 Including gain on fair value adjustment of investments in associate
NP:
Befo
re T
ax
10,562 11,059
20
17,54814,926
29,410
4,8695,221
6,512
4,721 7,911
2,189
236
2014 2015 2016
Gain on fair value adjustment on investment in associates
Divestment and Dividend
Equity (Share in Profit of Associates)
EBIT
7.1
9.87.3
2014 2015 2016
D/EBITDA Ratio (interest Bearing Debt)
14,703
CAGR +18%

2016 : Results Briefing
Consolidated Net Profit - Quarterly
Unit : THB, M
: * Including restate of IFRS basis
*
2Q15 Gain on fair value adjustment of investments in associates = 236 MB
21
1,026
2,050
2,956
3,764
1,636
3,546
2,983
4,016
2,649
4,158
3,571
5,184
1,754
808
1,5491,739
2013 2014 2015 2016
1Q 2Q 3Q 4Q
2016 : Results Briefing
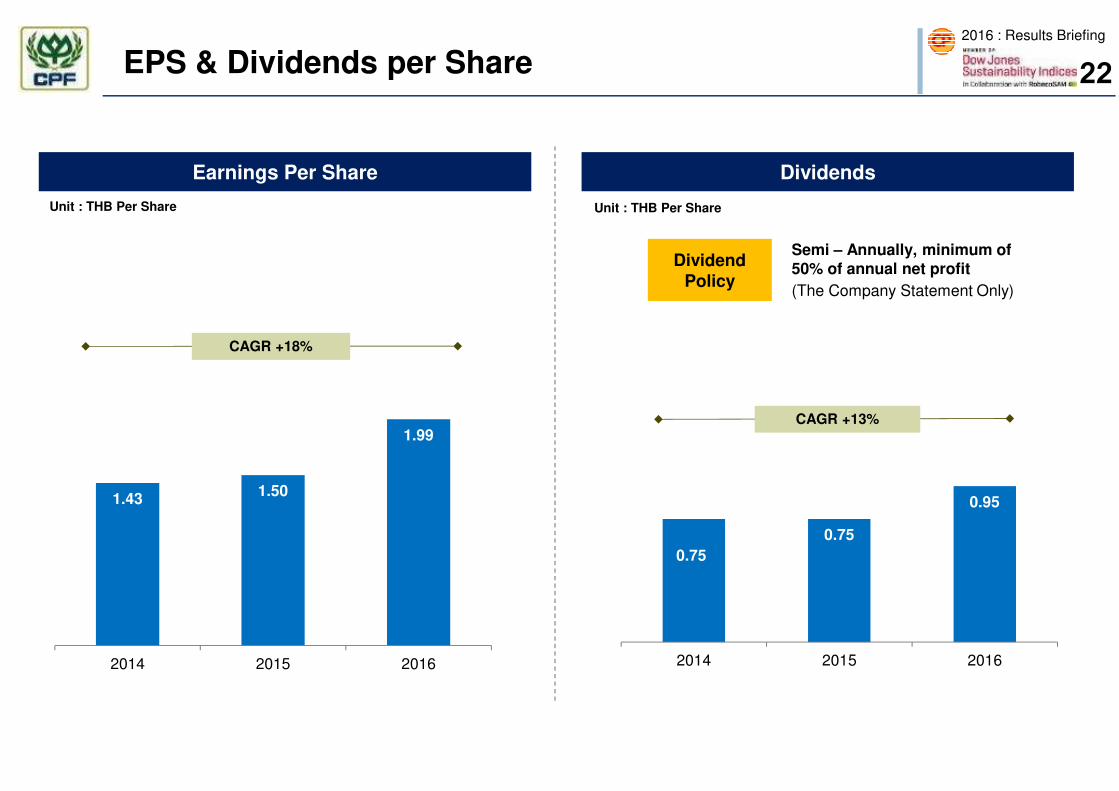
EPS & Dividends per Share
Earnings Per Share Dividends
Unit : THB Per Share
1.431.50
1.99
2014 2015 2016
CAGR +18%
Semi – Annually, minimum of 50% of annual net profit
(The Company Statement Only)
Dividend Policy
Unit : THB Per Share
22
0.75
0.75
0.95
2014 2015 2016
CAGR +13%

Kitchen of The World
Appendix B: Product & Raw Materials Price Trend
2016 : Results Briefing
40.0
50.0
60.0
70.0
80.0
90.0
1Q14 2Q14 3Q14 4Q14 1Q15 2Q15 3Q15 4Q15 1Q16 2Q16 3Q16 4Q16 CurrentPrice
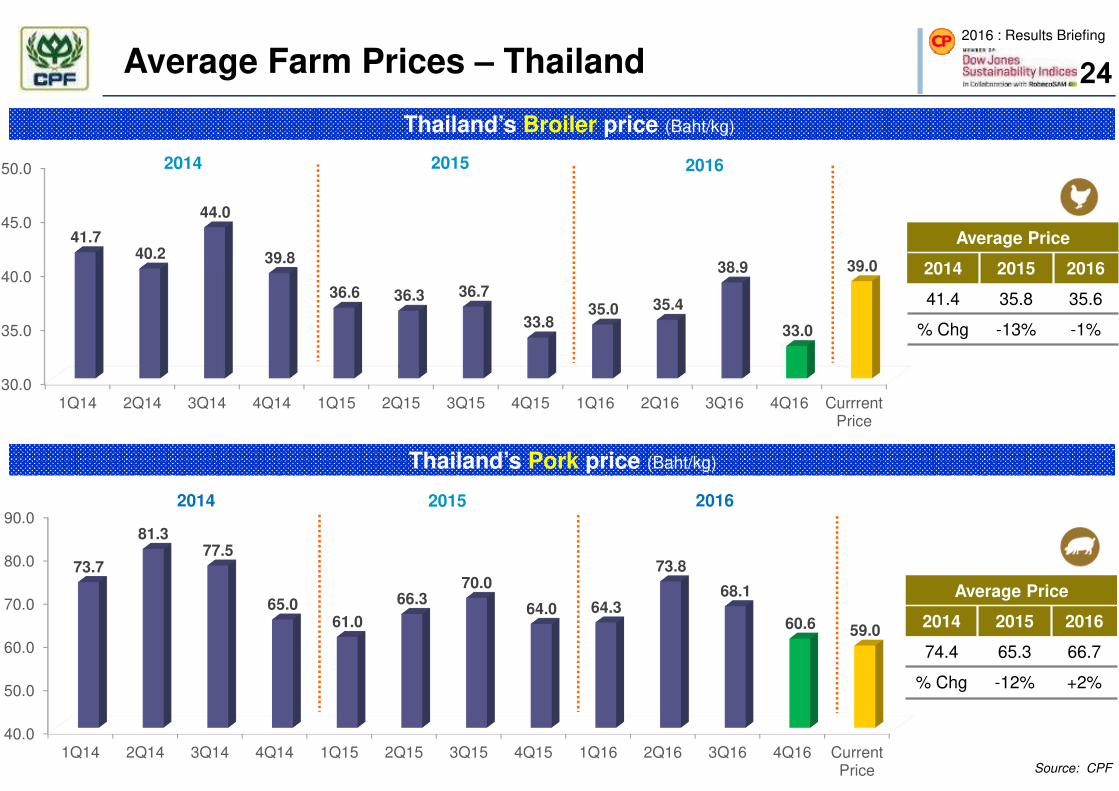
73.7
81.377.5
65.061.0
66.370.0
64.0 64.3
73.8
68.1
60.6 59.0
30.0
35.0
40.0
45.0
50.0
1Q14 2Q14 3Q14 4Q14 1Q15 2Q15 3Q15 4Q15 1Q16 2Q16 3Q16 4Q16 CurrrentPrice
41.740.2
44.0
39.8
36.6 36.3 36.7
33.835.0 35.4
38.9
33.0
39.0
Average Price
2014 2015 2016
41.4 35.8 35.6
% Chg -13% -1%
Thailand’s Broiler price (Baht/kg)
Average Farm Prices – Thailand
Thailand’s Pork price (Baht/kg)
2014
20162014
Average Price
2014 2015 2016
74.4 65.3 66.7
% Chg -12% +2%
2015
2015
Source: CPF
24
2016
2016 : Results Briefing
0.0
100.0
200.0
300.0
400.0
1Q14 2Q14 3Q14 4Q14 1Q15 2Q15 3Q15 4Q15 1Q16 2Q16 3Q16 4Q16 CurrrentPrice
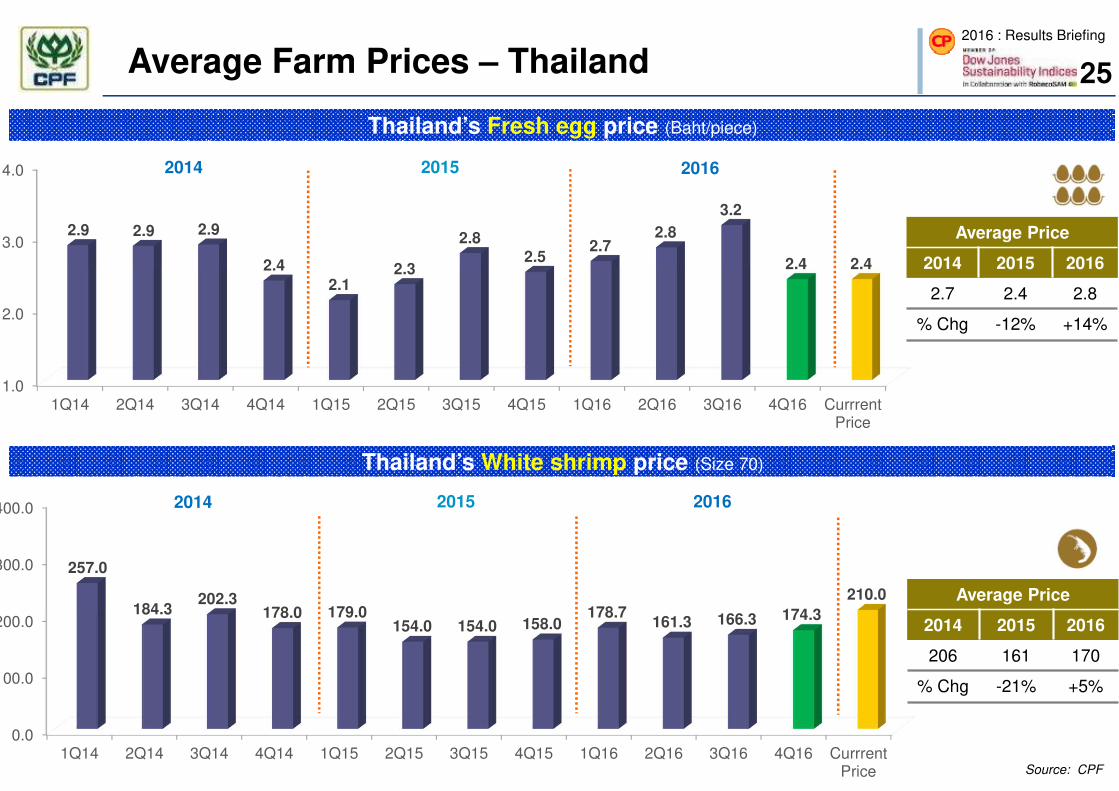
257.0
184.3202.3
178.0 179.0154.0 154.0 158.0
178.7161.3 166.3 174.3
210.0
1.0
2.0
3.0
4.0
1Q14 2Q14 3Q14 4Q14 1Q15 2Q15 3Q15 4Q15 1Q16 2Q16 3Q16 4Q16 CurrrentPrice
2.9 2.9 2.9
2.4
2.12.3
2.82.5
2.72.8
3.2
2.4 2.4
Thailand’s Fresh egg price (Baht/piece)
Average Farm Prices – Thailand
Thailand’s White shrimp price (Size 70)
20162014
20162014
Average Price
2014 2015 2016
2.7 2.4 2.8
% Chg -12% +14%
Average Price
2014 2015 2016
206 161 170
% Chg -21% +5%
2015
2015
Source: CPF
25
2016 : Results Briefing
10.0
15.0
20.0
25.0
30.0
1Q14 2Q14 3Q14 4Q14 1Q15 2Q15 3Q15 4Q15 1Q16 2Q16 3Q16 4Q16 CurrentPrice
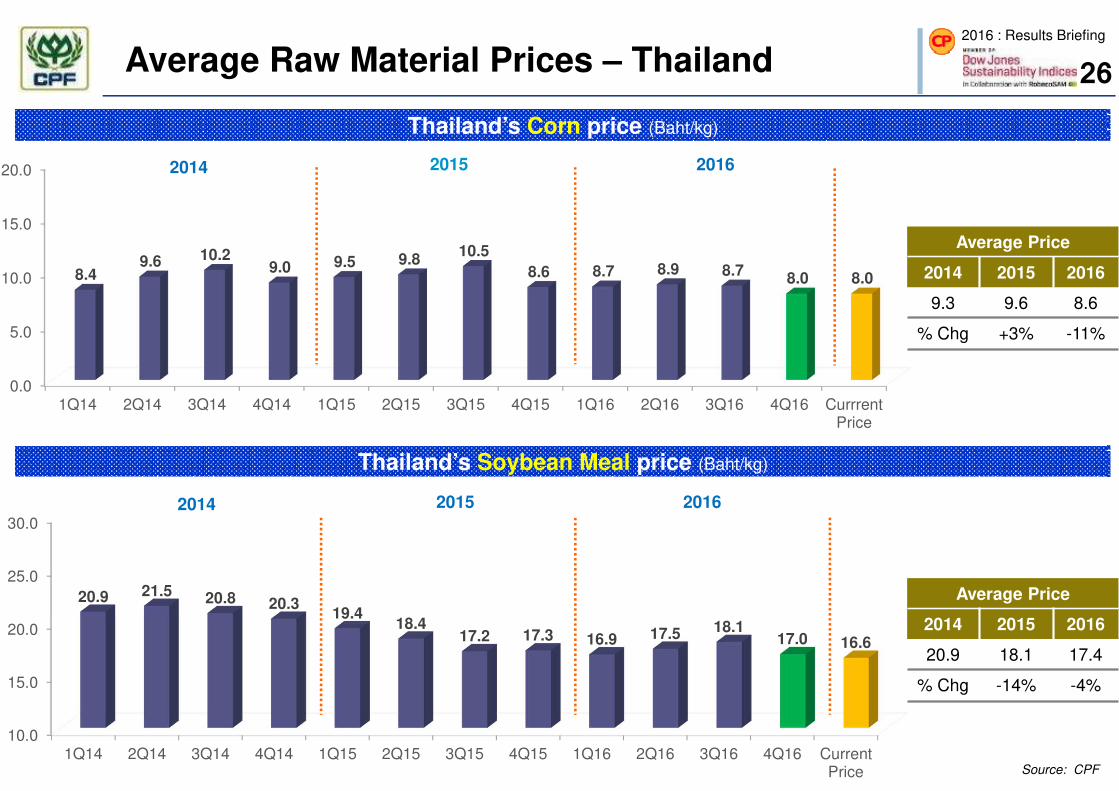
20.9 21.5 20.8 20.319.4
18.417.2 17.3 16.9 17.5 18.1
17.0 16.6
0.0
5.0
10.0
15.0
20.0
1Q14 2Q14 3Q14 4Q14 1Q15 2Q15 3Q15 4Q15 1Q16 2Q16 3Q16 4Q16 CurrrentPrice
8.49.6 10.2
9.0 9.5 9.810.5
8.6 8.7 8.9 8.78.0 8.0
Thailand’s Corn price (Baht/kg)
Average Raw Material Prices – Thailand
Thailand’s Soybean Meal price (Baht/kg)
20162014
20162014 2015
Average Price
2014 2015 2016
9.3 9.6 8.6
% Chg +3% -11%
Average Price
2014 2015 2016
20.9 18.1 17.4
% Chg -14% -4%
2015
Source: CPF
26
2016 : Results Briefing
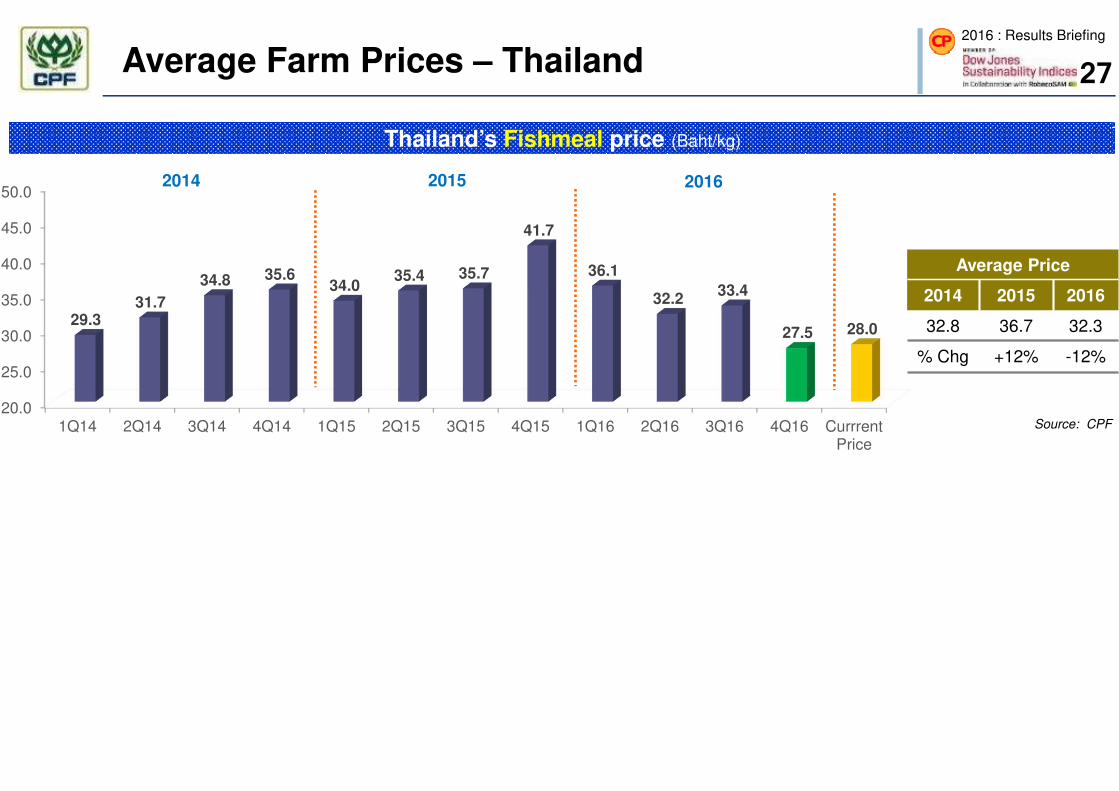
20.0
25.0
30.0
35.0
40.0
45.0
50.0
1Q14 2Q14 3Q14 4Q14 1Q15 2Q15 3Q15 4Q15 1Q16 2Q16 3Q16 4Q16 CurrrentPrice
29.331.7
34.8 35.634.0
35.4 35.7
41.7
36.1
32.233.4
27.5 28.0
Thailand’s Fishmeal price (Baht/kg)
Average Farm Prices – Thailand
2015 20162014
Average Price
2014 2015 2016
32.8 36.7 32.3
% Chg +12% -12%
Source: CPF
27
2016 : Results Briefing
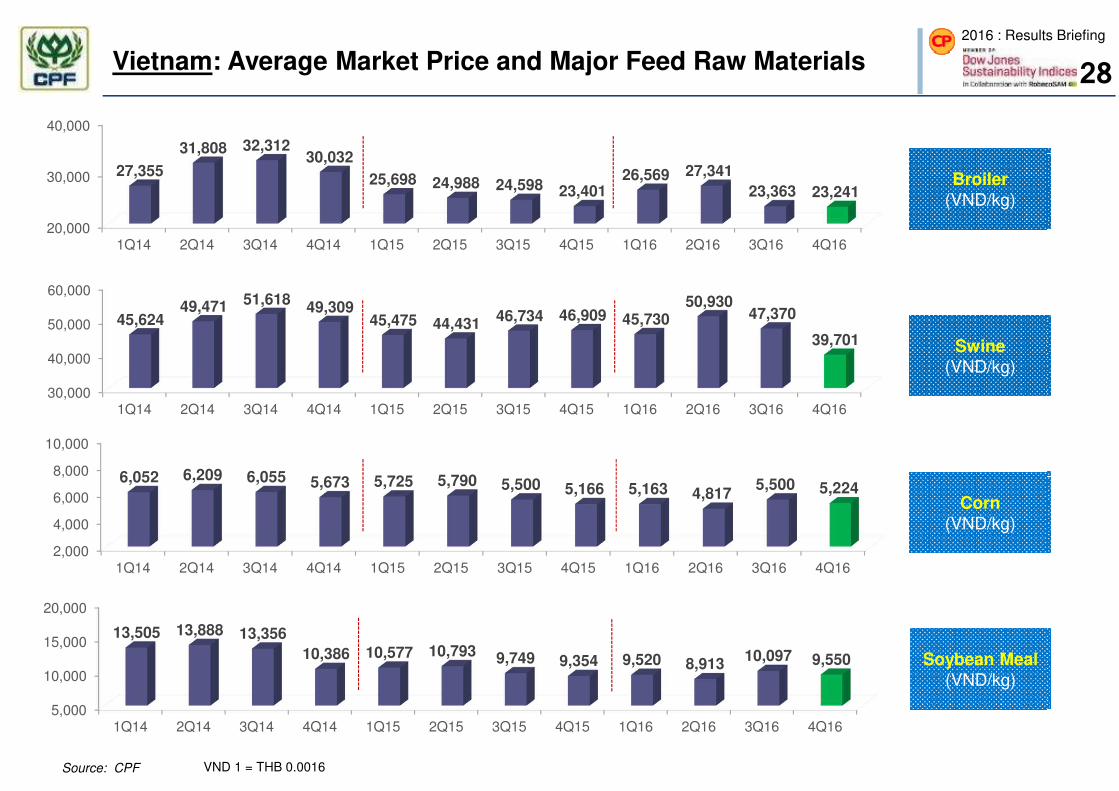
Vietnam: Average Market Price and Major Feed Raw Materials
Source: CPF VND 1 = THB 0.0016
20,000
30,000
40,000
1Q14 2Q14 3Q14 4Q14 1Q15 2Q15 3Q15 4Q15 1Q16 2Q16 3Q16 4Q16
27,355
31,808 32,31230,032
25,698 24,988 24,598 23,40126,569 27,341
23,363 23,241Broiler
(VND/kg)
30,000
40,000
50,000
60,000
1Q14 2Q14 3Q14 4Q14 1Q15 2Q15 3Q15 4Q15 1Q16 2Q16 3Q16 4Q16
45,62449,471 51,618
49,30945,475 44,431
46,734 46,909 45,73050,930
47,370
39,701
2,000
4,000
6,000
8,000
10,000
1Q14 2Q14 3Q14 4Q14 1Q15 2Q15 3Q15 4Q15 1Q16 2Q16 3Q16 4Q16
6,052 6,209 6,055 5,673 5,725 5,790 5,500 5,166 5,163 4,8175,500 5,224
5,000
10,000
15,000
20,000
1Q14 2Q14 3Q14 4Q14 1Q15 2Q15 3Q15 4Q15 1Q16 2Q16 3Q16 4Q16
13,505 13,888 13,356
10,386 10,577 10,793 9,749 9,354 9,520 8,91310,097 9,550
Swine(VND/kg)
Corn(VND/kg)
Soybean Meal (VND/kg)
28

2016 : Results Briefing
Turkey: Average Market Price and Major Feed Raw Materials
Source: CPF TRY 1 = THB 11.26
0.00
2.00
4.00
1Q14 2Q14 3Q14 4Q14 1Q15 2Q15 3Q15 4Q15 1Q16 2Q16 3Q16 4Q16
2.74 2.84 2.84 2.81 2.76 2.76 2.86 2.87 2.73 2.78 2.78 2.83
0.00
0.50
1.00
1Q14 2Q14 3Q14 4Q14 1Q15 2Q15 3Q15 4Q15 1Q16 2Q16 3Q16 4Q16
0.690.78 0.75 0.68 0.72 0.76 0.74 0.70 0.72 0.75 0.81 0.74
0.00
1.00
2.00
1Q14 2Q14 3Q14 4Q14 1Q15 2Q15 3Q15 4Q15 1Q16 2Q16 3Q16 4Q16
1.55 1.441.28 1.16 1.20
1.66 1.54 1.491.18 1.08
1.261.43
Broiler (TRY/kg)
Corn(TRY/kg)
Soybean Meal (TRY/kg)
29

2016 : Results Briefing
India: Average Market Price and Major Feed Raw Materials
Source: CPF Rs 1 = THB 0.52
0.0
50.0
100.0
1Q14 2Q14 3Q14 4Q14 1Q15 2Q15 3Q15 4Q15 1Q16 2Q16 3Q16 4Q16
66.5 67.3 66.9 63.4 56.872.5
57.7 59.572.0
86.3
68.1 66.4
100.0
200.0
300.0
400.0
500.0
1Q14 2Q14 3Q14 4Q14 1Q15 2Q15 3Q15 4Q15 1Q16 2Q16 3Q16 4Q16
450
308 333 311 297256 265
330 355 326 318360
0.0
10.0
20.0
30.0
1Q14 2Q14 3Q14 4Q14 1Q15 2Q15 3Q15 4Q15 1Q16 2Q16 3Q16 4Q16
13.3 14.2 14.2 13.2 13.7 14.2 15.7 16.1 15.7 16.318.7
15.9
10.0
20.0
30.0
40.0
50.0
60.0
1Q14 2Q14 3Q14 4Q14 1Q15 2Q15 3Q15 4Q15 1Q16 2Q16 3Q16 4Q16
37.744.7 41.8
33.1 32.637.5 34.0 37.4 36.9 40.1 36.7
28.9
Broiler (Rs/kg)
Shrimp(60 pieces)
(Rs/kg)
Corn(Rs/kg)
Soybean Meal (Rs/kg)
30
Kitchen of The World
Appendix C: Product Sample & Retail Outlet Format
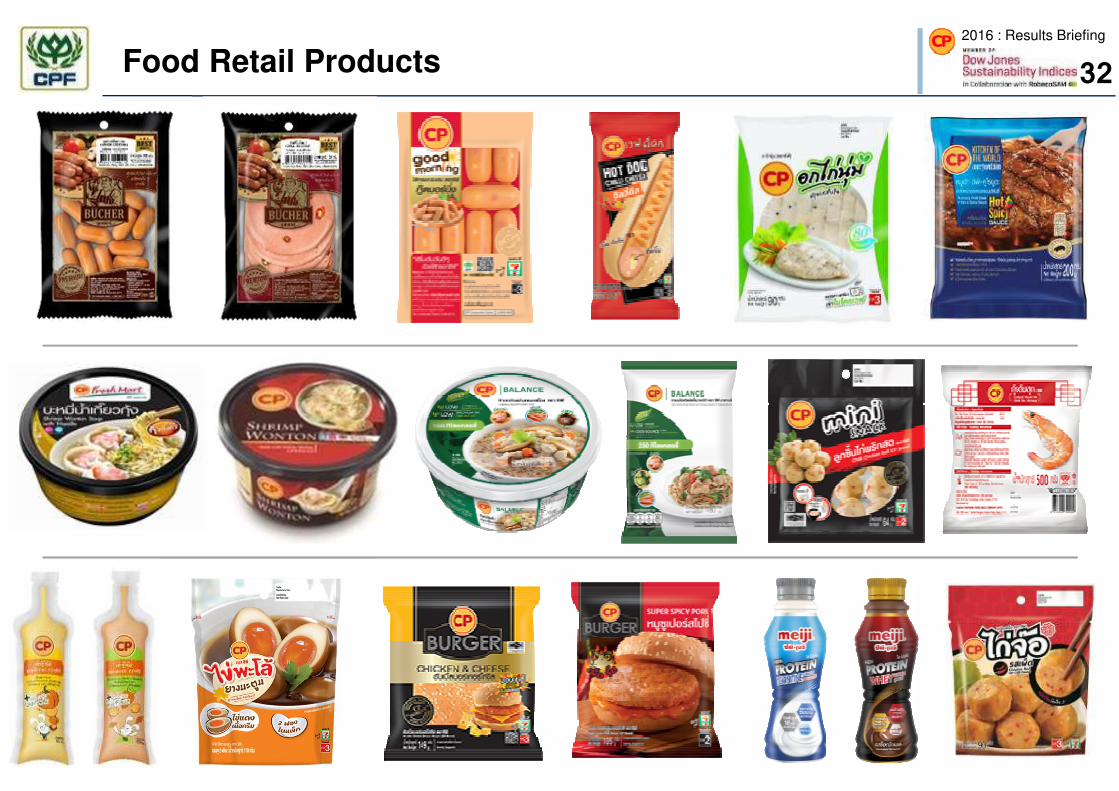
2016 : Results Briefing
Food Retail Products 32
2016 : Results Briefing
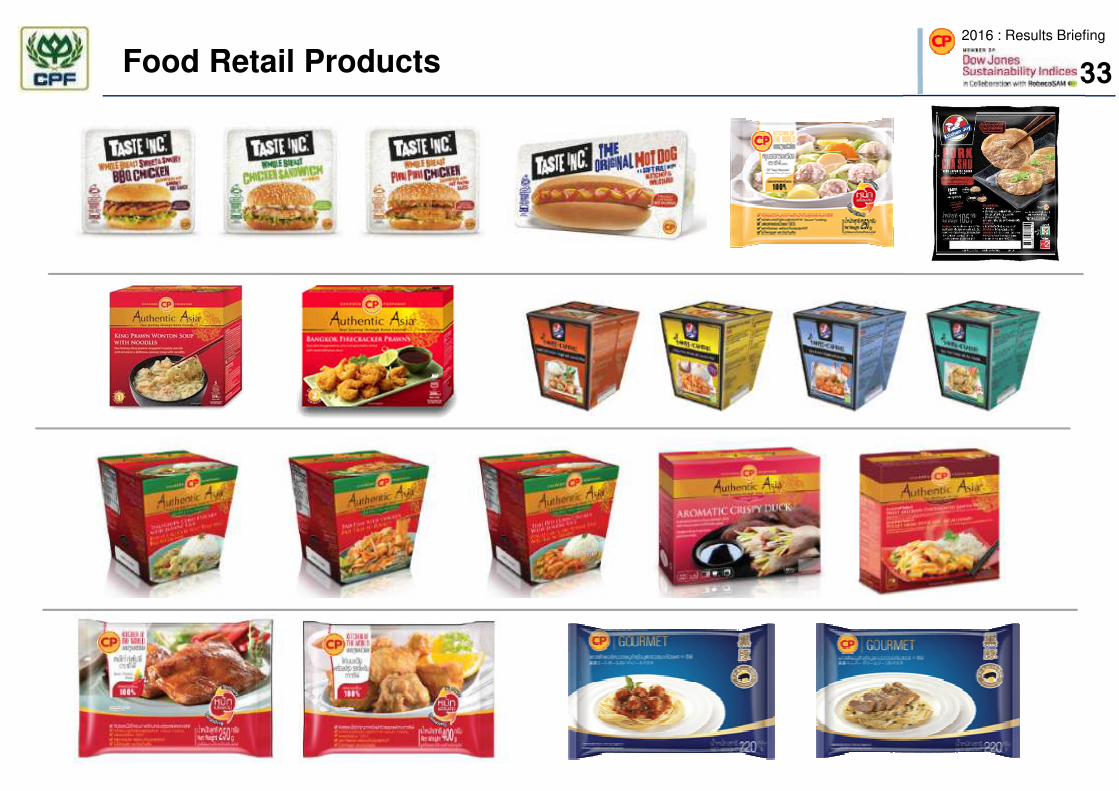
Food Retail Products 33
2016 : Results Briefing
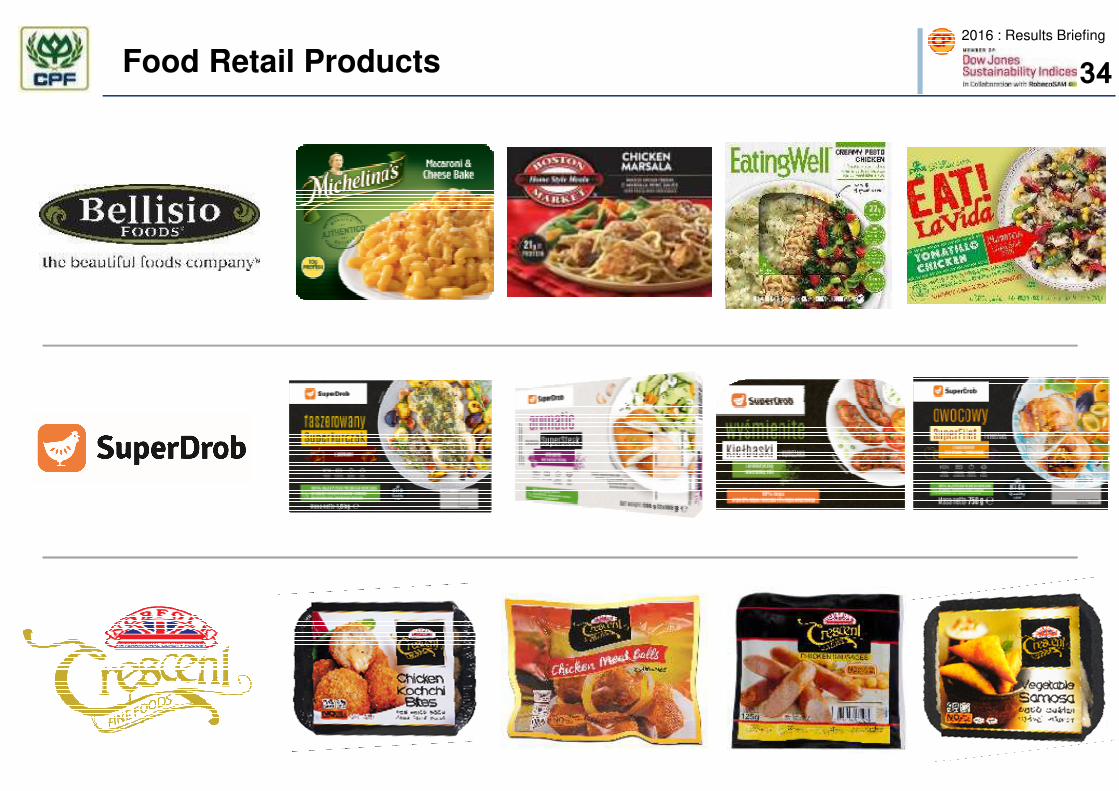
Food Retail Products 34
2016 : Results Briefing
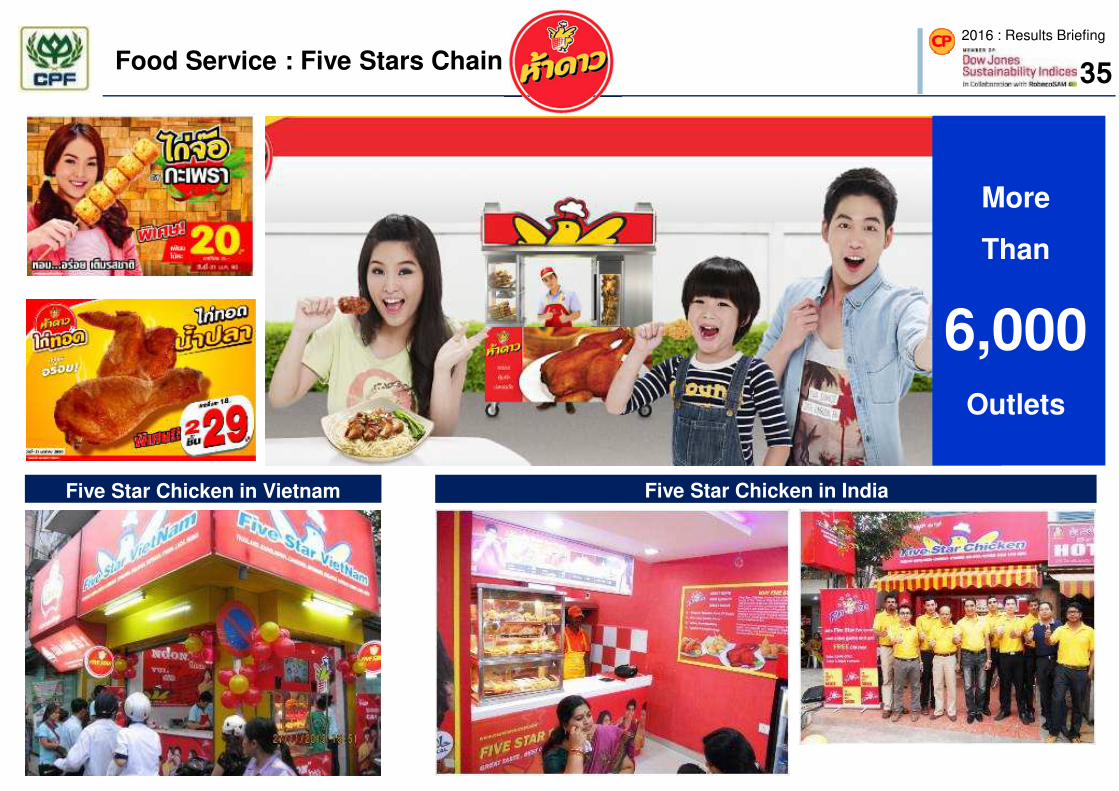
Five Star Chicken in Vietnam
Food Service : Five Stars Chain
Five Star Chicken in India
More
Than
6,000Outlets
35

2016 : Results Briefing
Food Service : Chester’s
198 Outlets
36

2016 : Results Briefing
Food Retail Outlets
409 Stores
5 Stores
37

2016 : Results Briefing
CP CHOZEN LIMITED
18 Kiosks
38

Appendix D: Highlights: 4Q16 results

2016 : Results Briefing
4Q15 4Q16
1,549 1,739
4Q16 Results Highlights
+9%Y-o-Y
Net profit margin
4Q15 1.41%
4Q16 1.45%
0.04
Gross profit margin
4Q15 13.8%
4Q16 13.0%
0.8%
+3%Y-o-Y +12%Y-o-Y
Consolidated Revenue (THB millions)
Gross Profit(THB millions)
Net Profit(THB millions)
4Q15 4Q16
109,576 119,626
Consolidated sales 9% Y-o-Y
4Q15 4Q16
15,103 15,622
40

2016 : Results Briefing
Thai-Livestock Thai-Aqua Overseas-Livestock Overseas-Aqua TOTAL
36,451
7,888
58,652
6,585
109,576
37,731
7,799
66,916
7,180
119,626
4Q16: Sales & Gross Profit Margin by Business
13.5% 12.5%GPM 8.5% 7.5% 15.3% 14.4% 8.0% 10.1% 13.8% 13.1%
+9%In THB, m
4Q16
4Q15
OPM 2.2% 3.4% -1.1% 0.3% 6.7% 4.3% -0.8% 1.4% 4.2% 3.6%
+14%
-1%
+4%
9%
41
2016 : Results Briefing
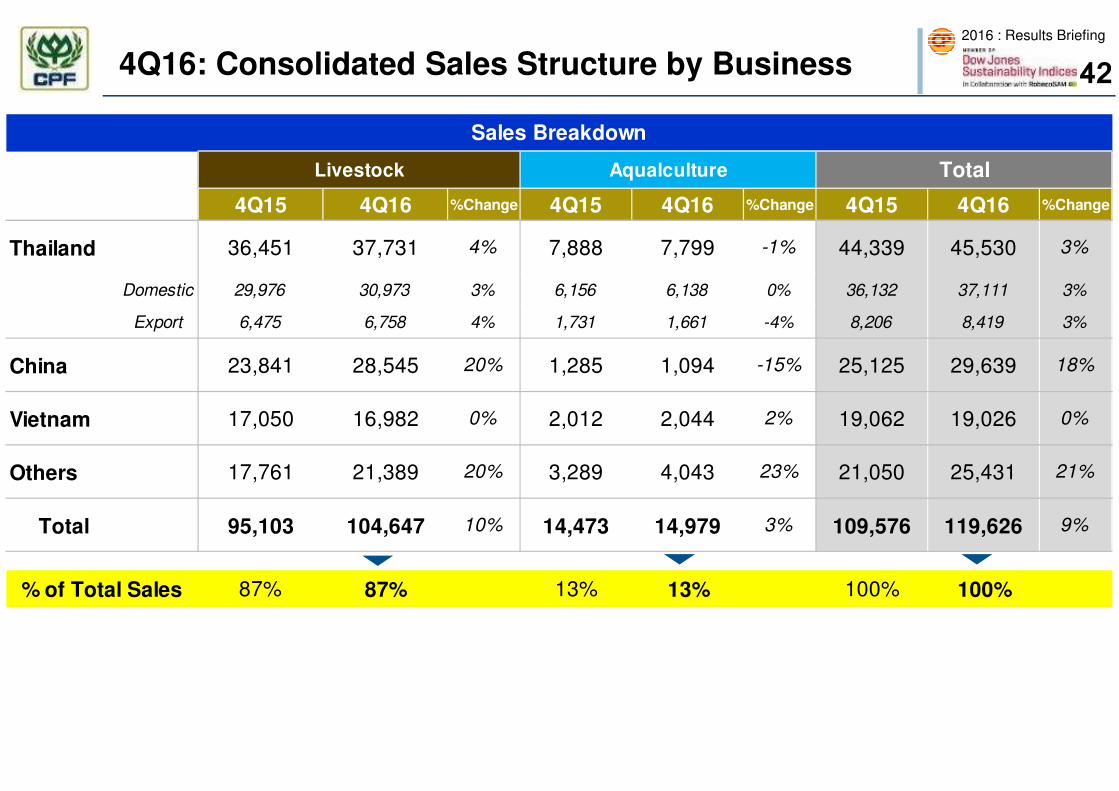
4Q15 4Q16 %Change 4Q15 4Q16 %Change 4Q15 4Q16 %Change
Thailand 36,451 37,731 4% 7,888 7,799 -1% 44,339 45,530 3%
Domestic 29,976 30,973 3% 6,156 6,138 0% 36,132 37,111 3%
Export 6,475 6,758 4% 1,731 1,661 -4% 8,206 8,419 3%
China 23,841 28,545 20% 1,285 1,094 -15% 25,125 29,639 18%
Vietnam 17,050 16,982 0% 2,012 2,044 2% 19,062 19,026 0%
Others 17,761 21,389 20% 3,289 4,043 23% 21,050 25,431 21%
Total 95,103 104,647 10% 14,473 14,979 3% 109,576 119,626 9%
87% 87% 13% 13% 100% 100%% of Total Sales
Sales Breakdown
TotalLivestock Aqualculture
4Q16: Consolidated Sales Structure by Business 42

2016 : Results Briefing
4Q16: Consolidated Sales by Products 43
4Q15 4Q16 %Change 4Q15 4Q16 %Change 4Q15 4Q16 %Change 4Q15 4Q16 %Change
Thailand 12,116 12,626 4% 20,488 21,143 3% 11,735 11,761 0% 44,339 45,530 3%
Domestic 12,053 12,577 4% 18,509 18,969 2% 5,570 5,565 0% 36,132 37,111 3%
Export 63 49 22% 1,979 2,174 10% 6,165 6,196 1% 8,207 8,419 3%
China 25,065 27,349 9% 0 515 100% 60 1,775 2858% 25,125 29,639 18%
Vietnam 7,326 8,375 14% 11,249 10,138 -10% 487 513 5% 19,062 19,026 0%
Others 8,150 8,839 8% 11,232 14,061 25% 1,669 2,532 52% 21,050 25,432 21%
52,657 57,189 9% 42,968 45,857 7% 13,950 16,580 19% 109,576 119,626 9%Total
Sales Breakdown by Products
Feed Farm Food Total
Kitchen of The World
Appendix E: Export Destination

2016 : Results Briefing
49%
43%
4%4%
Asia EU USA Others
2016: Thailand Operations – Export Destination
61%
35%
2%2%
Asia EU USA Others
Farm
THB 7,393 million +21%
Food
THB 21,179 million +5%
Asia
EU
USA
Asia
EU
USAOthersOthers
45
Disclaimer
Investor Relations Office
Charoen Pokphand Foods Public Company Limited
313 C.P.Tower Building, 26th Floor, Silom Road, Bangrak, Bangkok 10500, Thailand
Tel. Ms.Kobboon S. (662) 625-8353 / Mr.Warrawut T. (662) 625-8355 / Mr.Savin W. (662) 625 8397
Fax.(662) 638-2942
www.cpfworldwide.com
Email : [email protected] / [email protected] / [email protected]
“This presentation contains some information from other sources, that CPF does not make any
representations regarding the use, validity, accuracy, or reliability of, or the results of the use of information,
data but not limited to, all text, and images (“the Content”) on this presentation. Some content may contain
forward-looking statements, that based on management’s view upon the information currently available to
us. These statement are subject to certain risks and uncertainties that could cause the actual results
materially differed from what had been previously stated.
The Content and the Forward-looking statements state within this presentation only as the date they made.
The Company undertakes no responsibility on the change after that date stated herein.”
The material set forth herein is for informational purposes only. It should not be construed, as an offer of
securities for sale.


![EESC hearing on Sustainable Consumption and Production, 10 December 2008 1 - [Lars Fogh Mortensen] Unsustainable consumption and production a big mouthful.](https://static.fdocuments.us/doc/165x107/5697bf871a28abf838c888bd/eesc-hearing-on-sustainable-consumption-and-production-10-december-2008-1.jpg)