Evaluation Sceptor Microdilution Antibiotic Susceptibility ... · 0095-1137/81/010184-11$02.00/0...
11
Vol. 13, No. 1 JOURNAL OF CLINICAL MICROBIOLOGY, Jan. 1981, p. 184-194 0095-1 137/81/010184-11$02.00/0 Evaluation of the Sceptor Microdilution Antibiotic Susceptibility Testing System: a Collaborative Investigation RONALD N. JONES,I* CLYDE THORNSBERRY,2 ARTHUR L. BARRY,3 AND THOMAS L. GAVAN4 Department of Pathology, Kaiser Foundation Laboratory, Clackamas, Oregon 97015'; Antimicrobics Investigations Section, Center for Disease Control, Atlanta, Georgia 303332; Clinical Microbiology Laboratory, University of California, Davis Medical Center, Sacramento, California 958173; and Department of Microbiology, The Cleveland Clinic Foundation, Cleveland, Ohio 441064 A multiwell, dried antimicrobial agent susceptibility test system, Sceptor (BBL Microbiology Systems, Cockeysville, Md.), was tested. The system was compared directly with a reference microdilution method by using two collections of stock cultures and 305 fresh clinical isolates. Sceptor was found to be in agreement (±1 log2 dilution) with the reference microdilution method in 96.9 to 98.3% of 9,840 minimal inhibitory concentration determinations performed on stock strains and 95.0% of 7,308 minimal inhibitory concentrations obtained from the clinical isolates. The intralaboratory and interlaboratory reproduciblility on stock strains was 97.6 and 97.2%, respectively. The intralaboratory reproducibility for the clinical isolates was 96.9%. Sceptor accurately categorized representative chal- lenge strains of methicillin-resistant staphylococci, beta-lactamase-producing bac- teria, organisms producing other antimicrobial agent-inactivating enzymes, and permeability mutants as resistant. Only 0.2% very major errors (false-sensitive minimal inhibitory concentrations by Sceptor) were identified among the clinical isolate test results, the majority being clinically insignificant. The product is accurate and reliable, has a long shelf life, and seems applicable for routine use in clinical laboratories. The broth microdilution procedure for quan- titative antimicrobial susceptibility testing has become an acceptable alternative to the more cumbersome and often impractical agar and broth tube methods (1, 2, 5-9, 11, 12, 14-16). The rapid emergence of commercial microdilu- tion products has made the quantitative suscep- tibiity procedure readily available to most clin- ical microbiology laboratories. Some of these products (Micro-Media System, Sensititre, AST, and 3M-MPS) have been evaluated and found satisfactory for use in the clinical laboratory (2, 6, 8, 11, 12, 14, 15; E. H. Gerlach et al., manu- script in preparation). In addition, several sem- iautomated broth-dispensing devices (Dynatech MIC 2000, Sandy Springs Instruments Quick Spense II, and the Anderson Dispenser) which enable economical and rapid in-laboratory tray production may be purchased. Two main differences in form have appeared among the commercially prepared microdilution products; a frozen tray with a relatively short shelf life and easy replicate inoculation and a second form that has dried antimicrobial agents in plastic trays needing broth rehydration com- bined with or followed by organism inoculation. Systems of the latter form have extended prod- uct shelf life to approximately 1 year stored at room temperature (6, 8). Even with these pro- cedural modifications of the microdilution method, the commercial products have been shown to produce test results, minimum inhibi- tory concentrations (MICs), comparable to those obtained with the World Health Organization International Collaborative Study broth method and the microdilution broth method utilizing trays manufactured in the clinical laboratory (2, 3, 6, 8, 11, 12, 14, 15). In this study we evaluate a new commercial microdilution product, the Sceptor system (BBL Microbiology Systems, Cockeysville, Md.) The Sceptor antimicrobial susceptibility test (SAST) system uses 84-well plastic trays containing dried antimicrobial agents at concentrations for determining the MICs of 12 drugs (log2 dilution scales, see Table 1). Unlike other dried antimi- crobial products that use Mueller-Hinton broth (Difco Laboratories, Detroit, Mich.) with or without divalent cation supplement, the SAST system employs a special medium formulation said to contain cations and produce MICs similar to those in Mueller-Hinton broth. The trays and susceptibiity test broth are manufactured by BBL Microbiology Systems. This collaborative effort of four medical centers used sample lots of three SAST tray designs tested directly 184 on January 26, 2019 by guest http://jcm.asm.org/ Downloaded from
Transcript of Evaluation Sceptor Microdilution Antibiotic Susceptibility ... · 0095-1137/81/010184-11$02.00/0...

Vol. 13, No. 1JOURNAL OF CLINICAL MICROBIOLOGY, Jan. 1981, p. 184-1940095-1 137/81/010184-11$02.00/0
Evaluation of the Sceptor Microdilution AntibioticSusceptibility Testing System: a Collaborative Investigation
RONALD N. JONES,I* CLYDE THORNSBERRY,2 ARTHUR L. BARRY,3 AND THOMAS L. GAVAN4Department of Pathology, Kaiser Foundation Laboratory, Clackamas, Oregon 97015'; AntimicrobicsInvestigations Section, Center for Disease Control, Atlanta, Georgia 303332; Clinical MicrobiologyLaboratory, University of California, Davis Medical Center, Sacramento, California 958173; and
Department ofMicrobiology, The Cleveland Clinic Foundation, Cleveland, Ohio 441064
A multiwell, dried antimicrobial agent susceptibility test system, Sceptor (BBLMicrobiology Systems, Cockeysville, Md.), was tested. The system was compareddirectly with a reference microdilution method by using two collections of stockcultures and 305 fresh clinical isolates. Sceptor was found to be in agreement(±1 log2 dilution) with the reference microdilution method in 96.9 to 98.3% of9,840 minimal inhibitory concentration determinations performed on stock strainsand 95.0% of 7,308 minimal inhibitory concentrations obtained from the clinicalisolates. The intralaboratory and interlaboratory reproduciblility on stock strainswas 97.6 and 97.2%, respectively. The intralaboratory reproducibility for theclinical isolates was 96.9%. Sceptor accurately categorized representative chal-lenge strains of methicillin-resistant staphylococci, beta-lactamase-producing bac-teria, organisms producing other antimicrobial agent-inactivating enzymes, andpermeability mutants as resistant. Only 0.2% very major errors (false-sensitiveminimal inhibitory concentrations by Sceptor) were identified among the clinicalisolate test results, the majority being clinically insignificant. The product isaccurate and reliable, has a long shelf life, and seems applicable for routine use inclinical laboratories.
The broth microdilution procedure for quan-titative antimicrobial susceptibility testing hasbecome an acceptable alternative to the morecumbersome and often impractical agar andbroth tube methods (1, 2, 5-9, 11, 12, 14-16).The rapid emergence of commercial microdilu-tion products has made the quantitative suscep-tibiity procedure readily available to most clin-ical microbiology laboratories. Some of theseproducts (Micro-Media System, Sensititre, AST,and 3M-MPS) have been evaluated and foundsatisfactory for use in the clinical laboratory (2,6, 8, 11, 12, 14, 15; E. H. Gerlach et al., manu-script in preparation). In addition, several sem-iautomated broth-dispensing devices (DynatechMIC 2000, Sandy Springs Instruments QuickSpense II, and the Anderson Dispenser) whichenable economical and rapid in-laboratory trayproduction may be purchased.Two main differences in form have appeared
among the commercially prepared microdilutionproducts; a frozen tray with a relatively shortshelf life and easy replicate inoculation and asecond form that has dried antimicrobial agentsin plastic trays needing broth rehydration com-bined with or followed by organism inoculation.Systems of the latter form have extended prod-uct shelf life to approximately 1 year stored at
room temperature (6, 8). Even with these pro-cedural modifications of the microdilutionmethod, the commercial products have beenshown to produce test results, minimum inhibi-tory concentrations (MICs), comparable to thoseobtained with the World Health OrganizationInternational Collaborative Study broth methodand the microdilution broth method utilizingtrays manufactured in the clinical laboratory (2,3, 6, 8, 11, 12, 14, 15).
In this study we evaluate a new commercialmicrodilution product, the Sceptor system (BBLMicrobiology Systems, Cockeysville, Md.) TheSceptor antimicrobial susceptibility test (SAST)system uses 84-well plastic trays containingdried antimicrobial agents at concentrations fordetermining the MICs of 12 drugs (log2 dilutionscales, see Table 1). Unlike other dried antimi-crobial products that use Mueller-Hinton broth(Difco Laboratories, Detroit, Mich.) with orwithout divalent cation supplement, the SASTsystem employs a special medium formulationsaid to contain cations and produce MICs similarto those in Mueller-Hinton broth. The trays andsusceptibiity test broth are manufactured byBBL Microbiology Systems. This collaborativeeffort of four medical centers used sample lotsof three SAST tray designs tested directly
184
on January 26, 2019 by guesthttp://jcm
.asm.org/
Dow
nloaded from

SCEPTOR SYSTEM EVALUATION 185
against broth microdilution trays (10) preparedin each of the participating laboratories.
MATERIALS AND METHODS
Bacteria tested. The tested organisms were proc-
essed in three phases. Twenty-six bacterial strainswere each tested (phase 1) by the two microdilutionprocedures on 3 separate days in three participatinglaboratories (The Cleveland Clinic Foundation, KaiserFoundation Laboratory, and University of California[U.C.] Davis Medical Center). The organisms testedwere utilized in previous studies (2, 6), with one addi-tional strain, Streptococcus faecalis CDC/2030, pro-
vided by C. Thornsberry. Bacteria having the prefix Kwere originally obtained from the Kaiser FoundationLaboratory, those having the prefix C were from TheCleveland Clinic Foundation, and those having theprefix CDC were from the Antimicrobics Investiga-tions Section, Center for Disease Control. Where ap-
plicable an American Type Culture Collection (ATCC)number is indicated for reference. These bacterialstrains were selected to maximize the number ofMICsthat fall within the seven-dilution-step concentrationrange provided by the SAST (2, 6). Only those MICs-1 dilution removed from the extremes of the concen-
tration range were considered to be "on-scale" end-points, considering that the biological variabiity ofthe test method is ±1 log2 dilution interval. Thesestrains were further selected to provide, where possi-ble, four or more on-scale MICs for each antimicrobialagent, determined by testing four or more species.Three SAST tray types were used in phase 1. TheRMD trays were produced to stimulate the antimicro-bial agent concentrations and ranges found in theSAST.An additional 176 bacteria were tested in phase 2.
All tests were performed at the Center for DiseaseControl by using bacterial strains specifically selectedto represent those organisms possessing antimicrobialresistance and susceptibility to all tested drugs (13).The distribution of species was as follows: Staphylo-coccus aureus, 20; S. epidermidis, 9; Streptococcusfaecalis, 11; S. bovis, 4; S. durans, 2; S. equinis, 1; S.faecium, 2; Escherichia coli, 29; Enterobacter aero-
genes, 11; E. cloacae, 6; E. agglomerans, 1; Serratialiquefaciens, 3; S. marcescens, 6; Proteus mirabilis,10; P. vulgaris, 4; Providencia rettgeri, 4; P. stuartii,3; Shigella spp., 3; Salmonella spp., 3; Hafniae alvei,1; Morganella morganii, 1; Klebsiella oxytoca, 2; K.pneumoniae, 8; Acinetobacter calcoaceticus subsp.anitratus, 3; and Pseudomonas aeruginosa, 29. Thesestrains include representative isolates having inacti-vating enzymes (constitutive and plasmid mediated),cell wall permeability mutations, and other resistancemechanisms (methicillin-resistant S. aureus). All iso-lates were tested on urine trays and a second tray as
directed by the gram stain characteristics of the or-
ganism. All SAST MICs having 22 dilution variationfrom the RMD MIC were repeated in triplicate.
In phase 3, 305 fresh clinical bacterial isolates weretested. These bacteria were tested by directly compar-ing the SAST and RMD MICs. The Cleveland ClinicFoundation tested gram-negative bacilli (100 isolates),the Kaiser Foundation Laboratory tested the urinary
tract pathogens (105 isolates), and the U.C. DavisMedical Center processed the gram-positive strains(100 isolates). All isolates were tested on two occasionsnot more than 48 h apart, with the first trial not morethan 48 h after the original clinical isolation. Thebacteria were identified to species level by the APIsystem (Analytab Products, Cattle Place, N.Y.) or acomparable method (4). A maximum of 25% E. coliwas allowed in the gram-negative and urine series, anda maximum of 50% S. aureus was allowed in the gram-positive test group. Minimal numbers of Klebsiella,Enterobacter, Serratia, P. mirabilis, pseudomonads,and indole-positive Proteus spp. were required in thegram-negative and urinary tract groups. Enterococciand S. epidermidis were required in the gram-positiveseries. Organisms sensitive and resistant to each drugtested were found in each study population.
Antimicrobial agent susceptibility testing. TheRMD test trays were prepared in each of the fourparticipating laboratories by using either the Dyna-tech MIC 2000 (Dynatech Laboratories, Inc., Alexan-dria, Va.) or the Quick Spense II (Sandy SpringsInstrument Co., Ijamsville, Md.) for broth dispensing(10). Each laboratory was provided with common lotsof antimicrobial powders with known potency (micro-grams per milligram of weight) and Mueller-Hintonbroth having a known divalent cation content. Allparticipants then prepared serial dilutions of each drugin the Mueller-Hinton broth supplemented to 50 mgof calcium per liter and 25 mg of magnesium per literas previously reported (6, 8). The inocula were pre-pared as follows. By a sterile technique, four or fiveisolated colonies derived from a stock or fresh culturewere picked from an overnight blood agar subculture;colonies were then inoculated into 0.5-ml brain heartinfusion broth; the brain heart infusion broth was
TABLE 1. SASTpanels and the testedantimicrobial agent concentrations after the
addition of 100 1il of brothRange of concn
Antimicrobial agent Gram Grampositive negative Urine
Ampicillin 0.25-16 0.25-16 8-512Carbenicillin NAa 4-256 16-1024Methicillin 0.12-8 NA NAPenicillin G 0.12-8 NA NACefamandole 0.5-32 1-64 4-256Cefoxitin NA 1-64 4-256Cephalothin 0.5-32 1-64 4-256Amikacin 1-32 0.5-32 1-64Gentamicin 0.12-8 0.25-16 0.5-32Kanamycin NA 0.5-32 4-256Tobramycin 0.12-8 0.25-16 0.5-32Chloramphenicol 0.5-32 0.5-32 NAClindamycin 0.12-8 NA NAErythromycin 0.12-8 NA NANitrofurantoin NA NA 2-64Tetracycline 0.25-16 0.5-16 1-64Trimethoprim/ NA 0.12-8b 0.25-16
sulfamethoxazolea NA, Not available.bDenotes trimethoprim concentration only.
VOL. 13, 1981
on January 26, 2019 by guesthttp://jcm
.asm.org/
Dow
nloaded from
186 JONES ET AL.
e00 OO eO DEA VI VI A
Z t tz tt ,z
:+Ci Ci Cli66C 00 00AA A
CqCI- cIl CSi
c VVIVI VI VI A A VI
o) o6 66t 6oo
H VlIVI VlIVI AA VI
E- E- E- E- E- E- E-iz z z z z z z
0 VI VI VI VI VI VIEVVI VIV VI VI
Ea VIVI VIVI VI VI
1È¢ VIVI VIVIVI VI VI
E Le( Lf Lfe LO I
D VIVI VIVI VI VI
E- E- E- E- E- E- E-i
> ~ ~~C CD leCDe
< VIVI VI VI VI
<._
Z .E cE- COD
._ ee - O
co CdC C Cd
E-: Vl l lVlV
=0 .H .HaHo ¢S¢E
OL $.. L. L.=
ct cqi C, CI
E-
00A
cl
6
VI
-
Z6
VI
VI6
VI
6VI
6VI
VlE-
ZVl
6
C¢Q
VI
E-
cDl ul LONO OO CO
VI
EE- E-E~- 0
CDC>1
66 66Ô 0 0000VI VI VI VI
00 l 00~
CDlLC eluqVI VI m
E-E~- E- E- 0z z z z
C
C' U'. Cq ul
VI VI
VI VI mA
Lq q U LqLVI VI VI VI
Li Li Li qVI VI VI VI
L LOOO .- - e i C`
CDlDl CDl C 00 00AA
ZZ ZZ
ce~~~~~c
Cd CODQX eQ *l
< o a
V . .2Q
ce cq C<
e eA
000 000 00~A A A A
000cc 000
Dler ec00 e.c
cI~0li 00 DlCD CD C0: C0Q
c_
CCO _D _O~
A A A A
cec c ceac_ -
c c ce ce rceci
000 00 00 00 00A A A A A A
VI VI VI
_ _ _-_ l -
aE- E- aE-
s-
vCo
CqÀ
r>
cN
z
V.>
Cr ¢ r>m¢-icq t c
J. CLIN. MICROBIOL.
le cm Cm
(DO 00
Dl cl
00 00
00 00
Nq 00
00 "Dl CD1-
eC 00-4
CS eoA
Cq CD
C-1 CqDl e
A A
le CS0
_ e
e -
Z ¢Q: cn
A
000
ce
A AS
Dlq cea
oo m
e e
C: C
A A
c' Cli
CSq
COD_
Vl
00 00
Z- e
VI
C/)
cq
zc
-6
11s
-4
-C
11
c1
-6
i-6
c
90.
e
on January 26, 2019 by guesthttp://jcm
.asm.org/
Dow
nloaded from

SCEPTOR SYSTEM EVALUATION 187
- 4 -q cq N
VI VI VI VI VI VI
c_C0 CD00
A A
00 l 00 ~ CDC
VI
cq4 C4 Cl Cq
ul~ LO
VI VI
cs s -~ - -
C4Scc _
CN CrN c
>U0
VI VI
00 00AA
00 lVI
le DG-
VI
> 0VI VI
le_
VI VI
o G>0>cc
Vl VI
E- E-
zz
VI VI
CD -
00 DG
AAci CYD
ci ci
A A
mo m
A A
0 00
CD DG_ C',
CD CD>0>UA A
A A
CD CDA A
E-E-
CD Xo
A A
00 DG
A A
A A
cD CD
CDmCA A>DG CNI
00 00
00 CD"-
CD CD>0>0
A A
CD CDe U>
DG DG
A ACO eo
CD Cq
A A
CO Co
E-E-
A A
'CME--$ Q E a E E
X E~.:OgC
àZ N ; 44
esI C
VI VI
0000
l:e
-4 CqVl
_>0>
P- c.q
VI
Vl VI
E- E-tzz
CD CC
E-
O-
A
VI
DG DG
> 0VI VI
_- _q
_G _
VI VI
E--zz
CD 00>0 DG
CQ _-
x M
=¢
-- - -
VI VI VI VI
-- 4
CD CD t
qC'4D 00 00
csi 66a
00 00 cqC
Cl Cicq1'-4 660
VI VI
00 l -4-4
00 00 CD
AA
-- CD00VI VI C0 'G
EC-Ec-
E- E-zz
C 00LO cq>0 D
cqD-
M E-xEVe G
E-- E-zz
VI VI
CD 00
E-
lz Go
VI VI
cq cq
00 CI
>0>0
CS niA A~oo
Vl Vl
A
C4A
E-E-zz
A A
FE-
DG
%- C.>u
C.>_ 9 ~~~oz
vo
u 0
E. u
VOL. 13, 1981
00CD 00P-
A A A A
AA A A
CDq Cq cr
Cq " _- Cq
C'1 Cq4_i _Co oVI VID4q C~4
E- E-zz
66
LO UD
_q Cq
"-4 C~4
00 le
VI VI
-0
zz
00 leVI
leo q
H
o.0
noH
OO
5
G>
O
.0
o.C)
Q
v
æ
4
QdE4
c
.0
M.
E
c
o
cc
-b
.s
.0
G)C.
CGr
cc
*.à
riz...
Eb-i
VI VI
E- E-zz
Vl Vl
_AA A
>0 0
A A
_ 00AA
CD 00
CD CD
CE
.0
A o
C _
G) .X Q
° O>.
a)
o-O
o.0
. .
a)E
.-a
Go
>4
G)we
.
DG DGC', C'q
DG m
E- -
VI VICD
Cq C4
C.>
z-
OQ
L _
, o
DG DG
CD DG
_l C4
VI VI
VI VI
CD DG
00
t-
40
G)
i.
on January 26, 2019 by guesthttp://jcm
.asm.org/
Dow
nloaded from

188 JONES ET AL.
incubated for 4 to 6 h at 35°C; an inoculum of 10'colony-forming units per ml was prepared in approxi-mately 25 to 30 ml of sterile distilled or deionizedwater, mixed thoroughly, poured into a disposableinoculum tray (Cooke), and inoculated by a Dynatech(Cooke) semiautomated inoculator said to deliver 1jul to each well. The test inoeulum dilution procedureswere designed to yield a final concentration of 5 x 10⁴to 5 x 10⁵ colony-forming units per ml. The trays werethen sealed with clear plastic tape and incubated at35°C for 15 to 18 h. The MICs were independentlyread in each laboratory by two experienced technolo-gists using the Dynatech mirror reader. Discrepantresults were arbitrated by a third observer. To verifypurity and final inoculum density in the trays, quan-titative subcultures were routinely made from thegrowth or turbidity control well. Nearly all inoculawere within the target concentration range (5 x 10⁴ to5 x 105 colony-forming units per ml). Variations weresimilar to those previously described (6) and did notcontribute to significant MIC alteration.The SAST procedure was performed in the three
antimicrobial tray designs provided to each laboratory.The laboratories received plastic trays from 11 lotsvarying from approximately 1 to 6 months from man-ufacture. The products were handled in accordancewith the manufacturers recommendations as follows.The inoculum prepared from the subcultures used forthe reference microdilution method and grown to tur-bidity in Trypticase soy broth (BBL) was then furtherdiluted to approximately 105 colony-forming units perml in BBL susceptibility test broth by using disposableplastic loops. By using a seven-channel micropipettor,100 jul of this inoculum was transferred to each well ofthe test tray, and then the trays were covered withsolid plastic lids and incubated to ambient air at 35°Cfor 15 to 18 h. MICs were read for the presence orabsence of visible turbidity by using a viewer-recordingdevice by the methods described above. Similar inoc-ulum purity and concentration results were verified aspreviously described for the RMD method.
RESULTS
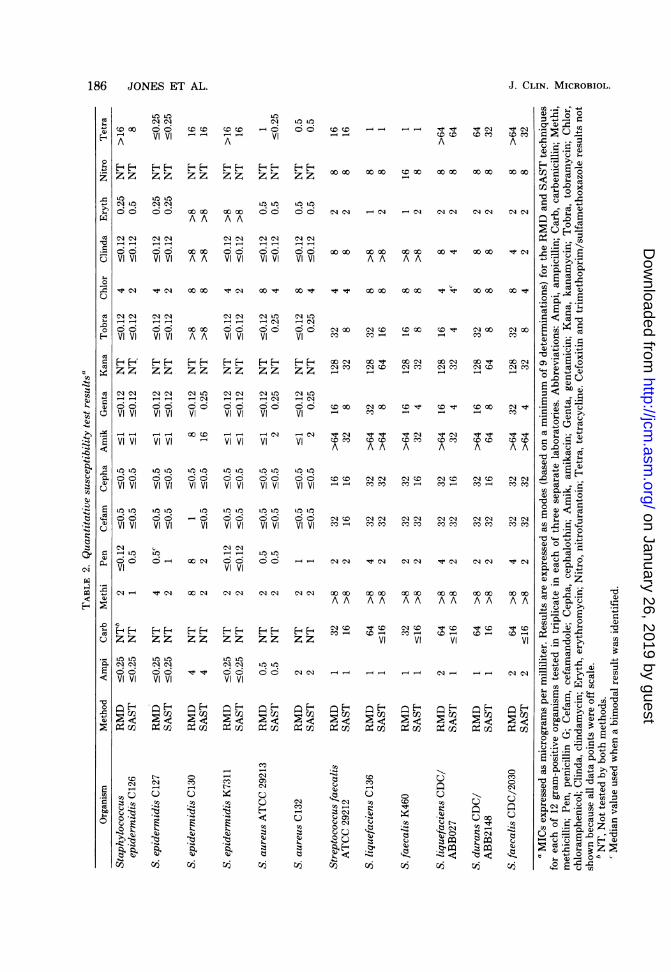
The antimicrobial agents tested on each of theSAST panels (gram positive, gram negative, andurine) are listed in Table 1. The modal MICs bythe SAST and the RMD methods are shown inTables 2 and 3. In the first study section, phase1, 26 stock organisms were sent to three of theparticipating laboratories. Each strain was proc-essed on three separate occasions (usually onconsecutive working days) by utilizing one ormore of the test panels. Direct comparisons weremade by matching the SAST result to an RMDMIC originating from the same subculture. Re-sults were expressed as MIC ratios (SAST MIC/RMD MIC) and intralaboratory and interlabo-ratory reproducibilities were tabulated in varia-tions in log2 dilutions.Of the 5,616 MIC data pairs (on- and off-scale
results) studied in phase 1, only 7.1% had MICratios beyond the acceptable ±1 1og2 dilution
TABLE 4. Summary of intralaboratory variation forthe SAST and RMD procedures
% MIC at log2 dilution % With
MIC variation: accept-method Laboratory able
O 1 2 a3 varia-tion
SAST Cleveland 77.2b 19.8 2.0 1.0 97.0Kaiser 79.1 18.9 1.8 0.2 98.0U.C. Davis 77.1 20.6 1.7 0.6 97.7Total 77.8 19.8 1.9 0.5 97.6
RMD Cleveland 85.8 13.3 0.9 0.0 99.1Kaiser 84.9 13.8 1.3 0.0 98.7U.C. Davis 81.0 17.2 1.5 0.3 98.2Total 83.9 14.8 1.2 0.1 98.7
Totals represent all data, including on- and off-scale MIC results. The use of only the on-scale MICsdid not result in significant differences from thoseanalyses presented in this table. The MICs of thethree trials were directly compared, i.e., trial A to B,A to C, and B to C, and the variations were expressedin log2 dilutions. Equal MIC results between trialswould be logged as zero variation.
TABLE 5. Summary of interlaboratory variation forthe SAST and RMD procedures
% MIC at log2 dilution % WithMIC variation: accept-
method Laboratory ableO 1 2 >3 varia-
tion
SAST Cleveland 79.1 17.7 2.4 0.8 96.8Kaiser 77.8 18.2 3.5 0.5 96.0U.C. Davis 84.2 14.5 0.9 0.4 98.7Total 80.4 16.8 2.2 0.6 97.2
RMD Cleveland 84.7 13.9 0.9 0.5 98.6Kaiser 84.0 14.7 1.1 0.2 98.7U.C. Davis 83.1 15.3 1.2 0.4 98.4Total 83.9 14.6 1.1 0.4 98.5
" Totals represent all data, including on- and off-scale MIC results. The use of only the on-scale MICsdid not result in significant differences from thosevalues presented in this table. The interlaboratoryanalysis compares trials A, B, and C at each laboratoryto the all-laboratory mode (or median) shown in Ta-bles 2 and 3. Total agreement would be shown as zerovariation.
range. Using only the on-scale MIC ratios forthe analysis did not result in significant changein this percentage of agreement between meth-ods. Variations with aminoglycoside MICs forthe six serogroup D streptococci tested accountfor approximately half of the disagreements. Theintralaboratory variability of each procedurewas analyzed by comparing the MIC result oftrial A to B, A to C, and B to C expressed in log2dilution steps. Table 4 shows acceptable consist-ency of MICs in each laboratory for both meth-
J. CLIN. MICROBIOL.
on January 26, 2019 by guesthttp://jcm
.asm.org/
Dow
nloaded from

SCEPTOR SYSTEM EVALUATION 189
TABLE 6. Comparison ofSAST and RMD MICratios'
No. with SAST MIC/RMD % With
Organism MIC ratio of: accept-group (n) able
s0.25 0.5 1 2 ?4 varia-tion,Enterobacteria- 18' 390 1,572 279 21 98.3
ceae (95)Non-enteric 1 92 597 69 9 98.8
gram-negativebacilli (32)
Staphylococci 6 90 476 114 10 97.7(29)
Streptococci 3 132 298 45 2 99.0(20)
Total (176) 28 704 2,943 507 42 98.3
'The challenge organisms processed possessed known re-sistance to antimicrobial agents and were tested at the Centerfor Disease Control.
h Initial screening trial only. Repetitive testing resulted inonly 0.26% consistent and significant (22 dilutions) variationsbetween MIC methods.
CMatched MIC pairs using both on- and off-scale end-points.
ods. The intralaboratory reproducibility for theSAST varied from 97.0% at the Cleveland ClinicFoundation to 98.0% at the Kaiser FoundationLaboratory (97.6% overall). The RMD was 1.1%more reproducible; although a small difference,this was statistically significant (P < 0.05). TheRMD showed a greater incidence of absoluteagreement, 83.9 versus 77.8%, between intra-laboratory trials.The interlaboratory comparisons are summa-
rized in Table 5. These statistics were analyzedby comparing the MIC results of the individuallaboratories to the modal MIC for that antibioticand organism shown in Tables 2 and 3. Varia-tions were expressed in log2 dilution steps fromthat modal MIC, i.e., 0, 1, 2, and >-3. Again, theRMD showed a slightly higher reproducibility,which was statistically significant (P < 0.05).The U.C. Davis Medical Center showed the bestcorrelation with the mode for SAST and thehighest variation for RMD. The opposite wastrue for the Kaiser Foundation Laboratory. Aswith the direct method MIC comparison, thestrictly on-scale results gave similar findings,e.g., intralaboratory reproducibility (SAST,97.7%; RMD, 98.5%) and interlaboratory repro-ducibility (SAST, 96.8%; RMD, 97.5%).Phase 2 of the study used 176 stock bacteria
from the collection of C. Thornsberry. Eachorganism was tested on two tray types, e.g.,Enterobacteriaceae and nonfermentative gram-negative bacteria were tested in gram-negativeand urine trays and the streptococci and staph-ylococci were inoculated into gram-positive andurine trays. Results were logged as SAST MIC/
RMD MIC ratios (Table 6). Minimal variationbetween method results was found. The bestcomparison was with the streptococci (99.0%with ratios of 0.5, 1, or 2), though a generaltendency toward slightly lower SAST MICs wasnoted. The lower correlation among the staph-ylococci was principally due to discrepant peni-cillin MICs between the susceptibility testingmethods.The examination of individual antimicrobial
MICs by organism group showed some skewing(slog2 dilution step) of results between methods.The Enterobacteriaceae had higher SASTMICs for tobramycin and lower MICs for car-benicillin, cephalothin, nitrofurantoin, and tet-racycline when compared with the RMD results.For the nonenteric, gram-negative bacilli, theSAST tobramycin MICs were again higher, andthose of carbenicillin, tetracycline, and trimeth-oprim/sulfamethoxazole were lower. The staph-ylococci showed an MIC correlation of 79.3% formethicillin due to generally lower RMD results.Amikacin, tobramycin, and nitrofurantoin alsohad staphylococcal SAST MIC/RMD MIC ra-tios of 0.5. Ratios of 2 were most often seen withchloramphenicol and tetracycline. The strepto-cocci were mostly serogroup D species, and thesestrains demonstrated excellent correlation be-tween MIC methods in this study section. How-ever, minor MIC shifts were identified for thesestreptococci with clindamycin and erythromycinwith ratios near 2 and all aminoglycosides, car-benicillin, and tetracycline with ratios near 0.5.This aminoglycoside MIC shift was similar tothat reported for other dried antimicrobial prod-ucts (6, 8; Gerlach et al., in preparation) and theopposite of that noted for other groups of orga-nisms in this study.
All organisms (47 total) having unacceptablevariations (ratios of s0.25 or ?-4) between MICmethods were retested in triplicate. Only 11 ofthe repeat organism-antimicrobial agent varia-tions were found to be reproducible, e.g., 0.26%of all MIC determinations. Table 7 shows eightof these variations in seven organisms. S. aureusP1052, a methicillin-resistant strain, is repre-sentative of three staphylococci for which theRMD test failed to recognize the heteroresist-ance on initial testing. The SAST also gave ahigher frequency of associated cephalothin in-termediate or resistant range MICs for methicil-lin-resistant strains. The consistently higherSAST methicillin MICs for the methicillin-re-sistant isolates more readily identified this re-sistance as compared with the RMD MICs. Twoother S. aureus strains and two P. vulgarisisolates exhibited lower SAST MICs against thepenicillins compared with the RMD. All of these
VOL. 13, 1981
on January 26, 2019 by guesthttp://jcm
.asm.org/
Dow
nloaded from

TABLE 7. Organisms demonstrating MIC discrepancies between the SAST and RMD MIC systemsaMIC determination (,Lg/rnl)
Antimicrobial MIC Resistanceagent method Initial Repeat Repeat Repeat mechanism
A B C
Staphylococcus aureus Methicillin SAST >8 >8 8 8 Heteroresistance(P1052)b RMD 4 0.5 8 8
Cephalothin SAST >32 32 32 32RMD 2 2 1 2
S. aureus (P1155)C Ampicillin SAST c8 c8 c8 c8 Beta-lactamaseRMD 32 32 32 64
A. calcoaceticus subsp. Ampicillin SAST 32 32 32 32 Unknownanitratus (N1055)d RMD c8 c8 c8 c8
Enterobacter aerogenes Cephalothin SAST 256 >256 >256 >256 Beta-lactamase(NlO19)e RMD 32 64 64 32
Proteus vulgaris (N1049) Carbenicillin SAST s4 c4 c4 s4 Beta-lactamaseRMD 32 16 16 32
P. vulgaris (N1165) Ampicillin SAST 16 c8 c8 16 Beta-lactamaseRMD 64 64 32 32
Streptococcus durans Gentamicin SAST 2 2 2 1 Unknown(P1160)d RMD 16 4 8 8a Results are from phase 2 studies at the Center for Disease Control.b Findings representative of two additional staphylococci for the methicillin only.c These lower, but resistant range, ampicillin SAST MICs were noted in one other S. aureus strain (P1119).d This illustrates the only phase 2 incidences (2) in which a lower SAST MIC would have resulted in a very
major interpretive error. The lower aminoglycoside SAST MIC pattern with serogroup D streptococci was aconsistent finding in all study sections.
e Representative of two additional E. aerogenes strains. Another enteric organism producing a broad spectrumbeta-lactamase (Salmonella typhi, N1137) had similarly discrepant lower cephalothin SAST MICs but wouldnot have been categorized as susceptible.
strains produced a beta-lactamase, and the dis-crepancy in MIC results would not have resultedin a susceptibility miscategorization. The oppo-site phenomenon appeared with three strains ofE. aerogenes and one S. typhi isolate that alsoproduced a beta-lactamase and had a -8-fold-higher cephalothin SAST MIC. An A. calcoac-eticus subsp. anitratus isolate whose resistancemechanism was unknown showed a variationsimilar to that of the enterobacters. Only for theAcinetobacter spp. among the gram-negativebacteria would there be a category shift fromresistant to susceptible. The explanation ofthesevariations may be related to species growthrates, enzyme production rates, and their rela-tionship to the different test media used in theRMD and SAST methods. Lastly, the S. duransgentamicin SAST MIC would also have resultedin a very major interpretive error.Phase 3, or the clinical isolate study, used 305
recently cultured clinical strains processed atthree medical laboratories. Table 8 shows theon-scale MIC comparison ratios for the organism
groups and participants. The overall acceptablecomparison ratio for the clinical strains wasslightly lower than that for stock organisms.When all MIC pairs were analyzed, 95.0% ofMICs were within ±1 log2 dilution step. If onlyon-scale MICs were used the acceptable per-centage rose to 95.8% (Table 8). The staphylo-cocci demonstrated the poorest correlation at92.2% (on-scale MIC data), and the Enterobac-teriaceae demonstrated the best correlation at97.6% (on-scale MIC data).Table 9 shows the MIC comparison ratios for
each antimicrobial agent. The best correlationbetween methods was obtained with clindamy-cin (99%), nitrofurantoin (99%), cefoxitin(98.8%), and chloramphenicol (98.7%). Penicillinhad 15.1% of ratios outside the acceptable range.The SAST MICs for carbenicillin, chloramphen-icol, and tetracycline in phase 3 were found tobe slightly lower than those of the RMD, con-firming the results on stock strains. Also, theSAST amikacin, tobramycin, and erythromycinMICs were generally higher, although the same
190 JONES ET AL. J. CLIN. MICROBIOL.
on January 26, 2019 by guesthttp://jcm
.asm.org/
Dow
nloaded from

VOL. 13, 1981 SCEPTOR SYSTEM EVALUATION 191
TABLE 8. Comparison ofphase 3 SAST and RMD MIC ratios
Laboratory (no. of com- No. with SAST MIC/RMD MIC ratio of:Organism group O5 0.i2panisons) --0.25 0.5 1 2 2
Enterobacteriaceae b Cleveland (1,113) 9 247 592 244 21Kaiser (414) 2 89 230 88 5Total 11 (0.7)c 336 (22.0) 822 (53.8) 332 (21.7) 26 (1.7)
Non-enteric baciilid Cleveland (173) 2 27 92 43 9Kaiser (64) 1 16 35 12 0Total 3 (1.3) 43 (18.1) 127 (53.6) 55 (23.2) 9 (3.8)
Staphylococcie Kaiser (31) 1 9 12 6 3U.C. Davis (750) 38 182 358 153 19Total 39 (5.0) 191 (24.5) 370 (47.4) 159 (20.4) 22 (2.8)
Streptococcif Kaiser (232) 12 73 116 30 1U.C. Davis (276) 5 82 167 21 1Total 17 (3.3) 155 (30.5) 283 (55.7) 51 (10.0) 2 (0.4)
Ail organisms (3,053) 70 (2.3) 725 (23.7) 1,602 (52.5) 597 (19.6) 59 (1.9)a All ratios are SAST MIC/RMD MIC, totalling 3,053 MIC data pairs. Both MICs were on-scale values, i.e.,
MIC 21 dilution removed from the extremes of the log2 dilution sequence. The addition of the off-scale results(7,308 MIC pairs) did not significantly alter the analysis.
b Includes the following species (with the ratio of the numbers obtained at the Cleveland Clinic Foundation,Kaiser Foundation Laboratory, and Sacramento Medical Center, respectively, given within parenthesis): E. coli(20, 27, 0), Klebsiella pneumoniae and K. oxytoca (15, 21, 0), Enterobacter aerogenes and E. cloacae (13, 6, 0),Proteus mirabilis (10, 12, 0), Providencia rettgeri (1, 1, 0), M. morganii (4, 1, 0), Citrobacter diversus (3, 0, 0),C. freundii (7, 1, 0), Serratia marcescens (6, 1, 0), Proteus vulgaris (0, 2, 0), and Providercia stuartii (1, 0, 0).
e Numbers within parenthesis indicate percentage of MICs.d Includes Pseudomonas aeruginosa (9, 6, 0), P. maltophilia (3, 0, 0), P. fluorescens-putida (3, 0, 0),
Acinetobacter calcoaceticus subsp. anitratus (3, 0, 0) or subsp. lwoffii (1, 0, 0), and Aeromonas sp. (1, 0, 0,).e Includes Staphylococcus aureus (0, 1, 50) and S. epidermidis (0, 7, 24).f Includes Streptococcus faecalis (0, 19, 25) and enterococci (not otherwise specified) (0, 0, 1).
paradoxically lower SAST aminoglycoside MICs(on stock strains) were seen for enterococci ofclinical origin.Of the 129 clinical on-scale MIC test pairs
differing by >±1 log2 dilution step (ratios '0.25or -4), only 16 would have resulted in significantsusceptibility category changes. Six (0.2%) verymajor errors, i.e., a sensitive SAST MIC and aresistant RMD MIC, were identified. The orga-nism-antimicrobial agent combinations in-cluded: S. faecalis-gentamicin, 4; S. epidermi-dis-tetracycline, 1; and Aeromonas hydrophila-trimethoprim/sulfamethoxazole, 1. Major errors(SAST false-resistance) were 0.3%, with the ma-jority being obtained with the combination ofcefamandole tested against a beta-lactamase-producing Citrobacter, Enterobacter, or Mor-ganella. In this latter case the SAST result maybe more accurate because of the susceptibilityof this cephalosporin to these beta-lactamases.Table 10 shows the intralaboratory reproduc-
ibility data for 3,660 SAST MICs. The results ofa second MIC test on each clinical strain (c48 hlater) were compared with the initial determi-nation. The SAST MICs for the enteric orga-
nisms were most reproducible at 98.0% (±1 di-lution from the original SAST MIC). Staphylo-cocci were least likely to show absolute repro-ducibility (72% at zero variation) and acceptableresults (94.8%). The RMD was slightly morereproducible than the SAST for these 305 clini-cal strains, e.g., 97.8 versus 96.9%, but this ob-served difference was not statistically significant(P > 0.05).
DISCUSSIONEarly evaluations of the microdilution broth
antimicrobial susceptibility method have re-sulted in favorable reports of MIC comparabil-ity, accuracy, and reproducibility (2, 5, 6, 9, 16).As more clinical microbiology laboratories haveadopted this methodology, numerous commer-cial products have become available for in-lab-oratory tray manufacture or as previously pre-pared reagents. The latter products have gen-erally offered a greater degree of standardizationof the methodology and reagents than that pos-sible by in-laboratory tray production. Fortu-nately, these products have appeared simulta-neously with an increasing sophistication in in-
on January 26, 2019 by guesthttp://jcm
.asm.org/
Dow
nloaded from

192 JONES ET AL.
fectious disease therapy and escalated antimi-crobial research and development. This greaterdemand for quantitative antimicrobial resultshas brought previously prepared microdilutionbroth trays into hundreds of laboratories unableor unwilling to produce their own susceptibilitytesting trays.We have previously evaluated commercially
prepared susceptibility trays as to comparative
TABLE 9. Data from 305 fresh clinical isolatestested at the three collaborating laboratories'
No. of No. with SAST MIC/RMDAntimicrobial test MIC ratio of:agent pairs s0.25 0.5 1 2 -4
Ampicillin 609 19 92 449 39 10Carbenicilin 410 22 86 270 24 8Methicillin 199 5 6 169 19 OPenicillin 199 20 30 100 39 10Cephalothin 609 7 61 501 36 4Cefamandole 609 5 109 450 25 20Cefoxitin 410 5 55 330 20 0Amikacin 609 14 64 251 254 26Gentamicin 609 23 121 357 96 12Kanamycin 410 1 26 296 82 5Tobramycin 609 13 77 234 236 49Erythromycin 199 2 6 81 100 10Clindamycin 199 1 8 178 Il 1Tetracycline 609 34 228 315 31 1Chloramphenicol 399 4 163 213 18 1Nitrofurantoin 210 1 45 128 35 1Trimethoprim/ 410 20 51 290 42 7
sulfamethoxa-zole
Total 7,308 196 1,228 4,612 1,107 165C All MIC data pairs including on- and off-scale
MICs. Exclusion of the off-scale data did not alter theanalysis. The boldfaced values represent skewing of-0.34 to c0.55 of a log2 dilution interval.
accuracy, intralaboratory and interlaboratoryreproducibility, clinical isolate application, man-ufacturing practices, and lot-to-lot variations (2,6, 8). These reports for the Micro-Media system,Sensititre, and 3M-MPS (unpublished data)have shown excellent accuracy compared withthe ICS macro-tube dilution method (2) andmicrodilution broth methods (2, 6, 8) using traysprepared by the investigators. Similar reports byTilton and Isenberg describe approximately 90%correlation of susceptibility results of the driedantimicrobial product, AST, to those of the diskdiffusion, agar dilution, and broth microdilutionmethods (14, 15).
In this study, SAST trays from 11 lots were
tested for comparative accuracy and reproduci-bility in three study sections. The accuracy ofthe SAST MIC was compared directly with sin-gle lots of microdilution broth panels producedby the investigators (10). The MICs were within± i10g2 dilution (acceptable range) for 92.9, 98.3,and 95.8% of two groups of stock cultures and305 recent clinical isolates, respectively. TheSAST MIC correlation for the stock strains com-pares favorably to the 87.6% obtained for theSensititre system (7). If only the drugs found inthe SAST were used in Sensititre statistics, thepercentage of Sensititre agreement would in-crease to nearly 90%. The clinical isolates testedhad 52.5% of their SAST MICs (on-scale results)in total agreement with the RMD and 95.8%within ±1 log2 dilution based on 3,053 MICcomparison pairs. The similar Sensititre clinicalseries (8) showed 52.3% at zero variation and94.6% ±1 log, dilution (data base of 1,999 MICcomparison pairs). The more limited Micro-Me-dia system-microdilution comparison produceda 91.1% overall agreement to within one dilutionstep (2).
TABLE 10. Reproducibility of intralaboratory SAST and RMD MICs using 305 fresh clinical isolates'No. of repeat MIC results at dilution at log,2 With ac-
Organism group (n)5 MIC method variation: ceptablevariations
Enterobacteriaceae (152) SAST 1,424 (78.1)" 364 (19.9) 36 (2.0) 98.0RMD 1,508 (82.7) 291 (15.9) 25 (1.4) 98.6
Non-enteric bacilli (26) SAST 265 (84.9) 39 (12.5) 8 (2.6) 97.4RMD 274 (87.8) 35 (11.3) 3 (0.9) 99.1
Staphylococci (82) SAST 708 (72.0) 225 (22.8) 51(5.2) 94.8RMD 774 (78.7) 162 (16.5) 45 (4.8) 95.2
Streptococci (45) SAST 410 (75.9) 113 (20.9) 17 (3.2) 96.8RMD 459 (85.2) 76 (13.8) 5 (1.0) 99.0
All organisms (305) SAST 2,807 (76.7) 741 (20.2) 112 (3.1) 96.9RMD 3,015 (82.4) 563 (15.4) 81(2.2) 97.8
All on- and off-scale MIC comparisons were tabulated (3,660 MIC determinations). The use of only on-scaleMIC pairs did not significantly alter the analysis.
See footnotes b, d, e, and f of Table 8 for the bacterial species tested.Numbers within parenthesis indicate percentage of MICs.
J. CLIN. MICROBIOL.
on January 26, 2019 by guesthttp://jcm
.asm.org/
Dow
nloaded from

SCEPTOR SYSTEM EVALUATION 193
The SAST intralaboratory and interlabora-tory reproducibiity in all study sections wasexcellent and comparable to that of the RMDmethod (10). The intralaboratory variation out-side of the acceptable ± 1 dilution range was only2.4% for the stock isolates (triplicate testing) and3.2% for the recent clinical strains (two trials).The SAST interlaboratory variation was mea-sured only against the 26 stock strains. A totalof 159 (2.8%) comparisons were beyond the ac-ceptable limits, principally due to poor repro-ducibility of aminoglycoside MICs (related to aillaboratory modes) against serogroup D strepto-cocci tested at the Kaiser Foundation Labora-tory. Again, these excellent results were onlyequalled in our experience by the comparativeRMD reproducibility performed on a single lotof trays in contrast to multiple lots for the SAST.
In studies of other dried antimicrobial prod-ucts, the frequency of "skip patterns" was higherthan that of the RMD (8; Gerlach et al., inpreparation). However, in our study rare skipswere observed in both test systems. Great carein the micropipetting of the SAST inoculum intothe trays certainly contributed to this low skippattern frequency related to the replicate inoc-ulated reference procedure. The time needed topipette the SAST inoculum into the trays wasjudged by the participating technical staff attwo- to threefold longer than the replicate inoc-ulation of the RMD. Such a cumbersome andtedious procedural step limits the utility of thedried antimicrobial products, though they havethe significant advantage of a long shelf life (-12months). A semiautomated rapid inoculumpreparation and tray rehydration device, cur-rently in laboratory trials, would offer significanttime savings and acceptance by laboratoriesprocessing higher volumes.
In addition to the favorable comparison andreproducibility statistics, the SAST readilycategorizes the resistant and sensitive strainswithin various bacterial genera and species. Thiswas especially evident for the methicillin-resist-ant staphylococci, beta-lactamase-producingEnterobacteriaceae, aminoglycoside-inactivat-ing (enzymes) pseudomonads, and enteric bac-teria. Only rare (0.2%) very major errors werediscovered in the clinical isolate series. Four ofthese six instances were falsely low gentamicinMICs (4 ,ig/ml) against strains of S. faecalis.This discrepancy is of no clinical significance,since serious enterococcal infections are treatedwith an aminoglycoside only in combinationwith an appropriate beta-lactam drug. Thistendency toward lower SAST aminoglycosideresults for enterococci was noted in all studysections, as well as in previous studies of dried
antimicrobial trays (6, 8; Gerlach et al., in prep-aration). Other instances of individual antimi-crobial agents associated with certain organismshaving a tendency toward lower or higher SASTMICs were observed. The most evident shifting(>0.33 to <0.55 of a log2 dilution interval) ofMICs, as measured by a geometric mean of thedilution interval, was lower for chloramphenicol(-0.38) and tetracycline (-0.43) SAST resultsand higher for amikacin (+0.34), erythromycin(+0.55), and tobramycin (+0.37) SAST MICs.We conclude that the SAST system for micro-
dilution antimicrobial susceptibility testing givesMICs equivalent to those of an RMD method(10). The SAST system has proven reproduci-bility both by intra- and interlaboratory analysisusing up to eleven different lots of trays. Thelonger tray shelf life, simplicity of technical use,and versatility of the rehydration-inoculationprocedures would make this product applicablein a wide variety of clinical laboratories.
LITERATURE CITED
1. Barry, A. L. 1976. The antimicrobic susceptibility test:principles and practices. Lea & Febiger, Philadelphia.
2. Barry, A. L., R. N. Jones, and T. L. Gavan. 1978.Evaluation of the Micro-Media System for quantitativeantimicrobial drug susceptibility testing: a collaborativestudy. Antimicrob. Agents Chemother. 13:61-69.
3. Ericsson, H. M., and J. C. Sherris. 1971. Antibioticsensitivity testing. Report of an international collabo-rative study. Acta Pathol. Microbiol. Scand. Sect. BSupply. 217:1-90.
4. Fuchs, P. C. 1976. The replicator method for identifica-tion and biotyping of common bacterial isolates. Lab.Med. 6:6-11.
5. Gavan, T. L., and D. A. Butler. 1974. An automatedmicrodilution method for antimicrobial susceptibilitytesting, p. 88-93. In A. Balows (ed.), Current techniquesfor antibiotic susceptibility testing. Charles C. Thomas,Springfield, Iil.
6. Gavan, T. L., R. N. Jones, and A. L. Barry. 1980.Evaluation of the Sensititre system for quantitativeantimicrobial drug susceptibility testing: a collaborativestudy. Antimicrob. Agents Chemother. 17:464-469.
7. Gavan, T. L., and M. A. Town. 1970. A microdilutionmethod for antibiotic susceptibility testing: an evalua-tion. Am. J. Clin. Pathol. 53:880-885.
8. Jones, R. N., T. L. Gavan, and A. L. Barry. 1980. Theevaluation of the Sensititre microdilution antibiotic sus-ceptibility system against recent clinical isolates: a threelaboratory collaborative study. J. Clin. Microbiol. 11:426-429.
9. MacLowry, J. D., and H. H. Marsh. 1968. Semiauto-matic microtechnique for serial dilution antibiotic sen-sitivity testing in the clinical laboratory. J. Lab. Clin.Med. 72:685-687.
10. National Committee for Clinical Laboratory Stand-ards. 1980. Proposed Standard PSM-7. Standardmethod for dilution antimicrobial susceptibility testsfor bacteria which grow aerobically. National Commit-tee for Clinical Laboratory Standards, Villanova, Pa.
Il. Phillips, I., C. Warren, and P. M. Waterworth. 1976.Determination of minimum inhibitory concentrationsby the Sensititre system, p. 78. In H. H. Johnson and S.W. B. Newson (ed.), Second International Symposiumin Rapid Methods and Automation in Microbiology,
VOL. 13, 1981
on January 26, 2019 by guesthttp://jcm
.asm.org/
Dow
nloaded from

J. CLIN. MICROBIOL.
Cambridge, England. Learned Information (Europe),Hinksley Hill, United Kingdom.
12. Phillips, I., C. Warren, and P. M. Waterworth. 1978.Determination of antibiotic sensitivities by the Sensi-titre system. J. Clin. Pathol. 31:531-535.
13. Thornsberry, C. T., T. L. Gavan, J. C. Sherris, A.Balows, J. M. Matsen, L. D. Sabath, F. Schoen-knecht, L. D. Thrupp, and J. A. Washington IL.1975. Laboratory evaluation of a rapid, automated sus-
ceptibility testing system: report of a collaborativestudy. Antimicrob. Agents Chemother. 7:467-480.
14. Tilton, R. C., and H. D. Isenberg. 1977. Evaluation ofthe performance parameters of a prediluted, quantita-tive antibiotic susceptibility test device. Antimicrob.Agents Chemother. 11:271-276.
15. Tilton, R. C., and H. D. Isenberg. 1977. In-use evalua-tion of a prediluted quantitative antibiotic susceptibilitytest device. Antimicrob. Agents Chemother. 12:470-473.
16. Tilton, R. C., L. Leiberman, and E. H. Gerlach. 1972.Microdilution antibiotic susceptibility test examinationof certain variables. Apple. Microbiol. 26:658-665.
194 JONES ET AL.
on January 26, 2019 by guesthttp://jcm
.asm.org/
Dow
nloaded from