EVALUATION OF THE ORIENTATION OF 90° AND 180°...
172
EVALUATION OF THE ORIENTATION OF 90° AND 180° REINFORCING BAR HOOKS by Nichole Podhorsky Lesley Sneed NUTC R257
-
Upload
truongcong -
Category
Documents
-
view
218 -
download
2
Transcript of EVALUATION OF THE ORIENTATION OF 90° AND 180°...

EVALUATION OF THE ORIENTATION OF 90° AND 180° REINFORCING BAR
HOOKS
by
Nichole Podhorsky Lesley Sneed
NUTC R257

Disclaimer
The contents of this report reflect the views of the author(s), who are responsible for the facts and the
accuracy of information presented herein. This document is disseminated under the sponsorship of
the Department of Transportation, University Transportation Centers Program and the Center for
Transportation Infrastructure and Safety NUTC program at the Missouri University of Science and
Technology, in the interest of information exchange. The U.S. Government and Center for
Transportation Infrastructure and Safety assumes no liability for the contents or use thereof.
NUTC ###
Technical Report Documentation Page
1. Report No.
NUTC R257
2. Government Accession No. 3. Recipient's Catalog No.
4. Title and Subtitle
Evaluation Of The Orientation Of 90° And 180° Reinforcing Bar Hooks
5. Report Date
January 2012
6. Performing Organization Code
7. Author/s
Lesley Sneed
8. Performing Organization Report No.
Project # 00028102
9. Performing Organization Name and Address
Center for Transportation Infrastructure and Safety/NUTC program Missouri University of Science and Technology 220 Engineering Research Lab Rolla, MO 65409
10. Work Unit No. (TRAIS)
11. Contract or Grant No.
DTRT06-G-0014
12. Sponsoring Organization Name and Address
U.S. Department of Transportation Research and Innovative Technology Administration 1200 New Jersey Avenue, SE Washington, DC 20590
13. Type of Report and Period Covered
Final
14. Sponsoring Agency Code
15. Supplementary Notes
16. Abstract
This report describes test results of a study initiated to evaluate the potential influence of hook tilt angle of standard reinforcing hooks on the bond strength of concrete. The topic of the evaluation of the orientation of 90 and 180 degree reinforcing bar hooks in concrete members was identified by the Concrete Reinforcing Steel Institute (CRSI) as high-priority for the reinforcing steel industry. In the test program conducted, a series of single bar and multiple bar specimens was designed and tested to examine bar behavior and potential group effects that may exist in wide flexural members with multiple bars, such as a slab or footing. Using beamend specimens, 90 and 180 degree standard reinforcing hooks were placed at varying angles to compare the angle of tilt and to compare the two hook types. Twelve single bar specimens and twelve multiple bar specimens, each containing either No. 5 or No. 8 standard reinforcing bars,were tested by axially loading the reinforcing bar(s) in tension. Measuring the bar displacement and strain at varying locations along the bar, load-displacement curves obtained were utilized in the analysis of hook tilt. Based on the results, design recommendations for tilted hooked bar anchorages were made. For No. 5 bars and smaller with concrete compressive strength, f’c, greater than 4500 psi, spacing between 0.5 and 2 times the hook length, A, and concrete cover equal to or exceeding the values used in this study, tilting reinforcing hooked bars from vertical at any angle did not compromise the structural integrity. For No. 5 bars and smaller with concrete compressive strength less than 4500 psi, spacing less than 0.5 times the hook length,A, or concrete cover less than the values used in this study, further study is needed.Additionally, further study is needed for bars larger than No. 5.
17. Key Words
Bridge superstructures, reinforcing bars, development
18. Distribution Statement
No restrictions. This document is available to the public through the National Technical Information Service, Springfield, Virginia 22161.
19. Security Classification (of this report)
unclassified
20. Security Classification (of this page)
unclassified
21. No. Of Pages
172
22. Price
Form DOT F 1700.7 (8-72)
ii
ABSTRACT
This report describes test results of a study initiated to evaluate the potential influence of hook tilt angle of standard reinforcing hooks on the bond strength of concrete. The topic of the evaluation of the orientation of 90 and 180 degree reinforcing bar hooks in concrete members was identified by the Concrete Reinforcing Steel Institute (CRSI) as high-priority for the reinforcing steel industry. In the test program conducted, a series of single bar and multiple bar specimens was designed and tested to examine bar behavior and potential group effects that may exist in wide flexural members with multiple bars, such as a slab or footing. Using beam-end specimens, 90 and 180 degree standard reinforcing hooks were placed at varying angles to compare the angle of tilt and to compare the two hook types. Twelve single bar specimens and twelve multiple bar specimens, each containing either No. 5 or No. 8 standard reinforcing bars, were tested by axially loading the reinforcing bar(s) in tension. Measuring the bar displacement and strain at varying locations along the bar, load-displacement curves obtained were utilized in the analysis of hook tilt. Based on the results, design recommendations for tilted hooked bar anchorages were made. For No. 5 bars and smaller with concrete compressive strength, f’c, greater than 4500 psi, spacing between 0.5 and 2 times the hook length, A, and concrete cover equal to or exceeding the values used in this study, tilting reinforcing hooked bars from vertical at any angle did not compromise the structural integrity. For No. 5 bars and smaller with concrete compressive strength less than 4500 psi, spacing less than 0.5 times the hook length, A, or concrete cover less than the values used in this study, further study is needed. Additionally, further study is needed for bars larger than No. 5.
iii
TABLE OF CONTENTS
Page
ABSTRACT ................................................................................................................................. ii
LIST OF ILLUSTRATIONS ....................................................................................................... v
LIST OF TABLES ....................................................................................................................... x
NOMENCLATURE .................................................................................................................... xi
SECTION
1. INTRODUCTION .................................................................................................................... 1
1.1. PROBLEM STATEMENT ............................................................................................. 1
1.2. SCOPE AND OBJECTIVES .......................................................................................... 2
1.3. SUMMARY OF CONTENT ........................................................................................... 2
2. LITERATURE REVIEW ......................................................................................................... 4
2.1. INTRODUCTION ........................................................................................................... 4
2.2. BOND STRESS DISTRIBUTION .................................................................................. 4
2.2.1. Mechanism of Bond Transfer ................................................................................. 4
2.2.2. Bond Stresses on Straight Deformed Bars ............................................................. 5
2.2.3. Bond Stresses on Hooked Deformed Bars ............................................................. 6
2.3. BOND TEST TYPES ...................................................................................................... 8
2.3.1. Pull-out Test ........................................................................................................... 8
2.3.2. Beam-end Test ........................................................................................................ 9
2.3.3. Beam Anchorage Test ............................................................................................ 9
2.4. PREVIOUS STUDIES .................................................................................................... 9
2.4.1. Minor, 1971 ............................................................................................................ 9
2.4.2. Jirsa and Marques, 1972 ....................................................................................... 10
2.4.3. Minor and Jirsa, 1975 ........................................................................................... 10
2.4.4. Marques and Jirsa, 1975 ....................................................................................... 11
2.4.5. Pinc, Watkins, and Jirsa, 1977 .............................................................................. 12
2.4.6. Johnson and Jirsa, 1981 ........................................................................................ 12
2.4.7. Hamad, Jirsa, and D’Abreu, 1993 ........................................................................ 12
2.4.8. Ehsani, Saadatmenash, and Tao, 1995 ................................................................. 13
iv
2.5. ACI 318 CODE (2008) PROVISIONS FOR DEVELOPMENT OF STANDARD
HOOKS IN TENSION.................................................................................................. 13
3. EXPERIMENTS ..................................................................................................................... 16
3.1. INTRODUCTION ......................................................................................................... 16
3.2. MATERIAL PROPERTIES .......................................................................................... 16
3.3. SPECIMEN DESIGN AND DIMENSIONS ................................................................ 16
3.4. TEST RESULTS ........................................................................................................... 20
4. ANALYSIS ............................................................................................................................ 27
4.1. INTRODUCTION ......................................................................................................... 27
4.2. DISCUSSION OF RESULTS ....................................................................................... 27
4.2.1. Effect of Hook Tilt Angle ..................................................................................... 28
4.2.2. Effect of Bar Size ................................................................................................. 28
4.2.3. Effect of Hook Type ............................................................................................. 31
4.2.4. Effect of Multiple Bars ......................................................................................... 31
4.2.4.1 Effect of bar spacing ................................................................................ 32
4.2.4.2 Effect of bar position................................................................................ 32
4.2.4.3 Multiple bar and single bar comparison ................................................... 32
4.3. COMPARISON TO LITERATURE ............................................................................. 33
5. SUMMARY, CONCLUSIONS, AND RECOMMENDATIONS ......................................... 42
5.1. SUMMARY .................................................................................................................. 42
5.2. CONCLUSIONS ........................................................................................................... 42
5.3. RECOMMENDATIONS .............................................................................................. 43
APPENDICES
A. TEST PROGRAM ................................................................................................................. 43
B. SPECIMEN DESIGN PROCEDURE ................................................................................... 65
C. TEST RESULTS .................................................................................................................... 74
D. ANALYSIS OF TEST VARIABLES ................................................................................. 125
REFERENCES ......................................................................................................................... 157
ACKNOWLEDGEMENTS ..................................................................................................... 159
v
LIST OF ILLUSTRATIONS
Figure Page
1.1. Construction photos1 of tilted reinforcing hooked bars ......................................................... 1
1.2. Recommended bar details for solid slabs (CRSI Design Handbook 2008) ........................... 2
1.3. Schematic of a hooked bar in concrete slab .......................................................................... 2
2.1. Bond force transfer mechanisms (ACI 408R-03) .................................................................. 4
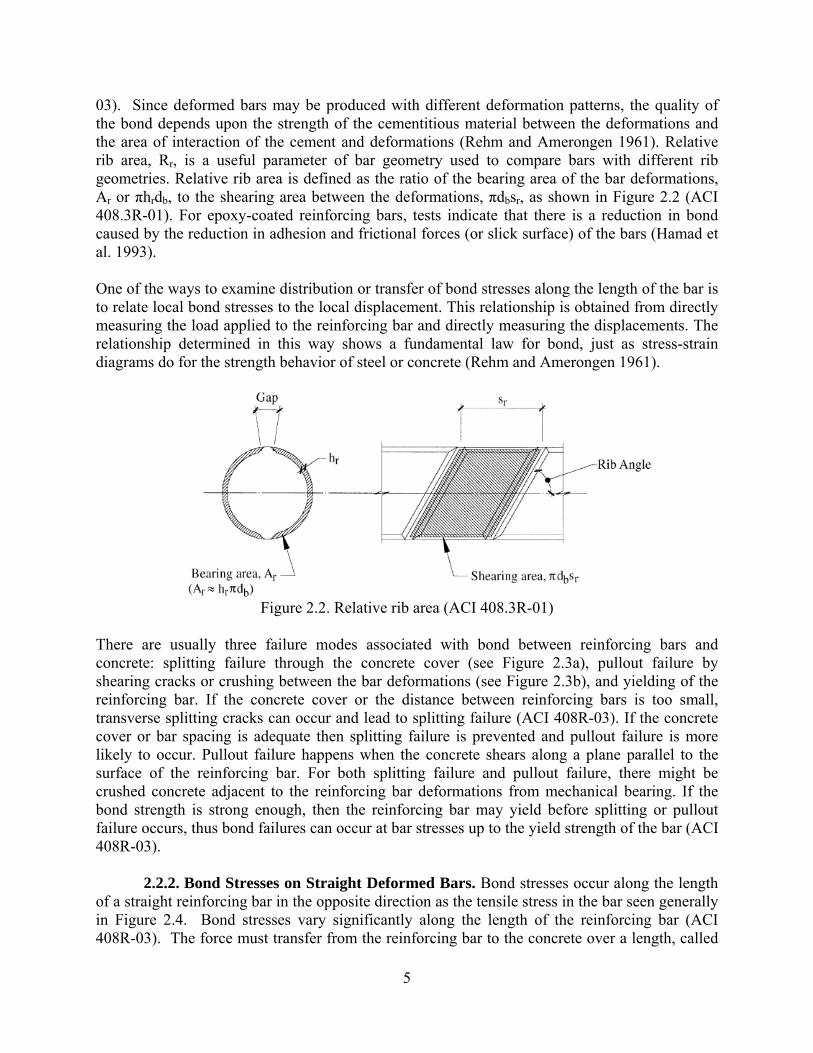
2.2. Relative rib area (ACI 408.3R-01) ........................................................................................ 5
2.3. Splitting failure and pullout failure shearing cracks (ACI 408R-03) .................................... 6
2.4. Bond stresses on a straight bar (Minor and Jirsa 1975) ......................................................... 6
2.5. Bond stresses on a hooked bar (Minor and Jirsa 1975) ......................................................... 7
2.6. Behavior of hooked anchorage (Minor 1971) ....................................................................... 7
2.7. Loss of bond of bar and crushing at bend (Jirsa and Marques 1972) .................................... 8
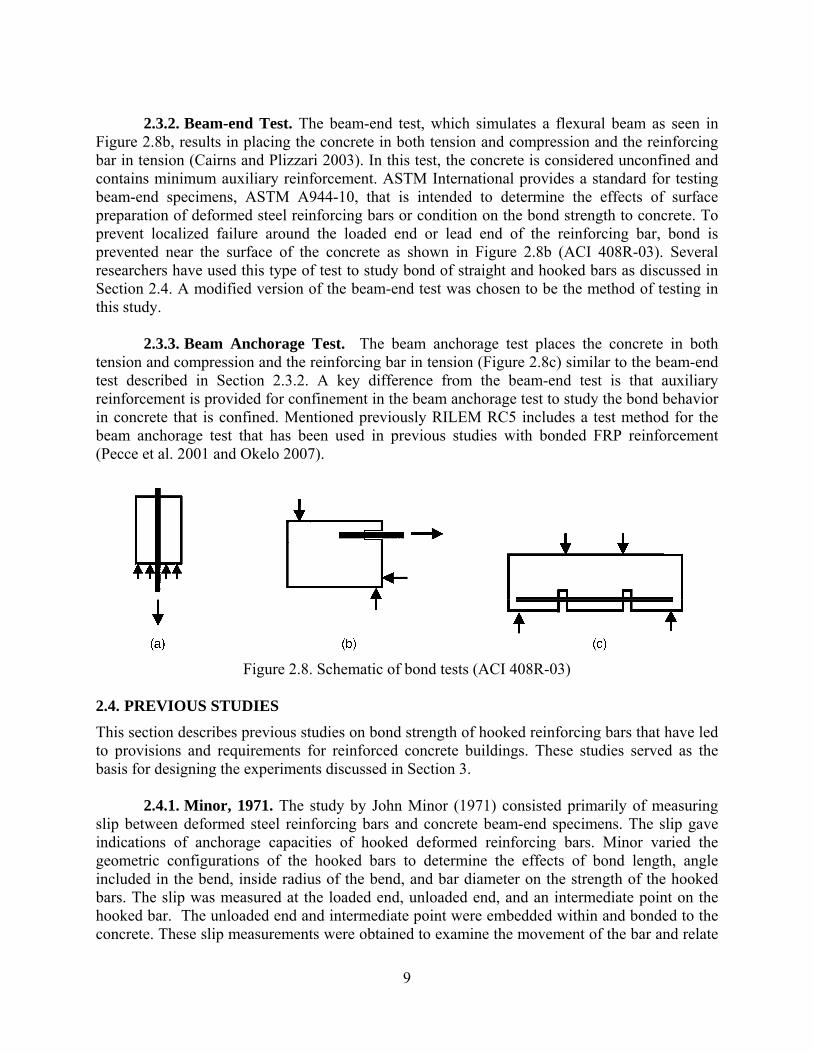
2.8. Schematic of bond tests (ACI 408R-03) ............................................................................... 9
2.9. Slip wire instrumentation (Minor and Jirsa 1975) ............................................................... 11
2.10. Minor and Jirsa beam-end specimen (Minor and Jirsa 1975) ........................................... 11
2.11. Ehsani et al. beam-end specimen (Ehsani et al. 1995) ...................................................... 14
2.12. Development length for standard hooked reinforcing bars (ACI 318-08) ........................ 15
3.1. CRSI Design Manual hook detail (CRSI Design Manual 2008) ......................................... 17
3.2. 180 degree single bar specimens ......................................................................................... 19
3.3. 90 degree single bar specimens ........................................................................................... 21
3.4. Multiple bar specimens – end view ..................................................................................... 21
3.5. Single bar specimen test setup ............................................................................................. 25
3.6. Multiple bar specimen test setup ......................................................................................... 26
4.1. Influence of tilt angle on maximum normalized bar stress for Groups 1-3 ......................... 29
4.2. Influence of tilt angle on bar displacement for Groups 1-3 ................................................. 29
4.3. Influence of tilt angle on maximum normalized bar stress for Groups 16-21 ..................... 30
4.4. Influence of tilt angle on bar displacement for Groups 16-21 ............................................. 30
4.5. Influence of tilt angle on bar displacement for Groups 32-37 ............................................. 31
4.6. Influence of bar spacing on bar displacement for Groups 12-15 ........................................ 34
4.7. Influence of bar spacing on bar displacement for Groups 28-31 ........................................ 34
4.8. Influence of group effect on normalized displacement for Groups 56-59 .......................... 35
vi
4.9. Influence of group effect on normalized displacement for Groups 60-63 .......................... 36
A.1. Compression and splitting tensile strength tests ................................................................. 48
A.2. Compressive strength history for all concrete mixtures ..................................................... 48
A.3. Reinforcing steel tensile coupons ....................................................................................... 50
A.4. Typical stress-strain curve for steel reinforcing bars .......................................................... 51
A.5. Summary of reinforcing steel yield and ultimate strength ................................................. 51
A.6. Formwork for specimens .................................................................................................... 53
A.7. Reinforcing bar(s) inside formwork before concrete placement ........................................ 54
A.8. Concrete placement ............................................................................................................ 55
A.9. Moist curing of concrete specimens ................................................................................... 55
A.10. Single bar specimen test frame (side view) ...................................................................... 57
A.11. Single bar specimen test frame (top view) ....................................................................... 57
A.12. Single bar specimen test frame (isometric view) .............................................................. 58
A.13. Multiple bar test frame (side view) ................................................................................... 58
A.14. Multiple bar test frame (top view) .................................................................................... 59
A.15. Multiple bar specimen test frame (isometric view) .......................................................... 59
A.16. Hydraulic jack and anchorage systems for test frames ..................................................... 60
A.17. Instrumentation placement ............................................................................................... 61
A.18. As-built instrumentation photos: strain gages .................................................................. 61
A.19. As-built instrumentation photos: displacement wires ...................................................... 62
A.20. DCVT and string transducer photos ................................................................................. 62
A.21. Hydraulic jacks ................................................................................................................. 63
B.1. Minor and Jirsa beam-end specimen (Minor and Jirsa 1975) ............................................. 66
B.2. Ehsani et al. beam-end specimen (Ehsani et al. 1995) ........................................................ 66
B.3. Strut and tie model from ACI 318-08 ................................................................................. 67
B.4. Modified beam-end specimen ............................................................................................. 67
B.5. 180 degree modified beam-end specimen .......................................................................... 69
B.6. 90 degree modified beam-end specimen ............................................................................ 69
B.7. 90 degree beam-end specimen width increase .................................................................... 70
B.8. 180 degree beam-end specimen width increase .................................................................. 70
B.9. CRSI Design Manual hook detail (CRSI Design Manual 2008) ........................................ 71
vii
B.10. 90 degree hook, 0 degree (nominal) tilt, 0.5 A spacing, multiple bar specimen .............. 71
B.11. 90 degree hook, 22.5 degree tilt, 0.5 A spacing, multiple bar specimen .......................... 71
C.1. Dissection process (specimen BE-5-180-90 shown) .......................................................... 75
C.2. Dissected specimen BE-5-180-0 ......................................................................................... 76
C.3. Dissected specimen BE-5-180-90 ....................................................................................... 77
C.4. Dissected specimen BE-5-90-90 ......................................................................................... 78
C.5. Dissected specimen BE-8-90-90 ......................................................................................... 79
C.6. Cracking of specimen BE-5-90-0-G2A .............................................................................. 80
C.7. Cracking of specimen BE-8-90-0-G2A .............................................................................. 82
C.8. Cracking of Specimen BE-8-90-0-GA ............................................................................... 83
C.9. Cracking of Specimen BE-8-90-0-G0.5A .......................................................................... 84
C.10. Cracking of Specimen BE-8-90-22.5-G2A ...................................................................... 85
C.11. Specimen BE-5-180-0 ....................................................................................................... 87
C.12. Specimen BE-5-180-22.5 .................................................................................................. 87
C.13. Specimen BE-5-180-45 ..................................................................................................... 88
C.14. Specimen BE-5-180-90 ..................................................................................................... 88
C.15. Specimen BE-5-90-0 ......................................................................................................... 89
C.16. Specimen BE-5-90-22.5 .................................................................................................... 89
C.17. Specimen BE-5-90-45 ....................................................................................................... 90
C.18. Specimen BE-5-90-90 ....................................................................................................... 90
C.19. Specimen BE-8-90-0 ......................................................................................................... 91
C.20. Specimen BE-8-90-22.5 .................................................................................................... 91
C.21. Specimen BE-8-90-45 ....................................................................................................... 92
C.22. Specimen BE-8-90-90 ....................................................................................................... 92
C.23. Specimen BE-5-90-0-G2A ............................................................................................... 93
C.24. Specimen BE-5-90-0-GA ................................................................................................. 94
C.25. Specimen BE-5-90-0-G0.5A ............................................................................................ 95
C.26. Specimen BE-5-90-22.5-G2A .......................................................................................... 96
C.27. Specimen BE-5-90-22.5-GA ............................................................................................ 97
C.28. Specimen BE-5-90-22.5-G0.5A ....................................................................................... 98
C.29. Specimen BE-8-90-0-G2A ............................................................................................... 99
viii
C.30. Specimen BE-8-90-0-GA ............................................................................................... 100
C.31. Specimen BE-8-90-0-G0.5A .......................................................................................... 101
C.32. Specimen BE-8-90-22.5-G2A ........................................................................................ 102
C.33. Specimen BE-8-90-22.5-GA .......................................................................................... 103
C.34. Specimen BE-8-90-22.5-G0.5A ..................................................................................... 104
C.36. Specimen BE-5-180-0 ..................................................................................................... 106
C.37. Specimen BE-5-180-22.5 ................................................................................................ 106
C.38. Specimen BE-5-180-45 ................................................................................................... 107
C.39. Specimen BE-5-180-90 ................................................................................................... 107
C.40. Specimen BE-5-90-0 ....................................................................................................... 108
C.41. Specimen BE-5-90-22.5 .................................................................................................. 108
C.42. Specimen BE-5-90-45 ..................................................................................................... 109
C.43. Specimen BE-5-90-90 ..................................................................................................... 109
C.44. Specimen BE-8-90-0 ....................................................................................................... 110
C.45. Specimen BE-8-90-22.5 .................................................................................................. 110
C.46. Specimen BE-8-90-45 ..................................................................................................... 111
C.47. Specimen BE-8-90-90 ..................................................................................................... 111
C.48. Specimen BE-5-90-0-G2A ............................................................................................. 112
C.49. Specimen BE-5-90-0-GA ............................................................................................... 113
C.50. Specimen BE-5-90-0-G0.5A .......................................................................................... 114
C.51. Specimen BE-5-90-22.5-G2A ........................................................................................ 115
C.52. Specimen BE-5-90-22.5-GA .......................................................................................... 116
C.53. Specimen BE-5-90-22.5-G0.5A ..................................................................................... 117
C.54. Specimen BE-8-90-0-G2A ............................................................................................. 118
C.55. Specimen BE-8-90-0-GA ............................................................................................... 119
C.56. Specimen BE-8-90-0-G0.5A .......................................................................................... 120
C.57. Specimen BE-8-90-22.5-G2A ........................................................................................ 121
C.58. Specimen BE-8-90-22.5-GA .......................................................................................... 122
C.59. Specimen BE-8-90-22.5-G0.5A ..................................................................................... 123
D.1. Influence of tilt angle on maximum normalized stress for Groups 1-3 ............................ 128
D.2. Influence of tilt angle on displacement for Groups 1-3 .................................................... 129
ix
D.3. Influence of bar size on maximum normalized stress for Groups 4-7 .............................. 130
D.4. Influence of bar size on displacement for Groups 4-7 ...................................................... 131
D.5. Influence of hook type on maximum normalized stress for Groups 8-11 ........................ 132
D.6. Influence of hook type on displacement for Groups 8-11 ................................................ 133
D.7. Influence of bar spacing on maximum normalized stress for Groups 12-15 .................... 138
D.8. Influence of bar spacing on displacement for Groups 12-15 ............................................ 139
D.9. Influence of tilt angle on maximum normalized stress for Groups 16-21 ........................ 140
D.10. Influence of tilt angle on displacement for Groups 16-21 .............................................. 141
D.11. Influence of bar size on maximum normalized stress for Groups 22-27 ........................ 142
D.12. Influence of bar size on displacement for Groups 22-27 ................................................ 143
D.13. Influence of bar spacing on maximum normalized stress for Groups 28-31 .................. 144
D.14. Influence of bar spacing on displacement for Graphs 28-31 .......................................... 145
D.15. Influence of tilt angle on maximum normalized stress for Groups 32-37 ...................... 146
D.16. Influence of tilt angle on displacement for Groups 32-37 .............................................. 147
D.17. Influence of bar size on maximum normalized stress for Groups 38-43 ........................ 148
D.18. Influence of bar size on displacement for Groups 38-43 ................................................ 149
D.19. Influence of bar position on maximum normalized stress for Groups 44-55 ................. 150
D.20. Influence of bar position on displacement for Groups 44-55 ......................................... 151
D.21. Influence of group effect on maximum stress for Groups 56-59 ................................... 153
D.22. Influence of group effect on normalized displacement for Groups 56-59 ..................... 154
D.23. Influence of group effect on maximum stress for Groups 60-63 ................................... 155
D.24. Influence of group effect on normalized displacement for Groups 60-63 ..................... 156
x
LIST OF TABLES
Table Page
3.1. Concrete Mixture Proportions and Properties ..................................................................... 17
3.2. Measured Hardened Concrete Properties of Single Bar Specimens ................................... 18
3.3. Measured Hardened Concrete Properties of Multiple Bar Specimens ................................ 18
3.4. Variable Top Concrete Cover .............................................................................................. 19
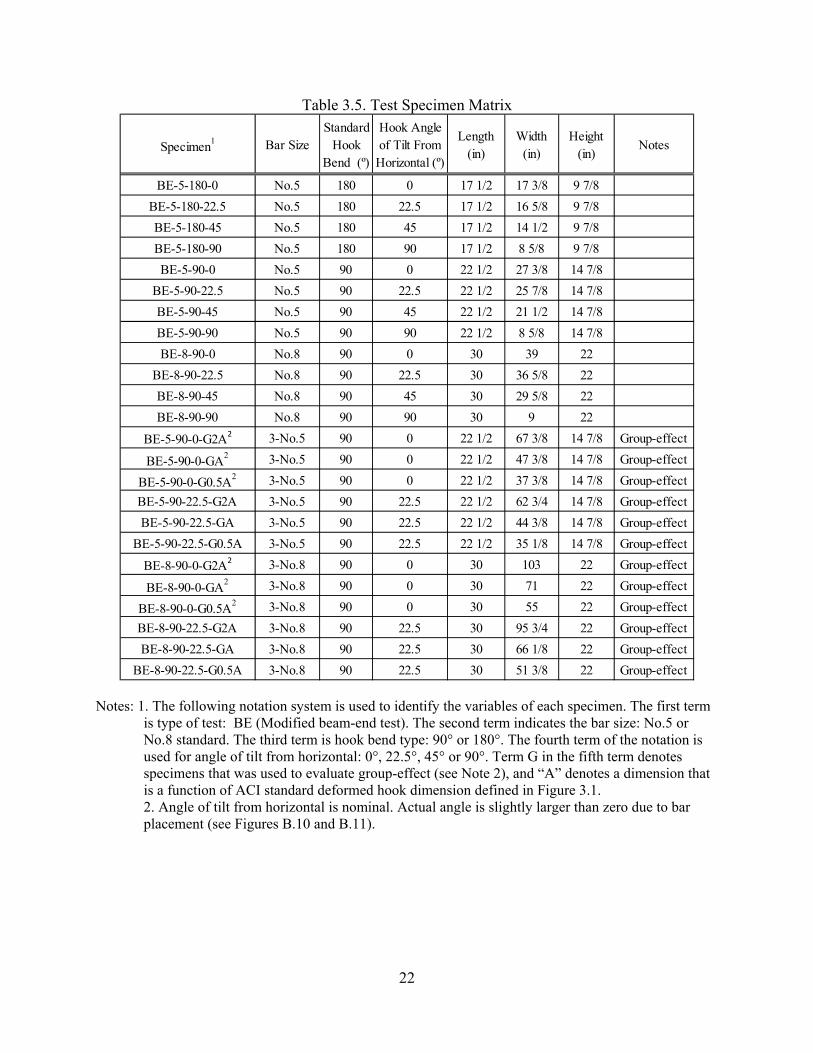
3.5. Test Specimen Matrix .......................................................................................................... 22
3.6. Summary of Test Results ..................................................................................................... 23
3.7. Summary of Measured Slip Values ..................................................................................... 24
4.1. Single Bar Specimen Groups and Results ........................................................................... 37
4.2. Multiple Bar Specimen Groups and Results ....................................................................... 38
4.3. Combined Single Bar and Multiple Bar Specimen Groups and Results ............................. 41
A.1. Concrete Mixture Proportions and Properties .................................................................... 46
A.2. Measured Hardened Concrete Properties of Single Bar Specimens ................................... 47
A.3. Measured Hardened Concrete Properties of Multiple Bar Specimens ............................... 47
B.1. Variable Top Concrete Cover ............................................................................................. 70
B.2. Test Specimen Matrix ......................................................................................................... 71
D.1. Single Bar Specimen Results, Groups 1-3 ........................................................................ 127
D.2. Single Bar Specimen Results, Groups 4-7 ........................................................................ 127
D.3. Single Bar Specimen Results, Groups 8-11 ...................................................................... 127
D.4. Multiple Bar Specimens Results, Groups 12-15 .............................................................. 134
D.5. Multiple Bar Specimens Results, Groups 16-21 .............................................................. 134
D.6. Multiple Bar Specimens Results, Groups 22-27 .............................................................. 135
D.7. Multiple Bar Specimen Results, Groups 28-31 ................................................................ 135
D.8. Multiple Bar Specimen Results, Groups 32-37 ................................................................ 136
D.9. Multiple Bar Specimens Results, Groups 38-43 .............................................................. 136
D.10. Multiple Bar Specimens Results, Groups 44-59 ............................................................ 137
D.11. Combined Single Bar and Multiple Bar Specimen Results, Groups 56-59 .................... 152
D.12. Combined Single Bar and Multiple Bar Specimen Results, Groups 60-63 .................... 152
xi
NOMENCLATURE
Symbol Description
Ar Bearing area, in2
db Nominal diameter of reinforcing bar, in
E Modulus of elasticity, psi
f'c Compressive strength of concrete at test date, psi
f'c avg Average compressive strength of concrete, psi
fy Yield strength of reinforcement, psi
hr Average height of deformations on reinforcing bar, in
L Length, in
ld Development length of straight reinforcing bar, in
ldh Development length of hooked reinforcing bar, in
Rr Relative rib area, in2
sr Average spacing of deformations on reinforcing bar, in
S1 Displacement at maximum normalized stress, in
S1* Normalized displacement at maximum stress, in
T1 Maximum stress, psi
T1* Maximum normalized stress, psi
δ Change in length, in
σ Stress, psi
1
1. INTRODUCTION
The topic of the evaluation of the orientation of 90° and 180° of reinforcing bar hooks in concrete members was identified by the Concrete Reinforcing Steel Institute (CRSI) as high-priority for the reinforcing steel industry. The stress of longitudinal reinforcing steel of flexural elements is often developed at the end of a concrete member by a 90° or 180° standard hook that is usually oriented in the vertical direction. In some instances, such as the case of a shallow member that is heavily reinforced with steel deformed reinforcing bars, the standard hook height in accordance with ACI 318-08 plus concrete cover above and below the bar may exceed the thickness of the concrete member and the reinforcing bar must be tilted. A construction example can be seen in Figure 1.1. (1Photos used with permission from Jack Gibbons of CRSI.)
Figure 1.1. Construction photos1 of tilted reinforcing hooked bars
1.1. PROBLEM STATEMENT
With the issue of necessity to tilt reinforcing bars in concrete, the CRSI Design Handbook (2008) notes that the hook may be tilted from vertical to maintain the required clear cover seen in Figure 1.2. The limits of this tilt, however, are not defined or known (Figure 1.3), thus, research is needed to study the influence of hook tilt angle on the hook performance and determine the limitations of hook tilt.
2
Figure 1.2. Recommended bar details for solid slabs (CRSI Design Handbook 2008)
Figure 1.3. Schematic of a hooked bar in concrete slab
1.2. SCOPE AND OBJECTIVES
The objective of this research was to evaluate the limits of reinforcing steel hook tilt, if any, to ensure bond of the reinforcing bar was not compromised. Design recommendations developed as part of this study will provide clarification to engineers and building code officials regarding limits of tilt of hooked reinforcing bars so that the original intent of hooked bar development provisions are met. Concrete reinforcement studied in this research includes deformed reinforcing steel bars with standard hooks as defined in ACI 318-08 in normal weight concrete. The variables of this test series include hook tilt angle, hook bend type, reinforcing bar size, and group-effect. Four hook tilt angles were evaluated at 0° (horizontal), 22.5°, 45°, and 90° (vertical). Both 90° and 180° hooked reinforcing bars were investigated because of their common use in construction projects. No. 5 and No. 8 bars were examined in this study since they are also commonly used. The multiple bar specimens were compared to single bar specimens to evaluate the effects. 1.3. SUMMARY OF CONTENT
The problem statement, scope, and objectives of this study can be found in the introductory Section 1. Section 2 contains a literature review, which is comprised of a review of the stress

3
distribution of bond between reinforcing steel and concrete as well as a discussion of the types of bond tests that were considered. A summary of previous studies related to bond and development of hooked reinforcing bars is also included in Section 2. Section 3 is a summary of the experimental work performed, including test specimen design, dimensions, material properties and test results, where the detailed information can be found in the appendices (where the appendices are an integral part of this report). Analysis of the test results is discussed in detail in Section 4 as well as a comparison of the test results from this study to previous literature presented in Section 2. Finally, Section 5 contains the summary of key findings of this study, the conclusions, and recommendations for the tilt angle of hooked reinforcing bars in concrete.
4
2. LITERATURE REVIEW
2.1. INTRODUCTION
The performance of reinforced concrete depends on the bond strength between concrete and reinforcing steel. The stress distribution of bond between concrete and straight and hooked steel reinforcing bars is discussed in detail in Section 2.2. Following, the types of bond tests reported in the literature are described and compared in Section 2.3. A summary of the bond studies reviewed for this investigation is presented in Section 2.4. Finally the current ACI 318-08 Code provisions on the development of standard hooks in tension are discussed in Section 2.5. 2.2. BOND STRESS DISTRIBUTION
2.2.1. Mechanism of Bond Transfer. Bond strength is created by bond transfer forces where the force in the steel is transferred to the concrete through different mechanisms. These mechanisms of force transfer include chemical adhesion, frictional forces, and mechanical anchorage of deformations or ribs on a reinforcing bar (ACI 408R-03, CRSI Design Handbook 2008) seen in Figure 2.1.
Figure 2.1. Bond force transfer mechanisms (ACI 408R-03)
Two types of reinforcing bars have been utilized in reinforced concrete construction: plain and deformed. While plain (not deformed) reinforcing bars may have irregular or random surface imperfections, they do not have intentional deformations or ribs. Therefore, the plain steel reinforcement transfers most of its bond forces by chemical adhesion and frictional forces. Deformed reinforcing bars have both straight and ribbed sections along the length of the bar. The frictional and adhesion forces are developed by the straight portion of the bar until initial slip of the bar occurs. After the initial slip of the bar occurs and the bar continues to slip, the forces transfer to the deformations as shown in Figure 2.1 (ACI 408R-03). Plain bars are not typically used in modern reinforced concrete construction as deformed bars can transfer more force by mechanical bearing, therefore deformed bars were the focus of this study. The bond of deformed bars is based on the interaction of the ribs or deformed surface of the bar with the cement of the concrete. Bond is affected by the mechanical properties of the concrete and steel including tensile and compressive strength, presence of transverse reinforcement, surface condition of the bar, geometry of the bar, concrete cover, and bar spacing (ACI 408R-
5
03). Since deformed bars may be produced with different deformation patterns, the quality of the bond depends upon the strength of the cementitious material between the deformations and the area of interaction of the cement and deformations (Rehm and Amerongen 1961). Relative rib area, Rr, is a useful parameter of bar geometry used to compare bars with different rib geometries. Relative rib area is defined as the ratio of the bearing area of the bar deformations, Ar or πhrdb, to the shearing area between the deformations, πdbsr, as shown in Figure 2.2 (ACI 408.3R-01). For epoxy-coated reinforcing bars, tests indicate that there is a reduction in bond caused by the reduction in adhesion and frictional forces (or slick surface) of the bars (Hamad et al. 1993). One of the ways to examine distribution or transfer of bond stresses along the length of the bar is to relate local bond stresses to the local displacement. This relationship is obtained from directly measuring the load applied to the reinforcing bar and directly measuring the displacements. The relationship determined in this way shows a fundamental law for bond, just as stress-strain diagrams do for the strength behavior of steel or concrete (Rehm and Amerongen 1961).
Figure 2.2. Relative rib area (ACI 408.3R-01)
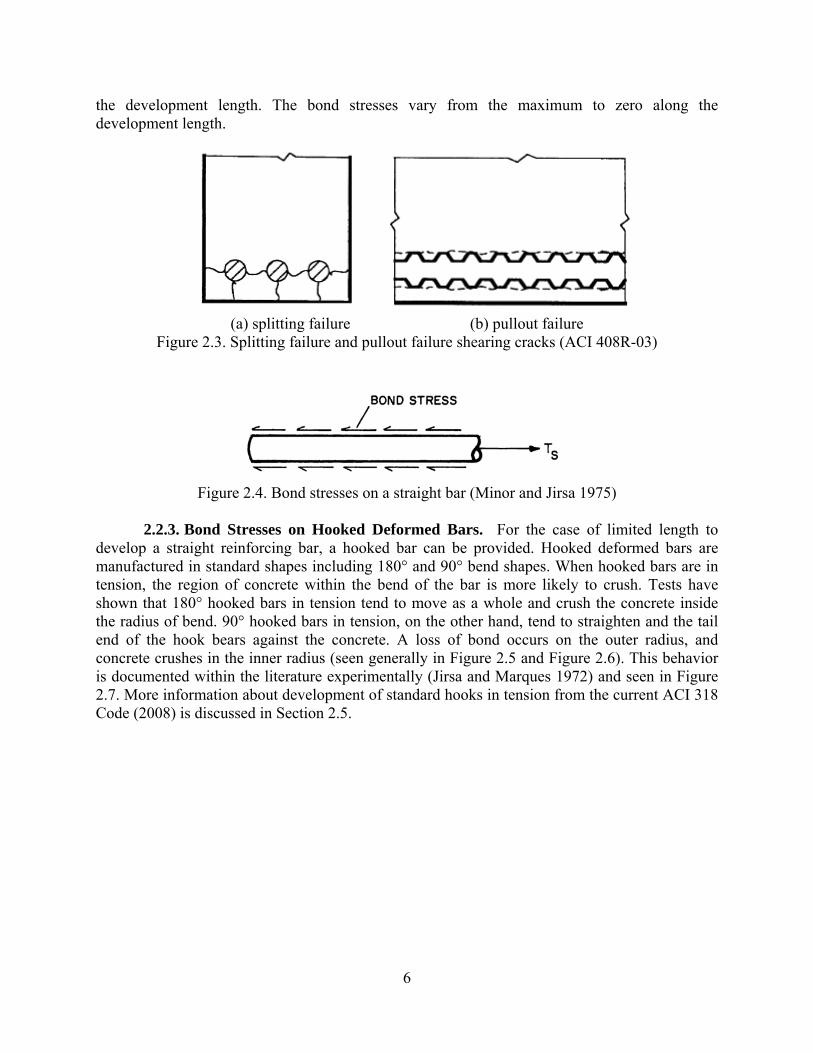
There are usually three failure modes associated with bond between reinforcing bars and concrete: splitting failure through the concrete cover (see Figure 2.3a), pullout failure by shearing cracks or crushing between the bar deformations (see Figure 2.3b), and yielding of the reinforcing bar. If the concrete cover or the distance between reinforcing bars is too small, transverse splitting cracks can occur and lead to splitting failure (ACI 408R-03). If the concrete cover or bar spacing is adequate then splitting failure is prevented and pullout failure is more likely to occur. Pullout failure happens when the concrete shears along a plane parallel to the surface of the reinforcing bar. For both splitting failure and pullout failure, there might be crushed concrete adjacent to the reinforcing bar deformations from mechanical bearing. If the bond strength is strong enough, then the reinforcing bar may yield before splitting or pullout failure occurs, thus bond failures can occur at bar stresses up to the yield strength of the bar (ACI 408R-03).
2.2.2. Bond Stresses on Straight Deformed Bars. Bond stresses occur along the length of a straight reinforcing bar in the opposite direction as the tensile stress in the bar seen generally in Figure 2.4. Bond stresses vary significantly along the length of the reinforcing bar (ACI 408R-03). The force must transfer from the reinforcing bar to the concrete over a length, called
6
the development length. The bond stresses vary from the maximum to zero along the development length.
(a) splitting failure (b) pullout failure
Figure 2.3. Splitting failure and pullout failure shearing cracks (ACI 408R-03)
Figure 2.4. Bond stresses on a straight bar (Minor and Jirsa 1975)
2.2.3. Bond Stresses on Hooked Deformed Bars. For the case of limited length to
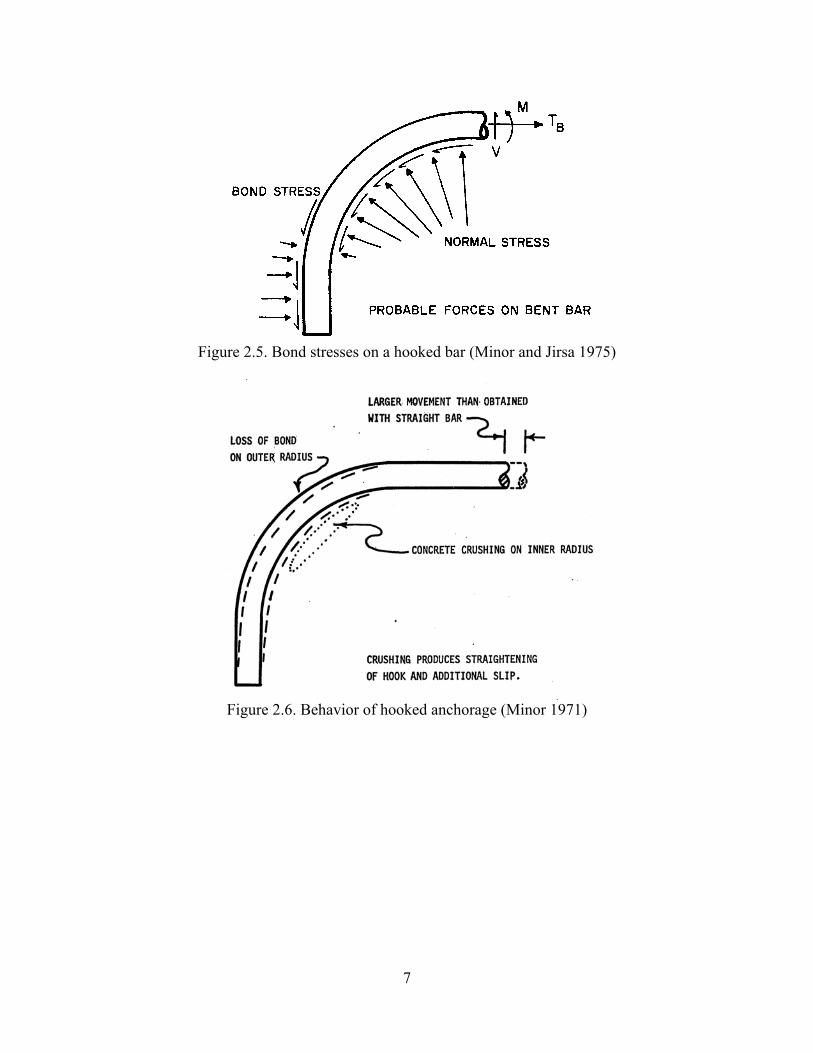
develop a straight reinforcing bar, a hooked bar can be provided. Hooked deformed bars are manufactured in standard shapes including 180° and 90° bend shapes. When hooked bars are in tension, the region of concrete within the bend of the bar is more likely to crush. Tests have shown that 180° hooked bars in tension tend to move as a whole and crush the concrete inside the radius of bend. 90° hooked bars in tension, on the other hand, tend to straighten and the tail end of the hook bears against the concrete. A loss of bond occurs on the outer radius, and concrete crushes in the inner radius (seen generally in Figure 2.5 and Figure 2.6). This behavior is documented within the literature experimentally (Jirsa and Marques 1972) and seen in Figure 2.7. More information about development of standard hooks in tension from the current ACI 318 Code (2008) is discussed in Section 2.5.
7
Figure 2.5. Bond stresses on a hooked bar (Minor and Jirsa 1975)
Figure 2.6. Behavior of hooked anchorage (Minor 1971)
8
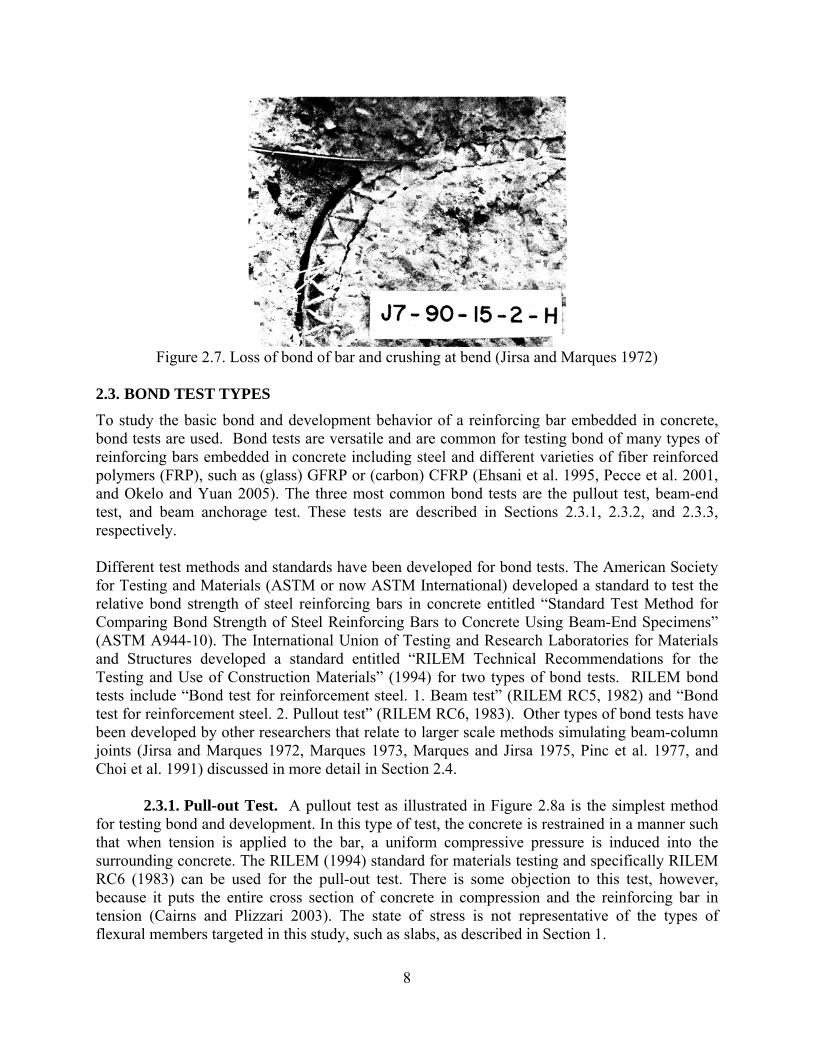
Figure 2.7. Loss of bond of bar and crushing at bend (Jirsa and Marques 1972)
2.3. BOND TEST TYPES
To study the basic bond and development behavior of a reinforcing bar embedded in concrete, bond tests are used. Bond tests are versatile and are common for testing bond of many types of reinforcing bars embedded in concrete including steel and different varieties of fiber reinforced polymers (FRP), such as (glass) GFRP or (carbon) CFRP (Ehsani et al. 1995, Pecce et al. 2001, and Okelo and Yuan 2005). The three most common bond tests are the pullout test, beam-end test, and beam anchorage test. These tests are described in Sections 2.3.1, 2.3.2, and 2.3.3, respectively. Different test methods and standards have been developed for bond tests. The American Society for Testing and Materials (ASTM or now ASTM International) developed a standard to test the relative bond strength of steel reinforcing bars in concrete entitled “Standard Test Method for Comparing Bond Strength of Steel Reinforcing Bars to Concrete Using Beam-End Specimens” (ASTM A944-10). The International Union of Testing and Research Laboratories for Materials and Structures developed a standard entitled “RILEM Technical Recommendations for the Testing and Use of Construction Materials” (1994) for two types of bond tests. RILEM bond tests include “Bond test for reinforcement steel. 1. Beam test” (RILEM RC5, 1982) and “Bond test for reinforcement steel. 2. Pullout test” (RILEM RC6, 1983). Other types of bond tests have been developed by other researchers that relate to larger scale methods simulating beam-column joints (Jirsa and Marques 1972, Marques 1973, Marques and Jirsa 1975, Pinc et al. 1977, and Choi et al. 1991) discussed in more detail in Section 2.4.
2.3.1. Pull-out Test. A pullout test as illustrated in Figure 2.8a is the simplest method for testing bond and development. In this type of test, the concrete is restrained in a manner such that when tension is applied to the bar, a uniform compressive pressure is induced into the surrounding concrete. The RILEM (1994) standard for materials testing and specifically RILEM RC6 (1983) can be used for the pull-out test. There is some objection to this test, however, because it puts the entire cross section of concrete in compression and the reinforcing bar in tension (Cairns and Plizzari 2003). The state of stress is not representative of the types of flexural members targeted in this study, such as slabs, as described in Section 1.
9
2.3.2. Beam-end Test. The beam-end test, which simulates a flexural beam as seen in
Figure 2.8b, results in placing the concrete in both tension and compression and the reinforcing bar in tension (Cairns and Plizzari 2003). In this test, the concrete is considered unconfined and contains minimum auxiliary reinforcement. ASTM International provides a standard for testing beam-end specimens, ASTM A944-10, that is intended to determine the effects of surface preparation of deformed steel reinforcing bars or condition on the bond strength to concrete. To prevent localized failure around the loaded end or lead end of the reinforcing bar, bond is prevented near the surface of the concrete as shown in Figure 2.8b (ACI 408R-03). Several researchers have used this type of test to study bond of straight and hooked bars as discussed in Section 2.4. A modified version of the beam-end test was chosen to be the method of testing in this study.
2.3.3. Beam Anchorage Test. The beam anchorage test places the concrete in both tension and compression and the reinforcing bar in tension (Figure 2.8c) similar to the beam-end test described in Section 2.3.2. A key difference from the beam-end test is that auxiliary reinforcement is provided for confinement in the beam anchorage test to study the bond behavior in concrete that is confined. Mentioned previously RILEM RC5 includes a test method for the beam anchorage test that has been used in previous studies with bonded FRP reinforcement (Pecce et al. 2001 and Okelo 2007).
Figure 2.8. Schematic of bond tests (ACI 408R-03)
2.4. PREVIOUS STUDIES
This section describes previous studies on bond strength of hooked reinforcing bars that have led to provisions and requirements for reinforced concrete buildings. These studies served as the basis for designing the experiments discussed in Section 3.
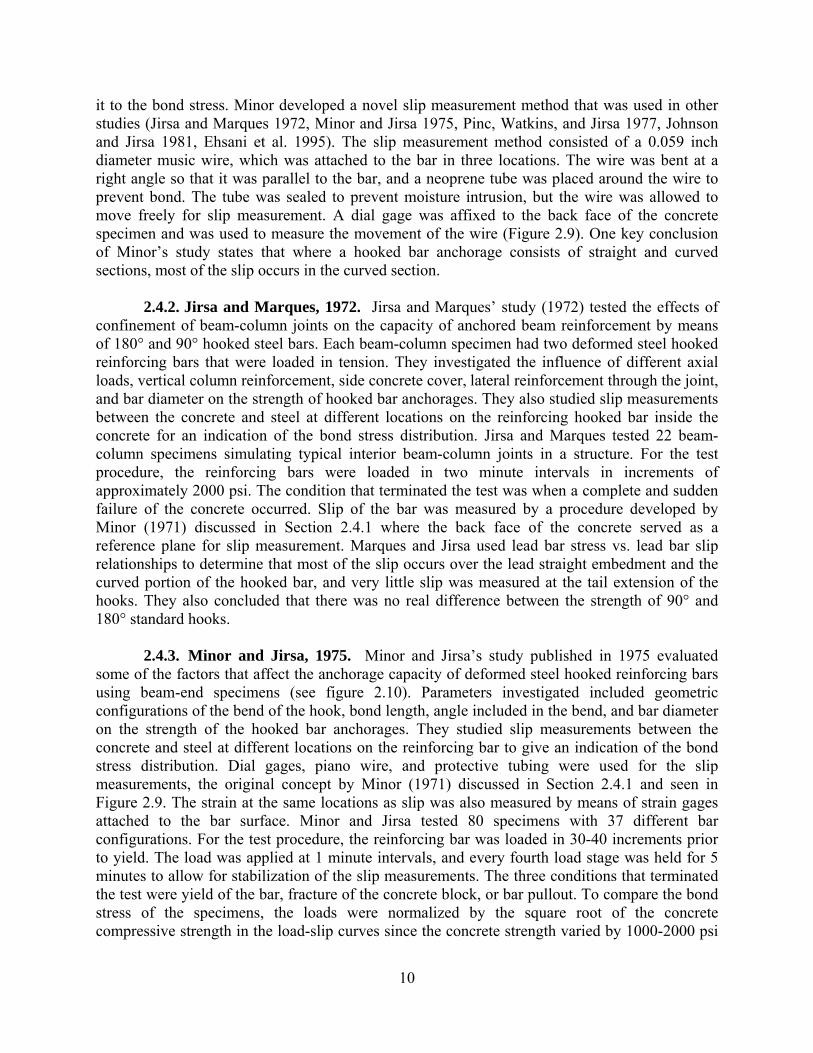
2.4.1. Minor, 1971. The study by John Minor (1971) consisted primarily of measuring slip between deformed steel reinforcing bars and concrete beam-end specimens. The slip gave indications of anchorage capacities of hooked deformed reinforcing bars. Minor varied the geometric configurations of the hooked bars to determine the effects of bond length, angle included in the bend, inside radius of the bend, and bar diameter on the strength of the hooked bars. The slip was measured at the loaded end, unloaded end, and an intermediate point on the hooked bar. The unloaded end and intermediate point were embedded within and bonded to the concrete. These slip measurements were obtained to examine the movement of the bar and relate
10
it to the bond stress. Minor developed a novel slip measurement method that was used in other studies (Jirsa and Marques 1972, Minor and Jirsa 1975, Pinc, Watkins, and Jirsa 1977, Johnson and Jirsa 1981, Ehsani et al. 1995). The slip measurement method consisted of a 0.059 inch diameter music wire, which was attached to the bar in three locations. The wire was bent at a right angle so that it was parallel to the bar, and a neoprene tube was placed around the wire to prevent bond. The tube was sealed to prevent moisture intrusion, but the wire was allowed to move freely for slip measurement. A dial gage was affixed to the back face of the concrete specimen and was used to measure the movement of the wire (Figure 2.9). One key conclusion of Minor’s study states that where a hooked bar anchorage consists of straight and curved sections, most of the slip occurs in the curved section.
2.4.2. Jirsa and Marques, 1972. Jirsa and Marques’ study (1972) tested the effects of confinement of beam-column joints on the capacity of anchored beam reinforcement by means of 180° and 90° hooked steel bars. Each beam-column specimen had two deformed steel hooked reinforcing bars that were loaded in tension. They investigated the influence of different axial loads, vertical column reinforcement, side concrete cover, lateral reinforcement through the joint, and bar diameter on the strength of hooked bar anchorages. They also studied slip measurements between the concrete and steel at different locations on the reinforcing hooked bar inside the concrete for an indication of the bond stress distribution. Jirsa and Marques tested 22 beam-column specimens simulating typical interior beam-column joints in a structure. For the test procedure, the reinforcing bars were loaded in two minute intervals in increments of approximately 2000 psi. The condition that terminated the test was when a complete and sudden failure of the concrete occurred. Slip of the bar was measured by a procedure developed by Minor (1971) discussed in Section 2.4.1 where the back face of the concrete served as a reference plane for slip measurement. Marques and Jirsa used lead bar stress vs. lead bar slip relationships to determine that most of the slip occurs over the lead straight embedment and the curved portion of the hooked bar, and very little slip was measured at the tail extension of the hooks. They also concluded that there was no real difference between the strength of 90° and 180° standard hooks.
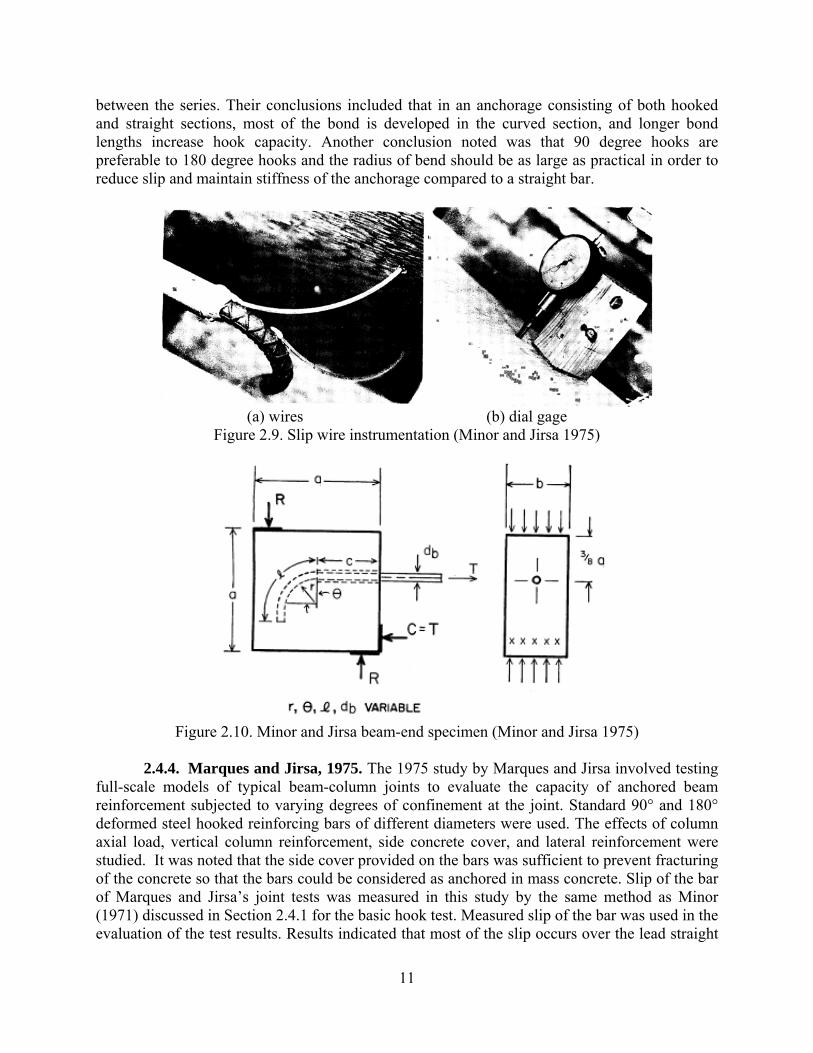
2.4.3. Minor and Jirsa, 1975. Minor and Jirsa’s study published in 1975 evaluated some of the factors that affect the anchorage capacity of deformed steel hooked reinforcing bars using beam-end specimens (see figure 2.10). Parameters investigated included geometric configurations of the bend of the hook, bond length, angle included in the bend, and bar diameter on the strength of the hooked bar anchorages. They studied slip measurements between the concrete and steel at different locations on the reinforcing bar to give an indication of the bond stress distribution. Dial gages, piano wire, and protective tubing were used for the slip measurements, the original concept by Minor (1971) discussed in Section 2.4.1 and seen in Figure 2.9. The strain at the same locations as slip was also measured by means of strain gages attached to the bar surface. Minor and Jirsa tested 80 specimens with 37 different bar configurations. For the test procedure, the reinforcing bar was loaded in 30-40 increments prior to yield. The load was applied at 1 minute intervals, and every fourth load stage was held for 5 minutes to allow for stabilization of the slip measurements. The three conditions that terminated the test were yield of the bar, fracture of the concrete block, or bar pullout. To compare the bond stress of the specimens, the loads were normalized by the square root of the concrete compressive strength in the load-slip curves since the concrete strength varied by 1000-2000 psi
11
between the series. Their conclusions included that in an anchorage consisting of both hooked and straight sections, most of the bond is developed in the curved section, and longer bond lengths increase hook capacity. Another conclusion noted was that 90 degree hooks are preferable to 180 degree hooks and the radius of bend should be as large as practical in order to reduce slip and maintain stiffness of the anchorage compared to a straight bar.
(a) wires (b) dial gage
Figure 2.9. Slip wire instrumentation (Minor and Jirsa 1975)
Figure 2.10. Minor and Jirsa beam-end specimen (Minor and Jirsa 1975)
2.4.4. Marques and Jirsa, 1975. The 1975 study by Marques and Jirsa involved testing
full-scale models of typical beam-column joints to evaluate the capacity of anchored beam reinforcement subjected to varying degrees of confinement at the joint. Standard 90° and 180° deformed steel hooked reinforcing bars of different diameters were used. The effects of column axial load, vertical column reinforcement, side concrete cover, and lateral reinforcement were studied. It was noted that the side cover provided on the bars was sufficient to prevent fracturing of the concrete so that the bars could be considered as anchored in mass concrete. Slip of the bar of Marques and Jirsa’s joint tests was measured in this study by the same method as Minor (1971) discussed in Section 2.4.1 for the basic hook test. Measured slip of the bar was used in the evaluation of the test results. Results indicated that most of the slip occurs over the lead straight
12
embedment and the curved portion of the hooked bar, while very little slip was measured on the tail extensions of the hooks. Also slip measurements showed that 180° hooks pulled toward the face of the specimen rather than around the bend. Based on this work, Marques and Jirsa proposed design recommendations for ACI 318 for development of tensile stresses and development length. This study also found that strength is increased as restraint against side splitting increased, and that standard hooks embedded in concrete exhibit strengths well in excess of yield.
2.4.5. Pinc, Watkins, and Jirsa, 1977. Pinc, Watkins, and Jirsa’s study investigated the influence of straight lead embedment and lightweight concrete on the strength of steel deformed hooked reinforcing bar anchorages. Their sixteen specimens simulated typical beam-column joints, and the bars were loaded in tension to failure to determine strength and stiffness values. For testing, slip values were measured by Minor’s (1971) method of instrumentation discussed in Section 2.4.1. Slip of the bars with respect to the surrounding concrete was measured along with the tensile stress in the bar, and representative plots were produced. This study found that the failure from a hooked bar is governed by a loss of cover rather than by pull-out due to a stress concentration inside the bend of the hooked anchorage. The principal factors affecting anchorage capacity are the length of embedment and the degree of lateral confinement of the joint. This study also proposed a basic embedment length equation with modification factors for the concrete cover and for lightweight concrete.
2.4.6. Johnson and Jirsa, 1981. The 1981 study by Johnson and Jirsa investigated the influence of short embedment and close spacing on the strength of deformed steel hooked reinforcing bar anchorages in thin concrete walls. The specimens in this study simulated full-scale typical anchorages in walls where adequate side cover was used to prevent fracturing of the concrete. The bar diameter, concrete strength, unbonded straight lead lengths, and spacing between multiple hooked bars were varied. The method of slip measurement developed by Minor (1971) and discussed in Section 2.4.1 was used in this study. Slip measurements were plotted against tensile bar stress where the bar stress was normalized by a factor of the square root of the concrete compressive strength. Since the tail end slips were not significant, only the lead tangent slip was reviewed for trends. Johnson and Jirsa concluded that in specimens with muiltiple bars (3 bars), closer spacing results in lower strengths while larger spacing results in higher strengths and similar to specimens with a singular bar. They also concluded that failure resulted from a loss of cover in front of the hook. Design recommendations for designing short hooked bar embedment lengths for ACI 318 were presented in this study.
2.4.7. Hamad, Jirsa, and D’Abreu, 1993. Hamad, Jirsa, and D’Abreu’s 1993 study reflected the advancement in corrosion resistance of steel reinforcing bars by examining anchorage characteristics of epoxy-coated deformed steel hooked reinforcing bars. The twenty-five specimens simulating typical beam-columns joints were created to determine the effects of bar size, concrete strength, amount of side cover, hook geometry, and amount of transverse reinforcement. Results showed that epoxy-coated bars developed lower anchorage capacities and had greater slips than uncoated steel bars. For epoxy-coated reinforcing bars, Hamad et al. recommended that the development length of an uncoated steel hooked reinforcing bar should be increased twenty percent to account for the reduction in bond of an epoxy coated steel hooked reinforcing bar.
13
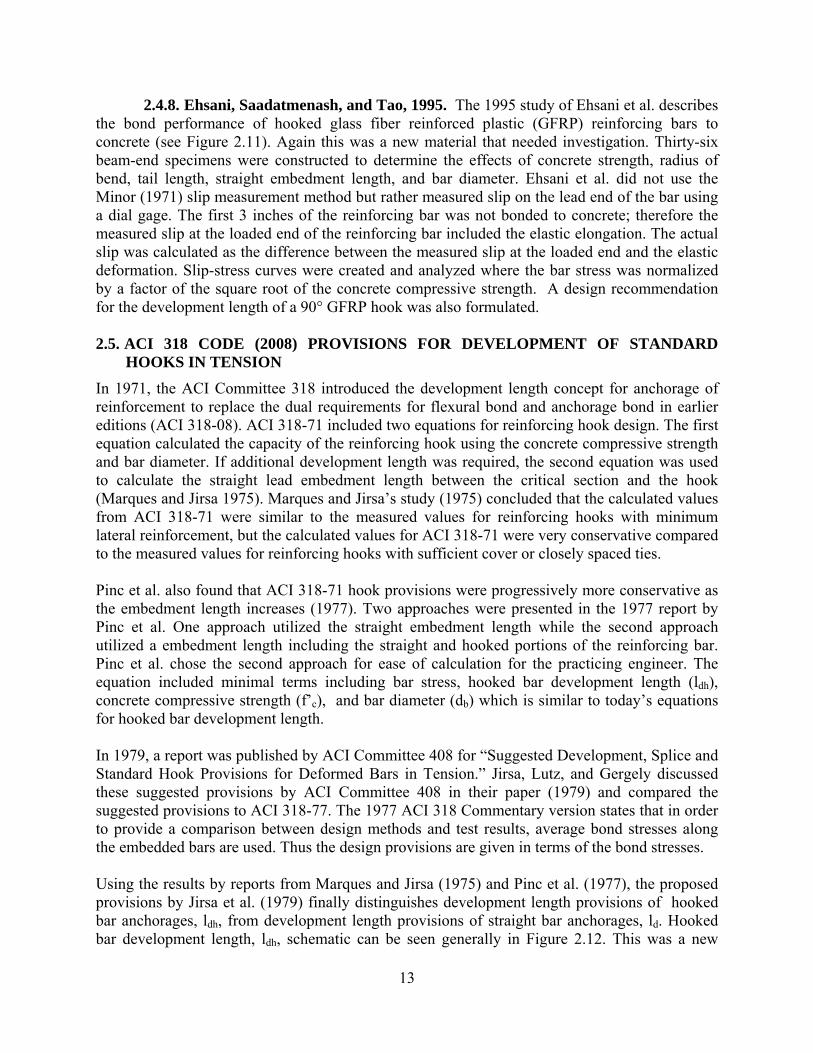
2.4.8. Ehsani, Saadatmenash, and Tao, 1995. The 1995 study of Ehsani et al. describes the bond performance of hooked glass fiber reinforced plastic (GFRP) reinforcing bars to concrete (see Figure 2.11). Again this was a new material that needed investigation. Thirty-six beam-end specimens were constructed to determine the effects of concrete strength, radius of bend, tail length, straight embedment length, and bar diameter. Ehsani et al. did not use the Minor (1971) slip measurement method but rather measured slip on the lead end of the bar using a dial gage. The first 3 inches of the reinforcing bar was not bonded to concrete; therefore the measured slip at the loaded end of the reinforcing bar included the elastic elongation. The actual slip was calculated as the difference between the measured slip at the loaded end and the elastic deformation. Slip-stress curves were created and analyzed where the bar stress was normalized by a factor of the square root of the concrete compressive strength. A design recommendation for the development length of a 90° GFRP hook was also formulated. 2.5. ACI 318 CODE (2008) PROVISIONS FOR DEVELOPMENT OF STANDARD
HOOKS IN TENSION
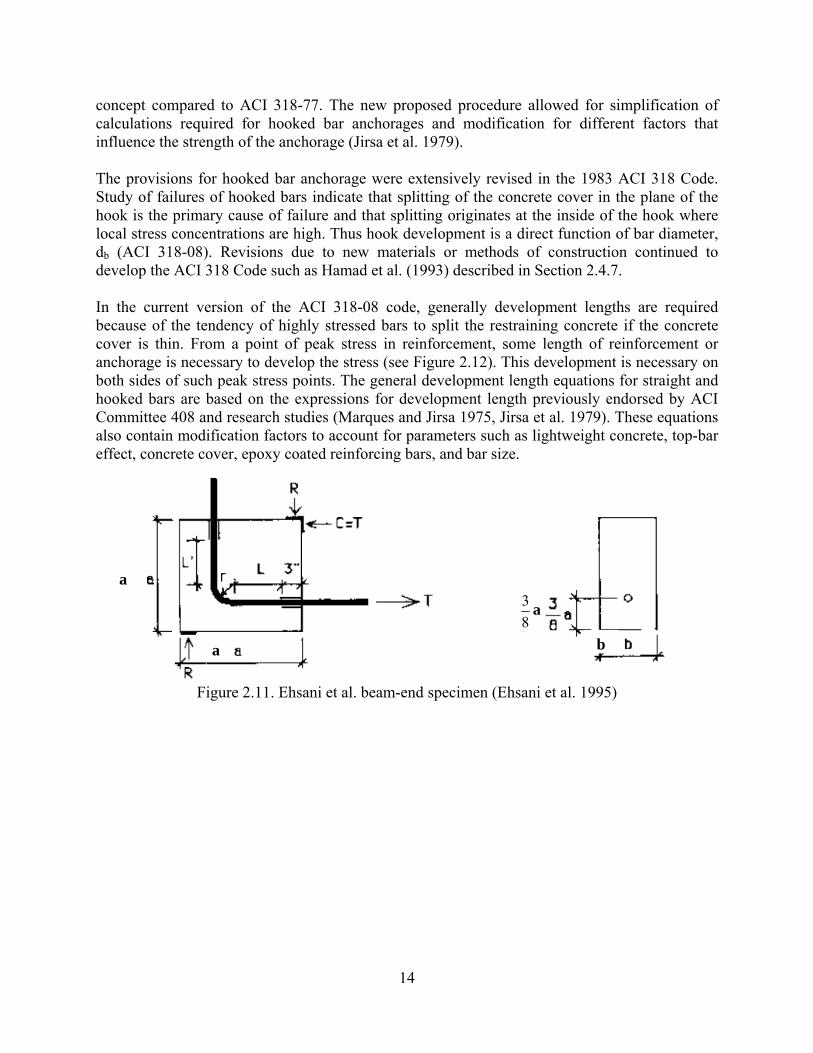
In 1971, the ACI Committee 318 introduced the development length concept for anchorage of reinforcement to replace the dual requirements for flexural bond and anchorage bond in earlier editions (ACI 318-08). ACI 318-71 included two equations for reinforcing hook design. The first equation calculated the capacity of the reinforcing hook using the concrete compressive strength and bar diameter. If additional development length was required, the second equation was used to calculate the straight lead embedment length between the critical section and the hook (Marques and Jirsa 1975). Marques and Jirsa’s study (1975) concluded that the calculated values from ACI 318-71 were similar to the measured values for reinforcing hooks with minimum lateral reinforcement, but the calculated values for ACI 318-71 were very conservative compared to the measured values for reinforcing hooks with sufficient cover or closely spaced ties. Pinc et al. also found that ACI 318-71 hook provisions were progressively more conservative as the embedment length increases (1977). Two approaches were presented in the 1977 report by Pinc et al. One approach utilized the straight embedment length while the second approach utilized a embedment length including the straight and hooked portions of the reinforcing bar. Pinc et al. chose the second approach for ease of calculation for the practicing engineer. The equation included minimal terms including bar stress, hooked bar development length (ldh), concrete compressive strength (f’c), and bar diameter (db) which is similar to today’s equations for hooked bar development length. In 1979, a report was published by ACI Committee 408 for “Suggested Development, Splice and Standard Hook Provisions for Deformed Bars in Tension.” Jirsa, Lutz, and Gergely discussed these suggested provisions by ACI Committee 408 in their paper (1979) and compared the suggested provisions to ACI 318-77. The 1977 ACI 318 Commentary version states that in order to provide a comparison between design methods and test results, average bond stresses along the embedded bars are used. Thus the design provisions are given in terms of the bond stresses. Using the results by reports from Marques and Jirsa (1975) and Pinc et al. (1977), the proposed provisions by Jirsa et al. (1979) finally distinguishes development length provisions of hooked bar anchorages, ldh, from development length provisions of straight bar anchorages, ld. Hooked bar development length, ldh, schematic can be seen generally in Figure 2.12. This was a new
14
concept compared to ACI 318-77. The new proposed procedure allowed for simplification of calculations required for hooked bar anchorages and modification for different factors that influence the strength of the anchorage (Jirsa et al. 1979). The provisions for hooked bar anchorage were extensively revised in the 1983 ACI 318 Code. Study of failures of hooked bars indicate that splitting of the concrete cover in the plane of the hook is the primary cause of failure and that splitting originates at the inside of the hook where local stress concentrations are high. Thus hook development is a direct function of bar diameter, db (ACI 318-08). Revisions due to new materials or methods of construction continued to develop the ACI 318 Code such as Hamad et al. (1993) described in Section 2.4.7. In the current version of the ACI 318-08 code, generally development lengths are required because of the tendency of highly stressed bars to split the restraining concrete if the concrete cover is thin. From a point of peak stress in reinforcement, some length of reinforcement or anchorage is necessary to develop the stress (see Figure 2.12). This development is necessary on both sides of such peak stress points. The general development length equations for straight and hooked bars are based on the expressions for development length previously endorsed by ACI Committee 408 and research studies (Marques and Jirsa 1975, Jirsa et al. 1979). These equations also contain modification factors to account for parameters such as lightweight concrete, top-bar effect, concrete cover, epoxy coated reinforcing bars, and bar size.
Figure 2.11. Ehsani et al. beam-end specimen (Ehsani et al. 1995)
a
a
83
a
b
15
Figure 2.12. Development length for standard hooked reinforcing bars (ACI 318-08)
16
3. EXPERIMENTS
3.1. INTRODUCTION
This section summarizes the material properties, experimental program, design of the specimens, and test results of the experiments conducted in this study. Detailed information about the test program including material properties, test specimen construction, test setup, and test procedure can be found in Appendix A. Detailed information about the test specimen design rationale can be found in Appendix B. The test results including a detailed account of the specimen failure modes, stress-strain displacement, and strain distribution can be found in Appendix C. 3.2. MATERIAL PROPERTIES
The materials used in this study were ASTM A615 Grade 60 reinforcing steel and normal weight concrete. The reinforcing steel was provided and bent to the specific hook type and dimensions by a steel manufacturer, Ambassador Steel Corporation. Mill certifications were provided for quality assurance. The concrete target compressive strength was 4500 psi and the mixture design is shown in Table 3.1. The single bar specimens achieved a measured average compressive strength of 6450 psi at test date and the multiple bar specimens achieved an average of 4850 psi compressive strength at test date. More information about the material properties of steel and concrete can be found in Appendix A.2. The measured specimen concrete compressive strengths at test date can be found in Table 3.2 and Table 3.3. 3.3. SPECIMEN DESIGN AND DIMENSIONS
This study focused on testing 24 beam-end specimens to analyze the bond characteristics of tilted hooked reinforcing bars and develop recommendations if needed. The variables of this test series include hook tilt angle, hook bend type, reinforcing bar size, and group effect. Four hook tilt angles were evaluated at 0° (horizontal), 22.5°, 45°, and 90° (vertical). Both 90° and 180° hooked reinforcing bars and No. 5 and No. 8 bar sizes were examined in this study since all are commonly used in construction. Two types of beam-end specimens were tested: single bar and multiple bar (where the multiple bar contained three hooked reinforcing bars). The multiple bar specimens tested only had hook bend of 90° and hook tilt angles of 0° and 22.5°. Variable bar spacing was used between the three hooked reinforcing bars: 0.5A, A, and 2A (see Figure 3.1 for “A” dimension). The entire test specimen matrix can be found in Table 3.5. The beam-end specimen design and testing procedure was modeled after the earlier tests of Minor and Jirsa and other research (see Section 2.4) with rationale discussed in Appendix B. All of the specimens had 3 inches of cover from the back face of the specimen to the hook tail, 4 inches of side cover to the hook, and 3db of concrete cover to the bottom of the bar to prevent the concrete cracking in those areas. The concrete cover from the end of the hook tail to the top of the specimen varied depending on hook orientation (≥ 3 inches) and is listed in Table 3.4. Single bar specimens with 180° and 90° hooks are shown in Figure 3.2 and Figure 3.3, respectively (θ is the angle of tilt of the hook). Multiple bar specimens are shown in Figure 3.4 (θ is the angle of tilt).
17
Figure 3.1. CRSI Design Manual hook detail (CRSI Design Manual 2008)
Table 3.1. Concrete Mixture Proportions and Properties
Specified Actual Specified Actual
Cement1 (lbs/cy) 642 645 642 642
Fine Aggregate2
(lbs/cy)1103
(3.61% MC7)1097
1065 (2.34% MC7)
1090
Coarse Aggregate3
(lbs/cy)1816
(3.54% MC7)1817
1755 (1.22% MC7)
1755
Water (lbs/cy)340 (SSD5)
286 6286
340 (SSD5) 336 6
336
Water-cement Ratio (w/c)
0.53 0.53 0.53 0.53
Slump (in) (not specified) 9 (not specified) 9.75
Air Content4 (%) (not specified) 1.4 (not specified) 1.2Unit Weight (lb/cf) (not specified) 147.7 (not specified) 146
7/23/2010 Concrete Batch 10/22/2010 Concrete BatchSingle Bar Specimens Multiple Bar Specimens
1. Cement is Type 1 2. Fine Aggregate is ASTM C33 3. Coarse Aggregate is ASTM C33 4. Air content was measured by pressure method, ASTM C231 5. Saturated surface dry (SSD) 6. Includes moisture from aggregates 7. Moisture content (MC) was measured from aggregate sampled the day before the concrete was batched

18
Table 3.2. Measured Hardened Concrete Properties of Single Bar Specimens
Test date SpecimenAge of test date (days)
Average compressive strength (psi)
Average splitting tensile strength
(psi)8/26/2010 BE-5-180-90 34 6690 4109/1/2010 BE-5-180-45 40 5910 4309/9/2010 BE-5-180-22.5 48 6420 480
9/11/2010 BE-5-180-0 50 6580 4909/15/2010 BE-5-90-90 54 6590 4609/20/2010 BE-5-90-45 59 6360 3909/23/2010 BE-5-90-0 62 6130 45010/4/2010 BE-5-9-22.5 73 6150 42010/6/2010 BE-8-90-45 75 6480 40010/11/2010 BE-8-90-0 80 6610 44010/12/2010 BE-8-90-90 81 6610 44010/13/2010 BE-8-90-22.5 82 6570 410
Table 3.3. Measured Hardened Concrete Properties of Multiple Bar Specimens
Test date SpecimenAge of test date (days)
Average compressive strength (psi)
Average splitting tensile strength
(psi)1/6/2011 BE-8-90-0-A 76 4850 450
1/14/2011 BE-8-90-22.5-A 84 5310 4101/15/2011 BE-8-90-22.5-0.5A 85 4260 4501/19/2011 BE-8-90-22.5-2A 89 4450 4101/22/2011 BE-8-90-0-2A 92 5020 4201/26/2011 BE-8-90-0-0.5A 96 4470 4101/31/2011 BE-5-90-0-A 101 5350 3802/3/2011 BE-5-90-22.5-0.5A 104 4840 420
2/23/2011 BE-5-90-22.5-A 124 4970 4102/25/2011 BE-5-90-0-0.5A 126 4970 4102/26/2011 BE-5-90-22.5-2A 127 4840 3802/28/2011 BE-5-90-0-2A 129 4840 380
19
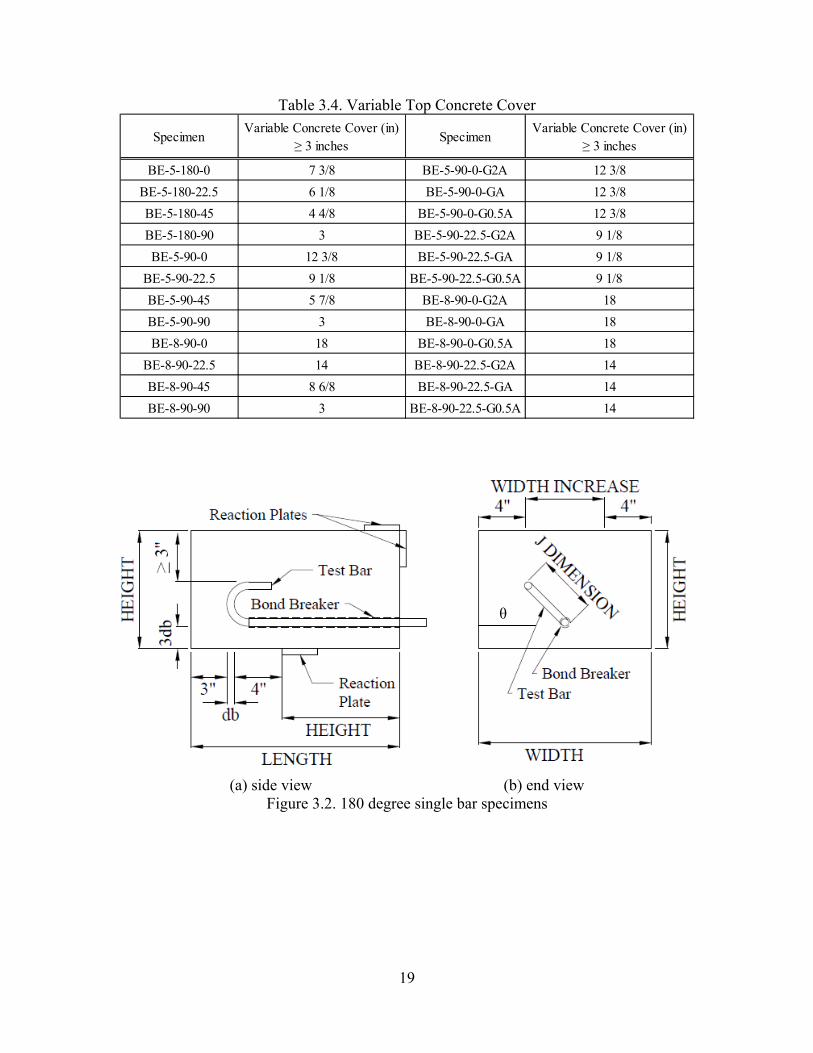
Table 3.4. Variable Top Concrete Cover
SpecimenVariable Concrete Cover (in)
≥ 3 inchesSpecimen
Variable Concrete Cover (in) ≥ 3 inches
BE-5-180-0 7 3/8 BE-5-90-0-G2A 12 3/8BE-5-180-22.5 6 1/8 BE-5-90-0-GA 12 3/8BE-5-180-45 4 4/8 BE-5-90-0-G0.5A 12 3/8BE-5-180-90 3 BE-5-90-22.5-G2A 9 1/8BE-5-90-0 12 3/8 BE-5-90-22.5-GA 9 1/8
BE-5-90-22.5 9 1/8 BE-5-90-22.5-G0.5A 9 1/8BE-5-90-45 5 7/8 BE-8-90-0-G2A 18 BE-5-90-90 3 BE-8-90-0-GA 18 BE-8-90-0 18 BE-8-90-0-G0.5A 18
BE-8-90-22.5 14 BE-8-90-22.5-G2A 14 BE-8-90-45 8 6/8 BE-8-90-22.5-GA 14 BE-8-90-90 3 BE-8-90-22.5-G0.5A 14
(a) side view (b) end view
Figure 3.2. 180 degree single bar specimens
θ
20
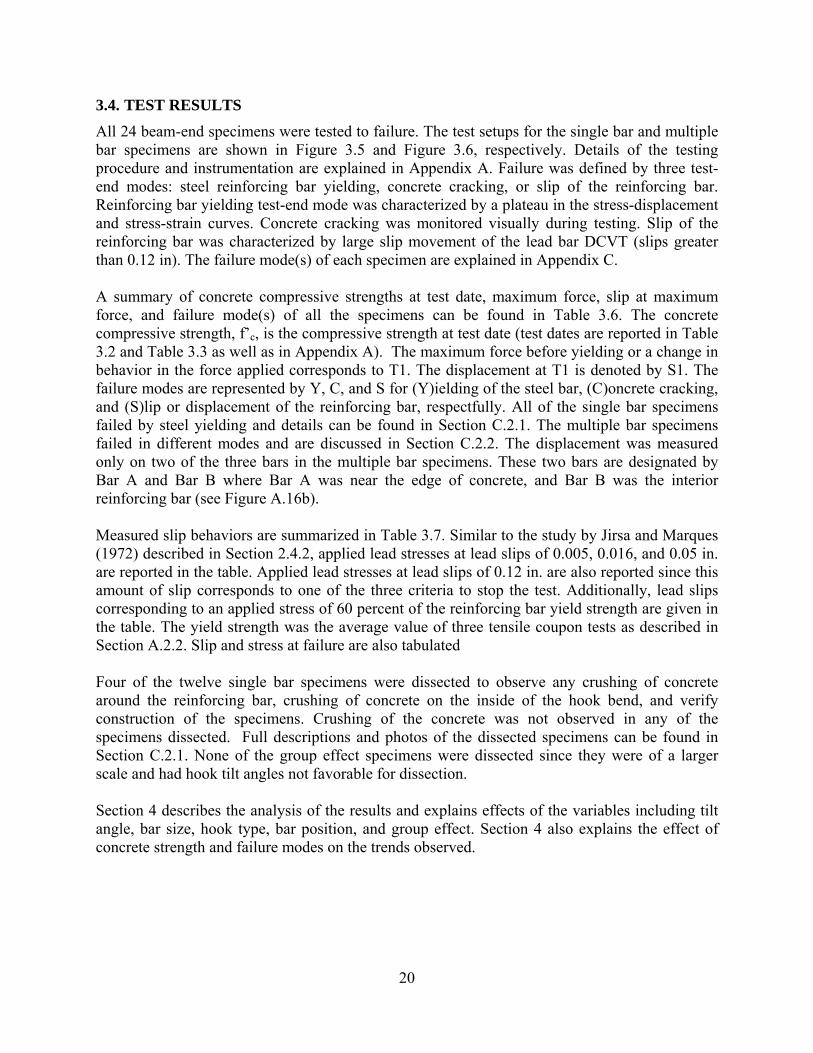
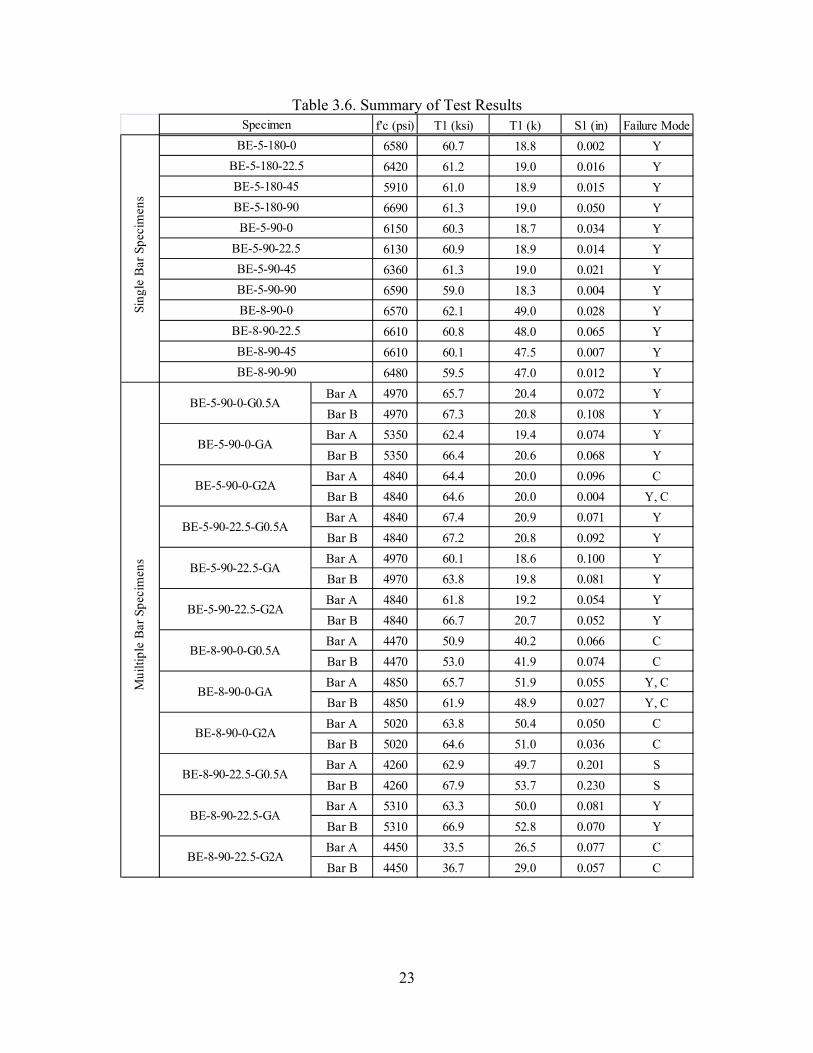
3.4. TEST RESULTS
All 24 beam-end specimens were tested to failure. The test setups for the single bar and multiple bar specimens are shown in Figure 3.5 and Figure 3.6, respectively. Details of the testing procedure and instrumentation are explained in Appendix A. Failure was defined by three test-end modes: steel reinforcing bar yielding, concrete cracking, or slip of the reinforcing bar. Reinforcing bar yielding test-end mode was characterized by a plateau in the stress-displacement and stress-strain curves. Concrete cracking was monitored visually during testing. Slip of the reinforcing bar was characterized by large slip movement of the lead bar DCVT (slips greater than 0.12 in). The failure mode(s) of each specimen are explained in Appendix C. A summary of concrete compressive strengths at test date, maximum force, slip at maximum force, and failure mode(s) of all the specimens can be found in Table 3.6. The concrete compressive strength, f’c, is the compressive strength at test date (test dates are reported in Table 3.2 and Table 3.3 as well as in Appendix A). The maximum force before yielding or a change in behavior in the force applied corresponds to T1. The displacement at T1 is denoted by S1. The failure modes are represented by Y, C, and S for (Y)ielding of the steel bar, (C)oncrete cracking, and (S)lip or displacement of the reinforcing bar, respectfully. All of the single bar specimens failed by steel yielding and details can be found in Section C.2.1. The multiple bar specimens failed in different modes and are discussed in Section C.2.2. The displacement was measured only on two of the three bars in the multiple bar specimens. These two bars are designated by Bar A and Bar B where Bar A was near the edge of concrete, and Bar B was the interior reinforcing bar (see Figure A.16b). Measured slip behaviors are summarized in Table 3.7. Similar to the study by Jirsa and Marques (1972) described in Section 2.4.2, applied lead stresses at lead slips of 0.005, 0.016, and 0.05 in. are reported in the table. Applied lead stresses at lead slips of 0.12 in. are also reported since this amount of slip corresponds to one of the three criteria to stop the test. Additionally, lead slips corresponding to an applied stress of 60 percent of the reinforcing bar yield strength are given in the table. The yield strength was the average value of three tensile coupon tests as described in Section A.2.2. Slip and stress at failure are also tabulated Four of the twelve single bar specimens were dissected to observe any crushing of concrete around the reinforcing bar, crushing of concrete on the inside of the hook bend, and verify construction of the specimens. Crushing of the concrete was not observed in any of the specimens dissected. Full descriptions and photos of the dissected specimens can be found in Section C.2.1. None of the group effect specimens were dissected since they were of a larger scale and had hook tilt angles not favorable for dissection. Section 4 describes the analysis of the results and explains effects of the variables including tilt angle, bar size, hook type, bar position, and group effect. Section 4 also explains the effect of concrete strength and failure modes on the trends observed.
21
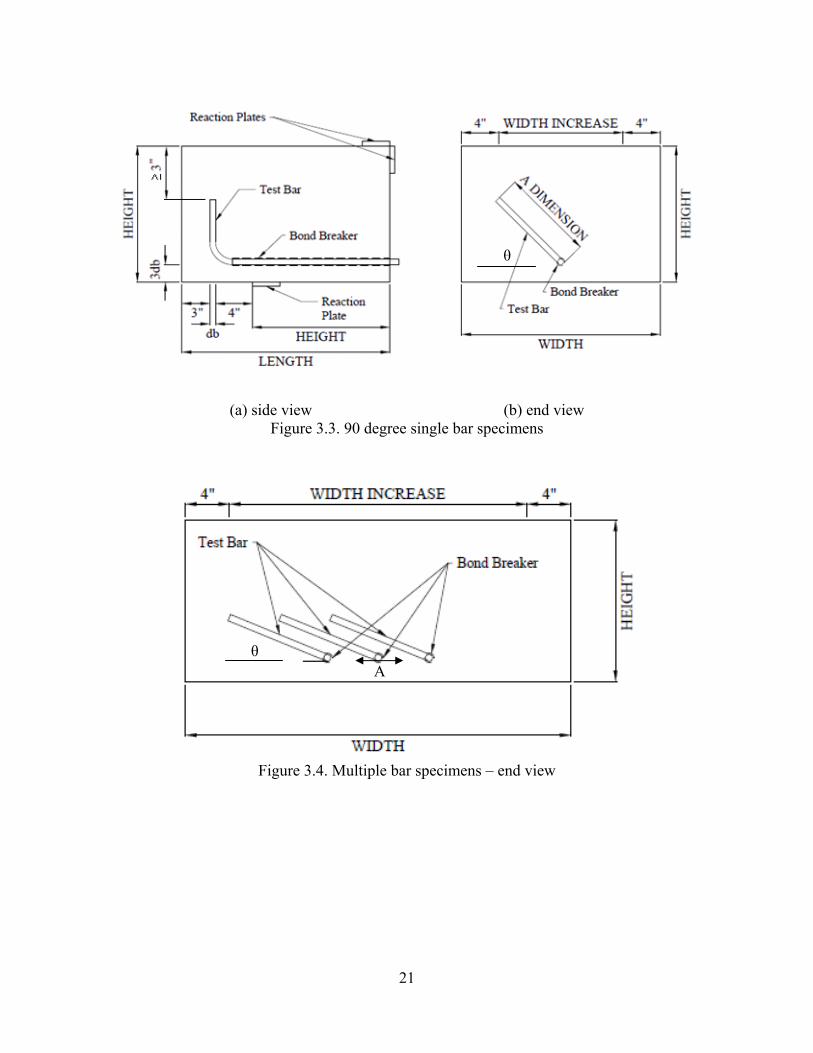
(a) side view (b) end view
Figure 3.3. 90 degree single bar specimens
Figure 3.4. Multiple bar specimens – end view
θ
θ A
22
Table 3.5. Test Specimen Matrix
Specimen1 Bar SizeStandard
Hook Bend (º)
Hook Angle of Tilt From
Horizontal (º)
Length (in)
Width (in)
Height (in)
Notes
BE-5-180-0 No.5 180 0 17 1/2 17 3/8 9 7/8BE-5-180-22.5 No.5 180 22.5 17 1/2 16 5/8 9 7/8BE-5-180-45 No.5 180 45 17 1/2 14 1/2 9 7/8BE-5-180-90 No.5 180 90 17 1/2 8 5/8 9 7/8BE-5-90-0 No.5 90 0 22 1/2 27 3/8 14 7/8
BE-5-90-22.5 No.5 90 22.5 22 1/2 25 7/8 14 7/8BE-5-90-45 No.5 90 45 22 1/2 21 1/2 14 7/8BE-5-90-90 No.5 90 90 22 1/2 8 5/8 14 7/8BE-8-90-0 No.8 90 0 30 39 22
BE-8-90-22.5 No.8 90 22.5 30 36 5/8 22BE-8-90-45 No.8 90 45 30 29 5/8 22BE-8-90-90 No.8 90 90 30 9 22
BE-5-90-0-G2A2 3-No.5 90 0 22 1/2 67 3/8 14 7/8 Group-effect
BE-5-90-0-GA2 3-No.5 90 0 22 1/2 47 3/8 14 7/8 Group-effect
BE-5-90-0-G0.5A2 3-No.5 90 0 22 1/2 37 3/8 14 7/8 Group-effectBE-5-90-22.5-G2A 3-No.5 90 22.5 22 1/2 62 3/4 14 7/8 Group-effectBE-5-90-22.5-GA 3-No.5 90 22.5 22 1/2 44 3/8 14 7/8 Group-effect
BE-5-90-22.5-G0.5A 3-No.5 90 22.5 22 1/2 35 1/8 14 7/8 Group-effect
BE-8-90-0-G2A2 3-No.8 90 0 30 103 22 Group-effect
BE-8-90-0-GA2 3-No.8 90 0 30 71 22 Group-effect
BE-8-90-0-G0.5A2 3-No.8 90 0 30 55 22 Group-effectBE-8-90-22.5-G2A 3-No.8 90 22.5 30 95 3/4 22 Group-effectBE-8-90-22.5-GA 3-No.8 90 22.5 30 66 1/8 22 Group-effect
BE-8-90-22.5-G0.5A 3-No.8 90 22.5 30 51 3/8 22 Group-effect
Notes: 1. The following notation system is used to identify the variables of each specimen. The first term is type of test: BE (Modified beam-end test). The second term indicates the bar size: No.5 or No.8 standard. The third term is hook bend type: 90° or 180°. The fourth term of the notation is used for angle of tilt from horizontal: 0°, 22.5°, 45° or 90°. Term G in the fifth term denotes specimens that was used to evaluate group-effect (see Note 2), and “A” denotes a dimension that is a function of ACI standard deformed hook dimension defined in Figure 3.1. 2. Angle of tilt from horizontal is nominal. Actual angle is slightly larger than zero due to bar placement (see Figures B.10 and B.11).
23
Table 3.6. Summary of Test Results f'c (psi) T1 (ksi) T1 (k) S1 (in) Failure Mode
6580 60.7 18.8 0.002 Y6420 61.2 19.0 0.016 Y5910 61.0 18.9 0.015 Y6690 61.3 19.0 0.050 Y6150 60.3 18.7 0.034 Y6130 60.9 18.9 0.014 Y6360 61.3 19.0 0.021 Y6590 59.0 18.3 0.004 Y6570 62.1 49.0 0.028 Y6610 60.8 48.0 0.065 Y6610 60.1 47.5 0.007 Y6480 59.5 47.0 0.012 Y
Bar A 4970 65.7 20.4 0.072 YBar B 4970 67.3 20.8 0.108 YBar A 5350 62.4 19.4 0.074 YBar B 5350 66.4 20.6 0.068 YBar A 4840 64.4 20.0 0.096 CBar B 4840 64.6 20.0 0.004 Y, CBar A 4840 67.4 20.9 0.071 YBar B 4840 67.2 20.8 0.092 YBar A 4970 60.1 18.6 0.100 YBar B 4970 63.8 19.8 0.081 YBar A 4840 61.8 19.2 0.054 YBar B 4840 66.7 20.7 0.052 YBar A 4470 50.9 40.2 0.066 CBar B 4470 53.0 41.9 0.074 CBar A 4850 65.7 51.9 0.055 Y, CBar B 4850 61.9 48.9 0.027 Y, CBar A 5020 63.8 50.4 0.050 CBar B 5020 64.6 51.0 0.036 CBar A 4260 62.9 49.7 0.201 SBar B 4260 67.9 53.7 0.230 SBar A 5310 63.3 50.0 0.081 YBar B 5310 66.9 52.8 0.070 YBar A 4450 33.5 26.5 0.077 CBar B 4450 36.7 29.0 0.057 C
BE-8-90-90
Mui
ltipl
e B
ar S
peci
men
sSi
ngle
Bar
Spe
cim
ens
BE-5-90-0-G0.5A
BE-5-90-0-GA
BE-5-90-0-G2A
BE-5-90-22.5-G0.5A
BE-5-90-22.5-GA
BE-5-90-22.5-G2A
BE-8-90-0-G0.5A
BE-8-90-0-GA
BE-8-90-0-G2A
BE-8-90-22.5-G0.5A
BE-8-90-22.5-GA
BE-8-90-22.5-G2A
BE-5-180-0
BE-5-90-45BE-5-90-90BE-8-90-0
BE-8-90-22.5BE-8-90-45
Specimen
BE-5-180-45BE-5-180-90BE-5-90-0
BE-5-90-22.5
BE-5-180-22.5
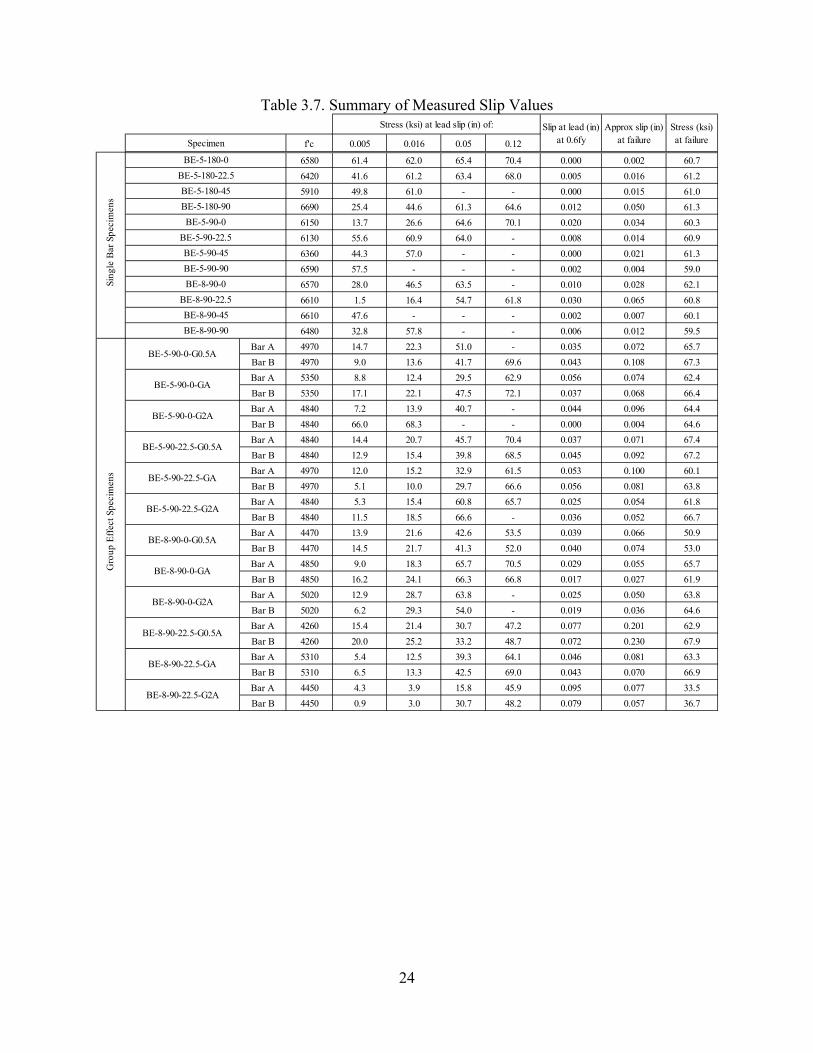
24
Table 3.7. Summary of Measured Slip Values
f'c 0.005 0.016 0.05 0.12
6580 61.4 62.0 65.4 70.4 0.000 0.002 60.76420 41.6 61.2 63.4 68.0 0.005 0.016 61.25910 49.8 61.0 - - 0.000 0.015 61.06690 25.4 44.6 61.3 64.6 0.012 0.050 61.36150 13.7 26.6 64.6 70.1 0.020 0.034 60.36130 55.6 60.9 64.0 - 0.008 0.014 60.96360 44.3 57.0 - - 0.000 0.021 61.36590 57.5 - - - 0.002 0.004 59.06570 28.0 46.5 63.5 - 0.010 0.028 62.16610 1.5 16.4 54.7 61.8 0.030 0.065 60.86610 47.6 - - - 0.002 0.007 60.16480 32.8 57.8 - - 0.006 0.012 59.5
Bar A 4970 14.7 22.3 51.0 - 0.035 0.072 65.7Bar B 4970 9.0 13.6 41.7 69.6 0.043 0.108 67.3Bar A 5350 8.8 12.4 29.5 62.9 0.056 0.074 62.4Bar B 5350 17.1 22.1 47.5 72.1 0.037 0.068 66.4Bar A 4840 7.2 13.9 40.7 - 0.044 0.096 64.4Bar B 4840 66.0 68.3 - - 0.000 0.004 64.6Bar A 4840 14.4 20.7 45.7 70.4 0.037 0.071 67.4Bar B 4840 12.9 15.4 39.8 68.5 0.045 0.092 67.2Bar A 4970 12.0 15.2 32.9 61.5 0.053 0.100 60.1Bar B 4970 5.1 10.0 29.7 66.6 0.056 0.081 63.8Bar A 4840 5.3 15.4 60.8 65.7 0.025 0.054 61.8Bar B 4840 11.5 18.5 66.6 - 0.036 0.052 66.7Bar A 4470 13.9 21.6 42.6 53.5 0.039 0.066 50.9Bar B 4470 14.5 21.7 41.3 52.0 0.040 0.074 53.0Bar A 4850 9.0 18.3 65.7 70.5 0.029 0.055 65.7Bar B 4850 16.2 24.1 66.3 66.8 0.017 0.027 61.9Bar A 5020 12.9 28.7 63.8 - 0.025 0.050 63.8Bar B 5020 6.2 29.3 54.0 - 0.019 0.036 64.6Bar A 4260 15.4 21.4 30.7 47.2 0.077 0.201 62.9Bar B 4260 20.0 25.2 33.2 48.7 0.072 0.230 67.9Bar A 5310 5.4 12.5 39.3 64.1 0.046 0.081 63.3Bar B 5310 6.5 13.3 42.5 69.0 0.043 0.070 66.9Bar A 4450 4.3 3.9 15.8 45.9 0.095 0.077 33.5Bar B 4450 0.9 3.0 30.7 48.2 0.079 0.057 36.7
BE-8-90-22.5-G0.5A
BE-8-90-22.5-GA
BE-8-90-22.5-G2A
Gro
up E
ffec
t Spe
cim
ens
BE-5-90-0-G0.5A
BE-5-90-0-GA
BE-5-90-0-G2A
BE-5-90-22.5-G0.5A
BE-5-90-22.5-GA
BE-5-90-22.5-G2A
BE-8-90-0-G0.5A
BE-8-90-0-GA
BE-8-90-0-G2A
BE-5-90-45BE-5-90-90BE-8-90-0
BE-8-90-22.5BE-8-90-45BE-8-90-90
Approx slip (in) at failure
Stress (ksi) at failure Specimen
Sing
le B
ar S
peci
men
s
BE-5-180-0BE-5-180-22.5BE-5-180-45BE-5-180-90BE-5-90-0
BE-5-90-22.5
Stress (ksi) at lead slip (in) of: Slip at lead (in) at 0.6fy
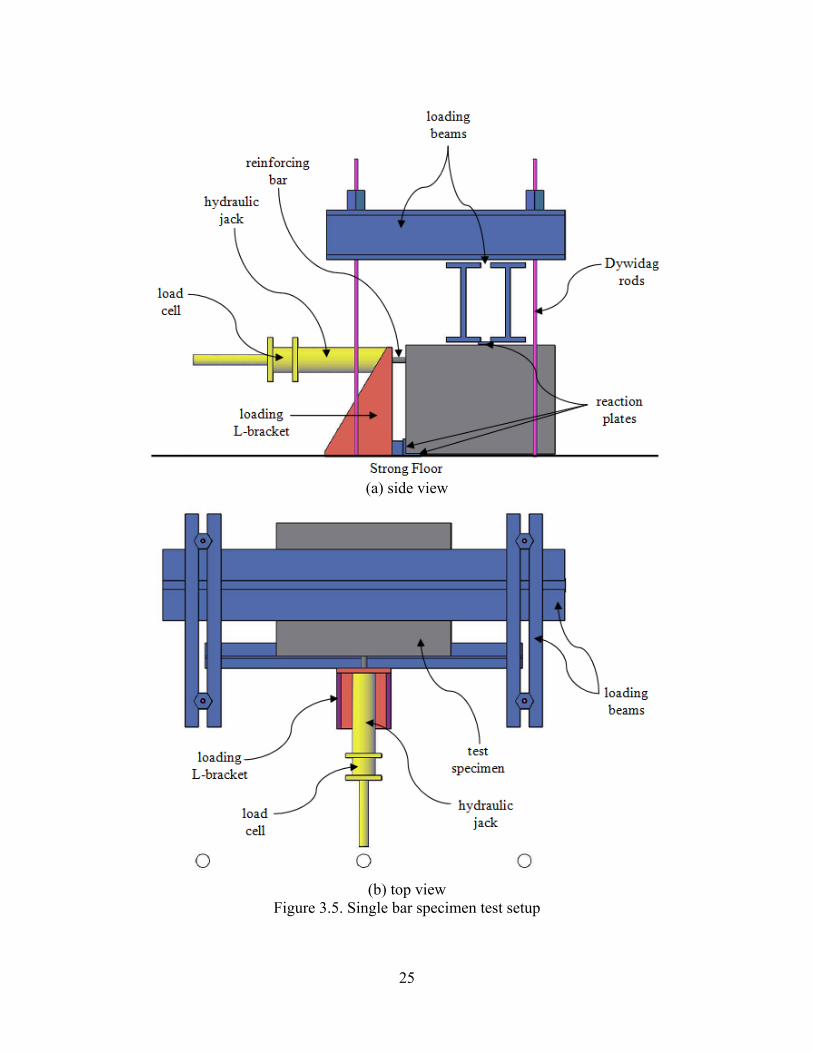
25
(a) side view
(b) top view
Figure 3.5. Single bar specimen test setup
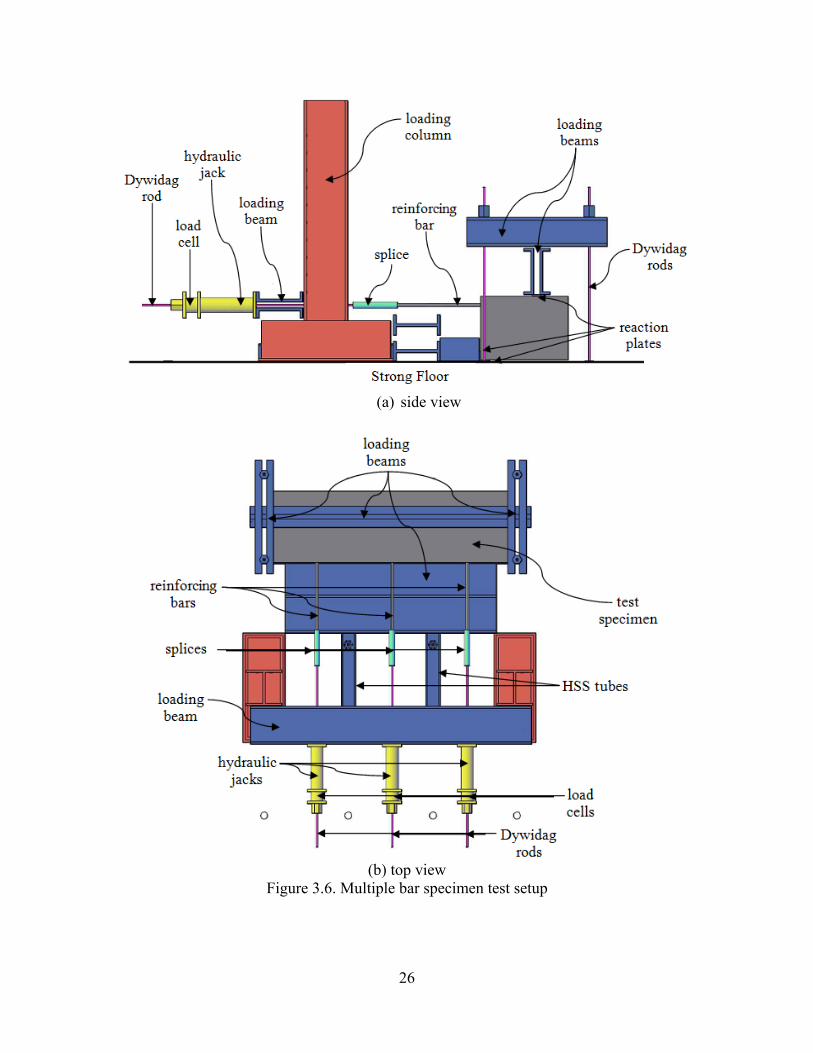
26
(a) side view
(b) top view
Figure 3.6. Multiple bar specimen test setup
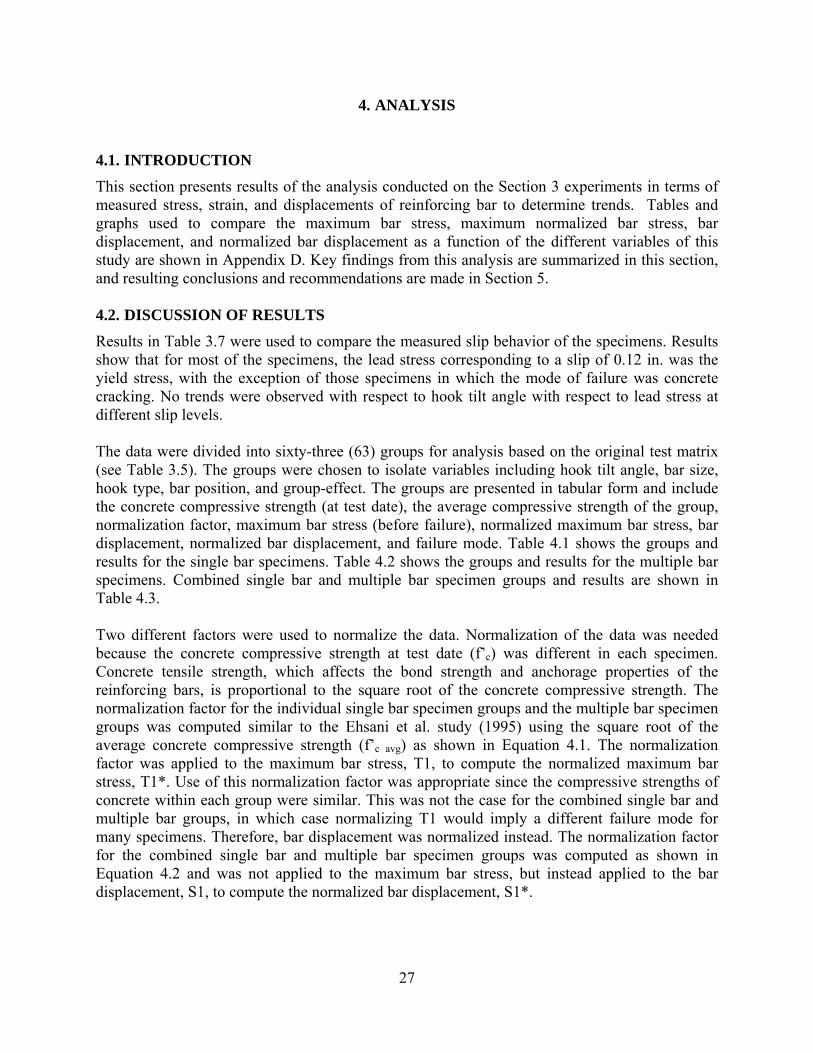
27
4. ANALYSIS
4.1. INTRODUCTION
This section presents results of the analysis conducted on the Section 3 experiments in terms of measured stress, strain, and displacements of reinforcing bar to determine trends. Tables and graphs used to compare the maximum bar stress, maximum normalized bar stress, bar displacement, and normalized bar displacement as a function of the different variables of this study are shown in Appendix D. Key findings from this analysis are summarized in this section, and resulting conclusions and recommendations are made in Section 5. 4.2. DISCUSSION OF RESULTS
Results in Table 3.7 were used to compare the measured slip behavior of the specimens. Results show that for most of the specimens, the lead stress corresponding to a slip of 0.12 in. was the yield stress, with the exception of those specimens in which the mode of failure was concrete cracking. No trends were observed with respect to hook tilt angle with respect to lead stress at different slip levels. The data were divided into sixty-three (63) groups for analysis based on the original test matrix (see Table 3.5). The groups were chosen to isolate variables including hook tilt angle, bar size, hook type, bar position, and group-effect. The groups are presented in tabular form and include the concrete compressive strength (at test date), the average compressive strength of the group, normalization factor, maximum bar stress (before failure), normalized maximum bar stress, bar displacement, normalized bar displacement, and failure mode. Table 4.1 shows the groups and results for the single bar specimens. Table 4.2 shows the groups and results for the multiple bar specimens. Combined single bar and multiple bar specimen groups and results are shown in Table 4.3. Two different factors were used to normalize the data. Normalization of the data was needed because the concrete compressive strength at test date (f’c) was different in each specimen. Concrete tensile strength, which affects the bond strength and anchorage properties of the reinforcing bars, is proportional to the square root of the concrete compressive strength. The normalization factor for the individual single bar specimen groups and the multiple bar specimen groups was computed similar to the Ehsani et al. study (1995) using the square root of the average concrete compressive strength (f’c avg) as shown in Equation 4.1. The normalization factor was applied to the maximum bar stress, T1, to compute the normalized maximum bar stress, T1*. Use of this normalization factor was appropriate since the compressive strengths of concrete within each group were similar. This was not the case for the combined single bar and multiple bar groups, in which case normalizing T1 would imply a different failure mode for many specimens. Therefore, bar displacement was normalized instead. The normalization factor for the combined single bar and multiple bar specimen groups was computed as shown in Equation 4.2 and was not applied to the maximum bar stress, but instead applied to the bar displacement, S1, to compute the normalized bar displacement, S1*.

28
c
avgc
ff
''
(4.1)
avgc
c
ff'
'
(4.2) Stress-displacement (bar and line) graphs were used to analyze the trends in the groups. All graphs are presented in Appendix D. Only those graphs that support the results are included in Section 4. The analysis of the test variables described in the following sections is based on these graphs, failure modes, and concrete strengths of the specimens.
4.2.1. Effect of Hook Tilt Angle. Hook tilt angle as described in Section 3.3 was varied to evaluate the limits of tilt angle on developing the bond strength of the reinforcing bar. The single bar specimens were compared in Groups 1-3 in terms of maximum normalized stress and displacement (all graphs and tables are shown in Appendix D, Section D.2.1). The graphs show that the maximum normalized bar stress was similar among all single bar specimens, at approximately 60 ksi, (see representative figure, Figure 4.1) and is due to the failure mode of yielding (see Table 4.1). For the single bar specimens, the displacement values of Groups 1-3 did not produce a clear trend and displacement values were low, less than 0.07 inch (see representative figure, Figure 4.2). It should be noted that the average compressive strength was 6400 psi, 6310 psi, and 6570 psi for Group 1, Group 2, and Group 3 of the single bar specimens, respectfully. Thus it can be stated that for this compressive strength, the tilt angle did not appear have an effect on the displacements of the reinforcing bar. The multiple bar specimens were compared in Groups 16-21 (Bar A) and Groups 22-37 (Bar B) in terms of maximum normalized bar stress and bar displacement (all graphs and tables shown found in Appendix D, Section D.2.2). The graphs show that the maximum normalized bar stress was similar among all multiple bar specimens, at approximately 60 ksi, except for a few that cracked before yielding (see representative figure, Figure 4.3). The data showed that the No. 5 bars generally yielded while the No. 8 bars exhibited different failure modes (see Tables 4.2a and 4.2b). The different failure modes are likely due to the higher force that must be transferred to the concrete in bond in order to yield the No. 8 bars versus the No. 5 bars. Even though the stresses were similar, the displacements were very different. The displacements of the multiple bar specimens were generally higher than the displacements of the single bar specimens (see representative figure, Figure 4.4). Graphs show that with an increased tilt angle (from 0° to 22.5°) there is an increased slip of the reinforcing bar. This trend happens only with the No. 8 bars (not the No. 5 bars) in the exterior bar (Bar A) for Groups 16-21 as seen in Figure 4.4. The trend is observed with both the No. 8 bars and 2/3 of the No. 5 bars in the interior bar (Bar B) for Groups 22-37 as seen in Figure 4.5.
4.2.2. Effect of Bar Size. Reinforcing bar size was varied and consisted of two common sizes of reinforcing bar, No. 5 and No. 8. Six of the twelve single bar specimens contained a No. 5 bar, and six contained a No. 8 bar. These specimens were compared in Groups 4-7 in terms of maximum normalized bar stress and bar displacement (all graphs and tables are shown in Appendix D, Section D.2.1). The graphs show that the maximum normalized bar stress is similar
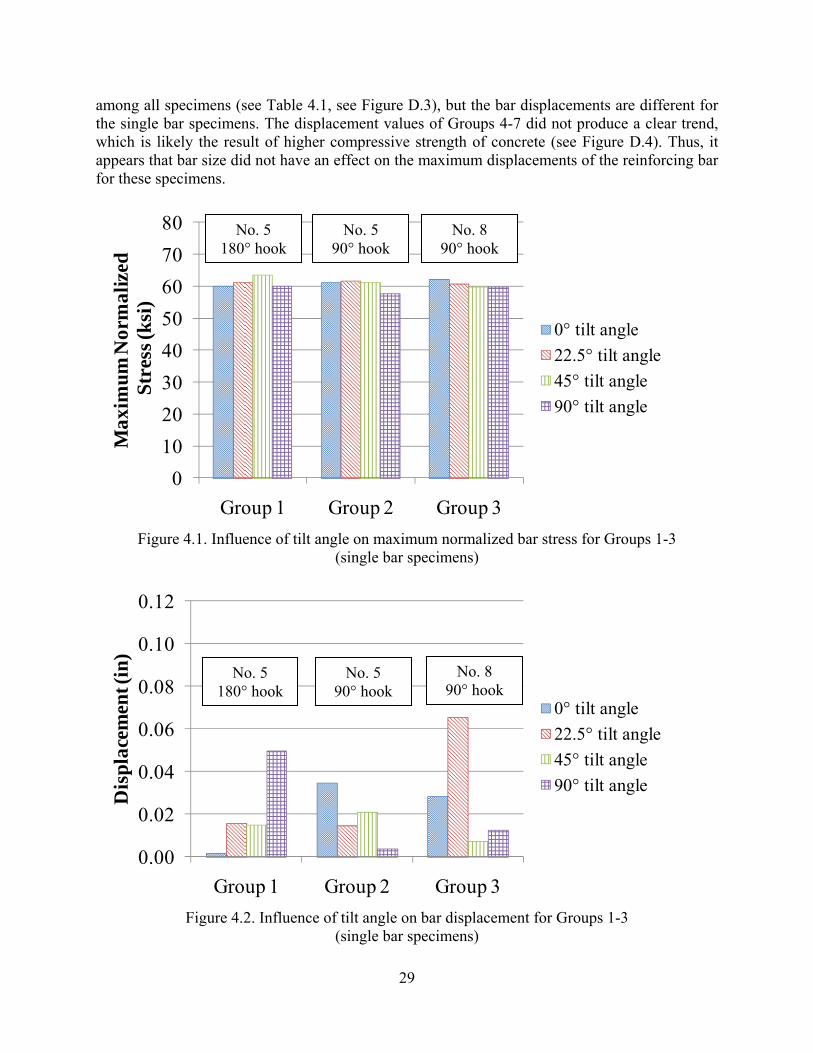
29
among all specimens (see Table 4.1, see Figure D.3), but the bar displacements are different for the single bar specimens. The displacement values of Groups 4-7 did not produce a clear trend, which is likely the result of higher compressive strength of concrete (see Figure D.4). Thus, it appears that bar size did not have an effect on the maximum displacements of the reinforcing bar for these specimens.
01020304050607080
Group 1 Group 2 Group 3
Max
imu
m N
orm
aliz
edSt
ress
(ksi
)
0° tilt angle22.5° tilt angle45° tilt angle90° tilt angle
Figure 4.1. Influence of tilt angle on maximum normalized bar stress for Groups 1-3
(single bar specimens)
0.00
0.02
0.04
0.06
0.08
0.10
0.12
Group 1 Group 2 Group 3
Dis
pla
cem
ent (
in)
0° tilt angle22.5° tilt angle45° tilt angle90° tilt angle
Figure 4.2. Influence of tilt angle on bar displacement for Groups 1-3
(single bar specimens)
No. 5 180° hook
No. 5 90° hook
No. 8 90° hook
No. 5 180° hook
No. 5 90° hook
No. 8 90° hook
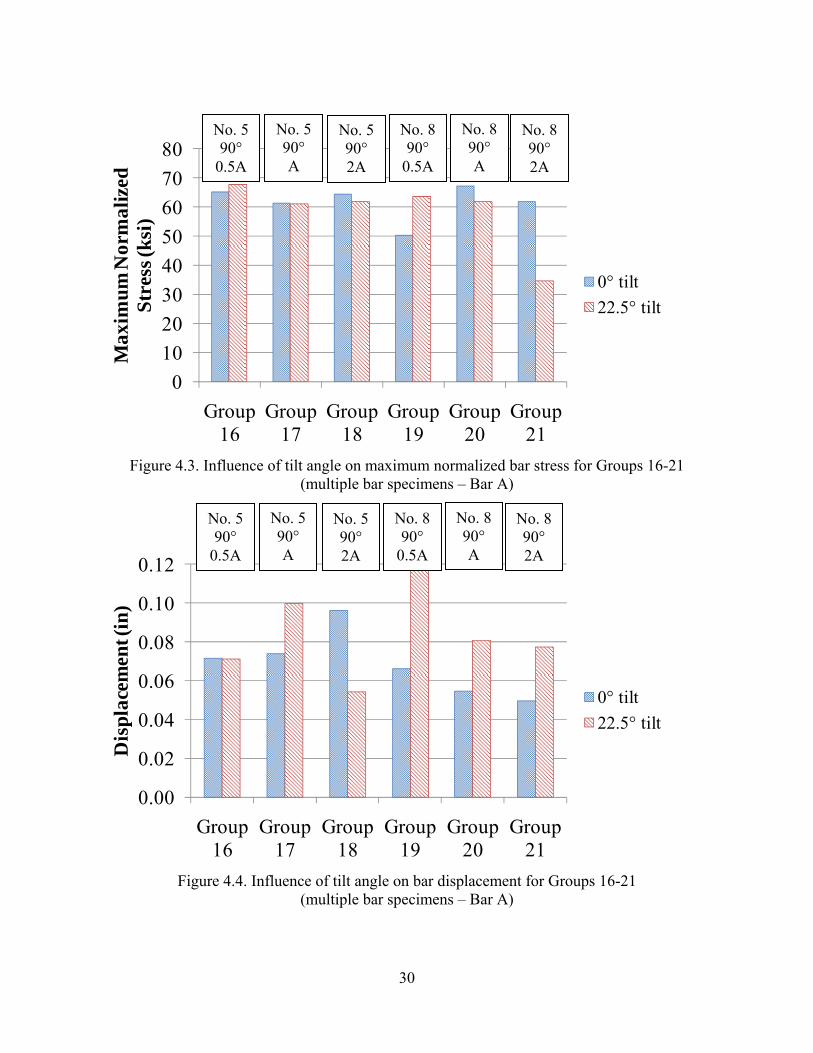
30
01020304050607080
Group 16
Group 17
Group 18
Group 19
Group 20
Group 21
Max
imu
m N
orm
aliz
ed
Str
ess
(ksi
)
0° tilt22.5° tilt
Figure 4.3. Influence of tilt angle on maximum normalized bar stress for Groups 16-21
(multiple bar specimens – Bar A)
0.00
0.02
0.04
0.06
0.08
0.10
0.12
Group 16
Group 17
Group 18
Group 19
Group 20
Group 21
Dis
plac
emen
t (in
)
0° tilt22.5° tilt
Figure 4.4. Influence of tilt angle on bar displacement for Groups 16-21
(multiple bar specimens – Bar A)
No. 5 90°
0.5A
No. 5 90° A
No. 5 90° 2A
No. 8 90°
0.5A
No. 8 90° A
No. 8 90° 2A
No. 5 90°
0.5A
No. 5 90° A
No. 5 90° 2A
No. 8 90°
0.5A
No. 8 90° A
No. 8 90° 2A

31
0.00
0.02
0.04
0.06
0.08
0.10
0.12
Group 32
Group 33
Group 34
Group 35
Group 36
Group 37
Dis
plac
emen
t (in
)
0° tilt22.5° tilt
Figure 4.5. Influence of tilt angle on bar displacement for Groups 32-37
(multiple bar specimens – Bar B) Six multiple bar specimens contained three No. 5 bars, and the other six multiple bar specimens contained three No. 8 bars. These specimens were compared in Groups 22-27 (Bar A) and Groups 38-43 (Bar B) in terms of maximum normalized bar stress and displacement (all graphs and tables are found in Appendix D, Section D.2.2). The graphs showed that the maximum normalized bar stress was similar among all specimens except those in which concrete cracking was the failure mode (see Figures D.11 and D.12). The data showed that the No. 5 bars generally yielded while the No. 8 bars exhibited different failure modes (see Tables 4.2a and 4.2b). The different failure modes are likely due to the higher force that must be transferred to the concrete in bond in order to yield the No. 8 bars versus the No. 5 bars. Graphs generally showed no trends with any of the specimens with regards to the reinforcing bar size (see Figure D.12 and Figure D.18).
4.2.3. Effect of Hook Type. Hook type was varied only in the single bar specimens (180° and 90° standard hook) as seen in Table 3.5. These specimens were compared in Groups 8-11 in terms of maximum normalized bar stress and bar displacement (all graphs and tables are found in Appendix D, Section D.2.1). The graphs show that the maximum normalized bar stress is similar among all specimens, approximately 60 ksi, and is a result of the failure mode of the specimens as yielding (see Table 4.1, see Figure D.5). The maximum bar displacements differ with each specimen and provide no trends among Groups 8-11 (see Figure D.6) based on hook type.
4.2.4. Effect of Multiple Bars. Adding three reinforcing bars to specimens produced more variables to analyze. The variable spacing of these three reinforcing bars was designed in
No. 5 90°
0.5A
No. 5 90° A
No. 5 90° 2A
No. 8 90°
0.5A
No. 8 90° A
No. 8 90° 2A

32
Section 3.3 as 0.5A, A and 2A (the spacing is based on the geometry of the standard reinforcing hook). Bar position was also evaluated with each specimen because there were two exterior reinforcing bars and one interior reinforcing bar to compare. Finally, single bar specimens of the same geometry were compared to the corresponding multiple bar specimens to analyze the behavior and determine trends.
4.2.4.1 Effect of bar spacing. Three bar spacing distances were compared in Groups 12-15 (for Bar A, exterior bar) and Groups 28-31 (for Bar B, interior bar) in terms of maximum normalized bar stress and bar displacement (all graphs and tables are shown in Appendix D, Section D.2.2). Generally all multiple bar specimens reached similar maximum normalized bar stress except those in which cracking was the failure mode (see Figures D.7 and D.13). The graphs showed that for Bar A (see Figure 4.6), generally the No. 5 bars exhibited no trend regarding bar spacing. On the contrary, graphs showed that for Bar A, the No. 8 bars exhibited increased lead bar slip with closer bar spacing. Johnson and Jirsa’s study (1981) also reported this trend (see Section 2.4.6). The graphs showed that with Bar B (see Figure 4.7), both the No. 5 and No. 8 bars exhibited increased lead bar slip with closer bar spacing.
4.2.4.2 Effect of bar position. Bar position was compared for trends within the multiple bar specimens (see Table 4.2c). There were two exterior reinforcing bars (Bar A and Bar C) in the multiple bar specimens and one interior reinforcing bar (Bar B). The specimens were compared in Groups 44-55 in terms of maximum normalized bar stress and bar displacement as seen in Appendix D, Section D.2.2. The graphs show that the applied load was distributed equally among the bars and the bar stress was similar among the specimens except those in which concrete cracked before steel yielding (see Figure D.19). The displacement graph for these groups shows no obvious trend associated with the bar position (see Figure D.20). There was one trend not found directly from Groups 44-55. It was noted that the interior reinforcing bar (Bar B) showed more trends with respect to bar spacing, seen in Figures D.14 and D.16, with both bar sizes than the exterior reinforcing bar (Bar A) seen in Figures D.8 and D.10 in which trends are observed only with the No. 8 bar. This observation is also discussed in Section 4.2.4.1.
4.2.4.3 Multiple bar and single bar comparison. Multiple bar specimens were compared with corresponding single bar specimens of the same geometric standard hook type, bar size, and hook tilt angle (see Table 4.3). The specimens were compared in Groups 56-59 for Bar A and Groups 60-63 for Bar B in terms of maximum bar stress and normalized bar displacement as seen in Appendix D, Section D.2.3. The maximum bar stress for the specimens were similar except for those specimens in which the concrete cracked before steel yielding (see Figures D.21 and D.23). The graphs show that closer spacing of multiple bars results in an increase in slip or displacement of the reinforcing bar relative to the concrete. The cause could be that one reinforcing bar and its bond with concrete has an effect on another reinforcing bar and its bond with concrete. The effect increases with closer spacing of reinforcing bars (see Figures 4.8 and 4.9). Also the normalized single bar specimens bar displacements were similar to those of the multiple bar specimens with A or 2A spacing (wide spacing) seen in Figures 4.8 and 4.9.
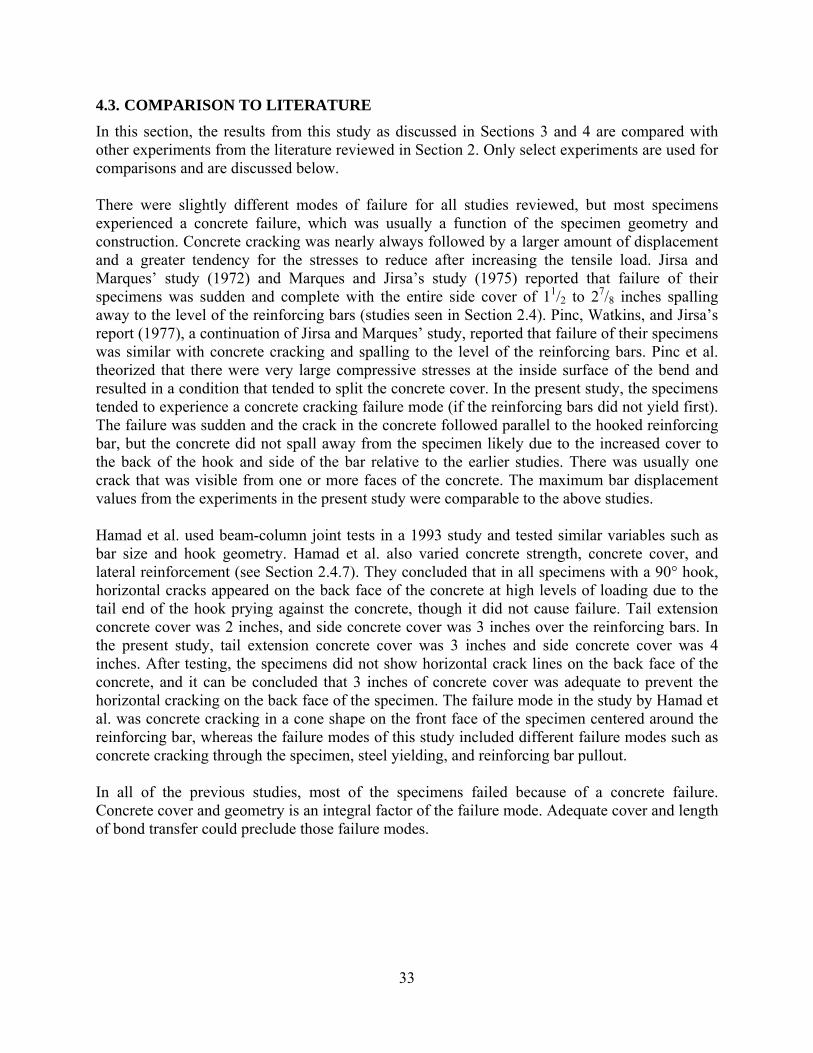
33
4.3. COMPARISON TO LITERATURE
In this section, the results from this study as discussed in Sections 3 and 4 are compared with other experiments from the literature reviewed in Section 2. Only select experiments are used for comparisons and are discussed below. There were slightly different modes of failure for all studies reviewed, but most specimens experienced a concrete failure, which was usually a function of the specimen geometry and construction. Concrete cracking was nearly always followed by a larger amount of displacement and a greater tendency for the stresses to reduce after increasing the tensile load. Jirsa and Marques’ study (1972) and Marques and Jirsa’s study (1975) reported that failure of their specimens was sudden and complete with the entire side cover of 11/2 to 27/8 inches spalling away to the level of the reinforcing bars (studies seen in Section 2.4). Pinc, Watkins, and Jirsa’s report (1977), a continuation of Jirsa and Marques’ study, reported that failure of their specimens was similar with concrete cracking and spalling to the level of the reinforcing bars. Pinc et al. theorized that there were very large compressive stresses at the inside surface of the bend and resulted in a condition that tended to split the concrete cover. In the present study, the specimens tended to experience a concrete cracking failure mode (if the reinforcing bars did not yield first). The failure was sudden and the crack in the concrete followed parallel to the hooked reinforcing bar, but the concrete did not spall away from the specimen likely due to the increased cover to the back of the hook and side of the bar relative to the earlier studies. There was usually one crack that was visible from one or more faces of the concrete. The maximum bar displacement values from the experiments in the present study were comparable to the above studies. Hamad et al. used beam-column joint tests in a 1993 study and tested similar variables such as bar size and hook geometry. Hamad et al. also varied concrete strength, concrete cover, and lateral reinforcement (see Section 2.4.7). They concluded that in all specimens with a 90° hook, horizontal cracks appeared on the back face of the concrete at high levels of loading due to the tail end of the hook prying against the concrete, though it did not cause failure. Tail extension concrete cover was 2 inches, and side concrete cover was 3 inches over the reinforcing bars. In the present study, tail extension concrete cover was 3 inches and side concrete cover was 4 inches. After testing, the specimens did not show horizontal crack lines on the back face of the concrete, and it can be concluded that 3 inches of concrete cover was adequate to prevent the horizontal cracking on the back face of the specimen. The failure mode in the study by Hamad et al. was concrete cracking in a cone shape on the front face of the specimen centered around the reinforcing bar, whereas the failure modes of this study included different failure modes such as concrete cracking through the specimen, steel yielding, and reinforcing bar pullout. In all of the previous studies, most of the specimens failed because of a concrete failure. Concrete cover and geometry is an integral factor of the failure mode. Adequate cover and length of bond transfer could preclude those failure modes.
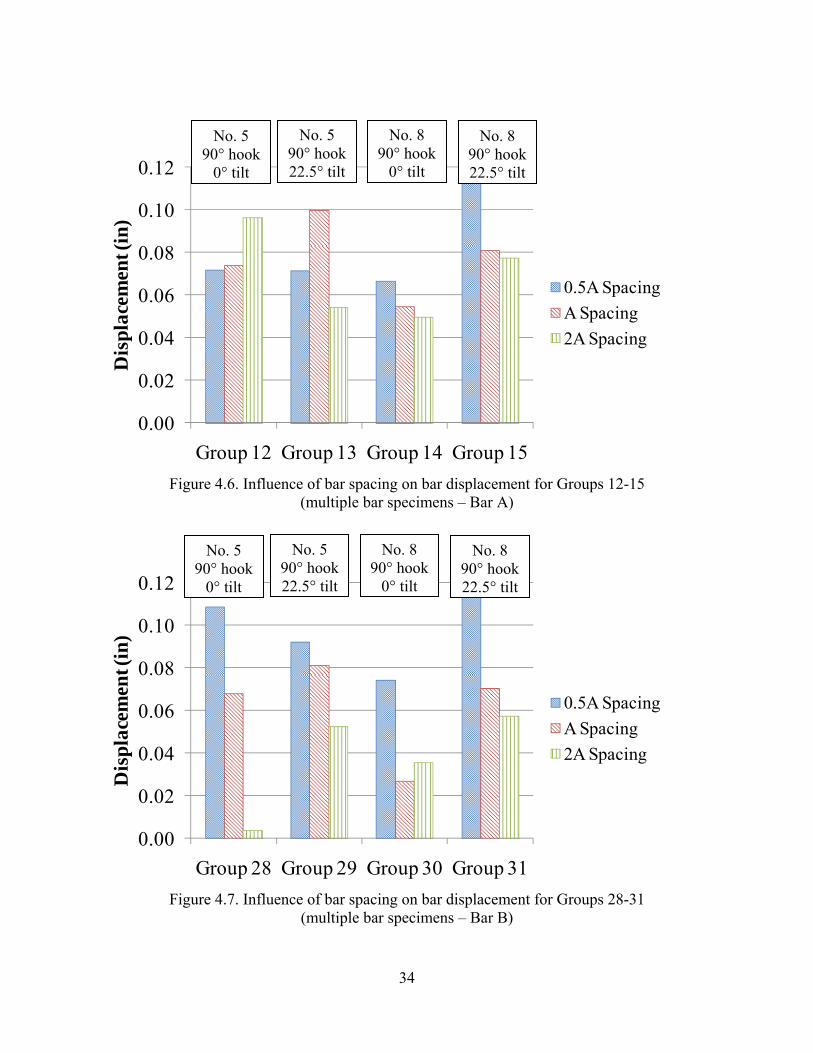
34
0.00
0.02
0.04
0.06
0.08
0.10
0.12
Group 12 Group 13 Group 14 Group 15
Dis
plac
emen
t (in
)
0.5A SpacingA Spacing2A Spacing
Figure 4.6. Influence of bar spacing on bar displacement for Groups 12-15
(multiple bar specimens – Bar A)
0.00
0.02
0.04
0.06
0.08
0.10
0.12
Group 28 Group 29 Group 30 Group 31
Dis
pla
cem
ent (
in)
0.5A SpacingA Spacing2A Spacing
Figure 4.7. Influence of bar spacing on bar displacement for Groups 28-31
(multiple bar specimens – Bar B)
No. 8 90° hook 22.5° tilt
No. 8 90° hook
0° tilt
No. 5 90° hook 22.5° tilt
No. 5 90° hook
0° tilt
No. 5 90° hook 22.5° tilt
No. 5 90° hook
0° tilt
No. 8 90° hook 22.5° tilt
No. 8 90° hook
0° tilt
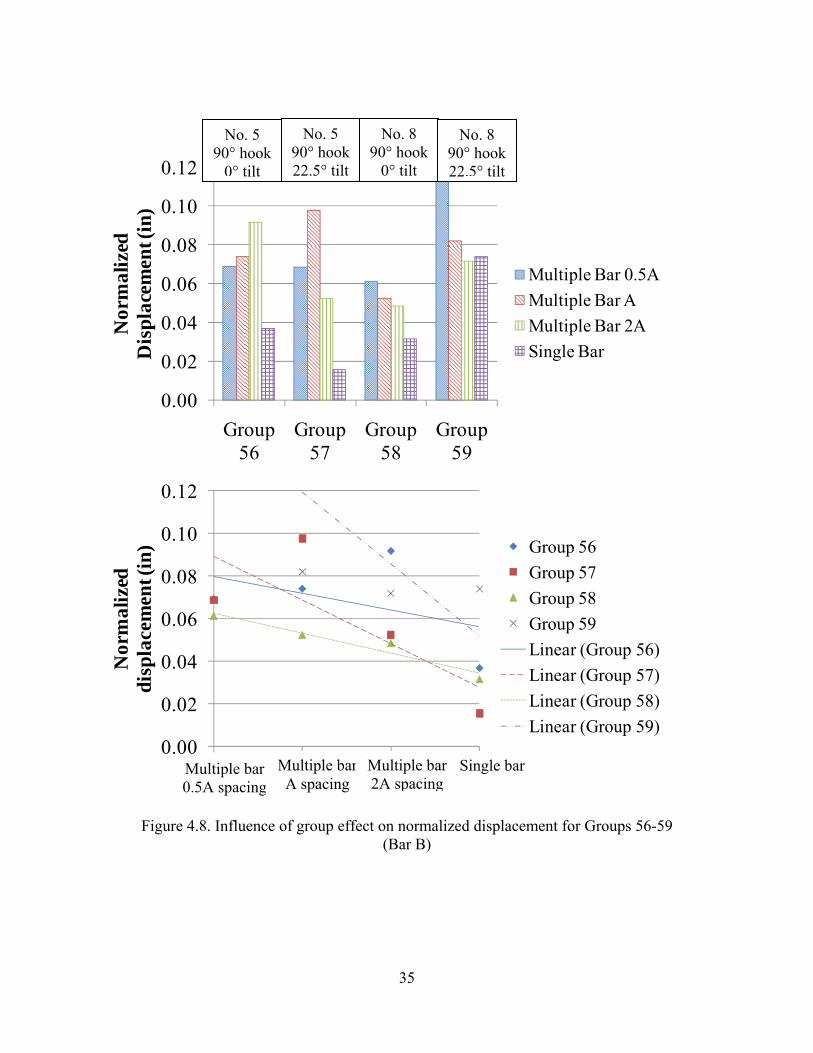
35
0.00
0.02
0.04
0.06
0.08
0.10
0.12
Group 56
Group 57
Group 58
Group 59
Nor
mal
ized
D
ispl
acem
ent (
in)
Multiple Bar 0.5AMultiple Bar AMultiple Bar 2ASingle Bar
0.00
0.02
0.04
0.06
0.08
0.10
0.12
1 2 3 4
Nor
mal
ized
d
isp
lace
men
t (in
) Group 56Group 57Group 58Group 59Linear (Group 56)Linear (Group 57)Linear (Group 58)Linear (Group 59)
Figure 4.8. Influence of group effect on normalized displacement for Groups 56-59 (Bar B)
Multiple bar 0.5A spacing
Single bar Multiple bar A spacing
Multiple bar 2A spacing
No. 5 90° hook
0° tilt
No. 5 90° hook 22.5° tilt
No. 8 90° hook
0° tilt
No. 8 90° hook 22.5° tilt
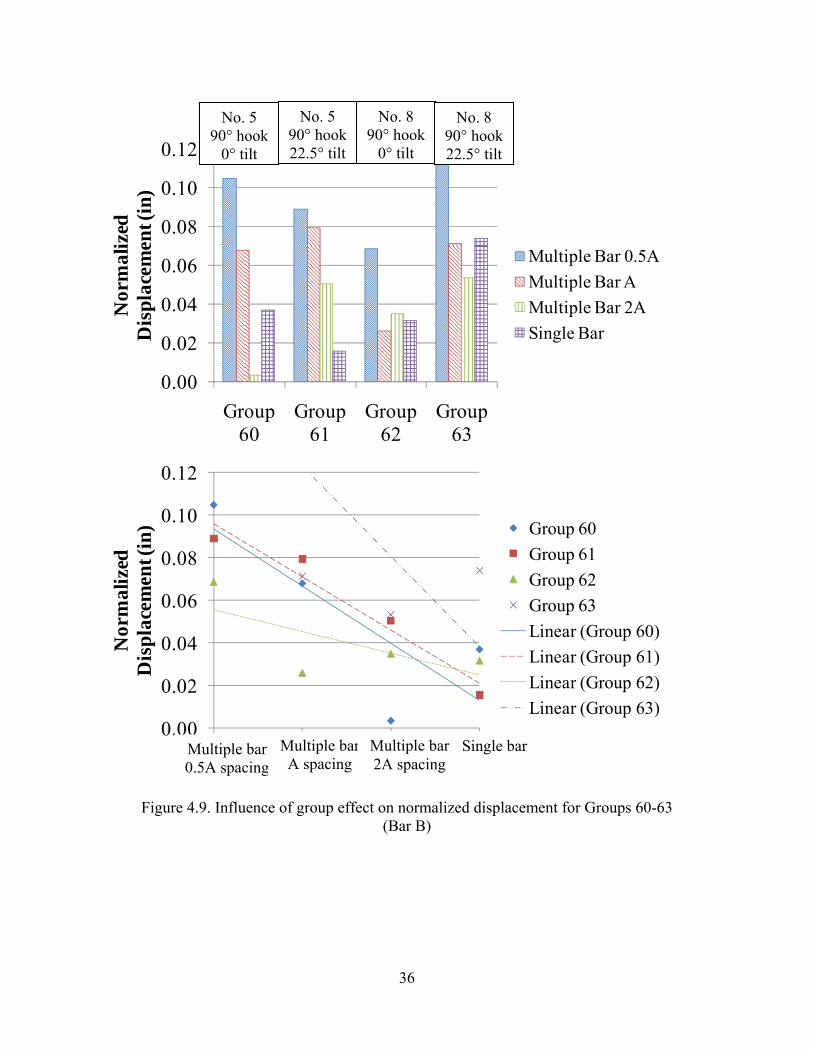
36
0.00
0.02
0.04
0.06
0.08
0.10
0.12
Group 60
Group 61
Group 62
Group 63
Nor
mal
ized
D
ispl
acem
ent (
in)
Multiple Bar 0.5AMultiple Bar AMultiple Bar 2ASingle Bar
0.00
0.02
0.04
0.06
0.08
0.10
0.12
1 2 3 4
Nor
mal
ized
D
isp
lace
men
t (in
) Group 60Group 61Group 62Group 63Linear (Group 60)Linear (Group 61)Linear (Group 62)Linear (Group 63)
Figure 4.9. Influence of group effect on normalized displacement for Groups 60-63 (Bar B)
No. 5 90° hook
0° tilt
No. 5 90° hook 22.5° tilt
No. 8 90° hook
0° tilt
No. 8 90° hook 22.5° tilt
Multiple bar 0.5A spacing
Single bar Multiple bar A spacing
Multiple bar 2A spacing
37
Table 4.1. Single Bar Specimen Groups and Results f'c (psi) f'c avg (psi)
SQRT (f'c avg/f'c)
T1 (ksi) T1* (ksi) S1 (in) Failure Mode
6580 6400 0.99 60.7 59.9 0.002 Y6420 6400 1.00 61.2 61.1 0.016 Y5910 6400 1.04 61.0 63.5 0.015 Y6690 6400 0.98 61.3 60.0 0.050 Y6150 6307 1.01 60.3 61.1 0.034 Y6130 6307 1.01 60.9 61.7 0.014 Y6360 6307 1.00 61.3 61.1 0.021 Y6590 6307 0.98 59.0 57.7 0.004 Y6570 6567 1.00 62.1 62.1 0.028 Y6610 6567 1.00 60.8 60.6 0.065 Y6610 6567 1.00 60.1 59.9 0.007 Y6480 6567 1.01 59.5 59.9 0.012 Y6150 6360 1.02 60.3 61.3 0.034 Y6570 6360 0.98 62.1 61.1 0.028 Y6130 6370 1.02 60.9 62.0 0.014 Y6610 6370 0.98 60.8 59.7 0.065 Y6360 6485 1.01 61.3 61.9 0.021 Y6610 6485 0.99 60.1 59.5 0.007 Y6590 6535 1.00 59.0 58.7 0.004 Y6480 6535 1.00 59.5 59.7 0.012 Y6580 6365 0.98 60.7 59.7 0.002 Y6150 6365 1.02 60.3 61.4 0.034 Y6420 6275 0.99 61.2 60.5 0.016 Y6130 6275 1.01 60.9 61.6 0.014 Y5910 6135 1.02 61.0 62.1 0.015 Y6360 6135 0.98 61.3 60.3 0.021 Y6690 6640 1.00 61.3 61.1 0.050 Y6590 6640 1.00 59.0 59.2 0.004 Y
Sing
le B
ar S
peci
men
sSi
ngle
Bar
Spe
cim
ens
Para
met
er v
arie
d =
bar h
ook
tilt a
ngle
Para
met
er v
arie
d =
bar s
ize
Para
met
er v
arie
d =
hook
type
BE-5-180-22.5BE-5-90-22.5
Grp
10 BE-5-180-45
BE-5-90-45
Grp
11 BE-5-180-90
BE-5-90-90
BE-8-90-45
Grp
7 BE-5-90-90BE-8-90-90
Grp
8 BE-5-180-0BE-5-90-0
Grp
9
Sing
le B
ar S
peci
men
s
Grp
4 BE-5-90-0BE-8-90-0
Grp
5 BE-5-90-22.5BE-8-90-22.5
Grp
6 BE-5-90-45
BE-5-90-45BE-5-90-90
Gro
up 3
BE-8-90-0BE-8-90-22.5BE-8-90-45BE-8-90-90
Specimen
Gro
up 1
BE-5-180-0BE-5-180-22.5BE-5-180-45BE-5-180-90
Gro
up 2
BE-5-90-0BE-5-90-22.5
*Asterisk denotes a normalized value
38
Table 4.2.a. Multiple Bar Specimen Groups and Results f'c (psi) f'c avg (psi)
SQRT (f'c avg/f'c)
T1 (ksi) T1* (ksi) S1 (in) Failure Mode
BE-5-90-0-G0.5A Bar A 4970 5053 1.01 65.7 66.3 0.072 YBE-5-90-0-GA Bar A 5350 5053 0.97 62.4 60.7 0.074 YBE-5-90-0-G2A Bar A 4840 5053 1.02 64.4 65.8 0.096 C
BE-5-90-22.5-G0.5A Bar A 4840 4883 1.00 67.4 67.7 0.071 YBE-5-90-22.5-GA Bar A 4970 4883 0.99 60.1 59.6 0.100 YBE-5-90-22.5-G2A Bar A 4840 4883 1.00 61.8 62.1 0.054 YBE-8-90-0-G0.5A Bar A 4470 4780 1.03 50.9 52.6 0.066 C
BE-8-90-0-GA Bar A 4850 4780 0.99 65.7 65.3 0.055 Y, CBE-8-90-0-G2A Bar A 5020 4780 0.98 63.8 62.3 0.050 C
BE-8-90-22.5-G0.5A Bar A 4260 4673 1.05 62.9 65.8 0.201 SBE-8-90-22.5-GA Bar A 5310 4673 0.94 63.3 59.4 0.081 YBE-8-90-22.5-G2A Bar A 4450 4673 1.02 33.5 34.3 0.077 CBE-5-90-0-G0.5A Bar A 4970 4905 0.99 65.7 65.3 0.072 Y
BE-5-90-22.5-G0.5A Bar A 4840 4905 1.01 67.4 67.8 0.071 Y
BE-5-90-0-GA Bar A 5350 5160 0.98 62.4 61.3 0.074 YBE-5-90-22.5-GA Bar A 4970 5160 1.02 60.1 61.2 0.100 YBE-5-90-0-G2A Bar A 4840 4840 1.00 64.4 64.4 0.096 C
BE-5-90-22.5-G2A Bar A 4840 4840 1.00 61.8 61.8 0.054 YBE-8-90-0-G0.5A Bar A 4470 4365 0.99 50.9 50.3 0.066 C
BE-8-90-22.5-G0.5A Bar A 4260 4365 1.01 62.9 63.6 0.201 SBE-8-90-0-GA Bar A 4850 5080 1.02 65.7 67.3 0.055 Y, C
BE-8-90-22.5-GA Bar A 5310 5080 0.98 63.3 61.9 0.081 YBE-8-90-0-G2A Bar A 5020 4735 0.97 63.8 62.0 0.050 C
BE-8-90-22.5-G2A Bar A 4450 4735 1.03 33.5 34.5 0.077 CBE-5-90-0-G0.5A Bar A 4970 4720 0.97 65.7 64.1 0.072 YBE-8-90-0-G0.5A Bar A 4470 4720 1.03 50.9 52.3 0.066 C
BE-5-90-0-GA Bar A 5350 5100 0.98 62.4 60.9 0.074 YBE-8-90-0-GA Bar A 4850 5100 1.03 65.7 67.4 0.055 Y, CBE-5-90-0-G2A Bar A 4840 4930 1.01 64.4 65.0 0.096 CBE-8-90-0-G2A Bar A 5020 4930 0.99 63.8 63.3 0.050 C
BE-5-90-22.5-G0.5A Bar A 4840 4550 0.97 67.4 65.3 0.071 YBE-8-90-22.5-G0.5A Bar A 4260 4550 1.03 62.9 65.0 0.201 S
BE-5-90-22.5-GA Bar A 4970 5140 1.02 60.1 61.1 0.100 YBE-8-90-22.5-GA Bar A 5310 5140 0.98 63.3 62.3 0.081 YBE-5-90-22.5-G2A Bar A 4840 4645 0.98 61.8 60.6 0.054 YBE-8-90-22.5-G2A Bar A 4450 4645 1.02 33.5 34.2 0.077 C
Para
met
er v
arie
d =
hook
tilt
angl
ePa
ram
eter
var
ied
= ba
r siz
e
Mul
tiple
Bar
Spe
cim
ens
- Bar
A
Para
met
er v
arie
d =
bar s
paci
ng
Mul
tiple
Bar
Spe
cim
ens
- Bar
AM
ultip
le B
ar S
peci
men
s - B
ar A
Grp
22
Grp
23
Grp
24
Grp
25
Grp
26
Grp
27
Grp
16
Grp
17
Grp
18
Grp
19
Grp
20
Grp
21
Specimen
Gro
up 1
2G
roup
13
Gro
up 1
4G
roup
15
*Asterisk denotes a normalized value
39
Table 4.2. (Cont’d) b. Multiple Bar Specimen Groups and Results f'c (psi) f'c avg (psi)
SQRT (f'c avg/f'c)
T1 (ksi) T1* (ksi) S1 (in) Failure Mode
BE-5-90-0-G0.5A Bar B 4970 5053 1.01 67.3 67.8 0.108 YBE-5-90-0-GA Bar B 5350 5053 0.97 66.4 64.5 0.068 YBE-5-90-0-G2A Bar B 4840 5053 1.02 64.6 66.0 0.004 Y, C
BE-5-90-22.5-G0.5A Bar B 4840 4883 1.00 67.2 67.5 0.092 YBE-5-90-22.5-GA Bar B 4970 4883 0.99 63.8 63.2 0.081 YBE-5-90-22.5-G2A Bar B 4840 4883 1.00 66.7 67.0 0.052 YBE-8-90-0-G0.5A Bar B 4470 4780 1.03 53.0 54.8 0.074 C
BE-8-90-0-GA Bar B 4850 4780 0.99 61.9 61.4 0.027 Y, CBE-8-90-0-G2A Bar B 5020 4780 0.98 64.6 63.0 0.036 C
BE-8-90-22.5-G0.5A Bar B 4260 4673 1.05 67.9 71.1 0.230 SBE-8-90-22.5-GA Bar B 5310 4673 0.94 66.9 62.7 0.070 YBE-8-90-22.5-G2A Bar B 4450 4673 1.02 36.7 37.6 0.057 CBE-5-90-0-G0.5A Bar B 4970 4905 0.99 67.3 66.8 0.108 Y
BE-5-90-22.5-G0.5A Bar B 4840 4905 1.01 67.2 67.6 0.092 YBE-5-90-0-GA Bar B 5350 5160 0.98 66.4 65.2 0.068 Y
BE-5-90-22.5-GA Bar B 4970 5160 1.02 63.8 65.0 0.081 YBE-5-90-0-G2A Bar B 4840 4840 1.00 64.6 64.6 0.004 Y, C
BE-5-90-22.5-G2A Bar B 4840 4840 1.00 66.7 66.7 0.052 YBE-8-90-0-G0.5A Bar B 4470 4365 0.99 53.0 52.4 0.074 C
BE-8-90-22.5-G0.5A Bar B 4260 4365 1.01 67.9 68.8 0.230 SBE-8-90-0-GA Bar B 4850 5080 1.02 61.9 63.3 0.027 Y, C
BE-8-90-22.5-GA Bar B 5310 5080 0.98 66.9 65.4 0.070 YBE-8-90-0-G2A Bar B 5020 4735 0.97 64.6 62.7 0.036 C
BE-8-90-22.5-G2A Bar B 4450 4735 1.03 36.7 37.8 0.057 CBE-5-90-0-G0.5A Bar B 4970 4720 0.97 67.3 65.5 0.108 YBE-8-90-0-G0.5A Bar B 4470 4720 1.03 53.0 54.5 0.074 C
BE-5-90-0-GA Bar B 5350 5100 0.98 66.4 64.8 0.068 YBE-8-90-0-GA Bar B 4850 5100 1.03 61.9 63.5 0.027 Y, CBE-5-90-0-G2A Bar B 4840 4930 1.01 64.6 65.2 0.004 Y, CBE-8-90-0-G2A Bar B 5020 4930 0.99 64.6 64.0 0.036 C
BE-5-90-22.5-G0.5A Bar B 4840 4550 0.97 67.2 65.1 0.092 YBE-8-90-22.5-G0.5A Bar B 4260 4550 1.03 67.9 70.2 0.230 S
BE-5-90-22.5-GA Bar B 4970 5140 1.02 63.8 64.9 0.081 YBE-8-90-22.5-GA Bar B 5310 5140 0.98 66.9 65.8 0.070 YBE-5-90-22.5-G2A Bar B 4840 4645 0.98 66.7 65.3 0.052 YBE-8-90-22.5-G2A Bar B 4450 4645 1.02 36.7 37.5 0.057 C
Para
met
er v
arie
d =
bar s
paci
ngPa
ram
eter
var
ied
= ho
ok ti
lt an
gle
Para
met
er v
arie
d =
bar s
ize
Mul
tiple
Bar
Spe
cim
ens
- Bar
BM
ultip
le B
ar S
peci
men
s - B
ar B
Mul
tiple
Bar
Spe
cim
ens
- Bar
B
Grp
38
Grp
39
Grp
40
Grp
41
Grp
42
Grp
43
Grp
32
Grp
33
Grp
34
Grp
35
Grp
36
Grp
37
Specimen
Gro
up 2
8G
roup
29
Gro
up 3
0G
roup
31
*Asterisk denotes a normalized value
40
Table 4.2. (Cont’d) c. Multiple Bar Specimen Groups and Results f'c (psi) f'c avg (psi)
SQRT (f'c avg/f'c)
T1 (ksi) T1* (ksi) S1 (in) Failure Mode
BE-5-90-0-G0.5A Bar A 4970 4970 1.00 65.7 65.7 0.072 YBE-5-90-0-G0.5A Bar B 4970 4970 1.00 67.3 67.3 0.108 Y
BE-5-90-0-GA Bar A 5350 5350 1.00 62.4 62.4 0.074 YBE-5-90-0-GA Bar B 5350 5350 1.00 66.4 66.4 0.068 YBE-5-90-0-G2A Bar A 4840 4840 1.00 64.4 64.4 0.096 CBE-5-90-0-G2A Bar B 4840 4840 1.00 64.6 64.6 0.004 Y, C
BE-5-90-22.5-G0.5A Bar A 4840 4840 1.00 67.4 67.4 0.071 YBE-5-90-22.5-G0.5A Bar B 4840 4840 1.00 67.2 67.2 0.092 Y
BE-5-90-22.5-GA Bar A 4970 4970 1.00 60.1 60.1 0.100 YBE-5-90-22.5-GA Bar B 4970 4970 1.00 63.8 63.8 0.081 YBE-5-90-22.5-G2A Bar A 4840 4840 1.00 61.8 61.8 0.054 YBE-5-90-22.5-G2A Bar B 4840 4840 1.00 66.7 66.7 0.052 YBE-8-90-0-G0.5A Bar A 4470 4470 1.00 50.9 50.9 0.066 CBE-8-90-0-G0.5A Bar B 4470 4470 1.00 53.0 53.0 0.074 C
BE-8-90-0-GA Bar A 4850 4850 1.00 65.7 65.7 0.055 Y, CBE-8-90-0-GA Bar B 4850 4850 1.00 61.9 61.9 0.027 Y, CBE-8-90-0-G2A Bar A 5020 5020 1.00 63.8 63.8 0.050 CBE-8-90-0-G2A Bar B 5020 5020 1.00 64.6 64.6 0.036 C
BE-8-90-22.5-G0.5A Bar A 4260 4260 1.00 62.9 62.9 0.201 SBE-8-90-22.5-G0.5A Bar B 4260 4260 1.00 67.9 67.9 0.230 S
BE-8-90-22.5-GA Bar A 5310 5310 1.00 63.3 63.3 0.081 YBE-8-90-22.5-GA Bar B 5310 5310 1.00 66.9 66.9 0.070 YBE-8-90-22.5-G2A Bar A 4450 4450 1.00 33.5 33.5 0.077 CBE-8-90-22.5-G2A Bar B 4450 4450 1.00 36.7 36.7 0.057 C
Para
met
er v
arie
d =
bar p
ositi
on
Mul
tiple
Bar
Spe
cim
ens
Grp
52
Grp
53
Grp
54
Grp
55
Specimen
Grp
44
Grp
45
Grp
46
Grp
47
Grp
48
Grp
49
Grp
50
Grp
51
*Asterisk denotes a normalized value
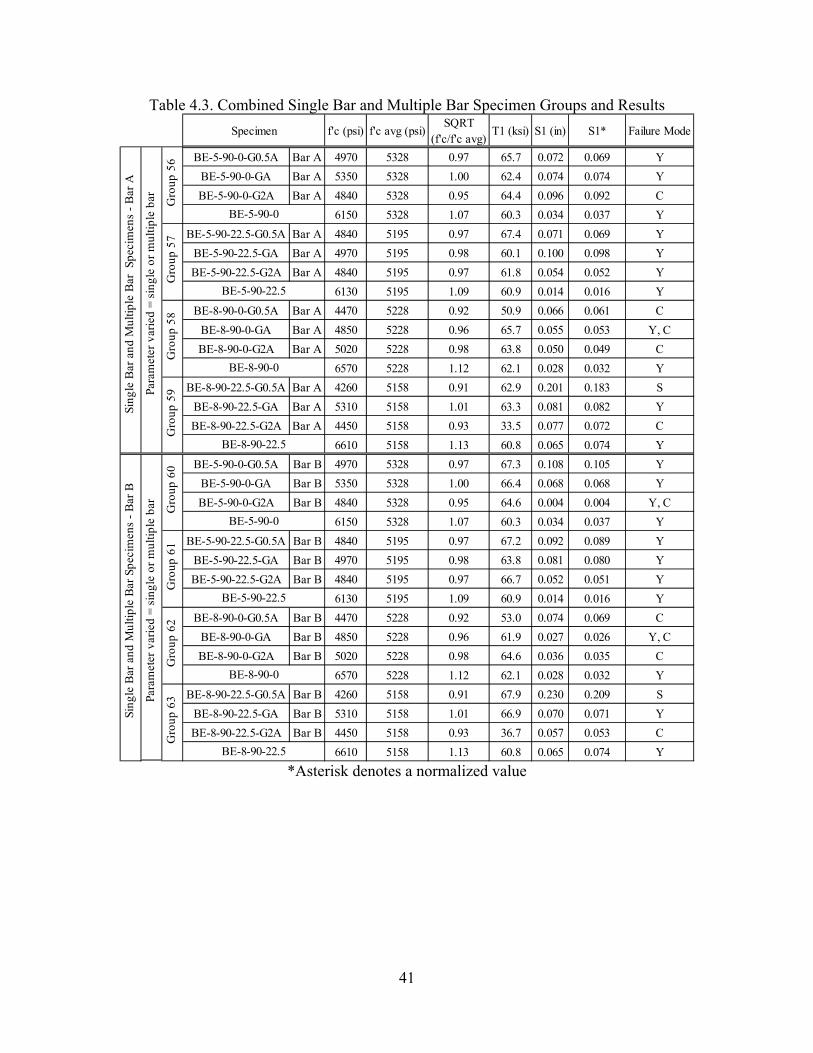
41
Table 4.3. Combined Single Bar and Multiple Bar Specimen Groups and Results f'c (psi) f'c avg (psi)
SQRT (f'c/f'c avg)
T1 (ksi) S1 (in) S1* Failure Mode
BE-5-90-0-G0.5A Bar A 4970 5328 0.97 65.7 0.072 0.069 YBE-5-90-0-GA Bar A 5350 5328 1.00 62.4 0.074 0.074 YBE-5-90-0-G2A Bar A 4840 5328 0.95 64.4 0.096 0.092 C
6150 5328 1.07 60.3 0.034 0.037 YBE-5-90-22.5-G0.5A Bar A 4840 5195 0.97 67.4 0.071 0.069 Y
BE-5-90-22.5-GA Bar A 4970 5195 0.98 60.1 0.100 0.098 YBE-5-90-22.5-G2A Bar A 4840 5195 0.97 61.8 0.054 0.052 Y
6130 5195 1.09 60.9 0.014 0.016 YBE-8-90-0-G0.5A Bar A 4470 5228 0.92 50.9 0.066 0.061 C
BE-8-90-0-GA Bar A 4850 5228 0.96 65.7 0.055 0.053 Y, CBE-8-90-0-G2A Bar A 5020 5228 0.98 63.8 0.050 0.049 C
6570 5228 1.12 62.1 0.028 0.032 YBE-8-90-22.5-G0.5A Bar A 4260 5158 0.91 62.9 0.201 0.183 S
BE-8-90-22.5-GA Bar A 5310 5158 1.01 63.3 0.081 0.082 YBE-8-90-22.5-G2A Bar A 4450 5158 0.93 33.5 0.077 0.072 C
6610 5158 1.13 60.8 0.065 0.074 YBE-5-90-0-G0.5A Bar B 4970 5328 0.97 67.3 0.108 0.105 Y
BE-5-90-0-GA Bar B 5350 5328 1.00 66.4 0.068 0.068 YBE-5-90-0-G2A Bar B 4840 5328 0.95 64.6 0.004 0.004 Y, C
6150 5328 1.07 60.3 0.034 0.037 YBE-5-90-22.5-G0.5A Bar B 4840 5195 0.97 67.2 0.092 0.089 Y
BE-5-90-22.5-GA Bar B 4970 5195 0.98 63.8 0.081 0.080 YBE-5-90-22.5-G2A Bar B 4840 5195 0.97 66.7 0.052 0.051 Y
6130 5195 1.09 60.9 0.014 0.016 YBE-8-90-0-G0.5A Bar B 4470 5228 0.92 53.0 0.074 0.069 C
BE-8-90-0-GA Bar B 4850 5228 0.96 61.9 0.027 0.026 Y, CBE-8-90-0-G2A Bar B 5020 5228 0.98 64.6 0.036 0.035 C
6570 5228 1.12 62.1 0.028 0.032 YBE-8-90-22.5-G0.5A Bar B 4260 5158 0.91 67.9 0.230 0.209 S
BE-8-90-22.5-GA Bar B 5310 5158 1.01 66.9 0.070 0.071 YBE-8-90-22.5-G2A Bar B 4450 5158 0.93 36.7 0.057 0.053 C
6610 5158 1.13 60.8 0.065 0.074 Y
Gro
up 6
2
BE-8-90-0
Gro
up 6
3
BE-8-90-22.5
Sing
le B
ar a
nd M
ultip
le B
ar S
peci
men
s - B
ar B
Sing
le B
ar a
nd M
ultip
le B
ar S
peci
men
s - B
ar A
Para
met
er v
arie
d =
sing
le o
r mul
tiple
bar
Para
met
er v
arie
d =
sing
le o
r mul
tiple
bar
Gro
up 5
8
BE-8-90-0
Gro
up 5
9
BE-8-90-22.5
Gro
up 6
0
BE-5-90-0
Gro
up 6
1
BE-5-90-22.5
Specimen
Gro
up 5
6
BE-5-90-0
Gro
up 5
7
BE-5-90-22.5
*Asterisk denotes a normalized value
42
5. SUMMARY, CONCLUSIONS, AND RECOMMENDATIONS
5.1. SUMMARY
The object of this study was to evaluate the potential influence of hook tilt angle of standard reinforcing hooks on the bond strength of normal weight concrete as discussed in Section 1. In the beam-end specimens utilized in this study, 90 and 180 degree standard reinforcing hooks were placed at varying angles to compare the angle of tilt and to compare two hook types. Twelve single bar specimens and twelve multiple bar specimens each containing either No. 5 or No. 8 standard reinforcing bars were tested by axially loading the reinforcing bar in tension. The series of single bar and multiple bar specimens were designed and tested to compare the single bar behavior with group effects. Previous studies of the bond between reinforcing bars and concrete were discussed in Section 2. Section 3 summarized the experimental program including specimen design, test setup, test procedure, instrumentation, and test results. The test results were given in terms of bar displacement at a given bar stress and checked with stress-strain values. Displacement values were measured from the loaded end of the reinforcing hooked bar relative to the concrete and a summary table was given. Comparisons of the variables were discussed in Section 4 including the effects of tilt angle, hook type, bar size, bar position, and group-effect. 5.2. CONCLUSIONS
Based on the test results, the following conclusions regarding single bar specimens were made:
1. Failure mode of all single bar specimens was steel yielding 2. The maximum stress for all single bar specimens was similar because of similar failure
mode and reinforcing bar yield strengths. 3. No trends were observed for single bar specimens with respect to the displacements at
maximum stress and different variables. Based on the test results, the following conclusions regarding multiple bar specimens were made:
1. For a given specimen, while the applied load on each of the three bars was nearly the
same, the displacement measured at maximum stress varied with bar position. 2. Bars with closer spacing had greater measured displacement at maximum stress. 3. Bars with larger tilt angle (from horizontal) exhibited greater measured displacement at
maximum stress. Based on the test results, the following conclusion regarding the comparisons between single bar specimens and multiple bar specimens was made:
1. Normalized single bar displacements were similar to those of the multiple bar specimens
with A or 2A spacing (wide spacing).

43
5.3. RECOMMENDATIONS
It should be noted that the conclusions in Section 5.2 are based on the results of the experiments conducted and their specific specimen geometry and material properties. The specimens had 3 inches of cover to the hook tail, 4 inches of side cover to the hook, and 3db of cover to the bottom of the bar as discussed in Section 3.3. For most of the specimens, it can be concluded that the concrete cover was large enough to preclude the concrete cracking failure mode that can result either from crushing inside the hook bend and its extension to the side surface, or from compressive stresses on the outside of the hook tail in the case of 90 degree hooks (Figure 2.5). Additionally, since all single bar specimens were able to achieve bar yielding and no concrete crushing was observed in the dissected test specimens after failure, it can be concluded that the failure (and the maximum bar force transferred to the concrete) was not governed by concrete strength. On the other hand, the multiple bar specimens, which had a lower average concrete strength than the single bar specimens, exhibited different modes of failure including bar yielding, concrete cracking, and slip. Additionally, the bar spacing, which varied between 0.5 and 2 times the hook length, A, as discussed in Section 3.3, was found to influence the results. Thus the recommendations must be limited to these geometrical and material considerations as follows:
1. For No. 5 bars and smaller with concrete compressive strength, f’c, greater than 4500 psi,
and a spacing between 0.5A and 2A, tilting reinforcing hooked bars from vertical at any angle does not compromise the structural integrity.
2. For No. 5 bars and smaller with concrete compressive strength less than 4500 psi, and spacing less than 0.5A, more data is needed.
3. For any bars larger than No. 5, more data is needed.

44
APPENDIX A
TEST PROGRAM
45
A. TEST PROGRAM
A.1. INTRODUCTION
This appendix includes the properties of the materials used, the test specimen construction, the test setup, and testing procedure of the reinforced concrete specimens used in this study. A.2. MATERIALS
The reinforced concrete was comprised of normal weight concrete and reinforcing steel. The following sections describe the concrete and reinforcing steel properties in detail as well as the material property tests performed.
A.2.1. Concrete. The concrete mixture used in the specimen construction was selected
by trial batching three mixture designs. Three mixture designs varied in their water to cement ratios (w/c) to find an optimal concrete mixture with a target compressive strength of 4500 psi at test date. The chosen mixtures as seen in Table A.1, were supplied by a local ready-mix company, Rolla Ready Mix. The components of the concrete mixtures were coarse aggregate (Jefferson City Dolomite), fine aggregate (Mississippi River Sand), type I Portland cement, and water; all local materials were provided by Rolla Ready Mix. There were no add-mixtures incorporated into the design. The concrete compression and splitting tensile strengths were measured seen in Figure A.1. The concrete compressive strength was determined from three 4 inch x 8 inch cylinders loaded in compression. Neoprene pads were used for the caps of the cylinders to decrease the influence of surface imperfections during loading. The cylinders were loaded at approximately 530 lbs/sec in the 400-kip Forney machine in the load frame laboratory in the Butler-Carlton Building at Missouri S&T. Split cylinder tests to measure the splitting tensile strength were also performed with three 4 inch x 8 inch cylinders at a loading rate of approximately 100 lbs/sec in the 400-kip Forney machine. All loading rates follow the appropriate ASTM standards. The mechanical properties of the concrete for the single bar specimens and multiple bar specimens are listed in Table A.2 and Table A.3, respectfully. The compression history for the concrete can be seen in Figure A.2.
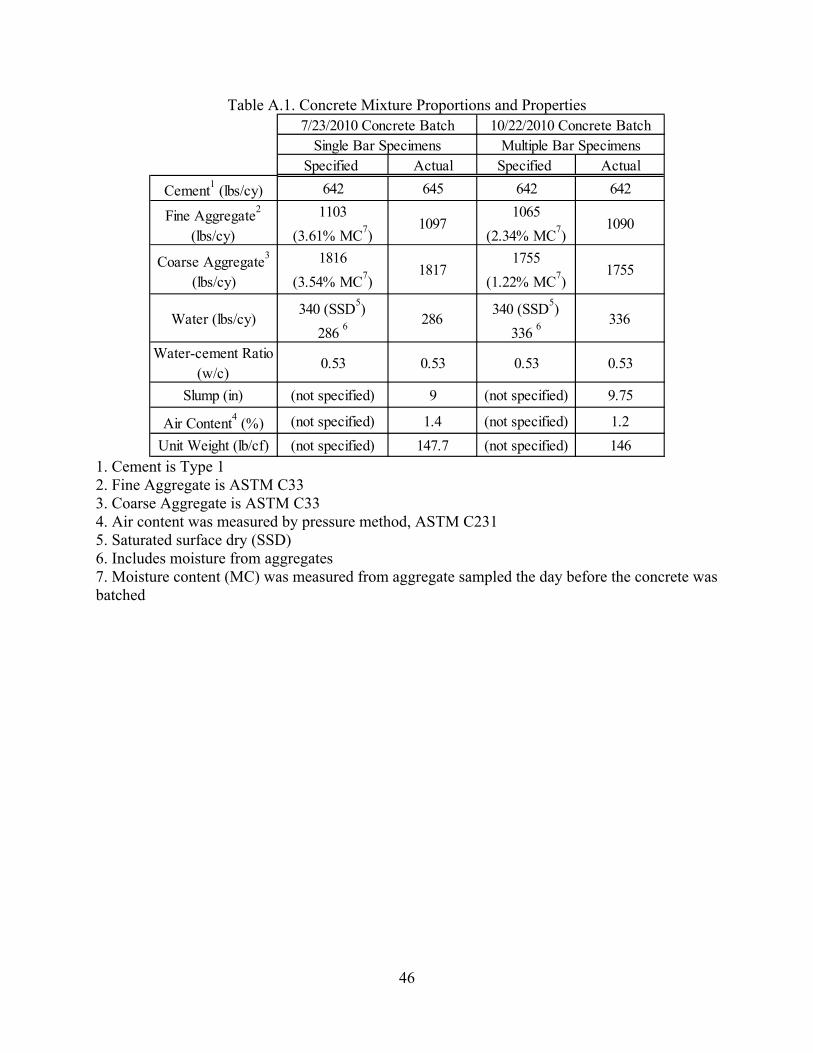
46
Table A.1. Concrete Mixture Proportions and Properties
Specified Actual Specified Actual
Cement1 (lbs/cy) 642 645 642 642
Fine Aggregate2
(lbs/cy)1103
(3.61% MC7)1097
1065 (2.34% MC7)
1090
Coarse Aggregate3
(lbs/cy)1816
(3.54% MC7)1817
1755 (1.22% MC7)
1755
Water (lbs/cy)340 (SSD5)
286 6286
340 (SSD5) 336 6
336
Water-cement Ratio (w/c)
0.53 0.53 0.53 0.53
Slump (in) (not specified) 9 (not specified) 9.75
Air Content4 (%) (not specified) 1.4 (not specified) 1.2Unit Weight (lb/cf) (not specified) 147.7 (not specified) 146
7/23/2010 Concrete Batch 10/22/2010 Concrete BatchSingle Bar Specimens Multiple Bar Specimens
1. Cement is Type 1 2. Fine Aggregate is ASTM C33 3. Coarse Aggregate is ASTM C33 4. Air content was measured by pressure method, ASTM C231 5. Saturated surface dry (SSD) 6. Includes moisture from aggregates 7. Moisture content (MC) was measured from aggregate sampled the day before the concrete was batched
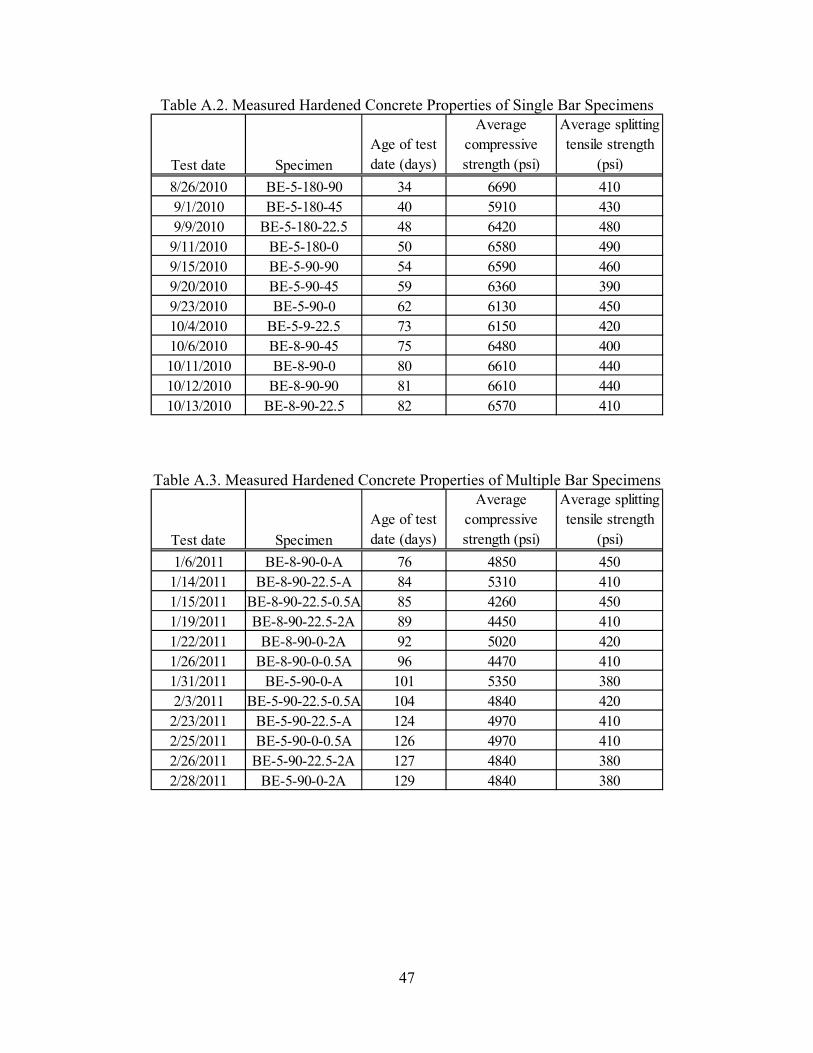
47
Table A.2. Measured Hardened Concrete Properties of Single Bar Specimens
Test date SpecimenAge of test date (days)
Average compressive strength (psi)
Average splitting tensile strength
(psi)8/26/2010 BE-5-180-90 34 6690 4109/1/2010 BE-5-180-45 40 5910 4309/9/2010 BE-5-180-22.5 48 6420 480
9/11/2010 BE-5-180-0 50 6580 4909/15/2010 BE-5-90-90 54 6590 4609/20/2010 BE-5-90-45 59 6360 3909/23/2010 BE-5-90-0 62 6130 45010/4/2010 BE-5-9-22.5 73 6150 42010/6/2010 BE-8-90-45 75 6480 40010/11/2010 BE-8-90-0 80 6610 44010/12/2010 BE-8-90-90 81 6610 44010/13/2010 BE-8-90-22.5 82 6570 410
Table A.3. Measured Hardened Concrete Properties of Multiple Bar Specimens
Test date SpecimenAge of test date (days)
Average compressive strength (psi)
Average splitting tensile strength
(psi)1/6/2011 BE-8-90-0-A 76 4850 450
1/14/2011 BE-8-90-22.5-A 84 5310 4101/15/2011 BE-8-90-22.5-0.5A 85 4260 4501/19/2011 BE-8-90-22.5-2A 89 4450 4101/22/2011 BE-8-90-0-2A 92 5020 4201/26/2011 BE-8-90-0-0.5A 96 4470 4101/31/2011 BE-5-90-0-A 101 5350 3802/3/2011 BE-5-90-22.5-0.5A 104 4840 420
2/23/2011 BE-5-90-22.5-A 124 4970 4102/25/2011 BE-5-90-0-0.5A 126 4970 4102/26/2011 BE-5-90-22.5-2A 127 4840 3802/28/2011 BE-5-90-0-2A 129 4840 380
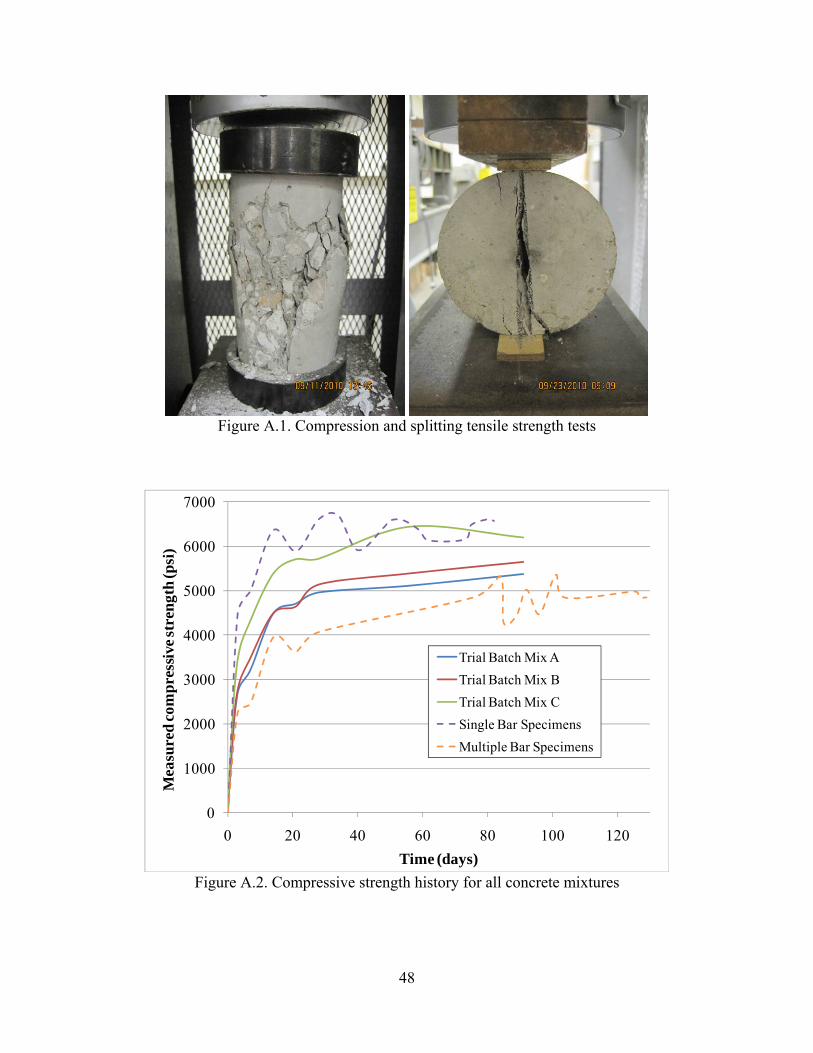
48
Figure A.1. Compression and splitting tensile strength tests
0
1000
2000
3000
4000
5000
6000
7000
0 20 40 60 80 100 120
Mea
sure
d c
omp
ress
ive
stre
ngt
h (p
si)
Time (days)
Trial Batch Mix ATrial Batch Mix BTrial Batch Mix CSingle Bar SpecimensMultiple Bar Specimens
Figure A.2. Compressive strength history for all concrete mixtures
49
A.2.2. Reinforcing Steel. The reinforcing steel used in this study was type ASTM A615 Gr. 60 provided by Ambassador Steel Corp and Gateway Steel Products. Coupons from the same heat as the reinforcing steel used in the reinforced concrete specimens were tested to determine the yield strength and ultimate strength. Yield strength was determined using ASTM A370 with three 36 inch long reinforcing steel coupons per bar size seen in Figure A.3. Two bar sizes were used: No. 5 and No. 8 bars per CRSI recommendations. The coupons were instrumented with a uniaxial electrical resistance strain gage (Vishay Micro-Measurements EA-06-250BG-120/LE) and a two inch gage extensometer (8 inch Epsilon Extensometer). The tension tests were performed on the Tinius Olson testing machine in the load frame room in the Butler-Carlton Building at Missouri S&T where the coupons were axially loaded at a rate of 0.5 inch/minute. Figure A.4 shows typical stress-strain curves for the tensile tests performed using the extensometer data. The reinforcing steel properties including the properties reported by the steel manufacturer are summarized in Figure A.5. Relative rib area was measured in accordance with ACI 408R-03. Values for Rr were 0.080 and 0.077 for the No. 5 and No 8 bars, respectively. The relative rib area, rib height, and rib spacing for both the No. 5 bars and the No. 8 bars were satisfactory according to ACI 408R-03 and ASTM A615-09.
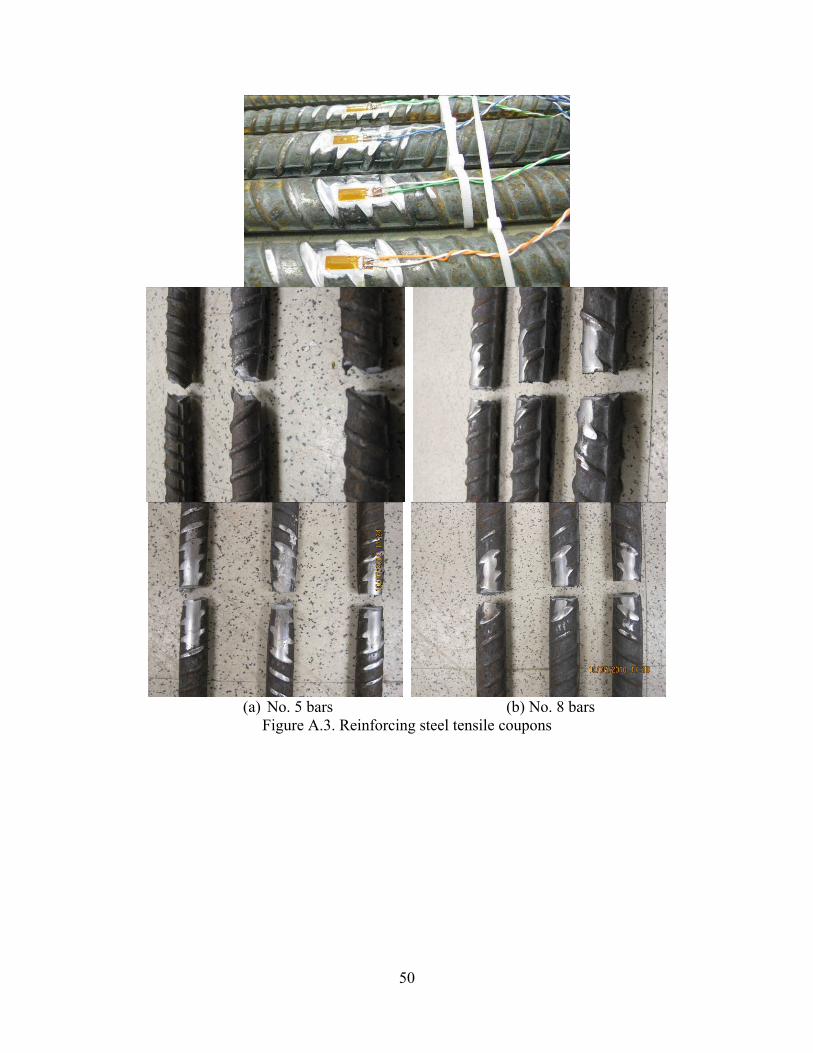
50
(a) No. 5 bars (b) No. 8 bars
Figure A.3. Reinforcing steel tensile coupons
51
0
10
20
30
40
50
60
70
80
0.000 0.002 0.004 0.006 0.008 0.010
Str
ess
(ksi
)
Strain (in)
No. 8
No. 5
Figure A.4. Typical stress-strain curve for steel reinforcing bars
0
20
40
60
80
100
120
Stre
ss (k
si)
YIELD
ULTIMATE
NO. 5 NO. 8
Coupon Tensile Test
Coupon Tensile Test
Steel Manufacturer
Steel Manufacturer
68.0 67.5 66.0 67.5
105 103 103 101
NO. 5NO. 8
NO. 8 NO. 8NO. 5 NO. 5
Figure A.5. Summary of reinforcing steel yield and ultimate strength
52
A.3. TEST SPECIMEN CONSTRUCTION
The following details the reinforcing steel preparation before placing concrete, the formwork design and construction, and the casting and curing of the specimens.
A.3.1. Reinforcing Steel Preparation. The reinforcing steel was delivered and stored in
the High Bay Structural Engineering Research Laboratory (SERL) in the Butler-Carlton Building at Missouri S&T. All of the hooked reinforcing steel bars used in the experiments came from the same heat and were bent to CRSI specifications by the manufacturer. The surfaces of the bars were prepared per Vishay instructions and fitted with three strain gages as defined in Section A.4.2.2. The bars were also prepared and fitted with four wires for measuring displacement as explained in Section A.4.2.3. The reinforcing bars were then carefully placed in the formwork on chairs and tied into place as described in Section A.3.2.
A.3.2. Formwork and Assembly. All of the formwork was custom built with new
lumber. The formwork was cut to size and assembled with deck screws. While the four side walls of the block were built to size, the bottom of the form was plywood sheeting. The plywood sheet was the base to which the four side walls attached with screws. To ensure that the fresh concrete pressure did not blow out the formwork, a ratchet strap was placed around the bottom third of the formwork before concrete was placed. Also to account for the concrete pressure, wooden straps were fixed to the top of the largest specimens so that the walls did not bow outward at the top of the forms seen in Figure A.6. There were five holes drilled in the formwork of each specimen: one on the front face where the loaded end of the reinforcing bar protruded and four on the back face where the displacement wires exited. There were also PVC tubes inserted through the specimens to provide a lifting and turning mechanism for the concrete specimens. The reinforcing bar, bond breaker, and displacement wires were placed in the formwork atop a continuous chair that was stapled in place. The reinforcing bar(s) were carefully placed so not to harm the strain gages or displacement wires. The bond breaker (not the reinforcing bar) was tied to the continuous chair to prevent movement. The hook part of the reinforcing bar was tilted to the required angle and then set on, not tied to, a chair that was stapled to the plywood mat. Note that the reinforcing bar was placed near the bottom of the form to avoid top bar effect and ensure there was enough coarse aggregate surrounding the reinforcement seen in Figure A.7. Once all of the preparation of the steel, strain gages, and displacement wires were in place, the forms were vacuumed out, and form oil was applied to all formwork surfaces to assist in easy removal.
53
(a) single bar specimens
(b) multiple bar specimens
Figure A.6. Formwork for specimens
54
(a) single bar specimens
(b) multiple bar specimens
Figure A.7. Reinforcing bar(s) inside formwork before concrete placement
A.3.3. Casting and Curing. Concrete placement occurred on 7/23/2010 for the single bar specimens and on 10/22/2010 for the multiple bar specimens and their corresponding cylinders. The single bar specimens required just one ready-mix truckload of concrete whereas the multiple bar specimens were much larger and required two truckloads of concrete. A project representative was at the ready-mix plant to watch the batching of concrete and then followed the ready-mix truck to the laboratory on both dates. The concrete mixture design and properties are discussed in Section A.2.1, and the choice to use a ready-mix company was to ensure uniformity throughout the specimens. When the concrete arrived at the laboratory, the slump, air content, and unit weight of concrete was determined and can be seen in Table A.1. During each concrete placement, concrete was shoveled from the truck chute or discharged from a bucket into the specimens avoiding placing concrete directly on top of the strain gages and wires and so that the hook maintained the correct tilt angle. The concrete specimens were then consolidated by vibrating (avoiding delicate wires), and then the tops of the specimens were finished by hand seen in Figure A.8. The cylinders were also cast at this time alongside the specimens per ASTM C31. For the 7/23/2010 placement, 108
55
concrete cylinders were cast. For the 10/22/2010 placement, 48 concrete cylinders were cast for the first truckload, and 50 concrete cylinders were cast for the second truckload. After all specimens and cylinders were cast, moist curing began. Wet burlap and plastic were placed on top of both the specimens and cylinders so that the wet burlap rested on top of the concrete and the plastic helped keep in the moisture as seen in Figure A.9. The forms for the single bar specimens were disassembled after three days of moist curing, while the forms for the multiple bar specimens were disassembled after seven days of moist curing due to slower concrete strength gain. The cylinders were removed from their forms when the specimens’ formwork was removed and the moist cure process was stopped. The specimens and cylinders were stored in the SERL until tested.
(a) single bar specimens (b) multiple bar specimens
Figure A.8. Concrete placement
(a) specimens (b) cylinders
Figure A.9. Moist curing of concrete specimens A.4. TEST SETUP
The test setup included the test frame, instrumentation including load cells, strain gages, and displacement transducers, the types of measurements taken, loading procedure, and loading protocol.
A.4.1. Test Frame. The test frame was comprised generally of steel loading beams,
Dywidag threaded rods and nuts, hydraulic jack(s), a hand pump, Hydrostone, and the strong floor. The test frame for the single bar specimens shown in Figure A.10, Figure A.11, and Figure
56
A.12 is different from the test frame for the multiple bar specimens shown in Figure A.13, Figure A.14, and Figure A.15. The test setup for the single bar specimen included an L-bracket that was tensioned to the strong floor and an equal-leg angle that rested against the L-bracket. The L-bracket was designed to take the shear and the moment from loading. The specimen, with the reinforcing bar passing through the L-bracket (note that the specimen in its testing position was oriented 180 degrees from the casting position to avoid top bar effects, as discussed in Section A.3.2), was placed resting on the steel angle (where the angle provided the distributed compression reactions). To resist overturning, a loading beam was placed on the top side of the specimen creating a distributed vertical reaction. The loading beam was held in position by two additional loading beams that were attached to Dywidag rods and nuts that were tensioned to the strong floor. To load the lead end of the reinforcing bar, a hydraulic jack, 0.25 inch steel plate, and load cell were placed on the bar while an anchorage was affixed to the end of the bar seen in Figure A.16. The test setup for the multiple bar specimen included two steel HSS tubes that were tensioned to the strong floor and a very stiff steel loading beam that rested against the tubes. The HSS tubes took the shear force from loading and directed it into the strong floor. The angle rested against the stiff beam and the specimen sat upon the angle. The multiple bar specimens utilized the loading beam reaction on the top side of the specimen similar to the single bar specimens. There were two large upright columns tensioned to the strong floor on either side of the specimen about two feet in front of the specimen. Another loading beam rested against the two upright columns. The reinforcing bars passed through this loading beam and induced moment in the columns. Since the reinforcing bars were too short for the test setup, threaded Dywidag rods were spliced to the bars for an extension using Zap Screwlok® Type 2 series splices. To load the lead end of the reinforcing bar, the hydraulic jacks, 0.25 inch steel plates, and load cells were placed on the respective threaded bars, and a nut was affixed to the end of the bar seen in Figure A.16. The hydraulic jacks and hand pump were connected by tee valves and rubber hoses in the configuration seen in Figure A.16. Between any steel and concrete, Hydrostone, a high strength material when dry, was used to fill the gap and reduce stress concentrations.

57
Figure A.10. Single bar specimen test frame (side view)
Figure A.11. Single bar specimen test frame (top view)
reinforcing bar
hydraulic jack
load cell
reaction plates
Dywidag rods
loading beams
loading L-bracket
Strong Floor
load cell
loading beams
test specimen
hydraulic jack
loading L-bracket
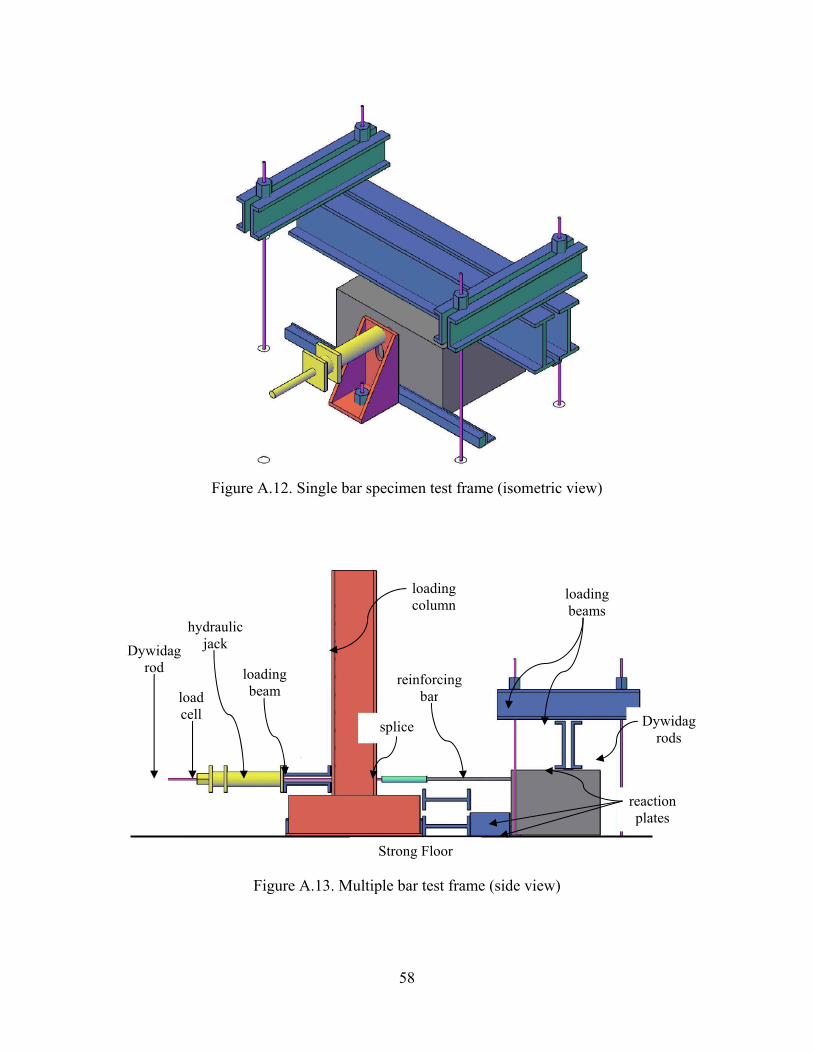
58
Figure A.12. Single bar specimen test frame (isometric view)
Figure A.13. Multiple bar test frame (side view)
Strong Floor
reaction plates
Dywidag rods
loading beams
reinforcing bar
splice
loading column
loading beam
hydraulic jack
load cell
Dywidag rod
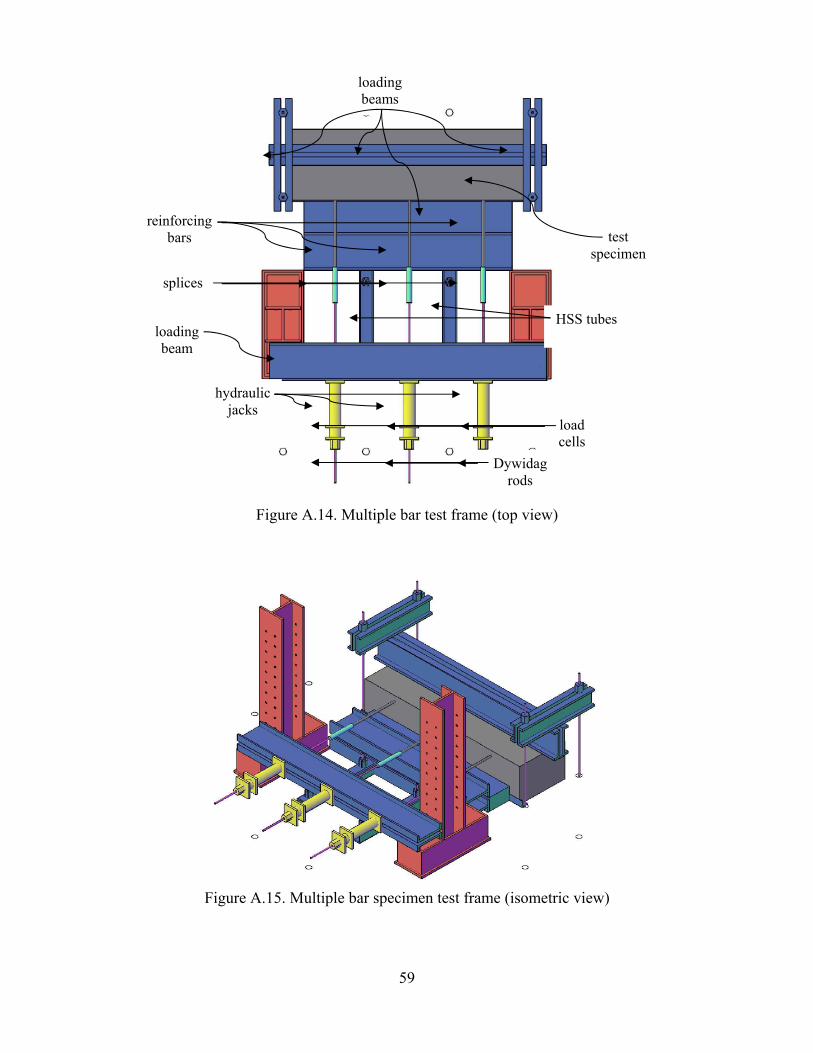
59
Figure A.14. Multiple bar test frame (top view)
Figure A.15. Multiple bar specimen test frame (isometric view)
loading beams
reinforcing bars
splices
loading beam
hydraulic jacks
Dywidag rods
load cells
HSS tubes
test specimen

60
(a) single bar specimen (b) multiple bar specimen Figure A.16. Hydraulic jack and anchorage systems for test frames
A.4.2. Instrumentation. Instrumentation of this test setup included load cells, uniaxial strain gages, displacement wires, and displacement transducers including string transducers and direct current linear variable displacement transducers (DC LVDT or DCVT).
A.4.2.1 Load Cell. For the single bar specimens, a single 200 kip Cooper load cell was
used to measure the load applied to the reinforcing bar. For the multiple bar specimens, three 200 kip load cells were used; two were Cooper load cells while one was Sensotec. The difference in brands of load cells was negligible to the test setup. All load cells were calibrated by the technical staff no more than a week before testing began for both the single bar and multiple bar specimens.
A.4.2.2 Strain Gages. The same type of uniaxial electronic resistance strain gages
(Vishay Micro-measurements EA-06-250BG-120/LE) were used on all of the reinforcing bars including the test coupons described in Section A.2.2 to measure the strains at key locations along the length of the bar. Three strain gages were applied per manufacturer’s instructions to each hooked reinforcing bar. Their locations can be seen in Figure A.17. While applying the strain gages, care was taken to leave as much cross sectional area on the hooked reinforcing bar while giving enough room for a smooth flat area for the strain gage and ensure adequate bond. After the strain gage was applied, a protective covering was placed over the strain gage (see Figure A.18) to protect it from moisture or damage from the placement of concrete.
A.4.2.3 Displacement Wires. Displacement wires were used on the reinforcing bar in
the single bar specimens and only on two of the three reinforcing bars in the multiple bar specimens (the interior bar and the exterior bar with the hook located nearest to the edge of the concrete). Four 0.04 inch diameter displacement wires were used to measure the movement of the reinforcing bar. These wires were fixed to the reinforcing bar using an epoxy suited for steel in the locations shown in Figure A.17. The attachment points were small and the influence on the performance of the bar was negligible. To prevent bonding to concrete, a plastic tube was placed around each wire and protruded out of the formwork seen in Figure A.19. As the wires protruded from the back of the concrete specimen, they were attached to string transducers to measure displacement described in Section A.4.2.4.
Bar A
Bar B
Bar C
61
A.4.2.4 Displacement Transducers. Two different types of displacement transducers were used. A 2-inch DCVT was used at the lead end of the bar, and string transducers were used at the other locations of displacement measurement (see Figure A.20). The DCVT was mounted with a bracket fixed to the reinforcing bar and placed so that the retractable spring-loaded tip touched the front face of the concrete. The string transducers were mounted onto a custom-made wooden support and attached to displacement wires (Section A.4.2.3) that were fixed to the reinforcing bar in the concrete.
Figure A.17. Instrumentation placement
(a) 90 degree hook (b) 180 degree hook Figure A.18. As-built instrumentation photos: strain gages
•
•
•
••
concrete face
1H
2H
3H
4H
3V
4V
leadfore
aft
Strain Gage Slip Horiz.
Vert.
62
(a) 90 degree hook (b) 180 degree hook Figure A.19. As-built instrumentation photos: displacement wires
(a) DCVT
(b) string transducer
Figure A.20. DCVT and string transducer photos
63
A.5. TEST PROCEDURE The test procedure was modeled from previous studies (see Section 2) and modified for ease of loading. The test sequence and test protocol is described in detail in the subsequent sections.
A.5.1. Test Sequence. The single bar specimens were tested first in order: specimen BE-
5-180-90, BE-5-180-45, BE-5-180-22.5, BE-5-180-0, BE-5-90-90, BE-5-90-45, BE-5-90-22.5, BE-5-90-0, BE-8-90-90, BE-8-90-45, BE-8-90-22.5, and BE-8-90-0. The multiple bar specimens were tested after the single bar specimens in this order: specimen BE-8-90-0-A, BE-8-90-22.5-A, BE-8-90-22.5-0.5A, BE-8-90-22.5-2A, BE-8-90-0-2A, BE-8-90-0-0.5A, BE-5-90-0-A, BE-5-90-22.5-0.5A, BE-5-90-22.5-A, BE-5-90-0-0.5A, BE-5-90-22.5-2A, and BE-5-90-0-2A. Test dates and age of concrete at test dates are shown in Table A.2 and Table A.3.
A.5.2. Test Protocol. The specimens were loaded under monotonic loading conditions
incrementally until one of three failure modes was met: concrete crushing, steel yielding, or reinforcing bar displacement. The loading procedure consisted of applying a load to the reinforcing bar in 1667 psi increments for both No. 5 and No. 8 bars which created 36 load stages based on yield strength of 60 ksi. At each load stage, the load was applied and held constant for two minutes. Every two minutes, the load was allowed to stabilize and data was recorded at every load stage. The bar was loaded with hydraulic jacks that were operated by a hand pump (see Figure A.21 and Figure A.22). All behavior of the specimens such as cracking, bar slip, and failure behavior was observed and recorded using photos, drawings, and data acquisition at every load stage. A data acquisition system was used to obtain the measurements from the instrumentation and was relayed to a computer program, LabView, where the computer program that scanned all the instrumentation readings at the same time. The data acquisition system acquired readings from the load cell(s), displacement transducers, and strain gages. The force applied by the hydraulic jack was read by the load cell which was compressed between the jack and the anchorage.
(a) single bar specimen (b) multiple bar specimen
Figure A.21. Hydraulic jacks
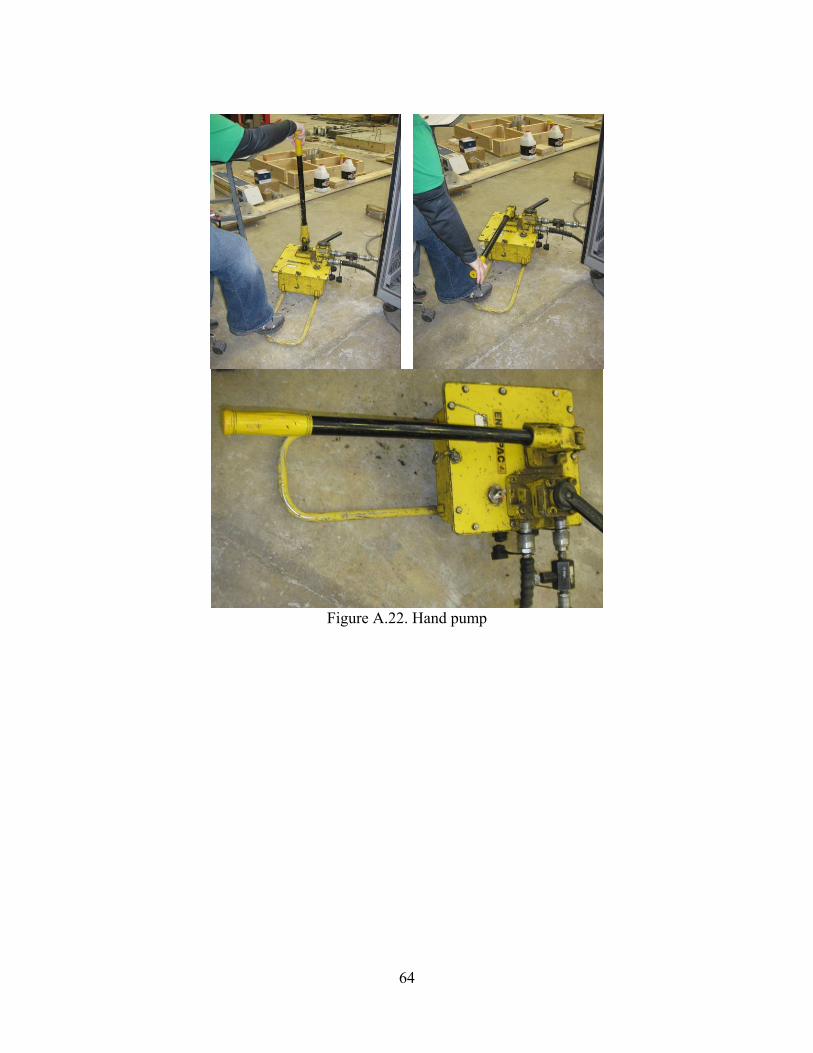
64
Figure A.22. Hand pump
65
APPENDIX B
SPECIMEN DESIGN PROCEDURE
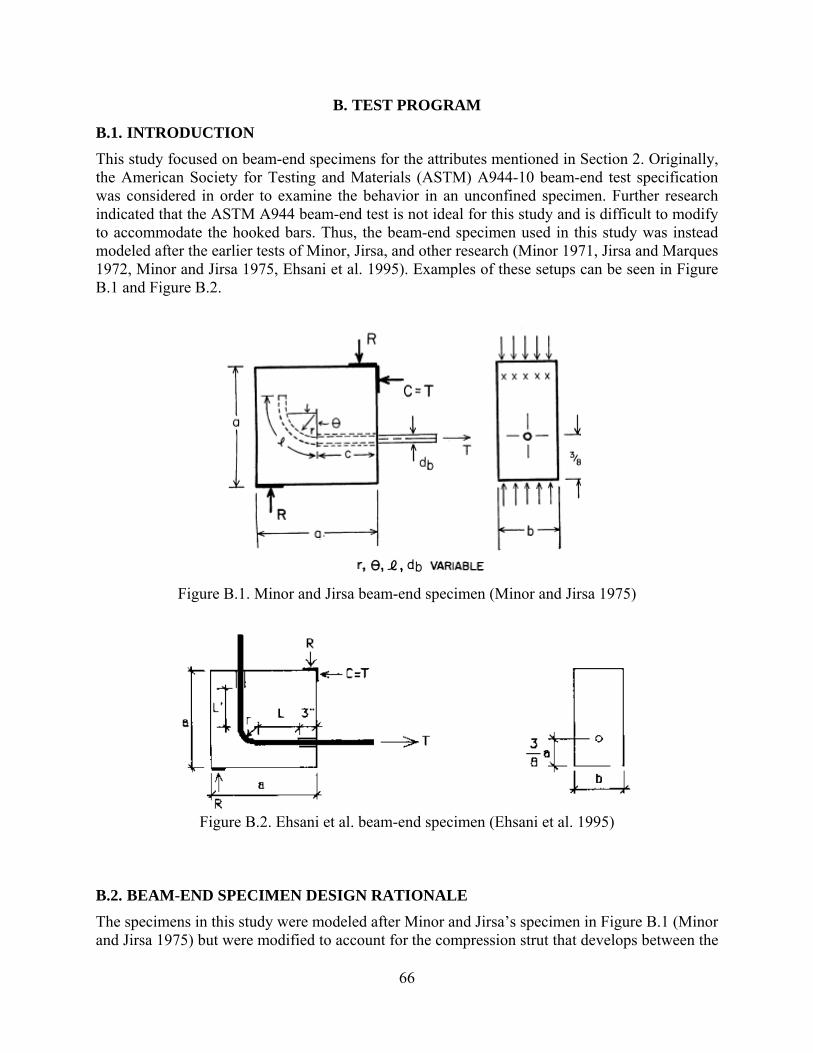
66
B. TEST PROGRAM
B.1. INTRODUCTION
This study focused on beam-end specimens for the attributes mentioned in Section 2. Originally, the American Society for Testing and Materials (ASTM) A944-10 beam-end test specification was considered in order to examine the behavior in an unconfined specimen. Further research indicated that the ASTM A944 beam-end test is not ideal for this study and is difficult to modify to accommodate the hooked bars. Thus, the beam-end specimen used in this study was instead modeled after the earlier tests of Minor, Jirsa, and other research (Minor 1971, Jirsa and Marques 1972, Minor and Jirsa 1975, Ehsani et al. 1995). Examples of these setups can be seen in Figure B.1 and Figure B.2.
Figure B.1. Minor and Jirsa beam-end specimen (Minor and Jirsa 1975)
Figure B.2. Ehsani et al. beam-end specimen (Ehsani et al. 1995)
B.2. BEAM-END SPECIMEN DESIGN RATIONALE
The specimens in this study were modeled after Minor and Jirsa’s specimen in Figure B.1 (Minor and Jirsa 1975) but were modified to account for the compression strut that develops between the

67
reaction plates as seen in Figure B.3. The modified specimen was elongated so that the reinforcing hook extended beyond the reaction plates and the compression strut (Figure B.4).
Figure B.3. Strut and tie model from ACI 318-08
Figure B.4. Modified beam-end specimen
The height of the test specimen designed was based upon the configuration where the hook of the reinforcing bar was oriented in the vertical direction. The height was a function of the concrete above the tail extension of the test bar (3 inches), the length of the tail extension of the test bar (12 times the diameter of the bar, 12db per CRSI standard hook details), the diameter of the bar (db), and the concrete cover of the bar (three times the diameter of the bar, 3db). The concrete above the tail extension of the test bar was chosen to be 3 inches based on the literature (Ehsani et al 1995). For tilted reinforcing bars, the top concrete cover varied (≥ 3 inches) and is listed in Table B.1. This was to eliminate the influence of the support reactions created by the loaded end of the bar (see Figure B.5 and Figure B.6). The concrete cover over the reinforcing bar was designed to be a function of the diameter of the bar. This resulted in different covers for specimens with different bar sizes, similar to other research (Minor 1971) and within the limits
68
of other studies (Marques and Jirsa 1975, Pinc et al. 1977, Johnson and Jirsa 1981, etc.). The cover meets the requirements of ACI 318-08. The length of the specimen was the height plus the distance beyond the compression plate, which was a modification from Minor and Jirsa’s specimen (1975). The distance beyond the compression plate was the sum of 4 inches (to account for the compression strut), the diameter of the test bar, and 3 inches (to account for the cover of the tail extension of the bar). The amount of cover for the tail extension of the bar was designed as 3 inches to prevent concrete fracture from the bearing of the tail end of the hook and also satisfies ACI 318-08. The width of the concrete beams was modified from the dimensions used by Minor and Jirsa (1975) and Ehsani et al. (1995) to accommodate the tilt of the hooked bars. This can be seen generally in Figure B.5 for the width increase of a 180° hooked bar and Figure B.6 for the width increase of a 90° hooked bar. The dimensions of the hook were used to calculate the width increase of the specimen. This width increase was doubled to maintain the position of the testing bar in the middle of the specimen as seen in Figure B.7 and Figure B.8 The amount of cover on each side of the reinforcing hook, tilted or not, was designed based on ASTM A944-10 as 4 inches. In twelve of the twenty-four specimens, group-effect was evaluated. It was decided to use 0° and 22.5° tilt from horizontal to investigate whether multiple reinforcing bars would cause a splitting plane in which the concrete would fracture in the plane of the bars. The bar spacing of the multiple bar specimens was varied as seen in Table 1. The spacing was designed to be a function of the CRSI recommended standard reinforcing hook distance A (seen in Figure B.9, CRSI Design Manual 2008), from the edge of the reinforcing bar to the end of the hook, 2A and 0.5A as seen generally in Figure B.10 and Figure B.11. All multiple bar specimens contained three 90° standard hooked reinforcing bars. Polyvinyl chloride (PVC) pipes were used as bond breakers to control the bond length of the bar and prevent localized failure of the concrete at the loaded end of the bar. These bond breakers can be seen in Figure B.5 and Figure B.6. PVC pipes as bond breakers were also used in previous studies (Minor 1971, Minor and Jirsa 1975, Ehsani et al. 1995) and in ASTM A944-10. Only the hooked part of the bar was bonded to the concrete as proposed by CRSI to evaluate the capacity and the influence of the hook. The lead end of the test bar extended beyond the face of the concrete in order to apply load to the bar. The test specimen matrix is shown in Table B.2. The variables of this test series include hook tilt angle, hook bend type, reinforcing bar size, and group-effect.
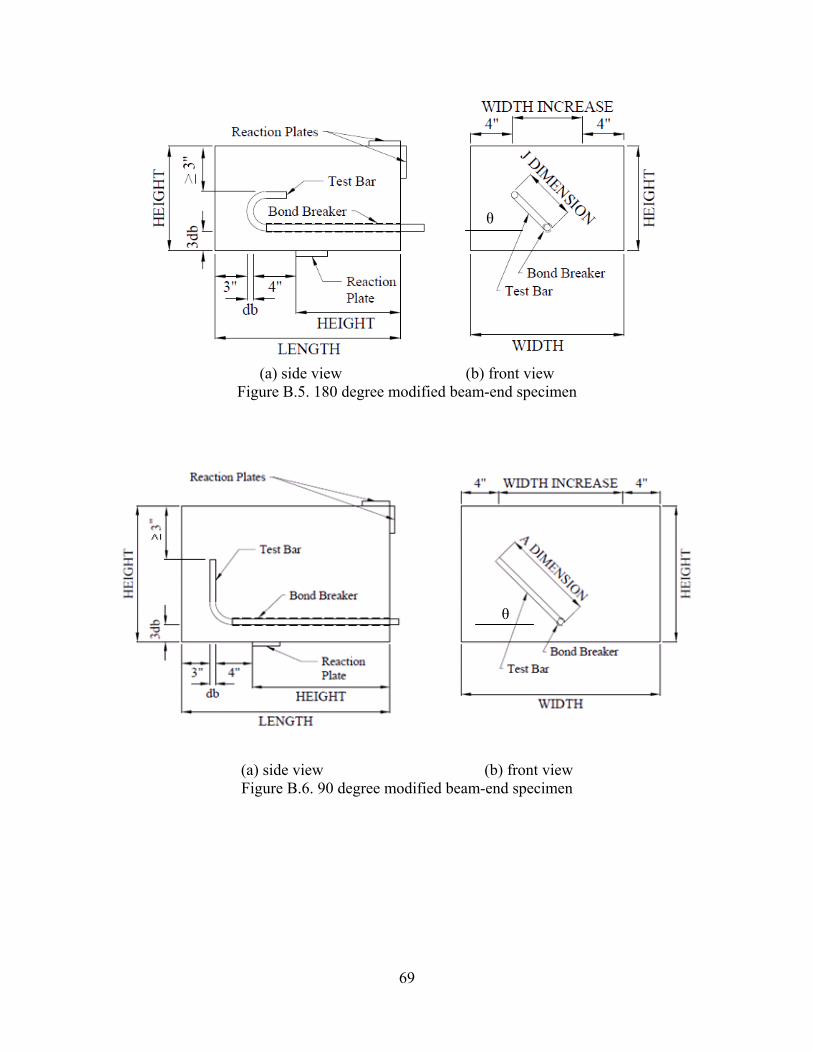
69
(a) side view (b) front view
Figure B.5. 180 degree modified beam-end specimen
(a) side view (b) front view Figure B.6. 90 degree modified beam-end specimen
θ
θ
70
Table B.1. Variable Top Concrete Cover
SpecimenVariable Concrete Cover (in)
≥ 3 inchesSpecimen
Variable Concrete Cover (in) ≥ 3 inches
BE-5-180-0 7 3/8 BE-5-90-0-G2A 12 3/8BE-5-180-22.5 6 1/8 BE-5-90-0-GA 12 3/8BE-5-180-45 4 4/8 BE-5-90-0-G0.5A 12 3/8BE-5-180-90 3 BE-5-90-22.5-G2A 9 1/8BE-5-90-0 12 3/8 BE-5-90-22.5-GA 9 1/8
BE-5-90-22.5 9 1/8 BE-5-90-22.5-G0.5A 9 1/8BE-5-90-45 5 7/8 BE-8-90-0-G2A 18 BE-5-90-90 3 BE-8-90-0-GA 18 BE-8-90-0 18 BE-8-90-0-G0.5A 18
BE-8-90-22.5 14 BE-8-90-22.5-G2A 14 BE-8-90-45 8 6/8 BE-8-90-22.5-GA 14 BE-8-90-90 3 BE-8-90-22.5-G0.5A 14
Figure B.7. 90 degree beam-end specimen width increase
Figure B.8. 180 degree beam-end specimen width increase
22.5° 45° 90°
0°
22.5° 45° 90° 0°
71
Figure B.9. CRSI Design Manual hook detail (CRSI Design Manual 2008)
Figure B.10. 90 degree hook, 0 degree (nominal) tilt, 0.5 A spacing, multiple bar specimen
Figure B.11. 90 degree hook, 22.5 degree tilt, 0.5 A spacing, multiple bar specimen
Table B.2. Test Specimen Matrix

72
Specimen1 Bar SizeStandard
Hook Bend (º)
Hook Angle of Tilt From
Horizontal (º)
Length (in)
Width (in)
Height (in)
Notes
BE-5-180-0 No.5 180 0 17 1/2 17 3/8 9 7/8BE-5-180-22.5 No.5 180 22.5 17 1/2 16 5/8 9 7/8BE-5-180-45 No.5 180 45 17 1/2 14 1/2 9 7/8BE-5-180-90 No.5 180 90 17 1/2 8 5/8 9 7/8BE-5-90-0 No.5 90 0 22 1/2 27 3/8 14 7/8
BE-5-90-22.5 No.5 90 22.5 22 1/2 25 7/8 14 7/8BE-5-90-45 No.5 90 45 22 1/2 21 1/2 14 7/8BE-5-90-90 No.5 90 90 22 1/2 8 5/8 14 7/8BE-8-90-0 No.8 90 0 30 39 22
BE-8-90-22.5 No.8 90 22.5 30 36 5/8 22BE-8-90-45 No.8 90 45 30 29 5/8 22BE-8-90-90 No.8 90 90 30 9 22
BE-5-90-0-G2A2 3-No.5 90 0 22 1/2 67 3/8 14 7/8 Group-effect
BE-5-90-0-GA2 3-No.5 90 0 22 1/2 47 3/8 14 7/8 Group-effect
BE-5-90-0-G0.5A2 3-No.5 90 0 22 1/2 37 3/8 14 7/8 Group-effectBE-5-90-22.5-G2A 3-No.5 90 22.5 22 1/2 62 3/4 14 7/8 Group-effectBE-5-90-22.5-GA 3-No.5 90 22.5 22 1/2 44 3/8 14 7/8 Group-effect
BE-5-90-22.5-G0.5A 3-No.5 90 22.5 22 1/2 35 1/8 14 7/8 Group-effect
BE-8-90-0-G2A2 3-No.8 90 0 30 103 22 Group-effect
BE-8-90-0-GA2 3-No.8 90 0 30 71 22 Group-effect
BE-8-90-0-G0.5A2 3-No.8 90 0 30 55 22 Group-effectBE-8-90-22.5-G2A 3-No.8 90 22.5 30 95 3/4 22 Group-effectBE-8-90-22.5-GA 3-No.8 90 22.5 30 66 1/8 22 Group-effect
BE-8-90-22.5-G0.5A 3-No.8 90 22.5 30 51 3/8 22 Group-effect Notes: 1. The following notation system is used to identify the variables of each specimen. The first term
is type of test: BE (Modified beam-end test). The second term indicates the bar size: No.5 or No.8 standard. The third term is hook bend type: 90° or 180°. The fourth term of the notation is used for angle of tilt from horizontal: 0°, 22.5°, 45° or 90°. Term G in the fifth term denotes specimens that was used to evaluate group-effect (see Note 2), and “A” denotes a dimension that is a function of ACI standard deformed hook dimension defined in Figure B.9. 2. Angle of tilt from horizontal is nominal. Actual angle is slightly larger than zero due to bar placement (see Figures B.10 and B.11).

73
APPENDIX C
TEST RESULTS
74
C. TEST RESULTS
C.1. INTRODUCTION
This appendix gives details about the failure mode, load-displacement behavior, and strain distribution of each specimen. Problems encountered during testing are also discussed at the end of Appendix C. C.2. FAILURE MODES
The three failure modes that were possible for a beam-end test were concrete cracking, steel yielding, and reinforcing bar pullout, or slip, as discussed in Section 2.1 and seen in research from Minor and Jirsa (1975) seen in Section 2.4.3. The single bar specimens and the multiple bar specimens were tested to failure. The test procedure was terminated due to visible concrete cracking or because the next load stage level could not be reached, usually due to yielding the bar. If the concrete cracked, it was usually sudden and was oriented parallel to the reinforcing bar. Reinforcing bar slip was defined by RILEM in RC5 to be 0.12 inches of slip (1982).
C.2.1. Single bar Specimens. All twelve single bar specimens were tested to failure and
showed no signs of cracking. The test dates ranged from 8/26/2010 to 10/13/2010 and can be seen in Table A.2. Their failure mode consisted entirely of the steel yielding since the lead bar slip (minus elongation of the bar) was less than 0.12 inches. Stress-strain curves were also indicative of a yielding failure mode. Of the single bar specimens, four were dissected (seen in Figure C.1) to examine the behavior of the reinforcing bar inside of the concrete after testing. Test specimens were cut using a wet saw oriented parallel to the hook and then pryed apart with a chisel. Photos of BE-5-180-90, BE-5-180-0, BE-5-90-90, and BE-8-90-90 can be seen in Figure C.2, Figure C.3, Figure C.4, and Figure C.5. The photos show that none of the specimens dissected had any concrete crushing around reinforcing bar deformations or the inside of the bend of the hook.
75
Figure C.1. Dissection process (specimen BE-5-180-90 shown)
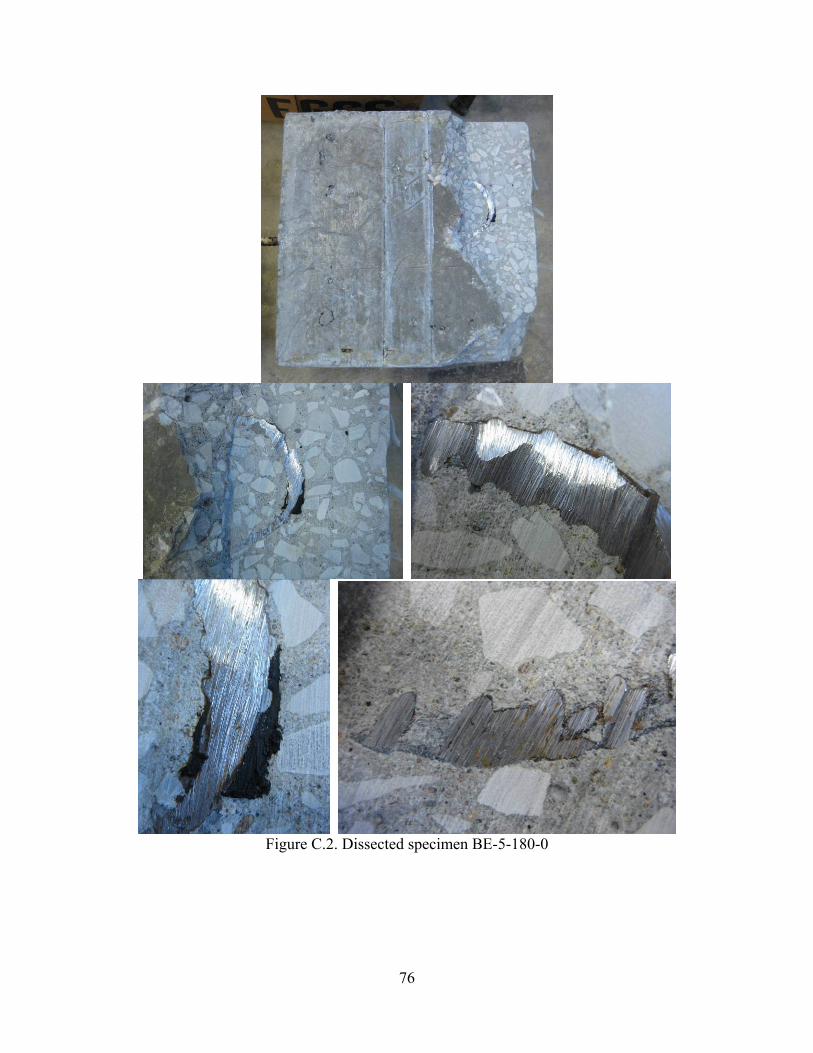
76
Figure C.2. Dissected specimen BE-5-180-0

77
Figure C.3. Dissected specimen BE-5-180-90
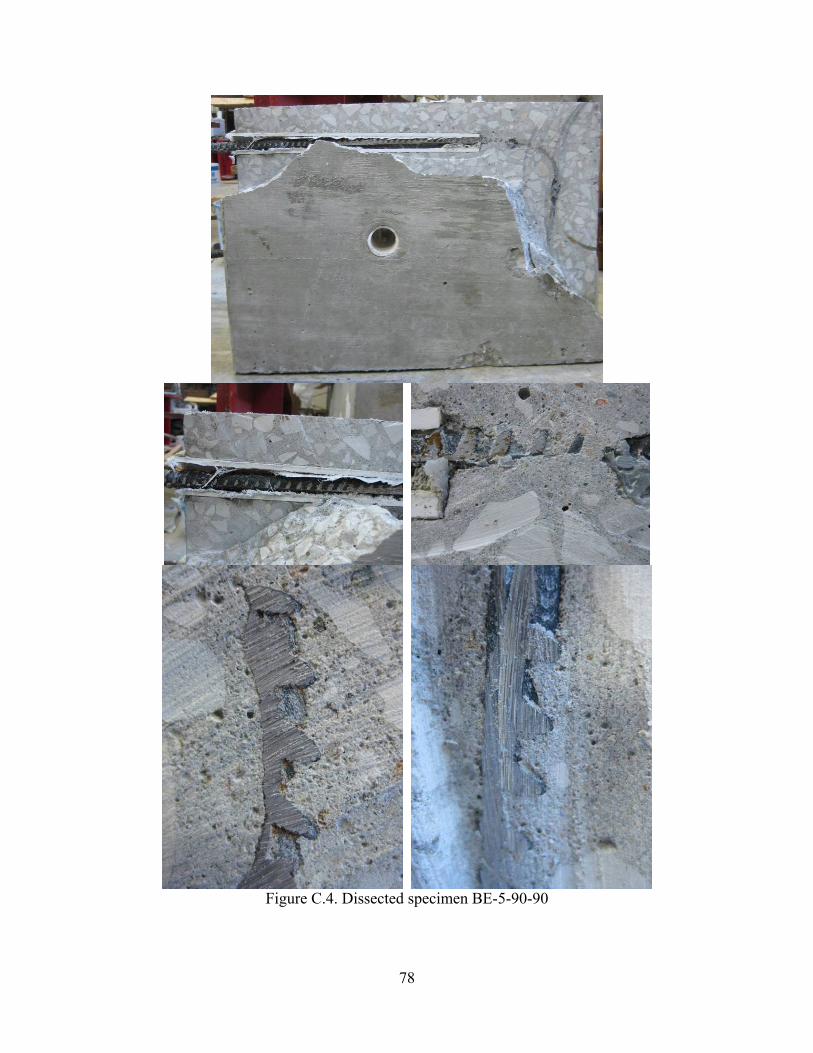
78
Figure C.4. Dissected specimen BE-5-90-90

79
Figure C.5. Dissected specimen BE-8-90-90
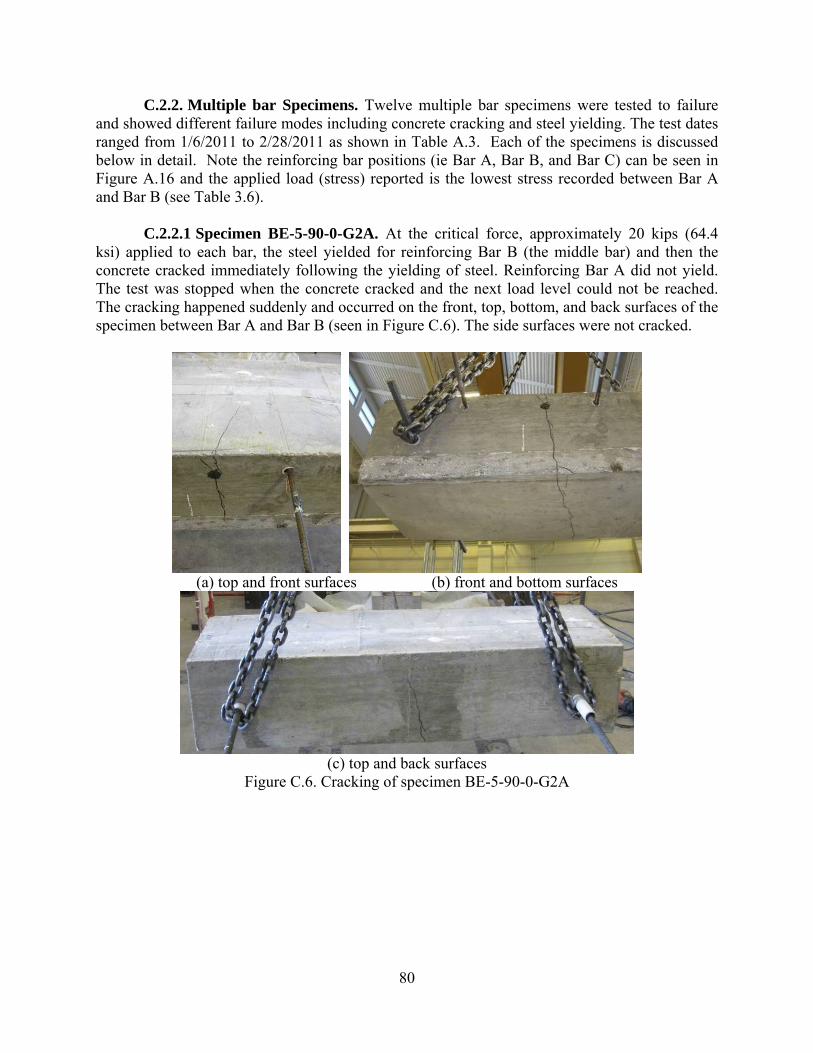
80
C.2.2. Multiple bar Specimens. Twelve multiple bar specimens were tested to failure and showed different failure modes including concrete cracking and steel yielding. The test dates ranged from 1/6/2011 to 2/28/2011 as shown in Table A.3. Each of the specimens is discussed below in detail. Note the reinforcing bar positions (ie Bar A, Bar B, and Bar C) can be seen in Figure A.16 and the applied load (stress) reported is the lowest stress recorded between Bar A and Bar B (see Table 3.6).
C.2.2.1 Specimen BE-5-90-0-G2A. At the critical force, approximately 20 kips (64.4
ksi) applied to each bar, the steel yielded for reinforcing Bar B (the middle bar) and then the concrete cracked immediately following the yielding of steel. Reinforcing Bar A did not yield. The test was stopped when the concrete cracked and the next load level could not be reached. The cracking happened suddenly and occurred on the front, top, bottom, and back surfaces of the specimen between Bar A and Bar B (seen in Figure C.6). The side surfaces were not cracked.
(a) top and front surfaces (b) front and bottom surfaces
(c) top and back surfaces
Figure C.6. Cracking of specimen BE-5-90-0-G2A
81
C.2.2.2 Specimen BE-5-90-0-GA. The test was stopped due to excess rotation in the setup (the specimen was not seated in the test setup correctly and the setup started to tip in the direction of the applied load). The test was restarted after the specimen was re-seated and the rotation was corrected. After restarting the test, at a critical force of approximately 19.4 kips (62.4 ksi) the next load stage could not be reached therefore the test was terminated. The reinforcing bars yielded; the slip measurements were less than 0.12 inch. By visual inspection, there were no cracks in the concrete.
C.2.2.3 Specimen BE-5-90-0-G0.5A. During testing, a splice at the loaded end of the
bar (for the bar extension as seen in Figure A.14) failed on one of the bars, so the test was stopped. A new splice was attached, and the test was restarted. After restarting the test, at a critical value of 20.4 kips (65.7 ksi) the next load stage could not be reached, and the test was stopped. The reinforcing bars yielded, and the slip measurements were less than 0.12 inch. There were no visible cracks in the concrete after the test was terminated.
C.2.2.4 Specimen BE-5-90-22.5-G2A. At a critical load of approximately 19.2 kips
(61.8 ksi), the next load stage could not be reached and the test was ended. Strain measurements from Bar A, Bar B, and Bar C indicate that the reinforcing bars yielded. Slip measurements for Bar A and Bar B were less than 0.12 inch. By visual inspection, there were no cracks in the concrete.
C.2.2.5 Specimen BE-5-90-22.5-GA. The test was terminated when the next load stage
could not be reached at a force of approximately 18.6 kips (60.1 ksi). Bars A, B, and C modes of failure were yielding because the strain measurements showed yielding behavior, and measured slip of Bar A and Bar B were less than 0.12 inch. There were no visible cracks in the concrete after the test was terminated.
C.2.2.6 Specimen BE-5-90-22.5-G0.5A. At a critical load of approximately 20.9 kips
(67.4 ksi), the next load stage could not be reached and the test was ended. Strain measurements from Bar A, Bar B, and Bar C indicate that the reinforcing bars yielded. Measured slip measurements of Bar A and Bar B were less than 0.12 inch. There were no cracks found by visual inspection on the specimen after the test was terminated.
C.2.2.7 Specimen BE-8-90-0-G2A. At approximately 50.4 kips (63.8 ksi), the specimen started cracking and continued internally (into the next load stage or after the two minute alloted time was up). The load was kept constant (for stabilization) until Bar C ruptured (at the 2H location, see Figure A.17). There was a sudden and explosive external cracking of the concrete. The cracking was observed on the front, top, and back surfaces of the concrete starting at Bar C and extending at a 45 degree angle around the back of the specimen (seen in Figure C.7). The angle of cracking followed the orientation of the hook of the reinforcing bar.
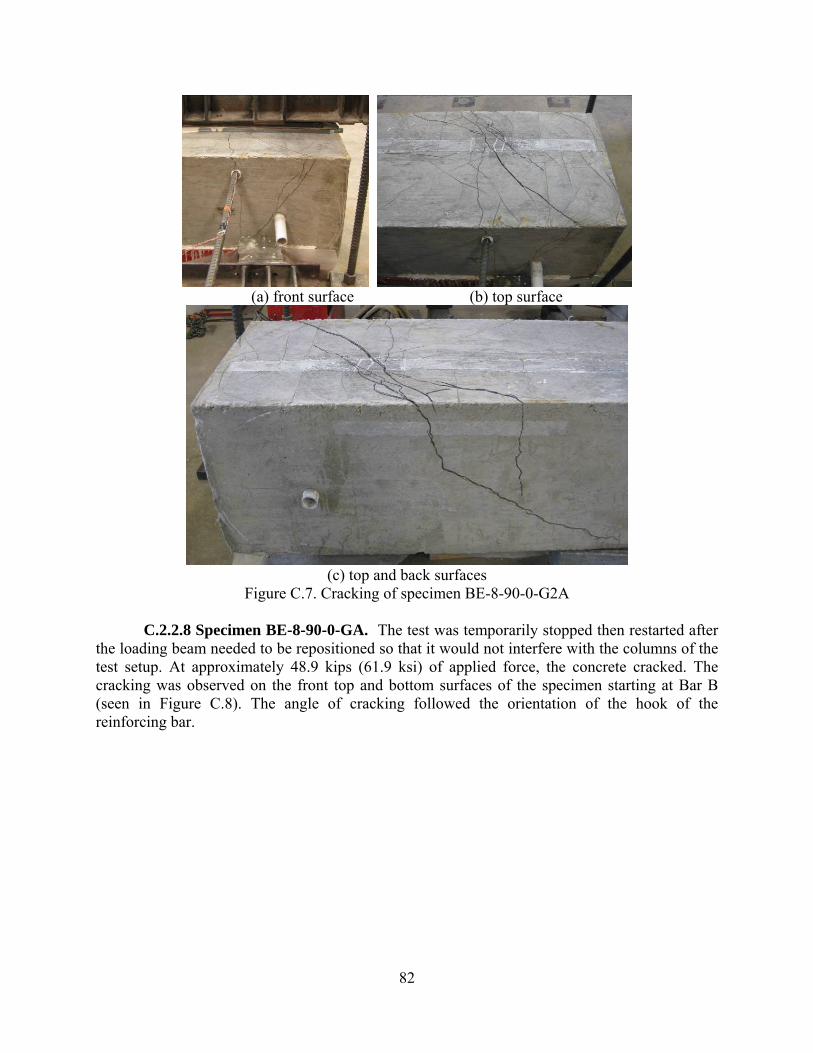
82
(a) front surface (b) top surface
(c) top and back surfaces
Figure C.7. Cracking of specimen BE-8-90-0-G2A C.2.2.8 Specimen BE-8-90-0-GA. The test was temporarily stopped then restarted after
the loading beam needed to be repositioned so that it would not interfere with the columns of the test setup. At approximately 48.9 kips (61.9 ksi) of applied force, the concrete cracked. The cracking was observed on the front top and bottom surfaces of the specimen starting at Bar B (seen in Figure C.8). The angle of cracking followed the orientation of the hook of the reinforcing bar.
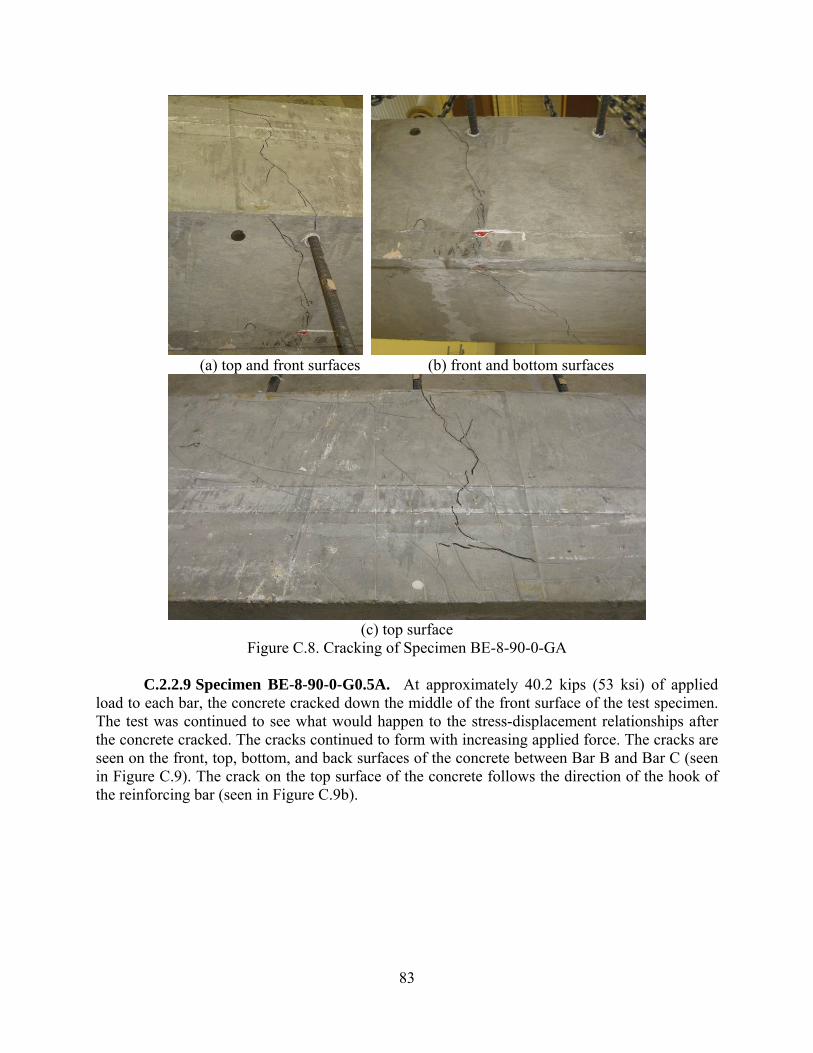
83
(a) top and front surfaces (b) front and bottom surfaces
(c) top surface
Figure C.8. Cracking of Specimen BE-8-90-0-GA C.2.2.9 Specimen BE-8-90-0-G0.5A. At approximately 40.2 kips (53 ksi) of applied
load to each bar, the concrete cracked down the middle of the front surface of the test specimen. The test was continued to see what would happen to the stress-displacement relationships after the concrete cracked. The cracks continued to form with increasing applied force. The cracks are seen on the front, top, bottom, and back surfaces of the concrete between Bar B and Bar C (seen in Figure C.9). The crack on the top surface of the concrete follows the direction of the hook of the reinforcing bar (seen in Figure C.9b).

84
(a) top and front (b) top
(c) front and bottom (d) back and bottom
Figure C.9. Cracking of Specimen BE-8-90-0-G0.5A
C.2.2.10 Specimen BE-8-90-22.5-G2A. The concrete cracked at an applied force of approximately 26.5 kips (33.5 ksi), which was relatively low compared to the other multiple bar specimens. The test was continued to see how the cracks progressed after the initial crack. The cracking on the top and bottom surfaces of the concrete starting at Bar B and followed parallel to the orientation of the hook bend of the reinforcing bar (seen in Figure C.10). As the test was continued, the crack on the front surface widened.

85
(a) top and front surfaces (b) top surface
(c) top and front surfaces (d) front and bottom surfaces
Figure C.10. Cracking of Specimen BE-8-90-22.5-G2A
C.2.2.11 Specimen BE-8-90-22.5-GA. The test was temporarily stopped because one of the support blocks broke from the test setup. The block was replaced, the specimen was re-seated, and the test was restarted. At approximately 50.0 kips (63.3 ksi), the test was terminated because the next load stage could not be reached. Reinforcing Bar A, B, and C yielded per strain measurement, and slip measurements were less than 0.12 inch. There were no cracks found by visual inspection on the specimen after the test was concluded.
C.2.2.12 Specimen BE-8-90-22.5-G0.5A. At approximately 49.7 kips (62.9 ksi), the test
was terminated because the next load stage could not be reached. Strain measurements indicated that Bars A, B, and C yielded, yet slip measurements of Bars A and B were more than 0.12 inch. which indicates slip was a controlling factor. By visual inspection, there were no cracks found after the test ended.

86
C.3. STRESS-DISPLACEMENT BEHAVIOR
Research shows that the lead end, or loaded end, and the bend of the reinforcing bar encounters the most slip compared to the tail end of the reinforcing hook (Minor 1971, Minor and Jirsa 1975, Ehsani et al. 1995). Stated in Appendix A.4.3 and shown in Figure A.17 (1H position), a DCVT was attached to the loaded end of the reinforcing bar, and the lead displacement was measured at the face of the concrete. The data from the DCVT readings were reduced, and graphs showing stress-displacement relationships were produced to examine the test results. The total slip of the lead end of the bar (the unbonded portion) consisted of the slip of the bar with respect to the surrounding concrete and the elongation of the bar, δ, shown in Equation C.1. The lead length was determined for each of the specimens and was used to calculate the elongation of the reinforcing bar. The lead length for all BE-5-180, BE-5-90, and BE-8-90 specimens was 12 inches, 17 inches, and 23 inches, respectfully. The elongation of the bar was calculated by Equation C.2, where δ is the elongation, σ is the measured force divided by the reinforcing bar’s nominal area (limited by the yield stress fy), L is the lead length, and E is the modulus of elasticity (assumed 29,000 ksi for steel). The measured slip values were corrected for elongation of the reinforcing bar.
δ+= SlipSlipTotal (C.1) EL /σδ = Note for σ ≤ fy (C.2)
Figures C.11 to C.22 are the stress-displacement relationships for the single bar specimens, and Figures C.23 to C.34 are the stress-displacement relationships for the multiple bar specimens. Most of the specimens have a large initial stiffness and this indicates that the force at first is carried by the bonded area near the lead end similar to Minor’s study (1971). In most cases, the shape of the stress-displacement graphs gives an indication of the failure mode. A linear relationship followed by a plateau where there is a large increase in displacement with little increase in stress is usually indicative of yielding of the steel reinforcement. In Figures C.23, C.29, C.31, and C.32 the cause of the drop in the curve was associated with concrete cracking at an applied load as discussed in Section 2.2. The stress-displacement relationships are similar among the bars of the multiple bar specimens. An exception is shown in Figure C.23 and can be contributed to a malfunction of one of the DCVTs.
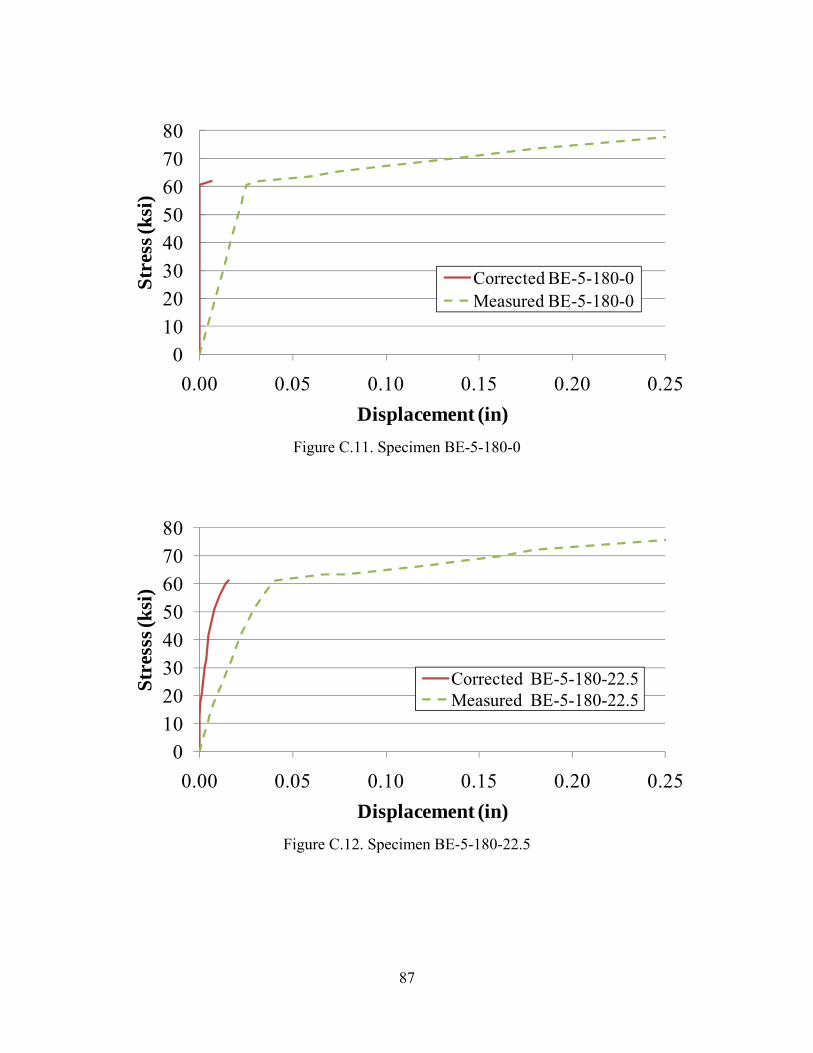
87
01020304050607080
0.00 0.05 0.10 0.15 0.20 0.25
Str
ess
(ksi
)
Displacement (in)
Corrected BE-5-180-0Measured BE-5-180-0
Figure C.11. Specimen BE-5-180-0
01020304050607080
0.00 0.05 0.10 0.15 0.20 0.25
Stre
sss
(ksi
)
Displacement (in)
Corrected BE-5-180-22.5Measured BE-5-180-22.5
Figure C.12. Specimen BE-5-180-22.5
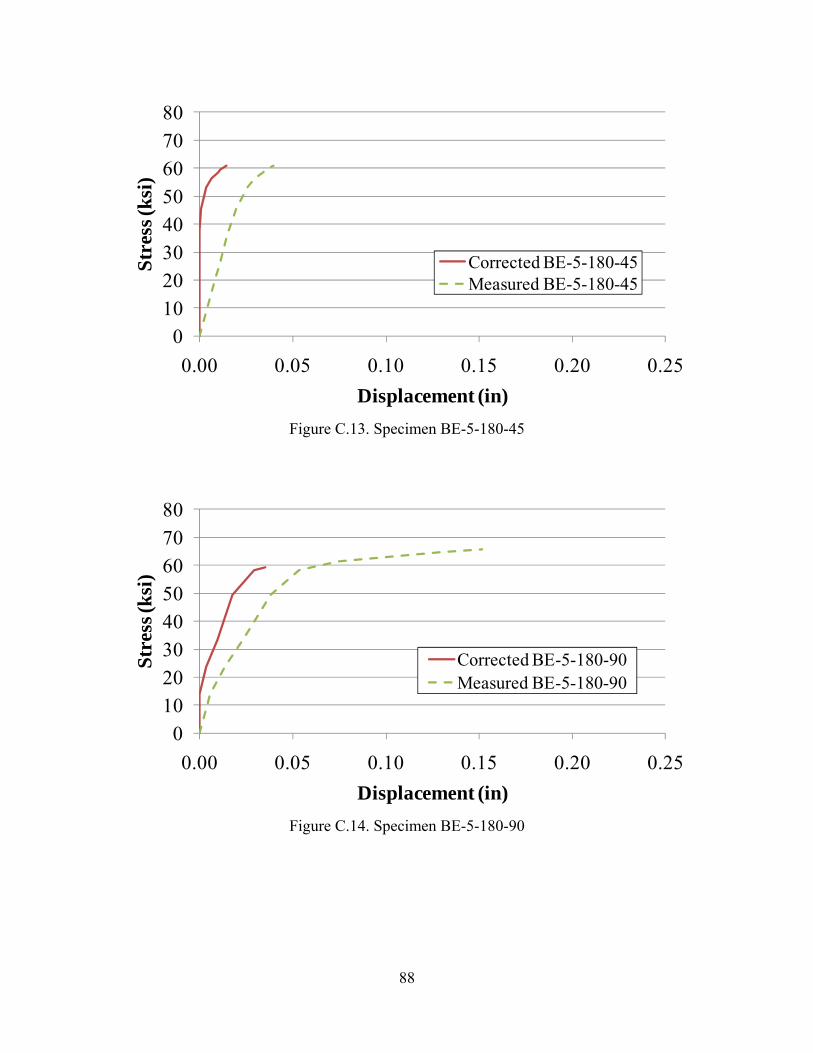
88
01020304050607080
0.00 0.05 0.10 0.15 0.20 0.25
Str
ess
(ksi
)
Displacement (in)
Corrected BE-5-180-45Measured BE-5-180-45
Figure C.13. Specimen BE-5-180-45
01020304050607080
0.00 0.05 0.10 0.15 0.20 0.25
Stre
ss (k
si)
Displacement (in)
Corrected BE-5-180-90Measured BE-5-180-90
Figure C.14. Specimen BE-5-180-90
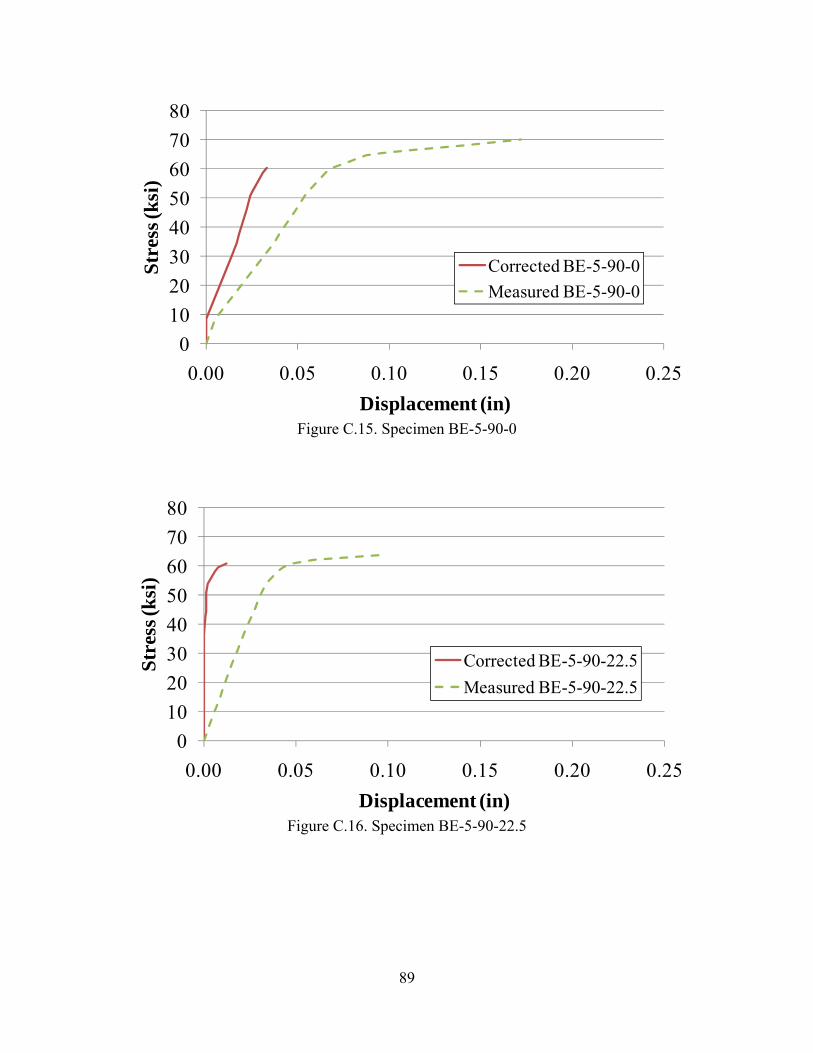
89
01020304050607080
0.00 0.05 0.10 0.15 0.20 0.25
Str
ess
(ksi
)
Displacement (in)
Corrected BE-5-90-0Measured BE-5-90-0
Figure C.15. Specimen BE-5-90-0
01020304050607080
0.00 0.05 0.10 0.15 0.20 0.25
Str
ess
(ksi
)
Displacement (in)
Corrected BE-5-90-22.5Measured BE-5-90-22.5
Figure C.16. Specimen BE-5-90-22.5

90
01020304050607080
0.00 0.05 0.10 0.15 0.20 0.25
Str
ess
(ksi
)
Displacement (in)
Corrected BE-5-90-45Measured BE-5-90-45
Figure C.17. Specimen BE-5-90-45
01020304050607080
0.00 0.05 0.10 0.15 0.20 0.25
Stre
ss (k
si)
Displacement (in)
Corrected BE-5-90-90Measured BE-5-90-90
Figure C.18. Specimen BE-5-90-90
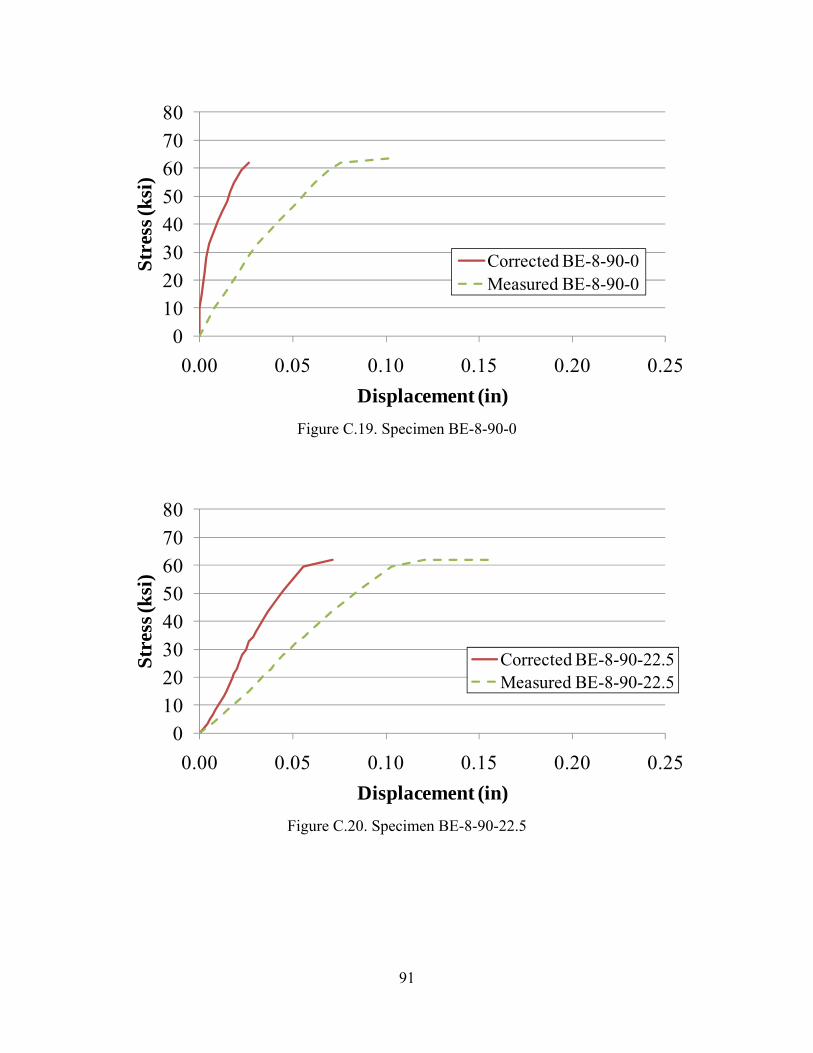
91
01020304050607080
0.00 0.05 0.10 0.15 0.20 0.25
Str
ess
(ksi
)
Displacement (in)
Corrected BE-8-90-0Measured BE-8-90-0
Figure C.19. Specimen BE-8-90-0
01020304050607080
0.00 0.05 0.10 0.15 0.20 0.25
Stre
ss (k
si)
Displacement (in)
Corrected BE-8-90-22.5Measured BE-8-90-22.5
Figure C.20. Specimen BE-8-90-22.5
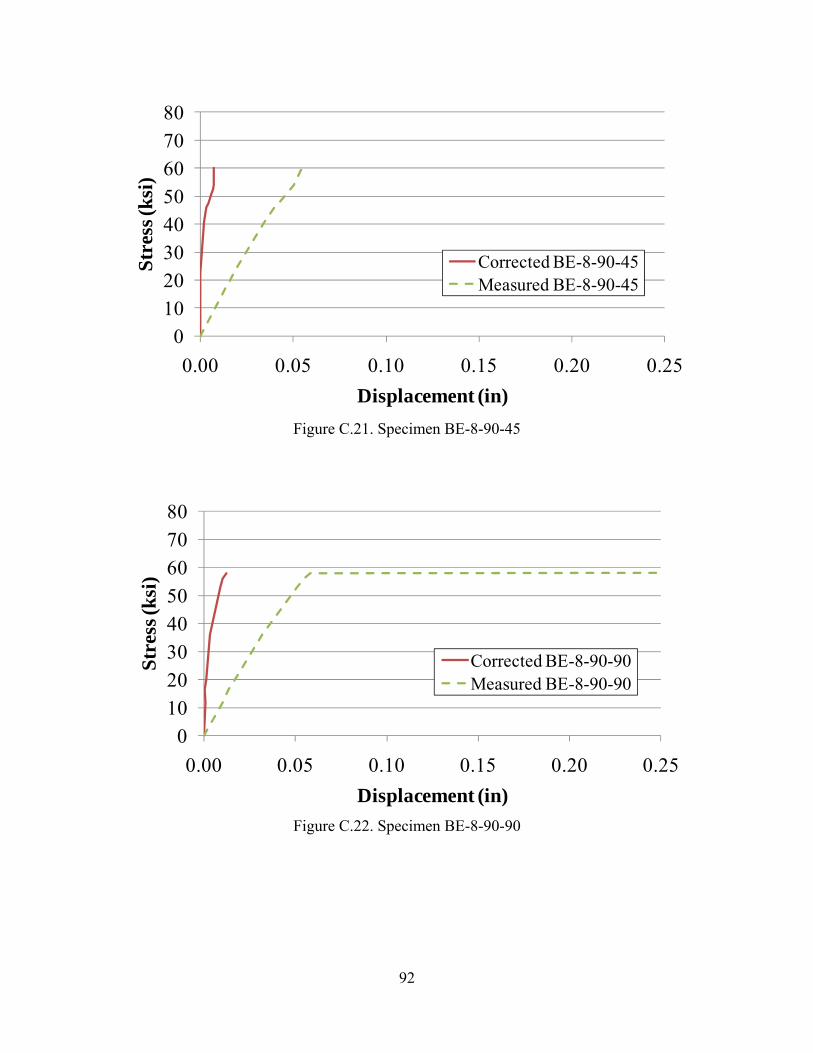
92
01020304050607080
0.00 0.05 0.10 0.15 0.20 0.25
Str
ess
(ksi
)
Displacement (in)
Corrected BE-8-90-45Measured BE-8-90-45
Figure C.21. Specimen BE-8-90-45
01020304050607080
0.00 0.05 0.10 0.15 0.20 0.25
Str
ess
(ksi
)
Displacement (in)
Corrected BE-8-90-90Measured BE-8-90-90
Figure C.22. Specimen BE-8-90-90

93
01020304050607080
0.00 0.05 0.10 0.15 0.20 0.25
Str
ess (
ksi)
Displacement (in)
Corrected BE-5-90-0-2A_Bar AMeasured BE-5-90-0-2A_Bar A
(a) Bar A
01020304050607080
0.00 0.05 0.10 0.15 0.20 0.25
Str
ess (
ksi)
Displacement (in)
Corrected BE-5-90-0-2A_Bar BMeasured BE-5-90-0-2A_Bar B
(b) Bar B
Figure C.23. Specimen BE-5-90-0-G2A
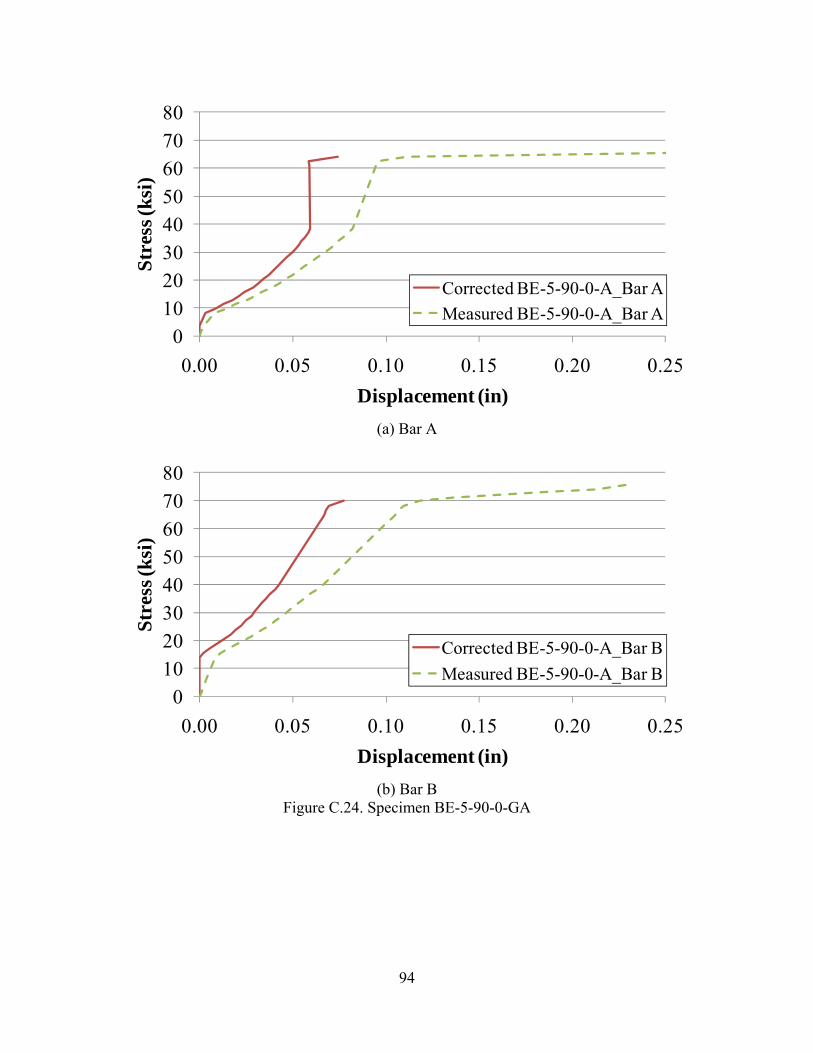
94
01020304050607080
0.00 0.05 0.10 0.15 0.20 0.25
Str
ess
(ksi
)
Displacement (in)
Corrected BE-5-90-0-A_Bar AMeasured BE-5-90-0-A_Bar A
(a) Bar A
01020304050607080
0.00 0.05 0.10 0.15 0.20 0.25
Stre
ss (k
si)
Displacement (in)
Corrected BE-5-90-0-A_Bar BMeasured BE-5-90-0-A_Bar B
(b) Bar B
Figure C.24. Specimen BE-5-90-0-GA
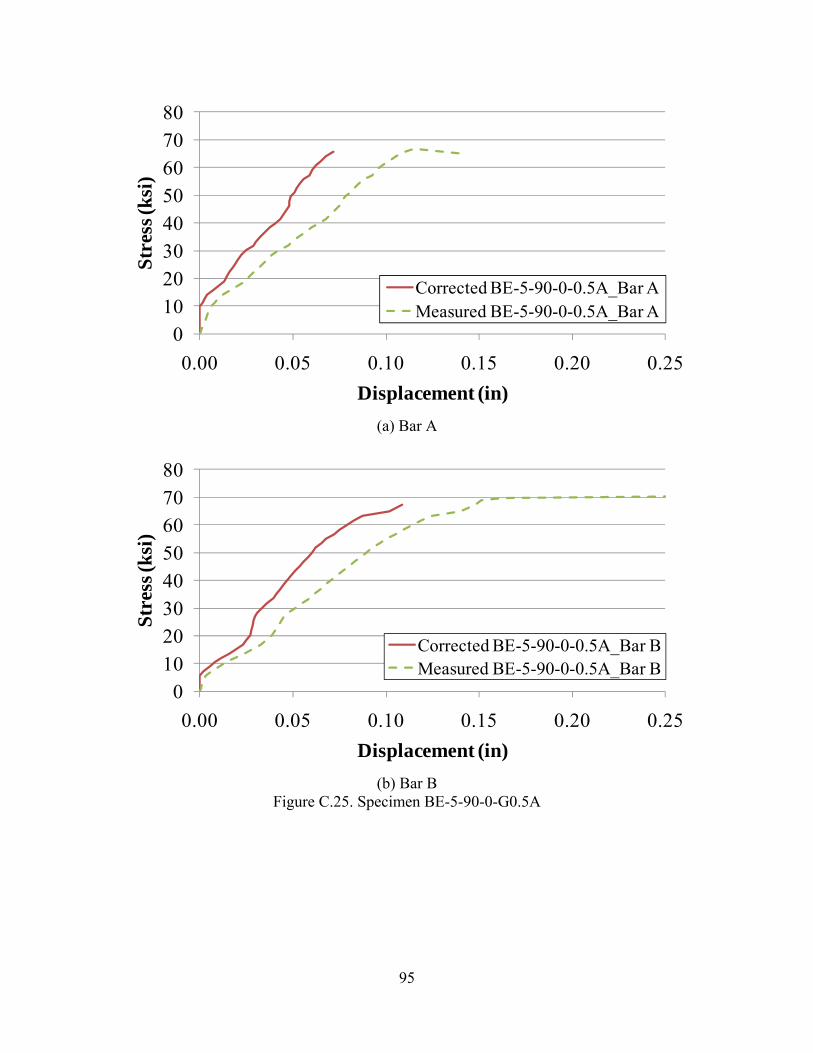
95
01020304050607080
0.00 0.05 0.10 0.15 0.20 0.25
Str
ess (
ksi)
Displacement (in)
Corrected BE-5-90-0-0.5A_Bar AMeasured BE-5-90-0-0.5A_Bar A
(a) Bar A
01020304050607080
0.00 0.05 0.10 0.15 0.20 0.25
Str
ess (
ksi)
Displacement (in)
Corrected BE-5-90-0-0.5A_Bar BMeasured BE-5-90-0-0.5A_Bar B
(b) Bar B
Figure C.25. Specimen BE-5-90-0-G0.5A
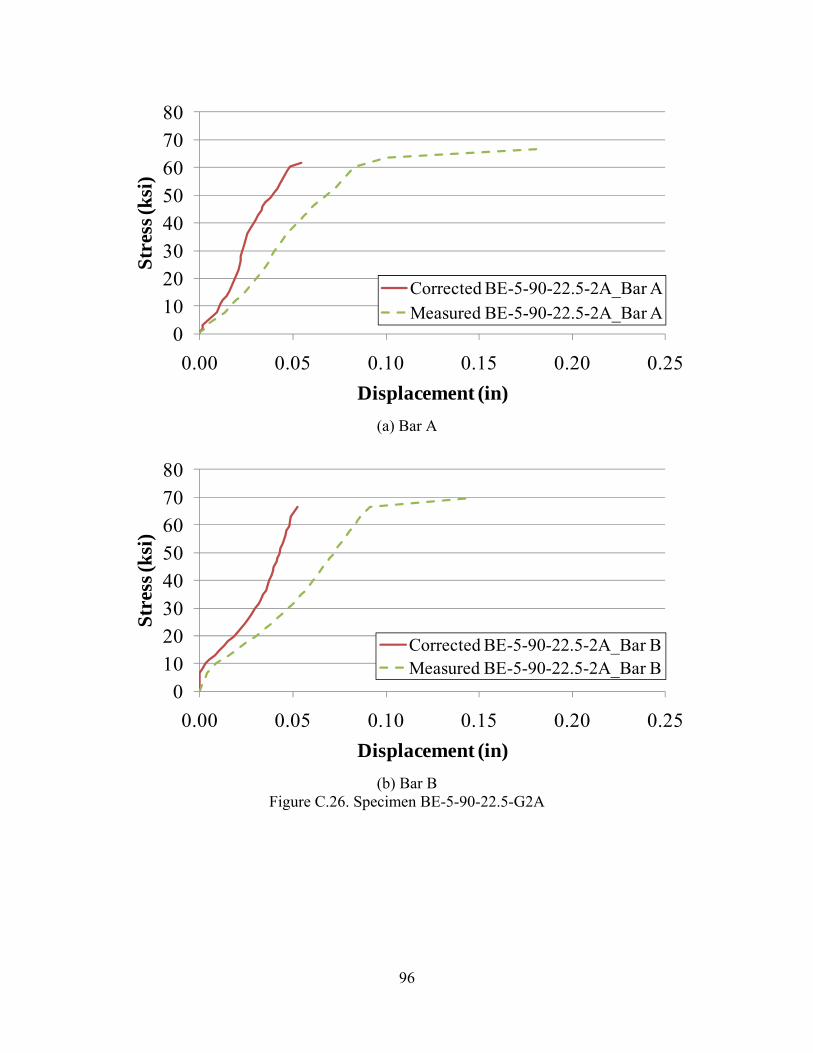
96
01020304050607080
0.00 0.05 0.10 0.15 0.20 0.25
Str
ess (
ksi)
Displacement (in)
Corrected BE-5-90-22.5-2A_Bar AMeasured BE-5-90-22.5-2A_Bar A
(a) Bar A
01020304050607080
0.00 0.05 0.10 0.15 0.20 0.25
Str
ess (
ksi)
Displacement (in)
Corrected BE-5-90-22.5-2A_Bar BMeasured BE-5-90-22.5-2A_Bar B
(b) Bar B
Figure C.26. Specimen BE-5-90-22.5-G2A
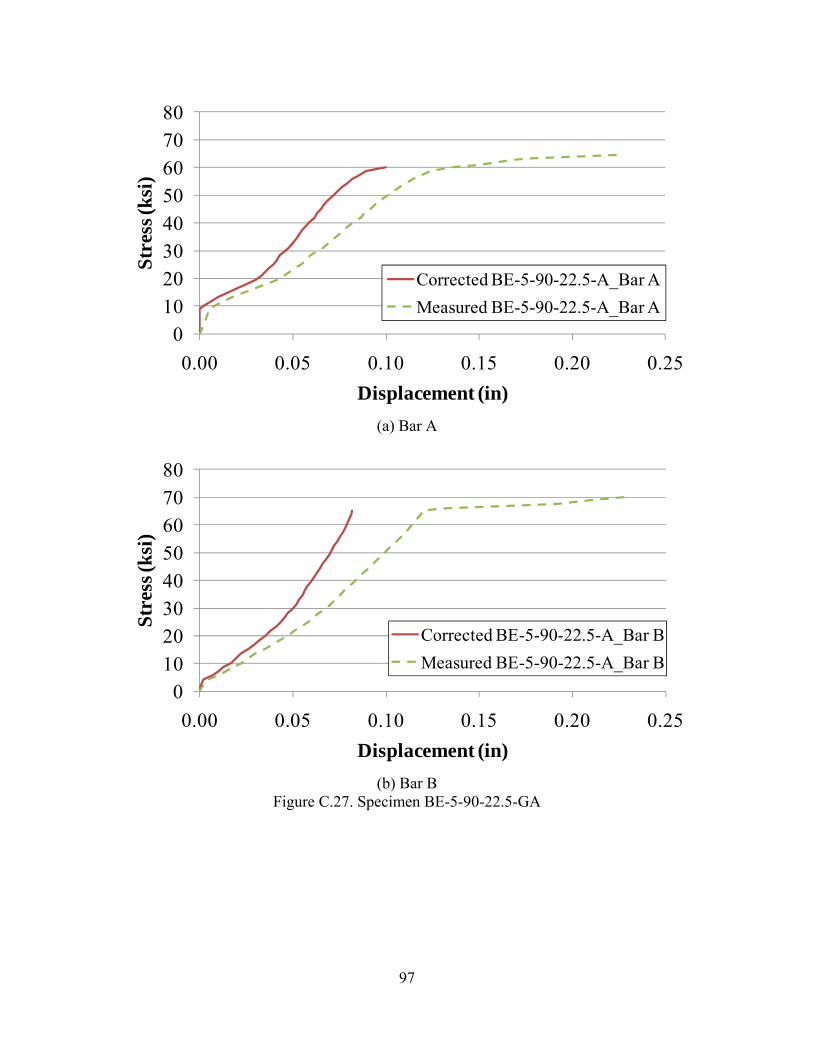
97
01020304050607080
0.00 0.05 0.10 0.15 0.20 0.25
Str
ess (
ksi)
Displacement (in)
Corrected BE-5-90-22.5-A_Bar AMeasured BE-5-90-22.5-A_Bar A
(a) Bar A
01020304050607080
0.00 0.05 0.10 0.15 0.20 0.25
Str
ess (
ksi)
Displacement (in)
Corrected BE-5-90-22.5-A_Bar BMeasured BE-5-90-22.5-A_Bar B
(b) Bar B
Figure C.27. Specimen BE-5-90-22.5-GA

98
01020304050607080
0.00 0.05 0.10 0.15 0.20 0.25
Str
ess (
ksi)
Displacement (in)
Corrected BE-5-90-22.5-0.5A_Bar AMeasured BE-5-90-22.5-0.5A_Bar A
(a) Bar A
01020304050607080
0.00 0.05 0.10 0.15 0.20 0.25
Str
ess (
ksi)
Displacement (in)
Corrected BE-5-90-22.5-0.5A_Bar BMeasured BE-5-90-22.5-0.5A_Bar B
(b) Bar B
Figure C.28. Specimen BE-5-90-22.5-G0.5A
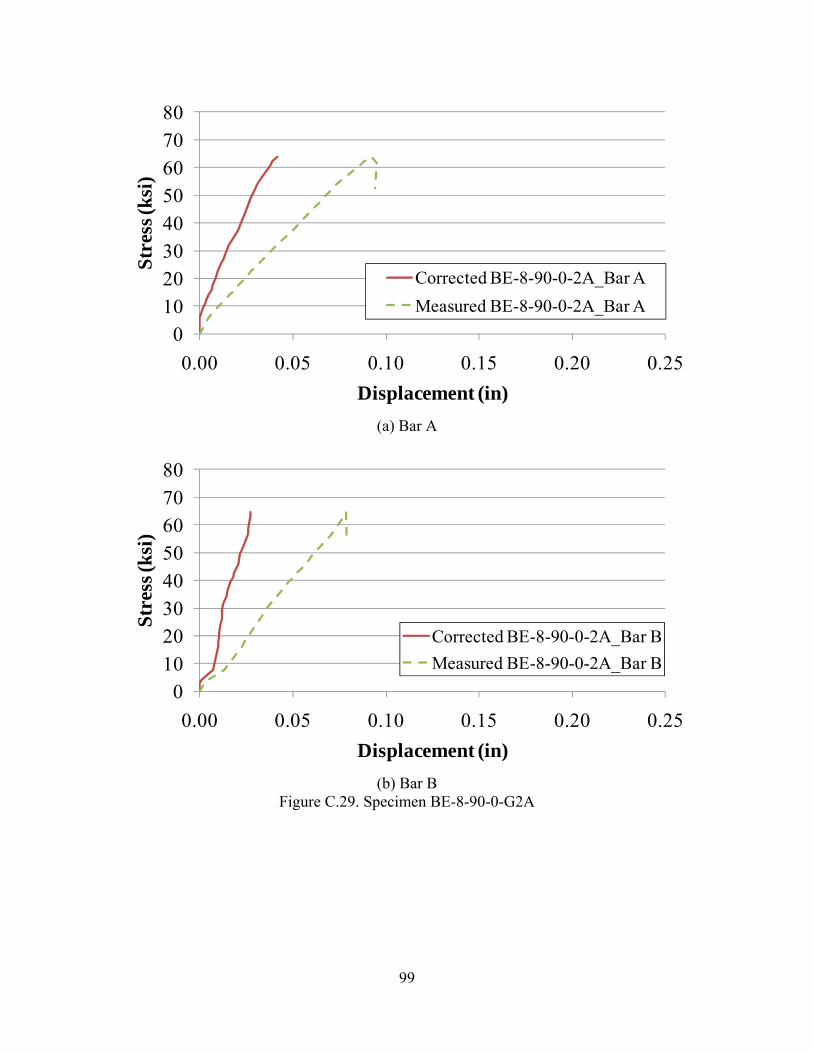
99
01020304050607080
0.00 0.05 0.10 0.15 0.20 0.25
Str
ess (
ksi)
Displacement (in)
Corrected BE-8-90-0-2A_Bar AMeasured BE-8-90-0-2A_Bar A
(a) Bar A
01020304050607080
0.00 0.05 0.10 0.15 0.20 0.25
Str
ess (
ksi)
Displacement (in)
Corrected BE-8-90-0-2A_Bar BMeasured BE-8-90-0-2A_Bar B
(b) Bar B
Figure C.29. Specimen BE-8-90-0-G2A

100
01020304050607080
0.00 0.05 0.10 0.15 0.20 0.25
Str
ess
(ksi
)
Displacement (in)
Corrected BE-8-90-0-A_Bar AMeasured BE-8-90-0-A_Bar A
(a) Bar A
01020304050607080
0 0.05 0.1 0.15 0.2 0.25
Stre
ss (k
si)
Displacement (in)
Corrected BE-8-90-0-A_Bar BMeasured BE-8-90-0-A_Bar B
(b) Bar B
Figure C.30. Specimen BE-8-90-0-GA
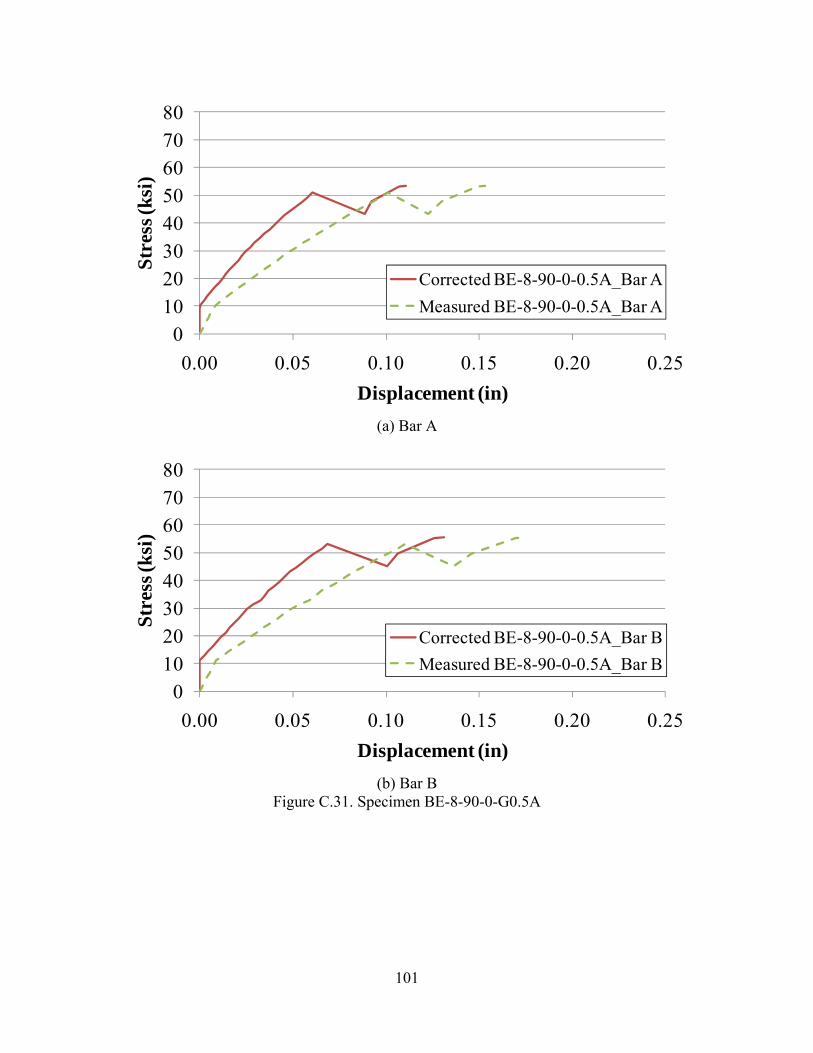
101
01020304050607080
0.00 0.05 0.10 0.15 0.20 0.25
Str
ess (
ksi)
Displacement (in)
Corrected BE-8-90-0-0.5A_Bar AMeasured BE-8-90-0-0.5A_Bar A
(a) Bar A
01020304050607080
0.00 0.05 0.10 0.15 0.20 0.25
Str
ess (
ksi)
Displacement (in)
Corrected BE-8-90-0-0.5A_Bar BMeasured BE-8-90-0-0.5A_Bar B
(b) Bar B
Figure C.31. Specimen BE-8-90-0-G0.5A
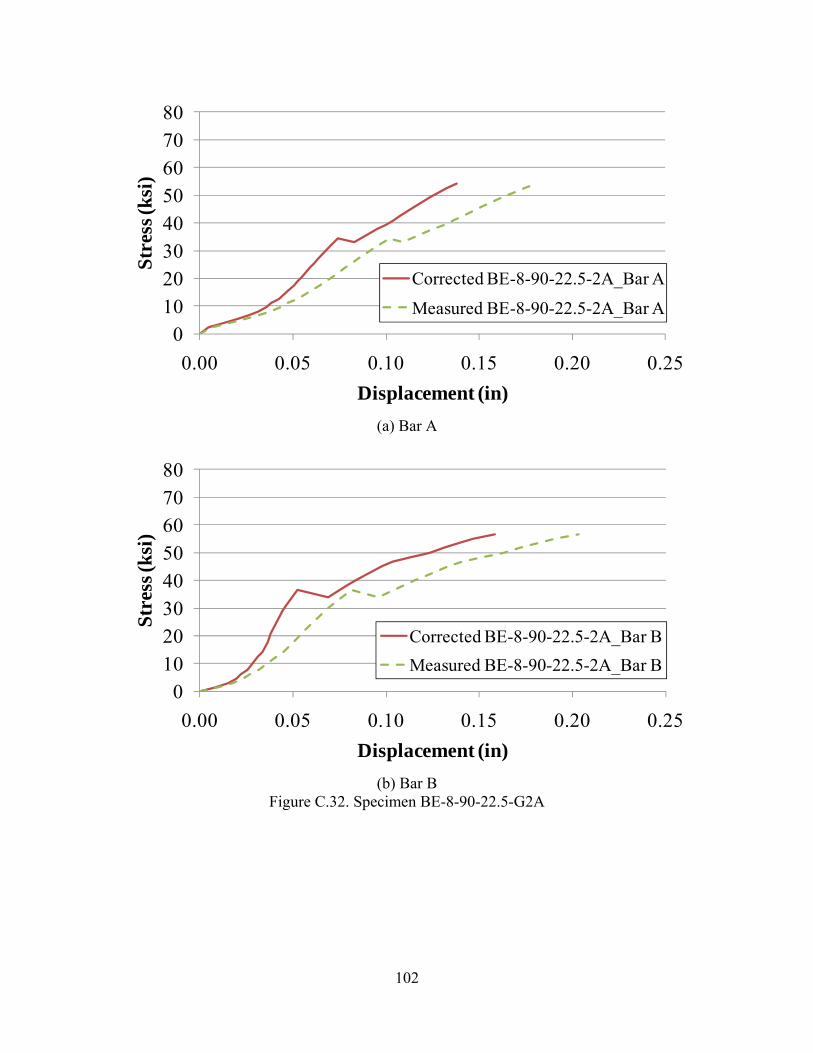
102
01020304050607080
0.00 0.05 0.10 0.15 0.20 0.25
Str
ess (
ksi)
Displacement (in)
Corrected BE-8-90-22.5-2A_Bar A
Measured BE-8-90-22.5-2A_Bar A
(a) Bar A
01020304050607080
0.00 0.05 0.10 0.15 0.20 0.25
Str
ess (
ksi)
Displacement (in)
Corrected BE-8-90-22.5-2A_Bar BMeasured BE-8-90-22.5-2A_Bar B
(b) Bar B
Figure C.32. Specimen BE-8-90-22.5-G2A
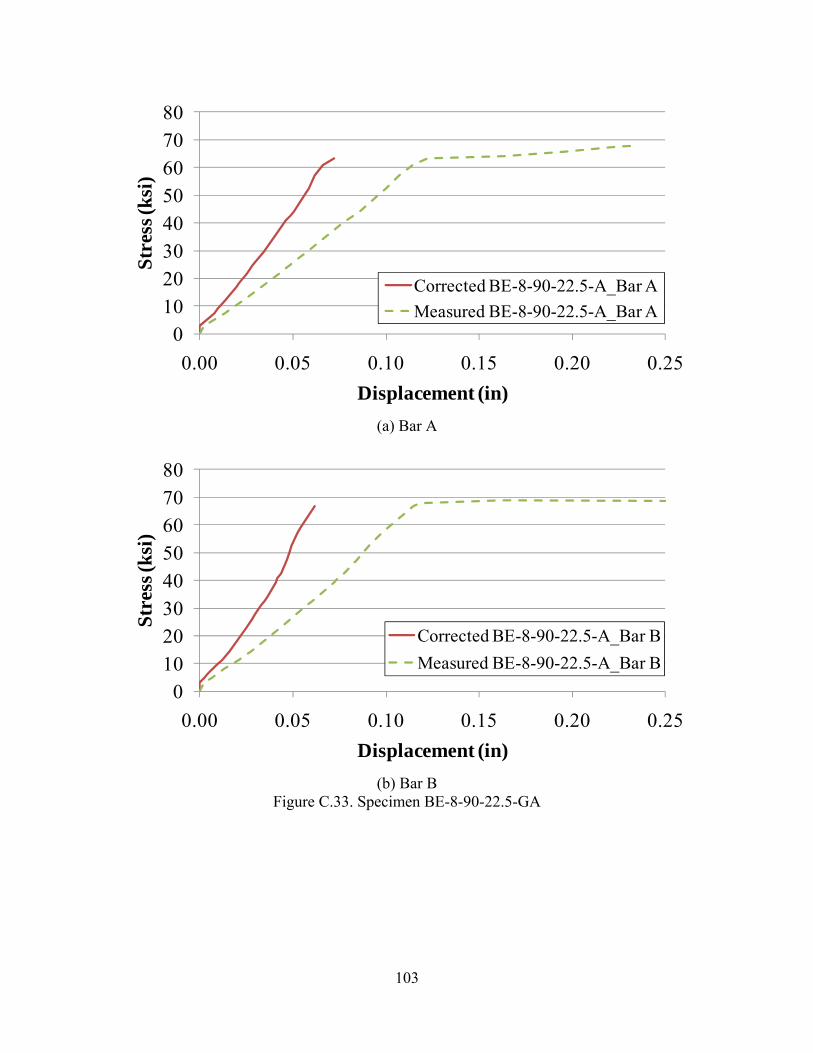
103
01020304050607080
0.00 0.05 0.10 0.15 0.20 0.25
Str
ess (
ksi)
Displacement (in)
Corrected BE-8-90-22.5-A_Bar AMeasured BE-8-90-22.5-A_Bar A
(a) Bar A
01020304050607080
0.00 0.05 0.10 0.15 0.20 0.25
Str
ess (
ksi)
Displacement (in)
Corrected BE-8-90-22.5-A_Bar BMeasured BE-8-90-22.5-A_Bar B
(b) Bar B
Figure C.33. Specimen BE-8-90-22.5-GA
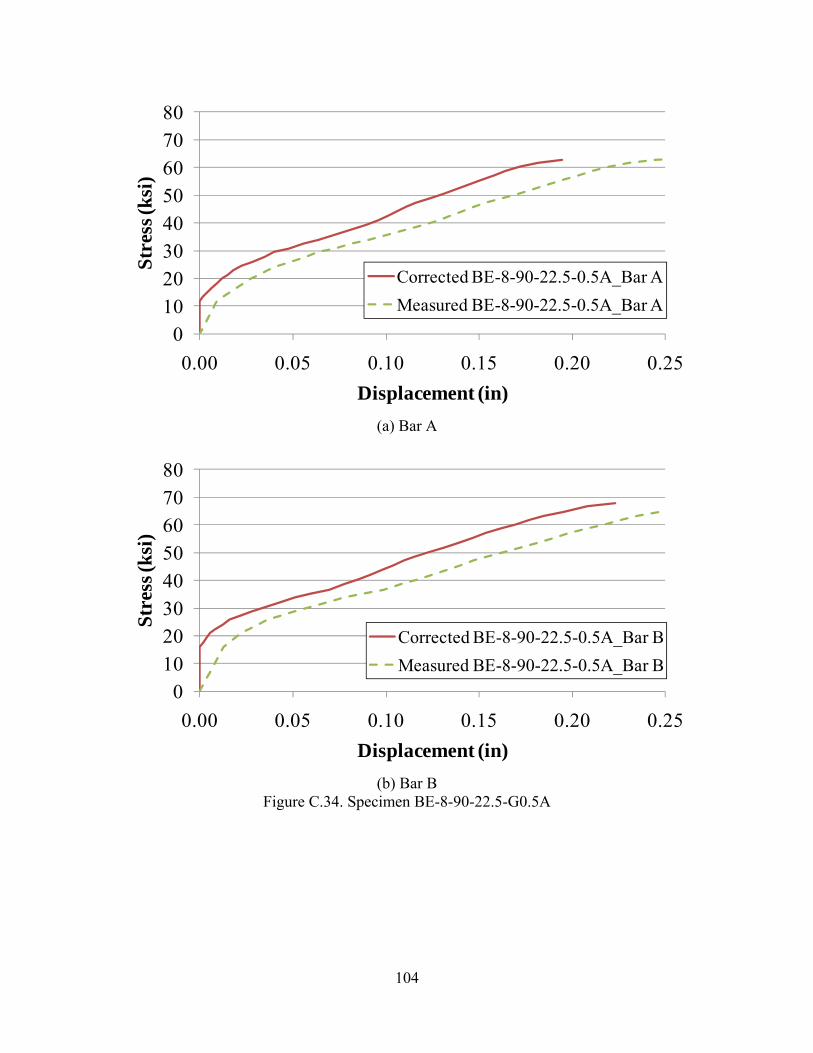
104
01020304050607080
0.00 0.05 0.10 0.15 0.20 0.25
Str
ess (
ksi)
Displacement (in)
Corrected BE-8-90-22.5-0.5A_Bar AMeasured BE-8-90-22.5-0.5A_Bar A
(a) Bar A
01020304050607080
0.00 0.05 0.10 0.15 0.20 0.25
Str
ess (
ksi)
Displacement (in)
Corrected BE-8-90-22.5-0.5A_Bar BMeasured BE-8-90-22.5-0.5A_Bar B
(b) Bar B
Figure C.34. Specimen BE-8-90-22.5-G0.5A
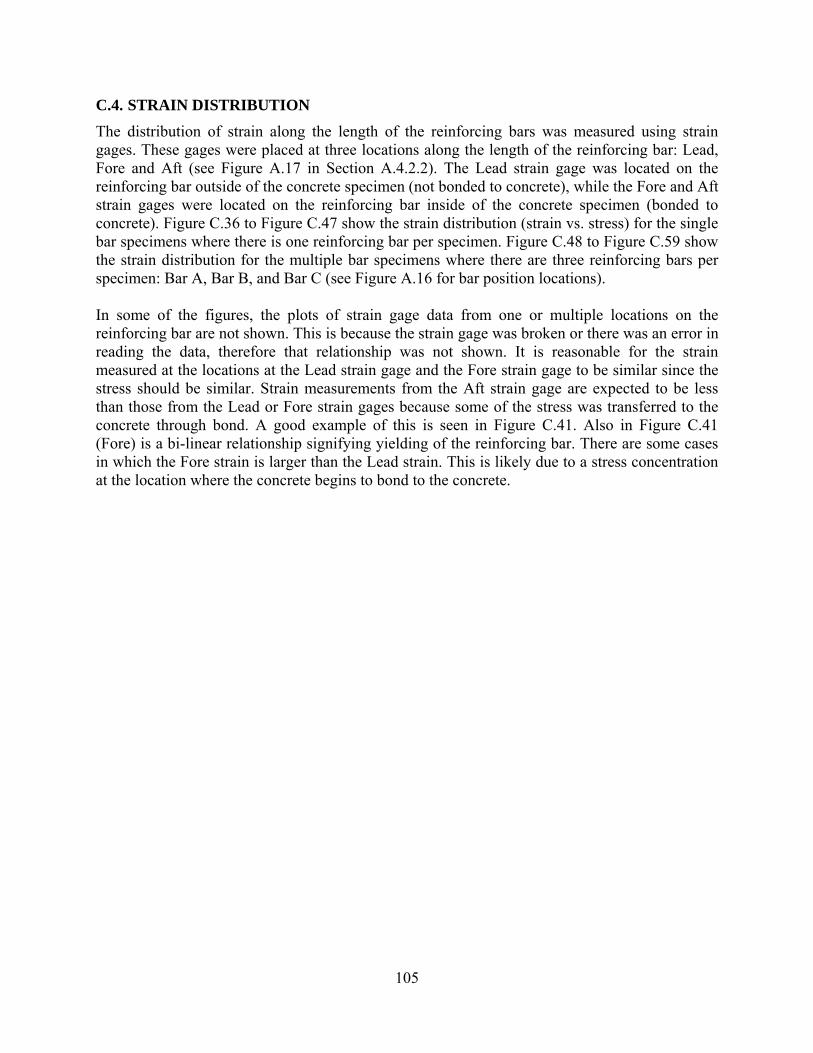
105
C.4. STRAIN DISTRIBUTION
The distribution of strain along the length of the reinforcing bars was measured using strain gages. These gages were placed at three locations along the length of the reinforcing bar: Lead, Fore and Aft (see Figure A.17 in Section A.4.2.2). The Lead strain gage was located on the reinforcing bar outside of the concrete specimen (not bonded to concrete), while the Fore and Aft strain gages were located on the reinforcing bar inside of the concrete specimen (bonded to concrete). Figure C.36 to Figure C.47 show the strain distribution (strain vs. stress) for the single bar specimens where there is one reinforcing bar per specimen. Figure C.48 to Figure C.59 show the strain distribution for the multiple bar specimens where there are three reinforcing bars per specimen: Bar A, Bar B, and Bar C (see Figure A.16 for bar position locations). In some of the figures, the plots of strain gage data from one or multiple locations on the reinforcing bar are not shown. This is because the strain gage was broken or there was an error in reading the data, therefore that relationship was not shown. It is reasonable for the strain measured at the locations at the Lead strain gage and the Fore strain gage to be similar since the stress should be similar. Strain measurements from the Aft strain gage are expected to be less than those from the Lead or Fore strain gages because some of the stress was transferred to the concrete through bond. A good example of this is seen in Figure C.41. Also in Figure C.41 (Fore) is a bi-linear relationship signifying yielding of the reinforcing bar. There are some cases in which the Fore strain is larger than the Lead strain. This is likely due to a stress concentration at the location where the concrete begins to bond to the concrete.
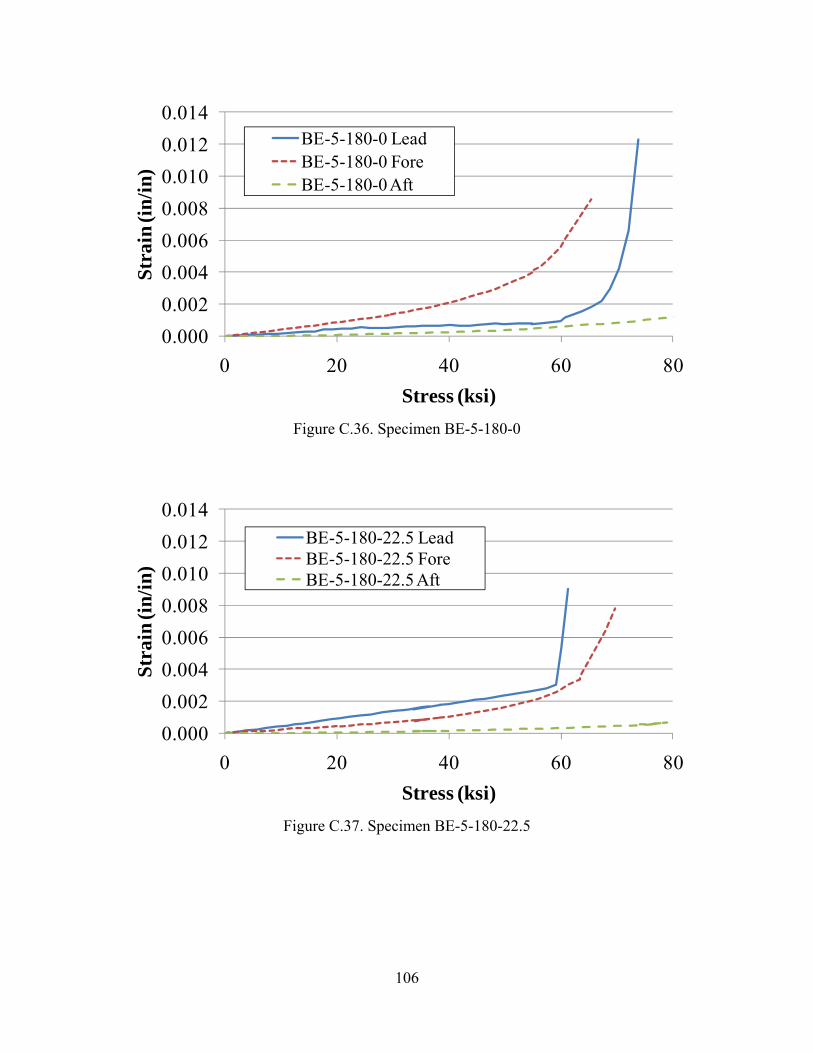
106
0.0000.0020.0040.0060.0080.0100.0120.014
0 20 40 60 80
Stra
in (i
n/i
n)
Stress (ksi)
BE-5-180-0 LeadBE-5-180-0 ForeBE-5-180-0 Aft
Figure C.36. Specimen BE-5-180-0
0.0000.0020.0040.0060.0080.0100.0120.014
0 20 40 60 80
Str
ain
(in
/in)
Stress (ksi)
BE-5-180-22.5 LeadBE-5-180-22.5 ForeBE-5-180-22.5 Aft
Figure C.37. Specimen BE-5-180-22.5
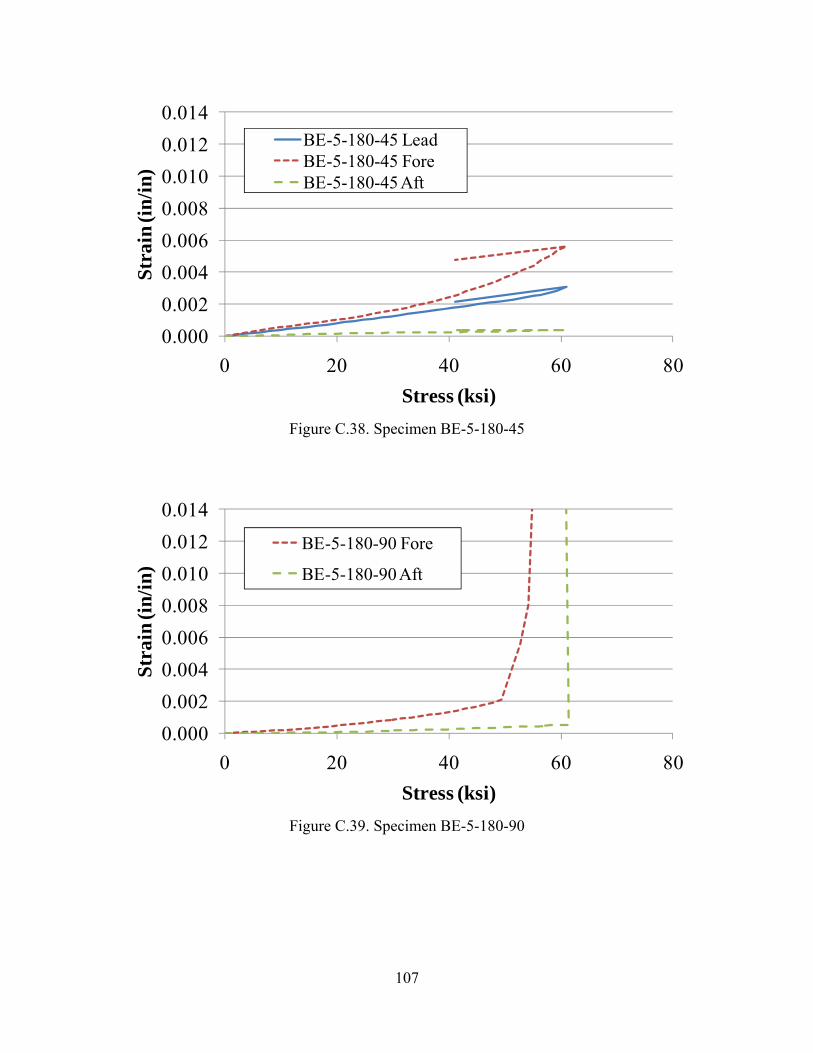
107
0.0000.0020.0040.0060.0080.0100.0120.014
0 20 40 60 80
Stra
in (i
n/i
n)
Stress (ksi)
BE-5-180-45 LeadBE-5-180-45 ForeBE-5-180-45 Aft
Figure C.38. Specimen BE-5-180-45
0.0000.0020.0040.0060.0080.0100.0120.014
0 20 40 60 80
Str
ain
(in
/in)
Stress (ksi)
BE-5-180-90 Fore
BE-5-180-90 Aft
Figure C.39. Specimen BE-5-180-90
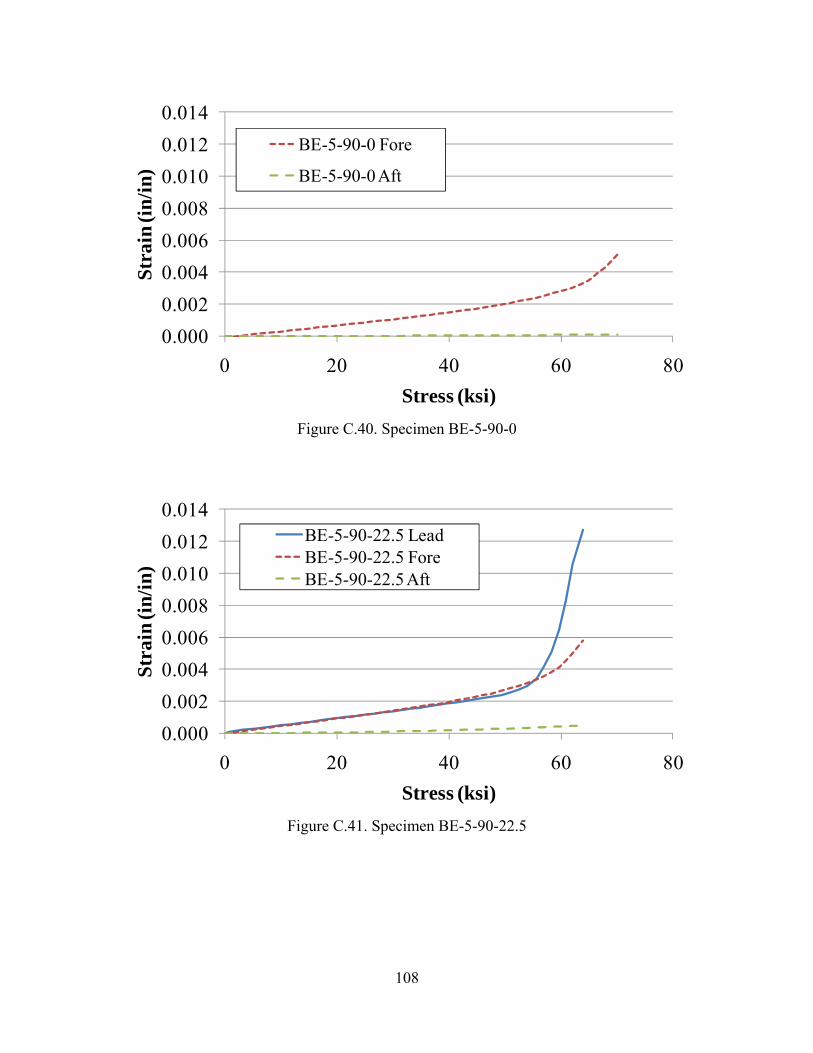
108
0.0000.0020.0040.0060.0080.0100.0120.014
0 20 40 60 80
Stra
in (i
n/i
n)
Stress (ksi)
BE-5-90-0 Fore
BE-5-90-0 Aft
Figure C.40. Specimen BE-5-90-0
0.0000.0020.0040.0060.0080.0100.0120.014
0 20 40 60 80
Str
ain
(in
/in)
Stress (ksi)
BE-5-90-22.5 LeadBE-5-90-22.5 ForeBE-5-90-22.5 Aft
Figure C.41. Specimen BE-5-90-22.5
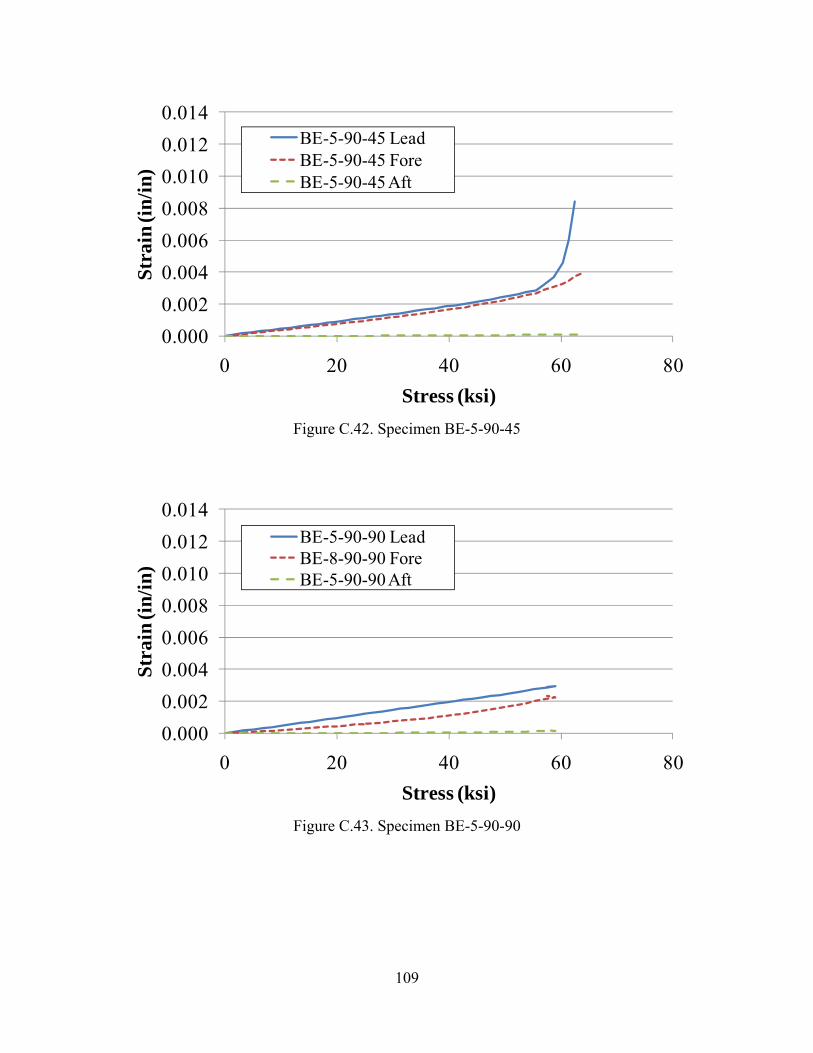
109
0.0000.0020.0040.0060.0080.0100.0120.014
0 20 40 60 80
Stra
in (i
n/i
n)
Stress (ksi)
BE-5-90-45 LeadBE-5-90-45 ForeBE-5-90-45 Aft
Figure C.42. Specimen BE-5-90-45
0.0000.0020.0040.0060.0080.0100.0120.014
0 20 40 60 80
Str
ain
(in
/in)
Stress (ksi)
BE-5-90-90 LeadBE-8-90-90 ForeBE-5-90-90 Aft
Figure C.43. Specimen BE-5-90-90
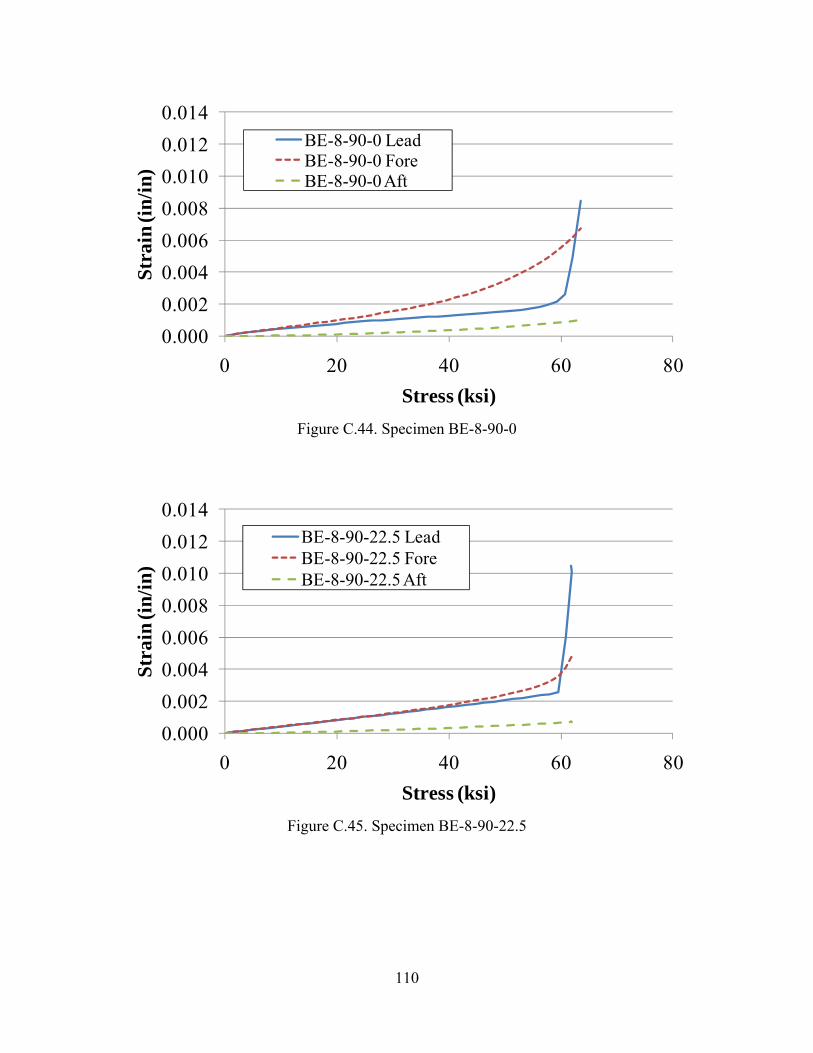
110
0.0000.0020.0040.0060.0080.0100.0120.014
0 20 40 60 80
Stra
in (i
n/i
n)
Stress (ksi)
BE-8-90-0 LeadBE-8-90-0 ForeBE-8-90-0 Aft
Figure C.44. Specimen BE-8-90-0
0.0000.0020.0040.0060.0080.0100.0120.014
0 20 40 60 80
Str
ain
(in
/in)
Stress (ksi)
BE-8-90-22.5 LeadBE-8-90-22.5 ForeBE-8-90-22.5 Aft
Figure C.45. Specimen BE-8-90-22.5
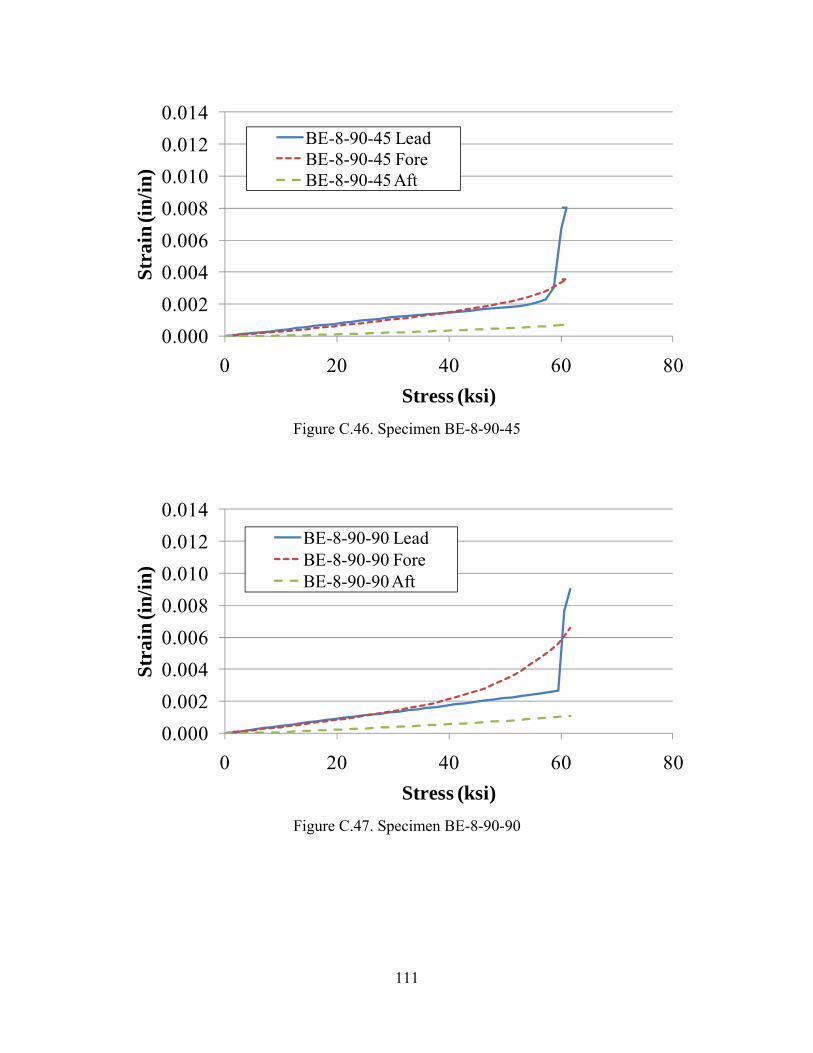
111
0.0000.0020.0040.0060.0080.0100.0120.014
0 20 40 60 80
Stra
in (i
n/i
n)
Stress (ksi)
BE-8-90-45 LeadBE-8-90-45 ForeBE-8-90-45 Aft
Figure C.46. Specimen BE-8-90-45
0.0000.0020.0040.0060.0080.0100.0120.014
0 20 40 60 80
Str
ain
(in
/in)
Stress (ksi)
BE-8-90-90 LeadBE-8-90-90 ForeBE-8-90-90 Aft
Figure C.47. Specimen BE-8-90-90
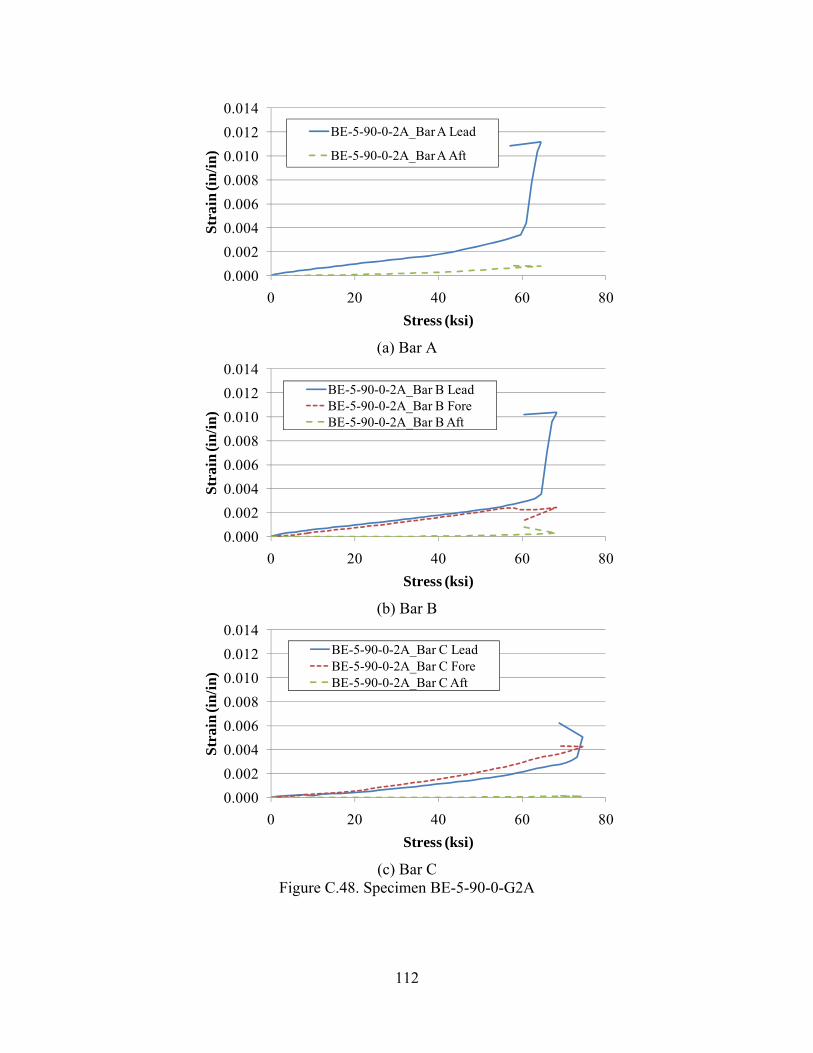
112
0.0000.0020.0040.0060.0080.0100.0120.014
0 20 40 60 80
Str
ain
(in
/in
)
Stress (ksi)
BE-5-90-0-2A_Bar A Lead
BE-5-90-0-2A_Bar A Aft
(a) Bar A
0.0000.0020.0040.0060.0080.0100.0120.014
0 20 40 60 80
Str
ain
(in
/in
)
Stress (ksi)
BE-5-90-0-2A_Bar B LeadBE-5-90-0-2A_Bar B ForeBE-5-90-0-2A_Bar B Aft
(b) Bar B
0.0000.0020.0040.0060.0080.0100.0120.014
0 20 40 60 80
Str
ain
(in
/in
)
Stress (ksi)
BE-5-90-0-2A_Bar C LeadBE-5-90-0-2A_Bar C ForeBE-5-90-0-2A_Bar C Aft
(c) Bar C
Figure C.48. Specimen BE-5-90-0-G2A
113
0.0000.0020.0040.0060.0080.0100.0120.014
0 20 40 60 80
Str
ain
(in
/in
)
Stress (ksi)
BE-5-90-0-A_Bar A LeadBE-5-90-0-A_Bar A ForeBE-5-90-0-A_Bar A Aft
(a) Bar A
0.0000.0020.0040.0060.0080.0100.0120.014
0 20 40 60 80
Str
ain
(in
/in
)
Stress (ksi)
BE-5-90-0-A_Bar B Lead
BE-5-90-0-A_Bar B Fore
(b) Bar B
0.0000.0020.0040.0060.0080.0100.0120.014
0 20 40 60 80
Str
ain
(in
/in
)
Stress (ksi)
BE-5-90-0-A_Bar C Lead
(c) Bar C
Figure C.49. Specimen BE-5-90-0-GA
114
0.0000.0020.0040.0060.0080.0100.0120.014
0 20 40 60 80
Str
ain
(in
/in
)
Stress (ksi)
BE-5-90-0-0.5A_Bar A LeadBE-5-90-0-0.5A_Bar A ForeBE-5-90-0-0.5A_Bar A Aft
(a) Bar A
0.0000.0020.0040.0060.0080.0100.0120.014
0 20 40 60 80
Str
ain
(in
/in
)
Stress (ksi)
BE-5-90-0-0.5A_Bar B LeadBE-5-90-0-0.5A_Bar B ForeBE-5-90-0-0.5A_Bar B Aft
(b) Bar B
0.0000.0020.0040.0060.0080.0100.0120.014
0 20 40 60 80
Str
ain
(in
/in
)
Stress (ksi)
BE-5-90-0-0.5A_Bar C Lead
(c) Bar C
Figure C.50. Specimen BE-5-90-0-G0.5A
115
0.0000.0020.0040.0060.0080.0100.0120.014
0 20 40 60 80
Str
ain
(in
/in
)
Stresss (ksi)
BE-5-90-22.5-2A_Bar A Lead
BE-5-90-22.5-2A_Bar A Fore
(a) Bar A
0.0000.0020.0040.0060.0080.0100.0120.014
0 20 40 60 80
Str
ain
(in
/in
)
Stress (ksi)
BE-5-90-22.5-2A_Bar B LeadBE-5-90-22.5-2A_Bar B ForeBE-5-90-22.5-2A_Bar B Aft
(b) Bar B
0.0000.0020.0040.0060.0080.0100.0120.014
0 20 40 60 80
Str
ain
(in
/in
)
Stress (ksi)
BE-5-90-22.5-2A_Bar C Lead
BE-5-90-22.5-2A_Bar C Aft
(c) Bar C
Figure C.51. Specimen BE-5-90-22.5-G2A
116
0.0000.0020.0040.0060.0080.0100.0120.014
0 20 40 60 80
Str
ain
(in
/in
)
Stress (ksi)
BE-5-90-22.5-A_Bar A LeadBE-5-90-22.5-A_Bar A ForeBE-5-90-22.5-A_Bar A Aft
(a) Bar A
0.0000.0020.0040.0060.0080.0100.0120.014
0 20 40 60 80
Str
ain
(in
/in
)
Stress (ksi)
BE-5-90-22.5-A_Bar B Lead
BE-5-90-22.5-A_Bar B Fore
(b) Bar B
0.0000.0020.0040.0060.0080.0100.0120.014
0 20 40 60 80
Str
ain
(in
/in
)
Stress (ksi)
BE-5-90-22.5-A_Bar C LeadBE-5-90-22.5-A_Bar C ForeBE-5-90-22.5-A_Bar C Aft
(c) Bar C
Figure C.52. Specimen BE-5-90-22.5-GA
117
0.0000.0020.0040.0060.0080.0100.0120.014
0 20 40 60 80
Str
ain
(in
/in
)
Stress (ksi)
BE-5-90-22.5-0.5A_Bar A LeadBE-5-90-22.5-0.5A_Bar A ForeBE-5-90-22.5-0.5A_Bar A Aft
(a) Bar A
0.0000.0020.0040.0060.0080.0100.0120.014
0 20 40 60 80
Str
ain
(in
/in
)
Stress (ksi)
BE-5-90-22.5-0.5A_Bar B LeadBE-5-90-22.5-0.5A_Bar B ForeBE-5-90-22.5-0.5A_Bar B Aft
(b) Bar B
0.0000.0020.0040.0060.0080.0100.0120.014
0 20 40 60 80
Str
ain
(in
/in
)
Stress (ksi)
BE-5-90-22.5-0.5A_Bar C LeadBE-5-90-22.5-0.5A_Bar C ForeBE-5-90-22.5-0.5A_Bar C Aft
(c) Bar C
Figure C.53. Specimen BE-5-90-22.5-G0.5A
118
0.0000.0020.0040.0060.0080.0100.0120.014
0 20 40 60 80
Str
ain
(in
/in
)
Stress (ksi)
BE-8-90-0-2A_Bar A Fore
BE-8-90-0-2A_Bar A Aft
(a) Bar A
0.0000.0020.0040.0060.0080.0100.0120.014
0 20 40 60 80
Str
ain
(in
/in
)
Stress (ksi)
BE-8-90-0-2A_Bar B Lead
(b) Bar B
0.0000.0020.0040.0060.0080.0100.0120.014
0 20 40 60 80
Str
ain
(in
/in
)
Stress (ksi)
BE-8-90-0-2A_Bar C LeadBE-8-90-0-2A_Bar C ForeBE-8-90-0-2A_Bar C Aft
(c) Bar C
Figure C.54. Specimen BE-8-90-0-G2A
119
0.0000.0020.0040.0060.0080.0100.0120.014
0 20 40 60 80
Str
ain
(in
/in
)
Stress (ksi)
BE-8-90-0-A_Bar A Lead
BE-8-90-0-A_Bar A Aft
(a) Bar A
0.0000.0020.0040.0060.0080.0100.0120.014
0 20 40 60 80
Str
ain
(in
/in
)
Stress (ksi)
BE-8-90-0-A_Bar B LeadBE-8-90-0-A_Bar B ForeBE-8-90-0-A_Bar B Aft
(b) Bar B
0.0000.0020.0040.0060.0080.0100.0120.014
0 20 40 60 80
Str
ain
(in
/in
)
Stress (ksi)
BE-8-90-0-A_Bar C Lead
BE-8-90-0-A_Bar C Aft
(c) Bar C
Figure C.55. Specimen BE-8-90-0-GA
120
0.0000.0020.0040.0060.0080.0100.0120.014
0 20 40 60 80
Str
ain
(in
/in
)
Stress (ksi)
BE-8-90-0-0.5A_Bar A LeadBE-8-90-0-0.5A_Bar A ForeBE-8-90-0-0.5A_Bar A Aft
(a) Bar A
0.0000.0020.0040.0060.0080.0100.0120.014
0 20 40 60 80
Str
ain
(in
/in
)
Stress (ksi)
BE-8-90-0-0.5A_Bar B LeadBE-8-90-0-0.5A_Bar B ForeBE-8-90-0-0.5A_Bar B Aft
(b) Bar B
0.0000.0020.0040.0060.0080.0100.0120.014
0 20 40 60 80
Str
ain
(in
/in
)
Stress (ksi)
BE-8-90-0-0.5A_BarA LeadBE-8-90-0-0.5A_BarA ForeBE-8-90-0-0.5A_BarA Aft
(c) Bar C
Figure C.56. Specimen BE-8-90-0-G0.5A
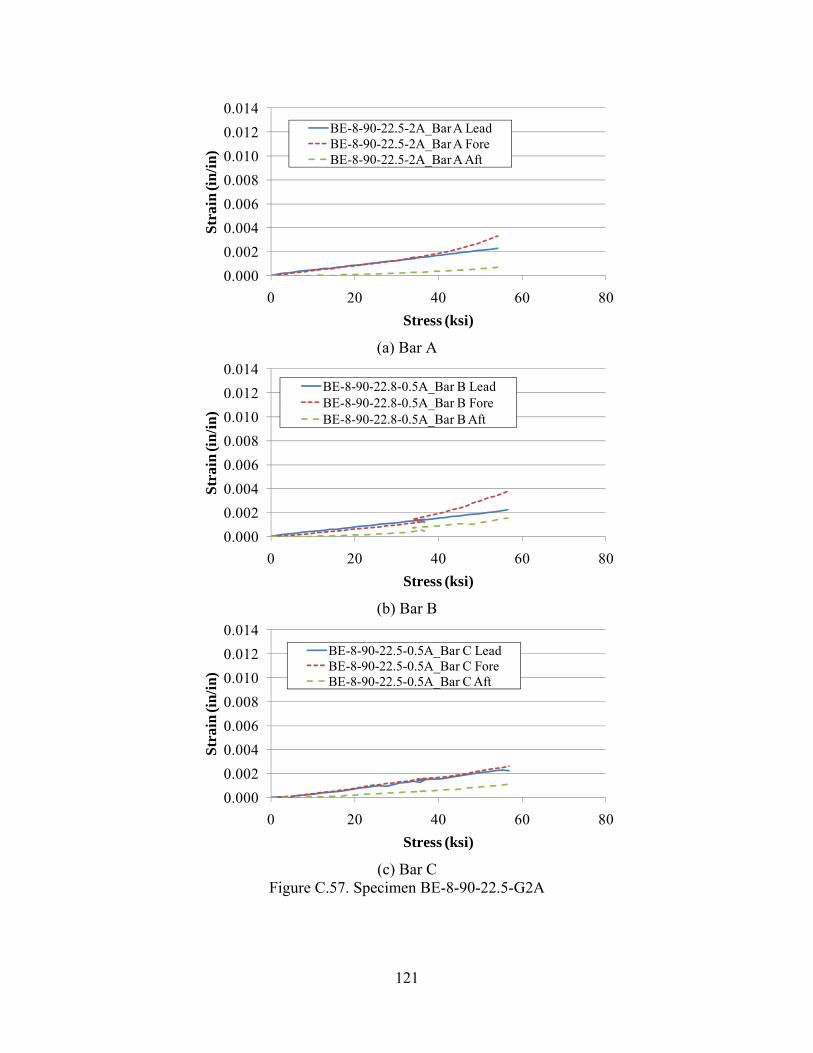
121
0.0000.0020.0040.0060.0080.0100.0120.014
0 20 40 60 80
Str
ain
(in
/in
)
Stress (ksi)
BE-8-90-22.5-2A_Bar A LeadBE-8-90-22.5-2A_Bar A ForeBE-8-90-22.5-2A_Bar A Aft
(a) Bar A
0.0000.0020.0040.0060.0080.0100.0120.014
0 20 40 60 80
Str
ain
(in
/in
)
Stress (ksi)
BE-8-90-22.8-0.5A_Bar B LeadBE-8-90-22.8-0.5A_Bar B ForeBE-8-90-22.8-0.5A_Bar B Aft
(b) Bar B
0.0000.0020.0040.0060.0080.0100.0120.014
0 20 40 60 80
Str
ain
(in
/in
)
Stress (ksi)
BE-8-90-22.5-0.5A_Bar C LeadBE-8-90-22.5-0.5A_Bar C ForeBE-8-90-22.5-0.5A_Bar C Aft
(c) Bar C
Figure C.57. Specimen BE-8-90-22.5-G2A
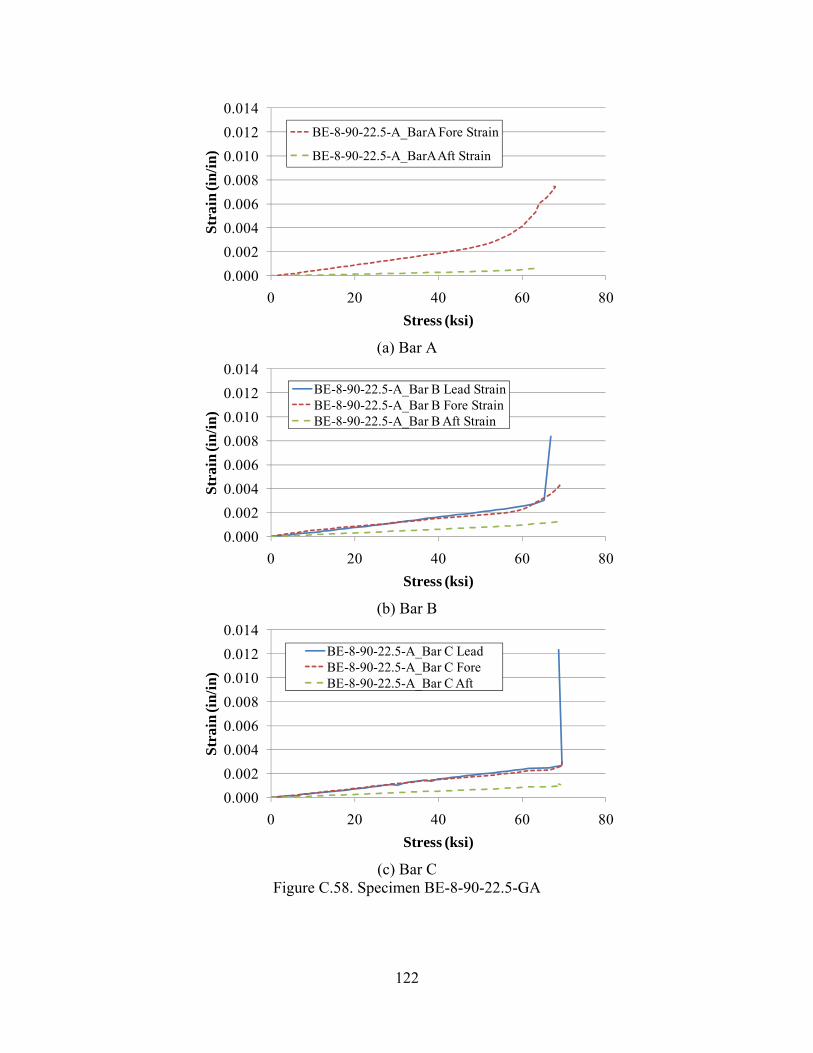
122
0.0000.0020.0040.0060.0080.0100.0120.014
0 20 40 60 80
Str
ain
(in
/in
)
Stress (ksi)
BE-8-90-22.5-A_BarA Fore Strain
BE-8-90-22.5-A_BarA Aft Strain
(a) Bar A
0.0000.0020.0040.0060.0080.0100.0120.014
0 20 40 60 80
Str
ain
(in
/in
)
Stress (ksi)
BE-8-90-22.5-A_Bar B Lead StrainBE-8-90-22.5-A_Bar B Fore StrainBE-8-90-22.5-A_Bar B Aft Strain
(b) Bar B
0.0000.0020.0040.0060.0080.0100.0120.014
0 20 40 60 80
Str
ain
(in
/in
)
Stress (ksi)
BE-8-90-22.5-A_Bar C LeadBE-8-90-22.5-A_Bar C ForeBE-8-90-22.5-A_Bar C Aft
(c) Bar C
Figure C.58. Specimen BE-8-90-22.5-GA
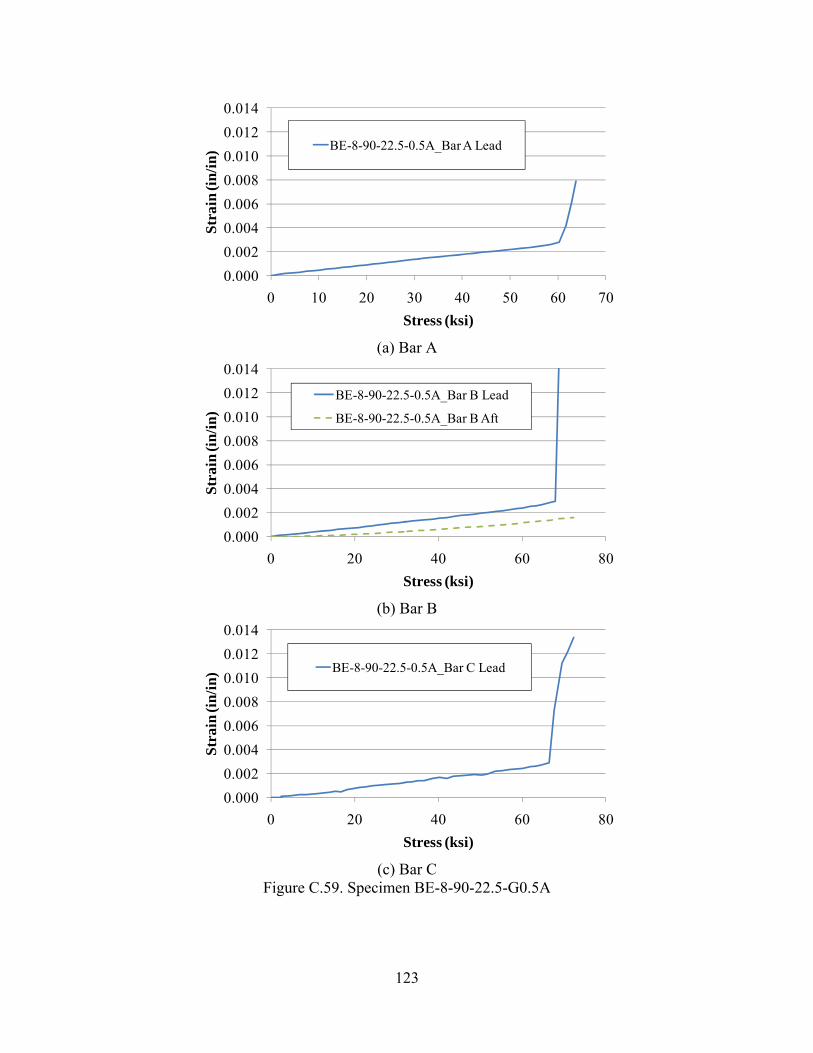
123
0.0000.0020.0040.0060.0080.0100.0120.014
0 10 20 30 40 50 60 70
Str
ain
(in
/in
)
Stress (ksi)
BE-8-90-22.5-0.5A_Bar A Lead
(a) Bar A
0.0000.0020.0040.0060.0080.0100.0120.014
0 20 40 60 80
Str
ain
(in
/in
)
Stress (ksi)
BE-8-90-22.5-0.5A_Bar B Lead
BE-8-90-22.5-0.5A_Bar B Aft
(b) Bar B
0.0000.0020.0040.0060.0080.0100.0120.014
0 20 40 60 80
Str
ain
(in
/in
)
Stress (ksi)
BE-8-90-22.5-0.5A_Bar C Lead
(c) Bar C
Figure C.59. Specimen BE-8-90-22.5-G0.5A
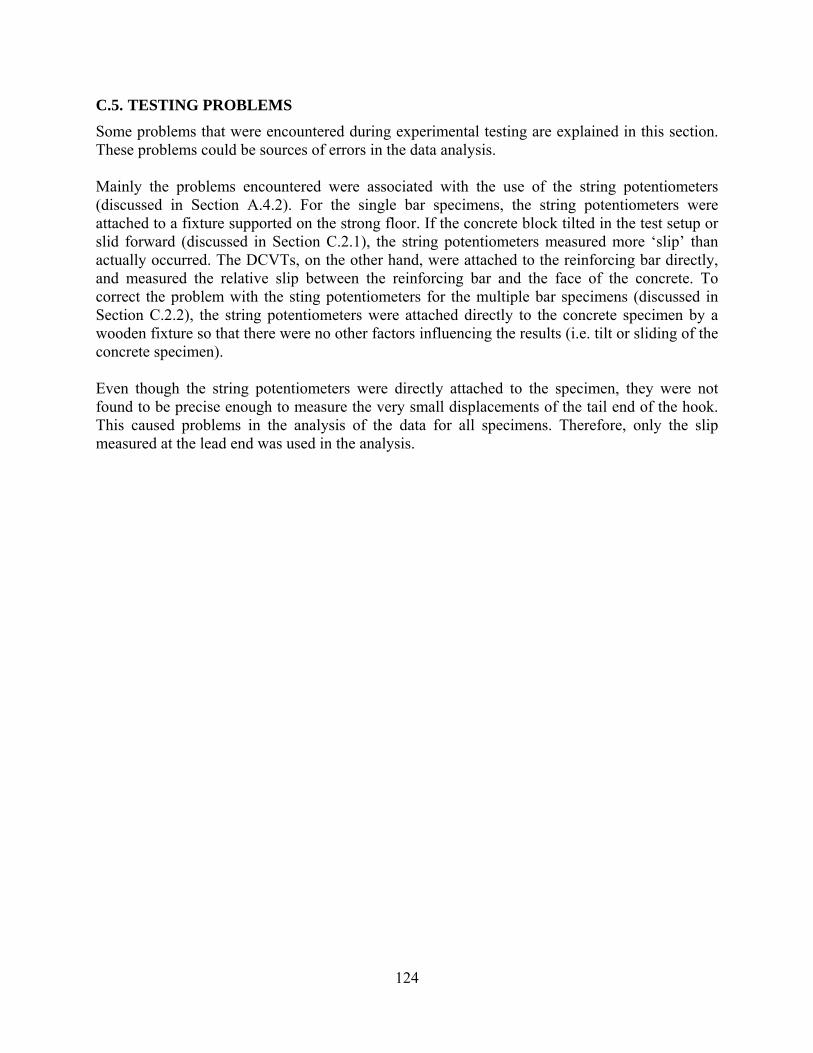
124
C.5. TESTING PROBLEMS
Some problems that were encountered during experimental testing are explained in this section. These problems could be sources of errors in the data analysis. Mainly the problems encountered were associated with the use of the string potentiometers (discussed in Section A.4.2). For the single bar specimens, the string potentiometers were attached to a fixture supported on the strong floor. If the concrete block tilted in the test setup or slid forward (discussed in Section C.2.1), the string potentiometers measured more ‘slip’ than actually occurred. The DCVTs, on the other hand, were attached to the reinforcing bar directly, and measured the relative slip between the reinforcing bar and the face of the concrete. To correct the problem with the sting potentiometers for the multiple bar specimens (discussed in Section C.2.2), the string potentiometers were attached directly to the concrete specimen by a wooden fixture so that there were no other factors influencing the results (i.e. tilt or sliding of the concrete specimen). Even though the string potentiometers were directly attached to the specimen, they were not found to be precise enough to measure the very small displacements of the tail end of the hook. This caused problems in the analysis of the data for all specimens. Therefore, only the slip measured at the lead end was used in the analysis.

125
APPENDIX D
ANALYSIS OF TEST VARIABLES
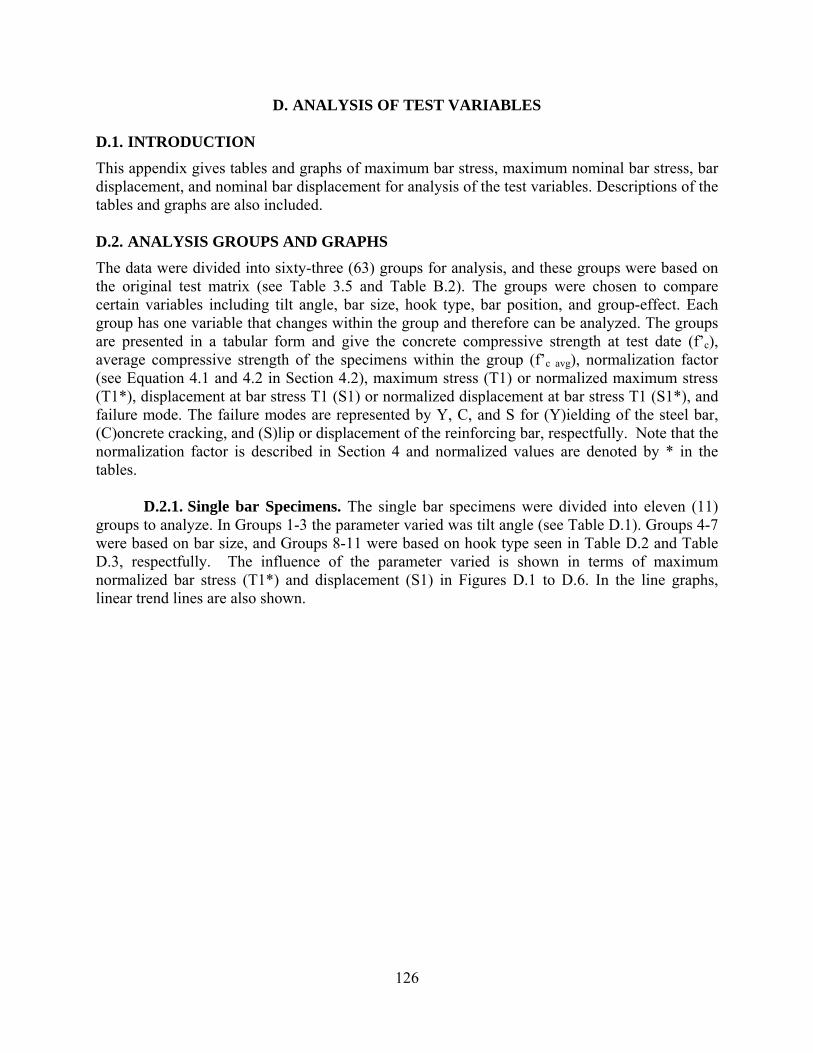
126
D. ANALYSIS OF TEST VARIABLES
D.1. INTRODUCTION
This appendix gives tables and graphs of maximum bar stress, maximum nominal bar stress, bar displacement, and nominal bar displacement for analysis of the test variables. Descriptions of the tables and graphs are also included. D.2. ANALYSIS GROUPS AND GRAPHS
The data were divided into sixty-three (63) groups for analysis, and these groups were based on the original test matrix (see Table 3.5 and Table B.2). The groups were chosen to compare certain variables including tilt angle, bar size, hook type, bar position, and group-effect. Each group has one variable that changes within the group and therefore can be analyzed. The groups are presented in a tabular form and give the concrete compressive strength at test date (f’c), average compressive strength of the specimens within the group (f’c avg), normalization factor (see Equation 4.1 and 4.2 in Section 4.2), maximum stress (T1) or normalized maximum stress (T1*), displacement at bar stress T1 (S1) or normalized displacement at bar stress T1 (S1*), and failure mode. The failure modes are represented by Y, C, and S for (Y)ielding of the steel bar, (C)oncrete cracking, and (S)lip or displacement of the reinforcing bar, respectfully. Note that the normalization factor is described in Section 4 and normalized values are denoted by * in the tables.
D.2.1. Single bar Specimens. The single bar specimens were divided into eleven (11)
groups to analyze. In Groups 1-3 the parameter varied was tilt angle (see Table D.1). Groups 4-7 were based on bar size, and Groups 8-11 were based on hook type seen in Table D.2 and Table D.3, respectfully. The influence of the parameter varied is shown in terms of maximum normalized bar stress (T1*) and displacement (S1) in Figures D.1 to D.6. In the line graphs, linear trend lines are also shown.
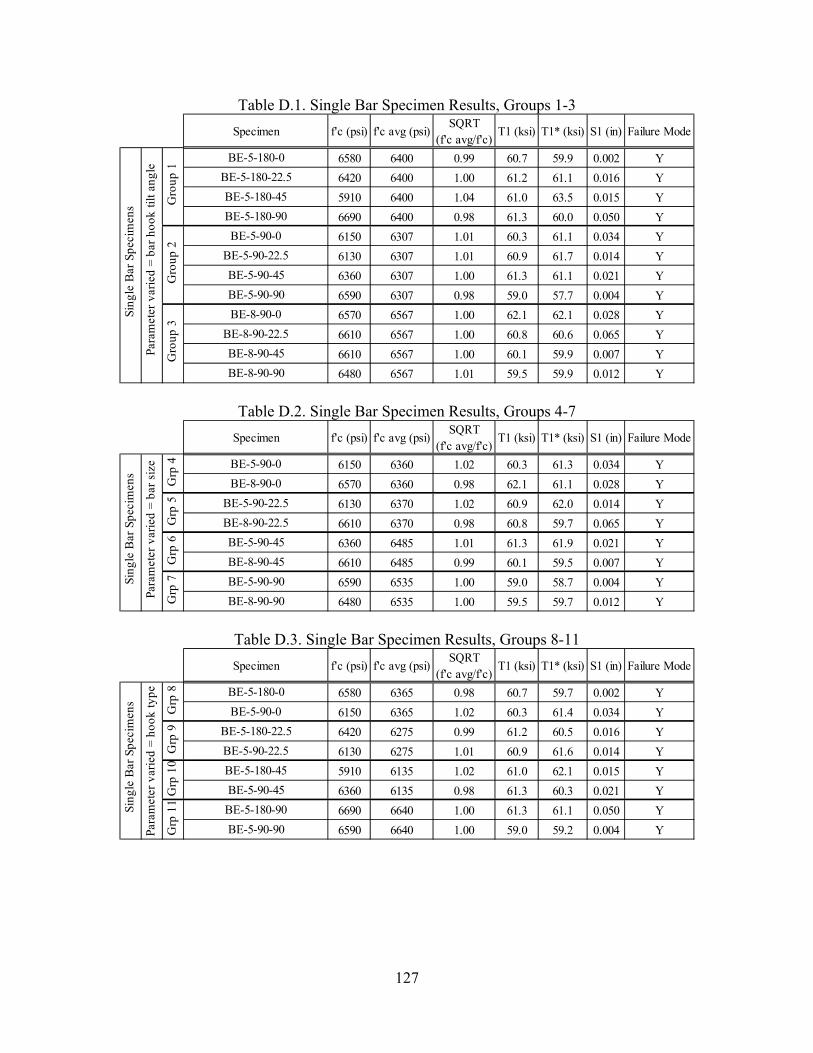
127
Table D.1. Single Bar Specimen Results, Groups 1-3 f'c (psi) f'c avg (psi)
SQRT (f'c avg/f'c)
T1 (ksi) T1* (ksi) S1 (in) Failure Mode
6580 6400 0.99 60.7 59.9 0.002 Y6420 6400 1.00 61.2 61.1 0.016 Y5910 6400 1.04 61.0 63.5 0.015 Y6690 6400 0.98 61.3 60.0 0.050 Y6150 6307 1.01 60.3 61.1 0.034 Y6130 6307 1.01 60.9 61.7 0.014 Y6360 6307 1.00 61.3 61.1 0.021 Y6590 6307 0.98 59.0 57.7 0.004 Y6570 6567 1.00 62.1 62.1 0.028 Y6610 6567 1.00 60.8 60.6 0.065 Y6610 6567 1.00 60.1 59.9 0.007 Y6480 6567 1.01 59.5 59.9 0.012 Y
SpecimenSi
ngle
Bar
Spe
cim
ens
BE-5-180-0BE-5-180-22.5BE-5-180-45BE-5-180-90BE-5-90-0
BE-5-90-22.5BE-5-90-45BE-5-90-90BE-8-90-0
BE-8-90-22.5BE-8-90-45BE-8-90-90
Gro
up 1
Gro
up 2
Gro
up 3
Para
met
er v
arie
d =
bar h
ook
tilt a
ngle
Table D.2. Single Bar Specimen Results, Groups 4-7 f'c (psi) f'c avg (psi)
SQRT (f'c avg/f'c)
T1 (ksi) T1* (ksi) S1 (in) Failure Mode
6150 6360 1.02 60.3 61.3 0.034 Y6570 6360 0.98 62.1 61.1 0.028 Y6130 6370 1.02 60.9 62.0 0.014 Y6610 6370 0.98 60.8 59.7 0.065 Y6360 6485 1.01 61.3 61.9 0.021 Y6610 6485 0.99 60.1 59.5 0.007 Y6590 6535 1.00 59.0 58.7 0.004 Y6480 6535 1.00 59.5 59.7 0.012 Y
Grp
4G
rp 5
Sing
le B
ar S
peci
men
s
Grp
6G
rp 7
Para
met
er v
arie
d =
bar s
ize
Specimen
BE-8-90-45BE-5-90-90BE-8-90-90
BE-5-90-0BE-8-90-0
BE-5-90-22.5BE-8-90-22.5BE-5-90-45
Table D.3. Single Bar Specimen Results, Groups 8-11 f'c (psi) f'c avg (psi)
SQRT (f'c avg/f'c)
T1 (ksi) T1* (ksi) S1 (in) Failure Mode
6580 6365 0.98 60.7 59.7 0.002 Y6150 6365 1.02 60.3 61.4 0.034 Y6420 6275 0.99 61.2 60.5 0.016 Y6130 6275 1.01 60.9 61.6 0.014 Y5910 6135 1.02 61.0 62.1 0.015 Y6360 6135 0.98 61.3 60.3 0.021 Y6690 6640 1.00 61.3 61.1 0.050 Y6590 6640 1.00 59.0 59.2 0.004 Y
Sing
le B
ar S
peci
men
s
Grp
8G
rp 9
Grp
10
Grp
11
Para
met
er v
arie
d =
hook
type
Specimen
BE-5-180-0BE-5-90-0
BE-5-180-22.5
BE-5-180-45BE-5-90-22.5
BE-5-90-45BE-5-180-90BE-5-90-90
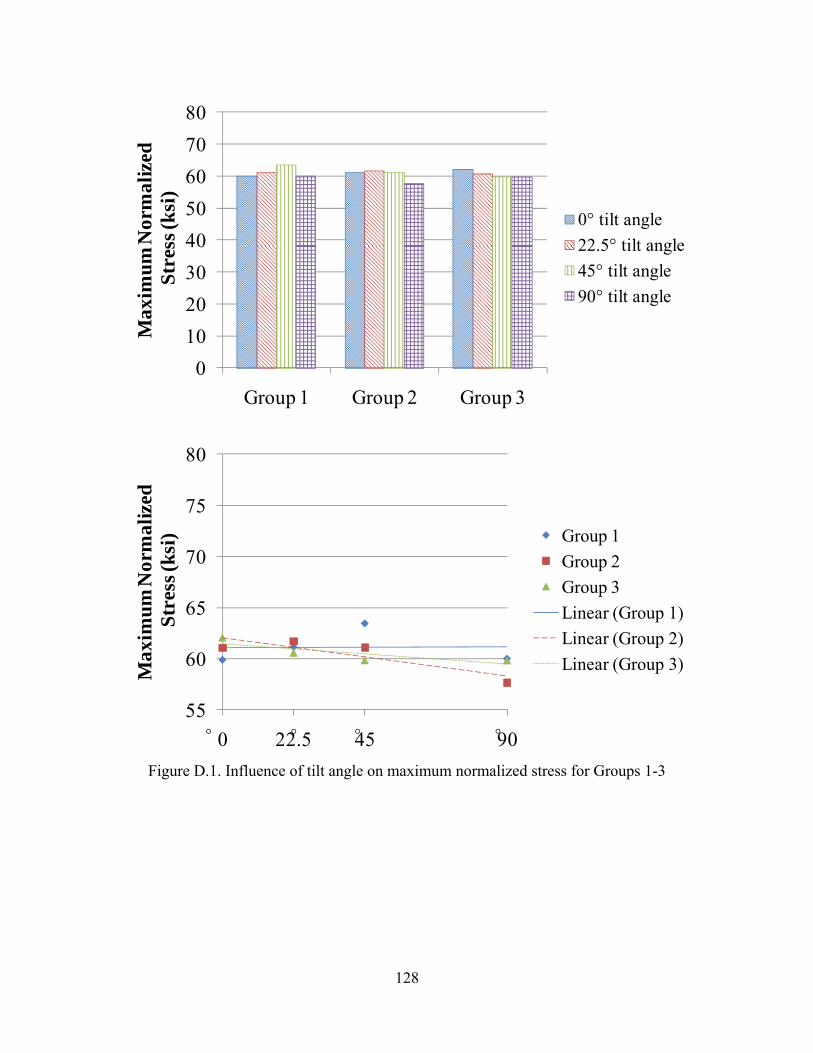
128
01020304050607080
Group 1 Group 2 Group 3
Max
imu
m N
orm
aliz
edSt
ress
(ksi
)
0° tilt angle22.5° tilt angle45° tilt angle90° tilt angle
55
60
65
70
75
80
0 22.5 45 67.5 90
Max
imum
Nor
mal
ized
Str
ess (
ksi) Group 1
Group 2Group 3Linear (Group 1)Linear (Group 2)Linear (Group 3)
Figure D.1. Influence of tilt angle on maximum normalized stress for Groups 1-3
° ° ° °
129
0.00
0.02
0.04
0.06
0.08
0.10
0.12
Group 1 Group 2 Group 3
Dis
plac
emen
t (in
)
0° tilt angle22.5° tilt angle45° tilt angle90° tilt angle
0.00
0.02
0.04
0.06
0.08
0.10
0.12
0 22.5 45 67.5 90
Dis
pla
cem
ent (
in)
Group 1Group 2Group 3Linear (Group 1)Linear (Group 2)Linear (Group 3)
Figure D.2. Influence of tilt angle on displacement for Groups 1-3
° ° ° °

130
01020304050607080
Group 4 Group 5 Group 6 Group 7
Max
imu
m N
orm
aliz
ed
Stre
ss (k
si)
No. 5 barNo. 8 bar
55
60
65
70
75
80
1 2
Max
imum
Nor
mal
ized
Str
ess (
ksi)
Group 4Group 5Group 6Group 7Linear (Group 4)Linear (Group 5)Linear (Group 6)Linear (Group 7)
Figure D.3. Influence of bar size on maximum normalized stress for Groups 4-7
No. 5 bar No. 8 bar
131
0.00
0.02
0.04
0.06
0.08
0.10
0.12
Group 4 Group 5 Group 6 Group 7
Dis
plac
emen
t (in
)
No. 5 barNo. 8 bar
0.00
0.02
0.04
0.06
0.08
0.10
0.12
1 2
Dis
pla
cem
ent (
in) Group 4
Group 5Group 6Group 7Linear (Group 4)Linear (Group 5)Linear (Group 6)Linear (Group 7)
Figure D.4. Influence of bar size on displacement for Groups 4-7
No. 5 bar No. 8 bar
132
01020304050607080
Group 8 Group 9 Group 10 Group 11
Max
imu
m N
orm
aliz
edSt
ress
(ksi
)
180° hook90° hook
55
60
65
70
75
80
1 2
Max
imum
Nor
mal
ized
Str
ess (
ksi)
Group 8Group 9Group 10Group 11Linear (Group 8)Linear (Group 9)Linear (Group 10)Linear (Group 11)
Figure D.5. Influence of hook type on maximum normalized stress for Groups 8-11
180° hook 90° hook
133
0.00
0.02
0.04
0.06
0.08
0.10
0.12
Group 8 Group 9 Group 10 Group 11
Dis
plac
emen
t (in
)
180° hook90° hook
0.00
0.02
0.04
0.06
0.08
0.10
0.12
1 2
Dis
pla
cem
ent (
in) Group 8
Group 9Group 10Group 11Linear (Group 8)Linear (Group 9)Linear (Group 10)Linear (Group 11)
Figure D.6. Influence of hook type on displacement for Groups 8-11
180° hook 90° hook
134
D.2.2. Multiple bar Specimens. The multiple bar specimens were divided into sixteen (16) groups per bar position (Bar A or Bar B) and twelve (12) groups to compare bar position (Bar A and Bar B) directly, for a total of twenty-eight (28) groups. In Groups 12-15, the parameter varied was bar spacing between reinforcing hooked bars on Bar A (see Table D.4). Groups 16-21 are based on tilt angle of the hook for Bar A and Groups 22-27 are based on bar size for Bar A seen in Table D.5 and Table D.6, respectfully. In Groups 28-31, the parameter varied was bar spacing between reinforcing hooked bars on Bar B (see Table D.7). Groups 32-37 are based on tilt angle of the hook for Bar B and Groups 38-43 are based on bar size for Bar B seen in Table D.8 and Table D.9, respectfully. Groups 44-55 compare Bar A and Bar B directly (see Table D.10). The influence of the parameter varied is shown in terms of maximum normalized bar stress (T1*) and displacement (S1) in Figures D7 to D20.
Table D.4. Multiple Bar Specimens Results, Groups 12-15 f'c (psi) f'c avg (psi)
SQRT (f'c avg/f'c)
T1 (ksi) T1* (ksi) S1 (in) Failure Mode
BE-5-90-0-G0.5A Bar A 4970 5053 1.01 65.7 66.3 0.072 YBE-5-90-0-GA Bar A 5350 5053 0.97 62.4 60.7 0.074 YBE-5-90-0-G2A Bar A 4840 5053 1.02 64.4 65.8 0.096 C
BE-5-90-22.5-G0.5A Bar A 4840 4883 1.00 67.4 67.7 0.071 YBE-5-90-22.5-GA Bar A 4970 4883 0.99 60.1 59.6 0.100 YBE-5-90-22.5-G2A Bar A 4840 4883 1.00 61.8 62.1 0.054 YBE-8-90-0-G0.5A Bar A 4470 4780 1.03 50.9 52.6 0.066 C
BE-8-90-0-GA Bar A 4850 4780 0.99 65.7 65.3 0.055 Y, CBE-8-90-0-G2A Bar A 5020 4780 0.98 63.8 62.3 0.050 C
BE-8-90-22.5-G0.5A Bar A 4260 4673 1.05 62.9 65.8 0.201 SBE-8-90-22.5-GA Bar A 5310 4673 0.94 63.3 59.4 0.081 YBE-8-90-22.5-G2A Bar A 4450 4673 1.02 33.5 34.3 0.077 C
Para
met
er v
arie
d =
bar s
paci
ng Gro
up 1
2G
roup
13
Gro
up 1
4G
roup
15
Mul
tiple
Bar
Spe
cim
ens
- Bar
A
Specimen
Table D.5. Multiple Bar Specimens Results, Groups 16-21 f'c (psi) f'c avg (psi)
SQRT (f'c avg/f'c)
T1 (ksi) T1* (ksi) S1 (in) Failure Mode
BE-5-90-0-G0.5A Bar A 4970 4905 0.99 65.7 65.3 0.072 YBE-5-90-22.5-G0.5A Bar A 4840 4905 1.01 67.4 67.8 0.071 Y
BE-5-90-0-GA Bar A 5350 5160 0.98 62.4 61.3 0.074 YBE-5-90-22.5-GA Bar A 4970 5160 1.02 60.1 61.2 0.100 YBE-5-90-0-G2A Bar A 4840 4840 1.00 64.4 64.4 0.096 C
BE-5-90-22.5-G2A Bar A 4840 4840 1.00 61.8 61.8 0.054 YBE-8-90-0-G0.5A Bar A 4470 4365 0.99 50.9 50.3 0.066 C
BE-8-90-22.5-G0.5A Bar A 4260 4365 1.01 62.9 63.6 0.201 SBE-8-90-0-GA Bar A 4850 5080 1.02 65.7 67.3 0.055 Y, C
BE-8-90-22.5-GA Bar A 5310 5080 0.98 63.3 61.9 0.081 YBE-8-90-0-G2A Bar A 5020 4735 0.97 63.8 62.0 0.050 C
BE-8-90-22.5-G2A Bar A 4450 4735 1.03 33.5 34.5 0.077 C
Para
met
er v
arie
d =
hook
tilt
angl
e
Specimen
Grp
16
Grp
17
Grp
18
Grp
19
Grp
20
Grp
21M
ultip
le B
ar S
peci
men
s - B
ar A
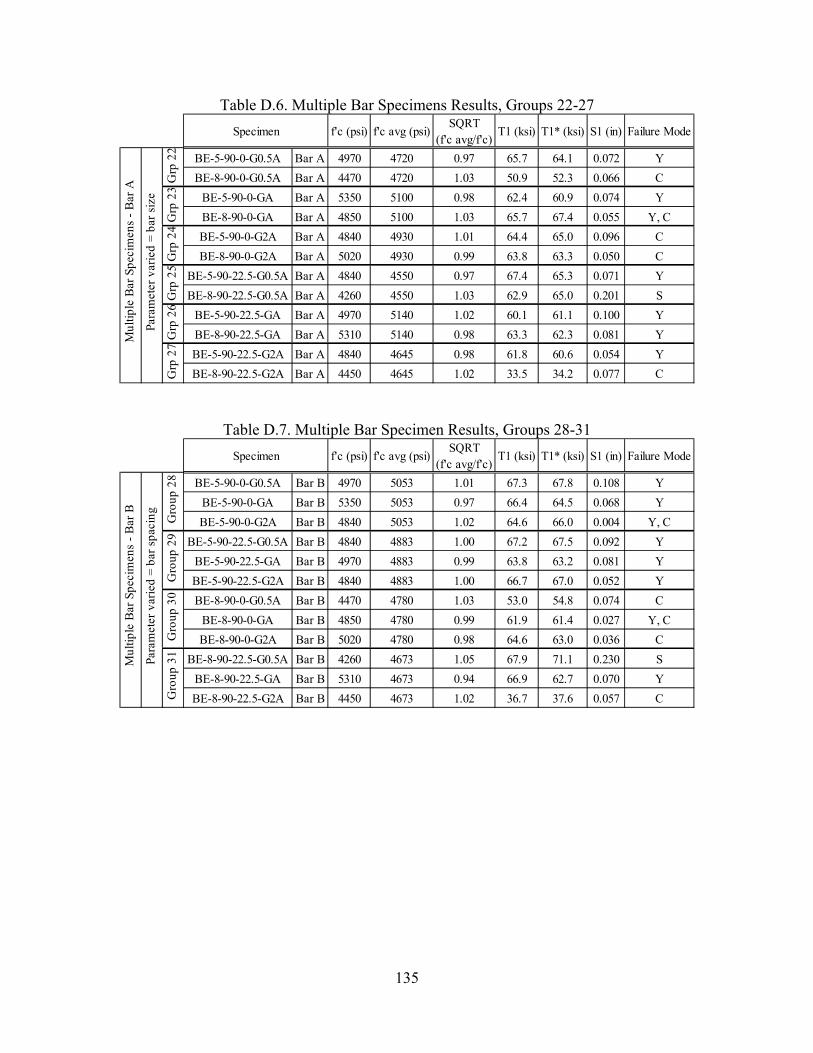
135
Table D.6. Multiple Bar Specimens Results, Groups 22-27 f'c (psi) f'c avg (psi)
SQRT (f'c avg/f'c)
T1 (ksi) T1* (ksi) S1 (in) Failure Mode
BE-5-90-0-G0.5A Bar A 4970 4720 0.97 65.7 64.1 0.072 YBE-8-90-0-G0.5A Bar A 4470 4720 1.03 50.9 52.3 0.066 C
BE-5-90-0-GA Bar A 5350 5100 0.98 62.4 60.9 0.074 YBE-8-90-0-GA Bar A 4850 5100 1.03 65.7 67.4 0.055 Y, CBE-5-90-0-G2A Bar A 4840 4930 1.01 64.4 65.0 0.096 CBE-8-90-0-G2A Bar A 5020 4930 0.99 63.8 63.3 0.050 C
BE-5-90-22.5-G0.5A Bar A 4840 4550 0.97 67.4 65.3 0.071 YBE-8-90-22.5-G0.5A Bar A 4260 4550 1.03 62.9 65.0 0.201 S
BE-5-90-22.5-GA Bar A 4970 5140 1.02 60.1 61.1 0.100 YBE-8-90-22.5-GA Bar A 5310 5140 0.98 63.3 62.3 0.081 YBE-5-90-22.5-G2A Bar A 4840 4645 0.98 61.8 60.6 0.054 YBE-8-90-22.5-G2A Bar A 4450 4645 1.02 33.5 34.2 0.077 C
Para
met
er v
arie
d =
bar s
ize
Grp
27
Specimen
Grp
22
Grp
23
Grp
24
Grp
25
Grp
26
Mul
tiple
Bar
Spe
cim
ens
- Bar
A
Table D.7. Multiple Bar Specimen Results, Groups 28-31 f'c (psi) f'c avg (psi)
SQRT (f'c avg/f'c)
T1 (ksi) T1* (ksi) S1 (in) Failure Mode
BE-5-90-0-G0.5A Bar B 4970 5053 1.01 67.3 67.8 0.108 YBE-5-90-0-GA Bar B 5350 5053 0.97 66.4 64.5 0.068 YBE-5-90-0-G2A Bar B 4840 5053 1.02 64.6 66.0 0.004 Y, C
BE-5-90-22.5-G0.5A Bar B 4840 4883 1.00 67.2 67.5 0.092 YBE-5-90-22.5-GA Bar B 4970 4883 0.99 63.8 63.2 0.081 YBE-5-90-22.5-G2A Bar B 4840 4883 1.00 66.7 67.0 0.052 YBE-8-90-0-G0.5A Bar B 4470 4780 1.03 53.0 54.8 0.074 C
BE-8-90-0-GA Bar B 4850 4780 0.99 61.9 61.4 0.027 Y, CBE-8-90-0-G2A Bar B 5020 4780 0.98 64.6 63.0 0.036 C
BE-8-90-22.5-G0.5A Bar B 4260 4673 1.05 67.9 71.1 0.230 SBE-8-90-22.5-GA Bar B 5310 4673 0.94 66.9 62.7 0.070 YBE-8-90-22.5-G2A Bar B 4450 4673 1.02 36.7 37.6 0.057 C
Para
met
er v
arie
d =
bar s
paci
ng
Mul
tiple
Bar
Spe
cim
ens
- Bar
B Gro
up 2
8G
roup
29
Gro
up 3
0G
roup
31
Specimen
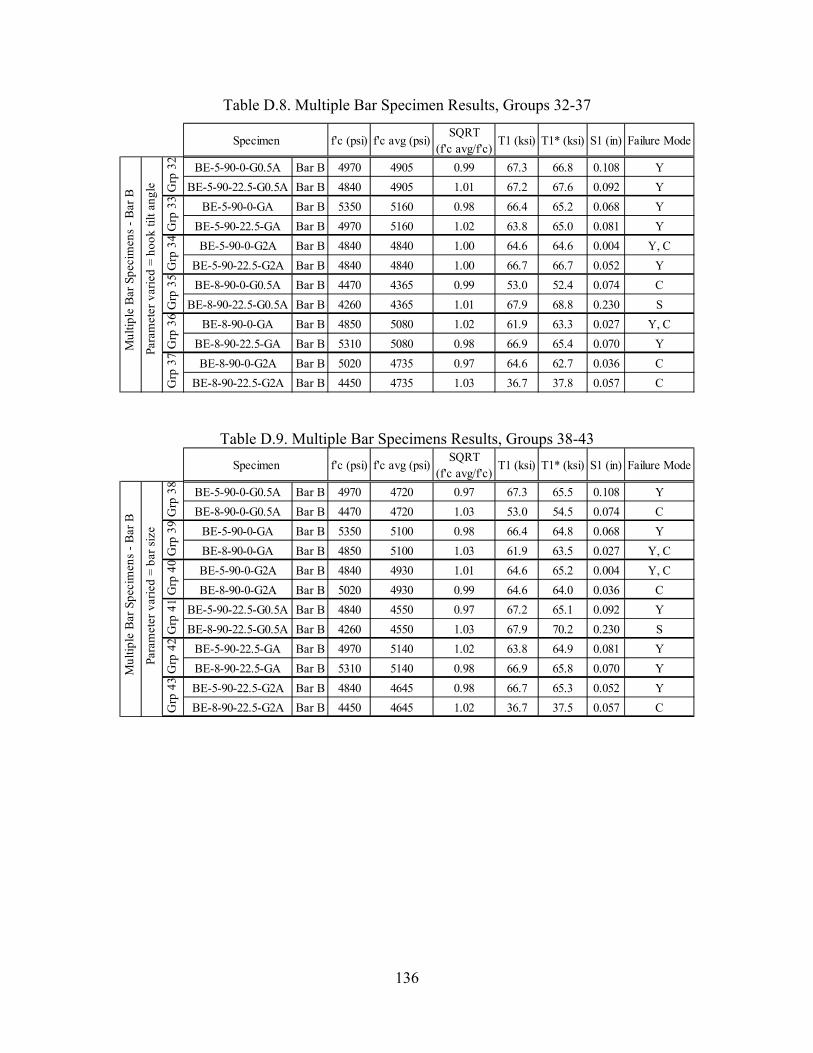
136
Table D.8. Multiple Bar Specimen Results, Groups 32-37
f'c (psi) f'c avg (psi)SQRT
(f'c avg/f'c)T1 (ksi) T1* (ksi) S1 (in) Failure Mode
BE-5-90-0-G0.5A Bar B 4970 4905 0.99 67.3 66.8 0.108 YBE-5-90-22.5-G0.5A Bar B 4840 4905 1.01 67.2 67.6 0.092 Y
BE-5-90-0-GA Bar B 5350 5160 0.98 66.4 65.2 0.068 YBE-5-90-22.5-GA Bar B 4970 5160 1.02 63.8 65.0 0.081 YBE-5-90-0-G2A Bar B 4840 4840 1.00 64.6 64.6 0.004 Y, C
BE-5-90-22.5-G2A Bar B 4840 4840 1.00 66.7 66.7 0.052 YBE-8-90-0-G0.5A Bar B 4470 4365 0.99 53.0 52.4 0.074 C
BE-8-90-22.5-G0.5A Bar B 4260 4365 1.01 67.9 68.8 0.230 SBE-8-90-0-GA Bar B 4850 5080 1.02 61.9 63.3 0.027 Y, C
BE-8-90-22.5-GA Bar B 5310 5080 0.98 66.9 65.4 0.070 YBE-8-90-0-G2A Bar B 5020 4735 0.97 64.6 62.7 0.036 C
BE-8-90-22.5-G2A Bar B 4450 4735 1.03 36.7 37.8 0.057 C
Para
met
er v
arie
d =
hook
tilt
angl
e
Mul
tiple
Bar
Spe
cim
ens
- Bar
B
Grp
32
Grp
33
Grp
34
Grp
35
Grp
36
Grp
37
Specimen
Table D.9. Multiple Bar Specimens Results, Groups 38-43 f'c (psi) f'c avg (psi)
SQRT (f'c avg/f'c)
T1 (ksi) T1* (ksi) S1 (in) Failure Mode
BE-5-90-0-G0.5A Bar B 4970 4720 0.97 67.3 65.5 0.108 YBE-8-90-0-G0.5A Bar B 4470 4720 1.03 53.0 54.5 0.074 C
BE-5-90-0-GA Bar B 5350 5100 0.98 66.4 64.8 0.068 YBE-8-90-0-GA Bar B 4850 5100 1.03 61.9 63.5 0.027 Y, CBE-5-90-0-G2A Bar B 4840 4930 1.01 64.6 65.2 0.004 Y, CBE-8-90-0-G2A Bar B 5020 4930 0.99 64.6 64.0 0.036 C
BE-5-90-22.5-G0.5A Bar B 4840 4550 0.97 67.2 65.1 0.092 YBE-8-90-22.5-G0.5A Bar B 4260 4550 1.03 67.9 70.2 0.230 S
BE-5-90-22.5-GA Bar B 4970 5140 1.02 63.8 64.9 0.081 YBE-8-90-22.5-GA Bar B 5310 5140 0.98 66.9 65.8 0.070 YBE-5-90-22.5-G2A Bar B 4840 4645 0.98 66.7 65.3 0.052 YBE-8-90-22.5-G2A Bar B 4450 4645 1.02 36.7 37.5 0.057 C
Para
met
er v
arie
d =
bar s
ize
Specimen
Mul
tiple
Bar
Spe
cim
ens
- Bar
B
Grp
38
Grp
39
Grp
40
Grp
41
Grp
42
Grp
43
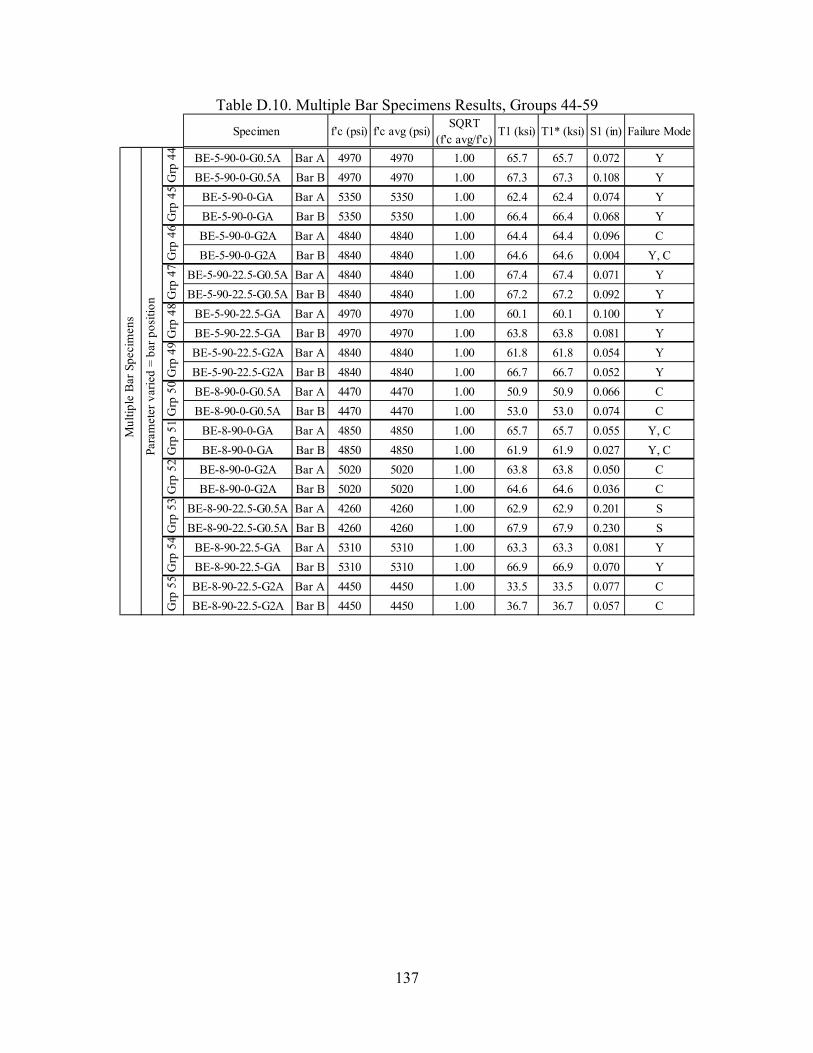
137
Table D.10. Multiple Bar Specimens Results, Groups 44-59 f'c (psi) f'c avg (psi)
SQRT (f'c avg/f'c)
T1 (ksi) T1* (ksi) S1 (in) Failure Mode
BE-5-90-0-G0.5A Bar A 4970 4970 1.00 65.7 65.7 0.072 YBE-5-90-0-G0.5A Bar B 4970 4970 1.00 67.3 67.3 0.108 Y
BE-5-90-0-GA Bar A 5350 5350 1.00 62.4 62.4 0.074 YBE-5-90-0-GA Bar B 5350 5350 1.00 66.4 66.4 0.068 YBE-5-90-0-G2A Bar A 4840 4840 1.00 64.4 64.4 0.096 CBE-5-90-0-G2A Bar B 4840 4840 1.00 64.6 64.6 0.004 Y, C
BE-5-90-22.5-G0.5A Bar A 4840 4840 1.00 67.4 67.4 0.071 YBE-5-90-22.5-G0.5A Bar B 4840 4840 1.00 67.2 67.2 0.092 Y
BE-5-90-22.5-GA Bar A 4970 4970 1.00 60.1 60.1 0.100 YBE-5-90-22.5-GA Bar B 4970 4970 1.00 63.8 63.8 0.081 YBE-5-90-22.5-G2A Bar A 4840 4840 1.00 61.8 61.8 0.054 YBE-5-90-22.5-G2A Bar B 4840 4840 1.00 66.7 66.7 0.052 YBE-8-90-0-G0.5A Bar A 4470 4470 1.00 50.9 50.9 0.066 CBE-8-90-0-G0.5A Bar B 4470 4470 1.00 53.0 53.0 0.074 C
BE-8-90-0-GA Bar A 4850 4850 1.00 65.7 65.7 0.055 Y, CBE-8-90-0-GA Bar B 4850 4850 1.00 61.9 61.9 0.027 Y, CBE-8-90-0-G2A Bar A 5020 5020 1.00 63.8 63.8 0.050 CBE-8-90-0-G2A Bar B 5020 5020 1.00 64.6 64.6 0.036 C
BE-8-90-22.5-G0.5A Bar A 4260 4260 1.00 62.9 62.9 0.201 SBE-8-90-22.5-G0.5A Bar B 4260 4260 1.00 67.9 67.9 0.230 S
BE-8-90-22.5-GA Bar A 5310 5310 1.00 63.3 63.3 0.081 YBE-8-90-22.5-GA Bar B 5310 5310 1.00 66.9 66.9 0.070 YBE-8-90-22.5-G2A Bar A 4450 4450 1.00 33.5 33.5 0.077 CBE-8-90-22.5-G2A Bar B 4450 4450 1.00 36.7 36.7 0.057 C
Para
met
er v
arie
d =
bar p
ositi
on
Grp
53
Grp
54
Grp
55
Mul
tiple
Bar
Spe
cim
ens
Grp
44
Grp
45
Grp
46
Grp
47
Grp
48
Grp
49
Grp
50
Grp
51
Grp
52
Specimen
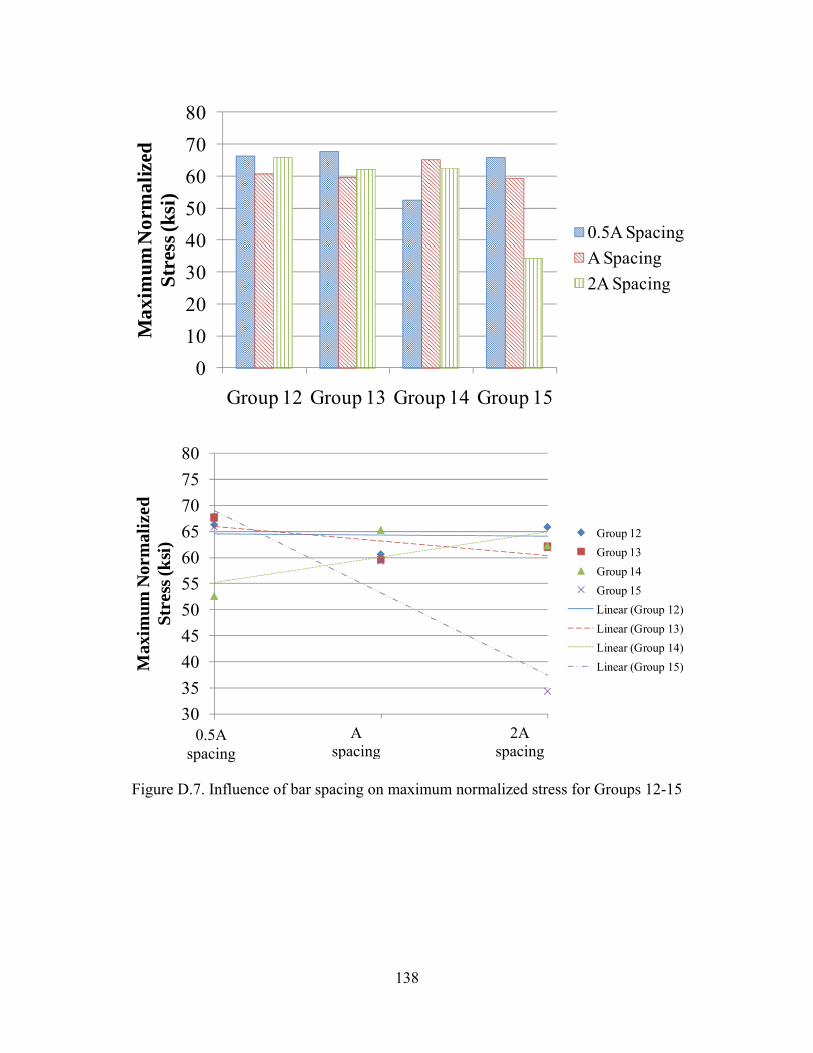
138
01020304050607080
Group 12 Group 13 Group 14 Group 15
Max
imu
m N
orm
aliz
ed
Stre
ss (k
si)
0.5A SpacingA Spacing2A Spacing
3035404550556065707580
1 2 3
Max
imum
Nor
mal
ized
St
ress
(ksi
)
Group 12Group 13Group 14Group 15Linear (Group 12)Linear (Group 13)Linear (Group 14)Linear (Group 15)
Figure D.7. Influence of bar spacing on maximum normalized stress for Groups 12-15
0.5A spacing
2A spacing
A spacing
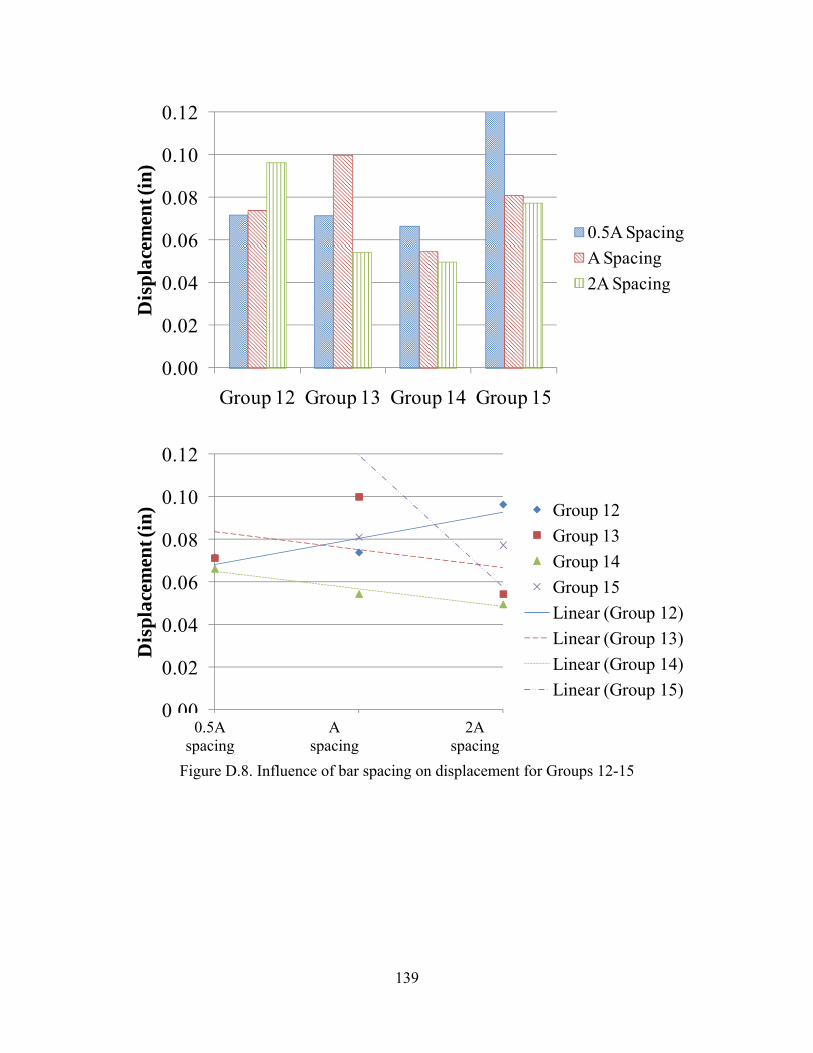
139
0.00
0.02
0.04
0.06
0.08
0.10
0.12
Group 12 Group 13 Group 14 Group 15
Dis
plac
emen
t (in
)
0.5A SpacingA Spacing2A Spacing
0.00
0.02
0.04
0.06
0.08
0.10
0.12
1 2 3
Dis
pla
cem
ent (
in) Group 12
Group 13Group 14Group 15Linear (Group 12)Linear (Group 13)Linear (Group 14)Linear (Group 15)
Figure D.8. Influence of bar spacing on displacement for Groups 12-15
0.5A spacing
2A spacing
A spacing
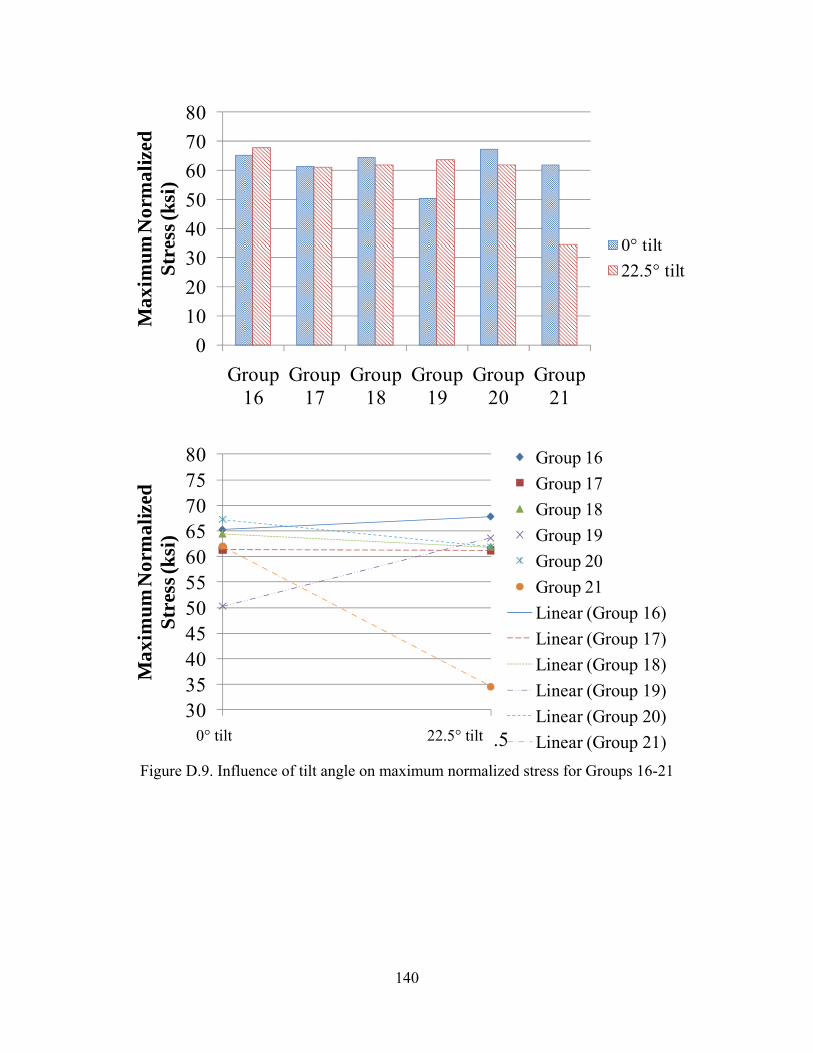
140
01020304050607080
Group 16
Group 17
Group 18
Group 19
Group 20
Group 21
Max
imu
m N
orm
aliz
ed
Str
ess (
ksi)
0° tilt22.5° tilt
3035404550556065707580
0 22.5
Max
imum
Nor
mal
ized
S
tres
s (ks
i)
Group 16Group 17Group 18Group 19Group 20Group 21Linear (Group 16)Linear (Group 17)Linear (Group 18)Linear (Group 19)Linear (Group 20)Linear (Group 21)
Figure D.9. Influence of tilt angle on maximum normalized stress for Groups 16-21
0° tilt 22.5° tilt
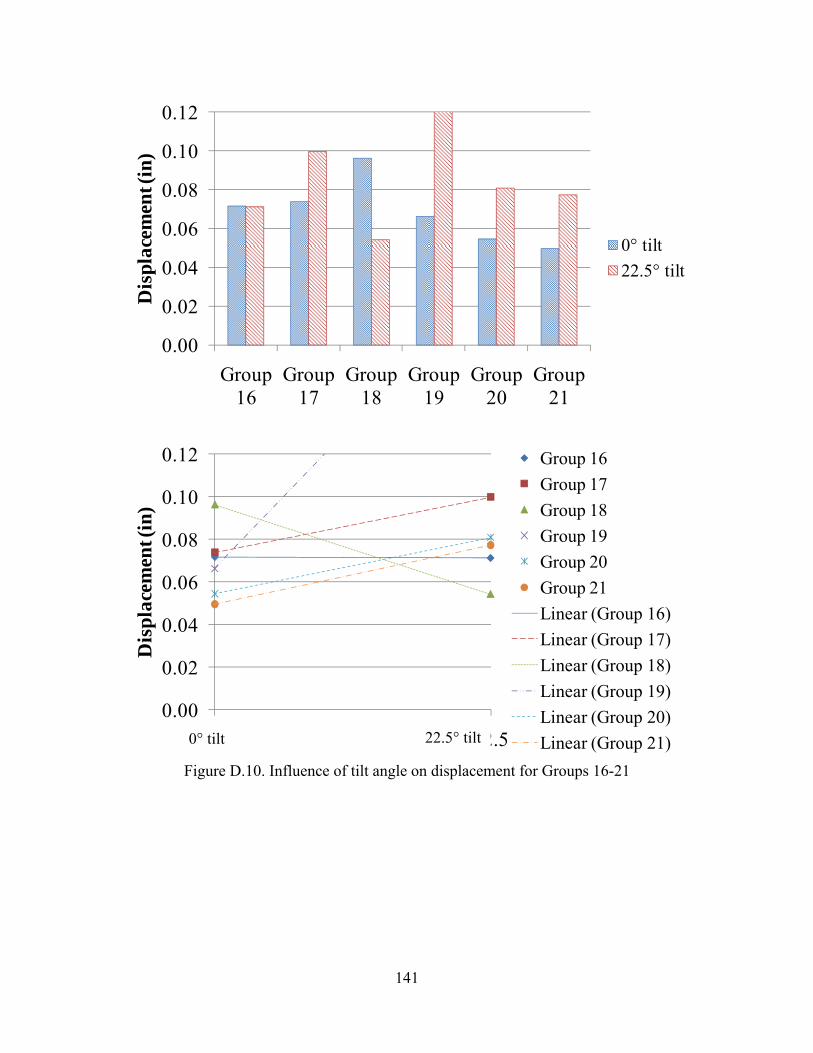
141
0.00
0.02
0.04
0.06
0.08
0.10
0.12
Group 16
Group 17
Group 18
Group 19
Group 20
Group 21
Dis
plac
emen
t (in
)
0° tilt22.5° tilt
0.00
0.02
0.04
0.06
0.08
0.10
0.12
0 22.5
Dis
pla
cem
ent (
in)
Group 16Group 17Group 18Group 19Group 20Group 21Linear (Group 16)Linear (Group 17)Linear (Group 18)Linear (Group 19)Linear (Group 20)Linear (Group 21)
Figure D.10. Influence of tilt angle on displacement for Groups 16-21
0° tilt 22.5° tilt
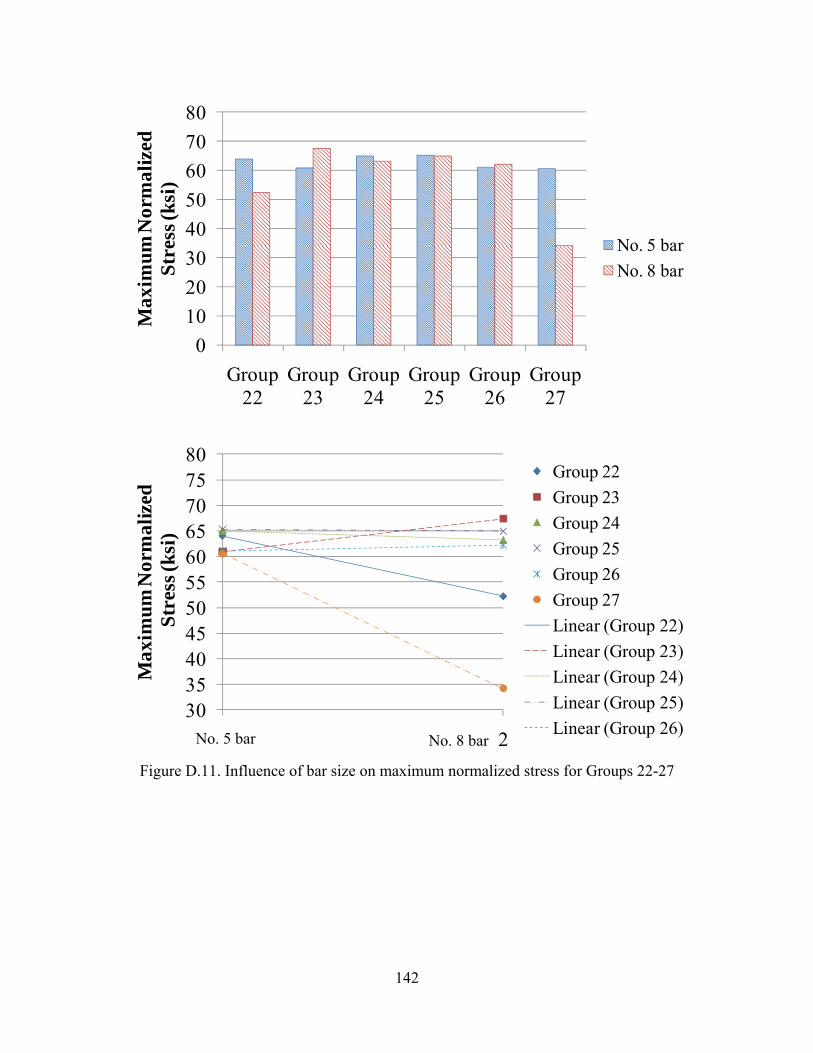
142
01020304050607080
Group 22
Group 23
Group 24
Group 25
Group 26
Group 27
Max
imu
m N
orm
aliz
ed
Str
ess (
ksi)
No. 5 barNo. 8 bar
3035404550556065707580
1 2
Max
imum
Nor
mal
ized
Str
ess (
ksi)
Group 22Group 23Group 24Group 25Group 26Group 27Linear (Group 22)Linear (Group 23)Linear (Group 24)Linear (Group 25)Linear (Group 26)
Figure D.11. Influence of bar size on maximum normalized stress for Groups 22-27
No. 5 bar No. 8 bar
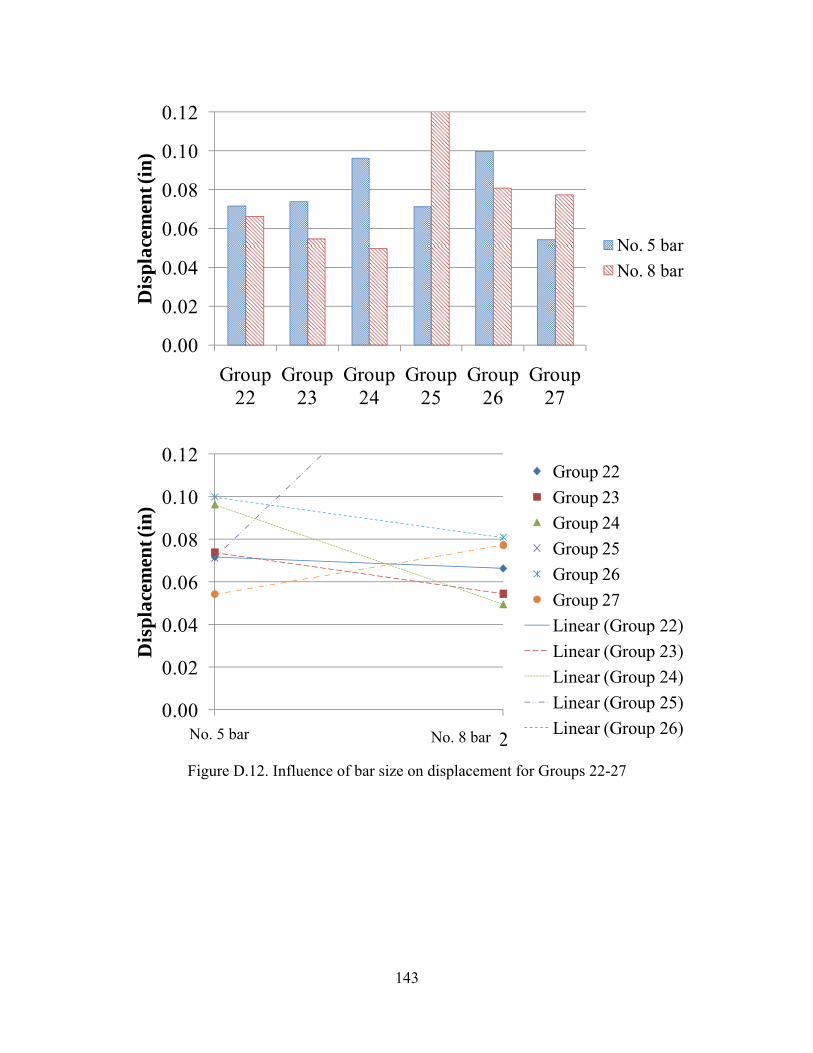
143
0.00
0.02
0.04
0.06
0.08
0.10
0.12
Group 22
Group 23
Group 24
Group 25
Group 26
Group 27
Dis
plac
emen
t (in
)
No. 5 barNo. 8 bar
0.00
0.02
0.04
0.06
0.08
0.10
0.12
1 2
Dis
pla
cem
ent (
in)
Group 22Group 23Group 24Group 25Group 26Group 27Linear (Group 22)Linear (Group 23)Linear (Group 24)Linear (Group 25)Linear (Group 26)
Figure D.12. Influence of bar size on displacement for Groups 22-27
No. 5 bar No. 8 bar
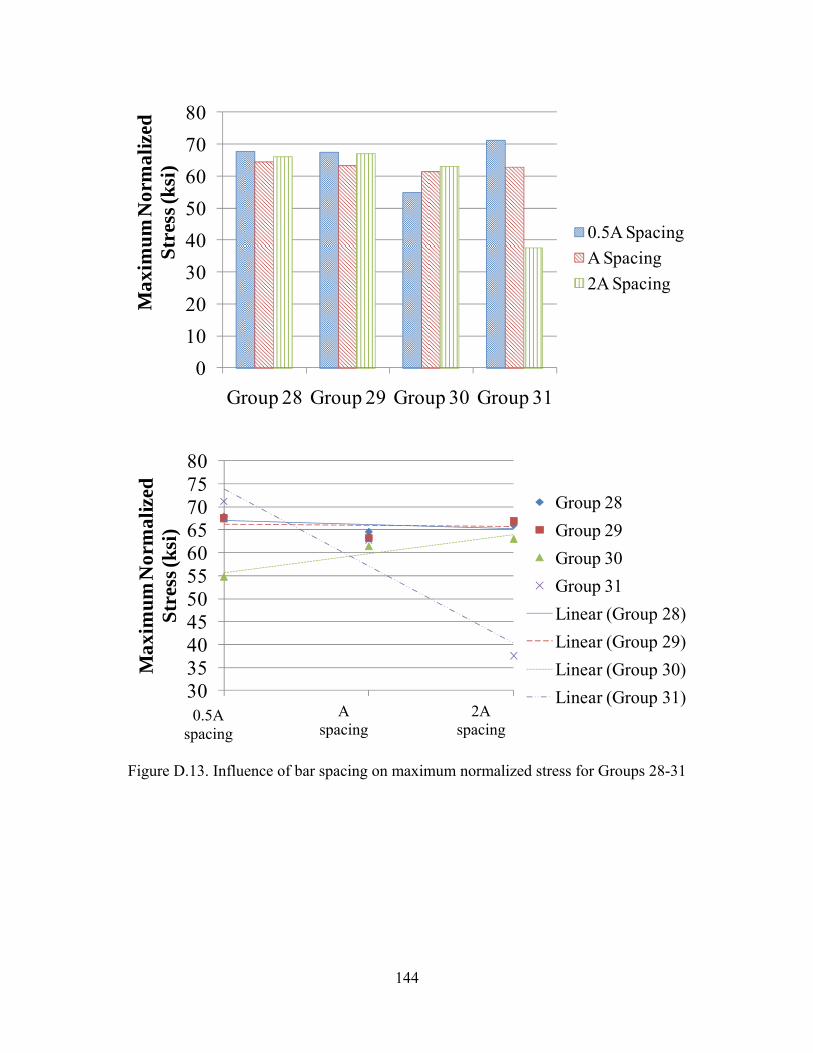
144
01020304050607080
Group 28 Group 29 Group 30 Group 31
Max
imu
m N
orm
aliz
ed
Str
ess
(ksi
)
0.5A SpacingA Spacing2A Spacing
3035404550556065707580
1 2 3
Max
imu
m N
orm
aliz
ed
Str
ess (
ksi)
Group 28Group 29Group 30Group 31Linear (Group 28)Linear (Group 29)Linear (Group 30)Linear (Group 31)
Figure D.13. Influence of bar spacing on maximum normalized stress for Groups 28-31
0.5A spacing
2A spacing
A spacing
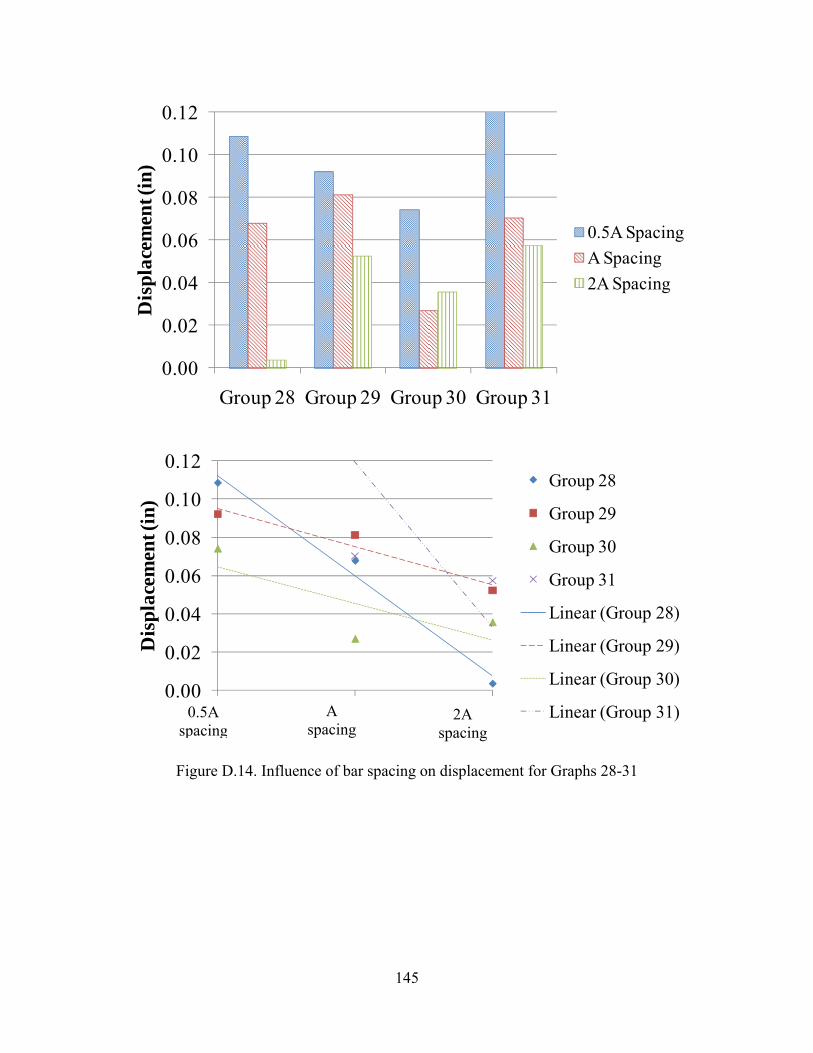
145
0.00
0.02
0.04
0.06
0.08
0.10
0.12
Group 28 Group 29 Group 30 Group 31
Dis
plac
emen
t (in
)
0.5A SpacingA Spacing2A Spacing
0.00
0.02
0.04
0.06
0.08
0.10
0.12
1 2 3
Dis
pla
cem
ent (
in)
Group 28
Group 29
Group 30
Group 31
Linear (Group 28)
Linear (Group 29)
Linear (Group 30)
Linear (Group 31)
Figure D.14. Influence of bar spacing on displacement for Graphs 28-31
0.5A spacing
2A spacing
A spacing
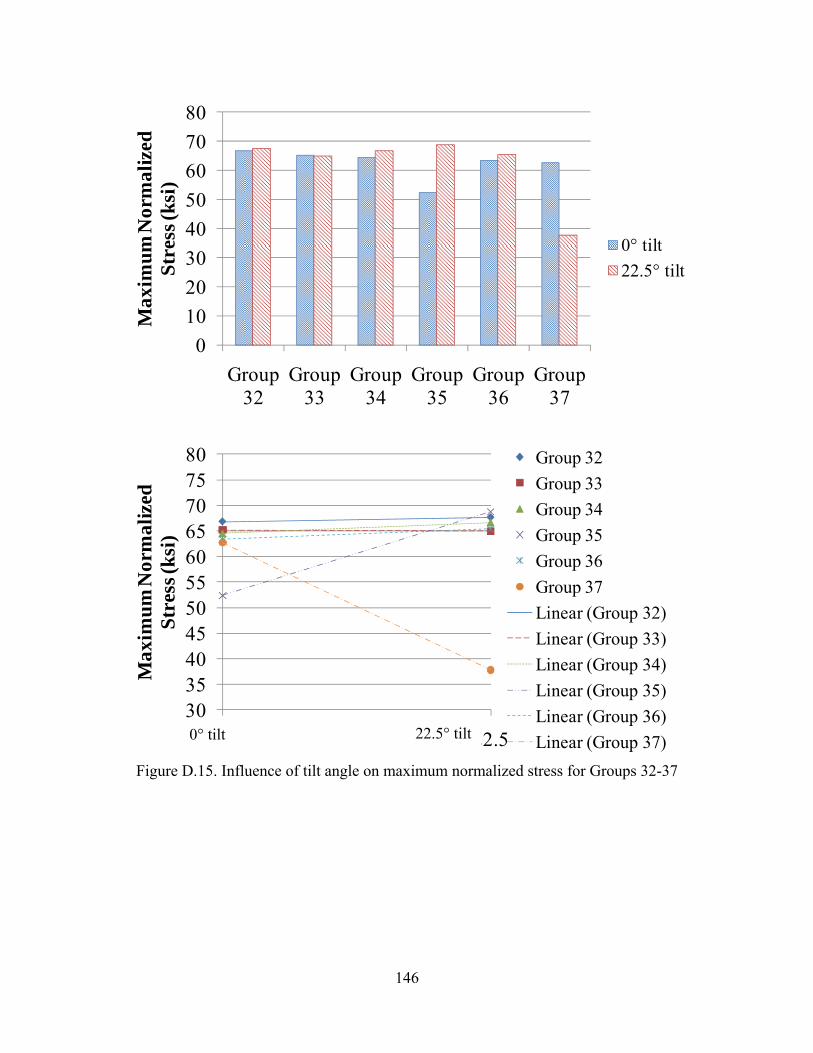
146
01020304050607080
Group 32
Group 33
Group 34
Group 35
Group 36
Group 37
Max
imu
m N
orm
aliz
ed
Str
ess (
ksi)
0° tilt22.5° tilt
3035404550556065707580
0 22.5
Max
imum
Nor
mal
ized
S
tres
s (ks
i)
Group 32Group 33Group 34Group 35Group 36Group 37Linear (Group 32)Linear (Group 33)Linear (Group 34)Linear (Group 35)Linear (Group 36)Linear (Group 37)
Figure D.15. Influence of tilt angle on maximum normalized stress for Groups 32-37
0° tilt 22.5° tilt
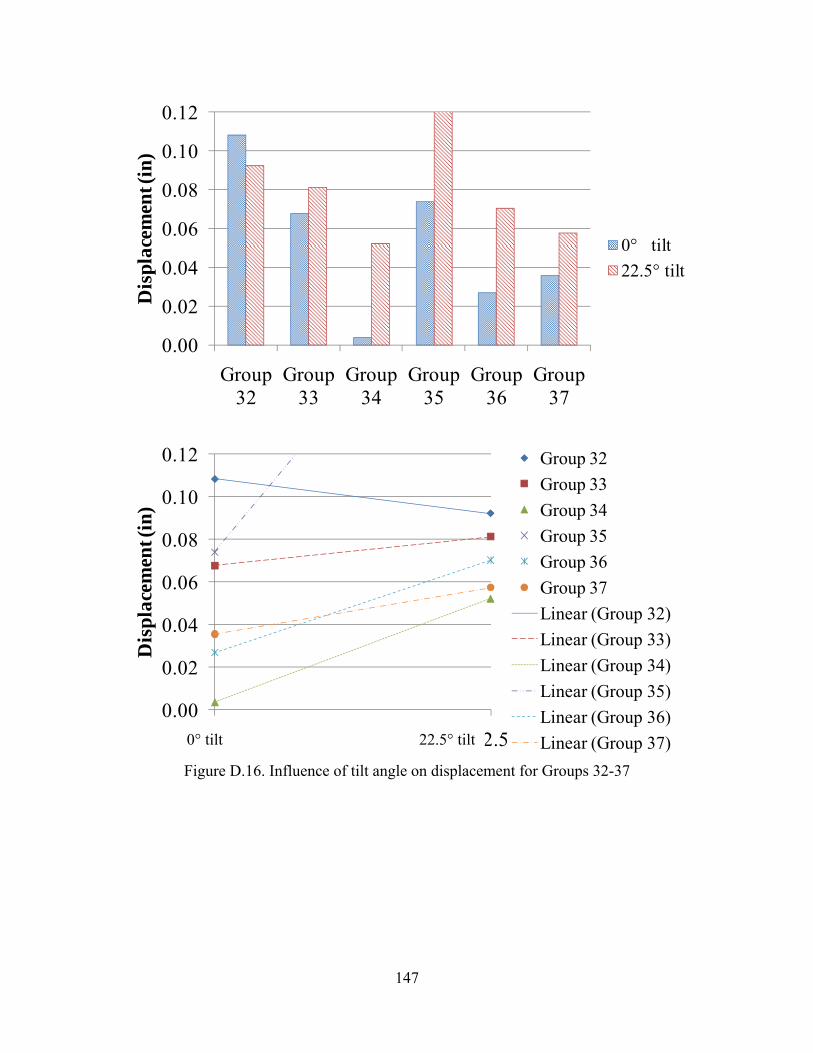
147
0.00
0.02
0.04
0.06
0.08
0.10
0.12
Group 32
Group 33
Group 34
Group 35
Group 36
Group 37
Dis
plac
emen
t (in
)
0° tilt22.5° tilt
0.00
0.02
0.04
0.06
0.08
0.10
0.12
0 22.5
Dis
pla
cem
ent (
in)
Group 32Group 33Group 34Group 35Group 36Group 37Linear (Group 32)Linear (Group 33)Linear (Group 34)Linear (Group 35)Linear (Group 36)Linear (Group 37)
Figure D.16. Influence of tilt angle on displacement for Groups 32-37
0° tilt 22.5° tilt
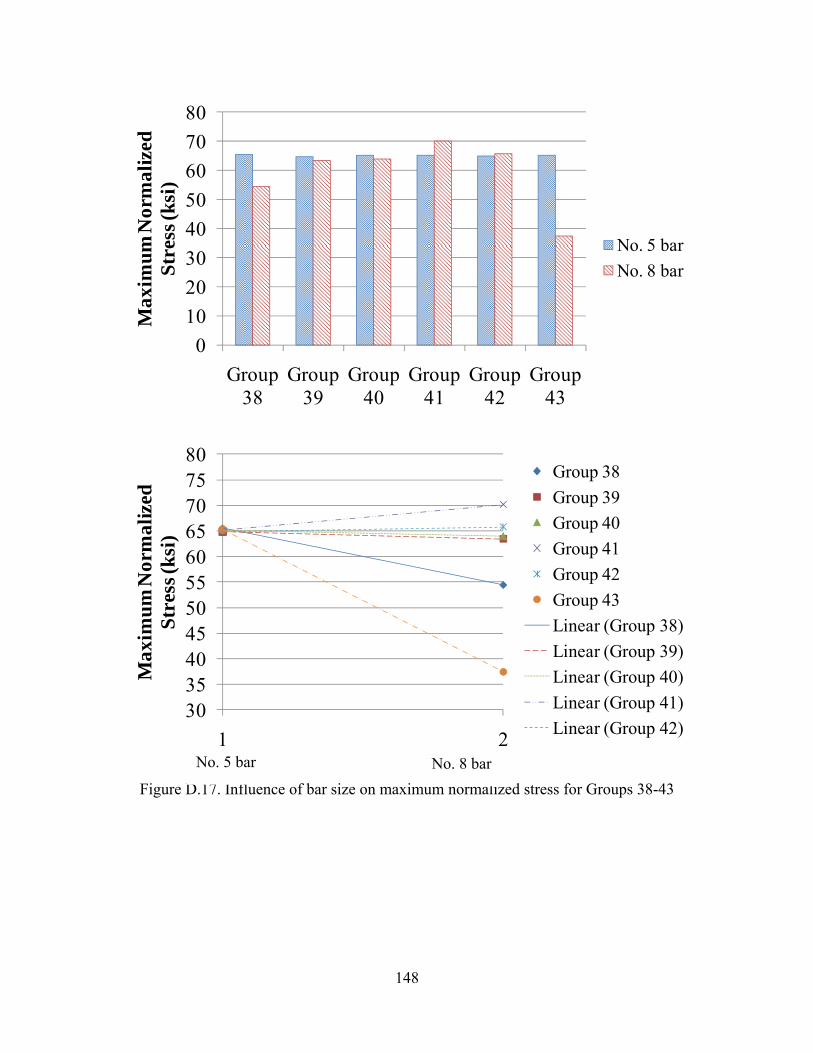
148
01020304050607080
Group 38
Group 39
Group 40
Group 41
Group 42
Group 43
Max
imu
m N
orm
aliz
ed
Str
ess (
ksi)
No. 5 barNo. 8 bar
3035404550556065707580
1 2
Max
imum
Nor
mal
ized
S
tres
s (ks
i)
Group 38Group 39Group 40Group 41Group 42Group 43Linear (Group 38)Linear (Group 39)Linear (Group 40)Linear (Group 41)Linear (Group 42)
Figure D.17. Influence of bar size on maximum normalized stress for Groups 38-43
No. 5 bar No. 8 bar
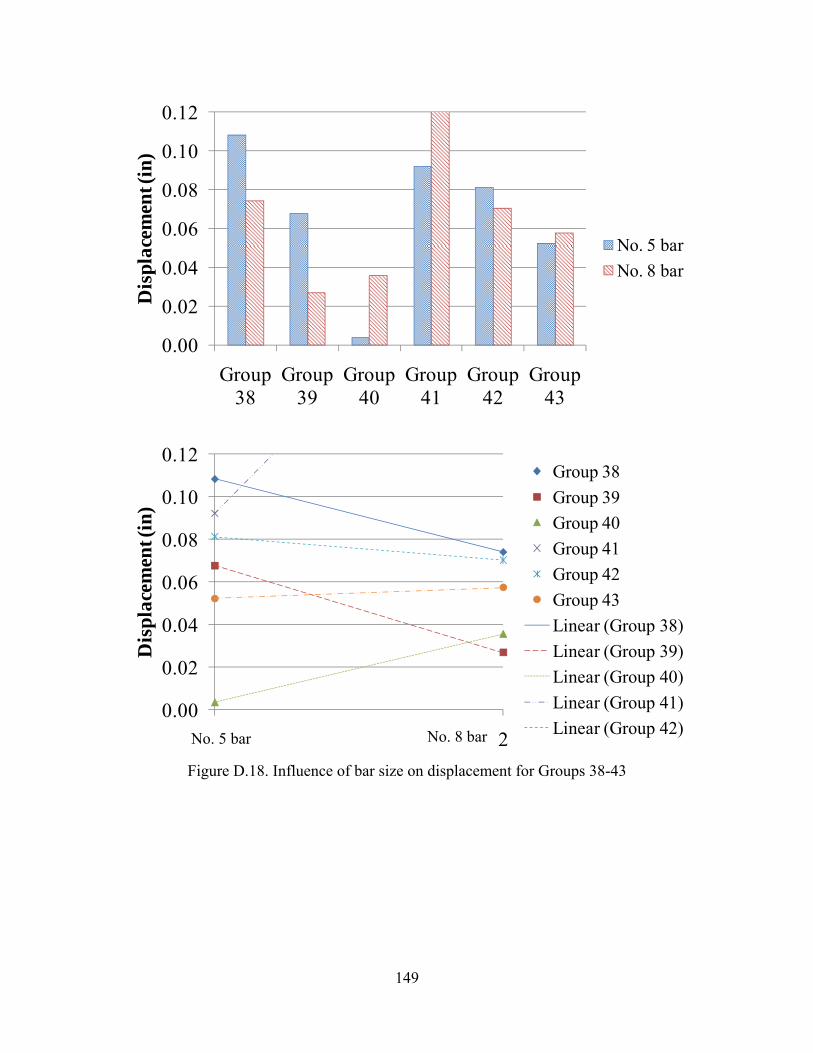
149
0.00
0.02
0.04
0.06
0.08
0.10
0.12
Group 38
Group 39
Group 40
Group 41
Group 42
Group 43
Dis
plac
emen
t (in
)
No. 5 barNo. 8 bar
0.00
0.02
0.04
0.06
0.08
0.10
0.12
1 2
Dis
pla
cem
ent (
in)
Group 38Group 39Group 40Group 41Group 42Group 43Linear (Group 38)Linear (Group 39)Linear (Group 40)Linear (Group 41)Linear (Group 42)
Figure D.18. Influence of bar size on displacement for Groups 38-43
No. 5 bar No. 8 bar
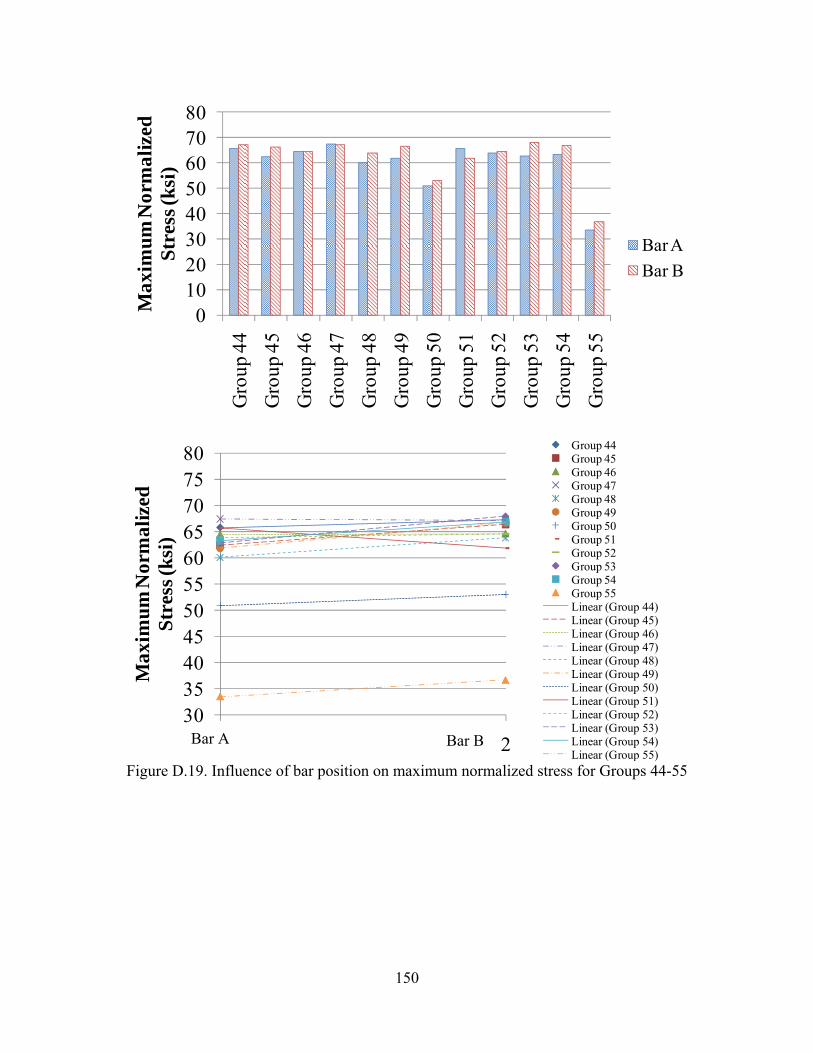
150
01020304050607080
Gro
up 4
4G
roup
45
Gro
up 4
6G
roup
47
Gro
up 4
8G
roup
49
Gro
up 5
0G
roup
51
Gro
up 5
2G
roup
53
Gro
up 5
4G
roup
55
Max
imu
m N
orm
aliz
ed
Str
ess (
ksi)
Bar ABar B
3035404550556065707580
1 2
Max
imu
m N
orm
aliz
ed
Str
ess
(ksi
)
Group 44Group 45Group 46Group 47Group 48Group 49Group 50Group 51Group 52Group 53Group 54Group 55Linear (Group 44)Linear (Group 45)Linear (Group 46)Linear (Group 47)Linear (Group 48)Linear (Group 49)Linear (Group 50)Linear (Group 51)Linear (Group 52)Linear (Group 53)Linear (Group 54)Linear (Group 55)
Figure D.19. Influence of bar position on maximum normalized stress for Groups 44-55
Bar A Bar B
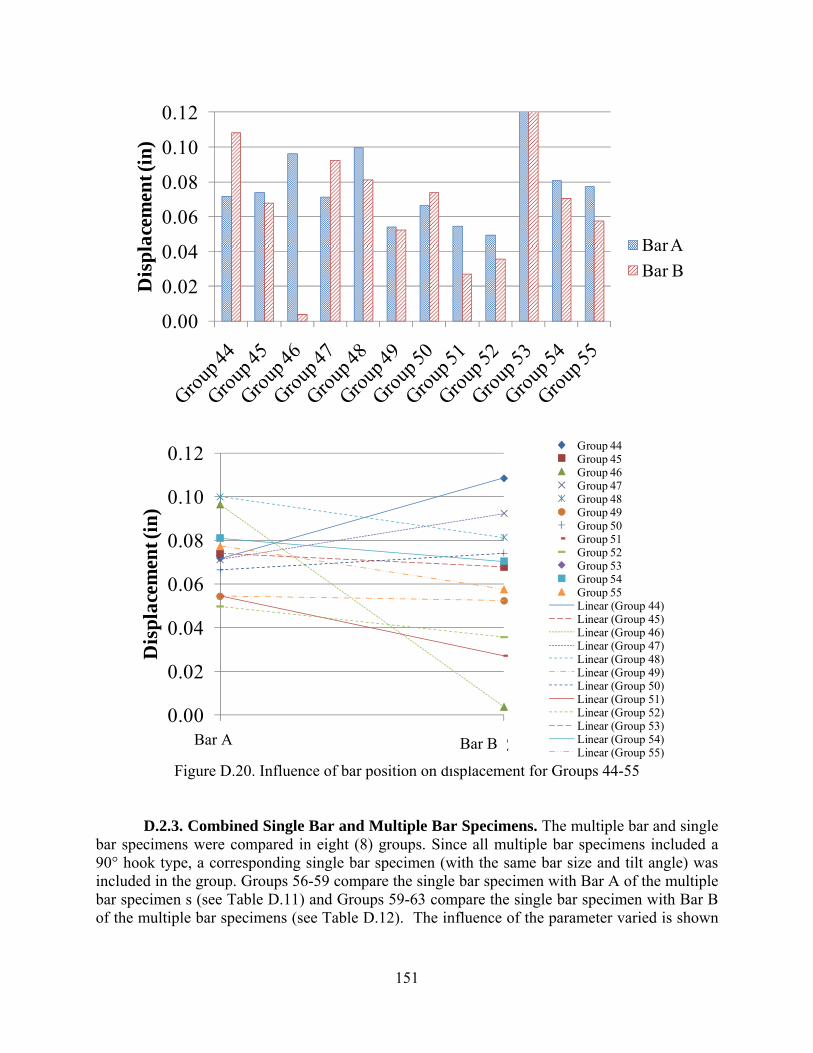
151
0.00
0.02
0.04
0.06
0.08
0.10
0.12D
ispl
acem
ent (
in)
Bar ABar B
0.00
0.02
0.04
0.06
0.08
0.10
0.12
1 2
Dis
plac
emen
t (in
)
Group 44Group 45Group 46Group 47Group 48Group 49Group 50Group 51Group 52Group 53Group 54Group 55Linear (Group 44)Linear (Group 45)Linear (Group 46)Linear (Group 47)Linear (Group 48)Linear (Group 49)Linear (Group 50)Linear (Group 51)Linear (Group 52)Linear (Group 53)Linear (Group 54)Linear (Group 55)
Figure D.20. Influence of bar position on displacement for Groups 44-55
D.2.3. Combined Single Bar and Multiple Bar Specimens. The multiple bar and single bar specimens were compared in eight (8) groups. Since all multiple bar specimens included a 90° hook type, a corresponding single bar specimen (with the same bar size and tilt angle) was included in the group. Groups 56-59 compare the single bar specimen with Bar A of the multiple bar specimen s (see Table D.11) and Groups 59-63 compare the single bar specimen with Bar B of the multiple bar specimens (see Table D.12). The influence of the parameter varied is shown
Bar A Bar B

152
in terms of maximum bar stress (T1) and normalized displacement (S1*) in Figures D.21 to D.24. In the line graphs, linear trend lines are also shown.
Table D.11. Combined Single Bar and Multiple Bar Specimen Results, Groups 56-59 f'c (psi) f'c avg (psi)
SQRT (f'c/f'c avg)
T1 (ksi) S1 (in) S1* Failure Mode
BE-5-90-0-G0.5A Bar A 4970 5328 0.97 65.7 0.072 0.069 YBE-5-90-0-GA Bar A 5350 5328 1.00 62.4 0.074 0.074 YBE-5-90-0-G2A Bar A 4840 5328 0.95 64.4 0.096 0.092 C
6150 5328 1.07 60.3 0.034 0.037 YBE-5-90-22.5-G0.5A Bar A 4840 5195 0.97 67.4 0.071 0.069 Y
BE-5-90-22.5-GA Bar A 4970 5195 0.98 60.1 0.100 0.098 YBE-5-90-22.5-G2A Bar A 4840 5195 0.97 61.8 0.054 0.052 Y
6130 5195 1.09 60.9 0.014 0.016 YBE-8-90-0-G0.5A Bar A 4470 5228 0.92 50.9 0.066 0.061 C
BE-8-90-0-GA Bar A 4850 5228 0.96 65.7 0.055 0.053 Y, CBE-8-90-0-G2A Bar A 5020 5228 0.98 63.8 0.050 0.049 C
6570 5228 1.12 62.1 0.028 0.032 YBE-8-90-22.5-G0.5A Bar A 4260 5158 0.91 62.9 0.201 0.183 S
BE-8-90-22.5-GA Bar A 5310 5158 1.01 63.3 0.081 0.082 YBE-8-90-22.5-G2A Bar A 4450 5158 0.93 33.5 0.077 0.072 C
6610 5158 1.13 60.8 0.065 0.074 Y
Para
met
er v
arie
d =
sing
le o
r mul
tiple
bar
Gro
up 5
7G
roup
58
Sing
le B
ar a
nd M
ultip
le B
ar S
peci
men
s - B
ar A
Gro
up 5
6
Specimen
BE-5-90-0
BE-5-90-22.5
BE-8-90-0
BE-8-90-22.5
Gro
up 5
9
Table D.12. Combined Single Bar and Multiple Bar Specimen Results, Groups 60-63 f'c (psi) f'c avg (psi)
SQRT (f'c/f'c avg)
T1 (ksi) S1 (in) S1* Failure Mode
BE-5-90-0-G0.5A Bar B 4970 5328 0.97 67.3 0.108 0.105 YBE-5-90-0-GA Bar B 5350 5328 1.00 66.4 0.068 0.068 YBE-5-90-0-G2A Bar B 4840 5328 0.95 64.6 0.004 0.004 Y, C
6150 5328 1.07 60.3 0.034 0.037 YBE-5-90-22.5-G0.5A Bar B 4840 5195 0.97 67.2 0.092 0.089 Y
BE-5-90-22.5-GA Bar B 4970 5195 0.98 63.8 0.081 0.080 YBE-5-90-22.5-G2A Bar B 4840 5195 0.97 66.7 0.052 0.051 Y
6130 5195 1.09 60.9 0.014 0.016 YBE-8-90-0-G0.5A Bar B 4470 5228 0.92 53.0 0.074 0.069 C
BE-8-90-0-GA Bar B 4850 5228 0.96 61.9 0.027 0.026 Y, CBE-8-90-0-G2A Bar B 5020 5228 0.98 64.6 0.036 0.035 C
6570 5228 1.12 62.1 0.028 0.032 YBE-8-90-22.5-G0.5A Bar B 4260 5158 0.91 67.9 0.230 0.209 S
BE-8-90-22.5-GA Bar B 5310 5158 1.01 66.9 0.070 0.071 YBE-8-90-22.5-G2A Bar B 4450 5158 0.93 36.7 0.057 0.053 C
6610 5158 1.13 60.8 0.065 0.074 Y
Para
met
er v
arie
d =
sing
le o
r mul
tiple
bar
BE-5-90-22.5
BE-8-90-0
BE-8-90-22.5
Sing
le B
ar a
nd M
ultip
le B
ar S
peci
men
s - B
ar B
Gro
up 6
0G
roup
61
Gro
up 6
2G
roup
63
Specimen
BE-5-90-0
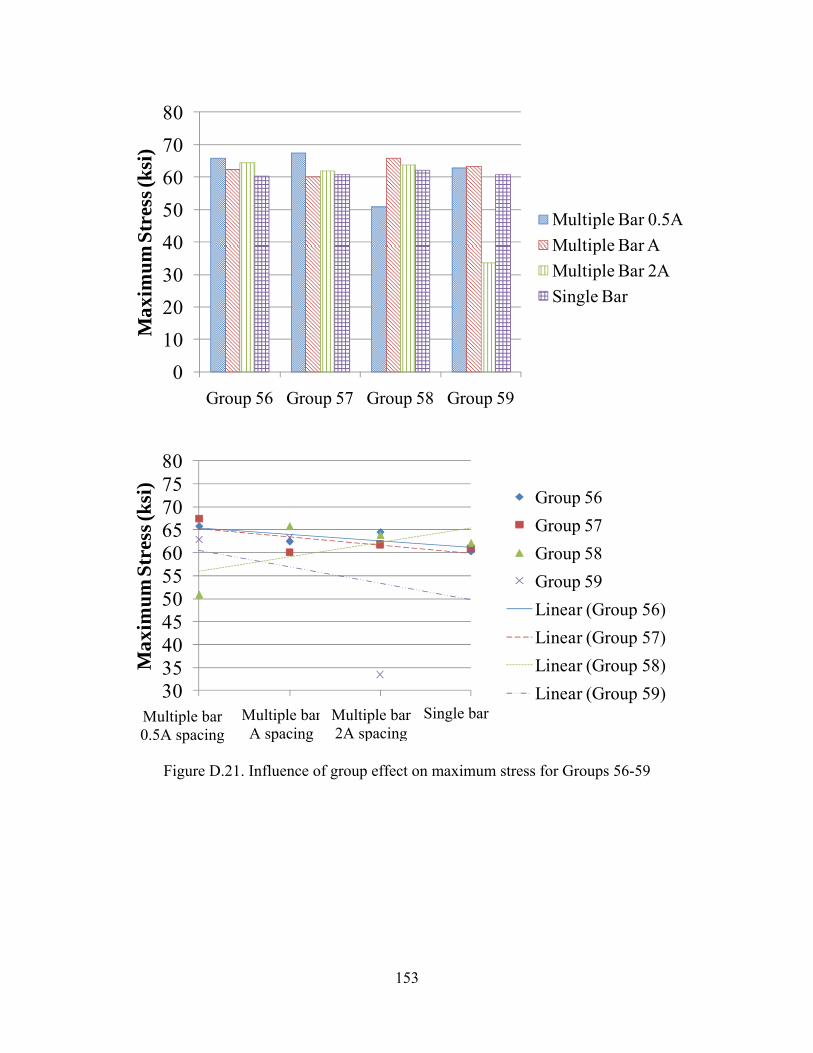
153
01020304050607080
Group 56 Group 57 Group 58 Group 59
Max
imu
m S
tres
s (k
si)
Multiple Bar 0.5AMultiple Bar AMultiple Bar 2ASingle Bar
3035404550556065707580
1 2 3 4
Max
imum
Str
ess
(ksi
)
Group 56Group 57Group 58Group 59Linear (Group 56)Linear (Group 57)Linear (Group 58)Linear (Group 59)
Figure D.21. Influence of group effect on maximum stress for Groups 56-59
Multiple bar 0.5A spacing
Single bar Multiple bar A spacing
Multiple bar 2A spacing
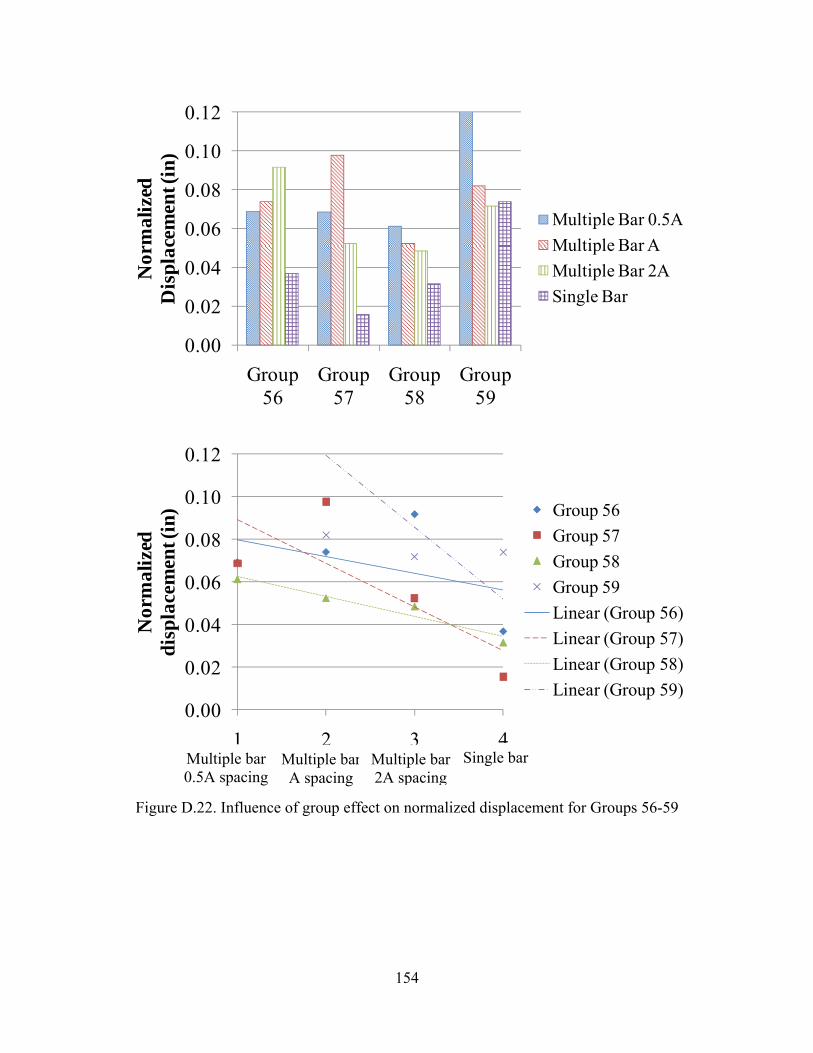
154
0.00
0.02
0.04
0.06
0.08
0.10
0.12
Group 56
Group 57
Group 58
Group 59
Nor
mal
ized
D
ispl
acem
ent (
in)
Multiple Bar 0.5AMultiple Bar AMultiple Bar 2ASingle Bar
0.00
0.02
0.04
0.06
0.08
0.10
0.12
1 2 3 4
Nor
mal
ized
d
isp
lace
men
t (in
) Group 56Group 57Group 58Group 59Linear (Group 56)Linear (Group 57)Linear (Group 58)Linear (Group 59)
Figure D.22. Influence of group effect on normalized displacement for Groups 56-59
Multiple bar 0.5A spacing
Single bar Multiple bar A spacing
Multiple bar 2A spacing
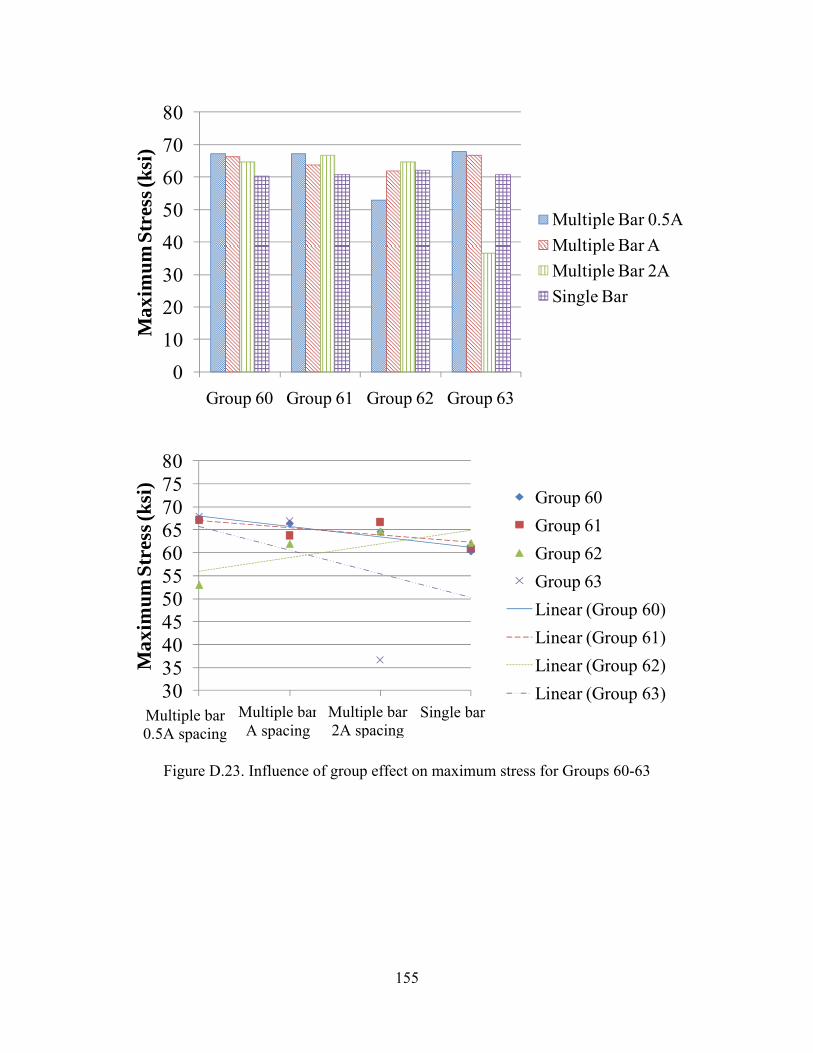
155
01020304050607080
Group 60 Group 61 Group 62 Group 63
Max
imu
m S
tres
s (k
si)
Multiple Bar 0.5AMultiple Bar AMultiple Bar 2ASingle Bar
3035404550556065707580
1 2 3 4
Max
imum
Str
ess
(ksi
)
Group 60Group 61Group 62Group 63Linear (Group 60)Linear (Group 61)Linear (Group 62)Linear (Group 63)
Figure D.23. Influence of group effect on maximum stress for Groups 60-63
Multiple bar 0.5A spacing
Single bar Multiple bar A spacing
Multiple bar 2A spacing

156
0.00
0.02
0.04
0.06
0.08
0.10
0.12
Group 60
Group 61
Group 62
Group 63
Nor
mal
ized
D
ispl
acem
ent (
in)
Multiple Bar 0.5AMultiple Bar AMultiple Bar 2ASingle Bar
0.00
0.02
0.04
0.06
0.08
0.10
0.12
1 2 3 4
Nor
mal
ized
D
isp
lace
men
t (in
) Group 60Group 61Group 62Group 63Linear (Group 60)Linear (Group 61)Linear (Group 62)Linear (Group 63)
Figure D.24. Influence of group effect on normalized displacement for Groups 60-63
Multiple bar 0.5A spacing
Single bar Multiple bar A spacing
Multiple bar 2A spacing
157
REFERENCES ACI Committee 408. Bond and Development of Straight Reinforcing Bars in Tension (ACI 408R-
03). Farmington Hills, MI: American Concrete Institute, 2003. ACI Committee 408. Splice and Development Length of High Relative Rib Area Reinforcing
Bars in Tension (408.3-01) and Commentary (408.3R-01). Farmington Hills, MI: American Concrete Institute, 2001.
ACI Committee 408. Suggested Development, Splice, and Standard Hook Provisions for Deformed Bars in Tension. Report No. ACI 408.1R-79. Concrete International. July 1979.
ACI Committee 408. Building Code Requirements for Structural Concrete (ACI 318-08) and Commentary. Farmington Hills, MI: American Concrete Institute, 2008.
Cairns, J., and G. A. Plizzari. "Towards a Harmonised European Bond Test." Materials and Structures Vol. 36. 2003.
CRSI Design Handbook. Schaumburg, IL: Concrete Reinforcing Steel Institute, 2008. Ehsani, M. R., H. Saadatmanesh, and S. Tao. Bond of Hooked Glass Fiber Reinforced Plastic
(GFRP) Reinforcing Bars to Concrete. 4th ed. Vol. 92. American Concrete Institute Materials Journal, July-August 1995.
Hamad, Bilal S., James O. Jirsa, and Natalie I. D’Abreau de Paulo. Anchorage Strength of Epoxy-Coated Hooked Bars. ACI Structural Journal. March-April 1993.
Jirsa, James, LeRoy A. Lutz, and Peter Gergely. Rationale for Suggested Development, Splice, and Standard Hook Provisions for Deformed Bars in Tension. Concrete International. July 1979.
Jirsa, J. O., and José L. G. Marques. A Study of Hooked Bar Anchorages in Beam-column Joints. Austin: Dept. of Civil Engineering, Structures Research Laboratory, University of Texas at Austin, 1972.
Marques, Jose. A Study of Anchorage Capacities of Confined Bent-Bar Reinforcement. Diss. Rice University. 1973.
Marques, Jose and James Jirsa. A Study of Hooked Bar Anchorages in Beam-Column Joints. ACI Journal. May 1975.
Minor, John and James Jirsa. Behavior of Bent Bar Anchorages. ACI Journal. April 1975. Minor, John. A Study of Bent Bar Anchorages. Diss. Rice University, 1971. Okelo, Roman. Realistic Bond Strength of FRP Reinforced in NSC from Beam Specimen. Journal
of Aerospace Engineering (ASCE). July 2007. Okelo, Roman and Robert L. Yuan. Bond Strength of Fiber Reinforced Polymer Rebars in
Normal Strength Concrete. Journal of Composites for Construction (ASCE). May/June 2005.
Pecce, Manfredi, Realfonzo, and Cosenza. Experimental and Analytical Evaluation of Bond Properties of GFRP Bars. Journal of Materials in Civil Engineering. July/August 2001.
Rehm, Gallus, and Amerongen C. Van. The Basic Principles of the Bond between Steel and Concrete. London: Cement and Concrete Association, 1961.
RILEM Technical Recommendations for the Testing and Use of Construction Materials (1994) the “Bond test for reinforcement steel. 1. Beam test” (RILEM RC5, 1982) and the “Bond test for reinforcement steel. 2. Pullout test” (RILEM RC6, 1983).
Standard Practice for Making and Curing Concrete Test Specimens in the Field (ASTM C31-09). West Conshohocken, PA: American Society for Testing and Materials, 2009.

158
Standard Specification for Concrete Aggregates (ASTM C33-08). West Conshohocken, PA: American Society for Testing and Materials, 2008.
Standard Specification for Deformed and Plain Carbon-Steel Bars for Concrete Reinforcement (ASTM A615-09). West Conshohocken, PA: American Society for Testing and Materials, 2009.
Standard Test Method for Air Content of Freshly Mixed Concrete by the Pressure Method (ASTM C231-09). West Conshohocken, PA: American Society for Testing and Materials, 2009.
Standard Test Method for Comparing Bond Strength of Steel Reinforcing Bars to Concrete Using Beam-end Specimens (ASTM A944-10). West Conshohocken, PA: American Society for Testing and Materials, 2010.
159
ACKNOWLEDGEMENTS This research was conducted with the sponsorship of the Concrete Reinforcing Steel Institute (CRSI) and the National University Transportation Center (NUTC) at the Missouri University of Science and Technology. Longitudinal reinforcing steel and bar supports used in this work were generously provided by Ambassador Steel Corporation and Gateway Building Products. The authors wish to thank Neal Anderson of CRSI and Donald Meinheit of Wiss, Janney, Elstner Associates, Inc. who served as advisors to this project; their assistance and input are greatly appreciated. Additionally, the authors gratefully acknowledge the assistance provided by Ruili He, who assisted with the testing and analysis.