Evaluation of the implementation and health-related ...piru.lshtm.ac.uk/assets/files/Cold Weather...
98
Evaluation of the implementation and health-related impacts of the Cold Weather Plan for England 2012 Final report PIRU Publication 2015-14 Zaid Chalabi, Bob Erens, Shakoor Hajat, Catherine Heffernan, Lorelei Jones, Nicholas Mays, Benjamin Ritchie and Paul Wilkinson
Transcript of Evaluation of the implementation and health-related ...piru.lshtm.ac.uk/assets/files/Cold Weather...

Evaluation of the implementation and health-related impacts of the Cold Weather Plan for England 2012Final report
PIRU Publication 2015-14
Zaid Chalabi, Bob Erens, Shakoor Hajat, Catherine Heffernan, Lorelei Jones, Nicholas Mays, Benjamin Ritchie and Paul Wilkinson

For further details, please contact:
Bob ErensPolicy Innovation Research Unit (PIRU)Department of Health Services Research & PolicyLondon School of Hygiene and Tropical Medicine15–17 Tavistock PlaceLondon WC1H 9SHEmail: [email protected]
© Copyright 2015. Not to be reproduced without permission.

Evaluation of the implementation and health-related impacts of the Cold Weather Plan for England 2012Final report
February 2015
Zaid Chalabi, Bob Erens, Shakoor Hajat, Catherine Heffernan, Lorelei Jones, Nicholas Mays, Benjamin Ritchie and Paul Wilkinson

AcknowledgementsThis work is funded by the Policy Research Programme of the Department of Health for England via its core support for the Policy Research Unit in Policy Innovation Research. This is an independent report commissioned and funded by the Department of Health. The views expressed are not necessarily those of the Department.
We thank the study participants; Rebecca Cheatle for co-ordinating, and the Royal College of Nursing for undertaking, the survey of primary care and community health services nurses among their membership; Gilliam Elam for helping with the design of the qualitative component of study and assisting with the interviews; the Advisory Group for their helpful advice and comments throughout the study; and, for their advice and assistance with this project: Virginia Murray, Angie Bone, Carl Petrokofsky and Kevyn Austyn from Public Health England; and Benjamin Evans, Katie Russell, Patrick Sachon, Christophe Sarran and Hazel Thornton from the Met Office.
Evaluation of the implementation and health-related impacts of the Cold Weather Plan for England 2012
Contents Key findings 1
Summary Background 2Section A Relationship between weather, health and use
of health services (objective 1) 4Section B1 Implementation of Cold Weather Plan, 2012/13 (objective 2) 6Section B2 Support received by potentially at-risk individuals
during periods of cold weather (objective 3) 9Section C Cost-effectiveness of the CWP (objective 4) 9Conclusions 12
Section A Relationship between weather, health and use of health services
Methods 14Results 15Discussion 26Strengths and limitations 27Conclusions 27
Section B1 Implementation of Cold Weather Plan, 2012/13 Methods 28Findings from interviews with health and social care managers in ten areas 34Findings from the national web survey of primary and community health
services nurses 48
Section B2 Support received by potentially at-risk individuals during periods of cold weather 55
Discussion 59Conclusion 64
Appendix B1 Topic guide for interviews with local authority and health service managers 67
Section C Cost-effectiveness analysis of the Cold Weather Plan for England
Introduction 70Methods 74Results 80Discussion 83Conclusion 84
Appendix C1 Calculation of health benefits associated with deaths and hospital admissions 88
Appendix C2 Selection of temperature time series 89
Appendix C3 Fitting extreme value probability distribution to CET data 90
Appendix C4 Total primary care, community care and hospital costs 91

Evaluation of the implementation and health-related impacts of the Cold Weather Plan for England 2012
1
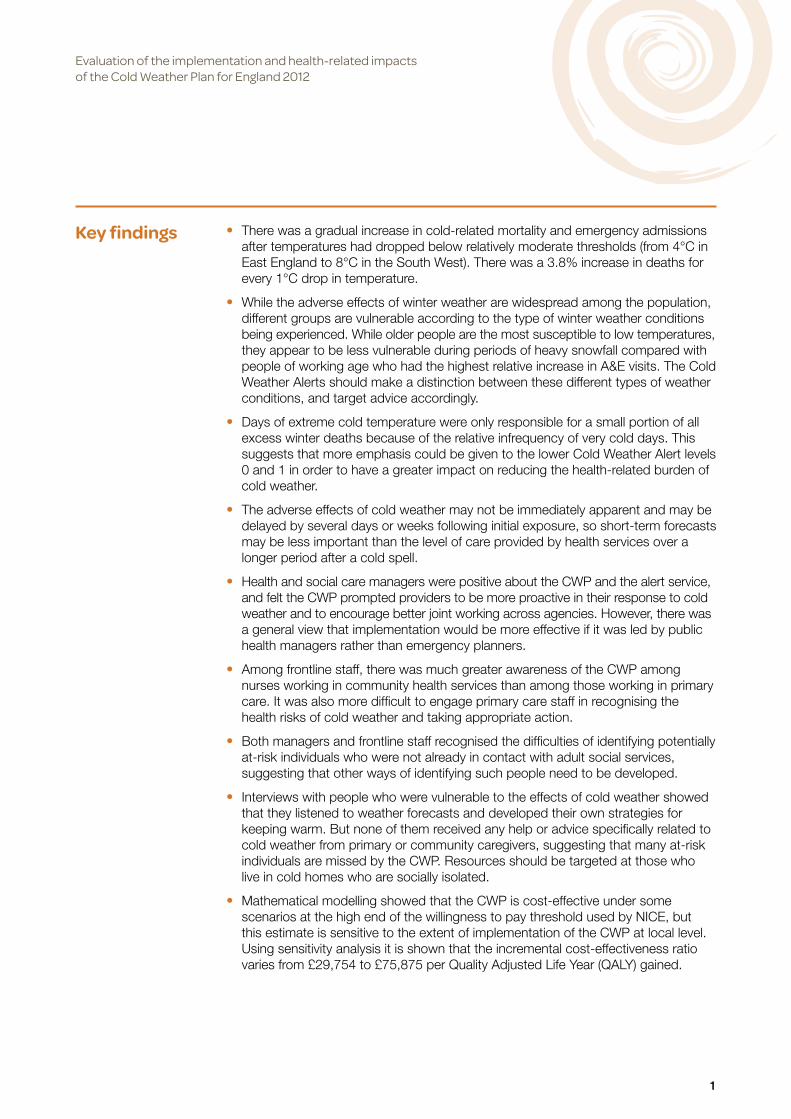
Key findings • There was a gradual increase in cold-related mortality and emergency admissions after temperatures had dropped below relatively moderate thresholds (from 4°C in East England to 8°C in the South West). There was a 3.8% increase in deaths for every 1°C drop in temperature.
• While the adverse effects of winter weather are widespread among the population, different groups are vulnerable according to the type of winter weather conditions being experienced. While older people are the most susceptible to low temperatures, they appear to be less vulnerable during periods of heavy snowfall compared with people of working age who had the highest relative increase in A&E visits. The Cold Weather Alerts should make a distinction between these different types of weather conditions, and target advice accordingly.
• Days of extreme cold temperature were only responsible for a small portion of all excess winter deaths because of the relative infrequency of very cold days. This suggests that more emphasis could be given to the lower Cold Weather Alert levels 0 and 1 in order to have a greater impact on reducing the health-related burden of cold weather.
• The adverse effects of cold weather may not be immediately apparent and may be delayed by several days or weeks following initial exposure, so short-term forecasts may be less important than the level of care provided by health services over a longer period after a cold spell.
• Health and social care managers were positive about the CWP and the alert service, and felt the CWP prompted providers to be more proactive in their response to cold weather and to encourage better joint working across agencies. However, there was a general view that implementation would be more effective if it was led by public health managers rather than emergency planners.
• Among frontline staff, there was much greater awareness of the CWP among nurses working in community health services than among those working in primary care. It was also more difficult to engage primary care staff in recognising the health risks of cold weather and taking appropriate action.
• Both managers and frontline staff recognised the difficulties of identifying potentially at-risk individuals who were not already in contact with adult social services, suggesting that other ways of identifying such people need to be developed.
• Interviews with people who were vulnerable to the effects of cold weather showed that they listened to weather forecasts and developed their own strategies for keeping warm. But none of them received any help or advice specifically related to cold weather from primary or community caregivers, suggesting that many at-risk individuals are missed by the CWP. Resources should be targeted at those who live in cold homes who are socially isolated.
• Mathematical modelling showed that the CWP is cost-effective under some scenarios at the high end of the willingness to pay threshold used by NICE, but this estimate is sensitive to the extent of implementation of the CWP at local level. Using sensitivity analysis it is shown that the incremental cost-effectiveness ratio varies from £29,754 to £75,875 per Quality Adjusted Life Year (QALY) gained.

Evaluation of the implementation and health-related impacts of the Cold Weather Plan for England 2012
2
Background
On average, about 27,000 more people die in England during the winter months (December to March) than expected from the death rates at other times of the year (Department of Health 2011a). Many of these excess winter deaths are attributable to cold weather, and their number may increase substantially during periods of very severe cold weather, such as in 2008-09 when there were 34,000 ‘excess’ deaths (Office for National Statistics 2012). In addition, many people visit GPs and hospitals during winter with a range of cold weather-related health problems. Cold winter weather directly leads to increases of heart attack, stroke, respiratory disease, influenza, falls and injuries, and hypothermia; it can also indirectly affect mental health illnesses and carbon monoxide poisoning from poorly maintained boilers, etc (Department of Health 2011a). There is an estimated annual cost to the NHS of treating winter-related disease due to cold private housing of over £850m (Department of Health 2010).
This excess mortality and morbidity is predictable and largely preventable. England does not compare well with other northern European countries in this respect (Department of Health 2010). Countries with colder winter climates are often better prepared for winter, with better-insulated, well-heated housing, and people with warm outdoor clothing (Marmot Review Team 2011).
The Department of Health developed its first Cold Weather Plan (CWP) for England in 2011 in order “to avoid the adverse health effects [of winter cold] by raising public awareness and triggering actions by those in contact with people who are most at risk… [which in turn] could help to reduce pressures on the health and social care system in the busiest months of the year”. The goal of the CWP is to reduce both the health burden of cold weather and health inequalities across the country (Department of Health 2011b).
It aims to do this “by building on established national and local campaigns for winter health with a more co-ordinated approach”. Actions involve:
• the NHS, social care and other public agencies • professionals working with people at risk, and • individuals and local communities.
Central to the CWP is the Cold Weather Alert service, following the system established in 2004 for the Heat Wave Plan for England. Cold Weather Alerts, linked to the Met Office winter weather warning system, trigger graded actions up to a major incident. The alert levels are:
Level 0 Long-term planning (all year)
Level 1 Winter preparedness programme (1 November to 31 March)
Level 2 Severe winter weather is forecast – Alert and readiness. Mean temperature of 2°C or less for a period of at least 48 hours and/or widespread ice and heavy snow is predicted within 48 hours, with 60% confidence.
Level 3 Response to severe winter weather – Severe weather action. Mean temperature of 2°C or less for a period of at least 48 hours and/or widespread ice and heavy snow.
Level 4 Major incident – Emergency response. Central government will declare a Level 4 alert in the event of severe or prolonged cold weather affecting sectors other than health.
Summary

Evaluation of the implementation and health-related impacts of the Cold Weather Plan for England 2012
3
The CWP, which is mainly targeted at improving the response of local health and social care services, sets out what should happen before and during severe winter weather, including the preparations that people and organisations could take in order to reduce health risks and protect vulnerable groups. The CWP also provides good practice guidance and advice on how to respond and what to do once severe weather has been forecast.
After piloting the plan and the Cold Weather Alert service in 2010-11, the CWP was rolled out across England in 2011-12. In October 2012, after the first year, PIRU was commissioned to carry out an independent evaluation of the operation of the CWP during the winter of 2012-13.
The evaluation aimed to examine, firstly, the extent to which the CWP was implemented at local level, the extent to which it had changed local practices, and whether the CWP was reaching its target groups in the population. Secondly, it examined the impact and cost-effectiveness of the CWP on health and demand for health care, and on the operation of health services. Thirdly, it was also thought beneficial to develop a fuller understanding of the relationship between weather and health in order to model the potential health and health service impacts that could arise from a range of weather conditions in the medium term, and the potential impact of the CWP in mitigating adverse impacts (e.g. by ensuring that the Cold Weather Alerts were being triggered at appropriate temperatures).
Because only one year of post-intervention data was available to look at the impact of the CWP quantitatively, the evaluation largely focused on describing and understanding how and to what extent the plan was implemented, and identifying any implementation issues at an early stage to enable suitable amendments to be incorporated into the CWP for the following winter, 2013/14.
The evaluation had four main objectives to:
• characterise the health-related impacts of low temperature (mortality, hospital admissions, A&E attendance) in order to provide a baseline level of winter burdens before the advent of the CWP
• assess the implementation (and costs, if possible) of the CWP in 2012-13 at the local level and examine how this compared with expectations
• undertake preliminary work looking at the level and nature of support received by ‘at-risk’ individuals in the population before and during periods of severe cold weather
• model the probabilities of various forms of extreme weather events and associated health impacts, under varying assumptions of the effectiveness of the CWP, in order to inform the future design of the CWP by modelling the likely costs and benefits of the CWP under different scenarios (e.g. of uptake).
In order to meet these objectives, the evaluation included four components:
• A time series analysis of regional health data (14 years for mortality and hospital admissions, shorter periods for A&E visits) linked to weather by location and date in order to characterise weather-health relationships and trends over time, and their yearly variations. While the main focus was assessing the health effects of low temperature throughout the winter months, the impact of periods of heavy snowfall was also examined. The analysis built on earlier work by defining regional cold thresholds and effects using state-of-the-art methods. The analysis also assessed the modification of cold effects by age group, disease, socio-economic status and other risk factors. The trends identified form a baseline for assessing the impact of the implementation of the CWP in future winters.

Evaluation of the implementation and health-related impacts of the Cold Weather Plan for England 2012
4
• The second component looked at: operational policy changes at local level and the extent of variation between areas; actions taken at local level by the health and social care system; and the extent of new activities motivated by the CWP. This information was obtained from ten purposively selected local authorities and associated National Health Service (NHS) primary care trusts (PCTs)/clinical commissioning groups (CCGs) spread throughout the country (at least one in each region). As well as a documentary analysis of plans, ‘good practice’ guides, etc., related to implementing the CWP, interviews were held with senior managers of health and social care organisations. A national survey of primary care and community health services nurses was also conducted in order to obtain a picture of responses of front line staff to preparations arising from the CWP and to specific cold weather alerts. Interviews were also carried out with care home managers in two areas.
• A preliminary study of a cohort of at-risk individuals looked at the nature and level of support they received before and during periods of cold weather. Soon after a Cold Weather Alert was issued, interviews were carried out with 35 at-risk individuals (e.g. people aged 75+ living alone) from two of the local authorities included in the study. These individuals were interviewed twice over the winter of 2012/13, immediately after Level 3 alerts were issued.
• Based on the time-series analysis and the interviews with health and social care managers, mathematical modelling was used to simulate the likely costs and benefits of the CWP by varying key parameters such as the upper bound of the effectiveness of the Plan, the proportion of the population subject to intervention and the time horizon of the cost-effectiveness analysis.
The evaluation started in autumn 2012, with data collection completed by May 2013. Initial findings were presented to the Department of Health and Public Health England in July 2013 (Public Health England 2013). The main results are reported in three papers (comprising the rest of this report), and are summarised below.
Section A Relationship between weather, health and use of health services (objective 1)
The first component of the study looked at the relationships between weather and mortality and use of health services. This provides baseline measures against which the impact of the CWP can be assessed in future years.
There were two analyses. The first was time series regression analysis to characterise temperature-health relationships occurring throughout the winter months, focusing on mortality and emergency hospital admissions. Since the effects of cold temperatures can be delayed by a few days or even weeks, the impact of cold weather over the following 4-week period was examined.
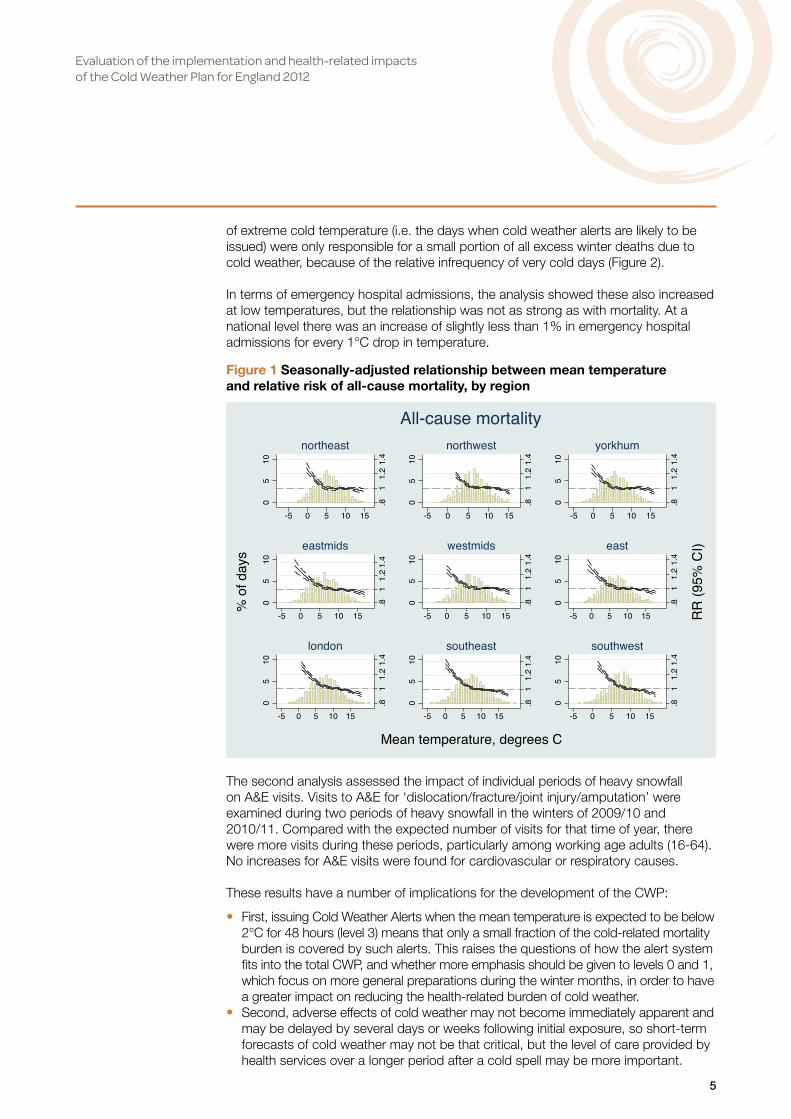
The data showed that there was a gradual increase in cold-related health events (i.e. increased risk of death or emergency admission) after temperatures had dropped below certain threshold levels, and that these thresholds occurred at relatively moderate temperatures (from 4°C daily mean temperature in East England to 8°C in the South West (Figure 1).
Deaths due to low temperature were apparent in all age groups in the population, but were particularly concentrated among elderly people aged 75+ years. Nationally, there was a 3.8% increase in deaths for every 1°C drop in temperature. Deaths from respiratory causes were particularly likely to increase. The data also showed that days
Evaluation of the implementation and health-related impacts of the Cold Weather Plan for England 2012
5
of extreme cold temperature (i.e. the days when cold weather alerts are likely to be issued) were only responsible for a small portion of all excess winter deaths due to cold weather, because of the relative infrequency of very cold days (Figure 2).
In terms of emergency hospital admissions, the analysis showed these also increased at low temperatures, but the relationship was not as strong as with mortality. At a national level there was an increase of slightly less than 1% in emergency hospital admissions for every 1°C drop in temperature.
The second analysis assessed the impact of individual periods of heavy snowfall on A&E visits. Visits to A&E for ‘dislocation/fracture/joint injury/amputation’ were examined during two periods of heavy snowfall in the winters of 2009/10 and 2010/11. Compared with the expected number of visits for that time of year, there were more visits during these periods, particularly among working age adults (16-64). No increases for A&E visits were found for cardiovascular or respiratory causes.
These results have a number of implications for the development of the CWP:
• First, issuing Cold Weather Alerts when the mean temperature is expected to be below 2°C for 48 hours (level 3) means that only a small fraction of the cold-related mortality burden is covered by such alerts. This raises the questions of how the alert system fits into the total CWP, and whether more emphasis should be given to levels 0 and 1, which focus on more general preparations during the winter months, in order to have a greater impact on reducing the health-related burden of cold weather.
• Second, adverse effects of cold weather may not become immediately apparent and may be delayed by several days or weeks following initial exposure, so short-term forecasts of cold weather may not be that critical, but the level of care provided by health services over a longer period after a cold spell may be more important.
Figure 1 Seasonally-adjusted relationship between mean temperature and relative risk of all-cause mortality, by region

Evaluation of the implementation and health-related impacts of the Cold Weather Plan for England 2012
6
• Third, while elderly people are clearly the most vulnerable to low temperatures, people of working age are most at risk of fractures etc. during periods of heavy snowfall. The CWP alerts therefore should distinguish between different types of cold weather conditions.
After the CWP has been in operation for several more years, sufficient data will be available to carry out similar analyses to determine whether there has been any reduction in the number of cold-related deaths and emergency hospital admissions that can be potentially attributed to the CWP.
Section B1 Implementation of the Cold Weather Plan, 2012/13 (objective 2)
This component of the evaluation aimed to assess how the CWP was implemented at the local level by the health and social care system. The study involved purposively selecting ten local authority areas (at least one from each region) which varied in terms of urban/rural (five of each) and level of deprivation (at least one from each Index of Multiple Deprivation (IMD) quintile). One locality with a high number of rough sleepers was selected, as was one local authority with a high proportion of non-native English speakers.
As well as documentary analysis of local cold weather plans and other relevant material, interviews were held with 46 health and social care managers in the ten areas between November 2012 and May 2013. The majority of interviews (25) were with local authority managers, followed by 13 with PCT/CCG managers, and a
Figure 2 Risk curve for the North East region in the winter months (October-March) and the fraction of deaths attributable to cold at varying temperature thresholds as a percentage of all cold-attributable deaths (all days below 6°C )

Evaluation of the implementation and health-related impacts of the Cold Weather Plan for England 2012
7
handful with NHS hospital trust and ambulance trust managers, and one each with a manager from the voluntary sector and a general practice. A further six interviews were carried out with care home managers in two local authority areas. Views from front-line staff were obtained from a web survey carried out in April and May 2013 with 437 primary care and community health services nurses (conducted using the Royal College of Nursing membership list).
Health and social care managers were broadly positive about the CWP and the alert service. The CWP appeared to prompt local service providers to be more proactive, rather than reactive, in their response to cold weather and to encourage better joint working across health and social care.
The main factors which account for the positive views of the CWP included:
• The CWP was seen as comprehensive, provided a useful reference guide for ‘good practice’, reinforced existing practice, increased coordination across organisations, and aligned with other policies such as the focus on prevention in the 2012 Social Care White Paper, the aim to reduce demand for health and social care services, and the goal to increase the level of integration between health and social care.
• The dedicated funding, in the form of the Warm Homes Healthy People Fund (now discontinued), which was instrumental in setting up initiatives that would not otherwise have happened.
• The CWP and alerts were used by managers to remind and encourage (often external) providers to undertake suggested actions, such as home insulation assessments and referrals.
While the CWP was often led by local authority emergency planners, there was a widespread view that it would be more effective if public health managers were in the lead, as this would enable greater focus on activities aimed at reducing cold-related morbidity and mortality, and facilitate coordination across departments and organisations.
A number of problems in implementing the CWP were also identified:
• identifying people who may be vulnerable to cold weather was often opportunistic rather than systematic
• pre-identifying vulnerable people was complicated by the number of agencies who had lists of vulnerable people and who were unwilling to share information without the person’s consent
• it was not always clear to managers which groups in the population they should be targeting since there was no agreed definition of ‘at-risk’, or what interventions were most likely to work
• people who were vulnerable to the cold but not in touch with social services might be overlooked
• some vulnerable people were not willing to accept the help on offer; • some local authorities found it difficult to engage primary care, especially GPs, in
cold weather planning and response • care for vulnerable people living at home was often contracted out to independent
sector providers, and commissioners could not be certain that the appropriate actions were carried out even if local plans and alerts were shared with these providers
• the CWP and Warm Homes Healthy People Fund were made available too late in the year so that, for example, home heating interventions could not be undertaken before the cold weather arrived.

Evaluation of the implementation and health-related impacts of the Cold Weather Plan for England 2012
8
The Cold Weather Alerts were valued by all the interview participants and used in a number of ways:
• for raising public awareness • mobilising partner agencies • prompting health and social care providers to take relevant actions • prioritising clients/actions/visits • ensuring safety of staff • workforce and emergency planning (e.g. ahead of a likely increase in admissions to
acute hospitals).
The survey of frontline staff showed much greater awareness of, and engagement with, the CWP among nurses employed in community health services than in primary care. However, very few frontline staff knew the extent to which the CWP had influenced planning in their own area, and only one in four reported that their service kept a list of vulnerable people (most did not know).
The vast majority of both primary care and community health services nurses had heard of the cold weather alerts, but nearly nine in ten were not aware of the actions specified by the different alert levels. Cold weather alerts do not appear to have much impact on the work of primary care nurses, whereas community health services nurses reported making a number of changes to their work routine when there was an alert: e.g. by prioritising visits to their most vulnerable patients, spending more time with them, and cancelling some of their routine activities. Overall, about seven in ten community health services nurses, but only four in ten primary care nurses, said their service had been (very or fairly) well prepared for dealing with vulnerable patients during the winter of 2012/13. Only one in ten primary care nurses said the CWP helped to a significant or moderate extent with local cold weather planning (most did not know), whereas four in ten community health services nurses reported this.
The results of the survey with frontline staff reinforced the message arising from the interviews with managers of the difficulties of engaging primary care staff in cold weather planning. The survey also showed that community health services nurses were better than those working in primary care in carrying out actions helpful to vulnerable people in cold weather, although many actions specified in the CWP were not undertaken, such as checking and advising on room temperature, checking that people had the necessary medicines or food at home, and arranging extra help for clients who needed it.
Table 1 Percentages of nurses taking actions in winter 2012/13 with all/most clients potentially vulnerable to cold weather
Primary care Community health servicesChecked flu vaccination 73% 75%
Reviewed medications 21% 28%
Checked they had help (e.g. from family) 12% 46%
Checked room temperature (if visit homes) 17% 49%
Checked enough food in house (if visit homes) 15% 53%
Checked had necessary medicines 14% 52%
Spoke about room temperature 12% 55%
Advised not to go outdoors 39% 76%
Arranged extra help 7% 22%Advised who to see for extra help 14% 39%

Evaluation of the implementation and health-related impacts of the Cold Weather Plan for England 2012
9
Section B2 Support received by potentially at-risk individuals during periods of cold weather (objective 3)
This part of the evaluation involved interviewing a group of people who were considered particularly vulnerable to the effects of cold weather (i.e. they were aged 75 years or more and lived alone, or aged 65 years or more and had a long-term condition). Semi-structured telephone interviews were held with 35 people in two of the local authority areas, soon after a cold weather alert had been issued in their area (on two separate occasions during the winter). The interview covered: contacts with health and social care professionals, and with other agencies; support provided by family, friends, and others; home heating; going outdoors in cold weather; supplies (e.g. food, fuel, medication); critical incidents (such as falls); awareness of the recent cold weather alert; actions taken and support received in response to this alert.
All participants said keeping warm was a priority and they employed various strategies to do so. They listened to the weather reports and took appropriate actions (e.g. stocking up on food and fuel when cold or icy weather was forecast). Nearly all participants kept their heating on during the day, although the expense meant that this was not always possible, and heating was usually turned off at night. Participants living in social housing reported having central heating, good insulation and feeling warm, in contrast to many owner occupiers who reported having inefficient heating systems. Despite all participants having a long-term health condition and regular contact with health care professionals, none reported receiving any advice or assistance relating to cold weather from a health professional. They were generally unaware of the cardiovascular risk of low temperatures. Of greatest concern to participants was the fear of slipping on ice and sustaining an injury. Many individuals stayed indoors and gave up their social activities when they felt they were at risk of slipping. Support for these participants mainly came in the form of help from relatives or neighbours, who would help with shopping, cooking and household repairs.
Although this part of the study involved only a small number of interviews with a non-representative sample of residents in two local authorities, the fact that none of the 35 people mentioned receiving any help from primary care or community health services nurses suggests that a large number, probably the majority, of vulnerable people are missed by the CWP because they are not in receipt of social services. The study also shows, however, that one potentially effective way to reach vulnerable people who are not already in touch with social services may be to undertake initiatives aimed at building community resilience by encouraging thriving local communities with facilities and informal social support that may counter social isolation.
Section C Cost-effectiveness of the CWP (objective 4)
The final component of the evaluation involved an exploratory analysis of the potential cost-effectiveness of the CWP. Because the CWP is such a complex intervention and has only been in place for a few years, evaluating its cost-effectiveness is challenging. For example, some of the actions included in the CWP were already being undertaken by some local authorities in England (but not by others), so the cost-effectiveness of the Plan may depend on what was being done before its implementation. Also, its cost-effectiveness depends on the extent to which the CWP is correctly and fully implemented. Implementation will also depend not only on the accuracy of cold weather alerts, but also how these are interpreted by staff in local authorities.

Evaluation of the implementation and health-related impacts of the Cold Weather Plan for England 2012
10
Because the CWP has only been operating for two winters, there is no epidemiological evidence on its effectiveness in terms of reducing cold-related mortality or morbidity, or information on its costs. Therefore, mathematical modelling was used to evaluate its potential effectiveness and cost-effectiveness under different scenarios. The modelling framework used to calculate the health benefits and direct costs of the CWP is shown in Figure 3.
In order to model the cost-effectiveness of the CWP, it is necessary to:
• calculate the cold-attributable disease burden pre-CWP (i.e. the work carried out in relation to objective 1 of the evaluation, above). This is shown in Block A in Figure 3
• examine the effectiveness of the CWP if it is fully or partially implemented; i.e. estimating the proportion of premature deaths and hospital admissions that would be reduced with varying extent of implementation
• estimate the health benefits that arise from the reduction in premature deaths and hospital admissions, and the increased contacts with primary and social care services, in terms of Quality Adjusted Life Years (QALYs) gained
• estimate cost savings of hospital admissions avoided • estimate additional costs of the CWP (e.g. longer contacts with health and social
care services), which depend on how fully the CWP is implemented and on the number and nature of these contacts pre-CWP
• estimate temperatures, especially cold extremes, over the next 20 years.
Figure 3 The modelling framework for cost-effectiveness analysis of the CWP
Daily fractional excess risk
Daily cold attributable health burden (deaths & hospital admissions)
Daily temperature
Daily baseline disease burden (deaths & hospital admissions)
Effectiveness of CWP if fully implemented (𝛿)
Effectiveness of implemented CWP (𝛿×𝜁)
Average degree of implementation of CWP (𝜁)
A
B
Cost saving associated with reduction in hospital admissions
Additional contacts with primary and social care
Health benefits due to reduction in deaths & hospital admissions and increase in contacts with primary and social care
Additional cost of implementing CWP
C
Evaluation of the implementation and health-related impacts of the Cold Weather Plan for England 2012
11
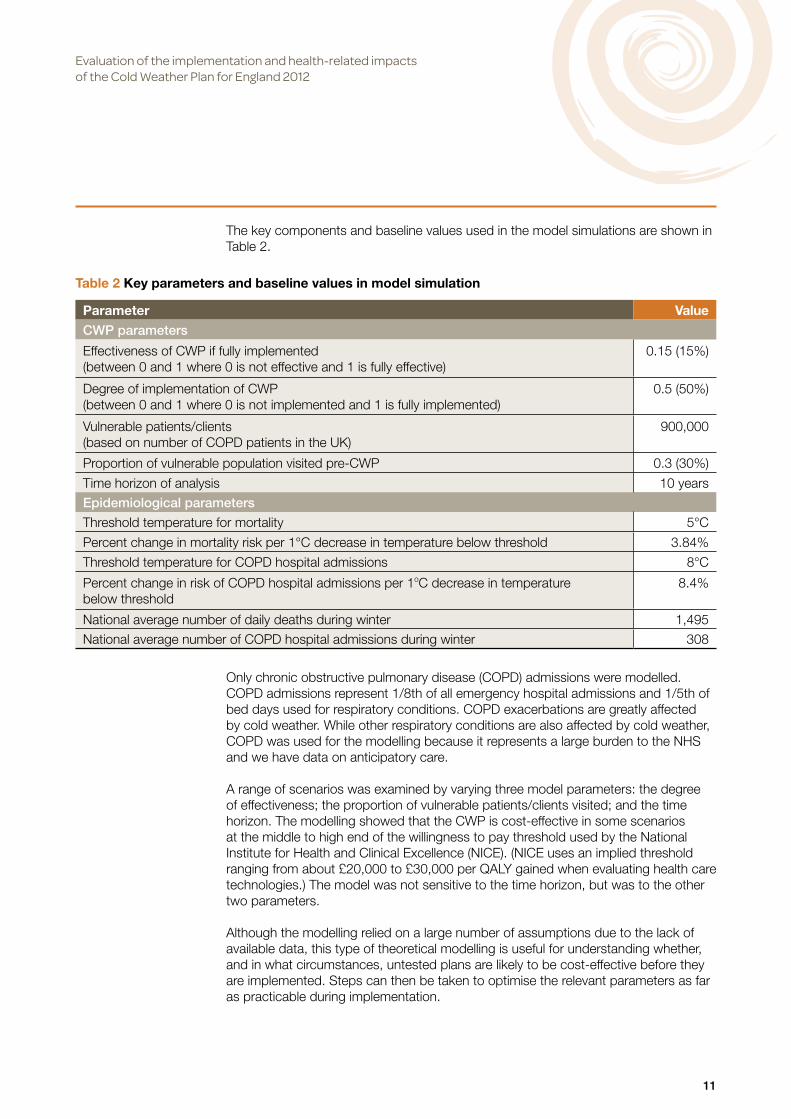
The key components and baseline values used in the model simulations are shown in Table 2.
Only chronic obstructive pulmonary disease (COPD) admissions were modelled. COPD admissions represent 1/8th of all emergency hospital admissions and 1/5th of bed days used for respiratory conditions. COPD exacerbations are greatly affected by cold weather. While other respiratory conditions are also affected by cold weather, COPD was used for the modelling because it represents a large burden to the NHS and we have data on anticipatory care.
A range of scenarios was examined by varying three model parameters: the degree of effectiveness; the proportion of vulnerable patients/clients visited; and the time horizon. The modelling showed that the CWP is cost-effective in some scenarios at the middle to high end of the willingness to pay threshold used by the National Institute for Health and Clinical Excellence (NICE). (NICE uses an implied threshold ranging from about £20,000 to £30,000 per QALY gained when evaluating health care technologies.) The model was not sensitive to the time horizon, but was to the other two parameters.
Although the modelling relied on a large number of assumptions due to the lack of available data, this type of theoretical modelling is useful for understanding whether, and in what circumstances, untested plans are likely to be cost-effective before they are implemented. Steps can then be taken to optimise the relevant parameters as far as practicable during implementation.
Table 2 Key parameters and baseline values in model simulation
Parameter ValueCWP parameters
Effectiveness of CWP if fully implemented (between 0 and 1 where 0 is not effective and 1 is fully effective)
0.15 (15%)
Degree of implementation of CWP (between 0 and 1 where 0 is not implemented and 1 is fully implemented)
0.5 (50%)
Vulnerable patients/clients (based on number of COPD patients in the UK)
900,000
Proportion of vulnerable population visited pre-CWP 0.3 (30%)
Time horizon of analysis 10 yearsEpidemiological parameters
Threshold temperature for mortality 5°C
Percent change in mortality risk per 1°C decrease in temperature below threshold 3.84%
Threshold temperature for COPD hospital admissions 8°C
Percent change in risk of COPD hospital admissions per 1oC decrease in temperature below threshold
8.4%
National average number of daily deaths during winter 1,495National average number of COPD hospital admissions during winter 308

Evaluation of the implementation and health-related impacts of the Cold Weather Plan for England 2012
12
Conclusions
The evaluation suffered from a number of limitations, not least the tight timetable the research team had to work to in order to feed into the 2013/14 CWP revisions. For the epidemiological analysis (Section A), the main drawbacks were the lack of up-to-date mortality date and the lack of influenza activity, while for the implementation section (Section B) there was under-representation of some groups (in particular representatives from general practice), and a low response rate to the nurse survey. For the cost-effectiveness modelling (Section C), it was not possible to include all potential costs and benefits, and the model was based on a large number of assumptions and parameters.
Despite these limitations, however, the findings of the evaluation contribute a number of new insights into cold weather impact and planning in England, and have a number of implications for the future design and implementation of the CWP, including:
• First, issuing Cold Weather Alerts when the mean temperature is expected to be below 2°C for 48 hours (level 3) means that only a small fraction of the cold-related mortality burden is covered by such alerts. This raises the question of whether more emphasis should be given to levels 0 and 1, which focus on more general preparations during the winter months and throughout the year, in order to have a greater impact on reducing the health-related burden of cold weather.
• Second, adverse effects of cold weather may not become immediately apparent and may be delayed by several days or weeks following initial exposure, so short-term forecasts of cold weather may not be that critical, and the level of care provided by the health services over a longer period after a cold spell may be more important.
• Third, while the elderly are clearly the most vulnerable to low temperatures, people of working age are most at risk of fractures, etc. during periods of heavy snowfall. The Cold Weather Alerts therefore should distinguish between different types of cold weather conditions.
• Fourth, it was more difficult to engage staff in primary care than those working in community health services in recognising the health risks of cold weather and responding accordingly, though levels of awareness and implementation of the specific actions associated with Cold Weather Alerts were generally low.
• Fifth, rather than being led by local authority emergency planning managers, public health managers should take the lead in local implementation of the CWP in order to provide greater focus on activities aimed at reducing cold-related mortality and morbidity, and to facilitate integration across health and social care services.
• Sixth, it was difficult to identify potentially at-risk people who were not already in contact with adult social services, implying a need to develop alternative means of identifying and supporting such people (e.g. potentially through community mobilisation and ‘good neighbour’ schemes).
• Seventh, it is plausible that the CWP is cost-effective under some scenarios at the high end of the willingness to pay threshold used by NICE. (NICE uses an implied threshold ranging from about £20,000 to £30,000 per QALY gained when evaluating health care technologies.) This estimate is sensitive to the extent to which the CWP is implemented at local level and the success with which potentially vulnerable people can be identified and supported ahead of and during cold weather.
Evaluation of the implementation and health-related impacts of the Cold Weather Plan for England 2012
13
References
Department of Health. (2010) ‘Winter kills’ in 2009 Annual report of the Chief Medical Officer.
Department of Health and Health Protection Agency. (2011a) Making the case: why cold weather planning is essential to health and well-being. www.gov.uk/government/uploads/system/ uploads/attachment_data/file/216641/dh_130925.pdf
Department of Health. (2011b) Cold weather plan for England: protecting health and reducing harm from severe cold. www.dh.gov.uk/prod_consum_dh/groups/dh_digitalassets/ documents/digitalasset/dh_130926.pdf
Marmot Review Team. (2011) The health impacts of cold homes and fuel poverty. Friends of the Earth and Marmot Review Team. www.instituteofhealthequity.org/projects/the-health-impacts-of-cold-homes-and-fuel-poverty
Office for National Statistics. (2012) Excess winter mortality in England and Wales 2011/11 (provisional) and 2010/11 (final). Statistical Bulletin, 29 November. www.ons.gov.uk/ons/dcp171778_288362.pdf
Public Health England. (2013) Cold Weather Plan seminar report. London 1 July 2013. www.hpa.org.uk/webc/HPAwebFile/HPAweb_C/1317140133507
Evaluation of the implementation and health-related impacts of the Cold Weather Plan for England 2012
14
The first objective of the evaluation of the Cold Weather Plan (CWP) for England involved an epidemiological assessment of retrospective data to characterise the nature of the relationships between weather and indicators of health and the use of health services. The results could then provide a baseline for any future assessment of the impact of the introduction of the CWP.
Methods
Data
The health data consisted of:
• All deaths occurring in England during 1st Jan 1993 – 31st Dec 2006, obtained from the Office for National Statistics.
• All emergency hospital admissions occurring in England during 1st April 1997 – 31st March 2011, obtained from the Health and Social Care Information Centre.
• Visits to Accident & Emergency (A&E) departments in England during 1st April 2007 – 31st March 2011, obtained from the Health and Social Care Information Centre.
Each health outcome was aggregated by date and Government region to create a time-series of the daily number of events for each region of England. Separate series were also created by age and disease groups. Other sub-groups were also considered where possible.
The exposure data consisted of daily mean temperature for the same time periods, derived by taking the average of daily minimum and daily maximum temperatures. These were recorded by Met Office land surface stations obtained through the British Atmospheric Data Centre website. For each measure, one composite series was created for each region by combining data from stations recording measures on at least 75% of days during the study period and using a previously published imputation method to deal with missing values.(Armstrong et al 2011) On average, 20 stations contributed data to each regional series. Mean temperature was found to be a better predictor of health events than either minimum or maximum temperature, and so is used here as the main exposure measure. Daily measures of resting snow depth for one site in each region were also obtained from the Met Office.
Statistical analysis
Assessment of the short-term (i.e. day-to-day) relationships between weather and health outcomes consisted of two components:
• Time-series regression analysis to characterise the temperature-health relationships occurring throughout the winter months.
• Episode analysis to assess the impact of individual episodes of extreme weather, in particular periods of heavy snowfall.
The time-series regression analysis focused on mortality and emergency hospital admissions series, but not on A&E visits since, when attempting to model such data using the same level of seasonal control as with the other health outcomes, the over-dispersion remained unacceptably high in all models, indicating residual seasonal confounding. For each series of deaths or emergency hospital admissions, slow-changing seasonal patterns in the health counts (unrelated to temperature) and any secular trends were controlled for using splines of time, with 7 degrees of freedom per
Section ARelationship between weather, health and use of health servicesLead author: Shakoor Hajat

Evaluation of the implementation and health-related impacts of the Cold Weather Plan for England 2012
15
year of data analysed. Spline functions are a series of polynomial curves (usually cubic) joined together to flexibly model patterns in the health series. Indicator terms were used to model any day-of-week effects. No adjustment for air pollution or humidity was conducted since the analysis was undertaken at regional level. (Sensitivity analysis in the London region, where it was possible to create a regionally representative series for particulate air pollution (PM10), left cold effects unchanged.) Flu data were not available to the research team at the time of reporting. Following the seasonal adjustment, the relationship between temperature and health indicators was assessed graphically, again using spline functions. As effects of low temperatures can be delayed by a few days or weeks, all results are based on modelling the impacts distributed up to four weeks following initial exposure. In general, the graphical relationships indicated a gradual increase in the risk of a cold-related health event once mean temperatures drop below certain threshold levels. For quantification purposes, therefore, a linear threshold model was used, whereby there is assumed to be no risk at temperatures above the threshold value, and a linear relationship between an increased risk of a cold-related health event and a drop in temperatures at values below the threshold. To objectively identify the cold threshold for each region, statistical model diagnostics were compared between models with threshold values fixed at varying temperatures. Regional estimates of risk were combined in a random-effects meta-analysis to obtain a national-level estimate.
For the episode analysis of individual periods of heavy snowfall, focus was on the daily number of A&E events as these were expected to be the most sensitive health indicator during such periods. The observed number of A&E visits during identified snowfall periods was compared with the expected number of visits, as reflected by the same time-period in surrounding years. As visitor numbers vary greatly by day-of-week, a 7-day moving average of series counts was used in comparisons.
Results
Table A1 shows summary statistics for the exposure and health data. As expected, the southern regions experience warmer winters than the northern regions. There are approximately 3 visits to A&E departments for 1 emergency hospital admission, and approximately 8 emergency hospital admissions for every 1 death. Figure A1, showing the time-series of the daily number of deaths and daily mean temperature in the North East region, illustrates the greater health burdens experienced during the winter months each year compared with other seasons. The days with very high mortality are mostly due to influenza epidemics. Similar patterns are observed in the other regions.

Evaluation of the implementation and health-related impacts of the Cold Weather Plan for England 2012
16
Table A1 Summary statistics for temperature and health data
Median for winter months (October – March)(and minimum, 25th percentile, 75th percentile, maximum)
Daily mean temperature (°C)
Daily all-cause mortality
Daily all-cause emergency hospital
admissions
Daily all-cause accident &
emergency visits
Region Jan 1993 – Mar 2011 Jan 1993 – Dec 2006 Apr 1997 – Mar 2011 Apr 2007 – Mar 2011
North East 5.1(-6.9, 2.7, 7.5, 16.2)
84(50, 76, 94, 178)
774(441, 684, 881, 1172)
2097(1298, 1834, 2330, 3174)
North West 6.3(-6.3, 3.9, 8.4, 16.5)
220(139, 203, 240, 454)
1921(1157, 1735, 2247, 2834)
5986(3594, 5535, 6350, 7812)
Yorkshire & Humberside
5.7(-6.6, 3.3, 8.4, 17.7)
153(102, 141, 169, 300)
1374(676, 1162, 1516, 1992)
3253(1680, 2565, 4002, 5366)
East Midlands
6(-6.3, 3.6, 8.7, 18)
126(77, 115, 137, 253)
1042(498, 887, 1166, 1496)
2709(1783, 2409, 2964, 3790)
West Midlands
6.3(-7.5, 3.6, 8.7, 17.4)
159(101, 146, 175, 310)
1294(762, 1160, 1464, 1886)
4070(2731, 3845, 4313, 5298)
East England
6.6(-5.7, 3.9, 9.3, 19.2)
155(110, 143, 168, 300)
1139(655, 1011, 1297, 1691)
3094(1879, 2692, 3517, 4468)
London 7.5(-3.9, 4.5, 10.2, 20.4)
174(99, 157, 194, 363)
1458(790, 1294, 1786, 2233)
7052(4248, 6235, 7566, 9781)
South East 7.2(-4.2, 4.5, 9.6, 19.5)
233(166, 216, 253, 481)
1689(944, 1506, 2011, 2557)
4603(2791, 3974, 5179, 6801)
South West 7.5(-3.6, 5.1, 9.6, 18)
159(101, 146, 173, 303)
1162(606,1029, 1358, 1793)
2912(1463, 2277, 3351, 4685)
Figure A1 Time-series of daily all-cause deaths (blue dots) and mean temperature (brown dots) in the North East region, 1993-2006

Evaluation of the implementation and health-related impacts of the Cold Weather Plan for England 2012
17
Relationships between temperature and mortality
Figure A2 shows the seasonally-adjusted relationships between all-year temperatures (bottom axis) and the relative risk (RR) of all-cause death (right-hand axis) for each region of England. The solid middle curve represents the estimated relationship, and the dashed outer curves the 95% confidence interval. The histograms displayed behind the risk curves show the distribution of temperatures within each region, with the left-hand axis indicating the percentage of days at each of the temperature values.
An elevated risk (RR greater than 1) is observed with low temperatures in all regions, and in each case the impacts become apparent at fairly moderate values of mean temperature (4-8°C). In some regions, e.g. the North West, the threshold is well defined with little increased risk above this value, but in other regions such as the southern regions the relationship tends more towards linearity across the whole of the temperature range and so the rise in ‘cold’ risk is already apparent at temperatures above the identified threshold.
Figure A2 Seasonally-adjusted relationship between mean temperature and RR of all-cause mortality, by region
Evaluation of the implementation and health-related impacts of the Cold Weather Plan for England 2012
18
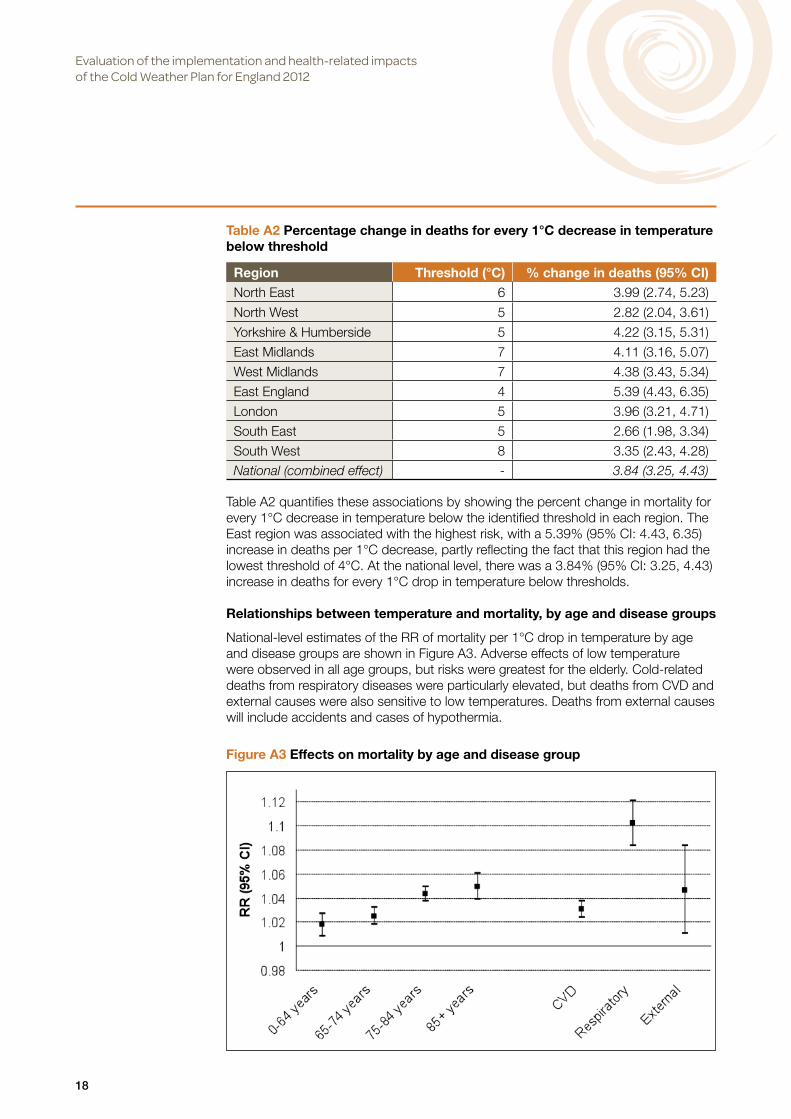
Table A2 quantifies these associations by showing the percent change in mortality for every 1°C decrease in temperature below the identified threshold in each region. The East region was associated with the highest risk, with a 5.39% (95% CI: 4.43, 6.35) increase in deaths per 1°C decrease, partly reflecting the fact that this region had the lowest threshold of 4°C. At the national level, there was a 3.84% (95% CI: 3.25, 4.43) increase in deaths for every 1°C drop in temperature below thresholds.
Relationships between temperature and mortality, by age and disease groups
National-level estimates of the RR of mortality per 1°C drop in temperature by age and disease groups are shown in Figure A3. Adverse effects of low temperature were observed in all age groups, but risks were greatest for the elderly. Cold-related deaths from respiratory diseases were particularly elevated, but deaths from CVD and external causes were also sensitive to low temperatures. Deaths from external causes will include accidents and cases of hypothermia.
Table A2 Percentage change in deaths for every 1°C decrease in temperature below threshold
Region Threshold (°C) % change in deaths (95% CI)North East 6 3.99 (2.74, 5.23)
North West 5 2.82 (2.04, 3.61)
Yorkshire & Humberside 5 4.22 (3.15, 5.31)
East Midlands 7 4.11 (3.16, 5.07)
West Midlands 7 4.38 (3.43, 5.34)
East England 4 5.39 (4.43, 6.35)
London 5 3.96 (3.21, 4.71)
South East 5 2.66 (1.98, 3.34)
South West 8 3.35 (2.43, 4.28)
National (combined effect) - 3.84 (3.25, 4.43)
Figure A3 Effects on mortality by age and disease group

Evaluation of the implementation and health-related impacts of the Cold Weather Plan for England 2012
19
Lagged effects of temperature on mortality
National-level estimates of the RR of all-cause mortality per 1°C drop in temperature at different lags of exposure are shown in Figure A4. The lag 0 risk represents the effect on mortality on the same day as exposure, lag 1 represents the effect on mortality one day later, and so on up to 28 days following exposure. This figure shows that the mortality effects of low temperatures, although not always statistically significant, do remain elevated at most lags – indicating that cold effects can be distributed over many days following initial exposure.
An increased risk in deaths is not observed on the day of exposure – indeed a cold day is associated with a reduced risk of same-day mortality. However, adverse effects become apparent from the following day onwards. Although only shown for all-cause mortality, the early peak is driven by cold-related deaths from CVD and the later rise is due to cold-related deaths from respiratory causes, which can be delayed by 3-3½ weeks following initial exposure to cold.
Attributable fractions of cold-related mortality at different temperature thresholds
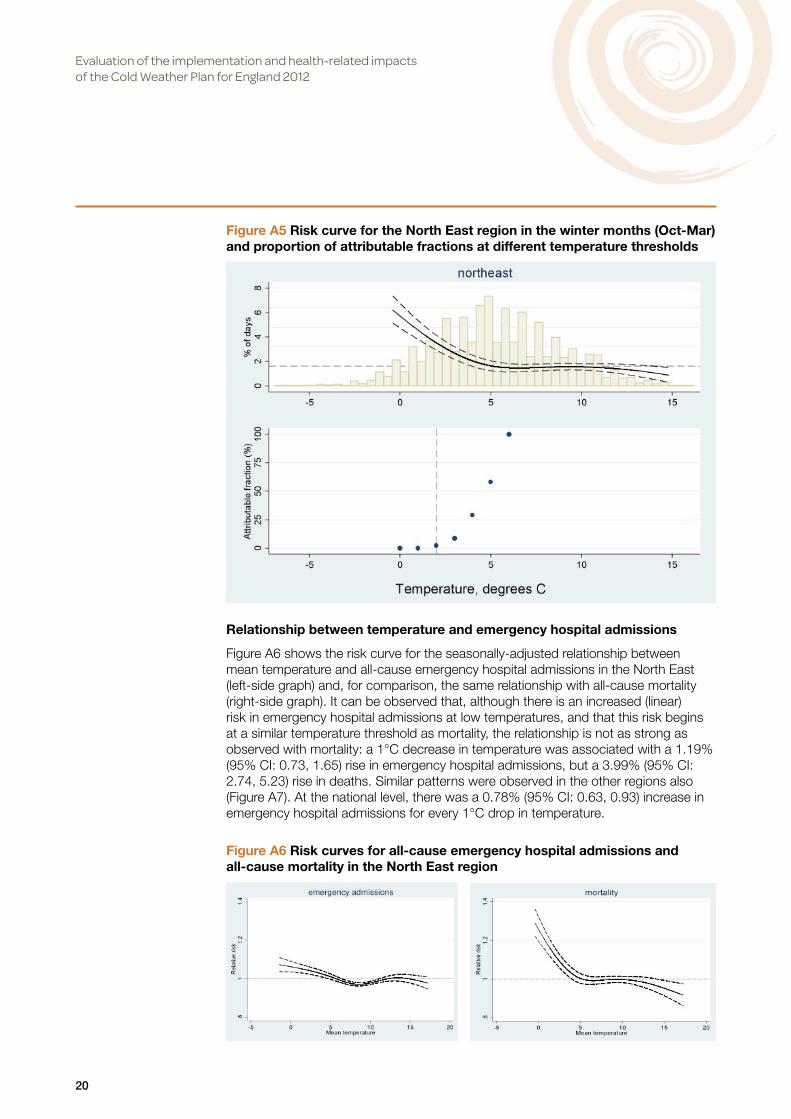
Figure A5 reproduces the North East risk curve from Figure A2, but restricted to just the winter months (Oct-March); also shown underneath are the corresponding attributable fractions at different temperature thresholds to take into account the typical number of days on which the estimated RRs occur. If all days below the estimated threshold of 6°C are considered to represent 100% of the cold burden in the North East, then it is observed that the more extreme cold temperature days (when alerts are issued in accordance with thresholds in the CWP – dashes vertical line in Figure A5) are only responsible for a small fraction of the total cold burden due to their infrequency. A similar pattern is observed in the other regions.
Figure A4 Effects on mortality at different lags of exposure
Evaluation of the implementation and health-related impacts of the Cold Weather Plan for England 2012
20
Relationship between temperature and emergency hospital admissions
Figure A6 shows the risk curve for the seasonally-adjusted relationship between mean temperature and all-cause emergency hospital admissions in the North East (left-side graph) and, for comparison, the same relationship with all-cause mortality (right-side graph). It can be observed that, although there is an increased (linear) risk in emergency hospital admissions at low temperatures, and that this risk begins at a similar temperature threshold as mortality, the relationship is not as strong as observed with mortality: a 1°C decrease in temperature was associated with a 1.19% (95% CI: 0.73, 1.65) rise in emergency hospital admissions, but a 3.99% (95% CI: 2.74, 5.23) rise in deaths. Similar patterns were observed in the other regions also (Figure A7). At the national level, there was a 0.78% (95% CI: 0.63, 0.93) increase in emergency hospital admissions for every 1°C drop in temperature.
Figure A5 Risk curve for the North East region in the winter months (Oct-Mar) and proportion of attributable fractions at different temperature thresholds
Figure A6 Risk curves for all-cause emergency hospital admissions and all-cause mortality in the North East region

Evaluation of the implementation and health-related impacts of the Cold Weather Plan for England 2012
21
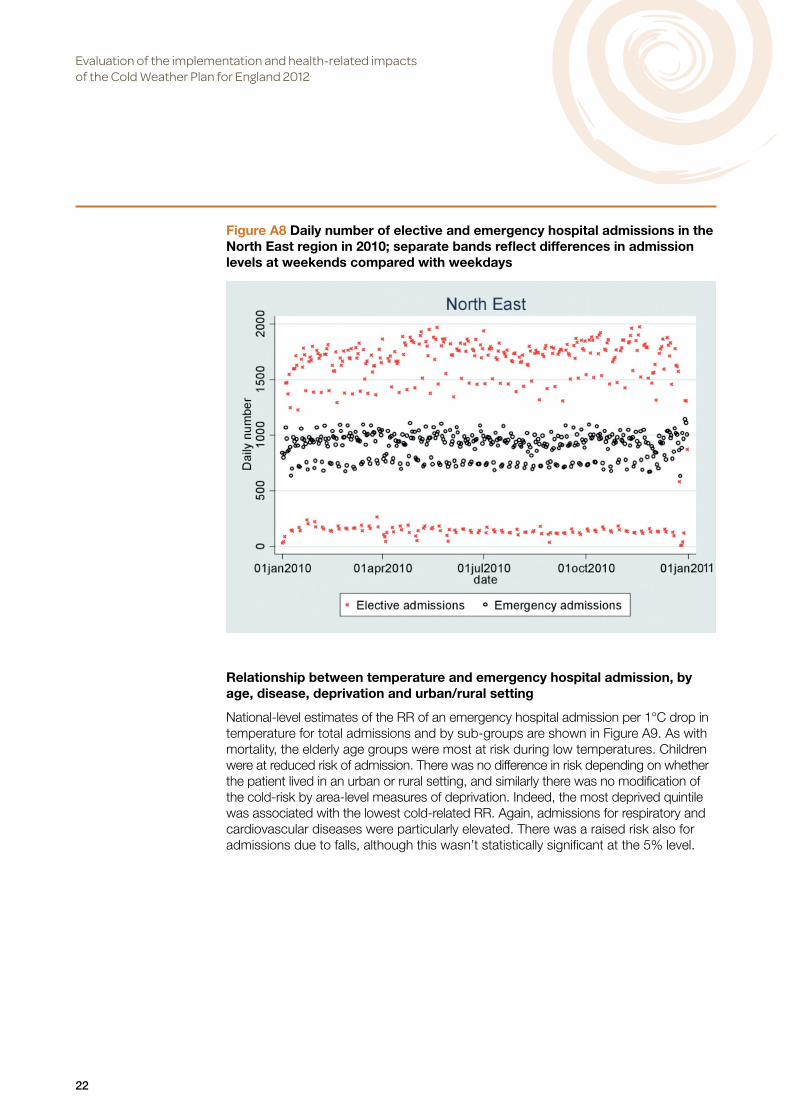
The lack of sensitivity of emergency admissions to cold weather is also the case during extreme winter conditions. For example, Figure A8 plots the daily number of hospital admissions – both emergency and elective – in the North East region throughout the year 2010, which began and ended with a harsh winter. However, at a regional-level there are no obvious spikes in emergency admissions during these times, and no knock-on effect on the number of elective admissions. A similar pattern is observed in all regions.
Figure A7 Risk curves for all-cause emergency hospital admissions by region
Evaluation of the implementation and health-related impacts of the Cold Weather Plan for England 2012
22
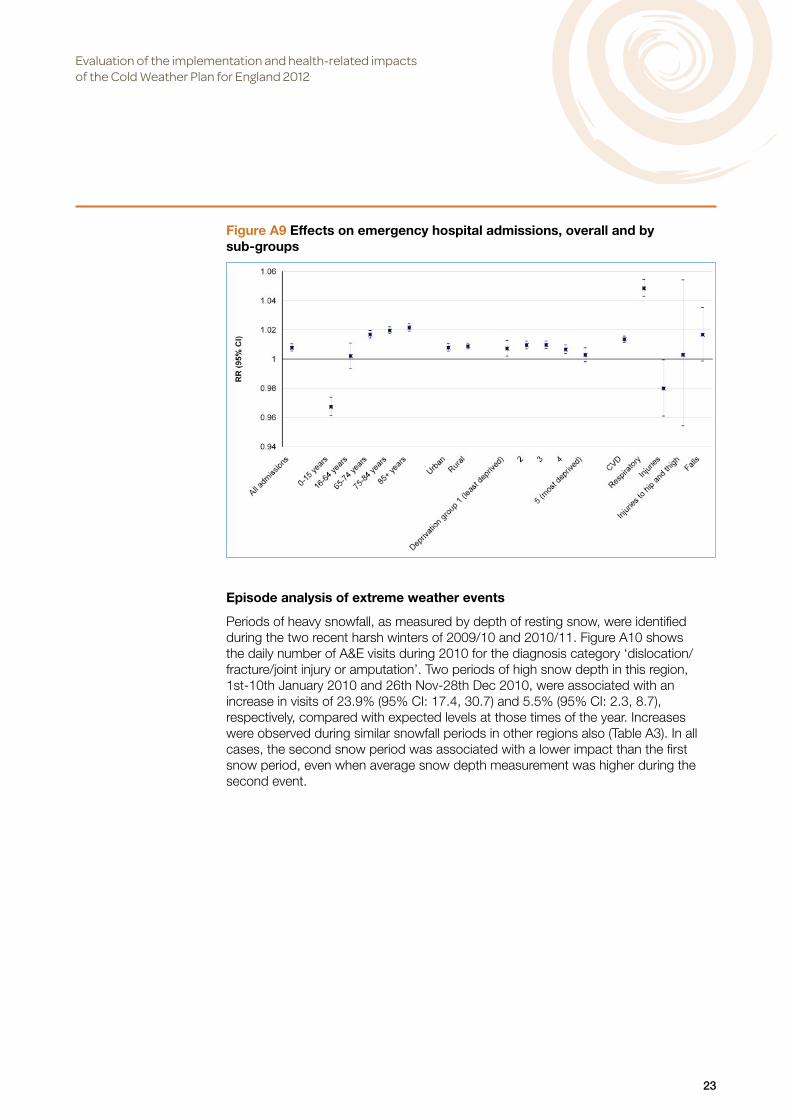
Relationship between temperature and emergency hospital admission, by age, disease, deprivation and urban/rural setting
National-level estimates of the RR of an emergency hospital admission per 1°C drop in temperature for total admissions and by sub-groups are shown in Figure A9. As with mortality, the elderly age groups were most at risk during low temperatures. Children were at reduced risk of admission. There was no difference in risk depending on whether the patient lived in an urban or rural setting, and similarly there was no modification of the cold-risk by area-level measures of deprivation. Indeed, the most deprived quintile was associated with the lowest cold-related RR. Again, admissions for respiratory and cardiovascular diseases were particularly elevated. There was a raised risk also for admissions due to falls, although this wasn’t statistically significant at the 5% level.
Figure A8 Daily number of elective and emergency hospital admissions in the North East region in 2010; separate bands reflect differences in admission levels at weekends compared with weekdays
Evaluation of the implementation and health-related impacts of the Cold Weather Plan for England 2012
23
Episode analysis of extreme weather events
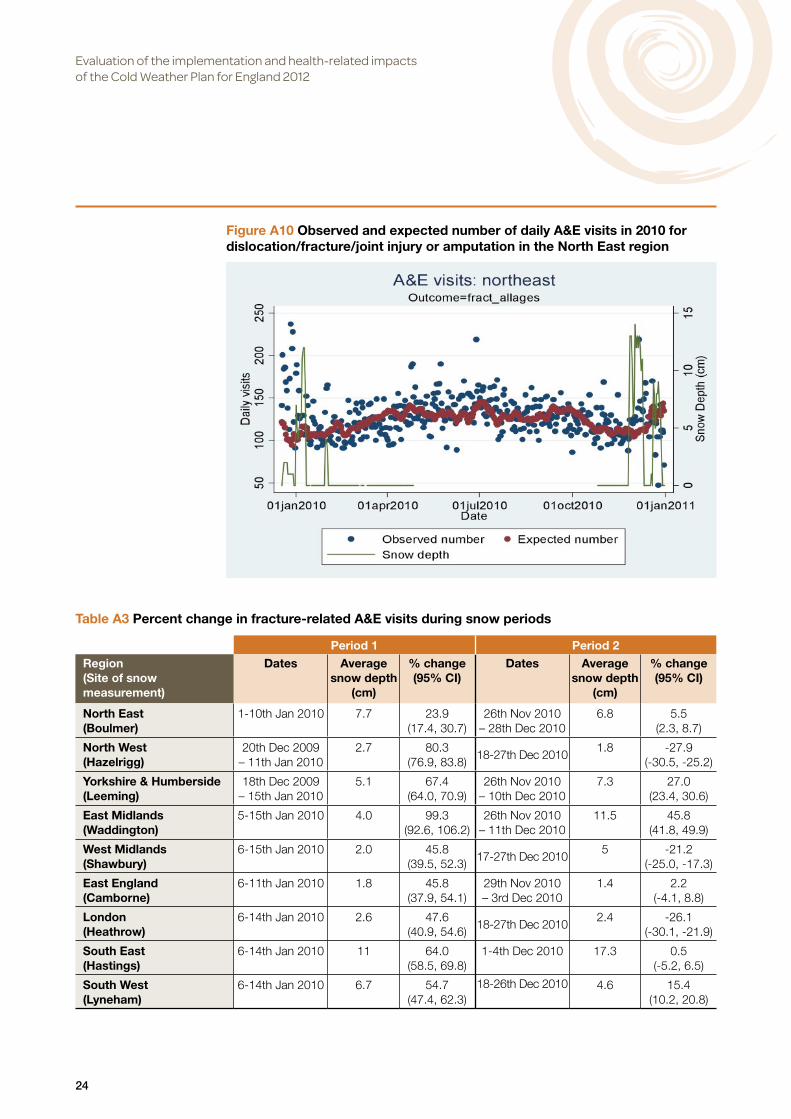
Periods of heavy snowfall, as measured by depth of resting snow, were identified during the two recent harsh winters of 2009/10 and 2010/11. Figure A10 shows the daily number of A&E visits during 2010 for the diagnosis category ‘dislocation/fracture/joint injury or amputation’. Two periods of high snow depth in this region, 1st-10th January 2010 and 26th Nov-28th Dec 2010, were associated with an increase in visits of 23.9% (95% CI: 17.4, 30.7) and 5.5% (95% CI: 2.3, 8.7), respectively, compared with expected levels at those times of the year. Increases were observed during similar snowfall periods in other regions also (Table A3). In all cases, the second snow period was associated with a lower impact than the first snow period, even when average snow depth measurement was higher during the second event.
Figure A9 Effects on emergency hospital admissions, overall and by sub-groups
Evaluation of the implementation and health-related impacts of the Cold Weather Plan for England 2012
24
Table A3 Percent change in fracture-related A&E visits during snow periods
Period 1 Period 2
Region(Site of snow measurement)
Dates Average snow depth
(cm)
% change (95% CI)
Dates Average snow depth
(cm)
% change (95% CI)
North East (Boulmer)
1-10th Jan 2010 7.7 23.9 (17.4, 30.7)
26th Nov 2010– 28th Dec 2010
6.8 5.5 (2.3, 8.7)
North West (Hazelrigg)
20th Dec 2009 – 11th Jan 2010
2.7 80.3 (76.9, 83.8)
18-27th Dec 20101.8 -27.9
(-30.5, -25.2)
Yorkshire & Humberside (Leeming)
18th Dec 2009 – 15th Jan 2010
5.1 67.4 (64.0, 70.9)
26th Nov 2010– 10th Dec 2010
7.3 27.0 (23.4, 30.6)
East Midlands (Waddington)
5-15th Jan 2010 4.0 99.3 (92.6, 106.2)
26th Nov 2010– 11th Dec 2010
11.5 45.8 (41.8, 49.9)
West Midlands(Shawbury)
6-15th Jan 2010 2.0 45.8 (39.5, 52.3)
17-27th Dec 20105 -21.2
(-25.0, -17.3)
East England(Camborne)
6-11th Jan 2010 1.8 45.8 (37.9, 54.1)
29th Nov 2010– 3rd Dec 2010
1.4 2.2 (-4.1, 8.8)
London(Heathrow)
6-14th Jan 2010 2.6 47.6 (40.9, 54.6)
18-27th Dec 20102.4 -26.1
(-30.1, -21.9)
South East(Hastings)
6-14th Jan 2010 11 64.0 (58.5, 69.8)
1-4th Dec 2010 17.3 0.5 (-5.2, 6.5)
South West(Lyneham)
6-14th Jan 2010 6.7 54.7(47.4, 62.3)
18-26th Dec 2010 4.6 15.4(10.2, 20.8)
Figure A10 Observed and expected number of daily A&E visits in 2010 for dislocation/fracture/joint injury or amputation in the North East region

Evaluation of the implementation and health-related impacts of the Cold Weather Plan for England 2012
25
Figure A11 repeats the analysis for the North East by separate age-groups. Increases among the elderly were modest, as were those among children where A&E numbers peaked in the summer months for this diagnosis category. It was among those of working age (16-64 years) where the highest relative increases were observed. Increases were generally not observed for A&E visits due to cardiovascular or respiratory causes, or for all-cause visits (Table A4). Impacts in mortality and hospital admissions outcomes were also not evident during these episodes.
Figure A11 Observed and expected daily A&E visits in 2010 for dislocation/fracture/joint injury or amputation in the North East region, by age group; right-side column presents percent change in visits during snow periods
Children (0-15 years)
Event 1:16.7% (95% CI -0.3, 35.8)
Event 2:-17.2% (95% CI -24.2, -9.7)
Adults (16-64 years)
Event 1:33.7% (95% CI 25.0, 42.8)
Event 2:11.3% (95% CI 7.1, 15.7)
Elderly (65+ years)
Event 1:4.5% (95% CI -7.2, 17.3)
Event 2:5.6% (95% CI -0.7, 12.1)

Evaluation of the implementation and health-related impacts of the Cold Weather Plan for England 2012
26
Discussion
Main findings
The main findings from this analysis, and their implications for the CWP, are:
• Firstly, the greatest health burdens of cold weather fall outside the alert levels used in the CWP. Our assessment of attributable fractions indicated that the days when a Cold Weather Alert is called (when mean temperature is forecast to be below 2°C for at least 48 hours) are responsible for only a small fraction of the cold-related mortality burden, e.g. in the North East where alert days are responsible for less than 3% of the total cold burden. This raises the question of the purpose of the Cold Weather Alerts. In terms of providing regular reminders of the dangers of cold weather, the alerts may play a useful role. However, in terms of reducing the total health burden, it is likely that long-term intervention strategies (e.g. in housing), and the more general preparations taken throughout the winter months, are more important than the acute interventions activated by the alerts. For this reason, levels 0 and 1 of the current CWP should be given greater emphasis.
• Secondly, cold-related health impacts can be delayed by up to several weeks. Unlike with heat exposure, where health impacts are mostly immediate and short-lived, the adverse effects of a cold day may not become immediately apparent, and the impacts may be distributed over many days following initial exposure. This indicates that forecasts of weather may not be as critical as they are for hot weather and its response, and that any heightened care in response to a cold day may need to be more prolonged.
• Thirdly, the groups who are vulnerable may differ according to the particular type of winter weather conditions being experienced. In general, the adverse effects of winter weather are widespread among the population, although some groups are at heightened vulnerability. While older people are the most susceptible to low temperatures, they appear to be less vulnerable during periods of heavy snowfall compared with people of working age who had the highest relative increase in A&E visits. The Cold Weather Alerts should make a distinction between these different types of weather conditions, and target advice accordingly.
• Fourthly, the Excess Winter Deaths measure, as referred to in the CWP, is not a good measure of cold-related health burdens. Although not a direct finding from this analysis, recent work has shown this measure to be associated with a number of biases, (Hajat, Kovats 2014) and that its use can lead to erroneous conclusions about cold-related health impacts. (Staddon et al 2014) Explicit characterisation of weather factors, as has been conducted in this report, is preferable.
Table A4 Percentage change in A&E visits during snow periods in 2010 in the North East region, by diagnosis category
Period 1 (1st-10th January 2010) Period 2 (26th Nov-28th Dec 2010)
Diagnosis category
Daily mean visits during period
(min, max)
% change in visits during period
(95% CI)
Daily mean visits during period
(min, max)
% change in visits during period
(95% CI)
All-causes 2035.1 (1656, 2482) -6.1% (-7.4, -4.8) 2242.1 (1742, 3174) -4.7% (-5.4, -4.0)
CVD 45.9 (38, 58) -8.2% (-16.4, 0.6) 40.8 (22, 68) -9.4% (-14.2, -4.4)
Respiratory 91 (64, 129) -24.0% (-29.0, -18.8) 115.5 (54, 275) 12.8% (9.3, 16.5)
Evaluation of the implementation and health-related impacts of the Cold Weather Plan for England 2012
27
Strengths and limitations
A major strength of the work is that for both the time-series regression and episode analysis, the explicit effects of weather have been quantified, separate from other seasonal factors. So the results reported are risks associated directly with exposure to weather factors rather than the Excess Winter Deaths measure referred to in the CWP, which may also be reflecting increases due to seasonal factors unrelated to weather.
There were also some limitations in our assessment related to inadequate data. The most recent year available for mortality analysis was only 2006. A long time-series going back to 1993 has been used here to estimate effects robustly, but the nature of the relationships and the thresholds have the potential to change over time due to changes in the demographic structure and adoption of adaptations such as improvement in housing. Using more recent years of data would provide the best evidence of current associations. Also, influenza is a potentially important confounder of the temperature-health relationships, and influenza activity has currently not been controlled for in the regression models due to delays in the provision of data. Although the control for season in the regression models may capture influenza epidemics to some extent, explicit counts of influenza activity would be the best control for this factor.
Conclusions Nationally, there was a 3.84% (95% CI: 3.25, 4.43) increase in deaths for every 1°C drop in temperature below thresholds. Some impacts were also observed with morbidity indicators. The greatest health burdens of cold weather fell outside the alert periods currently used in the CWP. The best robust quantitative evidence on the health effectiveness of the CWP will only be available once the system has been in operation for a number of years, and the type of relationships described here can be re-evaluated in the years post-intervention to assess any changes.
References Armstrong BG, Chalabi Z, Fenn B, Hajat S, Kovats S, Milojevic A, Wilkinson P. (2011) The association of mortality with high temperatures in a temperate climate: England and Wales. Journal of Epidemiology & Community Health 65:340-345.
Hajat S, Kovats S. (2014) A note of caution about using the excess winter deaths measure. Nature Climate Change 4:647. [Correspondence]
Staddon PL, Montgomery HE, Depledge MH. (2014) Climate warming will not decrease winter mortality. Nature Climate Change doi:10.1038/nclimate2121.
Evaluation of the implementation and health-related impacts of the Cold Weather Plan for England 2012
28
Section B1 Implementation of the Cold Weather Plan, 2012/13 Lead authors: Lorelei Jones and Benjamin Ritchie
A major part of the evaluation was to assess local implementation of the CWP in 2012-13, and the extent to which it met the expectations set out in the CWP. In doing so, we endeavoured to examine the operational policy changes at local level (Section B1) as well as the experiences of older members of the public in cold weather (Section B2).
Methods
Since the study was designed to capture the views and experiences of health and social care managers, front-line staff and members of the public, a range of data collection methods was used: telephone interviews with health and social care managers; analysis of local planning documents; a national web survey of primary care and community health services nurses; and telephone interviews with a sample of older people.
The research was undertaken primarily in ten upper tier local authority (LA) areas. The 10 LAs were purposively sampled on the following criteria to ensure a diversity of settings:
• Geographical location: At least one from each Government Office Region, in order to cover the range of different winter weather patterns experienced across the country.
• Rurality: Five urban localities and five rural localities, so as to include localities with difficult access in cold weather.
• Deprivation: At least one locality from each quintile of the English Index of Multiple Deprivation (IMD), 2010 (Department for Communities and Local Government 2011a), in order to include areas with both more and less deprived populations.
• Other specific criteria: One locality with a high number of rough sleepers counted in autumn 2011 (Department for Communities and Local Government 2011b); one locality with a low proportion of adults speaking English at home (Office for National Statistics 2009); one area where health and social care coordination might be more difficult because a clinical commissioning group (CCG) boundary crossed LA boundaries.
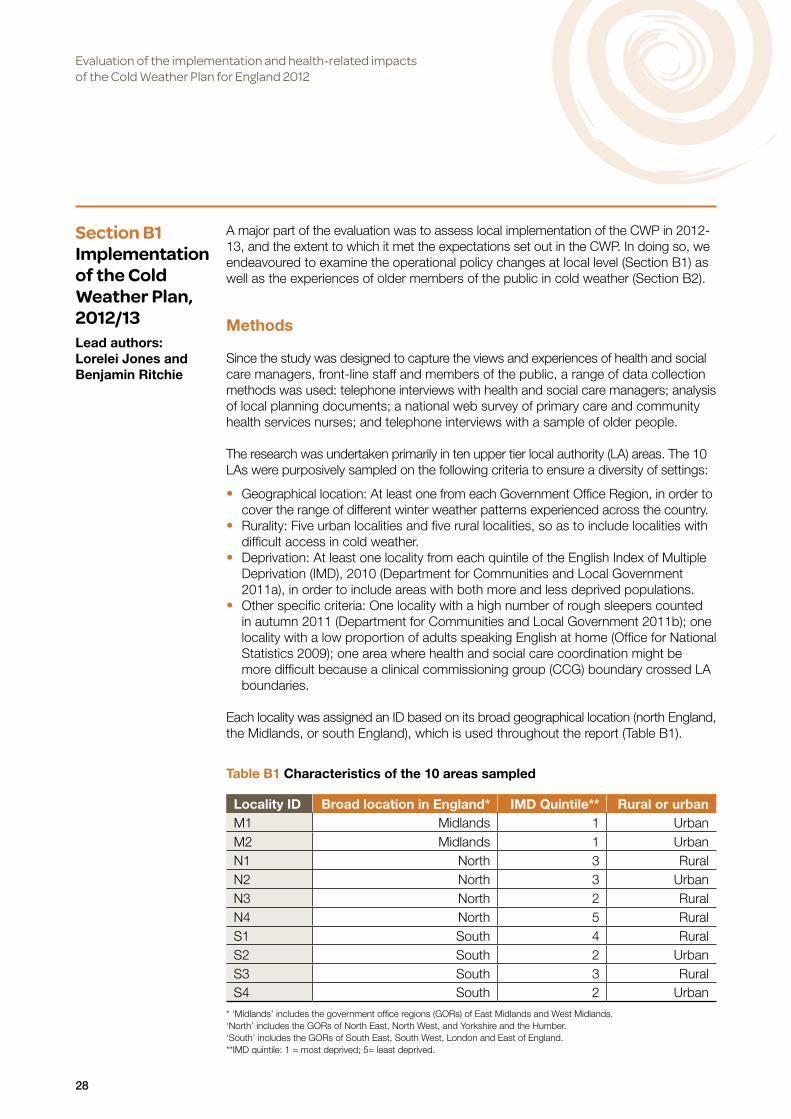
Each locality was assigned an ID based on its broad geographical location (north England, the Midlands, or south England), which is used throughout the report (Table B1).
* ‘Midlands’ includes the government office regions (GORs) of East Midlands and West Midlands.‘North’ includes the GORs of North East, North West, and Yorkshire and the Humber.‘South’ includes the GORs of South East, South West, London and East of England.**IMD quintile: 1 = most deprived; 5= least deprived.
Table B1 Characteristics of the 10 areas sampled
Locality ID Broad location in England* IMD Quintile** Rural or urbanM1 Midlands 1 UrbanM2 Midlands 1 UrbanN1 North 3 RuralN2 North 3 UrbanN3 North 2 RuralN4 North 5 RuralS1 South 4 RuralS2 South 2 UrbanS3 South 3 RuralS4 South 2 Urban

Evaluation of the implementation and health-related impacts of the Cold Weather Plan for England 2012
29
All data were collected between November 2012 and May 2013. According to the Met Office, the mean temperature for winter in the UK was 3.3°C which is 0.4°C below the long term average. December was equal to the long term average for the month and January was 0.3°C below the long term average. February was 0.9°C below the long term average and was the coldest month of the season (mean 2.8°C). Periods of notably cold weather occurred in early December, mid to late January, and the latter part of February (Figure B1). There was a period of widespread snowfall across much of the country from mid- to late January causing considerable disruption. There were shorter periods of snow in February.
Spring 2013 was particularly cold. The mean temperature over the UK was 6.0°C, which is 1.7°C below the long-term average. March was 3.3°C below the long-term average for the month, April was 1.1°C below, and May was 0.8°C below. March was colder than any of the winter months and the coldest for the UK since 1962. There were notable instances of snowfall in late March and early April.
In total 44 cold weather alerts were issued. There were 7 Level 1 alerts (winter preparedness). The first of these was issued on 27th November 2012. There were 20 Level 3 alerts (cold weather action) with the first issued on 30th November 2012 and the last issued on 20th March 2013. Most alerts were issued in early December, late January and late March.
Figure B1 Mean daily temperature: December 2012 to February 2013

Evaluation of the implementation and health-related impacts of the Cold Weather Plan for England 2012
30
Interviews with health and social care managers in the selected areas
Interviews with health and social care managers sought to establish what effect the introduction of the national CWP had had in local areas and to derive more general insights into preventing excess winter deaths to inform policy in this area.
Topic guide developmentInterviews with managers based at LAs and NHS organisations were guided by a semi-structured topic guide developed by the research team. When developing the topic guide, the research team drew on the content of the CWP for England 2011 (DH 2011), the CWP for England 2012 (DH 2012), the evaluation of the 2011 CWP conducted by the Health Protection Agency (HPA 2012) and the wider literature. The topic guide was circulated to members of an advisory group which had been specifically assembled for the evaluation and comments were received from two members.
The interview topic guide contained seven main areas:
• brief background of participants • current activities relating to cold weather planning • local cold weather plans • important issues, facilitating factors and challenges for cold weather planning and
response • procedures for responding to and views on Cold Weather Alerts • partnership working • costs of implementation.
The topic guide is included in Appendix B1.
Recruitment and interview proceduresIn November 2012, an initial letter from the research team was posted and emailed to the chief executives of the 10 LAs selected for the sample. The letter described the evaluation and asked the chief executives to provide names and contact details of relevant managers who had been tasked with leading winter planning and response to cold weather. A copy of the letter was emailed to the corresponding PCT and CCG chief executives in each LA area for their information. The names and contact details of LA managerial staff to approach for interviews were obtained from the replies to this initial letter as well as by asking participants for suggestions of additional people to interview in their areas.
Potential participants working in NHS organisations were identified through the following processes:
• communication with managers involved in cold weather planning and response at LAs and Local Resilience Forums
• communication with the staff of NHS R&D offices when applying for local permissions to conduct research
• inspection of local winter/severe weather plans accessible from PCT/PCT cluster or NHS trust websites
• telephone enquiries to PCTs/PCT clusters requesting help to identify local managers involved in cold weather planning or response.
Four members of the research team were involved with recruiting managers for interview (LJ, BR, GE and CH). A letter of invitation and a participant information sheet were emailed to potential participants. If the researcher did not receive a response, this was followed up by a telephone call approximately 10 days after mailing.

Evaluation of the implementation and health-related impacts of the Cold Weather Plan for England 2012
31
Recruitment continued in each locality until it was judged that a detailed picture of the implementation of the CWP could be established from the data, or until June 2013, at which point recruitment ceased.
Verbal consent was obtained from participants, and interviews were conducted by four members of the research team (LJ, BR, GE and CH). All interviews were conducted by telephone and were audio-recorded with participants’ consent. The topic guide was used in a flexible way so that issues of importance to participants could be discussed in detail. Interviews ranged in length from 18 to 82 minutes, with a mean interview length of 42 minutes. The researchers requested electronic copies of any local cold weather or winter plans referred to during the interviews. Rough notes from the initial interviews were shared among the research team and discussed to ensure that subsequent interviews effectively addressed the objectives of the study and emerging issues of interest.
In total, 52 interviews were held with health and social care managers in 10 LA areas in England. Table B2 shows the number of health and social care managers interviewed in each locality (n=52).
Data analysisAll interviews were transcribed verbatim by an external service and the transcripts were read by three researchers (LJ, BR and GE). Data were analysed in two ways:
• Organisation and summarisation of data collected in each of the 10 localities informed by the following questions:– How did the national CWP (including the action cards) appear to affect local
plans and arrangements?– Was it possible to identify any new activity associated with the national CWP
in the locality, and what was the nature of that new activity?– Were there any local contextual factors that had a bearing on implementation?– Who provided local leadership on planning for cold weather or where did it seem
to ‘fit in’?– How were Cold Weather Alerts used within the locality?– What information was provided regarding costs of implementation?
• Inductive coding of transcripts leading to the emergence of themes.
Table B2 Interviews with health and social care managers (n=52)
Local authority
PCT/CCG NHS Trust
NHS Ambulance
trust
Care home
Voluntary sector
General practice
Midlands 1 2 3 1Midlands 2 7 1North 1 1 1 2 1North 2 3 2North 3 2 1 3North 4 3 2 1South 1 4 1 1South 2 2 2South 3 2 2South 4 1 1Total 25 13 4 2 6 1 1

Evaluation of the implementation and health-related impacts of the Cold Weather Plan for England 2012
32
For the first approach, the localities were divided between three members of the research team (LJ, BR and GE) according to the areas in which the researchers had conducted the majority of their telephone interviews. Wherever possible, the findings from the interviews within a particular locality were triangulated with examinations of the local cold weather and winter plans that participants within that locality had sent to the team.
For the second approach, transcripts were coded using NVIVO 10 software (QSR International Pty Ltd). The codes were examined and linked together into major themes in an iterative fashion, whereby emerging themes informed further coding, which led to the refinement of themes.
Findings from the first and second approaches were shared with the team, and discrepancies in interpretation were resolved through re-examination of data and group discussions.
The findings were presented at a number of seminars and conferences before report writing. This provided an opportunity to test the analysis against the experiences of health and social care managers, and to assess its comprehensiveness and the extent to which it resonated with participants (member validation).
National web survey of primary and community nurses
The views and experiences of front line staff were obtained through a web survey of primary care and community health services nurses carried out in April-May 2013. An email invitation to take part in the survey was sent to all primary and community health services nurses identified on the Royal College of Nurses membership list (n=7823). There were 437 completed questionnaires, giving a response rate of 5.6% (which, although low, is not untypical for nurse surveys using the RCN membership list). Completed questionnaires were received from the following:
• Primary care (n=242), which includes ‘practice nurse’, ‘health care assistant’ and ‘other primary care’
• Community health services (n=181), which includes ‘district nurse’, ‘community nurse’ and ‘community matron’, ‘health care assistant’ and ‘other community care’
• Other (n=14), which includes nurses working in other areas such as schools, Ministry of Defence and sexual health
The web questionnaire covered: brief background of participants; knowledge and views of cold weather alert levels and actions; prioritising clients and activities taken during spells of cold weather; and views on how well their service was prepared for cold weather.
Experiences of people who are potentially at risk during cold weather in two of the selected areas
This part of the study explored the experiences of people who are potentially at risk during cold weather in the days following a cold weather alert. The aim was to assess these in light of the objectives of the CWP and to consider how the CWP may need to be altered in response to the experiences of target groups.
Interviews were held with 35 people in two of the LA areas selected for the evaluation. One site was an urban locality in the Midlands. Fifteen people were recruited by a social research organisation. The second site was a rural locality in the North of England.

Evaluation of the implementation and health-related impacts of the Cold Weather Plan for England 2012
33
Ten people were recruited by a social research organisation and ten people were recruited by the local Age UK office. The sample provided by Age UK differed from the other samples by including people who had had previous contact with a voluntary organisation and was therefore analysed separately. A purposive sampling strategy was used to find participants who reflected the target population; that is, people who were members of one of the groups, outlined in the Cold Weather Plan, who were considered to be potentially particularly vulnerable to cold weather. The groups chosen were people aged over 75 years and living alone, people aged over 90 years (not necessarily living alone) and people over 65 years with a long term condition (including chronic obstructive pulmonary disease, chronic bronchitis, asthma or an existing heart problem). In the Midlands urban locality, at least 3 people recruited were of Asian origin; in the Northern locality, at least half of the recruits lived in a rural area. Participants who agreed to take part were given a £20 honorarium in recognition of their time commitment.
Individuals were contacted on two occasions during the winter (in January and April), one or two days after a level 3 alert was issued. The initial stages of the interview were unstructured, covering the broad topic of how they were managing in the cold weather. Toward the end of the interview, probes were used, if necessary, to introduce any of the following topics not already covered during conversation:
• Extent and nature of contact with health and social care professionals • Contact with other agencies and organisations including non-governmental
organisations • Contact with and support provided by family, friends, neighbours • Nature, extent, functioning and use of home heating (e.g. are bedrooms heated at
night?) • Experience going out (e.g. nature of trip, evidence of snow being swept and gritting)
and consequences of not being able to leave the house during cold weather • Supplies (e.g. adequate supplies of food, fuel, medication, warm clothing and
footwear) • Critical incidents (e.g. falls, illnesses).
The concluding part of the interview contained direct questions about information and activities associated more directly with the CWP such as:
• Were you aware of the recent cold weather alert? • If so, how did you hear about the alert? • Did you find the information contained in the alert helpful? • What actions did you take in response to the alert? • Did anyone help you respond to the alert or the likelihood of cold weather? • How helpful were health and social care staff in the event of cold weather?
The unstructured design of the first part of the interview was intended to capture the participant’s priorities and frameworks of meaning (Britten 1995). Keeping direct questions on the CWP and/or the alerts to a minimum or scheduling them towards the end of the interview, was also intended to avoid the bias that can be introduced by people’s tendency to give what they believe to be the ‘right’ answer and the reluctance on the part of some people to report adversely about their health and social care services and individual members of staff.
Ethical approval was obtained in November 2012 from the Observational Research Ethics Committee of the London School of Hygiene & Tropical Medicine. Local NHS approvals were obtained between January and February 2013 from NHS R&D offices in the 10 localities.
Evaluation of the implementation and health-related impacts of the Cold Weather Plan for England 2012
34
Findings from interviews with health and social care managers in ten areas
All the health and social care managers reported that they found the CWP helpful and valued the cold weather alerts provided by the Met Office. As noted in the following quote, managers reported that they were already doing many of the suggested actions. Therefore our analysis sought to identify the ‘added value’ of the CWP.
I don’t think we were doing anything too much different from what the national plan suggested. And when the national plan did come along we said ‘oh yeah, we’re doing all this’. We’ll borrow the nice graphics. Thank you very much. (PCT emergency planning manager, North)
Contribution of the CWP to local cold weather planning
A frequent comment was that the CWP ‘formalised’ existing arrangements. For example, in some cases a Level 3 Cold Weather Alert would act as a trigger for a multi-agency meeting when previously these would have been arranged on an ad hoc basis.
It’s made it more formal, I think, and whereas before, it was a bit ad hoc. We sort of did it and we sort of did it to some degree, but now, it’s very much more focused upon. (NHS trust resilience and emergency planning manager, North)
It was something formal and practical that we could use in our emergency response structure. (LA resilience manager, North)
The CWP suggests actions at five levels that range from year-round planning to emergency response. This comprehensiveness was seen as a strength of the Plan in that it assumed a ‘whole system’ perspective and emphasised the importance of prevention:
I think it gave us a focus on what the outcomes were that we were trying to get from it and I think it made people realise it wasn’t just about the hospital setting and sort of NHS side of it and social care side of it, it’s far wider than that and I think that’s what needs to be brought out more. (PCT manager, South)
The CWP was also said to help coordinate a wide range of winter initiatives including:
• public information about keeping warm in winter • interventions aimed at reducing cold-related mortality and morbidity (such as
assistance with home heating and benefits advice) • capacity planning • emergency response.
Local managers reported that the CWP had led to more collaboration between agencies. Typical networks would consist of NHS organisations, the Council, police and fire authorities, housing providers, and voluntary and community organisations. Following the publication of the CWP, localities typically reported a more formal approach to multi-agency planning for cold weather with some localities producing multi-agency planning documents. Many localities reported that the communication between agencies during periods of cold weather had also improved.
Last year, when [the CWP] was new that’s when we started to do an awful lot of interdependency work then and we just carried it on this year. (LA resilience manager, Midlands)
Evaluation of the implementation and health-related impacts of the Cold Weather Plan for England 2012
35
This year I think we’ve got much better communication between the NHS and the Council and the shared plan really makes such a difference. (Director of Public Health, North)
The CWP was viewed as a ‘quality framework’ in the sense that it provided a useful reference for good practice. It was viewed as a practical document that clearly specified actions. Examples of initiatives introduced by local organisations as a consequence of the publication of the CWP included one emergency planner who had arranged for all NHS staff to receive the ‘flu vaccination at the beginning of winter so that, if there were to be periods of increased demand on NHS services, these were less likely to be exacerbated by staff absences and he would be more able to respond with an increase in staffing.
In another locality, the home addresses of staff were cross-referenced with those of people who were vulnerable to cold weather so that if staff were unable to come to work because of snow, they could visit a resident’s home on foot. Again this was done at the beginning of winter before the cold weather arrived.
Localities had also introduced a range of interventions aimed at reducing cold-related mortality and morbidity. These interventions included improvements to home heating, maximising income for vulnerable people (by ensuring that people were receiving all available benefits) and good neighbour schemes aimed at improving community resilience. Many of these initiatives had been funded by the Warm Homes Healthy People Fund, a grant provided by the government to underpin the objectives of the CWP. The Warm Homes Healthy People Fund has been the subject of a separate evaluation. However our research reinforced findings concerning the strengths of this initiative, in particular the requirement that agencies form partnerships with the voluntary sector (Sreeharan et al 2012). Managers in our study reported that voluntary organisations brought expertise (for example, on the best way to engage people in the target population) and were able to use their existing networks to identify individuals who were at risk during cold weather. Volunteers were also said to be essential for accessing people in geographically remote areas.
They can reach out into the communities that we can’t get to and quite likely people will listen to them in a way that they wouldn’t listen to us so that for us is why they’re so essential. (Local Authority manager, North)
On the whole, health and social care managers reported that CWP had led them to be more prepared and more proactive:
It brought to the attention of senior management the need to have this more systematic approach to things and I think that is good and we do now have sort of a plan and procedures that we follow, we do cascade the information better, I do think we are better prepared because of the national plan than we were previously. (LA manager, North)
Barriers to implementation
Despite the fact that the CWP was well received by local managers, it was clear that implementation of the Plan had been impeded by the April 2013 reorganisation of the English NHS that saw the abolition of strategic health authorities (SHAs) and primary care trusts (PCTs), and the shift of responsibility for commissioning health care to CCGs and the public health function to Local Authorities. PCT managers, in particular,

Evaluation of the implementation and health-related impacts of the Cold Weather Plan for England 2012
36
felt that the transition to the new NHS structures reduced the attention that could be given to implementing the CWP. New organisations that were expected to have a role in cold weather planning, such as the new LA Health and Wellbeing Boards and NHS Clinical Commissioning Groups, were not yet fully established at the time of data collection, since they did not formally come into existence until April 2013.
There were also requests for the CWP and the Warm Homes Healthy People Fund to be made available earlier in the year so as to improve winter planning. Reasons for the need for earlier availability of the Fund included the ‘lead’ time that was needed to engage GPs in systems for ‘signposting’ and client referral to interventions to improve home heating, and the perceived benefit of making home repairs in the summer, before the cold weather arrived.
One of the points that I’ve got when I was going through your questions was about you know, what can be done differently, what can be more helpful, is actually to know that we’re going to get the warm homes grant far, far earlier...we find for the work with the GPs, it’s actually a 6-month lead in time, it’s no good giving us the money in December and saying now go and work with the GPs because it’s too late; what you need to do with the GPs is actually to start working with them now so next September/October time, when the weather starts to get colder, so that we’ve got all the processes in place, they’ve have the chance to put all their arrangements in place. (LA manager, North)
Leadership
Leadership of the CWP implementation varied across the localities. In most cases, implementation of the CWP fell to emergency planning or resilience staff. One interviewee described it as being ‘handed round like a hot potato’. There was a feeling among some participants that, given the emphasis in the Plan on preventing cold-related morbidity and mortality, overall leadership of the Plan should have been the responsibility of the Director of Public Health, newly transferred from the NHS to the local authority:
What happens in our area is that it comes to the emergency planners to try and tackle. So what we’ve done is, we’ve really focused at the top end. So we’ve dealt with the cascades and also with happens if we get into the very bad, prolonged, sharp spells rather than the ‘winter happens every year’. And, for me, that’s actually one of the gaps. So one of the things that I’ve talked about with one of my colleagues in the City Council recently, is about trying to get it put back on the public health agenda, much more firmly, and tied into a lot of work that’s already going on.(PCT emergency planning manager, Midlands)
I think you should be, actually, planning and responding to avoid the situation rather than dealing with the emergency, per se. Which is what emergency planning is about really – it’s about managing emergencies. There’s an element of risk and mitigation in emergency planning but this is really about public health and education and ensuring that, not just educating the people that might be vulnerable, but the people around the people who might be vulnerable. So, I think, as I said before, I think that football needs to go firmly back into the Director of Public Health’s end of the pitch and they should take it forward, really, because I think it’s exactly what they should be doing.(PCT emergency planning manager, South)

Evaluation of the implementation and health-related impacts of the Cold Weather Plan for England 2012
37
One of the perceived benefits of having the local response to the CWP led by public health was that this would result in better coordination of initiatives undertaken by different departments (housing, neighbourhoods and communities, etc.) that have a bearing on long term planning for cold weather. In one locality where the CWP was led by public health this appeared to be the case (see Box B1). For example, this locality had coordinated initiatives by linking the fuel poverty initiatives to the Partnership Board for older people.
In this locality the Director of Public Health had also provided funding (in addition to that provided by the WHHP fund) to support the partnership working with voluntary organisations. The progress this locality felt it had made in addressing the wider determinants of cold related health and well-being was attributed in large part to this sustained funding.
Identifying vulnerable people
Different organisations had different definitions of ‘vulnerable people’. In many cases, only people who were in receipt of services from the LA were considered, rather than the broader population of local residents who might be vulnerable during periods of cold weather. Some of the managers who were interviewed acknowledged that local definitions would miss some people who were vulnerable in cold weather either because they were not eligible to receive, or did not use, services from the LA.
The action cards included in the CWP suggest that at level 0 (Long term planning) organisations work together to identify people who may be vulnerable to cold weather and systematically work to improve the resilience of vulnerable people to severe cold. In most cases, rather than seeking to identify such potentially vulnerable people ahead of winter, the strategy was to remind any staff who may come into contact with members of the public to ‘keep an eye out’ and to refer people they were concerned about.
Box B1 An example of a local Cold Weather Plan led by Public Health
• Cold Weather Alerts were incorporated into a local multi-agency Cold Weather Plan. The partners included the Council, the NHS, the fire and rescue service, Age UK and other local community and voluntary services, Area Action Partnerships and local housing associations.
• The aim of the local plan was to reduce excess winter deaths, and cold-related illnesses, by addressing its root causes and by targeting the locality’s most vulnerable residents.
• The plan set out, for each agency, the actions for each level of alert.
• Detailed guidance on identifying vulnerable people, including those not known to services, was provided in an appendix.
• The plan also detailed those interventions recommended in national guidance for reducing the risk of excess winter deaths (Health Inequalities National Support Team 2010).
• The trend in excess winter deaths for the area was being monitored over time.

Evaluation of the implementation and health-related impacts of the Cold Weather Plan for England 2012
38
Well to be frank, I don’t- if somebody came to our attention who was actually in some sort of critical situation because of the cold, then we would put together some sort of response plan for that individual; what we don’t do is pre-identify a group of people who might be vulnerable to the cold particularly and have a programme of ringing them every day or making sure everyone rings them, what we would do I suppose is by sending [the CWP] out to our partners and that includes some voluntary agencies, that might prompt them to check but I think us actually instituting a plan of seeing- talking to somebody daily who wasn’t already getting a daily contact, would have to be in response to a crisis actually happening with that person, a cold weather crisis. (LA emergency planning manager, South)
The last few years, we’ve written a plan, within the Council, which, until this winter gone, was always an internal document and it was really aimed at a lot of our frontline staff. And it was a reminder to them that, actually, we have a lot of staff across the entire Council who, for one reason or another, visit people’s homes, whether it’s a social care setting or whether it’s a …you know, it could be pest control. It could be building control. It could be absolutely anything. And, actually, what we did was we put some information together for them so that they could actually watch out for people when they were in someone’s home. So if they noticed that it was a bit chilly, you know, they would be able to sort of give them contact telephone numbers or they’d know how to sort of signpost those people into getting some support with fuel allowances or you know, emergency access to heating facilities, anything like that. Or just making that referral back to adult social care to say, “I’m a bit concerned about this person”. (LA resilience manager, North)
Whilst in most cases localities relied on opportunistic approaches to identifying vulnerable people, some localities had undertaken research aimed at identifying those residents who might be vulnerable during cold weather. In one locality research had revealed that excess winter mortality was higher in the least deprived areas. In another locality the LA had identified a particular problem amongst residents on low incomes living in housing estates where the accommodation was provided by private landlords. The research also revealed that for these residents the issues went beyond household warmth to include difficulties in getting access to food and medications during periods of snow and ice. Thus through this local ‘mapping’ exercise the LA identified the location of vulnerable residents and gained insight into the nature of that vulnerability.
Elsewhere, systematically identifying potentially vulnerable people, and then delivering an effective intervention, remained an as yet unrealised goal:
What we should have done is send something out earlier in the year and I think the idea is to choose a low peak time, September’s probably quite good, I’d say that the activity for this month is to identify those people who will be particularly at risk for cold weather, now the main purpose of that is to take action, in the autumn period, through the various grants or the various interventions that are possible to mean that when it comes to winter, they’re no longer particularly at risk, that won’t always be possible with all of them- so that’s- that’s when we should have done that, I think the way we’ve done has been much more reactive, it’s asking people to keep their eyes open – when they visit because um, they’re visiting these people anyway – because all our providers – the fact they are providers means that they – they’re going out to see people either daily or weekly or whatever the care plan is. (LA Emergency Planning Manager, South)
Evaluation of the implementation and health-related impacts of the Cold Weather Plan for England 2012
39
The task of identifying potentially vulnerable people was complicated by the many different organisations that hold lists of vulnerable people and difficulties with sharing data. Sources of information on vulnerable people included:
• GPs • community health services • social care • housing associations • utility companies (water, gas and electricity).
These organisations were unwilling to share information without the consent of the individual. A compromise was to compile a ‘list of lists’ that could be shared during an emergency, when data protection laws allowed data to be shared between organisations. However these individual lists were used for different types of emergencies (for example, flooding) and therefore did not necessarily include people who might be potentially vulnerable during cold weather. The criteria used to compile the lists included ‘in receipt of services’ or ‘eligible for services’. These criteria might include people who were not vulnerable during cold weather and exclude some who were.
With regards to identifying potentially vulnerable people and working to improve resilience to cold weather, interviewees reported that they were not always confident that they knew who they should be targeting and which interventions were the most effective:
I think I would like to understand exactly who the risk groups are and whether the interventions that are advocated are the correct interventions. I’ve got similar kinds of comments around heat wave as well because there’s two aspects: there’s one – are we actually sure that people are taking all the interventions they’re supposed to be doing; and then, two – are those interventions making any difference? And we’re not clear about some of that. I mean, I think the fuel poverty one, and the warm homes, it is very clear that that makes a difference. But again, it’s trying to understand, who should we actually be targeting and how? (PCT Emergency Planning Manager, Midlands)
It was apparent that, in some cases, the strategy for finding people who might be potentially vulnerable during cold weather, and the subsequent intervention, were of questionable effectiveness. For example, in one locality there was a scheme to distribute warm packs (the contents of warm packs varied between localities but might include such things as slippers, a blanket or a thermos). The warm packs were given to the parish council to distribute. The parish council had contact with some community groups, for example it rented a hall to groups such as the Women’s Institute, but there was nothing to suggest that these groups were in contact with people who might be particularly vulnerable during cold weather.
Participants also reported that in some cases people did not want to have the interventions. It was observed that a sensitive engagement strategy was required so as not to cause offence. The following quote relates to the distribution of warm packs:
We had people turning round and saying no we don’t need these, we don’t want them. And yet according to the information that we had those were people that could do with that support. The people actually distributing them in some cases were able to persuade them you know ‘just take it, it’s here if you use it great if you don’t need it at least you’ve got it’ but you know sometimes people can be a bit dogmatic and say no and you don’t want to go in too heavily to cause distress.(Local Resilience Forum Manager, Midlands)
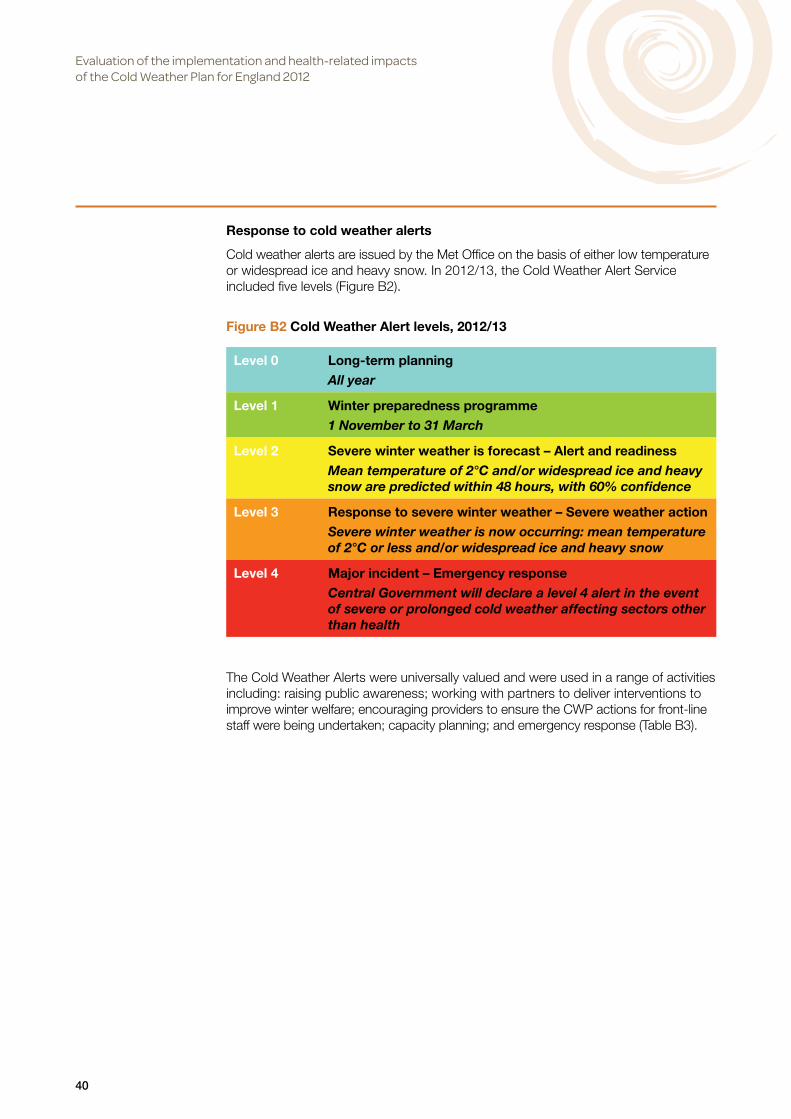
Evaluation of the implementation and health-related impacts of the Cold Weather Plan for England 2012
40
Response to cold weather alerts
Cold weather alerts are issued by the Met Office on the basis of either low temperature or widespread ice and heavy snow. In 2012/13, the Cold Weather Alert Service included five levels (Figure B2).
The Cold Weather Alerts were universally valued and were used in a range of activities including: raising public awareness; working with partners to deliver interventions to improve winter welfare; encouraging providers to ensure the CWP actions for front-line staff were being undertaken; capacity planning; and emergency response (Table B3).
Figure B2 Cold Weather Alert levels, 2012/13
Level 0 Long-term planningAll year
Level 1 Winter preparedness programme1 November to 31 March
Level 2 Severe winter weather is forecast – Alert and readinessMean temperature of 2°C and/or widespread ice and heavy snow are predicted within 48 hours, with 60% confidence
Level 3 Response to severe winter weather – Severe weather actionSevere winter weather is now occurring: mean temperature of 2°C or less and/or widespread ice and heavy snow
Level 4 Major incident – Emergency responseCentral Government will declare a level 4 alert in the event of severe or prolonged cold weather affecting sectors other than health

Evaluation of the implementation and health-related impacts of the Cold Weather Plan for England 2012
41
Table B3 Uses of the Cold Weather Alerts
Activity Examples
Promoting public awareness
Level 2 would have been basically updating our website, at the [local authority] and again, other partner agencies were also expected to update their local websites and just putting alerts on.(LA emergency planning officer, Midlands)
Working with partners to deliver interventions to improve winter welfare
From our point of view we then send it out to all our partners to make sure they’re all aware that there may be more demand on the phone lines, or for emergency help, or heaters, or whatever it is.(PCT manager, South)
It gives us a little bit of a warning that if you’re having really cold weather in the next 24 hours, 48 hours, 72 hours. And it allows agencies to then get their act together fairly quickly if they need to, for – say, distribute warm packs. That happens where there’s a little bit more of an urgency to do it now, when that alert comes out. So that was very useful. (LA public health consultant, South)
If there’s a cold weather alert of 3 coming out, we’ll automatically send our ‘knock next door’ messages around all of our voluntary organisations – they know to kind of step up some of the work that they do themselves. (LA manager, North)
Communicating with health and social care providers
Whenever the cold weather alerts do come out again, we sort of cascade emails around providers to remind them to pick up their action cards at the various levels […] and we always include the links to the CWP. (PCT winter lead, North)
From a health perspective what has been happening is the emergency planning team’s PCT cluster have been sending out alerts to the acute and community providers and our primary care colleagues to alert them to the fact that there is alert 2 or 3, whatever it is, and this is what the Plan says should be happening. So it’s general awareness raising that we’re entering a cold spell, this is what the Plan says, can you make sure you’re doing –”(LA assistant director of public health, South)
When the alerts come in depending upon the levels that they are, we circulate information to our care providers […] An example: If a care provider is somebody that’s going out delivering care in the home, et cetera, it’s perhaps communication with people that they would normally go to and say, they might not get there, or consider this, that, do this, if we can be there we will be there. Or they might look at re-planning some of their routes or their method of transport in getting to these people. Gives them the options to see how they’re going to go about their business and talk to perhaps the more vulnerable explaining the situation, then perhaps putting contingencies in place, ahead of the bad weather.(LA manager, South)
Ensuring the safety of staff travelling
I think the two bits are really about allowing extra time for their own journeys, making sure their own personal health and safety is considered.... we also send out the gritting schedules from the local authority. So they’ll know which roads are probably more treated than others. They’ll know to take extra care.(PCT public health consultant, South)
I know they start alerting their off duty night staff, for example, to start saying to them, don’t put yourselves at risk. I’m ringing the people on the rota now to say if this weather is as predicted, it may mean this, this and this.(LA manager, North)
Continued >
Evaluation of the implementation and health-related impacts of the Cold Weather Plan for England 2012
42
Activity Examples
Capacity planning and emergency response
It [cold weather alert] goes out to all members of our manager’s forum […] If there are problems anticipated or if any particular team is experiencing problems, it’s something that’s shared to see if we can compensate by moving staff around, for instance, probably the best example would be the recent snowy weather when we move social work resources to the hospital to assist with discharge.(LA manager, South)
I think we find [the cold weather alerts] useful in the sense that you know, when we have to arrange the staffing levels. Because obviously some severe weather conditions, it affects the staffing that can come in. So, it helps to organise the workforce.(LA manager, Midlands)
...we move resources around accordingly. So if [city] is getting really busy, then the outskirts, the outskirts [city] feed in and meet the demands there, and so forth, and it just basically has a hit all the way along, a ripple effect – meeting the demand. We move resources to meet demand.(NHS ambulance trust manager, North)
And a level 2 alert, my response for the acute side would be I would tend to advise places like trauma and orthopaedics, A&E, assessment suite and outpatients, that we’re on a 2. But if we’re on a 3 it would be more, I would still advise the same people, but their action might be different. So if it was a 3 they would probably be aware that we’re probably going to get an increase in activity into ED with falls and slips and trips.(NHS trust manager, North)
We could pre-alert and work with the acute trust, with the local authority and social services, to prepare for escalation over, say Friday, Saturday, Sunday, if we were advised Monday, Tuesday via the cold-weather alert, that there was a cold snap coming.(PCT manager, North)
It means that staff are on alert if they need to prioritise the services. If they think that the weather’s going to turn bad, make sure that the emergency visits are done, that the routine visits, if we need to cancel them then we’ve got good communication with patients and their relatives. They’ve been really helpful those weather warnings.(NHS trust community services manager, North)
As those alerts begin to rise then it’s sent to people like our director on call, or it’s sent to – via group email addresses – to our partners. When it gets to the point where it’s a level 3/4 then we start to have teleconferences and we’ve had that in the past. We start to bring partners together on teleconferences and then start to discuss the activation of the plan if we need to.(PCT cluster head of emergency planning, South)
Table B3 Uses of the Cold Weather Alerts continued
In general, level 2 and 3 alerts reached a wide audience. Approaches to cascading alerts included ‘all heads of service’, ‘all managers’ and ‘all staff’. In many cases the frequency of distribution of alerts was controlled, with managers leading on cold weather planning filtering alerts before cascading them. In some areas all front-line staff were encouraged to self-register for alerts, whilst in other localities a combination of strategies (cascading and encouraging self-registration) was employed:
I think it works quite well, it’s easy for people to sign up to and get – and receive the alerts. We pick them up and still send them on even if we know the people are subscribed to the alerts themselves because that extra reminder never hurts.(PCT winter lead, North)

Evaluation of the implementation and health-related impacts of the Cold Weather Plan for England 2012
43
For local managers it was important that the alerts were credible and relevant to their locality. Local managers also reported that there were different implications depending on whether it was just cold or snow and ice:
One of the things we would find useful on the cold weather alerts is making a distinction between cold weather, business as usual, no terrible weather event and cold weather alert accompanied by a bad weather event because to us we end up doing two different things. (Local Authority manager, North)
These requirements led to a pragmatic approach to distribution. For example, a frequent comment was that alerts would only be distributed if the risk of cold weather was reported to be 60% or higher. In many cases Cold Weather Alerts were used in conjunction with personal judgement and other sources of information.
Engaging with primary care
Managers reported variable engagement with GPs. There were some examples of GPs referring patients to interventions aimed at reducing cold-related mortality and morbidity, such as household warmth initiatives. Elsewhere, it was reported that these initiatives had received very few referrals from the NHS despite efforts to engage GPs:
It’s very ad hoc, their involvement. Some are much more involved and see the value of the fact that well actually these are my patients and if somebody can help them keep their home properly heated that’s going to actually allow me to save money …some GP’s just have the kind of you know the hand up, it’s about how much is it going to cost us to send letters and things like that ... I was quite amazed at that not particularly helpful attitude. They just don’t see this as part of their job whereas everybody else kind of does see it as part of their job.(LA manager, North)
It was frequently acknowledged that the difficulty in engaging GPs was due in part to GPs’ competing priorities. In the following example, GP engagement had been facilitated by a ‘GP champion’. In the quote below the manager is referring to a scheme where patients can receive a referral from the GP to have their energy bills paid for by the council:
What we found with (the scheme) was that at first some of them couldn’t see what their role was and why it was important and it was a really useful exercise to go to the [Local Medical Committee] and to be able to say, ‘Actually it really does make a difference’ and just to spell it out to them because for us who are working on it it’s absolutely obvious, but for busy GPs who are thinking about 175 different things, it’s far less obvious to them and so we kind of had to spell it out and once they got it, particularly in one part of the county they have really, really switched onto [the scheme] and they really, really like it. (LA manager, North)
As has been the case with other similar studies (Abrahamson and Raine 2009), we had difficulties recruiting GPs to participate in the research. The one general practice that agreed to speak to us had not heard of the CWP. Nonetheless, this practice had in place a year-round proactive approach to the management of its most vulnerable patients (defined in this case as patients who were housebound).

Evaluation of the implementation and health-related impacts of the Cold Weather Plan for England 2012
44
Actions for front-line staff
The CWP contains action cards that set out the appropriate actions for different local organisations. For example, it is recommended that front-line staff perform home checks when visiting clients (e.g. to assess room temperature, medications and food supplies). The Plan also suggests that during periods of severe winter weather (Level 3), providers should consider daily visits or phone calls to high-risk individuals who are living on their own or who have no regular contacts. The suggested actions for health, social care and community professional staff are given in Tables B4 and B5.
The interviews with managers provided no evidence that staff were conducting any additional visits to homes of vulnerable people during periods of cold weather, although there was usually a process in place for managing scheduled visits during periods of ice and snow when access might be difficult. This process typically involved prioritising certain clients, such as those who were socially isolated, to receive a scheduled visit using contingency arrangements such a 4x4 vehicle or staff travelling on foot. Other clients due a visit may, if appropriate, receive a phone call instead or some other arrangement, such as a visit by a family member:
So for example we may have some clients in a village on the moors which gets snowed in but we know that people in the village will rally round in times of need so we’re a bit more relaxed about them as opposed to someone who may be living on their own we know that they’ve got no carers so we’ll make every effort to get to them at least once a day. (LA manager, North)
Among local health and social care managers, there was an assumption that the suggested actions contained within the CWP were a core part of professional work. This assumption influenced the way the CWP was distributed and the extent to which adherence to the Plan was monitored.
For example, in one locality, commissioners distributed the CWP to providers at the beginning of winter. The Cold Weather Alerts published by the Met Office were then used as a reminder for providers to ensure the actions required under the Plan were being undertaken. In the following quote a manager suggests that he was hesitant about taking a harder line:
You’ve got to be quite careful because these are professional people who know the risks. They know vulnerable people. You don’t want to teach them to suck eggs, do you? You’ve got to say, ‘You all know there’s a problem around cold weather. You know what used to happen, years ago, when we had a huge number of deaths. This is the latest plan to address that and this is how it works and this is what we’ll do.’ And take a very straightforward and factual – just explain the process to them and they all seemed quite on board... (PCT Emergency Planning Manager, South)
In many cases, services had been contracted to external providers and in this context the CWP and the Cold Weather Alerts were viewed as a useful, non-confrontational way to prompt external providers to undertake the desired actions. Nonetheless, participants often admitted that they could not be certain that the actions were being carried out, but assumed that this was the case.

Evaluation of the implementation and health-related impacts of the Cold Weather Plan for England 2012
45
Tab
le B
4 C
WP
act
ions
, 201
2/13
: Hea
lth,
so
cial
car
e an
d c
om
mun
ity
pro
fess
iona
l sta
ff
Leve
l 0Lo
ng t
erm
pla
nnin
gLe
vel 1
Win
ter
pre
par
edne
ss
pro
gra
mm
e
Leve
l 2S
ever
e w
inte
r w
eath
er is
fo
reca
st –
A
lert
and
rea
din
ess
Leve
l 3R
esp
ons
e to
sev
ere
win
ter
wea
ther
–
Sev
ere
wea
ther
act
ion
Leve
l 4M
ajo
r in
cid
ent
–E
mer
gen
cy
resp
ons
e
Wor
k w
ithin
you
r or
gani
satio
n an
d w
ith p
artn
er o
rgan
isat
ions
to
ens
ure
that
sys
tem
s ar
e de
velo
ped
to s
uppo
rt th
e id
entifi
catio
n an
d sh
arin
g of
in
form
atio
n be
twee
n ag
enci
es o
f pe
ople
who
may
be
vuln
erab
le to
C
W a
nd o
ther
sea
sona
l var
iatio
ns
Sys
tem
atic
ally
wor
k to
impr
ove
the
resi
lienc
e of
vul
nera
ble
peop
le
to s
ever
e co
ld E
nsur
e th
at a
ll st
aff h
ave
been
mad
e aw
are
of
the
CW
P a
nd th
e da
nger
s of
CW
to
hea
lth a
nd k
now
how
to s
pot
sign
s an
d sy
mpt
oms.
Iden
tify
thos
e at
ris
k on
you
r ca
selo
ad a
nd n
eces
sary
cha
nges
to
car
e pl
ans
for
high
-ris
k gr
oups
Fo
r th
ose
with
mul
tiple
age
ncy
inpu
ts, e
nsur
e th
at th
e ke
y w
orke
r is
cle
arly
iden
tified
Wor
k w
ith in
divi
dual
s at
ris
k, th
eir
fam
ilies
and
care
rs to
ens
ure
that
th
ey a
re a
war
e of
the
dang
ers
of C
W a
nd c
old
hous
ing
and
how
to k
eep
war
m E
nsur
e th
at
ther
e ar
e cl
ear
arra
ngem
ents
for
‘sig
npos
ting’
thos
e at
ris
k cl
ient
s an
d pa
tient
s to
oth
er s
ervi
ces
(e.g
. hom
e in
sula
tion
sche
mes
, be
nefit
s en
title
men
ts) w
hen
iden
tified
in ‘c
linic
al’ s
ituat
ions
or
cons
ulta
tions
(see
als
o Fi
gure
3.3
) W
ork
with
par
tner
s to
ens
ure
that
vu
lner
able
pat
ient
s an
d cl
ient
s ha
ve a
cces
s to
fuel
sup
plie
s. L
ink
to e
nerg
y su
pplie
r pr
iorit
y se
rvic
e re
gist
ers
as re
quire
d E
nsur
e th
at
clie
nts
and
colle
ague
s ar
e aw
are
of, a
nd ta
ke a
dvan
tage
of,
flu a
nd
othe
r va
ccin
atio
n pr
ogra
mm
es
Iden
tify
the
reso
urce
s av
aila
ble
to y
ou fo
r ra
isin
g aw
aren
ess
of
the
heal
th r
isks
ass
ocia
ted
with
w
inte
r w
eath
er a
nd c
old
hous
ing
(for
exam
ple,
pha
rmac
ists
hav
e a
key
role
in re
min
ding
peo
ple
to
have
suf
ficie
nt m
edic
ine
and
can
help
with
pre
vent
ive
med
icin
es
man
agem
ent).
As
appr
opria
te, c
onta
ct th
ose
mos
t at r
isk
and
impl
emen
t ca
re p
lans
Whe
n m
akin
g ho
me
visi
ts, b
e aw
are
of
the
room
tem
pera
ture
in th
e ho
useh
old
and
be a
ble
to
advi
se o
n re
com
men
ded
room
te
mpe
ratu
res.
Kno
w h
ow to
si
gnpo
st c
lient
s on
to o
ther
se
rvic
es, e
spec
ially
thos
e at
hi
gh r
isk
(see
Fig
ure
3.2)
Rem
ind
clie
nts
of th
e ac
tions
they
can
ta
ke to
pro
tect
them
selv
es
from
the
effe
cts
of s
ever
e co
ld
Con
side
r ho
w fo
reca
st w
eath
er
cond
ition
s m
ay im
pact
on
your
w
ork
– an
d m
ake
appr
opria
te
arra
ngem
ents
Mak
e su
re y
ou a
nd
your
team
s ar
e pr
epar
ed fo
r an
po
tent
ial i
nflux
of w
eath
er-r
elat
ed
inju
ries
and
illnes
ses.
Impl
emen
t loc
al p
lans
for
cont
actin
g th
e vu
lner
able
. If
appr
opria
te, c
onsi
der
daily
vis
its
or p
hone
cal
ls fo
r hi
gh-r
isk
indi
vidu
als
livin
g on
thei
r ow
n w
ho h
ave
no re
gula
r co
ntac
ts
Ens
ure
staf
f can
hel
p an
d ad
vise
cl
ient
s O
ther
act
ions
as
per
Leve
l 2
Mai
ntai
n bu
sine
ss c
ontin
uity
.
Con
tinue
act
ions
as
per
Leve
l 3 u
nles
s ad
vise
d to
the
cont
rary
.

Evaluation of the implementation and health-related impacts of the Cold Weather Plan for England 2012
46
Tab
le B
5 C
WP
act
ions
, 201
2/13
: GP
s an
d p
rim
ary
care
tea
ms
Leve
l 0Lo
ng t
erm
pla
nnin
gLe
vel 1
Win
ter
pre
par
edne
ss
pro
gra
mm
e
Leve
l 2S
ever
e w
inte
r w
eath
er is
fo
reca
st –
A
lert
and
rea
din
ess
Leve
l 3R
esp
ons
e to
sev
ere
win
ter
wea
ther
–
Sev
ere
wea
ther
act
ion
Leve
l 4M
ajo
r in
cid
ent
– E
mer
gen
cy
resp
ons
e
Con
side
r the
cen
tral
com
mun
ity
role
of g
ener
al p
ract
ice,
pa
rtic
ular
ly in
rura
l are
as, a
nd
wor
k w
ith L
RFs
and
oth
er
stak
ehol
ders
in re
silie
nce
plan
ning
P
rom
ote
flu im
mun
isat
ion
to b
oth
staf
f and
pat
ient
s D
iscu
ss a
nd
agre
e w
ith y
our l
ocal
par
tner
s th
e ar
rang
emen
ts fo
r ‘si
gnpo
stin
g’
to o
ther
ser
vice
s su
ch a
s af
ford
able
war
mth
and
ben
efits
S
taff
trai
ning
sho
uld
incl
ude
sess
ions
on
seas
onal
wea
ther
an
d th
e id
entifi
catio
n of
vul
nera
ble
indi
vidu
als
to h
elp
staf
f be
mor
e aw
are
of th
e ef
fect
s of
CW
on
heal
th; t
hose
gro
ups
of p
atie
nts
likel
y to
be
mos
t vul
nera
ble;
and
ho
w th
ey c
an s
ignp
ost p
atie
nts
onto
oth
er s
ervi
ces
Con
side
r us
ing
oppo
rtun
istic
app
roac
hes
to
sign
post
app
ropr
iate
pat
ient
s to
ot
her s
ervi
ces
whe
n th
ey p
rese
nt
for o
ther
reas
ons
(see
Fig
ure
3.3)
. Fo
r exa
mpl
e, fl
u ja
b cl
inic
s ca
n be
an
oppo
rtun
ity to
pro
mot
e co
re p
ublic
hea
lth m
essa
ges
with
vu
lner
able
indi
vidu
als
Dis
cuss
w
ith p
ract
ice
and
com
mun
ity
nurs
ing
staf
f abo
ut a
vaila
ble
tool
s an
d to
olki
ts to
aid
sys
tem
atic
id
entifi
catio
n of
vul
nera
ble
peop
le.
Sta
ff tr
aini
ng s
houl
d in
clud
e a
spec
ific
sess
ion
on th
e C
WP
and
C
W re
silie
nce
whe
re re
quire
d,
rele
vant
and
app
ropr
iate
to
loca
l con
ditio
ns C
onsi
der
how
yo
u ca
n pr
omot
e ke
y pu
blic
he
alth
mes
sage
s in
the
surg
ery
Con
side
r ho
w y
ou c
an a
dapt
yo
ur te
am’s
cap
acity
to a
po
ssib
le s
urge
in a
ctiv
ity a
nd/
or d
isru
ptio
ns in
tran
spor
t lin
ks;
patie
nt a
cces
s to
pha
rmac
eutic
al
supp
lies,
etc
. Get
a fl
u ja
b to
he
lp y
ou p
rote
ct y
ou a
nd y
our
patie
nts
Use
the
star
t of t
he
CW
A s
easo
n as
an
oppo
rtun
ity
to re
view
bus
ines
s co
ntin
uity
ar
rang
emen
ts.
Take
adv
anta
ge o
f clin
ical
co
ntac
ts to
rein
forc
e co
re p
ublic
he
alth
mes
sage
s ab
out t
he
effe
cts
of C
W a
nd c
old
hom
es o
n he
alth
Act
ivat
e sy
stem
s to
hel
p si
gnpo
st p
atie
nts
to a
ppro
pria
te
serv
ices
from
oth
er a
genc
ies
Con
side
r ho
w fo
reca
st w
eath
er
cond
ition
s m
ay im
pact
on
your
w
ork
– an
d m
ake
appr
opria
te
arra
ngem
ents
. For
exa
mpl
e,
how
will
it af
fect
hom
e vi
sits
and
w
hat a
ltern
ativ
es a
re a
vaila
ble?
Yo
ur P
CT
shou
ld, w
hen
mak
ing
hom
e vi
sits
, be
broa
dly
awar
e of
the
room
tem
pera
ture
in th
e ho
useh
old
and,
if re
quire
d, k
now
ho
w to
adv
ise
on le
vels
that
are
of
con
cern
and
as
nece
ssar
y, to
si
gnpo
st to
oth
er s
ervi
ces.
Wor
k w
ith o
ther
NH
S a
nd s
ocia
l ca
re, c
omm
unity
and
vol
unta
ry
orga
nisa
tions
to e
nsur
e st
rate
gic
coor
dina
tion
of re
spon
se, t
akin
g in
to a
ccou
nt th
e lik
ely
surg
e in
de
man
d fo
r pr
imar
y ca
re in
the
days
follo
win
g a
cold
spe
ll B
e pr
epar
ed to
act
ivat
e bu
sine
ss
cont
inui
ty p
lan
Ens
ure
that
st
aff a
re a
war
e of
CW
ris
ks
and
are
able
to a
dvis
e pa
tient
s ap
prop
riate
ly.
Con
tinue
act
ions
as
per
Leve
l 3 u
nles
s ad
vise
d to
the
cont
rary
.
Evaluation of the implementation and health-related impacts of the Cold Weather Plan for England 2012
47
For example, in one locality, the commissioner (CCG) said that staff providing care for people in their homes were ‘made aware’ of the CWP. There was no training as such but the commissioner said that he thought that it would be included in their induction. The commissioner had provided free training on the broader issue of safeguarding vulnerable people which was provided in the form of ‘e-learning’. Quality monitoring was limited to monitoring how many staff had been referred to the training.
Table B6 summarises what local health and social care managers reported to be existing practice in relation to the actions of front-line staff during cold weather and how the CWP and the cold weather alerts were used.
Summary points from interviews with health and social care managers
• The CWP was viewed by local health service managers as helpful to planning activities. It was seen to bring together the full range of activities related to winter and to provide a reference guide for ‘good practice’.
• Managers valued the Cold Weather Alerts and used them in a range of activities including raising public awareness, providing interventions to improve winter welfare, capacity planning and emergency response.
• Since the publication of the CWP, local health and social care managers reported that they had increased the extent to which they had planned for cold weather in conjunction with other agencies and the extent to which they provided a coordinated response to cold weather. Typical networks consisted of local health and social care organisations, housing providers, the police and fire brigades, and voluntary and community organisations.
• Local health and social care managers reported being more proactive, for example vaccinating staff against influenza at the beginning of winter. Overall, localities felt they were more prepared for the arrival of cold weather than they had been previously.
• Leadership of the Cold Weather Plan local response often fell to emergency planning staff. Some participants felt that the Cold Weather Plan would be better off if led by public health. This would ensure a focus on those activities aimed at reducing cold related morbidity and mortality and the coordination of initiatives of different departments (health, adult social care, housing, neighbourhoods and communities etc).
Table B6 Actions of front-line staff before and after the introduction of the CWP
Before publication of the first CWP After publication of the first CWP
Cold • Staff trained on the health effects of cold weather
• Staff perform home checks • Staff signpost clients to other services as
needed
• CWP sent to operational managers and external providers
• Cold Weather Alerts used as a reminder to providers and front-line staff to perform the actions set out in the CWP
Snow and ice
• Procedures for prioritising clients and redeploying staff
• Alerts used to ‘warn and inform’ operational managers and external providers
• In some areas a local cold weather plan is produced that incorporates the existing escalation plan
• Alerts feed into existing escalation plans (e.g. a Cold Weather Alert is included as a ‘trigger’ for escalation)

Evaluation of the implementation and health-related impacts of the Cold Weather Plan for England 2012
48
• Healthcare commissioners, in particular, felt that the attention they could give to implementing the Cold Weather Plan was hampered by the transition to new structures. It remains to be seen what priority is given to the Cold Weather Plan by the new Clinical Commissioning Groups and Health and Wellbeing Boards.
• Interviewees reported variable engagement with GPs. In some instances local GPs were referring patients into schemes aimed at improving household warmth. In other cases, these schemes reported receiving relatively few referral’s from the NHS, despite considerable attempts to engage with GPs.
• Health and social care for people in their homes was often provided by external (independent sector providers). Managers felt that the CWP was a useful way to engage with such providers about the needs of individuals during cold weather, and the Cold Weather Alerts were sent to providers as a prompt or reminder to make sure that front-line staff were undertaking the specified actions. Nonetheless, managers reported that they could not be sure that front-line staff were carrying out the actions set out in the CWP.
• There were different definitions of vulnerable people. Often only existing clients were considered, rather than the broader population of residents who might be vulnerable during cold weather. Most localities relied on opportunistic strategies for identifying vulnerable people who might benefit from an intervention, for example referral to home heating improvements. Some localities had undertaken their own local mapping exercise which had provided valuable information on the location of vulnerable people and the nature of that vulnerability, which could be used to tailor the response to specific local needs.
Findings from the national web survey of primary and community health services nurses
Of the 437 responses from nurses, 242 worked in primary care, 181 worked in community health services and 14 worked in other areas (e.g. school nurse). Primary care nurses include practice nurses and health care assistants working in general practice surgeries and health centres. They are involved in the detection and assessment of undifferentiated needs, treatment of long-term conditions (such as asthma, cardiovascular disease, COPD and diabetes), illness prevention activities such as screening, and treating minor injuries and illness. Community health services nurses include district and other nurses and health care assistants who provide care to patients in their own homes. This includes patients requiring a short episode of nursing care and support (e.g. following hospital discharge) as well as patients requiring care for long-term conditions. The role of community matron includes coordinating services from other agencies such as primary care, secondary care, local authority, voluntary agencies and the independent sector. Primary care and community health services nurses are often the main point of contact for elderly and house bound patients, so their knowledge and implementation of the CWP can be critical for protecting vulnerable patients during periods of cold weather.
The types of nurses who responded to the survey are given in Table B7.

Evaluation of the implementation and health-related impacts of the Cold Weather Plan for England 2012
49
The sample of nurses included a mix of different types of employer, level of seniority and location of work (Table B8).
Table B7 Types of nurses who responded to the survey
Number %Practice nurse 239 55Other primary care 3 1District nurse 54 12Community nurse 88 20Community matron 22 5Health care assistant in the community 4 1Other community care 13 3Other 14 3Total 437 100
Table B8 Characteristics of nurses
Primary (n=242) Community (n=181) Other (n=14) All (n=437)Female 98% 96% 100.0% 97%Male 2% 4% - 3%Type of employerNHS 20% 86% 57% 49%Social enterprise 0% 7% - 3%Local authority 1% 1% - 1%Third sector - 1% 7% 1%Independent provider 76% 4% 7% 44%Other 3% 1% 29% 3%Years in current jobLess than 2 14% 18% 15% 16%2 to less than 5 17% 28% 31% 22%5 to less than 10 21% 22% 15% 21%10 or more 48% 32% 38% 41%Age18-34 3% 9% - 5.0%35-54 67% 70% 71% 68.0%55+ 31% 22% 29% 27.0%RegionNorth East 5% 7% - 6%North West 10% 11% 23% 11%Yorkshire and Humber 9% 12% 8% 10%East Midlands 8% 9% 15% 9%West Midlands 8% 15% - 11%East of England 11% 4% 8% 8%London 11% 4% 8% 8%South East 25% 21% 15% 23%South West 13% 17% 23% 15%Area typeInner city 12% 8% 14% 11%Other urban 26% 24% 36% 26%Suburban 34% 41% 36% 37%Rural 28% 26% 14% 27%
‘-‘=none. Percentages for ‘Other’ nurses must be treated with caution due to small base.

Evaluation of the implementation and health-related impacts of the Cold Weather Plan for England 2012
50
For the nurses who responded to the web survey, Table B9 shows some of the characteristics of their current roles (e.g. hours worked per week). Community nurses saw the highest proportion of patients over the age of 75. However primary care nurses saw more patients in a given day so may have seen a similar number of older patients. Primary care nurses will also see other groups who may be vulnerable to cold weather, such as patients with respiratory diseases and children under the age of five.
In total, 62% of the nurses had heard of the CWP (53% of primary care nurses and 75% of community health services nurses). Nearly half had read at least some of the CWP (38% of primary care and 52% of community health services nurses). Among the nurses who had heard of the Plan, 42% said that it was used by their service to help it make plans for the winter (25% of primary care nurses and 55% of community nurses) and 15% said that local preparations had changed because of the CWP (8% of primary care nurses and 21% of community nurses). For both questions, most nurses responded that they ‘don’t know’.
Nurses were asked to what extent they had carried out the actions that were suggested in the CWP (Table B10). Taking into account the fact that participants had been given a ‘not applicable’ option, community nurses were more likely to have undertaken the actions suggested in the CWP than practice nurses.
As Table B10 shows, aside from flu vaccinations (which most nurses checked for most of their patients) and advising people not to go outdoors in cold weather, all the other actions were less likely to be carried out with all or most of those patients who needed help. The action that was least likely to be met was arranging extra help for vulnerable patients who needed it.
Table B9 Work characteristics
Primary (n=242) Community (n=181) Other (n=14) All (n=437)Hours worked per weekLess than 10 3% 1% - 2%10 to 19 16% 8% 36% 14%20 to 39 74% 73% 50% 73%40 or more 7% 18% 14% 12%% of patients aged 75+Less than ½ 35% 6% 21% 23%About ½ 25% 9% 14% 18%50% to 75% 30% 33% 7% 30%More than 75% 3% 49% 14% 23%Don’t know 6% 3% 43% 6%Number of patients seen in a typical dayLess than 5 1% 9% 8% 5%5 to 9 2% 49% 15% 22%10 to 19 30% 38% 46% 33%20 or more 68% 4% 31% 40%See more/fewer patients in winterAbout the same 75% 56% 62% 67%More in winter 19% 29% 15% 23%Fewer in winter 1% 1% - 1%Varies 5% 14% 23% 9%
‘-‘=none. Percentages for ‘Other’ nurses must be treated with caution due to small base.
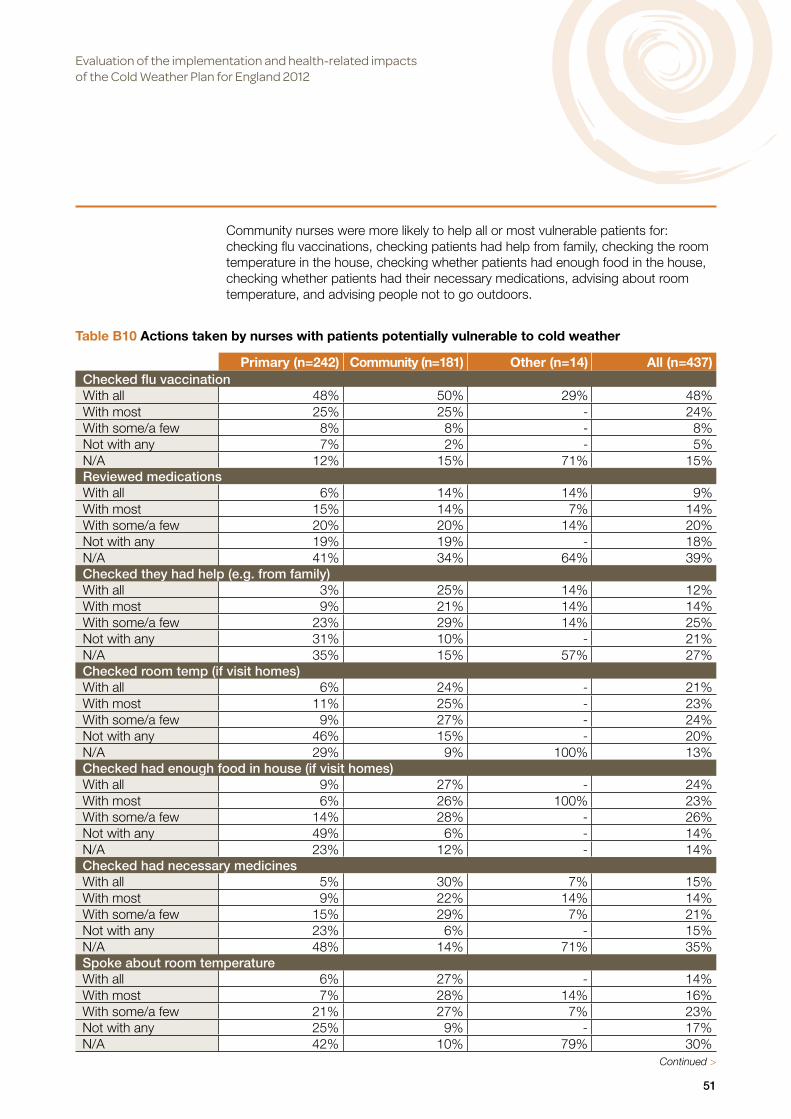
Evaluation of the implementation and health-related impacts of the Cold Weather Plan for England 2012
51
Community nurses were more likely to help all or most vulnerable patients for: checking flu vaccinations, checking patients had help from family, checking the room temperature in the house, checking whether patients had enough food in the house, checking whether patients had their necessary medications, advising about room temperature, and advising people not to go outdoors.
Table B10 Actions taken by nurses with patients potentially vulnerable to cold weather
Primary (n=242) Community (n=181) Other (n=14) All (n=437)Checked flu vaccinationWith all 48% 50% 29% 48%With most 25% 25% - 24%With some/a few 8% 8% - 8%Not with any 7% 2% - 5%N/A 12% 15% 71% 15%Reviewed medicationsWith all 6% 14% 14% 9%With most 15% 14% 7% 14%With some/a few 20% 20% 14% 20%Not with any 19% 19% - 18%N/A 41% 34% 64% 39%Checked they had help (e.g. from family)With all 3% 25% 14% 12%With most 9% 21% 14% 14%With some/a few 23% 29% 14% 25%Not with any 31% 10% - 21%N/A 35% 15% 57% 27%Checked room temp (if visit homes)With all 6% 24% - 21%With most 11% 25% - 23%With some/a few 9% 27% - 24%Not with any 46% 15% - 20%N/A 29% 9% 100% 13%Checked had enough food in house (if visit homes)With all 9% 27% - 24%With most 6% 26% 100% 23%With some/a few 14% 28% - 26%Not with any 49% 6% - 14%N/A 23% 12% - 14%Checked had necessary medicinesWith all 5% 30% 7% 15%With most 9% 22% 14% 14%With some/a few 15% 29% 7% 21%Not with any 23% 6% - 15%N/A 48% 14% 71% 35%Spoke about room temperatureWith all 6% 27% - 14%With most 7% 28% 14% 16%With some/a few 21% 27% 7% 23%Not with any 25% 9% - 17%N/A 42% 10% 79% 30%
Continued >

Evaluation of the implementation and health-related impacts of the Cold Weather Plan for England 2012
52
Table B10 Actions taken by nurses with patients potentially vulnerable to cold weather continued
Primary (n=242) Community (n=181) Other (n=14) All (n=437)Advised not to go outdoorsWith all 17% 53% 14% 32%With most 22% 23% 14% 22%With some/a few 29% 13% 7% 21%Not with any 8% 1% - 5%N/A 25% 10% 64% 20%Arranged extra helpWith all 2% 7% - 4%With most 5% 15% 14% 9%With some/a few 12% 31% 7% 20%Not with any 25% 22% 7% 23%N/A 56% 24% 71% 44%Advised who to see for extra helpWith all 5% 15% 7% 9%With most 9% 24% 7% 15%With some/a few 26% 28% 14% 26%Not with any 24% 17% 7% 21%N/A 37% 16% 64% 29%Nurse could not visit all vulnerable patients during cold weatherWith all - 8% - 7%With most 9% 13% 100% 13%With some/a few 31% 42% - 40%Not with any 26% 16% - 18%N/A 34% 21% - 23%Vulnerable patients could not always get to practiceWith all 9% 11% 15% 10%With most 30% 17% 8% 24%With some/a few 45% 36% 15% 41%Not with any 5% 5% - 4%N/A 11% 31% 62% 21%
‘-‘=none. Percentages for ‘Other’ nurses must be treated with caution due to small base. N/A = not applicable.
Knowledge and response to cold weather alerts
The vast majority of nurses responding to the survey had heard of the Cold Weather Alerts, although only 13% said they were aware of the actions for the different alert levels. Only 4% said they had seen the Action Cards. Overall, a third of nurses said they were made aware of the alerts by their manager (27% of primary care and 40% of community health services nurses). Half heard about the alert level from the news media (60% of primary care and 37% if community health services nurses) and 36% were sent the alerts directly (21% of primary care and 55% of community health services nurses).
The alerts did not appear to have much impact on the work of primary care nurses. Community nurses were more likely to make changes when there was an alert including: prioritising seeing their most vulnerable patients, spending more time with them, seeing some patients more often and cancelling some of their routine activities (Table B11). Overall 29% of nurses (44% of community health services nurses) said they had changed their plans in response to an alert which turned out to be not as cold as predicted.
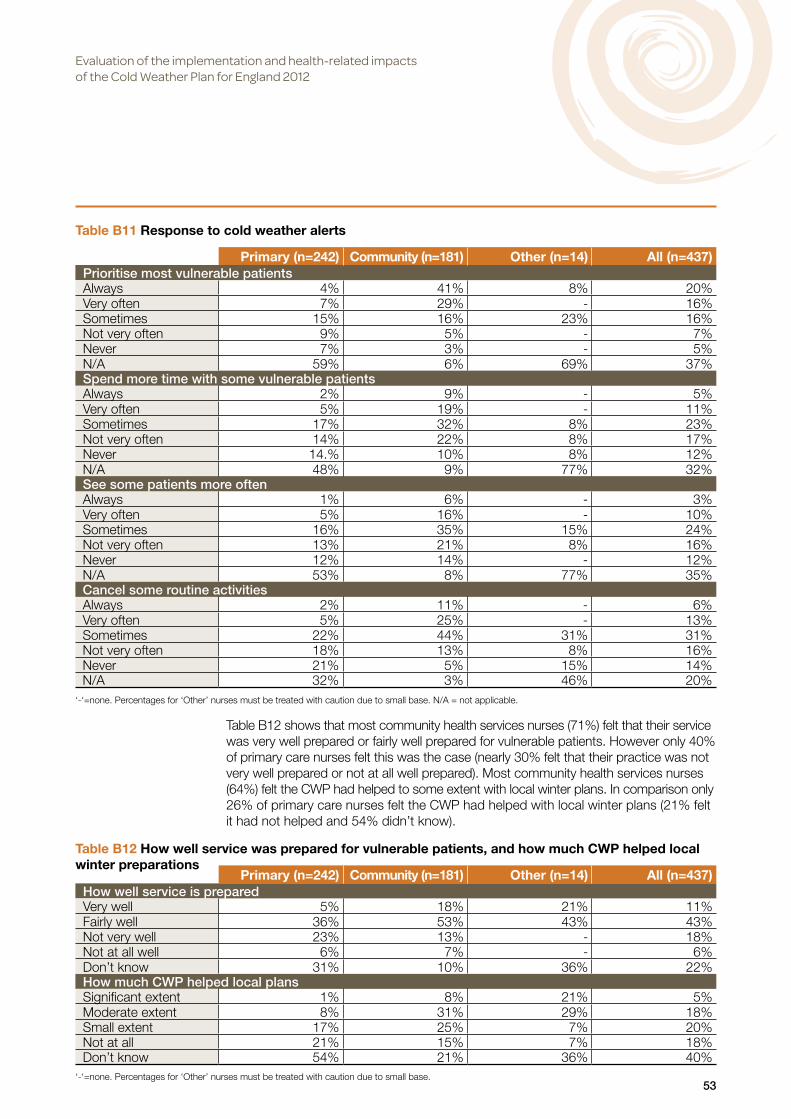
Evaluation of the implementation and health-related impacts of the Cold Weather Plan for England 2012
53
Table B12 shows that most community health services nurses (71%) felt that their service was very well prepared or fairly well prepared for vulnerable patients. However only 40% of primary care nurses felt this was the case (nearly 30% felt that their practice was not very well prepared or not at all well prepared). Most community health services nurses (64%) felt the CWP had helped to some extent with local winter plans. In comparison only 26% of primary care nurses felt the CWP had helped with local winter plans (21% felt it had not helped and 54% didn’t know).
Table B11 Response to cold weather alerts
Primary (n=242) Community (n=181) Other (n=14) All (n=437)Prioritise most vulnerable patientsAlways 4% 41% 8% 20%Very often 7% 29% - 16%Sometimes 15% 16% 23% 16%Not very often 9% 5% - 7%Never 7% 3% - 5%N/A 59% 6% 69% 37%Spend more time with some vulnerable patientsAlways 2% 9% - 5%Very often 5% 19% - 11%Sometimes 17% 32% 8% 23%Not very often 14% 22% 8% 17%Never 14.% 10% 8% 12%N/A 48% 9% 77% 32%See some patients more oftenAlways 1% 6% - 3%Very often 5% 16% - 10%Sometimes 16% 35% 15% 24%Not very often 13% 21% 8% 16%Never 12% 14% - 12%N/A 53% 8% 77% 35%Cancel some routine activitiesAlways 2% 11% - 6%Very often 5% 25% - 13%Sometimes 22% 44% 31% 31%Not very often 18% 13% 8% 16%Never 21% 5% 15% 14%N/A 32% 3% 46% 20%
‘-‘=none. Percentages for ‘Other’ nurses must be treated with caution due to small base. N/A = not applicable.
Table B12 How well service was prepared for vulnerable patients, and how much CWP helped local winter preparations
Primary (n=242) Community (n=181) Other (n=14) All (n=437)How well service is preparedVery well 5% 18% 21% 11%Fairly well 36% 53% 43% 43%Not very well 23% 13% - 18%Not at all well 6% 7% - 6%Don’t know 31% 10% 36% 22%How much CWP helped local plansSignificant extent 1% 8% 21% 5%Moderate extent 8% 31% 29% 18%Small extent 17% 25% 7% 20%Not at all 21% 15% 7% 18%Don’t know 54% 21% 36% 40%
‘-‘=none. Percentages for ‘Other’ nurses must be treated with caution due to small base.

Evaluation of the implementation and health-related impacts of the Cold Weather Plan for England 2012
54
Participants were asked to suggest other actions which they thought should be taken during winter or spells of cold weather that were not included in either their local plan or the national CWP. Most of the suggested actions related to the ability of nurses to get to patients during periods of ice and snow or to the safety of staff when travelling in cold weather (e.g. by improving the availability of 4X4 vehicles). Several primary care nurses suggested that communication could be improved, but their responses did not provide any detail beyond this (e.g. ‘better communication’).
The findings from the survey must be interpreted carefully given the low response rate (which is not untypical for surveys of RCN membership) and the fact that those that did respond may be more likely to have an interest in, and knowledge of, the particular topic. A lack of detailed knowledge of the CWP by frontline staff might be due to the fact that winter planning is usually undertaken by more senior staff. Nonetheless, among our potentially more knowledgeable and motivated survey participants, the findings suggest that many staff are aware of the CWP, although awareness among participants was significantly higher among community health services nurses than general practice nurses. Community health services nurses in particular used the Cold Weather Alerts as a source of information on the likelihood of cold weather and responded accordingly. However, even among those motivated to respond to the web survey, the findings also suggest that it cannot be assumed that primary and community health services nurses are undertaking the suggested actions in the CWP which are aimed at protecting people who are vulnerable to cold weather.
Summary points from survey of primary care and community health services nurses
• Most community health services nurses responding to the survey had heard of the CWP and many had read at least some of it. Among community health services nurses, 21% said that local preparations had changed because of the CWP. A comparatively lower proportion of primary care nurses had heard of the CWP and only 8% reported that local preparations had changed because of the CWP.
• Whilst most nurses in the survey were checking flu vaccination, and many were advising clients not to go out in cold weather, the other actions that were specified in the CWP, such as checking and advising on room temperature, checking clients had enough food in the house and checking clients had necessary medicines, were often not undertaken when needed. The action least likely to be undertaken was arranging extra help for people who needed it.
• The vast majority of survey participants had heard of the Cold Weather Alerts and most received them either directly or from their manager. Many community health services nurses reported making changes to their work in response to a Cold Weather Alert, such as prioritising vulnerable patients. Cold Weather Alerts did not have much impact on the work of primary care nurses.
• Most community health services nurses (71%) felt well prepared for winter and felt that the CWP had helped to some extent (64%). A comparatively smaller proportion of primary care nurses felt well prepared for winter (40%) and only 26% felt that the CWP had helped with their winter planning.
• Additional comments provided by nurses were concerned with improving access to clients (e.g. by having greater access to 4x4 vehicles) and for their personal safety when travelling to visit patients during periods of ice and snow.

Evaluation of the implementation and health-related impacts of the Cold Weather Plan for England 2012
55
Section B2 Support received by potentially at risk individuals during periods of cold weather
Strategies for keeping warm in cold weather
All the individuals in the sample (n=35) had taken steps to keep warm. These included wearing additional layers of clothes, and thick boots and a hat if they were going outside. All participants had also made preparations in anticipation of cold weather, especially those living in the rural area, most often stocking up on food and fuel.
I’ve got socks on; thermal vest, a thick jumper, a thick cardigan and I’ve just had about two or three cups of tea. I had a very nice warm dinner so that warms me up you see. I try and look after myself as much as possible. I don’t just sit here and deteriorate, if you know what I mean. I try my best. (Midlands 15)
Individuals from the rural area observed that they had had experience of many cold winters; those of 1963 and 1947 were recalled as having been particularly cold.
I’ve lived long enough and I’ve lived on a farm and that was isolated and if you don’t know, having lived in those circumstances, what to do, you have been asleep! (North 2)
All participants made a point of listening to the weather reports on the TV and radio, and some could recall what level cold weather alert had been issued:
Interviewer: Did you know that the Met Office had issued a cold weather alert?
Participant: It’s an amber warning, isn’t it? Interviewer: It is
Home heating
For all participants keeping warm was a priority and most therefore kept the heating on during cold weather even though it was expensive. There were exceptions, for example, one woman turned her heating off during the day because of the expense:
I have central heating but I had that on for a few hours, but I daren’t keep it on all day because of the cost. You see I’m over 80 and I do get the £300 extra to help with the heating. But with how the weather’s been this last fortnight, I think I’ve used about that much in heating. (Midlands 15)
There was, however, a universal preference for not having the heating on at night. The reason was comfort. Most participants said that they that they felt warm in their beds at night, although many mentioned that they would get up several times during the night to use the bathroom. One woman who had COPD would stand at her open front door in all weather in an effort to ease her breathing.
Among study participants, there was a clear distinction between those in council or housing association accommodation and owner occupiers. Participants who lived in housing provided by the council or by housing associations reported feeling warm, having central heating and insulation, and with repairs undertaken quickly. In contrast, owner occupiers reported inefficient heating systems. Study participants in the North, in particular, tended to live in older properties in rural locations that were not on mains gas so that they relied on other fuels such as electricity, wood or coal.

Evaluation of the implementation and health-related impacts of the Cold Weather Plan for England 2012
56
Financial assistance
Participants were asked if they had seen any information about what help might be available for people during cold weather such as financial assistance. This question clearly made some people feel uncomfortable and was met with a response along the lines of ‘I wouldn’t know about that’, perhaps reflecting a desire to appear independent.
However, many participants spontaneously mentioned that they had received helpful advice or assistance from Age UK (this was not confined to people from the group of interviewees identified by Age UK). This may reflect a preference for engaging with the voluntary sector rather than statutory services (Abrahamson et al 2009). Specific help that had been received from Age UK included assistance obtaining benefits, including filling in forms; advice on fuel providers with discounted tariffs for older people; and contact details for a local trustworthy ‘handyman’ service to undertake repairs. In one locality the local Age UK also provided a cafe which was a popular location for socializing.
Health and contact with health care professionals
All study participants reported some form of long-term condition. One woman was convalescing from a hip replacement. Despite all participants having regular contact with health care professionals, none reported receiving any advice or assistance relating to cold weather. Although some people had been invited over the winter to attend the practice for a review, this was a regular 6-month review and not related to the cold weather. No-one could recall receiving advice from a health professional specifically related to the cold weather. The people in this study valued a long-standing relationship with their GP. Indeed when asked if anyone had asked how they were managing in the cold weather, some were quick to suggest that the reason they had not been asked was that their GP knew them and knew that they had someone to help them if needed.
Three participants experienced a significant deterioration in their health over the winter requiring hospitalisation. Of these, one woman had had a stroke and one had recently experienced a deterioration of an existing respiratory illness. In the other case, the cause of hospitalisation was unknown as the participant was not well enough to be interviewed on a second occasion. The woman who had had the stroke was using the bathroom in the night. She reported lying in her bathroom for a day and a half before concerned neighbours called the police.
Cold weather risks and fear of falling
Interviewees sought to keep warm primarily for comfort and in the belief that the cold could exacerbate existing health conditions. In line with the findings of Gascoigne et al (2010), there was no indication that interviewees had any knowledge of the cardiovascular risk associated with cold temperatures. The exception was one woman whose partner had died of a heart attack whilst outside on a cold day. This woman observed that ‘my partner died because of the cold’.
The greatest concern during cold weather was slipping on ice and falling. To prevent this, individuals tended to stay inside when they believed there was a risk that they could slip.
For ten days I’m in the house, you know, I’ve never been out. I can’t – I just watch from my window the snow, but I can’t go out. I’m frightened sometimes. It’s slippery. So the problem is there. (Midlands 6)

Evaluation of the implementation and health-related impacts of the Cold Weather Plan for England 2012
57
Participants reported that, although the council were often quick to grit the roads, footpaths were not gritted, even in areas that were predominantly bungalows for older people. Although participants tended to stay inside during icy conditions when they perceived there was a risk of falling, social activities were of great importance which, together with a dislike of being ‘stuck in’, led to people going outside as soon as it was considered safe to do so:
It drives us crazy sitting in looking at the walls. Just lost my husband at Christmas and I miss him so much. I’ve got to go out and meet with my friends or have a cup of tea after swimming. It just keeps you going. (North 5)
Reasons for being outdoors during cold weather included property maintenance and attending to livestock, walking, swimming, shopping, voluntary work and visiting social clubs and day centres.
Reliance on public transport
Participants’ accounts revealed that transport was a key concern. Participants from both the urban and rural locations described journeys that involved a complex combination of buses and walking or else the use of taxis. In the North sample, which involved individuals from rural localities, the absence of local facilities increased the need to make arduous journeys using public transport.
I went shopping yesterday and it was very slippery. I can get two buses. If I go straight along I’ve got to cross two roads to get to it but if I go the other way, it means there is a slope to climb to get a bus. (North 6)
We’ve got nothing in the village I live in now. The only thing we’ve got is a pub which opens at seven o’clock at night and the only thing you can get here if you want it is a packet of crisps and that’s about it. We’ve got no post office, no shops. The Post Office used to have a shop but they closed them, in their wisdom so we’ve got nothing really. We used to have a butcher’s shop but he got closed. We’ve got nothing at all. If you want anything, you’ve got to get a taxi or get somebody to get it for you. (North 10)
In the following quote the interviewer and the participant were having a conversation about thermal underwear:
Participant: Where do you get them from?
Interviewer: Marks and Spencer’s.
Participant: We’ve got a Marks at (Town A) and I could get a minibus to (Town B). You only get five miles and then I get on a `Link bus, I’ve got a bus pass and the bus pass will take me to (Town A) and I could walk to Marks and Spencers and everything’s fine and hunky dory I would imagine. I would think that is probably the best thing because today when I went out to get the coal and the logs, the bitterness of the cold around the bottom of my back, although I’ve got warm clothes on, I think thermals is what I need. (North 2)
Evaluation of the implementation and health-related impacts of the Cold Weather Plan for England 2012
58
Social support
Many of the participants in this study had family who lived close by and who were a source of instrumental support during periods of cold weather. In one instance, a couple’s boiler failed leaving them with no heating during a period of very cold weather. The couple however had a nephew who was a plumber and able to repair it. Other examples of instrumental support from family members included:
• car journeys to do shopping or attend the hospital • delivering groceries and cooking meals • social outings such as family meals • household repairs • help with learning how to use a computer and the internet • advice on heating technology.
Interviewer: And how old is your sister?
Participant: 64. And she comes up and she’ll be up about 6 o’clock to 7 and make sure I’ve got everything. And she’s crafty, you know, she’ll look in the fridge and she always makes sure there’s plenty of food and things like that which, I suppose, is nice in one way. She’s doing to me what I did for me Mum, years ago, you see. You sort of do that, yeah. But I miss her if she doesn’t come but she does come every night, nearly, specially since the weather’s been bad. (Midlands 15)
Some interviewees also reported having very good neighbours who would drop by to see if they needed anything. One reported that on one particularly cold Friday night their neighbours had brought round fish and chips. It was clear that some participants lived in a neighbourhood with a culture of neighbours helping older people during cold weather. However such neighbourhoods tended to be predominantly of older people so that the ‘old’ were helping the ‘older’:
I’ve got an old guy next door and I keep an eye on him because he isn’t in the best of health. He’s got trouble with his heart and I just mention if he wants anything. He keeps himself warm so we manage alright. We live in a village and everybody seems to keep an eye on everybody else. (North 1)
One woman who lived in a neighbourhood with a greater mix of ages received no help from her neighbours. This she attributed to the fact that her neighbours had other commitments such as work and children. In the absence of family, flexible personal care was highly valued:
Well she is a proper carer. She cares for the person. She’s doing something for that person but it’s got to be everything that person needs; whatever is needed. No exclusions. My carer does it. (Midlands 12)
The following example illustrates the interplay of different factors that influence people’s ability to be warm in the home. On contacting a participant following a level 3 cold weather alert, he reported that he had not received his pension. He had contacted the relevant authority and was told that this was due to a technical problem with the computer system. However as a consequence he was unable to put money into the prepaid meter that controlled his electricity and therefore had no heating.

Evaluation of the implementation and health-related impacts of the Cold Weather Plan for England 2012
59
When I called the following day he still had not received his pension but had managed to borrow £5 to put on his electricity meter. A recent report on fuel poverty observed that people on low incomes often have the most expensive methods of payment (Hills 2011). In this case, the combination of low income and a prepaid meter left him particularly vulnerable during cold weather. However this vulnerability was again mediated by social support in that he was able to borrow some money to put on the meter.
Summary points from interviews with people who are potentially at risk during cold weather
• All participants made a point of listening to weather reports and acting accordingly, for example, by stocking up on food or fuel when periods of very cold weather or snow and ice were forecast. Being warm in the home was a priority and most participants kept the home heated even though this was expensive.
• There was, however, a universal preference for not having the bedroom heated at night. Most, but not all, participants said they felt warm in their bed at night, although there was a tendency to get up and move around during the night (for example to use the bathroom).
• There was a clear distinction between participants who lived in social housing which was newer, had efficient heating systems, was well insulated and well-maintained, and owner occupiers living in older, hard to heat homes, particularly in rural areas that were not connected to mains gas.
• Participants were largely unaware of the cardiovascular risk association with low temperatures. The greatest concern of participants was falling and all participants sought to avoid this by staying inside during icy conditions. Nonetheless, when it was thought to be safe to do so, participants made excursions outside, for shopping, exercise, to socialise or simply to ‘get out’. Most participants relied on public transport and many faced long and arduous journeys involving a combination of walking and buses to access facilities. The habit of venturing outdoors when possible, and the nature of journeys for participants who relied on public transport, were important sources of exposure to cold temperature.
• All participants had some form of chronic health condition, but none reported receiving any advice or attention from health or social care professionals particularly associated with cold weather.
• Many participants in this study had received practical support from family during periods of cold weather such as car journeys for shopping or hospital trips, delivering groceries and cooking meals, and help with household repairs, using the computer and the internet and using heating technology. This support was crucial to participants’ health and wellbeing in winter.
• Participants who lived in villages or in neighbourhoods that were predominantly older people reported cultures of neighbours looking in on each other and helping with jobs such as clearing paths. Indeed many of the participants provided this assistance themselves. This was not the case for participants who lived in neighbourhoods with more diverse age structures.
Discussion
The aim of this part of the evaluation was to explore how the CWP was implemented by local organisations. To this end, data were collected on the views and experiences of local health and social care managers, front-line staff and a sample of older people who may be vulnerable during cold weather. We discuss each of the main themes emerging from the data and the implications of each for future CWPs.

Evaluation of the implementation and health-related impacts of the Cold Weather Plan for England 2012
60
Broadly positive response to the CWP from local health and social care managers
Interviews with health and social care managers in ten local authority areas in England found that managers welcomed the CWP, and the Cold Weather Alerts, and believed these had helped to improve local planning for cold weather. The suggested actions were viewed as a compilation of good practice that could be used as a reference for local managers. In implementing the CWP managers felt they had formalised processes for planning and responding to periods of cold weather. In some localities it had initiated or increased the extent of joint planning between agencies, for example between NHS organisations, the Local Authority, the police and fire authorities and voluntary organisations. As a result, managers felt their organisations had become more proactive, rather than reactive, in their response to cold weather and that the planning and response of local organisations was better coordinated.
There was however a view held by some managers that the CWP would be more effective, especially in relation to preventing morbidity and mortality, if it was led by public health professionals rather than by emergency planning staff. Leadership by public health professionals was seen as crucial for maintaining the emphasis on prevention and long-term planning (Level 0 actions). Leadership from public health was also seen as necessary for facilitating the integration of initiatives aimed at preventing mortality and morbidity that were being implemented by different departments (housing, adult social care, communities and neighbourhoods, etc).
There are a number of factors which can account for the broadly positive response by local managers to the CWP. The CWP reinforced existing practice and was in line with other policies, such as the focus on prevention in the Social Care White Paper (Secretary of State for Health 2012). The CWP was also in line with local priorities, specifically the need reduce demand on both health and social care services which was a universal priority for local managers in this study. Therefore the emphasis on prevention in the Cold Weather Plan complemented other policies and existing priorities for managers. (This message has since been reinforced by local government’s new role in public health and its implications for reducing harm from cold weather, as outlined in Local Government Association 2013.)
In addition the CWP was accompanied by dedicated funding in the form of the Warm Homes Healthy People Fund. This was used by local organisations to fund the recommended actions aimed at preventing cold-related mortality and morbidity (Level 0 actions). It was clear that many of these initiatives would not have happened without the funding.
Difficulty engaging primary care providers
Health and social care managers reported variable engagement with GPs. There were some examples of GPs referring patients to interventions aimed at reducing cold-related mortality and morbidity, such as household warmth initiatives. Elsewhere it was reported that these initiatives had received very few referrals from the NHS despite efforts to engage GPs. The national web survey of nurses suggested that knowledge of the CWP was relatively poor in general practice and that it had had very little impact on the work of staff in primary care.
We were unable to recruit more than one general practice to this study (itself an indication of the level of interest in the topic), so were unable to explore the reasons behind this finding. Elsewhere it has been suggested that the pressures of the
Evaluation of the implementation and health-related impacts of the Cold Weather Plan for England 2012
61
‘day job’ and concerns about increasing workload meant that GPs do not see the provision of warmth advice and referral to other services as a priority (Department of Health 2013). Other barriers to referral were said to be:
Lack of knowledge of local available services, the worry of potentially embarrassing patients by raising issues around housing and income, lack of feedback from referrals they have made in the past, concerns around feedback from patients whose interaction with winter warmth services was negative, and concerns over the commercial motivations of energy companies. (Department of Health 2013, p 14)
The views of GPs should be a focus of any future research in this area.
Limited actions of front-line staff in response to the CWP
The care of people in their homes is now largely provided by external (independent sector) providers that have been awarded contracts by the Local Authority or the NHS. In this context, local health and social care commissioning managers found that the CWP, and the cold weather alerts, served as a useful way of engaging with providers on the subject of cold weather planning and encouraging providers to ensure that the CWP actions for front-line staff (such as checking the temperature in a client’s home) were being undertaken. Nonetheless, commissioning mangers reported that they could not be sure that the actions were being done by front-line staff. The findings from the web survey of nurses suggest that the desired actions were not always undertaken when needed.
Difficulties defining and identifying “vulnerable people”
Interviews with health and social care managers revealed that different organisations used different definitions of ‘vulnerable people’. In most cases the definition related only to the population of existing clients, rather than the broader population of local residents. Local managers also tended to think of vulnerability in terms of socio-economic deprivation. Typical definitions of vulnerability included ‘in receipt of statutory services’ or ‘eligible for services’. The latter related to what are sometimes referred to as ‘passport benefits’ (for example, income support or housing benefit). However, studies undertaken in the UK have found no socio-economic gradient in relation to cold attributable mortality (Wilkinson et al 2004). Thus, targeting resources to people who are in receipt of services will exclude some individuals who are vulnerable to cold whilst including some who are not.
One reason for the absence of a socio-economic gradient in relation to excess winter deaths is that housing is of a better standard in the social sector than in the private sector (Department of Communities and Local Government 2011c). The link between the quality of housing in the social sector and winter health outcomes is confirmed by a study by Wilkinson et al (2001) that found that private renters and home owners were at a significantly increased risk of excess winter mortality compared with social housing tenants. Another study found that individuals from ‘better off retirement areas’ had the highest excess winter morbidity rates (Watkins et al 2001). The suggested explanation was that older people in larger and harder to heat homes were at greater risk of adverse winter health outcomes.
These findings were reinforced by our interview study with older people. This found a clear distinction between the reports of people living in council or housing association properties of well insulated housing, efficient heating systems and timely repairs, and the experiences of owner-occupiers living in older properties in rural areas that were not connected to mains gas.

Evaluation of the implementation and health-related impacts of the Cold Weather Plan for England 2012
62
Localities also employed different strategies for identifying people who might be vulnerable to cold weather. Mostly organisations used opportunistic strategies that relied on staff that typically come into contact with members of the public as part of their duties ‘keeping an eye out’ for people who are potentially vulnerable and referring them to relevant services.
In some locations an effort had been made to systematically map where there were residents who were vulnerable to cold weather. In one locality, research found that residents living in housing estates where the accommodation was provided by private landlords were particularly vulnerable. The nature of this vulnerability extended beyond household warmth to include difficulty accessing food and medications. In another location, excess winter deaths were found to be higher in the least deprived areas. Similar experiences have been reported elsewhere (Department of Health 2013). This again suggests that using proxies for vulnerability based on socio-economic deprivation may not be effective for identifying vulnerable people. These findings also suggest that the nature of vulnerability varies between localities and underscores the value of basing interventions on local needs assessments (rather than a standardised approach).
Some studies have suggested that there may be individual ‘cultural’ or behavioural factors that increase an individual’s vulnerability during cold weather, such as a preference for sleeping with the window open in winter and an aversion to wearing hats. These factors were not so much in evidence in this study, with the exception that there was a clear preference for not having the heating on at night. Whilst many participants reported feeling warm in bed at night, some also reported getting up several times during a night which may potentially expose them to cold temperatures. As turning the heating off at night was a personal preference, on the grounds of comfort, simply recommending that people keep their heating on is unlikely to be effective. However, this finding is a further indication that people living in hard to heat homes are likely to be particularly vulnerable during cold weather.
Keatange (1986) has suggested that exposure to external temperatures may be a significant cause of excess winter mortality. Most of the older people that we interviewed relied on public transport. In rural areas, in particular, individuals faced convoluted journeys involving a combination of different buses and walking to access basic amenities such as food shops. Periods spent walking or waiting for buses was thus an important source of exposure to cold temperatures.
A key finding from the interviews with people at risk during cold weather was the way that an individual’s risk (based on age or the presence of pre-existing illness) was mediated by social support. People who had family living nearby received a considerable amount of flexible practical support, such as help with shopping, help with understanding the controls on heating systems, having hot meals prepared, transport and advice about seeking health care.
Social support has an influence on health outcomes across a range of conditions (Berkman and Glass 2000). For example, social support helps people better to manage their chronic health conditions (Gallant 2003) and has been found to be an important determinant of survival after a major health event such as a myocardial infarction (Mookadam and Arthur 2004). A systematic review of the literature evaluating the effectiveness of interventions aimed at providing social support concluded that the most effective interventions are those that involve social activities or group interventions with an educational element, rather than one to one interventions (Cattan et al 2005). It is likely that social activities or group interventions facilitate the formation

Evaluation of the implementation and health-related impacts of the Cold Weather Plan for England 2012
63
of friendships that provide instrumental social support when needed and offer opportunities for reciprocity that are valued by many older people (Lloyd 1991).
Need for better guidance as to who to target and with which interventions
Some managers interviewed as part of this evaluation indicated that they would like more guidance on who they should be targeting and with what intervention. The 2012 CWP listed a number of different categories of people who might be vulnerable to cold weather with the consequence that a large proportion of the population could be considered at risk.
Such a risk factor approach is a blunt instrument for identifying vulnerable people. For example, the CWP categories include ‘pre-existing chronic medical conditions such as heart disease, stroke or transient ischaemic attack (TIA), asthma, chronic obstructive pulmonary disease (COPD) or diabetes.’ Not only does this category relate to a large proportion of the population, but there is nothing to suggest that, in the absence of other conditions (such as a cold home or social isolation) an individual with diabetes is particularly vulnerable during cold weather. This approach provides little in the way of guidance for local agents on where to target resources.
The notion of ‘vulnerable people’ is complicated by the multiple ways that people may be at risk during cold weather. Cold temperature can lead to respiratory infections, stroke, heart attack and hypothermia; internal crowding can spread infectious diseases such as influenza; icy conditions can cause falls; and snow can prevent people accessing food and medication.
There is also little guidance available on the relative effectiveness of different interventions. This information would be valued by local organisations concerned with cost-effectiveness.
In this study, the cost-effectiveness of the interventions provided was at times questionable. For example, many localities were distributing ‘warm packs’ but these will be of little help if the problem is access to food or medicines. It would also be a poor use of resources if they are given to people who do not need them (e.g. because they do not live in a cold home).
Other studies have found some of the initiatives aimed at reducing excess winter mortality do not achieve their intended benefits (Wright 2004, National Audit Office 2003). Offers of free loft insulation, for example, will not suit frail older people unable to clear their loft unless this is included in the service. Research also suggests that sensitive engagement strategies are required so as to effectively recruit participants and not cause offence. It is currently suggested that agencies might ask individuals questions such as ‘can you afford to heat your home’ and ‘can you afford your fuel bills’. However, research has found that both professionals and the public may find these questions embarrassing and intrusive (Todd et al 2012, HPA 2012, Day and Hitchings 2009).
The findings from this evaluation suggest that a local needs assessment is a valuable way of identifying specific local issues and thus better tailoring interventions to the needs of the local population. Managers we spoke to also found the voluntary sector to be a useful source of information on residents who are in need of help and expertise on how best to engage with the target population.

Evaluation of the implementation and health-related impacts of the Cold Weather Plan for England 2012
64
There appears to be a need for a greater awareness of the national guidance on effective interventions that currently exists, for example the guidance provided by the Health Inequalities National Support Team (Department of Health 2010). Localities would also benefit from more opportunities to share case studies of what interventions and approaches have been found to work well. One local manager we spoke to said that what he would find most useful is what he called ‘promising practice’ (what has worked well in a particular context) rather than ‘best practice’. The forthcoming NICE guidance (National Institute for Health and Care Excellence 2013) will also provide guidance on interventions and approaches for the prevention of excess winter deaths and the health risks of cold weather.
The findings from this study suggest that social support mediates an individual’s risk to exposure to cold temperatures. Conversely, this suggests that those who are socially isolated are at particular risk. A study of all older people living in Denmark (Rau 2004) found similar results to Wilkinson et al (2004) with regard to the risk factors for excess winter mortality, namely an increase with age, higher for women, especially for respiratory disease, and a lack of socio-economic gradient. However, they also found that people living alone faced higher excess winter mortality than women and men who shared their household with at least one other person. In the UK, social isolation has been found to predict hospital admission for respiratory disease in winter (Jordon et al 2008). Further research should consider the relationship between social isolation and mortality and morbidity attributable to cold. If this relationship holds, then social isolation could be an effective way to prioritise people who are vulnerable during cold weather. This finding from the present study also underlines the value of initiatives aimed at building community resilience, for example, initiatives that are aimed at building thriving local communities with facilities and social groups that may counter social isolation.
Conclusion
The 2012/1013 Cold Weather Plan was welcomed by health and social care managers who found it helped to make their organisations better prepared for winter. Nonetheless this evaluation points to areas where the plan could be improved.
This study found that the adverse effect of cold temperatures on health can occur at relatively modest temperatures (approximately 6°C). These findings point to the need to clarify the purpose of Cold Weather Alerts. In terms of providing regular reminders of the dangers of cold weather, the alerts play a useful role; but in terms of reducing the total health burden, it is likely that long-term interventions (e.g. improved housing) and the more general preparations taken throughout the winter months are more important than the acute interventions activated by the alerts. For this reason, there should be more emphasis on levels 0 and 1 of the current CWP.
It may be better for local implementation of the CWP to be led by the director of public health, rather than with emergency planning, and the winter welfare of older people needs to be better integrated into primary care. Resources should be targeted at individuals in cold homes who are socially isolated and at interventions aimed at reducing social isolation and building community resilience.
Evaluation of the implementation and health-related impacts of the Cold Weather Plan for England 2012
65
References
Abrahamson V, Raine R. (2009) Health and social care responses to the Department of Health Heatwave Plan. Journal of Public Health 31(4):478-489.
Berkman L, Glass T. (2000) Social integration, social networks, social support and health. In: Berkman L, Kawachi I, eds. Social Epidemiology. New York: Oxford University Press.
Britten N. (1995) Qualitative interviews in medical research. BMJ 311:251-253.
Cattan M, White M, Bond J, Learmouth A. (2005) Preventing social isolation and loneliness among older people: a systematic review of health promotion interventions. Ageing and Society 25(01):41-67.
Department of Communities and Local Government. (2011a) English indices of deprivation 2010. www.gov.uk/government/publications/english-indices-of-deprivation-2010
Department of Communities and Local Government. (2011b) Rough sleeping statistics England – autumn 2011. www.gov.uk/government/publications/rough-sleeping-in-england-autumn-2011
Department of Communities and Local Government. (2011c) English Household Survey 2010/11. www.gov.uk/government/publications/english-housing-survey-household-report-2010-to-2011
Day R, Hitchings R. (2011) ‘Only old ladies would do that’: age stigma and older people’s strategies for dealing with winter cold. Health and Place 17:885-94.
Department of Health. (2012) Cold weather plan for England: protecting health and reducing harm from severe cold.
Department of Health. (2011) Cold weather plan for England: protecting health and reducing harm from severe cold.
Department of Health. (2010) How to reduce the risk of seasonal excess deaths systematically in vulnerable older people to impact at a population level. Health Inequalities National Support Team. http://lpbcc.files.wordpress.com/2012/02/ref-11-seasonal-access-deaths.pdf
Gallant M. (2003) The influence of social support on chronic disease self management: a review and directions for research. Health Education and Behaviour 30(2):170-95.
Gascoigne C, Morgan K, Gross H, et al. (2010) Reducing the health risks of severe winter weather among older people in the United Kingdom: an evidence-based intervention. Ageing and Society 30(2):275-297.
Health Protection Agency. (2013) Common Themes, Different Motivations. www.hpa.org.uk/webc/HPAwebFile/HPAweb_C/1317138072758
Health Protection Agency (2012). Evaluation Report – Cold Weather Plan for England 2011-12.
Jordan R, Hawker J, Ayres J, et al. (2008). Effect of social factors on winter hospital admission for respiratory disease: a case control study of older people. British Journal of General Practice 58:400-2.
Keatinge W. (1986) Seasonal mortality among elderly people with unrestricted home heating. BMJ 293:732-3.

Evaluation of the implementation and health-related impacts of the Cold Weather Plan for England 2012
66
Lloyd P. (1991) The empowerment of elderly people. Journal of Aging Studies 5(2):125-135.
Local Government Association. (2013) Reducing harm from cold weather: local government’s new public health role. www.local.gov.uk/publications/-/journal_content/56/10180/5707983/PUBLICATION
National Audit Office. (2003) Warm Front: helping to combat fuel poverty. www.nao.org.uk/report/warm-front-helping-to-combat-fuel-poverty
National Institute for Health and Care Excellence (2013). Excess winter deaths and morbidity and the health risks associated with cold homes. Public Health Guidance Final Scope. www.nice.org.uk/nicemedia/live/13899/63745/63745.pdf
Office for National Statistics. (2009) Labour Force Survey. www.ons.gov.uk/ons/guide-method/method-quality/specific/labour-market/labour-market-statistics/index.html
Rau R. (2004) Lack of social gradient in winter excess mortality is obvious in Denmark. BMJ 329:976.
Mookadam F, Arthur H. (2004) Social support and its relation to morbidity and mortality after acute myocardial infarction: systematic overview. Archives of Internal Medicine 164(14):1514-18.
Secretary of State for Health. (2012) Caring for our future: reforming care and support. Norwich: The Stationery Office. www.gov.uk/government/uploads/system/uploads/attachment_data/file/136422/White-Paper-Caring-for-our-future-reforming-care-and-support-PDF-1580K.pdf
Sreeharan V, Carmichael C, Murray V. (2012) Evaluation Report: Warm Homes, Healthy People Fund 2011/12. London: Health Protection Agency. www.hpa.org.uk/webc/HPAwebFile/HPAweb_C/1317136356595
Todd AM, Lusambili A, Homer C, et al. (2012) Understanding factors influencing vulnerable older people keeping warm and well in winter: a qualitative study using social marketing techniques. BMJ Open2:e000922.
Watkins S, Byrne D, McDevitt M. (2001) Winter excess morbidity: is it a summer phenomenon? Journal of Public Health Medicine 23:237-241.
Wilkinson P, Pattenden S, Armstrong B, et al. (2004) Vulnerability to winter mortality in elderly people in Britain: population based study. BMJ 329:647.
Wilkinson P, Landen M, Armstrong B. (2001) Cold comfort: the social and environmental determinants of excess winter deaths in England 1986-1996. Joseph Rowntree Foundation.
Wright F. (2006) Old and cold: older people and policies failing to address fuel poverty. Social Policy and Administration 38(5):488-503.

Evaluation of the implementation and health-related impacts of the Cold Weather Plan for England 2012
67
Appendix B1Topic guide for interviews with local authority and health services managers
Evaluation of the implementation and health-related impacts of the national Cold Weather Plan for England
1. What is your role in cold weather planning/response? How long have you been involved with planning for cold weather?
• Probe to find out about the interviewee’s previous experience of cold weather planning or emergency planning.
2. Have you done anything new this year with regard to cold weather planning? If yes, why did you make these changes?
• If there were no changes when preparing 2012-13 plans, enquire about whether there were changes in previous years.
• Probe regarding the extent to which the changes were influenced by the most recent (2012-13) national Cold Weather Plan (or the 2011-12 national CWP, if there were no changes this year, but there were changes last year).
3. How similar is your local cold weather plan to the national Cold Weather Plan?
• If there is no local cold weather plan, enquire about why there is no formal plan in their area, and why they have not decided to adopt the national Cold Weather Plan. Then go to question 8 or 9.
4. Do you make use of the action cards from the national Cold Weather Plan? If so, how?
5. Are there any parts of local plans that are not found in the national Cold Weather Plan?
6. Are there any parts of the national Cold Weather Plan that have not been incorporated into local plans?
7. The first national Cold Weather Plan was issued in the 2011-12 winter. How much did that affect your local plans? What did your local authority/organisation do before there was a national Cold Weather Plan?
• Can prompt on whether the introduction of the national Cold Weather Plan led to a more coordinated approach between organisations responding to cold weather.
8. More broadly, what impact did the publication of the national Cold Weather Plan have in your local area?
• Can prompt on whether the national Cold Weather Plan led to any increase in funding for planning for cold weather, raised the profile of cold weather planning, etc.
• Can prompt on whether the interviewee thinks that the national Cold Weather Plan has added value, and, if so, in which respects?
• Probe for views on whether cold weather planning risked displacing more valuable activities at local level. Are there more important things that they wanted to do but they felt they had to be seen to be doing something in relation to the national Cold Weather Plan.
9. What do you think is the most important issue to address when it comes to cold weather planning? To what extent do you feel this is reflected in the national Cold Weather Plan?

Evaluation of the implementation and health-related impacts of the Cold Weather Plan for England 2012
68
10. What do you see as your most effective intervention?
11. What problems are predicted with implementing the actions set out in your local cold weather plans?
• Prompt on whether there were issues with identifying people at-risk of the health related effects of cold weather, or prioritising the people to contact during cold weather alerts.
12. How do you identify people at-risk of the health effects of cold weather?
• Probe on whether there are any provisions for people who are not in contact with health/social services.
13. How well do local organisations work together on cold weather plans and actions?
• Probe on how involved GP practices have been.
14. In the event of a cold weather alert being received, what is the local procedure across the local authority and local NHS? What advice and instructions, prompted by cold weather alerts, do front line staff receive?
• Probe to find out what the specific response was to a recent level 2 alert.
15. What key normal activities does implementing the Cold Weather Plan displace during cold weather alerts?
16. With regard to the cold weather alert system, how do you interpret the %Risk values in the forecast e.g. is decision making different if the risk of cold weather is 50% compared to 60%?
17. Do you think there are opportunity costs associated with actions taken on false positive alerts?
18. With regard to the cold weather alert system, are all three periods of forecast (i.e. Day 1 to 5, Day 6 to 15 and Day 16 to 30) taken into account in decision-making? What confidence do you have in the Day 6 to 15 and Day 16 to 30 forecasts?
19. Have you costed the implementation of your local cold weather plan activities? Would it be possible for you to send a local estimate of the total and/or additional cost incurred in implementing the Cold Weather Plan?
• Interviewees do not have to provide detailed information on costs during the telephone interview. It would be helpful if they could send whatever costing information they can provide after the interview.
• The focus for cost information will be on staff time. Therefore if they could just send information on staff time required for implementing the Cold Weather Plan it would be useful.
20. Is the balance between preventive work (e.g. home insulation) and cold weather response about right in the national Cold Weather Plan, or should it be shifted?
21. How was the balance between preventive work and cold weather response struck in local plans?
• Probe regarding the extent to which local plans focus on, or emphasise, preparedness for extreme cold weather events.
Evaluation of the implementation and health-related impacts of the Cold Weather Plan for England 2012
69
22. How does your organisation raise awareness among staff regarding the health-related effects of cold weather on people at-risk? Does your organisation attempt to contribute to the public’s awareness of the impact of cold weather on health?
• Probe to ascertain to what extent ‘awareness activities’ are motivated by the national Cold Weather Plan or predated the Plan.
23. Which organisations are responsible for leadership on cold weather planning and response across the local system? Do any organisations have a target for reductions in excess winter deaths?
• Probe to find out who they consider ultimately accountable with regard to reducing excess winter deaths.
24. What roles did new bodies such as the Local Health Resilience Partnership and shadow Health & Wellbeing Board play and to what effect? (E.g. did HWB co-ordinate health improvement activities, such as assessing local population needs & planning for extreme cold.) Is the HWB ultimately accountable for local action and its impact?
25. How did the 2012-13 Cold Weather Plan assist in defining the roles of new bodies such as the Local Health Resilience Partnership and (shadow) Health and Wellbeing Board?
26. What activities are expected of clinical commissioning groups in relation to cold weather planning?
27. Would you be happy to send us a copy of your local cold weather plan/policy?
• Probe on whether there are any other related or relevant local documents or policies, which could also be requested.
28. Enquire about other people we should be talking to for our study, for example at the council, PCT/CCG, local hospitals, shadow Health & Wellbeing Board, Local Health Resilience Partnership.

Evaluation of the implementation and health-related impacts of the Cold Weather Plan for England 2012
70
Section C Cost-effectiveness analysis of the Cold Weather Plan for England Lead author: Zaid Chalabi
Introduction
Preparedness for winter continues to be important despite the general trends towards climatic warming because recent analyses have shown that extreme cold conditions will persist in the 21st century (Guirguis et al 2011, Kodra et al 2011). Past episodes of extreme cold winters in England, and the well-documented severe disruptions that these conditions had caused, include the winters of: 1946-1947 (Booth 2007), 1962-1963 (Hirschi and Sinha 2007, Dent 2013), 2009-2010 (Prior and Kendon 2011a) and 2010-2011 (Prior and Kendon 2011b). Extreme cold events like those that England experienced in 2010-2011 can still occur with the changing climate (Peterson et al 2012) and can even extend to spring. May 2013 was the coldest such month since 1996 and only 12 Mays in the last 100 years were colder (Eden 2013). Although most of the health burden of cold weather in England does not occur on extreme cold days (see Section A), because there are relatively few of such days, extreme cold conditions incur other impacts, such as disruption of travel and public services, including health care services.
There is a need to develop public health policies to reduce the avoidable winter cold-related morbidity and mortality (Conlon et al 2011). The Cold Weather Plan (CWP) for England was developed as one such policy and has been operational since 2011. Its aim is to “... prepare for, alert people to, and prevent the major avoidable effects in health during periods of severe cold in England” (Department of Health 2012). The CWP combines (i) the Cold Weather Alert (CWA) service run by the Met Office each winter between 1st November and 31st March, and (ii) guidance to the NHS (community, primary and secondary health care), local authorities (social care) and other public bodies and voluntary organizations, on what actions to take in response to alert levels issued by the CWA service. The actions proposed in the CWP are set out in very general terms to allow local authorities and the NHS to tailor their plans to suit their own needs and fit within their own resources.
The CWA service issues five alert levels: “Level 0” (long-term preparedness), “Level 1” (winter preparedness), “Level 2” (alert and readiness), “Level 3” (severe weather action) and “Level 4” (national emergency). Level 0 is triggered all year and reminds authorities of the need for long-term planning for the coming winter and entails actions that should be phased throughout the year. Level 1 is triggered on 1st November and prompts authorities to put in place general preparedness actions during the period from 1st November to 31st March. Level 2 is triggered whenever a mean temperature of 2°C and/or widespread ice and heavy snow are forecast within 48 hours with 60% confidence. Level 3 is triggered when the conditions described in Level 2 actually occur. Finally, Level 4 is declared by the Government when the weather conditions are very severe and/or prolonged.
The aim of Section C is to evaluate the effectiveness and cost-effectiveness of the CWP. However, because the CWP has only been operating for two winters, there is lack of epidemiological evidence on its health benefits and of information on its costs. The effectiveness and cost-effectiveness analyses carried out in this report are therefore exploratory. This initial analysis focuses on investigating scenarios for which the CWP is (or can be made to be) effective and cost-effective.

Evaluation of the implementation and health-related impacts of the Cold Weather Plan for England 2012
71
Effectiveness and cost-effectiveness of health forecasting services in England
One of the earliest applications of the Met Office health forecasting alert services was targeted towards patients with chronic obstructive pulmonary disease (COPD). There have been several evaluations of this service showing mixed results on its effectiveness in reducing COPD mortality, exacerbations and hospital admissions (Steventon et al 2014, Marno et al 2010, Maheswaran et al 2010, Bakerly et al 2011). Although the service was not associated with reductions in COPD admission rates (Maheswaran et al 2010, Bakerly et al 2011), it was associated with lower mortality rates (Steventon et al 2014). The Met Office has recently withdrawn this service citing reasons to do with its commercial viability in light of the restructuring of the NHS commissioning process (Met Office 2013). Determining the effectiveness of health forecasting alert services is important if they are to be routinely used to support the NHS and local authorities in their preparedness for weather conditions. It is also important to determine their cost-effectiveness given current resource and budgetary constraints. There have been very few economic evaluations of health forecasting services. Ebi et al (2004) estimated the benefits and costs of the heat warning system for Philadelphia and concluded that its health benefits in terms of lives saved far outweighed its operational costs. In England, Sampson et al (2003) carried out an exploratory analysis of the likely costs and benefits of health forecasting services. One of their key findings was that health care services need to engage with a forecasting service to realise the full potential of the forecasting service. They identified the main value of forecasting services is to help health services plan ahead for their workload in ways that can take account of weather conditions. For example, recent research has provided some evidence on the impact of extreme weather on the performance of ambulance services (Thornes et al 2013). The authors showed that, during three successive days of cold conditions in December 2010, the response rate of the ambulance service in Birmingham dropped 50% below its normal rate. An alert service could help the ambulance service plan its operations ahead of very cold weather, e.g. in terms of positioning its fleet at appropriate locations to minimise response times. In the absence of evidence on the health benefits and costs of the CWP, we use mathematical modelling to examine its potential effectiveness and cost-effectiveness. Before outlining the modelling framework, we discuss some issues pertaining to the evaluation of the CWP. Figure C1 shows a schematic of the CWP from the perspective of health and social services.
Figure C1 Schematic of the operational elements of the CWP
Weather forecast
Generate alerts
Met Office
Trigger action plans
Develop action plans
Implement actions by social care
Implement actions by primary health care
Implement actions by hospitals
Implement actions by community care
NHS and Local Authority
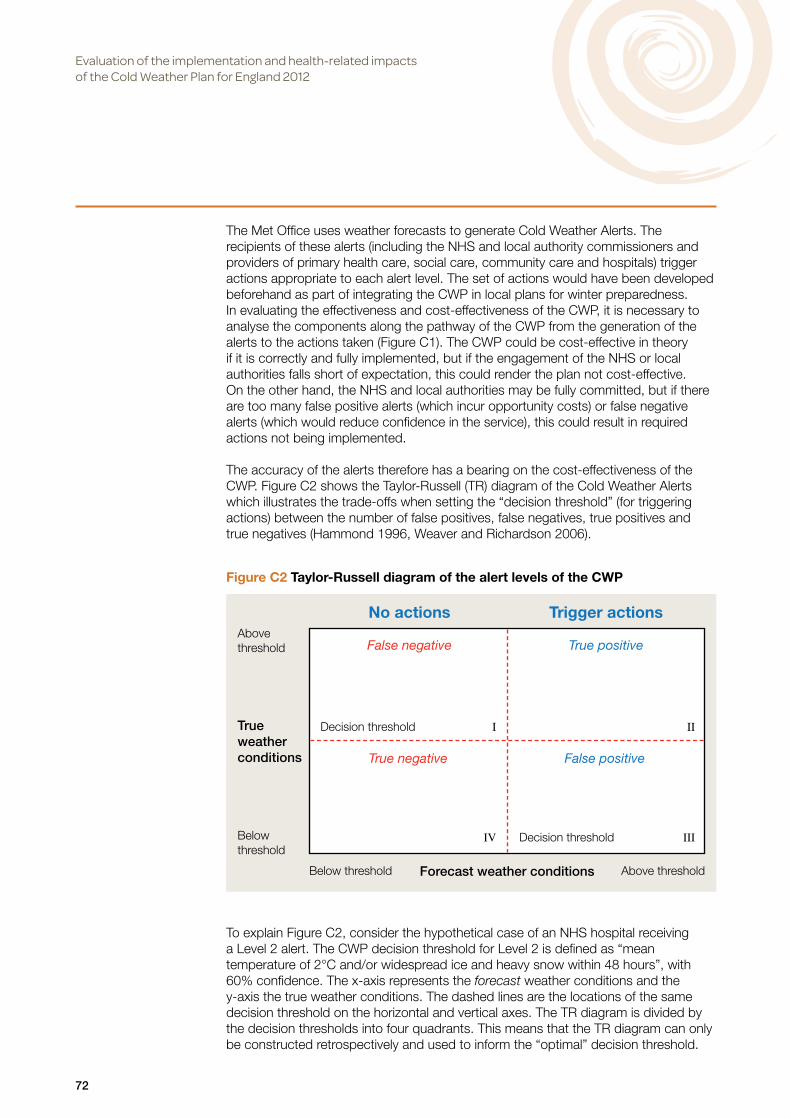
Evaluation of the implementation and health-related impacts of the Cold Weather Plan for England 2012
72
The Met Office uses weather forecasts to generate Cold Weather Alerts. The recipients of these alerts (including the NHS and local authority commissioners and providers of primary health care, social care, community care and hospitals) trigger actions appropriate to each alert level. The set of actions would have been developed beforehand as part of integrating the CWP in local plans for winter preparedness. In evaluating the effectiveness and cost-effectiveness of the CWP, it is necessary to analyse the components along the pathway of the CWP from the generation of the alerts to the actions taken (Figure C1). The CWP could be cost-effective in theory if it is correctly and fully implemented, but if the engagement of the NHS or local authorities falls short of expectation, this could render the plan not cost-effective. On the other hand, the NHS and local authorities may be fully committed, but if there are too many false positive alerts (which incur opportunity costs) or false negative alerts (which would reduce confidence in the service), this could result in required actions not being implemented.
The accuracy of the alerts therefore has a bearing on the cost-effectiveness of the CWP. Figure C2 shows the Taylor-Russell (TR) diagram of the Cold Weather Alerts which illustrates the trade-offs when setting the “decision threshold” (for triggering actions) between the number of false positives, false negatives, true positives and true negatives (Hammond 1996, Weaver and Richardson 2006).
To explain Figure C2, consider the hypothetical case of an NHS hospital receiving a Level 2 alert. The CWP decision threshold for Level 2 is defined as “mean temperature of 2°C and/or widespread ice and heavy snow within 48 hours”, with 60% confidence. The x-axis represents the forecast weather conditions and the y-axis the true weather conditions. The dashed lines are the locations of the same decision threshold on the horizontal and vertical axes. The TR diagram is divided by the decision thresholds into four quadrants. This means that the TR diagram can only be constructed retrospectively and used to inform the “optimal” decision threshold.
Figure C2 Taylor-Russell diagram of the alert levels of the CWP
No actions Trigger actions
False negative True positive
True negative False positive
True weather conditions
Above threshold
Belowthreshold
Below threshold Above thresholdForecast weather conditions
Decision threshold I II
IV Decision threshold III

Evaluation of the implementation and health-related impacts of the Cold Weather Plan for England 2012
73
The decision threshold divides each axis into two regions, “Above threshold” and “Below threshold”. In the context of this diagram, “Above threshold” refers to situations when weather conditions are more severe than those at the threshold, and “Below threshold” are situations when weather conditions are milder than those at the threshold. Actions are only triggered if the forecast conditions are at or above the decision threshold. Starting with quadrant I of Figure C2 and moving clockwise, this quadrant marks false negative scenarios when the forecast indicates weather conditions below threshold whereas the true weather conditions are at or above the threshold. Quadrant II marks true positive scenarios when both the forecast and the true conditions are at or above the threshold. Quadrant III marks false positive scenarios and refers to situations when the forecast is for conditions at or above the threshold but the true conditions are below threshold. Finally, quadrant IV marks true negative scenarios when both the forecast and the true conditions are below threshold.
False positives and false negatives can both have economic consequences for a hospital or other health service provider. For example, if the hospital’s plan included reducing elective surgery and outpatient activity in response to an alert (in order to meet the expected additional demand on its resources), in situations of either false negatives or false positives the hospital may not be able subsequently to meet its performance targets (e.g. patients not being operated on and thus remaining in a poor health state and possibly in a poorer health outcome). Also, if the hospital plans involve, e.g. moving staff from non-clinical activities to clinical activities in anticipation of the additional workload or transferring patients from the hospital to other locations (e.g. care homes), taking these unnecessary actions during a false positive alert could have economic consequences locally as well as for the wider health care system. As evidence is acquired on the performance of Level 2 alerts, the threshold can be fine-tuned to improve decision-making. However, as noted by Hammond (1996), there is “irreducible uncertainty and inevitable error” in the setting of any decision threshold for triggering actions because it will always entail trade-offs between false positives, false negatives, true positives and true negatives. The effectiveness and cost-effectiveness of the CWP also depends on the perception of the confidence level in the forecasts by those who develop and implement the actions (such as bed managers in a hospital). These decision-makers are likely to have different reactions to the level of confidence attached to Level 2 alerts (e.g. 60%), particularly if false positives imply significant opportunity costs (e.g. resulting in unnecessary cancellation of elective surgery or unnecessary deployment of additional staff). “Risk averse” and “risk taking” decision-makers would be expected to plan different courses of action in response to alerts qualified by varying levels of uncertainty. This expected divergence of views is reflected in surveys which show variations among the public in their interpretation of levels of uncertainty in weather forecasts and the confidence they then have in the forecasts (O’Hanrahan and Sweeney 2013).
In relation to the actions that should be carried out by public bodies, the guidance in the CWP is very general, and the effectiveness and cost-effectiveness of the CWP is thus likely to depend on (i) the local interpretation of the plan, and (ii) the actions that were implemented locally before the CWP was introduced. For example, two of the recommended actions in response to a Level 2 alert are:
• “Implement local actions for the vulnerable. Consider how to maintain regular contact as required”.
• “Ensure staff undertake appropriate home checks when visiting clients, e.g. room temperature, medications and food supplies”.

Evaluation of the implementation and health-related impacts of the Cold Weather Plan for England 2012
74
Figure C3 The modelling framework for cost-effectiveness analysisThe three components of the framework are represented by the dashed large rectangles
In evaluating the CWP (“new intervention”), it is necessary to know what was done prior to introducing the CWP. Depending on the extent and nature of winter preparedness plans pre-CWP, and assuming that the actions lead to benefits, the above two actions post-CWP could either mean (i) consolidation of actions which may incur relatively small additional health benefits and/or costs, or (ii) extension of the actions or introducing new actions which could result in large additional health benefits and/or costs, or (iii) no change in actions at all.
Methods
Modelling framework to calculate health benefits and costs
Figure C3 shows the mathematical modelling framework which is used to calculate the health benefits and the direct costs of the CWP. The framework can be divided into three main components (represented by the dashed large rectangles). The first component (block A in Figure C3) calculates the cold attributable disease burden pre-CWP. In this analysis, the cold-attributed disease burden is defined in terms of the numbers of premature deaths and emergency hospital admissions. The calculation of the daily cold attributable disease burden is a function of the temperature-dependent fractional excess risk and the daily baseline health burden. This burden would represent the pre-CWP scenario because the exposure-response relationships used in the health impact calculations are based on epidemiological analysis of historical data prior to the introduction of the CWP (Section A of this report).
Daily fractional excess risk
Daily cold attributable health burden (deaths & hospital admissions)
Daily temperature
Daily baseline disease burden (deaths & hospital admissions)
Effectiveness of CWP if fully implemented (𝛿)
Effectiveness of implemented CWP (𝛿×𝜁)
Average degree of implementation of CWP (𝜁)
A
B
Cost saving associated with reduction in hospital admissions
Additional contacts with primary and social care
Health benefits due to reduction in deaths & hospital admissions and increase in contacts with primary and social care
Additional cost of implementing CWP
C

Evaluation of the implementation and health-related impacts of the Cold Weather Plan for England 2012
75
The second component is represented by block B in the figure. It is necessary to differentiate between full or partial implementation of the CWP, given that no plan is ever completely implemented as intended. Two unknown parameters are introduced to determine the effectiveness of the implemented CWP. The first parameter is the upper bound of the proportion of avoidable premature deaths and hospital admissions that would be averted if the CWP were fully implemented (𝛿). The second parameter is the average degree of implementation of the CWP(𝜁). The effectiveness of the implemented CWP is therefore the product of these two parameters (𝛿 × 𝜁) which gives the proportion of burden averted.
The third component of the framework is represented by block C in the figure. The numbers of premature deaths and hospital admissions averted are the product of the health burden pre-CWP and the effectiveness of the CWP(𝛿 × 𝜁). The number of premature deaths and hospital admissions averted are combined to measure the health benefits in Quality Adjusted Life Years (QALYs). There is also a health benefit associated with increased contact with primary and social care services as a result of implementing the CWP (also measured in QALYs).
The cost of the additional contacts with primary and social care services depends on the degree of implementation of the CWP and the number and nature of contacts pre-CWP. The cost savings are estimated directly from the number of reduced hospital admissions associated with successful implementation of the CWP.
Cost-effectiveness analysis
Cost-effectiveness analysis is concerned with analysing the incremental costs and incremental benefits of a “new intervention” compared with “current practice”. In this analysis, the “new intervention” is the CWP and “current practice” is the set of actions taken by the NHS and Local Authorities (LAs) prior to the introduction of the CWP.
There are three inputs to the cost-effectiveness analysis of the CWP: (i) the effectiveness (health benefits) of the CWP, (ii) its direct costs, and (iii) the willingness-to-pay per unit health benefit. The health benefits of the CWP are defined in terms of QALYs. The main costs are divided into three components: (i) the cost of additional contacts with primary and social care (community contacts), which could be either contacting more individuals or changing the type of contact with the same individuals (e.g. longer visits), (ii) the cost saving associated with reduction in hospital admissions, and (iii) the cost of the CWA service provided by the Met Office. (The latter cost was not included because it is commercial in confidence.)
Willingness-to-pay is the amount a policy-maker is willing to pay per unit health gain. Figure C4 shows the cost-effectiveness plane of the CWP in relation to the situation pre-CWP. The CWP is deemed to be cost-effective when the total incremental costs ∆𝐶 and the total health benefits ∆𝐵 are such that where 𝜆 where 𝜆 is the willingness to pay per unit health gain. is the incremental cost-effectiveness ratio. In Figure C4, 𝜆 is the slope of the straight-line ∆𝐶 = 𝜆 × ∆𝐵 .
This straight line divides the four quadrants (North West, North East, South East and South West) of the cost-effectiveness plane into six regions (R1 through R6). Each of the quadrants and regions has its own interpretation in terms of cost-effectiveness (Dowie 2004). We are primarily interested in the North East quadrant which incorporates regions R1 and R2. Conditional on the value of the willingness to pay, R1 defines the region for which the CWP is both effective and cost-effective whereas R2
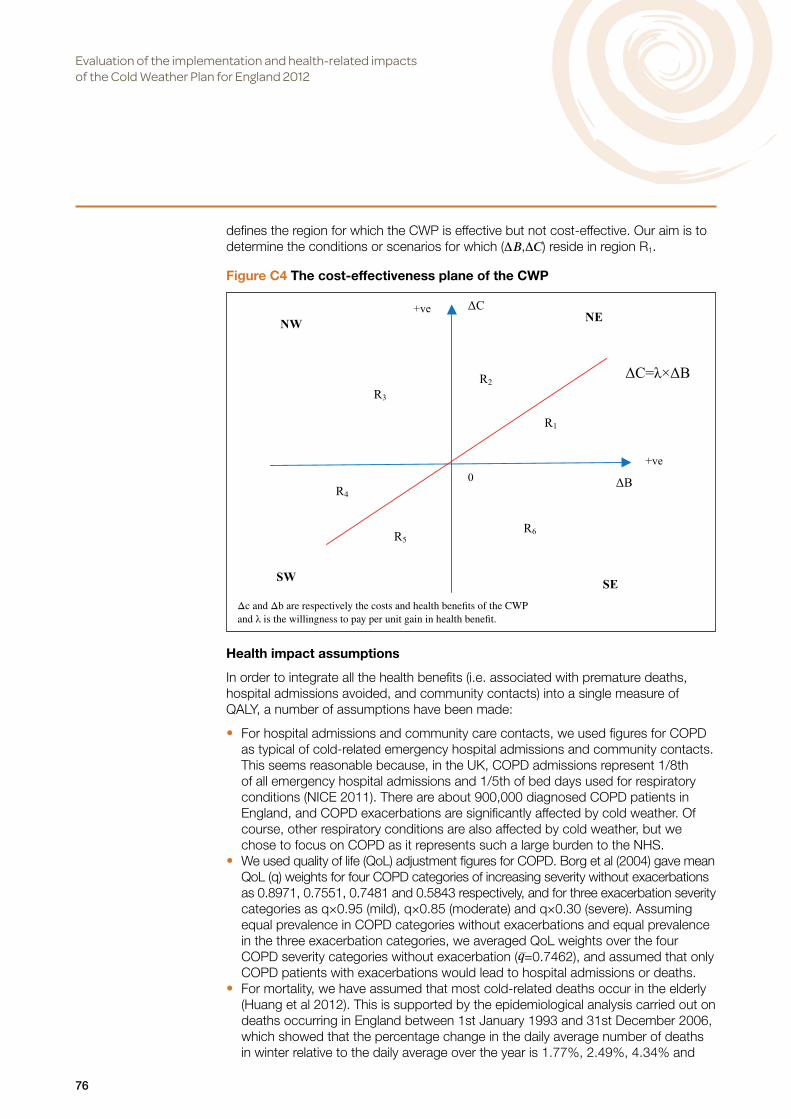
Evaluation of the implementation and health-related impacts of the Cold Weather Plan for England 2012
76
Figure C4 The cost-effectiveness plane of the CWP
Δc and Δb are respectively the costs and health benefits of the CWP and λ is the willingness to pay per unit gain in health benefit.
defines the region for which the CWP is effective but not cost-effective. Our aim is to determine the conditions or scenarios for which (∆𝐵 ,∆𝐶 ) reside in region R1.
Health impact assumptions
In order to integrate all the health benefits (i.e. associated with premature deaths, hospital admissions avoided, and community contacts) into a single measure of QALY, a number of assumptions have been made:
• For hospital admissions and community care contacts, we used figures for COPD as typical of cold-related emergency hospital admissions and community contacts. This seems reasonable because, in the UK, COPD admissions represent 1/8th of all emergency hospital admissions and 1/5th of bed days used for respiratory conditions (NICE 2011). There are about 900,000 diagnosed COPD patients in England, and COPD exacerbations are significantly affected by cold weather. Of course, other respiratory conditions are also affected by cold weather, but we chose to focus on COPD as it represents such a large burden to the NHS.
• We used quality of life (QoL) adjustment figures for COPD. Borg et al (2004) gave mean QoL (q) weights for four COPD categories of increasing severity without exacerbations as 0.8971, 0.7551, 0.7481 and 0.5843 respectively, and for three exacerbation severity categories as q×0.95 (mild), q×0.85 (moderate) and q×0.30 (severe). Assuming equal prevalence in COPD categories without exacerbations and equal prevalence in the three exacerbation categories, we averaged QoL weights over the four COPD severity categories without exacerbation (𝑞=0.7462), and assumed that only COPD patients with exacerbations would lead to hospital admissions or deaths.
• For mortality, we have assumed that most cold-related deaths occur in the elderly (Huang et al 2012). This is supported by the epidemiological analysis carried out on deaths occurring in England between 1st January 1993 and 31st December 2006, which showed that the percentage change in the daily average number of deaths in winter relative to the daily average over the year is 1.77%, 2.49%, 4.34% and
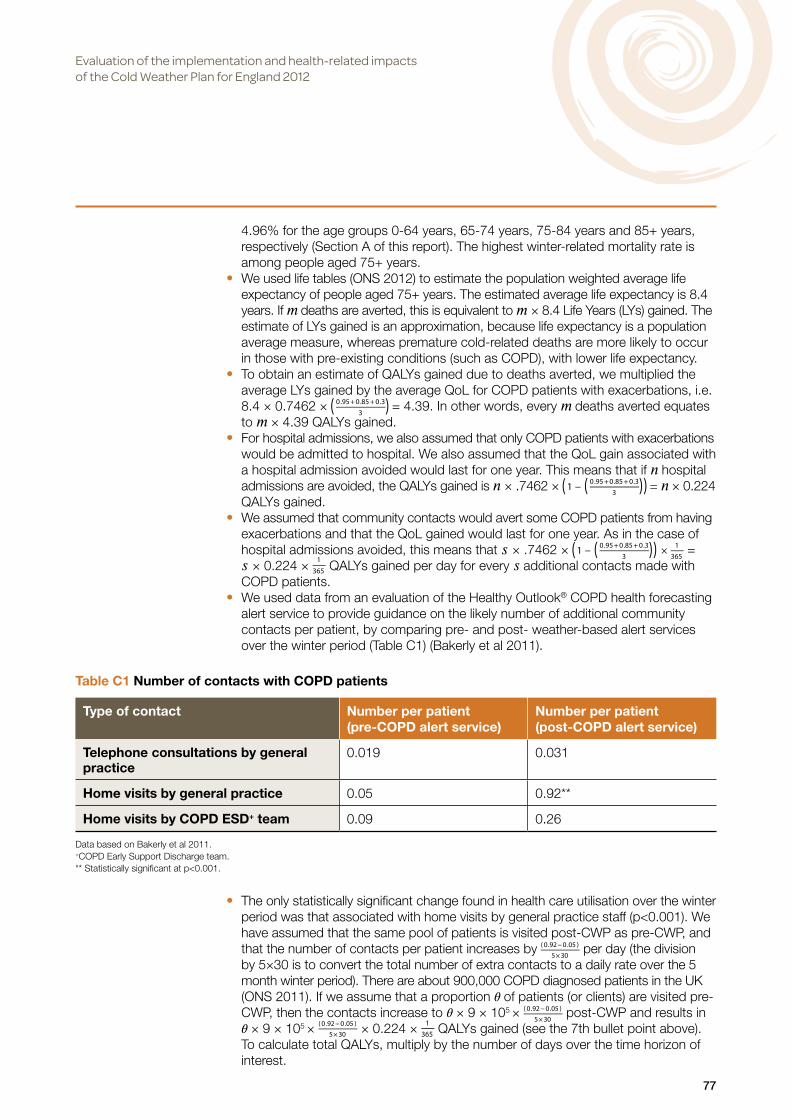
Evaluation of the implementation and health-related impacts of the Cold Weather Plan for England 2012
77
4.96% for the age groups 0-64 years, 65-74 years, 75-84 years and 85+ years, respectively (Section A of this report). The highest winter-related mortality rate is among people aged 75+ years.
• We used life tables (ONS 2012) to estimate the population weighted average life expectancy of people aged 75+ years. The estimated average life expectancy is 8.4 years. If 𝑚 deaths are averted, this is equivalent to 𝑚 × 8.4 Life Years (LYs) gained. The estimate of LYs gained is an approximation, because life expectancy is a population average measure, whereas premature cold-related deaths are more likely to occur in those with pre-existing conditions (such as COPD), with lower life expectancy.
• To obtain an estimate of QALYs gained due to deaths averted, we multiplied the average LYs gained by the average QoL for COPD patients with exacerbations, i.e. 8.4 × 0.7462 × = 4.39. In other words, every 𝑚 deaths averted equates to 𝑚 × 4.39 QALYs gained.
• For hospital admissions, we also assumed that only COPD patients with exacerbations would be admitted to hospital. We also assumed that the QoL gain associated with a hospital admission avoided would last for one year. This means that if 𝑛 hospital admissions are avoided, the QALYs gained is 𝑛 × .7462 × = 𝑛 × 0.224 QALYs gained.
• We assumed that community contacts would avert some COPD patients from having exacerbations and that the QoL gained would last for one year. As in the case of hospital admissions avoided, this means that 𝑠 × .7462 × = 𝑠 × 0.224 × QALYs gained per day for every 𝑠 additional contacts made with COPD patients.
• We used data from an evaluation of the Healthy Outlook® COPD health forecasting alert service to provide guidance on the likely number of additional community contacts per patient, by comparing pre- and post- weather-based alert services over the winter period (Table C1) (Bakerly et al 2011).
• The only statistically significant change found in health care utilisation over the winter period was that associated with home visits by general practice staff (p<0.001). We have assumed that the same pool of patients is visited post-CWP as pre-CWP, and that the number of contacts per patient increases by per day (the division by 5×30 is to convert the total number of extra contacts to a daily rate over the 5 month winter period). There are about 900,000 COPD diagnosed patients in the UK (ONS 2011). If we assume that a proportion 𝜃 of patients (or clients) are visited pre-CWP, then the contacts increase to 𝜃 × 9 × 10⁵ × post-CWP and results in 𝜃 × 9 × 10⁵ × × 0.224 × QALYs gained (see the 7th bullet point above). To calculate total QALYs, multiply by the number of days over the time horizon of interest.
Table C1 Number of contacts with COPD patients
Type of contact Number per patient (pre-COPD alert service)
Number per patient (post-COPD alert service)
Telephone consultations by general practice
0.019 0.031
Home visits by general practice 0.05 0.92**
Home visits by COPD ESD+ team 0.09 0.26
Data based on Bakerly et al 2011. +COPD Early Support Discharge team. ** Statistically significant at p<0.001.
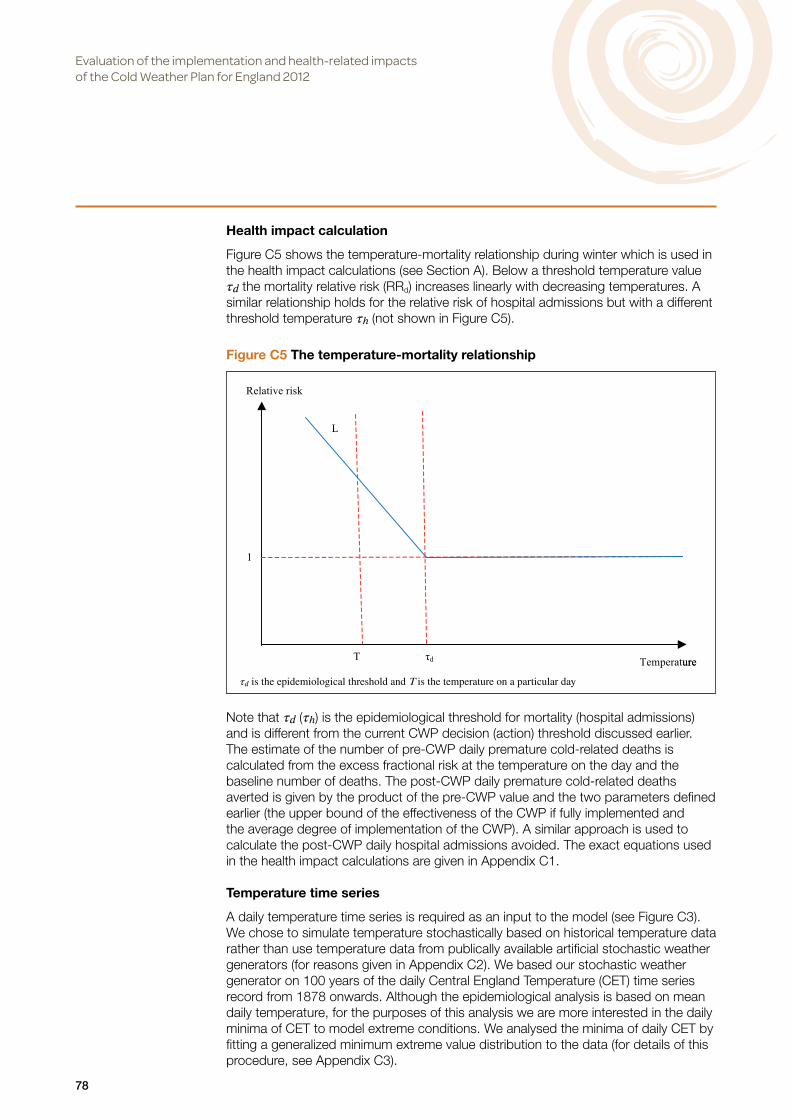
Evaluation of the implementation and health-related impacts of the Cold Weather Plan for England 2012
78
Health impact calculation
Figure C5 shows the temperature-mortality relationship during winter which is used in the health impact calculations (see Section A). Below a threshold temperature value 𝜏𝑑 the mortality relative risk (RRd) increases linearly with decreasing temperatures. A similar relationship holds for the relative risk of hospital admissions but with a different threshold temperature 𝜏ℎ (not shown in Figure C5).
Note that 𝜏𝑑 (𝜏ℎ) is the epidemiological threshold for mortality (hospital admissions) and is different from the current CWP decision (action) threshold discussed earlier. The estimate of the number of pre-CWP daily premature cold-related deaths is calculated from the excess fractional risk at the temperature on the day and the baseline number of deaths. The post-CWP daily premature cold-related deaths averted is given by the product of the pre-CWP value and the two parameters defined earlier (the upper bound of the effectiveness of the CWP if fully implemented and the average degree of implementation of the CWP). A similar approach is used to calculate the post-CWP daily hospital admissions avoided. The exact equations used in the health impact calculations are given in Appendix C1.
Temperature time series
A daily temperature time series is required as an input to the model (see Figure C3). We chose to simulate temperature stochastically based on historical temperature data rather than use temperature data from publically available artificial stochastic weather generators (for reasons given in Appendix C2). We based our stochastic weather generator on 100 years of the daily Central England Temperature (CET) time series record from 1878 onwards. Although the epidemiological analysis is based on mean daily temperature, for the purposes of this analysis we are more interested in the daily minima of CET to model extreme conditions. We analysed the minima of daily CET by fitting a generalized minimum extreme value distribution to the data (for details of this procedure, see Appendix C3).
Figure C5 The temperature-mortality relationship
𝜏𝑑 is the epidemiological threshold and T is the temperature on a particular day

Evaluation of the implementation and health-related impacts of the Cold Weather Plan for England 2012
79
Costs
Relevant primary, social and community care costs, and hospital admission costs for 2012 were taken from PPSRU (2012). Table C1 lists professional staff likely to contact patients/clients in the community (according to the CWP) and their corresponding costs (which depend on the nature of the contact).
In the absence of evidence on the nature of contacts with patients/clients in the community, we have assumed that each additional contact will incur a cost drawn randomly from a log-normal distribution informed by Table C2 with mean £51, median £49 and 10th-90th percentile range £36-£68.
The same approach is used for estimating the unit cost of a hospital admission; Table C3 shows the cost of different broad types of hospital admission and visits to A&E (PPSRU 2012).
Again, in the absence of any ‘hard data’, we have assumed that each hospital admission avoided would save a cost drawn from a log-normal distribution informed by Table C3, with mean £556, median £403, and 10th-90th percentile range £145-£1125.
Table C2 Unit costs for professional staff who make contact with patients/clients in the community
Profession Cost of contact (£) per patient/client per hour* Community nurse 42 to 61Nurse (mental health) 35 to 67Health visitor 43 to 63Nurse specialist (community) 43Nurse GP practice 35 to 45Social worker** 39 to 54Social worker assistant 28GP consultation*** 43 to 110
*The range depends on the nature of the contact. **The upper range of the unit cost for social worker (£156 per hour) has been excluded.*** The GP consultation cost is per session (and also depends on the nature of the contact).
Table C2 Unit costs for professional staff who make contact with patients/clients in the community
Type of admission National average (£)
Lower quartile (£)
Upper quartile (£)
Non-elective inpatient long stays 2,461 1,771 2,865Non-elective inpatient short stays 586 386 688A&E treatments leading to admissions 146 114 171A&E treatments leading to no admissions 112 93 130

Evaluation of the implementation and health-related impacts of the Cold Weather Plan for England 2012
80
Overall simulation model
The overall simulation model is summarised by the steps below:
Results
Baseline estimates for key parameters
The model was simulated in Mathematica (Wolfram 2013). As the simulation model has many parameters, it is not possible to simulate all the possible permutations. Table C4 shows the baseline values of the key parameters used in the simulations. The values of the selected key parameters are then varied in a sensitivity analysis.
1. Initialise the key parameters of the CWP. These are: 1.1. the upper bound of the effectiveness of the CWP (if fully implemented).1.2. the average degree of implementation of the CWP.1.3. the size of the vulnerable population (patients/clients) which can be contacted in the community. 1.4. the proportion of the vulnerable population contacted pre-CWP.1.5. time horizon for analysis.
2. Fit a generalized extreme value (GEV) distribution to the daily minimum CET time series over 100 years. 3. For each day:
3.1. Draw randomly a minimum temperature from the GEV distribution.3.2. Calculate the incremental number of deaths and hospital admissions.3.3. Calculate the daily additional number of contacts with patients/clients in the community.3.4. Draw randomly the unit cost of contact and multiply it by the number of contacts to calculate the
daily cost of community contact with patients/clients.3.5. Draw randomly the unit hospital admission cost and multiply it by the number of hospital
admissions to calculate the daily hospital admissions savings.4. Convert each of the health gains to QALYS and sum them over the time horizon.5. Sum the daily cost of community contacts over the time horizon.6. Sum the daily savings associated with hospital admissions avoided.7. Subtract the savings from the contact cost to calculate the overall cost.8. Calculate the cost-effectiveness ratio.
Table C4 Baseline values used in the model simulation
Parameter ValueCWP parametersEffectiveness of CWP if fully implemented (between 0 and 1 where 0 is not effective and 1 is fully effective)
0.15 (15%)
Degree of implementation of CWP (between 0 and 1 where 0 is not implemented and 1 is fully implemented)
0.5 (50%)
Vulnerable patients/clients (based on number of COPD patients in the UK) 900,000Proportion of vulnerable population visited pre-CWP 0.3 (30%)Time horizon of analysis 10 yearsEpidemiological parametersThreshold temperature for mortality 5°CPercent change in mortality risk per 1oC decrease in temperature below threshold 3.84%Threshold temperature for COPD hospital admissions 8°CPercent change in risk of COPD hospital admissions per 1°C decrease in temperature below threshold 8.4%National average number of daily deaths during winter 1,495National average number of COPD hospital admissions during winter 308

Evaluation of the implementation and health-related impacts of the Cold Weather Plan for England 2012
81
The epidemiological threshold temperatures for mortality and morbidity given in Table C4 were calculated on a country-wide basis using time-series regression analysis (see Section A).
The results of the simulation can be divided into three sets. The first set comprises the modelled inputs which drive the simulation model. These are the stochastically simulated daily temperature time series, and the unit costs and contacts of hospital and community services. The second set gives the simulated outputs. These are the health gains, costs and savings. The third set gives the results of the cost-effectiveness analysis presented as cost-effectiveness ratios.
Stochastic daily temperature time series
We fitted a minimum stable distribution to about 100 years of daily minimum CET time series. Figure C6 shows the estimated probability density function (PDF) fitted by maximum likelihood estimating alongside the empirical histogram. The PDF at a particular value gives the relative likelihood that the minimum temperature takes that value and the total area underneath the PDF is unity.
Figure C7 gives the estimated cumulative distribution function (CDF) of the daily minimum temperature. The CDF at a particular value gives the probability that the minimum temperature is less than or equal to that value.
Figure C6 Fitted Generalized Extreme Value (GEV) distribution and the empirical histogram
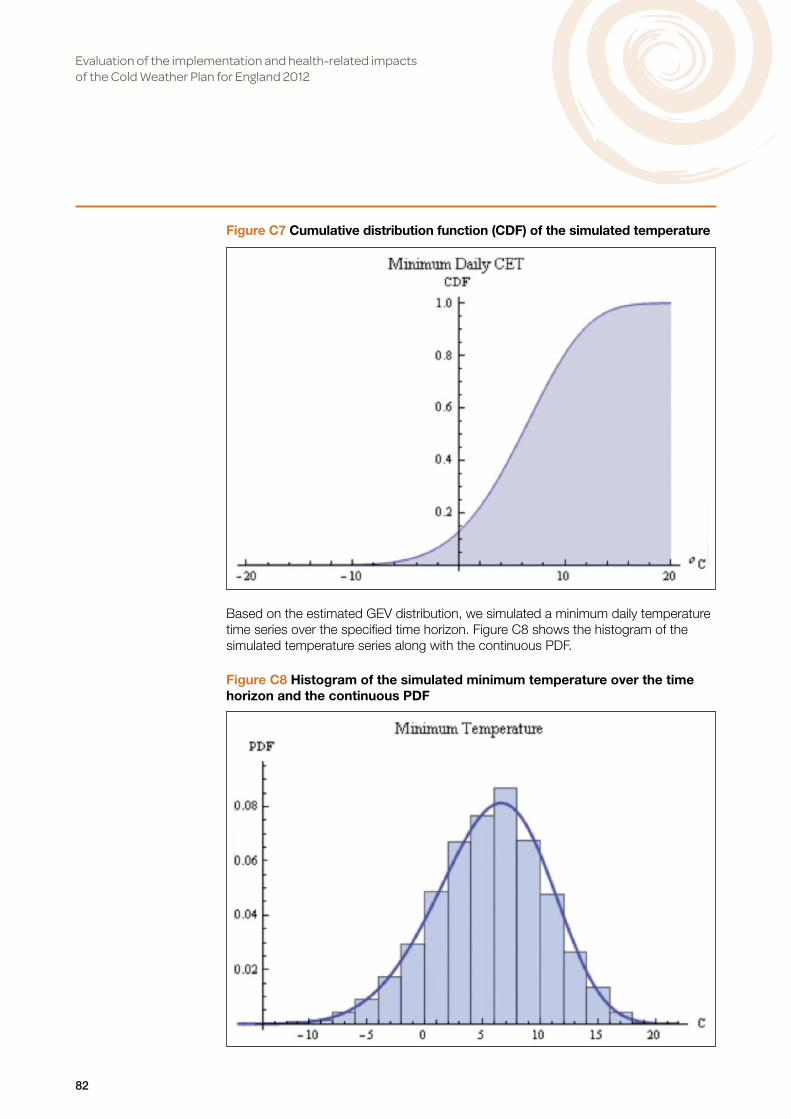
Evaluation of the implementation and health-related impacts of the Cold Weather Plan for England 2012
82
Based on the estimated GEV distribution, we simulated a minimum daily temperature time series over the specified time horizon. Figure C8 shows the histogram of the simulated temperature series along with the continuous PDF.
Figure C7 Cumulative distribution function (CDF) of the simulated temperature
Figure C8 Histogram of the simulated minimum temperature over the time horizon and the continuous PDF
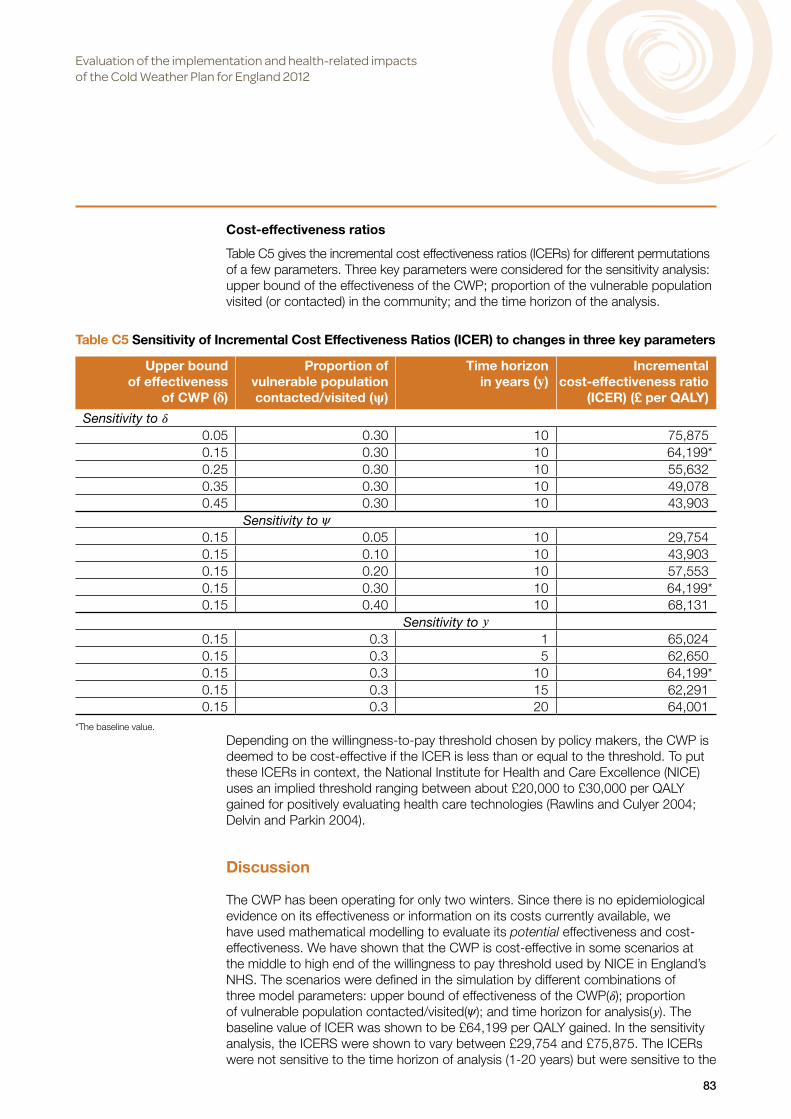
Evaluation of the implementation and health-related impacts of the Cold Weather Plan for England 2012
83
Cost-effectiveness ratios
Table C5 gives the incremental cost effectiveness ratios (ICERs) for different permutations of a few parameters. Three key parameters were considered for the sensitivity analysis: upper bound of the effectiveness of the CWP; proportion of the vulnerable population visited (or contacted) in the community; and the time horizon of the analysis.
Depending on the willingness-to-pay threshold chosen by policy makers, the CWP is deemed to be cost-effective if the ICER is less than or equal to the threshold. To put these ICERs in context, the National Institute for Health and Care Excellence (NICE) uses an implied threshold ranging between about £20,000 to £30,000 per QALY gained for positively evaluating health care technologies (Rawlins and Culyer 2004; Delvin and Parkin 2004).
Discussion
The CWP has been operating for only two winters. Since there is no epidemiological evidence on its effectiveness or information on its costs currently available, we have used mathematical modelling to evaluate its potential effectiveness and cost-effectiveness. We have shown that the CWP is cost-effective in some scenarios at the middle to high end of the willingness to pay threshold used by NICE in England’s NHS. The scenarios were defined in the simulation by different combinations of three model parameters: upper bound of effectiveness of the CWP(𝛿); proportion of vulnerable population contacted/visited(𝜓); and time horizon for analysis(𝑦). The baseline value of ICER was shown to be £64,199 per QALY gained. In the sensitivity analysis, the ICERS were shown to vary between £29,754 and £75,875. The ICERs were not sensitive to the time horizon of analysis (1-20 years) but were sensitive to the
Table C5 Sensitivity of Incremental Cost Effectiveness Ratios (ICER) to changes in three key parameters
Upper bound of effectiveness
of CWP (𝛅)
Proportion of vulnerable population contacted/visited (𝛙)
Time horizon in years (𝐲)
Incremental cost-effectiveness ratio
(ICER) (£ per QALY)
Sensitivity to 𝛿0.05 0.30 10 75,8750.15 0.30 10 64,199*0.25 0.30 10 55,6320.35 0.30 10 49,0780.45 0.30 10 43,903
Sensitivity to 𝜓0.15 0.05 10 29,7540.15 0.10 10 43,9030.15 0.20 10 57,5530.15 0.30 10 64,199*0.15 0.40 10 68,131
Sensitivity to 𝑦0.15 0.3 1 65,0240.15 0.3 5 62,6500.15 0.3 10 64,199*0.15 0.3 15 62,2910.15 0.3 20 64,001
*The baseline value.

Evaluation of the implementation and health-related impacts of the Cold Weather Plan for England 2012
84
other two parameters (effectiveness and proportion of contacts). In one way sensitivity analysis, the ICER is shown to decrease with increasing 𝛿 (i.e. becomes more cost-effective) and increase with increasing 𝜓 (i.e. becomes less cost-effective).
The model has a number of limitations. For example, while it uses as inputs the evidence-based epidemiological temperature thresholds below which mortality and morbidity risks start to increase, the simulation did not test the sensitivity of ICER to the decision thresholds of CWP for triggering the alert levels, because of a lack of information on how these thresholds were determined. Ideally, these decision thresholds should be informed by multiple factors, of which health is only one. Non-health factors could include, firstly, the trade-offs between true positives, false positives, true negatives and false negatives of the Cold Weather Alerts and, secondly, the confidence of NHS and LA frontline staff in the accuracy of the CWP forecasts, their interpretation of the levels of uncertainty attached to the forecasts, and the impact that these factors have on their implementation of the CWP.
As with any early warning system for health risk management, there are economic and societal consequences if true positive forecasts are ignored or if false positive forecasts are acted upon displacing other necessary activities (Rogers and Tsirkunov 2011). We have not quantified the consequences of false positives or false negatives because of a lack of sufficient data on the accuracy of the forecasts and on health workers’ understanding of the effects of not taking due actions or of taking unnecessary actions.
The model is based on many assumptions and parameters. Not all the parameters were examined in one-way sensitivity analyses, nor was it feasible to determine the sensitivity of the ICERs to all possible permutations of the parameters. We also used data for COPD as typical of patients/clients with chronic conditions who are admitted to hospital or contacted/visited in the community.
Nor were all the potential health benefits and costs taken into account. For example, there are other costs which could have been included in the model, such as the cost of management time to set up local plans, the cost to the Met Office for providing the cold weather alert service, or the cost of additional medication given to patients/clients during visits.
Despite the lack of evidence, however, this type of theoretical modelling has wide applicability since public health plans are being developed worldwide in response to extreme weather events which are likely to increase with climate change (Kirch et al 2005). It is important to establish how to make these untested plans effective and cost-effective a priori. One way to do this is to undertake ex ante theoretical modelling in order to explore which parameters are likely to be critical in influencing the effectiveness and cost-effectiveness of a policy. Steps can then be taken to ensure that these parameters are optimised as far as practicable.
Conclusion
A stochastic mathematical model was developed to simulate the daily health benefits and costs of the CWP over time horizons ranging from 1 to 20 years. Incremental cost-effectiveness ratios (ICERs) were calculated from which cost-effectiveness was established for given willingness-to-pay thresholds. In some situations, the CWP is cost-effective at the middle to high end of the range of willingness-to-pay thresholds used by NICE for comparative evaluation of health care technologies in the English NHS. The ICERs were not found to be sensitive to the time horizon of the analysis.

Evaluation of the implementation and health-related impacts of the Cold Weather Plan for England 2012
85
References
Bakerly ND, Roberts JA, Thomson AR, Dyer M. (2011) The effect of COPD health forecasting on hospitalisation and health care utilisation in patients with mild-to-moderate COPD. Chronic Respiratory Disease 8 (1), 5-9.
Booth G. (2007) Winter 1947 in the British Isles. Weather 62 (3), 61-68.
Borg S, Ericsson A, Wedzicha J, Gulsvik A, Lundbäck B, Donaldson G, Sullivan SD. (2004) A computer simulation model of the natural history and economic impact of chronic obstructive pulmonary disease. Value in Health 7 (2), 153-167.
Brabson BB, Palutikof JP. (2002) The evolution of extreme temperatures in the Central England temperature record. Geophysical Research Letters 29 (24), doi:10.1029/2002GL015964.
Coles S. (2001) An introduction to statistical modeling of extreme values. Springer-Verlag, London.
Conlon KC, Rajkovich NB, White-Newsome JL, Larsen L, O’Neill MS. (2011) Preventing cold-related morbidity and mortality in a changing climate. Maturitas 69, 197-202.
Delvin N, Parkin D. (2004) Does NICE have a cost-effectiveness threshold and what other factors influences its decisions? A binary choice analysis. Health Economics 13, 437-452.
Dent J. (2013) The 1962/1963 winter as observed at Belstead Hall (Suffolk) and through investigation of the synoptic charts. Weather 68 (1), 18-23.
Dowie J. (2004) Why cost-effectiveness should trump (clinical) effectiveness: the ethical economics of the South West quadrant. Health Economics 13, 453-459.
DH. (2012) Cold weather plan for England. Department of Health, London. www.gov.uk/government/uploads/system/uploads/attachment_data/file/216937/9211 -TSO-NHS-Cold-Weather-Plan_Accessible-main-doc.pdf (accessed September 2013)
Ebi KL, Teisberg TJ, Kalkstein LS, Robinson L, Weiher RF. (2004) Heat watch/warning systems save lives. Estimated costs and benefits for Philadelphia 1995-98. Bulletin of the American Meteorological Society 85 (8), 1067-1073.
Eden P. (2013) The coldest May since 1996. Weather 68 (7), Weather Log.
Fenwick E, Claxton K, Sculpher M. (2001) Representing uncertainty: the role of cost-effectiveness acceptability curves. Health Economics 10 (8), 779-787.
Guirguis K, Gershunov A, Schwartz R, Bennett S. (2011) Recent warn and cold daily temperature extremes in the Northern Hemisphere. Geophysical Research Letters 38, L17701.
Hammond KR. (1996) Human judgment and social policy. Irreducible uncertainty, inevitable error and unavoidable justice. Oxford University Press, Oxford.
Hirschi JJM, Sinha B. (2007) Negative NAO and cold Eurosian winters: How exceptional was the winter of 1962/1963. Weather 62 (2), 43-48.
Horton EB, Folland CK, Parker DE. (2001) The changing incidence of extremes in worldwide and Central England temperatures to the end of the twentieth century. Climatic Change 50, 267-295.
Huang C, Barnett AG, Wang X, Tong S. (2012) The impact of temperature on years of life lost in Brisbane, Australia. Nature Climate Change 2, 265-270.

Evaluation of the implementation and health-related impacts of the Cold Weather Plan for England 2012
86
Kirch W, Menne B, Bertollini R. (2005) Extreme weather events and public health responses. World Health Organization for Europe, Springer-verlag.
Kodra E, Steinhaeuser K, Ganguly AR. (2011) Persisting cold extremes under 21st-centruy warning scenarios. Geophysical Research Letters 38, L08705.
Kyselỳ J. (2002) Probability estimates of extreme temperature events: stochastic modelling approach vs. Extreme value distributions. Studia Geophysica et Geodaetica 46, 93-112.
Lambert JH, Matalas NC, Ling CW, Haimes YY, Li D. (1994) Selection of probability distributions in characterizing risk of extreme events. Risk Analysis 14, 731-742.
Maheswaran R, Pearson T, Hoysal N, Campbell MJ. (2010) Evaluation of the impact of a health forecast alert service on admissions for chronic obstructive pulmonary disease in Bradford and Airedale. Journal of Public Health 32 (1), 97-102.
Marno P, Chalder M, Laing-Morton T, Levy M, Sachon P, Halpin D. (2010) Can a health forecasting service offer COPD patients a novel way to manage their condition? Journal of Health Services Research & Policy 15 (3), 150-155.
Met Office. (2013) Health Outlook® COPD Forecast Alert Service. www.metoffice.gov.uk/health/professionals/copdforecastalertservice (accessed September 2013).
NICE (2011) Chronic obstructive pulmonary disease quality standard. National Institute for Health and Care Excellence. http://publications.nice.org.uk/chronic-obstructive-pulmonary-disease-quality-standard-qs10 (accessed December 2013)
O’Hanrahan P, Sweeney C. (2013) Odds on weather: probabilities and the public. Weather 68 (9), 247-248.
ONS. (2013) Life expectancies. Office of National Statistics, www.ons.gov.uk/ons/taxonomy/index.html?nscl=Life+Expectancies#tab-data-tables (access October 2013).
Peterson TC, Stott PA, Herring S. (2012) Stott P. (2012). Explaining extreme events of 2011 from a climate perspective. Bulletin of the American Meteorological Society July 2012, 1041-1067.
PPSRU. (2012) Unit costs of health and social care 2012. Personal Social Services Research Unit, University of Kent, Canterbury.
Prior J, Kendon M. (2011a) The UK winter of 2009/2010 compared with severe winters of the last 100 years. Weather 66 (1), 4-10.
Prior J, Kendon M. (2011b) The disruptive snowfalls and very low temperatures of late 2010. Weather 66 (12), 315-321.
Rawlins MD, Culyer AJ. (2004) National Institute for Clinical Excellence and its value judgements. BMJ 329, 224-227.
Rogers D, Tsirkunov V. (2011) Costs and benefits of early warning systems. In Global Assessment Report on Disaster Risk Reduction, ISDR and World Bank.
Sampson F, Munro J, Brazier J. (2003) The benefits and costs of workload forecasting in the health service: an exploratory study. Medical Care Research Unit, University of Sheffield, Sheffield.
Evaluation of the implementation and health-related impacts of the Cold Weather Plan for England 2012
87
Semenov MA, Barrow RJ. (1997) Use of a stochastic weather generator in the development of climatic change scenarios. Climatic Change 35, 397-414.
Semenov MA. (2008) Simulation of extreme weather events by a stochastic weather generator. Climatic Research 35,2030212.
Steventon A, Bardsley M, Mays N. (2014) Effect of a telephonic alert system (Healthy Outlook) for patients with chronic obstructive pulmonary disease: cohort study with matched control. Journal of Public Health doi:10.1093/pubmed/fdu042.
Thornes JE, Fisher PA, Rayment-Bishop T, Smith C. (2013) Ambulance call-outs and response times in Birmingham and the impact of extreme weather and climate change. Emergency Medicine Journal 10.1136/emermed-2012-201817.
UKCP09. (2012) Weather Generator version 2.0. http://ukclimateprojections.defra.gov.uk (accessed September 2013)
Weaver EA, Richardson G. (2006) Threshold setting and the cycling of a decision threshold. System Dynamics Review 22 (1), 1-26.
Wolfram S. (2013) Mathematica 9.www.wolfram.com
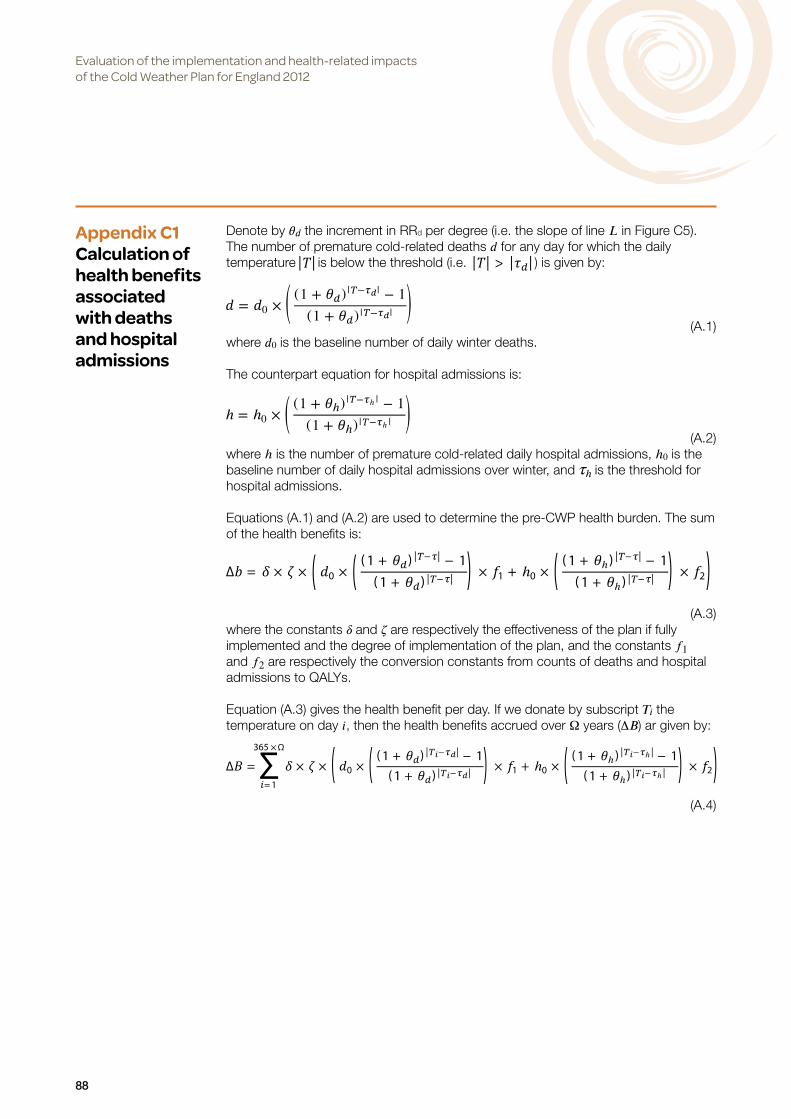
Evaluation of the implementation and health-related impacts of the Cold Weather Plan for England 2012
88
Appendix C1Calculation of health benefits associated with deaths and hospital admissions
Denote by 𝜃 𝑑 the increment in RRd per degree (i.e. the slope of line 𝐿 in Figure C5). The number of premature cold-related deaths 𝑑 for any day for which the daily temperature is below the threshold (i.e. ) is given by:
(A.1)
where 𝑑0 is the baseline number of daily winter deaths.
The counterpart equation for hospital admissions is:
(A.2)where ℎ is the number of premature cold-related daily hospital admissions, ℎ0 is the baseline number of daily hospital admissions over winter, and 𝜏ℎ is the threshold for hospital admissions.
Equations (A.1) and (A.2) are used to determine the pre-CWP health burden. The sum of the health benefits is:
(A.3)where the constants 𝛿 and 𝜁 are respectively the effectiveness of the plan if fully implemented and the degree of implementation of the plan, and the constants 𝑓1 and 𝑓2 are respectively the conversion constants from counts of deaths and hospital admissions to QALYs.
Equation (A.3) gives the health benefit per day. If we donate by subscript 𝑇𝑖 the temperature on day 𝑖, then the health benefits accrued over Ω years (∆𝐵 ) ar given by:
(A.4)

Evaluation of the implementation and health-related impacts of the Cold Weather Plan for England 2012
89
Appendix C2Selection of temperature time series
There are several alternative sources of daily temperature time series which could have been used to drive the model. These include the use of stochastic weather generators to simulate daily temperature in England under different climate scenarios (e.g. Semenov and Barrow 1997; UKCP09 2012). However the publically available daily weather generators are not-physics based and are originally derived from fitting empirical models to rainfall data from which temperature and other weather variables were determined. These were primarily used for agriculture and are not well suited to simulate extreme events. Although some were adapted to simulate extreme weather events, they focussed on extreme hot temperatures and rain fall, and were not tested for cold extremes (Semenov 2008). For these reasons, we opted to use historical temperature data for the simulations.

Evaluation of the implementation and health-related impacts of the Cold Weather Plan for England 2012
90
Appendix C3Fitting extreme value probability distribution to CET data
There have been some investigations of the extremes of CET using extreme value theory (Horton et al 2001, Brabson and Palutikof 2002). Extreme value theory is used to characterise the probability distribution of extreme events (Lambert et al 1994, Kysley 2002). The extreme value theorem states that the minimum (or maximum) of independent identically distributed random variables converges asymptotically to one of three types of a distribution known as the Generalized Extreme Value distribution irrespective of the probability density function of the parent random variable (Coles 2001).
We analysed the minima of daily CET by fitting a generalized minimum extreme value distribution with location parameter 𝜇, scale parameter 𝜎 and shape parameter 𝜉 and of probability density function:
(C.1) to the daily minima of the CET time series record using maximum likelihood estimation (Coles 2001).

Evaluation of the implementation and health-related impacts of the Cold Weather Plan for England 2012
91
Appendix C4Total primary care, community care and hospital costs
The total cost over Ω years is given by:
(D.1) where 𝛼 and 𝛽 are respectively the unit costs of hospital admission and primary/social care contact and 𝑢𝑖 is the additional number of contacts on day 𝑖; the remaining terms of equation (D.1) are described in Appendix C1.

The Policy Innovation Research Unit (PIRU) brings together leading healthand social care expertise to improve evidence-based policy-making andits implementation across the National Health Service, social care andpublic health.
We strengthen early policy development by exploiting the best routine dataand by subjecting initiatives to speedy, thorough evaluation. We also helpto optimise policy implementation across the Department of Health’sresponsibilities.
Our partnersPIRU is a novel collaboration between the London School of Hygiene & TropicalMedicine (LSHTM), the Personal Social Services Research Unit (PSSRU) at theLondon School of Economics and Political Science (LSE), and the Health andCare Infrastructure Research and Innovation Centre (HaCIRIC) at Imperial CollegeLondon Business School plus RAND Europe and the Nuffield Trust.
The Unit is funded by the Policy Research Programme of the Department of Health.
Policy Innovation Research UnitDepartment of Health Services Research & PolicyLondon School of Hygiene & Tropical Medicine15–17 Tavistock Place, London WC1H 9SH
Tel: +44 (0)20 7927 2784www.piru.ac.uk