Evaluation of the Green Low-Carbon Agri-Environment Scheme ...
147
Evaluation of the Green Low-Carbon Agri-Environment Scheme (GLAS) Year 2 Analysis of Actions under GLAS Full Report
Transcript of Evaluation of the Green Low-Carbon Agri-Environment Scheme ...

Evaluation of the Green Low-Carbon Agri-Environment Scheme (GLAS) Year 2 Analysis of Actions under GLAS Full Report

ADAS GENERAL NOTES
Project No.: 1020044
Title: Year 2 Analysis of Actions under GLAS. Full Report
Client: Department of Agriculture, Food and the Marine
Date: November 2019
Office: (1) ADAS, 11D Park House, Milton Park OX14 4RS, UK
(2) ADAS, 10D Cefn Llan Science Park, Aberystwyth SY23 3AH, UK
(3) ADAS, 4205 Park Approach, Leeds LS15 8GB, UK
Status: Final
Author Mike Image (1) Technical reviewer Chris Forster-Brown (2)
Signature [delete row if not required]
Signature [delete row if not required]
Date: 11 Nov 2019 Date:
Project manager John Elliott (3)
Quality reviewer [optional] John Elliott
Signature [delete row if not required]
Signature [delete row if not required]
Date: 11 Nov 2019 Date:
RSK ADAS Ltd (ADAS) has prepared this report for the sole use of the client, showing reasonable skill and care, for the intended purposes as stated in the agreement under which this work was completed. The report may not be relied upon by any other party without the
express agreement of the client and ADAS. No other warranty, expressed or implied, is made as to the professional advice included in this report.
Where any data supplied by the client or from other sources have been used, it has been assumed that the information is correct. No
responsibility can be accepted by ADAS for inaccuracies in the data supplied by any other party. The conclusions and recommendations in this report are based on the assumption that all relevant information has been supplied by those bodies from whom it was requested.
No part of this report may be copied or duplicated without the express permission of ADAS and the party for whom it was prepared.
Where field investigations have been carried out, these have been restricted to a level of detail required to achieve the stated objectives of the work.
This work has been undertaken in accordance with the quality management system of RSK ADAS Ltd.

i
Year 2 Analysis of Actions under GLAS. ADAS Project: 1020044
EXECUTIVE SUMMARY
Background
The Green Low Carbon Agri-Environment Scheme (GLAS) is a measure funded by the Rural Development Programme (RDP; 2014 to 2020) that promotes interventions to address the preservation of priority habitats and species and the issues of climate change mitigation and water quality, in support of sustainable Irish agriculture. It aims to do so by supporting the delivery of targeted environmental advice and encouraging more sustainable production practices at farm level in the context of Food Wise 2025. It also underpins a range of over-arching environmental objectives within the framework for environmental sustainability as set down in various EU Directives, as well as under a number of National and International Strategies and conventions.
The overall purpose of the evaluation is:
a. to assess the effectiveness of GLAS as a contributory measure towards sustainable Irish agriculture under the RDP 2014-2020;
b. to assess its contribution towards the achievement of wider environmental objectives; and
c. to fulfil, in part at least, Ireland’s commitment towards the monitoring and evaluation requirements set out in the RDP.
Impacts on water quality and climate are assessed in a modelling study, whilst impacts on attitudes towards sustainable land management are assessed through an attitudinal survey. These reports are available elsewhere.
The field survey is one of three components of the GLAS monitoring programme and focuses on biodiversity (designated areas, other priority habitats, and both target and non-target species). The survey is a longitudinal assessment where 26 GLAS actions are assessed at three different points in time: 2017, 2018 and 2020. This report presents the findings from the second year (2018) of monitoring and represents the first year where sample sites can be compared against the first year survey carried out in 2017.
Field Survey Methodology
The methodology for the field survey was developed in consultation with the Department of Agriculture, Food and the Marine (DAFM) within Task II of the requirements of the contract. A sample size of 30 sites per action was deemed sufficiently robust for the evaluation, taking into consideration budgetary constraints that limited the number of farms surveyable to slightly over 300. A lower sample size (10 sites) was deemed to be sufficient for the purposes of monitoring the Commonage habitat areas.
For each of the actions, a set of measures of success (MoS) were agreed. These are intended to provide an overall indication of the success or otherwise of the action in relation to the individual parcel. The measures are intended to be easily monitored and evaluated to facilitate comparison with future surveys at each sample site; and to assess the extent of change over time, and across the whole sample set, to understand variations in findings across space. The underlying data captured by surveyors when visiting each site informs whether an MoS has been met according to a field survey protocol agreed with DAFM.
In the vast majority of cases, the same site and parcel were resurveyed as per 2017. However, in a small number of cases (19) this was not possible as some parcels are replacement sites where either

ii
Year 2 Analysis of Actions under GLAS. ADAS Project: 1020044
the action or the entire farm dropped out of the scheme. Surveyors were not able to record data in a handful of cases, either because the action had failed or had not been complete, or because site conditions (weather, presence of livestock, or presence of breeding birds) prevented this. In the end 742 individual reports were prepared in total across a total of 318 farms.
In addition to collecting field data during the 2018 visits, surveyors were also asked to rate the overall quality of the agreement as a whole on the farm against a set of five questions. These complement the objective analysis at action level with a higher level but more qualitative lens.
Analytical Procedure
The MoS for each action are divided into three broad types:
Specification MoS are derived from the management requirements set out in the specification for each action. These indicate whether actions are being carried out as prescribed in GLAS documentations.
Outcome MoS are based on a knowledge of the ecology of the species or habitat that is the focus of the action. These are not set out in the specification requirements but are indicators that could be expected to be met if the prescription is being correctly followed and external variables are suitable.
Result MoS are a special type of Outcome MoS where the ability to evidence the success from a single point of time and single parcel field survey is challenging. In the context of this evaluation this refers to MoS evidencing the presence of mobile species relevant to the action’s objective.
Performance on sites are compared against Specification, Outcome and Result MoS separately. This is because each type of indicator provides different information about the effectiveness of the action. The more Specification MoS met, the better the quality of implementation by the landholder; the more Outcome or Results MoS met, the better the desired environmental outcomes with respect to action objectives. Another reason for not combining the Outcome, Result and Specification MoS is that the Result MoS are not strictly independent from the Specification and Outcome MoS, and the Outcome MoS not strictly independent from the Specification MoS. Combining them would provide misleading information and could violate assumptions underpinning the statistical tests subsequently used.
Performance is further compared across years for each action to examine if there have been any changes in individual MoS or across Specification, Outcome and Result MoS in general. Changes in underlying data are also compared to understand reasons for differences in MoS pass rates between years. Surveyors’ responses to agreement level questions are analysed using descriptive statistics.

iii
Year 2 Analysis of Actions under GLAS. ADAS Project: 1020044
Results
The execution of the agreement against the specification requirements has been very good for the vast majority of actions. Only Arable Margins (40%), Environmental Management of Fallow Land (68%), Coppicing of Hedgerows (57%), Conservation of Solitary Bees (Sand) (66%), Corncrake (31%) and Hen Harrier (52%) score less than 70% on average against Specification MoS in 2018. Of these six actions, when looking at the detail and the reasons for not meeting specification only the Corncrake performance (failure to provide an ELC) would represent a major concern in terms of the likelihood of the action meeting its objective. There are however mitigating circumstances for this action with the weather being a major limiting factor. Surveyors’ ratings for quality of implementation reflect the scores for Specification MoS with the vast majority (91%) deemed to be “OK” or “Very Well” implemented. Only a few sites were poorly implemented, details of which are highlighted in the individual action reports.
Quality of management has either been maintained or has even increased from an already high baseline. Of particular note are the increases in the Low-input Permanent Pasture, Grey Partridge, Hen Harrier and Wild Bird Cover pass rates which are statistically significant. Even when the standard has not been maintained (Water Actions) the change is not significant.
The ecological and landscape outcomes expected from actions at this stage of the agreement are largely being met. For the vast majority of actions, the average Outcome MoS score is greater than 70% on average. Only Arable Margins (68%), Commonages (67%), Chough (67%) and Twite (37%) score less than this. Of these, the two habitat actions are generally weak due to scores on floral cover and botanical diversity, which are common issues across all habitat actions. This is also a key factor in the lack of recognised Twite forage species recorded. Scores on these criteria are also low across other habitat actions. This is not surprising given the amount of time passed since the agreement started and the likely starting level of nutrients. The Outcome MoS for Chough is of less relevance to the overall objective. Surveyors’ ratings of agreements on the likelihood of delivering outcomes is also strong with the vast majority (87%) deemed to have a “good chance” or be “very likely” to achieve their objectives. 66% of sites were deemed to have outcomes that could not have been achieved without GLAS support. This ‘additionality’ was considered to be particularly high for certain Geese and Swans sites where grazing intensity would have been considerably higher otherwise.
Quality of outcomes has either been maintained from the baseline year or has even increased. There has been a statistically significant increase in the number of Outcome MoS being met for Low-input Permanent Pasture and Hen Harrier. The latter reflects improvements in a number of underlying indicators.
The Result MoS which directly measure actual or relative numbers of the mobile species targeted in the nesting / roosting and bird actions show species present on a few sites, with little change from the baseline year (except for Geese / Swans where this may reflect external factors such as weather). This is not surprising given the single point nature of the survey.
The vast majority of farms had not missed opportunities or created unintended consequences in their GLAS agreement, according to surveyors’ ratings. The few sites with missed opportunities relate generally to examples of non-implementation or absence of a feature (e.g. ELC for Corncrake), or where sites are not entirely suitable for that action.
Performance at individual action level is available in the main report and is not summarized here. The first table below provides an overall snapshot of performance of the actions of MoS as measured by the average pass rate on a given type of MoS across the sample where that MoS was assessable in each year. The surveyors’ responses to the agreement level questions are in the second table.

iv
Year 2 Analysis of Actions under GLAS. ADAS Project: 1020044
Summary of MoS Performance 2017 and 20181 Percentage of sites passing MoS by type
Specification Outcome Result
Pass 2017
(%) Pass 2018
(%) Pass 2017
(%) Pass 2018
(%) Pass 2017
(%) Pass 2018
(%)
Arable Grass Margins - 40 - 68 - -
Commonages - - 80 67 - -
Environmental Management of Fallow Land
- 68 80 - -
Farmland Habitat (Grassland) - - 67 71 - -
Low-input Permanent Pasture 85 94 72 81 - -
Traditional Hay Meadow 85 89 67 71 - -
Protection of Watercourse from Bovines
84 81 79 80 - -
Riparian Margins 90 81 88 92 - -
Coppicing of Hedgerows - 57 - - - -
Laying of Hedgerows - 76 - - - -
Planting New Hedgerows - 73 - - - -
Planting a Grove of Native Trees - 75 - - - -
Traditional Orchards - 84 - - - -
Traditional Dry Stone Wall Maintenance
93 89 93 97 - -
Bat Boxes 90 90 - - - 17
Bird Boxes 90 89 - - - 13
Conservation of Solitary Bees (Boxes)
87 87 - - - 0
Conservation of Solitary Bees (Sand)
- 66 - - - -
Breeding Waders and Curlew 75 77 87 27 20
Chough 67 71 67 67 10 17
Corncrake 28 31 - - 10 20
Geese / Swans 80 89 - - 3 12
Grey Partridge 83 91 - - 7 10
Hen Harrier 25 52 68 83 14 17
Twite (Option A) 100 93 33 37 3 7
Wild Bird Cover 64 78 - - - -
1 A blank entry means ‘non-applicable’ because in some cases no data of that type was recorded in a given year. This could be because the type of MoS does not apply to that action (e.g. Commonage and Farmland Habitat have no common specification assessment as the requirements are bespoke to each individual site/parcel with their Management Plans), or else because for some actions the 2017 survey comprised an implementation check only. Actions with a similar theme are grouped in adjacent shaded bands (habitat actions, water actions, landscape feature actions, nesting / roosting Actions and bird actions.

v
Year 2 Analysis of Actions under GLAS. ADAS Project: 1020044
Summary of Responses to Agreement Level Questions Number of responses by category of response
Question Count Y Count N Count 1 Count 2 Count 3 N/A
Are there any missed opportunities within the land parcels surveyed? (Y/N)
38 278 - - - 1
Are there any unintended consequences (good or bad) of implementing the actions on the
land parcels surveyed? (Y/N) 24 292 - - - 1
How well have the actions been implemented on the land parcels surveyed?
(1=Not well, 2=OK, 3= Very well)
- - 23 136 152 6
How likely are the intended outcomes of the actions implemented going to be achieved?
(1=very unlikely; 2=good chance; 3=very likely)
- - 35 134 141 7
Would similar outcomes of the actions be achieved without the GLAS support?
(1=can be achieved without the scheme; 2=to a lesser degree or at a later date; 3=cannot be
achieved otherwise)
- - 42 52 208 15
vi
Year 2 Analysis of Actions under GLAS. ADAS Project: 1020044
CONTENTS
Background ...................................................................................................................................... i
Field Survey Methodology ............................................................................................................. i
Analytical Procedure ..................................................................................................................... ii
Results iii
1 BACKGROUND TO GLAS EVALUATION ..................................................................... 1
2 METHODOLOGY ............................................................................................................ 3
2.1 Sample Size ........................................................................................................................... 3
2.2 Measures of Success ............................................................................................................ 3
2.3 Approach to Monitoring......................................................................................................... 4
2.4 Approach to Analysis ............................................................................................................ 4
3 INDIVIDUAL ACTION REPORTS ................................................................................... 7
3.1 Arable Grass Margins ........................................................................................................... 7
3.2 Bat Boxes .............................................................................................................................. 10
3.3 Bird Boxes ............................................................................................................................ 15
3.4 Breeding Waders and Curlew ............................................................................................ 20
3.5 Chough .................................................................................................................................. 27
3.6 Conservation of Solitary Bees (Boxes) ............................................................................ 32
3.7 Conservation of Solitary Bees (Sand) .............................................................................. 36
3.8 Commonages ....................................................................................................................... 39
3.9 Coppicing of Hedgerows .................................................................................................... 44
3.10 Corncrake ............................................................................................................................. 47
3.11 Environmental Management of Fallow Land ................................................................... 52
3.12 Farmland Habitat (Natura) ................................................................................................. 55
3.13 Geese and Swans ............................................................................................................... 62
3.14 Grey Partridge ...................................................................................................................... 67
3.15 Hen Harrier ........................................................................................................................... 72
3.16 Laying of Hedgerows .......................................................................................................... 78
3.17 Low Input Permanent Pasture ........................................................................................... 81
3.18 Planting a Grove of Native Trees ...................................................................................... 87
3.19 Planting New Hedgerows ................................................................................................... 90
3.20 Protection of Watercourses from Bovines ....................................................................... 93
3.21 Riparian Margins .................................................................................................................. 98
3.22 Traditional Dry Stone Wall Maintenance........................................................................ 104
vii
Year 2 Analysis of Actions under GLAS. ADAS Project: 1020044
3.23 Traditional Hay Meadow ................................................................................................... 108
3.24 Traditional Orchards .......................................................................................................... 115
3.25 Twite (Option A) ................................................................................................................. 118
3.26 Wild Bird Cover .................................................................................................................. 122
4 SYNTHESIS OF FINDINGS ........................................................................................ 127
4.1 Habitat Actions ................................................................................................................... 127
4.2 Water Actions ..................................................................................................................... 129
4.3 Landscape Feature Actions ............................................................................................. 130
4.4 Nesting / Roosting Feature Actions ................................................................................ 131
4.5 Bird Actions ........................................................................................................................ 132
4.6 Agreement Level Questions ............................................................................................. 134
4.7 Overall Conclusions .......................................................................................................... 135
Tables
Table 3.1-1: Arable Grass Margins. 2018 Performance on individual MoS ............................................................ 8 Table 3.1-2: Arable Grass Margins. 2018 Site level performance on underlying data .......................................... 9 Table 3.2-1: Bat Boxes. 2018 Performance on individual MoS ............................................................................... 11 Table 3.2-2: Bat Boxes. 2018 Site level performance on MOS ............................................................................... 12 Table 3.2-3: Bat Boxes. 2018 vs. 2017 Number of MoS Exact Symmetry Test. .................................................. 14 Table 3.3-1: Bird Boxes. 2018 Performance on individual MoS .............................................................................. 16 Table 3.3-2: Bird Boxes. 2018 Site level performance on MoS .............................................................................. 17 Table 3.3-3: Bird Boxes. 2018 vs. 2017 Number of MoS. Exact Symmetry Test ................................................. 19 Table 3.4-1: Breeding Waders. 2018 Performance on individual MoS .................................................................. 21 Table 3.4-2: Breeding Waders. 2018 Performance on sward height MoS sub-criteria ........................................ 21 Table 3.4-3: Breeding Waders. 2018 Site level performance on underlying data ................................................ 23 Table 3.4-4: Breeding Waders. 2018 vs. 2017 Number of MoS. Exact Symmetry Test ...................................... 25 Table 3.4-5: Breeding Waders. 2018 vs. 2017 Underlying data. Wilcoxon Signed Rank Test ........................... 26 Table 3.5-1: Chough. 2018 Performance on individual MoS ................................................................................... 28 Table 3.5-2: Chough. 2018 Site level performance on underlying data ................................................................. 29 Table 3.5-3: Chough. 2018 vs. 2017. Number of MoS. Exact Symmetry Test ..................................................... 31 Table 3.5-4: Chough. 2018 vs. 2017. Underlying data. Wilcoxon Signed Rank Test .......................................... 31 Table 3.6-1: Bee Boxes. 2018 Performance on individual MoS .............................................................................. 33 Table 3.6-2: Bee Boxes. 2018 Site level performance on underlying data............................................................ 33 Table 3.6-3: Bee Boxes. 2018 vs. 2017 Number of MoS. Exact Symmetry Test ................................................. 35 Table 3.7-1: Bee Sand. 2018. Performance on individual MoS .............................................................................. 37 Table 3.7-2: Bee Sand. 2018 Site level performance on underlying data ............................................................. 38 Table 3.8-1: Commonages. 2018 Performance on individual MoS ........................................................................ 40 Table 3.8-2: Commonages. 2018 Performance on sward height MoS sub-criteria .............................................. 40 Table 3.8-3: Commonages. 2018 Site level performance on underlying data ...................................................... 41 Table 3.8-4: Commonages. 2018 vs. 2017. Summary of underlying data ............................................................ 43 Table 3.9-1: Hedge Coppicing. 2018. Performance on individual MoS ................................................................. 45 Table 3.9-2: Hedge Coppicing. 2018 Site level results for underlying data ........................................................... 46 Table 3.10-1: Corncrake. 2018 Performance on individual MoS ............................................................................ 48 Table 3.10-2: Corncrake. 2018. Site level performance on underlying data ......................................................... 49 Table 3.10-3: Corncrake. 2018 vs. 2017 Number of MoS. Exact Symmetry Test ................................................ 51
viii
Year 2 Analysis of Actions under GLAS. ADAS Project: 1020044
Table 3.10-4: Corncrake. 2018 vs. 2017. Underlying data. Wilcoxon Signed Rank Test .................................... 51 Table 3.11-1: Fallow. 2018 Performance on individual MoS ................................................................................... 53 Table 3.11-2: Fallow. 2018 Site level performance on underlying data ................................................................. 54 Table 3.12-1: Farmland Habitat (Grassland). 2018. Performance on individual MoS ......................................... 56 Table 3.12-2: Farmland Habitat (Grassland). 2018 Site level and summary performance on underlying data 57 Table 3.12-3: Farmland Habitat (Grassland). 2018 vs. 2017. Number of MoS. Exact Symmetry Test ............. 59 Table 3.12-4: Farmland Habitat (Grassland). 2018 vs. 2017 Underlying data. Wilcoxon Signed Rank Test ... 59 Table 3.12-5: Farmland Habitat (Heathland). 2018 Performance on individual MoS .......................................... 60 Table 3.12-6: Farmland Habitat (Heathland) 2018. Site level performance on underlying data ........................ 61 Table 3.13-1: Geese & Swans. 2018. Performance on individual MoS ................................................................. 63 Table 3.13-2: Geese & Swans. 2018 Site level performance on underlying data ................................................ 64 Table 3.13-3: Geese & Swans. 2018 vs. 2017 Number of MoS. Exact Symmetry Test ...................................... 66 Table 3.13-4: Geese & Swans. 2018 vs. 2017 Underlying Data. Wilcoxon Signed Rank Test .......................... 66 Table 3.14-1: Grey Partridge. 2018 Performance on individual MoS ..................................................................... 68 Table 3.14-2: Grey Partridge. 2018 Site level performance on underlying data ................................................... 69 Table 3.14-3: Grey Partridge. 2018 vs. 2017 Number of MoS. Exact Symmetry Test ........................................ 71 Table 3.14-4: Grey Partridge. 2018 vs. 2017. Underlying data. Wilcoxon Signed Rank Test ............................ 71 Table 3.15-1: Hen Harrier. 2018 Performance on individual MoS .......................................................................... 73 Table 3.15-2: Hen Harrier. 2018 Performance on sward height MoS sub-criteria................................................ 73 Table 3.15-3: Hen Harrier. 2018 Site level performance on underlying data ........................................................ 74 Table 3.15-4: Hen Harrier. 2018 vs. 2017 Performance on sward height MoS sub-criteria................................ 76 Table 3.15-5: Hen Harrier. 2018 vs. 2017 Number of MoS. Exact Symmetry Test .............................................. 77 Table 3.15-6: Hen Harrier. 2018 vs. 2017 Underlying Data. Wilcoxon Signed Rank Test .................................. 77 Table 3.16-1: Hedge Laying. 2018 Performance on individual MoS ...................................................................... 79 Table 3.16-2: Hedge Laying. 2018 Site level performance on underlying data .................................................... 80 Table 3.17-1: Low-input Permanent Pasture. 2018 Performance on individual MoS .......................................... 82 Table 3.17-2: Low-input Permanent Pasture. 2018 Site level performance on underlying data ........................ 83 Table 3.17-3: Low-input Permanent Pasture. 2018 vs. 2017 Number of MoS. Exact Symmetry Test .............. 85 Table 3.17-4: Low-input Permanent Pasture. 2018 vs. 2017 Underlying Data. Wilcoxon Signed Rank Test .. 86 Table 3.18-1: Tree Grove. 2018 Performance on individual MoS .......................................................................... 88 Table 3.18-2: Tree Grove. 2018 Site level performance on underlying data......................................................... 89 Table 3.19-1: Planting New Hedgerows. 2018 Performance on individual MoS .................................................. 91 Table 3.19-2: Planting New Hedgerows. 2018 Site level performance on underlying data ................................ 92 Table 3.20-1: Watercourse Protection. 2018 Performance on individual MoS ..................................................... 94 Table 3.20-2: Watercourse Protection. 2018 Site level performance on underlying data ................................... 95 Table 3.20-3: Watercourse Protection. 2018 vs. 2017 Number of MoS. Exact Symmetry Test ......................... 97 Table 3.20-4: Watercourse Protection. 2018 vs. 2017 Underlying Data. Wilcoxon Signed Rank Test ............. 97 Table 3.21-1: Riparian Margins. 2018 Performance on individual MoS ................................................................. 99 Table 3.21-2: Riparian Margins. 2018 Site level performance on underlying data ............................................. 100 Table 3.21-3: Riparian Margins. 2018 vs. 2017. Number of MoS. Exact Symmetry Test ................................. 102 Table 3.21-4: Riparian Margins. 2018 vs. 2017 Underlying Data. Wilcoxon Signed Rank Test ...................... 103 Table 3.22-1: Dry Stone Walls. 2018 Performance on individual MoS ................................................................ 104 Table 3.22-2: Dry Stone Walls. 2018 Site level performance on underlying data .............................................. 105 Table 3.22-3: Dry Stone Walls. 2018 vs. 2017 Number of MoS. Exact Symmetry Test .................................... 107 Table 3.22-4: Dry Stone Walls. 2018 vs. 2017 Underlying data. Wilcoxon Signed Rank Test ......................... 107 Table 3.23-1: Traditional Hay Meadow. 2018 Performance on individual MoS .................................................. 109 Table 3.23-2: Traditional Hay Meadow. 2018 Site level performance on underlying data ................................ 110 Table 3.23-3: Traditional Hay Meadow. 2018 vs. 2017 Number of MoS. Exact Symmetry Test ..................... 113 Table 3.23-4: Traditional Hay Meadow. 2018 vs. 2017. Underlying Data. Wilcoxon Signed Rank Test ......... 114 Table 3.24-1: Traditional Orchards. 2018 Performance on individual MoS ......................................................... 116 Table 3.24-2: Traditional Orchards. 2018 Site level performance on underlying data ....................................... 117 Table 3.25-1: Twite (A). 2018 Performance on individual MoS ............................................................................. 118 Table 3.25-2: Twite (A). 2018 Site level performance on underlying data ........................................................... 119 Table 3.25-3: Twite (A). 2018 vs. 2017 Number of MoS. Exact Symmetry Test ................................................ 120 Table 3.25-4: Twite (A). 2018 vs. 2017. Underlying Data. Wilcoxon Signed Rank Test ................................... 121 Table 3.26-1: Wild Bird Cover. 2018 Performance on individual MoS ................................................................. 122 Table 3.26-2: Wild Bird Cover. 2018 Performance on crop species sub-criteria ................................................ 123
ix
Year 2 Analysis of Actions under GLAS. ADAS Project: 1020044
Table 3.26-3: Wild Bird Cover. 2018 Site level performance on underlying data ............................................... 124 Table 3.26-4: Wild Bird Cover. 2018 vs. 2017. Performance on crop species MoS sub-criteria ...................... 126 Table 3.26-5: Wild Bird Cover. 2018 vs. 2017 Number of MoS. Exact Symmetry Test..................................... 126 Table 3.26-6: Wild Bird Cover. 2018 vs. 2017 Underlying Data. Wilcoxon Signed Rank Test ......................... 126 Table 4.1-1: Habitat Actions. 2018 MoS pass rate by MoS type .......................................................................... 127 Table 4.1-2: Habitat Actions. 2018 vs. 2017 Number of Specification MoS. Exact Symmetry Test ................ 127 Table 4.1-3: Habitat Actions. 2018 vs. 2017. Number of Outcome MoS. Exact Symmetry Test ..................... 128 Table 4.2-1: Water Actions. 2018 MoS pass rate by MoS type ............................................................................ 129 Table 4.2-2: Water Actions. 2018 vs. 2017 Number of Specification MoS. Exact Symmetry Test .................. 129 Table 4.2-3: Water Actions. 2018 vs. 2017 Number of Outcome MoS. Exact Symmetry Test ........................ 129 Table 4.3-1: Landscape Feature Actions. 2018 MoS pass rate by MoS type ..................................................... 130 Table 4.3-2: Landscape Feature Actions. 2018 vs. 2017 Number of Specification MoS. Exact Symmetry Test ........................................................................................................................................................................................ 130 Table 4.3-3: Landscape Feature Actions. 2018 vs. 2017 Number of Outcome MoS. Exact Symmetry Test . 130 Table 4.4-1: Nesting / Roosting Feature Actions. 2018 MoS pass rate by MoS type ........................................ 131 Table 4.4-2: Nesting / Roosting Feature Actions. 2018 vs. 2017 Number of Specification MoS. Exact Symmetry Test ................................................................................................................................................................................ 131 Table 4.5-1: Bird Actions. 2018 MoS pass rate by MoS type ................................................................................ 132 Table 4.5-2: Bird Actions. 2018 vs. 2017 Number of Specification MoS. Exact Symmetry Test ...................... 132 Table 4.5-3: Bird Actions. 2018 vs. 2017 Number of Outcome MoS. Exact Symmetry Test ............................ 133 Table 4.5-4: Bird Actions. 2018 vs. 2017 Number of Result MoS. Exact Symmetry Test ................................. 133 Table 4.6-1: Agreement Level Questions. Summary of Responses ..................................................................... 134
Figures
Figure 3.1-1: Arable Grass Margins. 2018. Number of MoS met by sites. .............................................................. 7 Figure 3.2-1: Bat Boxes. 2018 Number of MoS met by sites. ................................................................................. 10 Figure 3.2-2: Bat Boxes. 2018 vs. 2017 Number of Specification MoS met. ........................................................ 13 Figure 3.2-3: Bat Boxes. 2018 vs. 2017 Individual MoS. ......................................................................................... 13 Figure 3.3-1: Bird Boxes. 2018 Number of MoS met by site. .................................................................................. 15 Figure 3.3-2: Bird Boxes. 2018 vs. 2017 Number of MoS met by sites. ................................................................ 18 Figure 3.3-3: Bird Boxes. 2018 vs. 2017 Individual MoS. ........................................................................................ 18 Figure 3.4-1: Breeding Waders. 2018 Number of MoS met by site. ....................................................................... 20 Figure 3.4-2: Breeding Waders. 2018 vs. 2017 Number of MoS met by site. ....................................................... 24 Figure 3.4-3: Breeding Waders. 2018 vs. 2017 Individual MoS. ............................................................................. 24 Figure 3.4-4: Breeding Waders. 2018 vs. 2017. Number of sward height sub-criteria by site. .......................... 25 Figure 3.5-1: Chough. 2018 Number of MoS met by site. ....................................................................................... 27 Figure 3.5-2: Chough. 2018 vs. 2017. Number of MoS met by site. ...................................................................... 30 Figure 3.5-3: Chough 2018 vs. 2017 Individual MoS. .............................................................................................. 30 Figure 3.6-1: Bee Boxes. 2018 Number of MoS met by site. .................................................................................. 32 Figure 3.6-2: Bee Boxes. 2018 vs. 2017. Number of MoS met by sites. ............................................................... 34 Figure 3.6-3: Bee Boxes. 2018 vs. 2017 Individual MoS. ........................................................................................ 34 Figure 3.7-1: Bee Sand. 2018 Number of MoS met by site. .................................................................................... 36 Figure 3.8-1: Commonages. 2018 Number of MoS met by sites. ........................................................................... 39 Figure 3.8-2: Commonages. 2018 vs. 2017 Number of MoS met by sites. ........................................................... 42 Figure 3.8-3: Commonages. 2018 vs. 2017 Individual MoS. ................................................................................... 43 Figure 3.8-4: Commonages. 2018 vs. 2017 Sward height MoS sub-criteria. ........................................................ 43 Figure 3.9-1: Hedge Coppicing. 2018 Number of MoS met by site. ....................................................................... 44 Figure 3.10-1: Corncrake. 2018 Number of MoS met by site. ................................................................................. 47 Figure 3.10-2: Corncrake. 2018 vs. 2017 Number of MoS met by site. ................................................................. 50 Figure 3.10-3: Corncrake. 2018 vs. 2017 Individual MoS. ....................................................................................... 50 Figure 3.11-1: Fallow. 2018 Number of MoS met by site. ........................................................................................ 52 Figure 3.12-1: Farmland Habitat (Grassland). 2018 Number of MoS met by sites. ............................................. 56 Figure 3.12-2: Farmland Habitat (Grassland). 2018 vs. 2017 Number of MoS met by sites. ............................. 58 Figure 3.12-3: Farmland Habitat (Grassland). 2018 vs. 2017. Individual MoS. .................................................... 58 Figure 3.13-1: Geese & Swans. 2018 Number of MoS by site. .............................................................................. 62 Figure 3.13-2: Geese & Swans. 2018 vs. 2017. Number of Specification MoS met by sites. ............................ 65
x
Year 2 Analysis of Actions under GLAS. ADAS Project: 1020044
Figure 3.13-3: Geese & Swans. 2018 vs. 2017. Number of Result MoS met by sites. ....................................... 65 Figure 3.13-4: Geese & Swans. 2018 vs. 2017. Individual MoS. ............................................................................ 65 Figure 3.14-1: Grey Partridge. 2018 Number of MoS met by site. ......................................................................... 67 Figure 3.14-2: Grey Partridge. 2018 vs. 2017. Number of MoS met by site ......................................................... 70 Figure 3.14-3: Grey Partridge. 2018 vs. 2017. Individual MoS ............................................................................... 70 Figure 3.15-1: Hen Harrier. 2018 Number of MoS met by sites .............................................................................. 72 Figure 3.15-2: Hen Harrier. 2018 vs. 2017 Number of Specification MoS met ..................................................... 75 Figure 3.15-3: Hen Harrier. 2018 vs. 2017 Number of Outcome MoS met ........................................................... 75 Figure 3.15-4: Hen Harrier. 2018 vs. 2017 Individual MoS ...................................................................................... 76 Figure 3.16-1: Hedge Laying. 2018 Number of MoS met by site ............................................................................ 78 Figure 3.17-1: Low-input Permanent Pasture. 2018 Number of MoS met by sites. ............................................. 81 Figure 3.17-2: Low-input Permanent Pasture. 2018 vs. 2017 Number of sites by Specification MoS met ...... 84 Figure 3.17-3: Low-input Permanent Pasture. 2018 vs. 2017 Number of sites by Outcome MoS met ............. 84 Figure 3.17-4: Low-input Permanent Pasture. 2018 vs. 2017 Individual MoS met. ............................................. 85 Figure 3.18-1: Tree Grove. 2018 Number of MoS met by site ................................................................................ 87 Figure 3.19-1: Planting New Hedgerows. 2018 Number of MoS met by site ........................................................ 90 Figure 3.20-1: Watercourse Protection. 2018 Number of MoS met by sites ......................................................... 93 Figure 3.20-2: Watercourse Protection. 2018 vs. 2017 Number of Specification MoS met by sites ................. 96 Figure 3.20-3: Watercourse Protection. 2018 vs. 2017 Number of Outcome MoS met by sites ........................ 96 Figure 3.20-4: Watercourse Protection. 2018 vs. 2017 Individual MoS. ................................................................ 97 Figure 3.21-1: Riparian Margins. 2018 Number of MoS met by sites .................................................................... 99 Figure 3.21-4: Riparian Margins. 2018 vs. 2017. Individual MoS ......................................................................... 102 Figure 3.22-1: Dry Stone Walls: Number of MoS met by sites .............................................................................. 104 Figure 3.22-2: Dry Stone Walls. 2018 vs. 2017 Number of MoS met by sites .................................................... 106 Figure 3.22-3: Dry Stone Walls. 2018 vs. 2017 Individual MoS. ........................................................................... 106 Figure 3.23-1: Traditional Hay Meadow. 2018 Number of MoS met by sites ...................................................... 108 Figure 3.23-2: Traditional Hay Meadow. 2018 vs. 2017 Number of Specification MoS met by sites .............. 111 Figure 3.23-3: Traditional Hay Meadow. 2018 vs. 2017 Number of Outcome MoS met by sites..................... 111 Figure 3.23-4: Traditional Hay Meadow. 2018 vs. 2017. Individual MoS. ........................................................... 112 Figure 3.24-1: Traditional Orchards. 2018 Number of MoS met by sites ............................................................ 115 Figure 3.25-1: Twite (A). 2018 vs. 2017 Individual MoS ........................................................................................ 120 Figure 3.26-1: Wild Bird Cover. 2018 Number of MoS met by sites ..................................................................... 122 Figure 3.26-3: Wild Bird Cover. 2018 vs. 2017 Individual MoS ............................................................................. 125 Figure 3.26-2: Wild Bird Cover. 2018 vs. 2017 Number of MoS met by sites ..................................................... 125

Department of Agriculture, Food and the Marine 1
Year 2 Analysis of Actions under GLAS
RSK ADAS Project: 1020044
1 BACKGROUND TO GLAS EVALUATION
The Green Low Carbon Agri-Environment Scheme (GLAS) is a measure funded by the Rural Development Programme (RDP; 2014-2020) that promotes interventions to address the preservation of habitats and species as well as the issues of climate change mitigation and water quality, in support of sustainable Irish agriculture. It aims to do so by supporting the delivery of targeted environmental advice and by encouraging more sustainable production practices at farm level in the context of Food Wise 2025. It also underpins a range of over-arching environmental objectives within the framework for environmental sustainability as set down in various EU Directives, as well as under a number of National and International Strategies and conventions, including the EU Climate Change and Renewable Energy Package and the Paris Agreement; the Water Framework Directive, including the Groundwater Directive and the Nitrates Directive; and the Convention on Biological Diversity, Habitats Directive, Birds Directive and the EU and National Biodiversity Strategies.
The overall purpose of the evaluation is:
to assess the effectiveness of GLAS as a contributory measure towards sustainable Irish agriculture under the RDP 2014-2020;
to assess its contribution towards the achievement of wider environmental objectives; and
to fulfil, in part at least, Ireland’s commitment towards the monitoring and evaluation requirements set out in the RDP.
Evaluation is formally reported to the EC through an Enhanced Annual Implementation Report (EAIR) in 2017 and 2019 and the ex-post evaluation in 2024. This requires quantification of programme achievements through the assessment of the complementary results indicators and by answering a set of common evaluation questions (CEQs).
The evidence is required to evaluate the impact of GLAS on 2 RDP priorities, Priority 4: Restoring, preserving and enhancing ecosystems related to agriculture and forestry; and Priority 5: Promoting resource efficiency and supporting the shift towards a low carbon and climate resilient economy in agriculture, food and forestry sectors. For these priorities CEQs are based on a number of associated scheme Focus Areas, namely 4A, 4B, 4C, 5D & 5E. The associated CEQs are:
4A: CEQ8. To what extent have RDP interventions supported the restoration, preservation and enhancement of biodiversity, including in Natura 2000 areas, areas facing natural and other specific constrains and HNV farming, and the state of European landscapes?
4B: CEQ9. To what extent have RDP interventions supported the improvement of water management, including fertilizer and pesticide management?
4C: CEQ10. To what extent have RDP interventions supported the prevention of soil erosion and improvement of soil management?
5D: CEQ14. To what extent have RDP interventions contributed to reducing GHG and ammonia emissions from agriculture?
5E: CEQ15. To what extent have RDP interventions supported carbon conservation and sequestration in agriculture and forestry?
The field survey is one of three components of the GLAS monitoring programme and will largely contribute to evidence on biodiversity (Focus Area 4A). Impacts on water quality and climate are difficult to measure directly and are evaluated through a modelling approach. A further analysis will evaluate attitudinal change, capturing the impact of participation in GLAS on attitudes towards sustainable land management and environmental actions and feedback on scheme access and

Department of Agriculture, Food and the Marine 2
Year 2 Analysis of Actions under GLAS
RSK ADAS Project: 1020044
operation. The attitudinal survey relates to the field survey sample of over 300 farms and is supported by a counterfactual sample of 100 farms outside the scheme.
The 2018 field survey report represents a summary evaluation of the second year of ecological monitoring for 26 actions in the GLAS agri-environment scheme and represents the first year where sample sites can be compared against the baseline survey carried out in 2017.

Department of Agriculture, Food and the Marine 3
Year 2 Analysis of Actions under GLAS
RSK ADAS Project: 1020044
2 METHODOLOGY
The methodology for the field survey was developed in consultation with the Department of Agriculture, Food and the Marine (DAFM) within Task II of the requirements of the contract, which specified a longitudinal (5 year) field-based evaluation of the GLAS actions contributing to biodiversity, climate and water quality objectives. It was agreed that climate change and water quality impacts would be addressed through modelling and that the field-survey should focus on biodiversity (designated areas, other priority habitats, and both target and non-target species). The survey was required at three points where feasible (baseline survey plus monitoring surveys in 2018 and 2020) and was required to cover 26 actions from the scheme. For some actions involving the creation or maintenance of specific features, a construction and maintenance survey was required (Bee Boxes, Bird Boxes, Bat Boxes and Traditional Dry Stone Walls).
2.1 Sample Size
The research team and DAFM agreed that a sample size of 30 sites per action would be sufficiently robust for the evaluation, taking into consideration budgetary constraints that limited the number of farms to approximately 300 (the 2018 survey comprises 318 farms). A lower sample size (10 sites) was deemed to be sufficient for the purposes of monitoring the Commonage habitat areas. Previous experience of agri-environment evaluation in the UK has indicated that samples of these size would be to capture the baseline condition and monitor change over the survey period within reasonable limits of precision for the various parameters to be recorded. All the farms surveyed were either in the first or second tranche of GLAS agreements.
To improve the cost efficiency of monitoring, farms which had implemented several actions were preferred, as were sites that were within reasonable geographic proximity to each other. The sites comprising the sample for each action were selected to represent, where possible, the distribution of the uptake across Ireland. However, many actions were geographically constrained due to known species range, the Natura 2000 network and other environmental conditions, so the location of sample sites also reflects this. This geographic clustering does not affect the statistical validity of the sample chosen, as the actions affected (i.e. Annex I Birds, Arable Grass Margins, Traditional Orchards) are present in a more limited number of agreements so the sample represents a proportionately higher percentage of the overall population.
2.2 Measures of Success
For each of the actions, a set of measures of success (MoS) were agreed. These are intended to provide an overall indication of the success or otherwise of the action in relation to the individual parcel. The measures are intended to be easily monitored and evaluated to facilitate comparison with future surveys at each sample site; and to assess the extent of change over time, and across the whole sample set, to understand variations in findings across space.
The MoS for each action have been further divided into three broad types:
Specification MoS are derived from the management requirements set out in the specification for each action. These indicate whether actions are being carried out as prescribed in GLAS documentations.
Outcome MoS are based on a knowledge of the ecology of the species or habitat that is the focus of the action. These are not set out in the specification requirements but are indicators that could be expected to be met if the prescription is being correctly followed and external variables are suitable.

Department of Agriculture, Food and the Marine 4
Year 2 Analysis of Actions under GLAS
RSK ADAS Project: 1020044
Result MoS are a special type of Outcome MoS where the ability to evidence the success from a single point of time and single parcel field survey is challenging. In the context of this evaluation this refers to MoS evidencing the presence of mobile species.
For example, the Twite (Option A) action is intended to create ideal foraging conditions for Twite within grassland fields that have typically been subject to relatively low levels of agricultural improvement, such that they contain a range of target plant species on which Twite feed. Actions within this option are designed to encourage seeding of these plants by either late mowing or appropriate grazing management.
Requirement 1 of the GLAS specification states that landholders should “produce a suitable sward by managing grazing and/or mowing of a parcel.” Requirement 3 puts limitations on grazing: “Where the parcel is grazed, approximately 50% of the field/parcel should be grazed from 15th April to 15th June with the other approximately 50% grazed from 16th June to 15th August annually”. These lead to the Specification MoS that the average sward height should be 5cm or greater. The exact threshold is not specified in the GLAS documentation, but a limit is required for the monitoring to be objective and this was agreed to be a reasonable value by the Field Survey team and DAFM.
The Twite (Option A) action also includes an Outcome MoS, which is that the recognised Twite breeding season forage species should be present to a reasonable extent (minimum 3 frequent and 3 occasional). This is a desired outcome of the action specification but is not a requirement. Finally, sites are also assessed for the presence of Twite. Clearly, this is the ultimate objective of the action; but even if the habitat is suitable, birds may not be present on a single survey date for a variety of external reasons. Hence Twite presence is a Result MoS.
2.3 Approach to Monitoring
A protocol was developed by the research team, agreed iteratively with DAFM and signed-off ahead of the survey. Full details of survey methodology are described in the protocol document and are not repeated here. However, key information such as the type of survey, number of sites visited, survey window, MoS used, and underlying data collected to evidence the MoS for each action are discussed in the individual action reports below.
In the vast majority of cases, the same site and parcel were resurveyed as per the baseline. However, in a small number of cases (19) this was not possible as some parcels are replacement sites where either the action or the entire farm dropped out of the scheme. Surveyors were not able to record data in a handful of cases, either because the action had failed or had not been complete, or because site conditions (weather, presence of livestock, or presence of breeding birds) prevented this. 742 individual reports were prepared in total and details are provided in the individual action summaries.
2.4 Approach to Analysis
2.4.1 2018 Data
The 2018 data has been analysed as follows. Firstly, the performance of sites is compared against the number of MoS met for the same action. This is done separately for Specification, Outcome and Result MoS. In part this reflects the fact that the cumulative data on the two types of indicator provide different information about the effectiveness of the scheme: the more Specification MoS met, the better the quality of implementation by the landholder; the more Outcome or Results MoS met, the better the desired environmental outcomes with respect to action objectives. Another reason for not combining the Outcome, Result and Specification MoS is that the Result MoS are not strictly independent from the Specification and Outcome MoS, and the Outcome MoS not strictly

Department of Agriculture, Food and the Marine 5
Year 2 Analysis of Actions under GLAS
RSK ADAS Project: 1020044
independent from the Specification MoS. Combining them would provide misleading information and could violate assumptions underpinning the statistical tests subsequently used.
Secondly, performance on the same MoS is compared across sites. This allows an assessment to be made of the relative performance between different MoS and thus identify which are more or less challenging to achieve. This is an important benchmark because the MoS, whilst all relevant, do vary in terms of how critical they are to achieving broader scheme objectives. For example, achieving sufficient floral cover is essential for actions whose objectives are to benefit pollinating insects such as Arable Grass Margins and Environmental Management of Fallow Land.
The underlying data underpinning each MoS is also presented and used for contextual purposes to illustrate why sites are passing or failing on MoS.
2.4.2 Comparative Analysis (2018 versus 2017)
The performance by MoS across sites and by sites across MoS are then compared across the baseline (2017) survey year and this year (2018) to establish if there are any differences between the two points in time, and to establish if these differences are statistically significant. This is only done where there is usable data on the same MoS from 2017 to 2018 and paired samples can be constructed2. Actions subject to an implementation check only (Arable Grass Margins, Bee Sand, Fallow, Hedgerow actions, Tree Grove, Orchards) and actions where there is a limited sample size (Commonages, Farmland Natura – Heathland) are not compared on a statistical basis. The analysis was carried out in the R statistical package3 using the packages “coin” 4 and “rcompanion”5.
Performance on individual MoS across survey Years
A two-by-two contingency table is built for each MoS indicating the number of paired sites passing or failing the MoS in the baseline year and 2018. An exact binomial test of symmetry for nominal data (Exact Symmetry Test) is then performed to test the null hypothesis that the table is symmetric6. The null hypothesis can also be described as: the probability of being in the discordant cells of the table (passed 2017/failed 2018 and failed 2017/passed 2018) is the same. If the null hypothesis is rejected, then this indicates that there has been a significant change in the number of sites meeting MoS between each year. A two-sided test has been used to allow for the possibility of sites showing a worse performance year on year.
Performance on summed MoS across survey years
A two-by-two contingency table is built for each MoS indicating the number of paired sites meeting/not-meeting the MoS in the baseline year and 2018. The contingency tables are summed across MoS type separately to produce a combined contingency table for each type of MoS. An Exact Symmetry Test is performed as described above.
2 In some cases, data is not available on the same MoS for all sites in the same survey year. This is either because data was not collected due to logistical or other reasons outlined in each action report, or because some MoS are based on a relative change from baseline to 2018 and thus were not assessable at baseline. 3 Version 3.5.2. R Core Team (2013). R: A language and environment for statistical computing. 4 Hothorn T, Hornik K, van de Wiel MA, Zeileis A (2006). “A Lego system for conditional inference.” The American Statistician, 60(3), 257–263. doi: 10.1198/000313006X118430. 5 Mangiafico, S.S. 2015. An R Companion for the Handbook of Biological Statistics, version 1.3.2
6 The exact binomial test is used rather than McNemar’s test because the latter is not sensitive to change when the counts of entries in the two discordant cells are relatively low, as is the case here.

Department of Agriculture, Food and the Marine 6
Year 2 Analysis of Actions under GLAS
RSK ADAS Project: 1020044
Performance on underlying data across survey years
Performance on the underlying data determining each MoS is also compared across survey years for the same site. This allows an assessment to be made of whether there has been any change in the environmental condition regardless of whether it has triggered thresholds for MoS. Again, this comparison is only made where there is usable data on the same MoS from the two years.
This analysis is only meaningful where the underlying data is ordinal or continuous. Where the data is already binomial (e.g. stock present/absent) then there is no need for further analysis.
Due to the heterogeneity of data types (percentage continuous, fully continuous, count, ranked ordinal) present across the survey, and the possibility that the distributions might violate the assumptions of parametric tests, a non-parametric test (Wilcoxon Signed Rank test) has been used. This allows for consistency of analysis across different MoS and requires fewer assumptions to be met. The null hypothesis is that the median difference between the paired data from each year is zero. If this is rejected, then it indicates that there has been a significant change in the distributions between years. Again, a two-sided test has been used to allow for the possibility of sites showing a worse performance year on year.
As it is a non-parametric test it does not indicate the extent to which the underlying data has changed from year to year. However, it does allow for a straightforward comparison to be made as to whether there are any significant changes in the underlying data. This can help shed additional light onto any changes or non-changes observed in the MoS. For example, if the number of sites meeting the floral cover MoS has not significantly changed year-on-year but the % cover of wildflowers has changed significantly then this may at least indicate that an effect is occurring, but it is yet to reach a threshold to trigger the MoS. Conversely, if an MoS has shown a significant change in the number meeting, but the underlying data have not changed significantly, then it may suggest that the change in MoS was due to small variation around the MoS threshold rather than a material change in the underlying variable.
2.4.3 Agreement Level Questions
In addition to collecting field data during the 2018 visits, surveyors were also asked to rate the overall quality of the agreement as a whole on the farm against a set of five questions. These complement the objective analysis at action level with a higher level but more qualitative lens. Questions were as follows:
Are there any missed opportunities within the land parcels surveyed? (Y/N)
Are there any unintended consequences (good or bad) of implementing the actions on the land parcels surveyed? (Y/N)
How well have the actions been implemented on the land parcels surveyed? (1=Not well, 2=OK, 3= Very well)
How likely are the intended outcomes of the actions implemented going to be achieved? (1=very unlikely; 2=good chance; 3=very likely)
Would similar outcomes of the actions be achieved without the GLAS support? (1=can be achieved without the scheme; 2=to a lesser degree or at a later date; 3=cannot be achieved otherwise)

Department of Agriculture, Food and the Marine 7
Year 2 Analysis of Actions under GLAS
RSK ADAS Project: 1020044
3 INDIVIDUAL ACTION REPORTS
3.1 Arable Grass Margins
The objective of the action is to provide a habitat for flora and fauna, increase biodiversity and help protect water quality by the establishment of an arable grass margin along the full length of an existing field or parcel boundary.
The action was assessed against one Specification MoS and seven Outcome MoS. The Specification MoS on the cover of Cocks-foot (Dactylis glomerata) and Timothy (Phleum pratense) reflects the choice of grasses and their expected dominance in the grass seed mix indicated in the action requirement. Three of the Outcome MoS (low cover of undesirable species7, low cover of bare ground, and high average sward height) are closely related to the management specifications but are not explicit in the documentation. Two further Outcome MoS check that the cover of Perennial Ryegrass (Lolium perenne) and White clover (Trifolium repens) are low as indicators of low nutrient enrichment. Finally, the margins are checked for sufficient presence of other grasses and forbs as indicators of biodiversity value.
Sites were visited during the agreed survey window of 1 May – 14 Aug with the exception of one site visited on 27 Apr8. Overall the results are mixed with very good scores on site management, average scores on indicators of soil improvement and presence of sown grasses, and low scores on other grass and forb cover MoS. The details are discussed below.
3.1.1 2018 Results
As shown in Figure 3.1-1 more than half (18) of the 30 sites surveyed9 had not established the requisite amount of grass species indicator in the specification. In terms of Outcome MoS, the bulk of sites (21) had met four or five of the seven requirements, but only five of the 29 sites with valid data across all of these met more than this.
Performance on individual MoS is shown in Table 3.1-1 and on the underlying data in Table 3.1-2. The Outcome MoS most closely related to the action specifications scored highly across all sites, namely:
7 Includes: Cirsium arvense, Cirsium vulgare, Rumex obtusifolius, Rumex crispus, Senecio jacobaea, Urtica dioica 8 Site #9. This was due to logistical issues and no impact on the results of the monitoring are expected. 9 Two of the sites (#2 and #26) from the baseline implementation check had dropped out of GLAS and were replaced in the survey by #31 and #32. Some data could not be collected at site #19 as it had been recently mown.
0
5
10
15
20
0 1
Co
un
t o
f Si
tes
Specification MoS met
0
2
4
6
8
10
12
14
16
0 1 2 3 4 5 6 7
Co
un
t o
f Si
tes
Outcome MoS met
Figure 3.1-1: Arable Grass Margins. 2018. Number of MoS met by sites. Median = thick border

Department of Agriculture, Food and the Marine 8
Year 2 Analysis of Actions under GLAS
RSK ADAS Project: 1020044
the lack of undesirable species cover (87% met), lack of bare ground (83% met) and sufficient sward height (93% met). The other MoS showed a more mixed set of scores.
Table 3.1-1: Arable Grass Margins. 2018 Performance on individual MoS
2018
Specification MOS Valid
Surveys Total
passed %
passed
Cumulative cover of Timothy and Cocksfoot should be >60% 30 12 40
Outcome MOS Valid
Surveys Total
passed %
passed
Cover of other grasses should be >15% 29 9 31
Cover of Perennial ryegrass should be <25% 29 17 59
Cover of White clover should be <25% 30 29 97
Combined cover of forbs should be >10% 30 8 27
Cover of undesirables should be <5% 30 26 87
Cover of bare ground should be <10% 30 25 83
Average sward height should be >20cm (considering time of year) 30 28 93
The MoS on which the sites struggled most frequently was the need for a material forb cover (an important feature for pollinators). Only a few sites (27%) met this requirement, and only a few sites (31%) showed wider grass species cover other than the two specified grasses or Perennial ryegrass. The latter was present in high amounts on a number of sites (around 40%), though this situation may improve by the final year as nutrient levels become depleted. Indeed, the two sites with the lowest cover (#20 and #28) were margins established before GLAS. However, almost all had acceptable levels of White Clover.
Around a quarter of sites (eight) are close to achieving the Specification MoS with cover of these grasses of 40% to 60%. For the ryegrass MoS, the target is to fall below 25%, and a quarter of sites are between 23% to 40% cover, so the prospects of improvement in this score look reasonable at the next survey point. The bar for forb and other grass cover is low (10% and 15%) respectively. But, as can be seen from the underlying data in the tables above and below, many sites are starting from a very low base: median scores for these are only 5% and 4% respectively and a quarter of sites have almost no cover at all.
There were some instances of inappropriate management: Sites #1, #19 and #31 showed evidence of having been cut or mown at an inappropriate time, whilst the margins of #8, #9 and #30 were being used as a track with possible risk of disturbance and damage. However, it is not clear if any of these factors relate to any low scores for these sites. Yellowhammer (Emberiza citrinella) was recorded at #11.
Improvement on the floral and grass diversity scores might be expected if sites continue to be managed appropriately, but to what extent this will be visible within the timeframe of the GLAS evaluation will likely be dependent on the starting levels of soil improvement in the margins assessed.
Department of Agriculture, Food and the Marine 9
Year 2 Analysis of Actions under GLAS
RSK ADAS Project: 1020044
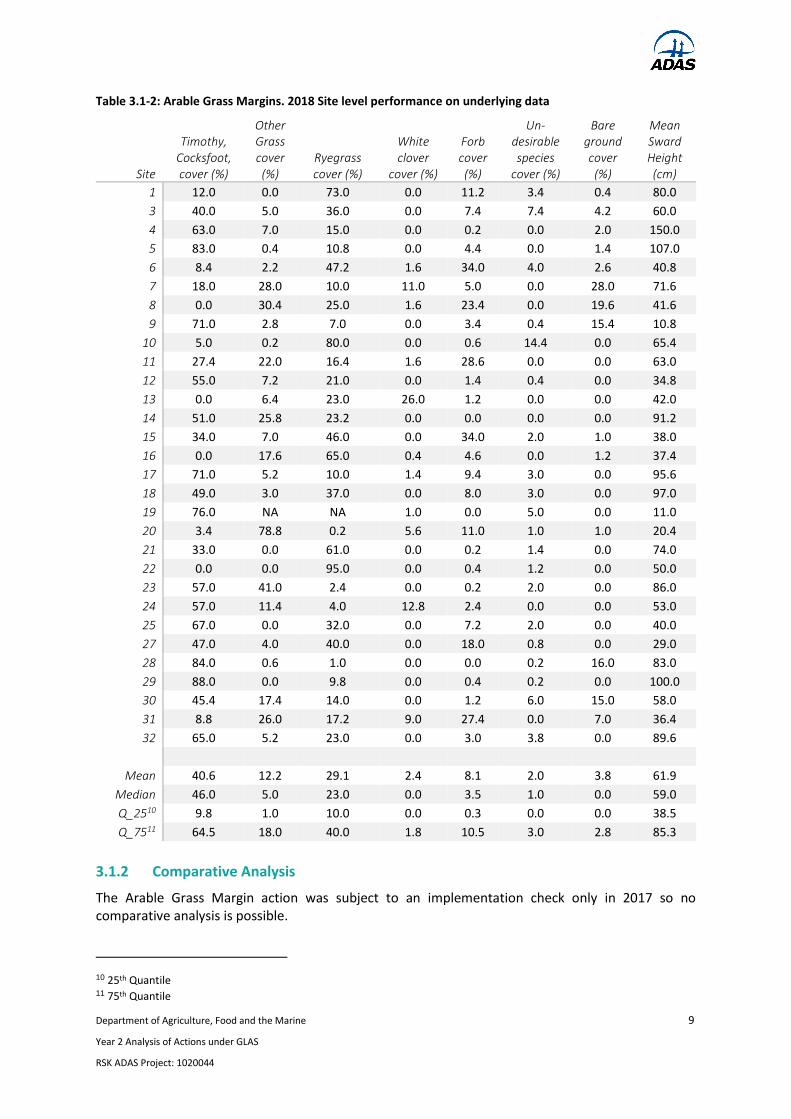
Table 3.1-2: Arable Grass Margins. 2018 Site level performance on underlying data
Site
Timothy, Cocksfoot, cover (%)
Other Grass cover (%)
Ryegrass cover (%)
White clover
cover (%)
Forb cover (%)
Un-desirable species
cover (%)
Bare ground cover (%)
Mean Sward Height (cm)
1 12.0 0.0 73.0 0.0 11.2 3.4 0.4 80.0
3 40.0 5.0 36.0 0.0 7.4 7.4 4.2 60.0
4 63.0 7.0 15.0 0.0 0.2 0.0 2.0 150.0
5 83.0 0.4 10.8 0.0 4.4 0.0 1.4 107.0
6 8.4 2.2 47.2 1.6 34.0 4.0 2.6 40.8
7 18.0 28.0 10.0 11.0 5.0 0.0 28.0 71.6
8 0.0 30.4 25.0 1.6 23.4 0.0 19.6 41.6
9 71.0 2.8 7.0 0.0 3.4 0.4 15.4 10.8
10 5.0 0.2 80.0 0.0 0.6 14.4 0.0 65.4
11 27.4 22.0 16.4 1.6 28.6 0.0 0.0 63.0
12 55.0 7.2 21.0 0.0 1.4 0.4 0.0 34.8
13 0.0 6.4 23.0 26.0 1.2 0.0 0.0 42.0
14 51.0 25.8 23.2 0.0 0.0 0.0 0.0 91.2
15 34.0 7.0 46.0 0.0 34.0 2.0 1.0 38.0
16 0.0 17.6 65.0 0.4 4.6 0.0 1.2 37.4
17 71.0 5.2 10.0 1.4 9.4 3.0 0.0 95.6
18 49.0 3.0 37.0 0.0 8.0 3.0 0.0 97.0
19 76.0 NA NA 1.0 0.0 5.0 0.0 11.0
20 3.4 78.8 0.2 5.6 11.0 1.0 1.0 20.4
21 33.0 0.0 61.0 0.0 0.2 1.4 0.0 74.0
22 0.0 0.0 95.0 0.0 0.4 1.2 0.0 50.0
23 57.0 41.0 2.4 0.0 0.2 2.0 0.0 86.0
24 57.0 11.4 4.0 12.8 2.4 0.0 0.0 53.0
25 67.0 0.0 32.0 0.0 7.2 2.0 0.0 40.0
27 47.0 4.0 40.0 0.0 18.0 0.8 0.0 29.0
28 84.0 0.6 1.0 0.0 0.0 0.2 16.0 83.0
29 88.0 0.0 9.8 0.0 0.4 0.2 0.0 100.0
30 45.4 17.4 14.0 0.0 1.2 6.0 15.0 58.0
31 8.8 26.0 17.2 9.0 27.4 0.0 7.0 36.4
32 65.0 5.2 23.0 0.0 3.0 3.8 0.0 89.6
Mean 40.6 12.2 29.1 2.4 8.1 2.0 3.8 61.9
Median 46.0 5.0 23.0 0.0 3.5 1.0 0.0 59.0
Q_2510 9.8 1.0 10.0 0.0 0.3 0.0 0.0 38.5
Q_7511 64.5 18.0 40.0 1.8 10.5 3.0 2.8 85.3
3.1.2 Comparative Analysis
The Arable Grass Margin action was subject to an implementation check only in 2017 so no comparative analysis is possible.
10 25th Quantile 11 75th Quantile

Department of Agriculture, Food and the Marine 10
Year 2 Analysis of Actions under GLAS
RSK ADAS Project: 1020044
3.2 Bat Boxes
The objective of the Bat Box action is to improve biodiversity in the farming landscape and replace habitats lost through changes in farming practice. Bats also play an important role in farm pest management as they feed on midges, flies and other potential pest species. The action requires landholders to install boxes to replace natural roost locations for bats that have been removed through the changes in farming practice.
The action was assessed against a set of six Specification MoS that check the quality of the construction and siting of the boxes against what was set out in the scheme documentation. The action was also surveyed against a single Result MoS to assess if the confirmed occupancy (the number of boxes showing clear evidence of use by bats) had increased from the baseline year.
Sites were visited during the agreed survey window of 1 May - 31 Aug. Overall, the findings discussed below indicate that the high quality of implementation of the specifications noted in the baseline year was maintained in 2018. However, the action is yet to show the desired result in terms of increase in occupancy which could be due to factors outside the influence of the action as well as the limitations of the survey method. Details for 2018 and the comparison with 2017 are discussed below.
3.2.1 2018 Results
As indicated in Figure 3.2-1 the agreement holders generally followed the prescriptions well. Nearly half (14) of the sites in the sample of 29 surveyed12 met all of the Specification MoS for the action, and a further 13 met all but one. However, only five sites could meet the Result MoS requirement.
Performance on individual MoS is shown in Table 3.2-1 and on the underlying data in Table 3.2-2. All boxes were correctly constructed and all but one located in an appropriate location on the farm (though in a few instances this differed from its expected location). The clustering of boxes (in groups of 3 - 15) was also good (76% of sites). As indicated in the site level data the sites that failed this requirement had at least one group with only one or two boxes present, though this may have been partially due to storm damage.
Seven sites had confirmed occupancy, including one site where three of the 10 boxes were occupied. However, only five of these sites had more boxes occupied than in 2017. This result must be taken into context. Firstly, this was the first full year that boxes were present, and there may have been other factors beyond the scope of the action that limited occupancy. Secondly, the survey
12 The original sample was 30, but site #17 was not assessable as the boxes had not been erected.
0
5
10
15
0 1 2 3 4 5 6
Co
un
t o
f Si
tes
Specification MoS met
0
5
10
15
20
25
30
0 1
Co
un
t o
f Si
tes
Result MoS met
Figure 3.2-1: Bat Boxes. 2018 Number of MoS met by sites. Median = thick border

Department of Agriculture, Food and the Marine 11
Year 2 Analysis of Actions under GLAS
RSK ADAS Project: 1020044
methodology was limited in its remit to a single occupancy check rather than a full survey of activity over time, which may have indicated more bat presence.
Table 3.2-1: Bat Boxes. 2018 Performance on individual MoS
2018
Specification MOS Valid
Surveys Total passed
% passed
The location of the bat boxes must match the agreement 29 24 83
Bat boxes must be located on a tree or post or external farm wall 29 28 97
Between 3 - 15 boxes per group 29 22 76
Individual bat boxes in each group must be orientated in a variety of directions
29 24 83
Bat boxes must be made of wood or Woodcrete 29 29 100
Bat boxes must be draught free 29 29 100
Result MOS Valid
Surveys Total passed
% passed
Confirmed occupancy rate should increase from baseline year 29 5 17
Department of Agriculture, Food and the Marine 12
Year 2 Analysis of Actions under GLAS
RSK ADAS Project: 1020044
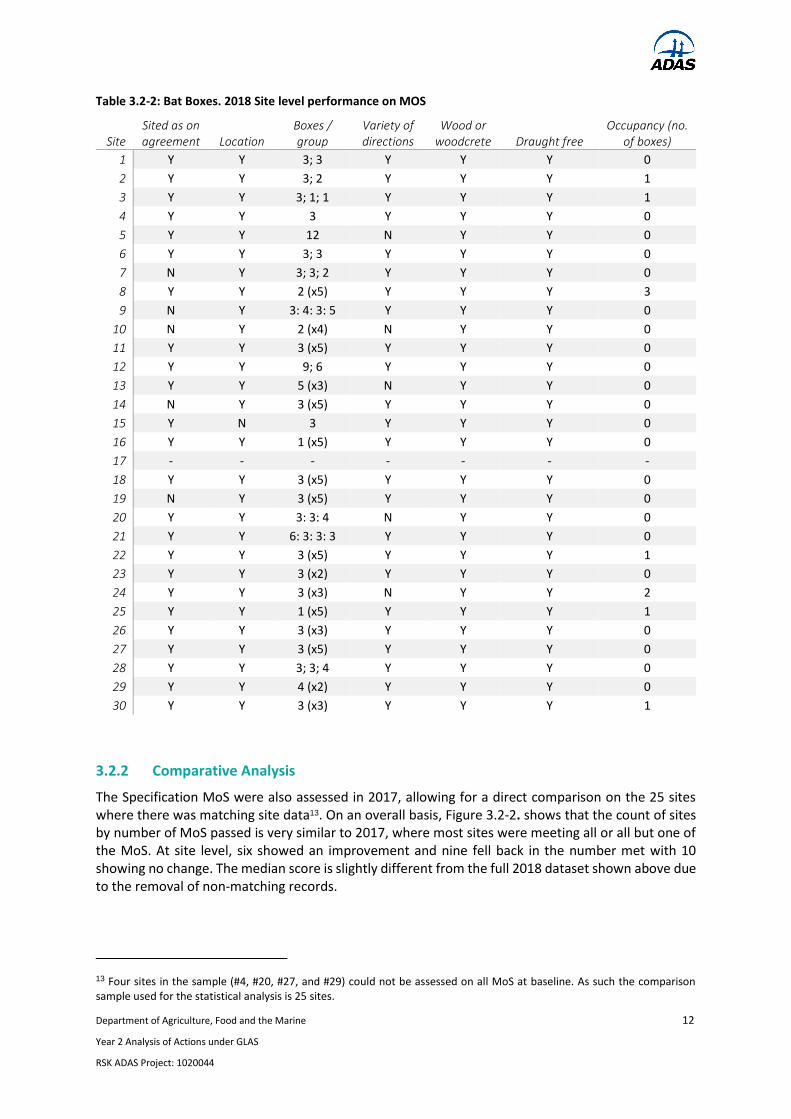
Table 3.2-2: Bat Boxes. 2018 Site level performance on MOS
Site Sited as on agreement Location
Boxes / group
Variety of directions
Wood or woodcrete Draught free
Occupancy (no. of boxes)
1 Y Y 3; 3 Y Y Y 0
2 Y Y 3; 2 Y Y Y 1
3 Y Y 3; 1; 1 Y Y Y 1
4 Y Y 3 Y Y Y 0
5 Y Y 12 N Y Y 0
6 Y Y 3; 3 Y Y Y 0
7 N Y 3; 3; 2 Y Y Y 0
8 Y Y 2 (x5) Y Y Y 3
9 N Y 3: 4: 3: 5 Y Y Y 0
10 N Y 2 (x4) N Y Y 0
11 Y Y 3 (x5) Y Y Y 0
12 Y Y 9; 6 Y Y Y 0
13 Y Y 5 (x3) N Y Y 0
14 N Y 3 (x5) Y Y Y 0
15 Y N 3 Y Y Y 0
16 Y Y 1 (x5) Y Y Y 0
17 - - - - - - -
18 Y Y 3 (x5) Y Y Y 0
19 N Y 3 (x5) Y Y Y 0
20 Y Y 3: 3: 4 N Y Y 0
21 Y Y 6: 3: 3: 3 Y Y Y 0
22 Y Y 3 (x5) Y Y Y 1
23 Y Y 3 (x2) Y Y Y 0
24 Y Y 3 (x3) N Y Y 2
25 Y Y 1 (x5) Y Y Y 1
26 Y Y 3 (x3) Y Y Y 0
27 Y Y 3 (x5) Y Y Y 0
28 Y Y 3; 3; 4 Y Y Y 0
29 Y Y 4 (x2) Y Y Y 0
30 Y Y 3 (x3) Y Y Y 1
3.2.2 Comparative Analysis
The Specification MoS were also assessed in 2017, allowing for a direct comparison on the 25 sites where there was matching site data13. On an overall basis, Figure 3.2-2. shows that the count of sites by number of MoS passed is very similar to 2017, where most sites were meeting all or all but one of the MoS. At site level, six showed an improvement and nine fell back in the number met with 10 showing no change. The median score is slightly different from the full 2018 dataset shown above due to the removal of non-matching records.
13 Four sites in the sample (#4, #20, #27, and #29) could not be assessed on all MoS at baseline. As such the comparison sample used for the statistical analysis is 25 sites.

Department of Agriculture, Food and the Marine 13
Year 2 Analysis of Actions under GLAS
RSK ADAS Project: 1020044
The relative performance on individual MoS is shown in Figure 3.2-3 below. In general, the proportion passing each MoS is broadly similar to the baseline year though there was a slight increase in the proportion passing the location per agreement criterion (73% to 81%) and a slight decrease in the proportion passing the boxes per group criterion (85% to 73%). The occupancy MoS could not be compared year-on-year as it was a relative measure in its own right and there is no baseline value.
Figure 3.2-3: Bat Boxes. 2018 vs. 2017 Individual MoS. Paired surveys only (n as shown)
The significance of the differences between the two years was assessed by means of an exact symmetry test for paired data (Table 3.2-3). To assess the action as a whole, the pass and fail rates for Specification MoS for valid paired data were compared and values added to a contingency table matrix. There was found to be no significant difference between the pass rates in the two years. There was also no significant difference in any of the individual MoS. The underlying data for this action is already binary in nature and thus relates directly to the MoS. There is no requirement for it to be further analysed.
0 10 20 30 40 50 60 70 80 90 100
The location of the bat boxes must match the agreement(26)
Bat boxes must be located on a tree or post or externalfarm wall (26)
Between 3 - 15 boxes per group (26)
Individual bat boxes in each group must be orientated ina variety of directions (25)
Bat boxes must be made of wood or Woodcrete (25)
Bat boxes must be draught free (25)
2017 % passed 2018 % passed
0
2
4
6
8
10
12
14
0 1 2 3 4 5 6
Co
un
t o
f Si
tes
MoS met
2017 2018
0
2
4
6
8
10
12
-2 -1 0 1 2
Co
un
t o
f Si
tes
Difference in MoS met (2018 - 2017)
Figure 3.2-2: Bat Boxes. 2018 vs. 2017 Number of Specification MoS met. Median = thick border

Department of Agriculture, Food and the Marine 14
Year 2 Analysis of Actions under GLAS
RSK ADAS Project: 1020044
Table 3.2-3: Bat Boxes. 2018 vs. 2017 Number of MoS Exact Symmetry Test.
Fail 17 Fail 18
Fail 17 Pass 18
Pass 17 Fail 18
Pass 17 Pass 18
P value14
All specification MoS 4 10 12 127 0.832
The location of the bat boxes must match the agreement
3 4 2 17 0.687
Bat boxes must be located on a tree or post or external farm wall
0 1 1 24 1
Between 3 - 15 boxes per group 0 4 7 15 0.549
Individual bat boxes in each group must be orientated in a variety of directions
1 1 2 21 1
Bat boxes must be made of wood or Woodcrete 0 0 0 25 -
Bat boxes must be draught free 0 0 0 25 - 15Confirmed occupancy rate should increase from
year 1 - - - - -
14 P values that are statistically significant at the 5% level (*), 1% level (**), or 0.1% level (***) are marked accordingly. 15 Blank value means non-applicable

Department of Agriculture, Food and the Marine 15
Year 2 Analysis of Actions under GLAS
RSK ADAS Project: 1020044
3.3 Bird Boxes
The objective of the Bird Box action is to improve biodiversity in the farming landscape and replace habitats lost through changes in farming practice. The action requires landholders to install boxes to replace natural habitats for birds that have been removed through the changes in farming practice.
The action was assessed against a set of five Specification MoS that check the quality of the construction and siting of the boxes against what was set out in the scheme documentation. The action was also surveyed against a single Result MoS to assess if the confirmed occupancy (the number of boxes showing clear evidence of use by birds) had increased from the baseline year.
Sites were visited within the agreed survey window of 1 Apr – 31 Aug with the exception of three farms surveyed between 7 to 11 Sep16. Overall, the findings discussed below indicate that the high quality of implementation of the specifications noted in the baseline year was maintained in 2018. The action is yet to show the desired result in terms of increase in confirmed occupancy, but the high levels of possible occupancy noted are encouraging. Details for 2018 and the comparison with 2017 are discussed below.
3.3.1 2018 Results
As indicated in Figure 3.3-1 the agreement holders generally followed the prescriptions well. Half of the sites in the sample of 30 surveyed met all of the Specification MoS for the action, and a further 14 met all but one. However, only three of the 23 sites assessed could meet the Result MoS requirement17.
Performance on individual MoS is shown in Table 3.3-1 and on the underlying data in Table 3.3-2. Boxes were all made from the correct materials but on a couple of sites they were not draught-free. Almost all boxes were appropriately sited but on a few farms the boxes were clustered. The vast majority (77%) had located them as per the GLAS agreement. Where this was not the case, in most instances the location was still suitable.
16 Sites #7, #16, #22. This was due to logistical reasons and no impact on the results is expected from this. 17 Change in occupancy could only be assessed at 23 sites as some locations were only subject to an implementation check at baseline.
0
2
4
6
8
10
12
14
16
0 1 2 3 4 5
Co
un
t o
f Si
tes
Specification MoS met
0
5
10
15
20
25
0 1
Co
un
t o
f Si
tes
Result MoS met
Figure 3.3-1: Bird Boxes. 2018 Number of MoS met by site. Median = thick border

Department of Agriculture, Food and the Marine 16
Year 2 Analysis of Actions under GLAS
RSK ADAS Project: 1020044
Table 3.3-1: Bird Boxes. 2018 Performance on individual MoS
2018
Specification MOS Valid Surveys Total passed % passed
The location of the bird box must match the agreement 30 23 77
Bird boxes must be located on a tree or post or external farm wall 30 29 97
A maximum of one box per tree or post 30 24 80
Bird boxes must be made of wood or Woodcrete 30 30 100
Bird boxes must be draught free 30 28 93
Result MOS Valid Surveys Total passed % passed
Confirmed occupancy rate should increase from year 1 23 3 13
As shown in the site level data, four sites had confirmed occupancy (marked with an asterisk) but only three of these managed to meet the relative increase requirement. A large number of other sites (an additional 15) were deemed as having possible occupation of the box/boxes and are marked with a cross in the table. Even if only a small number of these sites were definitely occupied, a score on possible occupancy should also be considered as a good outcome.

Department of Agriculture, Food and the Marine 17
Year 2 Analysis of Actions under GLAS
RSK ADAS Project: 1020044
Table 3.3-2: Bird Boxes. 2018 Site level performance on MoS
Site Siting Location No per tree / post/ wall Wood or woodcrete Draught free Occupancy
1 Y Y 1 Y N 0
2 N Y 1 Y Y 0†
3 Y N 1 Y Y 0†
4 Y Y 1 Y Y 1*
5 Y Y 1 Y Y 0†
6 Y Y 1 Y Y 0
7 Y Y 1 Y Y 2*
8 N Y 1 Y Y 0†
9 Y Y 2 Y N 0†
10 N Y 1 Y Y 0†
11 Y Y 1 Y Y 0†
12 N Y 1 Y Y 2*
13 Y Y 1 Y Y 0†
14 Y Y 1 Y Y 0
15 Y Y 1 Y Y 0
16 Y Y 1 Y Y 0
17 Y Y 1 Y Y 0†
18 Y Y 6; 1; 1 Y Y 0
19 N Y 1 Y Y 0†
20 Y Y 1 Y Y 0
21 Y Y 7 Y Y 0
22 Y Y 1 Y Y 0†
23 N Y 1 Y Y 2*
24 Y Y 3 Y Y 0
25 Y Y 1 Y Y 0†
26 Y Y 2 Y Y 0†
27 Y Y 1 Y Y 0†
28 Y Y 1 Y Y 0†
29 Y Y 1 Y Y 0
30 N Y 1 Y Y 0
3.3.2 Comparative Analysis
The Specification MoS were also assessed in 2017, allowing for a direct comparison on the 25 sites where there was matching site data18. As per Figure 3.3-2 on an overall basis, the count of sites by number of MoS passed is very similar to 2017, where most sites were meeting all or all but one of the MoS. At site level, four showed an improvement, six fell back in the number met, and 15 showed no change. The median score is slightly different from the full 2018 dataset shown above due to the removal of non-matching records.
18 Four sites in the sample (#7, #20, #22, #27, and #29) could not be assessed on all MoS at baseline. As such the comparison sample used for the statistical analysis is 26 sites.
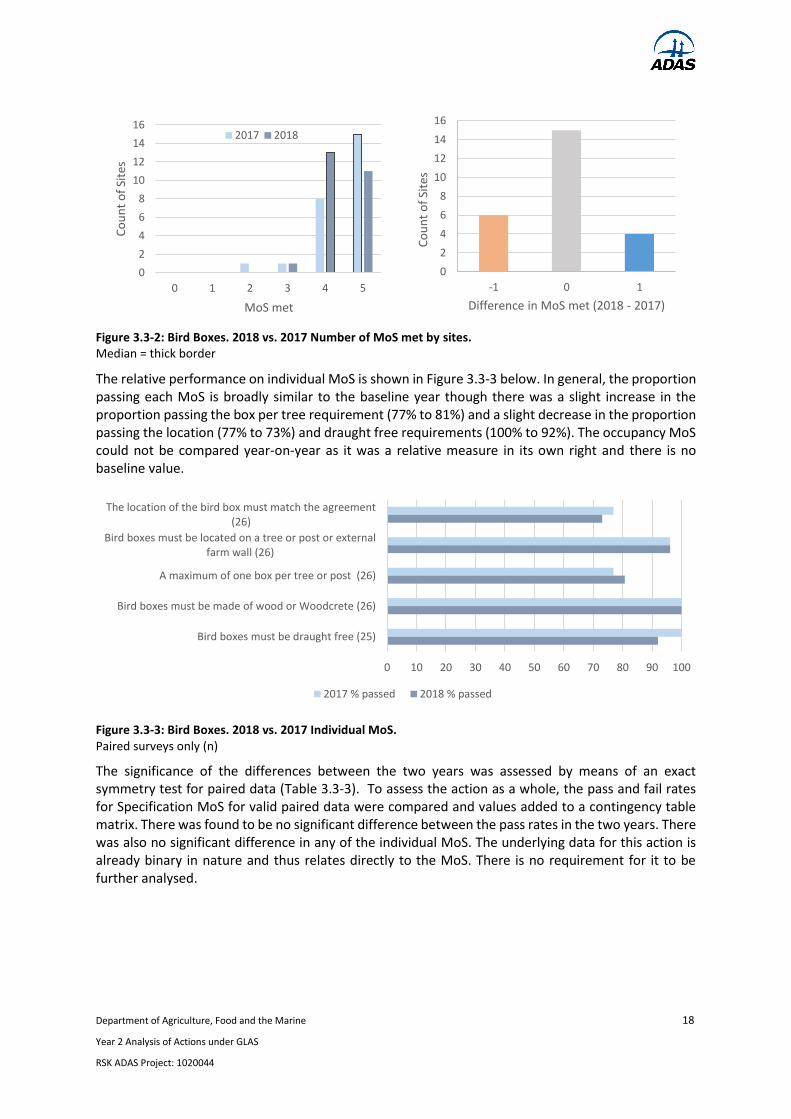
Department of Agriculture, Food and the Marine 18
Year 2 Analysis of Actions under GLAS
RSK ADAS Project: 1020044
The relative performance on individual MoS is shown in Figure 3.3-3 below. In general, the proportion passing each MoS is broadly similar to the baseline year though there was a slight increase in the proportion passing the box per tree requirement (77% to 81%) and a slight decrease in the proportion passing the location (77% to 73%) and draught free requirements (100% to 92%). The occupancy MoS could not be compared year-on-year as it was a relative measure in its own right and there is no baseline value.
Figure 3.3-3: Bird Boxes. 2018 vs. 2017 Individual MoS. Paired surveys only (n)
The significance of the differences between the two years was assessed by means of an exact symmetry test for paired data (Table 3.3-3). To assess the action as a whole, the pass and fail rates for Specification MoS for valid paired data were compared and values added to a contingency table matrix. There was found to be no significant difference between the pass rates in the two years. There was also no significant difference in any of the individual MoS. The underlying data for this action is already binary in nature and thus relates directly to the MoS. There is no requirement for it to be further analysed.
0 10 20 30 40 50 60 70 80 90 100
The location of the bird box must match the agreement(26)
Bird boxes must be located on a tree or post or externalfarm wall (26)
A maximum of one box per tree or post (26)
Bird boxes must be made of wood or Woodcrete (26)
Bird boxes must be draught free (25)
2017 % passed 2018 % passed
0
2
4
6
8
10
12
14
16
0 1 2 3 4 5
Co
un
t o
f Si
tes
MoS met
2017 2018
0
2
4
6
8
10
12
14
16
-1 0 1
Co
un
t o
f Si
tes
Difference in MoS met (2018 - 2017)
Figure 3.3-2: Bird Boxes. 2018 vs. 2017 Number of MoS met by sites. Median = thick border

Department of Agriculture, Food and the Marine 19
Year 2 Analysis of Actions under GLAS
RSK ADAS Project: 1020044
Table 3.3-3: Bird Boxes. 2018 vs. 2017 Number of MoS. Exact Symmetry Test
Fail 17 Fail 18
Fail 17 Pass 18
Pass 17 Fail 18
Pass 17 Pass 18 P value
All specification MoS 8 5 7 109 0.774
The location of the bird box must match the agreement
4 2 3 17 1
Bird boxes must be located on a tree or post or external farm wall
0 1 1 24 1
A maximum of one box per tree or post 4 2 1 19 1
Bird boxes must be made of wood or Woodcrete 0 0 0 26 -
Bird boxes must be draught free 0 0 2 23 0.5
Confirmed occupancy rate should increase from baseline
- - - - -

Department of Agriculture, Food and the Marine 20
Year 2 Analysis of Actions under GLAS
RSK ADAS Project: 1020044
3.4 Breeding Waders and Curlew
The objective of the Breeding Waders and Curlew action is to maintain and increase the breeding success of breeding waders by halting habitat loss and enhancing habitat availability and suitability.
The Breeding Waders and Curlew action was assessed against a set of three Specification MoS that reflect the need for a mosaic of short, medium and tall vegetation cover, annual control of rushes and minimal disturbance during the breeding season. The action was also assessed against an Outcome MoS that is not mentioned in the prescription. This is a test to see if landholders are managing scrub on the parcel. As with other bird actions there is also a Result MoS to check if any target birds are present.
Sites were visited during the agreed survey window of early May to early June. Overall the action continues to be successfully implemented in terms of the management of rushes and scrub as well as the avoidance of disturbance from machinery operations. The vegetation is also becoming more mosaic-like but not by enough to lead to a significant change in the MoS criterion as defined. Habitat conditions appeared to be suitable on the majority of sites visited but target birds were only present on six of these. Details for 2018 and the comparison with 2017 are discussed below.
3.4.1 2018 Results
As indicated in Figure 3.4-1 the agreement holders generally followed the prescriptions well. Nine of the sites in the sample of 30 surveyed met all the Specification MoS for the action, and a further 21 met all but one. 26 out of 30 met the scrub control Outcome MoS. However, target birds were only present on six of the 30 sites.
Performance on individual MoS is shown in Table 3.4-1 and on the underlying data in Table 3.4-3. As all the sites met the machinery operations and rush control criteria, the only differentiator between sites was the height criterion. At nine of the 30 sites, the vegetation height criteria were completely met but the majority had more limited variation.
0
5
10
15
20
25
0 1 2 3
Co
un
t o
f Si
tes
Specification MoS met
0
5
10
15
20
25
30
0 1
Co
un
t o
f Si
tes
Outcome MoS met
0
5
10
15
20
25
30
0 1
Co
un
t o
f Si
tes
Result MoS met
Figure 3.4-1: Breeding Waders. 2018 Number of MoS met by site. Median = thick border

Department of Agriculture, Food and the Marine 21
Year 2 Analysis of Actions under GLAS
RSK ADAS Project: 1020044
Table 3.4-1: Breeding Waders. 2018 Performance on individual MoS
2018
Specification MOS Valid
Surveys Total
passed %
passed
Sites meeting ALL sward height criteria 30 9 30
There should be no machinery operations between 15th March and 15th July
30 30 100
Rushes must not be cut between 15th March and 15th July. The use of a weed wiper for control of rushes is permissible.
30 30 100
Outcome MOS Valid
Surveys19 Total
passed %
passed
Scrub should not increase from baseline. 28 26 93
Result MOS Valid
Surveys Total
passed %
passed
Breeding waders present 30 6 20
Table 3.4-2 below shows the breakdown of the sward height criterion. Half of all sites managed to meet at least two criteria, and two thirds managed to meet at least three. The least commonly passed sub-criterion (57% of sites) was the need for at least 10% of the sward to be >=30cm. It is possible that this reflects to some degree the dry weather conditions in 2018 but given that other categories were only at 67% to 73% clearly this cannot be the only reason. The GLAS specification is not explicit about the heights, only that there should be a “mosaic of short, medium and tall vegetation cover”. Therefore, it is also likely that some farmers understanding of what this phrase means is different from the criteria agreed in the monitoring protocol. Site (#29) failed to meet any of the height criteria. This parcel is very much an agricultural grassland site where the landholder stated he had not seen curlew in two decades. Two other sites were also clearly improved grassland and therefore may not have been appropriate for this action (#7, #30).
Table 3.4-2: Breeding Waders. 2018 Performance on sward height MoS sub-criteria
2018
Sub-criteria for Sward Height MoS Valid Surveys Total passed % passed
At least 20% samples >= 20cm 30 22 73
At least 10% samples >= 30cm 30 17 57
At least 10% samples <= 5cm 30 20 67
At least 20% samples <= 10cm 30 20 67
Sites meeting NO sward height criteria 30 1 3
Sites meeting ONE sward height criterion 30 2 7
Sites meeting TWO sward height criteria 30 13 43
Sites meeting THREE sward height criteria 30 5 17
Sites meeting ALL sward height criteria 30 9 30
19 For two sites (#24 and #27) the scrub criterion could not be assessed in the first year due to the presence of breeding birds on the parcel.
Department of Agriculture, Food and the Marine 22
Year 2 Analysis of Actions under GLAS
RSK ADAS Project: 1020044
Most sites met the scrub criterion and regarding the two sites failing it, only the increase at site #23 appears to be very sharp (from 0 to 50%). For this site, the change in scrub cover may reflect a slightly different transect route taken in 2018 due to difficult terrain issues rather than an actual change in encroachment, so results may not be strictly comparable. The cover of scrub at site #1 is very low and the increase (from 0.5% to 1.0%) is trivial in absolute terms.
Target birds were recorded on six sites. Lapwing were present at #9 and #27; Snipe at #10, #14, #18 and #27; Redshank at #9 and #11; Curlew were also heard at site #11. At a further two sites (#13, #21), Curlew were calling nearby, and could potentially be breeding (Curlew are very difficult to pinpoint in terms of breeding location) though site #13 may be too narrow with overly high hedges. In addition, Lapwing were recorded close to a further single site (#22). A number of other sites were deemed as suitable for breeding waders, though none were recorded. These include sites #1, #2, #5, #12 and #23. Oystercatchers were also present at site #19.
All six sites which recorded target birds had wet features on at least 5% of the parcel. Of the remaining 24 sites, 19 had either no wet features or less than 5% cover of these. In the opinion of the surveyors, sites #4, #8, #15 and #16 were too dry for breeding waders.
As noted last year, whilst the overall total of sites with breeding or potentially breeding waders may be considered relatively low, this is perhaps more a reflection of the paucity of breeding waders generally in Ireland. Certainly, the habitat conditions appeared to be suitable on the majority of the sites surveyed.

Department of Agriculture, Food and the Marine 23
Year 2 Analysis of Actions under GLAS
RSK ADAS Project: 1020044
Table 3.4-3: Breeding Waders. 2018 Site level performance on underlying data
Site
% of samples where sward height…
Ma
ch. O
ps
Ru
sh cu
t
Scrub
(%)
Scrub
ba
seline
(%)
Bird
s presen
t
Wet fea
ts (%
pa
rcel)
>=20
cm
>=30
cm
<=5cm
<=10
cm
1 10.0 3.3 10.0 46.7 N N 1.0 0.5 N <5%
2 33.3 13.3 16.7 30.0 N N 0.0 0.0 N <5%
3 53.3 30.0 10.0 23.3 N N 1.0 1.5 N <5%
4 33.3 13.3 16.7 30.0 N N 3.0 5.0 N None
5 40.0 16.7 23.3 36.7 N N 1.0 1.0 N None
6 40.0 0.0 3.3 26.7 N N 0.0 0.0 N 5-50%
7 26.7 3.3 6.7 36.7 N N 0.0 0.0 N <5%
8 33.3 23.3 0.0 26.7 N N 0.0 0.0 N 5-50%
9 33.3 3.3 10.0 30.0 N N 0.0 0.0 Y 5-50%
10 66.7 16.7 0.0 10.0 N N 0.0 0.0 Y >50%
11 56.7 6.7 0.0 3.3 N N 0.0 0.0 Y 5-50%
12 50.0 13.3 10.0 16.7 N N 0.0 0.0 N <5%
13 83.3 60.0 0.0 3.3 N N 3.0 5.0 N <5%
14 43.3 36.7 33.3 46.7 N N 0.0 0.0 Y 5-50%
15 0.0 0.0 50.0 100.0 N N 0.0 0.0 N <5%
16 3.3 0.0 26.7 63.3 N N 4.0 5.0 N None
17 6.7 0.0 13.3 23.3 N N 1.0 3.0 N <5%
18 60.0 13.3 10.0 23.3 N N 0.0 0.0 Y >50%
19 0.0 0.0 100.0 100.0 N N 0.0 0.0 N None
20 90.0 80.0 3.3 6.7 N N 3.0 5.0 N <5%
21 66.7 36.7 10.0 16.7 N N 1.0 3.0 N 5-50%
22 73.3 23.3 0.0 3.3 N N 0.0 0.0 N None
23 23.3 16.7 53.3 63.3 N N 50.0 0.0 N 5-50%
24 60.0 46.7 10.0 16.7 N N 65.0 NA N 5-50%
25 26.7 23.3 43.3 60.0 N N 0.0 0.0 N <5%
26 3.3 0.0 13.3 60.0 N N 0.0 5.0 N None
27 60.0 30.0 13.3 20.0 N N 10.0 NA Y 5-50%
28 23.3 0.0 0.0 16.7 N N 0.0 0.0 N <5%
29 6.7 0.0 0.0 6.7 N N 0.0 0.0 N <5%
30 0.0 0.0 70.0 100.0 N N 0.0 0.0 N <5%
Mean 36.8 17.0 18.5 34.9 - - 4.8 1.2 - -
Median 33.0 13.0 10.0 27.0 - - 0.0 0.0 - -
Q_25 13.3 0.0 3.0 17.0 - - 0.0 0.0 - -
Q_75 59.3 23.0 21.5 47.0 - - 1.0 1.5 - -

Department of Agriculture, Food and the Marine 24
Year 2 Analysis of Actions under GLAS
RSK ADAS Project: 1020044
3.4.2 Comparative Analysis
All the Specification MoS were also assessed in 2017, allowing for a direct comparison where there was matching site data20. Figure 3.4-2 and Figure 3.4-3 show that the proportion passing in each year is very similar with only minor differences in a couple of MoS. Two sites dropped back by one MoS but four sites gained by one. 18 remained with the same score as the previous year.
Two more sites met all sward height criteria than in 2017 but two fewer sites had target birds present. Lapwing were not present on sites #14, #22 (though recorded nearby) and #28. In addition, Dunlin were not recorded at site #22 and Snipe were not present at sites #14 and #24. However, Snipe were present at site #10 and, most encouragingly, Curlew recorded close to three new sites (#11, #13 and #21). Oystercatcher was also recorded at site #19.
Figure 3.4-3: Breeding Waders. 2018 vs. 2017 Individual MoS. Paired surveys only (n as shown)
The relative performance on the height criteria is shown in Figure 3.4-4 below. The number of sites meeting the taller height criteria was lower than last year whilst the number of sites meeting the shorter height criteria was slightly higher. There was little difference in the average number of height criteria met by site.
20 Some sites could not be assessed on height or machinery operations criteria in 2017 due to presence of breeding birds. Only paired samples are compared in this section for statistical reasons.
0 10 20 30 40 50 60 70 80 90 100
Sites meeting ALL sward height criteria (26)
There should be no machinery operations between 15thMarch and 15th July (28)
Rushes must not be cut between 15th March and 15thJuly. Weed wiper permissible. (30)
Breeding waders present (30)
2017 % passed 2018 % passed
0
2
4
6
8
10
12
14
16
18
0 1 2 3
Co
un
t o
f Si
tes
Specification MoS met
2017 2018
0
5
10
15
20
-1 0 1
Co
un
t o
f Si
tes
Difference in MoS met (2018 - 2017)
Figure 3.4-2: Breeding Waders. 2018 vs. 2017 Number of MoS met by site. Median = thick border

Department of Agriculture, Food and the Marine 25
Year 2 Analysis of Actions under GLAS
RSK ADAS Project: 1020044
The significance of the differences between the two years was assessed by means of an exact symmetry test for paired data (Table 3.4-4). To assess the action as a whole, the pass and fail rates for Specification MoS for valid paired data were compared and values added to a contingency table matrix. There was found to be no significant difference between the pass rates in the two years. There was also no significant difference in any of the individual MoS nor in any of the height sub-criteria.
Table 3.4-4: Breeding Waders. 2018 vs. 2017 Number of MoS. Exact Symmetry Test
Fail 17 Fail 18
Fail 17 Pass 18
Pass 17 Fail 18
Pass 17 Pass 18 P value
All specification MoS 16 5 2 61 0.453
Sites meeting ALL sward height criteria 16 4 2 4 0.687
At least 20% samples >= 20cm 7 1 4 14 0.375
At least 10% samples >= 30cm 19 3 5 3 0.289
At least 10% samples <= 5cm 7 6 2 11 0.754
At least 20% samples <= 10cm 4 6 4 12 0.687
There should be no machinery operations between 15th March and 15th July
0 1 0 27 1
Rushes must not be cut between 15th March and 15th July. Weed wiper permissible.
0 0 0 30 -
Breeding waders present 19 3 5 3 0.727
Despite the lack of significant change in the number of MoS and height criteria met, there are some more encouraging findings if the underlying data on each height criterion are considered. The percentage of the sward meeting each height criterion is noticeably higher in 2018 than in 2017. A Wilcoxon Signed Rank test was applied to see if this change is significant. As highlighted in Table 3.4-5 below, all were significantly different at least at the 5% level, suggesting that there has been some change. The magnitude of change cannot be inferred from the test, but nonetheless the result is encouraging and suggests that the swards are become more varied even if they are not yet meeting all of the thresholds.
0
2
4
6
8
10
12
14
16
18
0 1 2 3 4
Co
un
t o
f Si
tes
Sward Height sub-criteria met
2017
2018
0
2
4
6
8
10
12
14
16
18
-2 -1 0 1 2
Co
un
t o
f Si
tes
Difference in MoS met (2018 - 2017)
Figure 3.4-4: Breeding Waders. 2018 vs. 2017. Number of sward height sub-criteria by site. Median = thick border
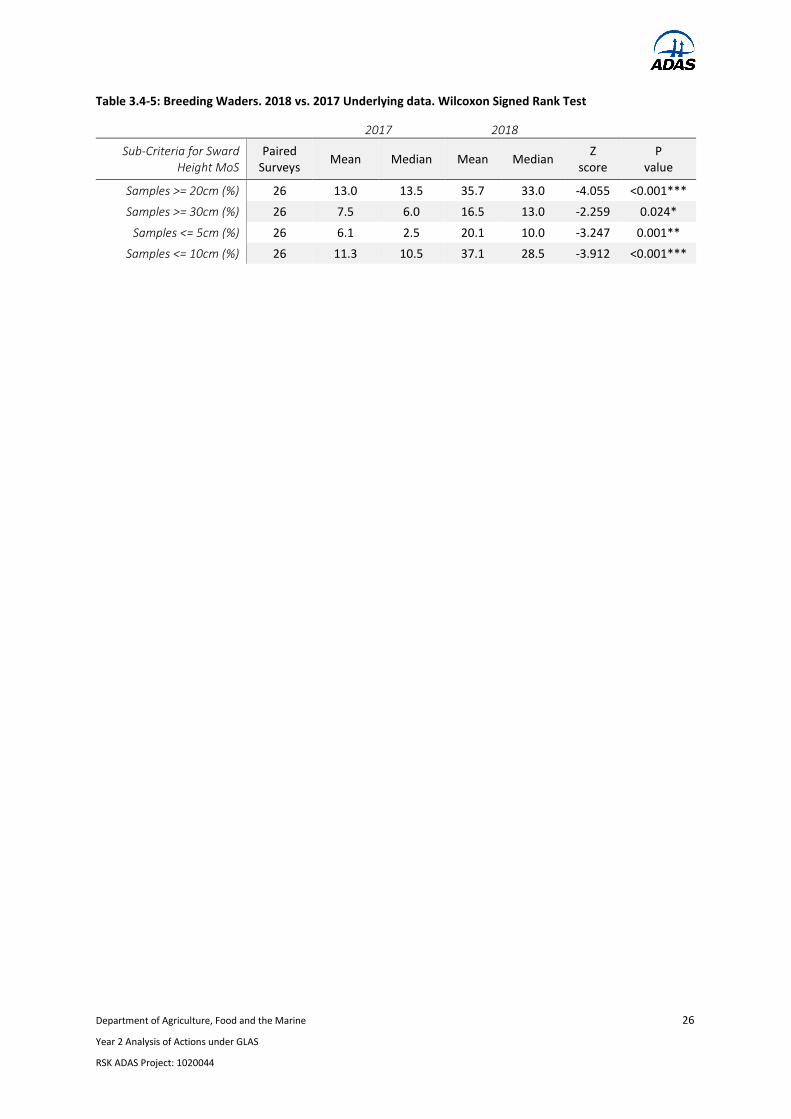
Department of Agriculture, Food and the Marine 26
Year 2 Analysis of Actions under GLAS
RSK ADAS Project: 1020044
Table 3.4-5: Breeding Waders. 2018 vs. 2017 Underlying data. Wilcoxon Signed Rank Test
2017 2018
Sub-Criteria for Sward Height MoS
Paired Surveys
Mean Median Mean Median Z
score P
value
Samples >= 20cm (%) 26 13.0 13.5 35.7 33.0 -4.055 <0.001***
Samples >= 30cm (%) 26 7.5 6.0 16.5 13.0 -2.259 0.024*
Samples <= 5cm (%) 26 6.1 2.5 20.1 10.0 -3.247 0.001**
Samples <= 10cm (%) 26 11.3 10.5 37.1 28.5 -3.912 <0.001***

Department of Agriculture, Food and the Marine 27
Year 2 Analysis of Actions under GLAS
RSK ADAS Project: 1020044
3.5 Chough
The objective of the action is to maintain and enhance habitat areas for Chough and increase numbers of breeding Chough in targeted areas. Landholders in the action are required to produce and maintain a tightly grazed short sward that provides optimal conditions for Chough to access their prey.
The Chough action was assessed against a set of four Specification MoS that reflected the need for a short sward with scrub and bracken cover kept low and under control. The action was also assessed against an Outcome MoS that is not mentioned in the prescription. This stresses the need for a grass and herb dominated sward. As with other bird actions there is also a Result MoS to check if any target birds are present.
Sites were visited during the agreed survey window of 1 Apr – 31 May. The action continues to perform reasonably well against the MoS. The swards are slightly shorter and there have also been slight increases in the number of sites passing individual MoS including the number of sites with Chough. However, the changes are not statistically significant. Details for 2018 and the comparison with 2017 are discussed below.
3.5.1 2018 Results
As indicated in Figure 3.5-1, the extent to which the specification was met was rather mixed. Over a third of the sites visited met all the Specification MoS. The remaining sites generally failed on one or more of the height criteria or the scrub change MoS. Two thirds of sites met the grass and herb cover Outcome MoS. Chough were present on five of the 30 sites.
Performance on individual MoS is shown in Table 3.5-1 and on the underlying data in Table 3.5-2. Half the sites had a sward that was shorter than 7cm on average and most (70%) had sufficient very short (<= 4cm) patches. Mention should be made that the specification is not specific about the exact height of the sward, only that it should be “tightly grazed” and “short”. So, it is possible that some farmers understanding of what this phrase means is different from the criteria agreed in the monitoring protocol. Indeed, five parcels are above 7cm but below 10cm on average, and four have at least 10% of very short (<= 4cm) cover.
Almost all sites had suitable levels of scrub or bracken but only two thirds had kept it at the same level. In six of these cases where there has been an increase in scrub, this is quite small (sites #3, #4, #7, #8, #21, #22) and overall levels of scrub are well below the 20% threshold, but the increase in cover at sites #19, #24, #25 and #30 is quite dramatic.
0
5
10
15
20
25
0 1
Co
un
t o
f Si
tes
Outcome MoS met
0
5
10
15
20
25
30
0 1
Co
un
t o
f Si
tes
Result MoS met
0
2
4
6
8
10
12
14
0 1 2 3 4
Co
un
t o
f Si
tes
Specification MoS met
Figure 3.5-1: Chough. 2018 Number of MoS met by site. Median = thick border

Department of Agriculture, Food and the Marine 28
Year 2 Analysis of Actions under GLAS
RSK ADAS Project: 1020044
Table 3.5-1: Chough. 2018 Performance on individual MoS
2018
Specification MOS Valid
Surveys Total
passed %
passed
On average, sward no taller than 7cm 30 15 50
At least 20% of the sward 4cm or less 30 21 70
Combined cover of scrub/bracken should not increase from baseline year 30 20 67
Individual site should not contain more than 20% of scrub/bracken 30 29 97
Outcome MOS Valid
Surveys Total
passed %
passed
At least 80% of the sample points to be grasses or herbs 30 20 67
Result MOS Valid
Surveys Total
passed %
passed
Chough present 30 5 17
Not surprisingly the sites failing on the grass / herb cover MoS also generally failed one or other of the scrub / bracken MoS. Some sites though are not showing sufficient grass or herbs due to high rush cover (e.g. sites #7 - #10 and #20). These would be too tussocky for Chough at present, though some landholders have taken steps to address this issue.
The five sites on which Chough were found (#11, #15, #17, #18, and #19) were also in the top six sites ranked by shortness of average sward. However, care should be taken in interpreting this observation as the survey is only a snapshot from a single visit, and this was not the case in the 2017 survey.
Beyond these five, some other parcels were also clearly suitable for Chough. However, a good number of parcels selected for this action (#3, #4, #5, #6, #8, #20, #22, #24, #28) are in known ranges for the bird, but contain areas of high botanical biodiversity value (e.g. acid grassland, wet grassland, dry heath) which may not align with the requirements of the Chough prescription. Consideration could be given as to whether these parcels should be managed accordingly, and perhaps identify other parts of the site that are more suited to Chough.

Department of Agriculture, Food and the Marine 29
Year 2 Analysis of Actions under GLAS
RSK ADAS Project: 1020044
Table 3.5-2: Chough. 2018 Site level performance on underlying data
Site Av sward
height (cm) % of sward
<=4cm Cover scrub / bracken (%)
Baseline scrub / bracken (%)
Quadrats grasses/herbs
(%) Chough Present
1 4.9 50.0 0.0 0.0 100.0 N
2 6.6 20.0 0.0 0.0 90.0 N
3 17.8 0.0 5.0 0.0 60.0 N
4 16.7 0.0 1.0 0.0 40.0 N
5 11 10.0 0.0 0.0 90.0 N
6 10.1 30.0 15.0 19.0 80.0 N
7 19.5 50.0 1.0 0.0 40.0 N
8 11.5 50.0 2.0 0.0 70.0 N
9 4.2 80.0 0.0 0.0 30.0 N
10 9.9 70.0 0.0 0.0 80.0 N
11 3.2 80.0 0.0 0.0 100.0 Y
12 5.2 60.0 0.0 0.0 100.0 N
13 3.3 70.0 0.0 0.0 100.0 N
14 3.8 70.0 0.0 0.0 60.0 N
15 2.9 90.0 0.0 0.0 80.0 Y
16 15.5 10.0 10.0 15.0 10.0 N
17 3.2 70.0 0.0 0.0 100.0 Y
18 1.3 100.0 0.0 0.0 100.0 Y
19 2.2 90.0 15.0 0.2 70.0 Y
20 9.1 0.0 15.0 16.3 60.0 N
21 8 10.0 5.0 0.6 100.0 N
22 9.9 0.0 2.0 0.2 100.0 N
23 12.9 10.0 0.0 0.0 100.0 N
24 11 30.0 20.0 5.0 90.0 N
25 5.2 20.0 30.0 0.0 100.0 N
26 14.3 0.0 0.0 0.0 100.0 N
27 4.6 20.0 0.0 0.0 100.0 N
28 4.7 50.0 0.0 2.0 100.0 N
29 7.9 30.0 0.0 0.0 100.0 N
30 3.1 80.0 15.0 0.0 70.0 N
Mean 8.1 41.7 80.7 4.5 1.9 N
Median 7.3 40.0 90.0 0.0 0.0 N
Q_25 3.9 10.0 70.0 0.0 0.0 N
Q_75 11.0 70.0 100.0 5.0 0.0 N

Department of Agriculture, Food and the Marine 30
Year 2 Analysis of Actions under GLAS
RSK ADAS Project: 1020044
3.5.2 Comparative Analysis
Three of the Specification MoS were also assessed in 2017, allowing for a direct comparison where there was matching site data21. As per Figure 3.5-2 the proportion passing in each year is similar with a small positive shift in number of MoS passed. The bulk of sites (21) remained the same, with seven sites showing a net positive change and two a net negative. The Outcome and Result MoS change is one MoS only so is shown further below in Figure 3.5-3.
Six more sites met the 4cm criterion than in 2017 and two more sites had Chough present. An additional site failed on the 20% scrub/bracken criterion. There is no change in the proportion of sites meeting the grass/herb criterion. The three sites which Chough were present on last year are not in the five that had the birds this year.
Figure 3.5-3: Chough 2018 vs. 2017 Individual MoS. Paired surveys only (n = 30)
The significance of the differences between the two years was assessed by means of an exact symmetry test for paired data (Table 3.5-3). To assess the action as a whole, the pass and fail rates for Specification MoS for valid paired data were compared and values added to a contingency table
21 Some sites could not be assessed on height or machinery operations criteria in 2017 due to presence of breeding birds. Only paired samples are compared in this section for statistical reasons.
0 10 20 30 40 50 60 70 80 90 100
On average, sward no taller than 7cm
At least 20% of the sward 4cm or less
Individual site should not contain more than 20% ofscrub/bracken
At least 80% of the sample points to be grasses or herbs
Chough present
2017 % passed 2018 % passed
Figure 3.5-2: Chough. 2018 vs. 2017. Number of MoS met by site. Median = thick border
0
2
4
6
8
10
12
14
16
0 1 2 3
Co
un
t o
f Si
tes
Specification MoS met
2017 2018
0
5
10
15
20
25
-2 -1 0 1 2C
ou
nt
of
Site
s
Difference in MoS met (2018 - 2017)

Department of Agriculture, Food and the Marine 31
Year 2 Analysis of Actions under GLAS
RSK ADAS Project: 1020044
matrix. There was found to be no significant difference between the pass rates in the two years. There was also no significant difference in any of the individual MoS.
Table 3.5-3: Chough. 2018 vs. 2017. Number of MoS. Exact Symmetry Test
Fail 17 Fail 18
Fail 17 Pass 18
Pass 17 Fail 18
Pass 17 Pass 18 P value
All specification MoS 23 7 5 55 0.774
On average, sward no taller than 7cm 13 2 2 13 1
At least 20% of the sward 4cm or less 8 7 1 14 0.070
Combined cover of scrub/bracken should not increase from baseline year
- - - - -
Individual site should not contain more than 20% of scrub/bracken
0 0 1 29 1
At least 80% of the sample points to be grasses or herbs
7 3 3 17 1
Chough present 22 5 3 0 0.727
At underlying data level (Table 3.5-4) there is not that much difference in the scores for the key variables with the exception of the median proportion of the sward height that is below 4cm. This has increased noticeably from 15% to 40%. Last year there were a large number (12 sites) that had no very short sward cover at all. This year, that number has dropped to five only. Whether this reflects an improvement in the grazing regime used or is an artefact of the very dry weather conditions is not certain. However, a Wilcoxon Signed Rank test shows that any difference between the 2017 and 2018 data for any of the underlying variables considered is not significant, even for the proportion of the sward below 4cm.
Table 3.5-4: Chough. 2018 vs. 2017. Underlying data. Wilcoxon Signed Rank Test
2017 2018 Wilcoxon Signed Rank
Variable Paired
surveys Mean Median Mean Median Z score P value
Average sward height (cm) 30 8.6 7.1 8.1 7.3 0.905 0.365
Sward height below 4cm (%) 30 34.3 15.0 41.7 40.0 -1.744 0.081
Scrub / Bracken cover (%) 30 76.3 100.0 80.7 90.0 -0.917 0.359
Grass / Herb cover (%) 30 1.9 0.0 1.9 0.0 -1.716 0.086

Department of Agriculture, Food and the Marine 32
Year 2 Analysis of Actions under GLAS
RSK ADAS Project: 1020044
3.6 Conservation of Solitary Bees (Boxes)
The objective of the Bee Box action is to improve biodiversity in the farming landscape and replace habitats lost through changes in farming practice. Solitary bees are useful in the pollination of crops as well as having wider biodiversity benefits. The action requires landholders to install boxes to provide nesting locations for solitary bees.
The action was assessed against a set of five Specification MoS that check the quality of the construction and siting of the boxes against what was set out in the scheme documentation. The action was also surveyed against a single Result MoS to assess if the confirmed occupancy (the number of boxes showing clear evidence of use by solitary bees) had increased from the baseline year.
Sites were visited during the agreed survey window of 1 Apr – 30 Nov. Overall, the findings discussed below indicate that the high quality of implementation of the specifications noted in the baseline year was maintained in 2018. The action is yet to show the desired result in terms of increase in confirmed occupancy, but the high levels of possible occupancy noted are encouraging. Details for 2018 and the comparison with 2017 are discussed below.
3.6.1 2018 Results
As indicated in Figure 3.6-1 the agreement holders generally followed the prescriptions well. 17 of the sites in the sample of 30 surveyed met all of the Specification MoS for the action, and a further eight met all but one. However, no sites could meet the Result MoS requirement.
Performance on individual MoS is shown in Table 3.6-1 and on the underlying data in Table 3.6-2. Siting was very good in terms of positioning (on post or tree) and number (one per location) with only a few sites failing to meet the requirements. The vast majority of boxes were also not at risk from stock. However, the location of boxes on the farm did not match the agreement document in 30% of cases. Four sites had issues with weather damage (#2, #6, #9, #23), whilst others had inappropriately designed holes that would be unlikely to be suitable for solitary bees (#9, #21, #30). Some may have been located in overly shady locations (#6, #9, #12, and #16). There were no issues with draughtiness, notwithstanding those boxes which had fallen down.
0
2
4
6
8
10
12
14
16
18
0 1 2 3 4 5
Co
un
t o
f Si
tes
Specification MoS met
0
5
10
15
20
25
30
0 1
Co
un
t o
f Si
tes
Result MoS met
Figure 3.6-1: Bee Boxes. 2018 Number of MoS met by site. Median = thick border

Department of Agriculture, Food and the Marine 33
Year 2 Analysis of Actions under GLAS
RSK ADAS Project: 1020044
Table 3.6-1: Bee Boxes. 2018 Performance on individual MoS
2018
Specification MOS Valid Surveys Total passed % passed
The location of the bee box must match the agreement 30 21 70
Bee boxes must be located on a tree or post 30 27 90
One box per tree or post 30 29 97
Bee boxes must be protected from or out of reach of livestock 30 25 83
Bee boxes must be made of timber 30 29 97
Result MOS Valid Surveys Total passed % passed
Confirmed occupancy rate should increase from year 1 30 0 0
Four sites had confirmed occupancy (#4, #14, #24 and #28) but no site managed to demonstrate an improvement. This most likely reflects extraneous factors beyond the Specification MoS. Site #28 showed the same occupancy level as the baseline year, which is at least encouraging.
Table 3.6-2: Bee Boxes. 2018 Site level performance on underlying data
Site Siting Location No. per tree / post Out of reach of livestock Made of timber Occupancy
1 N Y 1 Y Y 0
2 Y N 1 Y Y 0
3 Y Y 1 Y Y 0
4 N Y 1 Y Y 2
5 N Y 1 Y Y 0
6 Y Y 1 Y Y 0
7 N Y 1 Y Y 0
8 N N 1 Y Y 0
9 N N 1 N Y 0
10 N Y 1 N Y 0
11 N Y 1 Y Y 0
12 Y Y 1 Y Y 0
13 Y Y 3; 2 N Y 0
14 Y Y 1 Y Y 2
15 Y Y 1 Y Y 0
16 Y Y 1 Y Y 0
17 Y Y 1 Y Y 0
18 Y Y 1 Y Y 0
19 Y Y 1 Y Y 0
20 Y Y 1 Y Y 0
21 N Y 1 Y Y 0
22 Y Y 1 Y Y 0
23 Y Y 1 N N 0
24 Y Y 1 Y Y 3
25 Y Y 1 Y Y 0
26 Y Y 1 Y Y 0
27 Y Y 1 Y Y 0
28 Y Y 1 Y Y 2
29 Y Y 1 N Y 0
30 Y Y 1 Y Y 0

Department of Agriculture, Food and the Marine 34
Year 2 Analysis of Actions under GLAS
RSK ADAS Project: 1020044
3.6.2 Comparative Analysis
The Specification MoS were also assessed in 2017, allowing for a direct comparison where there was matching site data22. This is shown in Figure 3.6-2 below. The proportion passing at in each year is very similar with only minor differences in a couple of MoS where there are slight improvements. Five sites gained in their score whilst four fell back by one.
The relative performance on individual MoS is shown in Figure 3.6-3 below. In general, the proportion passing each MoS is very similar to the baseline year though there was a very slight increase in the proportion passing (each MoS gained by one site) with the exception of the timber requirement which was already 100% met. The occupancy MoS could not be compared year-on-year as it was a relative measure in its own right and there is no baseline value.
Figure 3.6-3: Bee Boxes. 2018 vs. 2017 Individual MoS. Paired surveys only (n = 19)
The significance of the differences between the two years was assessed by means of an exact symmetry test for paired data (Table 3.6-3). To assess the action as a whole, the pass and fail rates for Specification MoS for valid paired data were compared and values added to a contingency table matrix. There was found to be no significant difference between the pass rates in the two years. There
22 The action was only due to have an implementation check carried out in 2017. However, as surveyors were physically present to assess other actions on 19 of these, they were able to gather siting and construction data which can be used in the comparative analysis.
0 10 20 30 40 50 60 70 80 90 100
The location of the bee box must match the agreement
Bee boxes must be located on a tree or post
One box per tree or post
Bee boxes must be protected from livestock or out ofreach of livestock
Bee boxes must be made of timber
2017 % passed 2018 % passed
0
2
4
6
8
10
12
0 1 2 3 4 5
Co
un
t o
f Si
tes
MoS met
2017 2018
0
2
4
6
8
10
12
-1 0 1 2
Co
un
t o
f Si
tes
Difference in MoS met (2018 - 2017)
Figure 3.6-2: Bee Boxes. 2018 vs. 2017. Number of MoS met by sites. Median = thick border

Department of Agriculture, Food and the Marine 35
Year 2 Analysis of Actions under GLAS
RSK ADAS Project: 1020044
was also no significant difference in any of the individual MoS. The underlying data for this action is already binary in nature and thus relates directly to the MoS. There is no requirement for it to be further analysed.
Table 3.6-3: Bee Boxes. 2018 vs. 2017 Number of MoS. Exact Symmetry Test
Fail 17 Fail 18
Fail 17 Pass 18
Pass 17 Fail 18
Pass 17 Pass 18 P value
All specification MoS 5 8 4 80 0.388
The location of the bee box must match the agreement
2 5 4 9 1
Bee boxes must be located on a tree or post 1 1 0 18 1
One box per tree or post 1 1 0 17 1
Bee boxes must be protected from or out of reach of livestock
1 1 0 17 1
Bee boxes must be made of timber 0 0 0 19 -
Confirmed occupancy rate should increase from baseline
- - - - -

Department of Agriculture, Food and the Marine 36
Year 2 Analysis of Actions under GLAS
RSK ADAS Project: 1020044
3.7 Conservation of Solitary Bees (Sand)
The objective of the Bee Sand action is to improve biodiversity in the farming landscape and replace habitats lost through changes in farming practice. Solitary bees are useful in the pollination of crops as well as having wider biodiversity benefits. The action requires landholders to install sand piles in field corners to provide nesting locations for solitary bees.
The action requirement specifies that sites should be strimmed to keep shading vegetation under control. This is assessed against four Specification MoS that check the level of vegetation cover, the proportion of bare ground, the amount of litter, and the extent to which the pile is in a sunny location. The action is also assessed against a single Result MoS to check if the confirmed occupancy (the number of piles showing clear evidence of use by solitary bees) had increased. As the action was only subject to an implementation check at baseline, the Result MoS can only be verified at the 2020 survey.
Sites were visited during the agree survey window of 1 Apr – 30 Nov. Overall, the findings discussed below indicate that most piles were appropriately located, but that the aftercare was somewhat lacking. The majority of piles have too much encroaching vegetation and a few sites have issues with litter. Only one site had confirmed occupancy but some of the better managed sites showed signs of potential occupancy. Details for 2018 are discussed below.
3.7.1 2018 Results
Seven of the 29 sites surveyed23 achieved all four of these and a further 10 managed to achieve all but one. However, there were still seven sites which only managed two MoS and five which could only achieve one of the requirements (see Figure 3.7-1).
Figure 3.7-1: Bee Sand. 2018 Number of MoS met by site. Median = thick border
Performance on individual MoS is shown in Table 3.7-1 and on the underlying data in Table 3.7-2. Although the exact thresholds are not indicated in the specification, the vast majority of sites (86%) met the requirements for location in a sunny place and most also met the criteria for lack of litter cover (76%) and availability of bare ground (79%). There were a couple of instances where the execution of the action had resulted in a sand pile form that was too flat to be attractive to solitary bees, though this was not specified as a requirement in the action documentation. The only real issue with the implementation of this action is the ongoing management of vegetation. The majority of sites (76%) had failed to keep their piles clear of excess vegetation, eight of which had more than half the
23 Data could only be collected at 29 of the 30 sites visited as the sand piles at one site (#25) were not present. The landholder stated they had been inadvertently cleared.
0
2
4
6
8
10
12
0 1 2 3 4
Co
un
t o
f Si
tes
Specification MoS met

Department of Agriculture, Food and the Marine 37
Year 2 Analysis of Actions under GLAS
RSK ADAS Project: 1020044
pile under cover (#1, #10, #11, #13, #17, #19, #23, and #29). In two other cases (#4 and #7) the second pile could not even be located, probably due to vegetation cover. In a couple of instances (#27 and #28) there was evidence that the vegetation had been treated with herbicide, contrary to the management requirements of the action.
Table 3.7-1: Bee Sand. 2018. Performance on individual MoS
2018
Specification MOS Valid Surveys Total passed % passed
Cover of grasses and forbs should be < 20% 29 7 24
Bare ground/sand should be > 40% 29 23 79
Litter should be < 10% 29 22 76
Should be ideally Mostly in sun, and at least Partly in sun 29 25 86
Result MOS Valid Surveys Total passed % passed
Confirmed occupancy rate should increase - - -
Site (#28) showed confirmed signs of occupancy. There were also signs of possible occupancy (holes in the sand) at a further 10 sites, most of which were those with acceptable levels of vegetation and all of which had sufficient bare ground cover.
Although only 24% of sites met the grass / forb cover criterion, analysis of the median and 25% quantile suggests that there are a further quarter of sites with vegetation cover only 5% above the threshold (20%) to meet the MoS. A few sites are also quite close to the thresholds for bare ground / sand and litter. Therefore, it would not require much change in management to achieve an improvement in the quality of the piles between now and the final year. However, as the thresholds used in the evaluation are not explicit in the specification there is not necessarily any expectation that this will happen.

Department of Agriculture, Food and the Marine 38
Year 2 Analysis of Actions under GLAS
RSK ADAS Project: 1020044
Table 3.7-2: Bee Sand. 2018 Site level performance on underlying data
Site Forb / Grass (%) Bare Ground / Sand (%) Litter (%) In Sun? Occupancy
1 95.0 5.0 0.0 Mostly; 0
2 25.0 65.0 10.0 Partly; Mostly 0
3 40.0 60.0 0.0 Mostly; 0
4 20.0 80.0 3.0 Mostly; 0
5 35.0 65.0 0.0 Mostly; 0
6 45.0 55.0 0.0 Mostly; Mostly 0
7 20.0 79.0 1.0 Mostly; 0
8 10.0 90.0 1.0 Partly; 0
9 12.5 90.0 5.0 Mostly; Mostly 0
10 92.5 7.5 10.0 Partly; Partly 0
11 80.0 27.5 5.0 Mostly; Mostly 0
12 15.0 85.0 0.0 Mostly; 0
13 57.5 42.5 0.0 Mostly; Partly 0
14 20.0 60.0 10.0 Partly; Little 0
15 10.0 90.0 5.0 Mostly; 0
16 30.0 70.0 0.0 Mostly; 0
17 50.0 50.0 0.0 Little; 0
18 20.0 30.0 50.0 Mostly; 0
19 50.0 50.0 0.0 Partly; 0
20 8.5 88.0 3.5 Mostly; Mostly 0
21 20.0 80.0 3.0 Mostly; Mostly 0
22 25.0 75.0 1.0 Mostly; 0
23 62.5 32.5 5.0 Little; Little 0
24 7.5 92.5 0.0 Mostly; Mostly 0
25 - - - - -
26 35.0 65.0 10.0 Mostly; 0
27 10.0 90.0 0.0 Mostly; Mostly 0
28 20.5 45.0 37.5 Partly; Partly 1
29 60.0 35.0 7.5 Mostly; Mostly 0
30 35.0 47.5 17.5 Partly; Little 0
Mean 34.9 60.4 6.4 - 0
Median 25.0 65.0 3.0 - 0
Q_25 20.0 45.0 0.0 - 0
Q_75 50.0 80.0 7.5 - 0
3.7.2 Comparative Analysis
The Bee Sand action was subject to an implementation check only in 2017 so no comparative analysis is possible.

Department of Agriculture, Food and the Marine 39
Year 2 Analysis of Actions under GLAS
RSK ADAS Project: 1020044
3.8 Commonages
The objective of the action is to ensure that commonage lands are appropriately grazed and managed to ensure they remain in good agricultural and environmental condition (GAEC) and are compliant with eligibility criteria.
The specification of the Commonages action is linked to a bespoke Commonage Management Plan (CMP) that is prepared for each commonage in the scheme. The action has therefore only been assessed against a set of Outcome MoS that reflect what type of habitat might be expected if a suitable grazing and management regime were applied. These include checks that: the sward height is neither too short nor too uniform but also that scrub and bracken are kept under control; there is negligible bare peat and that graziers are not creating new ditches; the soil shows no sign of nutrient enrichment; that the diversity of habitats seen on each commonage is not in decline, and; that sufficient positive indicator species24 are present for each of the habitats identified as present.
Sites were visited during the agreed survey window of 1 Apr – 31 Sep. The survey was somewhat compromised by challenging weather conditions. Poor visibility on some days25 meant that surveyors found it impractical or unsafe to follow the same transect route as 2017, especially over challenging parts of the terrain. The implications of this are discussed below. Overall, MoS which are more directly linked to a Commonage management regime (sward height, scrub cover, undesirable species, and maintained ditches) continue to be delivered with a few exceptions. Soils also show no sign of nutrient enrichment whilst bare peat is only a concern at a couple of the sites. However, requirements for positive habitat indicators and habitat diversity were generally not met. These may simply reflect survey artefacts but could also be related to localised management issues.
3.8.1 2018 Results
As shown in Figure 3.8-1 on average, six out of nine MoS were met on a given site and only one site of the 10 surveyed met fewer than half the MoS set out. One site met all of the MoS.
Figure 3.8-1: Commonages. 2018 Number of MoS met by sites. Median = thick border
Performance on individual MoS is shown in Table 3.8-1 and on the underlying data in Table 3.8-3. Six of the 10 sites have managed to maintain bracken and scrub at or below the previous year’s levels. The increase at sites #3 and #4 is trivial, but the change at sites #1 and #9 is more noticeable. In the case of site #9, the transect route could have been a factor. Otherwise, sites were also generally
24 ‘Frequent’ and ‘Occasional’ are judged according to a modified ‘Domin’ scale where Frequent means present at 41 – 100% of stops and Occasional means present at 21 – 40% of stops. 25 This affected the surveys for sites #2, #4, #9 and #10.
0
1
2
3
4
5
0 1 2 3 4 5 6 7 8 9
Co
un
t o
f Si
tes
Outcome MoS met
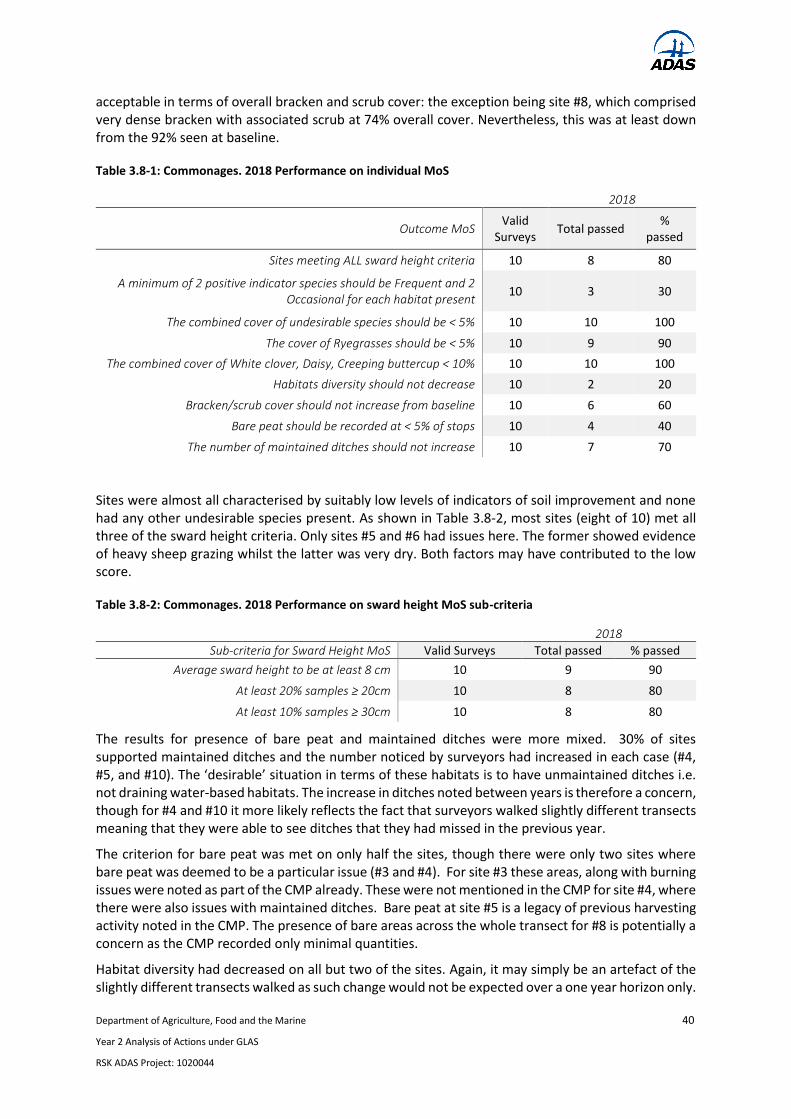
Department of Agriculture, Food and the Marine 40
Year 2 Analysis of Actions under GLAS
RSK ADAS Project: 1020044
acceptable in terms of overall bracken and scrub cover: the exception being site #8, which comprised very dense bracken with associated scrub at 74% overall cover. Nevertheless, this was at least down from the 92% seen at baseline.
Table 3.8-1: Commonages. 2018 Performance on individual MoS
2018
Outcome MoS Valid
Surveys Total passed
% passed
Sites meeting ALL sward height criteria 10 8 80
A minimum of 2 positive indicator species should be Frequent and 2 Occasional for each habitat present
10 3 30
The combined cover of undesirable species should be < 5% 10 10 100
The cover of Ryegrasses should be < 5% 10 9 90
The combined cover of White clover, Daisy, Creeping buttercup < 10% 10 10 100
Habitats diversity should not decrease 10 2 20
Bracken/scrub cover should not increase from baseline 10 6 60
Bare peat should be recorded at < 5% of stops 10 4 40
The number of maintained ditches should not increase 10 7 70
Sites were almost all characterised by suitably low levels of indicators of soil improvement and none had any other undesirable species present. As shown in Table 3.8-2, most sites (eight of 10) met all three of the sward height criteria. Only sites #5 and #6 had issues here. The former showed evidence of heavy sheep grazing whilst the latter was very dry. Both factors may have contributed to the low score.
Table 3.8-2: Commonages. 2018 Performance on sward height MoS sub-criteria
2018 Sub-criteria for Sward Height MoS Valid Surveys Total passed % passed
Average sward height to be at least 8 cm 10 9 90
At least 20% samples ≥ 20cm 10 8 80
At least 10% samples ≥ 30cm 10 8 80
The results for presence of bare peat and maintained ditches were more mixed. 30% of sites supported maintained ditches and the number noticed by surveyors had increased in each case (#4, #5, and #10). The ‘desirable’ situation in terms of these habitats is to have unmaintained ditches i.e. not draining water-based habitats. The increase in ditches noted between years is therefore a concern, though for #4 and #10 it more likely reflects the fact that surveyors walked slightly different transects meaning that they were able to see ditches that they had missed in the previous year.
The criterion for bare peat was met on only half the sites, though there were only two sites where bare peat was deemed to be a particular issue (#3 and #4). For site #3 these areas, along with burning issues were noted as part of the CMP already. These were not mentioned in the CMP for site #4, where there were also issues with maintained ditches. Bare peat at site #5 is a legacy of previous harvesting activity noted in the CMP. The presence of bare areas across the whole transect for #8 is potentially a concern as the CMP recorded only minimal quantities.
Habitat diversity had decreased on all but two of the sites. Again, it may simply be an artefact of the slightly different transects walked as such change would not be expected over a one year horizon only.

Department of Agriculture, Food and the Marine 41
Year 2 Analysis of Actions under GLAS
RSK ADAS Project: 1020044
Plant species diversity was measured in terms of the number of positive indicator species at frequent or occasional in the quadrats taken, but only met the requirement at three of the ten sites (#2, #4 and #7). The sites that failed to meet this MoS also had issues with sward height, scrub / bracken cover, or soil improvement thus emphasising the need for an appropriate grazing regime.
Table 3.8-3: Commonages. 2018 Site level performance on underlying data
Site
% Sw
ard
% ≥ 2
0cm
% Sw
ard
% ≥ 3
0cm
Swa
rd m
ean
(cm)
Po
sitive ind
icato
r
species freq
uen
cies
Ha
bita
t types
Un
desira
bles co
ver. (%)
Ryeg
rasses co
ver (%)
Wh
ite clover etc. co
ver (%
)
Bra
cken / scru
b co
ver
(%)
Ba
re pea
t cover (%
)
Ma
inta
ined
ditch
es
(nu
mb
er)
1 75.0 35.0 29.5 Dry Heath 1F 2O 1R;
Wet Heath 6F 1O 3 0 0 0 35.3 0 0
2 65.0 35.0 25.2 Bog 5F 3O 6R 3 0 0 0 0 15.0 0
3 90.0 80.0 33.8 Wet Heath 8F; Dry
Heath 3F 2 0 0 0 0.5 20.0 0
4 55.0 20.0 22.3 Bog 4F 4R 1 0 0 0 2.0 15.0 9.0
5 0.0 0.0 7.9 Acid Grass. 1F 1R; Dry
Heath 2F 1O; Wet Heath 3O 1R; Bog 1F
3 0 0 0.3 0 35.0 2.0
6 10.0 5.0 13.1 Marshy Grass. 1O 2R 1 0.4 11.4 1.2 0 0 0
7 85.0 70.0 40.0 Marshy Grass. 5F 3O 8R 5 0 0 0 0 0 0
8 95.0 85.0 62.3 - 1 0 0 0 74.0 100 0
9 90.0 90.0 47.2 Dry Heath 2F 1O 1 0 0 0.2 23.2 0 0
10 90.0 60.0 36.3 Dry Heath 1F 1O 1R,
Wet Heath 3F 1R, Acid Grass. 1F 1R, Bog 1F
3 0 0 0 0 35 8.0
Mean 65.5 48.0 31.7 - 2.3 0 1.1 0.2 13.5 22.0 1.9
Median 80.0 47.5 31.6 - 2.5 0 0.0 0.0 0.3 15.0 0.0
Q_25 57.5 23.8 23.0 - 1.0 0 0.0 0.0 0.0 0.0 0.0
Q_75 90.0 77.5 39.0 - 3.0 0 0.0 0.2 17.9 31.3 1.5
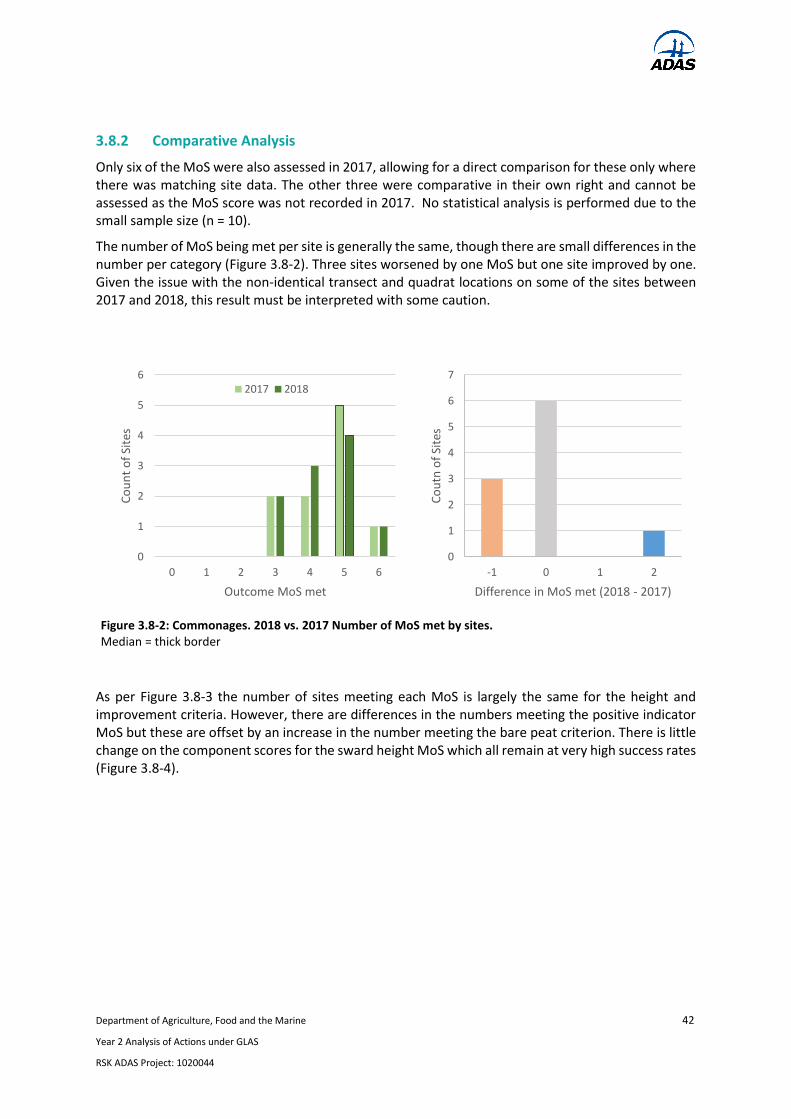
Department of Agriculture, Food and the Marine 42
Year 2 Analysis of Actions under GLAS
RSK ADAS Project: 1020044
3.8.2 Comparative Analysis
Only six of the MoS were also assessed in 2017, allowing for a direct comparison for these only where there was matching site data. The other three were comparative in their own right and cannot be assessed as the MoS score was not recorded in 2017. No statistical analysis is performed due to the small sample size (n = 10).
The number of MoS being met per site is generally the same, though there are small differences in the number per category (Figure 3.8-2). Three sites worsened by one MoS but one site improved by one. Given the issue with the non-identical transect and quadrat locations on some of the sites between 2017 and 2018, this result must be interpreted with some caution.
As per Figure 3.8-3 the number of sites meeting each MoS is largely the same for the height and improvement criteria. However, there are differences in the numbers meeting the positive indicator MoS but these are offset by an increase in the number meeting the bare peat criterion. There is little change on the component scores for the sward height MoS which all remain at very high success rates (Figure 3.8-4).
0
1
2
3
4
5
6
0 1 2 3 4 5 6
Co
un
t o
f Si
tes
Outcome MoS met
2017 2018
0
1
2
3
4
5
6
7
-1 0 1 2
Co
utn
of
Site
s
Difference in MoS met (2018 - 2017)
Figure 3.8-2: Commonages. 2018 vs. 2017 Number of MoS met by sites. Median = thick border

Department of Agriculture, Food and the Marine 43
Year 2 Analysis of Actions under GLAS
RSK ADAS Project: 1020044
Figure 3.8-3: Commonages. 2018 vs. 2017 Individual MoS. Paired surveys (n = 10)
Figure 3.8-4: Commonages. 2018 vs. 2017 Sward height MoS sub-criteria. Paired surveys (n = 10)
The underlying variables on which the five of the MoS above depend are shown in Table 3.8-4 below for both years. The average sward height is larger, as are the proportions of sward that are taller. There is little difference in the other variables. The positive indicator variable cannot be assessed in this way due to its compound nature and the fact that it varies based on the habitat types present.
Table 3.8-4: Commonages. 2018 vs. 2017. Summary of underlying data
2017 2018
Variable Paired
surveys Mean Median Mean Median
Average sward height (cm) 10 24 21 32 32
Samples above 20cm (%) 10 55 55 66 80
Samples above 30cm (%) 10 32 28 48 48
Undesirables cover (%) 10 0 0 0 0
Ryegrasses cover (%) 10 5 0 1 0
White clover, Daisy, Creeping buttercup cover (%) 10 1 0 0 0
Bare peat cover (%) 10 22 20 22 15
0 10 20 30 40 50 60 70 80 90 100
Sites meeting ALL sward height criteria
A minimum of 2 positive indicator species should beFrequent and 2 Occasional for each habitat present
The combined cover of undesirable species should be <5%
The cover of Ryegrasses should be < 5%
The combined cover of White clover, Daisy, Creepingbuttercup < 10%
Bare peat should be recorded at < 5% of stops
2017 % passed 2018 % passed
0 10 20 30 40 50 60 70 80 90 100
Average sward height to be at least 8 cm
At least 20% samples ≥ 20cm
At least 10% samples ≥ 30cm
2017 2018
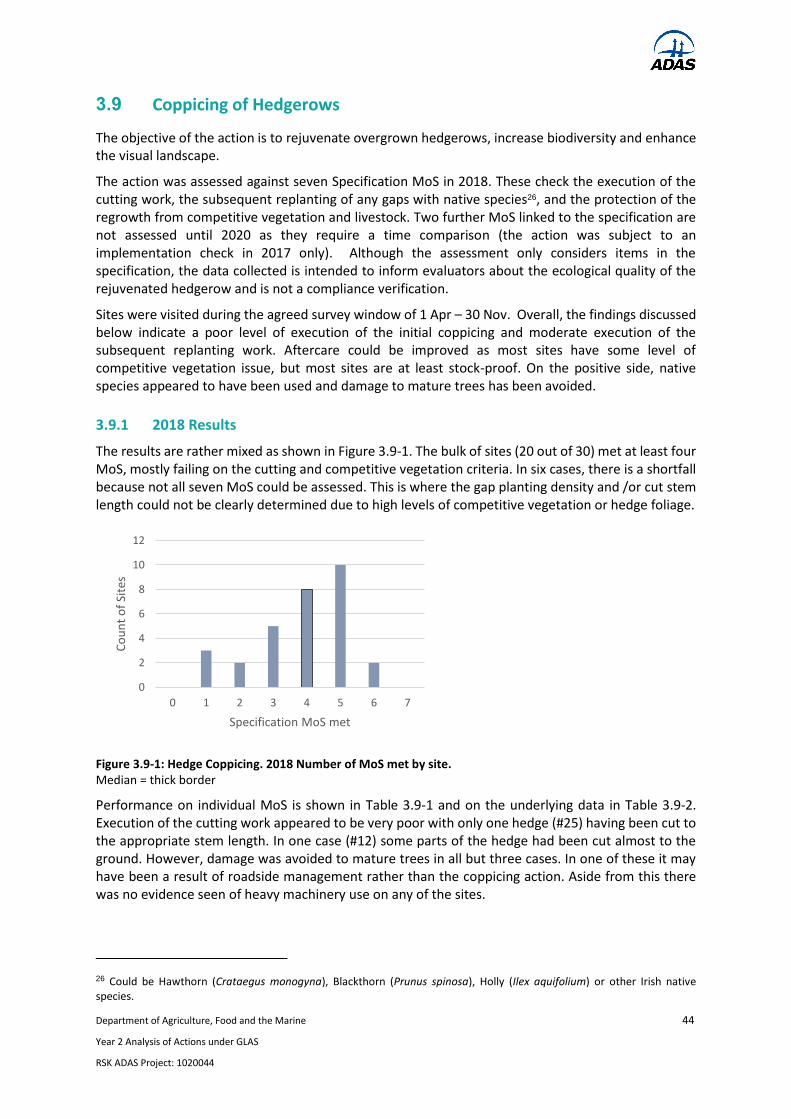
Department of Agriculture, Food and the Marine 44
Year 2 Analysis of Actions under GLAS
RSK ADAS Project: 1020044
3.9 Coppicing of Hedgerows
The objective of the action is to rejuvenate overgrown hedgerows, increase biodiversity and enhance the visual landscape.
The action was assessed against seven Specification MoS in 2018. These check the execution of the cutting work, the subsequent replanting of any gaps with native species26, and the protection of the regrowth from competitive vegetation and livestock. Two further MoS linked to the specification are not assessed until 2020 as they require a time comparison (the action was subject to an implementation check in 2017 only). Although the assessment only considers items in the specification, the data collected is intended to inform evaluators about the ecological quality of the rejuvenated hedgerow and is not a compliance verification.
Sites were visited during the agreed survey window of 1 Apr – 30 Nov. Overall, the findings discussed below indicate a poor level of execution of the initial coppicing and moderate execution of the subsequent replanting work. Aftercare could be improved as most sites have some level of competitive vegetation issue, but most sites are at least stock-proof. On the positive side, native species appeared to have been used and damage to mature trees has been avoided.
3.9.1 2018 Results
The results are rather mixed as shown in Figure 3.9-1. The bulk of sites (20 out of 30) met at least four MoS, mostly failing on the cutting and competitive vegetation criteria. In six cases, there is a shortfall because not all seven MoS could be assessed. This is where the gap planting density and /or cut stem length could not be clearly determined due to high levels of competitive vegetation or hedge foliage.
Performance on individual MoS is shown in Table 3.9-1 and on the underlying data in Table 3.9-2. Execution of the cutting work appeared to be very poor with only one hedge (#25) having been cut to the appropriate stem length. In one case (#12) some parts of the hedge had been cut almost to the ground. However, damage was avoided to mature trees in all but three cases. In one of these it may have been a result of roadside management rather than the coppicing action. Aside from this there was no evidence seen of heavy machinery use on any of the sites.
26 Could be Hawthorn (Crataegus monogyna), Blackthorn (Prunus spinosa), Holly (Ilex aquifolium) or other Irish native species.
0
2
4
6
8
10
12
0 1 2 3 4 5 6 7
Co
un
t o
f Si
tes
Specification MoS met
Figure 3.9-1: Hedge Coppicing. 2018 Number of MoS met by site. Median = thick border

Department of Agriculture, Food and the Marine 45
Year 2 Analysis of Actions under GLAS
RSK ADAS Project: 1020044
The majority of hedges (19) had no gaps. 12 of these had been replanted with native species and the remaining seven did not appear to have required replanting and so in effect passed this MoS. A further three still had gaps but native species had been at least planted to attempt to fill them. The remaining eight sites had not replanted the gaps. As such there were 11 sites where hedges were rather gappy. More often than not, the planting density was less than four trees per metre. Most hedges have been protected from stock (80%) but the aftercare has been poor in terms of management of competitive vegetation with only 40% of sites keeping this to acceptable levels. Some sites were particularly poor in this regard (#3, #12, #21 and #23) with the hedge being clearly choked. It may be less of an issue where woody species in the hedgerow have already become robust enough to survive (e.g. site #25).
Table 3.9-1: Hedge Coppicing. 2018. Performance on individual MoS
2018
Specification MOS Valid
Surveys Total
passed %
passed
< 5% of cut stems to be > 15cm 28 1 4
There should be no hedgerow gaps 30 19 63
Gap planting to consist of Hawthorn, Blackthorn, Holly or other native Irish hedgerow species
30 22 73
Planting to be ≥ 4 plants/m 24 11 46
No reduction in presence of mature trees from baseline - - -
No mature trees within the hedgerow should be coppiced/damaged 30 27 90
The whole hedgerow should be stock-proof 30 24 80
Dense growth of competitive vegetation must be < 5% 30 12 40
If newly planted saplings are ≥ 1m in height, then 60% of the hedgerow will comprise plants with interlinking lateral growth by year 5.
- - -
Clearly there is no prospect for improvement in the first item at the subsequent re-survey as the coppicing has already taken place. A number of sites failed on the competitive vegetation criterion, but the specification is not explicit as to the desired maximum cover, only that it should be “controlled”. Eight sites have vegetation levels above 5% but at or below 30%, and with slightly more management the trees could outgrow the competition. Indeed, in two of these cases (#10 and #26) this is already happening. However, there are still a quarter of sites with competitive vegetation at or above 50% and four of these in particular (#3, #12, #21, #23) could struggle to fully regrow due to this issue.
The interlinking lateral growth will be assessed in 2020; at the current point, the scores on this measure could be quite mixed due to the gap and competitive vegetation issues.
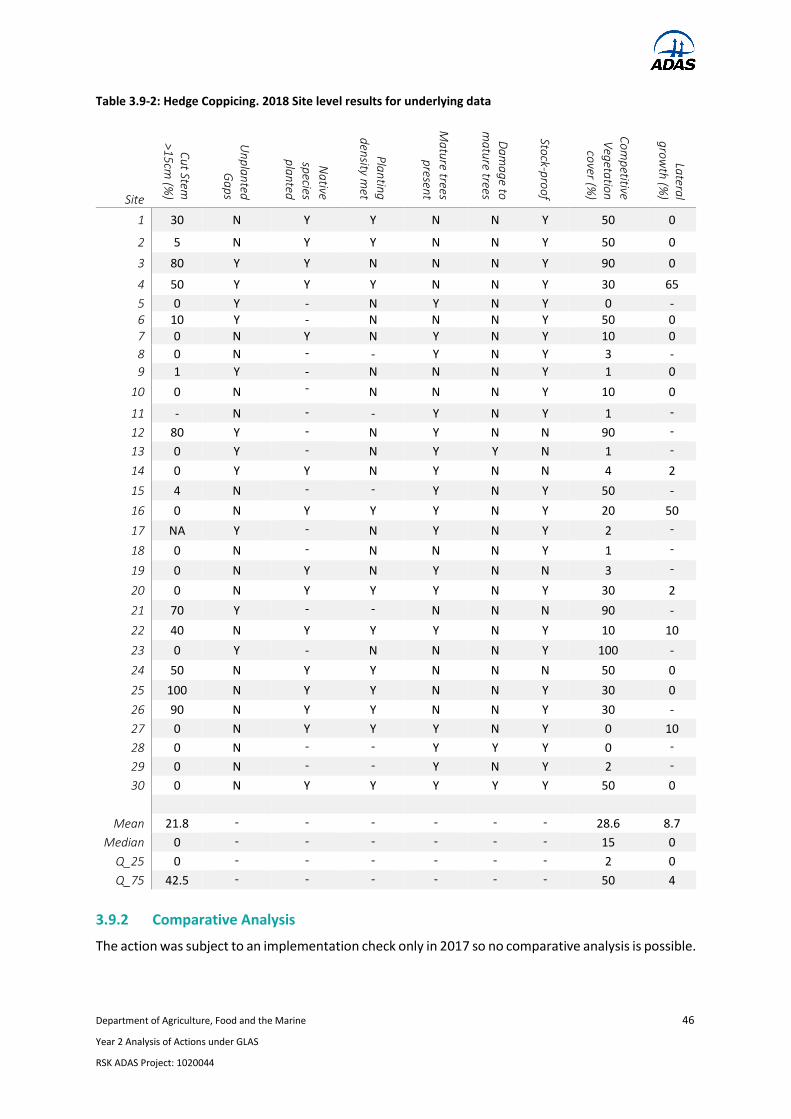
Department of Agriculture, Food and the Marine 46
Year 2 Analysis of Actions under GLAS
RSK ADAS Project: 1020044
Table 3.9-2: Hedge Coppicing. 2018 Site level results for underlying data
Site
Cu
t Stem
>15
cm (%
)
Un
pla
nted
G
ap
s
Na
tive
species
pla
nted
Pla
ntin
g
den
sity met
Ma
ture trees p
resent
Da
ma
ge to
m
atu
re trees
Stock-p
roo
f
Co
mp
etitive V
egeta
tion
cover (%
)
Latera
l g
row
th (%
)
1 30 N Y Y N N Y 50 0
2 5 N Y Y N N Y 50 0
3 80 Y Y N N N Y 90 0
4 50 Y Y Y N N Y 30 65
5 0 Y - N Y N Y 0 - 6 10 Y - N N N Y 50 0 7 0 N Y N Y N Y 10 0
8 0 N - - Y N Y 3 -
9 1 Y - N N N Y 1 0
10 0 N - N N N Y 10 0
11 - N - - Y N Y 1 -
12 80 Y - N Y N N 90 -
13 0 Y - N Y Y N 1 -
14 0 Y Y N Y N N 4 2
15 4 N - - Y N Y 50 -
16 0 N Y Y Y N Y 20 50
17 NA Y - N Y N Y 2 -
18 0 N - N N N Y 1 -
19 0 N Y N Y N N 3 -
20 0 N Y Y Y N Y 30 2
21 70 Y - - N N N 90 -
22 40 N Y Y Y N Y 10 10
23 0 Y - N N N Y 100 -
24 50 N Y Y N N N 50 0
25 100 N Y Y N N Y 30 0
26 90 N Y Y N N Y 30 -
27 0 N Y Y Y N Y 0 10
28 0 N - - Y Y Y 0 -
29 0 N - - Y N Y 2 -
30 0 N Y Y Y Y Y 50 0
Mean 21.8 - - - - - - 28.6 8.7
Median 0 - - - - - - 15 0
Q_25 0 - - - - - - 2 0
Q_75 42.5 - - - - - - 50 4
3.9.2 Comparative Analysis
The action was subject to an implementation check only in 2017 so no comparative analysis is possible.

Department of Agriculture, Food and the Marine 47
Year 2 Analysis of Actions under GLAS
RSK ADAS Project: 1020044
3.10 Corncrake
The objective of the action is to create and maintain cover and nesting shelter for Corncrake birds when they arrive from Africa throughout their breeding season (April to September). The specification sets out general requirements for a tall herbaceous parcel, but also requires landholders to provide Early Late Cover (ELC) areas in the spring that cover at least 5% of the parcel. ELCs are areas of tall, herbaceous vegetation that are important for Corncrake at times of the year when most of the sward will be short.
The action was assessed against five Specification MoS. Four of these are checks on the quality of the ELC: it must be of reasonable extent, sufficiently tall, have sufficient herbaceous content and not too much grass content. These are assessed in a spring survey. A further MoS assesses the quality of the whole parcel in the summer against the same height criterion. Information on sward species cover was also sought to ensure the parcel had sufficient herb, nettle and rush cover during the summer, but it proved impractical to estimate a percentage with any degree of confidence as the summer survey is conducted at night. The reason for the timing of this survey is to be able to also assess for the Result MoS, which is a check for Corncrake presence.
The spring day survey took place within the agreed window of 1 Apr – 20 May, and the summer night survey within the agreed window of 20 May – 30 Jun. Overall, the execution of the action remains rather weak with the majority of sites failing to have adequate ELC as per last year and there was no significant change in the MoS met or the underlying data. Most of the parcels have adequate cover during the summer, but surveyors were unable to verify if the vegetation type was suitable. Corncrake were present on six sites, slightly up on last year.
3.10.1 2018 Results
As indicated in Figure 3.10-1, the extent to which the specification was met was rather poor with only one site of the 29 sites surveyed27 meeting all MoS and over half the sites failing on four or even all the criteria. The shortfall may be larger than it appears as surveyors were not able to record height data for nine sites in the summer survey, so these show as not being passed. The median height on valid sites was 35cm so it is likely that some of these would have passed. But even with this caveat the scores would still be weak.
27 At one site it was not possible to access the field to record ELC data due to an aggressive cow.
0
2
4
6
8
10
0 1 2 3 4 5
Co
un
t o
f Si
tes
Specification MoS met
0
5
10
15
20
25
30
0 1
Co
un
t o
f Si
tes
Result MoS met
Figure 3.10-1: Corncrake. 2018 Number of MoS met by site. Median in bold outline

Department of Agriculture, Food and the Marine 48
Year 2 Analysis of Actions under GLAS
RSK ADAS Project: 1020044
Performance on individual MoS is shown in Table 3.10-1 and on the underlying data in Table 3.10-2. The critical criterion for Corncrake is the presence of ELC. This needs to be both of a suitable height and, perhaps more importantly, of a sufficient extent. However, only 27% of sites met the extent criterion and 17% of sites met the vegetation height criterion. Allied to the poor result for vegetation height, was a lack of ‘correct’ species composition, so only five out of 30 sites comprised at least 30% herb, nettle and rush cover (#8, #20, #22, #23 and #26). These criteria would be expected to complement each other, in that if sufficient herb, nettle and rushes were present, the height criteria would also be met (these being generally tall vegetation). Conversely, the result for grass cover indicates that many of these sites are too grassy at the expense of herbs, nettles and rushes. Many of the sites surveyed are more improved than would be desired but of the sites which failed on one or more of the ELC MoS did at least have suitable habitat nearby (e.g. #6, #7, #9, #19, and #23).
The wet winter and the very late, cold spring may have been contributory factors to the poor quality of ELC observed. However, 30% of sites showed signs of recent grazing and three (#10, #12 and #25) were recorded as being tightly grazed and were thus unsuitable in this respect. Two sites still had cattle present in the field. A couple of sites (#9, #30) were too rank to support Corncrake and a further site was machair and thus was not suitable. Nevertheless, there were a handful of sites with very good quality ELC (#8, #20 and #22). Some other sites also showed potential for nettle, rush and iris-dominated vegetation to emerge if management prescriptions are followed and other conditions are conducive (e.g. a relatively high water table).
Table 3.10-1: Corncrake. 2018 Performance on individual MoS
2018
Specification MOS Valid Surveys Total passed % passed
ELC should be at least 5% of Corncrake parcel 30 8 27
ELC average sward height to be at least 30cm 29 5 17
ELC herb, nettle and rush cover at least 30% 29 5 17
ELC grass cover no more than 80% 29 12 41
Field average sward height to be at least 30cm 21 13 62
Field herb, nettle and rush cover at least 30% 0 - -
Result MOS Valid Surveys Total passed % passed
Corncrake present 30 6 20
Surveyors were able to estimate average field height at the night-time survey for 21 sites only, and the majority of these (13 sites) had a height of at least 30cm. In spite of the rather poor ELC conditions present on a large number of sites, six sites supported calling Corncrake (#1, #6, #8, #18, #19 and #20) at the night time survey. At one of these sites there were two males calling and another had 12 males (though this site is in a known location for high breeding density. A further two sites had Corncrake calling in the vicinity of the parcel, though not from the parcel itself.
The fact that Corncrake are either present on target or adjacent parcels at time of observation or are noted as having been present previously is encouraging given the rarity of the species in Ireland, though of course this may simply reflect appropriate geographic selection. Performance on the Specification MoS for these eight sites is quite mixed, so no conclusions can be drawn as to the extent to which the quality of the ELC or summer habitat has influenced the presence or absence of the bird. Nevertheless, with further management (largely non-intervention) of selected sites and improved quality of ELC, more sites will become suitable in time. Certainly, the experience in the west coast of Scotland indicates that it is possible to instigate a good recovery in this species over a relatively short timescale.

Department of Agriculture, Food and the Marine 49
Year 2 Analysis of Actions under GLAS
RSK ADAS Project: 1020044
Table 3.10-2: Corncrake. 2018. Site level performance on underlying data
Site ELC Size (%
parcel)
ELC average sward height
(cm)
ELC herb, nettle, rush cover (%)
ELC grass cover (%)
ELC near suitable habitat
Field average sward height (cm)
Corncrake Present
1 0.0 3.2 0.0 99.8 No 6.5 Y
2 31.0 13.0 0.0 73.0 Partial 28.0 N
3 0.0 5.2 1.0 96.0 No - N
4 0.0 3.8 0.0 92.0 No - N
5 78.8 5.0 12.2 94.0 No 87.5 N
6 9.5 9.6 2.0 60.0 Yes - Y
7 0.0 7.0 8.0 100.0 Yes - N
8 32.0 39.8 49.0 48.0 Yes 34.6 Y
9 9.4 19.2 9.0 100.0 Yes - N
10 0.0 7.2 0.0 93.8 Partial 40.0 N
11 0.0 10.8 0.0 95.8 No 22.5 N
12 0.0 16.6 1.0 88.4 Partial 55.0 N
13 0.0 11.4 2.0 90.0 Partial 55.0 N
14 0.0 17.0 0.0 75.0 Partial 25.0 N
15 0.0 21.0 0.0 95.0 No 30.0 N
16 0.0 30.8 8.0 77.0 Partial 40.0 N
17 0.0 63.8 17.0 16.0 Partial 70.0 N
18 0.0 13.0 0.0 79.0 No 25.0 Y
19 0.0 29.6 3.0 58.0 Yes 35.0 Y
20 4.1 30.0 98.0 20.0 No NA Y
21 0.0 5.2 3.0 100.0 No NA N
22 41.0 27.2 40.0 76.8 Yes NA N
23 26.5 19.2 30.0 83.0 Yes NA N
24 1.8 8.6 0.0 92.0 No 17.5 N
25 0.0 2.4 0.0 87.0 Partial 12.5 N
26 17.5 20.0 35.0 65.0 Partial 50.0 N
27 1.9 - - - No 35.0 N
28 0.0 9.0 6.4 89.0 Partial 30.0 N
29 0.0 6.6 0.0 97.2 No 15.0 N
30 0.0 59 0.0 76.0 - 65.0 N
Mean 8.5 17.7 11.2 79.9 - 37.1 -
Median 0.0 13.0 2.0 88.4 - 34.6 -
Q_25 0.0 7.0 0.0 75.0 - 25.0 -
Q_75 8.1 21.0 9.0 95.0 - 50.0 -

Department of Agriculture, Food and the Marine 50
Year 2 Analysis of Actions under GLAS
RSK ADAS Project: 1020044
3.10.2 Comparative Analysis
Three of the Specification MoS were also comparable to 2017, allowing for a direct comparison where there was matching site data, though care should be taken with interpretation due to slight differences in the monitoring protocol28. Slightly more sites met none of these in 2018, but there was one more site which met all of them (Figure 3.10-2). Seven sites dropped back by one MoS and five gained by one or two.
The pass rates on the Specification MoS are very similar (Figure 3.10-3) with both years performing poorly on sward height and herb cover criteria and moderately on the grass cover MoS. Corncrake were present at three more sites than in 2017. Four of these are sites where the birds were not recorded last year and two were the same with one site dropping back.
Figure 3.10-3: Corncrake. 2018 vs. 2017 Individual MoS. Paired surveys only (n as shown)
28 In the baseline year surveyors were asked to determine whether the size and extent of the early late cover area (ELC) matched that on the plan. This year surveyors were asked to directly estimate the dimension of the visible ELC relative to the parcel area. Also, in the first year, some surveyors misinterpreted the spring ELC height and composition criterion and measured for the whole sward. This year surveyors have only assessed the ELC area in the spring survey. Height information was only captured at the night survey in 2017 at six sites so cannot be reasonably compared.
0 10 20 30 40 50 60 70 80 90 100
ELC average sward height to be at least 30cm (29)
ELC herb, nettle and rush cover at least 30% (29)
ELC grass cover no more than 80% (29)
Corncrake present (30)
2017 % passed 2018 % passed
0
2
4
6
8
10
12
14
16
18
0 1 2 3
Co
un
t o
f Si
tes
Specification MoS met
2017 2018
0
2
4
6
8
10
12
14
16
18
-1 0 1 2C
ou
nt
of
Site
s
Difference in MoS met (2018 - 2017)
Figure 3.10-2: Corncrake. 2018 vs. 2017 Number of MoS met by site. Median = thick border

Department of Agriculture, Food and the Marine 51
Year 2 Analysis of Actions under GLAS
RSK ADAS Project: 1020044
The significance of the differences between the two years was assessed by means of an exact symmetry test for paired data (Table 3.10-3). To assess the action as a whole, the pass and fail rates for Specification MoS for valid paired data were compared and values added to a contingency table matrix. There was found to be no significant difference between the pass rates in the two years. There was also no significant difference in any of the individual MoS.
Table 3.10-3: Corncrake. 2018 vs. 2017 Number of MoS. Exact Symmetry Test
Fail 17 Fail 18
Fail 17 Pass 18
Pass 17 Fail 18
Pass 17 Pass 18 P value
All specification MoS 60 7 8 18 1
ELC average sward height to be at least 30cm 22 2 2 3 1
ELC herb, nettle and rush cover at least 30% 23 3 1 2 0.625
ELC grass cover no more than 80% 13 2 4 10 0.687
Corncrake present 23 4 1 2 0.375
At underlying data level (Table 3.10-4) there is not that much difference in the scores for the three ELC variables though the median grass cover appears to be 6% higher. However, a Wilcoxon Signed Rank test shows that the difference between the 2017 and 2018 data for any of the underlying variables considered is not significant.
Table 3.10-4: Corncrake. 2018 vs. 2017. Underlying data. Wilcoxon Signed Rank Test
2017 2018 Wilcoxon Signed Rank
Variable Paired
surveys Mean Median Mean Median Z score P value
ELC average sward height (cm) 29 16.3 13.4 17.7 13.0 -0.508 0.611
ELC herb, nettle, rush cover (%) 29 7.8 0.5 11.2 2.0 -1.018 0.309
ELC grass cover (%) 29 79.2 81.9 79.9 88.4 -0.627 0.531

Department of Agriculture, Food and the Marine 52
Year 2 Analysis of Actions under GLAS
RSK ADAS Project: 1020044
3.11 Environmental Management of Fallow Land
The objective of the action is to establish a fallow area that will provide food and habitat for ground nesting birds, other fauna and insects throughout the nesting season.
The action is assessed against two Specification MoS. One of the Specification MoS reflects the requirement to sow a mix of two grasses, namely Cocksfoot (Dactylis glomerata) and Timothy (Phleum pratense). The other checks that their parcel is stock-proof. The action is also assessed against five Outcome MoS. Two of these are closely related to the action specifications for cutting and weed management (cover of undesirables and average sward height). The checks on the cover of Perennial ryegrass (Lolium perenne) and White clover (Trifolium repens) assess whether nutrient levels are declining so that a more diverse sward is possible. Finally, the sward is checked for cover of forbs to see if that diversity is present.
Sites were surveyed within the agreed window of 1 Apr – 31 Aug with the exception of three sites surveyed in early September29. Overall, the action was well executed and displayed good outcomes in terms of soil improvement indicators, undesirable species and sward height. However, only a few sites displayed desirable levels of forb cover. The initial levels of soil nutrients and the choice of grasses in the seed mix could be limiting factors.
3.11.1 2018 Results
Figure 3.11-1 shows that 14 of the 30 sites visited this year30 met both Specification MoS and a further 13 met one only. The majority of sites (18) met all but one of the Outcome MoS, but only six sites were able to meet all of them (#1, #15, #17, #20, #29 and #30). Site #17 was a particularly good example of fallow land with Goldfinches and the Meadow Brown butterfly present. Where sites came short this was generally on the forb cover, as discussed below.
Performance on individual MoS is shown in Table 3.11-1 and on the underlying data in Table 3.11-2. Around three quarters of the sites met the criterion for combined cover of Cocksfoot and Timothy. Although it appears that a high proportion of sites (37%) failed the stock-proofing criteria, every one of these was either an arable farm where stock were not present or else a mixed farm where the field was closed off to the pasture parcels but open to other arable fields. Therefore, this MoS should be treated as being fully met.
29 Sites #20, #21, #23. This was for logistical reasons and no impact on the survey results is expected. 30 This included four sites (#29, #30, #31 and #32) that were added to the survey to make up for the two sites that dropped out of the scheme in the first year and were never in the original phone check and two that have dropped out after the first year (#4 and #28).
0
2
4
6
8
10
12
14
16
0 1 2
Co
un
t o
f Si
tes
Specification MoS met
0
5
10
15
20
0 1 2 3 4 5
Co
un
t o
f Si
tes
Outcome MoS met
Figure 3.11-1: Fallow. 2018 Number of MoS met by site. Median = thick border

Department of Agriculture, Food and the Marine 53
Year 2 Analysis of Actions under GLAS
RSK ADAS Project: 1020044
Table 3.11-1: Fallow. 2018 Performance on individual MoS
2018
Specification MOS Valid
Surveys Total
passed %
passed
Cumulative cover of Timothy and Cocksfoot should be >30% 30 22 73
The whole parcel should be stock-proof 30 19 63
Result MOS Valid
Surveys Total
passed %
passed
Cover of Perennial ryegrass should be <25% 30 28 93
Cover of White clover should be <25% 30 30 100
Combined cover of forbs should be >10% 30 7 23
Cover of undesirables should be <5% 30 26 87
Average sward height should be >20cm (considering time of year) 30 29 97
Virtually all sites met the two criteria for indicators of lack of soil improvement as evidenced by the cover of Perennial ryegrass and White clover. The vast majority (87%) of sites also had very low levels of undesirable species. All sites bar one had sufficiently tall sward cover. That site (#32) had been recently cut, which may have been permitted under a derogation related to the fodder crisis.
The main shortcoming on this action is the failure on the forb cover criterion with only seven sites (23%) meeting this MoS. Good forb cover is essential for pollinators, so this should be a concern. At the current time, grasses are too tall and dominant in the sward, but whilst the site remains under fallow management and nutrient levels deplete forb cover and diversity should increase. Whether this change is achieved by the final year may be dependent on the initial nutrient levels. The choice of grasses offered in the specification may also be a limiting factor.
Of the eight sites not meeting the cover of the desired grasses, two are quite close to the 30% threshold (#3, #23). For others it might reflect either that the soil was too improved (#8) or that the fallow area was cut at the wrong time of year (#32). In two cases (#1 and #29) the parcel is heavily dominated by forbs and so is achieving a key objective. In terms of achieving desired level of forb cover at other sites, seven have 5% to 10% cover already and show the greatest potential but still half the sample has only 2% or less. One of these (#25) had at least good forb cover outside the quadrat locations.

Department of Agriculture, Food and the Marine 54
Year 2 Analysis of Actions under GLAS
RSK ADAS Project: 1020044
Table 3.11-2: Fallow. 2018 Site level performance on underlying data
Site
Timo
thy,
Co
cksfoo
t
cover (%
)
Stock-p
roo
f
Ryeg
rass
cover (%
)
Wh
ite clover
cover (%
)
Forb
cover
(%)
Un
desira
ble
species co
ver (%
)
Mea
n Sw
ard
Heig
ht (cm
)
1 9.0 Y 10.0 1.8 64.0 0.4 41.0
2 91.0 Y 0.4 0.4 3.8 0.0 96.4
3 28.4 Y 0.2 0.0 1.0 1.8 49.0
5 75.0 N 0.0 7.0 1.0 0.0 81.0
6 88.0 Y 0.0 0.0 2.0 1.0 149.0
7 81.0 Y 0.0 0.0 6.6 12.4 49.0
8 18.4 N 50.0 0.0 0.4 1.0 63.6
9 81.6 Y 2.6 0.0 7.0 0.6 92.8
10 49.0 N 22.6 1.4 9.6 0.8 89.8
11 82.6 N 5.0 0.0 0.2 0.4 100.0
12 64.0 N 18.0 5.0 0.6 0.2 94.8
13 35.0 Y 31.6 5.2 12.8 0.0 85.2
14 91.0 N 0.0 0.0 0.0 6.8 121.0
15 6.6 N 0.0 0.0 15.0 0.0 66.8
16 78.0 Y 9.0 5.0 8.0 0.0 83.0
17 42.0 N 7.6 0.0 20.0 0.0 86.6
18 0.0 Y 5.4 0.8 6.4 0.2 34.8
19 80.0 Y 6.4 1.0 0.4 2.4 108.6
20 36.0 N 0.0 0.0 44.0 0.0 37.0
21 100.0 Y 0.0 0.0 0.0 0.0 148.0
22 68.0 Y 0.0 0.0 0.0 6.4 28.0
23 28.0 N 0.0 0.0 8.0 0.0 37.0
24 69.0 Y 0.0 0.0 0.0 0.0 69.0
25 72.0 Y 20.0 0.2 0.0 0.8 94.0
26 80.0 Y 1.4 1.0 6.2 6.4 102.0
27 88.0 Y 0.8 0.0 0.4 0.2 84.0
29 0.0 Y 0.0 0.0 61.0 0.0 81.8
30 88.8 N 0.0 0.2 11.0 0.0 93.6
31 98.0 Y 0.0 0.0 0.0 1.4 87.0
32 9.0 Y 13.4 0.0 0.0 0.0 13.2
Mean 57.9 - 6.8 1.0 9.6 1.4 78.9
Median 70.5 - 0.6 0.0 2.9 0.2 84.6
Q_25 30.1 - 0.0 0.0 0.3 0.0 52.7
Q_75 82.4 - 8.7 1.0 9.2 1.0 94.6
3.11.2 Comparative Analysis
The action was subject to an implementation check only in 2017 so no comparative analysis is possible.
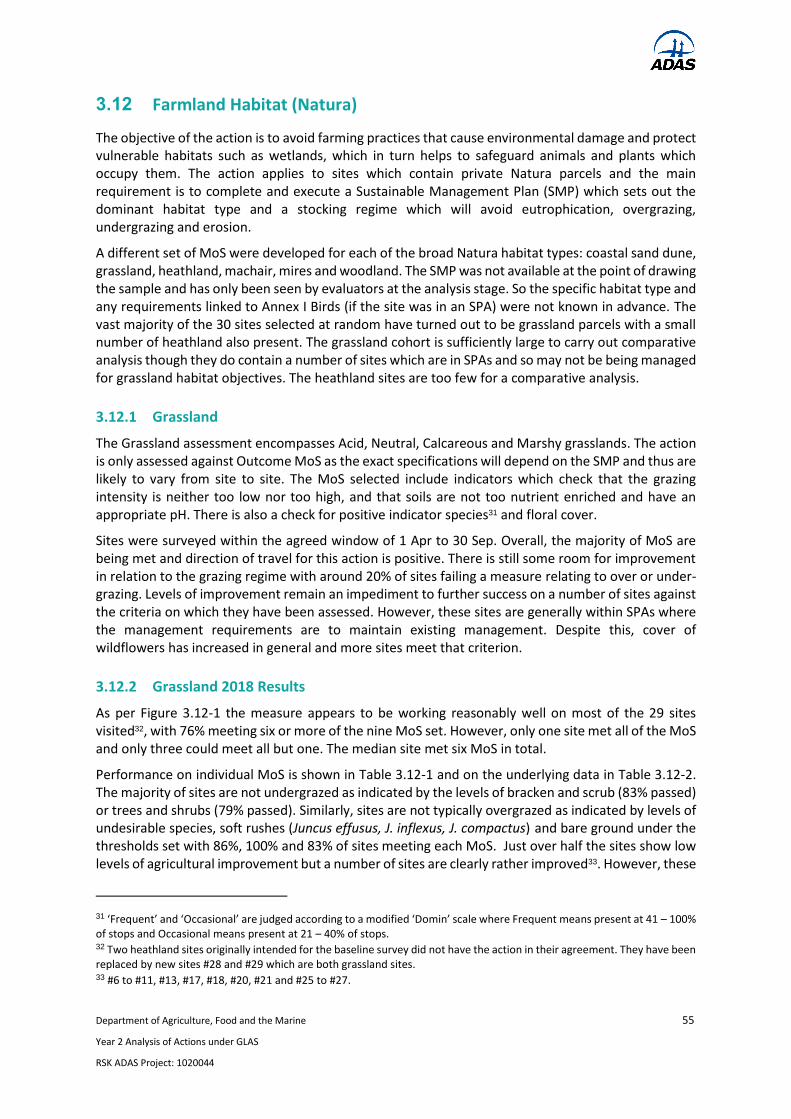
Department of Agriculture, Food and the Marine 55
Year 2 Analysis of Actions under GLAS
RSK ADAS Project: 1020044
3.12 Farmland Habitat (Natura)
The objective of the action is to avoid farming practices that cause environmental damage and protect vulnerable habitats such as wetlands, which in turn helps to safeguard animals and plants which occupy them. The action applies to sites which contain private Natura parcels and the main requirement is to complete and execute a Sustainable Management Plan (SMP) which sets out the dominant habitat type and a stocking regime which will avoid eutrophication, overgrazing, undergrazing and erosion.
A different set of MoS were developed for each of the broad Natura habitat types: coastal sand dune, grassland, heathland, machair, mires and woodland. The SMP was not available at the point of drawing the sample and has only been seen by evaluators at the analysis stage. So the specific habitat type and any requirements linked to Annex I Birds (if the site was in an SPA) were not known in advance. The vast majority of the 30 sites selected at random have turned out to be grassland parcels with a small number of heathland also present. The grassland cohort is sufficiently large to carry out comparative analysis though they do contain a number of sites which are in SPAs and so may not be being managed for grassland habitat objectives. The heathland sites are too few for a comparative analysis.
3.12.1 Grassland
The Grassland assessment encompasses Acid, Neutral, Calcareous and Marshy grasslands. The action is only assessed against Outcome MoS as the exact specifications will depend on the SMP and thus are likely to vary from site to site. The MoS selected include indicators which check that the grazing intensity is neither too low nor too high, and that soils are not too nutrient enriched and have an appropriate pH. There is also a check for positive indicator species31 and floral cover.
Sites were surveyed within the agreed window of 1 Apr to 30 Sep. Overall, the majority of MoS are being met and direction of travel for this action is positive. There is still some room for improvement in relation to the grazing regime with around 20% of sites failing a measure relating to over or under-grazing. Levels of improvement remain an impediment to further success on a number of sites against the criteria on which they have been assessed. However, these sites are generally within SPAs where the management requirements are to maintain existing management. Despite this, cover of wildflowers has increased in general and more sites meet that criterion.
3.12.2 Grassland 2018 Results
As per Figure 3.12-1 the measure appears to be working reasonably well on most of the 29 sites visited32, with 76% meeting six or more of the nine MoS set. However, only one site met all of the MoS and only three could meet all but one. The median site met six MoS in total.
Performance on individual MoS is shown in Table 3.12-1 and on the underlying data in Table 3.12-2. The majority of sites are not undergrazed as indicated by the levels of bracken and scrub (83% passed) or trees and shrubs (79% passed). Similarly, sites are not typically overgrazed as indicated by levels of undesirable species, soft rushes (Juncus effusus, J. inflexus, J. compactus) and bare ground under the thresholds set with 86%, 100% and 83% of sites meeting each MoS. Just over half the sites show low levels of agricultural improvement but a number of sites are clearly rather improved33. However, these
31 ‘Frequent’ and ‘Occasional’ are judged according to a modified ‘Domin’ scale where Frequent means present at 41 – 100% of stops and Occasional means present at 21 – 40% of stops. 32 Two heathland sites originally intended for the baseline survey did not have the action in their agreement. They have been replaced by new sites #28 and #29 which are both grassland sites. 33 #6 to #11, #13, #17, #18, #20, #21 and #25 to #27.
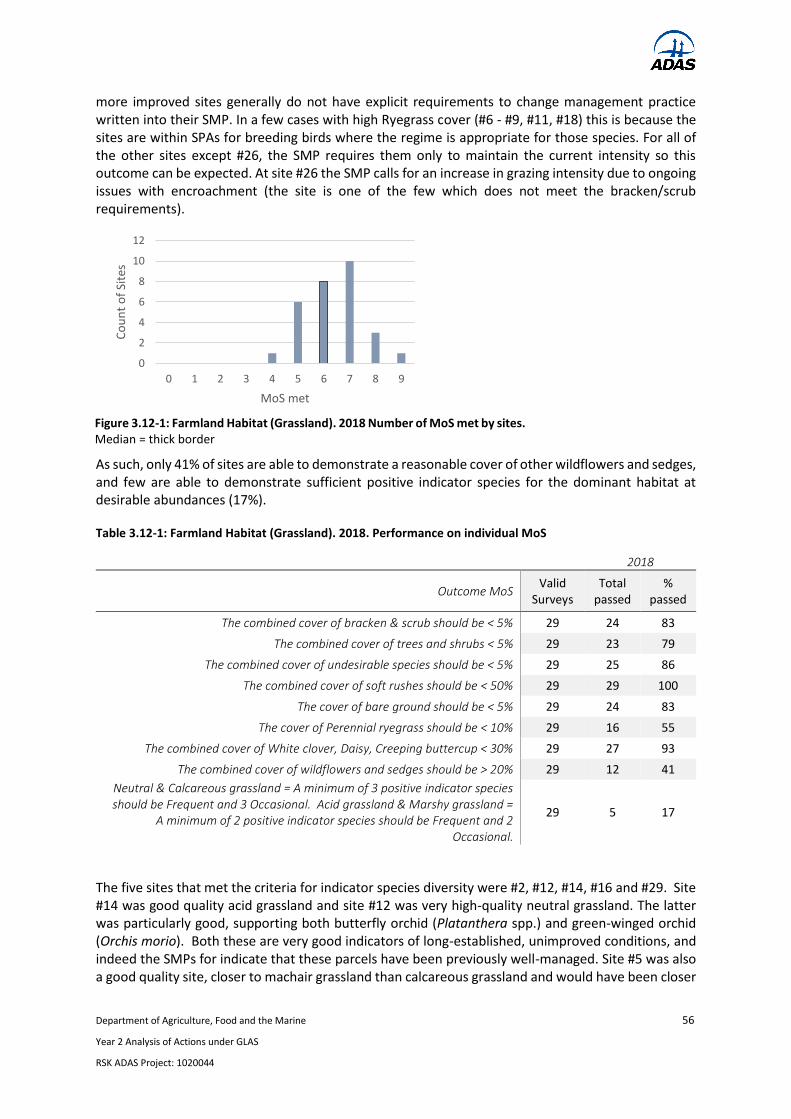
Department of Agriculture, Food and the Marine 56
Year 2 Analysis of Actions under GLAS
RSK ADAS Project: 1020044
more improved sites generally do not have explicit requirements to change management practice written into their SMP. In a few cases with high Ryegrass cover (#6 - #9, #11, #18) this is because the sites are within SPAs for breeding birds where the regime is appropriate for those species. For all of the other sites except #26, the SMP requires them only to maintain the current intensity so this outcome can be expected. At site #26 the SMP calls for an increase in grazing intensity due to ongoing issues with encroachment (the site is one of the few which does not meet the bracken/scrub requirements).
As such, only 41% of sites are able to demonstrate a reasonable cover of other wildflowers and sedges, and few are able to demonstrate sufficient positive indicator species for the dominant habitat at desirable abundances (17%).
Table 3.12-1: Farmland Habitat (Grassland). 2018. Performance on individual MoS
2018
Outcome MoS Valid
Surveys Total
passed %
passed
The combined cover of bracken & scrub should be < 5% 29 24 83
The combined cover of trees and shrubs < 5% 29 23 79
The combined cover of undesirable species should be < 5% 29 25 86
The combined cover of soft rushes should be < 50% 29 29 100
The cover of bare ground should be < 5% 29 24 83
The cover of Perennial ryegrass should be < 10% 29 16 55
The combined cover of White clover, Daisy, Creeping buttercup < 30% 29 27 93
The combined cover of wildflowers and sedges should be > 20% 29 12 41
Neutral & Calcareous grassland = A minimum of 3 positive indicator species should be Frequent and 3 Occasional. Acid grassland & Marshy grassland =
A minimum of 2 positive indicator species should be Frequent and 2 Occasional.
29 5 17
The five sites that met the criteria for indicator species diversity were #2, #12, #14, #16 and #29. Site #14 was good quality acid grassland and site #12 was very high-quality neutral grassland. The latter was particularly good, supporting both butterfly orchid (Platanthera spp.) and green-winged orchid (Orchis morio). Both these are very good indicators of long-established, unimproved conditions, and indeed the SMPs for indicate that these parcels have been previously well-managed. Site #5 was also a good quality site, closer to machair grassland than calcareous grassland and would have been closer
0
2
4
6
8
10
12
0 1 2 3 4 5 6 7 8 9
Co
un
t o
f Si
tes
MoS met
Figure 3.12-1: Farmland Habitat (Grassland). 2018 Number of MoS met by sites. Median = thick border

Department of Agriculture, Food and the Marine 57
Year 2 Analysis of Actions under GLAS
RSK ADAS Project: 1020044
to meeting the positive indicator for machair had it been assessed as such. Weather conditions (cold late spring and hot dry summer) may have been a factor in the low abundances.
Table 3.12-2: Farmland Habitat (Grassland). 2018 Site level and summary performance on underlying data
Site
Type
34
Co
ver of
bra
cken /
scrub
(%)
Co
ver of tree
/ shru
b (%
)
Co
ver of
un
desira
bles
(%)
Co
ver of so
ft
rush
es (%)
Co
ver of b
are
gro
un
d (%
)
Co
ver of
Ryeg
rass (%
)
Co
ver of
Wh
ite clover
etc. (%)
Co
ver of
wild
flow
er /
sedg
e (%)
Po
sitive
ind
icato
r
1 N 0.0 0.0 8.7 0.0 0.0 8.7 0.0 34.5 2F, 0O
2 M 9.0 0.0 1.7 0.5 7.2 0.5 0.9 21.6 2F, 2O
3 M 2.0 0.0 0.0 0.8 0.0 0.0 0.3 18.0 1F, 0O
4 M 0.0 0.0 0.2 7.1 0.0 0.0 3.9 21.2 1F, 2O
5 C 0.0 0.0 0.4 0.0 7.1 0.0 1.1 48.5 4F, 0O
6 N 0.0 0.0 0.0 0.0 0.0 49.0 13.9 4.7 0F, 0O
7 N 0.0 0.0 0.0 0.0 0.0 38.0 14.0 24.0 1F, 0O
8 N 0.0 0.0 1.2 0.0 0.0 52.0 8.2 17.1 1F, 0O
9 N 0.0 0.0 0.0 0.0 0.0 78.5 2.5 1.2 0F, 0O
10 N 1.0 0.0 1.6 0.0 0.0 15.3 5.7 45.5 0F, 1O
11 M 0.0 15.0 0.1 0.0 0.1 66.5 9.2 3.5 0F, 0O
12 N 20.0 35.0 0.0 6.0 0.0 0.0 2.5 38.5 3F, 3O
13 N 1.0 0.0 0.0 0.7 0.4 10.5 40.5 9.4 0F, 0O
14 A 2.0 2.0 1.5 27.0 0.2 0.0 12.6 35.0 3F, 4O
15 M 0.0 0.0 3.2 43.5 30.0 0.0 20.0 18.5 0F, 1O
16 M 0.0 0.0 1.7 24.0 0.1 0.0 19.5 16.8 3F, 3O
17 N 0.0 0.0 1.6 4.0 2.7 50.0 48.5 1.6 0F, 0O
18 N 0.0 5.0 3.7 12.0 0.8 3.0 24.9 38.6 1F, 2O
19 A 0.0 0.0 0.1 7.0 0.2 0.0 3.5 3.0 0F, 2O
20 N 0.0 0.0 1.2 0.0 0.0 20.5 4.5 13.5 1F, 0O
21 N 0.0 5.0 3.5 0.0 0.0 21.0 11.5 22.0 1F, 0O
22 M 5.0 20.0 0.0 29.0 3.9 8.5 12.5 11.1 1F, 0O
23 N 0.0 0.0 0.0 0.0 0.0 7.7 3.9 8.9 0F, 2O
24 N 0.0 1.0 0.2 0.0 5.2 26.5 21.5 39.8 0F, 0O
25 N 0.0 0.0 6.0 0.0 0.0 20.5 9.7 16.0 0F, 1O
26 N 30.0 10.0 3.0 41.5 4.7 3.5 11.5 10.7 0F, 1O
27 N 0.0 0.0 8.7 0.0 11.5 37.0 6.0 0.0 0F, 0O
28 A 0.0 0.0 5.7 17.7 0.0 0.0 5.7 3.9 1F, 0O
29 A 15.0 0.0 0.0 0.0 0.7 0.0 0.0 41.5 2F, 3O
Mean - 2.9 3.2 1.9 7.6 2.9 2.6 17.8 19.6 1.0F, 0.9O
Median - 0.0 0.0 1.2 0.0 0.0 0.1 8.5 17.1 1F, 0O
Q_25 - 0.0 0.0 0.0 0.0 0.0 0.0 0.0 8.9 0F, 0O
Q_75 - 1.0 1.0 3.0 7.1 1.0 2.7 26.5 34.5 1F, 2O
34 N = Neutral, A = Acid, C = Calcareous, M = Marshy

Department of Agriculture, Food and the Marine 58
Year 2 Analysis of Actions under GLAS
RSK ADAS Project: 1020044
3.12.3 Grassland Comparative Analysis
For the reasons outlined above, results could be compared year-on-year for 27 of the 29 sites. On average the number of MoS met per site is comparable to last year, with the median score also six out of nine (Figure 3.12-2). However, there has been a slight improvement with fewer sites scoring in lower categories (3, 5, and 6) and more sites scoring 7 out of 9. Almost half (48%) of sites now achieve at least seven MoS as compared to 29% previously.
More sites (10) improved their scores than dropped back (6). Sites #16 and #21 improved by three MoS. One site (#14) achieved all MoS, though not the same site as in the first year (#5). As per Figure 3.12-3, the change can be largely attributed to two factors. Firstly, management of trees and shrubs has improved with 78% of sites now having less than 5% on site as opposed to 59% at baseline. Secondly, the combined cover of wildflower and sedges has increased on average from 14% to 19% (see Table 3.12-6). This has brought a number of sites above the 20% threshold, namely #1, #2, #4, #7, #10, #21, and #29. Otherwise the performance on criteria is broadly the same as last year.
Figure 3.12-2: Farmland Habitat (Grassland). 2018 vs. 2017 Number of MoS met by sites. Median = thick border
0
2
4
6
8
10
12
0 1 2 3 4 5 6 7 8 9
Co
un
t o
f Si
tes
MoS met
2017 2018
0
2
4
6
8
10
12
-2 -1 0 1 2 3C
ou
nt
of
Site
sDifference in MoS met (2018 minus 2017)
Figure 3.12-3: Farmland Habitat (Grassland). 2018 vs. 2017. Individual MoS. Paired surveys (n = 27)
0 10 20 30 40 50 60 70 80 90 100
The combined cover of bracken & scrub should be < 5%
The combined cover of trees and shrubs < 5%
The combined cover of undesirable species should be < 5%
The combined cover of soft rushes should be < 50%
The cover of bare ground should be < 5%
The cover of Ryegrass should be < 10%
The combined cover of White clover, Daisy, Creepingbuttercup < 30%
The combined cover of wildflowers and sedges should be >20%
Positive indicator species meet Frequent and Occasionalthresholds
2017 % passed 2018 % passed

Department of Agriculture, Food and the Marine 59
Year 2 Analysis of Actions under GLAS
RSK ADAS Project: 1020044
The significance of the differences between the two years on MoS was assessed by means of an exact symmetry test for paired data (Table 3.12-3). To assess the action as a whole, the pass and fail rates for valid paired data were compared and values added to a contingency table matrix. No significant differences were found at the overall MoS type level or at the individual MoS level.
Table 3.12-3: Farmland Habitat (Grassland). 2018 vs. 2017. Number of MoS. Exact Symmetry Test
Fail 17 Fail 18
Fail 17 Pass 18
Pass 17 Fail 18
Pass 17 Pass 18
P value
All outcome MoS 56 25 16 146 0.211
The combined cover of bracken & scrub should be < 5% 1 4 3 19 1
The combined cover of trees and shrubs < 5% 6 5 0 16 0.063
The combined cover of undesirable species should be < 5%
1 1 2 23 1
The combined cover of soft rushes should be < 50% 0 0 0 27 -
The cover of bare ground should be < 5% 1 4 4 18 1
The cover of Perennial ryegrass should be < 10% 10 2 3 12 1
The combined cover of White clover, Daisy, Creeping buttercup < 30%
1 1 1 24 1
The combined cover of wildflowers and sedges should be > 20%
15 6 1 5 0.125
Positive indicator species meet Frequent and Occasional thresholds
21 2 2 2 1
The outcome MoS data are underpinned by variables which can be further assessed for changes at underlying level (Table 3.12-4). There does appear to have been a notable increase, on average, in the cover of wildflower and sedges (from a median of 9% to a median of 17%), which has obviously underpinned the improvement in this MoS. Indeed, the difference in the wildflower cover between the two years is significant according to a Wilcoxon Signed Rank test. (Z = -2.331, p = 0.02). The same test also indicates that there has been a significant change (increase) in the cover of soft rushes between the years (Z = 2.448, p = 0.014), although the current levels are well below the threshold for the MoS so this is unlikely to be of much consequence to the action.
Table 3.12-4: Farmland Habitat (Grassland). 2018 vs. 2017 Underlying data. Wilcoxon Signed Rank Test
2017 2018 Wilcoxon Signed Rank
Variable Paired
surveys Mean Median Mean Median Z score P value
Bracken / scrub cover (%) 27 2.5 0.0 2.6 0.0 -0.136 0.892
Tree / shrub cover (%) 27 5.3 0.0 3.4 0.0 1.300 0.194
Undesirables cover (%) 27 1.4 0.2 1.8 1.2 -0.974 0.330
Soft rush cover (%) 27 7.3 0.2 7.5 0.0 2.448 0.014*
Bare ground cover (%) 27 4.2 1.2 2.7 0.1 1.294 0.196
Ryegrass cover (%) 27 25.7 4.0 19.2 8.7 1.299 0.194
White clover, Daisy, Creeping buttercup cover (%)
27 12.2 8.3 11.6 9.2 -0.012 0.990
Wildflower / sedge cover (%) 27 14.4 8.9 19.4 17.1 -2.331 0.020*
Count of Frequent 27 1.0 1.0 0.9 1.0 0.688 0.492
Count of Occasional 27 1.0 0.0 0.9 0.0 0.089 0.929
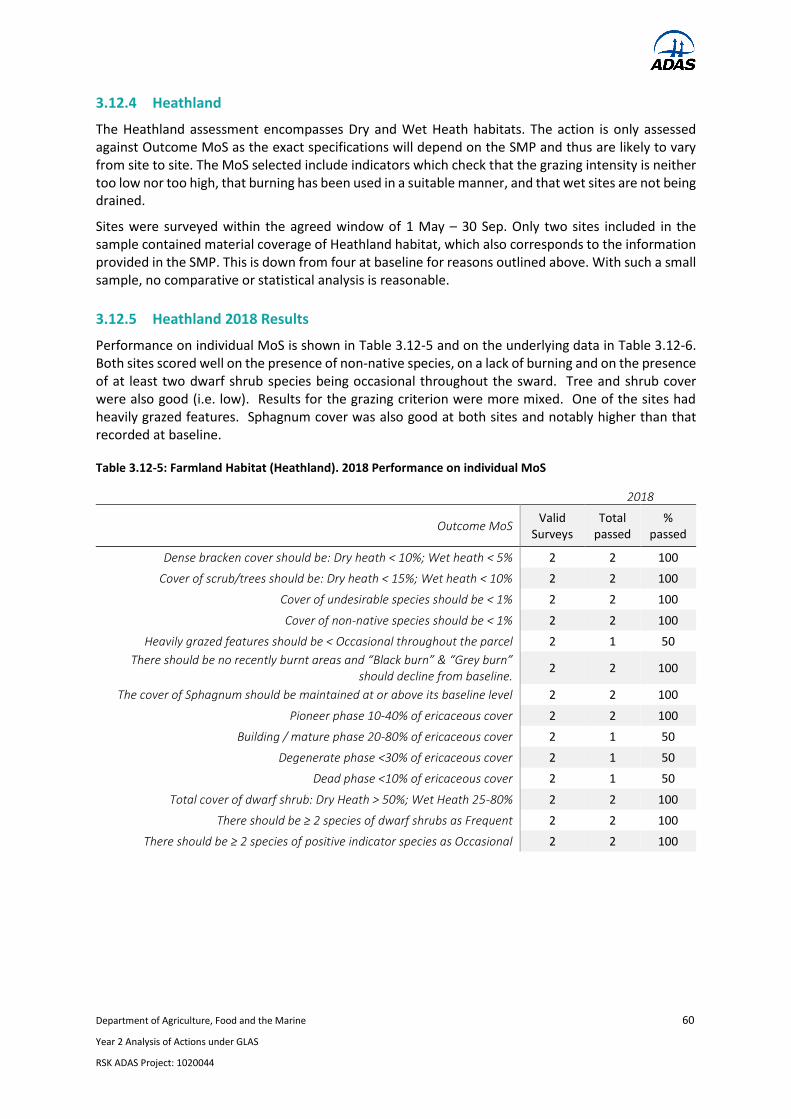
Department of Agriculture, Food and the Marine 60
Year 2 Analysis of Actions under GLAS
RSK ADAS Project: 1020044
3.12.4 Heathland
The Heathland assessment encompasses Dry and Wet Heath habitats. The action is only assessed against Outcome MoS as the exact specifications will depend on the SMP and thus are likely to vary from site to site. The MoS selected include indicators which check that the grazing intensity is neither too low nor too high, that burning has been used in a suitable manner, and that wet sites are not being drained.
Sites were surveyed within the agreed window of 1 May – 30 Sep. Only two sites included in the sample contained material coverage of Heathland habitat, which also corresponds to the information provided in the SMP. This is down from four at baseline for reasons outlined above. With such a small sample, no comparative or statistical analysis is reasonable.
3.12.5 Heathland 2018 Results
Performance on individual MoS is shown in Table 3.12-5 and on the underlying data in Table 3.12-6. Both sites scored well on the presence of non-native species, on a lack of burning and on the presence of at least two dwarf shrub species being occasional throughout the sward. Tree and shrub cover were also good (i.e. low). Results for the grazing criterion were more mixed. One of the sites had heavily grazed features. Sphagnum cover was also good at both sites and notably higher than that recorded at baseline.
Table 3.12-5: Farmland Habitat (Heathland). 2018 Performance on individual MoS
2018
Outcome MoS Valid
Surveys Total
passed %
passed
Dense bracken cover should be: Dry heath < 10%; Wet heath < 5% 2 2 100
Cover of scrub/trees should be: Dry heath < 15%; Wet heath < 10% 2 2 100
Cover of undesirable species should be < 1% 2 2 100
Cover of non-native species should be < 1% 2 2 100
Heavily grazed features should be < Occasional throughout the parcel 2 1 50
There should be no recently burnt areas and “Black burn” & “Grey burn” should decline from baseline.
2 2 100
The cover of Sphagnum should be maintained at or above its baseline level 2 2 100
Pioneer phase 10-40% of ericaceous cover 2 2 100
Building / mature phase 20-80% of ericaceous cover 2 1 50
Degenerate phase <30% of ericaceous cover 2 1 50
Dead phase <10% of ericaceous cover 2 1 50
Total cover of dwarf shrub: Dry Heath > 50%; Wet Heath 25-80% 2 2 100
There should be ≥ 2 species of dwarf shrubs as Frequent 2 2 100
There should be ≥ 2 species of positive indicator species as Occasional 2 2 100

Department of Agriculture, Food and the Marine 61
Year 2 Analysis of Actions under GLAS
RSK ADAS Project: 1020044
Table 3.12-6: Farmland Habitat (Heathland) 2018. Site level performance on underlying data
Site
Type
Co
ver of b
racken
(%)
Co
ver of scru
b / tree (%
)
Co
ver of u
nd
esirab
le species (%
)
Co
ver of n
on
-na
tives (%)
Hea
vily gra
zed fea
tures (%
)
Co
ver of b
urn
t area
s (%)
Co
ver of sp
ha
gn
um
(%)
Co
ver of sp
ha
gn
um
at b
aselin
e
(%)
Dw
arf sh
rub
gro
wth
form
35
Co
ver of d
wa
rf shru
b (%
)
Dw
arf sh
rub
species freq
uen
t
Po
sitive ind
icato
r species
frequ
ency
1 Mosaic 0 0 0 0 50 0 15 6 25P, 75B
54 2 2F, 0O
2 Mosaic 0 0 0 0 10 0 18 1 60B, 30D, 10DD
52 2 4F, 0O
3.12.6 Heathland Comparative Analysis
With such a small sample and two sites having been removed relative to 2017, no comparative or statistical analysis is reasonable.
35 P = Pioneer, B = Building/mature, D = Degenerate, DD = Dead
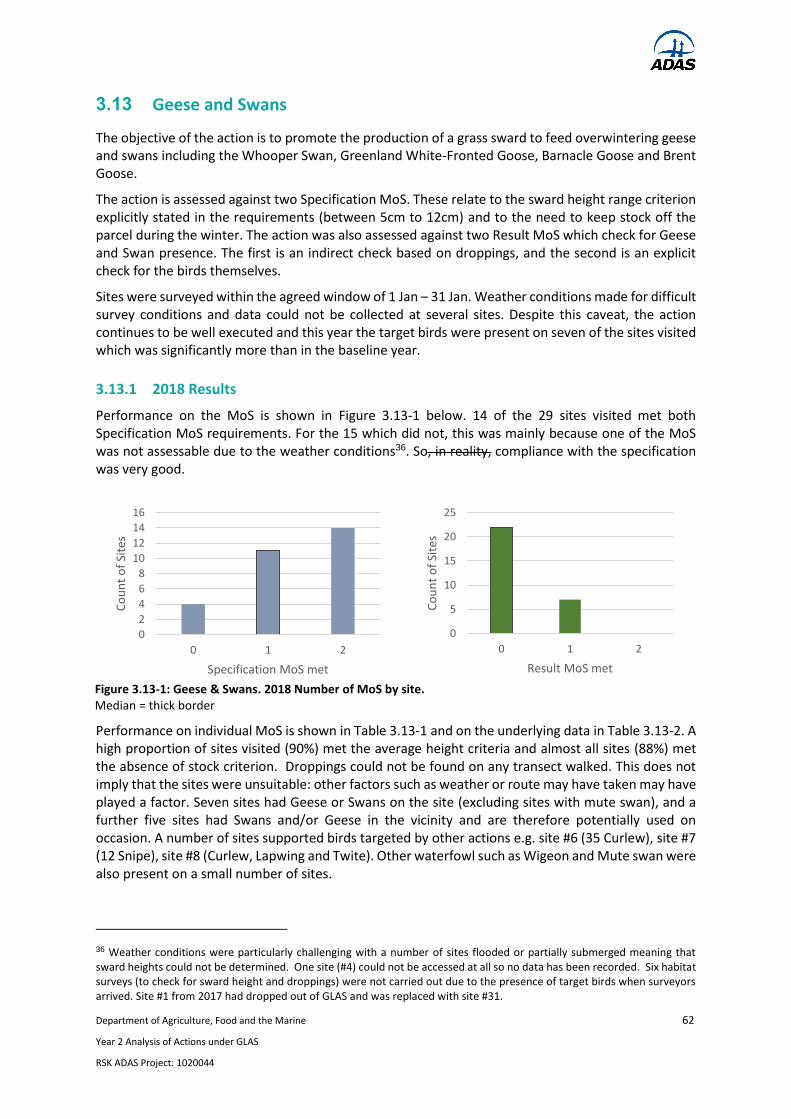
Department of Agriculture, Food and the Marine 62
Year 2 Analysis of Actions under GLAS
RSK ADAS Project: 1020044
3.13 Geese and Swans
The objective of the action is to promote the production of a grass sward to feed overwintering geese and swans including the Whooper Swan, Greenland White-Fronted Goose, Barnacle Goose and Brent Goose.
The action is assessed against two Specification MoS. These relate to the sward height range criterion explicitly stated in the requirements (between 5cm to 12cm) and to the need to keep stock off the parcel during the winter. The action was also assessed against two Result MoS which check for Geese and Swan presence. The first is an indirect check based on droppings, and the second is an explicit check for the birds themselves.
Sites were surveyed within the agreed window of 1 Jan – 31 Jan. Weather conditions made for difficult survey conditions and data could not be collected at several sites. Despite this caveat, the action continues to be well executed and this year the target birds were present on seven of the sites visited which was significantly more than in the baseline year.
3.13.1 2018 Results
Performance on the MoS is shown in Figure 3.13-1 below. 14 of the 29 sites visited met both Specification MoS requirements. For the 15 which did not, this was mainly because one of the MoS was not assessable due to the weather conditions36. So, in reality, compliance with the specification was very good.
Performance on individual MoS is shown in Table 3.13-1 and on the underlying data in Table 3.13-2. A high proportion of sites visited (90%) met the average height criteria and almost all sites (88%) met the absence of stock criterion. Droppings could not be found on any transect walked. This does not imply that the sites were unsuitable: other factors such as weather or route may have taken may have played a factor. Seven sites had Geese or Swans on the site (excluding sites with mute swan), and a further five sites had Swans and/or Geese in the vicinity and are therefore potentially used on occasion. A number of sites supported birds targeted by other actions e.g. site #6 (35 Curlew), site #7 (12 Snipe), site #8 (Curlew, Lapwing and Twite). Other waterfowl such as Wigeon and Mute swan were also present on a small number of sites.
36 Weather conditions were particularly challenging with a number of sites flooded or partially submerged meaning that sward heights could not be determined. One site (#4) could not be accessed at all so no data has been recorded. Six habitat surveys (to check for sward height and droppings) were not carried out due to the presence of target birds when surveyors arrived. Site #1 from 2017 had dropped out of GLAS and was replaced with site #31.
Figure 3.13-1: Geese & Swans. 2018 Number of MoS by site. Median = thick border
0
2
4
6
8
10
12
14
16
0 1 2
Co
un
t o
f Si
tes
Specification MoS met
0
5
10
15
20
25
0 1 2
Co
un
t o
f Si
tes
Result MoS met

Department of Agriculture, Food and the Marine 63
Year 2 Analysis of Actions under GLAS
RSK ADAS Project: 1020044
Table 3.13-1: Geese & Swans. 2018. Performance on individual MoS
2018
Specification MOS Valid Surveys Total passed % passed
Average height of sward between 5cm to 12cm 20 18 90
Stock absent 24 21 88
Result MOS Valid Surveys Total passed % passed
Geese or Swan droppings present 29 0 0
Geese or Swans present 29 7 24
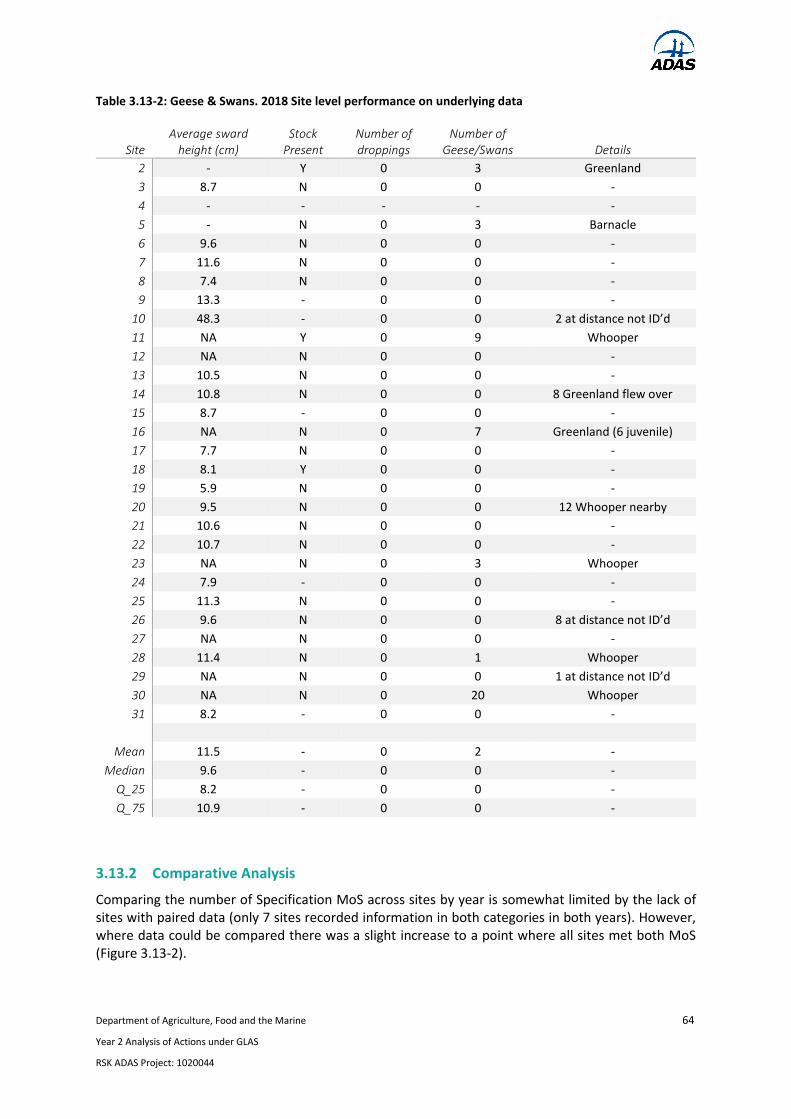
Department of Agriculture, Food and the Marine 64
Year 2 Analysis of Actions under GLAS
RSK ADAS Project: 1020044
Table 3.13-2: Geese & Swans. 2018 Site level performance on underlying data
Site Average sward
height (cm) Stock
Present Number of droppings
Number of Geese/Swans Details
2 - Y 0 3 Greenland
3 8.7 N 0 0 -
4 - - - - -
5 - N 0 3 Barnacle
6 9.6 N 0 0 -
7 11.6 N 0 0 -
8 7.4 N 0 0 -
9 13.3 - 0 0 -
10 48.3 - 0 0 2 at distance not ID’d
11 NA Y 0 9 Whooper
12 NA N 0 0 -
13 10.5 N 0 0 -
14 10.8 N 0 0 8 Greenland flew over
15 8.7 - 0 0 -
16 NA N 0 7 Greenland (6 juvenile)
17 7.7 N 0 0 -
18 8.1 Y 0 0 -
19 5.9 N 0 0 -
20 9.5 N 0 0 12 Whooper nearby
21 10.6 N 0 0 -
22 10.7 N 0 0 -
23 NA N 0 3 Whooper
24 7.9 - 0 0 -
25 11.3 N 0 0 -
26 9.6 N 0 0 8 at distance not ID’d
27 NA N 0 0 -
28 11.4 N 0 1 Whooper
29 NA N 0 0 1 at distance not ID’d
30 NA N 0 20 Whooper
31 8.2 - 0 0 -
Mean 11.5 - 0 2 -
Median 9.6 - 0 0 -
Q_25 8.2 - 0 0 -
Q_75 10.9 - 0 0 -
3.13.2 Comparative Analysis
Comparing the number of Specification MoS across sites by year is somewhat limited by the lack of sites with paired data (only 7 sites recorded information in both categories in both years). However, where data could be compared there was a slight increase to a point where all sites met both MoS (Figure 3.13-2).

Department of Agriculture, Food and the Marine 65
Year 2 Analysis of Actions under GLAS
RSK ADAS Project: 1020044
No sites met both Result MoS in either year, but the numbers meeting at least one has increased, driven by the improvement in the numbers of birds physically observed (Figure 3.13-3). As per Figure 3.13-4 scores were similar on the stock absence criterion, but have improved slightly in terms of achieving a desirable sward height. There were at least some sites with droppings present in 2017 as compared to the zero recorded in 2018. However, the number of sites with actual birds present has increased from one to seven.
Figure 3.13-4: Geese & Swans. 2018 vs. 2017. Individual MoS. Paired surveys only (n as shown)
The significance of the differences between the two years was assessed by means of an exact symmetry test for paired data (Table 3.13-3). To assess the action as a whole, the pass and fail rates for Specification MoS for valid paired data were compared and values added to a contingency table matrix. There was found to be no significant difference between the pass rates in the two years. The
0 10 20 30 40 50 60 70 80 90 100
Average height of sward between 5cm to 12cm (19)
Stock absent (11)
Geese or Swan droppings present (28)
Geese or Swans present (28)
2017 % passed 2018 % passed
Figure 3.13-3: Geese & Swans. 2018 vs. 2017. Number of Result MoS met by sites. Median = thick border
Figure 3.13-2: Geese & Swans. 2018 vs. 2017. Number of Specification MoS met by sites. Median = thick border
0
1
2
3
4
5
6
7
8
0 1 2
Co
un
t o
f Si
tes
Specification MoS met
2017 2018
0
1
2
3
4
5
6
0 1
Co
un
t o
f Si
tes
Difference in MOS met (2018 - 2017)
0
5
10
15
20
25
30
0 1 2
Co
un
t o
f Si
tes
Result MoS met
2017 2018
0
5
10
15
20
25
-1 0 1
Co
un
t o
f Si
tes
Difference in MOS met (2018 - 2017)
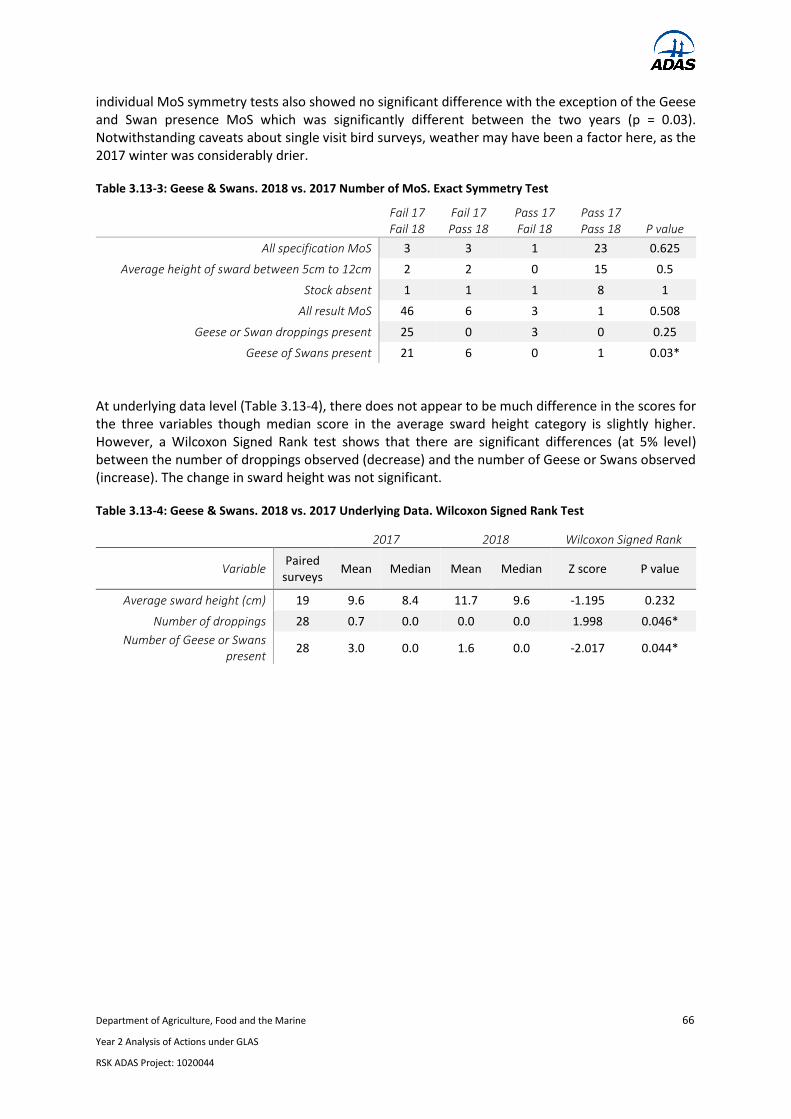
Department of Agriculture, Food and the Marine 66
Year 2 Analysis of Actions under GLAS
RSK ADAS Project: 1020044
individual MoS symmetry tests also showed no significant difference with the exception of the Geese and Swan presence MoS which was significantly different between the two years (p = 0.03). Notwithstanding caveats about single visit bird surveys, weather may have been a factor here, as the 2017 winter was considerably drier.
Table 3.13-3: Geese & Swans. 2018 vs. 2017 Number of MoS. Exact Symmetry Test
Fail 17 Fail 18
Fail 17 Pass 18
Pass 17 Fail 18
Pass 17 Pass 18 P value
All specification MoS 3 3 1 23 0.625
Average height of sward between 5cm to 12cm 2 2 0 15 0.5
Stock absent 1 1 1 8 1
All result MoS 46 6 3 1 0.508
Geese or Swan droppings present 25 0 3 0 0.25
Geese of Swans present 21 6 0 1 0.03*
At underlying data level (Table 3.13-4), there does not appear to be much difference in the scores for the three variables though median score in the average sward height category is slightly higher. However, a Wilcoxon Signed Rank test shows that there are significant differences (at 5% level) between the number of droppings observed (decrease) and the number of Geese or Swans observed (increase). The change in sward height was not significant.
Table 3.13-4: Geese & Swans. 2018 vs. 2017 Underlying Data. Wilcoxon Signed Rank Test
2017 2018 Wilcoxon Signed Rank
Variable Paired
surveys Mean Median Mean Median Z score P value
Average sward height (cm) 19 9.6 8.4 11.7 9.6 -1.195 0.232
Number of droppings 28 0.7 0.0 0.0 0.0 1.998 0.046*
Number of Geese or Swans present
28 3.0 0.0 1.6 0.0 -2.017 0.044*

Department of Agriculture, Food and the Marine 67
Year 2 Analysis of Actions under GLAS
RSK ADAS Project: 1020044
3.14 Grey Partridge
The objective of the action is to promote and maintain suitable breeding and foraging habitats for the Grey Partridge. It requires landholders to establish a grass margin to act as a nesting habitat as well as an arable margin that forms a brood rearing habitat.
The Grey Partridge action was assessed against four Specification MoS. Two of these relate to the specifications set out for the grass and arable margin dimensions. The two others check that landholders have achieved the balance and cover of arable species for that margin. The action was also assessed against a Result MoS which is an explicit check for the birds themselves
Sites were surveyed within the agreed window of mid-March to mid-April. Overall, the performance on the specification is very good and is significantly better than last year, driven by an improvement in the cumulative cover of the desired crop species in the arable margin. Despite this, Grey Partridge were only observed on three sites. This may simply reflect the slow speed at which this bird colonises new areas.
3.14.1 2018 Results
Performance on the MoS is shown in Figure 3.14-1 below. 20 of the 29 sites assessed37 met all four Specification MoS requirements. Despite this, Grey Partridge were only present on three sites.
Performance on individual MoS is shown in Table 3.14-1 and on the underlying data in Table 3.14-2. Performance was very good with 69% of sites meeting all MoS and 28% meeting all but one. Only one site (#7) was below this, where the cereal margin was not present. 90% of sites had at least three target species present, though cover was sometimes dominated by one species alone. Kale and chicory in particular were well established to the detriment of other species. Overall cover of the desired arable crops in the margin was also good with 76% of sites meeting this requirement.
37 Site #8 could not be assessed for specification MoS as the margins had not been implemented.
0
5
10
15
20
25
0 1 2 3 4
Co
un
t o
f Si
tes
Specification MoS met
0
5
10
15
20
25
30
0 1
Co
un
t o
f Si
tes
Result MoS met
Figure 3.14-1: Grey Partridge. 2018 Number of MoS met by site. Median = thick border
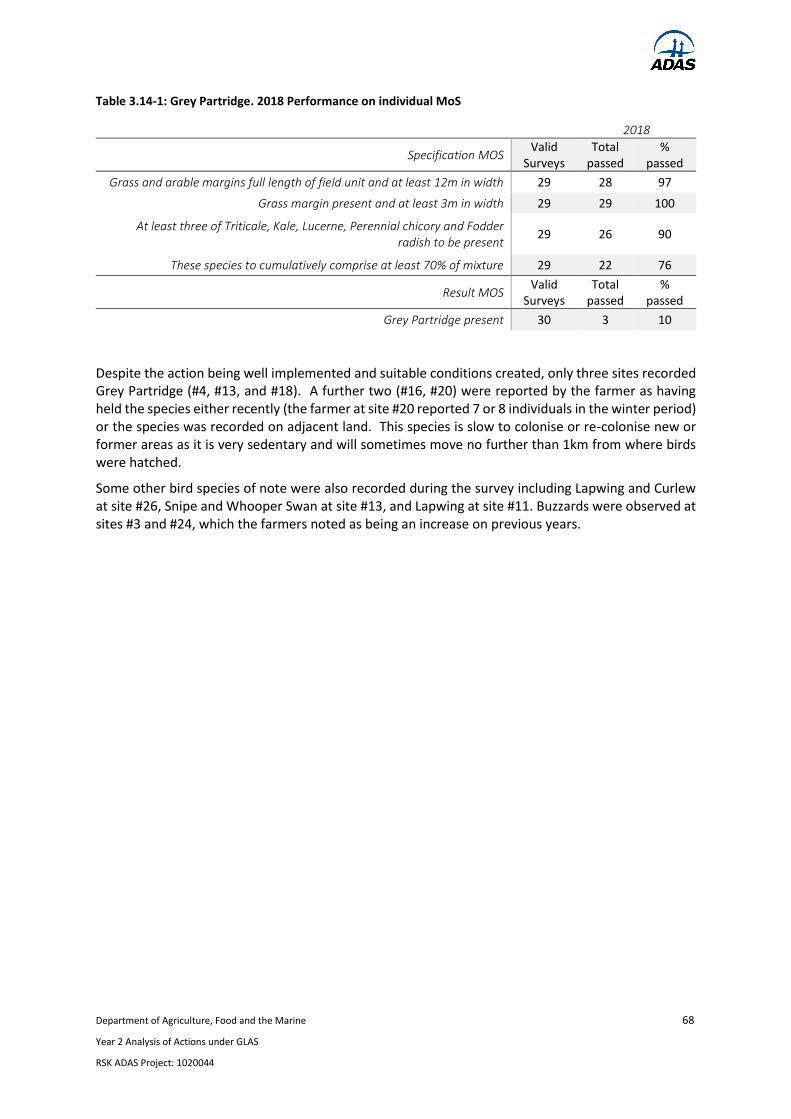
Department of Agriculture, Food and the Marine 68
Year 2 Analysis of Actions under GLAS
RSK ADAS Project: 1020044
Table 3.14-1: Grey Partridge. 2018 Performance on individual MoS
2018
Specification MOS Valid
Surveys Total
passed %
passed
Grass and arable margins full length of field unit and at least 12m in width 29 28 97
Grass margin present and at least 3m in width 29 29 100
At least three of Triticale, Kale, Lucerne, Perennial chicory and Fodder radish to be present
29 26 90
These species to cumulatively comprise at least 70% of mixture 29 22 76
Result MOS Valid
Surveys Total
passed %
passed
Grey Partridge present 30 3 10
Despite the action being well implemented and suitable conditions created, only three sites recorded Grey Partridge (#4, #13, and #18). A further two (#16, #20) were reported by the farmer as having held the species either recently (the farmer at site #20 reported 7 or 8 individuals in the winter period) or the species was recorded on adjacent land. This species is slow to colonise or re-colonise new or former areas as it is very sedentary and will sometimes move no further than 1km from where birds were hatched.
Some other bird species of note were also recorded during the survey including Lapwing and Curlew at site #26, Snipe and Whooper Swan at site #13, and Lapwing at site #11. Buzzards were observed at sites #3 and #24, which the farmers noted as being an increase on previous years.

Department of Agriculture, Food and the Marine 69
Year 2 Analysis of Actions under GLAS
RSK ADAS Project: 1020044
Table 3.14-2: Grey Partridge. 2018 Site level performance on underlying data
Site
12m width arable/grass margin
present 3m width grass margin present
Number of target crop species
Cover of target crop species
Grey Partridge number
1 Y Y 5 67.5 0
2 Y Y 5 61.2 0
3 Y Y 3 77.0 0
4 Y Y 4 73.5 2
5 Y Y 4 76.2 0
6 Y Y 5 92.9 0
7 N Y 0 0.0 0
8 - - - - 0
9 Y Y 3 75.5 0
10 Y Y 3 86.2 0
11 Y Y 3 76.5 0
12 Y Y 5 83.5 0
13 Y Y 3 38.2 4
14 Y Y 5 78.0 0
15 Y Y 4 91.2 0
16 Y Y 4 77.3 0
17 Y Y 4 74.7 0
18 Y Y 5 71.9 1
19 Y Y 3 57.0 0
20 Y Y 5 99.2 0
21 Y Y 3 92.9 0
22 Y Y 1 73.0 0
23 Y Y 2 74.5 0
24 Y Y 4 85.9 0
25 Y Y 3 37.0 0
26 Y Y 4 82.6 0
27 Y Y 5 90.9 0
28 Y Y 5 68.2 0
29 Y Y 5 92.6 0
30 Y Y 3 92.9 0
Mean - - 4 74.1 0
Median - - 4 76.5 0
Q_25 - - 3 71.9 0
Q_75 - - 5 86.2 0

Department of Agriculture, Food and the Marine 70
Year 2 Analysis of Actions under GLAS
RSK ADAS Project: 1020044
3.14.2 Comparative Analysis
The same MoS were assessed in the baseline year, allowing for a comparative analysis where there is paired site data between the years (Figure 3.14-2). 20 sites met all four specification MoS, which was a considerable improvement on the 14 from the baseline year. Nine sites improved their score, whilst four sites dropped back a measure. The change in site #14 was so large (+4 MoS) because in the baseline year the farmer had not correctly implemented the measure resulting in a zero score.
As per Figure 3.14-3, scores were similar on three of the specification MoS, which were already very high, but have improved notably in terms of achieving a desirable arable species cover (52% to 76% met). The number of sites with actual birds present has increased from two to three. Two sites had held Grey Partridge at baseline but they were not present this year (#11, #12). Notwithstanding caveats regarding observing birds on a single survey at a single site, the net increase in birds observed is encouraging. Given time, numbers at the sites sampled may increase and this might be observed in the final year.
0
5
10
15
20
25
0 1 2 3 4
Co
un
t o
f Si
tes
Specification MoS met
2017 2018
0
2
4
6
8
10
12
14
16
18
-1 0 1 2 3 4
Co
un
t o
f Si
tes
Difference in MoS met (2018 - 2017)
Figure 3.14-2: Grey Partridge. 2018 vs. 2017. Number of MoS met by site Median = thick border
0 10 20 30 40 50 60 70 80 90 100
Grass / arable margin full length of field unit and at least12m in width (29)
Grass margin component present and at least 3m inwidth (29)
At least three of Triticale, Kale, Lucerne, Perennialchicory and Fodder radish to be present (29)
These species to cumulatively comprise at least 70% ofmixture (29)
Grey Partridge present (30)
2017 % passed 2018 % passed
Figure 3.14-3: Grey Partridge. 2018 vs. 2017. Individual MoS Paired surveys only (n as shown)
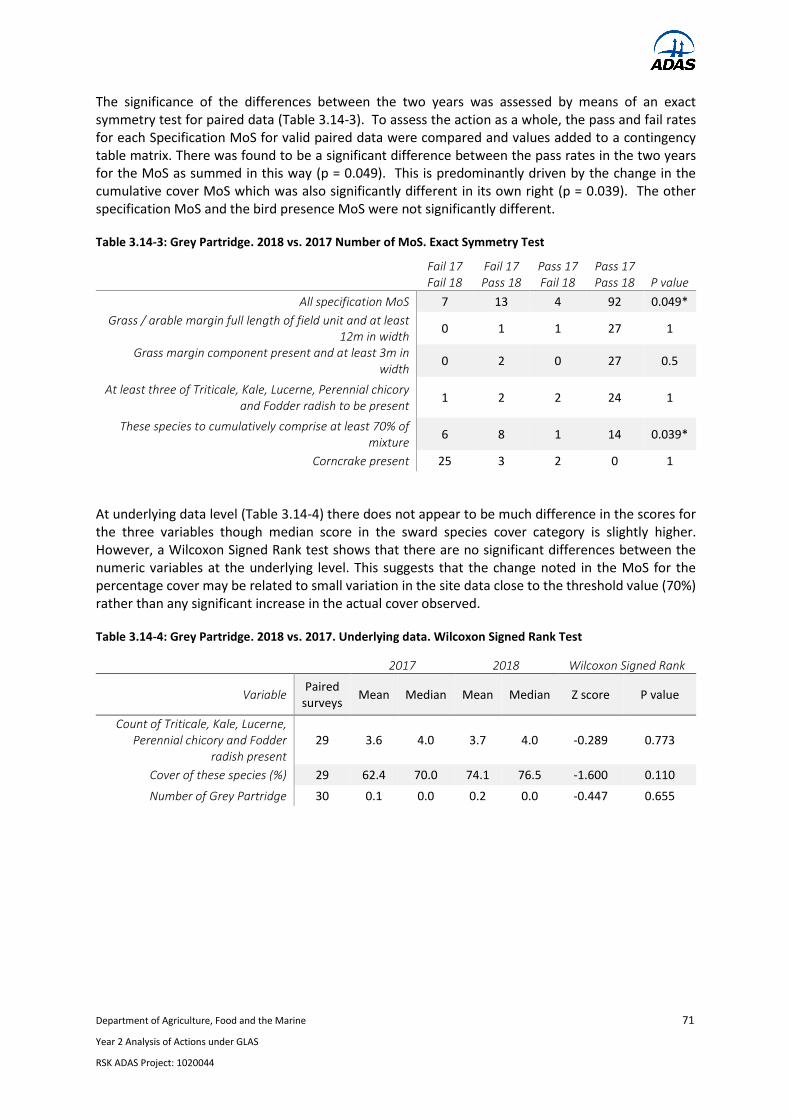
Department of Agriculture, Food and the Marine 71
Year 2 Analysis of Actions under GLAS
RSK ADAS Project: 1020044
The significance of the differences between the two years was assessed by means of an exact symmetry test for paired data (Table 3.14-3). To assess the action as a whole, the pass and fail rates for each Specification MoS for valid paired data were compared and values added to a contingency table matrix. There was found to be a significant difference between the pass rates in the two years for the MoS as summed in this way (p = 0.049). This is predominantly driven by the change in the cumulative cover MoS which was also significantly different in its own right (p = 0.039). The other specification MoS and the bird presence MoS were not significantly different.
Table 3.14-3: Grey Partridge. 2018 vs. 2017 Number of MoS. Exact Symmetry Test
Fail 17 Fail 18
Fail 17 Pass 18
Pass 17 Fail 18
Pass 17 Pass 18 P value
All specification MoS 7 13 4 92 0.049*
Grass / arable margin full length of field unit and at least 12m in width
0 1 1 27 1
Grass margin component present and at least 3m in width
0 2 0 27 0.5
At least three of Triticale, Kale, Lucerne, Perennial chicory and Fodder radish to be present
1 2 2 24 1
These species to cumulatively comprise at least 70% of mixture
6 8 1 14 0.039*
Corncrake present 25 3 2 0 1
At underlying data level (Table 3.14-4) there does not appear to be much difference in the scores for the three variables though median score in the sward species cover category is slightly higher. However, a Wilcoxon Signed Rank test shows that there are no significant differences between the numeric variables at the underlying level. This suggests that the change noted in the MoS for the percentage cover may be related to small variation in the site data close to the threshold value (70%) rather than any significant increase in the actual cover observed.
Table 3.14-4: Grey Partridge. 2018 vs. 2017. Underlying data. Wilcoxon Signed Rank Test
2017 2018 Wilcoxon Signed Rank
Variable Paired
surveys Mean Median Mean Median Z score P value
Count of Triticale, Kale, Lucerne, Perennial chicory and Fodder
radish present 29 3.6 4.0 3.7 4.0 -0.289 0.773
Cover of these species (%) 29 62.4 70.0 74.1 76.5 -1.600 0.110
Number of Grey Partridge 30 0.1 0.0 0.2 0.0 -0.447 0.655

Department of Agriculture, Food and the Marine 72
Year 2 Analysis of Actions under GLAS
RSK ADAS Project: 1020044
3.15 Hen Harrier
The objective of the action is to promote and maintain suitable breeding and foraging habitats for the Hen Harrier. It requires landholders to provide a mosaic of habitat types with the parcel, including tussock and rush vegetation.
The Hen Harrier action was assessed against two Specification MoS. The first of these checks that a suitable range of sward heights are present and relates to the requirements in the specification to produce a sward with tussocks and good structural diversity. The second checks that there is sufficient rush or purple moor grass present but also that these are not allowed to get too dominant in the sward (which is not suitable). The action is also assessed against three Outcome MoS. Two of these check that the parcel has low levels of improved grassland. The third checks that there is sufficient prey species available for the Hen Harrier. Both of these are important for the bird and should follow if the specifications are being met but are not in the action requirement. The action is also assessed against a Result MoS to check if any Hen Harrier are present.
Sites were surveyed within the agreed window of early April to end May. As indicated at baseline, the action was well targeted at the broad geographic scale in that all sites are within important breeding areas for Hen Harrier. Overall, in comparison to the baseline year, sites appear to be significantly better managed in terms of sward structure and are also displaying more signs of suitability for Hen Harrier.
3.15.1 2018 Results
Performance on the MoS is shown in Figure 3.15-1 below. Only seven of the 27 sites assessed38 met both Specification MoS requirements, more often than not failing to provide the full range of sward diversity. All the Outcome MoS were met on over half the sites and only one site failed to meet at least two of these. Hen Harrier themselves were present at five of the 27 sites.
Performance on individual MoS is shown in Table 3.15-1 and on the underlying data in Table 3.15-3. The breakdown of the sub-criteria unpinning the sward height MoS is provided in Table 3.15-2. 37% of the sites visited demonstrated the full range of sward heights that would be optimal for the Hen Harrier and a further 41% could meet three. All but one site met the >= 10cm sub-criterion (which is
38 One site (#29) dropped out of GLAS and was replaced by site #31. Three of the sites visited had Hen Harriers potentially breeding and so were not assessed for habitat suitability to avoid disturbance.
0
2
4
6
8
10
12
14
16
0 1 2 3
Co
un
t o
f Si
tes
Outcome MoS met
0
5
10
15
20
25
30
0 1
Co
un
t o
f Si
tes
Result MoS met
0
2
4
6
8
10
12
14
16
0 1 2
Co
un
t o
f Si
tes
Specification MoS met
Figure 3.15-1: Hen Harrier. 2018 Number of MoS met by sites Median = thick border

Department of Agriculture, Food and the Marine 73
Year 2 Analysis of Actions under GLAS
RSK ADAS Project: 1020044
explicitly mentioned in the action specification). A large majority also met the sub-criteria for areas of taller vegetation and 70% had sufficient shorter patches.
Table 3.15-1: Hen Harrier. 2018 Performance on individual MoS
2018
Specification MOS Valid
Surveys Total
passed %
passed
Sites meeting ALL sward height criteria 27 10 37
Between 40-70% of sample points to be rush or purple moor-grass dominant. Where rush is dominant at >70% samples, ground/subordinate
flora should be visible in at least 50% of these 27 18 67
Outcome MOS Valid
Surveys Total
passed %
passed
No more than 5% of samples to be classed as Improved Grassland 27 27 100
No more than 10% of species should be Perennial ryegrass or White clover 27 23 85
Site should have a minimum of 10 birds and/or small mammals recorded 27 17 63
Result MOS Valid
Surveys Total
passed %
passed
Hen Harrier present 30 5 17
Table 3.15-2: Hen Harrier. 2018 Performance on sward height MoS sub-criteria
2018
Sub-criteria for Sward Height MoS Valid Surveys Total passed % passed
At least 50% samples ≥ 10cm 27 26 96
At least 20% samples ≥ 20cm 27 22 81
At least 10% samples ≥ 30cm 27 18 67
At least 10% samples < 10cm 27 19 70
Sites meeting NO sward height criteria 27 0 0
Sites meeting ONE sward height criterion 27 0 0
Sites meeting TWO sward height criteria 27 6 22
Sites meeting THREE sward height criteria 27 11 41
Sites meeting ALL sward height criteria 27 10 37
10 of the sites had a rush or purple moor-grass dominance of 40% to 70%, with seven exceeding 70%. However, at all of these rush dominant sites, the ground or subordinate flora was visible so they passed on the MoS. Site #2 met this MoS but had a rather high scrub cover and may not have been good foraging habitat. All sites were classed as unimproved habitat, with most (84%) having acceptable levels of Perennial ryegrass and White clover. Prey availability was generally sufficient39.
Hen Harrier were recorded as being present at five of the sites visited. At three of these (#16, #21, #26) both male and female were present and may potentially have been breeding, though this could not be verified. Nine of the sites where Hen Harrier were not physically present were marked as good or reasonable foraging habitat and these are likely to form part of hen harriers' hunting ranges. Of the remaining 16 sites, most have the potential for suitability and thus higher scores if the management
39 Estimating the mammal numbers proved challenging and the overall count may be an overestimate so the score should be interpreted with a degree of caution, especially at those sites where there were few small birds present (#14, #15, #20, #28, #30)

Department of Agriculture, Food and the Marine 74
Year 2 Analysis of Actions under GLAS
RSK ADAS Project: 1020044
regime is applied. However, a small handful of sites have too much improved vegetation to become suitable habitat within the lifetime of the action (#12, #18, and #31).
Table 3.15-3: Hen Harrier. 2018 Site level performance on underlying data
Site
% in each height category
Ru
sh a
nd
pu
rple m
oo
r
gra
ss cover (%
)
% o
f sub
ord
ina
te flora
visible if ru
sh > 7
0%
Imp
roved
gra
sslan
d
cover (%
)
Ryeg
rass a
nd
clover
cover (%
)
Tota
l nu
mb
er of sm
all
bird
s an
d/o
r sma
ll m
am
ma
ls record
ed
Hen
Ha
rrier Presen
t
≥10
cm
≥20
cm
≥30
cm
<10
cm
1 80.0 33.3 20.0 30.0 23.3 - 0 0 36 Y
2 73.3 40.0 13.3 30.0 66.7 - 0 0 17 N
3 80.0 30.0 20.0 36.7 3.3 - 0 0 36 N
4 53.3 50.0 36.7 50.0 56.7 - 0 0 28 N
5 80.0 33.3 6.7 33.3 3.3 - 0 0 26 N
6 70.0 46.7 6.7 33.3 50.0 - 0 3 19 N
7 66.7 13.3 3.3 60.0 3.3 - 0 0 5 N
8 100.0 70.0 43.3 13.3 3.3 - 0 0 106 N
9 100.0 76.7 60.0 0.0 50.0 - 0 0 29 N
10 100.0 100.0 73.3 0.0 56.7 - 0 0 90 N
11 100.0 96.7 76.7 0.0 66.7 - 0 0 58 N
12 100.0 66.7 26.7 3.3 40.0 - 0 0 64 N
13 96.7 60.0 53.3 23.3 80.0 100.0 0 0 7 N
14 96.7 56.7 33.3 20.0 73.3 100.0 0 0 13 N
15 56.7 16.7 6.7 53.3 13.3 - 0 53.3 16 N
16 - - - - - - - - - Y
17 100.0 46.7 0.0 10.0 100.0 96.7 0 0 3 N
18 83.3 16.7 0.0 40.0 26.7 0 80.0 5 N
19 56.7 10.0 0.0 66.7 73.3 100.0 0 13.3 18 N
20 96.7 96.7 93.3 3.3 100.0 100.0 0 0 12 Y
21 - - - - - - - - - Y
22 86.7 43.3 30.0 23.3 66.7 - 0 10.0 3 N
23 96.7 73.3 63.3 13.3 46.7 - 0 0 4 N
24 100.0 93.3 80.0 3.3 93.3 96.4 0 0 8 N
25 40.0 40.0 33.3 60.0 40.0 - 0 0 3 N
26 - - - - - - - - - Y
27 100.0 83.3 66.7 3.3 66.7 - 0 0 2 N
28 66.7 10.0 3.3 46.7 0.0 - 0 33.3 10 N
30 93.3 76.7 63.3 20.0 73.3 100.0 0 0 12 N
31 70.0 20.0 0.0 43.3 20.0 - 0 6.7 3 N
Mean 83.1 51.9 33.8 26.7 48.0 - 0 7.4 23.4 -
Median 86.7 46.7 30.0 23.3 50.0 - 0 0 13 -
Q_25 70.0 31.7 6.7 6.7 21.7 - 0 0 5 -
Q_75 100.0 75.0 61.7 41.7 70.0 - 0 1.7 29.5 -
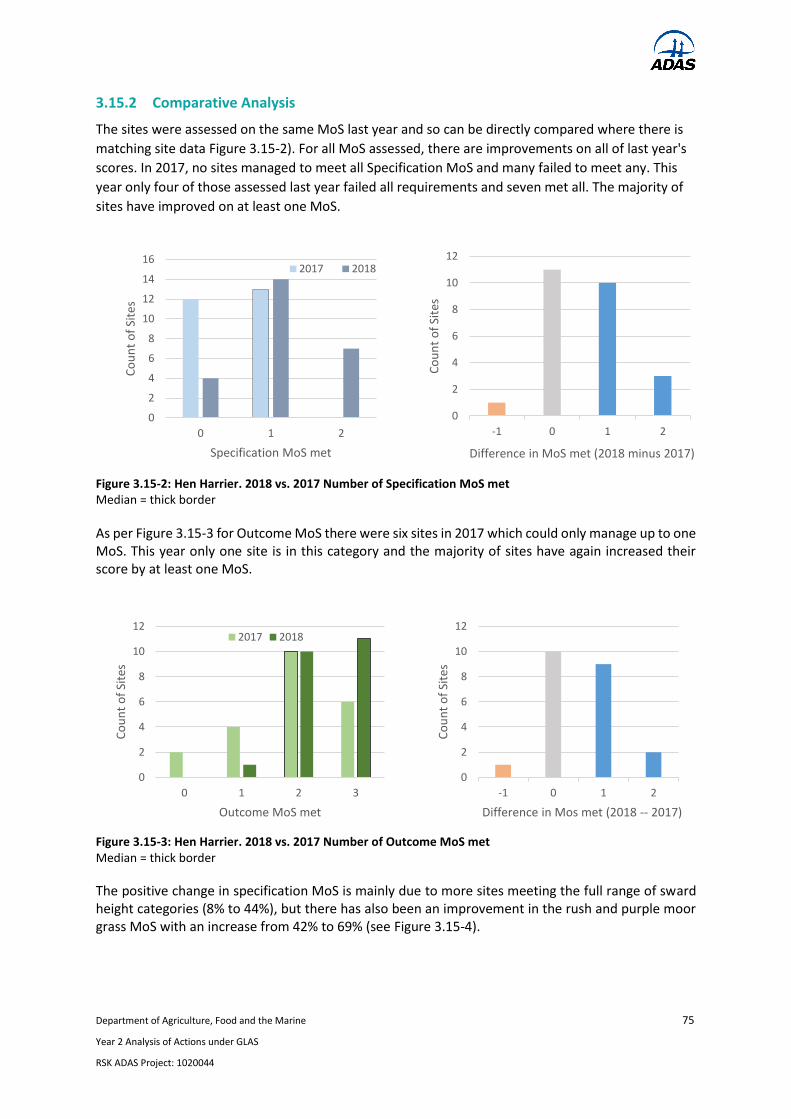
Department of Agriculture, Food and the Marine 75
Year 2 Analysis of Actions under GLAS
RSK ADAS Project: 1020044
3.15.2 Comparative Analysis
The sites were assessed on the same MoS last year and so can be directly compared where there is
matching site data Figure 3.15-2). For all MoS assessed, there are improvements on all of last year's
scores. In 2017, no sites managed to meet all Specification MoS and many failed to meet any. This
year only four of those assessed last year failed all requirements and seven met all. The majority of
sites have improved on at least one MoS.
As per Figure 3.15-3 for Outcome MoS there were six sites in 2017 which could only manage up to one MoS. This year only one site is in this category and the majority of sites have again increased their score by at least one MoS.
The positive change in specification MoS is mainly due to more sites meeting the full range of sward height categories (8% to 44%), but there has also been an improvement in the rush and purple moor grass MoS with an increase from 42% to 69% (see Figure 3.15-4).
0
2
4
6
8
10
12
14
16
0 1 2
Co
un
t o
f Si
tes
Specification MoS met
2017 2018
0
2
4
6
8
10
12
-1 0 1 2C
ou
nt
of
Site
s
Difference in MoS met (2018 minus 2017)
Figure 3.15-2: Hen Harrier. 2018 vs. 2017 Number of Specification MoS met Median = thick border
0
2
4
6
8
10
12
0 1 2 3
Co
un
t o
f Si
tes
Outcome MoS met
2017 2018
0
2
4
6
8
10
12
-1 0 1 2
Co
un
t o
f Si
tes
Difference in Mos met (2018 -- 2017)
Figure 3.15-3: Hen Harrier. 2018 vs. 2017 Number of Outcome MoS met Median = thick border

Department of Agriculture, Food and the Marine 76
Year 2 Analysis of Actions under GLAS
RSK ADAS Project: 1020044
Figure 3.15-4: Hen Harrier. 2018 vs. 2017 Individual MoS Paired surveys only (n as shown)
The positive change in the sward height MoS score is driven mainly by a sharp rise in the number of sites showing sufficient short patches, which was a weakness at the baseline survey (see Table 3.15-4). Given that the proportions meeting the taller vegetation criteria have remained largely the same, it seems unlikely that weather was a confounding factor.
Table 3.15-4: Hen Harrier. 2018 vs. 2017 Performance on sward height MoS sub-criteria
2017 2018
Components for Sward Height MoS Valid
Surveys Total
passed %
passed Total
passed %
passed
At least 50% samples ≥ 10cm 25 23 92 24 96
At least 20% samples ≥ 20cm 25 19 76 21 84
At least 10% samples ≥ 30cm 25 19 76 18 72
At least 10% samples < 10cm 25 7 28 14 56
Sites meeting NO sward height criteria 25 0 0 0 0
Sites meeting ONE sward height criterion 25 3 12 0 0
Sites meeting TWO sward height criteria 25 3 12 5 20
Sites meeting THREE sward height criteria 25 17 68 10 40
Sites meeting ALL sward height criteria 25 2 8 10 40
The number of sites where birds were recorded was similar to Year 1 (five as opposed to four). Two of these were the same as 2017 and three are different sites. The observation that three of these sites were displaying potential signs of breeding suggests that this action is producing some positive results.
The significance of the differences between the two years was assessed by means of an exact symmetry test for paired data (Table 3.15-5). To assess the action as a whole, the pass and fail rates for each type of MoS (Specification, Outcome, and Result) for valid paired data were compared and values added to a contingency table matrix.
0 20 40 60 80 100
Sites meeting ALL sward height criteria (25)
Between 40-70% of sample points to be rush or purple moor-grass dominant. Where rush is dominant at >70% …
No more than 5% of samples to be classed as ImprovedGrassland (26)
No more than 10% of species should be Perennial ryegrassor White clover (26)
Site should have a minimum of 10 birds and/or smallmammals recorded (24)
Hen Harrier present (29)
2017 % passed 2018 % passed

Department of Agriculture, Food and the Marine 77
Year 2 Analysis of Actions under GLAS
RSK ADAS Project: 1020044
Table 3.15-5: Hen Harrier. 2018 vs. 2017 Number of MoS. Exact Symmetry Test
Fail 17 Fail 18
Fail 17 Pass 18
Pass 17 Fail 18
Pass 17 Pass 18 P value
All specification MoS 20 18 2 11 0.001**
Sites meeting ALL sward height criteria 14 9 0 2 0.004**
Between 40-70% of sample points to be rush or purple moor-grass dominant. Where rush is
dominant at >70% samples, ground/subordinate flora should be visible in at least 50% of these
6 9 2 9 0.065
All outcome MoS 9 15 3 49 0.008**
No more than 5% of samples to be classed as Improved Grassland
0 5 0 21 0.063
No more than 10% of species should be Perennial ryegrass or White clover
3 3 1 19 0.625
Site should have a minimum of 10 birds and/or small mammals recorded
6 7 2 9 0.18
Hen Harrier Present 22 3 2 2 1
There was found to be a significant difference between the pass rates in the two years for the Specification MoS as summed in this way (p = 0.001). This is predominantly driven by the change in the sward height MoS which was also significantly different in its own right (p = 0.004). The change in the rush / purple moor grass MoS was not significant. Likewise, the change in the Outcome MoS was also significant (p = 0.008) but none of the individual MoS were (perhaps because the sample was not large enough to capture the signal).
Table 3.15-6: Hen Harrier. 2018 vs. 2017 Underlying Data. Wilcoxon Signed Rank Test
2017 2018 Wilcoxon Signed Rank
Variable Paired
surveys Mean Median Mean Median Z score P value
Number of Height criteria met 25 2.7 3.0 3.1 3.0 -1.785 0.074
Rush and purple moor grass cover (%)
26 49.6 53.5 49.1 53.4 0.241 0.809
Subordinate flora visible (if rush/purple moor grass cover
>70%) (%) - - - - - - -
Improved grassland cover (%) 26 14.3 0.0 0.0 0.0 2.232 0.026*
Perennial ryegrass or White clover cover (%)
26 12.9 0.0 7.4 0.0 1.022 0.307
Prey number (birds and small mammals)
24 18.2 11.0 25.7 16.5 -2.087 0.037*
At underlying data level (Table 3.15-6) there does not appear to be much difference in the scores for the number of height criteria met and the rush / purple more grass cover, but there are clear differences in the other data with indicators for improvement decreasing, prey numbers increasing and the mean number of height criteria met also increasing. A Wilcoxon Signed Rank test shows that there are no significant differences between the two years on the underlying data underpinning the Specification MoS at the underlying level. However, the decrease in improved grassland cover and the increase in prey numbers estimated by surveyors are both significant (Z = 2.232, p = 0.026; Z = -2.087, p = 0.037; respectively).

Department of Agriculture, Food and the Marine 78
Year 2 Analysis of Actions under GLAS
RSK ADAS Project: 1020044
3.16 Laying of Hedgerows
The objective of the action is to rejuvenate overgrown hedgerows, increase biodiversity and enhance the visual landscape.
The action was assessed against seven Specification MoS in 2018. These check the execution of the work, the subsequent replanting of any gaps with native species40, and the protection of the regrowth from competitive vegetation and livestock. Two other MoS linked to the specification are not assessed until 2020 as they require a time comparison (the action was subject to an implementation check in 2017 only). Although the assessment only considers items in the specification, the data collected is intended to inform evaluators about the ecological quality of the rejuvenated hedgerow and is not a compliance verification.
Sites were visited during the agreed window of 1 Apr – 30 Sep. Overall, the findings discussed below indicate a reasonable level of execution of the initial work and subsequent replanting work, though planting density was often too low. Aftercare could be improved as most sites have some level of competitive vegetation issue, but most sites are at least stock-proof. On the positive side, native species appeared to have been used and damage to mature trees has been avoided.
3.16.1 2018 Results
At site level, the majority of sites surveyed41 (20 out of 27) met at least four MoS, mostly failing on the competitive vegetation criteria (Figure 3.16-1). The observation should be taken into context in that the native species in gap planting criterion was only relevant on about half of the sites visited. In six cases, there is also shortfall because planting density could not be judged by the surveyor.
Figure 3.16-1: Hedge Laying. 2018 Number of MoS met by site Median = thick border
Performance on individual MoS is shown in Table 3.16-1 and on the underlying data in Table 3.16-2. Hedgerow gaps were absent in the majority of cases (23). Of these, nine had been fully replanted with native species and the remaining 14 did not appear to have required replanting and so in effect passed this MoS. A further two had not been fully replanted, but at least native species had been used. Mature trees were undamaged in the majority of cases (93%) and there was no evidence seen of heavy machinery use on any of the sites. Around three quarters of sites visited were stock-proof. As with the
40 Could be Hawthorn (Crataegus monogyna), Blackthorn (Prunus spinosa), Holly (Ilex aquifolium) or other Irish native species. 41 29 sites were given a phone implementation check in 2017. An additional site (#31) was added to make up for the site which had dropped out (#10). However, subsequent to that another site (#9) also dropped out of the scheme. Surveys were not possible at sites #15 or #25 where the action had not been implemented. As such, only 27 sites have been assessed against the MoS set.
0
2
4
6
8
10
12
14
0 1 2 3 4 5 6
Co
un
t o
f Si
tes
Specification MoS met

Department of Agriculture, Food and the Marine 79
Year 2 Analysis of Actions under GLAS
RSK ADAS Project: 1020044
coppicing action, a common shortcoming was management of competitive vegetation which failed the criterion at about half the sites visited. Seven hedges (#1, #11, #12, #17, #23, #27 and #30) were noted by surveyors as being particularly well laid, meeting all or all but one of the MoS applicable. By contrast only one site (#28) was deemed to have been badly laid: it only met two MoS and was noted as having large unplanted gaps.
Table 3.16-1: Hedge Laying. 2018 Performance on individual MoS
2018
Specification MOS Valid
Surveys Total
passed %
passed
There should be no hedgerow gaps 27 23 85
Gap planting to consist of Hawthorn, Blackthorn, Holly or other native Irish hedgerow species
13 13 100
Planting to be ≥ 4 plants/m 22 13 59
No reduction in presence of mature trees from baseline - - -
No mature trees within the hedgerow should be coppiced/damaged 27 25 93
The whole hedgerow should be stock-proof 27 20 74
Dense growth of competitive vegetation must be < 5% 27 14 52
If newly planted saplings are ≥ 1m in height, then 60% of the hedgerow will comprise plants with interlinking lateral growth by year 5.
- - -
A number of sites failed on the competitive vegetation criterion but the specification is not explicit as to the desired maximum cover, only that it should be “controlled”. Indeed, the absolute levels of competitive vegetation are considerably lower than in the coppicing action with all but one site having 10% or less present. For those hedges where the woody species are already advanced and strong, these levels may not pose a major issue to growth.
Only seven sites were assessed for lateral growth this year as the survey protocol only required this where newly planted saplings are greater than 1m high. Clearly, most are still below the 60% threshold but this will not be formally assessed for a further two years so there is still plenty of time. Lateral growth of established trees (as well as saplings) will be formally assessed in the final survey year, but surveyors notes where provided suggest that they have already rejuvenated well (e.g. #1, #11, #17, #23, #27, #30).
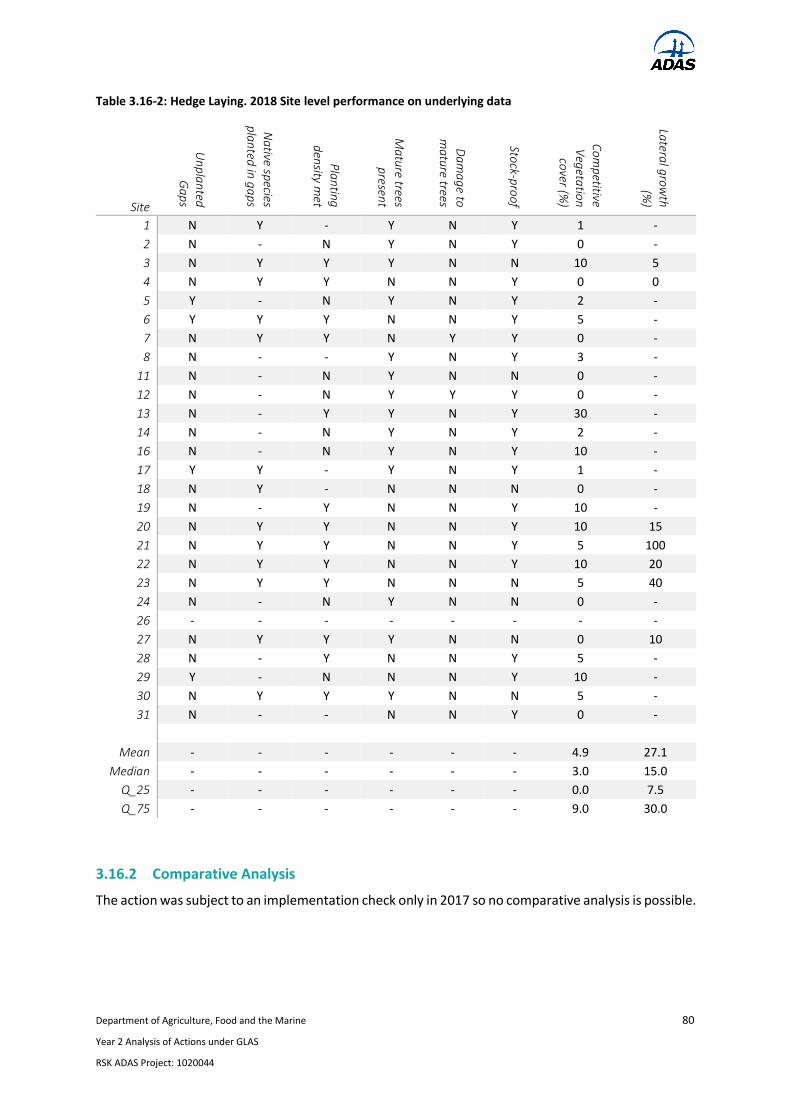
Department of Agriculture, Food and the Marine 80
Year 2 Analysis of Actions under GLAS
RSK ADAS Project: 1020044
Table 3.16-2: Hedge Laying. 2018 Site level performance on underlying data
Site
Un
pla
nted
G
ap
s
Na
tive species
pla
nted
in g
ap
s
Pla
ntin
g
den
sity met
Ma
ture trees
presen
t
Da
ma
ge to
ma
ture trees
Stock-p
roo
f
Co
mp
etitive
Veg
etatio
n
cover (%
)
Latera
l gro
wth
(%)
1 N Y - Y N Y 1 -
2 N - N Y N Y 0 -
3 N Y Y Y N N 10 5
4 N Y Y N N Y 0 0
5 Y - N Y N Y 2 -
6 Y Y Y N N Y 5 -
7 N Y Y N Y Y 0 -
8 N - - Y N Y 3 -
11 N - N Y N N 0 -
12 N - N Y Y Y 0 -
13 N - Y Y N Y 30 -
14 N - N Y N Y 2 -
16 N - N Y N Y 10 -
17 Y Y - Y N Y 1 -
18 N Y - N N N 0 -
19 N - Y N N Y 10 -
20 N Y Y N N Y 10 15
21 N Y Y N N Y 5 100
22 N Y Y N N Y 10 20
23 N Y Y N N N 5 40
24 N - N Y N N 0 -
26 - - - - - - - -
27 N Y Y Y N N 0 10
28 N - Y N N Y 5 -
29 Y - N N N Y 10 -
30 N Y Y Y N N 5 -
31 N - - N N Y 0 -
Mean - - - - - - 4.9 27.1
Median - - - - - - 3.0 15.0
Q_25 - - - - - - 0.0 7.5
Q_75 - - - - - - 9.0 30.0
3.16.2 Comparative Analysis
The action was subject to an implementation check only in 2017 so no comparative analysis is possible.

Department of Agriculture, Food and the Marine 81
Year 2 Analysis of Actions under GLAS
RSK ADAS Project: 1020044
3.17 Low Input Permanent Pasture
The Low-input Permanent Pasture action promotes a grassland management system that, through appropriate grazing levels and restriction on fertiliser and pesticide use, results in a more diverse sward with an increase in flora and fauna.
The action was assessed against five Specification MoS. The first of these checks that a sufficiently diverse range of grass and forb species are present in the sward and is an explicit pre-requirement for a parcel to be entered into the action. The second checks that the sward has less than 30% cover of Ryegrass (Lolium spp.) which is also a pre-requisite in the specification. The final three of these MoS check for evidence that the correct management regime is being applied (stock-proof, maintained by grazing only, and not topped in the closed period).
The action was also assessed against a set of Outcome MoS. The first of these is a further check that levels of soil improvement are low as evidenced by low cover of White Clover (Trifolium repens). Others are indirectly related to the action specifications but are not explicit requirements: low scrub and rank grass cover, as well as low levels of undesirable flora42 and bare ground are further evidence of an appropriate grazing and site management regime. Finally, good quality permanent pasture should have a minimum cover of wildflowers and sedges.
Sites were visited during the agreed survey window of 1 Apr – 15 Jul. Overall, both adherence to the specification and achievement of desirable outcomes as measured by the number of sites passing MoS have increased significantly since baseline. This has been driven by a significant improvement on the grass diversity and cover of rank grasses scores. Floral cover remains a limitation with only about a third of sites meeting the standard but not much change had been expected on this MoS in such a short period of time.
3.17.1 2018 Results
As shown in Figure 3.17-1 the requirements underpinning the Specification MoS have been executed to a very high standard. 80% of the 30 sites surveyed meeting all five MoS. The Outcome MoS were also mostly achieved, though only five sites met all of them.
Performance on individual MoS is shown in Table 3.17-1 and on the underlying data in Table 3.17-2. Where sites consistently came short was on the floral cover measure with only a third of parcels demonstrating the desired quantity. The median parcel in the sample has a wildflower / sedge cover
42 Includes: Cirsium arvense, Cirsium vulgare, Rumex obtusifolius, Rumex crispus, Senecio jacobaea, Urtica dioica
0
5
10
15
20
25
30
0 1 2 3 4 5
Co
un
t o
f Si
tes
Specification MoS met
0
5
10
15
20
0 1 2 3 4 5 6
Co
un
t o
f Si
tes
Outcome MoS met
Figure 3.17-1: Low-input Permanent Pasture. 2018 Number of MoS met by sites. Median = thick border

Department of Agriculture, Food and the Marine 82
Year 2 Analysis of Actions under GLAS
RSK ADAS Project: 1020044
of 9%, but 12 sites have a cover of 5% or less meaning that there still a considerable gap between the current cover and the target.
Table 3.17-1: Low-input Permanent Pasture. 2018 Performance on individual MoS
2018
Specification MOS Valid Surveys Total passed % passed
There should be ≥ four grasses and three forbs throughout the sward
30 28 93
Cover of Lolium perenne should be < 30% 30 25 83
The whole parcel should be stock-proof 30 30 100
The parcel must be grazed 30 28 93
The parcel should not be topped between 15th March & 1st July.
30 30 100
Outcome MOS Valid Surveys Total passed % passed
Cover of Trifolium repens should be < 25% 30 28 93
Cover of rank grasses should be < 10% 30 29 97
Cover of bare ground should be < 10%. 30 29 97
Cover of undesirable species should be < 5%. 30 26 87
Cover of scrub/bracken etc. should be < 5%. 30 23 77
Cover of wildflowers and sedges should be > 20% 30 10 33
Six of the 12 sites also failed to meet the Perennial Ryegrass Specification MoS, meaning that these sites are currently too agriculturally improved to support the desired level of floral cover. Another of the 12 had small patches of bare ground totalling about 14% of the parcel which may suggest an issue in the grazing regime applied. Cover of rank grasses, undesirable species and scrub were generally low, but where these were deemed an issue in terms of the MoS they did not appear to be consistently limiting the wildflower cover. One site (#21) displayed high levels of Ragged robin (Lychnis flos-cuculi) but these happened to be outside the locations previously chosen for the quadrats.
Other factors limiting the growth of wildflower cover could include the pre-GLAS levels of soil improvement and the very hot dry weather, but the survey methodology is unable to examine these. One site (#28) had been topped (though clearly after 1 July) and this limited the extent to which the floral survey could be carried out. Overall, though, with the exception of the floral cover, the parcels surveyed in 2018 were of a good standard.

Department of Agriculture, Food and the Marine 83
Year 2 Analysis of Actions under GLAS
RSK ADAS Project: 1020044
Table 3.17-2: Low-input Permanent Pasture. 2018 Site level performance on underlying data
Site
Nu
mb
er of g
rasses
Nu
mb
er of fo
rbs
Co
ver of Lo
lium
peren
ne
(%)
Stockp
roo
f
Gra
zing
Top
ped
Co
ver of Trifo
lium
repen
s (%)
Co
ver of ra
nk g
rasses
(%)
Co
ver of b
are g
rou
nd
(%)
Co
ver of u
nd
esirab
le
species (%
)
Co
ver of scru
b/b
racken
(%
)
Co
ver of w
ildflo
wer /
sedg
e (%)
1 6 3 3.4 Y Y N 4 4.0 0.0 0.0 0.0 2.0
2 3 4 76.0 Y Y N 4 3.5 0.0 1.5 0.3 2.0
3 6 7 0.0 Y Y N 1 0.6 0.0 0.4 0.0 1.0
4 5 21 0.1 Y Y N 3 3.0 0.0 3.2 0.0 0.0
5 5 4 11.6 Y Y N 2 2.0 0.0 0.0 2.6 0.0
6 5 5 0.4 Y Y N 1 0.9 0.0 0.0 2.6 0.0
7 6 8 16.0 Y Y N 17 16.5 0.0 0.0 0.0 0.0
8 8 22 24.0 Y Y N 11 11.0 0.0 0.0 1.2 15.0
9 7 11 0.0 Y Y N 0 0.0 14.0 1.0 11.0 5.0
10 4 3 52.5 Y Y N 1 0.5 0.0 14.1 0.2 0.0
11 7 13 0.0 Y Y N 2 1.6 0.0 7.9 2.5 2.0
12 6 9 12.2 Y Y N 6 6.3 8.5 3.0 2.5 2.0
13 7 9 17.7 Y Y N 26 25.6 1.6 0.0 2.5 0.0
14 6 25 0.0 Y Y N 45 45.0 0.0 3.1 10.7 10.0
15 7 5 29.5 Y Y N 10 9.6 0.0 0.0 0.0 0.0
16 5 6 12.5 Y Y N 2 1.9 4.4 0.0 6.3 0.0
17 6 4 9.5 Y Y N 4 3.5 0.0 0.0 1.1 0.0
18 6 4 4.0 Y Y N 2 1.9 0.0 0.7 2.2 0.0
19 4 6 9.5 Y Y N 6 6.3 0.0 2.3 2.3 5.0
20 5 4 9.5 Y Y N 1 0.9 0.0 0.0 0.0 0.0
21 7 20 2.7 Y Y N 4 3.5 0.0 4.5 0.5 0.0
22 7 4 6.5 Y Y N 6 5.5 0.0 0.0 0.5 5.0
23 9 20 1.0 Y Y N 8 7.6 0.8 1.3 0.6 4.0
24 7 4 8.0 Y Y N 6 5.5 0.0 0.0 1.9 10.0
25 8 16 0.5 Y Y N 4 4.0 0.5 0.0 1.8 25.0
26 12 8 0.0 Y N N 8 8.0 0.1 0.6 0.6 0.0
27 6 13 0.0 Y Y N 3 3.4 0.0 2.1 0.2 1.0
28 5 5 40.0 Y Y N 1 1.1 0.0 0.5 0.0 4.0
29 7 6 40.1 Y Y N 11 11.4 0.7 0.7 2.5 0.0
30 3 6 63.5 Y N N 0 0.3 0.0 2.5 6.7 0.0
Mean 6.2 9.2 15.0 - - - 6.5 1.0 1.6 2.1 3.1 16.4
Median 6.0 6.0 8.8 - - - 3.5 0.0 0.6 1.2 0.5 9.1
Q_25 5.0 4.0 0.4 - - - 1.7 0.0 0.0 0.2 0.0 3.1
Q_75 7.0 12.5 17.3 - - - 7.3 0.1 2.3 2.5 4.0 29.4

Department of Agriculture, Food and the Marine 84
Year 2 Analysis of Actions under GLAS
RSK ADAS Project: 1020044
3.17.2 Comparative Analysis
As per Figure 3.17-2, the Specification MoS can be collectively compared at 27 of the 30 sites43. There has been a notable improvement in the number of sites meeting all MoS. Only one site fell back whilst 12 sites met more MoS than they failed at baseline. The Outcome MoS can be collectively compared across the sample (Figure 3.17-3). Again, there is notable improvement overall in terms of the number of MoS passed per site. Two sites showed a dramatic gain in the number of MoS met (#21 and #26).
The year on year improvements (Figure 3.17-4) can be seen across most of the MoS with the exception of undesirable species and white clover cover where there was a small decrease (one fewer site meeting). There was a notable increase in the grass and forb diversity scores with 93% having at least four grasses and three forbs versus 77% at baseline. Rank grasses (97% met) and scrub / bracken (77% met) were more under control than in the baseline year where only 60% and 63% could meet them respectively. Where data can be compared, all sites this year met the topping criterion whereas only 85% met at the baseline year. Other MoS recorded only small increases. For the wildflower / sedge MoS this is not surprising given that only one year had passed in between surveys.
43 Surveyors were unable to assess three sites for evidence of topping in the closed period in 2017.
0
5
10
15
20
25
30
0 1 2 3 4 5
Co
un
t o
f Si
tes
Specification MoS met
2017 2018
0
2
4
6
8
10
12
14
16
-2 -1 0 1 2
Co
un
t o
f Si
tes
Difference in MoS met (2018 - 2017
Figure 3.17-2: Low-input Permanent Pasture. 2018 vs. 2017 Number of sites by Specification MoS met Median = thick border
0
2
4
6
8
10
12
14
16
18
0 1 2 3 4 5 6
Co
un
t o
f Si
tes
Outcome MoS met
2017 2018
0
2
4
6
8
10
12
-2 -1 0 1 2 3
Co
un
t o
f Si
tes
Difference in MoS met (2018 - 2017)
Figure 3.17-3: Low-input Permanent Pasture. 2018 vs. 2017 Number of sites by Outcome MoS met Median = thick border

Department of Agriculture, Food and the Marine 85
Year 2 Analysis of Actions under GLAS
RSK ADAS Project: 1020044
Figure 3.17-4: Low-input Permanent Pasture. 2018 vs. 2017 Individual MoS met. Paired surveys only (n = 30, except topping = 27)
The significance of the differences between the two years was assessed by means of an exact symmetry test for paired data (Table 3.17-3). To assess the action as a whole, the pass and fail rates for each type of MoS (Specification, Outcome) for valid paired data were compared and values added to a contingency table matrix.
Table 3.17-3: Low-input Permanent Pasture. 2018 vs. 2017 Number of MoS. Exact Symmetry Test
Fail 17 Fail 18
Fail 17 Pass 18
Pass 17 Fail 18
Pass 17 Pass 18 P value
All specification MoS 2 20 7 118 0.019*
There should be ≥ four grasses and three forbs throughout the sward
0 7 2 21 0.18
Cover of Lolium perenne should be < 30% 2 4 3 21 1
The whole parcel should be stock-proof 0 2 0 28 0.5
The parcel must be grazed 0 3 2 25 1
The parcel should not be topped between 15th March & 1st July.
0 4 0 23 0.125
All outcome MoS 25 26 10 119 0.011*
Cover of Trifolium repens should be < 25% 1 0 1 28 1
Cover of rank grasses should be < 10% 0 12 1 17 0.003**
Cover of bare ground should be < 10%. 0 3 1 26 0.625
Cover of undesirable species should be < 5%. 2 1 2 25 1
Cover of scrub/bracken etc. should be < 5%. 6 5 1 18 0.219
Cover of wildflowers and sedges should be > 20% 16 5 4 5 1
0 10 20 30 40 50 60 70 80 90 100
There should be ≥ four grasses and three forbs throughout the sward
Cover of Lolium perenne should be < 30%
The whole parcel should be stock-proof
The parcel must be grazed
The parcel should not be topped between 15th March &1st July.
Cover of Trifolium repens should be < 25%
Cover of rank grasses should be < 10%
Cover of bare ground should be < 10%.
Cover of undesirable species should be < 5%.
Cover of scrub/bracken etc should be < 5%.
Cover of wildflowers and sedges should be > 20%
2017 % passed 2018 % passed

Department of Agriculture, Food and the Marine 86
Year 2 Analysis of Actions under GLAS
RSK ADAS Project: 1020044
There was found to be a significant difference between the pass rates in the two years for the Specification MoS as summed in this way (p = 0.019). However, none of the individual Specification MoS changes are significant in their own right, perhaps in some cases because the sample size is not large enough to capture the signal. Likewise, the change in the Outcome MoS collectively is also significant (p = 0.011). This is predominantly driven by the change in the rank grass MoS which was also significantly different in its own right (p = 0.003). The changes in other Outcome MoS were not significant individually.
The underlying data (Table 3.17-4) appears to be trending as desired with averages generally moving in the preferred direction, with the exception of Ryegrass cover which increased slightly though is still well within the 30% threshold. However, this change is not significant according to a Wilcoxon Signed Rank test applied to the two years.
Table 3.17-4: Low-input Permanent Pasture. 2018 vs. 2017 Underlying Data. Wilcoxon Signed Rank Test
2017 2018 Wilcoxon Signed Rank
Variable Paired
surveys Mean Median Mean Median Z score P value
Number of grasses 30 4.8 4.0 6.2 6.0 -2.650 0.008**
Number of forbs 30 8.1 7.0 9.2 6.0 -0.516 0.606
Cover of Lolium perenne (%) 30 14.2 5.3 15.0 8.8 -0.103 0.918
Cover of Trifolium repens (%) 30 8.3 6.4 6.5 3.5 1.841 0.066
Cover of rank grasses (%) 30 24.0 3.7 1.0 0.0 -0.977 0.329
Cover of bare ground (%) 30 3.3 0.6 1.6 0.6 3.171 0.002**
Cover of undesirable species (%) 30 2.4 1.8 2.1 1.2 1.399 0.162
Cover of scrub and bracken (%) 30 4.4 0.0 3.1 0.5 0.988 0.323
Cover of wildflowers and sedges (%)
30 13.5 9.5 16.4 9.1 1.167 0.243
Indeed, there are no significant differences at the 5% level between the underlying data between years for most of the other variables too as tested in the same manner. The exceptions to this are the number of grasses which is significantly different (higher) to baseline (Z = -2.650, p = 0.008) and the cover of bare ground which is significantly different (lower) to baseline (Z = 3.171, p = 0.002).

Department of Agriculture, Food and the Marine 87
Year 2 Analysis of Actions under GLAS
RSK ADAS Project: 1020044
3.18 Planting a Grove of Native Trees
The objective of the action is to encourage the planting of small groups of trees to provide a valuable pocket habitat and opportunity for carbon sequestration.
The Tree Grove action was assessed against five Specification MoS in 2018. These check the execution of the planting itself and then the subsequent management which includes protection of the growing trees and replacement of dead or failed trees. An Outcome MoS to check the annual growth of the trees will be assessed in 2020 when a comparison can be made (sites were subject to an implementation check only in 2017)
Sites were visited within the agreed window of 1 Apr – 30 Sep. Overall, the findings discussed below indicate an excellent standard of execution but moderate standard of aftercare. Native species and planting density requirements have been followed in almost all cases, and most groves are stock-proof. However, many trees have levels of competitive vegetation above the desirable threshold. This is not a major issue at all of these sites but could be a factor in the high proportion of failed trees noted at a quarter of the groves visited.
3.18.1 2018 Results
As per Figure 3.18-1, of the 28 sites assessed44 nine met all the five MoS and a further eight met four. However, this still means that eleven sites failed on two or more of these criteria. These were mainly related to issues to do with aftercare as discussed below.
Figure 3.18-1: Tree Grove. 2018 Number of MoS met by site Median = thick border
Performance on individual MoS is shown in Table 3.18-1 and on the underlying data in Table 3.18-2. The action scored very highly as did the use of native species and correct spacing of planting (both 96%). The stock exclusion criterion scored a little lower, at 82%, though in a few cases the damage to trees was likely caused by wild animals. Where sites are failing to achieve more MoS it is largely due to competitive vegetation (18 sites failed) or a high tree failure rate (9 sites failed).
44 Three new sites (#30 - #32) were added to the survey to replace one which had dropped out of GLAS in the first year and two which had dropped out after the phone implementation check. Of the 30 sites visited, two (#5, #15) did not have groves present. In one case this was caused by cattle damage and the grove was being re-planted. In the other the reason could not be established as the farmer was not contactable.
0
2
4
6
8
10
0 1 2 3 4 5
Co
un
t o
f Si
tes
Specification MoS met

Department of Agriculture, Food and the Marine 88
Year 2 Analysis of Actions under GLAS
RSK ADAS Project: 1020044
Table 3.18-1: Tree Grove. 2018 Performance on individual MoS
2018
Specification MOS Valid
Surveys Total
passed %
passed
Planting to consist of native species 28 27 96
Planting to be in rows 2m apart with a distance of 1m between the plants within the rows
28 27 96
The whole plantation should be stockproof 28 23 82
<5% of new planting should consist of dead/failed plants 28 19 68
Dense growth competitive vegetation that is ≥ than one third height of tree must be < 5%
28 10 36
Result MOS Valid
Surveys Total
passed %
passed
Annual height growth of trees should be at least 5cm/yr., during these early years
- - -
Where native species were used, the trees most commonly planted were Common alder (Alnus glutinosa) and Downy birch (Betula pubescens). The one site with non-natives present (#28) had Red oak (Quercus rubra) and Italian alder (Alnus cordata).
Although 18 sites failed on the competitive vegetation criterion, the specification is not explicit as to the desired maximum cover, only that it should be “controlled”. A number of sites are only just failing on the 5% threshold. For the sites where alder had been planted, the issue was not critical as the saplings had already grown to a point where they had outcompeted the surrounding vegetation. However, birch, oak and hazel were struggling. The issue is more problematic on damper soils in which rushes (Juncus spp.) and purple moor-grass (Molinia caerulea) are predominant. In several cases (e.g. sites #2, #4, #11 and #23) surveyors noted unacceptably high levels of competition from these species, making it very difficult for any saplings to gain a foothold. Similarly, where conditions were too dry (sites #16 and #21) there was a high degree of competition from other vegetation such as thistle.
The competitive vegetation is likely a contributing factor to the high failure rates observed at sites #3, #11, #16, #21, #26, #30 and #31. In other cases, browsing or drought may have been responsible.

Department of Agriculture, Food and the Marine 89
Year 2 Analysis of Actions under GLAS
RSK ADAS Project: 1020044
Table 3.18-2: Tree Grove. 2018 Site level performance on underlying data
Site Native Species
Planting Density met? Stockproof
Failed / Dead trees (%)
Competitive Vegetation (%)
Average Tree Height (cm)
2 Y Y Y 0.0 8.3 147.8
3 Y Y Y 30.0 11.4 136.1
4 Y N Y 0.0 52.8 109.0
6 Y Y Y 1.0 0.0 NA
7 Y Y Y 4.0 1.2 212.4
8 Y Y Y 1.0 0.5 170.4
9 Y Y Y 1.0 3.8 117.7
10 Y Y Y 1.0 6.6 147.5
11 Y Y N 10.0 8.9 119.0
12 Y Y Y 0.0 4.7 75.5
13 Y Y Y 0.0 2.9 123.6
14 Y Y Y 3.0 1.7 221.6
16 Y Y Y 22.0 20.0 128.2
18 Y Y Y 0.0 0.0 NA
19 Y Y Y 0.0 6.5 221.4
20 Y Y N 0.0 9.3 216.5
21 Y Y Y 10.0 35.0 163.0
22 Y Y Y 1.0 3.7 118.5
23 Y Y Y 5.0 35.3 83.0
24 Y Y Y 1.0 34.4 154.1
25 Y Y Y 0.0 17.8 166.5
26 Y Y N 15.0 29.3 164.0
27 Y Y Y 0.0 23.8 191.0
28 N Y N 2.0 13.5 80.8
29 Y Y Y 15.0 3.7 173.3
30 Y Y N 50.0 23.1 132.6
31 Y Y Y 15.0 36.8 170.0
32 Y Y Y 1.0 5.4 107.1
Mean - - - 6.7 14.3 148.3
Median - - - 1.0 8.6 147.6
Q_25 - - - 0.0 3.7 118.9
Q_75 - - - 10.0 23.2 170.4
3.18.2 Comparative Analysis
The action was subject to an implementation check only in 2017 so no comparative analysis is possible.

Department of Agriculture, Food and the Marine 90
Year 2 Analysis of Actions under GLAS
RSK ADAS Project: 1020044
3.19 Planting New Hedgerows
The objective of the action is to rejuvenate overgrown hedgerows, increase biodiversity and enhance the visual landscape.
The action was assessed against six Specification MoS in 2018. These check the execution of the planting itself including use of native species45 and then the subsequent management which includes protection of the growing trees and replacement of dead or failed trees
Sites were visited during the agreed survey window of 1 Apr – 30 Sep. Overall, the findings discussed below indicate a good standard of execution but moderate standard of aftercare. Native species and planting density requirements have been followed in almost all cases, and most hedges are continuous and are stock-proof. However, most hedges have levels of competitive vegetation above the desirable threshold though this is only a major issue at a few sites.
3.19.1 2018 Results
At site level, Figure 3.19-1 shows that of the 29 sites surveyed46 six (21%) met all of the MoS and a further (31%) met all but one. However, there were still a number of sites (24%) which only met one, two or three of the MoS.
Figure 3.19-1: Planting New Hedgerows. 2018 Number of MoS met by site Median = thick border
Performance on individual MoS is shown in Table 3.19-1 and on the underlying data in Table 3.19-2. Implementation itself was excellent: native species were used in all cases and planting density was correctly implemented in almost all (97%). More than three quarters (76%) of hedges were effectively continuous (containing less than 5% gaps) and of the seven sites which failed four were only slightly above the 5% threshold.
45 Could be Hawthorn (Crataegus monogyna), Blackthorn (Prunus spinosa), Holly (Ilex aquifolium) or other Irish native species suitable to local conditions. 46 The hedge at site #18 had not been planted (so it could not be assessed against any of the criteria) and the hedge at site #14 had died meaning it could only be assessed against the failed/dead criterion. An additional site (#31) was added to the survey sample.
0
2
4
6
8
10
0 1 2 3 4 5 6
Co
un
t o
f Si
tes
Specification MoS met

Department of Agriculture, Food and the Marine 91
Year 2 Analysis of Actions under GLAS
RSK ADAS Project: 1020044
Table 3.19-1: Planting New Hedgerows. 2018 Performance on individual MoS
2018
Specification MOS Valid
Surveys Total
passed %
passed
There should be less than 5% of hedgerow length comprising gaps 29 22 76
Planting to consist of Hawthorn, Blackthorn, Holly or other native Irish hedgerow species that are suitable for local site conditions
29 29 100
Planting to be ≥ 6 plants/m 29 28 97
The whole hedgerow should be stock-proof 29 21 72
Dense growth of competitive vegetation must be < 5% 29 8 28
< 5% of new planting should consist of dead/failed plants 28 19 68
72% (21) of sites were identified as stock-proof and for the eight that were not, most of these were adjacent to arable fields where no stock were present anyway. Only site #19 showed evidence of damage to the growing hedge by stock. 68% of sites were below the 5% criterion for dead and failed plants, and eight of the nine sites which did not meet the MoS were only slightly above the 5% threshold.
Competitive vegetation was a common failing with 72% of sites failing to meet the standards. However, the specification is not explicit as to the desired maximum cover, only that it should be “controlled”. Of these sites, a large number (10) have levels of vegetation at or below 30%. Even in some cases where the vegetation cover was thick (#15, #17, #24) the hedge itself was healthy and there were no obvious signs of detrimental impact. Surveyors did raise concerns about the cover at four sites (#3, #16, #20, and #27). There were also other isolated management issues such as herbicide use (site #28).

Department of Agriculture, Food and the Marine 92
Year 2 Analysis of Actions under GLAS
RSK ADAS Project: 1020044
Table 3.19-2: Planting New Hedgerows. 2018 Site level performance on underlying data
Site Gaps (%) Native species
planted
Planting density
met Stock-proof
Competitive Vegetation %
New planting failed / dead (%)
1 0 Y Y Y 10 1
2 0 Y Y Y 10 0
3 5 Y Y Y 70 5
4 0 Y Y Y 5 0
5 0 Y Y Y 80 0
6 0 Y Y N 0 13
7 0 Y Y Y 5 0
8 0 Y Y N 2 20
9 3 Y Y Y 2 0
10 0 Y Y Y 0 1
11 0 Y Y Y 4 1
12 5 Y Y Y 10 0
13 1 Y Y Y 4 0
14 - - - - - 100
15 0 Y y y 50 0
16 4 Y Y Y 30 0
17 15 Y N N 80 5
18 - - - - - -
19 5 Y Y N 65 15
20 20 Y Y N 75 0
21 0 Y Y Y 5 0
22 0 Y Y N 50 0
23 10 Y Y Y 10 5
24 0 Y Y N 80 0
25 0 Y Y Y 0 0
26 0 Y Y Y 35 8
27 6 Y Y Y 90 10
28 0 Y Y Y 60 0
29 0 Y Y Y 20 5
30 0 Y Y N 30 0
31 0 Y Y Y 3 0
Mean 3 - - - 30.5 6.3
Median 0 - - - 10 0
Q_25 0 - - - 4 0
Q_75 4 - - - 60 5
3.19.2 Comparative Analysis
The action was subject to an implementation check only in 2017 so no comparative analysis is possible.

Department of Agriculture, Food and the Marine 93
Year 2 Analysis of Actions under GLAS
RSK ADAS Project: 1020044
3.20 Protection of Watercourses from Bovines
The objective of the action is to protect water quality by excluding bovines from watercourses by means of fencing.
The action is assessed against three Specification MoS. One of these checks that the fencing installed is of good quality; another checks that it is sufficiently far back from the water’s edge; and the third checks that there are no gaps in the fencing that might allow stock access to the water. The action is also assessed against a set of Outcome MoS. Measuring the effect of the measure on water quality and aquatic ecology was beyond the scope of the field survey. Instead, surveyors consider terrestrial ecology factors that indicate appropriate management of riparian sites. These check that wildflowers and sedges have become established in the sward, that undesirable species47 are controlled to a minimum and that invasive alien species are absent.
Sites were visited during the agreed survey window of 1 Apr – 30 Sep. Overall, the action continues to be well implemented, though there are a few instances of decline in fence quality where stock are now able to access the watercourse. Wildflower and sedge cover has increased significantly across the sample, an indicator that the fenced-off area is being protected from grazing and poaching. However, most sites were already meeting the minimum threshold expected. Undesirable species continue to be abundant and there has been no change in the cover of these across sites year on year.
3.20.1 2018 Results
As shown in Figure 3.20-1, the measure appears to be well implemented on the majority of sites with 20 of the 30 sites surveyed meeting all the MoS for fencing and stock access. Five further sites met all but one of the MoS. 43% of sites met all of the Outcome MoS and all but one of the sites was able to meet at least two.
Performance on individual MoS is shown in Table 3.20-1 and on the underlying data in Table 3.20-2. 24 out of 30 sites were deemed to have stock-proof fences, and where a fence was not stock-proof, this was usually only a small sub-section of its length. At site #4 however, the fence was damaged, and stock were seen in the watercourse. Most fences (83%) were correctly positioned, being at least 1.5m from the water’s edge, and stock were unable to gain access in 80% of cases. A few sites failed on more than one measures and two sites (#5 and #6) were unable to meet any.
47 Includes Cirsium arvense, Cirsium vulgare, Rumex obtusifolius, Rumex crispus, Senecio jacobaea, Urtica dioica
0
5
10
15
20
25
0 1 2 3
Co
un
t o
f Si
tes
Specification MoS met
0
2
4
6
8
10
12
14
16
18
0 1 2 3
Co
un
t o
f Si
tes
Outcome MoS met
Figure 3.20-1: Watercourse Protection. 2018 Number of MoS met by sites Median = thick border
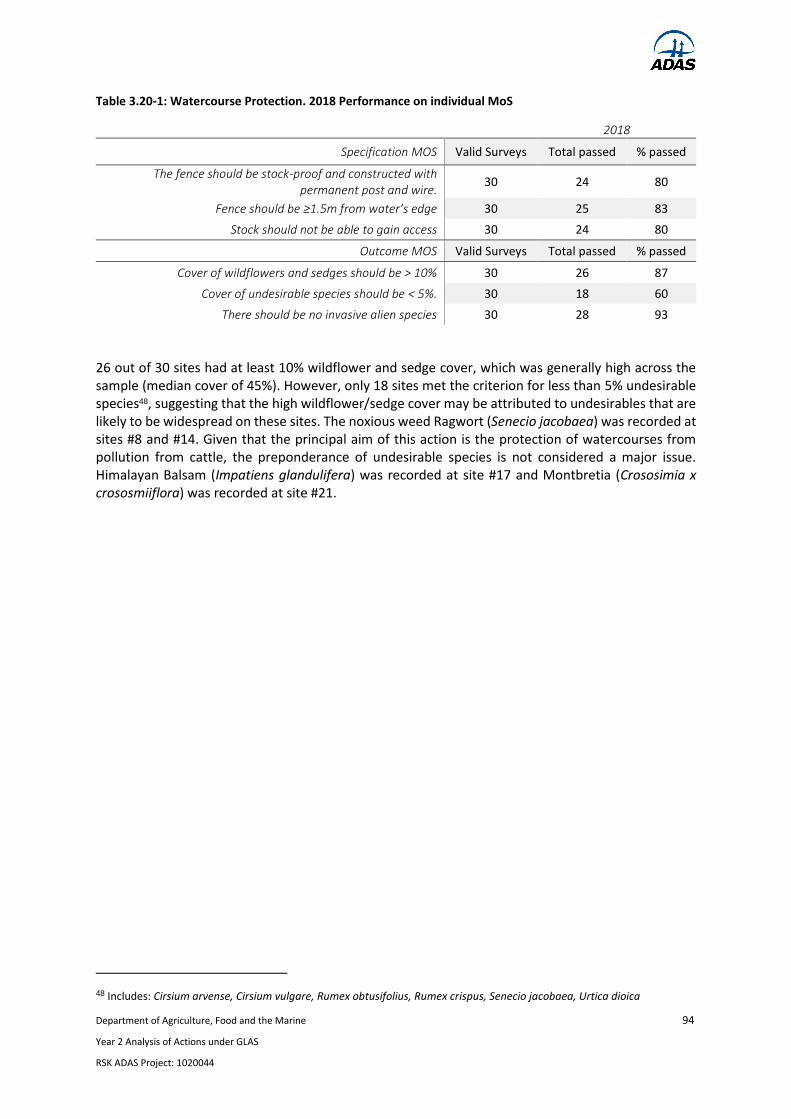
Department of Agriculture, Food and the Marine 94
Year 2 Analysis of Actions under GLAS
RSK ADAS Project: 1020044
Table 3.20-1: Watercourse Protection. 2018 Performance on individual MoS
2018
Specification MOS Valid Surveys Total passed % passed
The fence should be stock-proof and constructed with permanent post and wire.
30 24 80
Fence should be ≥1.5m from water’s edge 30 25 83
Stock should not be able to gain access 30 24 80
Outcome MOS Valid Surveys Total passed % passed
Cover of wildflowers and sedges should be > 10% 30 26 87
Cover of undesirable species should be < 5%. 30 18 60
There should be no invasive alien species 30 28 93
26 out of 30 sites had at least 10% wildflower and sedge cover, which was generally high across the sample (median cover of 45%). However, only 18 sites met the criterion for less than 5% undesirable species48, suggesting that the high wildflower/sedge cover may be attributed to undesirables that are likely to be widespread on these sites. The noxious weed Ragwort (Senecio jacobaea) was recorded at sites #8 and #14. Given that the principal aim of this action is the protection of watercourses from pollution from cattle, the preponderance of undesirable species is not considered a major issue. Himalayan Balsam (Impatiens glandulifera) was recorded at site #17 and Montbretia (Crososimia x crososmiiflora) was recorded at site #21.
48 Includes: Cirsium arvense, Cirsium vulgare, Rumex obtusifolius, Rumex crispus, Senecio jacobaea, Urtica dioica
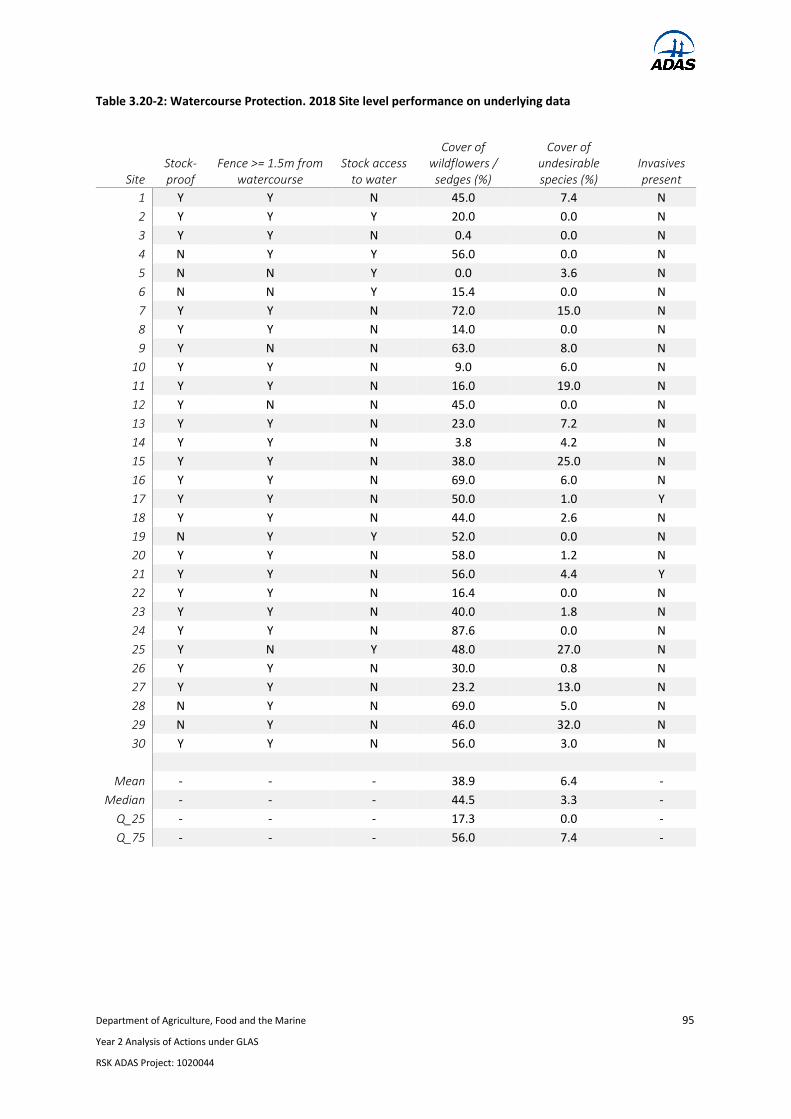
Department of Agriculture, Food and the Marine 95
Year 2 Analysis of Actions under GLAS
RSK ADAS Project: 1020044
Table 3.20-2: Watercourse Protection. 2018 Site level performance on underlying data
Site Stock-proof
Fence >= 1.5m from watercourse
Stock access to water
Cover of wildflowers / sedges (%)
Cover of undesirable species (%)
Invasives present
1 Y Y N 45.0 7.4 N
2 Y Y Y 20.0 0.0 N
3 Y Y N 0.4 0.0 N
4 N Y Y 56.0 0.0 N
5 N N Y 0.0 3.6 N
6 N N Y 15.4 0.0 N
7 Y Y N 72.0 15.0 N
8 Y Y N 14.0 0.0 N
9 Y N N 63.0 8.0 N
10 Y Y N 9.0 6.0 N
11 Y Y N 16.0 19.0 N
12 Y N N 45.0 0.0 N
13 Y Y N 23.0 7.2 N
14 Y Y N 3.8 4.2 N
15 Y Y N 38.0 25.0 N
16 Y Y N 69.0 6.0 N
17 Y Y N 50.0 1.0 Y
18 Y Y N 44.0 2.6 N
19 N Y Y 52.0 0.0 N
20 Y Y N 58.0 1.2 N
21 Y Y N 56.0 4.4 Y
22 Y Y N 16.4 0.0 N
23 Y Y N 40.0 1.8 N
24 Y Y N 87.6 0.0 N
25 Y N Y 48.0 27.0 N
26 Y Y N 30.0 0.8 N
27 Y Y N 23.2 13.0 N
28 N Y N 69.0 5.0 N
29 N Y N 46.0 32.0 N
30 Y Y N 56.0 3.0 N
Mean - - - 38.9 6.4 -
Median - - - 44.5 3.3 -
Q_25 - - - 17.3 0.0 -
Q_75 - - - 56.0 7.4 -

Department of Agriculture, Food and the Marine 96
Year 2 Analysis of Actions under GLAS
RSK ADAS Project: 1020044
3.20.2 Comparative Analysis
Scores are largely similar on the Specification MoS between baseline and 2018 and indicates that the high level of compliance with the requirements is being maintained (Figure 3.20-2). However, this year there were a couple of sites which met no MoS, unlike last year where this did not happen. The landholders here have not maintained fencing to the same standard as originally installed. Scores are also similar on the Outcome MoS between the two years (Figure 3.20-3).
Roughly similar numbers of sites have gained and dropped MoS, meaning that the number meeting two out of three MoS has increased year on year. At MoS level (Figure 3.20-4), scores are largely the same as last year with the exception of the stock-proof fencing requirement which has dropped from 90% to 80%, further suggesting that some landholders are not maintaining their fencing to the desired standard.
0
5
10
15
20
25
0 1 2 3
Co
un
t o
f Si
tes
Specification MoS met
2017 2018
0
5
10
15
20
25
-2 -1 0 1
Co
un
t o
f Si
tes
Difference in MoS met (2018 - 2017)
Figure 3.20-2: Watercourse Protection. 2018 vs. 2017 Number of Specification MoS met by sites Median = thick border
0
2
4
6
8
10
12
14
16
18
0 1 2 3
Co
un
t o
f Si
tes
Outcome MoS met
2017 2018
0
2
4
6
8
10
12
14
-2 -1 0 1 2
Co
un
t o
f Si
tes
Difference in MoS met (2018 - 2017)
Figure 3.20-3: Watercourse Protection. 2018 vs. 2017 Number of Outcome MoS met by sites Median = thick border

Department of Agriculture, Food and the Marine 97
Year 2 Analysis of Actions under GLAS
RSK ADAS Project: 1020044
Figure 3.20-4: Watercourse Protection. 2018 vs. 2017 Individual MoS. Paired surveys only (n = 30)
The significance of the differences between the two years was assessed by means of an exact symmetry test for paired data (Table 3.20-3). To assess the action as a whole, the pass and fail rates for each type of MoS (Specification, Outcome) for valid paired data were compared and values added to a contingency table matrix. No significant differences were found either at the overall MoS type level or at the individual MoS level.
Table 3.20-3: Watercourse Protection. 2018 vs. 2017 Number of MoS. Exact Symmetry Test
Fail 17 Fail 18
Fail 17 Pass 18
Pass 17 Fail 18
Pass 17 Pass 18
P value
All specification MoS 9 5 8 68 0.581
The fence should be stock-proof and constructed with permanent post and wire.
2 1 4 23 0.375
Fence should be ≥1.5m from water’s edge 2 2 3 23 1
Stock should not be able to gain access 5 2 1 22 1
All outcome MoS 8 11 10 61 1
Cover of wildflowers & sedges should be > 10% 2 3 2 23 1
Cover of undesirable species should be < 5%. 4 8 8 10 1
There should be no invasive alien species 2 0 0 28 -
The wildflower cover and undesirable cover are percentage variables which can be further assessed for changes at underlying level (Table 3.20-4). There does appear to have been a notable increase, on average, in the cover of wildflower and sedges (from a median of 21% to a median of 45%). Indeed, there does turn out to be a significant difference in the wildflower cover between the two years according to a Wilcoxon Signed Rank test applied to the two years (Z = -2.623, p = 0.009). Undesirable cover shows no significant difference.
Table 3.20-4: Watercourse Protection. 2018 vs. 2017 Underlying Data. Wilcoxon Signed Rank Test
2017 2018 Wilcoxon Signed Rank
Variable Paired
surveys Mean Median Mean Median Z score P value
Cover of wildflowers & sedges (%) 30 25.8 20.5 38.9 44.5 -2.623 0.009**
Cover of undesirable species (%) 30 5.8 4.1 6.4 3.3 -0.072 0.943
0 20 40 60 80 100
The fence should be stock-proof and constructed withpermanent post and wire.
Fence should be ≥1.5m from water’s edge
Stock should not be able to gain access
Cover of wildflowers and sedges should be > 10%
Cover of undesirable species should be < 5%.
There should be no invasive alien species
2017 % passed 2018 % passed

Department of Agriculture, Food and the Marine 98
Year 2 Analysis of Actions under GLAS
RSK ADAS Project: 1020044
3.21 Riparian Margins
The objective of the action is to protect watercourses by creating linear buffer zones by means of fencing. This is partly to avoid water quality issues directly created by livestock grazing in the riparian zone, but also to stabilise riverbanks and intercept nutrients transported in overland flow.
The action is assessed against two Specification MoS. One of these checks that the fencing installed is of good quality and another checks that there are no gaps in the fencing that might allow stock access to the water. The action is also assessed against a set of Outcome MoS. Measuring the effect of the measure on water quality and aquatic ecology was beyond the scope of the field survey. Instead, surveyors consider terrestrial ecology factors that indicate appropriate management of riparian sites. These check that sites are not too improved as indicated by a significant presence of Perennial ryegrass (Lolium perenne.) and White clover (Trifolium repens). They also check that wildflowers and sedges have become established in the sward, that undesirable species49 are controlled to a minimum. Sites are also required to be mulched or mown at least once a year outside a controlled period. Therefore, surveyors have been asked to check the cover of rank grasses as well as scrub / bracken as an indirect indicator.
Sites were visited within the agreed survey window of 1 Apr – 15 Aug with the exception of two sites visited in early September50. Overall, the action continues to be well implemented, though there are a few instances of decline in fence quality where stock are now able to access the watercourse. Wildflower and sedge cover has increased significantly across the sample and significantly more sites are meeting this requirement, an indicator that the fenced-off area is being protected from grazing and poaching and that levels of soil improvement remain low. Scrub and bracken have increased across the sample with a corresponding effect on the number of sites meeting this MoS. However, only a few sites are seriously overgrown.
3.21.1 2018 Results
As per Figure 3.21-1, the measure appears to be well implemented on the majority of sites with 22 of the 27 sites surveyed51 meeting all the MoS for fencing and stock access. Five sites failed to meet either of these. The Outcome MoS were fully met for 14 of the 26 sites where data was fully collected52. For the remaining sites the vast majority (11) met all but one of the MoS.
Performance on individual MoS is shown in Table 3.21-1 and on the underlying data in Table 3.21-2. Almost all of the individual MoS were fully met, with the exception of the scrub and bracken cover requirement which was only met at 69% of the sites checked. Many of these sites not meeting the requirement are within 20% scrub cover at least. Only sites #9 and #20 were deemed to be heavily overgrown.
49 Includes Cirsium arvense, Cirsium vulgare, Rumex obtusifolius, Rumex crispus, Senecio jacobaea, Urtica dioica 50 Sites #8, #10. This was for logistical reasons and is not expected to have any impact on the result of the survey. 51 30 sites were visited for this action, but this included two replacement sites (#31 and #32) in place of #3 and #12 which had dropped out of GLAS. The margin at site #21 had still not been implemented and so no data was recorded. There was also no purpose in recording data at the woodland site (#10) as per last year. Site #4 could not be surveyed due to a bull being present in the field. 52 The margin at site #29 had been recently mown so could only be assessed on the scrub and livestock management criteria.

Department of Agriculture, Food and the Marine 99
Year 2 Analysis of Actions under GLAS
RSK ADAS Project: 1020044
Levels of soil improvement are very low, with only one margin being notably improved (#5) in terms of the Perennial Ryegrass cover. Wildflower cover is high, with a median cover of 37%. A number of these fenced margins appear to be botanically species-rich (Sites #13, #14, #15, #17 and #25). Undesirable species are at low frequency in the sward, with only two sites (#28, #32) showing appreciably high levels. Presence of invasive alien species was not assessed as a MoS for the Riparian Margin action, but surveyors did take note if any were present. Himalayan Balsam (Impatiens glandulifera) was present at three sites (#1, #18, and #32), Giant Hogweed (Heraculeum mantegazzianum) was abundant at another (#23) and Rhododendron at a further site (#9).
Table 3.21-1: Riparian Margins. 2018 Performance on individual MoS
2018
Specification MOS Valid Surveys Total passed % passed
The fence should be stock-proof and constructed with permanent post and wire.
27 22 81
Stock should not be able to gain access 27 22 81
Outcome MOS Valid Surveys Total passed % passed
Cover of wildflowers and sedges should be > 10% 26 26 100
Cover of Perennial ryegrass should be < 25% 26 25 96
Cover of White clover should be < 25% 26 26 100
Cover of undesirable species should be ≤ 10% 26 24 92
Cover of rank grasses should be < 50% 26 24 92
Cover of scrub/bracken should be ≤ 10%. 26 18 69
0
5
10
15
20
25
0 1 2
Co
un
t o
f Si
tes
Specification MoS met
0
2
4
6
8
10
12
14
16
0 1 2 3 4 5 6
Co
un
t o
f Si
tes
Outcome MoS met
Figure 3.21-1: Riparian Margins. 2018 Number of MoS met by sites Median = thick border

Department of Agriculture, Food and the Marine 100
Year 2 Analysis of Actions under GLAS
RSK ADAS Project: 1020044
Table 3.21-2: Riparian Margins. 2018 Site level performance on underlying data
Site
Stock-p
roo
f
Stock a
ccess to
wa
ter
Co
ver of
wild
flow
ers / sed
ges (%
)
Co
ver of
Ryeg
rass (%
)
Co
ver of W
hite
Clo
ver (%)
Co
ver of ra
nk
gra
sses (%)
Co
ver of
un
desira
bles (%
)
Co
ver of scru
b /
bra
cken (%
)
1 Y Y 27.2 0.0 0.0 21.0 1.2 15.0
2 Y Y 33.0 2.0 1.0 0.0 4.0 0.0
4 - - - - - - - -
5 N N 25.4 37.0 1.4 1.2 0.0 0.0
6 Y Y 59.0 0.0 0.8 0.0 4.0 20.0
7 Y Y 57.0 1.0 1.4 17.0 4.0 2.0
8 Y Y 20.0 0.0 0.0 0.0 0.0 10.0
9 Y Y 68.0 0.0 0.0 0.0 0.0 30.0
10 - - - - - - - -
11 Y Y 16.0 0.0 0.0 52.0 3.0 15.0
13 N N 36.0 0.0 0.0 7.0 0.6 0.0
14 Y Y 67.0 0.0 0.0 0.0 5.6 10.0
15 Y Y 41.0 0.0 0.0 11.0 4.0 15.0
16 Y Y 28.0 2.0 0.0 10.0 0.0 15.0
17 Y Y 48.0 0.0 0.0 2.0 2.4 0.0
18 Y Y 32.0 12.0 0.0 45.0 4.0 0.0
19 N N 66.0 0.0 0.0 4.0 0.0 10.0
20 Y Y 37.0 0.0 0.0 0.0 0.0 65.0
21 - - - - - - - -
22 Y Y 67.0 1.0 0.0 3.0 0.2 20.0
23 Y Y 27.0 0.0 0.0 29.0 9.0 5.0
24 Y Y 26.0 0.0 0.0 39.0 1.0 5.0
25 Y Y 62.0 1.0 4.2 2.2 0.0 0.0
26 Y Y 56.0 0.0 1.4 60.0 2.0 10.0
27 Y Y 36.0 0.0 1.0 3.0 0.0 1.0
28 N N 57.0 0.0 1.0 15.0 28.0 10.0
29 Y Y - - - - - -
30 Y Y 15.0 6.0 9.0 6.0 0.2 0.0
31 Y Y 55.0 0.0 1.0 5.0 0.0 5.0
32 N N 10.4 18.0 0.0 4.0 24.0 10.0
Mean - - 41.2 3.1 0.9 12.9 3.7 10.5
Median - - 36.5 0.0 0.0 4.5 1.1 10.0
Q_25 - - 27.1 0.0 0.0 1.4 0.0 0.0
Q_50 - - 57.0 1.0 1.0 16.5 4.0 15.0
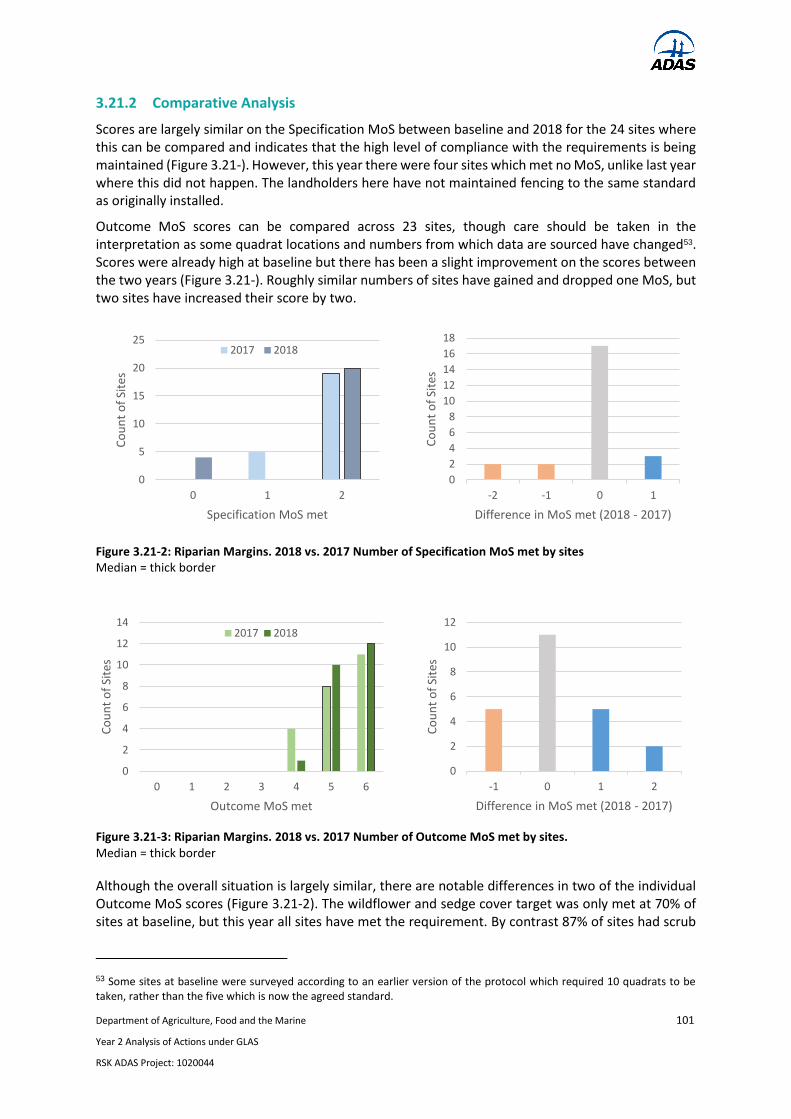
Department of Agriculture, Food and the Marine 101
Year 2 Analysis of Actions under GLAS
RSK ADAS Project: 1020044
3.21.2 Comparative Analysis
Scores are largely similar on the Specification MoS between baseline and 2018 for the 24 sites where this can be compared and indicates that the high level of compliance with the requirements is being maintained (Figure 3.21-). However, this year there were four sites which met no MoS, unlike last year where this did not happen. The landholders here have not maintained fencing to the same standard as originally installed.
Outcome MoS scores can be compared across 23 sites, though care should be taken in the interpretation as some quadrat locations and numbers from which data are sourced have changed53. Scores were already high at baseline but there has been a slight improvement on the scores between the two years (Figure 3.21-). Roughly similar numbers of sites have gained and dropped one MoS, but two sites have increased their score by two.
Although the overall situation is largely similar, there are notable differences in two of the individual Outcome MoS scores (Figure 3.21-2). The wildflower and sedge cover target was only met at 70% of sites at baseline, but this year all sites have met the requirement. By contrast 87% of sites had scrub
53 Some sites at baseline were surveyed according to an earlier version of the protocol which required 10 quadrats to be taken, rather than the five which is now the agreed standard.
0
5
10
15
20
25
0 1 2
Co
un
t o
f Si
tes
Specification MoS met
2017 2018
0
2
4
6
8
10
12
14
16
18
-2 -1 0 1
Co
un
t o
f Si
tes
Difference in MoS met (2018 - 2017)
Figure 3.21-2: Riparian Margins. 2018 vs. 2017 Number of Specification MoS met by sites Median = thick border
0
2
4
6
8
10
12
14
0 1 2 3 4 5 6
Co
un
t o
f Si
tes
Outcome MoS met
2017 2018
0
2
4
6
8
10
12
-1 0 1 2
Co
un
t o
f Si
tes
Difference in MoS met (2018 - 2017)
Figure 3.21-3: Riparian Margins. 2018 vs. 2017 Number of Outcome MoS met by sites. Median = thick border

Department of Agriculture, Food and the Marine 102
Year 2 Analysis of Actions under GLAS
RSK ADAS Project: 1020044
or bracken at or below 10% at baseline, but this is now only 65%. This is potentially a management issue that will need addressing, particularly in the cases identified above where scrub is becoming dominant to the detriment of species-rich vegetation. Although not recorded as an MoS in the protocol agreed with DAFM, the sites which had alien invasive species present in 2017 continued to have them present this year.
Figure 3.21-2: Riparian Margins. 2018 vs. 2017. Individual MoS Paired surveys only (n as shown)
The significance of the differences between the two years was assessed by means of an exact symmetry test for paired data (Table 3.21-3). To assess the action as a whole, the pass and fail rates for each type of MoS (Specification, Outcome) for valid paired data were compared and values added to a contingency table matrix. No significant differences were found at the overall MoS type level. However, the change in the wildflower and sedge MoS score was significant (p = 0.016) but the change in the scrub / bracken MoS score was not.
Table 3.21-3: Riparian Margins. 2018 vs. 2017. Number of MoS. Exact Symmetry Test
Fail 17 Fail 18
Fail 17 Pass 18
Pass 17 Fail 18
Pass 17 Pass 18 P value
All specification MoS 2 3 6 37 0.508
The fence should be stock-proof and constructed with permanent post and wire.
1 2 3 18 1
Stock should not be able to gain access 1 1 3 19 0.625
All outcome MoS 6 10 6 116 0.454
Cover of wildflowers and sedges should be > 10% 0 7 0 16 0.016*
Cover of Perennial ryegrass should be < 25% 1 2 0 20 0.5
Cover of White clover should be < 25% 0 0 0 23 -
Cover of undesirable species should be ≤ 10% 1 0 0 22 -
Cover of rank grasses should be < 50% 1 1 1 20 1
Cover of scrub/bracken should be ≤ 10%. 3 0 5 15 0.063
0 10 20 30 40 50 60 70 80 90 100
The fence should be stock-proof and constructed withpermanent post and wire. (24)
Stock should not be able to gain access (24)
Cover of wildflowers and sedges should be > 10% (23)
Cover of Perennial ryegrass should be < 25% (23)
Cover of White clover should be < 25% (23)
Cover of undesirable species should be ≤ 10% (23)
Cover of rank grasses should be < 50% (23)
Cover of scrub/bracken should be ≤ 10%. (23)
2017 % passed 2018 % passed
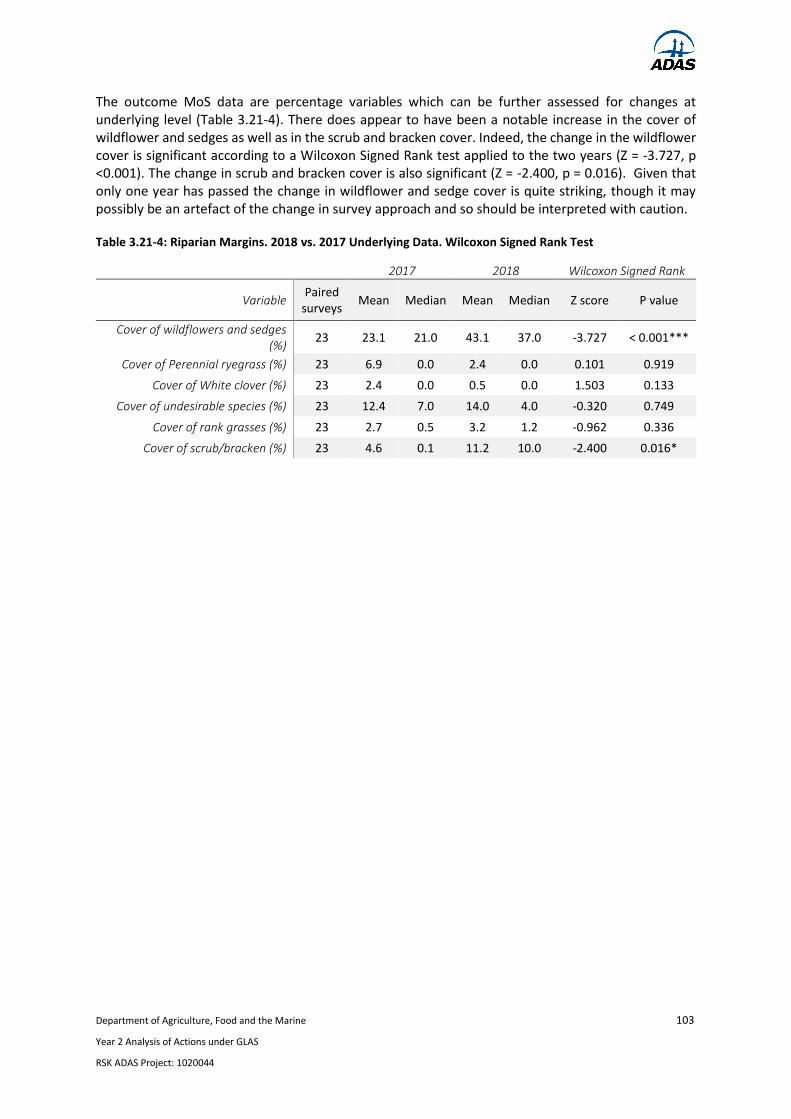
Department of Agriculture, Food and the Marine 103
Year 2 Analysis of Actions under GLAS
RSK ADAS Project: 1020044
The outcome MoS data are percentage variables which can be further assessed for changes at underlying level (Table 3.21-4). There does appear to have been a notable increase in the cover of wildflower and sedges as well as in the scrub and bracken cover. Indeed, the change in the wildflower cover is significant according to a Wilcoxon Signed Rank test applied to the two years (Z = -3.727, p <0.001). The change in scrub and bracken cover is also significant (Z = -2.400, p = 0.016). Given that only one year has passed the change in wildflower and sedge cover is quite striking, though it may possibly be an artefact of the change in survey approach and so should be interpreted with caution.
Table 3.21-4: Riparian Margins. 2018 vs. 2017 Underlying Data. Wilcoxon Signed Rank Test
2017 2018 Wilcoxon Signed Rank
Variable Paired
surveys Mean Median Mean Median Z score P value
Cover of wildflowers and sedges (%)
23 23.1 21.0 43.1 37.0 -3.727 < 0.001***
Cover of Perennial ryegrass (%) 23 6.9 0.0 2.4 0.0 0.101 0.919
Cover of White clover (%) 23 2.4 0.0 0.5 0.0 1.503 0.133
Cover of undesirable species (%) 23 12.4 7.0 14.0 4.0 -0.320 0.749
Cover of rank grasses (%) 23 2.7 0.5 3.2 1.2 -0.962 0.336
Cover of scrub/bracken (%) 23 4.6 0.1 11.2 10.0 -2.400 0.016*

Department of Agriculture, Food and the Marine 104
Year 2 Analysis of Actions under GLAS
RSK ADAS Project: 1020044
3.22 Traditional Dry Stone Wall Maintenance
The objective of the action is to maintain and enhance the network of traditional freestanding dry stone walls, increase biodiversity and enhance the visual landscape.
The action is assessed against three Specification MoS. One of these checks that top stones have been replaced so that the wall is of full height. The second check that there are no gaps in the wall, and the third checks that rebuilding work has been done in the local style. The action is also assessed against an Outcome MoS not explicit in the specification which assesses whether a wall is structurally sound.
Sites were visited as per the agreed window which could be at any time of year. Overall, the action continues to be very well carried out with walls under management in good condition. There are only a few isolated examples of deterioration relative to the specification.
3.22.1 2018 Results
As per Figure 3.22-1, the three Specification MoS were met on 22 of the 30 sites assessed with a further six meeting two. Almost all walls met the Outcome MoS and were structurally sound.
Performance on individual MoS is shown in Table 3.22-1 and on the underlying data in Table 3.22-2. All sites had been rebuilt in the local style, but gaps and missing top stones which were issues at 23% and 10% of all sites visited. In two cases (#27 and #29) walls appeared to be suffering from encroaching vegetation.
Table 3.22-1: Dry Stone Walls. 2018 Performance on individual MoS
2018
Specification MOS Valid
Surveys Total
passed %
passed
There should be a full height wall with missing top stones ≤ 5% of assessed wall length
30 23 77
There should be no gaps in the wall 30 27 90
Rebuilt walls must be built in the local style 30 30 100
Outcome MOS Valid
Surveys Total
passed %
passed
There may be minor imperfections such as minor slumping, but the wall should not be in danger of collapse at any point
30 29 97
0
5
10
15
20
25
30
0 1
Co
un
t o
f Si
tes
Outcome MoS met
0
5
10
15
20
25
0 1 2 3
Co
un
t o
f Si
tes
Specification MoS met
Figure 3.22-1: Dry Stone Walls: Number of MoS met by sites Median = thick border

Department of Agriculture, Food and the Marine 105
Year 2 Analysis of Actions under GLAS
RSK ADAS Project: 1020044
Table 3.22-2: Dry Stone Walls. 2018 Site level performance on underlying data
Site Wall not full height (%) Gaps Rebuilt in local style Structurally sound
1 0 N Y Y
2 0 N Y Y
3 0 N Y Y
4 0 N Y Y
5 2 N Y Y
6 10 N Y Y
7 35 Y Y N
8 5 Y Y Y
9 10 Y Y Y
10 2 N Y Y
11 10 N Y Y
12 15 N Y Y
13 0 N Y Y
14 0 N Y Y
15 2 N Y Y
16 0 N Y Y
17 0 N Y Y
18 0 N Y Y
19 0 N Y Y
20 0 N Y Y
21 0 N Y Y
22 0 N Y Y
23 0 N Y Y
24 2 N Y Y
25 0 N Y Y
26 20 N Y Y
27 15 N Y Y
28 1 N Y Y
29 5 N Y Y
30 0 N Y Y
Mean 4.5 - - -
Median 0 - - -
Q_25 0 - - -
Q_75 5 - - -
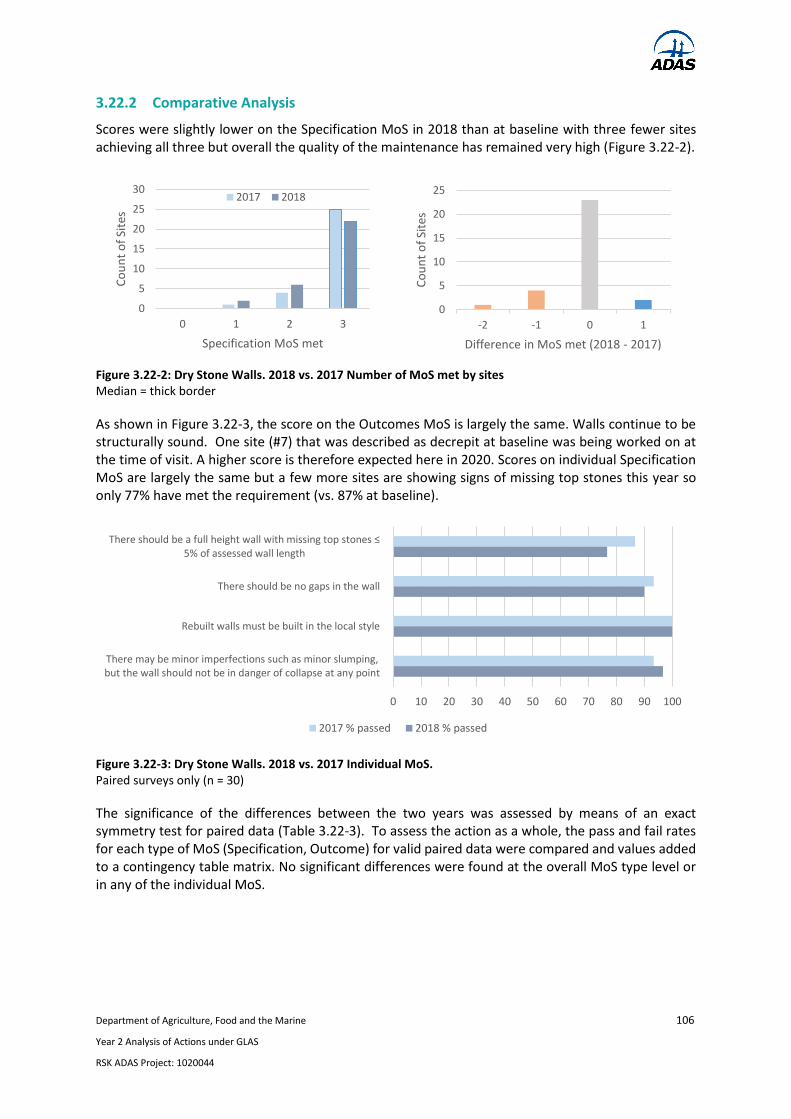
Department of Agriculture, Food and the Marine 106
Year 2 Analysis of Actions under GLAS
RSK ADAS Project: 1020044
3.22.2 Comparative Analysis
Scores were slightly lower on the Specification MoS in 2018 than at baseline with three fewer sites achieving all three but overall the quality of the maintenance has remained very high (Figure 3.22-2).
As shown in Figure 3.22-3, the score on the Outcomes MoS is largely the same. Walls continue to be structurally sound. One site (#7) that was described as decrepit at baseline was being worked on at the time of visit. A higher score is therefore expected here in 2020. Scores on individual Specification MoS are largely the same but a few more sites are showing signs of missing top stones this year so only 77% have met the requirement (vs. 87% at baseline).
Figure 3.22-3: Dry Stone Walls. 2018 vs. 2017 Individual MoS. Paired surveys only (n = 30)
The significance of the differences between the two years was assessed by means of an exact symmetry test for paired data (Table 3.22-3). To assess the action as a whole, the pass and fail rates for each type of MoS (Specification, Outcome) for valid paired data were compared and values added to a contingency table matrix. No significant differences were found at the overall MoS type level or in any of the individual MoS.
0 10 20 30 40 50 60 70 80 90 100
There should be a full height wall with missing top stones ≤ 5% of assessed wall length
There should be no gaps in the wall
Rebuilt walls must be built in the local style
There may be minor imperfections such as minor slumping,but the wall should not be in danger of collapse at any point
2017 % passed 2018 % passed
0
5
10
15
20
25
30
0 1 2 3
Co
un
t o
f Si
tes
Specification MoS met
2017 2018
0
5
10
15
20
25
-2 -1 0 1
Co
un
t o
f Si
tes
Difference in MoS met (2018 - 2017)
Figure 3.22-2: Dry Stone Walls. 2018 vs. 2017 Number of MoS met by sites Median = thick border

Department of Agriculture, Food and the Marine 107
Year 2 Analysis of Actions under GLAS
RSK ADAS Project: 1020044
Table 3.22-3: Dry Stone Walls. 2018 vs. 2017 Number of MoS. Exact Symmetry Test
Fail 17 Fail 18
Fail 17 Pass 18
Pass 17 Fail 18
Pass 17 Pass 18
P value
All specification MoS 4 2 6 78 0.289
There should be a full height wall with missing top stones ≤ 5% of assessed wall length
2 2 5 21 0.453
There should be no gaps in the wall 2 0 1 27 1
Rebuilt walls must be built in the local style 0 0 0 30 -
There may be minor imperfections such as minor slumping, but the wall should not be in danger of
collapse at any point 1 1 0 28 1
The number passing the full height criterion may be slightly lower (albeit not significantly) and there is a slight increase in the percentage of wall that is not full height across the sample. However, a Wilcoxon Signed Rank test indicates that this difference in the underlying variable is not significant (Table 3.22-4).
Table 3.22-4: Dry Stone Walls. 2018 vs. 2017 Underlying data. Wilcoxon Signed Rank Test
2017 2018 Wilcoxon Signed Rank
Variable Paired
surveys Mean Median Mean Median Z score
P value
Percentage of wall that is not full height (%)
30 2.9 0 4.5 0 -0.818 0.413
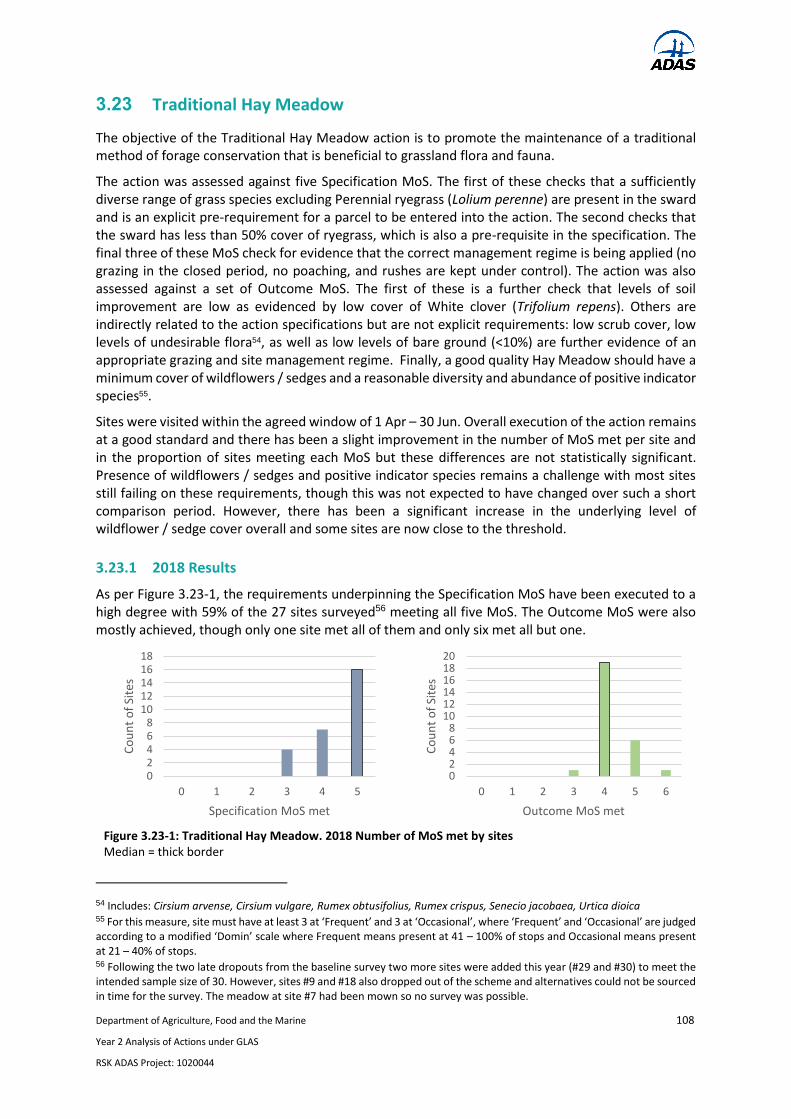
Department of Agriculture, Food and the Marine 108
Year 2 Analysis of Actions under GLAS
RSK ADAS Project: 1020044
3.23 Traditional Hay Meadow
The objective of the Traditional Hay Meadow action is to promote the maintenance of a traditional method of forage conservation that is beneficial to grassland flora and fauna.
The action was assessed against five Specification MoS. The first of these checks that a sufficiently diverse range of grass species excluding Perennial ryegrass (Lolium perenne) are present in the sward and is an explicit pre-requirement for a parcel to be entered into the action. The second checks that the sward has less than 50% cover of ryegrass, which is also a pre-requisite in the specification. The final three of these MoS check for evidence that the correct management regime is being applied (no grazing in the closed period, no poaching, and rushes are kept under control). The action was also assessed against a set of Outcome MoS. The first of these is a further check that levels of soil improvement are low as evidenced by low cover of White clover (Trifolium repens). Others are indirectly related to the action specifications but are not explicit requirements: low scrub cover, low levels of undesirable flora54, as well as low levels of bare ground (<10%) are further evidence of an appropriate grazing and site management regime. Finally, a good quality Hay Meadow should have a minimum cover of wildflowers / sedges and a reasonable diversity and abundance of positive indicator species55.
Sites were visited within the agreed window of 1 Apr – 30 Jun. Overall execution of the action remains at a good standard and there has been a slight improvement in the number of MoS met per site and in the proportion of sites meeting each MoS but these differences are not statistically significant. Presence of wildflowers / sedges and positive indicator species remains a challenge with most sites still failing on these requirements, though this was not expected to have changed over such a short comparison period. However, there has been a significant increase in the underlying level of wildflower / sedge cover overall and some sites are now close to the threshold.
3.23.1 2018 Results
As per Figure 3.23-1, the requirements underpinning the Specification MoS have been executed to a high degree with 59% of the 27 sites surveyed56 meeting all five MoS. The Outcome MoS were also mostly achieved, though only one site met all of them and only six met all but one.
54 Includes: Cirsium arvense, Cirsium vulgare, Rumex obtusifolius, Rumex crispus, Senecio jacobaea, Urtica dioica 55 For this measure, site must have at least 3 at ‘Frequent’ and 3 at ‘Occasional’, where ‘Frequent’ and ‘Occasional’ are judged according to a modified ‘Domin’ scale where Frequent means present at 41 – 100% of stops and Occasional means present at 21 – 40% of stops. 56 Following the two late dropouts from the baseline survey two more sites were added this year (#29 and #30) to meet the intended sample size of 30. However, sites #9 and #18 also dropped out of the scheme and alternatives could not be sourced in time for the survey. The meadow at site #7 had been mown so no survey was possible.
02468
1012141618
0 1 2 3 4 5
Co
un
t o
f Si
tes
Specification MoS met
02468
101214161820
0 1 2 3 4 5 6
Co
un
t o
f Si
tes
Outcome MoS met
Figure 3.23-1: Traditional Hay Meadow. 2018 Number of MoS met by sites Median = thick border

Department of Agriculture, Food and the Marine 109
Year 2 Analysis of Actions under GLAS
RSK ADAS Project: 1020044
Performance on individual MoS is shown in Table 3.23-1 and performance on underlying data in Table 3.23-2. All sites met the no poaching requirement and 85% had not been grazed. Almost all sites met the requirements for three grasses and ryegrass cover. Indeed, the median site had five grasses present and just 6% ryegrass cover and the vast majority of sites were well within the threshold. Rush cover was generally low and 78% of sites had less than 5%. The action specification is not explicit about the exact cover of rushes, just that they should be kept “under control”. Only a few sites had very high levels of rushes at or greater than 25% of the parcel (#11, #12, #14, and #26).
Table 3.23-1: Traditional Hay Meadow. 2018 Performance on individual MoS
2018
Specification MOS Valid Surveys Total passed % passed
There should be ≥ three grasses throughout the sward. 27 24 89
Cover of Perennial ryegrass should be < 50% 27 25 93
Cover of rushes should be ≤ 5%. 27 21 78
The parcel must not be grazed from April 15th after 1st of July and until the hay has been cut
27 23 85
There should be no poaching 27 27 100
Outcome MOS Valid Surveys Total passed % passed
Cover of White clover should be < 30% 27 27 100
Cover of bare ground should be < 10%. 27 27 100
Cover of undesirable species should be < 5%. 27 27 100
Cover of scrub/bracken etc. should be < 5%. 27 25 93
Cover of wildflowers and sedges should be > 20% 27 8 30
Min 3 Indicator Species should be Frequent and 3 Occasional 27 1 4
White clover was consistently low across all sites with a median cover of just 3% and even the site with the highest cover (#6 at 22%) was well within the threshold. All sites had very low levels of bare ground and undesirable species. Nearly all sites had less than 5% scrub and even the two which failed the MoS were right on the cusp with exactly 5% cover. Where sites consistently came short was on the floral cover and positive indicator measures with only a 30% having sufficient cover and only one site meeting the expectations for positive indicator species. The single site which met the requirement (#12) may be closer to wet grassland than hay meadow.
The poor indicator species and wildflower results are somewhat disappointing as these MoS are not particularly stringent in terms of what a medium quality Hay Meadow is likely to support, especially as most of the other MoS are being met. However, the lag between change in management and significant change in botanical diversity for Hay Meadows can be very long (often more than 10 years). So, if most sites have only been under appropriate management for a couple of years, then it is not surprising that most have not met these MoS.
Some sites (#3, #13, #14, and #25) already show high wildflower cover and came close to meeting the positive indicator requirement this year, so may possibly meet the threshold when they are reassessed in 2020. Site #14 comes closest to 'classic' hay meadow vegetation, with frequent black knapweed (Centaurea nigra), common bird's-foot-trefoil (Lotus corniculatus) and red clover (Trifolium pratense), as well as a number of other species such as devil's-bit scabious (Succisa pratensis). In some cases, herb species were mentioned as being present though not captured by the quadrats. This is probably a function of them being at low levels within the sward (e.g. sites #26 and #27). These two sites in particular supported a small suite of species within the parcel generally considered excellent indicators of good quality habitat (e.g. Dactylhoriza fuschsii). Site #30 had some positive indicator coverage
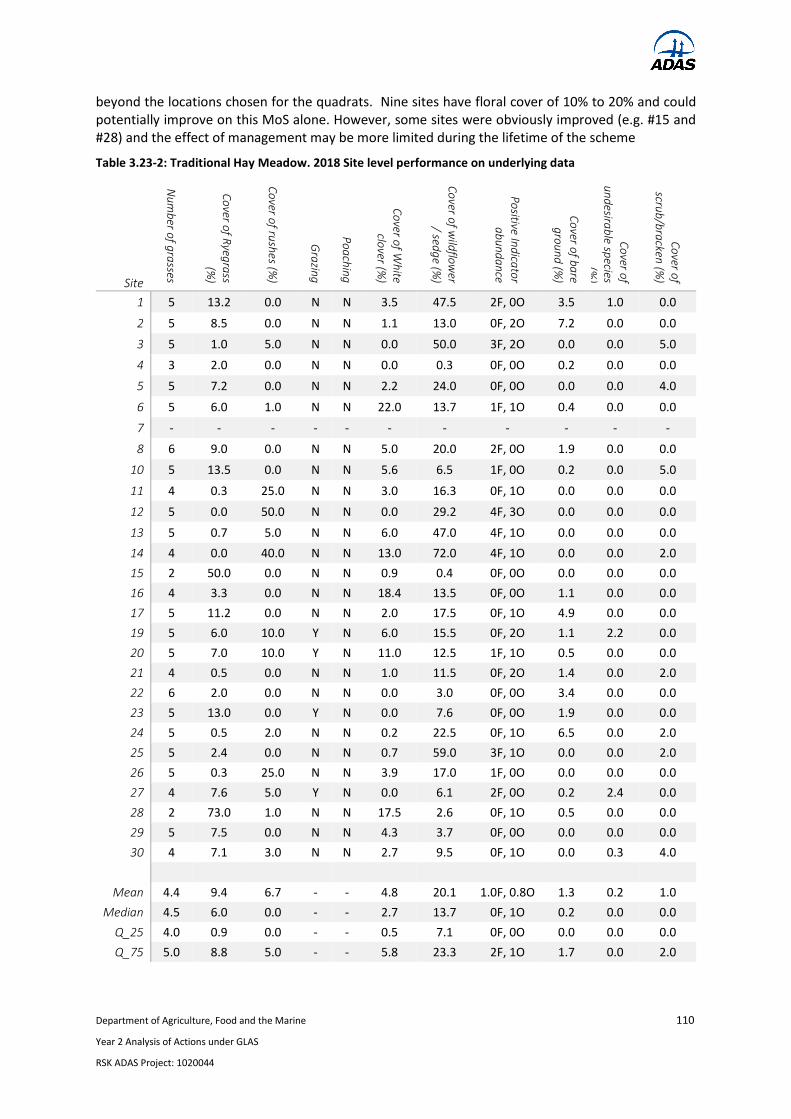
Department of Agriculture, Food and the Marine 110
Year 2 Analysis of Actions under GLAS
RSK ADAS Project: 1020044
beyond the locations chosen for the quadrats. Nine sites have floral cover of 10% to 20% and could potentially improve on this MoS alone. However, some sites were obviously improved (e.g. #15 and #28) and the effect of management may be more limited during the lifetime of the scheme
Table 3.23-2: Traditional Hay Meadow. 2018 Site level performance on underlying data
Site
Nu
mb
er of g
rasses
Co
ver of R
yegra
ss
(%)
Co
ver of ru
shes (%
)
Gra
zing
Po
ach
ing
Co
ver of W
hite
clover (%
)
Co
ver of w
ildflo
wer
/ sedg
e (%)
Po
sitive Ind
icato
r a
bu
nd
an
ce
Co
ver of b
are
gro
un
d (%
)
Co
ver of
un
desira
ble sp
ecies (%
)
Co
ver of
scrub
/bra
cken (%
)
1 5 13.2 0.0 N N 3.5 47.5 2F, 0O 3.5 1.0 0.0
2 5 8.5 0.0 N N 1.1 13.0 0F, 2O 7.2 0.0 0.0
3 5 1.0 5.0 N N 0.0 50.0 3F, 2O 0.0 0.0 5.0
4 3 2.0 0.0 N N 0.0 0.3 0F, 0O 0.2 0.0 0.0
5 5 7.2 0.0 N N 2.2 24.0 0F, 0O 0.0 0.0 4.0
6 5 6.0 1.0 N N 22.0 13.7 1F, 1O 0.4 0.0 0.0
7 - - - - - - - - - - -
8 6 9.0 0.0 N N 5.0 20.0 2F, 0O 1.9 0.0 0.0
10 5 13.5 0.0 N N 5.6 6.5 1F, 0O 0.2 0.0 5.0
11 4 0.3 25.0 N N 3.0 16.3 0F, 1O 0.0 0.0 0.0
12 5 0.0 50.0 N N 0.0 29.2 4F, 3O 0.0 0.0 0.0
13 5 0.7 5.0 N N 6.0 47.0 4F, 1O 0.0 0.0 0.0
14 4 0.0 40.0 N N 13.0 72.0 4F, 1O 0.0 0.0 2.0
15 2 50.0 0.0 N N 0.9 0.4 0F, 0O 0.0 0.0 0.0
16 4 3.3 0.0 N N 18.4 13.5 0F, 0O 1.1 0.0 0.0
17 5 11.2 0.0 N N 2.0 17.5 0F, 1O 4.9 0.0 0.0
19 5 6.0 10.0 Y N 6.0 15.5 0F, 2O 1.1 2.2 0.0
20 5 7.0 10.0 Y N 11.0 12.5 1F, 1O 0.5 0.0 0.0
21 4 0.5 0.0 N N 1.0 11.5 0F, 2O 1.4 0.0 2.0
22 6 2.0 0.0 N N 0.0 3.0 0F, 0O 3.4 0.0 0.0
23 5 13.0 0.0 Y N 0.0 7.6 0F, 0O 1.9 0.0 0.0
24 5 0.5 2.0 N N 0.2 22.5 0F, 1O 6.5 0.0 2.0
25 5 2.4 0.0 N N 0.7 59.0 3F, 1O 0.0 0.0 2.0
26 5 0.3 25.0 N N 3.9 17.0 1F, 0O 0.0 0.0 0.0
27 4 7.6 5.0 Y N 0.0 6.1 2F, 0O 0.2 2.4 0.0
28 2 73.0 1.0 N N 17.5 2.6 0F, 1O 0.5 0.0 0.0
29 5 7.5 0.0 N N 4.3 3.7 0F, 0O 0.0 0.0 0.0
30 4 7.1 3.0 N N 2.7 9.5 0F, 1O 0.0 0.3 4.0
Mean 4.4 9.4 6.7 - - 4.8 20.1 1.0F, 0.8O 1.3 0.2 1.0
Median 4.5 6.0 0.0 - - 2.7 13.7 0F, 1O 0.2 0.0 0.0
Q_25 4.0 0.9 0.0 - - 0.5 7.1 0F, 0O 0.0 0.0 0.0
Q_75 5.0 8.8 5.0 - - 5.8 23.3 2F, 1O 1.7 0.0 2.0
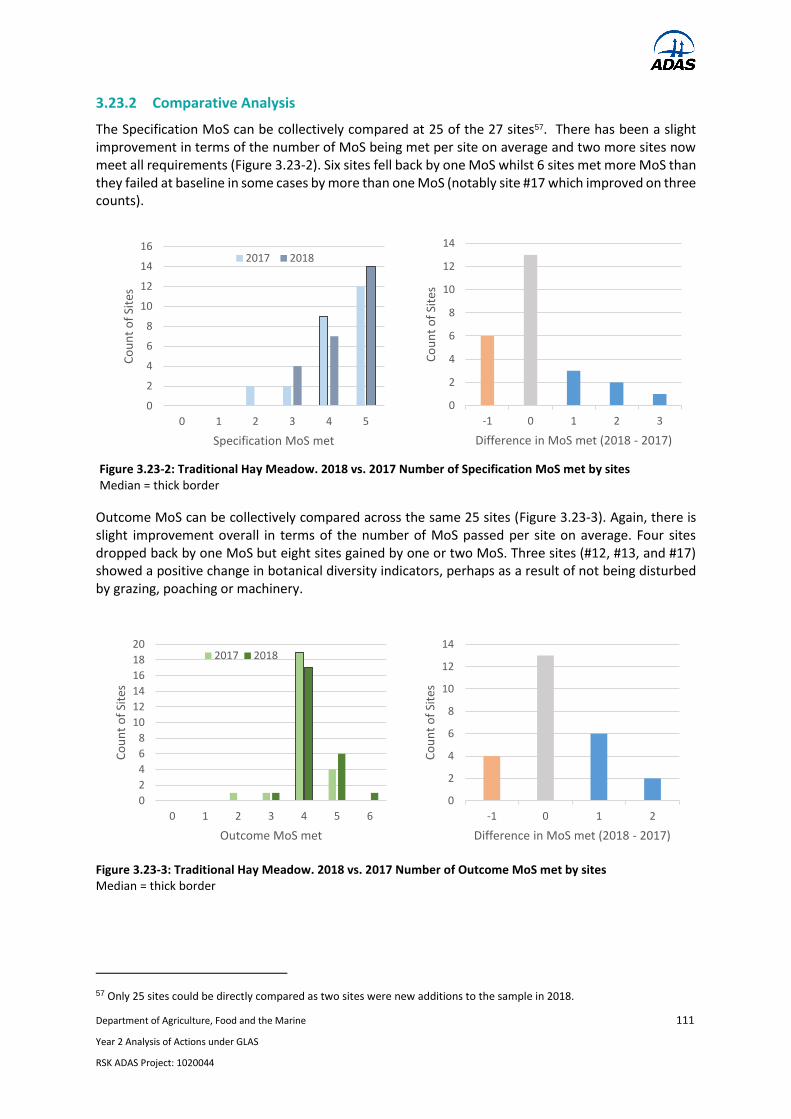
Department of Agriculture, Food and the Marine 111
Year 2 Analysis of Actions under GLAS
RSK ADAS Project: 1020044
3.23.2 Comparative Analysis
The Specification MoS can be collectively compared at 25 of the 27 sites57. There has been a slight improvement in terms of the number of MoS being met per site on average and two more sites now meet all requirements (Figure 3.23-2). Six sites fell back by one MoS whilst 6 sites met more MoS than they failed at baseline in some cases by more than one MoS (notably site #17 which improved on three counts).
Outcome MoS can be collectively compared across the same 25 sites (Figure 3.23-3). Again, there is slight improvement overall in terms of the number of MoS passed per site on average. Four sites dropped back by one MoS but eight sites gained by one or two MoS. Three sites (#12, #13, and #17) showed a positive change in botanical diversity indicators, perhaps as a result of not being disturbed by grazing, poaching or machinery.
57 Only 25 sites could be directly compared as two sites were new additions to the sample in 2018.
0
2
4
6
8
10
12
14
16
0 1 2 3 4 5
Co
un
t o
f Si
tes
Specification MoS met
2017 2018
0
2
4
6
8
10
12
14
-1 0 1 2 3C
ou
nt
of
Site
sDifference in MoS met (2018 - 2017)
Figure 3.23-2: Traditional Hay Meadow. 2018 vs. 2017 Number of Specification MoS met by sites Median = thick border
0
2
4
6
8
10
12
14
16
18
20
0 1 2 3 4 5 6
Co
un
t o
f Si
tes
Outcome MoS met
2017 2018
0
2
4
6
8
10
12
14
-1 0 1 2
Co
un
t o
f Si
tes
Difference in MoS met (2018 - 2017)
Figure 3.23-3: Traditional Hay Meadow. 2018 vs. 2017 Number of Outcome MoS met by sites Median = thick border

Department of Agriculture, Food and the Marine 112
Year 2 Analysis of Actions under GLAS
RSK ADAS Project: 1020044
There was limited change in most of the individual MoS, with the exception of the floral measures which were already well met at baseline (Figure 3.23-4). However, the percentage of sites with three or more grasses has increased from 76% to 88% and the number of sites with no poaching evident has increased from 84% to 100%. The lack of change in the wildflower / sedge and floral abundance / diversity MoS is not surprising given that only one year had passed in between surveys.
Figure 3.23-4: Traditional Hay Meadow. 2018 vs. 2017. Individual MoS. Paired surveys only (n = 25)
0 10 20 30 40 50 60 70 80 90 100
There should be ≥ three grasses throughout the sward.
Cover of Perennial ryegrass should be < 50%
Cover of rushes should be ≤ 5%.
The parcel must not be grazed from April 15th after 1st ofJuly and until the hay has been cut
There should be no poaching
Cover of White clover should be < 30%
Cover of bare ground should be < 10%.
Cover of undesirable species should be < 5%.
Cover of scrub/bracken etc should be < 5%.
Cover of wildflowers and sedges should be > 20%
A minimum of 3 Indicator Species should be Frequent and 3Occasional
2017 % passed 2018 % passed

Department of Agriculture, Food and the Marine 113
Year 2 Analysis of Actions under GLAS
RSK ADAS Project: 1020044
The significance of the differences between the two years was assessed by means of an exact symmetry test for paired data (Table 3.23-3). To assess the action as a whole, the pass and fail rates for each type of MoS (Specification, Outcome) for valid paired data were compared and values added to a contingency table matrix. No significant differences were found either at the overall MoS type level or at the individual MoS level.
Table 3.23-3: Traditional Hay Meadow. 2018 vs. 2017 Number of MoS. Exact Symmetry Test
Fail 17 Fail 18
Fail 17 Pass 18
Pass 17 Fail 18
Pass 17 Pass 18
P value
All specification MoS 7 12 8 98 0.503
There should be ≥ three grasses throughout the sward.
2 4 1 18 0.375
Cover of Perennial ryegrass should be < 50% 1 0 1 23 1
Cover of rushes should be ≤ 5%. 3 2 3 17 1
The parcel must not be grazed from April 15th after 1st of July and until the hay has been cut
1 2 3 19 1
There should be no poaching 0 4 0 21 0.125
All outcome MoS 38 11 5 96 0.21
Cover of White clover should be < 30% 0 0 0 25 NA
Cover of bare ground should be < 10%. 0 2 0 23 0.5
Cover of undesirable species should be < 5%. 0 2 0 23 0.5
Cover of scrub/bracken etc. should be < 5%. 0 2 2 21 1
Cover of wildflowers and sedges should be > 20% 14 4 3 4 1
A minimum of 3 Indicator Species should be Frequent and 3 Occasional
24 1 0 0 1
There has been limited change in the data underpinning the MoS where the variables can be easily quantified and are not binary (Table 3.23-4). However, there does appear to have been an increase, on average, in the number of grasses present (from a median of 3 to a median of 5) and the cover of wildflower and sedges (from a median of 12% to a median of 16%).
Indeed, these two differences turn out to be significant according to a Wilcoxon Signed Rank test applied to the two years. The number of grasses is significantly higher (Z = - 3.961, p < 0.001) as is the wildflower and sedge cover (Z = -2.287, p = 0.022). There is also a significant difference in the cover of undesirable species, which was lower than last year (Z = 2.846, p = 0.004) though this was not particularly relevant to the MoS as the cover was already well below the threshold. The Wilcoxon Signed Rank test is non-parametric, so the extent to which the wildflower cover has increased cannot be inferred from the result. However, the fact that there has been a change between the two years is encouraging given the need for more sites to pass on this measure going forward.
The positive indicator measure cannot be easily assessed on an underlying basis as it is a compound indicator. There does not appear to be a difference in the median number of positive indicators recorded as frequent, but the mean is higher than last year. However, on the Wilcoxon Signed Rank test there is no significant difference in the count of sites recording as Frequent or Occasional between the two years.
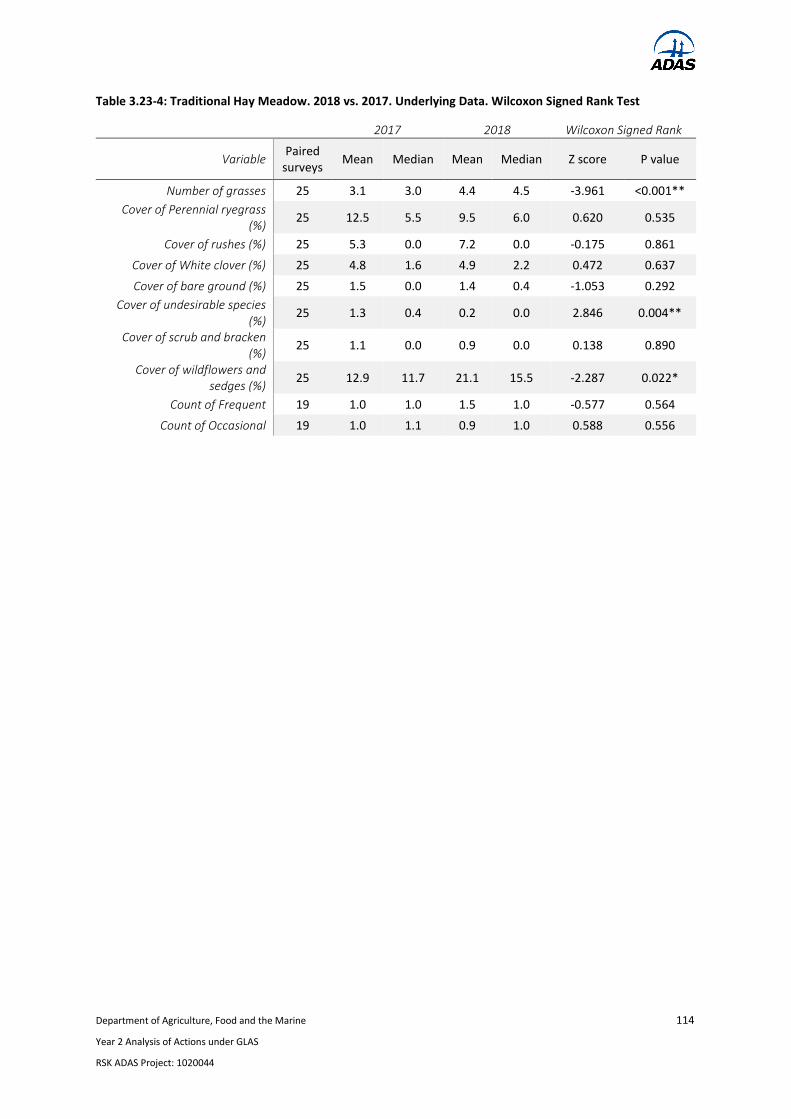
Department of Agriculture, Food and the Marine 114
Year 2 Analysis of Actions under GLAS
RSK ADAS Project: 1020044
Table 3.23-4: Traditional Hay Meadow. 2018 vs. 2017. Underlying Data. Wilcoxon Signed Rank Test
2017 2018 Wilcoxon Signed Rank
Variable Paired
surveys Mean Median Mean Median Z score P value
Number of grasses 25 3.1 3.0 4.4 4.5 -3.961 <0.001**
Cover of Perennial ryegrass (%)
25 12.5 5.5 9.5 6.0 0.620 0.535
Cover of rushes (%) 25 5.3 0.0 7.2 0.0 -0.175 0.861
Cover of White clover (%) 25 4.8 1.6 4.9 2.2 0.472 0.637
Cover of bare ground (%) 25 1.5 0.0 1.4 0.4 -1.053 0.292
Cover of undesirable species (%)
25 1.3 0.4 0.2 0.0 2.846 0.004**
Cover of scrub and bracken (%)
25 1.1 0.0 0.9 0.0 0.138 0.890
Cover of wildflowers and sedges (%)
25 12.9 11.7 21.1 15.5 -2.287 0.022*
Count of Frequent 19 1.0 1.0 1.5 1.0 -0.577 0.564
Count of Occasional 19 1.0 1.1 0.9 1.0 0.588 0.556

Department of Agriculture, Food and the Marine 115
Year 2 Analysis of Actions under GLAS
RSK ADAS Project: 1020044
3.24 Traditional Orchards
The objective of the action is to increase biodiversity and provide a habitat for wildlife on the farm. Traditional orchards also ensure the survival of old fruit varieties and enhance the visual and historical value of the landscape.
The action was assessed against five Specification MoS in 2018. These check the execution of the planting itself and then the subsequent management which includes protection of the growing trees and replacement of dead or failed trees. An Outcome MoS to check the trees have grown to a sufficient height will be assessed in 2020 only.
Sites were visited as per the agreed window which could be at any time of year. Overall, the findings discussed below indicate a reasonable standard of execution and a good standard of aftercare. The correct number of trees have been planted but often too close together. Most trees are property supported and almost all have been protected from grazing damage. Where trees have failed, they have almost all been replaced. By thus far, the majority of orchards appeared to be flourishing and healthy.
3.24.1 2018 Results
The action was largely successful with respect to the specification with 11 of the 27 sites58 meeting all the criteria on which they could be assessed, and a further 10 met all but one of these (Figure 3.24-1).
Performance on individual MoS is shown in Table 3.24-1 and on the underlying data in Table 3.24-2. Almost all sites met the criterion for planting of at least 10 fruit trees. Compliance was good with the tree support/staking criterion (81%) and the stipulation to prevent damage to trees from stock (89%). There were a few instances of trees that had suffered damage for other reasons. Replacement of failed or damaged trees was also good at those sites that required it with only a single site failing to comply.
58 29 sites were visited for the action in this year. One site (#17) had dropped out of the scheme and a replacement was not found in time. Only 27 could be assessed as at a further two sites (#22, #29) implementation had not taken place.
0
2
4
6
8
10
12
0 1 2 3 4 5
Co
un
t o
f Si
tes
Specification MoS met
Figure 3.24-1: Traditional Orchards. 2018 Number of MoS met by sites Median = thick border

Department of Agriculture, Food and the Marine 116
Year 2 Analysis of Actions under GLAS
RSK ADAS Project: 1020044
The one MoS where implementation was not optimal was planting density where only about half of the orchards had trees at least 7m apart.
Table 3.24-1: Traditional Orchards. 2018 Performance on individual MoS
2018
Specification MOS Valid
Surveys Total
passed %
passed
There should be at least 10 fruit trees, within 0.05Ha 27 26 96
Trees must be spaced with a radius of 7m apart59 27 15 56
All trees must be supported with a suitable stake and secured with a suitable tie or self-supporting
27 22 81
Trees should not be damaged by grazing 27 24 89
Failed or dead trees must be replaced during the next planting season 27 26 96
Result MOS Valid
Surveys Total
passed %
passed
By year 5 average tree height should be ≥ 1.5m - - -
Of those 12 not meeting the spacing requirement, five were only 1 metre short of the preferred density. However, that still left a number of sites where trees were too densely packed, meaning that they may need thinning in the future. At site #7 not only were the trees planted with a 4m density, but they were also planted all in a line. Five sites did not meet the supported requirement. Of these, three (#11, #23, #24) were at least well protected from threats, and trees appeared to be flourishing. At the other two (#12, #20) competitive vegetation and stock were limiting the growth of some of the trees.
Average tree height at 19 of the 27 sites was already at or above 1.5m, so as long as management continues and there are no external factors then this criterion should also be met by 2020 when it is assessable.
59 This is assumed to mean that trees must be at least 7m apart.

Department of Agriculture, Food and the Marine 117
Year 2 Analysis of Actions under GLAS
RSK ADAS Project: 1020044
Table 3.24-2: Traditional Orchards. 2018 Site level performance on underlying data
Site
No of (new) trees Spacing (m)
Trees supported (%)
Trees damaged by
stock (%) Number of dead trees
Dead over 1yr?
Average Tree Height
(cm)
1 10 7 100 0 0 - 205
2 10 6 100 0 0 - 185
3 22 4 100 0 0 - 205
4 10 7 100 0 0 - 183
5 10 7 100 0 0 - 143
6 10 6 100 0 1 N 175
7 5 4 100 0 0 - 138
8 12 8 100 0 1 N 200
9 11 7 100 0 0 - 210
10 10 7 100 0 0 - 214
11 10 9 0 0 0 - 150
12 10 7.5 0 0 0 - 130
13 10 8 100 0 0 - 163
14 10 5 100 30 0 - 135
15 10 2 100 0 2 Y 214
16 10 5 100 0 0 - 175
18 10 10 100 0 0 - 123
19 16 6 100 0 0 - 180
20 10 7 80 10 1 N 170
21 24 2 100 100 1 N 180
22 - - - - - - -
23 10 7 10 0 0 - 185
24 10 6 0 0 0 - 155
25 10 7 100 0 1 N 146
26 10 7 100 0 0 - 120
27 10 7 100 0 0 - 150
28 13 6 100 0 0 - 99
29 - - - - - - -
30 10 3 100 0 0 - 205
Mean 11.2 6.2 84.8 5.2 0 - 168.1
Median 10 7 100 0 0 - 175
Q_25 10 5.5 100 0 0 - 144.5
Q_75 10 7 100 0 0 - 192.5
3.24.2 Comparative Analysis
The action was subject to an implementation check only in 2017 so no comparative analysis is possible.
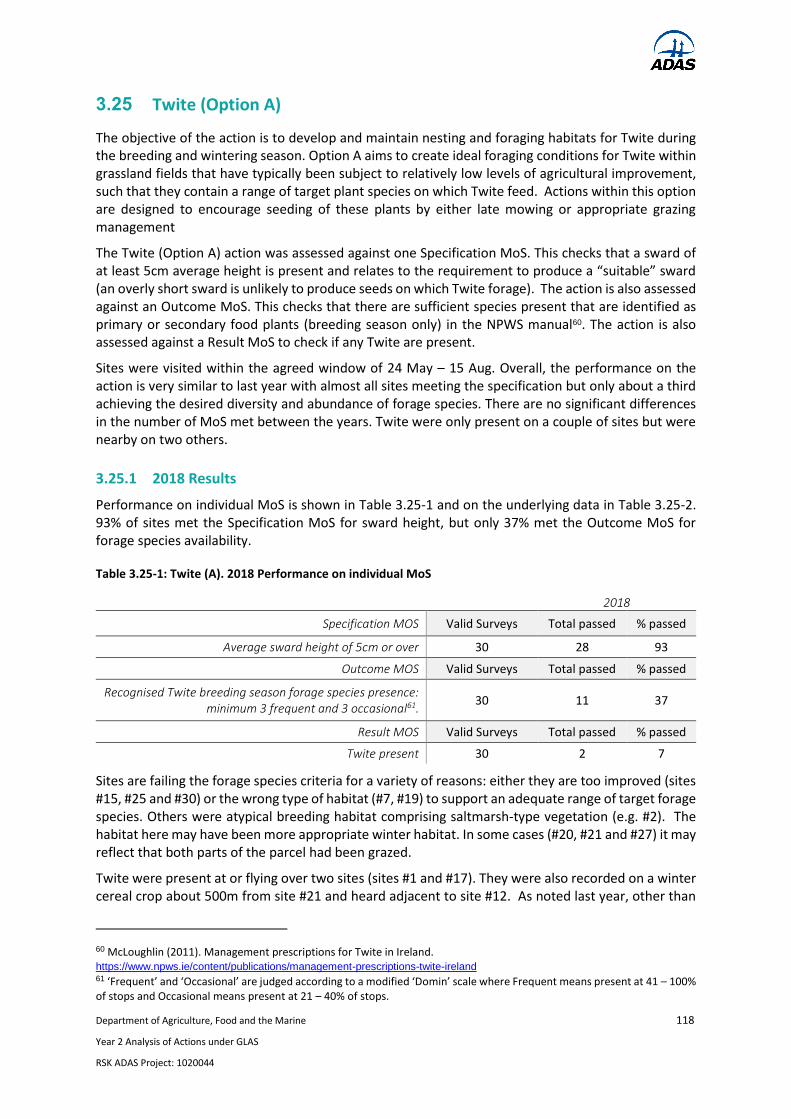
Department of Agriculture, Food and the Marine 118
Year 2 Analysis of Actions under GLAS
RSK ADAS Project: 1020044
3.25 Twite (Option A)
The objective of the action is to develop and maintain nesting and foraging habitats for Twite during the breeding and wintering season. Option A aims to create ideal foraging conditions for Twite within grassland fields that have typically been subject to relatively low levels of agricultural improvement, such that they contain a range of target plant species on which Twite feed. Actions within this option are designed to encourage seeding of these plants by either late mowing or appropriate grazing management
The Twite (Option A) action was assessed against one Specification MoS. This checks that a sward of at least 5cm average height is present and relates to the requirement to produce a “suitable” sward (an overly short sward is unlikely to produce seeds on which Twite forage). The action is also assessed against an Outcome MoS. This checks that there are sufficient species present that are identified as primary or secondary food plants (breeding season only) in the NPWS manual60. The action is also assessed against a Result MoS to check if any Twite are present.
Sites were visited within the agreed window of 24 May – 15 Aug. Overall, the performance on the action is very similar to last year with almost all sites meeting the specification but only about a third achieving the desired diversity and abundance of forage species. There are no significant differences in the number of MoS met between the years. Twite were only present on a couple of sites but were nearby on two others.
3.25.1 2018 Results
Performance on individual MoS is shown in Table 3.25-1 and on the underlying data in Table 3.25-2. 93% of sites met the Specification MoS for sward height, but only 37% met the Outcome MoS for forage species availability.
Table 3.25-1: Twite (A). 2018 Performance on individual MoS
2018
Specification MOS Valid Surveys Total passed % passed
Average sward height of 5cm or over 30 28 93
Outcome MOS Valid Surveys Total passed % passed
Recognised Twite breeding season forage species presence: minimum 3 frequent and 3 occasional61.
30 11 37
Result MOS Valid Surveys Total passed % passed
Twite present 30 2 7
Sites are failing the forage species criteria for a variety of reasons: either they are too improved (sites #15, #25 and #30) or the wrong type of habitat (#7, #19) to support an adequate range of target forage species. Others were atypical breeding habitat comprising saltmarsh-type vegetation (e.g. #2). The habitat here may have been more appropriate winter habitat. In some cases (#20, #21 and #27) it may reflect that both parts of the parcel had been grazed.
Twite were present at or flying over two sites (sites #1 and #17). They were also recorded on a winter cereal crop about 500m from site #21 and heard adjacent to site #12. As noted last year, other than
60 McLoughlin (2011). Management prescriptions for Twite in Ireland. https://www.npws.ie/content/publications/management-prescriptions-twite-ireland 61 ‘Frequent’ and ‘Occasional’ are judged according to a modified ‘Domin’ scale where Frequent means present at 41 – 100% of stops and Occasional means present at 21 – 40% of stops.
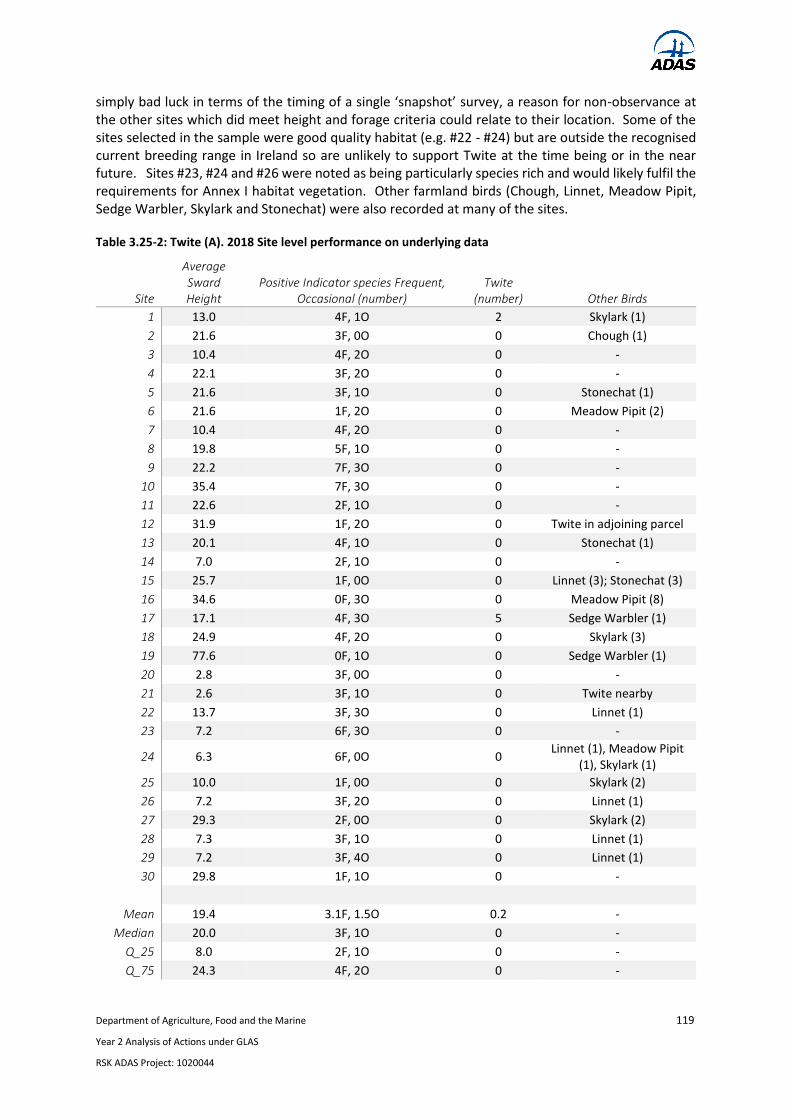
Department of Agriculture, Food and the Marine 119
Year 2 Analysis of Actions under GLAS
RSK ADAS Project: 1020044
simply bad luck in terms of the timing of a single ‘snapshot’ survey, a reason for non-observance at the other sites which did meet height and forage criteria could relate to their location. Some of the sites selected in the sample were good quality habitat (e.g. #22 - #24) but are outside the recognised current breeding range in Ireland so are unlikely to support Twite at the time being or in the near future. Sites #23, #24 and #26 were noted as being particularly species rich and would likely fulfil the requirements for Annex I habitat vegetation. Other farmland birds (Chough, Linnet, Meadow Pipit, Sedge Warbler, Skylark and Stonechat) were also recorded at many of the sites.
Table 3.25-2: Twite (A). 2018 Site level performance on underlying data
Site
Average Sward Height
Positive Indicator species Frequent, Occasional (number)
Twite (number) Other Birds
1 13.0 4F, 1O 2 Skylark (1)
2 21.6 3F, 0O 0 Chough (1)
3 10.4 4F, 2O 0 -
4 22.1 3F, 2O 0 -
5 21.6 3F, 1O 0 Stonechat (1)
6 21.6 1F, 2O 0 Meadow Pipit (2)
7 10.4 4F, 2O 0 -
8 19.8 5F, 1O 0 -
9 22.2 7F, 3O 0 -
10 35.4 7F, 3O 0 -
11 22.6 2F, 1O 0 -
12 31.9 1F, 2O 0 Twite in adjoining parcel
13 20.1 4F, 1O 0 Stonechat (1)
14 7.0 2F, 1O 0 -
15 25.7 1F, 0O 0 Linnet (3); Stonechat (3)
16 34.6 0F, 3O 0 Meadow Pipit (8)
17 17.1 4F, 3O 5 Sedge Warbler (1)
18 24.9 4F, 2O 0 Skylark (3)
19 77.6 0F, 1O 0 Sedge Warbler (1)
20 2.8 3F, 0O 0 -
21 2.6 3F, 1O 0 Twite nearby
22 13.7 3F, 3O 0 Linnet (1)
23 7.2 6F, 3O 0 -
24 6.3 6F, 0O 0 Linnet (1), Meadow Pipit
(1), Skylark (1)
25 10.0 1F, 0O 0 Skylark (2)
26 7.2 3F, 2O 0 Linnet (1)
27 29.3 2F, 0O 0 Skylark (2)
28 7.3 3F, 1O 0 Linnet (1)
29 7.2 3F, 4O 0 Linnet (1)
30 29.8 1F, 1O 0 -
Mean 19.4 3.1F, 1.5O 0.2 -
Median 20.0 3F, 1O 0 -
Q_25 8.0 2F, 1O 0 -
Q_75 24.3 4F, 2O 0 -

Department of Agriculture, Food and the Marine 120
Year 2 Analysis of Actions under GLAS
RSK ADAS Project: 1020044
3.25.2 Comparative Analysis
The results are very similar to last year when all sites met the height criterion and a third of sites met the forage species availability criterion. One more site has Twite present this year (Figure 3.25-1).
The only real change in the sites between the two years has been in terms of the forage species presence. Seven sites met this criterion which previously had not, but six sites failed to achieve it. Overall though the number meeting is more or less the same. Site #21 was one that fell back on both specification and outcomes measures. This was because both halves of the parcel had been grazed rather than just one as per the specification.
The significance of the differences between the two years was assessed by means of an exact symmetry test for paired data (Table 3.25-3). To assess the action as a whole, the pass and fail rates for each type of MoS (Specification, Outcome, and Result) for valid paired data were compared and values added to a contingency table matrix. Not surprisingly there were no significant differences.
Table 3.25-3: Twite (A). 2018 vs. 2017 Number of MoS. Exact Symmetry Test
Fail 17 Fail 18
Fail 17 Pass 18
Pass 17 Fail 18
Pass 17 Pass 18 P value
Average sward height of 5cm or over 0 0 1 28 1
Recognised Twite breeding season forage species presence: minimum 3 frequent and 3 occasional.
13 7 6 4 1
Twite present 27 2 1 0 1
As per Table 3.25-4, sward heights were on average lower this year than the previous year but the number of Twite were about the same. A straightforward comparison of the forage species numbers between the years is not feasible due to the compound nature of the underlying variable. However, there does appear to have been some change in the average frequencies for forage species at mean and median level.
A Wilcoxon Signed Rank test shows that there is a significant difference between the two years on the sward height (Z = 2.746, p = 0.006) suggesting that the sward is indeed shorter. Weather conditions may have been a factor in the lower values recorded this year, but this has not been analysed. However, this decrease has not affected the success of the action as most sites remain comfortably above the 5cm threshold. The same test also reveals a significant change in the count of forage species
0 10 20 30 40 50 60 70 80 90 100
Average sward height of 5cm or over (29)
Recognised Twite breeding season forage speciespresence: minimum 3 frequent and 3 occasional. (30)
Twite present (30)
2017 % passed 2018 % passed
Figure 3.25-1: Twite (A). 2018 vs. 2017 Individual MoS Paired surveys only (n as shown)

Department of Agriculture, Food and the Marine 121
Year 2 Analysis of Actions under GLAS
RSK ADAS Project: 1020044
at Occasional (Z = -2.343, p = 0.019) suggesting that there has been some increase in frequency. However, this has not had any effect on the number passing the MoS.
Table 3.25-4: Twite (A). 2018 vs. 2017. Underlying Data. Wilcoxon Signed Rank Test
2017 2018 Wilcoxon Signed Rank
Variable Paired
surveys Mean Median Mean Median Z score P value
Sward height (cm) 29 29.6 21 20.0 20 2.746 0.006**
Count of Frequent 30 3.4 2 3.1 3 0.496 0.620
Count of Occasional 30 0.8 1 1.5 1 -2.343 0.019*
Number of Twite 30 1 0 0 0 -0.537 0.591

Department of Agriculture, Food and the Marine 122
Year 2 Analysis of Actions under GLAS
RSK ADAS Project: 1020044
3.26 Wild Bird Cover
The objective of the action is to sow a seed crop mix that provides a food source and winter cover for farmland birds and other fauna.
The action was assessed against two Specification MoS. The first checks that the cover crop has been established to a sufficient height (15cm). The height threshold is not explicit in the action requirements but is implicit given the requirement that the crop is not harvested. The second checks that the crop species referred to in the specification are present both in absolute number (at least two present) and in area of coverage (at least half the sward under management). The action is not assessed against any further MoS but the absolute number of birds is noted, as is the presence of any Red and Amber-listed Birds of Conservation Concern.
Sites were visited within the agreed survey window of 1 Dec 2017 – 14 Mar 2018. Overall the action is being well implemented and there has been a significant year-on-year improvement in the number of sites meeting the requirements as a whole. There is still room for higher performance on the crop species MoS. There appeared to be fewer birds recorded on the sites this year, but the decrease is not statistically significant.
3.26.1 2018 Results
As shown in Figure 3.26-1 at site level, of the 29 sites surveyed62 16 met all of the MoS and the remainder met all but one.
As per Table 3.26-1 the height criterion was met on all sites. The percentage of ‘crop’ recorded as being the correct species varied considerably, from zero to as high as 87%, but over half the sample met both sub-criteria (Table 3.26-2). Performance at site level is shown in Table 3.26-3.
Table 3.26-1: Wild Bird Cover. 2018 Performance on individual MoS
2018
Specification MOS Valid
Surveys Total
passed % passed
Height of vegetation to be at least 15cm on average 29 29 100
Wheat, barley, Oats, Triticale, Oilseed rape, Linseed, Mustard and Kale, to comprise cumulatively at least 50% of the sward and at least two of
the above species to be present. 29 16 55
62 Site #28 dropped out of GLAS and a suitable replacement could not be identified in time, hence the sample size has reduced to 29.
0
5
10
15
20
0 1 2
Co
un
t o
f Si
tes
Specification MoS met
Figure 3.26-1: Wild Bird Cover. 2018 Number of MoS met by sites Median = thick border

Department of Agriculture, Food and the Marine 123
Year 2 Analysis of Actions under GLAS
RSK ADAS Project: 1020044
On average three of the crop species were present across the sites with linseed, kale and oats the most commonly planted species. On three sites (sites #2, #21 and #27) no wild bird cover had been planted and the height criterion was met due to the other vegetation. At a small number of other sites only a single species had properly established. A number of the planted species were also rather sparse. Site #2 appeared to be inappropriately selected for this action and comprised species-rich wet grassland with fen/flush characteristics, which should not be replaced with wild bird cover. Apart from this, the majority of sites appeared to be well suited to the action at a parcel level.
Table 3.26-2: Wild Bird Cover. 2018 Performance on crop species sub-criteria
2018
Sub-criteria for Crop Species MoS Valid
Surveys Total
passed % passed
Crop species comprise cumulatively at least 50% of sward 29 17 59
At least two species present 29 17 59
NO sub-criteria met 29 11 38
ONE sub-criterion met 29 2 7
BOTH sub-criteria met 29 16 55
Based on the number of birds recorded using many of these sites, the management appears to be working well (sites are broadly similar in terms of area) with a median of 34 relevant species recorded across the sample. The majority of the birds recorded were in the finch family (chaffinch, goldfinch, greenfinch and linnet). Yellowhammers (Emberiza citronella) were also only recorded on two sites, and then in very low numbers. Snipe and Stonechat (Saxicola rubicola) were recorded at site #2.
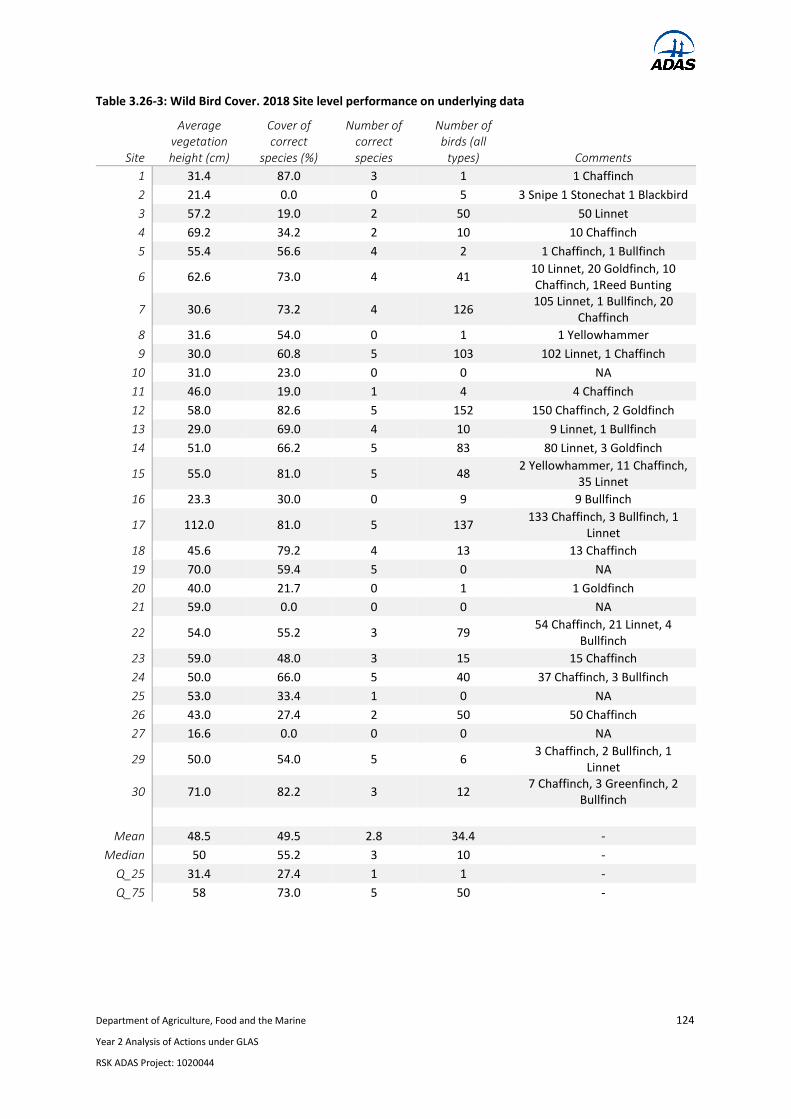
Department of Agriculture, Food and the Marine 124
Year 2 Analysis of Actions under GLAS
RSK ADAS Project: 1020044
Table 3.26-3: Wild Bird Cover. 2018 Site level performance on underlying data
Site
Average vegetation height (cm)
Cover of correct
species (%)
Number of correct species
Number of birds (all
types) Comments
1 31.4 87.0 3 1 1 Chaffinch
2 21.4 0.0 0 5 3 Snipe 1 Stonechat 1 Blackbird
3 57.2 19.0 2 50 50 Linnet
4 69.2 34.2 2 10 10 Chaffinch
5 55.4 56.6 4 2 1 Chaffinch, 1 Bullfinch
6 62.6 73.0 4 41 10 Linnet, 20 Goldfinch, 10 Chaffinch, 1Reed Bunting
7 30.6 73.2 4 126 105 Linnet, 1 Bullfinch, 20
Chaffinch
8 31.6 54.0 0 1 1 Yellowhammer
9 30.0 60.8 5 103 102 Linnet, 1 Chaffinch
10 31.0 23.0 0 0 NA
11 46.0 19.0 1 4 4 Chaffinch
12 58.0 82.6 5 152 150 Chaffinch, 2 Goldfinch
13 29.0 69.0 4 10 9 Linnet, 1 Bullfinch
14 51.0 66.2 5 83 80 Linnet, 3 Goldfinch
15 55.0 81.0 5 48 2 Yellowhammer, 11 Chaffinch,
35 Linnet
16 23.3 30.0 0 9 9 Bullfinch
17 112.0 81.0 5 137 133 Chaffinch, 3 Bullfinch, 1
Linnet
18 45.6 79.2 4 13 13 Chaffinch
19 70.0 59.4 5 0 NA
20 40.0 21.7 0 1 1 Goldfinch
21 59.0 0.0 0 0 NA
22 54.0 55.2 3 79 54 Chaffinch, 21 Linnet, 4
Bullfinch
23 59.0 48.0 3 15 15 Chaffinch
24 50.0 66.0 5 40 37 Chaffinch, 3 Bullfinch
25 53.0 33.4 1 0 NA
26 43.0 27.4 2 50 50 Chaffinch
27 16.6 0.0 0 0 NA
29 50.0 54.0 5 6 3 Chaffinch, 2 Bullfinch, 1
Linnet
30 71.0 82.2 3 12 7 Chaffinch, 3 Greenfinch, 2
Bullfinch
Mean 48.5 49.5 2.8 34.4 -
Median 50 55.2 3 10 -
Q_25 31.4 27.4 1 1 -
Q_75 58 73.0 5 50 -

Department of Agriculture, Food and the Marine 125
Year 2 Analysis of Actions under GLAS
RSK ADAS Project: 1020044
3.26.2 Comparative Analysis
The sites were assessed on the same MoS last year and so can be directly compared where there is matching site data. As shown in Figure 3.26-3, there is a notably improvement in the number of MoS met, with 10 sites achieving one more MoS than in the previous year. As such the number meeting all MoS has increased from nine to 16 and the number meeting only one or no MoS has decreased from 20 to 13.
As per Figure 3.26-2 the results on the height criterion are very similar to last year but this year all sites have managed to achieve the MoS. There has been a notable improvement in the number of sites meeting the species composition MoS.
There has been improvement in both sub-criteria of the crop species MoS with three more sites passing the 50% cover threshold and seven more having at least two species present (Table 3.26-4). The proportion of sites failing both remains the same (38%) and a number of these (eight) failed both in both years.
Figure 3.26-2: Wild Bird Cover. 2018 vs. 2017 Individual MoS Paired surveys only (n = 29)
0 10 20 30 40 50 60 70 80 90 100
Height of vegetation to be at least 15cm on average
Wheat, barley, Oats, Triticale, Oilseed rape, Linseed,Mustard and Kale, to comprise cumulatively at least 50%of the sward and at least two of the above species to be
present.
2017 % passed 2018 % passed
0
2
4
6
8
10
12
14
16
18
20
0 1 2
Co
un
t o
f Si
tes
Specification MoS met
2017 2018
0
2
4
6
8
10
12
14
16
18
-1 0 1
Co
un
t o
f Si
tes
Difference in MoS met (2018 - 2017)
Figure 3.26-3: Wild Bird Cover. 2018 vs. 2017 Number of MoS met by sites Median = thick border

Department of Agriculture, Food and the Marine 126
Year 2 Analysis of Actions under GLAS
RSK ADAS Project: 1020044
Table 3.26-4: Wild Bird Cover. 2018 vs. 2017. Performance on crop species MoS sub-criteria
2017 2018
Sub-criteria for Crop Species MoS Valid
Surveys Total
passed %
passed Total
passed %
passed
Crop species comprise cumulatively at least 50% of sward
29 14 48 17 59
At least two species present 29 13 45 17 59
NO components met 29 11 38 11 38
ONE component met 29 9 31 2 7
BOTH components met 29 9 31 16 55
The significance of the differences between the two years was assessed by means of an exact symmetry test for paired data (Table 3.26-5). To assess the action as a whole, the pass and fail rates for each MoS for valid paired data were compared and values added to a contingency table matrix. There was found to be a significant difference between the pass rates in the two years for the MoS as summed in this way (p = 0.039). Neither of the differences in the scores of the component MoS were significant in their own right.
Table 3.26-5: Wild Bird Cover. 2018 vs. 2017 Number of MoS. Exact Symmetry Test
Fail 17 Fail 18
Fail 17 Pass 18
Pass 17 Fail 18
Pass 17 Pass 18 P value
All specification MoS 11 10 2 35 0.039*
Height of vegetation to be at least 15cm on average 0 1 0 28 1
Wheat, barley, Oats, Triticale, Oilseed rape, Linseed, Mustard and Kale, to comprise cumulatively at least
50% of the sward and at least two of the above species to be present.
11 9 2 7 0.065
At underlying data level (Table 3.26-6), on average there was not much change in the sward height recorded between years, but the percentage cover and number of correct species present did increase. Bird numbers are down on average from a median of 36 per site to 10 per site. In contrast to baseline, no sites supported in excess of 200 birds, but four sites still supported 100 to 199 birds (sites #7, #9, #12 and #17). Fewer Red-listed species (Yellowhammer) were present with just three individuals across two sites, as compared to 2017 when 34 individuals were recorded across five sites. However, a Wilcoxon Signed Rank test shows that there are no significant difference between the two years on any of these criteria at the 5% level. This suggests that the significant improvement in the scores for the crop species MoS is driven by site specific changes, rather than a broader factor.
Table 3.26-6: Wild Bird Cover. 2018 vs. 2017 Underlying Data. Wilcoxon Signed Rank Test
2017 2018 Wilcoxon Signed Rank
Variable Paired
surveys Mean Median Mean Median Z score P value
Sward height (cm) 29 52.6 52.0 48.5 50.0 1.049 0.294
Cover of correct species (%) 29 39.7 38.0 49.5 55.2 -1.872 0.061
Number of correct species 29 3 2 3 3 -0.221 0.825
Number of birds 29 59 36 34 10 1.903 0.057

Department of Agriculture, Food and the Marine 127
Year 2 Analysis of Actions under GLAS
RSK ADAS Project: 1020044
4 SYNTHESIS OF FINDINGS
Each action has different objectives and a different set and number of MoS against which it has been judged. To enable a reasonable synthesis of the overall performance of the GLAS scheme, actions are grouped according to commonalities of objectives and requirements as follows:
4.1 Habitat Actions
Arable Grass Margins, Commonages, Environmental Management of Fallow Land, Farmland Habitat, Low-input Permanent Pasture and Traditional Hay Meadow are all actions which prescribe management systems with the aim of promoting botanical diversity within farmland through appropriate grazing / cutting, grass mixes, low nutrient inputs and other specifics. They differ in terms of the scale of management, farming system context, and whether the habitats are designated as Natura 2000 sites.
Table 4.1-1: Habitat Actions. 2018 MoS pass rate by MoS type
Specification MoS Outcome MoS
Action % Pass 2018 % Pass 2018
Arable Grass Margins 40 68
Commonages - 67
Environmental Management of Fallow Land 68 80
Farmland Habitat (Grassland) - 71
Low-input Permanent Pasture 94 81
Traditional Hay Meadow 89 71
4.1.1 Performance against Specifications
As per Table 4.1-1, Low-input Permanent Pasture and Traditional Hay Meadow parcels visited in 2018 were almost all excellently executed with respect to the specifications assessed. The Arable Grass Margin and Fallow parcels were somewhat less successful, which largely reflected that the cumulative cover of Cocksfoot and Timothy grasses was not always at the desired extent. The other two actions were not assessed against any specifications.
Relative to the baseline year only Low-Input Permanent Pasture and Traditional Hay Meadows can be compared on Specification MoS (Table 4.1-2). Other actions are either not assessable in this way or else were only subject to an implementation check at baseline. Both have shown improvement in the number of MoS being met from an already high base. The improvement in the execution of the Low-input Permanent Pasture action reflects changes across all of the individual MoS and is statistically significant on an Exact Symmetry Test (p = 0.019).
Table 4.1-2: Habitat Actions. 2018 vs. 2017 Number of Specification MoS. Exact Symmetry Test
Fail 17 Fail 18
Fail 17 Pass 18
Pass 17 Fail 18
Pass 17 Pass 18 P Value
Arable Margins - - - - -
Commonages - - - - -
Environmental Management of Fallow Land - - - - -
Farmland Habitat (Grassland) - - - - -
Low-input Permanent Pasture 2 20 7 118 0.019*
Traditional Hay Meadow 7 12 8 98 0.503

Department of Agriculture, Food and the Marine 128
Year 2 Analysis of Actions under GLAS
RSK ADAS Project: 1020044
4.1.2 Performance against Outcomes
Performance on the Outcome MoS was more consistent across actions and of a high standard in terms of the proportion of measures passed (Table 4.1-1). The data suggest that sites are being appropriately grazed or cut, and soils are generally not too nutrient enriched. Higher scores would have been achieved if sites had met Outcome MoS set for floral cover and botanical diversity, but this was not unexpected given the time that these features may require to develop. A number of Farmland Habitat (Grassland) sites were assessed against criteria for semi-natural grassland habitat when the actual parcel management requirements allowed for the maintenance of a more improved regime within that particular locality. If these are taken into account, then the performance for this action is stronger though the sites which scored the highest had clearly been in good management for some time before GLAS. A few of the Commonage sites also had high levels of bare peat which has detracted from overall performance, though these generally pre-dated the GLAS agreement.
2018 performance data on Outcome MoS can be statistically compared against the baseline year (2017) for Low-input Permanent Pasture, Traditional Hay Meadow and Farmland Habitat (Grassland) action (Table 4.1-3). All three have shown improvements in the number of MoS being met from an already high base. The improvement in the execution of the Low-input Permanent Pasture action reflects changes largely reflects a better score on the rank grass cover MoS and both the overall (p = 0.011) and that particular MoS (p = 0.003) change are statistically significant on an Exact Symmetry Test.
Better scores on the Outcome MoS relating to floral cover and botanical diversity would be desirable in the context of the habitat actions’ aims. For most of the sites surveyed achieving these could be possible with continued management as per the specification, though it may be unlikely to show as an indicator by 2020 due to the long lag time, especially where starting levels of nutrients were high.
Table 4.1-3: Habitat Actions. 2018 vs. 2017. Number of Outcome MoS. Exact Symmetry Test
Fail 17 Fail 18
Fail 17 Pass 18
Pass 17 Fail 18
Pass 17 Pass 18
P Value
Arable Margins - - - - -
Commonages - - - - -
Environmental Management of Fallow Land - - - - -
Farmland Habitat (Grassland) 56 25 16 146 0.211
Low-input Permanent Pasture 25 26 10 119 0.011*
Traditional Hay Meadow 38 11 5 96 0.210

Department of Agriculture, Food and the Marine 129
Year 2 Analysis of Actions under GLAS
RSK ADAS Project: 1020044
4.2 Water Actions
Protection of Watercourses from Bovines and Riparian Margins are both actions designed to improve water quality by excluding livestock and (in the latter case) intercepting nutrients before they enter watercourses.
Table 4.2-1: Water Actions. 2018 MoS pass rate by MoS type
Specification MoS Outcome MoS
Action % Pass 2018 % Pass 2018
Protection of Watercourse from Bovines 81 80
Riparian Margins 81 92
4.2.1 Performance against Specifications
Adherence to the specifications was high for the two watercourse protection actions with a pass rate of 81% overall (Table 4.2-1). There were a few cases where fences were damaged or missing, which is why not all of the sites were able to pass the Specification MoS. Relative to the baseline year, there have been some slight decreases in the number of Specification MoS met from a very high baseline score. This is not statistically significant on an Exact Symmetry Test and reflects a few isolated fence maintenance issues (Table 4.1-2).
Table 4.2-2: Water Actions. 2018 vs. 2017 Number of Specification MoS. Exact Symmetry Test
Fail 17 Fail 18
Fail 17 Pass 18
Pass 17 Fail 18
Pass 17 Pass 18
P Value
Protection of Watercourse from Bovines 9 5 8 68 0.581
Riparian Margins 2 3 6 37 0.508
4.2.2 Performance against Outcomes
Almost all the Riparian Margin sites and the majority of Protection of Watercourse from Bovines sites meet the Outcome MoS, meaning that sites are largely unimproved, with reasonable floral diversity and are appropriately managed to control the vegetation present. There has been a slight increase in the number of Outcome MoS met from a high baseline score but again the change is not statistically significant (Table 4.2-3). For the Riparian Margin action, the change is driven by an increase in the number of sites with wildflower and sedge cover exceeding 10%. The change in this MoS is significant and reflects a corresponding significant change in the underlying floral cover ((see Section 3.21.2 for more details). However, a change in survey methodology cannot be ruled out as possible explanation for this finding.
Table 4.2-3: Water Actions. 2018 vs. 2017 Number of Outcome MoS. Exact Symmetry Test
Fail 17 Fail 18
Fail 17 Pass 18
Pass 17 Fail 18
Pass 17 Pass 18
P Value
Protection of Watercourse from Bovines 8 11 10 61 1
Riparian Margins 6 10 6 116 0.454

Department of Agriculture, Food and the Marine 130
Year 2 Analysis of Actions under GLAS
RSK ADAS Project: 1020044
4.3 Landscape Feature Actions
Hedge Coppicing, Hedge Laying, Hedge Planting, Planting a Grove of Native Trees, Traditional Dry Stone Wall Maintenance, and Traditional Orchards are all actions whose objectives are to increase biodiversity and improve the visual landscape by restoring or creating features traditionally associated with Irish farmland landscapes.
Table 4.3-1: Landscape Feature Actions. 2018 MoS pass rate by MoS type
Specification MoS Outcome MoS
Action % Pass 2018 % Pass 2018
Coppicing of Hedgerows 57 -
Laying of Hedgerows 77 -
Planting New Hedgerows 73 -
Planting a Grove of Native Trees 75 -
Traditional Orchards 84 -
Traditional Dry Stone Wall Maintenance 89 97
4.3.1 Performance against Specifications
The pass rate is shown in Table 4.3-1. Dry stone walls continue to be maintained to very high standards both in terms of the specification requirements (wall height, continuity, and style). As for the actions relating to tree and hedgerow features, no Outcome MoS were assessed this year, but the specification has largely been followed. Where planting was required, native species have almost always been used; growing trees have been protected from stock and other browsers where necessary. Failed or dead trees have mostly been replaced and mature tree damage has been avoided.
Some aspects of tree and hedgerow actions were less well executed. Tree density in hedge planting was done to specification, but planting was often too sparse in the hedge coppicing and laying actions leaving a few sites with noticeable gaps. The initial cutting work in the coppicing action was also poor with most cut stems over 15cm in length. Where trees and hedgerow features have required aftercare to protect them from competing vegetation, this has not been followed in the majority of cases.
Most of these actions were assessed with an implementation check in the baseline year so no comparison can be made at this point. For the dry stone walls action, there is no significant change in the MoS from the baseline year where the execution was also of an excellent standard (Table 4.3-2).
Table 4.3-2: Landscape Feature Actions. 2018 vs. 2017 Number of Specification MoS. Exact Symmetry Test
Fail 17 Fail 18
Fail 17 Pass 18
Pass 17 Fail 18
Pass 17 Pass 18
P Value
Traditional Dry Stone Wall Maintenance 4 2 6 78 0.289
4.3.2 Performance against Outcomes
The landscape feature actions have been almost entirely evaluated against MoS linked to the action specifications. Only the dry stone wall action has an MoS that goes beyond these (assessing the structural integrity of walls) which shows that the walls surveyed continue to be secure (Table 4.3-3).
Table 4.3-3: Landscape Feature Actions. 2018 vs. 2017 Number of Outcome MoS. Exact Symmetry Test
Fail 17 Fail 18
Fail 17 Pass 18
Pass 17 Fail 18
Pass 17 Pass 18
P Value
Traditional Dry Stone Wall Maintenance 1 1 0 28 1

Department of Agriculture, Food and the Marine 131
Year 2 Analysis of Actions under GLAS
RSK ADAS Project: 1020044
4.4 Nesting / Roosting Feature Actions
Bat Boxes, Bird Boxes, Conservation of Solitary Bees (Boxes) and Conservation of Solitary Bees (Sand) are all actions designed to improve biodiversity in the farming landscape and replace nesting and roosting habitats lost through changes in farming practice.
Table 4.4-1: Nesting / Roosting Feature Actions. 2018 MoS pass rate by MoS type
Specification MoS Result MoS
Action % Pass 2018 % Pass 2018
Bat Boxes 90 17
Bird Boxes 89 13
Conservation of Solitary Bees (Boxes) 87 0
Conservation of Solitary Bees (Sand) 66 -
4.4.1 Performance against Specification
MoS pass rates are shown in Table 4.4-1. Execution of the three box actions against specifications assessed was done to a very high standard with boxes made of the correct materials, draught free, appropriately located and appropriately oriented. Occasionally some boxes were missing, perhaps due to weather damage. Execution of the solitary bee sand pile action was generally good but the majority of sites were lacking in aftercare with most having high levels of vegetation or litter cover.
There are no significant differences between the scores achieved this year and the scores achieved at baseline, where this is assessable (Table 4.4-2).
Table 4.4-2: Nesting / Roosting Feature Actions. 2018 vs. 2017 Number of Specification MoS. Exact Symmetry Test
Fail 17 Fail 18
Fail 17 Pass 18
Pass 17 Fail 18
Pass 17 Pass 18
P Value
Bat Boxes 4 10 12 127 0.832
Bird Boxes 8 5 7 109 0.774
Conservation of Solitary Bees (Boxes) 5 8 4 80 0.388
Conservation of Solitary Bees (Sand) - - - - -
4.4.2 Performance against Results
Despite the strong performance against the specification requirements, very few boxes displayed an increase in the number of confirmed occupancy (the Result MoS) though this is quite hard MoS to meet and many boxes at least displayed some sign of possible occupancy. The occupancy Result MoS for the bee sand piles requires a comparison and will be assessed in 2020, though only one site had confirmed occupancy.

Department of Agriculture, Food and the Marine 132
Year 2 Analysis of Actions under GLAS
RSK ADAS Project: 1020044
4.5 Bird Actions
Breeding Waders and Curlew, Chough, Corncrake, Geese/Swans, Grey Partridge, Hen Harrier, Twite, are all actions whose objectives are to create and encourage the management of habitats which are suitable for breeding, foraging and/or hunting for the designated bird species and thus promote sustainable wild populations. Wild Bird Cover is a more generic action that provides a winter food source and cover for a range of farmland birds.
Table 4.5-1: Bird Actions. 2018 MoS pass rate by MoS type
Specification MoS Outcome MoS Result MoS
Action % Pass 2018 % Pass 2018 % Pass 2018
Breeding Waders and Curlew 77 87 20
Chough 71 67 17
Corncrake 31 - 20
Geese / Swans 89 - 12
Grey Partridge 91 - 10
Hen Harrier 52 83 17
Twite (Option A) 93 37 7
Wild Bird Cover 78 - -
4.5.1 Performance against Specifications
MoS pass rates are shown in Table 4.5-1 and indicate mixed execution of the bird actions in 2018. The Geese and Swans, Twite and Grey Partridge actions were carried out to a very high standard. In the case of the first two this meant that the grazing regime had achieved a suitable sward height. For the latter it meant that the margin was implemented as specified and with the right composition of arable species. The winter cover crop in the Wild Bird Cover action was also mostly correctly executed, being of the correct height but not always of sufficient extent or crop diversity. Meeting sward height criteria was slightly more challenging for Chough (only about half were sufficiently short), Breeding Waders (only a third were sufficiently varied in height), and Hen Harrier (only 40% sufficiently diverse in structure) but the other requirements were generally met. The Corncrake action generally failed to meet the specification due to the lack of sufficient Early Late Cover areas in the sward.
Table 4.5-2: Bird Actions. 2018 vs. 2017 Number of Specification MoS. Exact Symmetry Test
Fail 17 Fail 18
Fail 17 Pass 18
Pass 17 Fail 18
Pass 17 Pass 18 P Value
Breeding Waders and Curlew 16 5 2 61 0.453
Chough 21 9 4 56 0.267
Corncrake 60 7 8 18 1
Geese / Swans 3 3 1 23 0.625
Grey Partridge 7 13 4 92 0.049*
Hen Harrier 20 18 3 10 0.001**
Twite (Option A) 0 0 1 28 1
Wild Bird Cover 11 10 2 35 0.039*
In relative terms there was general improvement in the Specification MoS scores between the 2017 and 2018 (Table 4.5-2). For Grey Partridge, Hen Harrier and Wild Bird Cover the net increase is statistically significant. For Grey Partridge this reflects an improvement in the number of sites meeting the cumulative cover target for the arable species in the margin. For Hen Harrier this is due to a change in the number of sites showing sufficiently diverse sward height structure. For Wild Bird Cover this

Department of Agriculture, Food and the Marine 133
Year 2 Analysis of Actions under GLAS
RSK ADAS Project: 1020044
reflects an improvement in the extent and diversity of the cover crop achieved though the individual MoS changes are not significant in their own right.
4.5.2 Performance against Outcomes
Outcome MoS were not set for Corncrake, Geese and Swans, Grey Partridge and Wild Bird Cover. For other bird species they were generally achieved and reflected appropriate control of scrub (Breeding Waders), suitable botanical cover (Chough), low levels of nutrient improvement and good provision of prey (Hen Harrier). However, only a third of Twite sites had sufficiently abundant and diverse recognised forage species to be ideal habitat.
Change in Outcome MoS could only be assessed for three actions (Chough, Twite and Hen Harrier) and are shown in Table 4.5-3. There was no change in the first two, but again the Hen Harrier action showed a significant increase in the number of MoS met according to an Exact Symmetry Test. This reflects better scores on improved grassland and prey availability MoS which themselves reflect significant changes in the underlying indicators for these MoS.
Table 4.5-3: Bird Actions. 2018 vs. 2017 Number of Outcome MoS. Exact Symmetry Test
Fail 17 Fail 18
Fail 17 Pass 18
Pass 17 Fail 18
Pass 17 Pass 18 P Value
Breeding Waders and Curlew - - - - -
Chough 7 3 3 17 1
Corncrake - - - - -
Geese / Swans - - - - -
Grey Partridge - - - - -
Hen Harrier 9 15 3 49 0.008**
Twite (Option A) 13 7 6 4 1
Wild Bird Cover - - - - -
4.5.3 Performance against Results
Target birds were present on a good number of sites given that the MoS is only judged on a single point survey, and a few more sites had birds in the immediate vicinity. As per Table 4.5-4, target birds were present on more sites in 2018 than in the baseline year with the exception of Breeding Waders. However, these differences are not statistically significant, apart from in the case of Geese and Swans (Exact Symmetry Test, p = 0.031). The change here may simply reflect that the weather conditions were more suitable as there was no discernible difference in the adherence to the specification.
Table 4.5-4: Bird Actions. 2018 vs. 2017 Number of Result MoS. Exact Symmetry Test
Fail 17 Fail 18
Fail 17 Pass 18
Pass 17 Fail 18
Pass 17 Pass 18 P Value
Breeding Waders and Curlew 19 3 5 3 0.727
Chough 22 5 3 0 0.727
Corncrake 23 4 1 2 0.375
Geese / Swans 21 6 0 1 0.031*
Grey Partridge 25 3 2 0 1
Hen Harrier 22 3 2 2 1
Twite (Option A) 27 2 1 0 1
Wild Bird Cover - - - - -

Department of Agriculture, Food and the Marine 134
Year 2 Analysis of Actions under GLAS
RSK ADAS Project: 1020044
4.6 Agreement Level Questions
In addition to collecting field data during the 2018 visits, surveyors were also asked to rate the overall quality of the agreement as a whole on the farm against a set of five questions. 317 of the responses could be used and the results are shown in Table 4.6-1.
The vast majority of farms had implemented actions appropriately with no missed opportunities (88%) and no unintended consequences (92%). The few sites with missed opportunities relate generally to examples of non-implementation or absence of a feature (e.g. ELC for Corncrake), or where sites are not entirely suitable for that action. An example of the latter would be the Chough sites discussed above containing good examples of grassland habitats which might have been more appropriate for inclusion in a Farmland Habitat SMP.
The rating of agreements for quality of implementation largely reflects the scores for Specification MoS with the vast majority (91%) deemed to be “OK” or “Very Well”. Only a few sites were poorly implemented, most of which have already been highlighted in the individual action reports. Likewise, the rating of agreements on the likelihood of delivering outcomes also reflects the scores for the Outcome MoS with the vast majority (87%) again deemed to have a “good chance” or be “very likely”.
The final question assesses the additionality of the agreement and the 66% of sites were, in the opinion of the surveyor, deemed to have outcomes that could not be achieved without GLAS support. This assessment is at the level of the agreement rather than each individual action surveyed, so it is not possible to infer additionality at action level. Surveyors’ comments certainly suggest that grazing regimes at some of the Geese/Swans sites would not have occurred without the scheme. However, it was harder to make this judgement at some of the Chough and Low-input Permanent Pasture sites.
Table 4.6-1: Agreement Level Questions. Summary of Responses Number of responses by category of response
Question Count Y Count N Count 1 Count 2 Count 3 N/A
Are there any missed opportunities within the land parcels surveyed? (Y/N)
38 278 - - - 1
Are there any unintended consequences (good or bad) of implementing the actions on the
land parcels surveyed? (Y/N) 24 292 - - - 1
How well have the actions been implemented on the land parcels surveyed?
(1=Not well, 2=OK, 3= Very well) - - 23 136 152 6
How likely are the intended outcomes of the actions implemented going to be achieved?
(1=very unlikely; 2=good chance; 3=very likely) - - 35 134 141 7
Would similar outcomes of the actions be achieved without the GLAS support?
(1=can be achieved without the scheme; 2=to a lesser degree or at a later date; 3=cannot be
achieved otherwise)
- - 42 52 208 15

Department of Agriculture, Food and the Marine 135
Year 2 Analysis of Actions under GLAS
RSK ADAS Project: 1020044
4.7 Overall Conclusions
For the vast majority of actions and agreements overall, the execution of the agreement against the requirements of the specification as assessed in 2018 has been very good. Only Arable Margins (40%), Environmental Management of Fallow Land (68%), Coppicing of Hedgerows (57%), Conservation of Solitary Bees (Sand) (66%), Corncrake (31%) and Hen Harrier (52%) score less than 70% on average against Specification MoS. Of these five actions, when looking at the detail and the reasons for not meeting specification only the Corncrake performance (failure to provide an ELC) would represent a major concern in terms of the likelihood of the action meeting its objective. There are however mitigating circumstances for this action with the weather being a major limiting factor.
The quality of management in many cases was already high at the baseline year, and overall this quality has either been maintained or has even increased. Of particular note are the statistically significant increases in the number of sites meeting MoS for sward height variety (Hen Harrier) and crop species presence (Grey Partridge) which are more challenging requirements.
Likewise, for the vast majority of actions and agreements overall, the quality of the habitat or feature delivered in 2018 in the context of the ecological or other outcomes above and beyond what was written in the specification was also very good where assessed. Only Arable Margins (68%), Commonages (67%), Chough (67%) and Twite (37%) score less than 70% on average against Outcome MoS. Of these, the two habitat actions are generally weak due to scores on floral cover and botanical diversity, which are a common issue across all habitat actions. The fact that most habitat sites are not yet florally abundant or botanically diverse is not surprising given the amount of time passed since the agreement started and the likely starting level of nutrients. This is also a key factor in the lack of recognised Twite forage species recorded. The Outcome MoS for Chough is of less relevance to the overall objective.
The quality of outcomes in many cases was already high at the baseline year, and overall this quality has either been maintained or has even increased. Of particular note, there has been a statistically significant increase in the number of Outcome MoS being met for the Hen Harrier, which reflects improvements on a range of indicator values.
The Result MoS which directly measure actual or relative numbers of the mobile species targeted in the nesting / roosting and bird actions show species present on a few sites, with little change from the baseline year (except for Geese / Swans where this may reflect external factors such as weather). This is not surprising given the single point nature of the survey.