Product Carbon Footprinting Standards in the Agri-food Sector
61
TECHNICAL PAPER PRODUCT CARBON FOOTPRINTING STANDARDS IN THE AGRI-FOOD SECTOR
Transcript of Product Carbon Footprinting Standards in the Agri-food Sector

Street addressInternational Trade Centre54-56 Rue de Montbrillant1202 Geneva, Switzerland
P: +41 22 730 0111F: +41 22 733 4439E: [email protected]
Postal addressInternational Trade CentrePalais des Nations1211 Geneva 10, Switzerland
The International Trade Centre (ITC) is the joint agency of the World Trade Organization and the United Nations.
TECHNICAL PAPER
PRODUCT CARBON FOOTPRINTING STANDARDS IN THE AGRI-FOOD SECTOR


PRODUCT CARBON FOOTPRINTING STANDARDS IN THE AGRI-FOOD SECTOR

PRODUCT CARBON FOOTPRINTING STANDARDS IN THE AGRI-FOOD SECTOR
ii MAR-12-217.E
Abstract for trade information services
ID=42702 2012 F-11.02 PRO
International Trade Centre (ITC) Product Carbon Footprinting Standards in the Agri-food Sector Geneva: ITC, 2012. xiii, 46 p. (Technical Paper) Doc. No. MAR-12-217.E
Guide dealing with the process of measuring the carbon footprint of products along the value chain, known as Product Carbon Footprints (PCFs), in the agri-food sector - provides an introduction to (PCF); outlines various types of PCF schemes and initiatives; describes steps involved in calculating PCFs, illustrating each step through case study examples; presents methodological issues and problems in calculating PCFs with a focus on data, uncertainty and issues particularly relevant to developing countries; gives an overview of potential mitigation measures; appendices include links to relevant websites, a glossary of related terms, and a list of frequently asked questions
Descriptors: Environmental Management, Agroindustry, Standards, Case Studies.
For further information on this technical paper, contact Mr. Kasterine ([email protected])
English, French, Spanish (separate editions)
The International Trade Centre (ITC) is the joint agency of the World Trade Organization and the United Nations.
ITC, Palais des Nations, 1211 Geneva 10, Switzerland (www.intracen.org)
Views expressed in this paper are those of consultants and do not necessarily coincide with those of ITC, UN or WTO. The designations employed and the presentation of material in this paper do not imply the expression of any opinion whatsoever on the part of the International Trade Centre concerning the legal status of any country, territory, city or area or of its authorities, or concerning the delimitation of its frontiers or boundaries.
Mention of firms, products and product brands does not imply the endorsement of ITC.
This technical paper has not been formally edited by the International Trade Centre.
Digital images on the cover: © Carbon footprint: Kristina Golubic/ITC; © Produce: I-5 Design & Manufacture (flickr); © Irrigation: agrilifetoday (flickr); © Woman in field: Glenna Gordon/ITC.
© International Trade Centre 2012
ITC encourages the reprinting and translation of its publications to achieve wider dissemination. Short extracts of this technical paper may be freely reproduced, with due acknowledgement of the source. Permission should be requested for more extensive reproduction or translation. A copy of the reprinted or translated material should be sent to ITC.

PRODUCT CARBON FOOTPRINTING STANDARDS IN THE AGRI-FOOD SECTOR
MAR-12-217.E iii
Foreword
Climate change – the defining development challenge of this century – poses a huge adaptation challenge for farmers in developing countries. In addition to meeting the challenge of adaptation, food exporters are increasingly being asked by retailers to measure the greenhouse gas emissions of their products.
As a result, many new market requirements, mainly in the form of standards on ‘product carbon footprinting’ (PCFs) have emerged in the last three years. These create new potential barriers, as well as new opportunities for exporters.
This trend is driven largely by retailers and several governments in developing and emerging economies. Their motivations are twofold. Firstly, there is a strong business case to identify emission “hot spots” in the supply chain and make cost savings. Secondly, these standards strengthen the corporate social responsibility profile of corporations and differentiate their products with new green selling points.
For exporters, PCF standards offer opportunities to reduce production and processing costs. However, it can also mean more work (and costs) for their businesses to comply: for example, they may need to buy data or employ carbon footprinting consultants.
For micro, small and medium-sized enterprises in particular, PCF standards pose technical and financial challenges. In response, ITC has prepared this guide for exporters to help them understand how to use PCF standards. The guide explains the background to their development, the different forms they take and six practical steps to measuring a product’s carbon footprint.
Our intention for this guide to help suppliers in developing countries to reduce greenhouse gas emissions, identify cost saving opportunities and ultimately result in strengthened competitiveness in the global marketplace for agri-food products.
Patricia Francis Executive Director International Trade Centre

PRODUCT CARBON FOOTPRINTING STANDARDS IN THE AGRI-FOOD SECTOR
iv MAR-12-217.E

PRODUCT CARBON FOOTPRINTING STANDARDS IN THE AGRI-FOOD SECTOR
MAR-12-217.E v
Acknowledgements
This report has been prepared by Katharina Plassmann of the Institute of Agricultural Climate Research in Germany under the supervision of Alexander Kasterine, Senior Advisor (Trade, Climate Change and Environment) and Amanda McKee (Project and Research Officer), (both ITC).
ITC extends its appreciation to the following individuals who provided their comments: Lloyd Blum (ITC), Sylvain Chevassus (Ministry for Sustainable Development, France), Stephanie Daniels (Sustainable Food Lab), Ludovica Ghizzoni (ITC), Matthew Hamilton (UNCTAD), Anna Richert (Svenskt Sigill), Anna Sabelström (Swedish National Board of Trade), Graham Sinden (Carbon Strategies), Klaus Radunsky (Federal Environment Agency, Austria) and Peter Wooders (IISD).
Production and editing support was kindly provided in ITC by Natalie Domeisen, Isabel Droste and Juliette Ovelacq.
Dedication
The Guide is dedicated to the memory of Gareth Edwards-Jones, Professor of Agriculture and Land-Use at Bangor University, who died in August 2011.
Professor Edwards-Jones was a leading researcher and communicator in the field of agricultural development and climate change. During 2009, he provided ITC with expert advice on providing technical support to Kenyan companies in carbon footprinting standards. This assignment and subsequent discussions with Gareth led to the idea to produce this Guide.
Sustainability Market Guides Series
This is part of a series of Sustainability Market Guides produced under ITC’s Trade, Climate Change and Environment Programme (TCCEP), financed by the Government of Denmark.
The series aims to guide exporters, civil society and policymakers on trends and practical guidance about the growing market for sustainably produced goods and services.
For further information about this series and the TCCEP, please contact Alexander Kasterine at [email protected].
2010-2011
1. Claim Statements for Natural Products: The United States Market
2. Labelling of Natural Products: The United States Market
3. Market Trends in Certified Coffees
4. Climate Change and Cotton
5. Climate Change and the Coffee Industry
2012 (published and forthcoming)
6. The North American Market for Natural Products
7. Product Carbon Footprinting in the Agri-food Sector
8. Packaging for Organic and Sustainable Food Exports

PRODUCT CARBON FOOTPRINTING STANDARDS IN THE AGRI-FOOD SECTOR
vi MAR-12-217.E

PRODUCT CARBON FOOTPRINTING STANDARDS IN THE AGRI-FOOD SECTOR
MAR-12-217.E vii
Contents
Foreword iii Acknowledgements v Dedication v Sustainability Market Guides Series v Acronyms ix Executive summary xi
1. Introduction 1
2. Background 2
2.1. Emergence of climate related standards 2
2.2. Aims of product carbon footprinting 3
2.3. Product carbon footprinting methodologies 3
2.4. Other forms of carbon accounting 5
2.5. Potential trade-offs with other environmental impacts and overall sustainability 5
3. Typology of PCF initiatives 6
3.1. Overview 6
3.2. Communication and carbon labels 7
3.3. International standards 8
3.4. Public initiatives 9
3.5. Private initiatives 12
4. Calculating product carbon footprints 13
Step 1: Set objectives and define the product 13
Step 2: Identify the system boundary and map the system 14
Step 3: Collect the data 16
Step 4: Calculate the GHGs 17
Step 5: Scale to a functional unit 18
Step 6: Reporting and assurance 18
5. Case studies 19
5.1. Case study – Tchibo Privat Kaffee Rarity Machare 19
5.2. Case study – Cool Farm Tool GHG Calculator 22
6. Data issues and uncertainty 24
7. Issues particularly relevant to developing countries 25
8. Mitigation opportunities 27
8.1. Yield levels 30
8.2. Nitrogen fertilisers 30
8.3. Land use change 31
8.4. Diesel use 32
8.5. Irrigation 32

PRODUCT CARBON FOOTPRINTING STANDARDS IN THE AGRI-FOOD SECTOR
viii MAR-12-217.E
8.6. Glasshouse production 33
8.7. Storage 33
8.8. Soil carbon changes 33
8.9. Waste 34
9. Conclusions 36
Appendix I Further information on different PCF schemes and data sources 37
Appendix II FAQs and further resources 39
Appendix III Glossary 40
References 43
Table 1. Factors to be considered when calculating a product carbon footprint 16 Table 2. Overview results, g C02e per cup of rarity coffee 20 Table 3. GHG emissions related to the cultivation of sugar cane on a farm in Mauritius (up to the
delivery to the refinery) and of fresh latex production in rubber plantations in Thailand 31 Table 4. GHG emissions from fresh latex production in rubber plantations in Thailand excluding
(case study A) and including (case study B) emissions from direct land use change 32 Table 5. Summary of mitigation hotspots – opportunities and constraints 35
Figure 1. Illustration of a product life cycle 4 Figure 2. Example flow chart for sugar cane production: cultivation, planting year 15 Figure 3. Example of system boundary for PCF calculation of coffee 20 Figure 4. Breakdown of emissions on the farm 21 Figure 5. Emissions associated with the use phase (g CO2e per cup of coffee) 21 Figure 6. Example of on-farm emissions associated with the production of field tomatoes 23 Figure 7. Example of on-farm emissions associated with the production of field tomatoes
using different management practices 23 Figure 8. PCF of runner beans, shipped from Kenya to the United Kingdom 28

PRODUCT CARBON FOOTPRINTING STANDARDS IN THE AGRI-FOOD SECTOR
MAR-12-217.E ix
Acronyms
B2B Business-to-business
B2C Business-to-consumer
CDM Clean Development Mechanism
CO2 Carbon dioxide
CO2e Carbon dioxide equivalent
EF Emission factor
FAO Food and Agriculture Organization of the United Nations
GHG Greenhouse gas
GWP Global warming potential
ha Hectare
IDF International Dairy Federation
IPCC Intergovernmental Panel on Climate Change
ISO International Organization for Standardization
ITC International Trade Centre
kg kilogram
kWh kilowatt hour
LCA Life cycle assessment
LUC Land use change
CH4 Methane
N2O Nitrous oxide
NGO Non-Governmental Organization
PAS Publically Available Specification
PCF Product carbon footprint
PCR Product category rule
WBCSD World Business Council for Sustainable Development
WRI World Resources Institute

PRODUCT CARBON FOOTPRINTING STANDARDS IN THE AGRI-FOOD SECTOR
x MAR-12-217.E

PRODUCT CARBON FOOTPRINTING STANDARDS IN THE AGRI-FOOD SECTOR
MAR-12-217.E xi
Executive summary
Exporters of agricultural products are being required to measure and take actions to reduce greenhouse gas emissions in their supply chains by retailers and corporations in the European Union, the United States of America and several emerging economies.
Measuring the carbon footprint of a product from cradle to grave is called product carbon footprinting (PCF). The methodologies often related to Life Cycle Analysis have been drafted into different standards in both the private and public sector.
Measuring PCFs is potentially a costly and technically challenging exercise. It requires the collection of data on greenhouse gas emissions from many processes in the supply chain ranging from clearing land, ploughing the field, applying agrochemicals, harvest, storage, processing, through to packing, transport and consumption.
This document aims to guide exporters and consultants using PCFs through the process of product carbon footprinting so as to make it easier for them to understand the processes involved, improve their environmental performance and ultimately to reduce the costs for their business.
A general background and introduction to PCFs is presented in section 2. A typology of PCF schemes and initiatives is provided in section 3, including examples of important initiatives. The different steps involved in calculating a PCF are described in section 4. Section 5 illustrates how to calculate a PCF with case study examples. Sections 6 and 7 present some methodological issues and problems in calculating PCFs with a focus on data, uncertainty and issues particularly relevant to developing countries. Section 8 gives a brief overview of potential mitigation measures and section 9 concludes this guide. Further information, including links to relevant websites, a glossary and an FAQ section can be found in the appendix.

PRODUCT CARBON FOOTPRINTING STANDARDS IN THE AGRI-FOOD SECTOR
MAR-12-217.E 1
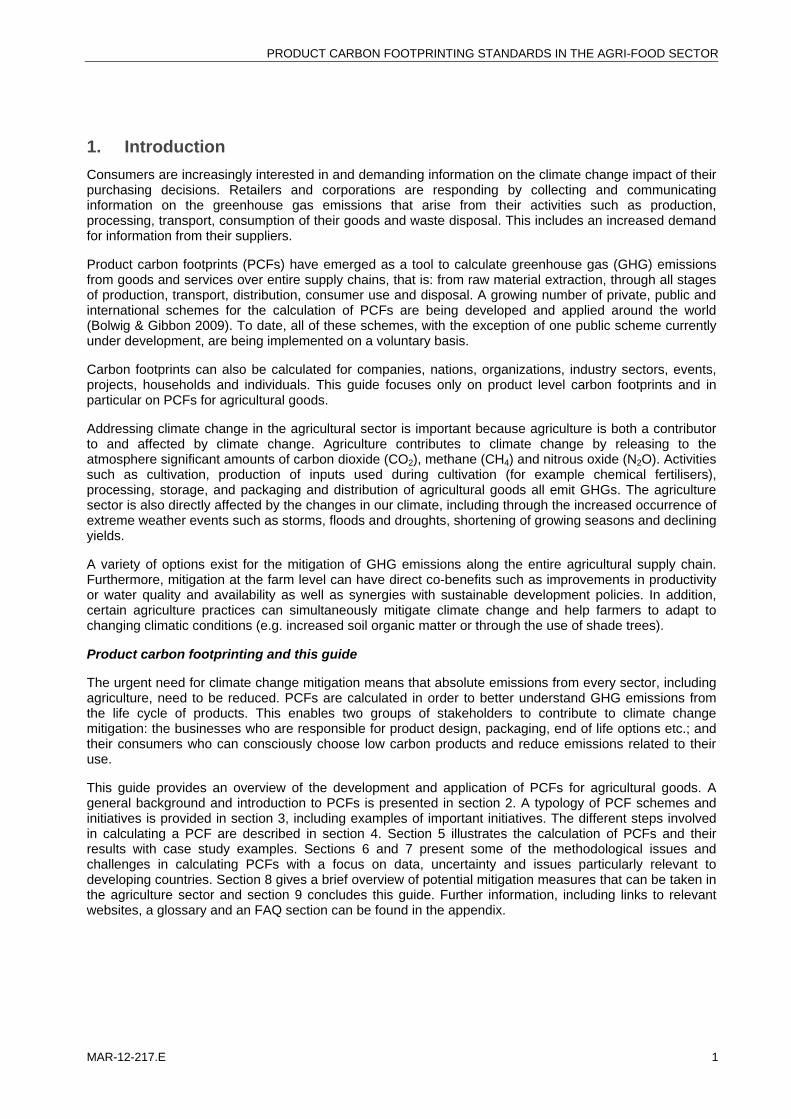
1. Introduction
Consumers are increasingly interested in and demanding information on the climate change impact of their purchasing decisions. Retailers and corporations are responding by collecting and communicating information on the greenhouse gas emissions that arise from their activities such as production, processing, transport, consumption of their goods and waste disposal. This includes an increased demand for information from their suppliers.
Product carbon footprints (PCFs) have emerged as a tool to calculate greenhouse gas (GHG) emissions from goods and services over entire supply chains, that is: from raw material extraction, through all stages of production, transport, distribution, consumer use and disposal. A growing number of private, public and international schemes for the calculation of PCFs are being developed and applied around the world (Bolwig & Gibbon 2009). To date, all of these schemes, with the exception of one public scheme currently under development, are being implemented on a voluntary basis.
Carbon footprints can also be calculated for companies, nations, organizations, industry sectors, events, projects, households and individuals. This guide focuses only on product level carbon footprints and in particular on PCFs for agricultural goods.
Addressing climate change in the agricultural sector is important because agriculture is both a contributor to and affected by climate change. Agriculture contributes to climate change by releasing to the atmosphere significant amounts of carbon dioxide (CO2), methane (CH4) and nitrous oxide (N2O). Activities such as cultivation, production of inputs used during cultivation (for example chemical fertilisers), processing, storage, and packaging and distribution of agricultural goods all emit GHGs. The agriculture sector is also directly affected by the changes in our climate, including through the increased occurrence of extreme weather events such as storms, floods and droughts, shortening of growing seasons and declining yields.
A variety of options exist for the mitigation of GHG emissions along the entire agricultural supply chain. Furthermore, mitigation at the farm level can have direct co-benefits such as improvements in productivity or water quality and availability as well as synergies with sustainable development policies. In addition, certain agriculture practices can simultaneously mitigate climate change and help farmers to adapt to changing climatic conditions (e.g. increased soil organic matter or through the use of shade trees).
Product carbon footprinting and this guide
The urgent need for climate change mitigation means that absolute emissions from every sector, including agriculture, need to be reduced. PCFs are calculated in order to better understand GHG emissions from the life cycle of products. This enables two groups of stakeholders to contribute to climate change mitigation: the businesses who are responsible for product design, packaging, end of life options etc.; and their consumers who can consciously choose low carbon products and reduce emissions related to their use.
This guide provides an overview of the development and application of PCFs for agricultural goods. A general background and introduction to PCFs is presented in section 2. A typology of PCF schemes and initiatives is provided in section 3, including examples of important initiatives. The different steps involved in calculating a PCF are described in section 4. Section 5 illustrates the calculation of PCFs and their results with case study examples. Sections 6 and 7 present some of the methodological issues and challenges in calculating PCFs with a focus on data, uncertainty and issues particularly relevant to developing countries. Section 8 gives a brief overview of potential mitigation measures that can be taken in the agriculture sector and section 9 concludes this guide. Further information, including links to relevant websites, a glossary and an FAQ section can be found in the appendix.

PRODUCT CARBON FOOTPRINTING STANDARDS IN THE AGRI-FOOD SECTOR
2 MAR-12-217.E
2. Background
2.1. Emergence of climate related standards
A number of standards exist in the agri-food sector, including product carbon footprinting standards. Traditionally, governments have played a major role in establishing minimum food safety standards to protect their populations, however, in response to increased social and environmental concerns among consumers a wider range of both public and private voluntary standards have emerged over the last decade. In particular, the role of standards is shifting towards a strategic tool for product differentiation and market segmentation (Smith 2009).
Recent years have seen an increasing uptake by various stakeholders of voluntary initiatives to mitigate climate change and increase overall sustainability. The drivers behind this development of voluntary initiatives include the anticipation of future mandatory measures, legislation and carbon pricing as well as increased consumer awareness of environmental, health and ethical issues, especially in relation to production conditions in developing countries. These voluntary initiatives have for the most part been implemented by private stakeholders, as opposed to public bodies, and include corporate sustainability plans, public-private sustainability partnerships and annual company level GHG reporting under mechanisms such as the GHG Protocol and the Carbon Disclosure Project, coupled with GHG mitigation targets.
Product carbon footprinting (PCF) has emerged as one such tool. PCF standards are being developed and implemented by various international, public and private actors (see section 3). To date, these schemes and labelling initiatives have all been implemented on a voluntary basis, with the exception of the regulatory scheme for environmental product labelling that is currently being developed in France (see section 3.4). Currently, various different PCF initiatives are being developed and implemented worldwide, where the exact rules prescribed for conducting the calculations may vary between initiatives.
One of the first public PCF methodologies to be published was the British Publically Available Specification (PAS) 20501 (BSI 2008a), which was developed in response to the increasing need of industry, society and other stakeholders for a consistent methodology for the assessment of product life cycle GHG emissions (BSI 2008a). The development of internationally agreed methodologies by both the International Organization for Standardization (ISO) and the World Resources Institute (WRI) and the World Business Council for Sustainable Development (WBSCD) (see section 3.3) started in 2008 as the application of PCF methods quickly gained ground and more and more individual initiatives emerged.
Since 2009 PCFs have gained considerable traction in the media, with non-government organizations and with food retailers. In Europe and North America, the ongoing development of PCF initiatives has mainly been driven by businesses, although governments and other stakeholders are also actively involved. In other parts of the world, emerging initiatives are mainly government driven (e.g. Thailand, Chinese Taipei, and Japan).
The impact of PCF methodologies is strongly linked to carbon labels because of the communication and dissemination of PCF results to retailers and consumers. Several supermarkets in Europe and North America are declaring the carbon footprint of various products to their consumers via on-pack carbon labels. Other stakeholders are publicising PCFs on purchase receipts or on their websites rather than on product labels. PCFs can also be used as a business-to-business tool or as an internal GHG emissions management tool without making the results public. A number of supermarkets are actively working with chosen suppliers to reduce the PCF of their products (e.g. across dedicated supply chains of fresh products such as milk or vegetables).
1PAS 2050, available at: http://www.bsigroup.com/en/Standards-and-Publications/How-we-can-help-you/Professional-Standards-Service/PAS-2050/.
PRODUCT CARBON FOOTPRINTING STANDARDS IN THE AGRI-FOOD SECTOR
MAR-12-217.E 3
2.2. Aims of product carbon footprinting
There are several reasons for companies to engage in PCF activities. These include:
Identifying GHG emissions hotspots and opportunities for achieving emissions reductions across a product’s life cycle, e.g. by increasing production efficiencies;
Identifying cost saving opportunities;
Gaining an understanding of the GHG emissions from their supply chains in order to prepare for the possible effects of future regulation and national or international policy initiatives;
Creating a benchmark to monitor and measure emissions reductions against and potentially communicate the improvement of the climate impact of a product;
Integrating GHG emissions into decision making, e.g. material choices, product design, manufacturing processes, etc.;
Engaging with suppliers throughout the supply chain;
Demonstrating environmental/corporate responsibility leadership to both stakeholders and consumers;
Enabling positive marketing and branding; and
Empowering consumers to select products with lower PCFs and meeting growing consumer demand for environmental information.
2.3. Product carbon footprinting methodologies
A PCF is an estimate of the sum of all GHGs released during the life cycle of a good or service (“cradle to grave”) or parts thereof (“cradle to gate”). For example, calculating the PCF for an agricultural product over its entire life cycle would generally include emissions from:
The production of inputs used during cultivation (e.g. fertilisers, plastics or concentrate animal feed);
The cultivation phase;
Transport (e.g. from the farm to processing facilities and to export destinations);
Packaging;
Processing and storage;
The consumer use phase; and
Waste disposal.
In order to calculate the PCF, all of the inputs to each stage of the life cycle are identified, quantified and traced back to their respective raw materials. For instance, GHG emissions related to the farming stage of an agricultural product include:
Emissions arising from the manufacture of inputs such as chemical fertilisers or bought in animal feed;
Emissions from the use of energy; and
Emissions from soils and livestock on the farm.
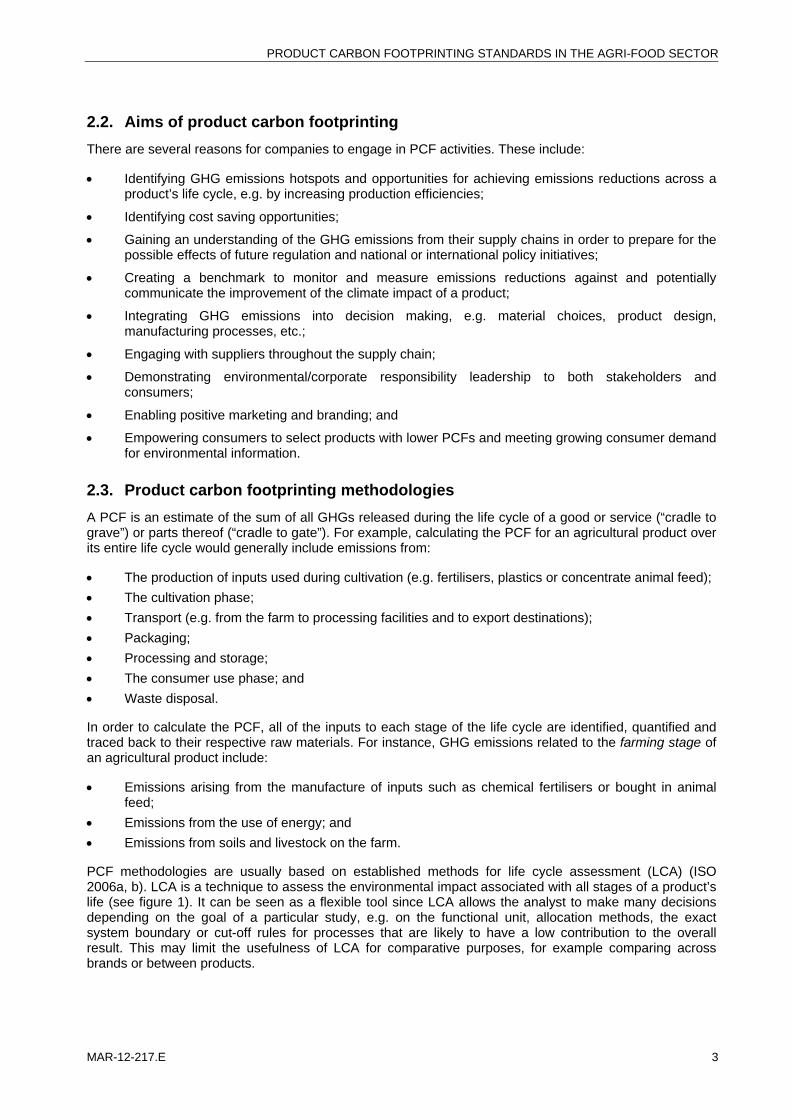
PCF methodologies are usually based on established methods for life cycle assessment (LCA) (ISO 2006a, b). LCA is a technique to assess the environmental impact associated with all stages of a product’s life (see figure 1). It can be seen as a flexible tool since LCA allows the analyst to make many decisions depending on the goal of a particular study, e.g. on the functional unit, allocation methods, the exact system boundary or cut-off rules for processes that are likely to have a low contribution to the overall result. This may limit the usefulness of LCA for comparative purposes, for example comparing across brands or between products.

PRODUCT CARBON FOOTPRINTING STANDARDS IN THE AGRI-FOOD SECTOR
4 MAR-12-217.E
Figure 1. Illustration of a product life cycle
Source: www.ghgprotocol.org/standards/product-standard.
On the contrary, PCF methods are less flexible than LCA methods as they standardize calculations further by defining a set of requirements that need to be met irrespective of the intended purpose or application of the analysis (Sinden 2009), e.g. by clearly identifying the system boundary and stating which processes shall be included and excluded from an analysis.
PCFs include all major GHGs; however, the most significant GHGs in agriculture are methane (CH4), nitrous oxide (N2O) and carbon dioxide (CO2). In order to allow for comparison across different GHGs, non-CO2 GHGs are converted to the common unit of carbon dioxide “equivalent” (CO2e) based on their global warming potential, relative to that of CO2. Both methane and nitrous oxide are more potent GHGs than CO2: the global warming potential of 1 kg of methane and nitrous oxide is 25 and 298 times greater than CO2, respectively (IPCC 2007b).
At the farm level, PCFs are generally expressed per unit of output (e.g. per kg of strawberries). As a result, yield levels achieved on farm will also have an impact on the result. The higher the output is in relation to the inputs, the lower the PCF will be. In order to lower the carbon footprint of a product it is therefore important to maximize yield levels at any given intensity of input use, i.e. to increase production efficiencies.
PCF methodologies are being used for the calculation of the GHG emissions associated with the life cycle of a wide range of products and services. For this reason, PCF methodologies have to be sufficiently broad and cannot address all the issues that may be specific to individual products or product groups. In response, Product category rules (PCRs) are being developed and used to ensure consistency and facilitate the standard application of PCF methodologies to individual product groups. PCRs are sets of rules and guidelines applicable to specific groups of products that can fulfil equivalent functions and have similar inputs and processes and therefore also require a similar set of rules for calculating their environmental or climate impacts. The use of PCRs is expected to increase the comparability of results within product groups. However, as with the broad framework standards the PCRs are aligned with, PCRs developed by different initiatives, sectors and stakeholders and in accordance with different PCF standards may be difficult to harmonize. Similar to PCRs, the revised PAS 2050 (BSI 2011) allows for the development of supplementary requirements that may support its consistent application to specific product sectors.

PRODUCT CARBON FOOTPRINTING STANDARDS IN THE AGRI-FOOD SECTOR
MAR-12-217.E 5
Currently, carbon labelled products do not carry any price premiums, but conducting PCF calculations and/or labelling could become market requirements in some segments of the food market. Very little information is available on the actual costs associated with the calculation of PCFs but it is expected to vary between schemes depending on the complexity of the methodology (Nanda 2010). After an initial PCF analysis, costs are expected to be much lower in subsequent years for further products within a given product category. Additional costs also arise from third party verification and certification of PCFs. The costs for conducting the calculations and certification of PCFs need to be balanced against the potential cost savings that may result from the identification of GHG emissions hotspots and subsequent efficiency gains.
2.4. Other forms of carbon accounting
PCFs analyse the GHG emissions of a product’s life cycle. This means that a product is traced through its entire supply chain and all related GHG emissions are included in the analysis, no matter where in the world they took place. Carbon footprints can also be calculated for countries, companies or industrial sectors and other entities, but common to them all is that emissions are considered independent of their location.
In contrast to this, the political instrument of national GHG inventories under the Kyoto Protocol and United Nations Framework Convention on Climate Change (UNFCCC) reports emissions at the scale of countries and considers emissions arising within national territories in order to assess the achievement of political national emissions reductions targets.
Corporate level accounting (e.g. GHG Protocol Corporate Standard, Carbon Disclosure Project) relates to emissions from a company’s own operations, including stores, offices and travel.
Carbon footprints for industrial sectors can be calculated using average data to represent the average production systems within a country. This differs from typical PCF calculations which use data from specified suppliers and individual supply chains where the product can ideally be traced back to individual farms. Where the supplier base is large, representative samples are taken.
The Clean Development Mechanism (CDM) under the Kyoto Protocol is also very different from PCFs. It is a project based mechanism that allows industrialized countries to purchase certified emissions reduction credits to meet their national reduction targets under the Kyoto Protocol. These credits can be earned through emission reduction projects in developing countries following strict rules. In particular, it must be shown that the emissions reductions generated by the project are additional to measures that would have been implemented anyway. This requirement is meant to ensure that the project reduces emissions beyond what would have occurred in the absence of the project.
2.5. Potential trade-offs with other environmental impacts and overall sustainability
A full LCA considers a variety of environmental impacts on land, air and water, e.g. GHG emissions, eutrophication, acidification or smog formation. A PCF can be regarded as a subset of a full LCA that addresses one impact category only, i.e. the climate change impact of a product or service. Because of their dedicated focus, PCFs can provide in-depth analyses of the emission of GHGs, however, where trade-offs exist this focus on only one environmental issue can come at the expense of other environmental impacts which might be overlooked and even potentially made worse.
For example, the PCF of tomatoes produced in Spain and consumed in the United Kingdom was found to be significantly lower than tomatoes produced in the United Kingdom. However, due to lower yields in Spain, more land is required to produce the same amount as in the United Kingdom, while impacts from pesticide use, water use, acidification and eutrophication were all found to be greater for the Spanish produce (Williams et al. 2009). So while carbon accounting initiatives are good measures of the climate change impact of production and consumption, they do not reflect the full environmental costs of products and therefore cannot represent a holistic indicator of environmental sustainability. Similarly, PCFs have not been designed to address other aspects of sustainability such as economic and social impacts.

PRODUCT CARBON FOOTPRINTING STANDARDS IN THE AGRI-FOOD SECTOR
6 MAR-12-217.E
3. Typology of PCF initiatives
3.1. Overview
The lack of any internationally agreed PCF methodology has meant that different stakeholders are developing and adopting different analytical methods for calculating PCFs based on the demands of the stakeholders involved. For this reason different methodologies may not support comparisons of PCFs between different products or countries of origin. At the time of writing this guide, internationally agreed standards for calculating PCFs had only just started to emerge.
PCF schemes can be classified into three main groups regarding their stakeholder involvement and pathways of development:
International schemes developed through international consultations with the involvement of stakeholders from public and private organizations, business, NGOs, academia, etc.;
Public schemes developed with the support of national governments which may also involve some international consultation and/or road testing and be applied internationally; and
Private schemes developed and applied by individual businesses or other stakeholders (e.g. supermarket chains), sometimes without the full publication of calculation details.
All current PCF schemes are voluntary, with the exception of the regulatory Grenelle scheme under development in France. As a result, businesses and other stakeholders can choose which standard to apply. Such decisions are normally based on which scheme would be most appropriate for them but this choice is also often constrained by market requirements. For example, if the PCF is to be calculated for an export product, companies might want to choose the main standard being used in the export destination, or by the buying organization. For instance, a supermarket chain may require a particular standard to be followed. If the product is exported and sold in many different countries, it may preferable to use an internationally agreed standard.
Two standards developed by international stakeholders and extensive international consultation have recently emerged. The ‘GHG Protocol Product Life Cycle Accounting and Reporting Standard’, developed by WRI and WBCSD, was published in October 2011 and ISO 14067 is in the advanced stages of development (see section 3.3 below). There have already been attempts to align various national methodologies with each other and these upcoming international standards. However, despite this potential for alignment, differences will likely remain. The GHG Protocol together with BSI and DEFRA have published a fact sheet that compares the revised PAS 2050 (BSI 2011) to the GHG Protocol Product Standard in order to support businesses in choosing which standard to follow and to highlight areas where the two standards differ.2
Further, even with the emergence of international standards, it is quite likely that the market will remain differentiated and resist harmonization between standards. This is partly because competing businesses use PCFs for product differentiation and marketing, sometimes preferring to use their own standard.
Once internationally agreed standard methods become operational, they will provide a broad framework that public and private schemes could align with but they will not be able to address product specific issues. Results can also be affected by limited data availability and uncertainty surrounding the value of key variables (Plassmann et al. 2010). Furthermore, it may be important that local conditions are reflected in the methods which may justify national methodologies or national adaptations of international methodologies.
GHG emissions are also increasingly being considered as part of other sustainability and organic food initiatives. For example, the Swedish KRAV3 and Svenskt Sigill4 have developed a climate certification 2 Fact sheet available at: http://www.ghgprotocol.org/files/ghgp/public/GHG%20Protocol%20PAS%202050%20Factsheet.pdf. 3 For more information on KRAV, see: http://www.klimatmarkningen.se/in-english. 4 For more information on Svenskt Sigill, see: http://www.klimatmarkningen.se/in-english.

PRODUCT CARBON FOOTPRINTING STANDARDS IN THE AGRI-FOOD SECTOR
MAR-12-217.E 7
system for food in cooperation with several major Swedish food companies. The scheme is used as an add-on module to existing sustainability standards or standards for food production. It does not imply any actual calculations of CO2e but rather defines best practice criteria that are expected to lead to reductions in GHG emissions. Other sustainability standards that also include or develop add-on climate modules are e.g. the Rainforest Alliance/Sustainable Agriculture Network (SAN) Standard,5 the 4C Association6 and the Round Table on Sustainable Palm Oil.7
3.2. Communication and carbon labels
The communication of PCF results is an important element in a number of PCF standards. Businesses can communicate the PCF to consumers or can use the results for internal GHG management. PCFs aimed at consumers or other interested stakeholders can be communicated through the use of a carbon label placed directly on the product, an indication on the supermarket shelf or the purchase receipt or on the company’s website.
When it comes to carbon labels, three main approaches exist for the calculation and communication of PCFs to consumers. They are:
Use of precise figures: GHG emissions arising over the life cycle of a product are calculated and the result is communicated in precise figures of CO2e per unit of product. This allows a quantitative assessment of the baseline conditions, the identification of GHG emissions hotspots specific to each individual case, and the subsequent evaluation of emissions reductions achieved through the application of mitigation measures. Any product that undergoes the assessment can apply for a carbon label no matter how carbon intensive the baseline calculation shows the product to be. However, some labelling initiatives, e.g. the British Carbon Reduction Label, include a requirement that continued improvements be made, leading to ongoing and documented GHG emission
reductions.
Indication of commitment to reducing the PCF: As more experience with PCFs is gained and methodologies and the credibility of precise figures and product comparisons are critically questioned, some PCF initiatives appear to be moving away from printing numbers on labels. Some users of the Carbon Reduction Label in the United Kingdom are now deciding to use a new version of the label that does not show any figures, preferring to print the label simply as a statement of their commitment to measuring and reducing the PCF of this product. As with the precise figures approach, any product can apply for the label and ongoing emissions reductions need to be achieved.
Front runner approach: The front runner approach only awards a label to those products which are more climate friendly than comparative products. An example for this approach is the scheme run by Climatop in Switzerland. Products found to have a climate impact that is significantly lower than other similar products analysed will receive the ‘approved by climatop’ label to indicate the product’s comparatively lower PCF. This kind of label may be easier for consumers to understand than the label showing precise figures but it does not necessarily allow a comparison between different product
categories, and it is not always clear to the consumers which products that do not carry a label have actually been analysed and which have not.
5 For more information on Rainforest Alliance/SAN Standard, see:
http://sanstandards.org/userfiles/file/SAN%20Sustainable%20Agriculture%20Standard%20July%202010.pdf. 6 For more information on the 4C Association, see:
http://www.4c-coffeeassociation.org/index.php?id=105&PHPSESSID=9edcsuk5rqnne8e85lk95v1cn3. 7 For more information on the Round Table on Sustainable Palm Oil, see: http://www.rspo.org/?q=page/532.
PRODUCT CARBON FOOTPRINTING STANDARDS IN THE AGRI-FOOD SECTOR
8 MAR-12-217.E
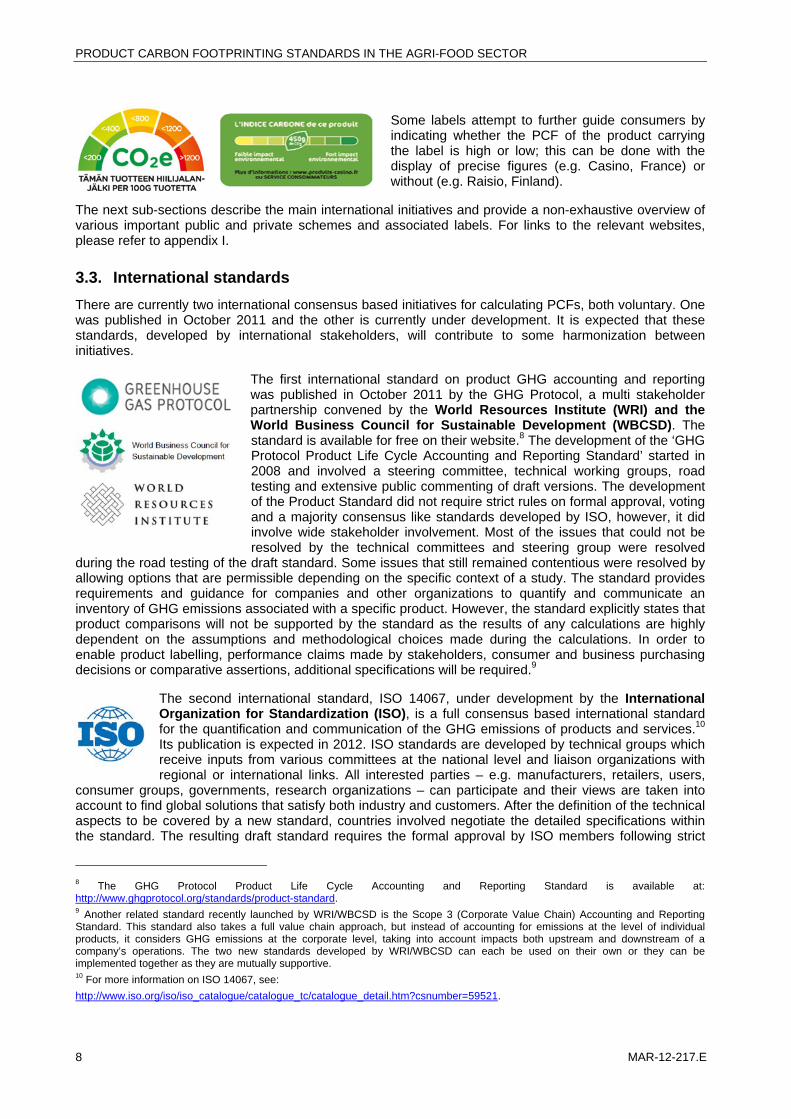
Some labels attempt to further guide consumers by indicating whether the PCF of the product carrying the label is high or low; this can be done with the display of precise figures (e.g. Casino, France) or without (e.g. Raisio, Finland).
The next sub-sections describe the main international initiatives and provide a non-exhaustive overview of various important public and private schemes and associated labels. For links to the relevant websites, please refer to appendix I.
3.3. International standards
There are currently two international consensus based initiatives for calculating PCFs, both voluntary. One was published in October 2011 and the other is currently under development. It is expected that these standards, developed by international stakeholders, will contribute to some harmonization between initiatives.
The first international standard on product GHG accounting and reporting was published in October 2011 by the GHG Protocol, a multi stakeholder partnership convened by the World Resources Institute (WRI) and the World Business Council for Sustainable Development (WBCSD). The standard is available for free on their website.8 The development of the ‘GHG Protocol Product Life Cycle Accounting and Reporting Standard’ started in 2008 and involved a steering committee, technical working groups, road testing and extensive public commenting of draft versions. The development of the Product Standard did not require strict rules on formal approval, voting and a majority consensus like standards developed by ISO, however, it did involve wide stakeholder involvement. Most of the issues that could not be resolved by the technical committees and steering group were resolved
during the road testing of the draft standard. Some issues that still remained contentious were resolved by allowing options that are permissible depending on the specific context of a study. The standard provides requirements and guidance for companies and other organizations to quantify and communicate an inventory of GHG emissions associated with a specific product. However, the standard explicitly states that product comparisons will not be supported by the standard as the results of any calculations are highly dependent on the assumptions and methodological choices made during the calculations. In order to enable product labelling, performance claims made by stakeholders, consumer and business purchasing decisions or comparative assertions, additional specifications will be required.9
The second international standard, ISO 14067, under development by the International Organization for Standardization (ISO), is a full consensus based international standard for the quantification and communication of the GHG emissions of products and services.10 Its publication is expected in 2012. ISO standards are developed by technical groups which receive inputs from various committees at the national level and liaison organizations with regional or international links. All interested parties – e.g. manufacturers, retailers, users,
consumer groups, governments, research organizations – can participate and their views are taken into account to find global solutions that satisfy both industry and customers. After the definition of the technical aspects to be covered by a new standard, countries involved negotiate the detailed specifications within the standard. The resulting draft standard requires the formal approval by ISO members following strict
8 The GHG Protocol Product Life Cycle Accounting and Reporting Standard is available at: http://www.ghgprotocol.org/standards/product-standard. 9 Another related standard recently launched by WRI/WBCSD is the Scope 3 (Corporate Value Chain) Accounting and Reporting Standard. This standard also takes a full value chain approach, but instead of accounting for emissions at the level of individual products, it considers GHG emissions at the corporate level, taking into account impacts both upstream and downstream of a company’s operations. The two new standards developed by WRI/WBCSD can each be used on their own or they can be implemented together as they are mutually supportive. 10 For more information on ISO 14067, see:
http://www.iso.org/iso/iso_catalogue/catalogue_tc/catalogue_detail.htm?csnumber=59521.

PRODUCT CARBON FOOTPRINTING STANDARDS IN THE AGRI-FOOD SECTOR
MAR-12-217.E 9
rules. Because ISO working documents are not publicly available, no detailed information on the draft ISO 14067 standard on the ‘Carbon footprint of products – Requirements and guidelines for quantification and communication’ can be given here. It is however to be expected that ISO 14067 will represent a broad framework standard that will need to be supported by guidelines for specific product groups.
Additionally, a regional standard is being developed within Europe. The Environment Directorate-General of the European Commission is developing a harmonized methodology for the calculation of environmental footprints of products which will include GHG emissions and other environmental impacts.11 This voluntary, harmonized methodology is intended to address the risk of fragmenting markets due to the proliferation of environmental standards and labels. It is expected to be finalised by September 2012, following public stakeholder consultations. An LCA resources centre is maintained on the website of the European Platform on Life Cycle Assessment.12
3.4. Public initiatives
In the United Kingdom
One of the first public initiatives to be developed was the British Publically Available Specification (PAS) 2050 (BSI 2008a, b) which has been adopted in many countries worldwide and has influenced the development of other PCF methodologies.13 PAS 2050 was developed and published by the British Standards Institute (BSI) and co-sponsored by the Carbon Trust and the United Kingdom Department for Environment, Food and Rural Affairs (Defra) with significant input from international stakeholders and experts through two public consultations, several technical working groups and industry trials of draft versions of the PAS. It should be noted that a PAS is, however, not a full consensus standard at the United Kingdom, European or international levels. A PAS represents a fast track mechanism applied to new areas where the need for standardization arises and it is important to quickly address new problems and provide business solutions. As such, PAS 2050 differs from British, European or international standards which are normally based on consensus and take much longer to develop, applying strict rules that ensure
transparency and fairness. PAS 2050 was recently revised and closely aligned with the WRI/WBCSD and ISO 14067 standards.
The Carbon Reduction Label conveys the results of a PAS 2050 analysis on products showing precise figures of CO2e.14 The main message of the label to consumers is the commitment of the company to reduce GHG emissions, and it can also be used to inform consumers on how to reduce their own emissions associated with the use of a particular product. Some users of the Carbon Reduction Label are now deciding to use a new version of the label that does not show any figures, preferring to just print the label as a statement of their commitment to measuring and reducing the PCF of this product. If a
reassessment two years later shows that a reduction in the PCF has been achieved, the label is awarded for a further two years. Independent certification is required to obtain the label. The Carbon Reduction Label has been adopted by stakeholders in various countries, including many European countries, the United States, Canada, the Russian Federation, New Zealand and Australia. The Carbon Trust Footprinting Certification Company provides independent verification of PCF results against PAS 2050. A public database containing information on all labelled products is available on the internet. The United Kingdom retailer Tesco is one of the companies applying the Carbon Reduction Label.15
11 For more information on the European Commission methodology, see:
http://ec.europa.eu/environment/eussd/product_footprint.htm. 12 European Platform on Life Cycle Assessment: http://lct.jrc.ec.europa.eu/. 13 For more information on PAS 2050, see: http://www.bsigroup.com/en/Standards-and-Publications/How-we-can-help-you/Professional-Standards-Service/PAS-2050/. 14 For more information on the Carbon Reduction Label, see: http://www.carbon-label.com/. 15 For more information on Tesco and its application of the Carbon Reduction Label, see: http://www.tesco.com/greenerliving/greener_tesco/what_tesco_is_doing/carbon_labelling.page.

PRODUCT CARBON FOOTPRINTING STANDARDS IN THE AGRI-FOOD SECTOR
10 MAR-12-217.E
In France
The right of consumers to accessible, objective and comprehensive information on the environmental impact of products was laid out in the French Grenelle 1 Act, passed in 2009 in order to promote more sustainable development.16 Environmental labelling is seen as an important part of this as it assists consumers, producers and retailers to become more environmentally friendly. In 2010, the Grenelle 2 law was adopted potentially making it a legal requirement, on the basis of the results of a national pilot, to disclose the carbon footprint and other environmental impacts of consumer goods. When the scheme is implemented, it will be the first example of a mandatory environmental labelling scheme to include PCFs.
The intention is that eventually, all consumer products concerned with future sector implementation measures sold in France will be labelled, including imported products. The information to be made available to consumers will include GHG emissions displayed as precise figures of CO2e and other environmental impacts (e.g. water use or natural resource use). The methodology used will be based on LCA methods, and although a methodology establishing general
principles is already available (BPX30-323), several different sector working groups are further developing the method. A public generic database is under development that will contain generic life cycle data, including for agricultural products, and the development of PCRs is also ongoing (nine PCRs have been adopted to date). On-line calculators, linked with the methodologies and the database, will be provided to ease the implementation for the economic actors. Specific tools will be made available to help small and medium sized enterprises with data issues and calculations. Primary data used in any calculations will have to be made available to public authorities, with a confidentiality clause, in case of random checks. As third party verification would be too expensive to require mandatorily, random market checks are expected to be put into place to ensure compliance once implementation of the new system starts (S. Chevassus, PCF World Forum, April 2011).
A one year national pilot scheme started in July 2011, involving a more than 160 companies who volunteered to take place. They included producers and retailers of a variety of sizes and from a variety of sectors. Three of them are foreign-based (Chile, Colombia and Sweden). During this period, the feasibility of the envisioned footprinting and labelling, and different options for making the information available to consumers will be tested, and issues relevant to small and medium sized enterprises and imported products as well as economic costs will be evaluated.
In Thailand
In Thailand, the public company Thailand Greenhouse Gas Management Organization (TGO), the National Metal and Materials Technology Centre (MTEC) and the governmental National Science and Technology Development Agency (NSTDA) have developed a national guideline on PCFs.17 The aims of this guideline are to stimulate more efficient use of energy and lower GHG emissions from consumer goods and services, to increase the competitiveness of Thai products in global markets, enhance economic growth and further sustainable development, and to prepare exporters for the increasing importance of carbon accounting in the international market place. The guideline has strong links to PAS 2050 and is expected to be closely aligned with the new ISO 14067 standard when it becomes operational. One important difference to PAS 2050, however, is the current exclusion of land use change emissions. This is due to insufficient information being available for Thailand to do so. In order to address this issue, research into developing country-specific emission factors for land use change emissions is ongoing; once this is finalised, these emissions will be included in the national guideline (personal communication P. Lohsonboom, July 2011). The development of PCRs and a public life cycle inventory (LCI) database containing country-specific emission factors is also ongoing.
16 For more information on the French Grenelle Act, see: http://www.developpement-durable.gouv.fr/-Consommation-durable,4303-.html. 17 For more information on the Thailand guideline, see: http://www.tgo.or.th/english.

PRODUCT CARBON FOOTPRINTING STANDARDS IN THE AGRI-FOOD SECTOR
MAR-12-217.E 11
Two types of carbon label are being implemented in Thailand: the Carbon Footprint Label (CFL) and the Carbon Reduction Label (CRL). The CFL follows the national guideline and is aimed at the international market. It is based on the full life cycle of a product and states precise numbers in terms of CO2e. There are no rules on how much the PCF has to be reduced within a certain period of time; however, it is expected that companies will make every effort to achieve emissions reductions when using a printed product label. One main aim of the use of the CFL is to raise awareness. This Thai label
is accepted in other countries which have their own labelling systems, e.g. Japan (pers. comm. P. Lohsonboom, July 2011). The second label, CRL, is only used on the domestic market and does not cover the full life cycle but only the production phase. A Carbon Label Promotion Committee supervises the administration of the carbon labels.
In Japan
The public PCF scheme in Japan was developed by the Ministry of Economy, Trade and Industry (METI) and is closely aligned with LCA methods.18 The technical specification was issued in 2009. An English abstract of the full guidelines as well as a list of PCRs developed, including for vegetables and fruit, raw bananas, mushrooms and instant coffee are available on the website. In total, over 250 products had been verified in March 2011. Land use change emissions are mentioned in the English abstract but no detailed calculation guidelines are included. Where there are regional or
seasonal differences between results, an average value should be printed on the label. A public LCA database containing emission factors is under development, and the private sector driven Carbon Footprint Japan Forum is a platform for stakeholders from industry, government and academia to promote exchange and cooperation, low carbon consumption and the practical application of PCFs.
The calculation results can be conveyed to consumers using carbon labels showing precise figures of CO2e. In addition, it is also allowed to give further information to advise consumers and increase the incentive for businesses to achieve emissions reduction. For example, emissions can be broken down by processes or life cycle stages, advice on the most low-carbon use of the product can be given to consumers or the emissions relating to the life cycle of the labelled product can be compared with those of a conventional product or an industry average.
In the Republic of Korea
A public LCA database developed in accordance with ISO 14044 on life cycle assessments supports the implementation of PCFs in the Republic of Korea.19 The voluntary labelling scheme consists of two steps: the Carbon Footprint Certificate relates to the baseline emissions calculation for a
product; and the Low Carbon Product Certificate certifies that minimum GHG emissions reductions as defined by the government have been met.
In Chinese Taipei
The national guidelines in Chinese Taipei, together with a labelling scheme involving precise figures, were developed by the Environmental Protection Administration (EPA) taking into account the British PAS 2050, the draft ISO 14067 standard and national conditions.20 Once international standards are finalised, the Chinese Taipei PCF methods will be revised to ensure that practices in Chinese Taipei are aligned with international practice while still reflecting national conditions. PCRs are also being developed. Training courses in carbon footprinting and inspection procedures are held in order to train personnel to meet the expected future market demand. Another campaign
lead by the EPA is aimed at educating consumers about carbon labelling and raising awareness on GHG 18 For more information on Japan’s PCF scheme, see: http://www.cfp-japan.jp/english. 19 For more information on the Republic of Korea’s LCA database, see:
http://www.edp.or.kr/index_eng.asp,%20http:/www.edp.or.kr/lcidb/english/main/main.asp. 20 For more information on the Chinese Taipei PCF guidelines, see: http://cfp.epa.gov.tw/carbon/defaultPage.aspx.
PRODUCT CARBON FOOTPRINTING STANDARDS IN THE AGRI-FOOD SECTOR
12 MAR-12-217.E
reduction opportunities. The ‘Taiwan Product Carbon Footprint Network’ was set up as a platform to exchange information and is open to participating businesses and the general public.
3.5. Private initiatives
The development of PCF methodologies has been very much driven by businesses and retailers. As shown above, many private businesses and retailers were involved in working with other stakeholders towards developing public protocols like PAS 2050 in the United Kingdom, however, others have also devised their own private standards.
Examples of private standards include schemes run by supermarket chains, for instance: Casino21 (France), Leclerc22 (France) and Migros23 (Switzerland). The exact calculation details of these private schemes are not always easily accessible and in the public domain, although the results are reported on both labels and websites. Other large retailers such as Walmart,24 Asda25 and Waitrose26 also have carbon initiatives but appear to be focussing more on the reduction of corporate and supply chain GHG emissions than PCFs and carbon labels. Below a number of examples are elaborated.
Casino introduced its Casino Carbon Index in 2008 in cooperation with the French Environment and Energy Management Agency (ADEME) and Bio Intelligence Service. GHG emissions for Casino-brand products are calculated up to the point of retail and expressed per 100 g of product. Suppliers to Casino are provided with a free software tool that allows them to calculate their GHG emissions. The product label puts the amount of GHG emissions per 100 g into context by showing it on a sliding scale to indicate the climate change impact of this particular product in comparison
with other products. By the end of 2010, over 600 Casino-brand products carried this label. Information on these products is available on the Casino website.
In Switzerland, the not-for-profit organization climatop runs a scheme which is being used by the supermarket Migros as well as other clients. The analysis covers the entire life cycle and several environmental impact categories including GHG emissions, toxicity, eutrophication and acidification. The calculation follows the GHG Protocol Product Standard for the PCF calculation, which is extended by ISO 14040 methods for the other impact categories. Primary data are collected from the producer and – where necessary – supplemented using secondary data from the database ecoinvent. Products found to have a climate impact that is significantly lower than
other similar products included in a comparative analysis receive the label ‘approved by climatop’. When deciding about awarding the label that indicates a low carbon product, the other environmental as well as social aspects are also taken into consideration. So far, only about 10%-15% of products analysed qualified for this label. Detailed factsheets for each labelled product as well as the guidelines and exclusion criteria for environmental and social impacts are available on the climatop website.27 The Migipedia website run by Migros gives information on all products that have been analysed, irrespective of whether they obtained the label or not.28 The information given includes a precise figure of CO2e (with uncertainties indicated) which is placed on a scale from low to high.
21 For more information on Casino’s standard, see: http://www.groupe-casino.fr/en/The-Casino-Carbon-Index-a-green.html. 22 For more information on Leclerc’s standard, see: http://www.consoglobe.com/co2-leclerc-teste-etiquetage-c02-produits-2365-cg. 23 For more information on Migros’ standard, see: http://www.climatop.ch/index.php?l=d&p=home&l=e. 24 For more information on Walmart’s initiative, see: http://walmartstores.com/pressroom/news/9668.aspx. 25 For more information on Asda’s initiative, see:
http://your.asda.com/assets/attachments/17733/original/Asda_2_0_Sustainability_Strategy_updated_.pdf. 26 For more information on Waitrose’s initiative, see:
http://www.waitrose.com/content/waitrose/en/home/inspiration/food_issues_and_policies/waitrose_way.html. 27 For more information on climatop, see: http://www.climatop.ch/index.php?l=e&p=producer&p2=tor. 28 For more information, see: http://www.migipedia.ch/de/search/products/klima.

PRODUCT CARBON FOOTPRINTING STANDARDS IN THE AGRI-FOOD SECTOR
MAR-12-217.E 13
The International Dairy Federation (IDF) has developed a common carbon footprinting approach for the dairy sector, including milk production and processing.29 The guide aims to provide a harmonized approach to calculating the PCF of milk and dairy products, thereby supporting the consistent and comparable calculation of PCFs for the dairy sector anywhere in the world. It was developed through a collaborative and consultative approach, involving organizations and stakeholders throughout the dairy sector value chain, scientists and organizations such as the Food and Agriculture Organization (FAO) and the Global Dairy Platform. The
methodology defines unambiguous approaches for key issues that may otherwise be treated in different ways by different analysts; for example, the functional unit for farm gate assessments is defined as one kilogram of fat and protein corrected milk, and the guidance for allocation between co-products is to use economic allocation. As such, this sector specific guidance contains more precise requirements for the dairy sector than the new standard by WRI/WBCSD but was developed in close collaboration.
The Sustainability Consortium, a business led initiative with global participants, is working towards improving informed decision making for product sustainability throughout entire product life cycles and for consumer goods from all important sectors.30 The vision is to create more transparency and make information on the environmental and social impacts of consumption more accessible. This will be done by developing Sustainability Measurement and Reporting Standards that will define how the sustainability of products can be measured and reported. Administered by Arizona State University and the University of Arkansas, the Sustainability Consortium is a mainly business membership organization but also includes members from NGOs and governments.
4. Calculating product carbon footprints
Calculating a product carbon footprint is a six step process. As LCAs are iterative processes, it may sometimes be necessary to re-visit previous steps of an analysis based on the findings or problems encountered during a later stage of the calculations.
Step 1: Set objectives and define the product
The first step is to decide on the objective of the PCF calculation. Generally, the aim of PCF analyses is to identify emissions hotspots and to guide decisions on where reductions can be achieved. In addition, another objective of the analysis can be to communicate the results externally in order to engage with consumers and other stakeholders.
In the latter case, verification of the results will be more important than in the former. However, the consistent use of data sources, calculation methods, system boundaries and other assumptions will be important for both applications. If the ultimate goal is to determine the PCF of more than one product, then the standardization of data collection methods and analysis will help save time and ensure consistency.
Once the product to be carbon footprinted has been chosen, the functional unit of the analysis needs to be defined. The functional unit represents the way in which the product is consumed by the end user or the way it is transferred from one business to the next in business-to-business assessments. For example, a functional unit for a drink could be a 250 ml carton, for a light bulb the provision of 1000 hours of light or an individual pizza for complex processed foods. All GHG emissions are calculated and expressed in relation to the functional unit, which may then serve for communication purposes or potentially for product comparisons.
29 For more information on the International Diary Foundation, see: http://www.idf-lca-guide.org/Public/en/LCA+Guide/LCA+Guidelines+overview. 30 For more information on the Sustainability Consortium, see: http://www.sustainabilityconsortium.org/.
PRODUCT CARBON FOOTPRINTING STANDARDS IN THE AGRI-FOOD SECTOR
14 MAR-12-217.E
Step 2: Identify the system boundary and map the system
The system boundary defines the extent of processes that are included in the analysis. It is important to clearly define the system boundary of concern, and to be aware of any potential differences in the system boundary when making comparisons between similar products from different supply chains.
PCF methodologies such as PAS 2050 clarify a specific set of rules and system boundaries to be adhered to. One reason for this is the intention to use these methods for comparative purposes. PAS 2050 defines two scopes for the assessment: business-to-business (B2B) and business-to-consumer (B2C).
B2B is a partial GHG assessment up to the point of transfer of a product to another business that uses it as an input to its own activities. B2C includes the full supply chain and life cycle of the product.
PAS 2050 specifies which processes and activities need to be included in the assessment and which shall be excluded, and gives guidance on how to deal with minor sources of emissions that are expected to contribute less than 1% to the overall emissions. Where a PCR is available, it should be used for additional guidance on how to deal with issues that are specific to the product to be analysed and that may not be covered as in-depth by PAS 2050.
It is worth noting that PAS 2050 excludes the following: capital inputs (e.g. machinery, equipment or buildings); human energy inputs to processes and/or processing (e.g. manual harvesting); transport of consumers to and from the retail outlet; transport of employees to and from their normal workplace; animals providing transport services (e.g. farm animals used in agriculture); and indirect land use change emissions.
Similarly, the GHG Protocol Product Standard does not require the inclusion of any non-attributable processes, i.e. those that are not directly connected to the life cycle of the studied product. Examples of non-attributable processes are: capital goods, overhead operations, corporate activities, transport of employees and the transport of the consumer to the retail location. The last item is excluded because the use phase is defined as starting when the consumer takes possession of the product. The transport of the consumer from the retail location home is however to be included. If a company decides to include any of these processes in the system boundary because they are expected to be important, they have to be disclosed in the required inventory report.
Both PAS 2050 and the GHG Protocol Product Standard also explicitly exclude offsets and avoided emissions where the studied product displaces another product with greater GHG emissions in the market. This is because carbon offsets are regarded as activities that occur outside of the product’s life cycle and therefore outside of the system boundary analysed. PCFs are meant to measure emissions and absolute emission reductions that take place within the system boundary of the analysis. However, while purchased offsets cannot be subtracted from the actual PCF, they can still be purchased and reported separately based on the results of the PCF analysis.
As described in section 3, the various PCF methodologies that are emerging around the world differ in their methodologies and requirements for the inclusion or exclusion of variables. For example, PAS 2050 includes GHG emissions arising from direct land use change, while the methodology developed in Thailand currently does not. This means that it is not always possible to directly compare PCFs and that the exact system boundary applied in a particular study should be clearly communicated.
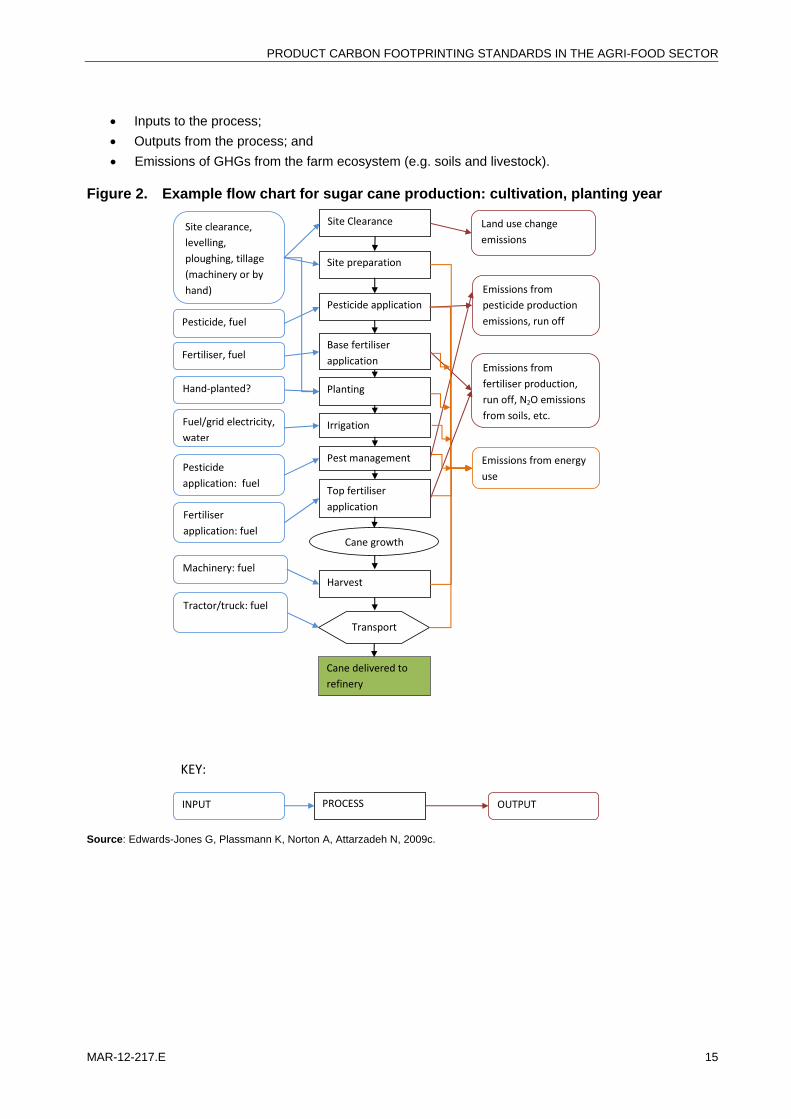
Developing a flow diagram or process chart of the supply chain can help in identifying all the activities, materials and processes that need to be considered for each supply chain step and therefore inform data collection. It also promotes in-depth understanding of the production system. For the cultivation stage of an agricultural system, this would include listing the various inputs such as fertilisers, agrochemicals and energy use, relevant processes such as emissions from soils or livestock, and consumables such as packaging materials or plastics used for mulching. Figure 2 below illustrates what a flow diagram might look like using the example of sugar cane cultivation. The flow chart is for illustrative purposes only and highlights important inputs, outputs and activities and related data collection requirements that need to be considered for PCF calculations up to the farm gate. Table 1 below illustrates the different phases of the production process including a simplified example of three classes of factors to be considered in a PCF measurement along the supply chain of an agricultural product. These factors include:
PRODUCT CARBON FOOTPRINTING STANDARDS IN THE AGRI-FOOD SECTOR
MAR-12-217.E 15
Inputs to the process;
Outputs from the process; and
Emissions of GHGs from the farm ecosystem (e.g. soils and livestock).
Figure 2. Example flow chart for sugar cane production: cultivation, planting year
Source: Edwards-Jones G, Plassmann K, Norton A, Attarzadeh N, 2009c.
Harvest
Site preparation
Planting
Irrigation
Pesticide application
Base fertiliser
application
Cane delivered to
refinery
Site clearance,
levelling,
ploughing, tillage
(machinery or by
hand)
Transport
Pesticide, fuel
Fertiliser, fuel
Machinery: fuel
Tractor/truck: fuel
Emissions from
pesticide production
emissions, run off
Emissions from energy
use
Emissions from
fertiliser production,
run off, N2O emissions
from soils, etc.
Cane growth
PROCESSINPUT OUTPUT
KEY:
Pest management
Top fertiliser
application
Fuel/grid electricity,
water
Fertiliser
application: fuel
Pesticide
application: fuel
Hand‐planted?
Site Clearance Land use change
emissions

PRODUCT CARBON FOOTPRINTING STANDARDS IN THE AGRI-FOOD SECTOR
16 MAR-12-217.E
Table 1. Factors to be considered when calculating a product carbon footprint
Section of supply chain
Class of factor to be considered
Inputs Outputs Ecosystem processes
On the farm
Type and amount of fertiliser and pesticide, electricity use, fuel use, type and amount of different plastics used, type and amount of growing media, type and amount of animal feed. Amount of manure produced and method of manure management.
Yield of functional unit. Fate of crop residues. Waste disposal of plastics and other non-organic matter (e.g. landfill, recycling, reuse). Waste disposal of plant residues and other organic matter (e.g. composting). Renewable energy.
Emissions from land use change if relevant. Emissions of nitrous oxide from organic soils. Emissions of nitrous oxide from N inputs (mineral and organic fertilisers, crop residues, N inputs via legumes). Methane from livestock. Emissions resulting from the use of lime fertiliser.
Processing and packaging
Energy use per functional unit, amount and type of plastics, paper and other materials, amount and type of pesticides / disinfectants, amount and type of refrigerants in store. Transport of goods from farm to processors.
Yield of functional unit leaving the packhouse. Fate of non-organic waste. Fate of organic waste.
N/A
Retail
Energy use per functional unit. Types and amounts of plastics, paper and other sundries. Types and amounts of refrigerants. Transport to retail outlet.
Yield of functional unit leaving the packhouse. Fate of non-organic waste. Fate of organic waste.
N/A
In the home
Energy use per functional unit (e.g. in storage and cooking). Transport to the home.
Fate of non-organic waste. Fate of organic waste.
N/A
Step 3: Collect the data
The next step involves collecting activity data on the type and amount of all inputs, including materials, energy and relevant processes (e.g. the amount of diesel, electricity, fertilisers, water, plastics used on the farm).
There are two possible sources of activity data and emission factors: primary and secondary.
Primary data are specific to the supply chain or product analysed; secondary data are not specific to the product and represent for example industry averages or general measurements of similar processes or materials.
Using primary data in the PCF calculation is preferable in that it enables an in-depth understanding of each individual system and thereby the identification of emissions hotspots and possible efficiency gains specific to the system under study.
PRODUCT CARBON FOOTPRINTING STANDARDS IN THE AGRI-FOOD SECTOR
MAR-12-217.E 17
Primary activity data are usually required for all activities that are owned, operated or controlled by the company carrying out the PCF calculation, where it is important to ensure that the primary data used are representative in time and space. The PAS 2050 methodology does not require primary data for emissions that occur further along the supply chain, e.g. during the consumer use phase or disposal.
Secondary data are used when primary data are not available or it is impractical or impossible to obtain good quality primary data. For example, methane emissions arising from ruminant livestock or nitrous oxide emissions from agricultural soils cannot be measured for each farm individually. In this case, PAS 2050 does not require the use of primary data and emission factors from sources such as IPCC (2006) can be used instead. This ensures consistency and allows greater comparability.
Step 4: Calculate the GHGs
The fourth step requires calculation of the GHGs that are emitted from the inputs and outputs and from ecosystem processes.
This is achieved by multiplying the amount of an input used, e.g. ammonium nitrate fertiliser, by its emission factor.
Emission factors (EFs) are figures that provide the amount of GHGs emitted during the manufacture and/or use of products, and during certain ecosystem processes. These are usually expressed in terms of kg of CO2e (carbon dioxide equivalent), and are either available from commercial or public LCA databases (e.g. ecoinvent or national databases) or from public sources such as IPCC (2006) guidelines, government publications, industry reports, published PCF studies and peer reviewed literature. EFs may be based on the entire life cycle or specific processes within the life cycle only.
By combining data on the amount of a product used in the supply chain, e.g. ammonium nitrate fertiliser, with the emission factors for the production and use of that fertiliser it is possible to calculate the total amount of GHGs emitted due to its use.
By repeating this process for all inputs and processes it is possible to estimate the amount of GHGs emitted from the entire supply chain. This process is illustrated by the following equation which can be used to quantify GHG emissions related to the production of inputs used at the farm level:
GHG emissions (kg CO2e/ha*year) = activity data * emission factor
Examples of activity data and corresponding emission factors include:
Examples of activity data: Examples of emission factors:
Litres of diesel or kWh of electricity used per hectare and year
Kg CO2e/litre of diesel or kg CO2e/kWh
Kg mineral nitrogen fertiliser applied per hectare and year
Kg CO2e released during the production of 1 kg of mineral nitrogen fertiliser
Kg of potassium fertiliser applied per hectare per year
Kg CO2e released during the production of 1 kg of potassium fertiliser
Kg of plastics used per hectare and year
Kg CO2e released during the production of 1 kg of plastic
Emissions from soils and livestock are usually calculated using equations and default factors from IPCC publications.31 These defaults often represent national averages or large geographical regions. When all 31 IPCC publications are available at: http://www.ipcc-nggip.iges.or.jp/public/2006gl/vol4.html.

PRODUCT CARBON FOOTPRINTING STANDARDS IN THE AGRI-FOOD SECTOR
18 MAR-12-217.E
inputs and processes have been calculated, they can be added up to give total farm gate emissions, and the next supply chain step can then be added.
When using EFs, care needs to be taken to choose the EF that best fits the process to be analysed, e.g. the system boundaries used when the EF was calculated need to be compatible with the analysis in hand. For example, an EF from a database might contain emissions from the production of capital inputs; these are however excluded from many PCF methodologies.
It is also important to pay attention to the global warming potential (GWP) that was used to convert non-CO2 GHGs to the unit of CO2e when calculating the EF because these GWPs have changed over the years as our scientific understanding improves. Most PCF methodologies require the use of the latest IPCC publications and latest GWPs. The IPCC defines GWPs for several different time periods (20, 100 and 500 years) but it is common practice to use the 100 year time horizon.
Another important issue relates to the allocation of GHG emissions between co-products. Processes often have more than one economic output, i.e. two or more co-products in addition to the main product under analysis. For example, the main output from a dairy farm is milk, but meat, leather and bull calves are co-products; and the sugar cane industry can produce sugar and molasses and export excess electricity from sugar cane processing to the national grid.
In such cases, GHG emissions from the overall process need to be allocated between these co-products. This is usually done using economic allocation where GHG emissions are allocated in proportion to the economic value of each co-product, or using physical allocation where a physical relationship can be established between the co-products, e.g. based on the mass or volume of the co-products.
If the co-products do not have an economic value or are disposed of, they are considered waste and no GHG emissions are allocated to them. The choice of allocation method may have an important impact on the final results and therefore allocation assumptions need to be documented.
Step 5: Scale to a functional unit
Once GHGs are calculated, the results next need to be scaled to a functional unit. While GHG emissions from the manufacture of inputs (e.g. fertilisers) and on-farm processes (e.g. nitrous oxide emissions from soils) are usually calculated on a per hectare basis, scaling requires expressing emissions per unit of output, i.e. per kg of yield per hectare. The following equation illustrates how to calculate the farm gate PCF, scaled to a functional unit:
GHG emissions (kg CO2e/kg of output) = GHG emissions (kg CO2e/ha*year) / yield (kg of output/ha*year)
After the produce leaves the farm, other units may be more applicable, e.g. one pallet of produce, as long as the relationship between the unit used and the functional unit chosen for the final result is clearly understood.
For a full business-to-consumer PCF the final functional unit is usually the package size of the product as it is sold in the supermarket.
Step 6: Reporting and assurance
As a final step, some methodologies require public reporting and assurance of the PCF results. Public reporting of the results and information on the processes included in the analysis, allocation rules, data collection and quality, uncertainty and other important choices made during the calculations is required in order to claim conformance with the GHG Protocol Product Standard. A disclaimer that explains the limitations of PCF analyses and states that the results do not support product comparisons shall be included. This is expected to prevent applications that are not supported by the standard and to ensure that readers understand the scope and intended purpose of the study.

PRODUCT CARBON FOOTPRINTING STANDARDS IN THE AGRI-FOOD SECTOR
MAR-12-217.E 19
Assurance that the results and public report are complete, accurate, consistent, transparent, relevant and without material misstatements may be conducted by persons from within the reporting company (first party) or by an independent organization (third party).
Other standards, such as PAS 2050, may not require the external disclosure or public communication of the assessment. However, in order to claim conformance with PAS 2050 when communicating the results externally, the type of conformity assessment or assurance conducted (third party certification, other party verification or self-verification) needs to be stated. More guidance on the communication of PCFs and reduction claims is available in Carbon Trust (2008, 2011).
5. Case studies
5.1. Case study – Tchibo Privat Kaffee Rarity Machare32
In order to illustrate the steps required to calculate a PCF, this section provides an example of the calculation of a PCF for coffee. The study was carried out by Tchibo GmbH, in collaboration with Öko-Institut (Institute for Applied Ecology) as a part of the Product Carbon Footprint Pilot Project Germany. The example goes through each of the first five steps in calculating the PCF, as presented above.
Step 1 Set objective and define product:
The objectives of the PCF Pilot Project were to:
Gain information about climate efficiency of a selected supply chain;
Identification hot spots of GHG emissions;
Identify possible reduction potentials;
Develop practical know-how about PCF;
Support the international harmonization of methodologies; and
Identify prospects of a communication which fulfils all requirements.
The product selected for the study was a type of rarity coffee,33 “Tchibo Privat Kaffee Rarity Machare”. This coffee is Arabica and originates from northern Tanzania. Data on the cultivation was collected from two farms where the coffee cherry is harvested, Machare (with 25 plots) and Uru (with 22 plots). Initial processing took place in the farm plant and the local mill, after which the product was shipped from Tanzania to Germany where it experienced re-processing, distribution, consumption and finally disposal.
Step 2 Identify system boundaries:
The value chain of the coffee production was roughly divided into seven stages which included cultivation and primary processing in Tanzania, overseas transportation of the intermediate product, reprocessing in Germany, distribution from wholesalers to retailers, purchase, consumption and disposal. An overview of the definition of the system boundaries is illustrated below (figure 3).
Following the PAS 2050 methodology certain elements were excluded from the analysis, including: human energy inputs and the potential environmental impacts associated with the production of capital equipment and facilities. In addition, due to their perceived limited impact the input of micro-organisms and the production process of sisal bags used by farmers were also excluded. Finally, due to a lack of data and in accordance with PAS 2050, carbon storage by shade trees whilst culturing the coffee shrubs and production of manure were not included in the analysis. 32 PCF Pilot Project Germany – Tchibo case study. Available at: http://www.pcf-projekt.de/files/1232962944/pcf_tchibo_coffee.pdf. 33 Rarity coffee is characterised as coffee from a single source and a single species as compared to coffee blended from various sources and species.

PRODUCT CARBON FOOTPRINTING STANDARDS IN THE AGRI-FOOD SECTOR
20 MAR-12-217.E
Another point worth noting is that in PAS 2050 the transport of consumers to and from the point of sale (shopping tour) is excluded from the assessment of the PCF. However, the shopping tour was considered important in this case study and was added to the analysis.
Figure 3. Example of system boundary for PCF calculation of coffee
Source: PCF Pilot Project Germany – Tchibo case study.
Step 3 Collect the data:
Both primary and secondary data were collected for the calculation. The time period covered the 2007-2008 coffee production, with the main processes during the life cycle of the analysed coffee taking place in Tanzania and Germany.
In general the data for the specific core processes, i.e. logistics, roasting, packaging, refer all to the state-of-the art technology either in the respective country or in Europe. The data on cultivation on the other hand represents a very high standard concerning the use of pesticides and the cultivation method in general (e.g. shaded polyculture system). For this reason, the Machare Estate is not representative of coffee plantations in general or within Africa in specific and is certified according to the standards of Rainforest Alliance.
Steps 4 and 5 Calculate GHGs and scale to functional unit:
The functional unit of this study was defined as one cup of brewed Tchibo Privat Kaffee Rarity Machare which is equivalent to 7 grams of coffee powder with 0.125 litres of water consumed.
The overall results of the case study show that one cup of rarity coffee has a PCF of 59.12 g CO2e. Table 2 breaks the PCF down into its individual life cycle phases.
Table 2. Overview results, g C02e per cup of rarity coffee
Life cycle phase Best guess
g CO2e Percentage of overall PCF
Extraction of raw materials (including cultivation and primary processing)
32.99 55.8%
Production 2.78 4.7%
Overseas transport 1.15 1.9%
Distribution 1.25 2.1%
Purchase 1.90 3.2%
Product use 17.90 30.3%
Disposal 1.15 1.9%
Source: PCF Pilot Project Germany – Tchibo case study.

PRODUCT CARBON FOOTPRINTING STANDARDS IN THE AGRI-FOOD SECTOR
MAR-12-217.E 21
The results show that the extraction of raw materials, including cultivation and primary processing in Tanzania, represents an emissions hotspot, accounting for 55.8% of the total PCF. In particular, 96.3% of the CO2e emissions from this stage came from the production and the use of agrochemicals (e.g. fertiliser and plant protecting products) and the cultivation on the farm (figure 4).
Figure 4. Breakdown of emissions on the farm
Source: PCF Pilot Project Germany – Tchibo case study.
The second biggest emissions hotspot was the product use, i.e. the preparation of coffee by the consumer. The largest emissions from product use were related to the preparation of coffee by an automatic coffee machine (see figure 5).
Figure 5. Emissions associated with the use phase (g CO2e per cup of coffee)
Source: PCF Pilot Project Germany – Tchibo case study.
Cultivation17.1%
Energy production1.9%
Application of agrochemicals
0.1%
Agrochemical production and transportation
79.1%
Transport1.2%
Processes in the mill
0.4%
0
10
20
30
40
50
60
70
Automatic coffee machine
Filter drip French press Mix of preparation methods

PRODUCT CARBON FOOTPRINTING STANDARDS IN THE AGRI-FOOD SECTOR
22 MAR-12-217.E
5.2. Case study – Cool Farm Tool GHG Calculator
Various methodologies exist for calculating carbon footprints, all of which define the system boundary of a product, identifying all of the activities, materials and processes that need to be considered for each supply chain step. These methodologies are meant to provide guidance on what emissions to include, however they are not meant to provide guidance on how exactly to calculate these emissions nor how to compare strategies for reduction of the key emission sources.
To assist farmers, supply chain managers and companies to calculate and manage their GHG emissions from agriculture, several tools and calculators have been developed. For example, researchers at the University of Aberdeen, in partnership with Unilever and the Sustainable Food Lab have developed the Cool Farm Tool, a farm-level greenhouse gas calculator.34 However, because the tool focuses on farm-level GHG emissions only, it cannot be used to calculate the carbon footprint for an entire product.
The tool was originally released in April 2010 and allows the user to calculate the best estimate of GHG emissions associated with the production of almost 20 different agricultural crops, based on data which is typically available to the average farmer. The tool is open source and freely available under a creative commons license.
The tool is not associated with any particular standard but is complementary and supportive of several PCF methodologies. The user can determine which data to include in the PCF calculation, based on the methodology they are following and the system boundary defined by the standard. The newest version of the tool (v1.1), to be released in 2012, will give users the option to explicitly calculate their PAS 2050 PCF.
The calculator has seven input sections, each on a separate Excel worksheet, relating to:
General Information (location, year, product, production area, climate), Crop Management (agricultural operations, crop protection, fertiliser use, residue management), Sequestration (land use and management, above ground biomass), Livestock (feed choices, enteric fermentation, N excretion, manure management), Field Energy Use (irrigation, farm machinery, etc), Primary Processing (factory, storage, etc), and Transport (road, rail, air, ship).
Results are reported back to the user as both a general summary of emissions from all components and a more detailed breakdown of each specific section. Figure 6 below provides an example from the calculation of on-farm emissions (kg CO2e/acre) associated with the production of field tomatoes.
34 The Cool Farm Tool is available at: http://www.unilever.com/aboutus/supplier/sustainablesourcing/tools/?WT.LHNAV=Tools.

PRODUCT CARBON FOOTPRINTING STANDARDS IN THE AGRI-FOOD SECTOR
MAR-12-217.E 23
Figure 6. Example of on-farm emissions associated with the production of field tomatoes
Source: Sustainable Food Lab, Cool Farming Options project.
In addition to allowing farmers, supply chain managers and companies to quantify their agricultural carbon footprint, the Cool Farm Tool also assists them to find practical ways of reducing it, identifying promising mitigation options on their farms. The results provided by the tool are a tailored figure of GHG emissions based on the specific management practices used on the farm. Figure 7 below shows the kg CO2e/acre for the same farm shown in figure 6 but with different management practices (reduced tillage, cover cropping and zero emissions compost).
Figure 7. Example of on-farm emissions associated with the production of field tomatoes using different management practices
Source: Sustainable Food Lab, Cool Farming Options project.
As such, the user can explore the most appropriate GHG mitigation options available to them with the management levers they have. The tool allows the user to carry out “what if” scenarios, testing what the impact would be of different mitigation options. In this regard, the tool also allows the user to take into account potential trade-offs. For instance, reduced fertiliser usage will reduce emissions per unit of area of
0100200300400500600700800900
1000
ferti
liser
pro
duct
ion
ferti
liser
indu
ced
emis
sion
s
padd
y m
etha
ne
pest
icid
es
crop
resi
due
man
agem
ent
carb
on s
tock
cha
nges
lives
tock
ent
eric
em
issi
ons
lives
tock
man
ure
man
agem
ent
lives
tock
feed
field
ene
rgy
use
prim
ary
proc
essi
ng
was
te w
ater
off-f
arm
tran
spor
t
Total = 1,724 kg CO2e / acre
-2000
-1500
-1000
-500
0
500
1000
ferti
liser
pro
duct
ion
ferti
liser
indu
ced
emis
sion
s
padd
y m
etha
ne
pest
icid
es
crop
resi
due
man
agem
ent
carb
on s
tock
cha
nges
lives
tock
ent
eric
em
issi
ons
lives
tock
man
ure
man
agem
ent
lives
tock
feed
field
ene
rgy
use
prim
ary
proc
essi
ng
was
te w
ater
off-f
arm
tran
spor
t
Total = 48 kg CO2e / acre

PRODUCT CARBON FOOTPRINTING STANDARDS IN THE AGRI-FOOD SECTOR
24 MAR-12-217.E
land, but this will come at a yield penalty. For a more detailed discussion on mitigation opportunities see section 8 of this guide.
6. Data issues and uncertainty
PCFs are quantitative assessments of GHG emissions and as such, data choices and assumptions that need to be made during the analysis impact the result. This makes it difficult to compare PCFs between products even when the same calculation guidelines are followed.
Uncertainties in our understanding of agricultural systems (Sonesson et al. 2010) and their large variability has lead some authors to question the value of communicating single figures of CO2e for bio-based products without an indication of the uncertainty surrounding these figures (Milà i Canals et al. 2011). Below, the key issues around data choices, assumptions and uncertainties are laid out.
Data choices and emission factors
Many PCF methodologies include guidance on activity data quality to assess how well the data used fit the given process in the product inventory. The methodologies give preference to data that are representative in time, technology and geography. For example, data specific to the geographical location and the technology specific to the product analysed are preferred over data derived from other regions or technologies. It is also important to use representative input data for the PCF calculation. For agricultural systems, this could for example be an average of inputs and yields over the last five years. This reduces the impact of unusual climatic conditions, e.g. particularly dry or wet years, pest and disease problems, or inputs that are only used every few years.
The quality of the data measurement also needs to be assessed, including its completeness, collection, consistency, precision and the representativeness of the sample.
The choice of emissions factors used to convert inputs and processes into CO2e can have an impact on the PCF result. Emission factors contained in different databases and other sources of secondary data may differ from each other. This is due to various reasons, including the system boundary defined for a particular emission factor, i.e. which processes were included in the calculation; the country an emission factor was originally developed for; the technology used in industrial processes; the GWP used for non-CO2 GHGs; etc.35
Due to potential cost implications, the choice of emissions factors may be particularly relevant for small and medium sized enterprises and micro businesses. An analyst should always try to understand the assumptions underlying any emission factors they use and strive to choose the most appropriate one for their own analysis. It is also important to clearly document the data sources used to increase transparency.
Assumptions
During a PCF analysis, the analyst often has to make assumptions, e.g. because of data gaps or a lack of emission factors, or in order to model the consumer use phase. Unlike energy rating schemes for electrical consumer goods where energy use during the life time of the appliance is estimated, PCFs may have to make assumptions and estimates for more life cycle stages than the consumer use phase, potentially increasing the overall uncertainty introduced by assumptions.
The consumer use phase is particularly difficult to model. However, depending on the product, the use phase can have a large impact on the overall result (see the coffee case study in section 5.1). It is worth noting that the consumer shopping trip by car is excluded in some PCF methods (e.g. PAS 2050) and only partially included in others (e.g. the GHG Protocol Product Standard where only the return trip from the retail location is included).
35 Although many PCF methodologies state clearly that the latest IPCC publications need to be followed, including the latest estimates of the GWP of the non-CO2 GHGs, it may be difficult for analysts using a particular commercial database or public source to adapt the GWP underlying any emission factor accordingly.

PRODUCT CARBON FOOTPRINTING STANDARDS IN THE AGRI-FOOD SECTOR
MAR-12-217.E 25
Some commodities are sold on the world market as mixed produce or without full documentation of origins and cannot be traced back through the upstream supply chain. Assumptions will then have to be made about upstream emissions by the buyer of this mixed produce. This may mean that actual emissions are overestimated or that individual farmers cannot get recognised for any mitigation measures they might apply. Therefore, it is important to increase the documentation and traceability of products along supply chains.
Uncertainty of emissions from agricultural production
The uncertainties attached to emission factors for agricultural processes can be considerable. For example, direct nitrous oxide emissions arising from soils after the application of nitrogen (N) fertilisers are usually calculated using a default factor of 1% from IPCC (2006). This means 1% of the N input is lost to the atmosphere as N2O-N. The uncertainty range for this emission factor is 0.3%-3%. This means that the actual emissions arising from any individual location may be much greater or lower than calculated, and their magnitude depends on the complex interplay of environmental factors such as climate and soil conditions, crop related factors (e.g. crop type) and management factors such as the time and rate of application (Lesschen et al. 2011). However, because it is not possible to conduct individual measurements for each individual farm, this cannot normally be reflected in PCF estimations.
The variability in the production of agricultural products is greater than for industrial products: natural systems and their environmental conditions vary according to factors such as soil type, climate, topography, crop or livestock variety, farming system and intensity as well as tradition, whereas technical systems usually are characterised by controlled and often standardized conditions (Milà i Canals et al. 2011). This means that the inclusion of a proper consideration of data availability, variability and uncertainty is of great importance, particularly for agricultural products and in PCF applications that display CO2e numbers on products for communication purposes (Milà i Canals et al. 2011).
What does this mean for PCF analyses?
All the above factors can impact the result of a PCF calculation. This is not so much a problem when the results are used for internal GHG emissions management. As long as data sources, assumptions etc. are used consistently, a business can assess GHG emissions reductions achieved as a result of applying mitigation measures by comparing later assessments with a baseline. If assumptions are changed or better data become available, then all previous assessments need to be recalculated using the new assumptions in order to allow meaningful comparisons over time.
However, the differences that may arise in PCFs due to the factors mentioned above will become more important when the results are communicated externally with stakeholders or consumers comparing between different products or countries of origin. This is a particular issue in relation to the use of carbon labels displaying precise figures of CO2e and will be worsened when different calculation guidelines are followed. This situation differs from the above example of energy rating schemes that operate in categories rather than communicating precise figures of energy use.
As mentioned above, it is likely that the market will remain differentiated and different PCF methodologies will remain operative even after the final publication of the international standards described in section 3.3 and further alignment of national guidelines with them. Therefore, it is important to clearly document which methodology and data sources were used as well as which assumptions were made during the calculation. Because understanding the uncertainty of a PCF analysis is important for the correct interpretation of results, the new GHG Protocol Product Standard requires that companies identify and assess uncertainty and report it as a qualitative statement. They may also conduct a quantitative uncertainty assessment which can help in prioritising data improvement efforts.
7. Issues particularly relevant to developing countries
There are a number of issues that are particularly relevant to the application of agricultural PCFs in a developing country context. These relate to methodological issues, including quantification methods used, degree of involvement of developing country stakeholders in defining the methodologies, data availability and lack of appropriate emission factors. Further, the issues of land use change and long distance

PRODUCT CARBON FOOTPRINTING STANDARDS IN THE AGRI-FOOD SECTOR
26 MAR-12-217.E
transport may put developing countries at a disadvantage because they are more relevant to tropical countries which often export agricultural goods over large distances to their markets. These considerations lead to concerns that developing countries might suffer from a reduction of export opportunities if carbon footprinting and labelling gain in importance.
Quantification methods used
PCF methodologies are not necessarily well adapted to developing country situations which may lead to problems in their application to agricultural products originating from such countries. For example, as developing country farming usually involves less capital inputs, the exclusion of capital inputs in some PCF methodologies may unfairly bias the results against these countries.
Lack of involvement of developing country stakeholders in defining methodologies
Most methodologies are developed in industrialized countries, often with limited involvement of developing country stakeholders (Brenton et al. 2009). Although the main international methodologies have made an effort to encourage the active participation of developing country stakeholders in the development and road testing of methods, developing countries are often under-represented in international standardization work. This is due to factors such as the costs involved in attending international meetings, a lack of institutional capacity or a lack of experience and knowledge related to the international standardization process. Recent years have seen emerging economies starting to develop their own PCF schemes. While these countries had mostly been standard takers in the past, some are now becoming more active themselves.
Data availability
Regarding data, a problem particularly relevant for small businesses and developing countries relates to the need for reliable, good quality primary data on the production processes in the country concerned. Such data can be a challenge to collect and this may involve considerable time and cost. The more data gaps exist, the more assumptions an analyst will be required to make, with consequences for the quality of the final assessment.
Many of the sources for emission factors and secondary data are focused on industrialized countries. There is a lack of country- and region specific emission factors for the very diverse situations in less developed countries (Brenton et al. 2010). Therefore, analysts often have to resort to large scale emission factors with little relevance to the actual situation on individual farms, or use emission factors that were developed to represent processes in industrialized countries which may heavily over- or underestimate actual emissions in developing countries.
Land use change
Land use change is another issue particularly relevant for developing countries. Land use change, i.e. the conversion of natural or semi-natural land to agriculture or from one agricultural land use category to another (e.g. from grassland to cropland), can cause very large emissions of GHGs. Indeed, these emissions are a significant source of GHG emissions worldwide and need to be addressed urgently (IPCC 2007a). The greatest increases in cropland area to provide food and fibre over the last two decades have occurred in Southeast Asia, parts of south Asia, the Great Lakes region of eastern Africa and the Amazon Basin (IPCC 2006). Many PCF methodologies require the inclusion of land use change related emissions where this land use change occurred 20 years or a single harvest period prior to the assessment, whichever is longer. Due to the greater occurrence of land use change in developing countries, a larger burden is likely to be placed on these countries by this requirement, potentially rendering their produce uncompetitive in terms of their carbon intensity.
Another challenge may arise from poor availability of records of historical land use and the vegetation type that was converted to agriculture, as well as the potentially low availability of country- and habitat-specific data on GHG emissions for individual regions and countries. Similar to the development of emission factors for industrial inputs, more data are needed to evaluate the impacts of land use change using more detailed figures that are better able to reflect local conditions.

PRODUCT CARBON FOOTPRINTING STANDARDS IN THE AGRI-FOOD SECTOR
MAR-12-217.E 27
Long distance transport
Long distance transport is an issue that may impact negatively on the PCF of goods exported from developing countries to distant markets. Transport is a life cycle stage that is generally included in PCF methodologies and transport related GHG emissions may contribute significantly to PCFs. This is particularly true for air freighted goods whereas sea freighting is associated with much lower GHG emissions (Edwards-Jones et al. 2008). Further, producers in distant locations may be more carbon efficient than closer by, and this carbon efficiency may outweigh the higher transport related emissions (Edwards-Jones et al. 2009a). The vulnerability of developing countries to this issue depends on various factors, including the level of substitutable exports (i.e. goods that can be produced closer to the export destination), the dependence on air transport or the access to low carbon modes of transport such as high volume shipping systems. Exports of tropical crops that simply cannot be produced closer to the market may have a low vulnerability because substitution is not possible (Edwards-Jones et al. 2009a).
Way forward?
Research and technological development can help to improve many of these challenges facing developing countries. For instance, initiatives to increase yields in a sustainable way, research to develop better emission factors and databases of land use change, supporting the development of low carbon modes of transport or creating more transparency in the supply chain can all help towards a more accurate assessment of PCFs and their reduction. However, this will require support from developed countries.
Finally, consumers can be made aware that their contribution to the life cycle emissions of the food items they consume can sometimes be greater than that of air freighting produce over long distances. Awareness should be raised among consumers on how they can reduce their own emissions related to the purchasing, consumption and disposal of their food items (e.g. by reducing waste in the home or being more energy efficient) before possibly reducing their purchases of products from developing countries because they may have travelled over long distances
8. Mitigation opportunities
There are opportunities to reduce (mitigate) GHG emissions at every stage of agricultural supply chains. Emissions hotspots within supply chains vary between different production systems and depend on the type of production, processing, transport distances and consumer use. For example, for fresh, unprocessed food items or food produced in glasshouses, the cultivation stage often dominates the share of emissions in the PCF (e.g. PCF Project 2009a, Hospido et al. 2009). The consumer use phase becomes more important for food that needs refrigeration or cooking than for fresh produce that is eaten raw (e.g. Edwards-Jones et al. 2009a).
Long distance transport can also represent an emissions hotspot, especially if fresh items are air freighted (e.g. Sim et al. 2007, Edwards-Jones et al. 2009a). As an example, the important contribution of air freighting fresh runner beans from Kenya to the United Kingdom retail distribution point is illustrated in figure 8 where transportation accounts for 89% of the total PCF. However, few mitigation opportunities exist to lower the emissions associated with air freighting.
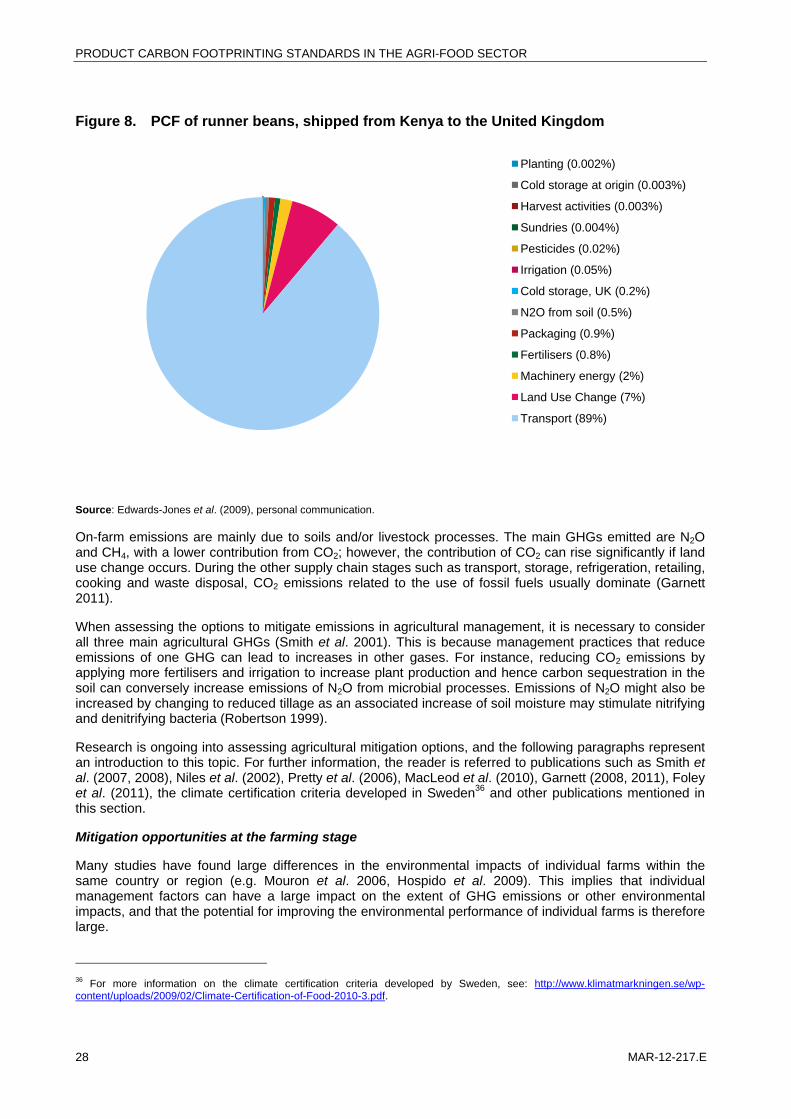
PRODUCT CARBON FOOTPRINTING STANDARDS IN THE AGRI-FOOD SECTOR
28 MAR-12-217.E
Figure 8. PCF of runner beans, shipped from Kenya to the United Kingdom
Source: Edwards-Jones et al. (2009), personal communication.
On-farm emissions are mainly due to soils and/or livestock processes. The main GHGs emitted are N2O and CH4, with a lower contribution from CO2; however, the contribution of CO2 can rise significantly if land use change occurs. During the other supply chain stages such as transport, storage, refrigeration, retailing, cooking and waste disposal, CO2 emissions related to the use of fossil fuels usually dominate (Garnett 2011).
When assessing the options to mitigate emissions in agricultural management, it is necessary to consider all three main agricultural GHGs (Smith et al. 2001). This is because management practices that reduce emissions of one GHG can lead to increases in other gases. For instance, reducing CO2 emissions by applying more fertilisers and irrigation to increase plant production and hence carbon sequestration in the soil can conversely increase emissions of N2O from microbial processes. Emissions of N2O might also be increased by changing to reduced tillage as an associated increase of soil moisture may stimulate nitrifying and denitrifying bacteria (Robertson 1999).
Research is ongoing into assessing agricultural mitigation options, and the following paragraphs represent an introduction to this topic. For further information, the reader is referred to publications such as Smith et al. (2007, 2008), Niles et al. (2002), Pretty et al. (2006), MacLeod et al. (2010), Garnett (2008, 2011), Foley et al. (2011), the climate certification criteria developed in Sweden36 and other publications mentioned in this section.
Mitigation opportunities at the farming stage
Many studies have found large differences in the environmental impacts of individual farms within the same country or region (e.g. Mouron et al. 2006, Hospido et al. 2009). This implies that individual management factors can have a large impact on the extent of GHG emissions or other environmental impacts, and that the potential for improving the environmental performance of individual farms is therefore large.
36 For more information on the climate certification criteria developed by Sweden, see: http://www.klimatmarkningen.se/wp-content/uploads/2009/02/Climate-Certification-of-Food-2010-3.pdf.
Planting (0.002%)
Cold storage at origin (0.003%)
Harvest activities (0.003%)
Sundries (0.004%)
Pesticides (0.02%)
Irrigation (0.05%)
Cold storage, UK (0.2%)
N2O from soil (0.5%)
Packaging (0.9%)
Fertilisers (0.8%)
Machinery energy (2%)
Land Use Change (7%)
Transport (89%)

PRODUCT CARBON FOOTPRINTING STANDARDS IN THE AGRI-FOOD SECTOR
MAR-12-217.E 29
For example, Milà i Canals et al. (2006) found a 30-fold difference in energy consumption for the same field operations in apple orchards in New Zealand (e.g. mowing, thinning, pruning, harvesting) performed by different producers. One important mitigation opportunity therefore lies within the training, awareness raising and better understanding of the influence of management decisions on environmental impacts.
The first step towards improving management decisions is record keeping and monitoring of the use of inputs such as diesel and fertilisers, and individual analyses of the environmental impacts of farms that lead to tailor-made improvements are recommended (Baumgartner et al. 2011).
Other opportunities for mitigating GHG emissions from the farming stage fall into three major categories (Smith et al. 2008):
Reducing emissions, Increasing carbon storage (‘removals’), and Avoiding emissions.
Mitigation options that improve the productivity of resource use generally lead to positive impacts on overall system sustainability (Sathaye et al. 2007). Measures related to cropland management include e.g. improved agronomic practices, increasing yields, using improved crop varieties or cover crops, enhancing nitrogen use efficiency and nutrient management in general, improved residue management and agroforestry practices.
Avoiding further soil carbon losses, particularly from very carbon rich organic soils, is also very important, e.g. by avoiding deep drainage and deep ploughing (Smith et al. 2008; Garnett 2011). The restoration of degraded lands damaged by erosion, excessive disturbance, loss of organic matter etc. can be achieved by using nutrient amendments, applying organic fertilisers or retaining crop residues.
For grazing systems, important options include the adjustment of grazing intensities, improving the productivity of grazing lands, improved nutrient and fire management and the introduction of grass species with higher productivity.
Mitigation measures in the livestock sector range from improved feeding practices, management changes and animal breeding to improved manure management during storage and application.
Agroecological farming practices aim to mimic natural processes and so bring about positive biological interactions and synergies between the different parts of agricultural systems (De Schutter 2010). This application of ecological science to the study, design and management of sustainable agroecosystems is being promoted as an integrated approach to raising yield levels, enhancing on-farm fertility and adapting to the effects of climate change, at the same time achieving wider benefits such as improved nutrition, creating jobs and increasing incomes (Pretty et al. 2006, De Schutter 2010). The breeding of new crop cultivars that have the potential to reduce GHG emissions may also contribute to mitigation efforts in the future (Philippot & Hallin 2011). Finally, the use of solar, wind or certain kinds of bioenergy can help reduce emissions from fossil fuel use.
Mitigation opportunities beyond the farm gate
Mitigation opportunities beyond the farm gate refer largely to technological and managerial improvements (Garnett 2011). Refrigeration is a major source of GHG emissions from retailing and manufacturing. Improvement options include increasing energy efficiency, the correct specification of new equipment, the development of new technologies, the prevention of refrigerant leakage and the use of alternatives to hydrofluorocarbons (Garnett 2011). Energy management and efficiency are also important for shops, buildings, offices etc., and the use of renewable energy sources might contribute to lowering overall GHG emissions from retailing and manufacture. For the transportation stage, the following measures lead to reduced emissions: better logistics, optimal route planning and avoiding empty return trips, increasing the average load per trip, the choice of low carbon modes of transport, driver training to increase fuel use efficiency, vehicle sharing and backhauling (Garnett 2011, PCF Project 2009a). In the packaging sector, the development of lighter packaging and bulk importing can contribute towards lowering a product’s PCF (Garnett 2011). For example, detergent manufacturers are now developing concentrate liquids which

PRODUCT CARBON FOOTPRINTING STANDARDS IN THE AGRI-FOOD SECTOR
30 MAR-12-217.E
require less of some ingredients and less packaging, making them more efficient to transport, thereby reducing the overall PCF (e.g. Tesco concentrated liquid).37
Finally, the end consumer often contributes a large share of the total life cycle GHG emissions of food products (e.g. Milà i Canals et al. 2008, PCF Project 2009b). Companies can raise awareness for this impact and also influence use phase emissions positively by improving product design and characteristics. The development of detergents that are effective at a washing temperature of 20 °C or hair shampoo that washes out faster are examples of new product design that allows the consumer to reduce the emissions relating to the use of the product.
In the following paragraphs, some particularly relevant sources of GHG emissions along agricultural supply chains and mitigation opportunities are discussed in more detail.
8.1. Yield levels
The result of the final PCF of a product is influenced by the productivity of the farming system being analysed. A high input system that is efficient at converting inputs into high yields can have a low farm gate PCF per unit product. In other words, the higher the output is in relation to the inputs, the lower the PCF will be. In order to lower the carbon footprint of a product it is therefore important to maximize yield levels at any given intensity of input use, i.e. to increase production efficiencies.
Extensive practices and less productive systems often have lower GHG emissions per hectare of farmland than more intensive systems. However, due to often lower yields, they can have higher farm gate PCFs per unit of product (e.g. Haas et al. 2001, Edwards-Jones et al. 2009b). Any efficiency gains that the farmer can achieve will result in a lower farm gate PCF.
Increasing a farm’s yields, especially where average yields are relatively low, can contribute to climate mitigation by reducing the need for expansion and land use change. Because land is a finite resource, it is important to use it efficiently. Even if the direct emissions per unit of output are low, low yields mean that more land will be required to produce a given amount of product. If yields were higher, less land would be needed to produce the same amount of product and land could instead be allocated for other purposes (Sonesson et al. 2010). This implies that high yields could potentially avert land use change in other places to meet increasing demands for food, feed and biomass products. However, the provision of other ecosystem services such as the provision of drinking water and biodiversity, need to be considered too. There is some controversy about whether increasing yields does indeed contribute to a reduction of land use changes and preserve biodiversity (Garnett 2011).
8.2. Nitrogen fertilisers
The use of nitrogen containing fertilisers can lead to GHG emissions from two sources: the industrial manufacture of mineral fertilisers, and nitrous oxide emissions from agricultural soils following the application of mineral and organic nitrogen fertilisers.
The increase in available nitrogen in soils through the addition of mineral or organic fertilisers, plant residues, slurries, manures, etc. leads to enhanced
direct emissions of N2O through microbial processes. In addition, nitrogen inputs also lead to N2O emissions indirectly through volatilisation, leaching and run-off of nitrogen from managed soils. Because of the often large quantities of nitrogen fertilisers that are applied in many agricultural systems and the high global warming potential of N2O (nearly 300 times greater than CO2), these emissions can often dominate total farm gate PCFs. Because of the significance of nitrogen additions for GHG emissions from agricultural systems, it is important to use good data on the amount applied in any PCF calculations and keep up to date records on the actual use of nitrogen fertilisers.
37 See ITC’s Packaging and Sourcing Selection for Organic and Sustainable Food (2012).

PRODUCT CARBON FOOTPRINTING STANDARDS IN THE AGRI-FOOD SECTOR
MAR-12-217.E 31
Another important GHG emissions source related to the use of mineral nitrogen fertilisers is the industrial production of the fertiliser itself. The industrial production of these fertilisers is very energy intensive, leading to much greater emissions of CO2 than the production of phosphate or potassium fertilisers. In addition, nitrogen fertiliser production also releases N2O.
Table 3 illustrates the importance of nitrogen fertiliser use for the farm gate PCF using two case study examples. The PCF of sugar cane produced on a case study farm on Mauritius and delivered to the refinery was dominated by emissions related to the production of mineral nitrogen fertilisers and from soils after their application which together account for over 50% of all emissions (Brenton et al. 2010). Another case study on the production of natural rubber in Thailand found that 55% of the farm gate PCF was related to the production of nitrogen fertilisers and 39% to field emissions of N2O (Jawjit et al. 2010).
Consequently, mitigation opportunities at the farm level often focus on reducing emissions related to the use of these fertilisers. Emissions from the industrial production of fertilisers can be reduced by improving energy efficiency or using renewable energies at the plant level and by employing catalytic conversion to reduce losses of N2O. Another way of avoiding these production-related emissions would be to replace synthetic fertilisers with the use of more animal manures. On farm, the efficient use of nitrogen fertilisers, both organic and mineral, is essential (Smith et al. 2008). This can be achieved by reducing or eliminating surplus application, improving the application in space and time (e.g. avoiding time delays between nitrogen application and nitrogen uptake by plants), changing the frequency of application or avoiding spillage of fertilisers. Analyses of the amount of plant available nitrogen in soils at certain times of the year can help assess nutrient needs and match fertiliser applications to plant requirements.
Table 3. GHG emissions related to the cultivation of sugar cane on a farm in Mauritius (up to the delivery to the refinery) and of fresh latex production in rubber plantations in Thailand
% contribution to farm gate PCF
Sugar cane Primary rubber
Production and use of inputs
Fertiliser: N 19.6 55
Fertiliser: P N/A 2
Fertiliser: K 4.2 N/A
Diesel 19.7 4
Electricity 23.8 N/A
Field emissions
N2O from soils 32.8 39
Source: Brenton et al. (2010) and Jawjit et al. (2010).
8.3. Land use change
Emissions resulting from land use change (LUC) can dominate PCFs. They are usually included in PCF calculations if the conversion of one land type to another occurred up to 20 years earlier or a single harvest period earlier (whichever is longer). The importance of LUC emissions was shown for example for rubber plantations in Thailand where two cases were analysed by Jawjit et al. (2010). Case study A in table 4 below shows rubber plantations on land that was converted to agriculture 60-80 years ago; no emissions from LUC were included
in the PCF. In case study B, it was assumed that recent LUC had occurred, and related GHG emissions were included in the PCF. The results for these two cases are shown in table 4: the inclusion of LUC emissions resulted in an over 30-fold increase in the farm gate PCF, and LUC emissions accounted for 97% of total farm gate emissions for case study B. Therefore, wherever possible, any further LUC should be avoided, especially land with high carbon stocks such as tropical forests which will also benefit biodiversity. The conversion land used for the cultivation of other crops may result in a lower carbon loss and therefore lower emissions from LUC; however, this might lead to indirect LUC emissions elsewhere if
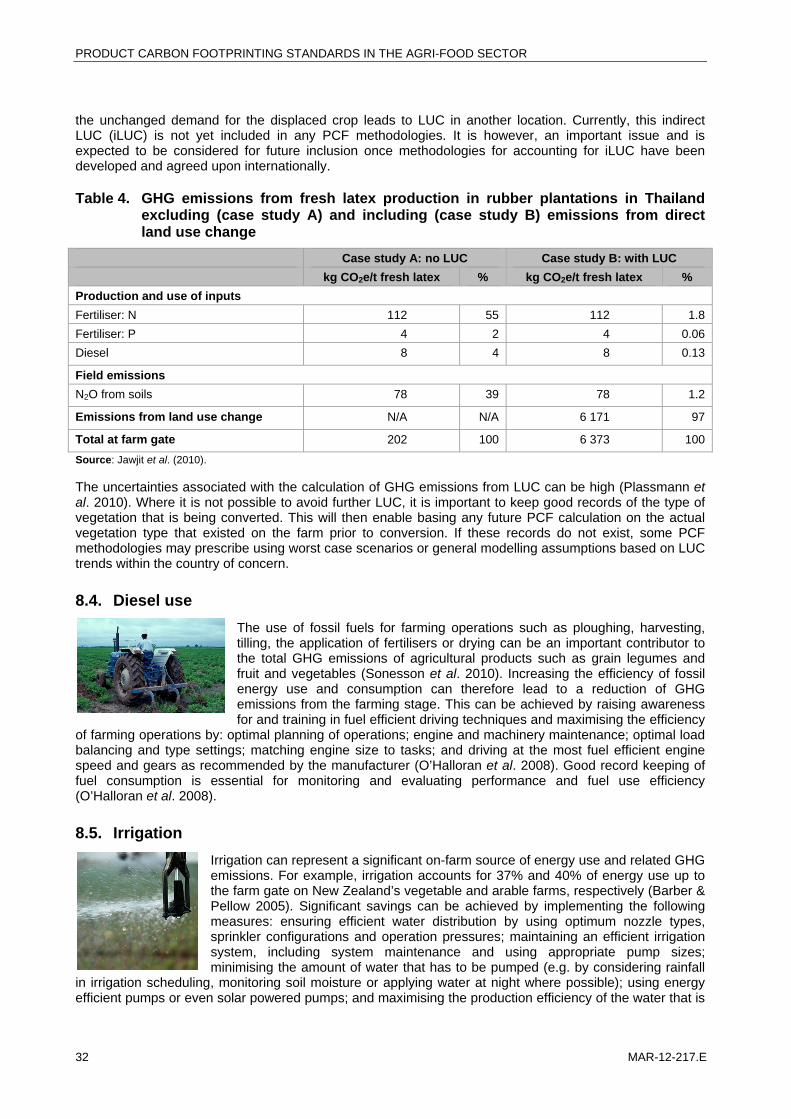
PRODUCT CARBON FOOTPRINTING STANDARDS IN THE AGRI-FOOD SECTOR
32 MAR-12-217.E
the unchanged demand for the displaced crop leads to LUC in another location. Currently, this indirect LUC (iLUC) is not yet included in any PCF methodologies. It is however, an important issue and is expected to be considered for future inclusion once methodologies for accounting for iLUC have been developed and agreed upon internationally.
Table 4. GHG emissions from fresh latex production in rubber plantations in Thailand excluding (case study A) and including (case study B) emissions from direct land use change
Case study A: no LUC Case study B: with LUC
kg CO2e/t fresh latex % kg CO2e/t fresh latex %
Production and use of inputs
Fertiliser: N 112 55 112 1.8
Fertiliser: P 4 2 4 0.06
Diesel 8 4 8 0.13
Field emissions
N2O from soils 78 39 78 1.2
Emissions from land use change N/A N/A 6 171 97
Total at farm gate 202 100 6 373 100
Source: Jawjit et al. (2010).
The uncertainties associated with the calculation of GHG emissions from LUC can be high (Plassmann et al. 2010). Where it is not possible to avoid further LUC, it is important to keep good records of the type of vegetation that is being converted. This will then enable basing any future PCF calculation on the actual vegetation type that existed on the farm prior to conversion. If these records do not exist, some PCF methodologies may prescribe using worst case scenarios or general modelling assumptions based on LUC trends within the country of concern.
8.4. Diesel use
The use of fossil fuels for farming operations such as ploughing, harvesting, tilling, the application of fertilisers or drying can be an important contributor to the total GHG emissions of agricultural products such as grain legumes and fruit and vegetables (Sonesson et al. 2010). Increasing the efficiency of fossil energy use and consumption can therefore lead to a reduction of GHG emissions from the farming stage. This can be achieved by raising awareness for and training in fuel efficient driving techniques and maximising the efficiency
of farming operations by: optimal planning of operations; engine and machinery maintenance; optimal load balancing and type settings; matching engine size to tasks; and driving at the most fuel efficient engine speed and gears as recommended by the manufacturer (O’Halloran et al. 2008). Good record keeping of fuel consumption is essential for monitoring and evaluating performance and fuel use efficiency (O’Halloran et al. 2008).
8.5. Irrigation
Irrigation can represent a significant on-farm source of energy use and related GHG emissions. For example, irrigation accounts for 37% and 40% of energy use up to the farm gate on New Zealand’s vegetable and arable farms, respectively (Barber & Pellow 2005). Significant savings can be achieved by implementing the following measures: ensuring efficient water distribution by using optimum nozzle types, sprinkler configurations and operation pressures; maintaining an efficient irrigation system, including system maintenance and using appropriate pump sizes; minimising the amount of water that has to be pumped (e.g. by considering rainfall
in irrigation scheduling, monitoring soil moisture or applying water at night where possible); using energy efficient pumps or even solar powered pumps; and maximising the production efficiency of the water that is

PRODUCT CARBON FOOTPRINTING STANDARDS IN THE AGRI-FOOD SECTOR
MAR-12-217.E 33
applied (O’Halloran et al. 2008). Installing water meters will result in accurate knowledge and monitoring of actual water usage which is essential for managing an efficient irrigation system (Barber & Pellow 2005).
8.6. Glasshouse production
The cultivation of out of season produce in heated and lighted glasshouses can cause significant energy related GHG emissions and present an emissions hotspot in those supply chains. For example, Hospido et al. (2009) showed that heating and lighting caused 84% of GHG emissions for protected lettuce production in the United Kingdom winter (from farming to the regional distribution centre). Total emissions amounted to 3.7 and 1.5 kg CO2e per kg lettuce for the two case study
farms analysed. During summer, when lettuce production in the United Kingdom is in the open field, these emissions decrease to less than 0.5 kg CO2e per kg lettuce (Hospido et al. 2009). In winter, the PCF of lettuce imported into the United Kingdom from Spain can be lower than lettuce produced in protected systems in the United Kingdom because the GHG emissions from road transport from Spain to the United Kingdom are lower than those from heating and lighting the United Kingdom glasshouses (Hospido et al. 2009). Record keeping and analysis, efficient energy management and the use of renewable energy are recommended to reduce emissions related to energy use in glasshouses. A Swedish study investigated the PCF of glasshouse tomatoes (including cultivation, packaging and transport) produced and consumed in Sweden. The result for tomatoes from glasshouses that were heated using fossil fuels was more than three times higher than for tomatoes cultivated using renewable energy (Sonesson et al. 2010).
8.7. Storage
Storage is important for enabling the provision of food items out of season, and cold storage can be important for reducing losses through spoiling. However, where produce is stored for several months, this storage period may have a significant impact on the total energy used during the life cycle. For example, storing apples grown in the United Kingdom for up to 10 months from October to the following August can almost double total energy use per kg of apples (Milà i Canals et al. 2007). This suggests that measures to increase energy efficiency
during storage, the use of renewable energy and the reduction of storage losses can reduce overall energy use and therefore the PCF.
8.8. Soil carbon changes
One of the largest fluxes within the global carbon cycle is represented by emissions of CO2 from soils (Schlesinger & Andrews 2000). Cultivated soils emit more CO2 than natural soils because improved soil aeration and moisture contents lead to the increased decomposition of soil organic matter through biological and chemical processes. At the same time, the return of plant materials such as dead leaves is reduced compared to native vegetation. The
drainage and cultivation of organic peat soils in particular can lead to large emissions and it is important to protect these large soil carbon stores from further losses.
On the other hand, there are management practices that can increase the soil organic matter content of agricultural soils. These can be seen as mitigation measures that may help remove carbon from the atmosphere and can lead to a number of other benefits which may enhance crop productivity, e.g. increased soil fertility, soil and water quality, and reduced soil erosion.
Most PCF methodologies currently do not include changes in soil carbon other than those related to land use change. PAS 2050 explicitly states that these carbon gains and losses from agricultural soils are excluded from any calculations, whereas the Japanese and Thai methodologies do not mention soil carbon changes other than from land use change. This means that a significant mitigation potential, especially in developing and tropical countries (Smith et al. 2007), is not reflected in PCFs, and therefore no direct incentives are given by these schemes to encourage practices that increase soil carbon sequestration on farms. However, if increased soil carbon sequestration leads to enhanced crop productivity, i.e. greater yields achieved while using the same amounts of agricultural inputs as before, this can lead to a decrease

PRODUCT CARBON FOOTPRINTING STANDARDS IN THE AGRI-FOOD SECTOR
34 MAR-12-217.E
in the PCF per unit of output. So although soil carbon is not a part of PCF calculations as such, management practices that increase the amount of organic soil carbon can help reduce GHG emissions per unit output and reduce the overall PCF. Including soil carbon changes resulting from land management is not a requirement of the GHG Protocol Product Standard, but companies may include them if they are able to reasonably estimate the emissions or removals.
However, where increasing soil carbon sequestration leads to decreased yields, this may then lead to more intensive cultivation and increased GHG emissions elsewhere (Garnett 2011). Moreover, soil carbon sequestration is easily reversible and limited in time, i.e. further carbon sequestration in soils can only continue until a new equilibrium is reached.
8.9. Waste
Wastage of food products occurs at all stages along the supply chain (Parfitt et al. 2010). Any food wasted results in a waste of the resources and energy used as well as the GHGs emitted along the supply chain when growing, processing and transporting produce.
On farms, edible crops may be left in the fields or ploughed into the soil, badly timed harvests may reduce food quality or crops may be damaged during
harvesting. Threshing, storage and drying can lead to physical losses or losses in quality through spillage, spoiling, contamination or damage by pests or diseases. Process losses and contamination can occur during processing and reduce food quality. Further losses may arise during out-grading, packaging, transportation and marketing through spillage, inappropriate packaging, spoilage and lack of cooling or cold storage. Another hotspot of food wastage is the consumer’s home.
Post-harvest losses generally are greater for perishable crops such as horticultural products than for grain crops (Parfitt et al. 2010). Post-harvest losses in several developing countries for various fresh fruits and vegetables have been estimated to range between 18% and 50%. These losses are often related to a lack of infrastructure, e.g. the lack of a cold chain or packing houses, or managerial and technical limitations in harvesting or growing techniques (Gustavsson et al. 2011). Overall, global estimates of food waste range between 10% and 50%, but the evidence base is insufficient and further research is needed. For the United Kingdom, losses from processing, distribution and retail are estimated at 20%, while 25% by weight are wasted in the consumer’s home (Parfitt et al. 2010). Another study estimates that avoidable household food waste in the United Kingdom accounts for 20 million tonnes of CO2e per year or about 3% of the country’s domestic GHG emissions (Chapagain & James 2011). These figures highlight the potential GHG savings that could be achieved by reducing food waste. Overall, more food is wasted in developed than in developing countries.
Measures to reduce this food waste need to address losses at all supply chain stages (Parfitt et al. 2010). For developing countries, they include investment in agricultural infrastructure, technological skills and knowledge, better storage facilities, transport, packaging and distribution, the diversification and upscaling of production and marketing (Parfitt et al. 2010, Gustavsson et al. 2011). In industrialized countries, the main mitigation opportunities lie with retailers, food service providers and consumers, including awareness raising, improved food labelling and better consumer understanding of labelling and food storage as well as the better coordination of different stakeholders. Industry initiatives to use technological solutions to increase shelf-life and improve packaging can further reduce food waste.

PRODUCT CARBON FOOTPRINTING STANDARDS IN THE AGRI-FOOD SECTOR
MAR-12-217.E 35
Table 5. Summary of mitigation hotspots – opportunities and constraints
Relevant source of GHG emissions
Mitigation opportunity Mitigation constraint
Monitoring individual farm management
Understanding and monitoring the impact of individual farm management decisions can help towards a better understanding of GHG emissions and their subsequent reduction.
Need of individual farm analyses to give tailored recommendations which can be costly. Need to introduce monitoring and record keeping systems.
Yield levels Maximize yield levels at any given intensity of input use (increase production efficiencies).
Trade off between intensive practices (high yields) and extensive practices (lower GHG emissions per hectare). Increased yields effect on biodiversity.
Nitrogen fertilisers Reduce emissions from industrial production of fertilisers through increased energy efficiency, use of renewable energy and use of catalytic conversion to reduce loses of N2O. Replace synthetic fertilisers with animal manures. Efficient use of nitrogen fertilisers (both organic and mineral), including by reducing surplus application, improving application in space and time, changing frequency of application, avoiding spillage. Monitor available nitrogen in soils to assess nutrient needs and match fertiliser application to plant requirements.
Reduced fertiliser use can affect yields. Availability of manure or manure being used for other purposes. Practical difficulties in adjusting farm management operations. Lack of equipment or practical difficulties in conducting soil analyses.
Land use change (LUC)
Avoid further LUC, especially in land with high carbon stocks such as tropical forests with high biodiversity. Keep good records of the type of vegetation being converted (if records do not exist, some methodologies require use of worst case scenarios).
LUC may increase in other areas if the unchanged demand for the displaced crop leads to LUC in another location (indirect LUC). Uncertainties in estimating emissions from LUC are high.
Diesel use Increase the efficiency of energy use. Increase training and awareness in fuel efficient driving techniques. Maximize the efficiency of farming operations by: optimal planning of operations, engine and machinery maintenance, optimal load balancing and tyre settings, match engine size to tasks, drive most fuel efficient engine speed and gears as recommended by manufacturer.
Irrigation Ensure efficient water distribution (use optimal nozzle types, sprinkler configurations and operation pressures). Maintain an efficient irrigation system (including system maintenance and use of appropriate pump sizes). Minimise amount of water that has to be pumped (consider rainfall in irrigation schedule, monitor soil moisture, apply water at night when possible). Use energy efficient pumps or solar powered pumps. Maximize the production efficiency of the

PRODUCT CARBON FOOTPRINTING STANDARDS IN THE AGRI-FOOD SECTOR
36 MAR-12-217.E
Relevant source of GHG emissions
Mitigation opportunity Mitigation constraint
water that is applied. Install water meters to accurately monitor actual water use.
Glasshouse production
Increase use of renewable energy. Increase efficient energy management. Improve record keeping and analysis.
Storage Increase use of renewable energy. Increase efficient energy management. Reduce storage loses.
Soil carbon changes Management practices that increase soil organic matter content. Increased soil carbon sequestration can lead to enhanced crop productivity (higher yields).
Changes in soil carbon (other than those related to land use change) are not included in most PCF methodologies. Soil carbon sequestration is easily reversible and limited in time.
Waste Investment in agricultural infrastructure, technological skills and knowledge, better storage facilities, transport, packaging and distribution, the diversification and up scaling of production and marketing. Raise awareness among consumers, improve food labelling and better consumer understanding of labelling and food storage. Improve coordination of different areas along supply chain. Industry initiatives to use technological solutions to increase shelf-life and improve packaging.
Need to coordinate different stakeholders.
9. Conclusions
PCF initiatives are becoming an increasingly important tool to assess and reduce GHG emissions related to consumer goods, including food and other agricultural products. The significant interest in carbon accounting by a multitude of stakeholders, the uptake of PCF initiatives by industry and the development and release of new international PCF standards all suggest that carbon accounting in the form of PCFs will become increasingly widespread.
Almost all of the existing initiatives are voluntary, some are private, some public, and some are being developed as public-private partnerships. Various schemes around the world use different calculation guidelines but harmonization efforts are under way and international standards are emerging. It is however expected that scope will remain for various different methodologies. One of the important tasks in the further development of PCF methodologies will be the definition of sector- or product group specific guidelines that will increase the comparability of results. All relevant stakeholders are encouraged to take an active part in these activities.
PCF analyses involve complex calculations and their calculation, verification and certification may involve considerable costs. They may therefore present particular burdens for small producers. As the use of voluntary PCF schemes is rising and mandatory environmental requirements may increase in the future, it is important to support businesses in meeting the challenges posed by these new market requirements.
PRODUCT CARBON FOOTPRINTING STANDARDS IN THE AGRI-FOOD SECTOR
MAR-12-217.E 37
Appendix I Further information on different PCF schemes and data sources
Public and international PCF and labelling schemes: Carbon Reduction Label: http://www.carbon-label.com/
http://www.carbontrustcertification.com/page?pageid=a042000000FjjEv http://www.footprintexpert.com/registry/Pages/default.aspx http://carbonreductionlabel.com.au/consumers (Carbon Reduction Label in Australia)
European Commission: http://ec.europa.eu/environment/eussd/product_footprint.htm http://lct.jrc.ec.europa.eu/
France: http://www.boutique.afnor.org/BGR1AccueilGroupe.aspx http://www.developpement-durable.gouv.fr/Le-Ministere-presente-l-affichage.html http://www.developpement-durable.gouv.fr/-Consommation-durable,4303-.html http://www.developpement-durable.gouv.fr/IMG/pdf/LPS39c-en-2.pdf http://www.maboissonetlenvironnement.fr/ http://www.c-laterre.fr/affichage-environnemental/
ISO: http://www.iso.org/iso/iso_catalogue/catalogue_tc/catalogue_detail.htm?csnumber=59521
Japan: www.cfp-japan.jp/english
Republic of Korea: http://www.edp.or.kr/index_eng.asp http://www.edp.or.kr/lcidb/english/main/main.asp
PCF Project Germany: http://www.pcf-projekt.de/main/news/?lang=en
PCF World Forum: http://www.pcf-world-forum.org/
Round Table on Sustainable Palm Oil: http://www.rspo.org/?q=page/532
Sustainable Agriculture Network (SAN)/Rainforest Alliance: http://sanstandards.org/userfiles/file/SAN%20Sustainable%20Agriculture%20Standard%20July%202010.pdf
Chinese Taipei: http://cfp.epa.gov.tw/carbon/defaultPage.aspx (Chinese only)
Thailand: www.tgo.or.th/english
United Kingdom (PAS 2050 and Carbon Trust): http://www.bsigroup.com/en/Standards-and-Publications/How-we-can-help-you/Professional-Standards-Service/PAS-2050/, http://www.footprintexpert.com/registry/Pages/default.aspx
WRI/WBCSD: http://www.ghgprotocol.org/standards/product-standard
Private schemes and initiatives: Asda: http://your.asda.com/assets/attachments/17733/original/Asda_2_0_Sustainability_Strategy_updated_.pdf
Casino, France: http://www.groupe-casino.fr/en/The-Casino-Carbon-Index-a-green.html http://www.produits-casino.fr/developpement-durable/dd_indice-carbone-demarche.html
International Dairy Federation: http://www.fil-idf.org/Public/ColumnsPage.php?ID=2307 7 http://www.idf-lca-guide.org/Public/en/LCA+Guide/LCA+Guidelines+overview
KRAV and Svenskt Sigill, Sweden: http://www.klimatmarkningen.se/in-english
Leclerc, France: http://www.consoglobe.com/co2-leclerc-teste-etiquetage-c02-produits-2365-cg
Migros, Switzerland: http://www.climatop.ch/index.php?l=d&p=home&l=e

PRODUCT CARBON FOOTPRINTING STANDARDS IN THE AGRI-FOOD SECTOR
38 MAR-12-217.E
http://www.migipedia.ch/de/search/products/klima, http://www.climatop.ch/index.php?l=e&p=producer&p2=tor
Raisio, Finland: http://www.raisio.com/www/page/Ecology_CO_label
Tesco: http://www.tesco.com/climatechange/
Sustainability Consortium: http://www.sustainabilityconsortium.org/
Walmart: http://walmartstores.com/pressroom/news/9668.aspx
Additional sources of information and data and open access tools: IPCC publications: www.ipcc.ch
http://www.ipcc-nggip.iges.or.jp/public/2006gl/vol4.html http://www.ipcc-nggip.iges.or.jp/EFDB/find_ef_main.php http://www.ipcc.ch/publications_and_data/publications_and_data_reports.shtml
European Union: http://lct.jrc.ec.europa.eu/assessment/directories http://www.biograce.net/content/abouthebiograceproject/aim
GHG Protocol: http://www.ghgprotocol.org/calculation-tools http://www.ghgprotocol.org/Third-Party-Databases
United Kingdom: http://www.defra.gov.uk/environment/economy/business-efficiency/reporting/
Carbon Accounting for Land Managers: http://www.calm.cla.org.uk/
CCaLC Carbon Footprinting Tool: http://www.ccalc.org.uk/
Earthster database and software tool (under development): http://www.earthster.org/
List of green environmental accounting software tools:,http://www.environmenttools.co.uk/
Food Climate Research Network: http://www.fcrn.org.uk/
openLCA Software for Life Cycle and Sustainability Assessment: http://www.greendeltatc.com/openLCA-Framework.115.0.html?&L=1&docinput[flavour]=2&docinput[lang]=de
Cool Farm Tool: http://www.unilever.com/aboutus/supplier/sustainablesourcing/tools/

PRODUCT CARBON FOOTPRINTING STANDARDS IN THE AGRI-FOOD SECTOR
MAR-12-217.E 39
Appendix II FAQs and further resources
What is a carbon footprint? Product carbon footprints provide an estimate of the total amount of greenhouse gases (GHGs) emitted during the life cycle of goods and services, i.e. from the extraction of raw materials, production, transportation, storage, use and waste disposal. They are calculated by businesses, governments and others in order to understand the emissions of GHG from consumer products, including food. Carbon footprints can also be calculated for e.g. nations, individuals, events or organizations.
What is a carbon label? A carbon label is a public declaration of the carbon footprint of a given product. This can appear on the packaging of the product, or alternatively it can be made available to interested stakeholders by other means, such as on a website or in company literature.
Does a carbon footprint only measure carbon? No, a ‘carbon footprint’ measures all GHGs emitted from a given system (e.g. an agricultural supply chain). The most important greenhouse gases emitted from horticulture and agriculture are carbon dioxide (CO2), nitrous oxide (N2O) and methane (CH4). Some refrigerants are also important. A carbon footprint should consider emissions of all of these gases.
Each of the greenhouse gases has different impacts on the atmosphere, termed their global warming potential (GWP). The level of GWP depends on how long they survive in the atmosphere, their current concentration in the atmosphere and their ability to capture infrared radiation.
In order to simplify discussion of the impacts of different mixes of GHGs the global warming potential of 1 kg of each gas is compared to that of 1 kg of carbon dioxide. The latest estimates suggest that the impact of 1 kg of methane on global warming is equivalent to that of 25 kg of carbon dioxide, while 1 kg of nitrous oxide is equivalent to 298 kg of carbon dioxide (IPCC 2007b). After making the impact of all the GHGs equivalent to that of carbon dioxide, their impacts can be summed, and the overall impact can be expressed as kg of CO2-equivalents.
What is a system boundary? The system boundary defines the extent of processes that are included in the carbon footprint. For a partial business-to-business PCF, the system boundary may include all emissions that arise up to the point of transfer of the product to a new organization.
What is life cycle assessment (LCA)? LCA is an internationally standardized methodology which aims to quantify the environmental impacts of products on air, water and land, taking into account their entire life cycle from the extraction of raw materials, the production phase, distribution, to use and waste disposal. LCA considers a range of environmental impacts, including the emission of GHGs. The thinking behind LCA and carbon footprints is very similar, and a complete LCA can be used to provide a carbon footprint. However, many companies tend to find it cheaper and easier to only calculate a carbon footprint. So in effect, a carbon footprint is a subset of a full LCA.
The framework for carbon footprinting is provided by existing methods for LCA. However, the needs of supply chain carbon footprints are not fully met by either the existing standards for LCA (ISO 2006 a, b) or standards for company GHG accounting such as the GHG Protocol developed by the World Resources Institute (WRI). One of the problems with the existing ISO standards for LCA is that they allow a lot of flexibility, leaving decisions up to the practitioner which may vary according to the aim of a particular analysis. This limits their use for comparative purposes. As a result additional principles and techniques that address essential aspects of carbon footprinting need to be developed.

PRODUCT CARBON FOOTPRINTING STANDARDS IN THE AGRI-FOOD SECTOR
40 MAR-12-217.E
Appendix III Glossary38
Activity data: All the materials and energy used during the product’s life cycle (e.g. material inputs and outputs, energy used, transport, etc.). Allocation: Partitioning the emissions and removals data of a common process between the product system under study and one or more other co-products. Avoided emissions: The studied product displaces another product in the market that has greater GHG impacts. Business-to-business: The customer is another business using the product as an input to its own activities. Business-to-consumer: The provision of goods to the end user. CO2 equivalents (CO2e): Unit for comparing the climate change effect or radiative forcing of a GHG relative to that of CO2. The conversion of non-CO2 greenhouse gases to CO2e is done using their respective global warming potentials. Co-product: Valuable output from the studied production system in addition to the main product analysed. Cradle-to-grave: See business-to-consumer. Cradle-to-gate: See business-to-business. Emission factor: Emission factors are needed to convert an activity or process into CO2e; they represent the amount of GHGs emitted per unit of activity data. Functional unit: Usually reflects the way in which the product is consumed by the end user and represents a meaningful amount of a product that is used for calculation purposes, e.g. 1 litre of milk (BSI 2008b). Global warming potential (GWP): Factor describing the radiative forcing impact of one mass-based unit of a given greenhouse gas relative to an equivalent unit of carbon dioxide over a given period of time. Greenhouse gas (GHG): One of several gases that can absorb and emit longwave (infrared) radiation in a planetary atmosphere; on earth this is carried out by some of the trace gases, namely: Water vapour, Carbon dioxide, Methane, Nitrous oxide, Ozone, Halocarbons. Although the proportion of the trace gases in the atmosphere appears very small (< 1%), they can still have a big impact on climate change (Source: BBC Weather Service).
38 Sources: BBC Weather Service, BSI (2008a, b), http://www.bsigroup.com/, Encyclopaedia Britannica, Henson & Humphrey (2010), WRI & WBCSD (2011)

PRODUCT CARBON FOOTPRINTING STANDARDS IN THE AGRI-FOOD SECTOR
MAR-12-217.E 41
Infrared radiation: That portion of the electromagnetic spectrum that extends from the long wavelength, or red, end (1000 um) of the visible-light range to the microwave range (0.8um). Invisible to the eye, it can be detected as a sensation of warmth on the skin (Source: Encyclopedia Britannica). International standard: A standard is a document defining best practice, established by consensus and approved by a recognised national standardization body such as British Standards or international bodies such as the European Committee for Standardization (CEN) or the International Organization for Standardization (ISO). Formal standards are developed according to strict rules to ensure that they are fair and transparent. Land use change: Direct land use change: the conversion of land from one land category as defined by IPCC (2006) to another. These land categories are: forest land, grassland, cropland, settlements, wetlands and other land. Indirect land use change: the conversion of land due to changes in agricultural land use in other regions of the world. The GHG emissions related to indirect land use change are not (yet) included in any PCF methodologies. Life Cycle Assessment (LCA): Compilation and evaluation of inputs, outputs and potential environmental impacts of a product system throughout its entire life cycle, from the extraction of raw materials to waste disposal or recycling. Primary data: Primary data refers to direct measurements made internally or by someone else in the supply chain about the specific product’s life cycle.(BSI 2008b). Private voluntary standard or scheme: These are developed by commercial or non-commercial private bodies, e.g. a company or an NGO, and usually adopted by commercial private firms or organizations. They may require conformity assessments by private auditors and be enforced by private third party certification and compliance checks. Product Carbon Footprint (PCF): The sum of greenhouse gas emissions related to a product across its entire life cycle from raw material acquisition to production, distribution, consumer use and waste disposal or recycling, or parts thereof. PCFs should include the six main greenhouse gases carbon dioxide, methane and nitrous oxide as well as hydrofluorocarbons (HFCs), perfluorocarbons (PFCs) and sulphur hexafluoride (SF6). Product Category Rule (PCR): A set of rules and guidelines applicable to specific groups of products that can fulfil equivalent functions and that have similar inputs and processes. Public voluntary standard or scheme: Schemes or standards developed by public bodies. If these standards become mandatory, they are better termed regulation. Secondary data: Data originating from external measurements that are not specific to the product but represent an average or general measurement of similar processes or materials (e.g. industry reports or aggregated data from a trade association) (BSI 2008b). System boundary: Defines the scope for the product carbon footprint, i.e. which life cycle stages, inputs and outputs should be included in the assessment (BSI 2008b).

PRODUCT CARBON FOOTPRINTING STANDARDS IN THE AGRI-FOOD SECTOR
42 MAR-12-217.E
PRODUCT CARBON FOOTPRINTING STANDARDS IN THE AGRI-FOOD SECTOR
MAR-12-217.E 43
References
Barber, A., Pellow, G., 2005. Energy use and efficiency measures for the New Zealand arable and outdoor vegetable industry. Prepared for the Climate Change Office and Energy Efficiency and Conservation Authority. AgriLINK New Zealand Ltd.
Baumgartner, D.U., Mieleitner, J., Alig, M., Gaillard, G., 2011. Environmental profiles of farm types in Switzerland based on LCA. In: Finkbeiner, M. (Ed.) Towards Life Cycle Sustainability Management. Springer-Verlag.
Bolwig, S., Gibbon, P., 2009. Emerging product carbon footprint standards and schemes and their possible trade impacts. Risø-R-Report 1719(EN). Risø National Laboratory for Sustainable Energy, Technical University of Denmark.
Brenton, P., Edwards-Jones, G., Jensen, M.F., Attarzadeh, N., Norton, A., Plassmann, K., 2010. Carbon footprints and food systems: Do current accounting methodologies disadvantage developing countries? The World Bank, Washington, D.C., United States. ISBN 978-0-8213-8539-5.
Brenton, P., Edwards-Jones, G., Jensen, M.F., 2009. Carbon labelling and low income country exports: A review of the development issues. Development Policy Review 27, 243–265.
BSI, 2011. PAS 2050:2011. Specification for the assessment of the life cycle greenhouse gas emissions of goods and services. British Standards, London, United Kingdom.
BSI, 2008a. PAS 2050:2008. Specification for the assessment of the life cycle greenhouse gas emissions of goods and services. British Standards, London, United Kingdom.
BSI, 2008b. Guide to PAS 2050. How to assess the carbon footprint of goods and services. British Standards, London, United Kingdom.
Carbon Trust, 2011. Code of good practice for product greenhouse gas emissions and reduction claims. Guidance to support the robust communication of product carbon footprints. Interpretation. Carbon Trust, London.
Carbon Trust, 2008. Code of good practice for product greenhouse gas emissions and reduction claims. Guidance to support the robust communication of product carbon footprints. Carbon Trust, London.
Chapagain, A., James, K., 2011. The water and carbon footprint of household food and drink waste in the UK. WWF-UK and Waste Resources Action Programme.
De Schutter, D., 2010. Agroecology and the right to food. Report presented at the 16th Session of the United Nations Human Rights Council [A/HRC/16/49]. http://www.srfood.org/images/stories/pdf/officialreports/20110308_a-hrc-16-49_agroecology_en.pdf
Edwards-Jones, G., Plassmann, K., York, L., Hounsome, B., Jones, D., Milà i Canals, L., 2009a. The vulnerability of exporting nations to the development of a carbon label in the United Kingdom. Environmental Science and Policy 12, 479–490.
Edwards-Jones, G., Plassmann, K., Harris, I., 2009b. Carbon footprinting of lamb and beef production systems: Insights from an empirical analysis of farms in Wales, UK. Journal of Agricultural Science 147, 707-719.
Edwards-Jones, G., Plassmann, K., Norton, A., Attarzadeh, N., 2009c. Food system differences and carbon labelling: Developing development-friendly design guidelines. Interim project report, unpublished.
Edwards-Jones, G., Milà i Canals, L., Hounsome, N., Truninger, M., Koerber, G., Hounsome, B., Cross, P., York, E.H., Hospido, A., Plassmann, K., Harris, I.M., Edwards, R.T., Day, G.A.S., Tomos, A.D., Cowell, S.J., Jones, D.L., 2008. Testing the assertion that 'local food is best': the challenges of an evidence based approach. Trends in Food Science and Technology 19, 265-274.

PRODUCT CARBON FOOTPRINTING STANDARDS IN THE AGRI-FOOD SECTOR
44 MAR-12-217.E
Foley, J.A., Ramankutty, N., Brauman, K.A., Cassidy, E.S., Gerber, J.S., Johnston, M., Mueller, N.D., O’Connell, C., Ray, D.K., West, P.C., Balzer, C., Bennett, E.M., Carpenter, S.R., Hill, J., Monfreda, C., Polasky, S., Rockström, J., Sheehan, J., Siebert, S., Tilman, D., Zaks, D.P.M., 2011. Solutions for a cultivated planet. Nature 478, 337-342.
Garnett, T., 2011. Where are the best opportunities for reducing greenhouse gas emissions in the food system (including the food chain)? Food Policy 36, 23–32.
Garnett, T., 2008. Cooking up a storm. Food, greenhouse gas emissions and our changing climate. Food Climate Research Network. Centre for Environmental Strategy, University of Surrey.
Gustavsson, J., Cederberg, C., Sonesson, U, van Otterdijk, R., Meybeck, A., 2011. Global food losses and food waste: Extent, causes and prevention. Food and Agriculture Organization of the United Nations, FAO, Rome.
Haas, G., Wetterich, F., Köpke, U., 2001. Comparing intensive, extensified and organic grassland farming in southern Germany by process life cycle assessment. Agriculture, Ecosystems and Environment 83, 43-53.
Henson, S., Humphrey, J., 2010. Understanding the complexities of private standards in global agri-food chains as they impact developing countries. Journal of Development Studies 46, 1628-1646.
Hospido, A., Milà i Canals, L., McLaren, S., Truninger, M., Edwards-Jones, G., Clift, R., 2009. The role of seasonality in lettuce consumption: a case study of environmental and social aspects. International Journal of Life Cycle Assessment 14, 381-391.
IPCC, 2007a. Climate change 2007: The physical science basis. Contribution of Working Group I to the Fourth Assessment Report of the Intergovernmental Panel on Climate Change [Solomon, S., D. Qin, M. Manning, Z. Chen, M. Marquis, K.B. Averyt, M. Tignor and H.L. Miller (eds.)]. Cambridge University Press, Cambridge, United Kingdom and New York, NY, United States, 996 pp.
IPCC, 2007b. Climate change 2007: Impacts, adaptation and vulnerability. Contribution of Working Groups I, II and III to the Fourth Assessment Report of the Intergovernmental Panel on Climate Change. Core Writing Team, Pachauri, R.K. and Reisinger, A. (Eds.). IPCC, Geneva, Switzerland.
IPCC, 2006. 2006 IPCC Guidelines for National Greenhouse Gas Inventories. Prepared by the National Greenhouse Gas Inventories Programme, Eggleston, H.S., Buendia, L., Miwa, K., Ngara, T., Tanabe, K. (Eds.), IGES, Japan.
ISO, 2006a. ISO14040. Environmental Management–Life Cycle Assessment—Principles and Framework. International Organization for Standardization, Geneva, Switzerland.
ISO, 2006b. ISO 14044. Environmental Management–Life Cycle Assessment—Requirements and Guidelines. International Organization for Standardization, Geneva, Switzerland.
Jawjit, W., Kroeze, C., Rattanapan, S., 2010. Greenhouse gas emissions from rubber industry in Thailand. Journal of Cleaner Production 18, 403-411.
Lesschen, J.P., Velthof, G.L., de Vries, W., Kros, J., 2011. Differentiation of nitrous oxide emission factors for agricultural soils. Environmental Pollution 159, 3215-3222.
MacLeod, M., Moran, D., Eory, V., Rees, R.M., Barnes, A., Topp, C.F.E., Ball, B., Hoad, S., Wall, E., McVittie, A., Pajot, G., Matthews, R., Smith, P., Moxey, A., 2010. Developing greenhouse gas marginal abatement cost curves for agricultural emissions from crops and soils in the UK. Agricultural Systems 103, 198-209.
Milà i Canals, L., Azapagic, A., Doka, G., Jefferies, D., King, H., Mutel, C., Nemecek, T., Roches, A., Sim, S., Stichnothe, H., Thoma, G., Williams, A., 2011. Approaches for addressing life cycle assessment data gaps for bio-based products. Journal of Industrial Ecology 15, 707-725.

PRODUCT CARBON FOOTPRINTING STANDARDS IN THE AGRI-FOOD SECTOR
MAR-12-217.E 45
Milà i Canals, L., Munoz, I., Hospido, A., McLaren, S., Plassmann, K., 2008. Life cycle assessment (LCA) of domestic vs. imported vegetables. Case studies on broccoli, salad crops and green beans. Centre for Environmental Strategy, University of Surrey, United Kingdom.
Milà i Canals, L., Cowell, S.J., Sim, S., Basson, L., 2007. Comparing domestic vs. imported apples: a focus on energy use. Environmental Science and Pollution Research 14, 338-344.
Milà i Canals, L., Burnip, G.M., Cowell, S.J., 2006. Evaluation of the environmental impacts of apple production using life cycle assessment (LCA): Case study in New Zealand. Agriculture, Ecosystems and Environment 114, 226-238.
Mouron, P., Nemecek, T., Scholz, R., Weber, O., 2006. Management influence on environmental impacts in an apple production system on Swiss fruit farms: Combining life cycle assessment with statistical risk assessment. Agriculture, Ecosystems and Environment 114, 311-322.
Nanda, N., 2010. International trade and climate change: issues for South Asia. Kathmandu: South Asia Watch on Trade, Economics and Environment (SAWTEE).
Niles, J.O., Brown, S., Pretty, J., Ball, A.S., Fay, J., 2002. Potential carbon mitigation and income in developing countries from changes in use and management of agricultural and forest lands. Philosophical Transactions of the Royal Society London A 360, 1621-1639.
O’Halloran, N., Fisher, P., Rab, A., 2008. Vegetable industry carbon footprint scoping study. Discussion Paper 6. Options for mitigating greenhouse gas emissions for the Australian vegetable industry. Horticulture Australia Ltd.
Parfitt, J., Barthel, M., Macnaughton, S., 2010. Food waste within food supply chains: quantification and potential for change to 2050. Philosophical Transactions of the Royal Society B 365, 3065-3081.
PCF Project, 2009a. Fallstudie ’Best Alliance’ – Früherdbeeren der REWE Group. Dokumentation. Fallstudie im Rahmen des PCF (Product Carbon Footprint) Pilotprojekts Deutschland.
PCF Project, 2009b. Case study Tchibo Privat Kaffee Rarity Machare by Tchibo GmbH. Documentation. Case study undertaken within the PCF Pilot Project Germany.
Philippot, L., Hallin, S., 2011. Towards food, feed and energy crops mitigating climate change. Trends in Plant Science 16, 476-480.
Plassmann, K., Norton, A., Attarzadeh, N., Jensen, M.F., Brenton, P., Edwards-Jones, G., 2010. Methodological complexities of carbon footprinting: a sensitivity analysis of key variables in a developing country context. Environmental Science and Policy 13, 393-404.
Pretty, J.N., Noble, A.D., Bossio, D., Dixon, D., Hine, R.E., Penning de Vries, F.W.T., Morison, J.I.L., 2006. Resource-conserving agriculture increases yields in developing countries. Environmental Science and Technology 40, 1114-1119.
Robertson, G.P., 1999. Keeping track of carbon. Science 285, 1849.
Sathaye, J., Najam, A., Cocklin, C., Heller, T., Lecocq, F., Llanes-Regueiro, J., Pan, J., Petschel-Held, G., Rayner, S., Robinson, J., Schaeffer, R., Sokona, Y., Swart, R., Winkler, H., 2007. Sustainable Development and Mitigation. In: Climate Change 2007: Mitigation. Contribution of Working Group III to the Fourth Assessment Report of the Intergovernmental Panel on Climate Change [B. Metz, O.R. Davidson, P.R. Bosch, R. Dave, L.A. Meyer (eds)], Cambridge University Press, Cambridge, United Kingdom and New York, NY, United States.
Schlesinger, W.H., Andrews, J.A., 2000. Soil respiration and the global carbon cycle. Biogeochemistry 48, 7-20.
PRODUCT CARBON FOOTPRINTING STANDARDS IN THE AGRI-FOOD SECTOR
46 MAR-12-217.E
Sim, S., Barry, M., Clift, R., Cowell, S.J., 2007. The relative importance of transport in determining an appropriate sustainability strategy for food sourcing. A case study of fresh produce supply chains. International Journal of Life Cycle Assessment 12, 422-431.
Sinden, G., 2009. The contribution of PAS 2050 to the evolution of international greenhouse gas emission standards. International Journal of Life Cycle Assessment 14, 195-203.
Smith, G., 2009. Interaction of Public and Private Standards in the Food Chain. OECD Food, Agriculture and Fisheries Working Papers, No. 15, OECD Publishing. doi: 10.1787/221282527214.
Smith, P., Martino, D., Cai, Z., Gwary, D., Janzen, H., Kumar, P., McCarl, B., Ogle, S., O’Mara, F., Rice, C., Scholes, B., Sirotenko, O., Howden, M., McAllister, T., Pan, G., Romanenkov, V., Schneider, U., Towprayoon, S., Wattenbach, M., Smith, J., 2008. Greenhouse gas mitigation in agriculture. Philosophical Transactions of the Royal Society B 363, 789-813.
Smith, P., Martino, D., Cai, Z. Gwary, D., Janzen, H., Kumar, P., McCarl, B., Ogle, S., O’Mara, F., Rice, C., Scholes, B., Sirotenko, O., 2007. Agriculture. In: Climate Change 2007: Mitigation. Contribution of Working Group III to the Fourth Assessment Report of the Intergovernmental Panel on Climate Change [B. Metz, O.R. Davidson, P.R. Bosch, R. Dave, L.A. Meyer (eds)], Cambridge University Press, Cambridge, United Kingdom and New York, NY, United States.
Smith, P., Goulding, K.W., Smith, K.A., Powlson, D.S., Smith, J.U., Falloon, P., Coleman, K., 2001. Enhancing the carbon sink in European agricultural soils: Including trace gas fluxes in estimates of carbon mitigation potential. Nutrient Cycling in Agroecosystems 60, 237-252.
Sonesson, U., Davis, J., Ziegler, F., 2010. Food production and emissions of greenhouse gases. An overview of the climate impact of different product groups. SIK-Report No. 802. ISBN 978-91-7290-291-6.
WRI & WBCSD. 2011. Greenhouse Gas Protocol Product Life Cycle Accounting and Reporting Standard (2011). http://www.ghgprotocol.org/standards/product-standard.
Williams, A., Pell, E., Webb, J., Tribe, E., Evans, D., Moorhouse, E., Watkiss, P., 2009. Comparative life cycle assessment of food commodities procured for UK consumption through a diversity of supply chains. Final Report to Defra on Project FO0103.

Street addressInternational Trade Centre54-56 Rue de Montbrillant1202 Geneva, Switzerland
P: +41 22 730 0111F: +41 22 733 4439E: [email protected]
Postal addressInternational Trade CentrePalais des Nations1211 Geneva 10, Switzerland
The International Trade Centre (ITC) is the joint agency of the World Trade Organization and the United Nations.
TECHNICAL PAPER
COTTON AND CLIMATE CHANGE
IMPACTS AND OPTIONS TO MITIGATE AND ADAPT