Evaluation of suppressive and pro-resolving effects of … · Evaluation of suppressive and...
41
1 MS ID#: JLR/2012/031260 Evaluation of suppressive and pro-resolving effects of EPA and DHA in human primary monocytes and T-helper cells. Anke Jaudszus 1 , Michael Gruen 2,3 , Bernhard Watzl 1 , Christina Ness 2 , Alexander Roth 1 , Alfred Lochner 2 , Dagmar Barz 4 , Holger Gabriel 5 , Michael Rothe 6 , and Gerhard Jahreis 2 1 Max Rubner-Institut, Federal Research Institute of Nutrition and Food, Department of Physiology and Biochemistry of Nutrition, D-76131 Karlsruhe, Germany; 2 Institute of Nutrition, Department of Nutritional Physiology, Friedrich Schiller University, D-07743 Jena, Germany; 3 Current address: Food GmbH, D-07743 Jena; 4 Clinic of Internal Medicine, Institute of Transfusion Medicine, Friedrich Schiller University, D-07743 Jena; 5 Institute of Sports Medicine, Friedrich Schiller University, D-07749 Jena; 6 Lipidomix GmbH, D-13125 Berlin, Germany To whom correspondence should be addressed: Dr. Anke Jaudszus, Max Rubner-Institut, Department of Physiology and Biochemistry of Nutrition, Haid-und-Neu-Straße 9, D-76131 Karlsruhe, Germany E-mail: [email protected] Abbreviations: CD, cluster of differentiation; COX, cyclooxygenase; DMSO, dimethylsulfoxide; HDHA, hydroxydocosahexaenoic acid; HETE, hydroxyeicosatetraenoic acid; IFNγ, interferon gamma; IL, interleukin; FAME, fatty acid methyl esters; FBS, fetal bovine serum; mAb, monoclonal antibody; LO, lipoxygenase; LPS, lipopolysaccharide; by guest, on June 13, 2018 www.jlr.org Downloaded from
Transcript of Evaluation of suppressive and pro-resolving effects of … · Evaluation of suppressive and...

1
MS ID#: JLR/2012/031260
Evaluation of suppressive and pro-resolving effects of EPA and DHA in
human primary monocytes and T-helper cells.
Anke Jaudszus1, Michael Gruen
2,3, Bernhard Watzl
1, Christina Ness
2, Alexander Roth
1,
Alfred Lochner2, Dagmar Barz
4, Holger Gabriel
5, Michael Rothe
6, and Gerhard Jahreis
2
1Max Rubner-Institut, Federal Research Institute of Nutrition and Food, Department of
Physiology and Biochemistry of Nutrition, D-76131 Karlsruhe, Germany;
2Institute of Nutrition, Department of Nutritional Physiology, Friedrich Schiller University,
D-07743 Jena, Germany;
3Current address: Food GmbH, D-07743 Jena;
4Clinic of Internal Medicine, Institute of Transfusion Medicine, Friedrich Schiller University,
D-07743 Jena;
5Institute of Sports Medicine, Friedrich Schiller University, D-07749 Jena;
6Lipidomix GmbH, D-13125 Berlin, Germany
To whom correspondence should be addressed: Dr. Anke Jaudszus, Max Rubner-Institut,
Department of Physiology and Biochemistry of Nutrition, Haid-und-Neu-Straße 9, D-76131
Karlsruhe, Germany
E-mail: [email protected]
Abbreviations: CD, cluster of differentiation; COX, cyclooxygenase; DMSO,
dimethylsulfoxide; HDHA, hydroxydocosahexaenoic acid; HETE, hydroxyeicosatetraenoic
acid; IFNγ, interferon gamma; IL, interleukin; FAME, fatty acid methyl esters; FBS, fetal
bovine serum; mAb, monoclonal antibody; LO, lipoxygenase; LPS, lipopolysaccharide;
by guest, on June 13, 2018w
ww
.jlr.orgD
ownloaded from

2
LTB, leukotriene B; MFI, mean fluorescence intensity; NK, natural killer; PBMC, peripheral
blood mononuclear cells; PI, propidium iodide; PMA, phorbol 12-myristate 13-acetate;
PPARγ, peroxisome proliferator-activated receptor gamma; PUFA, polyunsaturated fatty
acids; SFA, saturated fatty acids; T0070907, 2-Chloro-5-nitro-N-4-pyridinylbenzamide;
TNF-α, tumor necrosis factor alpha; TXB, thromboxane B
Supplementary key words: cytokines / DHA / EPA / monocytes / PBMC / Th cells
by guest, on June 13, 2018w
ww
.jlr.orgD
ownloaded from

3
ABSTRACT
Besides their health beneficial anti-inflammatory properties, eicosapentaenoic acid (EPA) and
docosahexaenoic acid (DHA) may increase the infection risk at high doses, likely by generating
an immune-depressed state. To assess the contribution of different immune cell populations to
the immunomodulatory fatty acid effect, we comparatively investigated several aspects of
inflammation in human T-helper (Th) cells and monocytes.
Both fatty acids, but DHA to a lesser extent compared to EPA, selectively and dose-
dependently reduced the percentage of cytokine expressing Th cells in a PPAR -dependent
fashion, whereas the expression of the cell surface marker CD69 was unaltered on activated T
cells. In monocytes, both EPA and DHA increased IL-10 without affecting TNF-α and IL-6.
Cellular incorporation of EPA and DHA occurred mainly at the expense of arachidonic acid.
Concomitantly, TXB2 and LTB4 in supernatants decreased, while levels of TXB3 and LTB5
increased. This increase was independent of activation and in accordance with cyclooxygenases
expression patterns in monocytes. Moreover, EPA and DHA gave rise to a variety of mono- and
trihydroxy derivatives of highly anti-inflammatory potential, such as resolvins and their
precursors.
Our results suggest that EPA and DHA do not generally affect immune cell functions in an
inhibitory manner but rather promote pro-resolving responses.
by guest, on June 13, 2018w
ww
.jlr.orgD
ownloaded from
4
INTRODUCTION
Long-chain polyunsaturated fatty acids of the omega-3 series (n-3 LC-PUFA), such as
eicosapentaenoic acid (EPA, C20:5n-3) and docosahexaenoic acid (DHA, C22:6n-3), are
unanimously considered to be health-promoting due to their anti-inflammatory potential (rev. in
1). Primarily, they are claimed to reduce the incidence and mortality of cardiovascular and
angiopathy disorders (rev. in 2, 3). In addition, a substantial number of studies have
demonstrated their supportive efficacy to alleviate disease-specific symptoms in chronic
immune-associated disorders such as bronchial asthma (4, 5), psoriasis (6), rheumatoid arthritis
(7) and inflammatory bowel disease (rev. in 8). Moreover, EPA and DHA supplementation was
shown to reduce episodes and duration of illnesses in children and might therefore be valuable
for maintaining health (9).
On the other hand, a growing body of literature suggests that excessive dietary supplementation
with EPA and DHA can be deleterious in certain immunocompromised disease states. Likely by
generating a hyporesponsive host environment, high-dose fish oil consumption was shown to
facilitate viral infections, to impair bacterial resistance, to delay pathogen clearance, to
aggravate acute tissue injury (10-13), and even to be implicated in the development of
pathogen-associated colitis and gastrointestinal cancer in rodents (14). Though evidence-based
data for such an impairment of immunity in humans is limited, controversial and still not
conclusive (15, 16), the German Federal Research Institute for Risk Assessment recommended
the setting of maximum levels for the fortification of foods with n-3 LC-PUFA to 1.5 g/d (17).
Investigating the mechanisms that underlie the fish oil dependent immunomodulation, most of
the work has focused on the effects of orally administered EPA and DHA on immune markers
reflected by ex vivo mitogen-induced lymphocyte proliferation, natural killer (NK) cell activity
and cytokine production of T cells or monocytes. However, with respect to study population
and design, methods of measurements and outcomes, available data are highly inconsistent and
by guest, on June 13, 2018w
ww
.jlr.orgD
ownloaded from
5
at times contradictory, as thoroughly reviewed in Ref. (18). Moreover, studies on the effect of
EPA and/or DHA on separate T cell subsets such as T-helper (Th) cells are rare.
Aim of the present study was therefore to comparatively investigate several aspects of
inflammation of pure EPA or DHA in primary human Th cells and monocytes in order to
examine the contribution of these two immune cell populations, crucially involved in adaptive
and innate immunity, to the immunomodulatory effect of n-3 LC-PUFA. For this purpose, we
intended to match a largely realistic ex vivo representation on one hand and highly standardized
in vitro research on the other.
by guest, on June 13, 2018w
ww
.jlr.orgD
ownloaded from

6
MATERIALS AND METHODS
Chemicals
EPA and DHA in free fatty acid form (both Larodan, Malmö, Sweden) were dissolved in sterile
dimethylsulfoxide (DMSO) to produce a 100 mM stock solution and stored in aliquots at -20°C.
Further, lyophilized 2-chloro-5-nitro-N-4-pyridinylbenzamide (T0070907), phorbol 12-
myristate 13-acetate (PMA), ionomycin, brefeldin A (all Enzo, Lörrach, Germany),
lipopolysaccharide (LPS from E.coli, Serotype 0111:B4; Sigma-Aldrich, Taufkirchen,
Germany) and concanavalin A (ConA, Sigma-Aldrich) were solubilized in DMSO, aliquoted
and stored at -20°C.
Purification of PBMC
Mononuclear cells were isolated from buffy coats obtained from peripheral blood of healthy
donors who gave their written consent. Buffy coat blood was diluted with PBS (PAA, Cölbe,
Germany) at a ratio of 1:1, layered onto Lymphocyte Separation Medium (LSM) 1077 (1.077
g/mL; PAA; ratio 1:1) and centrifuged at 700×g for 20 min at 20°C. The PBMC interphase was
collected, washed three times with PBS and resuspended in Roswell Park Memorial Institute
(RPMI) 1640 medium supplemented with 10% endotoxin-free heat-inactivated fetal bovine
serum (PAA).
PBMC viability
To assess the impact of high-dose EPA and DHA, respectively, on cell viability, PBMC
(1 106/mL) were incubated without or with 25, 50, 100, 150 or 200 µM of either fatty acid for
24 h in a 5% CO2 humidified atmosphere at 37°C. Control cultures contained 0.2% DMSO
vehicle, according to the maximal volume in the treatments. Cell viability was analyzed by
annexin-V (Immunotech, Marseille, France) and propidium iodide (PI; Sigma-Aldrich)
exclusion double staining. In brief, cells were washed with PBS, incubated in binding buffer
and annexin-V or PI for 15 min at room temperature in the dark and analyzed flow-
by guest, on June 13, 2018w
ww
.jlr.orgD
ownloaded from

7
cytometrically using an EPICS XL flow cytometer (Beckman Coulter, Krefeld, Germany).
Cell culture
For Th cell assays, PBMC (1 106/mL) were incubated without or with increasing
concentrations of EPA or DHA (25, 50, 100 µM) for 19 h. Subsequently, cells were
alloreactively stimulated with PMA (2.5 ng/mL; induces cytokine production by activation of
protein kinase C) and ionomycin (0.5 µg/mL; potentiates activation as calcium ionophore) in
the presence of brefeldin A (5 µg/mL; increases sensitivity of intracellular cytokine detection by
interfering with the function of the Golgi apparatus) for another 5 h. Supernatants were frozen at
-80°C until lipid mediator analysis. For some experiments, cells were pre-incubated for 30 min
with different concentrations of the selective PPARγ inhibitor T0070907 (0.4 or 2 µM) before
100 µM EPA or DHA and the stimulation cocktail were added as described above. For
measurement of T cell activation (expression of the cell surface marker CD69), PBMC were
pre-treated without or with increasing concentrations of EPA or DHA (25, 50, 100 µM) for 19 h
and subsequently incubated with either 2.5 ng/mL PMA and 0.5 µg/mL ionomycin or 10 µg/mL
ConA for further 5 h. For monocyte assays, PBMC were treated with fatty acids as indicated for
20 h before addition of 1 µg/mL LPS and 5 µg/mL brefeldin A for further 4 h. Control cultures
contained maximum 0.2% DMSO. All experiments were performed under standard cell culture
conditions.
Intracellular cytokine and cyclooxygenases detection
Both unstimulated and stimulated cells were stained either with anti-human CD3 mAb (PE-
Dy647, clone MEM-57, Immunotools, Friesoythe, Germany) and anti-human CD4 mAb (FITC,
clone MEM-241, Immunotools) for detection of Th cells or with anti-human CD14 mAb (PE-
Dy647, clone MEM-15, Immunotools) for identification of monocytes before cells were fixed
with 2% formaldehyde (Histofix®, Roth, Karlsruhe, Germany). For intracellular cytokine
quantification, cells were permeabilized by washing with PBS/0.1% BSA/0.1% saponine,
by guest, on June 13, 2018w
ww
.jlr.orgD
ownloaded from

8
stained with anti-human TNF-α mAb (PE, clone MAb11, eBioscience, Frankfurt/Main,
Germany), anti-human IL-2 mAb (PE, clone MQ1-17H12, eBioscience), anti-human IL-4 mAb
(PE, clone 8D4-8, eBioscience), anti-human IFN-γ mAb (PE, clone 4S.B3, eBioscience), anti-
human IL-6 mAb (PE, clone MQ2-13A5, eBioscience) or anti-human IL-10 mAb (PE, clone
JES3-9D7) and analyzed by means of flow cytometry. Intracellular levels of COX-1 and COX-
2 in CD14+ cells were determined with Multicolor anti-human COX-1-FITC/anti-human COX-
2-PE mAb (clones AS70/AS57, Becton Dickinson, Heidelberg, Germany). To assess T cell
activation, cells were stained with anti-human CD3 mAb and anti-human CD69 mAb (PE,
clone FN50, Biolegend/Biozol, Eching, Germany). When necessary, probes were analyzed in
reference to FMO (fluorescence minus one)-PE controls. Non-specific fluorescence was
controlled by incubation with isotype-matched antibodies. Data were assessed and illustrated by
WinMDI version 2.8 software (J. Trotter, Scripps Research Institute), except for COX-2 in
stimulated monocytes that was measured in a FACSCalibur flow cytometer (Becton Dickinson,
Heidelberg Germany) and analyzed using CELLQUEST software (BD).
Fatty acid profiles
PBMC (1 106/mL) were cultured in the presence of increasing concentrations (25, 50, 100 µM)
of EPA and DHA, respectively, or DMSO vehicle for 24 h, as indicated above. Cells were
harvested, washed twice with PBS and total lipids were extracted using a methanol/chloroform
mixture according to (19). For fatty acid analysis, a base-catalyzed transesterification method
was performed by incubating samples with 0.5 N sodium methylate at 100°C for 10 min
followed by methanolic boron trifluoride (10% w/w; Supelco, Bellefonte, PA, USA) treatment
at 100°C for 5 min. Afterwards, fatty acid methyl esters (FAME) were extracted with n-hexan,
separated in a gas chromatograph (GC 17a V3, Shimadzu, Kyoto, Japan) using a fused-silica
capillary column with medium polarity (DB 225 MS, 60 m × 0.25 mm i.d., 0.25 µm film
thickness; Agilent Technologies, Santa Clara, USA) and downstream detected by flame
ionization (FID). GC conditions were as previously described (20). Peak area integration was
by guest, on June 13, 2018w
ww
.jlr.orgD
ownloaded from
9
accomplished using GC solution software version 2.3 in comparison to previously measured
reference standards (BR2, BR4, and Menhaden from Larodan/CPS-Chemie, Aachen, Germany;
463 and 674 from Nu-Chek-Prep, Minnesota, USA).
Lipid mediator profiles
PBMC (1 106/mL) were cultured in the presence of 100 µM EPA or DHA for 19 h and
subsequently activated for another 5 h with the stimulation mixture as described above.
Corresponding control cultures contained the according volume of DMSO. Afterwards, 1 mL
supernatant was added to 1 mL methanol containing BHT (0.1%) and spiked with an internal
standard consisting of 15-HETE-d8, PGE2-d4 and LTB4-d4 (each 1 µg/mL). After addition of 2
mL 0.1 mM sodium acetate buffer to adjust the pH at 6, and centrifugation, the upper phase was
subjected to a solid phase extraction using anion exchange columns (Varian Bond Elute Certify
II, Agilent), which were preconditioned with 3 mL methanol, followed by 3 mL 0.01 M sodium
acetate buffer containing 5% methanol (v/v; pH 6). The columns were then washed twice with 3
mL methanol/water (1/1, v/v) each. For elution, 2 mL of an ethyl acetate:n-hexane extraction
mixture (1/1, v/v) was added. The eluate was evaporated in N2 at 40°C and the solid residues
were dissolved in 50 µL acetonitrile. For HPLC analysis, an Agilent 1200SL system equipped
with a Phenomenex Kinentex column and coupled with an Agilent 6460 Triplequad mass
spectrometer with electrospray ionization source was used. The solvent system consisted of
acetonitrile and aqueous formic acid (0.1%). The elution gradient was started with 5%
acetonitrile for 30 s, which was increased within 10 min to 90% and held for 8 min. The
injection volume was 7.5 µL and the flow rate was set at 0.4 mL/min. Lipid mediator analysis
was performed with dynamic Multiple Reaction Monitoring in negative mode. For the
preparation of standards and peak calculation including detailed MRM characterization of all
measured compounds see Ref. (21). Peak integration and signal to noise calculation was
accomplished using Agilent MassHunter Workstation Software.
by guest, on June 13, 2018w
ww
.jlr.orgD
ownloaded from
10
Statistics
For the statistical analysis of the data concerning concentration-dependent fatty acid effects
including cellular fatty acid profiles, Th cell cytokines in the absence or presence of T0070907,
and lipid mediator profiles, linear mixed models were used with the concentration of the
corresponding fatty acid/cytokine being the dependent variable, while the treatment (DHA vs.
EPA) and the concentration (of DHA/EPA or T0070907) were entered as independent variables
(fixed effects). For the lipid mediator profiles, treatment and stimulation condition were used as
independent variables. For all models, a random intercept per donor was integrated to control
for inter-individual differences. Visual inspection of QQ-plots of the residuals and plots of the
residuals vs. fitted response values allowed us to justify the assumptions of the linear mixed
models, namely homoscedasticity and normal distribution of the residuals. In cases where the
assumption of variance homogeneity could not be met we extended the variance structure of the
models by including a treatment specific variance structure. We tested better model fit of the
extended model by means of a likelihood ratio test (LRT). If the LRT was significant on the
0.05 level, the model with adapted variance structure was preferred. Statistical analysis was
carried out using SAS software 9.2 and R 2.15.0 (R Foundation for Statistical Computing,
Vienna, Austria). All other data were compared by means of 2-tailed Student´s t-test using
SPSS software version 19.0 (SPSS Inc., Illinois, USA). All data are reported as means ± SEM
(or SD as indicated) from at least five independent experiments (unless indicated otherwise).
Significance of difference was set at P < 0.05.
by guest, on June 13, 2018w
ww
.jlr.orgD
ownloaded from

11
RESULTS
Both EPA and DHA do not affect viability of human leukocytes
First we tested whether incubation with EPA or DHA at high concentration has an impact on
the viability of primary lymphocytes and monocytes over a period of 24 h. Compared to the
DMSO control, neither EPA nor DHA showed any cytotoxic effect at 100 µM (Fig. 1). A
drop in viability was observed only at concentrations higher than 150 µM (data not shown).
Based on these data, a maximum fatty acid concentration of 100 µM was used in all
subsequent experiments.
EPA reduces intracellular IL-2, TNF-α and IL-4, but not IFN-γ, stronger than DHA in Th
cells
The expression kinetics of IL-2 and TNF-α and their stable presence in relatively high
proportions within Th cells following short term stimulation enable comparable and reliable
measurements in vitro (22). In activated cell cultures, 18.7 ± 1.7% of the T cells (CD3+) were
identified as Th cells (CD3+CD4
+) positive for IL-2 and 25.6 ± 2.2% were positive for TNF-α;
Fig. 2 a, b). After 24 h incubation with EPA, the percentage of IL-2 positive and TNF-α positive
Th cells dose-dependently decreased by up to 81% and 73% to 2.7 ± 0.5% and 4.2 ± 0.9%,
respectively (P < 0.001). Simultaneously, the mean fluorescence intensity (MFI) reflecting the
cytokine levels on a per cell basis, dose-dependently decreased. DHA also significantly reduced
the intracellular content of IL-2 and TNF-α in activated Th cells by 61% and 71% to 7.3 ± 1.2%
and 7.5 ± 1.2%, respectively (P < 0.001). The reduction in cytokine levels caused by DHA
treatment was significantly weaker than that ascertained for EPA (P = 0.005 for IL-2 and P =
0.032 for TNF-α) at all concentrations tested. Correlation analysis revealed a stronger negative
association between the cellular uptake of EPA in PBMC and the reduction in the IL-2 and
TNF-α positive Th cell population, respectively, than DHA (Fig. 2 c). Regarding the Th cell
population positive for IL-4, a signature cytokine produced by Th2-type T cells (23), also a
by guest, on June 13, 2018w
ww
.jlr.orgD
ownloaded from

12
significant fatty acid-mediated and concentration-dependent decrease was found (P = 0.002).
However, the reduction observed after incubation with EPA tended to be more pronounced than
in the presence of DHA (P = 0.087; Fig. 2 a). The fatty acid-mediated inhibition of cytokine
production in Th cells was not general, since neither EPA nor DHA affected the level of IFN- ,
classically characterizing the Th1 lineage (23), at any tested concentration (Fig. 2 a).
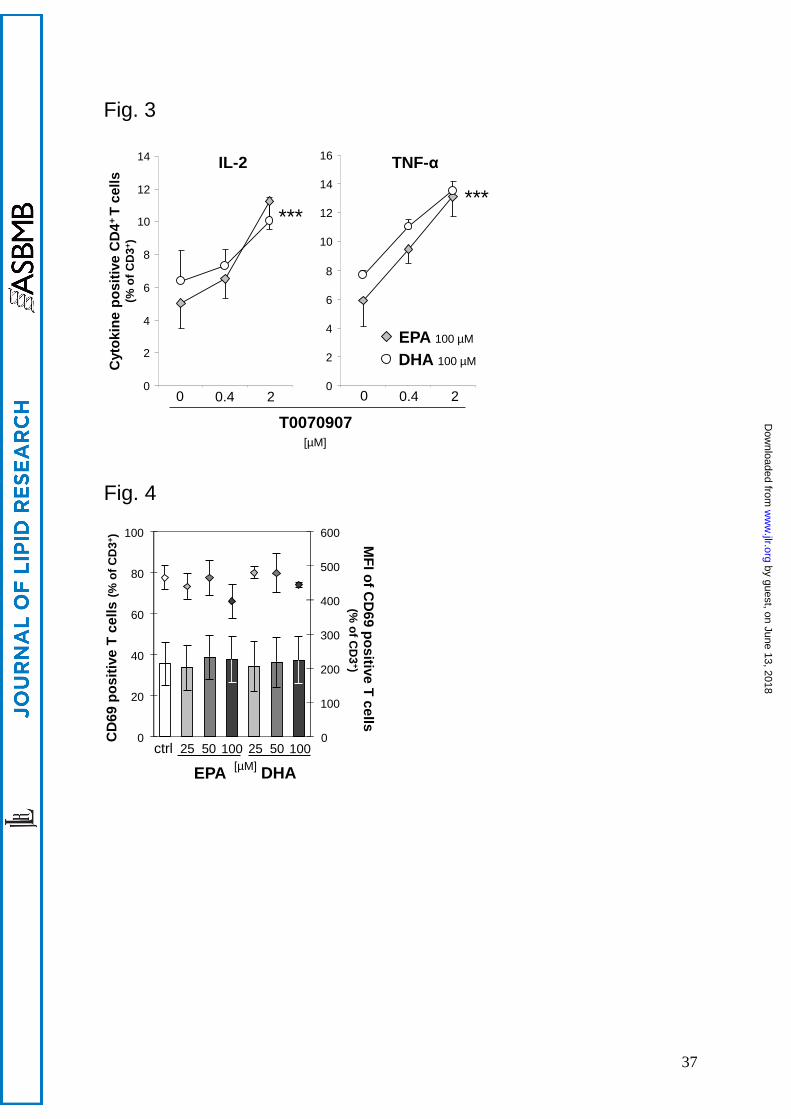
Both EPA- and DHA-mediated cytokine effects involve PPAR
To investigate whether the fatty acids exert cytokine expression reducing effects via a PPAR
ligand-like action, cells were pre-treated with the selective PPAR antagonist T0070907 in
different concentrations before 100 µM EPA or DHA and the alloreactive stimulation mixture
were added. At the example of IL-2 and TNF-α, in both EPA and DHA treated cultures, the
reduced cytokine positive Th cell population dose-dependently re-expanded in the presence of
T0070907 (P < 0.001 for both IL-2 and TNF-α; Fig. 3). These results clearly implicate that
PPAR was involved as a mediator of the anti-inflammatory fatty acid effect.
Both EPA and DHA do not affect the expression of the T cell activation marker CD69
Mitogen activation of PBMC resulted in a significant increase in the expression of the
activation marker CD69 on T cells. In the presence of PMA/ionomycin, the percentage of
CD69+ rapidly increased from < 1% to > 95% of CD3
+ lymphocytes (data not shown). Neither
EPA nor DHA altered this percentage at any tested concentration. Likewise, the corresponding
MFI remained unaltered (data not shown). In order to evaluate whether any fatty acid effect
might have been overlaid by the strong stimulation effect, we gradually reduced the PMA
concentration to one tenth of the initially used 2.5 ng/mL. However, the percentage of
CD3+CD69
+ constantly remained > 95% (data not shown). Thus, to ensure that the lacking
effect of EPA and DHA on CD69 expression on T cells was true and not due to non-optimal
stimulation conditions for displaying any fatty acid effect, we repeated this experimental part
with ConA as mitogen stimulant. Upon ConA stimulation, the percentage of CD69+ increased
by guest, on June 13, 2018w
ww
.jlr.orgD
ownloaded from

13
to 35.4 ± 10.2% of CD3+ lymphocytes and remained unaltered in the presence of either EPA or
DHA at any tested concentration (Fig. 4). Likewise, no changes in the corresponding MFI were
observed (Fig. 4).
Both EPA and DHA increase anti-inflammatory IL-10 in monocytes
IL-10 is known to have immunoregulatory and suppressive function on T cells and to be
important for the generation of regulatory T cells (Treg) (24). The spontaneous expression of IL-
10 in monocytes was low but detectable: 6.2 0.4% of the CD14+ cell population were
determined being IL-10 positive, while LPS activation of the cells did not alter this percentage
(5.8 0.1%, Fig. 5). However, the population of IL-10 positive monocytes significantly
increased in the presence of EPA (9.3 0.5%, P < 0.05 compared to the activated control) as
well as DHA (10.5 0.6%, P < 0.01).
Both EPA and DHA have no effect on TNF-α and IL-6 production in monocytes
We next measured the levels of TNF-α and IL-6, since these cytokines are the most important
produced by monocytes and macrophages. Their over-expression is implicated in several
inflammatory conditions, e.g., in the context of the acute phase response (25). Upon activation
by LPS, 71.8 7.5% of the CD14+ cell population were found to be TNF-α positive and 19.5
6.0% expressed IL-6 (Fig. 6). Since both EPA and DHA exerted a strong inhibition on the
expression of pro-inflammatory cytokines, such as TNF-α, in Th cells, it was surprising that the
percentages of TNF-α and IL-6 positive monocytes remained completely unaffected in the
presence of EPA and DHA at 100 µmol/L (or less, data not shown), respectively (Fig. 6).
Cellular incorporation of both EPA and DHA is negatively associated with arachidonic
acid
Since the strong reduction in TNF-α was clearly associated with the cellular incorporation of
EPA and DHA (Fig. 2 c), but only present in the T cell population, we took a closer look at
other than cytokine effects. We therefore determined the impact of EPA and DHA on the
by guest, on June 13, 2018w
ww
.jlr.orgD
ownloaded from
14
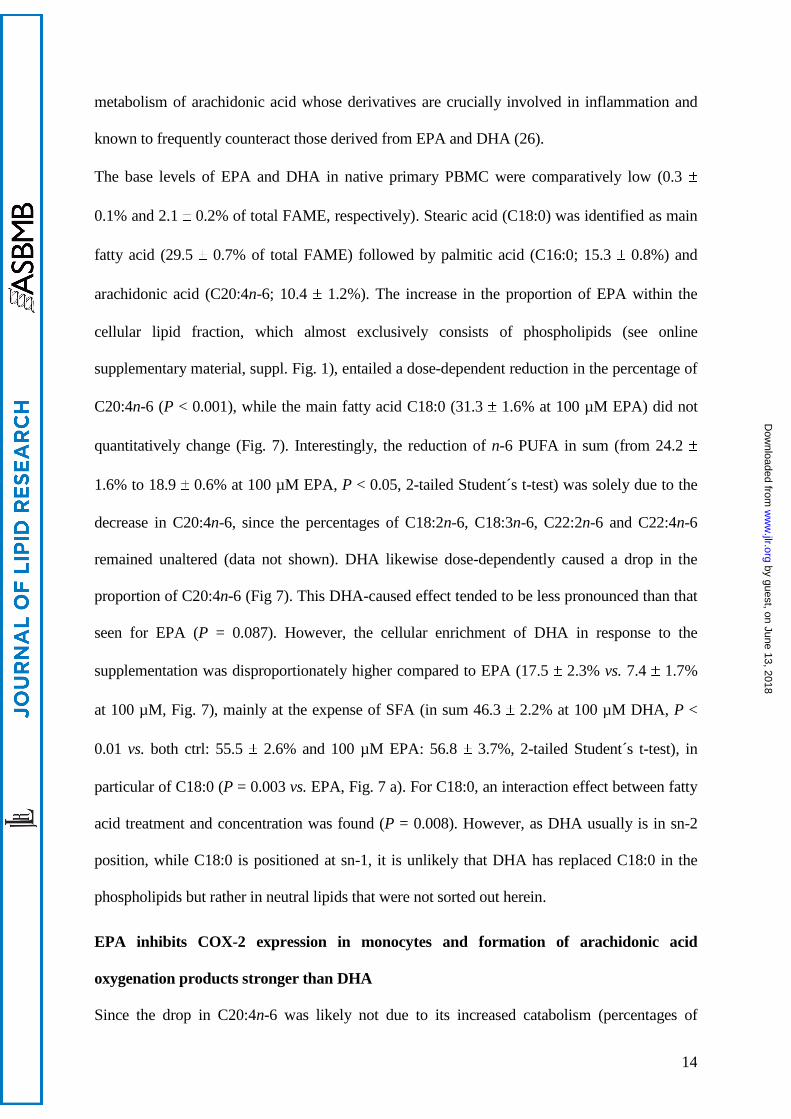
metabolism of arachidonic acid whose derivatives are crucially involved in inflammation and
known to frequently counteract those derived from EPA and DHA (26).
The base levels of EPA and DHA in native primary PBMC were comparatively low (0.3
0.1% and 2.1 0.2% of total FAME, respectively). Stearic acid (C18:0) was identified as main
fatty acid (29.5 0.7% of total FAME) followed by palmitic acid (C16:0; 15.3 0.8%) and
arachidonic acid (C20:4n-6; 10.4 1.2%). The increase in the proportion of EPA within the
cellular lipid fraction, which almost exclusively consists of phospholipids (see online
supplementary material, suppl. Fig. 1), entailed a dose-dependent reduction in the percentage of
C20:4n-6 (P < 0.001), while the main fatty acid C18:0 (31.3 1.6% at 100 µM EPA) did not
quantitatively change (Fig. 7). Interestingly, the reduction of n-6 PUFA in sum (from 24.2
1.6% to 18.9 0.6% at 100 µM EPA, P < 0.05, 2-tailed Student´s t-test) was solely due to the
decrease in C20:4n-6, since the percentages of C18:2n-6, C18:3n-6, C22:2n-6 and C22:4n-6
remained unaltered (data not shown). DHA likewise dose-dependently caused a drop in the
proportion of C20:4n-6 (Fig 7). This DHA-caused effect tended to be less pronounced than that
seen for EPA (P = 0.087). However, the cellular enrichment of DHA in response to the
supplementation was disproportionately higher compared to EPA (17.5 2.3% vs. 7.4 1.7%
at 100 µM, Fig. 7), mainly at the expense of SFA (in sum 46.3 2.2% at 100 µM DHA, P <
0.01 vs. both ctrl: 55.5 2.6% and 100 µM EPA: 56.8 3.7%, 2-tailed Student´s t-test), in
particular of C18:0 (P = 0.003 vs. EPA, Fig. 7 a). For C18:0, an interaction effect between fatty
acid treatment and concentration was found (P = 0.008). However, as DHA usually is in sn-2
position, while C18:0 is positioned at sn-1, it is unlikely that DHA has replaced C18:0 in the
phospholipids but rather in neutral lipids that were not sorted out herein.
EPA inhibits COX-2 expression in monocytes and formation of arachidonic acid
oxygenation products stronger than DHA
Since the drop in C20:4n-6 was likely not due to its increased catabolism (percentages of
by guest, on June 13, 2018w
ww
.jlr.orgD
ownloaded from

15
shorter chain n-6 fatty acids remained unaltered), we next examined whether an increased
metabolism, e.g. via cyclo- or lipoxygenation, took place.
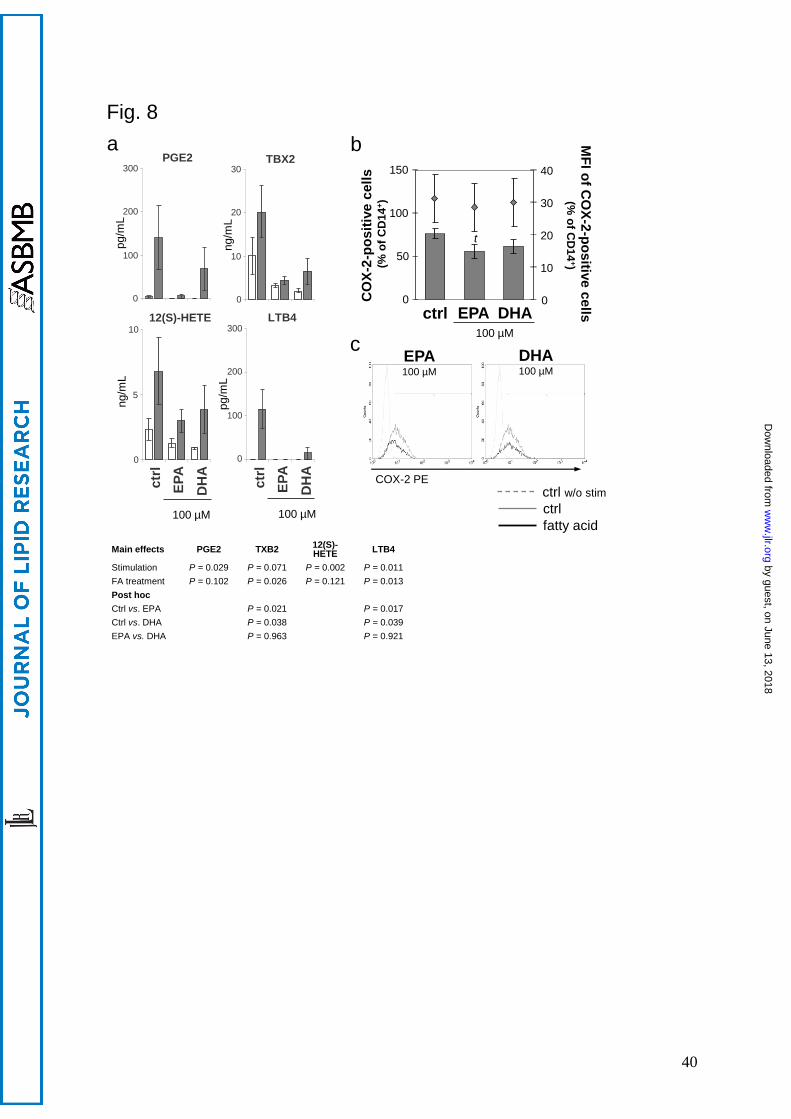
Upon stimulation, the formation of bioactive lipid mediators deriving from C20:4n-6 such as
PGE2, TXB2 (both metabolized by COX-2), LTB4 (generated via 5-LO pathway) and 12-
HETE (generated via 12-LO pathway), often causally involved in pathophysiological processes
(27), increased (Fig. 8 a). At 100 µM, EPA, clearer than DHA, prevented this increase
(significant for TXB2: P = 0.021 vs. ctrl, and LTB4: P = 0.017 vs. ctrl, Fig. 8 a). In accordance,
COX-2 abundance in stimulated monocytes decreased in the presence of EPA (Fig. 8 b, c).
However, this reduction was only by trend (P = 0.1, 2-tailed Student´s t-test).
Increase in both EPA- and DHA-derived lipid metabolite formation is independent of
stimulation
In contrast to the arachidonic acid derived cyclo- and lipoxygenation products, the
corresponding EPA products, namely TXB3 (COX-2) and LTB5 (5-LO), augmented
significantly (Fig. 9 a). Interestingly, the increase in EPA metabolite formation was independent
of stimulation. Thus, we supposed that the presence of EPA sufficed to activate the oxygenation
pathway. Indeed, here we show that COX-2 expression was induced by 100 µM EPA, but not
DHA, in monocytes, even in the absence of any stimulant (P = 0.012, Fig. 9 b).
COX-1 expression in monocytes was low (0.2-0.8% of CD14+) and unaffected by either fatty
acid treatment or stimulation (data not shown).
Moreover, we detected a variety of monohydroxy derivatives in the supernatants of
unstimulated and stimulated cultures after 24 h incubation with the fatty acids. Of the numerous
HEPE generated from EPA, 18-HEPE, which can be further metabolized to the inflammation
dampening resolvins of the E-series (28), was the predominant with 171.5 7.5 ng/mL (Fig. 9
c). Monohydroxy products from DHA were likewise abundantly detectable. Beside 4-, 20-, 17-,
8-, 7- and 11-HDHA (quantitatively in descending order; Fig. 9 d), also 10-, 13- and 16-HDHA
were found in relevant quantity (data not shown), accounting for a total HDHA amount of 936.2
by guest, on June 13, 2018w
ww
.jlr.orgD
ownloaded from

16
326.6 ng/mL. Moreover, DHA gave rise to Resolvin D1 (RvD1, Fig. 9 d), a lipoxygenated
trihydroxy position isomer with high anti-inflammatory potential (29). Likewise, alloreactive
stimulation of PBMC did not further increase hydroxy product formation (Fig. 9 c, d). Analysis
of the medium supplemented with EPA or DHA in increasing concentrations but without
PBMC revealed that HEPE as well as HDHA and subsequent RvD1 formation occurs non-
enzymatically (see online supplementary material, suppl. Fig. 2).
by guest, on June 13, 2018w
ww
.jlr.orgD
ownloaded from

17
DISCUSSION
Th cells and monocytes are intrinsically involved in adaptive and innate immune responses.
The present study aimed at distinctively elucidating the contribution of these two key
mediators of cellular immunity to the immunomodulatory effect of EPA and DHA. For this
purpose, we focussed on the early production of cytokines and lipid mediators, since these
strategies belong to the first being pursued in the acute state of defence.
Herein, we show that both EPA and DHA, but DHA to a lesser extent than EPA, dose-
dependently decreased the intracellular amounts of immunostimulatory cytokines in Th cells.
The extent of cytokine reduction was cytokine specific, affecting some (IL-2, TNF-α, IL-4),
but not others (IFNγ, Fig. 2). This finding corroborates previous reports on an EPA-mediated
strong suppression of IL-2, whereas other cytokines such as IFNγ remained unaltered (30).
Induction of IL-2 production in Th cells by alloreactive stimulation mimics the sophisticated
response to T cell receptor (TCR) engagement (31) and reflects the convergence of multiple
signal transduction pathways on at least four unrelated families of transcription factors, such
as nuclear factor of activated T cells (NFAT) and nuclear factor κB (NF-κB) (32). IL-2 itself
is stimulus for further cytokines. Its signals are transduced by heterodimerized IL-2 receptors
(IL-2R) via activation of phosphatidylinositol 3-kinase (PI 3-K)/AKT, Ras/mitogen activated
protein kinase (MAPK), and Janus kinase (JAK)/signal transducer and activator of
transcription (STAT) pathways (33), and finally result in a specific cellular response, e.g.,
augmented cytokine production, including TNF-α but likely not IFNγ (34). Therefore, the
reduction in TNF-α herein likely depends on the reduction in IL-2.
PPAR (NR1C3) is predominately expressed in Th cells (35) and the expression of its splice
variant 1 is therein inducible by agonist ligation (36). Since PPARγ activation by ligand
binding antagonizes the pro-inflammatory capability of several transcription factors such as
NF-κB, STATs (37, 38) and NFAT to control the expression of, e.g., IL-2 (39) and IL-4 (40)
by guest, on June 13, 2018w
ww
.jlr.orgD
ownloaded from
18
on one hand, and pre-treatment of the cultures with the selective PPARγ antagonist T0070907
(41) largely reverted the effect EPA and DHA on the other (Fig. 3), it is plausible that the
fatty acids acted at least in part through PPARγ. Moreover, our results are in line with
previous data on anti-inflammatory effects exerted by EPA and DHA via activation of PPARγ
(42). However, it has also been shown that n-3 LC-PUFA PPARγ-independently decrease
activation of NF-κB in immune competent cells (43).
A second mechanism underlying an altered T cell function is that n-3 LC-PUFA induce
biophysical and biochemical changes within the cell membrane affecting both detergent-
insoluble and non-raft membrane domains (44). For instance, the reorganization of these
domains results in displacement of signal proteins such as IL-2R and/or impairment of
relocalization of integrins such as lymphocyte function-associated antigen-1 (LFA-1).
Interference with the formation of the immunological synapse has substantial consequences
for Ca++
-dependent cytoskeletal rearrangement, transcriptional regulation and cytokine
secretion (45-49). Moreover, it has been shown that EPA and DHA inhibit PMA-induced
membrane recruitment of protein kinases C (PKC)-α and -ε, what downstream leads to a
decrease in nuclear translocation of NF-κB, resulting in an inhibition of IL-2 gene expression
and cell proliferation (50). Although EPA and DHA treatment herein caused significant
changes regarding the cellular fatty acid profiles (Fig. 7), we did not observe any fatty acid-
mediated effect on the surface expression of CD25, the ligand-specific α-chain of the IL-2R,
on activated T cells (unpublished findings). However, others showed a reduction in CD25
expression following DHA but not EPA treatment at 25 µM (51). In accordance to our
findings, Zeyda et al. (30) and Kew et al. (52) observed no significant effect of EPA or DHA
on the mitogen-induced expression of the early T cell activation marker CD69, when
expressed as percentage of CD69-positive cells (Fig. 4). In the latter study, however, confined
to the MFI, which is related to the number of CD69 molecules expressed per T cell, a DHA-
dependent inhibitory effect was shown, that we did not observe. Nevertheless, although the
by guest, on June 13, 2018w
ww
.jlr.orgD
ownloaded from

19
experimental design (mode of application, composition of supplemented fatty acids,
concentration of EPA and DHA) substantially differed between that and our study, the data
concerning the percentage of CD69+ T cells obtained following ConA stimulation are largely
comparable to one another.
Interestingly, with regard to cytokine production, also a cell-type specific fatty acid effect
existed, since neither EPA nor DHA reduced TNF-α or IL-6 (Fig. 6) and even stimulated the
expression of the immunoregulatory IL-10 (Fig. 5) in monocytes. The latter outcome might be
of substantial significance as it indicates that EPA and DHA not primarily act
immunosuppressive but rather promote resolution by selectively stimulating the production of
pro-resolving cytokines. For instance, IL-10 induces the expression of the suppressor of
cytokine signalling-3 (SOCS3) that inhibits JAKs by acting as a pseudo-substrate and appears
therefore to be responsible for the termination of IL-10 effects (rev. in 24). Moreover, IL-10
has been suggested to directly and indirectly interfere with the NF-κB pathway primarily
mediated by the activation of STAT3 (rev. in 31). However, why IL-10 induces anti-
inflammatory effects and other cytokines such as IL-6 that also signal through STAT3 do not,
remains elusive (31). It is conceivable, that EPA and DHA herein indirectly affect the
monocyte response by maintaining IFNγ in Th cells (Fig. 2): IFNγ-polarized monocytes have
been shown to preferably produce TNF-α and IL-6 in the presence of LPS (53). One group
reported a negative association between the LPS-stimulated production of TNF-α and IL-6 by
PBMC and n-3 PUFA intake which, however, appeared to be characterized by a ´U-shaped´
dose-response relationship with maximum inhibitory effects noted at comparably low doses
(54). This could be another explanation for the lacking effect of EPA and DHA herein on
TNF-α and IL-6 in primary monocytes at high doses, as generally used in vitro. However,
since EPA and DHA in the aforementioned study were orally given as capsuled formula and
no distinction has been made regarding different immune cell populations or subsets, the
limitation for data comparison resides again in the differences between the approaches. In
by guest, on June 13, 2018w
ww
.jlr.orgD
ownloaded from

20
general, available data on the effects of EPA or DHA exerted on monocyte cytokine
production are highly inconsistent. The majority of the studies have employed heterogeneous
blends of EPA and DHA, which preclude examination of the individual effects.
Monocytes not only contribute to the immune response via the secretion of cytokines but also
are a main population of immune cells with respect to COX-2 catalyzed eicosanoid formation.
A rapid increase in the expression of COX-2, classically inducible by LPS in monocytes, has
also been shown in T cells following PMA/ionomycin stimulation (55). The fact that EPA and
DHA were not very effective in reducing COX-2 expression in monocytes (Fig. 8 b, c) may in
some respect be considered positive as they were allowed to maintain their function to
suppress T cell immune responses and to govern the conversion of resting Th cells into such
with a suppressive phenotype (56). Interestingly, the presence of substrate, herein EPA,
sufficed to increase the percentage of COX-2 positive cells (Fig. 9 b), albeit to a much lesser
extent than upon the stimulation procedure. It has previously been shown that EPA induces
COX-2, even in the absence of any stimulant, and that this induction is PPARγ-mediated (57).
Moreover, we show that EPA and DHA gave rise to a bunch of monohydroxylated derivatives
(Fig. 9 c, d) that can be further metabolized to highly bioactive compounds. Polyhydroxylated
and conjugated di-, tri- or tetraene derivatives of EPA and DHA are subjects of a new concept
of resolution-phase mediators that elicit their anti-inflammatory and protective properties at
concentrations in the nano- and picomolar range. The mechanisms underlying the action of
such specialized pro-resolving mediators, collectively referred to as resolvins (resolution-
phase interaction products, Rv), protectins (PD), and, most recently, maresins (macrophage
mediators in resolving inflammation, MaR), are being systematically elucidated (58).
By means of gene array analyses, the body of data that contributes to the understanding on the
molecular mechanisms leading to the effect of EPA and DHA has grown rapidly. A
substantial number of genes have been revealed to be altered in human PBMC following
middle- to long-term ingestion of EPA+DHA, of which many are involved in inflammatory
by guest, on June 13, 2018w
ww
.jlr.orgD
ownloaded from
21
processes, including several NF-κB target genes, pro-inflammatory cytokines and genes
crucial for eicosanoid synthesis (59, 60). However, we can conclude from our data that it is
mandatory to distinguish between subpopulations of PBMC, since EPA and DHA differently
influenced Th cells and monocytes and did not generally affect immune responses in a
suppressive fashion. Moreover, our findings indicate that differences exist in the extent of the
fatty acid-mediated effects. The conclusion to be drawn from our data, however, cannot be
generally transferred to courses of inflammation, since the herein used model system does not
allow discriminating between acute and chronic states. This appears to be crucial since
available data show that, with respect to infections, n-3 LC-PUFA even improve host
response under chronic conditions (61).
Altogether, our data may contribute to the understanding on the regulatory action of EPA and
DHA in immune cells and therefore to the increasing knowledge in terms of fatty acid
assessment from an immunological point of view.
by guest, on June 13, 2018w
ww
.jlr.orgD
ownloaded from
22
Acknowledgments
This study was financially supported by a grant of the German Research Foundation (DFG Ja
893/5). The contents are solely the responsibility of the authors and do not necessarily
represent the official view of the granting institution. AJ and MG designed research. CN did
the experimental work with substantial contributions from MG, MR and AJ. AL contributed
to the fatty acid analysis. AJ drafted the manuscript. AR performed statistical analysis. DB
kindly provided the buffy coats and HG and BW the technical support. MG, BW and GJ
jointly supervised this work. We thank Lars Uhlmann, Gisela Schultheiss, Susanne Merkel
and Marina Giorgi from the Department of Physiology and Biochemistry of Nutrition, Federal
Research Institute of Nutrition and Food, Karlsruhe, Germany, for their excellent technical
assistance.
The authors declare no conflict of interest. by guest, on June 13, 2018w
ww
.jlr.orgD
ownloaded from
23
REFERENCES
1. Calder P. C. 2006. N-3 polyunsaturated fatty acids, inflammation, and inflammatory
diseases. Am. J. Clin. Nutr. 83: 1505S-19S.
2. Wang C., W. S. Harris, M. Chung, A. H. Lichtenstein, E. M. Balk, B. Kupelnick, H. S.
Jordan, J. Lau. 2006. N-3 fatty acids from fish or fish-oil supplements, but not alpha-
linolenic acid, benefit cardiovascular disease outcomes in primary- and secondary-
prevention studies: a systematic review. Am. J. Clin. Nutr. 84: 5-17.
3. León H., M. C. Shibata, S. Sivakumaran, M. Dorgan, T. Chatterley, R. T. Tsuyuki. 2008.
Effect of fish oil on arrhythmias and mortality: systematic review. BMJ. 227: a2931.
4. Nagakura T., S. Matsuda, K. Shichijyo, H. Sugimoto, K. Hata. 2000. Dietary
supplementation with fish oil rich in omega-3 polyunsaturated fatty acids in children
with bronchial asthma. Eur. Respir. J. 16: 861-5.
5. Mickleborough T. D., M. R. Lindley, A. A. Ionescu, A. D. Fly. 2006. Protective effect of
fish oil supplementation on exercise-induced bronchoconstriction in asthma. Chest.
129: 39-49.
6. Balbás G. M., M. S. Regaña, P. U. Millet. 2011. Study on the use of omega-3 fatty acids as
a therapeutic supplement in treatment of psoriasis. Clin. Cosmet. Investig. Dermatol.
4: 73-7.
7. Caughey G. E., M. J. James, S. M. Proudman, L. G. Cleland. 2010. Fish oil
supplementation increases the cyclooxygenase inhibitory activity of paracetamol in
rheumatoid arthritis patients. Complement. Ther. Med. 18: 171-4.
8. Calder P. C. 2008. Polyunsaturated fatty acids, inflammatory processes and inflammatory
bowel disease. Mol. Nutr. Food Res. 52: 885-97.
9. Thienprasert A., S. Samuhaseneetoo, K. Popplestone, A. L. West, E. A. Miles, P. C.
Calder. 2009. Fish oil n-3 polyunsaturated fatty acids selectively affect plasma
by guest, on June 13, 2018w
ww
.jlr.orgD
ownloaded from
24
cytokines and decrease illness in Thai schoolchildren: a randomized, double-blind,
placebo-controlled intervention trial. J. Pediatr. 154: 391-5.
10. Byleveld P. M., G. T. Pang, R. L. Clancy, D. C. Roberts. 1999. Fish oil feeding delays
influenza virus clearance and impairs production of interferon-gamma and virus-
specific immunoglobulin A in the lungs of mice. J. Nutr. 129: 328-35.
11. Auvin S., F. Collet, F. Gottrand, M. O. Husson, X. Leroy, C. Beermann, B. P. Guery.
2005. Long-chain polyunsaturated fatty acids modulate lung inflammatory response
induced by Pseudomonas aeruginosa in mice. Pediatr. Res. 58: 211-5.
12. McFarland C. T., Y. Y. Fan, R. S. Chapkin, B. R. Weeks, D. N. McMurray. 2008. Dietary
polyunsaturated fatty acids modulate resistance to Mycobacterium tuberculosis in
guinea pigs. J. Nutr. 138: 2123-8.
13. Schwerbrock N. M., E. A. Karlsson, Q. Shi, P. A. Sheridan, M. A. Beck. 2009. Fish oil-
fed mice have impaired resistance to influenza infection. J. Nutr. 139: 1588-94.
14. Woodworth H. L., S. J. McCaskey, D. M. Duriancik, J. F. Clinthome, I. M. Langohr, E.
M. Gardner, J. I. Fenton. 2010. Dietary fish oil alters T lymphocyte cell populations
and exacerbates disease in a mouse model of inflammatory colitis. Cancer Res. 70:
7960-9.
15. Anderson M., K. L. Fritsche. (n-3) fatty acids and infectious disease resistance. 2002. J.
Nutr. 132: 3566-76.
16. Hooper L., R. L. Thompson, R. A. Harrison, C. D. Summerbell, A. R. Ness, H. J. Moore,
H. V. Worthington, P. N. Durrington, J. P. Higgins, N. E. Capps, R. A. Riemersma, S.
B. Ebrahim, G. Davey Smith. Risks and benefits of omega 3 fats for mortality,
cardiovascular disease, and cancer: systematic review. 2006. BMJ. 332: 752-60.
17. BfR Opinion No. 030/2009:
http://www.bfr.bund.de/cm/349/bfr_recommends_the_setting_of_maximum_levels_fo
r_the_fortification_of_foods_with_omega_3_fatty_acids.pdf
by guest, on June 13, 2018w
ww
.jlr.orgD
ownloaded from

25
18. Sijben J. W., P. C. Calder. 2007. Differential immunomodulation with long-chain n-3
PUFA in health and chronic disease. Proc. Nutr. Soc. 66: 237-59.
19. Bligh E. G., W. J. Dyer. 1959. A rapid method of total lipid extraction and purification.
Can. J. Biochem. Physiol. 37: 911-7.
20. Jaudszus A., P. Möckel, E. Hamelmann, G. Jahreis. 2010. Trans-10,cis-12-CLA-caused
lipodystrophy is associated with profound changes of fatty acid profiles of liver, white
adipose tissue and erythrocytes in mice: possible link to tissue-specific alterations of
fatty acid desaturation. Ann. Nutr. Metab. 57: 103-11.
21. Gomolka B., Siegert E., Blossey K., Schunck W. H., Rothe M., Weylandt K. H. 2011.
Analysis of omega-3 and omega-6 fatty acid-derived lipid metabolite formation in
human and mouse blood samples. Prostaglandins Other Lipid Mediat. 94: 81-7.
22. Mascher B., P. Schlenke, M. Seyfarth. 1999. Expression and kinetics of cytokines
determined by intracellular staining using flow cytometry. J. Immunol. Methods. 223:
115-21.
23. Mosmann T. R., R. L. Coffman. 1989. Th1 and Th2 cells: Different patterns of
lymphokine secretion lead to different functional properties. Annu. Rev. Immunol. 7:
145-73.
24. Sabat R., G. Grütz, K. Warszawska, S. Kirsch, E. Witte, K. Wolk, J. Geginat. 2010.
Biology of interleukin-10. Cytokine Growth Factor Rev. 21: 331-44.
25. Haimovich B., J. Calvano, A. D. Haimovich, S. E. Calvano, S. M. Coyle, S. F. Lowry.
2010. In vivo endotoxin synchronizes and suppresses clock gene expression in human
peripheral blood leukocytes. Crit. Care Med. 38: 751-8.
26. Calder P. C. Polyunsaturated fatty acids, inflammation and immunity. 2010. Lipids. 36:
1007-24.
27. Samuelsson B. 1991. Arachidonic acid metabolism: role in inflammation. Z. Rheumatol.
50: 3-6.
by guest, on June 13, 2018w
ww
.jlr.orgD
ownloaded from

26
28. Isobe Y., M. Arita, S. Matsueda, R. Iwamoto, T. Fujihara, H. Nakanishi, R. Taguchi, K.
Masuda, K. Sasaki, D. Urabe, M. Inoue, H. Arai. 2012. Identification and structure
determination of novel anti-inflammatory mediator resolvin E3, 17,18-
dihydroxyeicosapentaenoic acid. J. Biol. Chem. 287: 10525-34.
29. Serhan C. N , N. A. Petasis. 2011. Resolvins and protectins in inflammation resolution.
Chem. Rev. 111: 5922-43.
30. Zeyda M., A. B. Szekeres, M. D. Säemann, R. Geyeregger, H. Stockinger, G. J. Zlabinger,
W. Waldhäusl, T. M. Stulnig. 2003. Suppression of T cell signaling by
polyunsaturated fatty acids: selectivity in inhibition of mitogen-activated protein
kinase and nuclear factor activation. J. Immunol. 170: 6033-9.
31. Akdis M., S. Burgler, R. Crameri, T. Eiwegger, H. Fujita, E. Gomez, S. Klunker, N.
Meyer, L. O´Mahony, O. Palomares, C. Rhyner, N. Quaked, A. Schaffartzik, W. Van
De Veen, S. Zeller, M. Zimmermann, C. A. Akdis. 2011. Interleukins, from 1 to 37,
and interferon-γ: Receptors, functions, and roles in diseases. J. Allergy Clin. Immunol.
127: 701-21.
32. Jain J., C. Loh, A. Rao. 1995. Transcriptional regulation of the IL-2 gene. Curr. Opin.
Immunol. 7: 333-42.
33. Liao W., J. X. Lin, W. J. Leonard. 2011. IL-2 family cytokines: new insights into the
complex roles of IL-2 as a broad regulator of T helper cell differentiation. Curr. Opin.
Immunol. 23: 598-604.
34. Reddy J., P. Chastagner, L. Fiette, X. Liu, J. Thèze. 2001. IL-2-induced tumor necrosis
factor (TNF)-beta expression: further analysis in the IL-2 knockout model, and
comparison with TNF-alpha, lymphotoxin-beta, TNFR1 and TNFR2 modulation. Int.
Immunol. 13: 135-47.
by guest, on June 13, 2018w
ww
.jlr.orgD
ownloaded from

27
35. Clark R., D. Bishop-Bailey, T. Estrada-Hernandez, T. Hla, L. Puddington, S. Padula.
2000. The nuclear receptor PPAR gamma and immunoregulation: PPAR gamma
mediates inhibition of helper T cell responses. J. Immunol. 164: 1364-71.
36. Norazmi M. N., R. Mohamed, A. A. Nurul, N. S. Yaacob. 2012. The modulation of
PPARγ1 and PPARγ2 mRNA expression by ciglitazone in CD3/CD28-activated naïve
and memory CD4+ T cells. Clin. Dev. Immunol. 2012: 849195.
37. Delerive P., J. C. Fruchart, B. Staels. 2001. Peroxisome proliferator-activated receptors in
inflammation control. J. Endocrinol. 169: 453-9.
38. Wang P., P. O. Anderson, S. Chen, K. M. Paulsson, H. O. Sjogren, S. Li. 2001. Inhibition
of the transcription factors AP-1 and NF-kappaB in CD4 T cells by peroxisome
proliferator-activated receptor gamma ligands. Int. Immunopharmacol. 1: 803-12.
39. Yang X. Y., L. H. Wang, T. Chen, D. R. Hodge, J. H. Resau, L. DaSilva, W. L. Farrar.
2000. Activation of human T lymphocytes is inhibited by peroxisome proliferator-
activated receptor gamma (PPARgamma) agonists. PPARgamma co-association with
transcription factor NFAT. J. Biol. Chem. 275: 4541-4.
40. Chung S. W., B. Y. Kang, T. S. Kim. 2003. Inhibition of interleukin-4 production in
CD4+ T cells by peroxisome proliferator-activated receptor-gamma (PPAR-gamma)
ligands: involvement of physical association of between PPAR-gamma and the nuclear
factor of activated T cells transcription factor. Mol. Pharmacol. 64: 1169-79.
41. Lee G., F. Elwood, J. McNally, J. Weiszmann, M. Lindstrom, K. Amaral, M. Nakamura,
S. Miao, P. Cao, R. M. Learned, J. L. Chen, Y. Li. 2002. T0070907, a selective ligand
for peroxisome proliferator-activated receptor gamma, functions as an antagonist of
biochemical and cellular activities. J. Biol. Chem. 277: 19649-57.
42. Li H., X. Z. Ruan, S. H. Powis, R. Fernando, W. Y. Mon, D. C. Wheeler, J. F. Moorhead, Z.
Varghese. 2005. EPA and DHA reduce LPS-induced inflammation responses in HK-2
cells: evidence for a PPAR-gamma-dependent mechanism. Kidney Int. 67: 867-74.
by guest, on June 13, 2018w
ww
.jlr.orgD
ownloaded from

28
43. Draper E., C. M. Reynolds, M. Canavan, K. H. Mills, C. E. Loscher, H. M. Roche. 2011.
Omega-3 fatty acids attenuate dendritic cell function via NF-κB independent of
PPARγ. J. Nutr. Biochem. 22: 784-90.
44. Shaik S. A. 2010. Diet-induced docosahexaenoic acid non-raft domains and lymphocyte
function. Prostaglandins Leukotr. Essent. Fatty Acids. 82: 159-64.
45. Li Q., M. Wang, L. Tan, C. Wang, J. Ma, N. Li, Y. Li, G. Xu, J. Li. 2005.
Docosahexaenoic acid changes lipid composition and interleukin-2 receptor signaling
in membrane rafts. J. Lipid Res. 49: 1904-13.
46. Geyeregger R., M. Zeyda, G. J. Zlabinger, W. Waldhäusl, T. M. Stulnig. 2005.
Polyunsaturated fatty acids interfere with formation of the immunological synapse. J.
Leukoc. Biol. 77: 680-8.
47. Li Q., L. Tan, C. Wang, N. Li, Y. Li, G. Xu, J. Li. 2006. Polyunsaturated
eicosapentaenoic acid changes lipid composition in lipid rafts. Eur. J. Nutr. 45: 144-
51.
48. Yog R., R. Barhoumi, D. N. McMurray, R. S. Chapkin. 2010. N-3 polyunsaturated fatty
acids suppress mitochondrial translocation of the immunological synapse and
modulate calcium signaling in T cells. J. Immunol. 184: 5864-73.
49. Shaik S. A., C. A. Jolly, R. S. Chapkin. 2012. N-3 polyunsaturated fatty acids exert
immunomodulatory effects on lymphocytes by targeting plasma membrane molecular
organization. Mol. Aspects Med. 33: 46-54.
50. Denys A., A. Hichami, N. A. Khan. 2005. N-3 PUFAs modulate T-cell activation via
protein kinase C-alpha and -epsilon and the NF-kappaB signaling pathway. J. Lipid Res.
46: 752-8.
51. Gorjão R., S. M. Hirabara, T. M. de Lima, M. F. Cury-Boaventura, R. Curi. 2007.
Regulation of interleukin-2 signaling by fatty acids in human lymphocytes. J. Lipid
Res. 48: 2009-19.
by guest, on June 13, 2018w
ww
.jlr.orgD
ownloaded from

29
52. Kew S., M. D. Mesa, S. Tricon, R. Buckley, A. M. Minihane, P. Yaqoob. 2004. Effects of
oils rich in eicosapentaenoic and docosahexaenoic acids on immune cell composition
and function in healthy humans. Am. J. Clin. Nutr. 79: 674-81.
53. Ambarus C. A., K. C. Santegoets, L. van Bon, M. H. Wenink, P. P. Tak, T. R. Radstake,
T. L. Baeten. 2012. Soluble immune complexes shift the TLR-induced cytokine
production of distinct polarized human macrophage subsets towards IL-10. PLoS
ONE. 7: e35994.
54. Trebble T., N. K. Arden, M. A. Strout, S. A. Wootton, G. C. Burdge, E. A. Miles, A. B.
Ballinger, R. L. Thompson, P. C. Calder. 2003. Inhibition of tumour necrosis factor-
alpha and interleukin 8 production by mononuclear cells following dietary fish-oil
supplementation in healthy men and response to antioxidant co-supplementation. Br. J.
Nutr. 90: 405-12.
55. Lee J. Y., A. Y. Choi, Y. T. Oh, W. Choe, E. J. Yeo, J. Ha, I. Kang. 2012. AMP-activated
protein kinase mediates T cell activation-induced expression of FasL and COX-2 via
protein kinase C theta-dependent pathway in human Jurkat T leukemia cells. Cell
signal. 24: 1195-207.
56. Bryn T., S. Yaqub, M. Mahic, K. Henjum, E. M. Aandahl, E. Taskén. 2008. LPS-activated
monocytes suppress T-cell immune responses and induce FOXP3+ T cells through a
COX-2-PGE2-dependent mechanism. Int. Immunol. 20: 235-45.
57. Chêne G., M. Dubourdeau, P. Balard, L. Escoubet-Lozach, C. Orphila, A. Berry, J.
Bernad, M. F. Aries, M. Charveron, B. Pipy. 2007. n-3 and n-6 polyunsaturated fatty
acids induce the expression of COX-2 via PPARgamma activation in human
keratinocyte HaCaT cells. Biochim. Biophys. Acta. 1771: 576-89.
58. Bannenberg G., C. N. Serhan. 2010. Specialized pro-resolving lipid mediators in the
inflammatory response: An update. Biochim. Biophys. Acta. 1801: 1260-73.
by guest, on June 13, 2018w
ww
.jlr.orgD
ownloaded from

30
59. Bouwens M., O. van de Rest, N. Dellschaft, M. G. Bromhaar, L. C. de Groot, J. M.
Geleijnse, M. Müller, L. A. Afman. 2009. Fish oil supplementation induces
antiinflammatory gene expression profiles in human blood mononuclear cells. Am. J.
Clin. Nutr. 90: 415-24.
60. Vedin I., T. Cederholm, Y. Freund-Levi, H. Basun, A. Garlind, G. F. Irving, M.
Eriksdotter-Jönhagen, L. O. Wahlund, I. Dahlmann, J. Palmblad. 2012. Effects of
DHA-rich n-3 fatty acid supplementation on gene expression in blood mononuclear
leukocytes: the OmegAD study. PLoS ONE. 7: e35425.
61. Pierre M., M. O. Husson, R. Le Berre, J. L. Desseyn, C. Galabert, L. Béghin, C.
Beermann, A. Dagenais, Y. Berthiaume, B. Cardinaud, P. Barbry, F. Gottrand, B. P.
Guery. 2007. Omega-3 polyunsaturated fatty acids improve host response in chronic
Pseudomonas aeruginosa lung infection in mice. Am. J. Physiol. Lung Cell. Mol.
Physiol. 292: L1422-31.
by guest, on June 13, 2018w
ww
.jlr.orgD
ownloaded from

31
FIGURE LEGENDS
Fig. 1. EPA and DHA do not affect cell viability. Cell viability was flow-cytometrically
assessed by annexin-V and propidium iodide exclusion double staining. a. Forward scatter
(FS) against side scatter (SS) dot plot of human PBMC after alloreactive stimulation. Data
acquisition was set to lymphocytes (L) and monocytes (M) within the scatter gate R1 of
50,000 total counts. b. Representative histograms of fluorescence intensities of PBMC treated
without or with 100 µM fatty acid for 24 h. Relative to the control (ctrl), annexin-V positive
and PI negative cells were defined as early apoptotic cells; annexin-V positive and PI positive
cells were defined as late apoptotic and necrotic cells.
Fig. 2. Effect of EPA and DHA on cytokine production of Th cells (CD3+CD4
+). a. PBMC
from buffy coats were incubated without or with increasing concentrations of EPA or DHA
for 19 h and activated by PMA and ionomycin for subsequent 5 h. Th cells were identified by
staining for CD3 and CD4. Expression of IL-2, TNF-α, IL-4 and IFN- was analyzed by
means of flow cytometry. Right scales denote mean fluorescence intensity (MFI) depicted as
dots. b. Representative dot plots of lymphocytes stained for CD3, CD4 and TNF-α. c. Levels
of IL-2 (left) and TNF-α (right) are negatively associated with cellular incorporation of EPA
and DHA as determined by gas chromatographic analysis. Non-linear curve-fitting was
performed and P values were calculated with regression analysis.
Fig. 3. Pre-treatment with T0070907 reverses the inhibitory effect of EPA and DHA on
cytokine production of Th cells (CD3+CD4
+). PBMC were pre-treated for 30 min with 0.4
or 2 µM T0070907 before 100 µM fatty acids were added. After 19 h, cells were activated for
subsequent 5 h. Cytokine expression of CD4+ T cells was flow-cytometrically analyzed. ***P
by guest, on June 13, 2018w
ww
.jlr.orgD
ownloaded from

32
< 0.001: main effect of T0070907 with no significant difference determined between EPA and
DHA; n = 4.
Fig. 4. EPA and DHA do not affect CD69 expression on activated T cells. PBMC were
incubated for 19 h without or with increasing concentrations of EPA or DHA before
stimulation with ConA for subsequent 5 h. Cells were then stained for CD3 and CD69.
Expression of cell surface markers was flow-cytometrically analysed. Data are expressed as
means SD of n = 3. Right scales denote mean fluorescence intensity (MFI) depicted as dots.
Fig. 5. EPA and DHA increase IL-10 production in monocytes. Intracellular levels of IL-
10 were flow-cytometrically analyzed in LPS-stimulated compared to unstimulated
monocytes. a. Data are expressed as means SEM, a vs. b: P < 0.05, 2-tailed Student´s t test.
b. Representative histograms of monocytes stained for CD14 and IL-10. Marker was set in
reference to the isotype control.
Fig. 6. EPA and DHA have no effects on TNF-α and IL-6 production in monocytes.
Intracellular levels of TNF-α and IL-6 were flow-cytometrically analyzed in LPS-stimulated
monocytes. a. Data are expressed as means SEM. b. Representative histograms of
monocytes stained for CD14 and TNF- α, w/o stim – without stimulant. Marker was set in
reference to the isotype control.
Fig. 7. Cellular incorporation of EPA and DHA dose-dependently decreases arachidonic
acid (C20:4n-6). Total lipids were extracted from PBMC after 24 h incubation with
increasing concentrations of EPA or DHA and fatty acid profiles were determined by gas
chromatographic analysis. a. Data are expressed as means SEM relating to 100% detectable
by guest, on June 13, 2018w
ww
.jlr.orgD
ownloaded from
33
fatty acids (as FAME). b. Partial GC chromatograms of PBMC treated either with EPA
(upper chart) or DHA (lower chart) in increasing concentrations. N.d. – not detected.
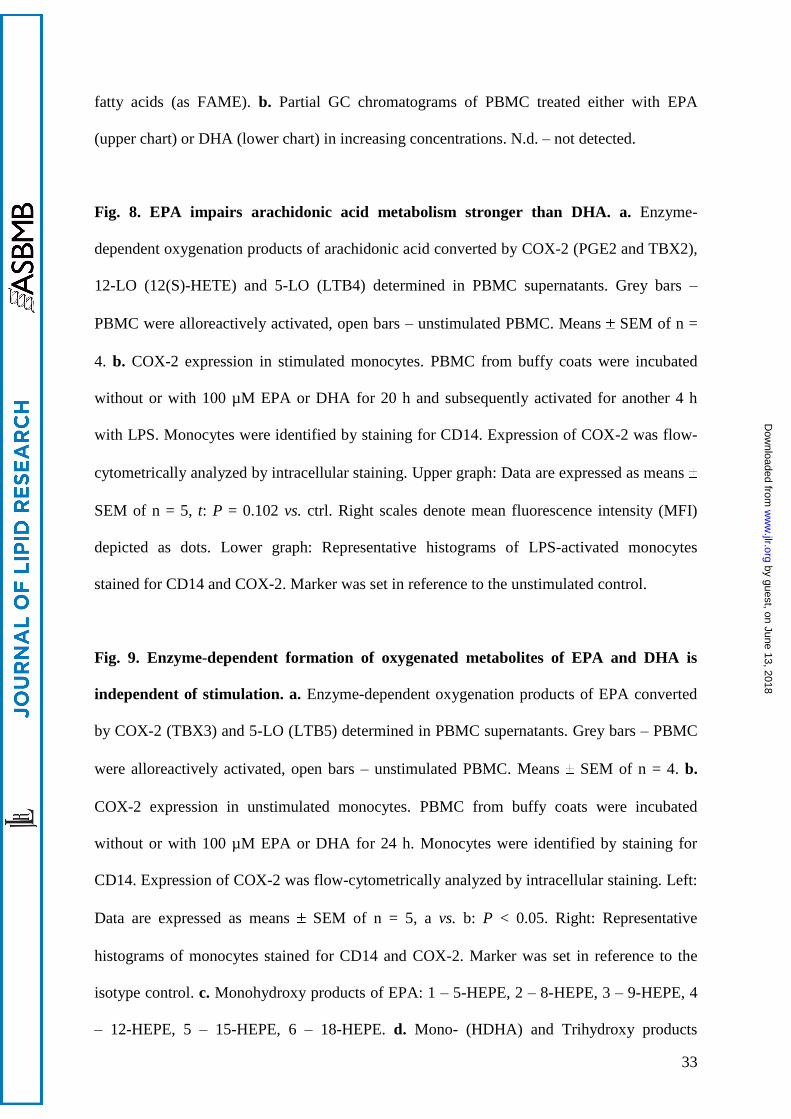
Fig. 8. EPA impairs arachidonic acid metabolism stronger than DHA. a. Enzyme-
dependent oxygenation products of arachidonic acid converted by COX-2 (PGE2 and TBX2),
12-LO (12(S)-HETE) and 5-LO (LTB4) determined in PBMC supernatants. Grey bars –
PBMC were alloreactively activated, open bars – unstimulated PBMC. Means SEM of n =
4. b. COX-2 expression in stimulated monocytes. PBMC from buffy coats were incubated
without or with 100 µM EPA or DHA for 20 h and subsequently activated for another 4 h
with LPS. Monocytes were identified by staining for CD14. Expression of COX-2 was flow-
cytometrically analyzed by intracellular staining. Upper graph: Data are expressed as means
SEM of n = 5, t: P = 0.102 vs. ctrl. Right scales denote mean fluorescence intensity (MFI)
depicted as dots. Lower graph: Representative histograms of LPS-activated monocytes
stained for CD14 and COX-2. Marker was set in reference to the unstimulated control.
Fig. 9. Enzyme-dependent formation of oxygenated metabolites of EPA and DHA is
independent of stimulation. a. Enzyme-dependent oxygenation products of EPA converted
by COX-2 (TBX3) and 5-LO (LTB5) determined in PBMC supernatants. Grey bars – PBMC
were alloreactively activated, open bars – unstimulated PBMC. Means SEM of n = 4. b.
COX-2 expression in unstimulated monocytes. PBMC from buffy coats were incubated
without or with 100 µM EPA or DHA for 24 h. Monocytes were identified by staining for
CD14. Expression of COX-2 was flow-cytometrically analyzed by intracellular staining. Left:
Data are expressed as means SEM of n = 5, a vs. b: P < 0.05. Right: Representative
histograms of monocytes stained for CD14 and COX-2. Marker was set in reference to the
isotype control. c. Monohydroxy products of EPA: 1 – 5-HEPE, 2 – 8-HEPE, 3 – 9-HEPE, 4
– 12-HEPE, 5 – 15-HEPE, 6 – 18-HEPE. d. Mono- (HDHA) and Trihydroxy products
by guest, on June 13, 2018w
ww
.jlr.orgD
ownloaded from

34
(Resolvin D1 - RvD1) of DHA: 7 – 4-HDHA, 8 – 7-HDHA, 9 – 8-HDHA, 10 – 11-HDHA,
11 – 14-HDHA, 12 – 17-HDHA, 13 – 20-HDHA. Means SEM of n = 4.
by guest, on June 13, 2018w
ww
.jlr.orgD
ownloaded from

35
a b
Propidium iodide
ctrl EPA DHA100 µM 100 µM
Annexin-V
M
L
R1
10 0 10 1 10 2 10 3 10 4
064
Eve
nts
M1
10 0 10 1 10 2 10 3 10 4
064
Eve
nts
M1
10 0 10 1 10 2 10 3 10 4
064
Eve
nts
M1
10 0 10 1 10 2 10 3 10 4
064
Eve
nts
M1
10 0 10 1 10 2 10 3 10 4
064
Eve
nts
M1
10 0 10 1 10 2 10 3 10 4
064
Eve
nts
M1
Fig. 1
a
25 50 100 25 50 100
EPA DHA[µM]
ctrl 25 50 100 25 50 100
EPA DHA[µM]
ctrl0
10
20
30
40
50
0
60
120
180
TNF-α
0
10
20
30
40
0
50
100
150
200
IL-2
Cyto
kin
e p
osit
ive
CD
4+
T c
ell
s(%
of
CD
3+)
MF
I of c
yto
kin
e p
ositiv
e C
D4
+T
ce
lls(%
of C
D3
+)
IFN-
0
5
10
15
0
20
40
60
80
0
50
100
IL-4
0
1.5
3
Main effects IL-2 TNF- IL-4 IFN-
Concentration P < 0.001 P < 0.001 P = 0.002 P = 0.695
FA treatment P = 0.005 P = 0.032 P = 0.087 P = 0.514
Interaction
Conc × treat P = 0.250 P = 0.397 P = 0.265 P = 0.713
Fig. 2
by guest, on June 13, 2018w
ww
.jlr.orgD
ownloaded from

36
34.2% 43.3%
8.9% 13.6%
32.4% 27.4%
11.8% 28.4%
37.4% 55.4%
4.5% 2.7%
39.1% 55.5%
3.3% 2.1%
33.5% 38.3%
9.7% 18.4%
34.7% 44.3%
8.9% 12.1%
36.5% 51.7%
6.9% 4.9%
CD4 FITC
TN
F-α
PE
ctrlEPA
25 µM 50 µM 100 µM
25 µM 50 µM 100 µM
DHA
CD4 FITC
TN
F-α
PE
b
Fig. 2
Cyto
kin
e p
osit
ive
CD
4+
T c
ell
s (
% o
f C
D3
+)
IL-2 TNF-α
1
10
100
0 5 10 15 20 25
r2 = 0.687
P < 0.001
1
10
100
0 5 10 15 201
10
100
0 5 10 15 20
1
10
100
0 5 10 15 20 25
c
r2 = 0.711
P < 0.001
r2 = 0.501
P < 0.01
r2 = 0.452
P < 0.01
Fig. 2
EPA (% of total FAME)
DHA (% of total FAME)
IL-2 TNF-α
by guest, on June 13, 2018w
ww
.jlr.orgD
ownloaded from
37
0
2
4
6
8
10
12
14
0
2
4
6
8
10
12
14
16TNF-α
Cyto
kin
e p
os
itiv
e C
D4
+ T
ce
lls
(%
of
CD
3+)
EPA 100 µM
DHA 100 µM
0 0.4 2 0 0.4 2
T0070907[µM]
******
IL-2
Fig. 3
25 50 100 25 50 100
EPA DHA[µM]
ctrl0
100
200
300
400
500
600
0
20
40
60
80
100
MF
I of
CD
69
po
sitiv
eT
ce
lls(%
of
CD
3+)
CD
69
po
sit
ive
T c
ell
s(%
of
CD
3+)
Fig. 4
by guest, on June 13, 2018w
ww
.jlr.orgD
ownloaded from

38
10 0 10 1 10 2 10 3 10 4
064
Events
M1
10 0 10 1 10 2 10 3 10 4
064
Events
M1
10 0 10 1 10 2 10 3 10 4
064
Events
M1
10 0 10 1 10 2 10 3 10 4
0E
vents
M1
64
IL-10 PE
ctrlw/o stim
ctrl EPA DHA100 µM 100 µM
0
4
8
12
IL-1
0-p
os
itiv
e c
ell
s
(% o
f C
D14
+)
ctrlw/o stim
ctrl EPA DHA100 µM
baa
a
bb
6.4% 5.8% 9.6% 10.9%
Fig. 5
100 101 102 103 104
TNF-α PE
032
Events
M1
100 101 102 103 104
032
Events
M1
100 101 102 103 104
032
Events
M1
100 101 102 103 104
032
Events
M1
ctrlw/o stim
ctrl EPA DHA
b
0
20
40
60
80
100
Cyto
kin
e-p
osit
ive
ce
lls
(%
of
CD
14
+)
IL-6
TNF-α
ctrl EPA DHA100 µM
a
100 µM 100 µM
0.9% 65.2% 60.9% 72.1%
Fig. 6
ctrl 25 50 100
EPA [µM]
ctrl 25 50 100
DHA [µM]
C22:6n-3
C20:5n-3
C16:0
C20:4n-6
C18:0
Main effects C16:0 C18:0 C20:4n-6 C20:5n-3 C22:6n-3
Concentration P = 0.034 P = 0.067 P < 0.001 P < 0.001 P < 0.001
FA treatment P = 0.099 P = 0.003 P = 0.087 P = 0.001 P < 0.001
Interaction
Conc × treat P = 0.631 P = 0.008 P = 0.760 P < 0.001 P < 0.001
0
5
10
15
20
25
30
35
% o
fto
tal F
AM
E
a
Fig. 7
by guest, on June 13, 2018w
ww
.jlr.orgD
ownloaded from

39
b
32.5 35.0 37.5 40.0 42.5 min
0.0
1.0
2.0
3.0
4.0
uV(x10,000)
ChromatogramC20:4n-6
C21:0C20:3n-6
C20:5n-3
EPA
n.d.
C22:2n-6C22:5n-6
C22:5n-3
n.d.
C22:6n-3
ctrl
25 µM
50 µM
100 µM
C22:4n-6
min
0.0
1.0
2.0
3.0
4.0
uV(x10,000)
n.d.
C20:5n-3
C22:6n-3
DHAC22:5n-3
ChromatogramC20:4n-6
C21:0C20:3n-6C22:2n-6
C22:5n-6n.d.
32.5 35.0 37.5 40.0 42.5
ctrl
25 µM
50 µM
100 µM
C22:4n-6
Fig. 7
by guest, on June 13, 2018w
ww
.jlr.orgD
ownloaded from
40
TBX2
0
10
20
30
PGE2
0
100
200
300
12(S)-HETE
0
5
10
ctr
l
EP
A
DH
A
LTB4
pg/m
L
ng/m
L
ng/m
L
0
100
200
300
pg/m
L
ctr
l
EP
A
DH
A
100 µM 100 µM
a b
Main effects PGE2 TXB212(S)-HETE
LTB4
Stimulation P = 0.029 P = 0.071 P = 0.002 P = 0.011
FA treatment P = 0.102 P = 0.026 P = 0.121 P = 0.013
Post hoc
Ctrl vs. EPA P = 0.021 P = 0.017
Ctrl vs. DHA P = 0.038 P = 0.039
EPA vs. DHA P = 0.963 P = 0.921
CO
X-2
-po
sit
ive
ce
lls
(% o
f C
D14
+)
ctrl EPA DHA100 µM
0
10
20
30
40
0
50
100
150
MF
I of C
OX
-2-p
ositiv
e c
ells
(% o
f CD
14
+)
t
c
COX-2 PE
ctrl
fatty acid
ctrl w/o stim
EPA100 µM
DHA100 µM
Fig. 8
by guest, on June 13, 2018w
ww
.jlr.orgD
ownloaded from

41
c
0
110
220
ng/m
L
ctrl EPA DHA
0
90
180
270
360
d
ng/m
L
RvD1
0
0.5
1.0
1.5
ctrl EPA DHA
ng
/mL
1 2 3 4 5 6
7 8 9 10 11 12 13
100 µM
TBX3
0
2
4
6
8LTB5
0
50
100
ng/m
L
ctr
l
EP
A
DH
A100 µM
pg/m
L
a
10 0 10 1 10 2 10 3 10 4
01
6E
ve
nts
M1
10 0 10 1 10 2 10 3 10 4
01
6E
ve
nts
M1
ctrl w/o stim
fatty acid w/o stim
EPA100 µM
DHA100 µM
COX-2 PE
b
ctrlw/o stim
ctr
l
EP
A
DH
A
100 µM
Main effects TXB3 LTB5 RvD1
Stimulation P = 0.896 P = 0.999 P = 0.738
FA treatment P < 0.001 P < 0.001 P < 0.001
Post hoc
Ctrl vs. EPA P < 0.001 P < 0.001 P = 0.211
Ctrl vs. DHA P = 0.999 P = 0.038 P < 0.001
EPA vs. DHA P < 0.001 P < 0.001 P < 0.001
0
8
16
0
5
10
15
CO
X-2
-po
sitiv
e c
ells
(% o
f C
D14
+)
EPA DHA100 µM
w/o stim
MF
I of C
OX
-2-p
ositiv
e c
ells
(% o
f CD
14
+)
a
bb
Fig. 9
by guest, on June 13, 2018w
ww
.jlr.orgD
ownloaded from