Evaluation of strategies for second generation bioethanol ... · Evaluation of strategies for...
13
Evaluation of strategies for second generation bioethanol production from fast growing biomass Paulownia within a biorefinery scheme Elena Domínguez a,b , Aloia Romaní a,b,c , Lucília Domingues c , Gil Garrote a,b,⇑ a Department of Chemical Engineering, Faculty of Science, University of Vigo (Campus Ourense), As Lagoas, 32004 Ourense, Spain b CITI-Tecnopole, San Ciprian de Viñas, 32901 Ourense, Spain c CEB-Centre of Biological Engineering, University of Minho, Campus Gualtar, 4710-057 Braga, Portugal highlights Autohydrolysis of Paulownia biomass was studied as first step of a biorefinery. At S 0 = 4.19, 78.9% of xylan was recovered as xylose and xylooligosaccharides. At S 0 = 4.19, 47% higher ethanol concentration was achieved by SHF than SSF. At S 0 = 4.72, 52.7 g/L of ethanol (80% of conversion) was obtained by SSF. An energy production of 648,074 MJ/ hayear could be produced from this process. graphical abstract Cellulose 39.73 g/100 g RM Hemicellulose 17.98 g/100 g RM • 14.69 g Xylan/100 g RM • 3.29 g Acetyl groups/100 g RM Lignin 21.84 g /100 g RM SIMULTANEOUS SACCHARIFICATION AND FERMENTATION SL: 20, 14.3 and 11.1 % CSR: 5, 10 and 15 FPU/g AUTOHYDROLYSIS LSR: 8 g/g Non-isothermal conditions Severities: 3.31-5.16 Stirring : 150 rpm RAW MATERIAL Paulownia tomentosa Temperature: 35 °C Stirring: 120 rpm SEPARATE HYDROLYSIS AND FERMENTATION SL: 14.3 % CSR: 15 FPU/g EH STEP Temperature: 48.5 °C Stirring:150 rpm Reaction time: 16-72h FERMENTATION STEP Temperature: 32 °C Stirring: 120 rpm Reaction time: 24h Reactor EtOH CSR 15 SL 20 EtOH CSR 15 SL 14.3 EtOH CSR 10 SL 14.3 EtOH CSR 15 SL 11.1 EtOH CSR 5 SL 14.3 G CSR 15 SL 20 G CSR 15 SL 14.3 G CSR 10 SL 14.3 G CSR 15 SL 11.1 G CSR 5 SL 14.3 EtOH EH 16h EtOH EH 24h EtOH EH 36h EtOH EH 48h G EH 16h G EH 24h G EH 36h G EH 48h time (h) 0 12 24 36 48 60 72 Concentration (g/L) 0 10 20 30 40 50 60 time (h) 0 12 24 36 48 60 72 Concentration (g/L) 0 20 40 60 80 100 *SL: Solid Loading; CER: Cellulose to Substrate Rao; EH: Enzymac Hydrolysis; G: Glucose; EtOH: Ethanol article info Article history: Received 2 October 2016 Received in revised form 27 November 2016 Accepted 28 November 2016 Keywords: Fast growing biomass Bioethanol production Autohydrolysis Separate hydrolysis and fermentation Simultaneous saccharification and fermentation abstract Fast-growing and short-rotation biomass is identified as glucan-rich feedstock to be used for bioenergy purposes. For the first time to our knowledge, fast growing biomass (Paulownia tomentosa) was evaluated for bioethanol production in a biorefinery scheme. For that, Paulownia wood was subjected to autohy- drolysis pretreatment under severity (S 0 ) conditions in the range of 3.31–5.16. The effect of this treat- ment on its fractionation was evaluated by means of hemicelluloses solubilization as hemicellulose- derived compounds in liquid phase and enzymatic hydrolysis of glucan (remained in the solid phase) into glucose. A xylose and xylooligosaccharides concentration of 17.5 g/L was obtained at S 0 = 3.99 which cor- responds to complete xylan solubilization. On the other hand, glucose yield of enzymatic hydrolysis increased up to reach 99% at S 0 = 4.82. In addition, separate and simultaneous saccharification and fer- mentation assays (SHF and SSF) of autohydrolyzed Paulownia were compared for ethanol production. An increase of 47% in ethanol concentration was obtained by SHF in comparison with results achieved by SSF for Paulownia treated at S 0 = 4.19. In SSF, Paulownia was successfully converted into ethanol (52.7 g/L which corresponded to 80% of ethanol yield) operating at 20% solid loadings and S 0 = 4.72. Energy analysis of results obtained in this work showed that 83% of energy respect to raw material can be recovered considering the ethanol and the combustion of residual lignin. This work provides a fea- sible process for bioethanol production using fast growing specie which could enrich the feedstock needs for biofuels sector. Ó 2016 Elsevier Ltd. All rights reserved. http://dx.doi.org/10.1016/j.apenergy.2016.11.114 0306-2619/Ó 2016 Elsevier Ltd. All rights reserved. ⇑ Corresponding author at: Department of Chemical Engineering, Faculty of Science, University of Vigo (Campus Ourense), As Lagoas, 32004 Ourense, Spain. E-mail address: [email protected] (G. Garrote). Applied Energy 187 (2017) 777–789 Contents lists available at ScienceDirect Applied Energy journal homepage: www.elsevier.com/locate/apenergy
-
Upload
phungtuong -
Category
Documents
-
view
225 -
download
0
Transcript of Evaluation of strategies for second generation bioethanol ... · Evaluation of strategies for...

Applied Energy 187 (2017) 777–789
Contents lists available at ScienceDirect
Applied Energy
journal homepage: www.elsevier .com/locate /apenergy
Evaluation of strategies for second generation bioethanol productionfrom fast growing biomass Paulownia within a biorefinery scheme
http://dx.doi.org/10.1016/j.apenergy.2016.11.1140306-2619/� 2016 Elsevier Ltd. All rights reserved.
⇑ Corresponding author at: Department of Chemical Engineering, Faculty ofScience, University of Vigo (Campus Ourense), As Lagoas, 32004 Ourense, Spain.
E-mail address: [email protected] (G. Garrote).
Elena Domínguez a,b, Aloia Romaní a,b,c, Lucília Domingues c, Gil Garrote a,b,⇑aDepartment of Chemical Engineering, Faculty of Science, University of Vigo (Campus Ourense), As Lagoas, 32004 Ourense, SpainbCITI-Tecnopole, San Ciprian de Viñas, 32901 Ourense, SpaincCEB-Centre of Biological Engineering, University of Minho, Campus Gualtar, 4710-057 Braga, Portugal
h i g h l i g h t s
� Autohydrolysis of Paulownia biomasswas studied as first step of abiorefinery.
� At S0 = 4.19, 78.9% of xylan wasrecovered as xylose andxylooligosaccharides.
� At S0 = 4.19, 47% higher ethanolconcentration was achieved by SHFthan SSF.
� At S0 = 4.72, 52.7 g/L of ethanol (80%of conversion) was obtained by SSF.
� An energy production of 648,074 MJ/ha�year could be produced from thisprocess.
g r a p h i c a l a b s t r a c t
Cellulose 39.73 g/100 g RMHemicellulose 17.98 g/100 g RM• 14.69 g Xylan/100 g RM• 3.29 g Acetyl groups/100 g RMLignin21.84 g /100 g RM
SIMULTANEOUS SACCHARIFICATION AND FERMENTATION
SL: 20, 14.3 and 11.1 %
CSR: 5, 10 and 15 FPU/g
AUTOHYDROLYSIS
LSR: 8 g/g
Non-isothermal conditions
Severities: 3.31-5.16
Stirring : 150 rpm
RAW MATERIAL
Paulownia tomentosa
Temperature: 35 °C
Stirring: 120 rpm
SEPARATE HYDROLYSIS AND FERMENTATION
SL: 14.3 %
CSR: 15 FPU/g
EH STEP
Temperature: 48.5 °C
Stirring:150 rpm
Reaction time: 16-72h
FERMENTATION STEP
Temperature: 32 °C
Stirring: 120 rpm
Reaction time: 24h
Reactor
EtOH CSR 15 SL 20 EtOH CSR 15 SL 14.3
EtOH CSR 10 SL 14.3 EtOH CSR 15 SL 11.1
EtOH CSR 5 SL 14.3 G CSR 15 SL 20 G CSR 15 SL 14.3
G CSR 10 SL 14.3 G CSR 15 SL 11.1
G CSR 5 SL 14.3
EtOH EH 16h EtOH EH 24h EtOH EH 36h EtOH EH 48h G EH 16h G EH 24h G EH 36h G EH 48h
time (h)0 12 24 36 48 60 72
Con
cent
ratio
n (g
/L)
0
10
20
30
40
50
60
time (h)0 12 24 36 48 60 72
Con
cent
ratio
n (g
/L)
0
20
40
60
80
100
*SL: Solid Loading; CER: Cellulose to Substrate Ra�o; EH: Enzyma�c Hydrolysis; G: Glucose; EtOH: Ethanol
a r t i c l e i n f o
Article history:Received 2 October 2016Received in revised form 27 November 2016Accepted 28 November 2016
Keywords:Fast growing biomassBioethanol productionAutohydrolysisSeparate hydrolysis and fermentationSimultaneous saccharification andfermentation
a b s t r a c t
Fast-growing and short-rotation biomass is identified as glucan-rich feedstock to be used for bioenergypurposes. For the first time to our knowledge, fast growing biomass (Paulownia tomentosa) was evaluatedfor bioethanol production in a biorefinery scheme. For that, Paulownia wood was subjected to autohy-drolysis pretreatment under severity (S0) conditions in the range of 3.31–5.16. The effect of this treat-ment on its fractionation was evaluated by means of hemicelluloses solubilization as hemicellulose-derived compounds in liquid phase and enzymatic hydrolysis of glucan (remained in the solid phase) intoglucose. A xylose and xylooligosaccharides concentration of 17.5 g/L was obtained at S0 = 3.99 which cor-responds to complete xylan solubilization. On the other hand, glucose yield of enzymatic hydrolysisincreased up to reach 99% at S0 = 4.82. In addition, separate and simultaneous saccharification and fer-mentation assays (SHF and SSF) of autohydrolyzed Paulownia were compared for ethanol production.An increase of 47% in ethanol concentration was obtained by SHF in comparison with results achievedby SSF for Paulownia treated at S0 = 4.19. In SSF, Paulownia was successfully converted into ethanol(52.7 g/L which corresponded to 80% of ethanol yield) operating at 20% solid loadings and S0 = 4.72.Energy analysis of results obtained in this work showed that 83% of energy respect to raw materialcan be recovered considering the ethanol and the combustion of residual lignin. This work provides a fea-sible process for bioethanol production using fast growing specie which could enrich the feedstock needsfor biofuels sector.
� 2016 Elsevier Ltd. All rights reserved.

Nomenclature
AbbreviationsEH enzymatic hydrolysisF furfuralFPU Filter Paper UnitsHMF hydroxymethylfurfuralIU International UnitSHF separate hydrolysis and fermentationSSF simultaneous saccharification and fermentation
Parameters and constantsq density (g/L)x empirical constant (14.75 �C)[Biomass] dry biomass concentration at the beginning of the fer-
mentation (g/L)[Cellobiose] cellobiose concentration (g/L)[EtOH]f ethanol concentration at the end of the fermentation
(g/L)[EtOH]0 ethanol concentration at the beginning of the
fermentation (g/L)[Glucose] glucose concentration (g/L)CEtMAX maximal ethanol concentration (g/L)CSR cellulase to Substrate Ratio (FPU/g)EEG energy produced from ethanol from glucan (MJ)EELP energy produced from ethanol from liquid phase (MJ)ELIGNIN energy produced from lignin (MJ)f cellulose fraction of dry biomass (g/g)Gn glucan content (g glucan/100 g spent solid, oven dry
basis)
HHV Higher Heating Value (MJ/kg)KL Klason Lignin content (g Klason lignin/100 g spent solid,
oven dry basis)LSR liquid to solid ratio (g/g)NVC non-volatile compounds (g NVC in liquid phase per
100 g raw material, oven dry basis)O + M oligosaccharides + monomers (kg)QpEtMAX productivity calculated at maximal concentration of
ethanol (g/L/h)R2 coefficient of determination (dimensionless)R0 severity factor (min)S0 severity (dimensionless)SY solid yield (g solid recovered/100 g raw material, oven
dry basis)t time (h)T(t) temperature profile in the heating stage (�C)T’(t) temperature profile in the cooling stage (�C)t1/2 reaction time needed to reach 50% of YGMAX (h)tF time needed for the whole heating–cooling period (min)tMAX time needed to achieve the target temperature (min)TMAX target temperature (�C)TREF reference temperature (100 �C)YEt ethanol yield (%)YG glucose yield (%)YGMAX maximum glucose yield achievable at infinite reaction
time (%)YGt gluczose yield at time t (%)
778 E. Domínguez et al. / Applied Energy 187 (2017) 777–789
1. Introduction
Currently, the search for alternative raw materials to be used asrenewable sources for energy production is one of the most impor-tant challenges to achieve a sustainable growth based on a bio-economy strategy [1]. In this context, lignocellulosic biomass isone of the most promising rawmaterial for biofuel production con-sidering its great availability and limited price [2]. Lignocellulosicmaterials (LCM) such as wood provide abundant and renewablefeedstock that doesn’t compete with food crops [3].
LCM structural composition includes a complex structure com-posed of cellulose (a linear polymer made from glucose structuralunits), hemicellulose (branched polymer made up of sugars andsubstituents) and lignin (polymer made up of oxygenatedphenylpropane structural units) [4]. In order to produce bioetha-nol, the sugars forming polysaccharides can be hydrolyzed by cel-lulolytic enzymes and subsequently fermented by microorganismssuch as Saccharomyces cerevisiae [5,6]. Nevertheless, thethree-dimensional and recalcitrant structure of LCM hinders theenzymatic hydrolysis of cellulose and subsequent fermentation ofglucose to ethanol [7].
Bioethanol from lignocellulosic feedstock remains on the vergeof commercialization due to higher capital and operating costs [8].Second generation bioethanol could be made cost-competitive bythe development of biorefinery-based processes for the integraluse of lignocellulosic biomass [9]. An effective pretreatment playsa key role in the success of the process since it critically influencesthe subsequent stages of biofuel production [10].
Pretreatment using water at high temperature (also known asautohydrolysis or liquid hot water) consists in an attractivehydrolyzing medium that enable a wide variety of reactionswithout catalyst [11,12]. The autohydrolysis reaction may be
considered either as a fractionation process or as a pretreatmentto enhance biomass susceptibility to enzymatic hydrolysis. Hemi-cellulose is solubilized selectively by autohydrolysis, yielding spentsolids mainly composed of acid insoluble lignin and cellulose, moresusceptible to enzyme action [13].
The production of bioethanol from pretreated lignocellulosicbiomass can be carried out by consecutive stages of enzymatichydrolysis and fermentation (method known as separate hydroly-sis and fermentation, SHF) or by a single stage of saccharificationand fermentation (known as simultaneous saccharification and fer-mentation, SSF) [4,14]. The main advantage of the SHF process isthat both steps (saccharification and fermentation) can be carriedout at their individual optimal process conditions. While in theSSF process, a compromise should be accomplished on the reactionconditions. The main advantage of the SSF process is that the glu-cose produced is simultaneously consumed by yeast. This con-sumption decreases the product inhibition of enzyme catalysis.In addition, the SSF process can be carried out in one process step[15], resulting in overall cost reduction from the use of only onereactor [16].
Paulownia tomentosa is a fast growing, short-rotation woodycrop plant with high biomass production, 50 t/(ha year) [17], sig-nificantly higher than the production of other species (such aspoplar, switchgrass, miscanthus or willow), with values of 6–17 t/(ha year) [18]. In addition, P. tomentosa presents an elevatedegree of tolerance to different abiotic stress conditions (such asresistance to rooting, drought and poor soils) [19,20]. These fea-tures are of utmost importance to select P. tomentosa as feedstockto produce bioethanol [21].
In previous research, Paulownia biomass was evaluated forpulping paper manufacture and lignin applications using combinedprocesses of autohydrolysis and delignification [22,23]. Moreover,

E. Domínguez et al. / Applied Energy 187 (2017) 777–789 779
enzymatic saccharification assessment of pretreated P. tomentosafor glucose production (without bioethanol yielding) using acidand alkali processes was reported by Ye and Chen [24]. Neverthe-less, this raw material has not been previously evaluated forbioethanol production within a biorefinery scheme using autohy-drolysis as pretreatment.
Therefore, this study is the first work showing a suitable processfor bioethanol production and hemicellulose recovery (asxylooligosaccharides) from fast growing, short-rotation P. tomen-tosa wood using autohydrolysis as first step of a biorefinery. Ligno-cellulose biomass was processed by autohydrolysis under a widerange of severities (S0 = 3.31–5.16), in order to fractionate the bio-mass into its main components (hemicelluloses, cellulose and lig-nin) and to improve enzymatic susceptibility of cellulose.Experimental data from enzymatic hydrolysis allowed the inter-pretation and evaluation of the hydrolysis kinetics as a functionof autohydrolysis conditions. Moreover, biomass pretreated underselected conditions was successfully converted into bioethanol,comparing two strategies of SSF and SHF. Finally, overall mass bal-ance of proposed processes and energy recovery from main frac-tions were calculated, compared and discussed. Taking intoaccount experimental data obtained in this work and the advan-tages of the use of a fast growing short-rotation species, the strat-egy followed in this study is shown as an interesting solution tomeet the feedstock needs for bioenergy production.
2. Materials and methods
2.1. Raw material
The raw material used in this study was P. tomentosa wood andwas provided by a local wood plantation, located in Foz (Lugo, NWSpain). P. tomentosa was milled to a size of a particle of 8 mm(using a portable sieve shaker, mesh 5/16 in) and stored in contain-ers with aeration in a cool, dry and dark place until its use.
2.2. Analysis of raw material
Samples from the homogenized lot were milled to a particle sizeless than 0.5 mm and analyzed (composition shown in Table 1)using the following methods: extractives [25], moisture [26], ashes[27], and quantitative acid hydrolysis [28]. Fig. 1 shows the analyt-ical methods used in this work and the scheme of the wholeprocess.
The liquid phase from quantitative acid hydrolysis was ana-lyzed by high performance liquid chromatography (HPLC) for sug-ars and acetic acid concentration (conditions: detector, refractiveindex; column, Aminex HPX-87H; mobile phase, 0.01 M H2SO4;flow rate, 0.6 mL/min; temperature of column 50 �C). The concen-trations of glucose, xylose, arabinose and acetic acid wereemployed to calculate the content of glucan, xylan, arabinan andacetyl groups. The insoluble phase from the quantitative acidhydrolysis was gravimetrically measured and reported as Klason
Table 1Chemical composition of Paulownia tomentosa (expressed in g/100 g wood in oven-dry basis ± standard deviation based on three replicate determinations).
Cellulose (glucan) 39.7 ± 0.97Xylan 14.7 ± 0.56Acetyl groups 3.29 ± 0.01Klason lignin 21.9 ± 0.50Extractives 5.60 ± 0.004Ashes 0.50 ± 0.05Uronic acids (expressed in glucuronic acid) 1.30 ± 0.30
lignin. Uronic acids were determined using a colorimetric method[29]. Analyses were carried out in triplicate.
2.3. Non-Isothermal autohydrolysis treatment of P. tomentosa
Water and P. tomentosa were mixed at a liquid to solid ratio(LSR) of 8 kg of water/kg of oven-dry raw material in a Parr reactor(Parr Instruments Company, Moline, IL) of 1 gallon of internal vol-ume, equipped with four blade turbine impellers, heated by anexternal fabric mantle, and cooled by flowing water through aninternal stainless steel loop. The reaction media was stirred at150 rpm and heated following the standard temperature profileto reach the target temperature (Fig. 2). The harshness of autohy-drolysis treatments can be expressed in terms of severity (S0)which was defined as S0 = log R0 by Lavoie [30]. R0 is calculatedby the following equation as function of temperature and time ofautohydrolysis:
S0 ¼ logR0 ¼ logðR0HEATING þ R0COOLING Þ
¼ logZ tMAX
0exp
TðtÞ � TREF
x
� �� dt
� �
þZ tF
tMAXexp
T0ðtÞ � TREF
x
� �� dt
� �ð1Þ
According to this expression, R0 is the severity factor, tMAX (min)is the time needed to achieve the target temperature TMAX (�C), tF(min) is the time needed for the whole heating–cooling period,and T(t) and T0(t) represent the temperature profiles in the heatingand cooling stages, respectively. Calculations were made using thevalues reported usually for x and TREF (14.75 �C and 100 �C,respectively).
The range of studied temperatures included in Table 2 (TMAX:182–240 �C corresponding to severities, S0, of 3.31–5.16) was cho-sen in basis of previous experience with other raw materials ascorn cob and Eucalyptus globulus [31,32]. This range was selectedwith the purpose of studying extensively the pretreatment process.Operational conditions were evaluated to maximize hemicellulosederived compounds concentration in liquid phase and to improveenzymatic susceptibility of glucan present in solid phase.
Solids from autohydrolysis treatment were recovered by filtra-tion, washed with water and quantified for solid yield determina-tion (SY, g solid recovered per 100 g raw material, oven dry basis)and analyzed for chemical composition as was described inSection 2.2. All the analyses were carried out in triplicate. One ali-quot of liquid phase (liquors) from autohydrolysis treatment wasfiltered through 0.45 lm membranes and employed for HPLCquantitation of glucose, xylose, arabinose, acetic acid, hydrox-ymethylfurfural (HMF) and furfural (F). A second aliquot was sub-jected to quantitative acid posthydrolysis (4% w/w sulphuric acidat 121 �C for 40 min), filtered through 0.45 lm membranes andanalyzed in HPLC for oligosaccharides quantification. A third ali-quot of liquor was used for non-volatile compounds quantification(NVC, g non-volatile compounds in liquid phase per 100 g rawmaterial, oven dry basis) in an oven at 105 �C for 48 h.
2.4. Enzymatic hydrolysis of autohydrolyzed P. tomentosa
Enzymatic hydrolysis (EH) assays were carried out at 48.5 �Cand pH 4.85 (using 0.05 N citric acid–sodium citrate buffer) in100 mL Erlenmeyer flasks with orbital agitation (150 rpm) usingcommercial enzymes (‘‘Celluclast 1.5 L’’ cellulases from Tricho-derma reesei and ‘‘Novozyme 188” b-glucosidase from Aspergillusniger), which were kindly provided by Novozymes (Madrid, Spain).The cellulase activity of ‘‘Celluclast 1.5 L’’ concentrates was mea-sured by the Filter Paper assay, and the activity was expressed interms of Filter Paper Units, FPU [33]. The b-glucosidase activity

Raw materialPaulownia tomentosa wood
• Extractives (NREL/TP-510-42619)• Moisture (NREL/TP-510-42621)• Ashes (NREL/TP-510- 24 42622)• Quantitative acid hydrolysis (NREL/TP-510-42618)• Uronic acids
NON-ISOTHERMAL AUTOHYDROLYSIS
S0: 3.31-5.16LSR: 8 kg water/kg PTW
Water Liquid phase• HPLC quantitation• Quantitative acid posthydrolysis• Non-volatile compounds
Solid phase• Solid Yield• Moisture (NREL/TP-510-42621)• Quantitative acid hydrolysis (NREL/TP-510-42618)
SIMULTANEOUS SACCHARIFICATION AND
FERMENTATION20-9.1 % of solidsCSR: 5-15 FPU/g
β-glucosidase : 10 UI/FPU
SEPARATE SACCHARIFICATION AND
FERMENTATION14.3-9.1 % of solids
CSR: 15 FPU/gβ-glucosidase : 10 UI/FPU
ENZYMATIC HYDROLYSIS12.5-4.8 % of solidsCSR: 6-20 FPU/g
β-glucosidase : 10 UI/FPU
Water / Enzymes / Microorganism
Water / Enzymes / Buffer
• HPLC quantitation
Ethanol Ethanol
Glucose
• Yeast cultivation and inoculum preparation
• HPLC quantitation• HPLC quantitation
Fig. 1. Flow chart of whole process and analytical methods used in this work.
time (h)0 20 40 60 80 100
Tem
pera
ture
(ºC
)
40
60
80
100
120
140
160
180
200
220
240S0=3.67 S0=3.99 S0=4.48 S0=4.82
TREF
T(t) for S0 =3.67
T´(t) for S0 = 3.67
heatingcooling
Fig. 2. Heating and cooling temperature profiles of autohydrolysis assay carried outat S0 = 3.67, 3.99, 4.48 and 4.82. Temperature was controlled with a thermocoupleinserted in a thermowell, which extends near the bottom of the reactor vessel (T (t):heating profile, T0 (t): cooling profile, TREF: temperature of reference, 100 �C).
780 E. Domínguez et al. / Applied Energy 187 (2017) 777–789
of ‘‘Novozyme 188” concentrates was measured in InternationalUnit (IU) using p-nitrophenyl-b-d-glucopyranoside as substratefollowing the method described in Paquot and Thonart [34]. Oneunit of activity (IU) was defined as the release of 1 lmol of p-nitrophenol per minute. The enzyme activities were 70 FPU/mLfor Celluclast 1.5 L (or 82.6 FPU/g) and 630 UI/mL for Novozyme188 (or 743.4 UI/g). EH experiments were carried out in duplicateusing a percentage of solids in the range of 4.8–12.5% at Cellulaseto Substrate Ratio (CSR) in the range of 6–20 FPU/g of pretreatedPaulownia. Novozyme 188 was added at ratio of 10 UI of Novo-zyme 188 per FPU of Celluclast 1.5 L. Samples from EH assays werewithdrawn at desired times in the range 0–120 h, centrifuged(5000 rpm for 10 min), filtered through 0.2 lm membranes andanalyzed by HPLC for monosaccharides, using the method cited
in Section 2.2. The results of EH can be expressed in terms of glu-cose concentration (g/L) and in terms of glucose yield (YG) (%), cal-culated using the following equation [35].
%YG ¼ ½Glucose� þ 1:053½Cellobiose�1:111f ½Biomass� ð2Þ
where [Glucose] is glucose concentration (g/L), [Cellobiose] is cel-lobiose concentration (g/L), [Biomass] is dry biomass (or LCM) con-centration (g/L), f is cellulose fraction in dry biomass (g/g), themultiplication factor, 1.053, converts cellobiose to equivalent glu-cose. In all experiments, cellobiose was not detected.
2.5. Yeast cultivation and inoculum preparation
The strain Saccharomyces cerevisiae CECT-1170, obtained fromthe Spanish Collection of Type Cultures (Valencia, Spain), wasemployed for fermentation. Cells were grown at 30 �C for 24 h ina medium containing 10 g glucose/L, 5 g peptone/L, 3 g malt ex-tract/L, and 3 g yeast extract/L.
After yeast grown, cells were recollected and inoculated toexperiments of saccharification and fermentation with 2 g/L (dryweight basis).
2.6. Saccharification and fermentation of autohydrolyzed P. tomentosa
Pretreated P. tomentosa under selected conditions were used assubstrates for bioethanol production following two strategies ofsaccharification and fermentation: simultaneously and separate(SSF and SHF).
SSF assays were carried out in 100 mL Erlenmeyer flasks (orbitalshaking at 120 rpm, 35 �C, and pH 5). SSF media were preparedby mixing the appropriate amounts of substrate (pretreatedP. tomentosa), water, buffer, nutrients and yeast inoculum.Suspensions containing water, buffer and solid substrates wereautoclaved at 121 �C for 15 min separately from the nutrients,and thermostated at 35 �C. SSF experiments were carried out under

Table2
Solid
andliq
uidph
ases
compo
sition
ofpretreated
Paulow
niatomen
tosa
woo
d(olig
osacch
arides
areex
pressedas
mon
osacch
arides
equiva
lent)±stan
dard
deviationba
sedon
threereplicatede
term
inations
.
T MAX(�C)
182
197
203
206
209
210
212
218
220
230
232
240
So(dim
ension
less)
3.31
3.67
3.85
3.99
4.08
4.19
4.24
4.43
4.48
4.72
4.82
5.16
SY(g
solidreco
veredpe
r10
0graw
material,ov
endry
basis)
78.8
75.4
69.6
71.5
68.9
70.7
71.7
70.9
67.7
66.1
67.3
63.8
NVC(g
non
-volatileco
mpo
unds
inliqu
idph
asepe
r10
0g
raw
material,ov
endryba
sis)
12.9
±0.3
22.1
±0.1
26.4
±0.01
22.7
±0.3
23.4
±0.3
22.2
±0.1
22.8
±0.2
15.6
±0.1
15.7
±0.1
9.98
±0.1
10.3
±0.1
9.01
±0.04
Solid
PhaseCo
mpo
sition
(g/100
gpretreated
material,ov
endryba
sis)
Cellulose
40.5
±0.9
47.8
±1.1
50.1
±0.6
54.5
±0.4
54.4
±1.4
56.3
±0.7
53.3
±0.1
53.0
±1.4
52.9
±0.6
53.1
±0.5
48.8
±1.7
53.2
±0.4
Xylan
11.0
±0.2
7.12
±0.13
5.33
±0.19
4.44
±0.21
3.73
±0.08
2.64
±0.87
3.28
±0.10
2.11
±0.39
0.95
±0.50
0.49
±0.05
0.20
±0.02
0.00
±0.00
Acetylgrou
ps2.60
±0.06
1.35
±0.04
1.08
±0.07
1.02
±0.02
0.86
±0.08
0.52
±0.21
0.49
±0.16
0.00
±0.00
0.19
±0.49
0.00
±0.00
0.02
±0.04
0.00
±0.00
Klaso
nlign
in29
.1±0.
533
.0±0.3
34.4
±0.6
33.3
±0.8
34.7
±1.0
35.7
±0.4
36.6
±0.8
37.6
±1.0
41.5
±0.3
41.4
±0.7
45.4
±0.5
42.3
±0.3
Liqu
idPh
aseCo
mpo
sition
(g/L)
Gluco
se0.49
0.60
0.61
0.54
0.48
0.96
0.45
0.42
1.07
1.40
0.51
1.24
Xylos
e0.43
0.77
1.18
1.78
2.19
4.05
2.04
3.11
4.89
1.78
0.31
0.68
Arabinos
e0.11
0.56
0.67
0.48
0.40
0.23
0.56
0.00
0.18
0.00
0.00
0.00
Aceticacid
0.61
1.01
1.50
2.05
2.51
2.72
2.77
4.68
4.93
6.34
5.93
7.16
Hyd
roxy
methylfurfural
0.04
0.05
0.11
0.21
0.26
0.44
0.22
0.44
0.95
1.78
1.28
2.62
Furfural
0.07
0.12
0.31
0.67
1.00
1.26
0.92
1.90
3.00
4.58
2.80
4.70
Oligo
saccharides
*6.21
±0.10
12.9
±1.9
17.3
±0.5
20.2
±0.2
19.4
±0.1
14.7
±0.2
14.7
±0.8
8.60
±0.38
5.06
±0.24
0.89
±0.18
1.11
±0.13
0.69
±0.29
Gluco
oligos
acch
arides
0.73
±0.03
0.47
±0.00
0.70
±0.07
1.25
±0.05
1.32
±0.01
1.36
±0.01
0.59
±0.06
1.10
±0.04
1.14
±0.01
0.89
±0.04
0.57
±0.04
0.69
±0.02
Xyloo
ligo
saccharides
4.66
±0.05
10.9
±0.1
13.9
±0.4
15.7
±0.1
15.3
±0.2
10.9
±0.0
12.3
±0.6
7.02
±0.14
3.25
±0.07
0.00
±0.05
0.55
±0.32
0.00
±0.02
Arabinoo
ligo
saccharides
0.27
±0.01
0.09
±0.01
0.00
±0.03
0.00
±0.04
0.00
±0.00
0.00
±0.00
0.00
±0.13
0.07
±0.00
0.00
±0.01
0.00
±0.00
0.00
±0.00
0.00
±0.00
Acetylgrou
pslinke
dto
oligos
acch
arides
0.54
±0.14
1.38
±1.85
2.77
±0.06
3.23
±0.14
2.81
±0.16
2.43
±0.24
1.82
±0.14
0.42
±0.16
0.67
±0.19
0.00
±0.21
0.00
±0.15
0.00
±0.25
*Oligo
saccharides
weremea
suredas
sum
ofxy
looligos
acch
arides,g
luco
oligos
acch
arides,a
rabinoo
ligos
acch
arides
andacetyl
grou
pslinke
dto
oligos
acch
arides.
E. Domínguez et al. / Applied Energy 187 (2017) 777–789 781
selected operational conditions using different solids and cellulaseloadings (9–20% of solids and CSR: 5–15 FPU/g). At time 0, enzymesand yeast inoculum were added. For 100 mL of media, 10 mL ofinoculum and 10 mL of nutrients (concentrations: 5 g peptone/L,3 g yeast extract/L and 3 g malt extract/L) were added. All the SSFexperiments were carried out in duplicate.
In SHF experiments, an EH was accomplished before fermenta-tion. Suspensions containing water, buffer and solid substrateswere autoclaved at 121 �C for 15 min and thermostated at48.5 �C before EH stage. EH experiments were carried out at48.5 �C and pH 4.85, in 100 mL Erlenmeyer flaks with orbital agita-tion (150 rpm) using cellulolytic enzymes. EH experiments werecarried out under different operational conditions for the autohy-drolyzed P. tomentosa substrates (9–14.3% of solids and CSR:15 FPU/g). The reaction time of EH was varied in the range 16–72 h. Once the EH step was finished, cells were added to start thefermentation stage, using the same conditions for inoculum andnutrient loading as the SSF experiments. These volumes of inocu-lum and nutrients were taken into consideration in the initial cal-culation for solid liquid ratio. Fermentation was carried out in anorbital shaker at 120 rpm and 30 �C for 48 h. All the SHF experi-ments were carried out in duplicate.
At preset times, samples were withdrawn from the media, cen-trifuged at 5000 rpm for 10 min, and aliquots of supernatants werefiltered through 0.2 lm membranes and assayed for monosaccha-rides, acetic acid and ethanol by HPLC using the method describedin Section 2.2. The results of SSF and SHF can be expressed in termsof ethanol concentrations (g/L) and in terms of ethanol yield (YEt)(%), using the following equation [35].
%ethanol yield ¼ ½EtOH�f � ½EtOH�00:5lðf ½Biomass�1:111Þ � 100% ð3Þ
where [EtOH]f is ethanol concentration at the end of the fermenta-tion (g/L) minus any ethanol produced from the enzyme and med-ium, [EtOH]o is ethanol concentration at the beginning of thefermentation (g/L) which should be zero, [Biomass] is dry biomassconcentration at the beginning of the fermentation (g/L), f is cellu-lose fraction of dry biomass (g/g), 0.51 is conversion factor for glu-cose to ethanol based on stoichiometric biochemistry of yeast.1.111 is the stoichiometric factor that converts cellulose to equiva-lent glucose.
3. Results and discussion
3.1. Autohydrolysis fractionation of P. tomentosa wood
Table 1 shows the chemical composition of rawmaterial used inthis study. In addition, SY and chemical composition of spent solidsor autohydrolyzed P. tomentosa and liquors from autohydrolysistreatment were also listed in Table 2.
The autohydrolysis SY varied in the range 63.8–78.8 g solidrecovered per 100 g raw material, oven dry basis. These valuesare close to the weight percent of the raw material correspondingto the joint contributions of cellulose and lignin, suggesting thatboth fractions were not significantly affected by the treatment.About 90% of pretreated material composition corresponded toglucan and lignin, and the combined amounts of these fractionsmatched the ones contained in the raw material. Accordingly, glu-can was recovered almost quantitatively in the solid phase with anaverage content of 90 g of glucan of pretreated wood/100 g of glu-can in the raw material. Glucan content was higher than 50 g ofglucan/100 g of pretreated biomass for S0 > 3.85, except atS0 = 4.82. Lignin content in pretreated samples was in the rangeof 29–45 g of lignin/100 g of pretreated P. tomentosa. The remain-ing solid composition corresponded to residual hemicelluloses as

782 E. Domínguez et al. / Applied Energy 187 (2017) 777–789
xylan (that achieved a maximum value of 10.95 g/100 g pretreatedP. tomentosa for the lowest severity) and other minor compounds.The removal of hemicelluloses from solid phase increased withseverity, achieving complete solubilization in the harshest condi-tions of severity conducted at S0 = 5.16. The results obtained in thiswork are in agreement with reported data using hardwoods asEucalyptus globuluswood in which 98% of glucan and 80% of Klasonlignin were recovered in solid phase and xylan was almost totallysolubilized at S0 > 4.67 [36].
As seen in Table 2, the main compounds present in the autohy-drolysis liquor (or liquid phase) corresponded to hemicellulose-derived compounds, including oligosaccharides, monosaccharidesand sugar degradation products [4]. Xylooligosaccharides were themajority hemicellulose-derived compound which achieved themaximal concentration (15.7 g/L or 13 kg/100 kg of raw material)at S0 of 3.99 representing 60% of the compounds identified in the liq-uid phase and 83.1% of xylan solubilization in raw material intoxylooligosaccharides. These results can be compared with reporteddata in literature using autohydrolysis treatment (also knownas liq-uid hot water) in which 64.1% and 74.1% of hemicellulose fromBrewer’s spent grain and corn cob respectively, were solubilized at190 �C for 30 min (S0 = 4.13) [37]. The maximal concentration ofxylose and xylooligosaccharides (17.5 g/L, measured as sum) wasobtained in this work at S0 = 3.99. At similar autohydrolysis condi-tions (TMAX = 200 �C), maximal oligosaccharides extraction fromPaulownia fortunei was also reported by Caparrós and co-workers[22]. High oligosaccharides extraction (14.7 kg/100 kg of olivestone) was also solubilized by autohydrolysis pretreatment of olivestones at milder severity conditions (S0 = 3.59) [38]. On the otherhand in this work, glucooligosaccharides, arabinooligosaccharides
(a) 30
ntra
tion
(g/L
)
20
25
Glu
cose
con
ce
5
10
15
0 20 40 60 80
G
0
5
time (h)
(b) 100
eld
(YG) (
%)
60
80
Glu
cose
Yie
20
40
time (h)0 20 40 60 80
0
Fig. 3. (a) Time course of glucose concentration (g/L) of Paulownia wood treated at aautohydrolysis conditions of S0 in the range: 3.31–4.82. Experiments were carried out i
and acetyl groups linked to oligosaccharides represented a percent-age lower than 30% of total identified oligosaccharides for S0 6 4.19.From S0 P 4.19, xylooligosaccharides started to degrade into xylosewhich reached up to 4.89 g/L at S0 = 4.48. In consequence, thehighest furfural concentration was 4.7 g/L at S0 = 5.16. For the useof biomass for bioethanol production, it is important to highlightthe presence of degradation compounds (such as furfural, HMFand acetic acid) since they are considered inhibitors of subsequentstage of saccharification and fermentation [39]. Glucose was alsopresent in low amounts (with concentrations of 0.42–1.40 g/L)which represented<4%of glucan solubilization showing the reducedsolubilization of glucan fraction in comparison with xylansolubilization.
The data described above indicate that autohydrolysis treat-ment under selected conditions is an appropriate process for theselective fractionation of Paulownia wood obtaining a solid frac-tion composed mainly by glucan and lignin and high solubilizationof hemicelluloses in liquid phase.
3.2. Evaluation of enzymatic susceptibility of autohydrolyzed P.tomentosa
In a second step of the biorefinery scheme, P. tomentosa treatedby autohydrolysis was used as substrate in assays of enzymatichydrolysis in order to evaluate the susceptibility of pretreated bio-mass for glucose production. Fig. 3(a) and (b) displayed timecourse of glucose production and respective glucose yield compar-ing some selected conditions studied in this work (S0: 3.31–4.82).For these preliminary assays of enzymatic susceptibility, favorableconditions of CSR = 20 FPU/g and solids loadings (4.8%) were
S0=3.31 S0=3.67 S0=3.85 S0=3.99 S0=4.19 0S0=4.24 S0=4.43 S0=4.82
100 120
S0=3.67 exp S0=3.67 cal S0=3.85 exp S0=3.85 cal S0=3.99 exp S0=3.99 cal S0=4.24 exp 0 pS0=4.24 cal S0=4.82 exp S0=4.82 cal S0=3.31 exp S0=3.31 cal S =4 19 exp
100 120
S0=4.19 exp S0=4.19 cal
utohydrolysis conditions of S0 in the range: 3.31–4.82; (b) Yield of glucose (%) atn duplicate, error bars represented standard deviation.
S0 (-)3.2 3.4 3.6 3.8 4.0 4.2 4.4 4.6 4.8 5.0
Max
imum
Glu
cose
Yie
ld, Y
GM
AX(%
)
20
40
60
80
100
t1/2 (h)
0
5
10
15
20
25
YGMAX (%) t1/2 (h)
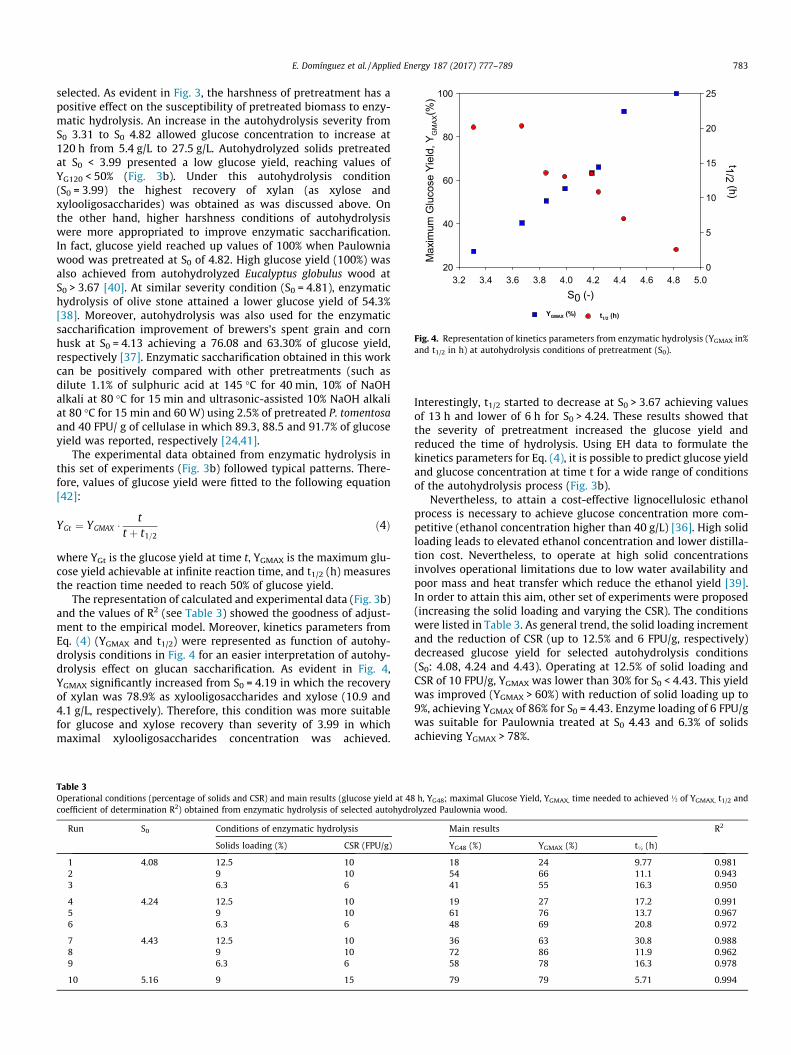
Fig. 4. Representation of kinetics parameters from enzymatic hydrolysis (YGMAX in%and t1/2 in h) at autohydrolysis conditions of pretreatment (S0).
E. Domínguez et al. / Applied Energy 187 (2017) 777–789 783
selected. As evident in Fig. 3, the harshness of pretreatment has apositive effect on the susceptibility of pretreated biomass to enzy-matic hydrolysis. An increase in the autohydrolysis severity fromS0 3.31 to S0 4.82 allowed glucose concentration to increase at120 h from 5.4 g/L to 27.5 g/L. Autohydrolyzed solids pretreatedat S0 < 3.99 presented a low glucose yield, reaching values ofYG120 < 50% (Fig. 3b). Under this autohydrolysis condition(S0 = 3.99) the highest recovery of xylan (as xylose andxylooligosaccharides) was obtained as was discussed above. Onthe other hand, higher harshness conditions of autohydrolysiswere more appropriated to improve enzymatic saccharification.In fact, glucose yield reached up values of 100% when Paulowniawood was pretreated at S0 of 4.82. High glucose yield (100%) wasalso achieved from autohydrolyzed Eucalyptus globulus wood atS0 > 3.67 [40]. At similar severity condition (S0 = 4.81), enzymatichydrolysis of olive stone attained a lower glucose yield of 54.3%[38]. Moreover, autohydrolysis was also used for the enzymaticsaccharification improvement of brewers’s spent grain and cornhusk at S0 = 4.13 achieving a 76.08 and 63.30% of glucose yield,respectively [37]. Enzymatic saccharification obtained in this workcan be positively compared with other pretreatments (such asdilute 1.1% of sulphuric acid at 145 �C for 40 min, 10% of NaOHalkali at 80 �C for 15 min and ultrasonic-assisted 10% NaOH alkaliat 80 �C for 15 min and 60 W) using 2.5% of pretreated P. tomentosaand 40 FPU/ g of cellulase in which 89.3, 88.5 and 91.7% of glucoseyield was reported, respectively [24,41].
The experimental data obtained from enzymatic hydrolysis inthis set of experiments (Fig. 3b) followed typical patterns. There-fore, values of glucose yield were fitted to the following equation[42]:
YGt ¼ YGMAX � tt þ t1=2
ð4Þ
where YGt is the glucose yield at time t, YGMAX is the maximum glu-cose yield achievable at infinite reaction time, and t1/2 (h) measuresthe reaction time needed to reach 50% of glucose yield.
The representation of calculated and experimental data (Fig. 3b)and the values of R2 (see Table 3) showed the goodness of adjust-ment to the empirical model. Moreover, kinetics parameters fromEq. (4) (YGMAX and t1/2) were represented as function of autohy-drolysis conditions in Fig. 4 for an easier interpretation of autohy-drolysis effect on glucan saccharification. As evident in Fig. 4,YGMAX significantly increased from S0 = 4.19 in which the recoveryof xylan was 78.9% as xylooligosaccharides and xylose (10.9 and4.1 g/L, respectively). Therefore, this condition was more suitablefor glucose and xylose recovery than severity of 3.99 in whichmaximal xylooligosaccharides concentration was achieved.
Table 3Operational conditions (percentage of solids and CSR) and main results (glucose yield at 48coefficient of determination R2) obtained from enzymatic hydrolysis of selected autohydr
Run S0 Conditions of enzymatic hydrolysis
Solids loading (%) CSR (FPU/g)
1 4.08 12.5 102 9 103 6.3 6
4 4.24 12.5 105 9 106 6.3 6
7 4.43 12.5 108 9 109 6.3 6
10 5.16 9 15
Interestingly, t1/2 started to decrease at S0 > 3.67 achieving valuesof 13 h and lower of 6 h for S0 > 4.24. These results showed thatthe severity of pretreatment increased the glucose yield andreduced the time of hydrolysis. Using EH data to formulate thekinetics parameters for Eq. (4), it is possible to predict glucose yieldand glucose concentration at time t for a wide range of conditionsof the autohydrolysis process (Fig. 3b).
Nevertheless, to attain a cost-effective lignocellulosic ethanolprocess is necessary to achieve glucose concentration more com-petitive (ethanol concentration higher than 40 g/L) [36]. High solidloading leads to elevated ethanol concentration and lower distilla-tion cost. Nevertheless, to operate at high solid concentrationsinvolves operational limitations due to low water availability andpoor mass and heat transfer which reduce the ethanol yield [39].In order to attain this aim, other set of experiments were proposed(increasing the solid loading and varying the CSR). The conditionswere listed in Table 3. As general trend, the solid loading incrementand the reduction of CSR (up to 12.5% and 6 FPU/g, respectively)decreased glucose yield for selected autohydrolysis conditions(S0: 4.08, 4.24 and 4.43). Operating at 12.5% of solid loading andCSR of 10 FPU/g, YGMAX was lower than 30% for S0 < 4.43. This yieldwas improved (YGMAX > 60%) with reduction of solid loading up to9%, achieving YGMAX of 86% for S0 = 4.43. Enzyme loading of 6 FPU/gwas suitable for Paulownia treated at S0 4.43 and 6.3% of solidsachieving YGMAX > 78%.
h, YG48; maximal Glucose Yield, YGMAX, time needed to achieved ½ of YGMAX, t1/2 andolyzed Paulownia wood.
Main results R2
YG48 (%) YGMAX (%) t½ (h)
18 24 9.77 0.98154 66 11.1 0.94341 55 16.3 0.950
19 27 17.2 0.99161 76 13.7 0.96748 69 20.8 0.972
36 63 30.8 0.98872 86 11.9 0.96258 78 16.3 0.978
79 79 5.71 0.994

784 E. Domínguez et al. / Applied Energy 187 (2017) 777–789
3.3. Comparison of simultaneous saccharification and fermentation(SSF) and separate hydrolysis and fermentation (SHF) processes forbioethanol production
Two strategies of saccharification and fermentation separatelyand simultaneously for ethanol production from autohydrolyzedP. tomentosa were evaluated.
3.3.1. Effect of autohydrolysis severity on ethanol productionIn view of the results obtained from enzymatic susceptibility,
conditions of autohydrolysis treatment and solids and enzymeloadings were selected and listed in Table 4. Fig. 5a and b showstime course of ethanol and glucose concentration of SSF and SHF,respectively. As seen in SSF, accumulated glucose was rapidly con-sumed before 12 h. For S0 4.48–4.72, 25.5–27.5 g/L of ethanol con-centration (corresponding to ethanol yield of 89–95%) wereachieved at 48 h of fermentation. At S0 = 4.19 (Fig. 5a), lower etha-nol concentration (16.3 g/L) was obtained. These results showed aclear effect of autohydrolysis treatment on saccharification andfermentation performance. Severity of pretreatment higher than4.19 was necessary to obtain an ethanol yield > 54% in SSF.
Comparatively in SHF, ethanol production was clearly improvedachieving ethanol concentrations in the range of 23.9–31.5 g/L forS0 of 4.19 and 4.72, respectively. This improvement meant anincrease of 47% ethanol concentration by SHF in comparison withSSF at S0 = 4.19. Thus, ethanol yield was also enhanced andachieved values that varied in the range of 79–100%. Ethanol pro-ductivities for SSF and SHF were calculated at stationary phase(when ethanol concentration was maximum) and listed in Table 4,showing higher productivities by SHF strategy. The production ofglucose was improved due to optimal temperature at the sacchar-ification stage. Therefore, ethanol productivity was higher. In addi-
Table 4Operational conditions (percentage of solids and CSR) and main results obtained from SH(CEtMAX); Ethanol Yield (YEt) and productivity calculated at maximal concentration of etha
Operational conditions Main results
SSF
S0 Solids loading (%) CSR (FPU/g) CEtMAX (g/L) YEt (%)
4.19 9 15 16.3 544.48 25.5 894.72 27.5 955.16 27.0 94
(a) 30
(g/L
) 20
25
Con
cent
ratio
n (
10
15
C
0
5
time (h)0 12 24 36 48 60 72
(
Fig. 5. Ethanol and glucose concentration (g/L) obtained from Paulownia (treated at S0:4duplicate, error bars represented standard deviation.
tion, glucose release was improved with increase of treatmentseverity as was discussed above in the evaluation of enzymaticsusceptibility (Fig. 4). In this sense, the duration of enzymatichydrolysis was evaluated depending on enzymatic susceptibilityof pretreated P. tomentosa. The duration of enzymatic hydrolysiswas chosen in basis of glucose production profiles (Fig. 5b) inwhich can be observed that the production of glucose concentra-tion increased less than 5 g/L in the last 24 h for each experiment.Therefore in SHF experiments (Fig. 5b), the duration of enzymatichydrolysis was: 72 h for pretreated P. tomentosa at S0 4.19 and4.48; 36 h for S0 = 4.72; and 24 h for autohydrolysis severity at5.16. The glucose achieved a concentration between 38.6 and56.0 g/L that was consumed by the yeast in less than 12 h.
Direct comparison with reported data in literature is notstraightforward since the process variables (selected raw material,pretreatment and the conditions of solid and enzyme loadings usedin the saccharification and fermentation) may vary substantially.Nevertheless, literature reported works comparing strategies ofsaccharification and fermentation [43–45]. Ethanol concentration(39.9 g/L) from acid treated rapeseed (180 �C for 20 min and 0.5%H2SO4) by SHF was higher than results obtained by SSF and pre-saccharification and simultaneous saccharification and fermenta-tion (PSSF) at high solid loadings, 20% of solids [43]. Higher ethanolconcentration (with an ethanol yield of 92%) was also obtained bySHF than SSF using steam-exploded poplar wood (S0 = 4.13) at100 g of dry biomass/L (10% of solids) and 0.06 g of enzyme/g ofdry biomass [45].
From results of Fig. 5, it was concluded that the highest ethanolconcentrations in SSF and SHF using 9% of solids were obtainedfrom Paulownia wood treated at 4.72, achieving 27.5 g/L (corre-sponding to 95% of conversion at 48 h) and 31.5 g/L (with 100%of conversion at 54 h), respectively.
F and SSF of autohydrolyzed Paulownia tomentosa: maximal ethanol concentrationnol (QpEtMAX).
SHF
QpEtMAX (g/Lh) CEtMAX (g/L) YEt (%) QpEtMAX (g/Lh)
0.31 23.9 79 0.270.50 30.7 100 0.360.54 31.5 100 0.550.53 30.3 100 0.64
b) 80
(g/L
) 60
SHF of S0=4.19 and S0=4.48: 72 h of EH
SHF of S0=4.72: 48 h of EH
SHF of S0=5.16: 36 h of EH
Con
cent
ratio
n (
40
C
0
20
time (h)0 12 24 36 48 60 72 84 96
EH* Enzymatic Hydrolysis
.19–5.16) by: (a) SSF process and (b) SHF process. Experiments were carried out in

E. Domínguez et al. / Applied Energy 187 (2017) 777–789 785
3.3.2. Effect of operational SHF and SSF conditions on ethanolproduction
At autohydrolysis condition of S0 = 4.72, the results showed thatautohydrolyzed Paulownia wood was a suitable substrate for enzy-matic hydrolysis of glucan and subsequence fermentation to etha-nol. Taking into account the improved results from SHF strategy, aset of experiments was also studied varying the time of enzymatichydrolysis (Table 5) in order to evaluate and optimize the saccha-rification time on ethanol production with 14.3% of solids andCSR = 15 FPU/g. Under these conditions, SHF strategy was carriedout and ethanol and glucose concentration were displayed inFig. 6a. Times of enzymatic hydrolysis (or time of inoculation) werecarried out within 16–48 h in which glucose concentrationachieved 56.0–85.9 g/L (corresponding to 73–95% of glucose yield).Fermentation stage for all of SHF experiments was performed for48 h in which glucose was completely consumed. The highest
Table 5Experimental conditions (solid loading and CSR) and main results (maximal ethanolconcentration of ethanol, QpEtMAX) of SSF and SHF assays carried out with autohydrolyzed
Run Solids loading (%) CSR (FPU/g) Time of inoculum or
SHF-1 14.3 15 16SHF-2 14.3 15 24SHF-3 14.3 15 36SHF-4 14.3 15 48
SSF-1 20 15 –SSF-2 14.3 15 –SSF-3 11.1 15 –SSF-4 14.3 10 –SSF-5 14.3 5 –
(a) 100
SHF-3: 36 h of EH
SHF-4: 48 h of EH
ratio
n (g
/L)
60
80
SHF-1: 16 h of EH
SHF-2: 24 h of EH
Con
cent
r
20
40
time (h)0 12 24 36 48
0
EH: EnzymaticHydrolysis
50
60
ntra
tion
(g/L
)
30
40
Con
cen
10
20
time (h)0 12 24 36 48
0
(b)
Fig. 6. a) Time course of ethanol concentration (g/L) from Paulownia wood treated at S0 =process. Experiments were carried out in duplicate, error bars represented standard dev
ethanol concentration (37.2 g/L corresponding to 81% of conver-sion) was achieved at 48 h of enzymatic hydrolysis (SHF-4). Never-theless, comparing ethanol productivities for SHF experiments,SHF-1 inoculated at 16 h of hydrolysis yielded 80% of ethanol with1.77-fold higher productivity than SHF-4.
On the other hand, Fig. 6b shows the time course of ethanol pro-duction from Paulownia treated at S0 = 4.72 by SSF process. Com-paratively, results obtained from SSF-2 showed higher ethanolconcentration than SHF 1–4 assays. The SSF strategy improvedethanol yield using 14.3% of solids which is attributed to minimalaccumulation of glucose in the SSF medium, compared with theSHF strategy. In SHF, glucose accumulates in the enzymatic hydrol-ysis medium, promoting end-product inhibition of cellulaseenzymes [43], which leads to less optimal glucose yield and subse-quently lower ethanol yield. In order to improve the overall pro-cess of ethanol production from Paulownia wood, percentage of
concentration, CEtMAX; Ethanol yield, YEt and productivity calculated at maximalPaulownia wood at S0 = 4.72.
enzymatic hydrolysis (h) CEtMAX (g/L) YEt (%) QpEtMAX
36.7 80 0.9234.0 74 0.9436.2 78 0.6037.2 81 0.52
52.7 80 0.7340.4 88 0.8429.5 83 0.6233.8 73 0.7022.7 49 0.47
SHF-1 Glucose SHF-1 Ethanol SHF-2 Glucose SHF-2 Ethanol SHF-3 Glucose SHF-3 Ethanol SHF-4 Glucose SHF-4 Ethanol
60 72
SSF-1 Glucose SSF-2 Ethanol SSF-2 GlucoseSSF-2 EthanolSSF-3 Glucose SSF-3 Ethanol SSF-4 Glucose SSF-4 Ethanol SSF-5 Glucose SSF-5 Ethanol
72
4.72 (a) by SHF process varying the time of enzymatic hydrolysis step and (b) by SSFiation.

786 E. Domínguez et al. / Applied Energy 187 (2017) 777–789
solids was increased up to 20% (to increase the ethanol concentra-tion) and CSR was decreased up to 5 FPU/g (to reduce enzyme load-ing) in SSF process. Operational conditions were also listed inTable 5. The highest ethanol concentration (52.7 g/L) was obtainedwith 20% of solids. It is important to highlight that ethanol yieldwas reduced using 20% of solids (achieving 80%) in comparisonwith 83 and 88% obtained with solids loading of 11.1% and14.3%, respectively. Nevertheless, this decrease in ethanol yieldwas not very significant showing the feasibility to operate at highsolid loadings under this condition of autohydrolysis (S0 = 4.72).On the other hand, the reduction of enzyme loading up to 5 FPU/g was not suitable to ethanol production achieving yield lowerthan 50%. An ethanol yield of 73% was achieved using an enzymeloading of 10 FPU/g of substrate. The reduction of enzyme dosagecould be improved by applying an enzyme recycling strategy beingpossible its use in successive batches [46].
3.4. Overall balance of autohydrolyzed P. tomentosa wood
Considering the results obtained in this study, Fig. 7 summa-rizes the fractionation process approached using autohydrolysistreatment as first stage of biorefinery in which ethanol productioncan be compared considering different severities of treatment(4.19 and 4.72). These selected conditions of treatment were
Fig. 7. Overall balance of Paulownia wood processing by autohydrolysis and saccharifipretreatment: (a) S0 = 4.19 and (b) S0 = 4.72 (results expressed in kg/100 kg raw materi
chosen taking into account the highest ethanol yield from saccha-rification and fermentation experiments (S0 = 4.72) and the recov-ery of hemicellulose-derived compounds from autohydrolysisliquors and feasible enzymatic hydrolysis of glucan (S0 = 4.19).Thus, Fig. 7 shows two suitable process configurations for ethanolproduction by SHF and SSF that allows an easier and direct com-parison between alternative process proposals. SHF strategy wasmore appropriate than SSF for ethanol production at milder(S0 = 4.19) and higher (S0 = 4.72) conditions of treatment. Anincrease of 24.2% and 14.6% of ethanol yield was obtained at theseconditions, respectively (Fig. 7). Regarding enzyme spending com-parison, 0.93 kg of ethanol (at S0 = 4.19 and SHF, Fig. 7a) and1.23 kg of ethanol (at S0 = 4.72 and SHF, Fig. 7b) per kg of cellulaseemployed were obtained meaning a 32% higher ethanol productionfor the same enzyme loading. This fact implies the possibility toreduce the enzyme loading at S0 = 4.72.
Considering an overall balance of process, per 100 kg of P.tomentosa: 18.86 kg of hemicellulose-derived compounds(11.38 kg as oligosaccharides) and 17.01 kg of bioethanol wererecovered and produced from autohydrolysis liquor and by SHF,respectively at S0 = 4.19. On the other hand, 21 kg of ethanol per100 kg of P. tomentosa (corresponding to 92% of ethanol yield)and low recovery of hemicellulosic fraction were obtained atS0 = 4.72 by SHF. The ethanol obtained in this work can be
cation and fermentation simultaneously and separately at severity conditions ofal, oven dry basis).

Table 6Energy analysis for 100 kg of raw Paulownia tomentosa (HHV = 1556 MJ) obtained from data presented in Fig. 7 (O + M: oligosaccharides + monomers; ELIGNIN: energy obtainedfrom the combustion of residual lignin; EEG: energy obtained from ethanol from glucan; EELP: energy obtained from the ethanol from xylose fermentation).
Configuration (severity/fermentation mode) Output energy and/or chemicals Energy recovery (%)
O + M (kg) ELIGNIN (MJ) EEG (MJ) EELP (MJ)
Scenario 1: O + M for other industriesS0 = 4.19/SSF 15.44 589 343 – 59.9S0 = 4.19/SHF 15.44 589 504 – 70.2S0 = 4.72/SSF 3.13 637 541 – 75.7S0 = 4.72/SHF 3.13 637 620 – 80.7
Scenario 2: O + M for ethanol productionS0 = 4.19/SSF – 589 343 199 72.6S0 = 4.19/SHF – 589 504 199 83.0S0 = 4.72/SSF – 637 541 40 78.2S0 = 4.72/SHF – 637 620 40 83.3
E. Domínguez et al. / Applied Energy 187 (2017) 777–789 787
favorably compared with data reported by other authors whoobtained 23.3 kg of ethanol/100 kg of Eucalyptus globulus after anautohydrolysis treatment at S0 = 4.67 [40] and 12 kg of etha-nol/100 kg of rapeseed straw after autohydrolysis at 217 �C for42 min [43]. Evaluation of pretreatment biomass in order to max-imize the ethanol production is a relevant issue for the scale-up ofprocess. Recently, ethanol obtained from Eucalyptus grandis in pilotand laboratory scales using acid-pretreatment followed by steamexplosion was compared, obtaining 82.5 and 113 kg/ton dry bio-mass, respectively [47]. The ethanol produced from two configura-tions evaluated in this work at laboratory scale (170–210 kg/ton ofPaulownia) can be positively compared with these reported data.In basis of these results and Paulownia biomass production perhectare, 10,779–13,300 L ethanol/(ha�year) could be produced.
3.5. Energy analysis of fractionated P. tomentosa wood
For a better comparison of process configurations proposed inthis work, an energy analysis of the data shown in Fig. 7 was car-ried out. The Higher Heating Value (HHV) of P. tomentosa as rawmaterial was calculated using the chemical composition of rawmaterial (Table 1) and the corresponding HHV of 17.80, 17.62and 23.32 MJ/kg for glucan, hemicellulose and lignin, respectively[48,49]. Considering these main structural fractions, the calculatedHHV for P. tomentosa was 15.56 MJ/kg. This data was comparablewith the value experimentally determined by Lopez andco-workers [50] for P. fortunei (HHV = 17.83 MJ/kg). The smalldifferences observed could be due to the contribution ofnon-structural components.
As presented in Fig. 7, four alternative configurations ofPaulownia biorefinery process were proposed, attending to bio-mass fractionation (conditions to maximize the oligosaccharidesconcentration from hemicellulose in liquid phase at S0 = 4.19 andto obtain the maximum enzymatic hydrolysis yield from solidphase at S0 = 4.72) and the strategy used for bioethanol productionby SSF or SHF. Table 6 shows the energy production from these fouralternatives, comparing the energy obtained from: (i) ethanol(using HHV = 29.6 MJ/kg for ethanol) produced from glucan (EEG),(ii) combustion of solid after SHF or SSF, composed mainly byresidual lignin (ELIGNIN) and (iii) ethanol from liquid phase (EELP)containing C5 sugars (an ethanol yield of 85% was considered forC5 fermentation according to previous work [51]).
Considering the overall balance shown in Fig. 7 and the HHVs,energy recovery from ethanol or lignin combustion was calculatedand included in Table 6. Energy recovery was calculated consider-ing these four biorefinery configurations and two scenarios foreach configuration: scenario (1) oligosaccharides and monomersfrom liquid phase for other industrial uses (such as chemical,pharmaceutical and food products), increasing the versatility of
biorefinery, or scenario (2) use the ooligosaccharides and mono-mers from liquid phase for ethanol production. In all cases, energyfrom combustion of cellulosic ethanol and lignin was considered.The energy recovery varied in the range from 59.9–70.2% at lowestseverity (S0 = 4.19) and 75.7–80.7% at highest severity (S0 = 4.72). Itis noteworthy that similar energy recoveries (around 83% of energycontained in raw material) were achieved in all configurationsevaluated including or not ethanol from hemicellulosic fraction(C5). Moreover, energy obtained from lignin combustion was sim-ilar to the energy obtained from ethanol which confirms the needto employ lignin to improve the economy of the biorefinery pro-cess. On the other hand, oligosaccharides fraction from liquidphase can be addressed to several industries (such as chemicaland food) or employed for energy production, depending on theeconomic benefit or the biofuels needs which improves the versa-tility of the process.
Annually in terms of energy produced per hectare, the Paulow-nia biorefinery proposed in this work would be able to obtain13,300 L of cellulosic ethanol or 15,070 L including hemicellulosicethanol which would be equivalent to 310,000–350,000 MJ. Addi-tionally, taking into account the lignin combustion obtained fromPaulownia-to-ethanol process, 294,000–318,000 MJ could be pro-duced. These data imply an overall production of 628,000 MJ/(ha year) or 648,000 MJ/(ha year) including C5 bioethanol.
4. Conclusions
In this work, an evaluation of autohydrolysis pretreatment forbioethanol production from P. tomentosa wood was carried out fol-lowing the biorefinery concept. High biomass production and tol-erance of abiotic stress conditions make P. tomentosa wood aninteresting biomass for energy purposes. This work provides exper-imental data of P. tomentosa fractionation, fermentation strategiesto increase ethanol yield and an energy analysis of whole processshowing the feasibility of this biomass as energy crop. Neverthe-less, one single condition of autohydrolysis was not satisfactoryto maximize the recovery of all fractions. High recovery ofhemicellulose-derived compounds (as xylooligosacchairdes) wasobtained at milder conditions of pretreatment (S0 = 3.99).On theother hand, glucose yield of enzymatic hydrolysis was enhancedwith increase of pretreatment harshness (S0 > 4.43) achievingYG > 70%. After this fractionation evaluation, two severities wereselected to compare ethanol production by SHF and SSF, attendingto hemicellulose-derived compounds recovery (S0 = 4.19) andethanol yield (S0 = 4.72). Overall mass balance of these configura-tions showed that SHF strategy was more appropriate for ethanolproduction than SSF, increasing up to 24.2% the ethanol produc-tion. Nevertheless at S0 = 4.72, SSF strategy was more suitable thanSHF to operate at high solid loadings (20%), achieving 52.7 g/L of

788 E. Domínguez et al. / Applied Energy 187 (2017) 777–789
ethanol. Energy analysis of these two configurations showed thatlignin combustion was necessary to improve the energy recovery.Comparing two strategies, C5 fermentation into ethanol couldincrease the energy recovery up to 83% at S0 = 4.19 by SHF. Thisstudy showed that autohydrolysis is an appropriate pretreatmentfor the fractionation of Paulownia wood. In addition, these resultsprovide data for further techno-economic analysis in order to com-pare the two configurations and select the optimal operationalconditions.
Acknowledgments
This work was supported by the ‘‘Ministerio de Economía yCompetitividad” of Spain [research project reference CTQ2012-3085: ‘‘Development of processes for integral benefit of fast-growing biomass through bioethanol and chemicals production”,partially funded with the FEDER funds of the EU]. Aloia Romaníis grateful to Xunta de Galicia for her fellowship (Plan I2C, 2014).
References
[1] Mendes CVT, Carvalho MGVS, Baptista CMSG, Rocha JMS, Soares BIG, SousaGDA. Valorisation of hardwood hemicelluloses in the kraft pulping process byusing an integrated biorefinery concept. Food Bioprod Process2009;87:197–207. http://dx.doi.org/10.1016/j.fbp.2009.06.004.
[2] Favaro L, Basaglia M, van Zyl WH, Casella S. Using an efficient fermenting yeastenhances ethanol production from unfiltered wheat bran hydrolysates. ApplEnergy 2013;102:170–8. http://dx.doi.org/10.1016/j.apenergy.2012.05.059.
[3] Palmqvist E, Hahn-Hägerdal B. Fermentation of lignocellulosic hydrolysates. I:inhibition and detoxification. Bioresour Technol 2000;74:17–24. http://dx.doi.org/10.1016/S0960-8524(99)00160-1.
[4] Ares-Peón IA, Romaní A, Garrote G, Parajó JC. Invasive biomass valorization:environmentally friendly processes for obtaining second generationbioethanol and saccharides from Ulex Europæus. J Chem Technol Biotechnol2012;88:999–1006. http://dx.doi.org/10.1002/jctb.3963.
[5] Palmqvist E, Hahn-Hägerdal B. Fermentation of lignocellulosic hydrolysates. II:inhibitors and mechanisms of inhibition. Bioresour Technol 2000;74:25–33.http://dx.doi.org/10.1016/S0960-8524(99)00161-3.
[6] Mussatto SI, Machado EMS, Carneiro LM, Teixeira JA. Sugars metabolism andethanol production by different yeast strains from coffee industry wasteshydrolysates. Appl Energy 2012;92:763–8. http://dx.doi.org/10.1016/j.apenergy.2011.08.020.
[7] Zheng Y, Yu C, Cheng YS, Lee C, Simmons CW, Dooley TM, et al. Integratingsugar beet pulp storage, hydrolysis and fermentation for fuel ethanolproduction. Appl Energy 2012;93:168–75. http://dx.doi.org/10.1016/j.apenergy.2011.12.084.
[8] Pourbafrani M, McKechnie J, Shen T, Saville BA, Maclean HL. Impacts of pre-treatment technologies and co-products on greenhouse gas emissions andenergy use of lignocellulosic ethanol production. J Clean Prod 2014;78(2014):104–11. http://dx.doi.org/10.1016/j.jclepro.2014.04.050.
[9] Tao L, Aden A, Elander RT, Pallapolu VR, Lee YY, Garlock RJ, et al. Process andtechnoeconomic analysis of leading pretreatment technologies forlignocellulosic ethanol production using switchgrass. Bioresour Technol2011;102:11105–14. http://dx.doi.org/10.1016/j.biortech.2011.07.051.
[10] Alonso JL, Domínguez H, Garrote G, González-Muñoz MJ, Gullón B, Moure A,et al. Biorefinery processes for the integral valorization of agroindustrial andforestal wastes. CyTA-J Food 2011;9:282–9. http://dx.doi.org/10.1080/19476337.2011.598949.
[11] Thangavelu SK, Ahmed AS, Ani FN. Bioethanol production from sago pith wasteusing microwave hydrothermal hydrolysis accelerated by carbon dioxide. ApplEnergy 2014;128:277–83. http://dx.doi.org/10.1016/j.apenergy.2014.04.076.
[12] Laser M, Schulman D, Allenb SG, Lichwa J, Antal Lee Jr MJ, Lynda R. Acomparison of liquid hot water and steam pretreatments of sugar cane bagassefor bioconversion to ethanol. Bioresour Technol 2002;81:33–44. http://dx.doi.org/10.1016/S0960-8524(01)00103-1.
[13] Requejo A, Peleteiro S, Rodríguez A, Garrote G, Parajó JC. Second-generationbioethanol from residual woody biomass. Energy Fuels 2011;25:4803–10.http://dx.doi.org/10.1021/ef201189q.
[14] Rohowsky B, Häßler T, Gladis A, Remmele E, Schieder D, Faulstich M.Feasibility of simultaneous saccharification and juice co-fermentation onhydrothermal pretreated sweet sorghum bagasse for ethanol production. ApplEnergy 2013;102:211–9. http://dx.doi.org/10.1016/j.apenergy.2012.03.039.
[15] Olsson L, Soerensen HR, Dam BP, Christensen H, Krogh KM, Meyer AS. Separateand simultaneous enzymatic hydrolysis and fermentation of wheathemicellulose with recombinant xylose utilizing Saccharomyces cerevisiae.Appl Biochem Biotechnol 2006;129:117–29. http://dx.doi.org/10.1385/ABAB:129:1:117.
[16] Talebnia F, Karakashev D, Angelidaki I. Production of bioethanol from wheatstraw: an overview on pretreatment, hydrolysis and fermentation. BioresourTechnol 2010;101:4744–53. http://dx.doi.org/10.1016/j.biortech.2009.11.080.
[17] López F, Pérez A, Zamudio MAM, De Alva HE, García JC. Paulownia as rawmaterial for solid biofuel and cellulose pulp. Biomass Bioenergy2012;45:77–86. http://dx.doi.org/10.1016/j.biombioe.2012.05.010.
[18] Marsal F, Thevathasan NV, Guillot S, Mann J, Gordon AM, Thimmanagari M,et al. Biomass yield assessment of five potential energy crops grown insouthern Ontario, Canada. Agroforest Syst 2016;90:773–83. http://dx.doi.org/10.1007/s10457-016-9893-3.
[19] Yang JC, Ho CK, Chen ZZ, Chang SH. Paulownia x taiwaniana (TaiwanPaulownia). Biotechnol Agric For 1996;35:269–90. http://dx.doi.org/10.1007/978-3-662-10617-4_16.
[20] San José MC, Cernadas MJ, Corredoira E. Histology of the regeneration ofPaulownia tomentosa (Paulowniaceae) by organogenesis. Rev Biol Trop2014;62:809–18.
[21] García A, González Alriols M, Labidi J. Evaluation of different lignocellulosicraw materials as potential alternative feedstocks in biorefinery processes. IndCrops Prod 2014;53:102–10. http://dx.doi.org/10.1016/j.indcrop.2013.12.019.
[22] Caparrós S, Ariza J, Garrote G, López F, Díaz MJ. Optimization of PaulowniaFortunei L. Autohydrolysis-Organosolv pulping as a source of xylooligomersand cellulose pulp. Ind Eng Chem Res 2007;46:623–31. http://dx.doi.org/10.1021/ie060561k.
[23] Zamudio MAM, Alfaro A, de Alva HE, García JC, García-Moralesa M, López F.Biorefinery of paulownia by autohydrolysis and soda-anthraquinonedelignification process. Characterization and application of lignin. J ChemTechnol Biotechnol 2015;90:534–42. http://dx.doi.org/10.1002/jctb.4345.
[24] Ye X, Chen Y. Kinetics study of enzymatic hydrolysis of Paulownia by diluteacid, alkali, and ultrasonic-assisted alkali pretreatments. BiotechnolBioprocess Eng 2015;20:242–8. http://dx.doi.org/10.1007/s12257-014-0490-x.
[25] Sluiter A, Ruiz R, Scarlata C, Sluiter J, Templeton D. Determination ofextractives in biomass. NREL chemical analysis and testing laboratoryanalytical procedures. 2008, NREL/TP-510-42619, 2008.
[26] Sluiter A, Hames B, Hyman D, Payne C, Ruiz R, Scarlata C, et al. Determinationof total solids in biomass and total dissolved solids in liquid process samples.NREL chemical analysis and testing laboratory analytical procedures. 2008,NREL/TP-510-42621., 2008.
[27] Sluiter A, Hames B, Ruiz R, Scarlata C, Sluiter J, Templeton D. Determination ofash in biomass. NREL chemical analysis and testing laboratory analyticalprocedures. 2008, NREL/TP-510-42622, 2008.
[28] Sluiter A, Hames B, Ruiz R, Scarlata C, Sluiter J, Templeton D, et al.Determination of structural carbohydrates and lignin in biomass. NRELchemical analysis and testing laboratory analytical procedures. 2008, NREL/TP-510-42618, 2008.
[29] Blumenkrantz N, Asboe-Hansen G. New method for quantitativedetermination of uronic acids. Anal Biochem 1973;54:484–9. http://dx.doi.org/10.1016/0003-2697(73)90377-1.
[30] Lavoie JM, Capek-Menard E, Gauvin H, Chornet E. Production of pulp from salixviminalis energy crops using the FIRSST process. Bioresour Technol2010;101:4940–6. http://dx.doi.org/10.1016/j.biortech.2009.09.021.
[31] Garrote G, Yáñez R, Alonso JL, Parajó JC. Coproduction of oligosaccharides andglucose from corncobs by hydrothermal processing and enzymatic hydrolysis.Ind Eng Chem 2008;47:1336–45. http://dx.doi.org/10.1021/ie071201f.
[32] Romaní A, Garrote G, Alonso JL, Parajó JC. Bioethanol productionfrom hydrothermally pretreated Eucalyptus Globulus wood. BioresourTechnol 2010;101:8706–12. http://dx.doi.org/10.1016/j.biortech. 2010.06.093.
[33] Ghose TK. Measurement of cellulase activities. Pure Appl Chem1987;59:257–68. http://dx.doi.org/10.1351/pac198759020257.
[34] Paquot M, Thonart P. Hydrolyse enzymatique de la celluloserégénérée. Holzforschung 1982;36:177–82. http://dx.doi.org/10.1515/hfsg.1982.36.4.177.
[35] Dowe N, McMillan J. SSF Experimental Protocols - Lignocellulosic BiomassHydrolysis and Fermentation. NREL chemical analysis and testing laboratoryanalytical procedures. 2008, NREL/TP-510-42630, 2008.
[36] Cannella D, Sveding PV, Jørgensen H. PEI detoxification of pretreated spruce forhigh solids ethanol fermentation. Appl Energy 2014;132:394–403. http://dx.doi.org/10.1016/j.apenergy.2014.07.038.
[37] Michelin M, Teixeira JA. Liquid hot water pretreatment of multi feedstocks andenzymatic hydrolysis of solids obtained thereof. Bioresour Technol2016;216:862–9. http://dx.doi.org/10.1016/j.biortech.2016.06.018.
[38] Cuevas M, García JF, Hodaifac G, Sánchez S. Oligosaccharides andsugars production from olive stones by autohydrolysis and enzymatichydrolysis. Ind Crop Prod 2015;70:100–6. http://dx.doi.org/10.1016/j.indcrop.2015.03.011.
[39] Romaní A, Ruíz HA, Pereira FB, Teixeira JA, Domingues L. Integrated approachfor effective bioethanol production using whole slurry from autohydrolyzedEucalyptus globulus wood at high-solid loadings. Fuel 2014;135:482–91.http://dx.doi.org/10.1016/j.fuel.2014.06.061.
[40] Romaní A, Garrote G, Alonso JL, Parajó JC. Experimental assessment on theEnzymatic Hydrolysis of Hydrothermally Pretreated Eucalyptus globulus wood.Ind Eng Chem Res 2010;49:4653–63. http://dx.doi.org/10.1021/ie100154m.
[41] Ye X, Zhang Z, Chen Y, Cheng J, Tang Z, Hu Y. Physico-chemical pretreatmenttechnologies of bioconversionefficiency of Paulownia tomentosa (Thunb.)Steud. Ind Crop Prod 2016;87:280–6. http://dx.doi.org/10.1016/j.indcrop.2016.04.045.
[42] Holtzapple MT, Caram HS, Humphrey AE. Comparison of two empirical modelsfor the enzymatic hydrolysis of pretreated poplar wood. Biotechnol Bioeng1984;26:936–41. http://dx.doi.org/10.1002/bit.260260818.

E. Domínguez et al. / Applied Energy 187 (2017) 777–789 789
[43] López-Linares JC, Romero I, Cara C, Ruiz E, Moya M, Castro E. Bioethanolproduction from rapeseed straw at high solids loading with different processconfigurations. Fuel 2014;122:112–8. http://dx.doi.org/10.1016/j.fuel.2014.01.024.
[44] Franco H, Ferraz A, Milagres AMF, Carvalho W, Freer J, Baeza J, et al. Alkalinesulfite/anthraquinone pretreatment followed by disk refining of Pinusradiata and Pinus caribaea wood chips for biochemical ethanol production. JChem Technol Biotechnol 2012;87:651–7. http://dx.doi.org/10.1002/jctb.2761.
[45] Cantarella M, Cantarella L, Gallifuoco A, Spera A, Alfani F. Comparison ofdifferent detoxification methods for steam-exploded poplar wood as asubstrate for the bioproduction of ethanol in SHF and SSF. Process Biochem2004;39:1533–42. http://dx.doi.org/10.1016/S0032-9592(03)00285-1.
[46] Gomes D, Rodrigues AC, Domingues L, Gama M. Cellulase recycling inbiorefineries—is it possible? Appl Microbiol Biotechnol 2015;99:4131–43.http://dx.doi.org/10.1007/s00253-015-6535-z.
[47] McIntosh S, Zhang Z, Palmer J, Wong HH, Doherty WOS, Vancov T. Pilot-scalecellulosic ethanol production using eucalyptus biomass pre-treated by diluteacid and steam explosion. Biofuel Bioprod Bioref 2016;10:346–58. http://dx.doi.org/10.1002/bbb.1651.
[48] Demirbas A. Relationships between lignin contents and heating values ofbiomass. Energy Convers Manage 2001;42:183–8. http://dx.doi.org/10.1016/S0196-8904(00)00050-9.
[49] Murphy WK, Masters KR. Gross heat of combustion of northern red oak(Quercus rubra) chemical components. Wood Sci. 1978;10:139–41.
[50] López F, García JC, Pérez A, Feria MJ, Zamudio Minerva AM, Garrote G.Chemical and energetic characterization of species with a high-biomassproduction: fractionation of their components. Env Prog Sust Energ2010;29:499–509. http://dx.doi.org/10.1002/ep.10429.
[51] Rodríguez-López J, Romaní A, González-Muñoz MJ, Garrote G, Parajó JC.Extracting value-added products before pulping: Hemicellulosic ethanol fromEucalyptus globulus wood. Holzforschung 2012;66:591–9. http://dx.doi.org/10.1515/hf-2011-0204.