Sang-Yoon Kim Department of Physics Kangwon National University
Upload
zoe-josephCategory
view
215download
1
Evaluation of Scottsdale 101 Photo Enforcement Demonstration Program
Simon Washington
Kangwon Shin
Ida van Schalkwyk
Department of Civil and Environmental Engineering
Arizona State University
2
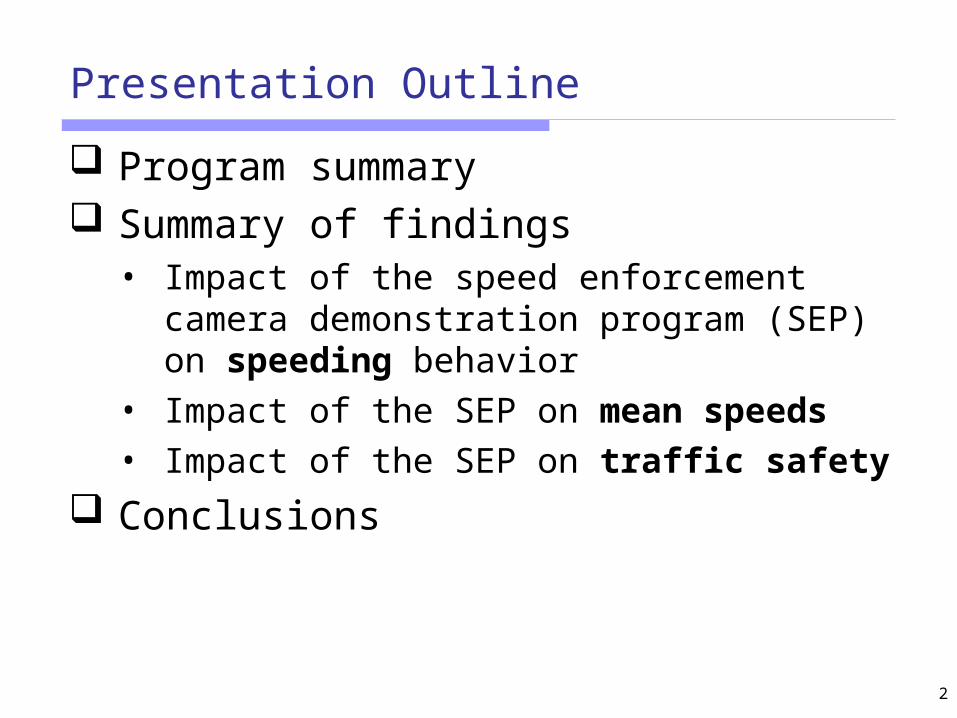
Presentation Outline
Program summary Summary of findings
• Impact of the speed enforcement camera demonstration program (SEP) on speeding behavior
• Impact of the SEP on mean speeds
• Impact of the SEP on traffic safety
Conclusions

Program Summary
4
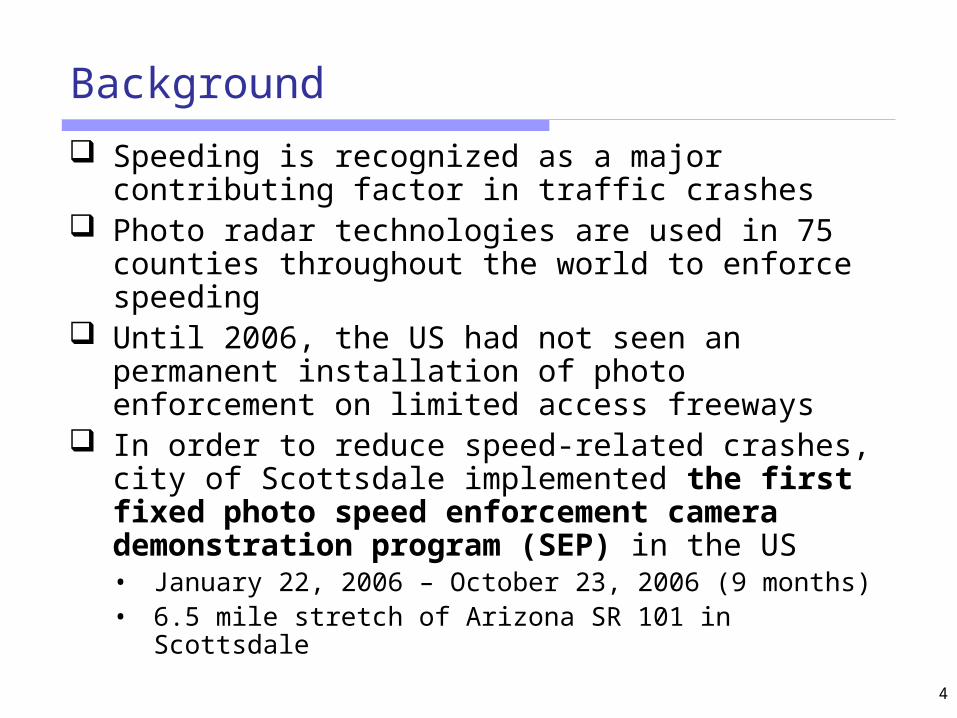
Background
Speeding is recognized as a major contributing factor in traffic crashes
Photo radar technologies are used in 75 counties throughout the world to enforce speeding
Until 2006, the US had not seen an permanent installation of photo enforcement on limited access freeways
In order to reduce speed-related crashes, city of Scottsdale implemented the first fixed photo speed enforcement camera demonstration program (SEP) in the US• January 22, 2006 – October 23, 2006 (9 months)• 6.5 mile stretch of Arizona SR 101 in Scottsdale
5
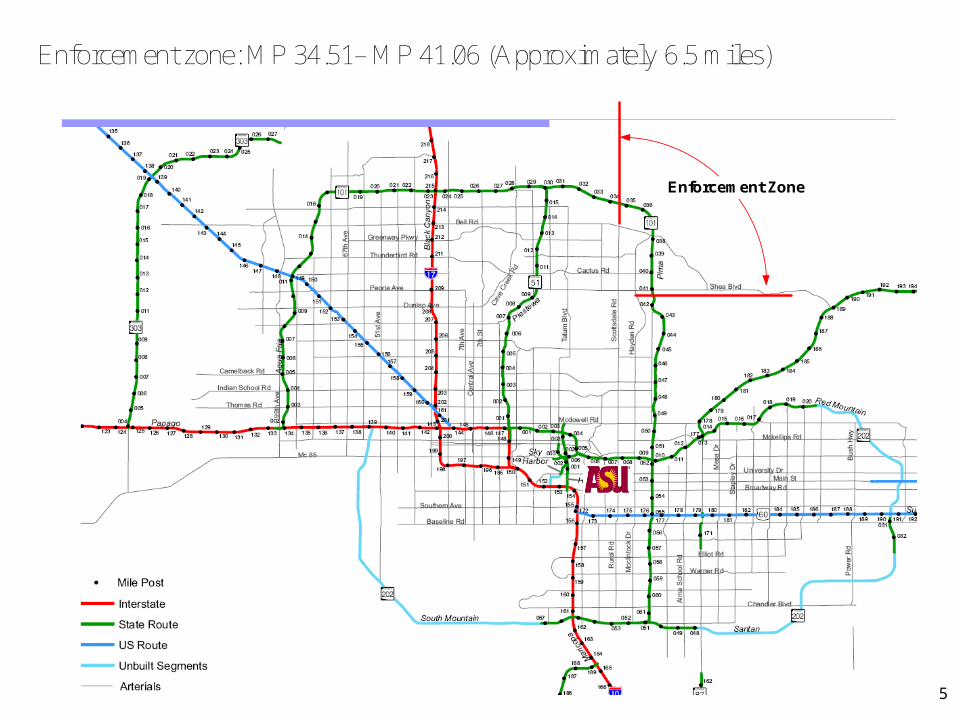
Enforcement Zone
Enforcement zone: MP 34.51– MP 41.06 (Approximately 6.5 miles)
6
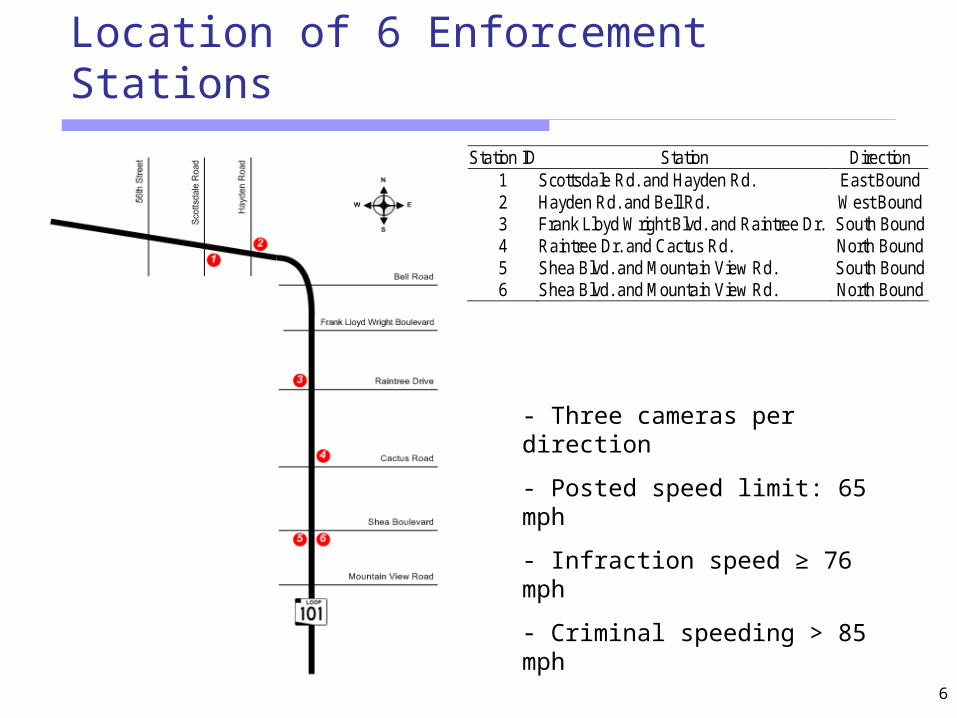
Location of 6 Enforcement Stations
- Three cameras per direction
- Posted speed limit: 65 mph
- Infraction speed ≥ 76 mph
- Criminal speeding > 85 mph
Station ID Station Direction 1 Scottsdale Rd. and Hayden Rd. East Bound 2 Hayden Rd. and Bell Rd. West Bound 3 Frank Lloyd Wright Blvd. and Raintree Dr. South Bound 4 Raintree Dr. and Cactus Rd. North Bound 5 Shea Blvd. and Mountain View Rd. South Bound 6 Shea Blvd. and Mountain View Rd. North Bound
7
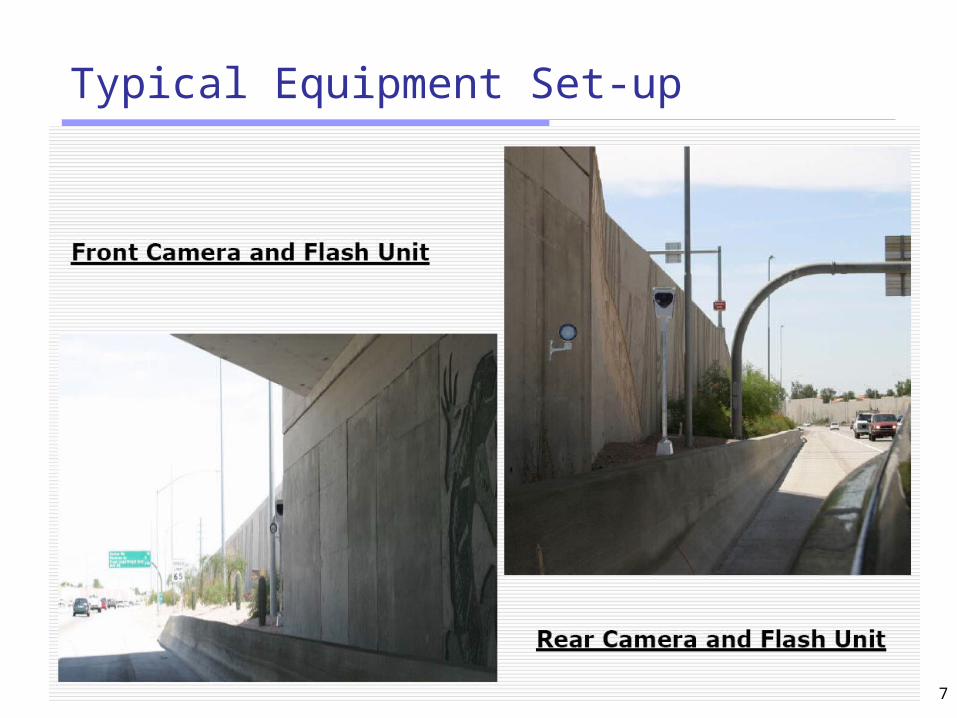
Typical Equipment Set-up
8
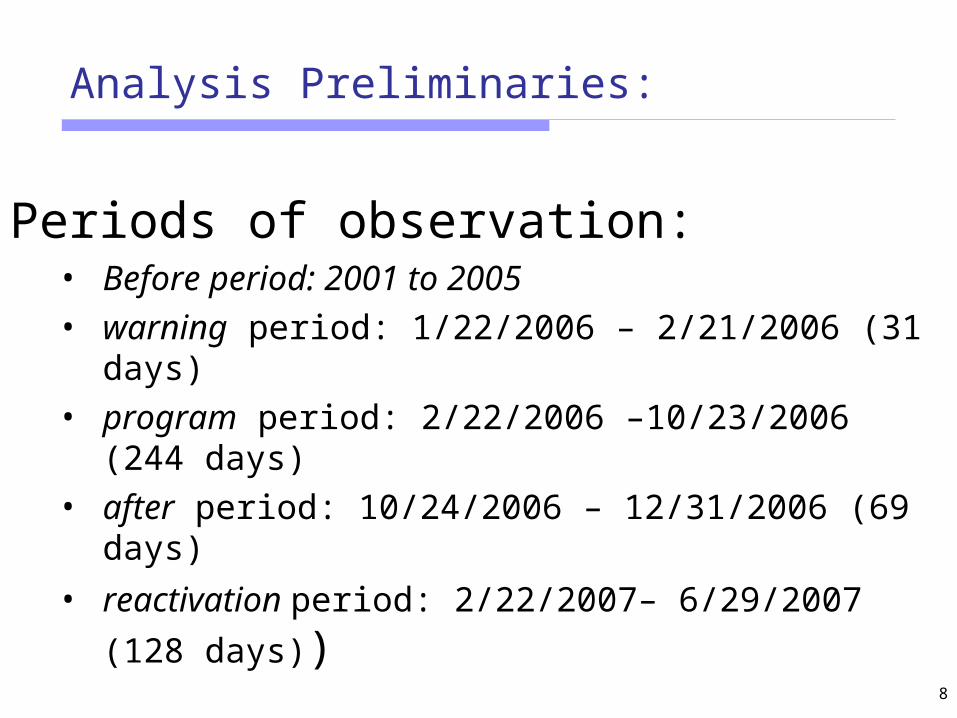
Analysis Preliminaries:
Periods of observation:• Before period: 2001 to 2005
• warning period: 1/22/2006 – 2/21/2006 (31 days)
• program period: 2/22/2006 –10/23/2006 (244 days)
• after period: 10/24/2006 – 12/31/2006 (69 days)
• reactivation period: 2/22/2007– 6/29/2007 (128 days))
SEP Impact on Speeding
10
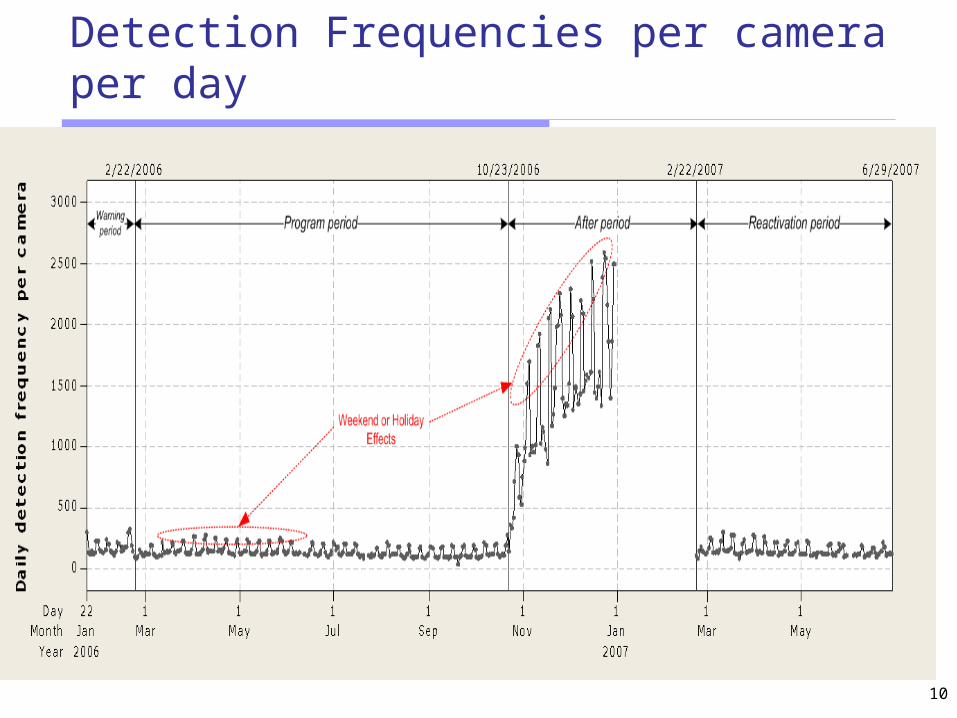
Detection Frequencies per camera per day
11
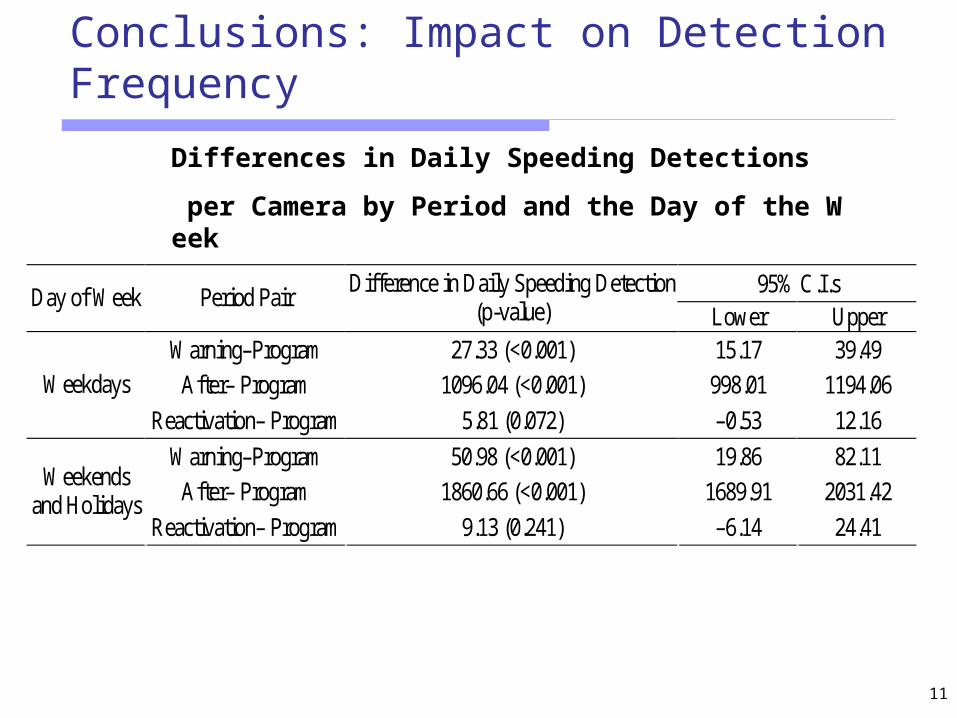
Conclusions: Impact on Detection Frequency
Differences in Daily Speeding Detections
per Camera by Period and the Day of the Week
95% C.I.s Day of Week Period Pair Difference in Daily Speeding Detection
(p-value) Lower Upper Warning–Program 27.33 (<0.001) 15.17 39.49
After– Program 1096.04 (<0.001) 998.01 1194.06 Weekdays
Reactivation– Program 5.81 (0.072) –0.53 12.16
Warning–Program 50.98 (<0.001) 19.86 82.11
After– Program 1860.66 (<0.001) 1689.91 2031.42 Weekends
and Holidays Reactivation– Program 9.13 (0.241) –6.14 24.41
Impact on Mean Speeds
13
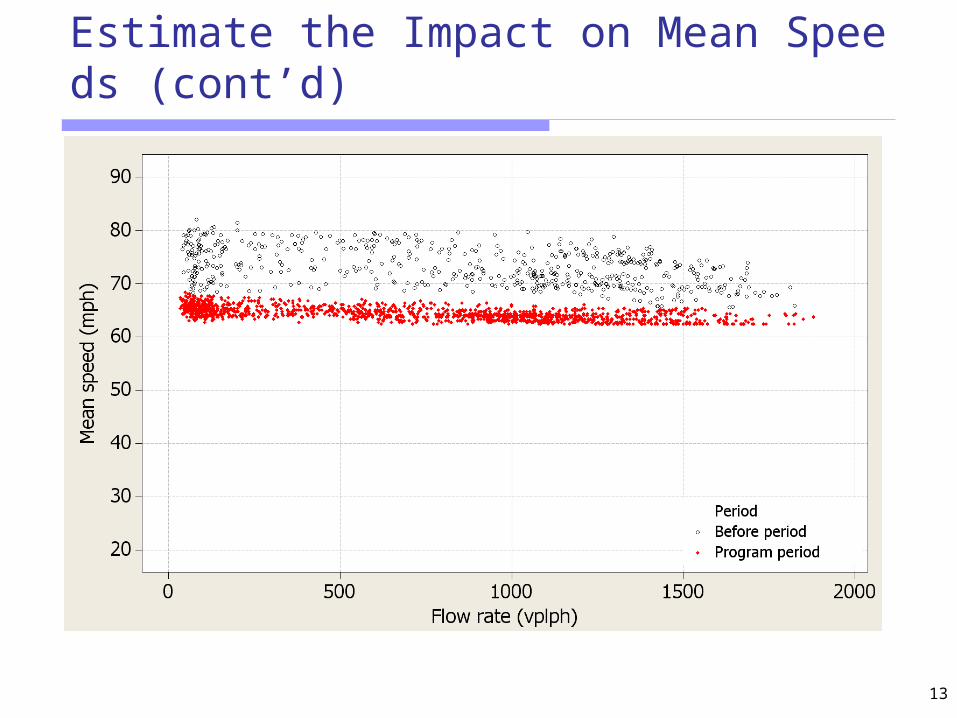
Estimate the Impact on Mean Speeds (cont’d)
14
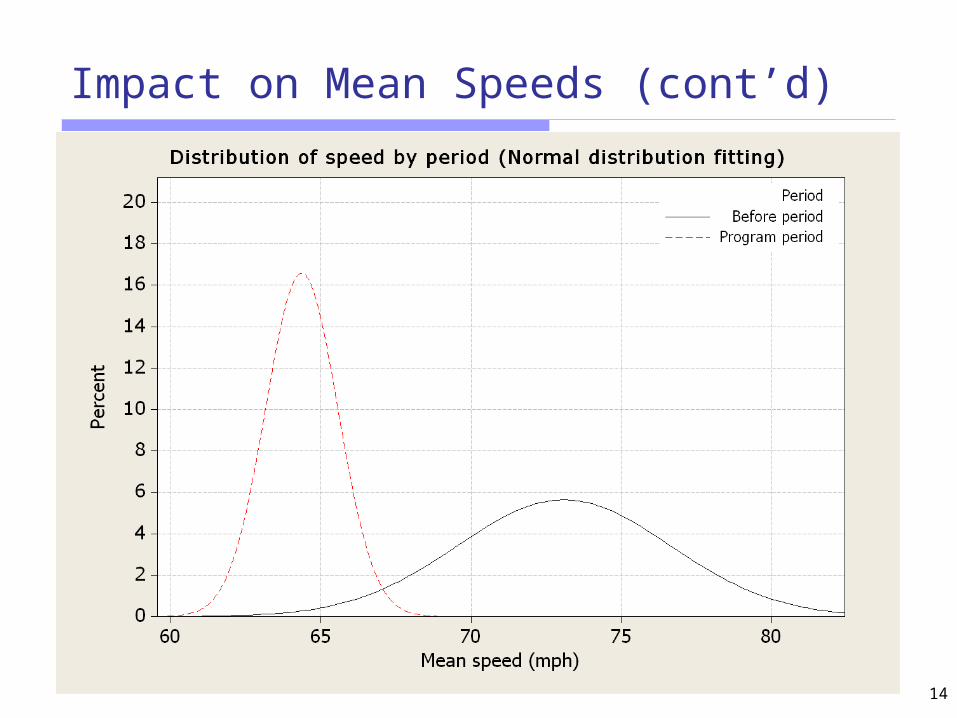
Impact on Mean Speeds (cont’d)
15
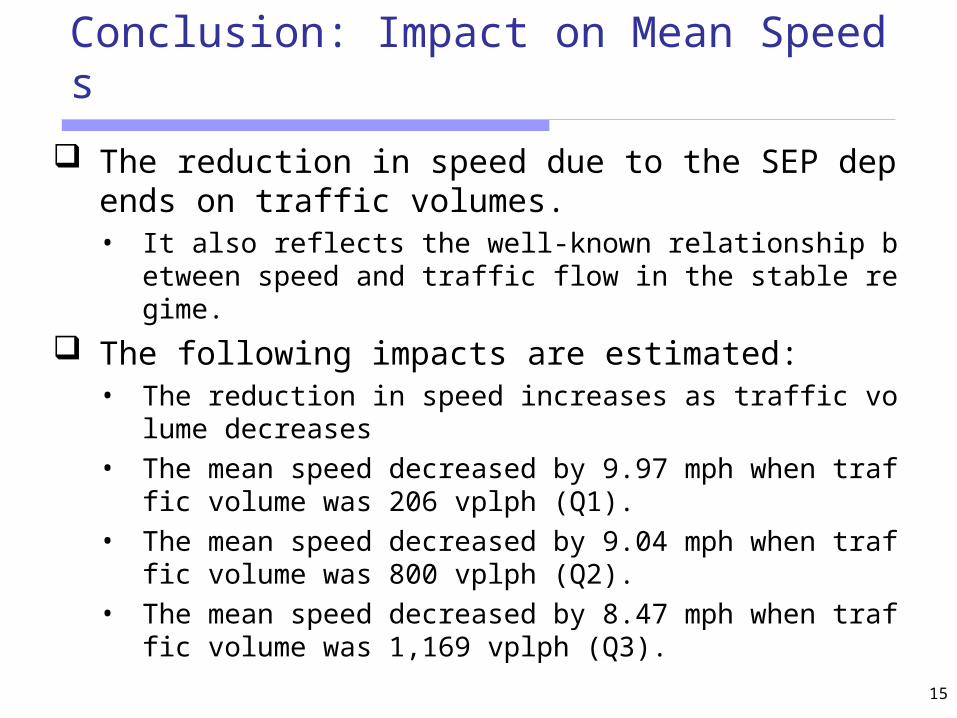
Conclusion: Impact on Mean Speeds
The reduction in speed due to the SEP depends on traffic volumes.• It also reflects the well-known relationship between speed and t
raffic flow in the stable regime.
The following impacts are estimated: • The reduction in speed increases as traffic volume decreases
• The mean speed decreased by 9.97 mph when traffic volume was 206 vplph (Q1).
• The mean speed decreased by 9.04 mph when traffic volume was 800 vplph (Q2).
• The mean speed decreased by 8.47 mph when traffic volume was 1,169 vplph (Q3).
Safety Impacts
17
Defining Target Crashes
We start by defining which crashes are materially affected by the speed enforcement cameras (“target” crashes)• Using all crashes would under-estimate the impact of the
program
Since the crashes during the peak periods are unlikely to be significantly affected by the photo enforcement cameras (speeds are constrained), target crashes are crashes that occurred during non-peak period.
We use time-of-day as a surrogate to determine whether crashes occurred ‘peak’ or ‘off-peak’
18
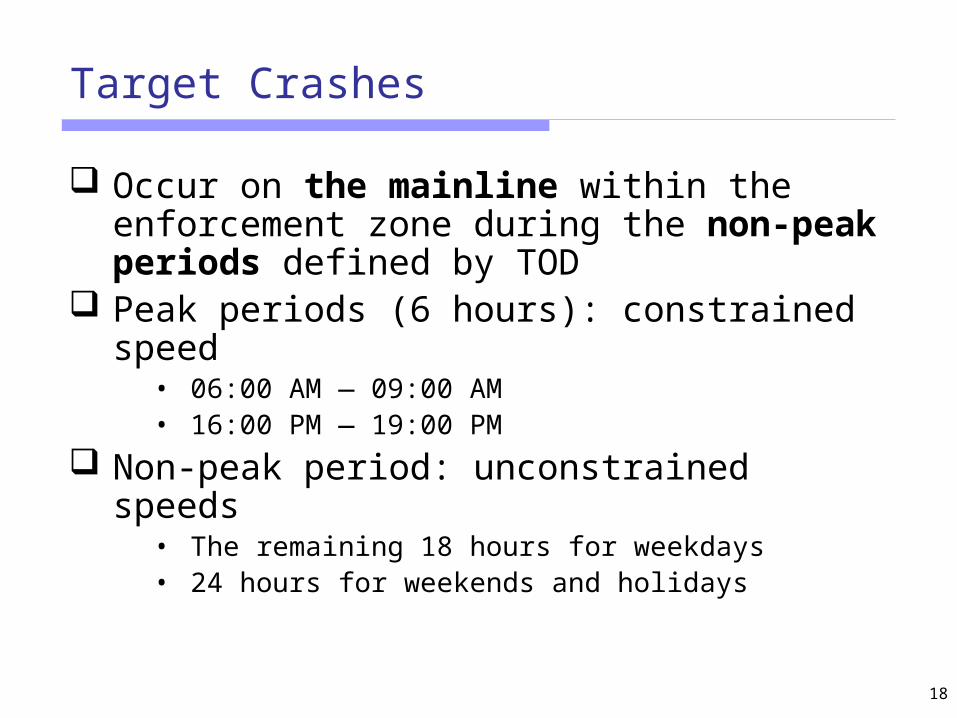
Target Crashes
Occur on the mainline within the enforcement zone during the non-peak periods defined by TOD
Peak periods (6 hours): constrained speed• 06:00 AM — 09:00 AM• 16:00 PM — 19:00 PM
Non-peak period: unconstrained speeds• The remaining 18 hours for weekdays• 24 hours for weekends and holidays
19
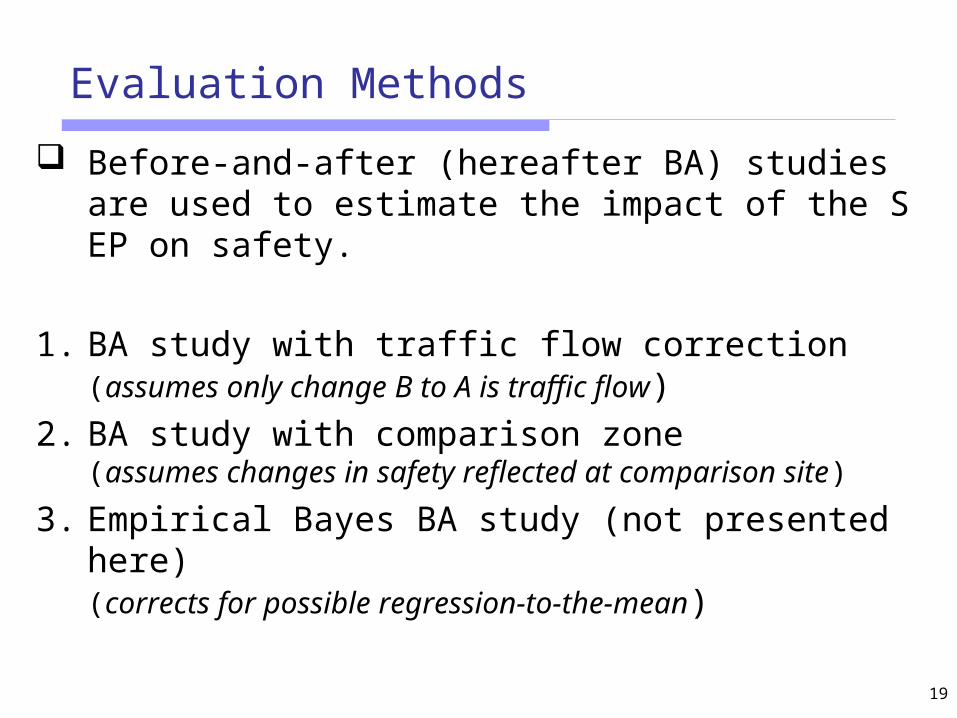
Evaluation Methods
Before-and-after (hereafter BA) studies are used to estimate the impact of the SEP on safety.
1. BA study with traffic flow correction (assumes only change B to A is traffic flow)
2. BA study with comparison zone(assumes changes in safety reflected at comparison site)
3. Empirical Bayes BA study (not presented here)(corrects for possible regression-to-the-mean)
20
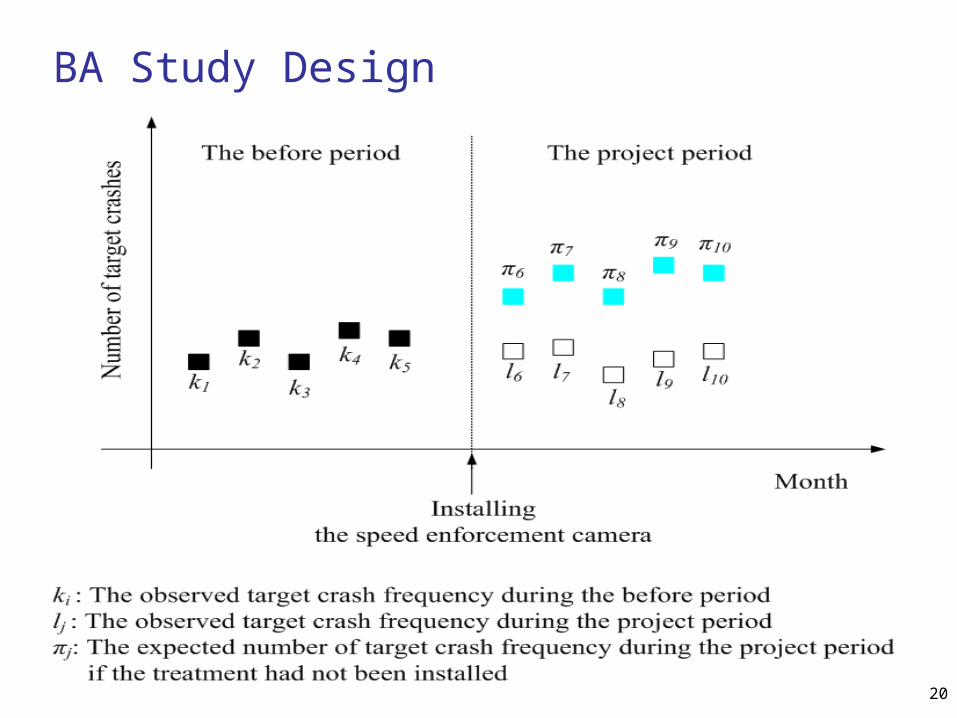
BA Study Design

21
Analysis I: BA Study with Traffic Flow Correction
Traffic flow is one of the most important factors affecting safety.
We modify predictions of safety ‘before’ by accounting for differences in traffic flow (denoted rtf)
100 crashes/yr with 100,000 AADT, for example, might be worth 200 crashes/yr with 200,000 AADT
22
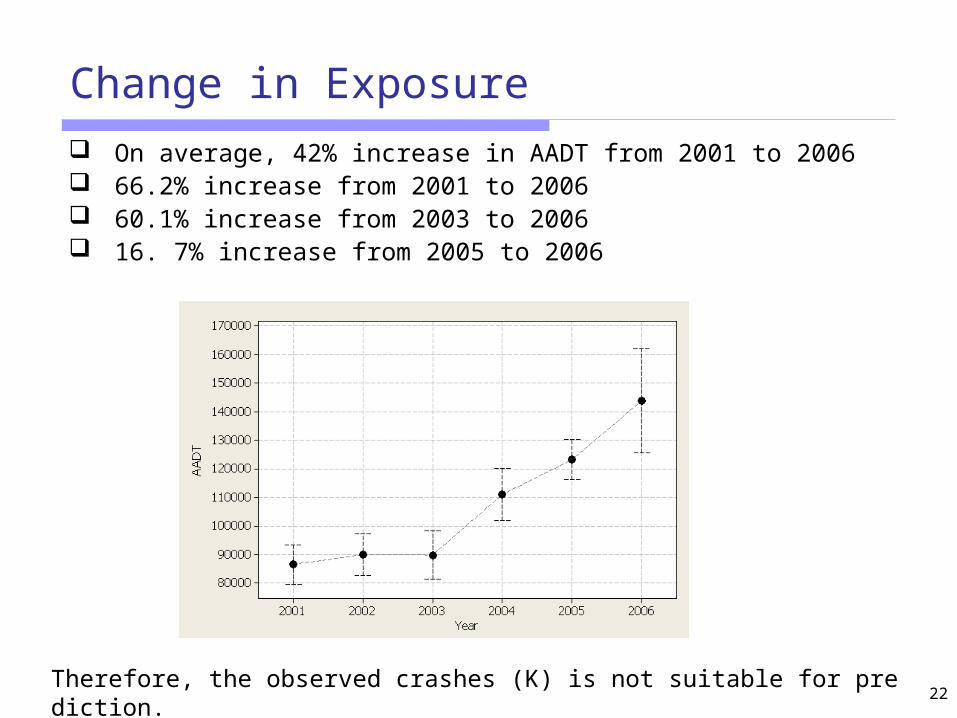
Change in Exposure
On average, 42% increase in AADT from 2001 to 2006 66.2% increase from 2001 to 2006 60.1% increase from 2003 to 2006 16. 7% increase from 2005 to 2006
Therefore, the observed crashes (K) is not suitable for prediction.

23
Analysis I: How we ‘quantify’ the impact of the SEP on safety
π (pi) is the predicted number of crashes after had the SEP not been installed
λ (lambda) is the observed number of crashes after Θ (theta) is the estimated index effectiveness of the SEP
Example: theta = 0.70 means that there is a 30% reduction in crashes, or Crashes (after) = 0.70*Crashes (before)
Δ is the reduction in accidents
Example: delta = 10, means 10 crashes reduced by the program

24
Results of the BA Study with rtf
Crash estimates Impact estimates Crash type and severity 1 2
Single Vehicle 51.18 19 0.37 (0.09) 3*** 32.18 (5.88)*** Side-swipe (same) 21.85 12 0.54 (0.17)** 9.85 (4.55)**
Rear-end 30.43 23 0.74 (0.18)* 7.43 (6.41)* All target crashes
Other 15.28 2 0.13 (0.09)*** 13.28 (2.79)*** Single Vehicle 10.37 6 0.56 (0.24)* 4.37 (3.02)*
Side-swipe (same) 4.83 2 0.39 (0.27)* 2.83 (1.89)* Rear-end 9.30 8 0.82 (0.33) 1.30 (3.57)
Injury crashes
Other 6.61 1 0.14 (0.13)*** 5.61 (2.11)** Single Vehicle 39.60 13 0.33 (0.09)*** 26.60 (4.97)***
Side-swipe (same) 16.82 10 0.58 (0.20)** 6.82 (4.13)** Rear-end 21.01 15 0.69 (0.21)* 6.01 (5.33)*
PDO crashes
Other 9.19 1 0.10 (0.10)*** 8.19 (2.02)*** Total target crashes 118.74 56 0.47 (0.07)*** 62.74 (10.50)*** Total injury crashes 31.12 17 0.54 (0.14)** 14.12 (5.43)** Total PDO crashes 86.62 39 0.45 (0.08)*** 47.62 (8.93)***
25
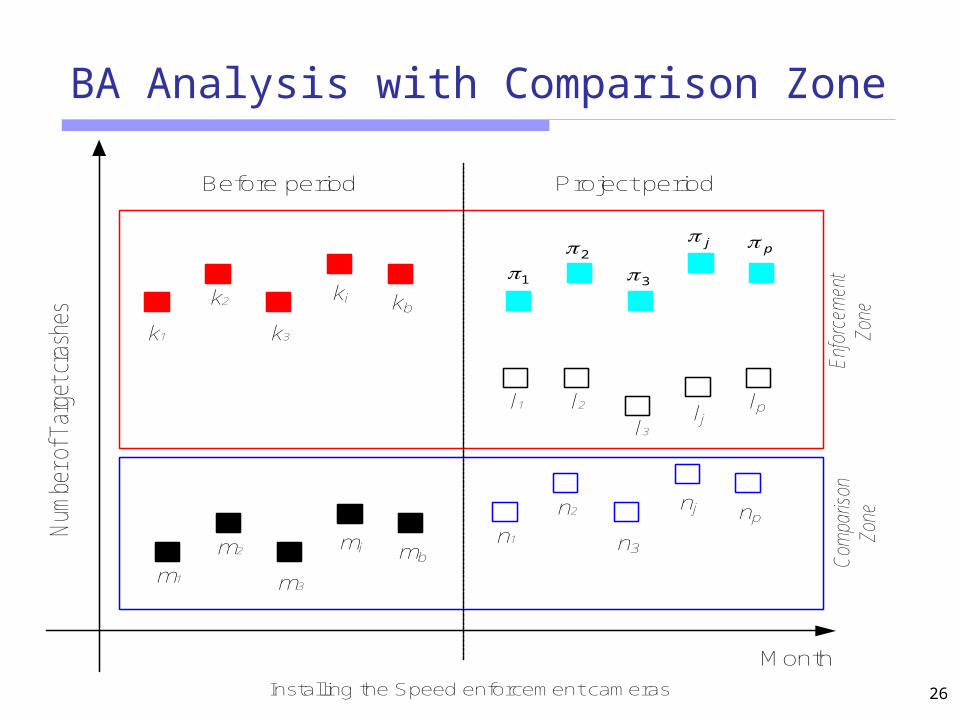
Analysis II: BA Study with Comparison Zone
In addition to the change in traffic flow between the two periods, it is often necessary to account for other changes as well (e.g. drivers, weather, enforcement, etc.)
The BA study with comparison group is routinely used to accomplish this…• The comparison group is selected based on its
similarity to the treatment group
26
BA Analysis with Comparison Zone
Month
Num
ber o
f Tar
get c
rash
es
Installing the Speed enforcement cameras
Before period Project period
m1
m2
l1 l2
m3
mi mb
l3
ljlp
12
3
jp
k2
k3
ki kb
k1
n1
n2
n3
nj np
Enfo
rcem
ent
Zone
Com
paris
on
Zone
27
(1)
Glendale
Northern
(2)
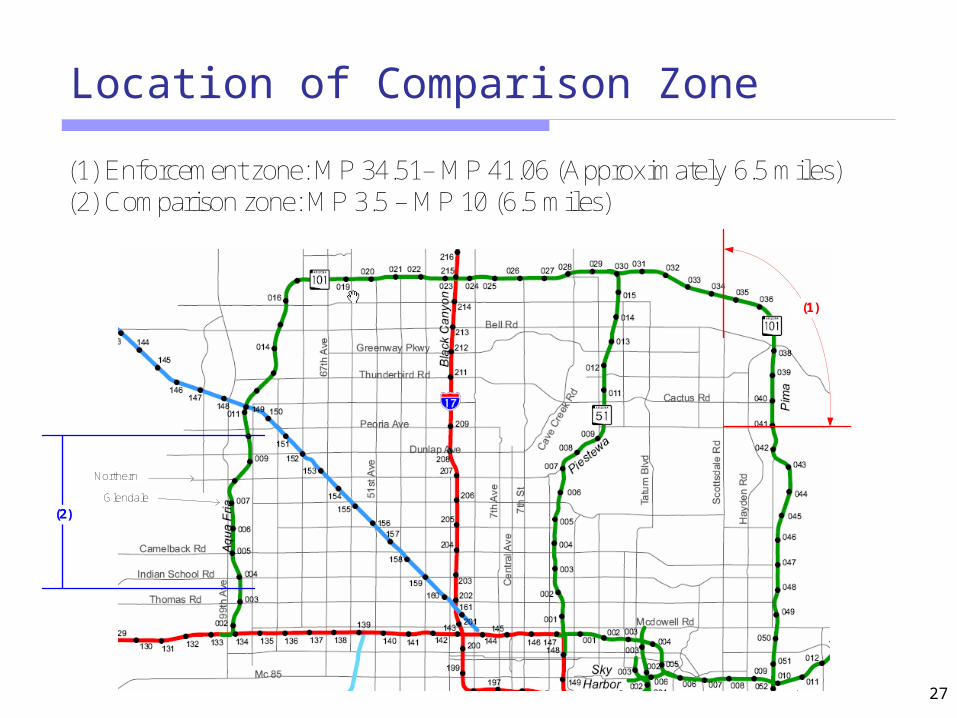
(1) Enforcement zone: MP 34.51– MP 41.06 (Approximately 6.5 miles)(2) Comparison zone: MP 3.5 – MP 10 (6.5 miles)
Location of Comparison Zone
28
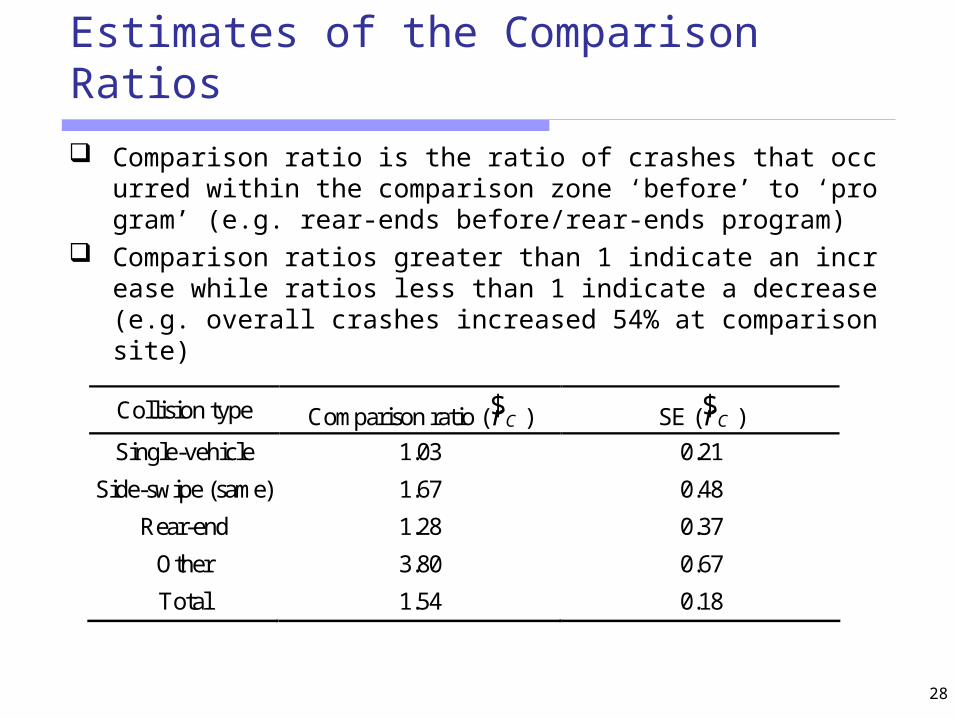
Estimates of the Comparison Ratios
Comparison ratio is the ratio of crashes that occurred within the comparison zone ‘before’ to ‘program’ (e.g. rear-ends before/rear-ends program)
Comparison ratios greater than 1 indicate an increase while ratios less than 1 indicate a decrease (e.g. overall crashes increased 54% at comparison site)
Collision type Comparison ratio ( Cr$ ) SE ( Cr$ )
Single-vehicle 1.03 0.21
Side-swipe (same) 1.67 0.48
Rear-end 1.28 0.37
Other 3.80 0.67
Total 1.54 0.18
29
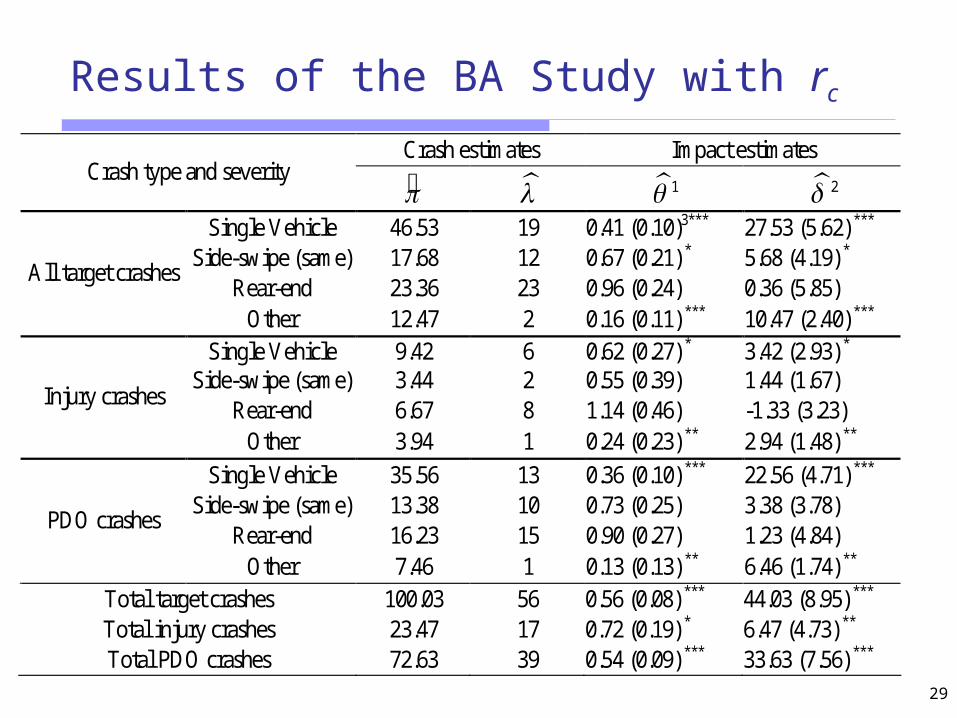
Results of the BA Study with rc
Crash estimates Impact estimates Crash type and severity 1 2
Single Vehicle 46.53 19 0.41 (0.10)3*** 27.53 (5.62) *** Side-swipe (same) 17.68 12 0.67 (0.21) * 5.68 (4.19) *
Rear-end 23.36 23 0.96 (0.24) 0.36 (5.85) All target crashes
Other 12.47 2 0.16 (0.11) *** 10.47 (2.40) *** Single Vehicle 9.42 6 0.62 (0.27) * 3.42 (2.93) *
Side-swipe (same) 3.44 2 0.55 (0.39) 1.44 (1.67) Rear-end 6.67 8 1.14 (0.46) -1.33 (3.23)
Injury crashes
Other 3.94 1 0.24 (0.23) ** 2.94 (1.48) **
Single Vehicle 35.56 13 0.36 (0.10) *** 22.56 (4.71) *** Side-swipe (same) 13.38 10 0.73 (0.25) 3.38 (3.78)
Rear-end 16.23 15 0.90 (0.27) 1.23 (4.84) PDO crashes
Other 7.46 1 0.13 (0.13) ** 6.46 (1.74) ** Total target crashes 100.03 56 0.56 (0.08) *** 44.03 (8.95) *** Total injury crashes 23.47 17 0.72 (0.19) * 6.47 (4.73) ** Total PDO crashes 72.63 39 0.54 (0.09) *** 33.63 (7.56) ***
Estimated Benefit of Photo Enforcement on Traffic Safety (Crash Costs)
31
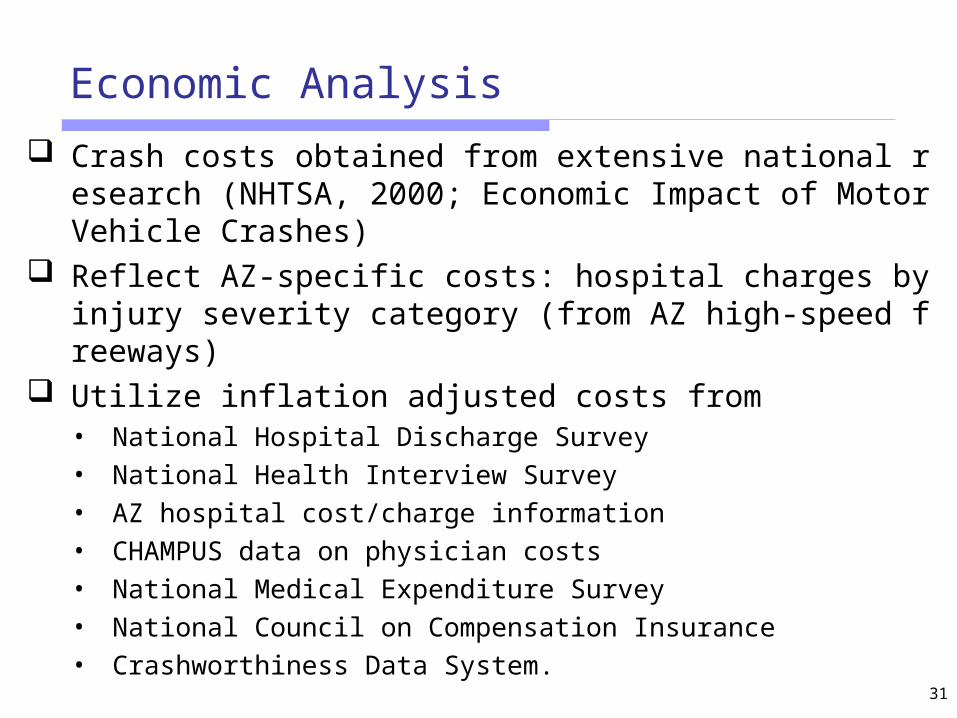
Economic Analysis
Crash costs obtained from extensive national research (NHTSA, 2000; Economic Impact of Motor Vehicle Crashes)
Reflect AZ-specific costs: hospital charges by injury severity category (from AZ high-speed freeways)
Utilize inflation adjusted costs from • National Hospital Discharge Survey
• National Health Interview Survey
• AZ hospital cost/charge information
• CHAMPUS data on physician costs
• National Medical Expenditure Survey
• National Council on Compensation Insurance
• Crashworthiness Data System.
32
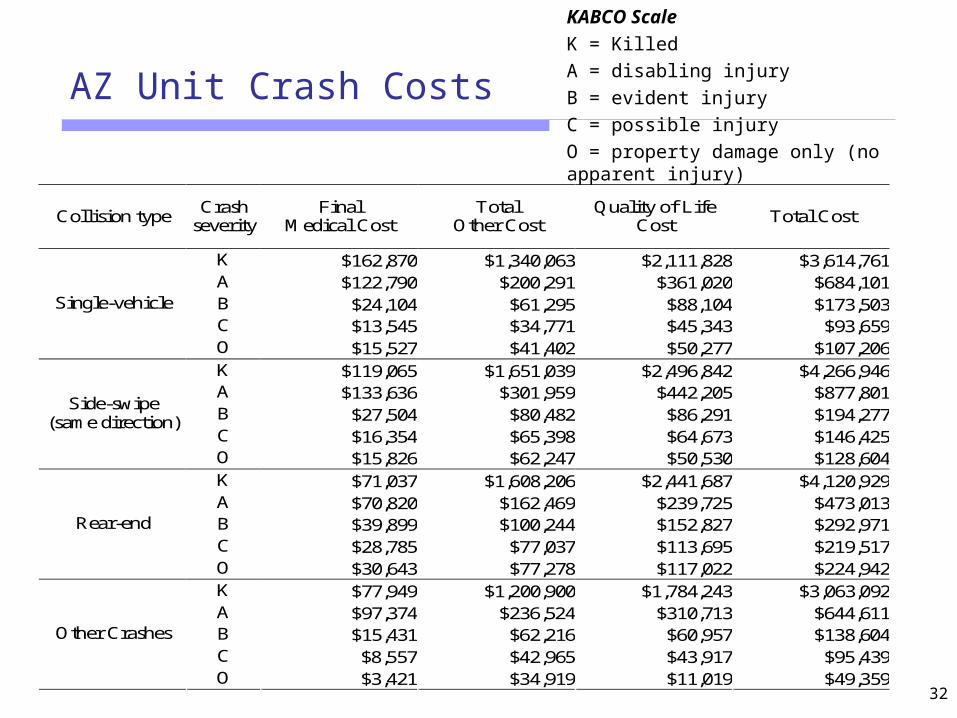
AZ Unit Crash Costs
Collision type Crash
severity Final
Medical Cost Total
Other Cost Quality of Life
Cost Total Cost
K $162,870 $1,340,063 $2,111,828 $3,614,761 A $122,790 $200,291 $361,020 $684,101 B $24,104 $61,295 $88,104 $173,503 C $13,545 $34,771 $45,343 $93,659
Single-vehicle
O $15,527 $41,402 $50,277 $107,206 K $119,065 $1,651,039 $2,496,842 $4,266,946 A $133,636 $301,959 $442,205 $877,801 B $27,504 $80,482 $86,291 $194,277 C $16,354 $65,398 $64,673 $146,425
Side-swipe (same direction)
O $15,826 $62,247 $50,530 $128,604 K $71,037 $1,608,206 $2,441,687 $4,120,929 A $70,820 $162,469 $239,725 $473,013 B $39,899 $100,244 $152,827 $292,971 C $28,785 $77,037 $113,695 $219,517
Rear-end
O $30,643 $77,278 $117,022 $224,942 K $77,949 $1,200,900 $1,784,243 $3,063,092 A $97,374 $236,524 $310,713 $644,611 B $15,431 $62,216 $60,957 $138,604 C $8,557 $42,965 $43,917 $95,439
Other Crashes
O $3,421 $34,919 $11,019 $49,359
KABCO Scale
K = Killed
A = disabling injury
B = evident injury
C = possible injury
O = property damage only (no apparent injury)
33
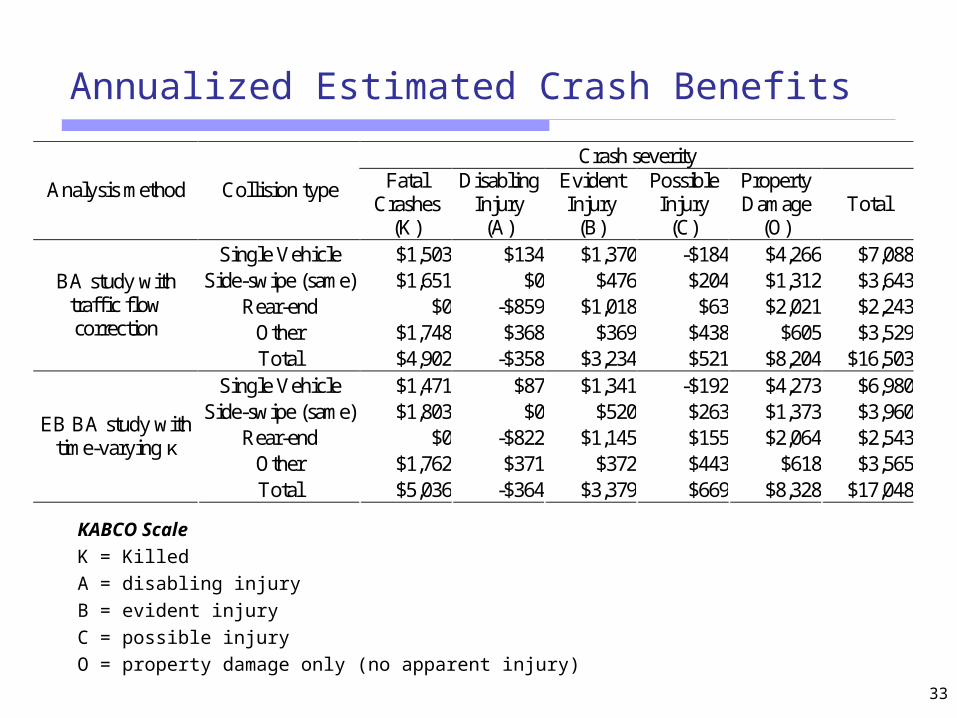
Annualized Estimated Crash Benefits
KABCO Scale
K = Killed
A = disabling injury
B = evident injury
C = possible injury
O = property damage only (no apparent injury)
Crash severity
Analysis method Collision type Fatal Crashes
(K)
Disabling Injury
(A)
Evident Injury
(B)
Possible Injury
(C)
Property Damage
(O) Total
Single Vehicle $1,503 $134 $1,370 -$184 $4,266 $7,088 Side-swipe (same) $1,651 $0 $476 $204 $1,312 $3,643
Rear-end $0 -$859 $1,018 $63 $2,021 $2,243 Other $1,748 $368 $369 $438 $605 $3,529
BA study with traffic flow correction
Total $4,902 -$358 $3,234 $521 $8,204 $16,503 Single Vehicle $1,471 $87 $1,341 -$192 $4,273 $6,980
Side-swipe (same) $1,803 $0 $520 $263 $1,373 $3,960 Rear-end $0 -$822 $1,145 $155 $2,064 $2,543
Other $1,762 $371 $372 $443 $618 $3,565
EB BA study with time-varying κ
Total $5,036 -$364 $3,379 $669 $8,328 $17,048
Conclusions

35
Scottsdale 101 Program Conclusions
Speeding detection frequency (speeds ≥ 76 mph) increased by a factor of 10.5 after the SEP was temporarily terminated. During this termination the cameras were “bagged” and advertising and news media advertised the end of the program.
The Scottsdale 101 SEP appears to be an effective deterrent to speeding in excess of 75 mph.
The SEP not only reduced the average speed at the enforcement camera sites by about 9 mph, but also contributed to reducing the speed dispersion at the enforcement camera sites. Thus, as prior research has revealed, both the prerequisites for crash reduction (safety improvement) are met with the SEP.
The reduction in the mean and variance of speed resulting from the SEP depends on traffic flow.
36
Scottsdale 101 Program Conclusions (cntd.)
The total number of target crashes was reduced by about 54%, the total number of injury crashes by about 48%, and the total number of PDO crashes decreased by about 56%.
All but rear-end crashes types appear to have been reduced. Although the changes in safety for rear-end crashes were inconsistent among evaluation methods, the increase in rear-end crashes was not significant.
Swapping of crash types is common for safety countermeasures—many countermeasures exhibit the ‘crash swapping’ phenomenon observed in this study (left-turn channelization, red-light cameras, conversion of stop signs to signals, etc.).
The total estimated SEP benefits range from an estimated $16.5 M to $17.1 M per year.
The speed enforcement camera is a promising countermeasure to reduce crashes in Arizona, which is consistent with findings in other countries.

37
38
Scottsdale 101 Program Conclusions (cntd.)
There is no significant difference in the total free-flow travel time with and without the SEP, suggesting that drivers can travel in the enforcement zone in the same acceptable amount of travel time regardless of the existence of the SEP.
The insignificant difference in total free-flow travel time with and without the SEP conditions led to total travel time savings, which resulted from the reduction in crash frequency. The reduction was at least ‘569 vehicle-hours/year’ when assuming the 1-lane block crash state and at least ’37,981 vehicle-hours/year’ when assuming the 2-lane block crash state.
This research raises serious doubts as to the validity of arguments against photo speed enforcement on the grounds of reduced mobility; in fact we show that photo speed enforcement not only improves safety but also improves mobility through travel time savings, improved travel time reliability, and reduced travel time uncertainty in Arizona, which is consistent with findings in other countries.

39