Evaluation of Regular Multistory Buildings Using IBC2009...
23
Open Journal of Civil Engineering, 2016, 6, 595-617 http://www.scirp.org/journal/ojce ISSN Online: 2164-3172 ISSN Print: 2164-3164 DOI: 10.4236/ojce.2016.64049 September 16, 2016 Evaluation of Regular Multistory Buildings Using IBC2009 Code and ESEE Regulations by Pushover Analysis Method Mohamed Sobaih 1 , Ahmed Mousa 2 1 Department of Structural Engineering, Cairo University, Gize, Egypt 2 Frederick University, Nicosia, Cyprus Abstract For structural design and assessment of reinforced concrete members, the nonlinear analysis has become an important tool. The purpose of the pushover analysis is to assess the structural performance by estimating the strength and deformation capaci- ties using static, nonlinear analysis and comparing these capacities with the demands at the corresponding performance levels. This paper aims to compare the results given by IBC2009 code and ESEE regulations. In this paper, four RC frames having 5, 15, 20 and 30 storeys were designed for seismicity according to both the recently adopted seismic code in Abu Dhabi (IBC2009) and the ESEE regulations. A pushover analysis is carried out for these buildings using SAP2000 (Ver. 15) and the ultimate capacities of the buildings are established. The obtained pushover curves and plastic hinges distributions are used to compare between the IBC2009 code and ESEE regu- lations. The comparison showed that there was variation in the obtained results by the two codes and the buildings designed by IBC2009 code were more vulnerable. Keywords Pushover Analysis, Seismic Evaluation, ESEE Regulations, IBC2009 Code, Abu Dhabi 1. Introduction Recently, the nonlinear static analysis (NSA) method has emerged as an attractive me- thod for evaluating the performance of new and existing buildings. This is primarily because of the ability of the NSA method to provide estimates of the expected inelastic deformation demands and to help identify design flaws that would be otherwise ob- How to cite this paper: Sobaih, M. and Mousa, A. (2016) Evaluation of Regular Multistory Buildings Using IBC2009 Code and ESEE Regulations by Pushover Analysis Method. Open Journal of Civil Engineering, 6, 595-617. http://dx.doi.org/10.4236/ojce.2016.64049 Received: June 4, 2016 Accepted: September 12, 2016 Published: September 16, 2016 Copyright © 2016 by authors and Scientific Research Publishing Inc. This work is licensed under the Creative Commons Attribution International License (CC BY 4.0). http://creativecommons.org/licenses/by/4.0/ Open Access
Transcript of Evaluation of Regular Multistory Buildings Using IBC2009...
Open Journal of Civil Engineering, 2016, 6, 595-617 http://www.scirp.org/journal/ojce
ISSN Online: 2164-3172 ISSN Print: 2164-3164
DOI: 10.4236/ojce.2016.64049 September 16, 2016
Evaluation of Regular Multistory Buildings Using IBC2009 Code and ESEE Regulations by Pushover Analysis Method
Mohamed Sobaih1, Ahmed Mousa2
1Department of Structural Engineering, Cairo University, Gize, Egypt 2Frederick University, Nicosia, Cyprus
Abstract For structural design and assessment of reinforced concrete members, the nonlinear analysis has become an important tool. The purpose of the pushover analysis is to assess the structural performance by estimating the strength and deformation capaci-ties using static, nonlinear analysis and comparing these capacities with the demands at the corresponding performance levels. This paper aims to compare the results given by IBC2009 code and ESEE regulations. In this paper, four RC frames having 5, 15, 20 and 30 storeys were designed for seismicity according to both the recently adopted seismic code in Abu Dhabi (IBC2009) and the ESEE regulations. A pushover analysis is carried out for these buildings using SAP2000 (Ver. 15) and the ultimate capacities of the buildings are established. The obtained pushover curves and plastic hinges distributions are used to compare between the IBC2009 code and ESEE regu-lations. The comparison showed that there was variation in the obtained results by the two codes and the buildings designed by IBC2009 code were more vulnerable.
Keywords Pushover Analysis, Seismic Evaluation, ESEE Regulations, IBC2009 Code, Abu Dhabi
1. Introduction
Recently, the nonlinear static analysis (NSA) method has emerged as an attractive me-thod for evaluating the performance of new and existing buildings. This is primarily because of the ability of the NSA method to provide estimates of the expected inelastic deformation demands and to help identify design flaws that would be otherwise ob-
How to cite this paper: Sobaih, M. and Mousa, A. (2016) Evaluation of Regular Multistory Buildings Using IBC2009 Code and ESEE Regulations by Pushover Analysis Method. Open Journal of Civil Engineering, 6, 595-617. http://dx.doi.org/10.4236/ojce.2016.64049 Received: June 4, 2016 Accepted: September 12, 2016 Published: September 16, 2016 Copyright © 2016 by authors and Scientific Research Publishing Inc. This work is licensed under the Creative Commons Attribution International License (CC BY 4.0). http://creativecommons.org/licenses/by/4.0/
Open Access
M. Sobaih, A. Mousa
596
scured in a linear analysis of the building. In addition, the features of the NSA method are available to the structural engineer without the modeling and computational effort of a nonlinear time-history analysis. Therefore, extensive research efforts have been devoted to investigatingthe structural behavior under seismic loads by using pushover analysis.
Sung et al. (2013) [1] investigated the shear failure behavior of beam-column joints (BCJs) of RC frame structures by the means of nonlinear static pushover analysis (NSPA). The authors proposed a new NSPA procedure to assess effectively the shear failure of BCJs and its seismic capacity and the progressive failure of the joints. Fur-thermore, they provided novel plastic hinges (PHS) characteristics of BCJs and an in-novative cross-strut model to simulate detailed joint behavior in NSPA. The analytically derived pushover curves were compared to three different full-scaled RC frames to va-lidate the proposed methodology.
Hassaballa et al. (2014) [2] performed a 3D NSPA to study the performance of exist-ing four-storey RC flat slab building in both positive and negative X and Y directions separately. The evaluation was carried out by using SAP2000 software (Ver. 14) [3]. It was observed from the analysis that the building was not safe and needed retrofitting in the X-direction because there were some elements exceeded the limit level between life safety (LS) and collapse prevention (CP), whereas, all structural elements did not reach the limit in Y-direction.
Maske et al. (2014) [4] performed 3D NSPA on 5 and 15 storeys frame structures us-ing SAP2000 software (Ver. 14). A detailed description of pushover method and capac-ity curve properties was presented. In addition, the authors evaluated different parame-ters that affected seismic assessment of frame structures, e.g. pushover and capacity curves. It was concluded that the considered case studies performed reasonably under seismic loads.
Choudhary and Wadia (2014) [5] investigated the effect of shear walls on the seismic performance of the RC frame structures. Two case studies were considered in the anal-ysis, in which one was symmetrical building and the other was unsymmetrical building (i.e. L-shaped building). It was found that providing shear walls led to a significant de-crease in both buildings. Moreover, placing the shear walls in the short direction is mandatory for the unsymmetrical building since they provide more reduction in roof displacement.
Aleksieva (2015) [6] conducted a comparative study between the NSPA and incre-mental dynamic analysis (IDA) to investigate the structural behavior of a RC three- storey frame building under the seismic loading. The aim of the paper was to highlight the advantages of each method and their applicability in structural seismic design. The OpenSees software [7] was used to conduct the analysis of the building. It was con-cluded that the pushover analysis produced accurate results in the elastic region, whe-reas the results were very conservative in the nonlinear region.
Kadlag and Kenkar (2016) [8] performed a parametric study to investigate the im-pact of the variation of bay width and base condition on the structural behavior of RC

M. Sobaih, A. Mousa
597
frames by the means of pushover analysis. To investigate the soil-structure interaction (SSI) effects, three base conditions were considered which were fixed base, medium soil and soft soil. Moreover, the RC framed buildings’ height was G + 10, G + 15 and G + 20 and the width varied from 4 to 5 meters. It was observed that with the increase of bay width and building height, the number of failed PHs was increasing as well for all the base conditions.
Keerthan and Babu (2016) [9] carried out a pushover analysis on 3D 10 storeys RC frames in order to investigate the effect of mass irregularities on the structural behavior under severe earthquakes. ETABS software (Ver. 9.7) was used to carry out the pu-shover analysis. The main findings of study were that the increase in lateral displace-ment of mass irregular frame was promotional to the heavy mass floor level. Further-more, the mass irregular RC frames experienced significant interstorey drifts compared to the regular RC frames.
The focus of this paper is on the evaluation of the nonlinear performance of regular multi-storey reinforced concrete buildings using the NSA and pushover analysis under the loads of the IBC2009 [10] and the Regulations of the Egyptian Society for Earth-quake Engineering (ESEE) [11]. Moreover, the obtained pushover curves and plastic hinges distributions are used to compare between the IBC2009 code and ESEE regula-tions. The outcome of this study is to check the vulnerability of both codes, and to pro-vide useful information for further seismic designs in UAE.
2. Pushover Analysis
Pushover analysis is a static nonlinear procedure in which the magnitude of the lateral force is incrementally increased, maintaining the predefined distribution pattern along the height of the building. With the increase in the magnitude of the loads, weak links and failure modes of the building are found [12]. Pushover analysis can determine the behavior of a building, including the ultimate load and the maximum inelastic deflec-tion. Local nonlinear effects are modeled and the structure is pushed until a collapse mechanism gets developed. At each step, the base shear and the roof displacement can be plotted to generate the pushover curve. It gives an idea of the maximum base shear that the structure was capable of resisting at the time of the earthquake. For regular buildings, it can also give an estimate about the global stiffness of the building [13].
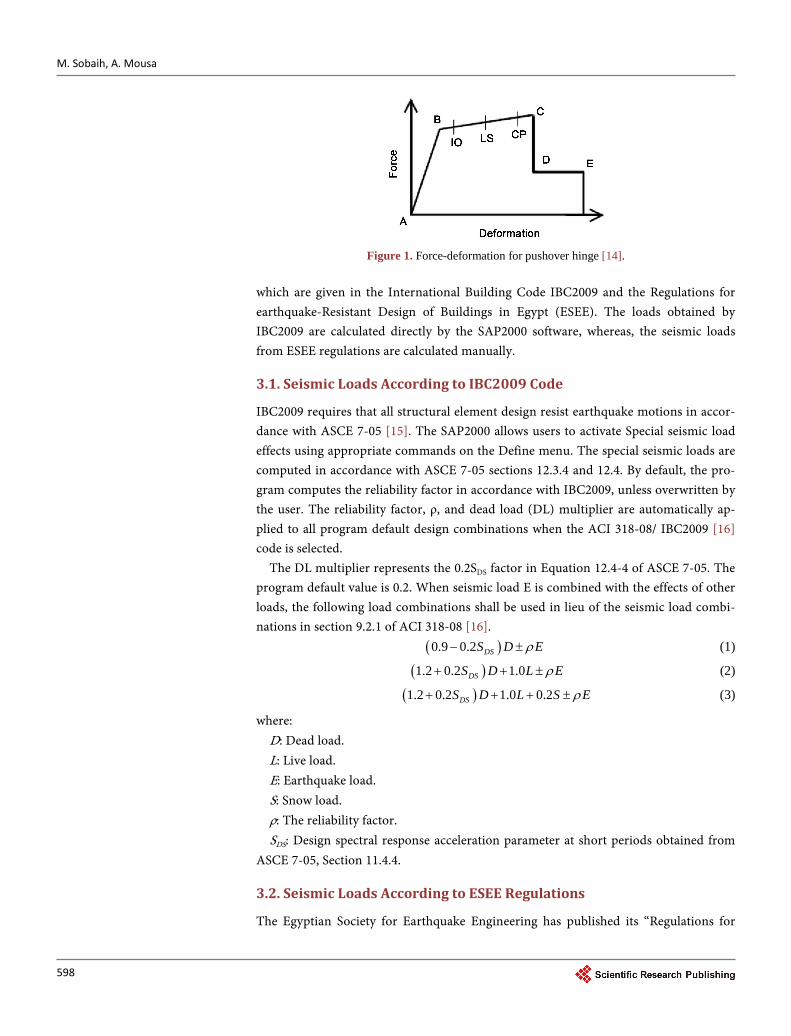
In this paper, the lateral loads were applied monotonically in a step-by-step nonli-near static analysis. The applied lateral loads were accelerations in the x direction representing the forces that would be experienced by the structures when subjected to ground shaking. Under incrementally increasing loads some elements may yield se-quentially. Consequently, at each event, the structures experiences a stiffness change as shown in Figure 1, where IO, LS and CP stand for immediate occupancy, life safety and collapse prevention, respectively.
3. Earthquake Loads
The seismic loads applied on the frame building are calculated according to the rules
M. Sobaih, A. Mousa
598
Figure 1. Force-deformation for pushover hinge [14].
which are given in the International Building Code IBC2009 and the Regulations for earthquake-Resistant Design of Buildings in Egypt (ESEE). The loads obtained by IBC2009 are calculated directly by the SAP2000 software, whereas, the seismic loads from ESEE regulations are calculated manually.
3.1. Seismic Loads According to IBC2009 Code
IBC2009 requires that all structural element design resist earthquake motions in accor-dance with ASCE 7-05 [15]. The SAP2000 allows users to activate Special seismic load effects using appropriate commands on the Define menu. The special seismic loads are computed in accordance with ASCE 7-05 sections 12.3.4 and 12.4. By default, the pro-gram computes the reliability factor in accordance with IBC2009, unless overwritten by the user. The reliability factor, ρ, and dead load (DL) multiplier are automatically ap-plied to all program default design combinations when the ACI 318-08/ IBC2009 [16] code is selected.
The DL multiplier represents the 0.2SDS factor in Equation 12.4-4 of ASCE 7-05. The program default value is 0.2. When seismic load E is combined with the effects of other loads, the following load combinations shall be used in lieu of the seismic load combi-nations in section 9.2.1 of ACI 318-08 [16].
( )0.9 0.2 DSS D Eρ− ± (1)
( )1.2 0.2 1.0DSS D L Eρ+ + ± (2)
( )1.2 0.2 1.0 0.2DSS D L S Eρ+ + + ± (3)
where: D: Dead load. L: Live load. E: Earthquake load. S: Snow load. ρ: The reliability factor. SDS: Design spectral response acceleration parameter at short periods obtained from
ASCE 7-05, Section 11.4.4.
3.2. Seismic Loads According to ESEE Regulations
The Egyptian Society for Earthquake Engineering has published its “Regulations for

M. Sobaih, A. Mousa
599
earthquake-Resistant Design of Buildings in Egypt”. These regulations have been proven to be more adequate for seismic safety of buildings in Egypt. It was recom-mended that these regulations be compared with international codes. Therefore, it has been chosen in this paper to compare these Regulations by the results obtained by ap-plying the used code in Abu Dhabi.
Using the static lateral force procedure and according to the Regulations of the Egyp-tian Society for Earthquake Engineering (ESEE 1988) [12] every building shall be de-signed and constructed to withstand a total horizontal seismic force (V) and estimated as explained in section 3.11.1 and clause 2.3.2.1 of the ESEE Regulations. According to ESEE, the total seismic base shear force V is determined as follows:
s tV C W= (4)
where: V is the total horizontal seismic force at the base, Cs is the seismic coefficient deter-
mined as follows: ( )4.8sC ZISMRQ ZIMQ= ≤ (5)
where: Z is the seismic zoning factor and shall be determined according to the equation
(3.17) as follows: Z ACF= (6)
where: A is a standard value for horizontal acceleration ratio. C is the coefficient of the standardized response spectrum for average damping of
5%. F is the foundation soil factor. I is the importance factor. S is the Structural system type factor. M is the material factor. R is the risk factor. Q is the construction quality factor. Wt is the total weight, and it is evaluated from:
1
n
t ii
W W=
=∑ (7)
i i iW D pL= + (8)
where Di is the total dead load for the ith floor, Li is the total live load for the ith floor, and p is the incidence factor for live load as seen in Table 1. Table 1. Incidence factor for live loads “p”.
Type of Structure p
Residential buildings, hotels, offices, hospitals, public buildings, etc. 0.25
Storage areas and warehouses1. 0.5 1Tanks, reservoirs, silos and the like shall be considered to contain their full contents.
M. Sobaih, A. Mousa
600
The seismic coefficient CS shall not be taken greater than (4.8ZIMQ) and shall—in no case—be taken less than (0.02) in non-zero seismic zones.
Distribution of Horizontal Seismic Forces: For a regular building, the total base shear calculated from Equation (4) shall be dis-
tributed over the height of the building laterally, the equation of distribution is:
( )1
i ii tn
i ii
W hF V F
W h=
= − ∑
(9)
where: Fi is that part of the total horizontal seismic force assigned to the ith floor. Wi is the total load on the ith floor. hi is the height over the base to the level of the ith floor. V is the total base shear. Ft is additional concentrated force at top storey and shall be determined as follows: Ft = 0.0 for H/d < 3.0 m; Ft = 0.1 V for H/d > 3.0 m; Ft = 0.2 V for chimneys and smoke-stacks resting on the ground;
where H/d is the height to width ratio of the building.
4. Description of Studied Cases
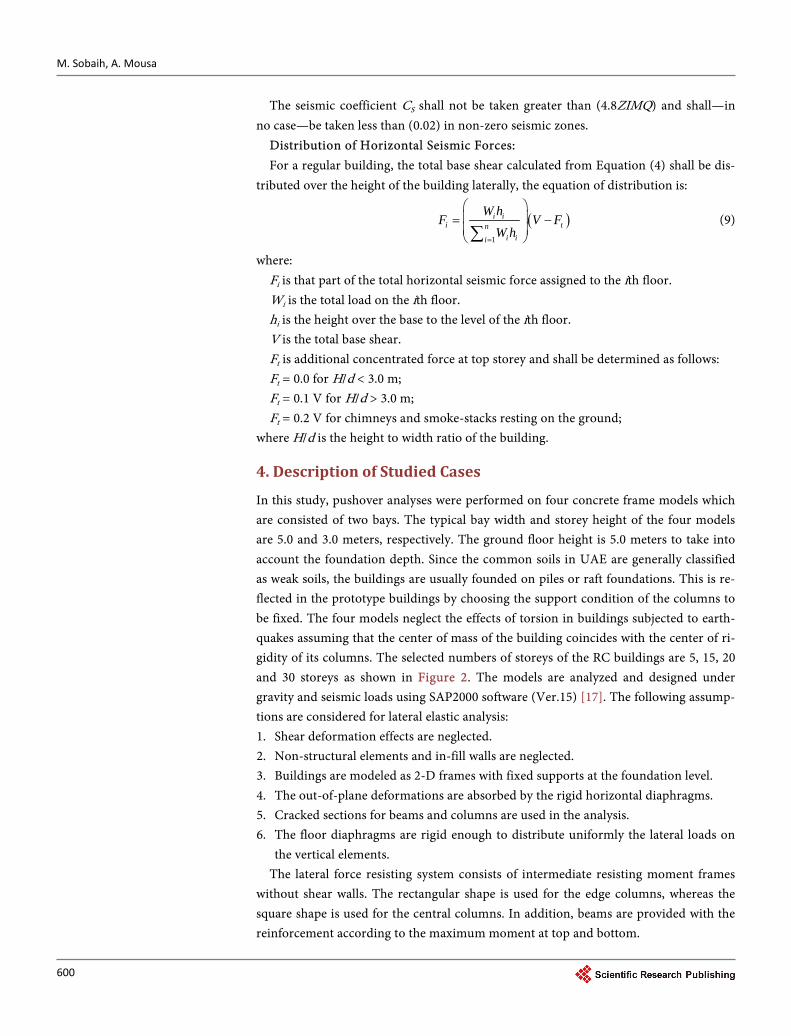
In this study, pushover analyses were performed on four concrete frame models which are consisted of two bays. The typical bay width and storey height of the four models are 5.0 and 3.0 meters, respectively. The ground floor height is 5.0 meters to take into account the foundation depth. Since the common soils in UAE are generally classified as weak soils, the buildings are usually founded on piles or raft foundations. This is re-flected in the prototype buildings by choosing the support condition of the columns to be fixed. The four models neglect the effects of torsion in buildings subjected to earth-quakes assuming that the center of mass of the building coincides with the center of ri-gidity of its columns. The selected numbers of storeys of the RC buildings are 5, 15, 20 and 30 storeys as shown in Figure 2. The models are analyzed and designed under gravity and seismic loads using SAP2000 software (Ver.15) [17]. The following assump-tions are considered for lateral elastic analysis: 1. Shear deformation effects are neglected. 2. Non-structural elements and in-fill walls are neglected. 3. Buildings are modeled as 2-D frames with fixed supports at the foundation level. 4. The out-of-plane deformations are absorbed by the rigid horizontal diaphragms. 5. Cracked sections for beams and columns are used in the analysis. 6. The floor diaphragms are rigid enough to distribute uniformly the lateral loads on
the vertical elements. The lateral force resisting system consists of intermediate resisting moment frames
without shear walls. The rectangular shape is used for the edge columns, whereas the square shape is used for the central columns. In addition, beams are provided with the reinforcement according to the maximum moment at top and bottom.
M. Sobaih, A. Mousa
601
Figure 2. Models of 5, 15, 20 and 30-storey buildings.
5. Results and Discussion
This part presents the results of the analysis and design of considered RC buildings. It also provides a through comparison between the IBC2009 code and the ESEE regula-tions to investigate which code produces buildings that are more vulnerable.
5.1. Beams Sections Design
All the beam elements are designed to withstand the maximum bending moments and shear forces applied on them. The section properties for IBC2009 code and ESEE regu-lations are shown in Table 2; both codes have the same reinforcement for beams.
5.2. Columns Sections Design
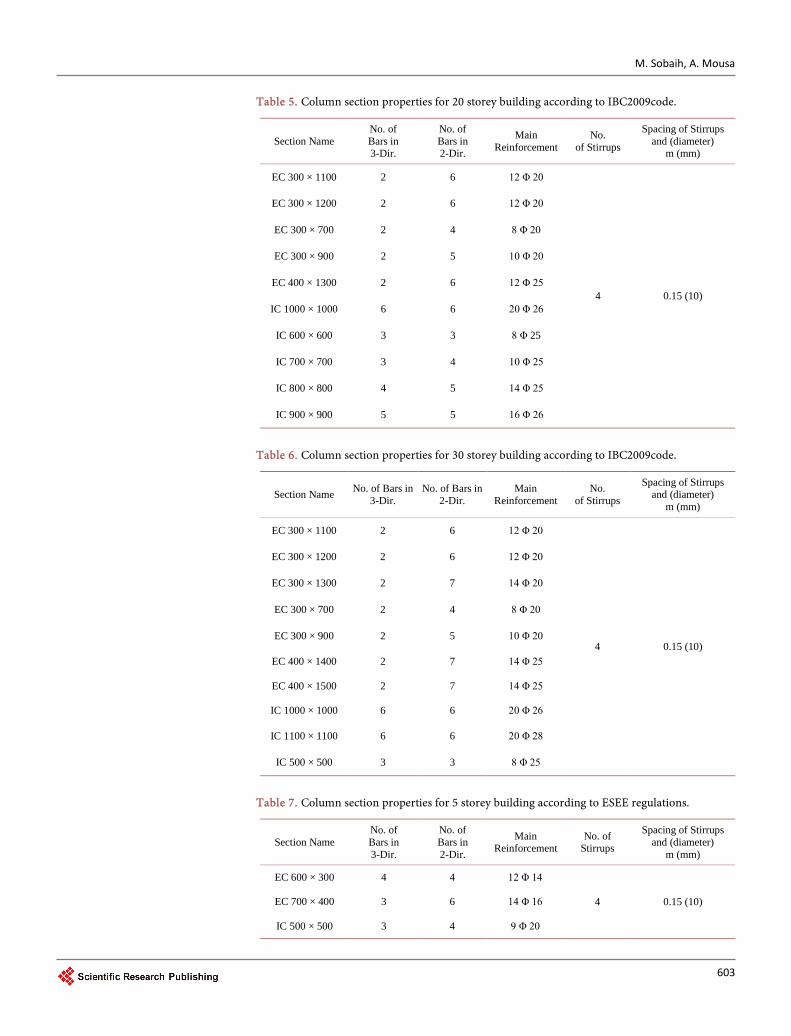
All the columns elements are designed to withstand the maximum bending moments and axial forces that are applied on them. Tables 3-6 show the designed columns ac-cording to IBC2009 code. Similarly, Tables 7-10 shows the designed columns accord-ing to ESEE regulations.
5.3. Comparison of Pushover Curves
Figures 3-6 show the differences between each building using the IBC2009 code with its identical case using the ESEE regulations.
From the comparison of the 5-storey with its identical case in the ESEE regulations as shown in Figure 3, we can notice that there are obvious differences in values be-tween the two codes. The ESEE regulations gives mush larger base shear, but they are similar to each other in terms of total displacement.
From the comparison of the 15-storey as shown in Figure 4, we found that the base

M. Sobaih, A. Mousa
602
Table 2. Beam section properties according to IBC2009 code and ESEE regulations.
Building Floors Section Name Reinforcement Top Reinforcement Bot
5 Storey 1 to 4 B 250 × 500 5 Φ 14 5 Φ 14
5 B 250 × 500 5 Φ 12 5 Φ 10
15 Storey
12 to 15 B 250 × 600 4 Φ 14 4 Φ 12
7 to 11 B 250 × 700 4 Φ 14 4 Φ 12
1 to 6 B 250 × 800 5 Φ 14 4 Φ 12
20 Storey
15 to 20 B 250 × 600 4 Φ 14 5 Φ 12
9 to 14 B 250 × 700 4 Φ 14 4 Φ 12
1 to 8 B 250 × 800 5 Φ 14 4 Φ 12
30 Storey
23 to 30 B 250 × 600 4 Φ 14 3 Φ 14
17 to 22 B 250 × 700 4 Φ 14 4 Φ 12
10 to 16 B 250 × 800 5 Φ 14 4 Φ 12
1 to 9 B 250 × 900 5 Φ 14 4 Φ 12
Table 3. Column section properties for 5 storey building according to IBC2009 code.
Section Name No. of Bars in 3-Dir.
No. of Bars in 2-Dir.
Main Reinforcement
No. of Stirrups
Spacing of Stirrups and (diameter)
m (mm)
EC 600 × 300 4 4 12 Φ 14
4 0.15 (10) EC 700 × 400 3 6 14 Φ 16
IC 600 × 600 3 3 8 Φ 20
Table 4. Column section properties for 15 storey building according to IBC2009code.
Section Name No. of Bars in 3-Dir.
No. of Bars in 2-Dir.
Main Reinforcement
No. of Stirrups
Spacing of Stirrups and (diameter)
m (mm)
EC 300 × 1000 2 5 10 Φ 20
4 0.15 (10)
EC 300 × 1100 3 4 12 Φ 20
EC 300 × 700 2 4 8 Φ 20
EC 300 × 800 2 4 8 Φ 20
EC 300 × 900 2 5 10 Φ 20
IC 500 × 500 3 3 8 Φ 25
IC 600 × 600 3 3 8 Φ 25
IC 700 × 700 3 4 10 Φ 25
IC 800 × 800 4 5 14 Φ 25
IC 900 × 900 4 5 14 Φ 28
M. Sobaih, A. Mousa
603
Table 5. Column section properties for 20 storey building according to IBC2009code.
Section Name No. of Bars in 3-Dir.
No. of Bars in 2-Dir.
Main Reinforcement
No. of Stirrups
Spacing of Stirrups and (diameter)
m (mm)
EC 300 × 1100 2 6 12 Φ 20
4 0.15 (10)
EC 300 × 1200 2 6 12 Φ 20
EC 300 × 700 2 4 8 Φ 20
EC 300 × 900 2 5 10 Φ 20
EC 400 × 1300 2 6 12 Φ 25
IC 1000 × 1000 6 6 20 Φ 26
IC 600 × 600 3 3 8 Φ 25
IC 700 × 700 3 4 10 Φ 25
IC 800 × 800 4 5 14 Φ 25
IC 900 × 900 5 5 16 Φ 26
Table 6. Column section properties for 30 storey building according to IBC2009code.
Section Name No. of Bars in 3-Dir.
No. of Bars in 2-Dir.
Main Reinforcement
No. of Stirrups
Spacing of Stirrups and (diameter)
m (mm)
EC 300 × 1100 2 6 12 Φ 20
4 0.15 (10)
EC 300 × 1200 2 6 12 Φ 20
EC 300 × 1300 2 7 14 Φ 20
EC 300 × 700 2 4 8 Φ 20
EC 300 × 900 2 5 10 Φ 20
EC 400 × 1400 2 7 14 Φ 25
EC 400 × 1500 2 7 14 Φ 25
IC 1000 × 1000 6 6 20 Φ 26
IC 1100 × 1100 6 6 20 Φ 28
IC 500 × 500 3 3 8 Φ 25
Table 7. Column section properties for 5 storey building according to ESEE regulations.
Section Name No. of Bars in 3-Dir.
No. of Bars in 2-Dir.
Main Reinforcement
No. of Stirrups
Spacing of Stirrups and (diameter)
m (mm)
EC 600 × 300 4 4 12 Φ 14
4 0.15 (10) EC 700 × 400 3 6 14 Φ 16
IC 500 × 500 3 4 9 Φ 20

M. Sobaih, A. Mousa
604
Table 8. Column section properties for 15 storey building according to ESEE regulations.
Section Name No. of Bars in 3-Dir.
No. of Bars in 2-Dir.
Main Reinforcement
No. of Stirrups
Spacing of Stirrups and (diameter)
m (mm)
EC 300 × 1000 2 5 10 Φ 20
4 0.15 (10)
EC 300 × 1100 3 4 12 Φ 20 EC 300 × 700 2 4 8 Φ 20 EC 300 × 800 2 4 8 Φ 20 EC 300 × 900 2 5 10 Φ 20 IC 500 × 500 3 4 9 Φ 25 IC 600 × 600 3 4 9 Φ 25 IC 700 × 700 4 4 11 Φ 25 IC 800 × 800 5 5 15 Φ 25 IC 900 × 900 5 5 15 Φ 28
Table 9. Column section properties for 20 storey building according to ESEE regulations.
Section Name No. of Bars in 3-Dir.
No. of Bars in 2-Dir.
Main Reinforcement
No. of Stirrups
Spacing of Stirrups and (diameter)
m (mm)
EC 300 × 1100 2 6 12 Φ 20
4 0.15 (10)
EC 300 × 1200 2 6 12 Φ 20 EC 300 × 700 2 4 8 Φ 20 EC 300 × 900 2 5 10 Φ 20 EC 400 × 1300 2 6 12 Φ 25 IC 1100 × 1100 6 7 21 Φ 26
IC 700 × 700 3 4 9 Φ 25 IC 800 × 800 4 4 11 Φ 25 IC 900 × 900 5 5 15 Φ 25
IC 1000 × 1000 5 6 17 Φ 26
Table 10. Column section properties for 30 storey building according to ESEE regulations.
Section Name No. of Bars in 3-Dir.
No. of Bars in 2-Dir.
Main Reinforcement
No. of Stirrups
Spacing of Stirrups and (diameter)
m (mm)
EC 300 × 1100 2 6 12 Φ 20
4 0.15 (10)
EC 300 × 1200 2 6 12 Φ 20
EC 300 × 1300 2 7 14 Φ 20
EC 300 × 700 2 4 8 Φ 20 EC 300 × 900 2 5 10 Φ 20 EC 400 × 1400 2 7 14 Φ 25 EC 400 × 1500 2 7 14 Φ 25 IC 1100 × 1100 6 7 21 Φ 26
IC 1200 × 1200 6 7 21 Φ 28
IC 600 × 600 3 4 9 Φ 25
IC 700 × 700 3 4 9 Φ 25
IC 800 × 800 4 4 11 Φ 25
IC 900 × 900 5 5 15 Φ 25
IC 1000 × 1000 5 6 17 Φ 26

M. Sobaih, A. Mousa
605
Figure 3. Pushover curves for 5-storey building using IBC2009 and ESEE.
Figure 4. Pushover curves for 15-storey building using IBC2009 and ESEE.
Figure 5. Pushover curves for 20-storey building using IBC2009 and ESEE.
Figure 6. Pushover curves for 30-storey building using IBC2009 and ESEE.

M. Sobaih, A. Mousa
606
shear gap between the two models are smaller compared to 5-storey model. Further-more, the IBC2009 loading code gives lesser total displacement than the ESEE regula-tion. From Figure 5, we can notice from the comparison of 20-storey model that the ESEE gives higher base shear with much larger total displacement. Moreover, from Figure 6, we found that the comparison of 30-storey model is similar to 5-storey mod-el. It may be concluded that the ESEE-designed buildings were stronger than the IBC2009 buildings, because as the loads increase there is a proportional increase in cross sections and reinforcement.
5.4. Plastic Hinges Distribution
Plastic hinges are created at the ends of the beams and at the base of the columns which lead to the foundation. First, the characteristics of plastic hinges have to assign for each section. A crucial force for the beams, a critical for failure, is the moment in the local axis 3 (M3). At the columns, a critical for failure, is the interaction between the axial force P and the moment in local axes 3 (M3). The characteristics for plastic hinges are given at both ends of the element (relative distance 0 and 1).
5.4.1. Using IBC2009 Loads Using the IBC2009 loading code, Figures 7-14 show the plastic hinges distribution caused because of the pushover load affecting the considered RC buildings heights, i.e. 5, 15, 20 and 30 storeys, with fixed load pattern (Uniform load Pattern).
For the 5-storey building, it was found that most of plastic hinges occurred in the beams, which satisfies the weak beam-strong column criteria. Moreover, these plastic hinges were located at the third, fourth and fifth levels with severe damage in beams, as the colors indicate the amount of damage.
Figure 7. Distribution of hinges in 5-storey building using IBC2009 (CP).

M. Sobaih, A. Mousa
607
Figure 8. Distribution of hinges in 5-storey building using IBC2009 (E).
Figure 9. Distribution of hinges in 15-storey building using IBC2009 (CP).

M. Sobaih, A. Mousa
608
Figure 10. Distribution of hinges in 15-storey building using IBC2009 (E).
Figure 11. Distribution of hinges in 20-storey building using IBC2009 (CP).

M. Sobaih, A. Mousa
609
Figure 12. Distribution of hinges in 20-storey building using IBC2009 (E).
Figure 13. Distribution of hinges in 30-storey building using IBC2009 (CP).

M. Sobaih, A. Mousa
610
Figure 14. Distribution of hinges in 30-storey building using IBC2009 (E).
From distribution of hinges for 15-storey, it can be noticed that the plastic hinges
were located at the fourth, fifth and sixth levels with severe failure. In addition, most of plastic hinges occurred in the beams, which satisfies the weak beam-strong column cri-teria. Moreover, critical section was located on the columns of the tenth floor, as for these columns the load was released which is an indication for the near failure for the soft storey in building.
As for the 20-storey building the plastic hinges were also located at the intermediate levels with a complete failure in some beams of the seventh and the eighth floors. In addition, a critical section was located on the columns of the seventeenth floor, as for these columns the load was released which is an indication for the near failure for the soft storey in building.
Finally, for the 30-storey building the plastic hinges were located from fourth to fourteenth levels have a complete failure in the beams. Moreover, a critical section was located on the columns of the twenty third floor, as for these columns the load was re-leased which is an indication for the near failure for the soft storey in building.
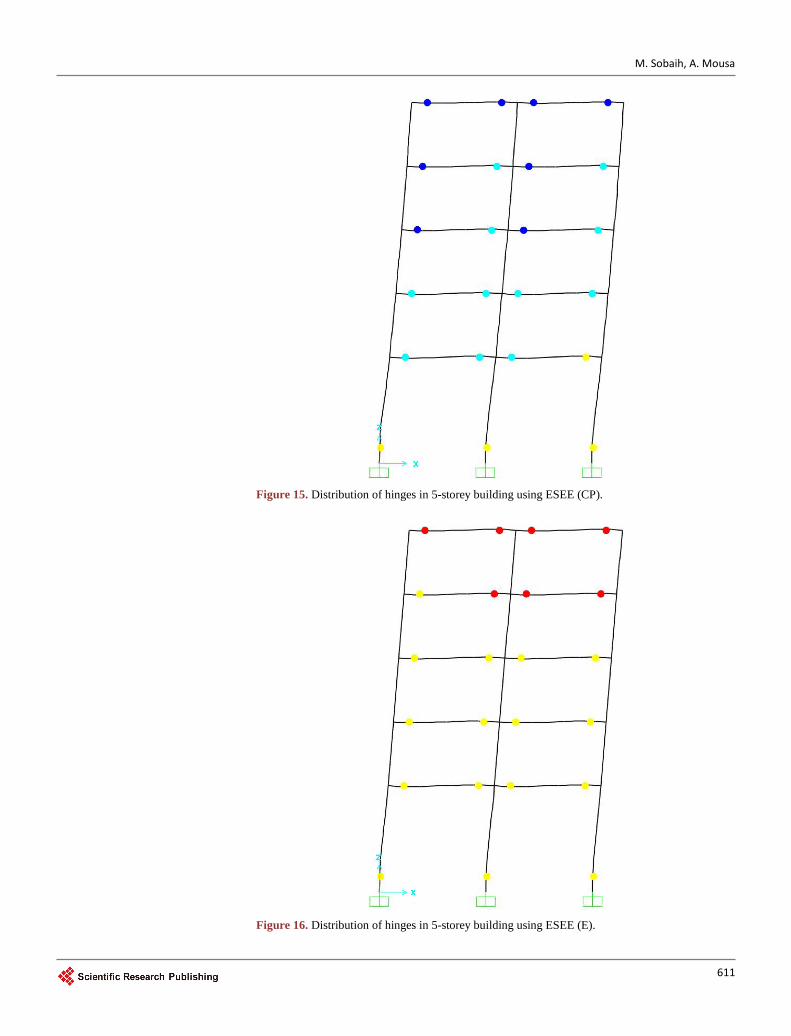
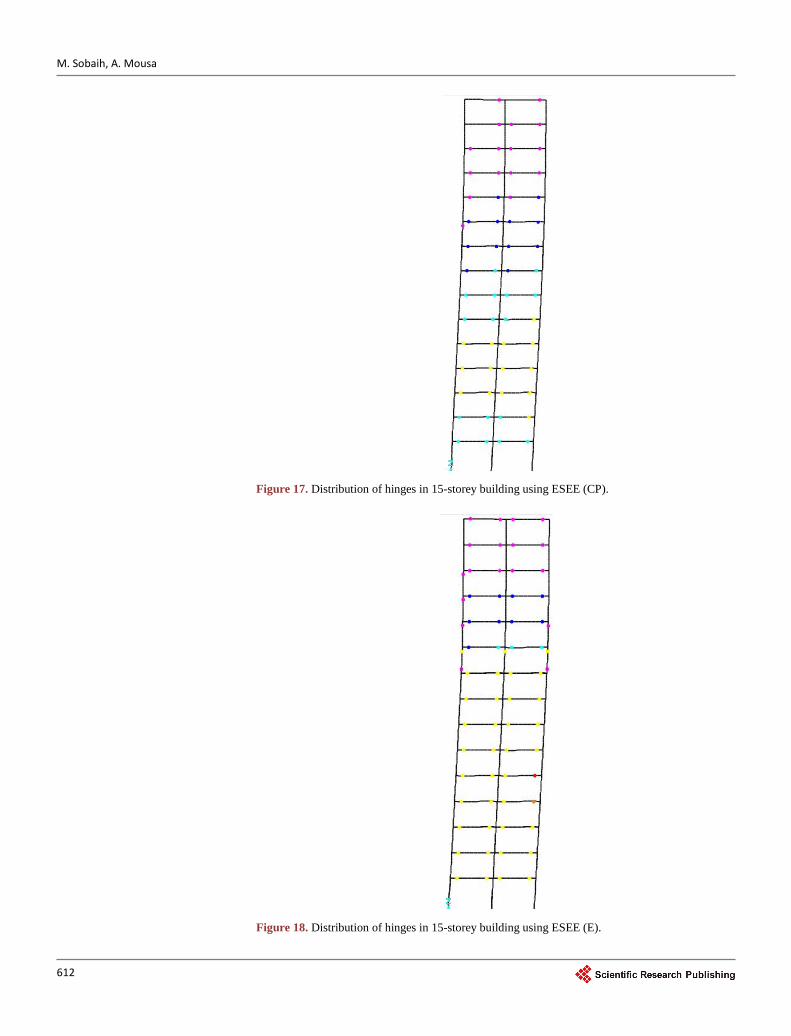
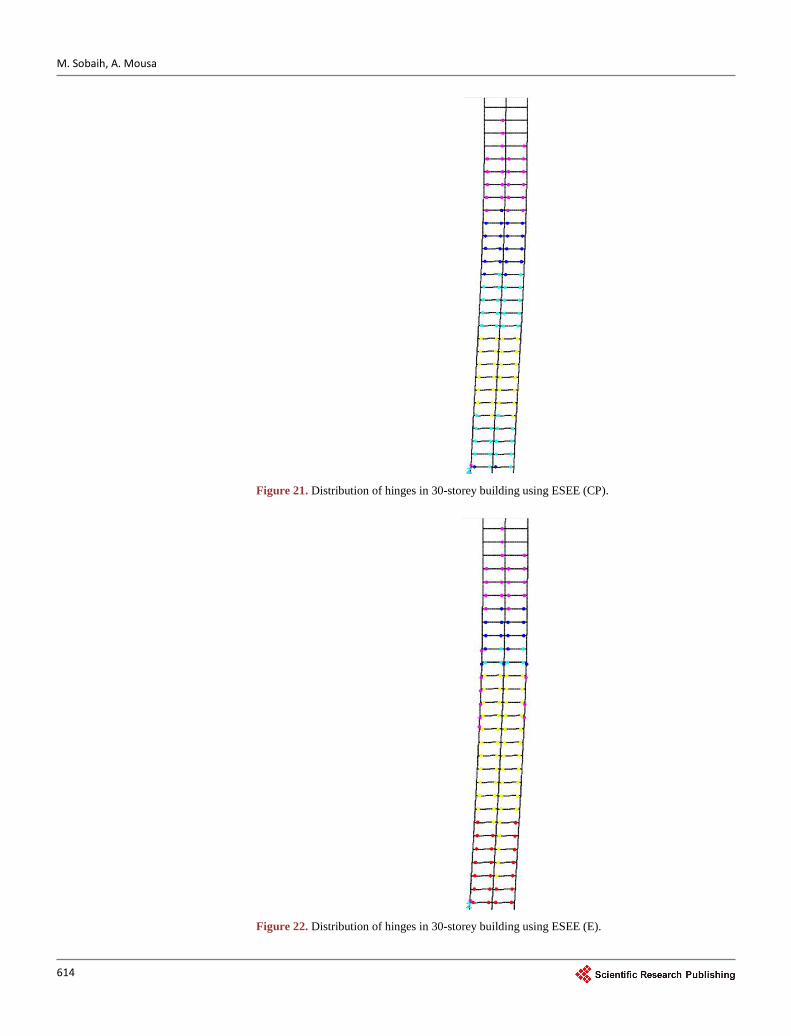
5.4.2. Using ESEE Loads Similarly, using the ESEE Loading code, Figures 15-22 show the plastic hinges distri-bution caused as a result for the pushover load affecting the considered RC buildings having heights of 5, 15, 20 and 30 stories with fixed load pattern (Uniform Load Pat-tern).
M. Sobaih, A. Mousa
611
Figure 15. Distribution of hinges in 5-storey building using ESEE (CP).
Figure 16. Distribution of hinges in 5-storey building using ESEE (E).
M. Sobaih, A. Mousa
612
Figure 17. Distribution of hinges in 15-storey building using ESEE (CP).
Figure 18. Distribution of hinges in 15-storey building using ESEE (E).

M. Sobaih, A. Mousa
613
Figure 19. Distribution of hinges in 20-storey building using ESEE (CP).
Figure 20. Distribution of hinges in 20-storey building using ESEE (E).
M. Sobaih, A. Mousa
614
Figure 21. Distribution of hinges in 30-storey building using ESEE (CP).
Figure 22. Distribution of hinges in 30-storey building using ESEE (E).

M. Sobaih, A. Mousa
615
Similar to the IBC2009, it was found for the ESEE designed 5-storey building that most of plastic hinges occurred in the beams, which satisfies the weak beam-strong column criteria. Moreover, these plastic hinges were located at top levels with severe damage in beams, as the colours indicate the amount of damage.
From distribution of hinges for 15-storiey, it can be noticed that the plastic hinges were located at the fifth floor with severe failure. In addition, a critical section was lo-cated on the columns of the eighth floor, as for these columns the load was released which is an indication for the near failure for the soft storey in building. However, this damage was formed after a longer time than for the case of the IBC2009, which indi-cates that the ESEE building will sustain the earthquake loads higher than the IBC2009 code.
As for the 20-storey building, the plastic hinges were also located at the seventh and eighth levels with some failure in beams.
At last, for the 30-storey building the plastic hinges were located at the low levels with a complete failure in the beams of the first six floors. It was also noticed that there was plastic hinges located on the columns of the fifteenth and nineteenth floors, as for these columns the load was still unreleased which is an indication for the strength of this building code.
6. Summary and Conclusions
The IBC2009 and ESEE loads were used to analyze the four RC frames and the cross sections and reinforcement were obtained from the analysis. The plastic hinges proper-ties were assigned to each joint of these frames. A pushover load case was created and assigned to these frames.
This load was located at the center of mass of each floor level. The obtained pushover curves and plastic hinges distribution were the main aspect of comparison between the four buildings using the two codes. The comparison shows that there is variation in the results produced by the two codes, and one of them leads to more vulnerable buildings than the other.
After designing and detailing the reinforced concrete frames, a non-linear static pu-shover analysis is carried out to evaluate the structural performance of the frames by using both the IBC2009 code and ESEE regulations. By comparing the two codes, the main observations and conclusions drawn are summarized below: 1. Using FEMA-356 [18] Regulations, the distribution of plastic hinges intensity was
heavily increased for beams in the IBC2009 compared to the ESEE at different de-formation stages. This makes the buildings designed by the ESEE regulations sustain more earthquake loads than those designed by the IBC2009 code at certain loading cases.
2. Using FEMA-356 [18] Regulations, the distribution of plastic hinges intensity was almost similar in both codes for columns. Whereas, there were indications of near soft storey failure in 15, 20 and 30 building models that were designed by IBC2009 code, due to released load in columns. On the other hand, there was indication of

M. Sobaih, A. Mousa
616
near soft storey failure in 15-storey building model only, but it took longer time to reach near soft storey failure than case of the IBC2009. Therefore, this shows that the ESEE can perform better in facing earthquake loads.
3. The ESEE Regulations give larger base shear failure results than those obtained by the IBC2009 code. This shows the adequacy of the ESEE Regulations.
4. The obtained beams and external columns cross sections and their reinforcement are the same for both codes, but the ESEE requires bigger cross sections and rein-forcement for the internal columns. Thus for the same seismic loads, more plastic hinges will be developed when using the IBC2009 code.
5. It is recommended to use the ESEE code in the seismic design as it has the ability to sustain stronger lateral loads than the IBC2009.
6. The additional cross sections or the reinforcement ratio are not significant, so the additional cost will be low. In fact, considering the safety of the building and lives, the warnings before failure, the building durability on the long run and the higher performance, it is believed that designing according to ESEE Regulations is safer than IBC2009 code.
References [1] Sung, Y.C., Lin, T.K., Hsiao, C.C. and Lai, M.C. (2013) Pushover Analysis of Reinforced
Concrete Frames Considering Shear Failure at Beam-Column Joints. Earthquake Engi-neering and Engineering Vibration, 12, 373-383. http://dx.doi.org/10.1007/s11803-013-0179-8
[2] Hassaballa, A.E., Ismaeil, M.A., Alzead, A.N. and Adam, F.M. (2014) Pushover Analysis of Existing 4 Storey RC Flat Slab Building. International Journal of Sciences: Basic and Ap-plied Research (IJSBAR), 16, 242-257. http://gssrr.org/index.php?journal=JournalOfBasicAndApplied&page=article&op=download&path%5B%5D=2419&path%5B%5D=1789.
[3] CSI. SAP2000 V-14 (2010) Integrated Finite Element Analysis and Design of Structures Ba-sic Analysis Reference Manual. Computers and Structures Inc., Berkeley.
[4] Maske Abhijeet, A., Maske Nikhil, A. and Shiras Preeti, P. (2014) Pushover Analysis of Reinforced Concrete Frame Structures: A Case Study. International Journal of Advanced Technology in Engineering and Science (IJATES), 2, 118-128. http://ijates.com/images/short_pdf/1413745743_P118-128.pdf
[5] Choudhary, N. and Wadia, M. (2014) Pushover Analysis of R.C. Frame Building with Shear Wall. IOSR Journal of Mechanical and Civil Engineering (IOSR-JMCE), 11, 9-13. http://dx.doi.org/10.9790/1684-11250913 http://www.iosrjournals.org/iosr-jmce/papers/vol11-issue2/Version-5/B011250913.pdf
[6] Aleksieva Gergana (2015) Nonlinear Analysis of a Reinforced Concrete Frame. Internation-al Journal of Civil and Structural Engineering Research, 3, 156-163.
[7] OpenSees (2006) Open System for Earthquake Engineering Simulation. Pacific Earthquake Engineering Research Center, University of California, Berkeley.
[8] Kadlag, V.A. and Kenkar, K.S. (2016) Pushover Analysis of RC Frames by Considering Bay Width Variation of Structures. International Journal of Research, 3, 19-22. http://edupediapublications.org/journals/index.php/IJR/article/view/4169/4005
[9] Keerthan, M.S. and Jayashankar Babu, B.S. (2016) Seismic Performance Study of RC
M. Sobaih, A. Mousa
617
Frames with Mass Irregularity from Pushover Analysis. International Journal of Engineer-ing Science and Computing, 6. http://ijesc.org/upload/d1507dd4abde1944a06a3157798a32f2.Seismic%20Performance%20Study%20of%20RC%20Frames%20with%20Mass%20Irregularity%20from%20Pushover%20Analysis.pdf
[10] IBC2009 (2009) International Building Code. International Code Council.
[11] ESEE (1988) Regulations for Earthquake-Resistant Design of Buildings in Egypt. The Egyp-tian Society for Earthquake Engineering.
[12] Mouzzoun, M., Moustachi, O., Taleb, A. and Jalal, S. (2013) Seismic Performance Assess-ment of Reinforced Concrete Buildings Using Pushover Analysis. Journal of Mechanical and Civil Engineering, 5, 44-49. http://dx.doi.org/10.9790/1684-0514449 http://iosrjournals.org/iosr-jmce/papers/vol5-issue1/E0514449.pdf?id=2494
[13] Raut, A.V. and Prasad, R.V.R.K. (2014) Pushover Analysis of G+ 3 Reinforced Concrete Building with Soft Storey. Journal of Mechanical and Civil Engineering, 11, 25-29. http://dx.doi.org/10.9790/1684-11412529
[14] Ashraf Habibullah, S.E. and Stephen Pyle, S.E. (1988) Practical Three Dimensional Nonli-near Static Pushover Analysis. Structure Magazine, 2. http://computersandengineering.de/downloads/technical_papers/CSI/PushoverPaper.pdf
[15] American Society of Civil Engineering (2005) Minimum Loads for Buildings and Other Structures, (ASCE 7-05). Reston.
[16] American Concrete Institute (2008) Building Code Requirements for Structural Concrete (ACI 318-08) and Commentary. Farmington Hills.
[17] Computer and Structures, Inc. (CSI) (2009) SAP2000/NL-PUSH Software Version 15.0. Computer and Structures, Inc., Berkeley.
[18] Federal Emergency Management Agency FEMA 356 (2000) Pre Standard and Commentary for the Seismic Rehabilitation of Buildings.
Submit or recommend next manuscript to SCIRP and we will provide best service for you:
Accepting pre-submission inquiries through Email, Facebook, LinkedIn, Twitter, etc. A wide selection of journals (inclusive of 9 subjects, more than 200 journals) Providing 24-hour high-quality service User-friendly online submission system Fair and swift peer-review system Efficient typesetting and proofreading procedure Display of the result of downloads and visits, as well as the number of cited articles Maximum dissemination of your research work
Submit your manuscript at: http://papersubmission.scirp.org/