Evaluation of operator whole-body vibration and shock ...
140
Evaluation of operator whole-body vibration and shock exposure in a South African open cast mine Sylvester Aondolumun Aye A dissertation submitted in partial fulfilment of the requirements for the degree Master of Science in the Department of Mechanical and Aeronautical Engineering of the Faculty of Engineering, Built Environment and Information Technology at the University of Pretoria November 2009 © University of Pretoria
Transcript of Evaluation of operator whole-body vibration and shock ...

Evaluation of operator whole-body vibration and shock exposure in a
South African open cast mine
Sylvester Aondolumun Aye
A dissertation submitted in partial fulfilment of the requirements for the degree
Master of Science
in the Department of Mechanical and Aeronautical Engineering
of the Faculty of Engineering, Built Environment
and Information Technology
at the
University of Pretoria
November 2009
©© UUnniivveerrssiittyy ooff PPrreettoorriiaa

ii
Evaluation of operator whole-body vibration and shock exposure in a South
African open cast mine
by
Sylvester Aondolumun Aye
Supervisor : Prof. PS Heyns
Department: Mechanical and Aeronautical Engineering
Degree : Master of Science
Abstract
This study quantifies whole-body vibration on a range of mine machinery
typically used in a South African open cast mine. The ISO 2631-1 (1997)
standard was used in the computation of weighted root mean square (WRMS)
and vibration dose values (VDVs) whereas the ISO 2631-5 (2004) standard
was used in the computation of daily static compressive stress (Sed) and R
factor values. Two methods have been used to evaluate the whole-body
vibration on a wide range of equipment used in an open cast mine. There are
two main parameters for each of the standards. The ISO 2631-1 (1997)
standard utilises the daily exposure A(8) and VDV, whereas the new ISO
2631-5 (2004) standard methodology uses the parameters Sed and R factor.
ISO 2631-1 (1997) is poor in taking account of transient shocks. This led to
the development of ISO 2631-5 (2004). Signals were therefore generated in
the laboratory to further explore the parameters of the two standards.

iii
Vibration signals of more-or-less steady periodic processes can be
approximated by superposition of sinusoids. To investigate the effect of
shocks on the WBV response parameters used in the two standards, a series
of investigations were conducted using very simplified simulations to capture
the essential nature of various operational conditions, and qualitatively explain
the trends in the response parameters. Pure sinusoidal data was first
generated without shocks and investigated. Subsequently, sinusoidal signals
with higher amplitudes were generated and investigated. Sinusoidal signals
with increasing shock amplitude up to and exceeding the crest factor of 9
based on ISO 2631-1 (1997) were generated and analyzed. Finally, simulated
data with different shock magnitude for five typical example cases were then
generated and analyzed.
The pure sinusoidal data was artificially generated using the signal generator
at different amplitudes and frequencies, which are similar to field observed
frequencies to enable numerical investigation of parameters to be carried out.
A subset of the data was selected based on frequencies and amplitudes
obtained on the field so as to have a representative data set on which
investigations were carried out.
The two parameters of the two standard methodologies were computed using
simulated sinusoidal signal data. The trends in each of the parameters
corresponding to each of the standards were monitored using various
scenarios obtained by varying the signal parameters and compared against
each other. There was approximate proportional correlation between the two
parameters (VDV and Sed) with varying degrees of slope for each scenario.
The Sed and VDV parameters are plotted on the x- and y-axes respectively.
The graphs with slope greater than 1 corresponded to signals with low or no
shock content; whereas the graphs with slope less than 1 corresponded to
high shock content.
The shock parameters (VDV and Sed) corresponding to the ISO 2631-1 (1997)
and ISO 2631-5 (2004) standard methodologies were computed from field
data and compared to see if the same trend obtained from the numerically

iv
obtained sinusoidal signals could be validated. It was found that the there was
a gradual band correlation with slope less than 1 between the VDV and Sed
parameters corresponding to signals of high shock content thereby validating
the numerical findings.
Since little or no extensive epidemiological studies have been carried out on
the new methodology; it is recommended that more epidemiological studies
be done to determine the exposure action and exposure limit values with
respect to shocks in the Sed parameter for the new ISO 2631-5 (2004)
standard methodology.
It is advisable that caution is taking when using the new ISO 2631-5 (2004)
standard methodology in evaluating whole-body vibration measurements until
the limits are properly established. It is suggested that the new standard be
used along with the established ISO 2631-1 (1997) standard methodology. Keywords: Whole-body vibration, ISO 2631-1 (1997), ISO 2631-5 (2004),
open cast mine, transient shock

v
Acknowledgement I wish to express my profound gratitude to the following individuals who made
it possible and enjoyable for me to complete the Masters degree programme:
The Almighty whose guidance and protection was key
Professor Stephan Heyns, my study leader, for his patience, invaluable
guidance and encouragement throughout my programme
The management and staff of the open cast mine for the facilitation
provided
Machine owners and their operators who enthusiastically participated
in this investigation
Mr Jimmy Mokhafela for his assistance in taking field measurements
Mrs Marietjie Calder for her assistance in administrative tasks
My wife, Mrs Goodness Aye and daughter, Joy Aye, for their
understanding even though I deprived them of my presence at home
most of the time
My parents, Major (Rtd) and Mrs BC & CA Aye, for their
encouragement
All my colleagues in the Sasol Laboratory for Structural Mechanics for
being good friends which made my research more enjoyable.

vi
Table of contents
Abstract ii
Acknowledgements v
Table of contents vi
Acronyms x
List of Figures xii
List of Tables xv
1. Introduction and objectives 1
1.1 Background 1
1.2 Dissertation overview 5
1.3 Literature survey 6
1.3.1 Various whole-body vibration standards 6
1.3.2 Discussion of whole-body vibration field studies 8
1.3.3 Duration of measurement of whole-body vibration 12
1.3.4 Attenuation of whole-body vibration 12
1.3.5 Whole-body vibration in the mining industry 14
1.3.6 Whole-body vibration in the South African mining industry 15
1.3.7 WBV with transient shock 16
1.4 Scope of the work 26
1.4.1 Objectives 27
2. Measurement and analysis 28
2.1 Overview of the open cast mine 28
2.2 The open cast mining process 28
2.3 Whole-body vibration (WBV) measurement and analysis 29
2.3.1 Measured parameters and transducers 29
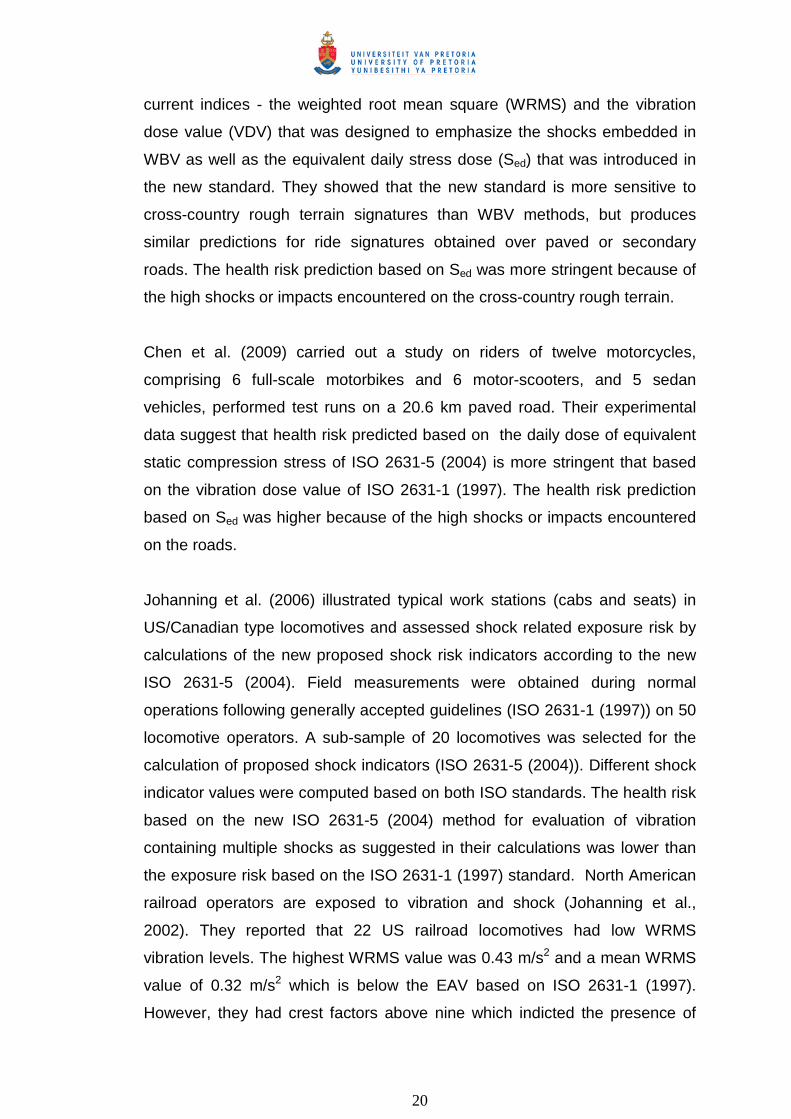
2.3.1.1 Dytran tri-axial seat accelerometer 29
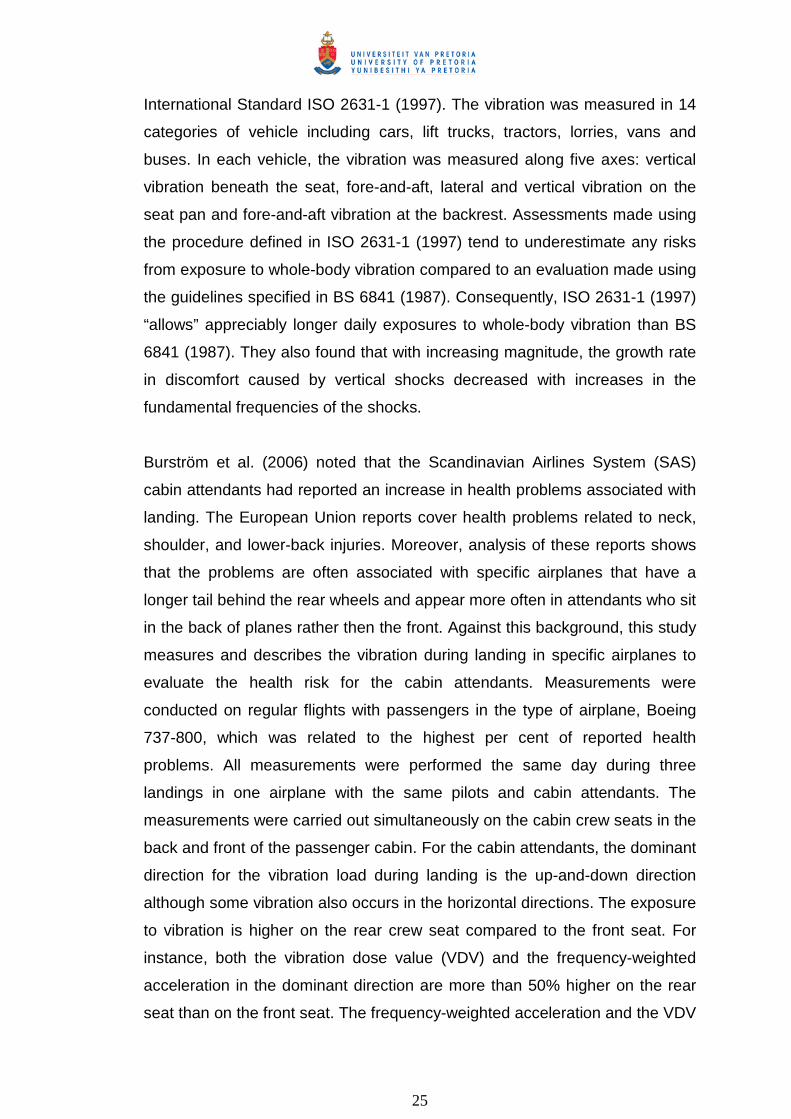
2.3.1.2 Industrial ICP accelerometer 29
2.3.2 Data acquisition and recording 33
2.4 Data analysis 34
2.4.1 Computation of ISO 2631-1 (1997) parameters 34

vii
2.4.2 Computation of ISO 2631-5 (2004) parameters 36
2.4.3 Calculation of acceleration dose based on ISO 2631-5 (2004)
37
2.4.4 Assessment of health effects based on ISO 2631-5 (2004) 38
2.5 Summary 39
3. Results 40
3.1 Target machines and applications 40
3.2 Time domain accelerations 41
3.3 Summary of machine whole-body vibration levels based on ISO 2631-1 (1997) using WRMS parameter
45
3.4 Summary of machine whole-body vibration levels based on ISO 2631-1 (1997) using VDV parameter
49
3.5 Summary of machine whole-body vibration levels using ISO 2631-5 (2004) using Sed and R parameters
51
3.6 Summary 54
4. Numerical investigation of parameters 55
4.1 Results of simulation of data without shocks 56
4.2 Results of simulation of sinusoidal data with higher amplitude
59
4.3 Effect of increasing amplitude of shocks on computed values Sed and VDV
59
4.4 Effect of increasing amplitude of shocks above crest factor (CF) of 9 on computed values Sed and VDV
61
4.5 Simulated data with different amplitude and low shock magnitude for five typical example cases
62
4.6 Simulated data with different amplitude and shock magnitude for five typical example cases
63
4.7 Summary 64
5. Evaluation of results of investigation 71
5.1 WBV results based on ISO 2631-1 (1997) using WRMS 71
5.2 WBV results based on ISO 2631-1 (1997) using VDV 76
5.3 WBV results based on ISO 2631-5 (2004) using Sed 81
5.4 WBV results based on ISO 2631-5 (2004) using R factor 86
5.5 Comparison of results based on ISO 2631-1 (1997) and ISO 2631-5 (2004)
91
5.6 Summary 95

viii
6. Conclusions and recommendations 99
6.1 Conclusions 99
6.2 Recommendations 100
7. References 101
Appendices 109
Appendices A-J 109
Appendix A A1 Volvo A35D LHD 110
A2 Mercedes Actros V8 LHD 110
A3 Caterpillar 785B LHD 110
A4 Tata Novus truck 3434 111
A5 Bell Rear Dumper B25D 111
A6 Bell Rear Dumper B40D 111
A7 Bell Rear Dumper B50D 112
A8 Iveco truck or trailer 112
A9 MAN trailer TGA 33.400 112
A10 Dragline 55W70 113
Appendix B B1 Hitachi excavator Zaxis 670 LCR 113
B2 Volvo excavator EC700Blc 114
B3 CAT excavator 320D 114
B4 Hitachi excavator Zaxis 370 LCR 114
B5 Hitachi excavator Zaxis 500 LCR 115
B6 Komatsu excavator PC1250SP 115
B7 Hitachi excavator Zaxis 670 LCR 115
Appendix C C1 CAT front end loader 992G 116
C2 Kawaski Safika front end loader 116
C3 Kawasaki FEL 116
Appendix D D1 Track dozer CAT D9T 117
D2 CAT caterpillar D10R 117
D3 Bell TLB 315 SG 117
D4 Shantui 118
Appendix E E1 Pit Viper 118

ix
E2 DMM2 drilling machine 119
Appendix F F1 CAT grader 119
F2 Sany grader 120
F3 Komatsu grader GD 825 A 120
Appendix G G1 Bell water bowser B20C 121
G2 Powerstar 2628 121
G3 Diesel bowser CAT 740 121
Appendix H H1 Toyota fortuner 122
Appendix I I1 Landpac compactor 122
Appendix J J1 Whole-body vibration questionnaire 123

x
Acronyms Acronym Meaning A(8) for WBV The daily exposure (8-hour energy-equivalent
continuous, frequency-weighted RMS acceleration) A(8)n Normalised daily exposure (8-hour energy-equivalent
continuous, frequency-weighted RMS acceleration) ANN Artificial Neural Network
ATD Anglo Technical Division
ATVs All-terrain vehicles
CF Crest factor
Dk The acceleration dose in the k direction
Dy Group mean total (lifetime) exposure duration in years
EAV Exposure action value
EAV n Normalised exposure action value
EFV Expeditionary fighting vehicle
ELV Exposure limit value
ELV n Normalised exposure limit value
EMG Electromyography
EU European Union
FEL Front End Loader
HAV Hand-arm vibration
HEMM Heavy earth-moving machineries
HGCZ Health Guidance Caution Zone
HHA Health Hazard Assessment
HVM Human Vibration Meter
ICP Integrated Circuit Piezoelectric
LHD Load haul dump
MARS Multi-axis Ride Simulator
MR Magneto-rheological
MSD Musculoskeletal disorders
PC Personal Computer
PCB Printed Circuit Board
R Risk factor

xi
Rn Normalized Risk factor
RMS Root Mean Square
RNN Recurrent Neural Network
Se Equivalent static compressive stress
SEAT Seat Effective Amplitude Transmissibility
Sed Daily equivalent static compressive dose
Sedn Normalized daily equivalent static compressive dose
Sui Ultimate strength of the lumbar spine
SVAN Sound Vibration Analyzer
TGV Tactical Ground Vehicles
USAARL United States Army Aeromedical Research
Laboratory
VDV Vibration Dose Value
VDVn Normalized Vibration Dose Value
WBV Whole-Body Vibration
WRMS Weighted Root Mean Square

xii
List of Figures
Figure 2.1 Basic open cast coal mining process 30
Figure 2.2 Basicentric axes of the human body (ISO 2631-1 (1997))
31
Figure 2.3 Dytran tri-axial seat accelerometer 32
Figure 2.4 Floor industrial ICP accelerometer 32
Figure 2.5 SVAN958 HVM data acquisition system 33
Figure 2.6 Flowchart for acceleration dose calculation (ISO 2631-5 (2004))
38
Figure 3.1 Weighted acceleration for x, y & z axes according to ISO 2631-1 (1997) for Volvo A35D LHD
42
Figure 3.2 Unweighted acceleration for x, y & z-axes for Volvo A35D LHD
43
Figure 3.3 Weighted acceleration for x, y & z axes according to ISO 2631-1 (1997) for Caterpillar 785B
43
Figure 3.4 Unweighted acceleration for x, y & z-axes for Caterpillar 785B
43
Figure 3.5 Weighted acceleration for x, y & z according to ISO 2631-1 (1997) for Hitachi Excavator Zaxis 670 LCR
44
Figure 3.6 Unweighted acceleration for x, y & z-axes for Hitachi Excavator Zaxis 670 LCR
44
Figure 4.1 Simulated sinusoidal signal with equally spaced shocks for dominant z-axis for case 1
60
Figure 4.2 Relationship between health predicted by (a) VDVn versus A(8)n values, (b) Rn factor versus Sedn values, (c) A(8)n versus Sedn values and (d) VDVn versus Sedn values for signals without shocks. The associated HGCZ are also indicated in the figures.
65 Figure 4.3 Relationship between health predicted by (a) VDVn
versus A(8)n values, (b) Rn factor versus Sedn values, (c) A(8)n versus Sedn values and (d) VDVn versus Sedn values for sinusoidal signals with higher amplitude. The associated HGCZ are also indicated in the figures.
66 Figure 4.4 Relationship between health predicted by (a) VDVn
versus A(8)n values, (b) Rn factor versus Sedn values, (c) A(8)n versus Sedn values and (d) VDVn versus Sedn values for signals with transient shocks in order of increasing amplitude. The associated HGCZ are also indicated in the figures.
67 Figure 4.5 Relationship between health predicted by (a) VDVn
versus A(8)n values, (b) Rn factor versus Sedn values, (c) A(8)n versus Sedn values and (d) VDVn versus Sedn values for signal with transient shocks above the CF of 9 respectively. The associated HGCZ are also indicated in the figures.
68

xiii
Figure 4.6 Relationship between health predicted by (a) VDVn versus A(8)n values, (b) Rn factor versus Sedn values, (c) A(8)n versus Sedn values and (d) VDVn versus Sedn values for simulated data with different amplitude and low shock magnitude for five typical example cases. The associated HGCZ are also indicated in the figures
69 Figure 4.7 Relationship between health predicted by (a) VDVn
versus A(8)n values, (b) Rn factor versus Sedn values, (c) A(8)n versus Sedn values and (d) VDVn versus Sedn values for simulated data with different amplitude and shock magnitude for five typical example cases. The associated HGCZ are also indicated in the figures.
70
Figure 5.1 Weighted RMS acceleration magnitudes for LHDs 72 Figure 5.2 Weighted RMS acceleration magnitudes for excavators 73 Figure 5.3 Weighted RMS acceleration magnitudes for front end
loaders
73 Figure 5.4 Weighted RMS acceleration magnitudes for dozers 74
Figure 5.5 Weighted RMS acceleration magnitudes for drills 74
Figure 5.6 Weighted RMS acceleration magnitudes for graders 74
Figure 5.7 Weighted RMS acceleration magnitudes for liquid conveyers
75
Figure 5.8 Weighted RMS acceleration magnitudes for 4x4 75
Figure 5.9 Weighted RMS acceleration magnitudes for compactor 75
Figure 5.10 VDV magnitudes for LHDs 77
Figure 5.11 VDV magnitudes for excavators 78
Figure 5.12 VDV magnitudes for front end loaders 78
Figure 5.13 VDV magnitudes for dozers 79
Figure 5.14 VDV magnitudes for drills 79
Figure 5.15 VDV magnitudes for graders 79
Figure 5.16 VDV magnitudes for liquid conveyers 80
Figure 5.17 VDV magnitudes for 4x4 80
Figure 5.18 VDV magnitudes for compactor 80
Figure 5.19 Sed magnitudes for LHDs 82
Figure 5.20 Sed magnitudes for excavators 83
Figure 5.21 Sed magnitudes for front end loaders 83
Figure 5.22 Sed magnitudes for dozers 84
Figure 5.23 Sed magnitudes for drills 84
Figure 5.24 Sed magnitudes for graders 84
Figure 5.25 Sed magnitudes for liquid conveyers 85

xiv
Figure 5.26 Sed magnitudes for 4x4 85
Figure 5.27 Sed magnitudes for compactor 85
Figure 5.28 R magnitudes for LHDs 87
Figure 5.29 R magnitudes for excavators 88
Figure 5.30 R magnitudes for front end loaders 88
Figure 5.31 R magnitudes for dozers 89
Figure 5.32 R magnitudes for drills 89
Figure 5.33 R magnitudes for graders 89
Figure 5.34 R magnitudes for liquid conveyers 90
Figure 5.35 R magnitudes for 4x4 90
Figure 5.36 R magnitudes for compactor 90
Figure 5.37 Relationship between health predicted by (a) VDVn versus A(8)n values, (b) Rn factor versus Sedn values, (c) A(8)n versus Sedn values and (d) VDVn versus Sedn values for LHDs
96 Figure 5.38 Relationship between health predicted by (a) VDVn
versus A(8)n values, (b) Rn factor versus Sedn values, (c) A(8)n versus Sedn values and (d) VDVn versus Sedn values for excavators
97 Figure 5.39 Relationship between health predicted by (a) VDVn
versus A(8)n values, (b) Rn factor versus Sedn values, (c) A(8)n versus Sedn values and (d) VDVn versus Sedn values for other equipment
98

xv
List of Tables
Table 1.1 Table of exposure action and limit values and health guidance caution zones for whole-body vibration
2
Table 1.2 Major whole-body vibration standards 7
Table 1.3 Differences between ISO 2631-1 (1997) and ISO 2631-5 (2004)
8
Table 2.1 Transducer calibration 31
Table 2.2 Overall channel calibration 31
Table 2.3 Instrumentation 31
Table 3.1 Load haul dumpers (LHDs) 40
Table 3.2 Excavators 40
Table 3.3 Front End Loaders 40
Table 3.4 Dozers 41
Table 3.5 Drills 41
Table 3.6 Graders 41
Table 3.7 Liquid Conveyers 41
Table 3.8 4x4 41
Table 3.9 Compactor 41
Table 3.10 Dominant frequency of machines 45 Table 3.11 LHDs: WRMS, CF and A(8) acceleration summary of
WBV seat data
46 Table 3.12 Excavators: WRMS, CF and A(8) acceleration summary
of WBV seat data
47 Table 3.13 Front end loaders: WRMS, CF and A(8) acceleration
summary of WBV seat data
47 Table 3.14 Dozers: WRMS, CF and A(8) acceleration summary of
WBV seat data
48 Table 3.15 Drills: WRMS, CF and A(8) acceleration summary of
WBV seat data
48 Table 3.16 Graders: WRMS, CF and A(8) acceleration summary of
WBV seat data
48 Table 3.17 Liquid conveyers: WRMS, CF and A(8) acceleration
summary of WBV seat data
48 Table 3.18 4x4: WRMS, CF and A(8) acceleration summary of WBV
seat data
49 Table 3.19 Compactor: WRMS, CF and A(8) acceleration summary
of WBV seat data
49 Table 3.20 LHDs: VDV summary of WBV seat data 49
Table 3.21 Excavators: VDV summary of WBV seat data 50
Table 3.22 Front end loaders: VDV summary of WBV seat data 50

xvi
Table 3.23 Dozers: VDV summary of WBV seat data 50
Table 3.24 Drills: VDV summary of WBV seat data 50
Table 3.25 Graders: VDV summary of WBV seat data 50
Table 3.26 Liquid conveyers: VDV summary of WBV seat data 51
Table 3.27 4x4: VDV summary of WBV seat data 51
Table 3.28 Compactor: VDV summary of WBV seat data 51
Table 3.29 LHDs: Summary of Dk for the x-, y-, z- axes and Sed and R factors
52
Table 3.30 Excavators: Summary of Dk for the x-, y-, z- axes and Sed and R factors
52
Table 3.31 Front end loaders: Summary of Dk for the x-, y-, z- axes and Sed and R factors
52
Table 3.32 Dozers: Summary of Dk for the x-, y-, z- axes and Sed and R factors
53
Table 3.33 Drills: Summary of Dk for the x-, y-, z- axes and Sed and R factors
53
Table 3.34 Graders: Summary of Dk for the x-, y-, z- axes and Sed and R factors
53
Table 3.35 Liquid conveyers: Summary of Dk for the x-, y-, z- axes and Sed and R factors
53
Table 3.36 4x4: Summary of Dk for the x-, y-, z- axes and Sed and R factors
53
Table 3.37 Compactor: Summary of Dk for the x-, y-, z- axes and Sed and R factors
53
Table 4.1 Frequencies and amplitudes of selected field signals 56
Table 4.2 Table of normalized exposure action and limit values and health guidance caution zone for whole body vibration
56
Table 4.3 Results for simulated sinusoidal data without shocks 59
Table 4.4 Results for simulated sinusoidal data with higher magnitude
59
Table 4.5 Signals in increasing order of shock amplitude 61
Table 4.6 Signal with increasing shock amplitude below and above CF of 9
62
Table 4.7 Results for simulated data with different amplitude and low shock magnitude for five typical example cases
63
Table 4.8 Results for simulated data with different amplitude and shock magnitude for five typical example cases
64

1
1. Introduction and objectives
1.1 Background
Mining involves frequent and intensive usage of heavy machinery that often
results in significant exposure of operators to shock and vibration, over
prolonged periods. Such exposures may lead to discomfort, interference with
activities and impaired health (Griffin, 1990).
To deal with the complexity and diversity of these effects on the human body,
it is customary to consider human vibration as either a whole-body vibration
problem or a hand arm vibration problem. Whole-body vibration refers to
where the whole body is exposed to vibration through contact by the buttocks
or feet whereas hand-arm vibration refers to where the hand are exposed to
vibration through contact. Various international standards have been
developed which govern the way in which human vibration should be
measured and reported, as well as provide indications of the health risk
involved. In this regard ISO 2631-1 (1997) and ISO 5349-1 (2001) are well
known in industry. The complexity of the problem however still escapes final
agreement and standardization.
European Parliament legislation (EU Directive 2002/44/EC, 2002) stipulates
minimum standards for health and safety of workers exposed to either hand-
arm or whole-body vibration. Unlike Europe, South Africa does not have
legislation which governs maximum acceptable vibration levels. However, it
might be expected that the EU initiative may gradually start to influence the
situation in South Africa (Heyns, 2007). EU practice is therefore considered
here in the evaluation of acceptable vibration levels.
The EU legislation specifies daily vibration exposure levels (exposure action
value (EAV) and exposure limit value (ELV)), shown in Table 1.1, in addition
to requiring employers to reduce worker vibration exposure levels wherever it
is practically possible. Where an operator is likely to be exposed to vibration,

2
an assessment of the likely daily vibration exposure is to be made. If the
exposure level is above the EAV, a range of actions must be taken to reduce
exposure and decrease risks. If the ELV is exceeded, immediate action must
be taken to reduce vibration exposure below the ELV and procedures be
implemented to prevent it being exceeded again. Prediction of whole-body
vibration (WBV) health risks is based on ISO 2631-1 (1997) and ISO 2631-5
(2004) health guidance caution zone (HGCZ) limits as shown in Table 1.1.
Table 1.1 Table of exposure action and limit values and health guidance caution zone values for whole-body vibration
Exposure/HGCZ ISO 2631-1 (1997) ISO 2631-5 (2004) WRMS VDV Sed R
EAV/ HGCZ lower limit 0.50 m/s2 9.1 m/s1.75 0.50 MPa 0.80 ELV/ HGCZ upper limit 1.15 m/s2 21.0 m/s1.75 0.80 MPa 1.20
Since vibration exposure is dependent on the magnitude of vibration and the
duration of exposure, the duration of operation of such machines which cause
high levels of vibration, could possibly be limited to reduce exposure. With
reference to WBV the ELV stated by the EU directive should not be taken as a
safe level of vibration exposure in the workplace, but rather as a high,
undesirable level of vibration exposure to be complied to (Whole-body
vibration guide to good practice). It is on this basis that the directive requires
action to be taken, as far as is reasonably practicable, to reduce vibration
exposure once levels are above the EAV.
Numerous epidemiological studies have been conducted all over the world,
documenting the detrimental effects of high levels of vibration exposure on
human beings.
A pilot study (Van Niekerk et al. 2000; MHSC, 2004) has shown that vibration
levels in South African mines are very high. Subsequent work by Phillips et al.
(2007) confirmed these conclusions.
Mdlazi (2008) conducted research to investigate the impact of whole-body
vibration on the day to day activities at Anglo operations South Africa. It was
concluded that there is enough evidence that a number of vehicles and

3
equipment at Anglo operations expose a large number of employees to high
vibration levels and that vibration exposure levels have to be managed to
minimize the risk of injury.
The problem is very complex and needs to be very carefully managed. This is
currently being understood and addressed at various levels. In South Africa
the situation is still confused with a limited legal framework and diverse
approaches to the problem (Heyns, 2007). While vibration measurements and
analyses are usually conducted in accordance with ISO 2631-1 (1997), a
unified approach to the problem requires the development of a system of
commonly acceptable and practically executable best practice which
addresses issues such as measuring procedures, measuring instruments,
occupational exposure limits for whole-body vibration, exposure control
measures and assessment and management of WBV related disease (Heyns,
2007).
It is against this background that a best practice document for South African
conditions needs to be developed, based on experience all over the world.
There have been a number of initiatives in South Africa, all based on ISO
2631-1 (1997). This work has shown high levels of vibration and occurrence
of transient shocks. In situations where transient shocks are present, the ISO
2631-1 (1997) is however now understood to be insufficient to fully evaluate
whole-body vibration (Nicol, 1996; Marjanen, 2005). Hence, there is the need
for a separate evaluation methodology for such cases of whole-body vibration
in the presence of transient shocks (Marjanen, 2005).
The International Organisation for Standardization released an updated
whole-body vibration standard, ISO 2631-5 in 2004. For the new standard
WBV levels are either below the daily equivalent static compressive stress
(Sed) value of 0.5 MPa or between the Sed values of 0.5 MPa and 0.8 MPa or
above the Sed value of 0.8 MPa. According to ISO 2631-5 (2004), Sed values
below 0.5 MPa give an indication of low probability of an adverse health effect
whereas Sed values above 0.8 MPa give an indication of high probability of an
adverse health effect. However, Sed values between 0.5 MPa and 0.8 MPa

4
give an indication of moderate probability of an adverse health effect.
Alternatively, WBV levels are either below the R factor of 0.8 or between the
R factors of 0.8 and 1.2 respectively or above the R factor of 1.2. The R factor
takes into account increased age and reduced strength. According to ISO
2631-5 (2004); R factors below 0.8 give an indication of low probability of an
adverse health effect whereas R factors above 1.2 give an indication of high
probability of an adverse health effect. However, R factors between 0.8 and
1.2 give an indication of moderate probability of an adverse health effect.
North American railroad operators are exposed to vibration and shock.
Twenty two US railroad locomotives had low WRMS vibration levels
(Johanning et al., 2002). The highest WRMS value was 0.43 m/s2 and a mean
WRMS value of 0.32 m/s2 which is below the EAV based on ISO 2631-1
(1997). Johanning et al. (2006) reported higher predicted risks based on ISO
2631-1 (1997) variables than ISO 2631-5 (2004) variables for 20 locomotive
operators. According to their findings, frequency-weighted RMS acceleration
values indicated several locomotive operators were exposed to vibration
levels above HGCZ limits outlined in ISO 2631-1 (1997); however, fewer
operators were found to be at risk according to ISO 2631-5 (2004). Since the
impacts or shocks were not high enough as earlier explained; this led to low
values of Sed based on ISO 2631-5 (2004) which led to even lower risk
predictions.
Cooperrider and Gordon (2008) also reported higher risks for locomotive
operators, based on VDVs from an ISO 2631-1 (1997) analysis when
compared to Sed values from an ISO 2631-5 (2004) analysis. In their study,
four locomotive operators had VDVs that placed them within the HGCZ (for an
8-h working shift); however, all the Sed values were below the boundary for low
probability of adverse health effects.
A recent study (Eger et al., 2008) explores the differences in health risk
predictions in the operation of load haul dump mining vehicles, and concludes
that more dialogue is needed to identify the appropriate application of ISO
2631-1 (1997) and ISO 2631-5 (2004). Eger et al. found that the risk indicated

5
by values obtained by using ISO 2631-1 (1997) was higher than that based on
ISO 2631-5 (2004). They had WRMS values ranging from 0.06 m/s2 to 1.06
m/s2 and a mean WRMS value of 0.76 m/s2. However, they had crest factors
above nine which indicted the presence of shocks. This was because the
impacts were high relative to the lower values of WRMS obtained from the
data since crest factor is a ratio of the highest impact magnitude to the
WRMS. When the shocks are low this could still lead to lower values of Sed
which leads to the prediction of lower risk to health based on ISO 2631-5
(2004).
Another study (Alem, 2005) found that the risk based on values obtained by
using ISO 2631-1 (1997) was less than that based on ISO 2631-5 (2004) in
the presence of high transient shocks on US army vehicle on cross country
rough terrain. Yet another study (Chen et al., 2009) carried out on riders of
twelve motorcycles on rough roads with high shock content, suggested that
health risk predicted based on the daily dose of equivalent static compression
stress of ISO 2631-5 (2004) is more stringent than that based on the vibration
dose value of ISO 2631-1 (1997). The findings from these studies contradict
each other.
There is a need for further research studies on the ISO 2631-5 (2004)
standard, and for South Africa, especially its application in the mining industry.
1.2 Dissertation overview The dissertation is divided into chapters dealing with introduction and
objectives; measurement and analysis; results; numerical investigation of
parameters; evaluation of results of investigation; and conclusions and
recommendations.
The first chapter deals mainly with the literature pertaining to comprehensive
investigations done using the ISO 2631-1 (1997) methodology and the much
smaller body of pioneering work done on the ISO 2631-5 (2004) standard
methodology.

6
The second chapter deals with the measuring and analysis methodologies.
The chapter lists the equipment used in measurement and shows how the
computations of the various parameters in the standards are done.
The third chapter reports on the analysis of vibration data obtained from field
measurements on the various machines on the open cast mine using the two
standard methodologies under consideration.
The fourth chapter deals with the laboratory simulation of data which is used
to compute the various parameters in the standard methodologies under
investigation. The characteristics of the data are varied to see the trend in the
results obtained. The numerical results of simulation so obtained are used to
see trends and differences in results between ISO 2631-1 (1997) and ISO
2631-5 (2004).
The fifth chapter evaluates the results obtained from the field based on the
ISO 2631-1 (1997) and ISO 2631-5 (2004) standard methodologies in
comparison to each other. Also results obtained on the field are compared to
numerical results.
The sixth and final chapter concludes the dissertation and discusses the
accomplishments, shortcomings and recommendations for further study.
1.3 Literature survey 1.3.1 Various whole-body vibration standards There were about 150 human vibration national standards about two decades
ago (Mansfield, 2005). Since, then some of the standards have been updated
and several new ones have been written. Some of the standards used
globally for whole-body vibration are tabulated below in Table 1.2. Many of
these standards are based on ISO 2631-1 (1997) and give similar results. As
such ISO 2631-1 (1997) is used most often.

7
Table 1.2 Major whole-body vibration standards ISO 2631-1(1997) ISO 2631-2(1989) ISO 2631-4(2001) ISO 2631-5(2004)
Mechanical vibration and shock – Evaluation of human exposure to whole-body vibration. Part 1: General Requirements. Evaluation of human exposure to whole-body vibration – Part 2: Continuous and shock induced vibration in buildings (1 to 80 Hz) Part 4: Guidelines for the evaluation of the effects of vibration and rotational motion on passenger and crew comfort in fixed-guideway transport systems Part 5: Method for evaluation of vibration containing multiple shocks
ISO 8041(1990) Human response to vibration – Measuring instrumentation BS 6841(1987) Measurement and evaluation of human exposure to whole-body
mechanical vibration and repeated shock SAE J1013(1992) Measurement of whole-body vibration of the seated operator of off-
highway work machines SAE J1384(1993) Vibration performance evaluation of operator seats ANSI S2.72/Part 1-2002 (R 2007)
American National Standard Mechanical vibration and shock - Evaluation of human exposure to whole-body vibration – Part 1: General requirements
AS 2670.1-1990 Evaluation of human exposure to whole-body vibration - General requirements
The standard instructs doing a risk assessment also for the repeated shocks.
Partly for this reason ISO 2631-5 (2004) was produced. The purpose of ISO
2631-5 is to define a method for analyzing the effect of multiple shocks in
relation to human health. The standard has a method on how to analyze the
effect of transient shocks based on an experimental model of the lumbar
spine response. Using the method one can calculate the pressure that a
shock or multiple shocks will create to the spine and thus analyze if it will be
damaged or not. It is the only current standard that can be used to analyze
shocks properly.
To evaluate the health effects, the standard introduces a static compressive
stress value (Sed). Sed is calculated from the sixth power sum of acceleration
dose values multiplied with dose coefficients. There are separate procedures
for horizontal and vertical directions in the standard. Horizontal directions are
assumed to have a linear response. The acceleration data is filtered using a
single-degree-of-freedom lumped-parameter model. The vertical direction

8
model is based on a recurrent neural network model, which is non-linear.
There are several variables to be chosen when calculating the health risk.
One of them is the age of the worker. Starting age defines the total years of
exposure until retirement, which contributes to the likeliness of the health risk.
Other factors are the exposure time on a given day, which defines the
acceleration daily dose value, and exposure days in a year, which also affects
the final value.
The differences between ISO 2631-1 (1997) and ISO 2631-5 (2004) are
tabulated below. Table 1.3 Differences between ISO 2631-1 (1997) and ISO 2631-5 (2004) ISO 2631-1 (1997) ISO 2631-5 (2004) Crest factors higher than 9 indicate the presence of shock
Examples of conditions resulting in vibration containing multiple shocks are given to include, but not limited to, machinery travelling over rough surfaces, small boats in rough sea, aircrafts in buffeting, presses and mechanical hammers
Shock is evaluated by using the Vibration dose value (VDV) parameter
Shock is evaluated by using the equivalent static stress (Sed) parameter
The basicentric axis with the highest magnitude is arbitrarily picked
Sed values computed based on input from the three basicentric axes
Does not handle transient shocks well Handles transient shocks well VDV is 4th power based method Sed is 6th power based method Weighting along the three basicentric axes similar
Response in x- and y-axes is linear and based on single degree of freedom model while z-axis is non linear and based on a RNN model
Does not model response to whole-body vibration response
Models lumbar spine response to vibration
Procedure simpler to understand Procedure more complicated 1.3.2 Discussion of whole-body vibration field studies
Occupational health and safety issues have been investigated in several
countries including British Columbia (Teschke et al., 2008), China (Zeng et al.,
2007), Croatia (Goglia and Grbac, 2005), Finland (Yränheikki and Savolainen,

9
2000), Malaysia (Rampal et al., 2006), Spain (Sese´ et al., 2002), amongst
others.
Griffin (1998) compared guidance on measuring, evaluating and assessing
the health effects of whole-body vibration and repeated shock given in ISO
2631 (1974, 1985), BS 6841 (1987), and ISO 2631 (1997) standards.
International Standard 2631 (1974, 1985) offers a set of exposure limits.
British Standard 6841 (1987) defines a measurement and evaluation
procedure (based on frequency weightings and the vibration dose value,
VDV), and gives an action level that can be used to assess vibration severity.
It also mentions some appropriate actions (consideration of the fitness of
exposed persons, design of safety precautions, regular health checks).
International Standard 2631 (1997) is unclear in several important areas:
which body postures and axes are to be assessed; whether evaluations of
multi-axis vibration should be based on the “worst axis” or a combination of
the frequency-weighted acceleration in all axes. He concluded that the
recently revised ISO 2631-1 (1997) for measuring, evaluating and assessing
human exposures to vibration and shock will cause unnecessary confusion.
Salmoni et al. (2008) presented three case studies in transportation to
highlight difficulties experienced when assessing whole-body vibration (WBV)
exposure within an industrial occupational health setting. Across the three
cases and various vehicles, the z-axis was always dominant with acceleration
values collected at the seat–operator interface ranging from 0.10–1.08 m/s2.
Some of the main challenges discussed include the use and interpretation of
safety standards, time and event sampling, effective access to equipment and
operators, and lack of control when testing.
Fritz et al. (2005) found that long-term vibration stress can contribute to
degenerative changes in the joints of the human body, especially in the
lumbar spine. An important factor in the development of these diseases is
given by the forces transmitted in the joints. Because the forces can hardly be
measured, a biomechanical model was developed which simulates the human
body in the standing and the sitting postures. The vibration properties of the

10
model were adapted to the transmissibility transfer function provided in the
standards and the literature. With the model the compressive forces at the
driving point of the body, in the leg joints, and in two motion segments of the
spine were simulated under a vertical pseudo random vibration. Transfer
functions between the accelerations of the ground or of the seat and the
forces were computed. The consideration of the forces resulted in a stronger
weighting of low-frequency vibrations compared to the weighted acceleration
as suggested by ISO 2631-1 (1997). In order to enable an assessment of the
health risk a force-related guidance value was derived which amounted to
0.81 m/s2 (RMS).
Scarlett et al. (2007) conducted a study to quantify whole-body vibration
(WBV) emission and estimated exposure levels found upon a range of
modern, state-of-the-art agricultural tractors, when operated in controlled
conditions (traversing ISO ride vibration test tracks and performing selected
agricultural operations) and whilst performing identical tasks during ‘on-farm’
use. Tractor WBV emission levels were found to be very dependent upon the
nature of field operation performed, but largely independent of vehicle
suspension system capability (due to the dominance of horizontal vibration).
However, this trend was reversed during on-road transport. They concluded
that further ‘on-farm’ WBV data collection is required to enable creation of a
robust, generic WBV emission database for agricultural tractor operations, to
enable estimation of likely WBV exposure by employers.
Hoy et al. (2005) conducted a cross-sectional study to investigate the risks
from whole-body vibration and posture demands for low back pain (LBP)
among forklift truck (forklift) drivers using ISO 2631-1 (1997). They found that
whole-body vibration acted associatively with other factors (not independently)
to precipitate LBP.
Bovenzi and Hulshof (1998) updated the information on the epidemiologic
evidence of the adverse health effects of whole-body vibration (WBV) on the
spinal system by means of a review of the epidemiologic studies published
between 1986 and 1996. In a systematic search of epidemiologic studies of

11
low back pain (LBP) disorders and occupations with exposure to WBV, 37
articles were retrieved. The findings of the selected studies and the results of
the meta-analysis of both cross-sectional and cohort studies showed that
occupational exposure to WBV is associated with an increased risk of LBP,
sciatic pain, and degenerative changes in the spinal system, including lumbar
intervertebral disc disorders. Upon comparing the epidemiologic studies
included in their review with those conducted before 1986, they concluded
that research design and the quality of exposure and health effect data in the
field of WBV had improved in the last decade.
Rehn (2005) characterized whole-body vibration (WBV) exposure from
various all-terrain vehicles (ATVs) like snowgroomers, snowmobiles and
forwarders, and investigated how frequently the drivers’ cervical spine is
positioned in a non-neutral rotational position during operation. They obtained
field measurements of WBV according to the international standard ISO 2631-
1 (1997) in 19 ATVs. The sum of the vectors of frequency-weighted RMS
acceleration varied between 0.5 and 3.5 m/s2, which meant that for most
vehicles they exceeded the action value stated by the European Union (0.5
m/s2 WRMS). In general, snowmobiles achieved the highest vibration total
value. The dominant vibration direction for the snowmobile was the x-axis but
the z-axis also had relatively high vibration dose values and maximal transient
vibration values. The z-axis was the dominant vibration direction for the snow
groomer and the y-axis for the forwarder. Frequency and duration of non-
neutral rotational neck postures were relatively low for all driver categories.
They concluded vibration magnitudes in ATVs are considerably higher than
the EU’s action value and the health guidance caution zones in ISO 2631-1
(1997). The dominant vibration direction varies depending on the machine
type.

12
1.3.3 Duration of measurement of whole-body vibration
Mansfield and Atkinson (2003) discovered that when searching the literature,
one is hard pressed to find reports of whole-body vibration measurements
with duration longer than a few minutes. When making a risk assessment
according to standards and directives, the vibration exposure must be
assessed and often measured. It has previously been assumed that a
measurement of a few minutes will suffice as being representative of the full
working day, although there is little evidence to back-up this assumption. They
measured vibration exposure for drivers for a full working day. The exposures
were analysed to investigate the potential errors from making measurements
from 10 seconds to 60 minutes when compared with the full working day
exposure. They recommended that measurements of vertical whole-body
vibration in vehicles should last at least 10 minutes.
1.3.4 Attenuation of whole-body vibration
Rodean and Arghir (2007) investigated the biodynamic response of the
human body subjected to vertical vibrations in an auto vehicle, in two different
situations: the driver sitting on a rigid seat and the driver sitting on a vehicle
seat with seat cushion and additional seat suspension respectively. In doing
so, a seat suspension model with a detailed lumped parameter model of the
human body, was developed. The human body can be considered as a
mechanical system and it may be roughly approximated by a linear lumped
parameter at low frequencies and low vibration levels. The lumped parameter
model of the human body consists of four parts: pelvis, upper torso, viscera
and head. The seat suspension is formed by a spring and dashpot. They
concluded that adding the seat cushion with the mechanical characteristics
(mass, stiffness, damper) and the additional seat suspension resulted in the
modification of the eigenvalues of the given mechanical system (the human

13
body) close to the natural frequencies. This means the seat with an additional
mechanical system changes the human body’s natural frequencies and can
protect the human body inside an auto vehicle.
Newell and Mansfield (2008) investigated the influence of sitting in different
working postures on the reaction time and perceived workload of subjects
exposed to whole-body vibration. Twenty-one subjects were exposed to 1–
20 Hz random vibration in the vertical and fore-and-aft directions. A task was
completed while seated in four posture conditions: upright or twisted, with and
without armrests. Posture combined with whole-body vibration exposure had
a significant influence on the ability to perform the task. The combined
environmental stressors significantly degraded the performance; not only did
their reaction times become compromised, the participants’ workload demand
also increased. The most severe decrement in performance and workload
was experienced while seated in a twisted posture with no armrest support.
They concluded the inclusion of armrests significantly improved the
participants’ ability to complete the task with a lower workload demand.
Tiemessen et al. (2007) found that musculoskeletal disorders (MSD) at the
workplace cost a lot. These MSD, low back pain in particular, could be caused
by exposure to whole-body vibration (WBV). They suggested preventive
strategies to reduce vibration exposure may contribute to a decrease in MSD.
They explored evidence-based preventive strategies to reduce vibration
exposure on drivers by using 15 laboratory studies, 17 field studies, 4
laboratory/field studies and 1 intervention study. The intervention study,
described an intervention strategy to reduce WBV exposure in the workplace.
The other studies only identified factors that have effects on vibration
exposure. They categorized the factors into two: (1) design considerations
and (2) skills and behaviour. Most studies focused on factors within category
(1) while factors within category (2) may be promising as well, as these
factors are often less expensive and easier to implement. They suggested
factors from both categories should be combined in preventive strategies, as
there is a lack of evidence of effective preventive strategies to reduce

14
vibration exposure on drivers. This might lead to a decrease in the incidence
of low back pain due to exposure to whole-body vibration.
1.3.5 Whole-body vibration in the mining industry
Mandal et al. (2006) measured frequency weighted root mean square
(WRMS) acceleration of 18 (eighteen) heavy earth-moving machineries
(HEMM) comprising dumper, dozer and shovels in three opencast mines
using a human vibration monitoring system. Analysis of the data showed that
13 of the 18 pieces of equipment had vibration levels beyond safe limits for
four hours operation in a day, as per ISO 2631-1 (1997) standard. The tested
dumpers and dozers indicated potential for health risk from WBV. The
vibration levels of shovels were within safe limits.
Eger et al. (2005) measured WBV exposure levels at the vehicle seat
interface and the operator seat interface, during the operation of both small
and larger load haul dumper (LHD) vehicles. Results were compared to the
ISO 2631-1 (1997) health guidance caution zones to determine safe exposure
durations. Preliminary test results indicated that LHD operators were exposed
to whole-body vibration levels putting them at risk for injury. ISO 2631-1
(1997) exposure guidelines for the health caution zone were exceeded during
the operation of several different vehicles. Some seats were also found to
amplify the vibration signal resulting in a reduction in the recommended
exposure duration.
Santos et al. (2008) determined the acute effects of whole-body vibration
(WBV) on the sensorimotor system and potentially on the stability of the
spine. Different biomechanical responses were tested before and after 60
minutes of sitting, with and without vertical WBV, on four different days.
Postures adopted while sitting without WBV and the simulated WBV exposure
corresponded to large mining load haul dump (LHD) vehicles as measured in
the field. Twelve males performed trials of standing balance on a force plate
15
and a sudden loading perturbation test to assess back muscle reflex
response, using surface electromyography (EMG). They concluded exposure
to WBV elicits significantly higher, though low-level, back muscle activity,
compared to sitting without vibration. Muscle fatigue of the longissimus and
iliocostalis lumborum muscles as well as some variables associated with
balance was significantly affected after sitting for 60 minutes. However, WBV
alone did not induce effects any more than sitting without vibration. This
emphasizes that WBV per se is not necessarily responsible for such acute
effects. Sitting without vibration appears to have the potential to influence
back muscle fatigue and postural balance. However, this may only be
attributed to the constrained trunk posture simulated during the 60 minutes of
exposure.
Berezan et al. (2004) found that aggressive driving patterns, rough and poorly
maintained roads and pit floors, along with the occasional bump and poorly
placed load from a shovel can create intense and sometimes serious vibration
levels on a heavy hauler. They proposed that an onboard vibration warning
system based on the ISO 2631-1 (1997) standard could be used to help
operators reduce the vibration levels experienced in a heavy hauler. The
onboard system would consist of a screen that displays the instantaneous
vibration in the form of three lights: green (safe zone), yellow (cautious zone),
and red (danger zone), as well as an overall vibration exposure or dose for
the entire shift. With the utilization of the warning system, it is anticipated that
the overall vibration levels will be decreased resulting in improved operator
health, a reduction of vibration-induced maintenance, and improved haul
roads through reduced impact loading and repair for localized trouble areas.
1.3.6 Whole-body vibration in the South African mining industry
Van Niekerk et al. (2000) made the first comprehensive attempt to measure
the vibration levels of a variety of tools and equipment in the South African
mining industry to determine the effect thereof on the health of workers and
operators. The scope of their research included measurements over a broad
spectrum of tools, machines and vehicles used in the South African mining

16
industry. Whole-body vibration was investigated and measured. They
obtained WBV data from several mines in accordance with ISO 2631-1
(1997). The equipment with the highest vibration levels in the whole-body
vibration were earth-moving equipment.
Mdlazi (2008) conducted further research to investigate the impact of whole-
body vibration on the day to day activities at Anglo operations in South Africa.
It was concluded that there is enough evidence that a number of vehicles and
equipment at Anglo operations expose employees to high vibration levels and
that vibration exposure levels have to be managed to minimize the risk of
injury.
1.3.7 WBV with transient shock For most people, vehicle vibration and shocks are low magnitude. However,
for occupants in off road vehicles, such stress may be severe and frequent,
leading to adverse health effects (Griffin, 1990; Nicol, 1996). Epidemiological
studies suggest that exposure to shock and vibration can lead to fatigue,
gastro intestinal/cardiovascular problems, and back disorders such as disk
degeneration (Nicol, 1996). For vibration without transient shocks ISO 2631-1
(1997) is sufficient for evaluating the exposure levels. However, for high
amplitude shocks experienced in off road vehicles a separate approach needs
to be taken.
Nicol worked on modeling of the dynamic response of the human spine to
mechanical shock and vibration, which involved the development of an
artificial neural network (ANN) and two linear different models. This was
presented as a proposed annex to the International Organization of
Standardization for inclusion in the ISO 2631 (Morrison et al., 1998). ANNs
are universal approximators capable of modeling any continuous function if
trained with a sufficiently representative set of measured input-output data.
Nicol (1996) used such an ANN to predict the z-axis (vertical) acceleration at
the fourth lumbar vertebra based on measured z-axis seat acceleration.
17
Morrison et al. (1998) evaluated exposures to repeated mechanical shocks in
tactical ground vehicles (TGV) using the health hazard assessment (HHA)
method they developed in phase 5 of a project titled “Development of a
standard for health hazard assessment (HHA) of mechanical shock and
repeated impact in army vehicles”. Prior to this, in phase 1, a comprehensive
review of the literature including field measurements of vehicle vibration,
epidemiological data and existing standards were considered. In phase 2,
they analyzed acceleration data obtained from military vehicles under a
variety of operational conditions, developed unique methods for motion
characterization and appropriate motion simulations for the experimental
phase. In phase 3, a pilot study was conducted at the Multi-axis Ride
Simulator (MARS) in Fort Rucker, Alabama, to develop suitable measures of
human response to shock. In phase 4, measurement of human response to
individual shocks of different duration and amplitude, and to daily exposures
to repeated mechanical shocks were conducted at MARS in Fort Rucker,
Alabama. Finally, in phase 5, a HHA method based on the information
gathered in the previous phases of the project was developed. The method
predicted the risk of injury to the crew of a TGV from its seat acceleration
signature. The HHA identified both acute and chronic health risks resulting
from either a few large amplitude shocks, or prolonged exposure to travel over
rough terrain. They obtained experimental data from volunteers exposed to a
range of repeated shocks exposures. The HHA consists of four components:
dynamic response models predicting seat-to-spine transmission of
acceleration; a biomechanical model which computes the compressive force
in the lumbar spine in response to acceleration; a dose model for exposure to
repeated shocks based on material fatigue characteristics and an injury risk
model based on probability to failure. A software version of the HHA was
developed in MATLAB.
Lewis and Griffin (1998) performed evaluations on the seat accelerations
measured in nine different transport environments (bus, car, mobile crane,
fork-lift truck, tank, ambulance, power boat, inflatable boat, mountain bike).
These evaluations were carried out in conditions that might be considered
severe using three standards to assess the vibration and shock transmitted by

18
a vehicle seat with respect to possible effects on human health. The three
standards used were ISO 2631/1 (1985), BS 6841 (1987) and ISO 2631-1
(1997). For each environment, limiting daily exposure durations were
estimated by comparing the frequency weighted root mean square (RMS)
accelerations and the vibration dose values (VDV), calculated according to
each standard with the relevant exposure limits, action level and health
guidance caution zones. They obtained different estimates of the limiting daily
exposure duration obtained using the methods described in the three
standards. Differences were observed due to variations in the shapes of the
frequency weightings, the phase responses of the frequency weighting filters,
the method of combining multi-axis vibration, the averaging method, and the
assessment method. With the evaluated motions, differences in the shapes of
the weighting filters resulted in up to about 31% difference in RMS
acceleration between the ISO 2631/1 (1985) and the ISO 2631-1 (1997)
standard and up to about 14% difference between BS 6841 (1987) and the
ISO 2631-1 (1997). There were correspondingly greater differences in the
estimates of safe daily exposure durations. With three of the more severe
motions there was a difference of more then 250% between estimated safe
daily exposure durations based on WRMS acceleration and those based on
fourth power vibration dose values. The vibration dose values provided the
more cautious assessments of the limiting daily exposure duration.
Khorshid et al. (2007) used speed control humps to introduce shocks and high
vibration levels when a car passes over them if its speed is higher than the
allowable limit. They based their assessment on two standard methods of
measuring whole-body vibration: the British standard BS 6841 (1987) and the
new ISO/DIS standard 2631-5. These methods were used to assess the
effects of vehicle type, passenger location in the vehicle, vehicle speed, and
speed control hump geometry. It was found that circular speed control humps
currently installed on many public roads should be modified in order to
eliminate hazards. They found the magnitude of shock parameters that might
harm the health of vehicle occupants depended on the vehicle speed, hump
geometry, vehicle type, position of occupants in the vehicles, and evaluation
method. The whole-body vibration of the driver’s seat was affected greatly by

19
hump geometry, especially the hump height. As the height increases, the
health risk increases. The rear-seated passenger is also at high health risk,
compared to the front-seated driver.
Kumar (2004) investigated if the vibration in x-, y- and z- axes of the seat
pans of the heavy haul trucks used in overburden mining, and the vibration
experienced by the drivers at the third lumbar and seventh cervical vertebral
levels in operating these trucks, exceeded the ISO standards, and thereby
posing a threat to safety. They found that heavy haul trucks (240 and 320 ton
capacity) frequently generated vibrations in excess of ISO standards in
overburden mining operations, representing a health hazard.
Ahn and Griffin (2008) studied the discomfort of seated subjects exposed to a
wide range of vertical mechanical shocks. Shocks were produced from
responses of single degree-of-freedom models with 16 fundamental
frequencies (0.5–16 Hz) and four damping ratios (0.05, 0.1, 0.2 and 0.4) to
half-sine force inputs. Shocks with a damping ratio of 0.4 were presented with
both polarities. Each type of shock was presented at five unweighted vibration
dose values (0.35–2.89 m/s1.75). The magnitude estimates of 15 subjects to all
400 shocks showed that the rate of growth in discomfort (the exponent in
Stevens’ power law) decreased with increasing shock frequency from 0.5 to 4
Hz. Equivalent comfort contours showed greatest sensitivity from 4 to 12.5
Hz. At lower magnitudes, variations in discomfort with frequency were similar
to weighting, Wb in British Standard 6841. At higher magnitudes, low
frequencies were judged relatively more uncomfortable than predicted by this
weighting. There were small but statistically significant differences in
discomfort associated with variations in damping ratios and shock direction.
They concluded that the frequency dependence of discomfort produced by
vertical shocks depends on shock magnitude, but for shocks of low and
moderate discomfort, the current evaluation methods are reasonable.
Alem et al. (2004) presented results of health risk prediction by the new
multiple shocks standard (ISO 2631-5 (2004)) compared to predictions by the
current WBV standard ISO 2631-1 (1997). The comparison focused on two
20
current indices - the weighted root mean square (WRMS) and the vibration
dose value (VDV) that was designed to emphasize the shocks embedded in
WBV as well as the equivalent daily stress dose (Sed) that was introduced in
the new standard. They showed that the new standard is more sensitive to
cross-country rough terrain signatures than WBV methods, but produces
similar predictions for ride signatures obtained over paved or secondary
roads. The health risk prediction based on Sed was more stringent because of
the high shocks or impacts encountered on the cross-country rough terrain.
Chen et al. (2009) carried out a study on riders of twelve motorcycles,
comprising 6 full-scale motorbikes and 6 motor-scooters, and 5 sedan
vehicles, performed test runs on a 20.6 km paved road. Their experimental
data suggest that health risk predicted based on the daily dose of equivalent
static compression stress of ISO 2631-5 (2004) is more stringent that based
on the vibration dose value of ISO 2631-1 (1997). The health risk prediction
based on Sed was higher because of the high shocks or impacts encountered
on the roads.
Johanning et al. (2006) illustrated typical work stations (cabs and seats) in
US/Canadian type locomotives and assessed shock related exposure risk by
calculations of the new proposed shock risk indicators according to the new
ISO 2631-5 (2004). Field measurements were obtained during normal
operations following generally accepted guidelines (ISO 2631-1 (1997)) on 50
locomotive operators. A sub-sample of 20 locomotives was selected for the
calculation of proposed shock indicators (ISO 2631-5 (2004)). Different shock
indicator values were computed based on both ISO standards. The health risk
based on the new ISO 2631-5 (2004) method for evaluation of vibration
containing multiple shocks as suggested in their calculations was lower than
the exposure risk based on the ISO 2631-1 (1997) standard. North American
railroad operators are exposed to vibration and shock (Johanning et al.,
2002). They reported that 22 US railroad locomotives had low WRMS
vibration levels. The highest WRMS value was 0.43 m/s2 and a mean WRMS
value of 0.32 m/s2 which is below the EAV based on ISO 2631-1 (1997).
However, they had crest factors above nine which indicted the presence of

21
shocks. This was because the impacts were high relative to the low values of
WRMS obtained from the data since crest factor is a ratio of the highest
impact magnitude to the WRMS. Since the impacts or shocks were not high
enough this led to low values of Sed based on ISO 2631-5 (2004) which led to
the lower risk predictions.
Cooperrider and Gordon (2008) measured shock and impacts on North
American locomotives and evaluated the data through the vibration dose
value (VDV) and spinal stress methods given in international standard ISO
2631-5 (2004). More than 90 h of measurement data are used in this analysis.
This analysis found that shock and impact present a low probability of adverse
health effects. They concluded the health guidance provided in ISO 2631-1
(1997) for the VDV is more stringent than the health guidance for the spinal
stress in the ISO 2631-5 (2004).
Eger et al. (2008) compared health risks predicted by ISO 2631-1 (1997) and
2631-5 using the operation of load haul dump (LHD) vehicles. Whole-body
vibration (WBV) exposure was measured according to procedures established
in ISO 2631-1 (1997). A tri-axial seat pad accelerometer was used to measure
vibration exposure at the operator/seat interface. According to ISO 2631-1
(1997) criteria, calculated 8-h equivalent vibration dose values placed three of
the seven LHD operators above the health guidance caution zone (HGCZ)
boundaries and four LHD operators within the HGCZ. However, health risks
predicted by the ISO 2631-5 (2004) criteria were always lower than the risks
predicted by ISO 2631-1 (1997) criteria. They suggested more dialogue is
required to identify the appropriate application of ISO 2631-1 (1997) and
2631-5 given the different health risks predicted for a data set with high shock
content. As earlier explained, the shock magnitude here was low in spite of
the high crest factors obtained. This was because the impacts were high
relative to the low values of WRMS obtained from the data since crest factor
is a ratio of the highest impact magnitude to the WRMS. Hence, low
magnitude impacts or shocks led to the prediction of the presence of shocks
based on ISO 2631-1 (1997). However, because the shocks were of low

22
magnitude this led to low values of Sed based on ISO 2631-5 (2004) which
also led to the lower risk predictions.
Notini et al. (2006) presented a quantitative assessment of WBV components
below 1 Hz in WBV data acquired from a sample of earth moving machines.
Assessment of the components occurs in terms of their contribution to ISO
2631-1 (1997) metrics and ISO 2631-5 (2004) determined risk of an adverse
health effect. They concluded that components below 1 Hz make an important
contribution to frequency weighted RMS and VDV values in the x- and y-
axes, but a marginal one to the ISO 2631-5 (2004) determined risk of an
adverse health effect.
Marjanen (2005) states that ISO 2631-1 (1997) standard is poor in taking into
account transient shocks, especially those which occur rarely, thus giving a
wrong indication of the potential health problems when shocks are present. It
is also important to notice that WRMS and VDV values do not correlate with
each other, because they emphasize amplitudes differently. Still the transient
shocks are recognized to be dangerous to a lumbar spine, even though they
would occur rarely.
In this study Marjanen used ISO 2631-5 (2004) as an additional evaluation
method to determine how helpful it is and what kind of implications it has. The
study used whole-body vibration measurements from 26 mobile work
machines that were previously analyzed only using WRMS values based on
ISO 2631-1 (1997). The results showed that ISO 2631-5 (2004) is useful
especially when the result values are showed jointly with ISO 2631-1 (1997)
WRMS values. From WRMS value alone it is very hard to conclude what kind
of characteristics the vibration has. However, looking at the WRMS of ISO
2631-1 (1997) together with the acceleration dose or static compressive
stress value from ISO 2631-5 (2004) also showed the results will be easier to
evaluate.
There is a need to have more accurate values (from two standards like the
ISO 2631-1 (1997) and ISO 2631-5 (2004)) for evaluation of vibration

23
exposure instead of using only one standard (ISO 2631-1 (1997)). This could
be possible if other values (Sed and R factor values) would be shown with
WRMS or VDV value. This might be helpful especially when evaluating
vibration exposure based on literature or previous measurements alone.
WRMS value itself does not include any information about the frequency or
shock content of the vibration. It only shows statistical energy content of the
vibration. Marjanen concluded the ISO 2631-5 (2004) standard is a
complicated document. It takes a great deal of studying to understand it
properly. Although there is a complete MATLAB script as an example in one
of the annexes, it is not a straightforward procedure to use. This might restrain
wider usage of the standard in the future. There is no direct correlation
between ISO 2631-5 (2004) and WRMS values. The vector sum of WRMS
values gives the closest correlation, but there still is a great variability
between the values. This means that both methods can underestimate the
health risks of the vibration exposure, if used separately for evaluation. The
methods will become more useful if the values are shown together. The Sed
value shows the potential health problems of transient shocks and WRMS
value (or VDV) the problems associated with the average level of vibration. If
one of them exceeds their own limit value, then there is a great possibility of
potential health problem. Also the information about the content of the
measurement is more detailed if both values are calculated and saved. There
is no doubt that the concept of ISO 2631-5 (2004) can be helpful for an
employer and even for a researcher. How helpful it will be, depends on how
widely it will be used and how easily it will be understood. Also there might be
some scepticism if this method evaluates spinal column response and health
problems correctly, because of the complex procedure of evaluating vibration.
Hiemenz and Wereley (2007) carried out a study on the newest United States
Marine Corps amphibious vehicle, Expeditionary Fighting Vehicle (EFV),
designed to operate over harsh off-road terrain as well as in oceans and
rivers. Travelling over water, the EFV is capable of much higher speeds (3x)
than its predecessors, which has lead to high shock loads being transmitted to
the occupants when operating in high sea states. These shock loads are
particularly problematic in the forward seating positions for the driver and

24
troop crew commander. Shock and vibration may also be transmitted to the
occupants when the vehicle is travelling over land and traversing rough
terrain. Magneto-rheological (MR) shock absorbers have the advantage that
their damping levels can be adjusted automatically in real-time with low power
control signals, and accomplish controllability without additional moving parts
over conventional hydraulic dampers (therefore highly reliable). They showed
that, with a real-time controller developed specifically for this application, the
system can reduce the ISO 2631-5 (2004) shock dosages applied to the
occupant by up to 23% in water mode and reduce the vibration transmitted to
the occupant by up to 65% as compared to the current passive suspension
system. The study showed that the semi-active MR seat suspension enables
a unique single solution for both shock and vibration environments that will
provide optimal occupant protection from both harmful shock and vibration
and thus significantly lengthen the allowable exposure time for soldiers in both
training and tactical missions.
Li (2007) presented a constrained multi-body dynamics method to study
musculoskeletal disorders due to human vibration, modifying Kane’s
equations to develop governing equations of a multi-body human-body model
subjected to constraints. It is observed that the resulting generalized
constraint force array is proportional to the transpose of the matrix of
coefficients of the constraint equations. This theoretical method is used to
obtain a computational simulation of a heavy equipment operator subjected to
whole-body vibration due to multiple shocks in a working environment. He
determined the mechanism of shock inducing low back pain and disorder by
developing a quantitative relation between vibration excitation and human
response. A multi-body sitting human body model subjected to lower
amplitude and high amplitude acceleration exposures containing multiple
shocks was used. The simulation results were compared to published data.
The dissertation presented a vibration analysis procedure to conduct time
domain and frequency domain human body dynamics.
Paddan and Griffin (2002) measured, evaluated and assessed vibration in
100 different vehicles according to British Standard BS 6841 (1987) and
25
International Standard ISO 2631-1 (1997). The vibration was measured in 14
categories of vehicle including cars, lift trucks, tractors, lorries, vans and
buses. In each vehicle, the vibration was measured along five axes: vertical
vibration beneath the seat, fore-and-aft, lateral and vertical vibration on the
seat pan and fore-and-aft vibration at the backrest. Assessments made using
the procedure defined in ISO 2631-1 (1997) tend to underestimate any risks
from exposure to whole-body vibration compared to an evaluation made using
the guidelines specified in BS 6841 (1987). Consequently, ISO 2631-1 (1997)
“allows” appreciably longer daily exposures to whole-body vibration than BS
6841 (1987). They also found that with increasing magnitude, the growth rate
in discomfort caused by vertical shocks decreased with increases in the
fundamental frequencies of the shocks.
Burström et al. (2006) noted that the Scandinavian Airlines System (SAS)
cabin attendants had reported an increase in health problems associated with
landing. The European Union reports cover health problems related to neck,
shoulder, and lower-back injuries. Moreover, analysis of these reports shows
that the problems are often associated with specific airplanes that have a
longer tail behind the rear wheels and appear more often in attendants who sit
in the back of planes rather then the front. Against this background, this study
measures and describes the vibration during landing in specific airplanes to
evaluate the health risk for the cabin attendants. Measurements were
conducted on regular flights with passengers in the type of airplane, Boeing
737-800, which was related to the highest per cent of reported health
problems. All measurements were performed the same day during three
landings in one airplane with the same pilots and cabin attendants. The
measurements were carried out simultaneously on the cabin crew seats in the
back and front of the passenger cabin. For the cabin attendants, the dominant
direction for the vibration load during landing is the up-and-down direction
although some vibration also occurs in the horizontal directions. The exposure
to vibration is higher on the rear crew seat compared to the front seat. For
instance, both the vibration dose value (VDV) and the frequency-weighted
acceleration in the dominant direction are more than 50% higher on the rear
seat than on the front seat. The frequency-weighted acceleration and the VDV

26
measured at the crew seats are below the exposure limits as described by the
European vibration directive. The evaluation of the cabin attendants’ exposure
to multiple shocks during landing shows that the potential of an adverse
health effect for the cabin attendants is low in the front of the airplane and
increases to moderate in the rear. They concluded that there could be a risk
for cabin attendants due to the exposure of multiple shocks. Therefore, efforts
should be spent to minimize their risk by developing a better seat cushion and
back support to lessen the effects of shocks. In addition, attendants should be
informed about the most suitable posture to take during landing.
1.4 Scope of the work Employers are required to perform “a suitable and sufficient assessment of
risk”, including estimation of worker daily vibration exposure level, to
determine whether the EAV or ELV are likely to be exceeded during normal
work on these machines. It is therefore of considerable importance that an
adequate, robust database of WBV levels and daily exposure data is
developed to encompass as wide a range of machines and operations in the
South African mining industry where working conditions are different from
other parts of the world. Such a database may then be used by South African
mines to assess the exposures/risks in these mines. Previous work has been
carried out on whole-body vibration in the South African mines (Van Niekerk
et al. 2000; MHSC 2004; Mdlazi 2008) using the ISO 2631-1 (1997) standard
methodology. However, no work has been done using the new standard
methodology.
Within the scope of this investigation, whole-body vibration was recorded on
basically one or two of each type of machinery in an open cast mine. These
machine types included load haul dumpers, excavators, graders, dragline,
drills, off road vehicles, liquid conveyors, compactors, front end loaders and
dozers.
Adverse effects on the lumbar spine are the dominating health risks of long-
term exposure to vibration containing multiple shocks. ISO 2361-5 is therefore

27
basically concerned with the lumbar spine response. The purpose of this
standard is to define a method of quantifying whole-body vibration containing
multiple shocks in relation to human health.
Static compressive stress, Sed, and R factor parameters based on ISO 2631-5
(2004) were compared with the WRMS and VDV parameters obtained using
ISO 2631-1 (1997) to bring out the differences between the two standards.
1.4.1 Objectives
Even though the new ISO 2631-5 (2004) standard methodology has been
used in a few studies around the world, it has never been used to evaluate
whole-body vibration in the South African mining industry. Several studies
(Alem et al. (2004), Johanning et al. (2006), Cooperrider and Gordon (2008),
Eger et al. (2008) and Chen et al. (2009)) carried out WBV using the new
standard methodology; which led to conflicting results when compared with
the established ISO 2631-1 (1997) methodology. This research study
therefore tries to evaluate operator whole-body vibration and shock exposure
using the two standard methodologies and critically comparing them.
The research endeavours to accomplish the following objectives:
• Assessing whole-body vibration based on ISO 2631-1 (1997) standard
in an open cast mine;
• Assessing whole-body vibration with shock based on ISO 2631-5
(2004) standard in an open cast mine;
• Study of the effect of increasing magnitude of shocks on computation
of Sed and VDV values;
• Critical evaluation of results obtained using ISO 2631-1 (1997) and ISO
2631-5 (2004) standards in an open cast mine.

28
2. Measurement and analysis
2.1 Overview of the open cast mine Vibration levels were measured in an open cast mining environment. These
measurements were done on a wide range of mining machines at the a large
mine in the Southern hemisphere in South Africa. This mine has three open
cast mining sections. The WBV measurement was done on one or two
examples of each of the different types of machines on the mine for
subsequent WBV analysis.
The mine is one of the largest in the southern hemisphere and has a fleet of
some 2000 mining vehicles. This investigation was commissioned by the open
cast mine management to determine WBV emissions and operator exposure
levels upon all the different types of machinery used in the three mining
sections. The selected machinery measured in this investigation is
representative of the typical machines that one will find on South African open
cast mines.
2.2 The open cast mining process
Open cast or surface mines generally follow the same basic steps to produce
coal. The mining process begins with removal of the topsoil which is stored
for later use in the reclamation process. Many small holes are drilled through
the overburden (dirt and rock above the coal seam) to the coal seam. The
holes are then loaded with explosives which are discharged, shattering the
rock in the overburden. Giant power shovels or draglines then clear away the
overburden until the coal is exposed. Excavators (smaller shovels) and track
dozers are then used to scoop up the coal and load it onto trucks or LHDs,
which convey the coal to the temporary site or preparation or processing

29
plant. Figure 2.1 shows the schematic of the basic open cast coal mining
process.
2.3 Whole-body vibration (WBV) measurement and analysis
2.3.1 Measured parameters and transducers
Vibration measurements were done according to the measuring procedure
outlined in ISO 2631-1 (1997), which is also applicable to ISO 2631-5 (2004).
Acceleration levels were measured on the operator seat of the target machine
in three perpendicular directions (seat x - longitudinal, seat y - transverse,
seat z – vertical, see Figure 2.2) and on the floor beneath the seat.
2.3.1.1 Dytran tri-axial seat accelerometer Vibration on the driver’s seat was measured by placing the tri-axial seat
accelerometer on the seat cushion. The seat accelerometer was attached to
the seat cushion using duct tape (see Figure 2.3). Calibration details are
provided in Table 2.1. The accelerometers and SVAN958 calibration was
given by the manufacturer as approximately 100 mV/g and 100mV/m/s2
respectively. The latter introduced a factor of square root of 2. The overall
channel calibration (see Table 2.2) was therefore computed to be
approximately 140m/s2/V. The full instrumentation list is shown in Table 2.3.
2.3.1.2 Industrial ICP accelerometer The industrial ICP accelerometer was attached to the machine floor under the
seat of the operator as shown in Figure 2.4. Calibration detail is provided in
Table 2.1. Overall channel calibration detail is provided in Table 2.2.

30
Excavator-excavates and loads top soil
LHD-loads, hauls and dumps top
soil at sites
Drill-drills holes to coal bed for
blasting
D10R or D9T track dozers-gathers coal
Excavator-excavates and
loads coal
Dragline-removes overburden to expose coal
LHD-conveys coal to coal temporary
site
Double trailer- conveys coal to processing plant
Grader-grades or levels the road for
LHD
Compactor- compacts graded
roads
Water bowser-waters the road to
reduce dust Figure 2.1: Basic open cast coal mining process

31
Principal basicentric axes for a seated person
Figure 2.2: Basicentric axes of the human body (ISO 2631-1 (1997))
Table 2.1 Transducer calibration Transducer Axis Calibration
Dytran tri-axial seat accelerometer Model 5313A x 100.0 mV/g Dytran tri-axial seat accelerometer Model 5313A y 98.9 mV/g
Dytran tri-axial seat accelerometer Model 5313A z 97.7 mV/g
Industrial ICP accelerometer Model E327A01 z 100.0 mV/g
Table 2.2 Overall channel calibration Transducer Axis Calibration
Dytran tri-axial seat accelerometer Model 5313A x 138.7 m/s2/V Dytran tri-axial seat accelerometer Model 5313A y 140.3 m/s2/V Dytran tri-axial seat accelerometer Model 5313A z 142.0 m/s2/V Industrial ICP accelerometer Model E327A01 z 138.7 m/s2/V
Table 2.3 Instrumentation Instruments Laptop Acer Extensa Model MS2205 SVAN958 Analyzer and cables Model 958 Sony Digital Camera Calibrator Accelerometers Industrial ICP accelerometer Model E327A01 Dytran tri-axial seat accelerometer Model 5313A
32
Figure 2.3: Dytran tri-axial seat accelerometer
Figure 2.4: Floor ICP industrial accelerometer

33
Figure 2.5: SVAN958 HVM data acquisition system 2.3.2 Data acquisitioning and recording Signals from the tri-axial accelerometer and the ICP industrial accelerometer
were passed to a 4-channel SVAN958 Human Vibration Meter (HVM) which
did the digital data recording (see Figure 2.5). A Kingston 16 GB flash storage
disk was attached to the SVAN958 to enable it record data of long duration.
High quality long life batteries were used to power the HVM data recorder to
ensure sufficient recording times.
The sampling rate of the HVM is automatically fixed at 48 kHz. Anti-aliasing
filters are embedded in the system. The HVM has ISO 2631 filters. For data
acquisition purposes and accuracy, the enhanced memory of the HVM was
used to record time data as well as the unweighted RMS averages of the
acceleration signals. These data were downloaded to a PC for post
processing and further analysis.

34
The time required for both fitting and removal of the transducers and the data
acquisition system was about 10-20 minutes. As suggested by Mansfield and
Atkinson (2003) a minimum of 10 minutes is required to record data.
Therefore, to minimise disruption of the commercial operations for which the
machines are used, the fitting and removal were performed during normal
work breaks where possible. This led to overall data recording periods that
were generally between 30 minutes and 1 hour.
2.4 Data analysis The data time histories were recorded in Volts in waveform audio (WAV) file
format. The calibration factors (Tables 2.1. and 2.2) were then applied to
obtain the equivalent acceleration-time history in m/s2 from the WAV format
data obtained from the SVAN958 Human Vibration Meter (HVM). The data
was subsequently downloaded to a PC and dedicated MATLAB based
software was used to enable reading of large WAV files. The same data set
was used for the analysis using the two standards ISO 2631-1 (1997) and ISO
2631-5 (2004).
2.4.1 Computation of ISO 2631-1 (1997) parameters
In accordance with the requirements of ISO 2631-1 (1997), the acceleration
time histories recorded on the operator’s seat and floor of the target machines
were post-processed using dedicated MATLAB software to compute the
following:
• Frequency and measurement axis-weighted acceleration RMS time
histories;
• Estimated operator daily vibration exposure, presented in 8-hour
energy-equivalent continuous, frequency-weighted RMS acceleration
A(8) and VDV forms;
• Crest factor CF for each target machine;

35
• Time to reach the EAV and ELV, when specified both in A(8) and VDV
forms;
• WRMS and VDV “SEAT” (seat effective amplitude transmissibility)
values.
As a check on the integrity of the results obtained via MATLAB from the
recorded time data, the RMS and VDV were computed and compared to the
values displayed directly on the SVAN958 HVM. The VDVs for an 8-hour
exposure period and the operating time to reach the exposure action and limit
values (EAV and ELV), as defined in EU Directive 2002/44/EC (see Table 1.1)
were also computed. The weighted acceleration histories were also plotted
from the data obtained.
During the data collection period, questionnaires (see appendix J) were used
to record operator and equipment details as well as other information
(Vibration Injury Network, 2001). The vibration measurement times were
recorded on the SVAN958. The data acquired was measured for 30 minutes
to 1 hour period as earlier explained. However, this was measured in such a
way as to represent the vibration levels experienced by the operator during
the nominal 8-hour work period.
The required parameters were then computed and extrapolated to cover the
entire duration of exposure using dedicated software developed in the
MATLAB environment. The time domain data was read in MATLAB and then
converted to m/s2. The data was then weighted according to ISO 2631-1
(1997) whole-body vibration weighting filter. Subsequent to the weighting, the
WRMS and VDV parameters were then computed. The software was
validated by reproducing the whole-body vibration weighting curve in the ISO
2631-1 (1997) standard from artificially generated sinusoids over the range of
frequencies between 1 Hz to 80 Hz.
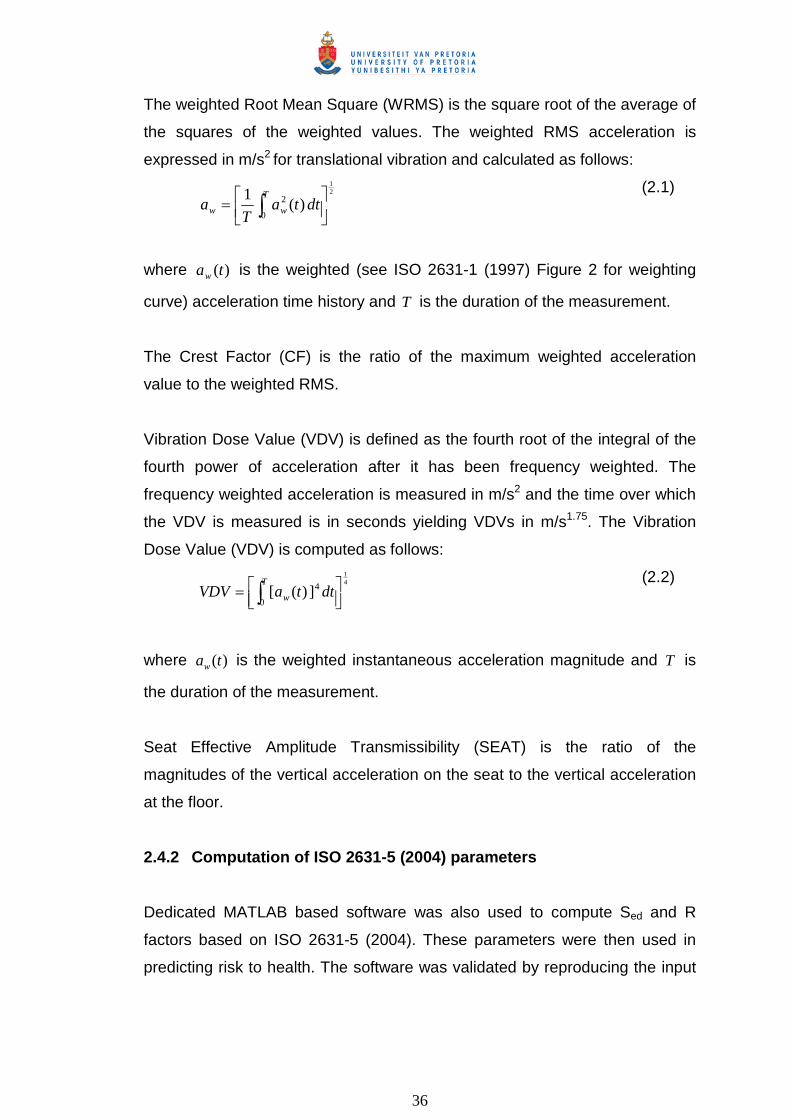
36
The weighted Root Mean Square (WRMS) is the square root of the average of
the squares of the weighted values. The weighted RMS acceleration is
expressed in m/s2 for translational vibration and calculated as follows:
21
)(1 2
0
= ∫ dttaT
a w
T
w (2.1)
where )(taw is the weighted (see ISO 2631-1 (1997) Figure 2 for weighting
curve) acceleration time history and T is the duration of the measurement.
The Crest Factor (CF) is the ratio of the maximum weighted acceleration
value to the weighted RMS.
Vibration Dose Value (VDV) is defined as the fourth root of the integral of the
fourth power of acceleration after it has been frequency weighted. The
frequency weighted acceleration is measured in m/s2 and the time over which
the VDV is measured is in seconds yielding VDVs in m/s1.75. The Vibration
Dose Value (VDV) is computed as follows:
41
4
0])([
= ∫ dttaVDV w
T
(2.2)
where )(taw is the weighted instantaneous acceleration magnitude and T is
the duration of the measurement.
Seat Effective Amplitude Transmissibility (SEAT) is the ratio of the
magnitudes of the vertical acceleration on the seat to the vertical acceleration
at the floor.
2.4.2 Computation of ISO 2631-5 (2004) parameters
Dedicated MATLAB based software was also used to compute Sed and R
factors based on ISO 2631-5 (2004). These parameters were then used in
predicting risk to health. The software was validated by reproducing the input

37
seat acceleration and obtaining the lumbar x, y and z response in Annex D of
the ISO 2631-5 (2004) standard.
The measurement was resampled to a sampling rate of 160 samples per
second as required by the ISO 2631-5 (2004) standard methodology. The
software only accepts data at a sampling frequency of 160 Hz. We are
interested in frequencies between 0 to 80 Hz. Hence, to see the desirable
frequency we need to sample at twice the frequency we wish to see, that is,
160 Hz.
2.4.3 Calculation of acceleration dose based on ISO 2631-5 (2004) The acceleration dose, Dk, in the k-direction is given by equation 2.3
6/16
= ∑i
ikk AD (2.3)
where Aik is the ith peak of the response acceleration, alk(t) and k=x, y or z.
A peak is defined as the maximum absolute value of the response
acceleration between two consecutive zero crossings.
For assessment of health effects the average daily dose, Dkd, is determined
using equation 2.4. 6/1
= ∑
i m
dkkd t
tDD (2.4)
where td is the duration of the daily exposure and tm is the period over which
Dk has been measured.
Equation 2.5 is used to compute average daily dose that consists of two or
more periods of different magnitudes. 6/1
1
6
= ∑
=
n
j mj
djkjkd t
tDD
(2.5)
where tdj is the duration of the daily exposure to condition j and tm is the period
over which Dkj has been measured.

38
The procedure for the computation of acceleration dose is summarised in
Figure 2.6.
Figure 2.6: Flowchart for acceleration dose calculation (ISO 2631-5 (2004)) 2.4.4 Assessment of health effects based on ISO 2631-5 (2004)
The equivalent static compressive stress, Se, in MPa is given as shown in
equation 2.9.
( )6/1
,,
6
= ∑
= zyxkkke DmS
(2.9)
The daily equivalent static compressive dose, Sed, is given by equation 2.10.
( )6/1
,,
6
= ∑
= zyxkkdked DmS
(2.10)
The R factor is defined for use in adverse health effects related to the human
response acceleration dose and is computed using equation 2.11. 6/1
1
66/1.
−
= ∑=
n
i ui
ed
cSNSR
(2.11)
Calculation of acceleration dose Dk and Dkd, Equations (2.3), (2.4) and (2.5)
Measurement of vibration on the seat, ask(t), k=x, y or z
Calculation of the response, alk(t)
Identification of peak values, Aik
k = x or y: use the linear SDOF model
k = z: use the non-linear model

39
where N is the number of exposure days per year; i is the year counter; n is
the number of years of exposure; c is a constant representing the static stress
due to gravitational force; Sui is the ultimate strength of the lumbar spine for a
person of age (b+i) years; b is the age at which exposure starts.
)(066.075.6 ibSui +−= (2.12)
2.5 Summary The procedures and methodologies in the computation of parameters in the
ISO 2631-1 (1997) and ISO 2631-5 (2004) standards were outlined together
with their differences. The parameters were also properly defined.

40
3. Results 3.1 Target machines and applications During the course of this study the target list was divided based on task and
basically one or two of each machine type was measured on the open cast
mine. The machines encompassed by the study are listed in Tables 3.1 to 3.9,
together with brief descriptions of what they do.
Table 3.1 Load haul dumpers (LHDs) Machine Type/ID Machine Activity/Application Volvo A35 LHD (A1) Loading, transport and offloading Mercedes Actros V8 LHD (A2) Loading, conveying and offloading of topsoil and rocks Caterpillar 785B (A3) Loading, conveying and offloading of topsoil Tata Novus Truck 3434 (A4) Loading, conveying and offloading of topsoil Bell Rear Dumper B25D (A5) Loading, conveying, offloading of top soil and rocks Bell Rear Dumper B40D (A6) Loading, conveying, offloading of top soil and rocks Bell Rear Dumper B50D (A7) Loading, conveying, offloading of coal Iveco Truck/Trailer(Double) (A8) Loading, conveying, offloading of coal MAN TGA 33.400 Trailer (A9) Loading, conveying, offloading of coal Dragline (A10) Excavating of top soil and rocks to expose coal
Table 3.2 Excavators Machine Type/ID Machine Activity/Application Hitachi Excavator Zaxis 670 LCR (B1)
Excavating and loading of top soil into LHDs
Volvo Excavator EC700Blc (B2) Digging and loading of top soil into LHDs CAT Excavator 320D (B3) Pushing of coal into the tip Hitachi Excavator Zaxis 370 LCR (B4)
Excavating and loading of top soil into LHDs
Hitachi Excavator Zaxis 500 LCR (B5)
Excavating and loading of top soil into LHDs
Komatsu Excavator PC1250SP (B6)
Excavating and loading of top soil and rocks into trucks
Hitachi Excavator Zaxis 670 LCR (B7)
Excavating and loading of top soil into LHDs
Table 3.3 Front End Loaders Machine Type/ID Machine Activity/Application CAT FEL 992G (C1) Carrying and tipping of coal into the tip Kawasaki Safika FEL 852IV (C2) Ripping and loading of coal into trucks Kawasaki FEL (C3) Ripping and loading of coal into trucks

41
Table 3.4 Dozers Machine Type/ID Machine Activity/Application CAT Track Dozer D9T (D1) Making a catch berm CAT Caterpillar D10R (D2) Ripping and pushing of coal into a hip Bell TLB 315SG (D3) Ripping of top soil. Shantui (D4) Ripping and loading of top soil and clearing of roads
Table 3.5 Drills Machine Type/ID Machine Activity/Application Pit Viper (E1) Drilling of holes to the coal bed DMM 2 Drilling Machine (E2) Drilling of holes to the coal bed
Table 3.6 Graders Machine Type/ID Machine Activity/Application CAT Grader 16G (F1) Grading of the road to make it level Sany Grader (F2) Grading of the road to make it level Komatsu Grader 9D825A (F3) Grading of the road to make it level
Table 3.7 Liquid Conveyers Machine Type/ID Machine Activity/Application Bell Water Bowser B20C (G1) Watering the road to reduce the amount of dust raised Powerstar 2628 Refueler (G2) Refueling of mine vehicles CAT 740 Diesel Bowser (G3) Refueling of mine vehicles
Table 3.8 4x4 Machine Type/ID Machine Activity/Application Toyota Fortuner (H1) Driving around for inspection on dusty or gravel road
Table 3.9 Compactor Machine Type/ID Machine Activity/Application Landpac Compactor (I1) Compacting of soil
3.2 Time domain accelerations
Time domain accelerations for selected machinery are given below. The
weighted acceleration histories of Volvo A35D LHD, Caterpillar 785B and
Hitachi Excavator Zaxis 670 LCR are shown in Figures 3.1, 3.3 and 3.5
respectively. The remaining weighted acceleration histories of all the other
machinery are shown in the appendices. These time histories were used in
the computation of the WRMS and VDV dose values based on ISO 2631-1
(1997).

42
The unweighted acceleration histories of Volvo A35D LHD, Caterpillar 785B
and Hitachi Excavator Zaxis 670 LCR are shown in Figures 3.2, 3.4 and 3.6
respectively. It can be seen that shocks are present in these time acceleration
histories. For the Volvo A35D LHD and Caterpillar 785B, the shocks range
roughly between -10 m/s2 and 10 m/s2 apiece. For Hitachi Excavator Zaxis
670 LCR the shocks range roughly between -15 m/s2 and 15 m/s2. ISO 2631-
5 (2004) specifies that the dataset acceleration in the z direction should be in
the range of -20 m/s2 to 40 m/s2 and 0.5 Hz to 40 Hz. This is because the z
axis is modeled as a non linear recurrent artificial neural network (RNN)
model and the RNN algorithm was trained for only data in the above
mentioned range (Nicol, 1996; Morrison et al., 1998; ISO 2631-5 (2004). The
standard does not specify any limit for the x and y direction. This is because
the x and y axes are modeled as linear SDOF models.
Table 3.10 shows the dominant frequencies of all the machinery. It can be
seen that all the frequencies along the z-axis are less than 40 Hz. These
frequencies were obtained by conducting an FFT analysis on the weighted
acceleration responses. Also, looking at Appendices A to I it can be seen that
the vibration acceleration amplitudes of all shocks fall within the range for the
applicability of the ISO 2631-5 (2004) standard. The unweighted acceleration
data set were used in the computation of the Sed and R factor parameters
based on ISO 2631-5 (2004).
Figure 3.1: Weighted acceleration for x, y & z axes according to ISO 2631-1 (1997) for Volvo A35D LHD

43
Figure 3.2: Unweighted acceleration for x, y & z-axes for Volvo A35D LHD
Figure 3.3: Weighted acceleration for x, y & z axes according to ISO
2631-1 (1997) Caterpillar 785B
Figure 3.4: Unweighted acceleration for x, y & z-axes for Caterpillar
785B
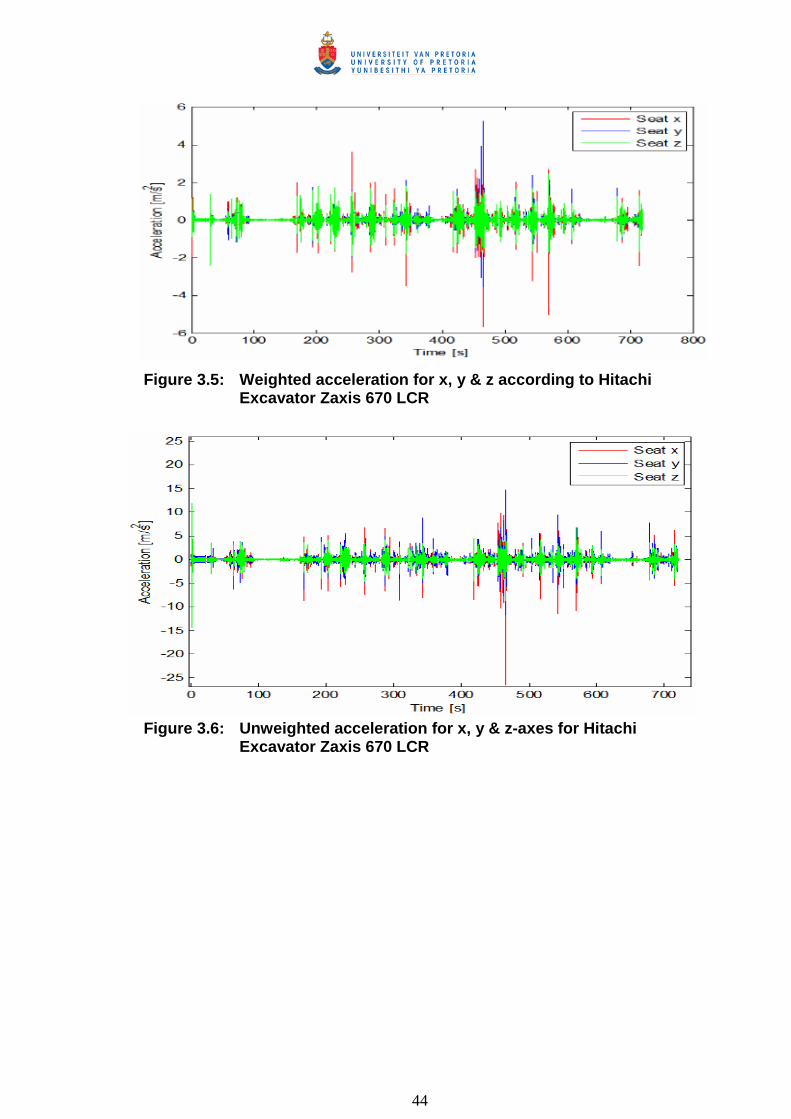
44
Figure 3.5: Weighted acceleration for x, y & z according to Hitachi Excavator Zaxis 670 LCR
Figure 3.6: Unweighted acceleration for x, y & z-axes for Hitachi
Excavator Zaxis 670 LCR

45
Table 3.10 Dominant frequencies of machines Machines/ID Freq. (Hz) Machines/ID Freq. (Hz)
x y z x y z Volvo A35 LHD (A1) 35 3 2 Hitachi Excavator Zaxis
670 LCR (B1) 45 45 25
Mercedes Actros V8 LHD (A2)
40 15 4 Volvo Excavator EC700Blc (B2)
40 40 20
Caterpillar 785B (A3) 40 35 20 CAT Excavator 320D (B3) 50 50 20 Tata Novus Truck 3434 (A4)
10 30 10 Hitachi Excavator Zaxis 370 LCR (B4)
15 2 5
Bell Rear Dumper B25D (A5)
30 30 2 Hitachi Excavator Zaxis 500 LCR (B5)
5 8 18
Bell Rear Dumper B40D (A6)
34 34 2 Komatsu Excavator PC1250SP (B6)
10 7 10
Bell Rear Dumper B50D (A7)
11 30 2 Hitachi Excavator Zaxis 670 LCR (B7)
45 20 30
Iveco Truck/Trailer (Double) (A8)
2 2 3 CAT FEL 992G (C1) 2 2 3
MAN TGA 33.400 Trailer (A9)
28 28 10 Kawasaki Safika FEL 852IV (C2)
7 30 7
Dragline (A10) 32 5 5 Kawasaki FEL (C3) 30 26 24 CAT Track Dozer D9T (D1) 2 2 2 Pit Viper (E1) 30 30 15 CAT Caterpillar D10R (D2) 15 10 4 DMM 2 Drilling Machine
(E2) 50 50 25
Bell TLB 315SG (D3) 5 9 17 CAT Grader 16G (F1) 5 2 5 Shantui (D4) 2 2 2 Sany Grader (F2) 5 2 5 Bell Water Bowser B20C (G1)
35 35 35 Komatsu Grader 9D825A (F3)
44 26 2
Powerstar 2628 Refueler (G2)
20 20 20 Toyota Fortuner (H1) 10 2 2
CAT 740 Diesel Bowser (G3)
50 30 2 Landpac Compactor (I1) 5 2 5
3.3 Summary of machine whole-body vibration levels based on
ISO 2631-1 (1997) using WRMS parameter The recorded data comprised WBV levels measured with respect to time in
three orthogonal axes (x, y and z) on the operator’s seat and along the z axis
on the floor beneath the seat. The weighted root mean square acceleration
(WRMS), crest factor (CF), time to reach exposure action value (EAV) and
exposure limit value (ELV), as well as the seat effective amplitude
transmissibility (SEAT) values were calculated and tabulated separately for
each machine / activity combination identified in Tables 3.1 to 3.9. A summary
overview of the computed results is shown in Tables 3.11 to 3.19 for WRMS
acceleration.

46
ISO 2631-1 (1997) states that for CF higher than 9; an additional parameter
vibration dose value (VDV) needs to be calculated because the shock content
of the vibration is high. Going through Tables 3.11 to 3.19 it can be seen that
most of the CFs are higher than 9. Hence the additional parameter was
computed and is tabulated in Tables 3.20 to 3.28.
Table 3.11 LHDs: WRMS, CF and A(8) acceleration summary of WBV seat data
Machine/ID WRMS (m/s2) aw Crest Factor (CF) EAV (A(8))
ELV (A(8))
SEAT value x y z x y z
Volvo A35 LHD (A1)
0.61 0.49 0.54 6.30 11.14 11.52 5.00 16.00 1.10
Mercedes Actros V8 LHD (A2)
0.44 0.55 0.65 8.18 8.64 8.19 5.00 16.00 0.94
Caterpillar 785B (A3)
0.50 0.54 0.70 11.08 9.59 9.15 4.00 14.00 1.89
Tata Novus Truck 3434 (A4)
0.33 0.43 0.59 13.21 12.40 11.41 5.00 16.00 1.64
Bell Rear Dumper B25D (A5)
0.41 0.43 0.38 11.10 9.48 11.40 12.00 >24.00 1.12
Bell Rear Dumper B40D (A6)
0.47 0.81 0.41 12.86 6.42 7.72 2.00 6.00 1.41
Bell Rear Dumper B50D (A7)
0.32 0.44 0.35 7.53 9.32 10.44 12.00 >24.00 1.59
Iveco Truck/Trailer (Double) (A8)
0.54 0.53 0.60 14.88 10.88 8.64 5.00 16.00 0.95
MAN TGA 33.400 Trailer (A9)
0.28 0.43 0.35 15.32 12.19 36.90 12.00 >24.00 0.88
Dragline (A10)
0.10 0.18 0.12 7.80 9.38 5.95 >24.00 >24.00 0.75

47
Table 3.12 Excavators: WRMS, CF and A(8) acceleration summary of WBV seat data
Machine/ID WRMS (m/s2) aw Crest Factor (CF) EAV (A(8))
ELV (A(8))
SEAT value x y z x y z
Hitachi Excavator Zaxis 670 LCR (B1)
0.36 0.34 0.41 54.28 55.22 54.78 12.00 >24.00 1.46
Volvo Excavator EC700Blc (B2)
0.39 0.36 0.34 36.46 34.20 43.50 12.00 >24.00 1.55
CAT Excavator 320D (B3)
0.35 0.21 0.24 12.28 14.22 10.38 12.00 >24.00 0.71
Hitachi Excavator Zaxis 370 LCR (B4)
0.36 0.29 0.37 19.83 15.08 14.37 12.00 >24.00 1.32
Hitachi Excavator Zaxis 500 LCR (B5)
0.33 0.38 0.39 27.53 19.14 13.85 12.00 >24.00 0.80
Komatsu Excavator PC1250SP (B6)
0.45 0.47 0.51 19.36 15.84 12.53 8.00 24.00 0.86
Hitachi Excavator Zaxis 670 LCR (B7)
0.21 0.18 0.21 15.78 16.71 10.29 >24.00 >24.00 1.00
Table 3.13 Front End Loaders: WRMS, CF and A(8) acceleration summary of WBV seat data
Machine/ID WRMS (m/s2) aw Crest Factor (CF) EAV (A(8))
ELV (A(8))
SEAT value
x y z x y z CAT FEL 992G (C1)
0.19 0.29 0.21 15.42 11.79 8.15 20.00 >24.00 1.05
Kawasaki Safika FEL 852IV (C2)
0.38 0.36 0.48 12.29 13.81 9.86 8.00 24.00 1.17
Kawasaki FEL (C3)
0.34 0.33 0.42 16.03 13.05 18.28 12.00 >24.00 1.35
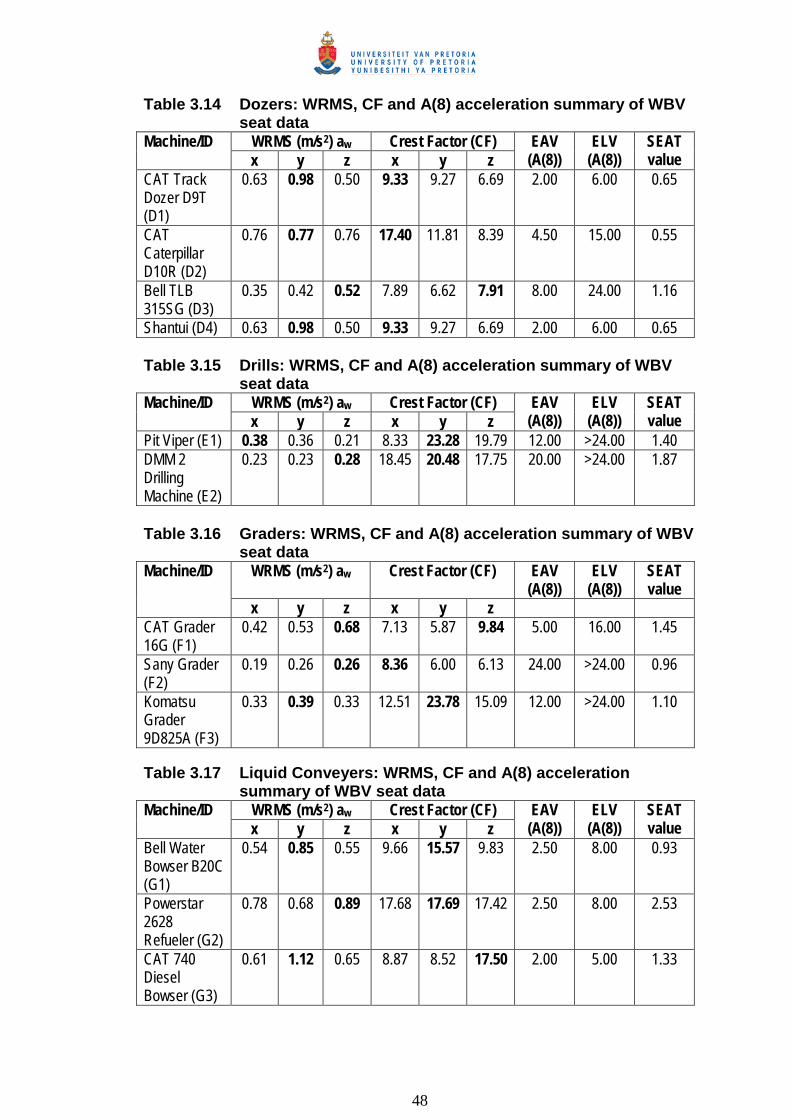
48
Table 3.14 Dozers: WRMS, CF and A(8) acceleration summary of WBV seat data
Machine/ID WRMS (m/s2) aw Crest Factor (CF) EAV (A(8))
ELV (A(8))
SEAT value x y z x y z
CAT Track Dozer D9T (D1)
0.63 0.98 0.50 9.33 9.27 6.69 2.00 6.00 0.65
CAT Caterpillar D10R (D2)
0.76 0.77 0.76 17.40 11.81 8.39 4.50 15.00 0.55
Bell TLB 315SG (D3)
0.35 0.42 0.52 7.89 6.62 7.91 8.00 24.00 1.16
Shantui (D4) 0.63 0.98 0.50 9.33 9.27 6.69 2.00 6.00 0.65 Table 3.15 Drills: WRMS, CF and A(8) acceleration summary of WBV
seat data Machine/ID WRMS (m/s2) aw Crest Factor (CF) EAV
(A(8)) ELV
(A(8)) SEAT value x y z x y z
Pit Viper (E1) 0.38 0.36 0.21 8.33 23.28 19.79 12.00 >24.00 1.40 DMM 2 Drilling Machine (E2)
0.23 0.23 0.28 18.45 20.48 17.75 20.00 >24.00 1.87
Table 3.16 Graders: WRMS, CF and A(8) acceleration summary of WBV
seat data Machine/ID WRMS (m/s2) aw Crest Factor (CF) EAV
(A(8)) ELV
(A(8)) SEAT value
x y z x y z CAT Grader 16G (F1)
0.42 0.53 0.68 7.13 5.87 9.84 5.00 16.00 1.45
Sany Grader (F2)
0.19 0.26 0.26 8.36 6.00 6.13 24.00 >24.00 0.96
Komatsu Grader 9D825A (F3)
0.33 0.39 0.33 12.51 23.78 15.09 12.00 >24.00 1.10
Table 3.17 Liquid Conveyers: WRMS, CF and A(8) acceleration
summary of WBV seat data Machine/ID WRMS (m/s2) aw Crest Factor (CF) EAV
(A(8)) ELV
(A(8)) SEAT value x y z x y z
Bell Water Bowser B20C (G1)
0.54 0.85 0.55 9.66 15.57 9.83 2.50 8.00 0.93
Powerstar 2628 Refueler (G2)
0.78 0.68 0.89 17.68 17.69 17.42 2.50 8.00 2.53
CAT 740 Diesel Bowser (G3)
0.61 1.12 0.65 8.87 8.52 17.50 2.00 5.00 1.33

49
Table 3.18 4x4: WRMS, CF and A(8) acceleration summary of WBV seat data
Machine/ID WRMS (m/s2) aw Crest Factor (CF) EAV (A(8))
ELV (A(8))
SEAT value x y z x y z
Toyota Fortuner (I1)
0.56 0.73 0.55 8.04 10.47 10.18 3.00 7.00 0.63
Table 3.19 Compactor: WRMS, CF and A(8) acceleration summary of WBV seat data
Machine/ID WRMS (m/s2) aw Crest Factor (CF) EAV (A(8))
ELV (A(8))
SEAT value x y z x y z
Landpac Compactor (J1)
0.87 0.82 0.91 7.41 6.79 5.32 2.00 6.00 1.36
3.4 Summary of machine whole-body vibration levels based on ISO 2631-1 (1997) using VDV parameter
A summary overview of the VDV is shown below in Tables 3.20 to 3.28 for
various set of machinery.
Table 3.20 LHDs: VDV summary of WBV seat data Machine/ID Estimated 8-hour VDV(m/s1.75) EAV
(VDV) ELV
(VDV) SEAT value x y z Main
Volvo A35 LHD (A1) 11.21 9.02 9.84 x 3.5 >24.00 1.11 Mercedes Actros V8 LHD (A2)
8.05 9.97 11.80 z 2.83 >24.00 0.93
Caterpillar 785B (A3) 9.20 9.77 12.77 z 2.06 >24.00 1.89 Tata Novus Truck 3434 (A4)
6.09 7.78 10.81 z 4.02 >24.00 1.66
Bell Rear Dumper B25D (A5)
7.43 7.78 6.87 y 14.98 >24.00 1.11
Bell Rear Dumper B40D (A6)
8.61 14.80 7.46 y 1.14 >24.00 1.41
Bell Rear Dumper B50D (A7)
5.76 8.05 6.36 y 13.04 >24.00 1.56
Iveco Truck/Trailer(Double) (A8)
9.92 9.74 10.91 z 3.87 >24.00 0.94
MAN TGA 33.400 Trailer (A9)
5.06 7.87 6.39 y 14.30 >24.00 0.89
Dragline (A10) 1.88 3.35 2.23 y >24.00 >24.00 0.74

50
Table 3.21 Excavators: VDV summary of WBV seat data Machine/ID Estimated 8-hour VDV(m/s1.75) EAV
(VDV) ELV
(VDV) SEAT value x y z Main
Hitachi Excavator Zaxis 670 LCR (B1)
6.59 6.18 7.52 z 17.19 >24.00 1.48
Volvo Excavator EC700Blc (B2)
7.13 6.57 6.26 x 21.19 >24.00 1.53
CAT Excavator 320D (B3) 6.36 3.85 4.39 x >24.00 >24.00 0.71 Hitachi Excavator Zaxis 370 LCR (B4)
6.65 5.25 6.81 z >24.00 >24.00 1.32
Hitachi Excavator Zaxis 500 LCR (B5)
6.07 6.92 7.15 z 21.02 >24.00 0.79
Komatsu Excavator PC1250SP (B6)
8.14 8.55 9.25 z 7.49 >24.00 0.86
Hitachi Excavator Zaxis 670 LCR (B7)
3.88 3.24 3.84 x >24.00 >24.00 1.00
Table 3.22 Front End Loaders: VDV summary of WBV seat data Machine/ID Estimated 8-hour VDV(m/s1.75) EAV
(VDV) ELV
(VDV) SEAT value x y z Main
CAT FEL 992G (C1) 3.42 5.25 3.89 y >24.00 >24.00 1.06 Kawasaki Safika FEL 852IV (C2)
7.00 6.63 8.82 z 9.05 >24.00 1.19
Kawasaki FEL (C3) 6.15 6.04 7.65 z 16.01 >24.00 1.34
Table 3.23 Dozers: VDV summary of WBV seat data Machine/ID Estimated 8-hour VDV(m/s1.75) EAV
(VDV) ELV
(VDV) SEAT value x y z Main
CAT Track Dozer D9T (D1) 11.41 17.83 9.11 y 0.54 >24.00 0.65 CAT Caterpillar D10R (D2) 13.86 14.07 13.94 y 1.40 >24.00 0.55 Bell TLB 315SG (D3) 6.33 7.73 9.55 z 6.60 >24.00 1.16 Shantui (D4) 13.36 19.46 8.89 y 0.38 >24.00 0.38
Table 3.24 Drills: VDV summary of WBV seat data Machine/ID Estimated 8-hour VDV(m/s1.75) EAV
(VDV) ELV
(VDV) SEAT value x y z Main
Pit Viper (E1) 6.94 6.57 3.85 x >24.00 >24.00 1.44 DMM 2 Drilling Machine (E2)
4.14 4.11 5.18 z >24.00 >24.00 1.86
Table 3.25 Graders: VDV summary of WBV seat data Machine/ID Estimated 8-hour VDV(m/s1.75) EAV
(VDV) ELV
(VDV) SEAT value x y z Main
CAT Grader 16G (F1) 7.70 9.60 12.45 z 2.28 >24.00 1.44 Sany Grader (F2) 3.47 4.68 4.72 z >24.00 >24.00 0.98 Komatsu Grader 9D825A (F3)
6.06 7.16 6.10 y 20.90 >24.00 1.13

51
Table 3.26 Liquid Conveyers: VDV summary of WBV seat data Machine/ID Estimated 8-hour VDV(m/s1.75) EAV
(VDV) ELV
(VDV) SEAT value x y z Main
Bell Water Bowser B20C (G1)
9.81 15.57 10.05 y 0.93 >24.00 0.93
Powerstar 2628 Refueler (G2)
22.24 21.04 25.68 z 0.22 7.93 2.55
CAT 740 Diesel Bowser (G3)
11.06 20.43 11.91 y 0.31 >24.00 1.32
Table 3.27 4x4: VDV summary of WBV seat data Machine/ID Estimated 8-hour VDV(m/s1.75) EAV
(VDV) ELV
(VDV) SEAT value x y z Main
Toyota Fortuner (I1) 10.28 13.27 10.08 y 1.77 >24.00 0.62
Table 3.28 Compactor: VDV summary of WBV seat data Machine/ID Estimated 8-hour VDV(m/s1.75) EAV
(VDV) ELV
(VDV) SEAT value x y z Main
Landpac Compactor (J1) 15.95 14.98 16.62 z 0.72 >24.00 1.36 3.5 Summary of machine whole-body vibration levels using ISO 2631-
5 (2004) using Sed and R factor parameters WBV levels measured with respect to time along three orthogonal axes (x, y
and z) on the operator’s seat were used in the computation of the acceleration
dose, Dk, for the x, y, z-axes, daily equivalent static compressive stress, Sed,
and R factor values and tabulated separately for each machine / activity
combination identified in Tables 3.1 to 3.9. A summary overview of the
computed values is shown in Tables 3.29 to 3.37.

52
Table 3.29 LHDs: Summary of Dk for the x-, y-, z- axes and Sed and R factors
Machine/ID Dk (m/s2) Sed(MPa) R x y z Main
Volvo A35 LHD (A1) 19.73 20.03 23.21 z 1.33 2.08 Mercedes Actros V8 LHD (A2)
12.45 13.87 15.96 z 0.95 1.49
Caterpillar 785B (A3) 14.53 14.39 34.52 z 1.79 2.80 Tata Novus Truck 3434 (A4)
9.40 14.89 22.39 z 1.26 1.92
Bell Rear Dumper B25D (A5)
12.58 19.35 25.01 z 1.30 2.04
Bell Rear Dumper B40D (A6)
15.75 20.77 29.49 z 1.59 2.48
Bell Rear Dumper B50D (A7)
14.95 17.83 19.54 y 1.18 1.85
Iveco Truck/Trailer(Double) (A8)
10.38 10.52 20.45 z 1.12 1.75
MAN TGA 33.400 Trailer (A9)
8.94 18.70 37.26 z 1.90 2.97
Dragline (A10) 2.77 3.88 2.65 y 0.28 0.44 Table 3.30 Excavators: Summary of Dk for the x-, y-, z- axes and Sed
and R factors Machine/ID Dk (m/s2) Sed(MPa) R
x y z Main Hitachi Excavator Zaxis 670 LCR (B1)
10.29 7.61 13.53 z 0.71 1.11
Volvo Excavator EC700Blc (B2)
11.86 8.64 7.47 x 0.55 0.86
CAT Excavator 320D (B3) 3.60 3.31 6.53 z 0.42 1.06 Hitachi Excavator Zaxis 370 LCR (B4)
15.65 12.15 16.41 z 0.99 1.54
Hitachi Excavator Zaxis 500 LCR (B5)
13.77 21.92 39.23 z 2.32 3.62
Komatsu Excavator PC1250SP(B6)
20.54 16.05 21.54 z 1.19 1.86
Hitachi Excavator Zaxis 670 LCR (B7)
8.73 3.44 7.62 x 0.48 0.76
Table 3.31 Front End Loaders: Summary of Dk for the x-, y-, z- axes and
Sed and R factors Machine/ID Dk (m/s2) Sed(MPa) R
x y z Main CAT FEL 992G (C1) 8.73 10.91 5.47 y 0.70 1.09 Kawasaki Safika FEL 852IV (C2)
25.45 10.31 16.45 x 1.00 1.57
Kawasaki FEL (C3) 23.70 9.42 22.93 x 1.39 2.17

53
Table 3.32 Dozers: Summary of Dk for the x-, y-, z- axes and Sed and R factors
Machine/ID Dk (m/s2) Sed(MPa) R x y z Main
CAT Track Dozer D9T (D1) 20.96 13.30 10.20 x 0.83 1.30 CAT Caterpillar D10R (D2) 14.40 16.86 30.42 z 1.70 2.65 Bell TLB 315SG (D3) 10.57 9.45 14.22 z 0.87 1.36 Shantui (D4) 15.30 17.78 9.89 y 1.19 1.86 Table 3.33 Drills: Summary of Dk for the x-, y-, z- axes and Sed and R
factors Machine/ID Dk (m/s2) Sed(MPa) R
x y z Main Pit Viper (E1) 10.89 8.15 18.10 z 0.99 1.54 DMM 2 Drilling Machine (E2)
16.44 16.41 17.16 z 0.40 0.63
Table 3.34 Graders: Summary of Dk for the x-, y-, z- axes and Sed and R
factors Machine/ID Dk (m/s2) Sed(MPa) R
x y z Main CAT Grader 16G (F1) 24.03 13.69 24.27 z 1.37 2.14 Sany Grader (F2) 9.37 8.38 6.18 x 0.54 0.85 Komatsu Grader 9D825A (F3)
11.48 10.76 14.96 z 0.93 1.46
Table 3.35 Liquid Conveyers: Summary of Dk for the x-, y-, z- axes and
Sed and R factors Machine/ID Dk (m/s2) Sed(MPa) R
x y z Main Bell Water Bowser B20C (G1)
12.91 13.57 28.30 z 1.43 2.23
Powerstar 2628 Refueler (G2)
88.24 79.43 162.13 z 11.30 17.68
CAT 740 Diesel Bowser (G3)
14.51 15.34 36.68 z 2.23 3.50
Table 3.36 4x4: Summary of Dk for the x-, y-, z- axes and Sed and R factors
Machine/ID Dk (m/s2) Sed(MPa) R x y z Main
Toyota Fortuner (I1) 8.54 13.30 18.21 z 1.03 1.61 Table 3.37 Compactor: Summary of Dk for the x-, y-, z- axes and Sed and
R factors Machine/ID Dk (m/s2) Sed(MPa) R
x y z Main Landpac Compactor (J1) 23.09 24.63 26.27 z 2.23 3.50

54
3.6 Summary Experimental data was obtained on each set of machinery. The parameters of
interest from ISO 2631-1 (1997) and ISO 2631-5 (2004) standard
methodologies were computed and tabulated for further analysis. The results
obtained are similar to those obtained earlier on South African mines (Van
Niekerk et al., 2000; MHSC, 2004; Mdlazi 2008) using the ISO 2631-1 (1997)
standard methodology. This dataset will subsequently be used in analysis to
obtain the various parameters for the ISO 2631-1 (1997) and ISO 2631-5
(2004) standard methodologies and compare them.

55
4. Numerical investigation of parameters To investigate the effect of shocks on the WBV response parameters used in
the ISO 2631-1 (1997) and ISO 2631-5 (2004) standards, a series of
numerical investigations were conducted using very simplified simulations to
capture the essential nature of various operational conditions, and
qualitatively explain the trends in the response parameters. Signals were
therefore artificially generated in the laboratory to explore the parameters of
the two standards. Vibration signals of more-or-less steady periodic
processes can be approximated by superposition of sinusoids. Pure
sinusoidal data was first generated without shocks being present and
investigated. Subsequently, sinusoidal signals with higher amplitudes were
generated and investigated. Sinusoidal signals with increasing shock
amplitude up to and exceeding the crest factor of 9 based on ISO 2631-1
(1997) were generated and analyzed. Finally, simulated data with different
shock magnitudes for five typical example cases were generated and
analyzed.
To conduct the numerical investigation of the parameters based on the two
standards, pure sinusoidal data was first artificially generated using a signal
generator at amplitudes and frequencies which are similar to the field
observed frequencies shown earlier in Table 3.2 and Table 4.1. A subset of
the data, comprising 5 cases, was considered based on frequencies and
amplitudes (Table 4.1) obtained in the field, so as to have a representative
data set on which investigations could be carried out. Shock data was equally
generated and introduced to the pure sinusoidal data to obtain data with
transient shocks. The signals were generated at different frequencies along
the three basicentric axes for each signal as shown in Table 4.1. The z axis
data was generated in accordance with the requirement of ISO 2631-5 (2004)
that the frequency and amplitude should be in the range of -20 m/s2 to 40 m/s2
and 0.5 Hz to 40 Hz respectively. The artificially generated data was
measured back using the SVAN958 human vibration meter. Further analysis
was done on the generated signals in the MATLAB environment and the
results obtained are tabulated in Tables 4.3 to 4.7.

56
Table 4.1 Frequencies and amplitudes of selected field signals Signal Frequency (Hz) Amplitude (m/s2) Shock amplitude (m/s2) x y z x y z x y z Case 1 45 45 25 0.5 0.7 0.3 1.3 1.3 1.4 Case 2 35 3 2 1.3 1.4 1.3 2.2 2.0 2.0 Case 3 40 15 4 1.5 1.4 1.3 2.7 2.1 2.0 Case 4 40 40 20 0.6 0.7 0.7 1.9 1.9 2.0 Case 5 40 35 20 2.0 1.4 1.4 3.3 2.7 2.7 To facilitate interpretation, the calculated WRMS, VDV, Sed and R factor
parameters were normalized with respect to the exposure upper limit values
reported in Table 1.1. This led to normalized HGCZ lower and upper limits or
boundaries which are shown in Table 4.2 and plotted as the HGCZ
boundaries shown in Figures 4.2 to 4.6. The normalized upper limits are all
unity for the four parameters. A line with slope of magnitude one (1) originates
at (0,0) and passes through a point defined by the normalized upper limits
(1,1) on both axes as shown in Figures 4.2 to 4.6.
Table 4.2 Table of normalized exposure action and limit values and
health guidance caution zone values for whole-body vibration
Normalized Exposure= Exposure/HGCZ upper limit
ISO 2631-1 (1997) ISO 2631-5 (2004) WRMSn VDVn Sedn Rn
EAVn=EAV/HGCZ upper limit 0.43 0.43 0.63 0.67 ELVn=ELV/HGCZ upper limit 1.00 1.00 1.00 1.00
4.1 Results of simulation of data without shocks The WRMS, VDV, Sed and R factor parameters based on pure sinusoids
corresponding to cases 1 to 5, are tabulated in Table 4.3. Health risk is
evaluated based on the above parameters as low, medium or high depending
on whether the exposure values are below the EAV, between the EAV and
ELV or above ELV as earlier discussed in Section 1.1. Low risk to health is
predicted based on the values of WRMS and VDV parameters of ISO 2631-1
(1997) for cases 1 and 4. Medium risk to health is predicted for the remaining
cases as shown in Table 4.3. However, low risk to health is predicted based
on the values of Sed and R factor parameters of ISO 2631-5 (2004) for all the
five cases. This is because of the absence of transient shocks.

57
According to ISO 2631-1 (1997) based on the WRMS and VDV values, cases
1 and 4 correspond to vibration levels below the health guidance caution zone
(HGCZ) boundaries. The remaining three cases are within the HGCZ (Table
4.3, Figure 4.2). When the Sed and R factor values are used in the prediction
of health risks, all five cases are associated with vibration levels below the
HGCZ. There is agreement between the WRMS and VDV values and the Sed
and R factor values for cases 1 and 4, as low risk to operator health is
predicted since the vibration levels are below the HGCZ.
For data without shocks, it can be seen from Table 4.3 that the health risk
prediction based on VDV is more conservative than that based on the static
compressive stress, Sed, values. This is because the computation of sixth
power based Sed emphasizes transient shocks (equations 2.3, 2.4, 2.5)
whenever present in a vibration signal. However, these shocks are absent in
the generated data, and low values of Sed are obtained. The health risk
assessments based on the VDV of the signals are relatively higher than that
based on Sed because of the absence of transient shocks. The results in
Table 4.3 are normalized and plotted for better visual appreciation in Figure
4.2. A(8)n and VDVn parameters are plotted on the x- and y- axes respectively
in Figure 4.2 (a). In Figure 4.2 (b) Sedn and Rn factor parameters are plotted on
the x- and y- axes respectively. Sedn and A(8)n parameters are plotted on the
x- and y-axes respectively in Figure 4.2 (c). Finally, Sedn and Rn factor
parameters are plotted on the x- and y-axes respectively in Figure 4.2 (d). The
VDVn versus A(8)n values, Rn factor versus Sedn values, A(8)n versus Sedn
values and VDVn versus Sedn values plots are all proportional as shown in
Figures 4.2(a), (b), (c) and (d) respectively. The subscript n refers to the
normalization.
In Figure 4.2 (a) both parameters are from ISO2631-1. Since the slope is 1
and the lower and upper HGCZ values correspond exactly, i.e. 0.43 and 1 on
both axes, it is clear that the two parameters from the same standard are
consistent in their health risk assessments.
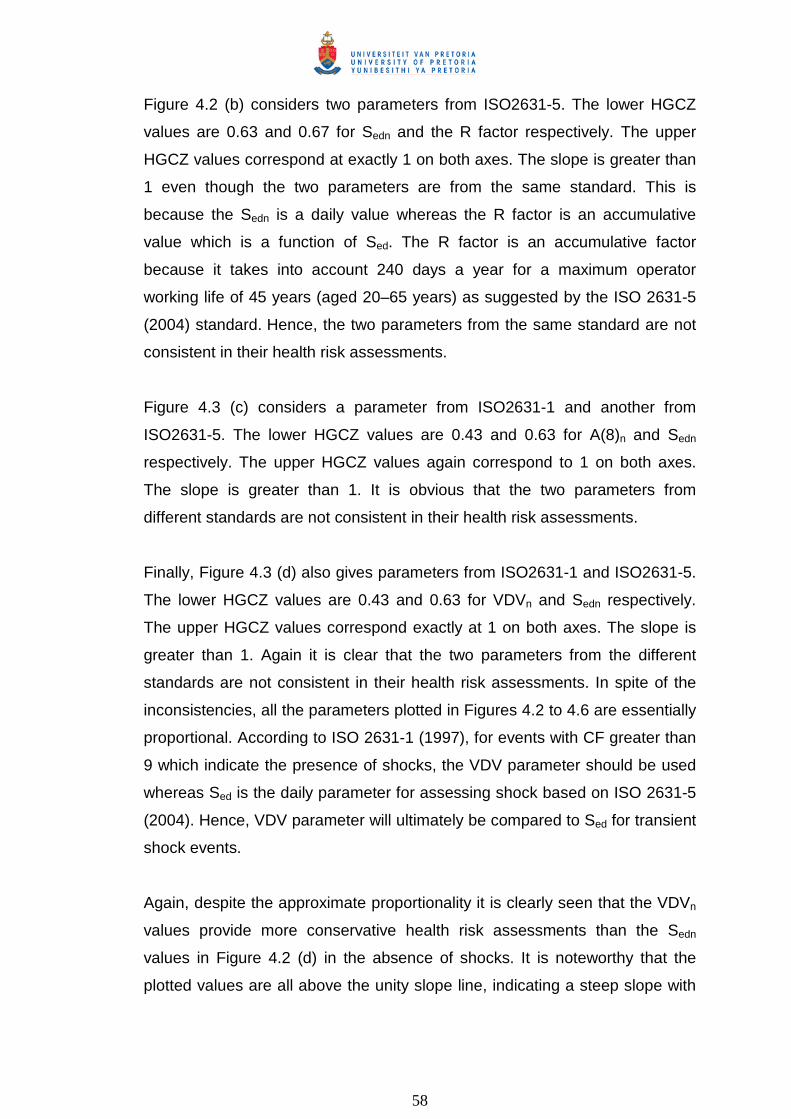
58
Figure 4.2 (b) considers two parameters from ISO2631-5. The lower HGCZ
values are 0.63 and 0.67 for Sedn and the R factor respectively. The upper
HGCZ values correspond at exactly 1 on both axes. The slope is greater than
1 even though the two parameters are from the same standard. This is
because the Sedn is a daily value whereas the R factor is an accumulative
value which is a function of Sed. The R factor is an accumulative factor
because it takes into account 240 days a year for a maximum operator
working life of 45 years (aged 20–65 years) as suggested by the ISO 2631-5
(2004) standard. Hence, the two parameters from the same standard are not
consistent in their health risk assessments.
Figure 4.3 (c) considers a parameter from ISO2631-1 and another from
ISO2631-5. The lower HGCZ values are 0.43 and 0.63 for A(8)n and Sedn
respectively. The upper HGCZ values again correspond to 1 on both axes.
The slope is greater than 1. It is obvious that the two parameters from
different standards are not consistent in their health risk assessments.
Finally, Figure 4.3 (d) also gives parameters from ISO2631-1 and ISO2631-5.
The lower HGCZ values are 0.43 and 0.63 for VDVn and Sedn respectively.
The upper HGCZ values correspond exactly at 1 on both axes. The slope is
greater than 1. Again it is clear that the two parameters from the different
standards are not consistent in their health risk assessments. In spite of the
inconsistencies, all the parameters plotted in Figures 4.2 to 4.6 are essentially
proportional. According to ISO 2631-1 (1997), for events with CF greater than
9 which indicate the presence of shocks, the VDV parameter should be used
whereas Sed is the daily parameter for assessing shock based on ISO 2631-5
(2004). Hence, VDV parameter will ultimately be compared to Sed for transient
shock events.
Again, despite the approximate proportionality it is clearly seen that the VDVn
values provide more conservative health risk assessments than the Sedn
values in Figure 4.2 (d) in the absence of shocks. It is noteworthy that the
plotted values are all above the unity slope line, indicating a steep slope with

59
a gradient greater than 1 in the insignificant or no shock situation, meaning
the VDV predicts higher risk to health.
Table 4.3 Results for simulated sinusoidal data without shocks Signal WRMS VDV Comment
on risk Sed
MPa R Comment
on risk m/s2 Main m/s1.75 Main Case 1 0.13 y 2.43 y Low 0.04 0.07 Low Case 2 0.91 y, z 16.65 y, z Moderate 0.35 0.55 Low Case 3 0.91 z 16.65 z Moderate 0.34 0.54 Low Case 4 0.31 z 5.61 z Low 0.11 0.17 Low Case 5 0.61 z 11.21 z Moderate 0.21 0.33 Low
4.2 Results of simulation of sinusoidal data with higher amplitude For simulated data with higher amplitude but still without shocks, it can be
seen that the risk to health predicted based on Sed values continues to be
lower than risk based on VDVs, as shown in Table 4.4. Even, though the
generated sinusoidal data may have the same magnitude as typical shocks,
the crest factor is just two; hence lower values of Sed are again obtained. The
values of the parameters in Table 4.4 are normalized and plotted in Figure
4.3.
Again the normalized VDVn versus A(8)n, Rn factor versus Sedn, A(8)n versus
Sedn and VDVn versus Sedn plots are all proportional as shown in Figures
4.3(a), (b), (c) and (d) respectively. Again, in spite of the proportionality it is
clearly seen from Figure 4.3 (d) that the VDVn health risk assessments are
more conservative than the those based on Sedn , in the absence of shocks.
Again, it is noteworthy that proportionality is with a gradient greater than 1
(steep slope) as was obtained in Section 4.2 corresponding to the no shock
situation.
Table 4.4 Results for simulated sinusoidal data with higher amplitude Signal WRMS VDV Comment on
risk Sed
MPa R Comment
on risk m/s2 Main m/s1.75 Main Case 1 0.50 z 9.04 z Low 0.19 0.30 Low Case 2 1.37 z 25.02 z High 0.53 0.83 Moderate Case 3 1.37 z 25.02 z High 0.52 0.82 Moderate Case 4 0.92 z 16.84 z Moderate 0.31 0.49 Low Case 5 1.23 z 22.42 z High 0.42 0.65 Low

60
4.3 Effect of increasing amplitude of shocks on computed values Sed and VDV
Subsequently, to increase the magnitude of shocks, the amplitude of shock
over 1 cycle in every harmonic number of cycles (for example over 1 cycle in
every 16 cycles for case 3 in z direction as shown in Figure 4.1) was
increased by multiplying the original data within the shock cycle with values of
1.5, 2, 2.5 and 3 for cases 3b, 3c, 3d and 3f respectively. The number of
cycles within each harmonic period was selected based on physically
observed data. Figure 4.1 is an example plot of the generated shock signal.
The results in Table 4.5 are normalized and plotted in Figure 4.4.
It is interesting to note that once again the VDVn versus A(8)n, Rn factor versus
Sedn, A(8)n versus Sedn and VDVn versus Sedn plots are all proportional as
shown in Figures 4.4 (a), (b), (c) and (d) respectively. However, in spite of the
approximate proportionality it is clearly seen that the predicted health risk
based on VDVs are less conservative than the predicted risk based on Sed
values as shown in Figure 4.4 (d) in the presence of shocks. Now the plotted
values are below the unity slope line except for the first value. The slope is
now less than 1 which means the Sed predicts higher risk to health. This is as
a result of higher weighting once the presence of high impact or shock is
detected in the ISO 2631-5 (2004) standard procedure which leads to higher
values of Sed and hence a slope of less than 1. Also, in Figure 4.4 (c) and (d)
there is a very large offset i.e. the graph no longer goes through 0. This is due
to the presence of transient shocks which leads to a gradient less than 1.

61
Figure 4.1: Simulated sinusoidal signal with equally spaced shocks for
dominant z-axis for case 3
Table 4.5 Signals in increasing order of shock amplitude for case 3 Signal WRMS VDV Comment
on risk Sed
MPa R Comment
on risk Comment
(magnitude) m/s2 m/s1.75 Main
Case 3a 0.98 17.34 z Moderate 0.52 0.81 Moderate Original signal
Case 3b 1.03 18.78 z Moderate 0.79 1.23 Moderate ×1.5 signal Case 3c 1.13 20.64 z Moderate 1.08 1.68 High ×2 signal Case 3d 1.25 22.80 z High 1.40 2.19 High ×2.5 signal Case 3f 1.38 25.19 z High 1.79 2.79 High ×3 signal
4.4 Effect of increasing amplitude of shocks above crest factor (CF)
of 9 on computed values Sed and VDV The magnitude of shocks was further increased so as to obtain crest factors
higher than 9. To do this; the amplitude of shock over 1 cycle in every
harmonic number of cycles as discussed in Section 4.3 was increased by
multiplying the original data within the shock cycle with values of 2.5, 3, 9, 18
and 20 for cases 3d, 3e, 3f, 3g and 3h respectively. Parameters of interest
were then computed and tabulated in Table 4.6. The values of the parameters
in Table 4.6 are normalized and plotted in Figure 4.5. It is interesting to note
that once again the VDVn versus A(8)n Rn factor versus Sedn, A(8)n versus Sedn
and VDVn versus Sedn plots are all proportional, despite obtaining crest factors
greater than 9 as shown in Figures 4.5 (a), (b), (c) and (d) respectively.
However, in spite of the proportionality it is clearly seen that health risk
prediction based on the VDVs are less conservative than those based on the

62
Sed values in Figure 4.5 (d) in the presence of shocks as before. All the plotted
values are below unity slope line and with a slope less than 1 corresponding
to the significant shock situation meaning the Sed predicts higher risk to
health. This is consistent with findings by Alem et al. (2004) and Chen et al.
(2009) who obtained higher predictions of health risk based on the Sed values
than on VDVs in the presence of high impacts or shocks, in their study as
discussed in Section 1.3.
Table 4.6 Signal with increasing shock amplitude below and above CF of 9 for case 3
Signal WRMS VDV Comment on risk
Sed MPa
R Comment on risk
Comment (magnitude) m/s2 m/s1.75 Main
Case 3d 1.25 22.80 z High 1.40 2.19 High ×2.5 signal Case 3e 1.38 25.19 z High 1.79 2.79 High ×3 signal Case 3f 3.31 60.31 z High 5.31 8.31 High ×9 signal Case 3g 6.43 117.4 z High 12.30 19.24 High ×18 signal Case 3h 7.14 130.2 z High 13.61 21.30 High ×20 signal 4.5 Simulated data with different amplitude and low shock magnitude
for five typical example cases Simulated data with different amplitudes; low shock magnitudes and CFs
above and below 9 for five typical cases were generated. The various
parameters obtained from results of analysis are tabulated in Table 4.7. The
values of the parameters are then normalized and plotted in Figure 4.6. It is
interesting to note that the VDVn versus A(8)n and Rn factor versus Sedn, are
proportional; however, the A(8)n versus Sedn and VDVn versus Sedn plots are
roughly proportional as shown in Figures 4.6 (a), (b), (c) and (d) respectively.
Figures 4.6 (c) and 4.6 (d) are roughly proportional because of the stochastic
nature of the data. However, in spite of the rough proportionality it is clearly
seen that predicted risk based on VDVs is more stringent than the predicted
risk based on the Sed values as shown in Figure 4.6 (d) in the presence of low
shocks. All the plotted values are above the unity slope line with a slope
greater than 1 corresponding to the low or no significant shock content
situation. This means that health risk predictions based on VDV are higher.

63
This is consistent with findings by Johanning et al. (2006), Cooperrider and
Gordon (2008) and Eger et al. (2008) who obtained higher predictions of
health risk based on the VDVs than risk based on Sed values in the presence
of low shock magnitude.
Table 4.7 Results for simulated data with different amplitude and low
shock magnitude for five typical example cases Signal WRMS VDV Comment
on risk Sed
MPa R Comment
on risk m/s2 Main m/s1.75 Main Case 1 0.37 z 8.57 z Low 0.19 0.30 Low Case 2 0.61 z 11.11 z Moderate 0.39 0.62 Low Case 3 0.94 z 17.20 z Moderate 0.47 0.73 Low Case 4 0.35 z 5.65 z Low 0.16 0.21 Low Case 5 0.52 z 9.47 z Moderate 0.47 0.73 Low
4.6 Simulated data with different amplitude and shock magnitude for
five typical example cases Data with different amplitudes and shock magnitudes for the five typical cases
were generated. The various parameters obtained from results of analysis are
tabulated in Table 4.8. The values of the parameters are then normalized and
plotted in Figure 4.7. It is interesting to note that the VDVn versus A(8)n and
Rn factor versus Sedn, are proportional; however, the A(8)n versus Sedn and
VDVn versus Sedn plots are roughly proportional with some scatter as shown in
Figures 4.7 (a), (b), (c) and (d) respectively. Figures 4.7 (c) and 4.7 (d) are
roughly proportional because of the stochastic nature of the data. However, in
spite of the rough proportionality it is clearly seen that health risk prediction
based on the VDVs is less conservative than that based on the Sed values in
Figure 4.7 (d) in the presence of shocks as before. All the plotted values are
below the unity slope line with a slope less than 1 corresponding to the high or
significant shock content situation. This means the Sed predicts higher risk to
health. This is further consistent with findings by Alem et al. (2004) and Chen
et al. (2009) who obtained higher predictions of the risk based on the Sed
values than on VDVs in the presence of high shock magnitude on rough
terrain.

64
Table 4.8 Results for simulated data with different amplitude and shock magnitude for five typical example cases
Signal WRMS VDV Comment on risk
Sed MPa
R Comment on risk m/s2 Main m/s1.75 Main
Case 1 0.40 z 7.33 z Low 0.95 1.49 High Case 2 1.14 z 20.73 z Moderate 6.28 9.82 High Case 3 1.08 z 19.73 z Moderate 1.15 1.81 High Case 4 0.72 z 13.07 z Moderate 1.73 2.71 High Case 5 1.39 z 25.44 z High 2.36 3.69 High
4.7 Summary The two parameters of the two standard methodologies were computed using
simulated numerically generated signals. The trends in each of the
parameters corresponding to each of the standards were monitored using
various scenarios obtained by varying the signal parameters and comparing
these against each other. For shock evaluation the VDV parameter is used
with respect to ISO 2631-1 (1997) whereas the Sed parameter is used with
respect to ISO 2631-5 (2004). The two parameters (VDV and Sed) were
proportional with varying slopes for each scenario. The graphs with values
above the unity slope line and slopes or gradients higher than 1 (steep)
corresponded to signals with low or no shock content meaning that health risk
prediction based on the VDV is higher; whereas the graphs with values below
the unity slope line and gradients less than 1 (gradual) corresponded to
signals with high or significant shock content meaning the health risk
prediction based on Sed is higher.

65
0 0.2 0.4 0.6 0.8 1 1.20
0.2
0.4
0.6
0.8
1
VDV n
A(8)n
0 0.2 0.4 0.6 0.8 1 1.20
0.2
0.4
0.6
0.8
1
R n fac
tor
Sedn
0 0.2 0.4 0.6 0.8 1 1.20
0.2
0.4
0.6
0.8
1
A(8)
n
Sedn
0 0.2 0.4 0.6 0.8 1 1.20
0.2
0.4
0.6
0.8
1
VDV n
Sedn Figure 4.2: Relationship between health predicted by (a) VDVn versus A(8)n values, (b) Rn factor versus Sedn values,
(c) A(8)n versus Sedn values and (d) VDVn versus Sedn values for signals without shocks. The associated HGCZ are also indicated in the figures.
“HGCZ” Rn
“HGCZ” A(8)n
“HGCZ” VDVn
“HGCZ” Sedn
“HGCZ” A(8)n
“HGCZ” VDVn
“HGCZ” Sedn “HGCZ” Sedn
A B
D C
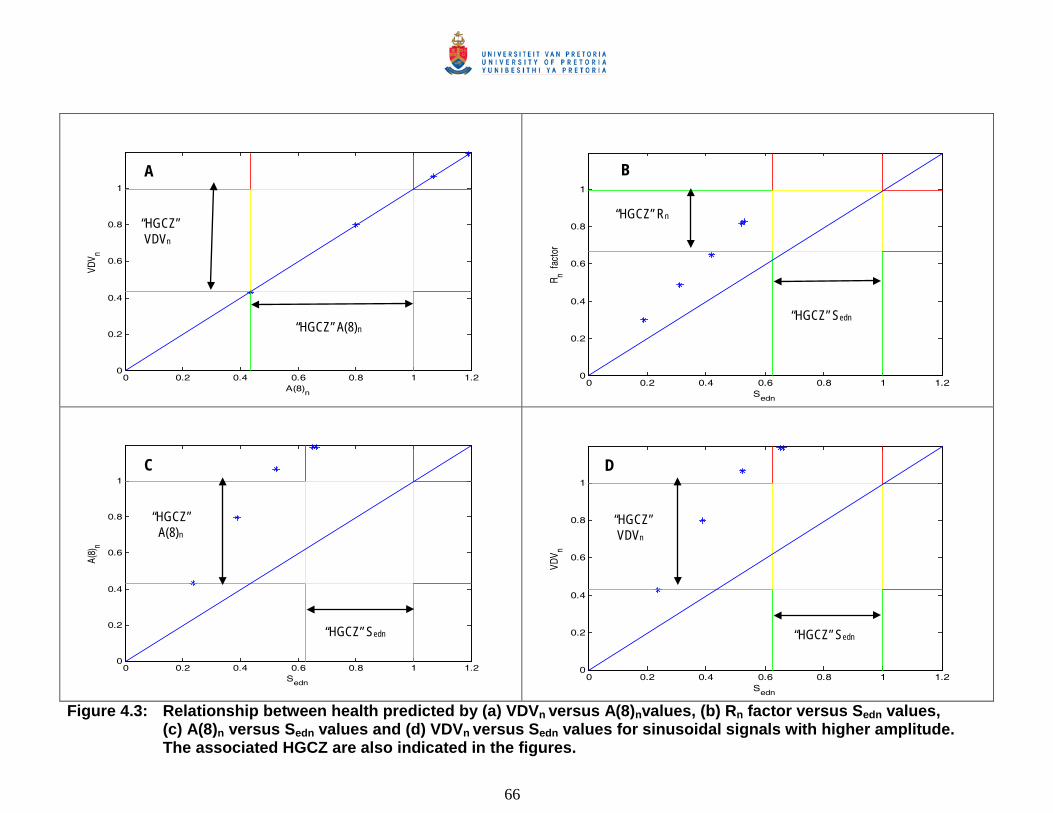
66
0 0.2 0.4 0.6 0.8 1 1.20
0.2
0.4
0.6
0.8
1
VDV n
A(8)n
0 0.2 0.4 0.6 0.8 1 1.20
0.2
0.4
0.6
0.8
1
R n fac
tor
Sedn
0 0.2 0.4 0.6 0.8 1 1.20
0.2
0.4
0.6
0.8
1
A(8)
n
Sedn
0 0.2 0.4 0.6 0.8 1 1.20
0.2
0.4
0.6
0.8
1
VDV n
Sedn Figure 4.3: Relationship between health predicted by (a) VDVn versus A(8)nvalues, (b) Rn factor versus Sedn values,
(c) A(8)n versus Sedn values and (d) VDVn versus Sedn values for sinusoidal signals with higher amplitude. The associated HGCZ are also indicated in the figures.
“HGCZ” Rn
“HGCZ” A(8)n
“HGCZ” VDVn
“HGCZ” Sedn
“HGCZ” A(8)n
“HGCZ” VDVn
“HGCZ” Sedn “HGCZ” Sedn
A B
D C

67
0 0.2 0.4 0.6 0.8 1 1.2 1.40
0.2
0.4
0.6
0.8
1
1.2
VDV n
A(8)n 0 0.2 0.4 0.6 0.8 1 1.2 1.4 1.6 1.8 2
0
0.5
1
1.5
2
2.5
3
R n fac
tor
Sedn
0 0.5 1 1.5 2 2.50
0.5
1
1.5
A(8)
n
Sedn 0 0.5 1 1.5 2 2.50
0.5
1
1.5
VDV n
Sedn Figure 4.4: Relationship between health predicted by (a) VDVn versus A(8)n values, (b) Rn factor versus Sedn values,
(c) A(8)n versus Sedn values and (d) VDVn versus Sedn values for signals with transient shocks in order of increasing amplitude. The associated HGCZ are also indicated in the figures.
“HGCZ” Rn
“HGCZ” A(8)n
“HGCZ” VDVn
“HGCZ” Sedn
“HGCZ” A(8)n “HGCZ”
VDVn
“HGCZ” Sedn “HGCZ” Sedn
A B
D C

68
0 1 2 3 4 5 60
1
2
3
4
5
6
VDV n
A(8)n 0 2 4 6 8 10 12 140
2
4
6
8
10
12
14
16
18
20
22
R n fac
tor
Sedn
0 2 4 6 8 10 12 14 16 180
1
2
3
4
5
6
A(8)
n
Sedn 0 2 4 6 8 10 12 14 16 18
0
1
2
3
4
5
6
VDV n
Sedn
Figure 4.5: Relationship between health predicted by (a) VDVn versus A(8)n values, (b) Rn factor versus Sedn values, (c) A(8)n versus Sedn values and (d) VDVn versus Sedn values for signal with transient shocks above the CF of 9 respectively. The associated HGCZ are also indicated in the figures.
“HGCZ” Rn “HGCZ” A(8)n
“HGCZ” VDVn
“HGCZ” Sedn
“HGCZ” A(8)n “HGCZ”
VDVn
“HGCZ” Sedn
“HGCZ” Sedn
A B
D C

69
0 0.2 0.4 0.6 0.8 1 1.2 1.40
0.2
0.4
0.6
0.8
1
1.2
1.4
VDV n
A(8)n 0 1 2 3 4 5 6 7 80
1
2
3
4
5
6
7
8
9
10
R n fac
tor
Sedn
0 1 2 3 4 5 6 7 80
0.2
0.4
0.6
0.8
1
1.2
1.4
A(8)
n
Sedn
0 1 2 3 4 5 6 7 80
0.2
0.4
0.6
0.8
1
1.2
1.4
VDV n
Sedn
Figure 4.6: Relationship between health predicted by (a) VDVn versus A(8)n values, (b) Rn factor versus Sedn values, (c) A(8)n versus Sedn values and (d) VDVn versus Sedn values for simulated data with different amplitude and low shock magnitude for five typical example cases. The associated HGCZ are also indicated in the figures.
“HGCZ” Rn
“HGCZ” A(8)n
“HGCZ” VDVn
“HGCZ” Sedn
“HGCZ” A(8)n
“HGCZ” VDVn
“HGCZ” Sedn
“HGCZ” Sedn
A B
D C

70
0 0.2 0.4 0.6 0.8 1 1.2 1.40
0.2
0.4
0.6
0.8
1
1.2
1.4
VDV n
A(8)n 0 1 2 3 4 5 6 7 8
0
1
2
3
4
5
6
7
8
9
10
R n fac
tor
Sedn
0 1 2 3 4 5 6 7 80
0.2
0.4
0.6
0.8
1
1.2
1.4
A(8)
n
Sedn 0 1 2 3 4 5 6 7 8
0
0.2
0.4
0.6
0.8
1
1.2
1.4
VDV n
Sedn
Figure 4.7: Relationship between health predicted by (a) VDVn versus A(8)n values, (b) Rn factor versus Sedn values, (c) A(8)n versus Sedn values and (d) VDVn versus Sedn values for simulated data with different amplitude and shock magnitude for five typical example cases. The associated HGCZ are also indicated in the figures.
“HGCZ” Rn “HGCZ” A(8)n
“HGCZ” VDVn
“HGCZ” Sedn
“HGCZ” A(8)n “HGCZ”
VDVn “HGCZ” Sedn “HGCZ” Sedn
A B
D C

71
5. Evaluation of results of investigation 5.1 Whole-body vibration results based on ISO 2631-1 (1997) using
WRMS Figures 5.1 to 5.9 graphically summarizes the machinery whose WBV levels are
either below the WRMS action (HGCZ lower limit) value of 0.5 m/s2 or between
the WRMS action and limit values of 0.5 m/s2 and 1.15 m/s2 respectively. None of
the equipment has WRMS values above the HGCZ upper limit value of 1.15
m/s2. In all the following cases, reference should be made to Tables 3.11 to 3.19
for a summary of operator seat vibration magnitudes and the operating periods
before the WRMS action values and limit values are reached.
Of the ten LHDs evaluated four had values below the HGCZ lower limit value and
the remaining six had values between the HGCZ limit values. All the excavators
had vibration values below the HGCZ. Of the remaining equipment, seven had
vibration values below the HGCZ and the remaining ten had vibration values
above the HGCZ.
All the machinery have vibration values that are either below the WRMS action
value or between the WRMS action and limit values. Fifty three percent of the
machinery/equipment have vibration values below the WRMS action value. The
remaining forty seven percent have exposure values between the WRMS action
and limit values (between the HGCZ limit values). The WRMS values are similar
to those obtained earlier on the South African mines (Van Niekerk et al., 2000;
MHSC, 2004; Mdlazi 2008) using the ISO 2631-1 (1997) standard methodology.
Mdlazi 2008 obtained WRMS values which were all below the limit value.
However, Van Niekerk et al. (2000) and MHSC (2004) had some values above
the WRMS limit value. This was as a result of the dominant frequency being

72
within 4-8 Hz and higher weighting factor being attached to this frequency range
because of the serious effect on health.
Weighted RMS acceleration (m/s2) 0.00 0.50 1.00 1.50 2.00 Volvo A35 LHD (A1)
Mercedes Actros V8 LHD 4150 (A2)
Caterpillar 785B (A3) Tata Novus Truck 3434 (A4) Bell Rear Dumper B25D (A5) Bell Rear Dumper B40D (A6) Bell Rear Dumper B50D (A7) Iveco Truck/Trailer (Double) (A8) MAN TGA 33.400 Trailer (A9) Dragline 55W70 (A10) Figure 5.1: Weighted RMS acceleration magnitudes for LHDs Values less than EAV Values between EAV and ELV Values higher than ELV

73
Weighted RMS acceleration (m/s2) 0.00 0.50 1.00 1.50 2.00 Hitachi Excavator Zaxis 670LCR(B1)
Volvo Excavator EC700Blc(B2) CAT Excavator 320D (B3) Hitachi Excavator Zaxis 370 LCR (B4) Hitachi Excavator Zaxis 500 LCR (B5) Komatsu Excavator PC1250SP (B6) Hitachi Excavator Zaxis 670 LCR (B7) Figure 5.2: Weighted RMS acceleration magnitudes for Excavators
Weighted RMS acceleration (m/s2)
0.00 0.50 1.00 1.50 2.00 CAT FEL 992G (C1)
Kawasaki Safika FEL 852IV (C2) Kawasaki FEL (C3)
Figure 5.3: Weighted RMS acceleration magnitudes for Front End Loaders

74
Weighted RMS acceleration (m/s2) 0.00 0.50 1.00 1.50 2.00 CAT Track Dozer D9T (D1)
CAT Caterpillar D10R (D2) Bell TLB 315SG (D3) Shantui (D4) Figure 5.4: Weighted RMS acceleration magnitudes for Dozers
Weighted RMS acceleration (m/s2) 0.00 0.50 1.00 1.50 2.00 Pit Viper (E1)
DMM 2 Drilling Machine (E2) Figure 5.5: Weighted RMS acceleration magnitudes for Drills
Weighted RMS acceleration (m/s2) 0.00 0.50 1.00 1.50 2.00 CAT Grader 16G (F1)
Sany Grader (F2) Komatsu Grader 9D825A (F3)
Figure 5.6: Weighted RMS acceleration magnitudes for Graders

75
Weighted RMS acceleration (m/s2) 0.00 0.50 1.00 1.50 2.00 Bell Water Bowser B20C (G1)
Powerstar 2628 Refueler (G2) CAT 740 Diesel Bowser (G3)
Figure 5.7: Weighted RMS acceleration magnitudes for Liquid Conveyers Weighted RMS acceleration (m/s2) 0.00 0.50 1.00 1.50 2.00 Toyota Fortuner (H1)
Figure 5.8: Weighted RMS acceleration magnitude for 4x4
Weighted RMS acceleration (m/s2) 0.00 0.50 1.00 1.50 2.00 Landpac Compactor (I1)
Figure 5.9: Weighted RMS acceleration magnitude for Compactor

76
5.2 WBV results based on ISO 2631-1 (1997) using VDV
The ISO 2631-1 (1997) standard requires that if the crest factor is higher than 9,
then the vibration dose value needs to be calculated. Crest factors higher than 9
indicate the presence of shock.
Figures 5.10 to 5.18 show the summaries of the machinery whose WBV levels
are either below the VDV action (HGCZ lower limit) value of 9.1 m/s1.75 or
between the VDV action and limit values of 9.1 m/s1.75 and 21 m/s1.75 respectively
or above the VDV limit (HGCZ upper limit) values of 21 m/s1.75. In all the following
cases, reference should be made to Tables 3.20 to 3.28 for summary of operator
seat vibration magnitudes and operating periods to the VDV action value and
limit value.
Of the ten LHDs evaluated four had values below the HGCZ lower limit value and
the remaining six had values between the HGCZ limit values. Six of the
excavators had vibration values below the HGCZ whereas one excavator had a
value between the HGCZ boundaries. Of the remaining equipment, seven had
vibration values below the HGCZ; nine had values between the HGCZ
boundaries and the remaining one had vibration values above the HGCZ.
Half the numbers of machinery/equipment have VDVs below the VDV action
value. Forty seven percent of the machinery have VDVs between the VDV action
and limit value. The remaining three percent of the machinery have VDVs above
the VDV limit values.

77
VDV (m/s1.75)
0.00 5.00 10.00 15.00 20.00 Volvo A35 LHD (A1)
Mercedes Actros V8 LHD 4150 (A2) Caterpillar 785B (A3) Tata Novus Truck 3434 (A4) Bell Rear Dumper B25D (A5) Bell Rear Dumper B40D (A6) Bell Rear Dumper B50D (A7) Iveco Truck/Trailer (Double) (A8) MAN TGA 33.400 Trailer (A9) Dragline 55W70 (A10)
Figure 5.10: VDV magnitudes for LHDs Values less than VDV action value Values between VDV action and limit values Values higher than VDV limit value

78
VDV (m/s1.75)
0.00 5.00 10.00 15.00 20.00 Hitachi Excavator Zaxis 670LCR(B1)
Volvo Excavator EC700Blc(B2) CAT Excavator 320D (B3) Hitachi Excavator Zaxis 370 LCR (B4) Hitachi Excavator Zaxis 500 LCR (B5) Komatsu Excavator PC1250SP (B6) Hitachi Excavator Zaxis 670 LCR (B7) Figure 5.11: VDV magnitudes for Excavators
VDV (m/s1.75) 0.00 5.00 10.00 15.00 20.00 CAT FEL 992G (C1)
Kawasaki Safika FEL 852IV (C2) Kawasaki FEL (C3)
Figure 5.12: VDV magnitudes for Front End Loaders

79
VDV (m/s1.75)
0.00 5.00 10.00 15.00 20.00 CAT Track Dozer D9T (D1)
CAT Caterpillar D10R (D2) Bell TLB 315SG (D3) Shantui (D4) Figure 5.13: VDV magnitudes for Dozers
VDV (m/s1.75) 0.00 5.00 10.00 15.00 20.00 Pit Viper (E1)
DMM 2 Drilling Machine (E2)
Figure 5.14: VDV magnitudes for Drills
VDV (m/s1.75) 0.00 5.00 10.00 15.00 20.00 CAT Grader 16G (F1)
Sany Grader (F2) Komatsu Grader 9D825A (F3)
Figure 5.15: VDV magnitudes for Graders

80
VDV (m/s1.75) 0.00 5.00 10.00 15.00 20.00 Bell Water Bowser B20C (G1)
Powerstar 2628 Refueler (G2) CAT 740 Diesel Bowser (G3)
Figure 5.16: VDV magnitudes for Liquid Conveyers
VDV (m/s1.75)
0.00 5.00 10.00 15.00 20.00 Toyota Fortuner (I1)
Figure 5.17: VDV magnitude for 4x4
VDV (m/s1.75)
0.00 5.00 10.00 15.00 20.00 Landpac Compactor (J1)
Figure 5.18: VDV magnitude for Compactor

81
5.3 WBV results based on ISO 2631-5 (2004) using Sed The ISO 2631-5 (2004) standard gives examples of conditions resulting in
vibration containing multiple shocks to include machinery travelling over rough
surfaces, small boats in rough sea, aircrafts in buffeting, presses and mechanical
hammers. The machineries whose results are shown below fall in these
categories.
Figures 5.19 to 5.27 show the summaries of the machinery whose WBV levels
are either below the Sed value of 0.5 MPa; between the Sed values of 0.5 MPa
and 0.8 MPa or above the Sed value of 0.8 MPa.
Of the ten LHDs evaluated only one had a value below the HGCZ lower limit
value and the remaining nine had values above the HGCZ upper limit value. Two
of the excavators had vibration values below the HGCZ; two excavators had
values between the HGCZ boundaries and three had vibration values above the
HGCZ upper limit value. Of the remaining equipment, one had a vibration value
below the HGCZ; two had values between the HGCZ boundaries and the
remaining fourteen had vibration values above the HGCZ.
In all the following cases, reference should be made to Tables 3.29 to 3.37 for
summary of operator seat vibration magnitudes and operating periods to the Sed
values. The graphical presentation of the lumbar response acceleration histories
are presented in Appendix A-I.
About twelve percent of the numbers of machinery/equipment have Sed values
below 0.6 MPa which give an indication of low probability of an adverse health
effect. Another twelve percent of the machinery have Sed values between 0.6
MPa and 0.8 MPa give an indication of moderate probability of an adverse health
effect. The remaining seventy six percent of the machinery have Sed values
above 0.8 MPa give an indication of high probability of an adverse health effect.

82
Sed (MPa) 0.00 0.50 1.00 1.50 2.00 Volvo A35 LHD (A1)
Mercedes Actros V8 LHD 4150 (A2) Caterpillar 785B (A3) Tata Novus Truck 3434 (A4) Bell Rear Dumper B25D (A5) Bell Rear Dumper B40D (A6) Bell Rear Dumper B50D (A7) Iveco Truck/Trailer (Double) (A8) MAN TGA 33.400 Trailer (A9) Dragline 55W70 (A10)
Figure 5.19: Sed magnitudes for LHDs Values less than 0.5 MPa Values between 0.5 MPa and 0.8 MPa Values higher than 0.8 MPa

83
Sed (MPa)
0.00 0.50 1.00 1.50 2.00 Hitachi Excavator Zaxis 670LCR(B1)
Volvo Excavator EC700Blc(B2) CAT Excavator 320D (B3) Hitachi Excavator Zaxis 370 LCR (B4) Hitachi Excavator Zaxis 500 LCR (B5) Komatsu Excavator PC1250SP (B6) Hitachi Excavator Zaxis 670 LCR (B7) Figure 5.20: Sed magnitudes for Excavators
Sed (MPa) 0.00 0.50 1.00 1.50 2.00 CAT FEL 992G (C1)
Kawasaki Safika FEL 852IV (C2) Kawasaki FEL (C3)
Figure 5.21: Sed magnitudes for Front End Loaders
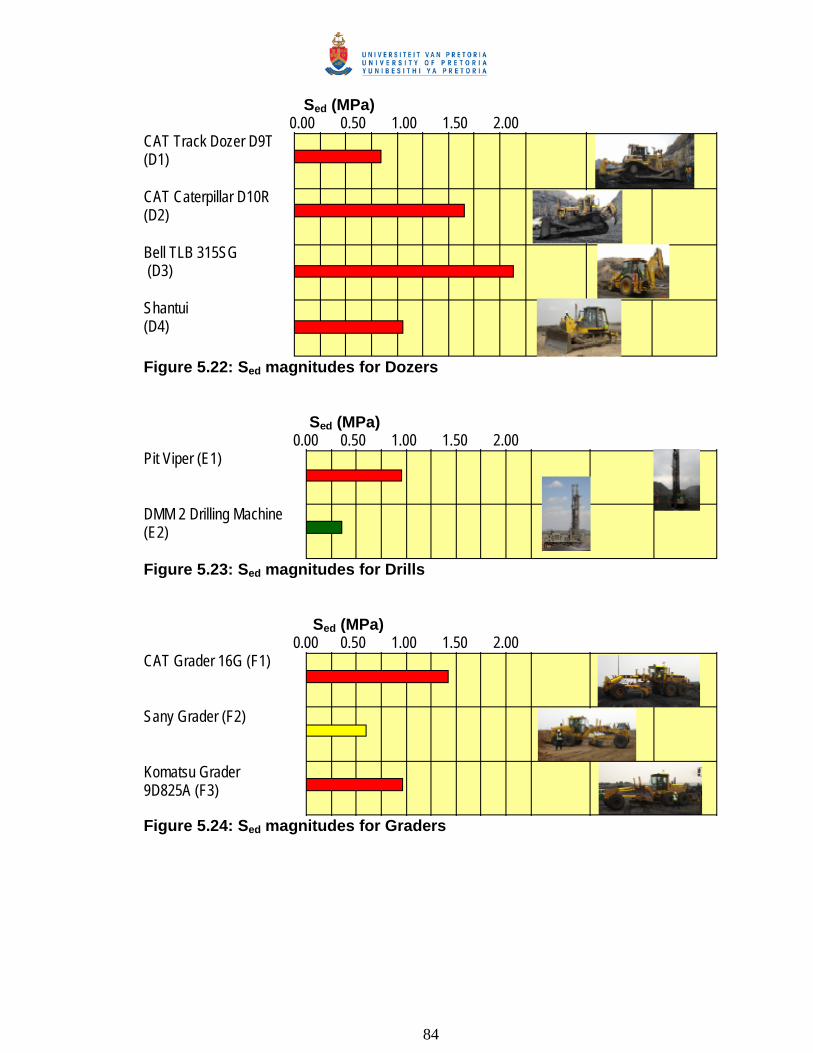
84
Sed (MPa) 0.00 0.50 1.00 1.50 2.00 CAT Track Dozer D9T (D1)
CAT Caterpillar D10R (D2) Bell TLB 315SG (D3) Shantui (D4) Figure 5.22: Sed magnitudes for Dozers
Sed (MPa) 0.00 0.50 1.00 1.50 2.00 Pit Viper (E1)
DMM 2 Drilling Machine (E2)
Figure 5.23: Sed magnitudes for Drills
Sed (MPa) 0.00 0.50 1.00 1.50 2.00 CAT Grader 16G (F1)
Sany Grader (F2) Komatsu Grader 9D825A (F3)
Figure 5.24: Sed magnitudes for Graders

85
Sed (MPa)
0.00 0.50 1.00 1.50 2.00 Bell Water Bowser B20C (G1)
Powerstar 2628 Refueler (G2) CAT 740 Diesel Bowser (G3)
Figure 5.25: Sed magnitudes for Liquid Conveyers Sed (MPa) 0.00 0.50 1.00 1.50 2.00 Toyota Fortuner (I1)
Figure 5.26: Sed magnitude for 4x4
Sed (MPa) 0.00 0.50 1.00 1.50 2.00 Landpac Compactor (J1) Figure 5.27: Sed magnitude for Compactor

86
5.4 WBV results based on ISO 2631-5 (2004) using R factor Figures 5.28 to 5.36 show the summaries of the machinery whose WBV levels
are either below the R factor of 0.8 or between the R factors of 0.8 and 1.2 or
above the R factor of 1.2. In all the following cases, reference should be made to
Tables 3.29 to 3.37 for summary of operator seat vibration magnitudes and
operating periods to the R factors.
Of the ten LHDs evaluated only one had a value below the HGCZ lower limit
value and the remaining nine had values above the HGCZ upper limit value. One
of the excavators had a vibration value below the HGCZ; three excavators had
values between the HGCZ boundaries and three had vibration values above the
HGCZ upper limit value. Of the remaining equipment, one had a vibration value
below the HGCZ; two had values between the HGCZ boundaries and the
remaining fourteen had vibration values above the HGCZ.
About nine percent of the numbers of machinery/equipment have R factors below
0.8 which give an indication of low probability of an adverse health effect. Another
fifteen percent of the machinery have R factors between 0.8 and 1.2 give an
indication of moderate probability of an adverse health effect. The remaining
seventy six percent of the machinery have R factors above 1.2 give an indication
of high probability of an adverse health effect.

87
R 0.00 0.50 1.00 1.50 2.00 Volvo A35 LHD (A1)
Mercedes Actros V8 LHD 4150 (A2) Caterpillar 785B (A3) Tata Novus Truck 3434 (A4) Bell Rear Dumper B25D (A5) Bell Rear Dumper B40D (A6) Bell Rear Dumper B50D (A7) Iveco Truck/Trailer (Double) (A8) MAN TGA 33.400 Trailer (A9) Dragline 55W70 (A10)
Figure 5.28: R magnitudes for LHDs Values less than 0.8 Values between 0.8 and 1.2 Values higher than 1.2

88
R 0.00 0.50 1.00 1.50 2.00 Hitachi Excavator Zaxis 670LCR(B1)
Volvo Excavator EC700Blc(B2) CAT Excavator 320D (B3) Hitachi Excavator Zaxis 370 LCR (B4) Hitachi Excavator Zaxis 500 LCR (B5) Komatsu Excavator PC1250SP (B6) Hitachi Excavator Zaxis 670 LCR (B7) Figure 5.29: R magnitudes for Excavators
R 0.00 0.50 1.00 1.50 2.00 CAT FEL 992G (C1)
Kawasaki Safika FEL 852IV (C2) Kawasaki FEL (C3) Figure 5.30: R magnitudes for Front End Loaders
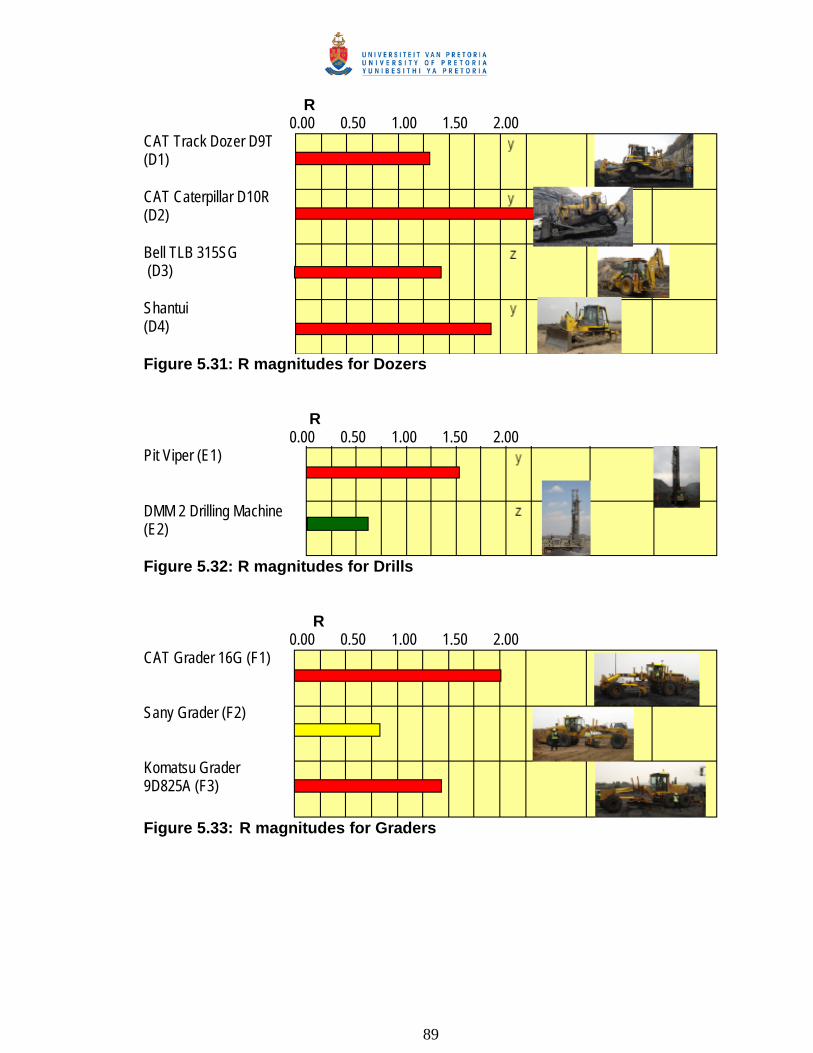
89
R 0.00 0.50 1.00 1.50 2.00 CAT Track Dozer D9T (D1)
CAT Caterpillar D10R (D2) Bell TLB 315SG (D3) Shantui (D4) Figure 5.31: R magnitudes for Dozers
R 0.00 0.50 1.00 1.50 2.00 Pit Viper (E1)
DMM 2 Drilling Machine (E2)
Figure 5.32: R magnitudes for Drills
R 0.00 0.50 1.00 1.50 2.00 CAT Grader 16G (F1)
Sany Grader (F2) Komatsu Grader 9D825A (F3)
Figure 5.33: R magnitudes for Graders

90
R 0.00 0.50 1.00 1.50 2.00 Bell Water Bowser B20C (G1)
Powerstar 2628 Refueler (G2) CAT 740 Diesel Bowser (G3)
Figure 5.34: R magnitudes for Liquid Conveyers R 0.00 0.50 1.00 1.50 2.00 Toyota Fortuner (I1)
Figure 5.35: R magnitude for 4x4
R 0.00 0.50 1.00 1.50 2.00 Landpac Compactor (J1)
Figure 5.36: R magnitude for Compactor

91
5.5 Comparison of results based on ISO 2631-1 (1997) and ISO 2631-5 (2004)
It should be recalled that the ISO 2631-1 (1997) standard requires that if the
crest factor is higher than 9, then the vibration dose value needs to be calculated.
Crest factors higher than 9 indicate the presence of shock. However, as stated
earlier, the ISO 2631-5 (2004) standard gives examples of conditions resulting in
vibration containing multiple shocks. The machineries whose results are
compared below fall in these categories.
A(8)n and VDVn parameters are plotted on the x- and y- axes respectively in
Figure 5.37 (a). In Figure 5.37 (b) Sedn and Rn factor parameters are plotted on
the x- and y- axes respectively. Sedn and A(8)n parameters are plotted on the x-
and y-axes respectively in Figure 5.37 (c). Finally, Sedn and Rn factor parameters
are plotted on the x- and y-axes respectively in Figure 5.37 (d).
In Figure 5.37 (a) both parameters are from ISO2631-1. Since the gradient is 1
and the lower and upper HGCZ values correspond exactly, i.e. 0.43 and 1 on
both axes; it is clear that the two parameters from the same standard are
consistent in their health risk assessments as earlier shown Section 4.1.
Also, Figure 5.37 (b) gives two parameters from ISO2631-5. The lower HGCZ
values are 0.63 and 0.67 for Sedn and R factor respectively. The upper HGCZ
values correspond exactly at 1 on both axes. The gradient is greater than 1 even
though the two parameters are from the same standard. This is because the Sedn
is a daily value whereas the R factor is an accumulative value which is a function
of Sed. The R factor is an accumulative factor because it takes into account the
number of days in a year and number of years of exposure for a maximum
operator working life of 45 years (aged 20–65 years) as suggested by the ISO
2631-5 (2004) standard. It is therefore obvious that the two parameters from the
same standard are not consistent in their health risk assessments.

92
Figure 5.37 (c) gives a parameter from ISO2631-1 and from ISO2631-5. The
lower HGCZ values are 0.43 and 0.63 for A(8)n and Sedn respectively. The upper
HGCZ values correspond exactly at 1 on both axes. The gradient is less than 1.
Again it is evident that the two parameters from the twodifferent standards under
consideration are not consistent in their health risk assessments.
Figure 5.37 (d) gives parameters from ISO2631-1 and ISO2631-5. The lower
HGCZ values are 0.43 and 0.63 for VDVn and Sedn respectively. The upper
HGCZ values correspond exactly at 1 on both axes. The gradient is less than 1.
It is clear that the two parameters from the different standards are not consistent
in their health risk assessments. In spite of the inconsistency all the parameters
plotted in Figures 5.37 to 5.39 are roughly proportional. According to ISO 2631-1
(1997), for events with CF greater 9 which indicate the presence of shocks, the
VDV parameter should be used whereas Sed is the daily parameter for assessing
shock based on ISO 2631-5 (2004). Hence, VDV parameter will ultimately be
compared to Sed for transient shock events.
For the 10 LHDs measured, the RMS, VDV, Sed and R factor ranges are 0.10-
0.81 m/s2, 1.88-12.77 m/s1.75, 0.28-1.90 MPa, 0.44-2.97 respectively. The
minimum CF value was 5.95 and the maximum CF value was 36.90 indicating
the presence of shocks. The various parameters obtained from results of
analysis as tabulated in Tables 3.11, 3.20 and 3.29 are normalized and plotted in
Figure 5.37. It is interesting to note that the VDVn versus A(8)n and Rn factor
versus Sedn, are proportional as shown in Figures 5.37 (a) and (b); however, the
A(8)n versus Sedn and VDVn versus Sedn plots are roughly proportional as shown
in Figures 5.37 (c) and (d) respectively. Figures 5.37 (c) and 5.37 (d) are roughly
proportional with some scatter because of the stochastic nature of the field data
as can be seen in Figure 4.7 of Section 4.6. All the plotted values are below the
unity slope line with a slope less than 1 corresponding to the high or significant
shock content situation meaning Sed predicts higher risk to health as earlier
obtained in Section 4.6. It is clearly seen that health risk prediction based on the

93
VDVs is less conservative than that based on the Sed values in Figure 5.37 (d) in
the presence of shocks. This is consistent with findings by Alem et al. (2004) and
Chen et al. (2009) who obtained higher predictions of the risk based on the Sed
values than on VDVs in the presence high impacts or shocks.
Some studies had earlier carried out health risk prediction prior to this study.
Johanning et al. (2006) reported higher predicted risks based on ISO 2631-1
(1997) variables than ISO 2631-5 (2004) variables for 20 locomotive operators.
Cooperrider and Gordon (2008) also reported higher risks for locomotive
operators, based on VDVs from an ISO 2631-1 (1997) analysis when compared
to Sed values from an ISO 2631-5 (2004) analysis. In their study, four locomotive
operators had VDVs that placed them within the HGCZ (for an 8-h working shift);
however, all the Sed values were below the boundary for low probability of
adverse health effects. Another study by Eger et al. (2008) in the operation of
mining vehicles equally found that the risk indicated by values obtained by using
ISO 2631-1 (1997) was higher than that based on ISO 2631-5 (2004). This was
because of the presence of low shock or impact as opposed to our study which
was carried in a high shock environment. Their studies had crest factors above
nine which indicted the presence of shocks. However, this was because the
impacts were high relative to the lower values of WRMS obtained from the data
since crest factor is a ratio of the highest impact magnitude to the WRMS. When
the shocks are low this could still lead to lower values of Sed which led to the
prediction of lower risk to health based on ISO 2631-5 (2004) in such low shock
environments.
The 7 excavators measured had WRMS, VDV, Sed and R factor in the ranges of
0.18-0.51 m/s2, 3.24-9.25 m/s1.75, 0.42-2.32 MPa and 0.76-3.62 respectively. The
minimum CF value was 10.29 and the maximum CF value was 55.22. For the
other 15 machinery, which include front end loaders, dozers, drills, graders, liquid
conveyors, 4x4 and compactor, the RMS, VDV, Sed and R factor ranges are 0.19-
1.12 m/s2, 3.42-25.68 m/s1.75, 0.40-11.30 MPa, 0.63-17.68 respectively. The
minimum CF value was 6.00 and the maximum CF value was 23.78 indicating
94
the presence of high shock for both excavators and other machinery. The data
for the excavators and the other machinery as tabulated in Tables 3.12, 3.21 and
3.30 and Tables 3.13-3.19, 3.22-3.28 and 3.31-3.37 respectively are also
normalized and subsequently plotted in Figures 5.38 and 5.39 respectively.
Again, the A(8)n versus Sedn and VDVn versus Sedn plots are roughly proportional
with some scatter because of the stochastic nature of the field data as shown in
Figures 5.38 (c) and (d) and Figures 5.39 (c) and (d) for the excavators and other
machinery respectively. All the plotted values are below the unity slope line with
a slope less than 1 corresponding to the high or significant shock content
situation as earlier demonstrated in Section 4.6. The health risk prediction based
on the VDVs is less conservative than that based on the Sed values as shown in
Figure 5.38 (d) and 5.39 (d) in the presence of shocks for all the equipment. Also,
in Figures 5.38 (c) and (d) and Figures 5.39 (c) and (d) it is evidently clear that
there is a very large offset i.e. the graph no longer goes through 0. This is due to
the presence of transient shocks which leads to a gradient less than 1 as
similarly illustrated in Figure 4.4 (c) and (d) of Section 4.3.
When using ISO 2631-1 (1997) it can be seen that over ninety five percent of the
machinery fall within or below the health guidance caution zone (HGCZ)
indicating less risk to occupational hazard as shown in Figures 5.37 (a) to 5.39
(a). However, when ISO 2631-5 (2004) is used it can be seen that over seventy
percent of the machinery fall above the HGCZ indicating a high probability to risk
due to occupational hazard as shown in Figures 5.37 (d) to 5.39 (d). It can
therefore be stated that health risk assessment based on Sed parameter of ISO
2631-5 (2004) standard is more conservative than risk assessment based on the
VDV of the ISO 2631-1 (1997) standard in the presence of shocks. This is due to
the fact that the ISO 2631-5 (2004) standard takes into account the transient and
high magnitude shock events which are handled better than the ISO 2631-1
(1997) standard.
95
5.6 Summary
The parameters (VDV and Sed) corresponding to the two ISO 2631-1 (1997) and
ISO 2631-5 (2004) standard methodologies were compared to see if the same
trend obtained from the numerically obtained sinusoidal signals could be
validated. It was found that there was approximate correlation between the plots
of values obtained for each set of machinery and the numerically generated
values. For each set of machinery, there was a band correlation between the
VDV and Sed parameters with all values below the unity slope line and with
gradients less than one indicating the presence of transient shocks as shown in
Figures 5.37 (d), 5.38 (d) and 5.39 (d) for LHDs, excavators and other machinery
respectively. The gradual slope band graphs with gradients less than one
corresponded to high shock content thereby validating the numerical findings. In
the study, the two parameters from the different standards are not consistent in
their health risk assessments as the assessment based on Sed values are more
conservative than those based on the VDVs.
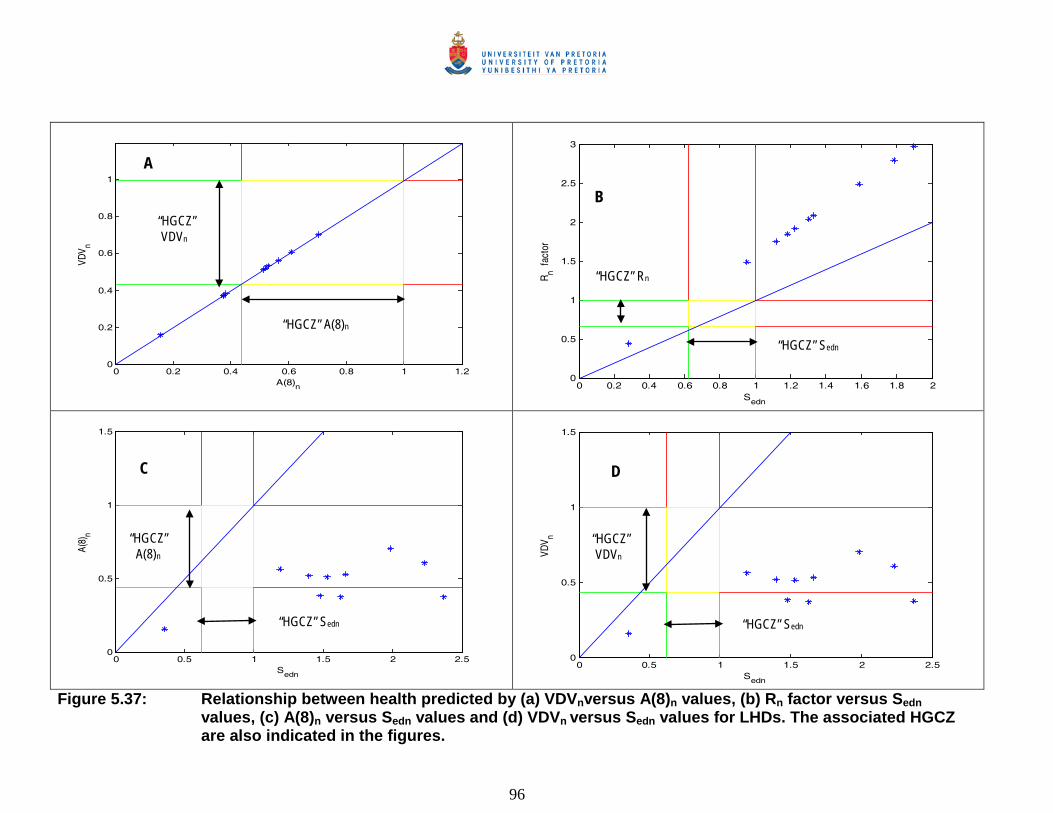
96
0 0.2 0.4 0.6 0.8 1 1.20
0.2
0.4
0.6
0.8
1
VDV n
A(8)n 0 0.2 0.4 0.6 0.8 1 1.2 1.4 1.6 1.8 20
0.5
1
1.5
2
2.5
3
R n fac
tor
Sedn
0 0.5 1 1.5 2 2.50
0.5
1
1.5
A(8)
n
Sedn 0 0.5 1 1.5 2 2.5
0
0.5
1
1.5
VDV n
Sedn Figure 5.37: Relationship between health predicted by (a) VDVnversus A(8)n values, (b) Rn factor versus Sedn
values, (c) A(8)n versus Sedn values and (d) VDVn versus Sedn values for LHDs. The associated HGCZ are also indicated in the figures.
“HGCZ” Rn
“HGCZ” A(8)n
“HGCZ” VDVn
“HGCZ” Sedn
“HGCZ” A(8)n
“HGCZ” VDVn
“HGCZ” Sedn “HGCZ” Sedn
B
A
C D

97
0 0.2 0.4 0.6 0.8 1 1.20
0.2
0.4
0.6
0.8
1
VD
Vn
A(8)n 0 0.5 1 1.5 2 2.50
0.5
1
1.5
2
2.5
3
3.5
4
Rn f
acto
r
Sedn
0 0.5 1 1.5 2 2.5 30
0.2
0.4
0.6
0.8
1
A(8)
n
Sedn 0 0.5 1 1.5 2 2.5 3
0
0.2
0.4
0.6
0.8
1
VDV n
Sedn Figure 5.38: Relationship between health predicted by (a) VDVn versus A(8)n values, (b) Rn factor versus Sedn
values, (c) A(8) versus Sedn values and (d) VDVn versus Sedn values for Excavators. The associated HGCZ are also indicated in the figures.
“HGCZ” A(8)
“HGCZ” VDVn
“HGCZ” Sedn
“HGCZ” A(8)n “HGCZ”
VDVn
“HGCZ” Sedn “HGCZ” Sedn
C D
B A
“HGCZ” Rn
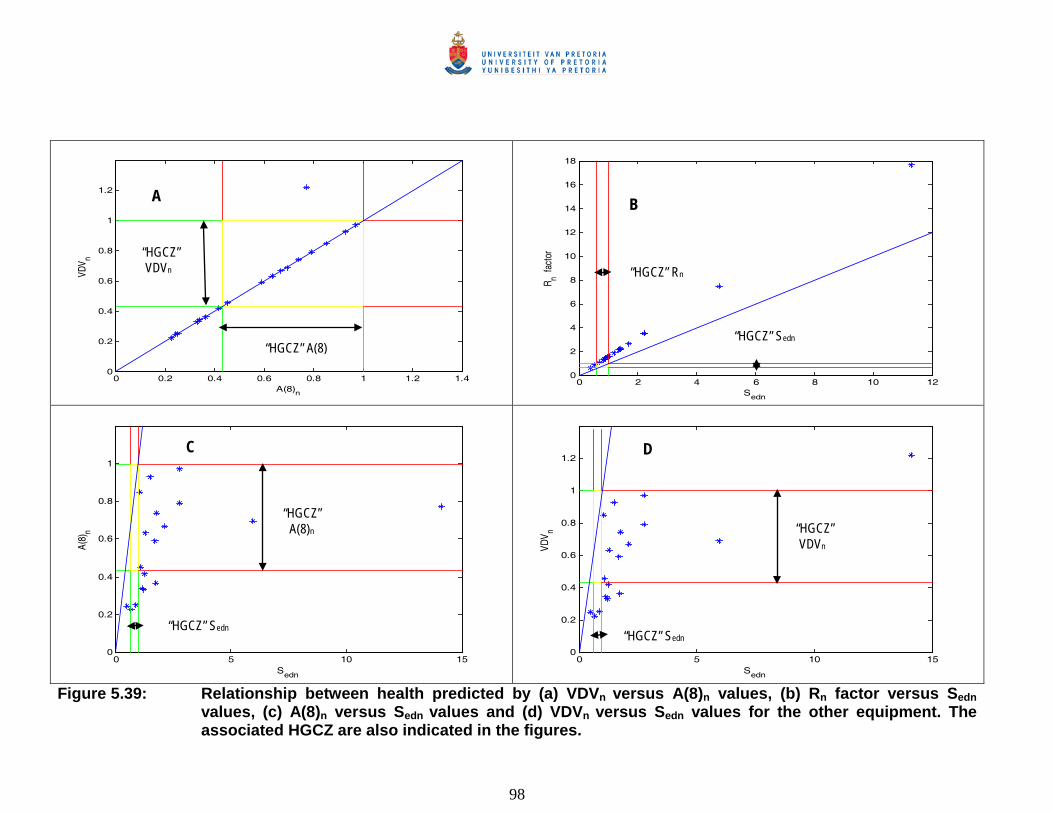
98
0 0.2 0.4 0.6 0.8 1 1.2 1.40
0.2
0.4
0.6
0.8
1
1.2
VDV n
A(8)n 0 2 4 6 8 10 12
0
2
4
6
8
10
12
14
16
18
R n fac
tor
Sedn
0 5 10 150
0.2
0.4
0.6
0.8
1
A(8)
n
Sedn 0 5 10 15
0
0.2
0.4
0.6
0.8
1
1.2
VDV n
Sedn Figure 5.39: Relationship between health predicted by (a) VDVn versus A(8)n values, (b) Rn factor versus Sedn
values, (c) A(8)n versus Sedn values and (d) VDVn versus Sedn values for the other equipment. The associated HGCZ are also indicated in the figures.
“HGCZ” Rn
“HGCZ” A(8)
“HGCZ” VDVn
“HGCZ” Sedn
“HGCZ” A(8)n “HGCZ”
VDVn
“HGCZ” Sedn “HGCZ” Sedn
A B
D C

99
6. Conclusions and recommendations
6.1 Conclusions Two methods have been used to evaluate the whole-body vibration on a wide
range of equipment in an open cast mine. There are two main parameters for
each of the standards. The ISO 2631-1 (1997) standard bases evaluation on the
parameters A(8) and VDV, whereas the new ISO 2631-5 (2004) standard
methodology uses the parameters Sed and R.
The trends in each of the parameters of the ISO 2631-1 (1997) and ISO 2631-5
(2004) standard methodologies corresponding to each of the standards were
monitored using various scenarios obtained by varying the signal characteristics
of the simulated sinusoidal signal data and compared against each other. The
Sed and VDV parameters were plotted on the x- and y-axes respectively. There
was approximate proportional correlation between the two parameters (VDV and
Sed) with varying degrees of slope for each scenario. The graphs with plotted
values above the unity slope line and slope greater than 1 corresponded to
signals with low or no shock content meaning that VDV predicts risk; whereas the
graphs with plotted values below the unity slope line and slope less than 1
corresponded to high shock content meaning that Sed predicts risk.
Experimental data was obtained from the mine on different set of machineries.
The parameters of interest from ISO 2631-1 (1997) and ISO 2631-5 (2004)
standard methodologies were computed and tabulated for each set of machinery
for further analysis. The parameters (VDV and Sed) corresponding to the two
standard methodologies were compared to see if the same trend obtained from
the numerically obtained sinusoidal signals could be validated. It was found that
there was a rough proportional correlation with a slope less than 1 between the
VDV and Sed parameters corresponding to signals of high shock content thereby
validating the numerical findings.

100
6.2 Recommendations Various epidemiological studies have been carried out on the ISO 2631-1 (1997)
with respect to normal vibration with no shock (WRMS) or low shock (VDV)
content which has led to exposure action and limit values been determined and
being generally accepted for these two parameters respectively. However, few or
no extensive epidemiological studies have been carried using the new
methodology in South Africa. It is therefore recommended that more
epidemiological studies be done to determine the generally acceptable exposure
action and exposure limit values with respect to shocks in the Sed and R factor
parameters for the new ISO 2631-5 (2004) standard methodology. In addition,
the old data for the previous epidemiological studies could be reinterpreted in
terms of the new standard.
In the meantime, caution should be taking when using the new ISO 2631-5
(2004) standard methodology in evaluating vibration measurements. It is
suggested that the new standard be used along with the established ISO 2631-1
(1997) standard methodology.

101
7. References Ahn, S., and Griffin M.J., 2008. Effects of frequency, magnitude, damping, and
direction on the discomfort of vertical whole-body mechanical shocks. Journal of
Sound and Vibration, vol. 311, pp. 485–497.
Alem, N., 2005. Application of the new ISO 2631-5 to health hazard assessment
of repeated shocks in U.S. army vehicles. Industrial Health, vol. 43, pp. 403–412.
Alem, N.M., Hiltz, E.E., Breuax-Sims, A.M. and Bumgardner, B.A., 2004.
Evaluation of new methodology for health hazard assessment of repeated shock
in military tactical ground vehicles. Habitability of Combat and Transport
Vehicles: Noise, Vibration and Motion, Prague, Czech Republic, RTO-MP-AVT-
110.
Berezan, J.J., Joseph, T.G. and del Valle, V.D., 2004. Monitoring whole-body
vibration effects on ultra-class haulers. CIM Bulletin, vol. 97, no 1082, pp 1-4.
Burström, L., Lindberg, L. and Lindgren, T., 2006. Cabin attendants’ exposure to
vibration and shocks during landing. Journal of Sound and Vibration, vol. 298, pp.
601–605.
Chen, H.C., Chen, W.C., Liu, Y.P, Chen, C.Y. and Pan, Y.T., 2009. Whole-body
vibration exposure experienced by motorcycle riders – An evaluation according
to ISO 2631-1 and ISO 2631-5 standards. International Journal of Industrial
Ergonomics, vol. 39, pp. 708-718.
Cooperrider, N.K. and Gordon, J.J., 2008. Shock and impact levels on North
American locomotives. Journal of Sound and Vibration, vol. 318, pp. 809–819.

102
EEC (2002) Directive 2002/44/EC of the European parliament and the Council of
25 June 2002 on the minimum health and safety requirements regarding the
exposure of workers to the risks arising from physical agents (vibration)
(sixteenth individual Directive within the meaning of Article 16(1) of Directive
89/391/EEC).
Eger, T., Stevenson, J., Boileau, P.E., Salmoni, A., and VibRG., 2008. Prediction
of health risks associated with load haul dump mining vehicles; Part 1-Analysis of
whole-body vibration exposure using ISO 2631-1 and ISO 2631-5 standards.
International Journal of Industrial Ergonomics, vol. 38, pp. 726-738.
Eger, T., Grenier, S., Smets, M. and VibRG., 2005. Whole-body vibration
exposure experienced during the operation of small and large load haul dump
vehicles. Association of Canadian Ergonomics Conference Proceedings, Halifax,
NS.
Fritz, M., Fischer, S. and Brode, P., 2005. Vibration induced low backdisorders -
comparison of the vibration evaluation according to ISO 2631 with a force-related
evaluation. Applied Ergonomics, vol. 36, pp. 481–488.
Goglia, V. and Grbac, I., 2005. Whole-body vibration transmitted to the framesaw
operator. Applied Ergonomics, vol. 36, pp. 43–48.
Griffin, M.J., 1990. Handbook of human vibration. Academic Press.
Griffin, M.J., 1998. A comparison of standardized methods for predicting the
hazards of whole-body vibration and repeated shocks. Journal of Sound and
Vibration, vol. 215, no. 4, pp. 772-803.

103
Heyns, P.S., 2007. Vibration. Chapter 17: MHSC Handbook on mine occupational
hygiene measurements. Editors: Stanton D.W., Kielblock, J. Schoeman, J.J. &
Johnston, R.W. pp. 203-212.
Hiemenz, G. and Wereley, N., 2007. Adaptive semi-active magnetorheological
seat suspension for the expeditionary fighting vehicle. 78th Shock and Vibration
Symposium, Philadelphia, PA.
Hoy, J., Mubarak, N., Nelson, S., de Landas, M.S., Magnusson, M., Okunribido,
O. and Pope, M., 2005. Whole-body vibration and posture as risk factors for low
back pain among forklift truck drivers. Journal of Sound and Vibration, vol. 284,
pp. 933–946.
ISO 2631-1., 1997. Mechanical vibration and shock – Evaluation of human
exposure to whole-body vibration.
ISO 2631-5., 2004. Mechanical vibration and shock – Evaluation of human
exposure to whole-body vibration.
ISO 5349-1., 2001. Mechanical vibration – Measurement and evaluation of
human exposure to hand-transmitted vibration.
Johanning, E., Fischer, S., Christ, E., Göres, B. and Luhrman, R., 2006. Railroad
locomotive whole-body vibration, shock and seat ergonomics. Proceedings of the
first American Conference on Human Vibration June 5-7, 2006, Morgantown
West Virginia, USA.
Johanning E., Fischer S., Christ E., Göres B. and Landsbergis P., 2002. Whole-
body vibration exposure study in u.s. railroad locomotives—an ergonomic risk
assessment. AIHA Journal, vol. 63, pp. 439–446.

104
Khorshid, E., Alkalby, F. and Kamal, H., 2007. Measurement of whole-body
vibration exposure from speed control humps. Journal of Sound and Vibration,
vol. 304, no. 3-5, pp. 640–659.
Kumar, S., 2004. Vibration in operating heavy haul trucks in overburden mining.
Applied Ergonomics, vol. 35, pp. 509–520.
Lewis, C. H. and Griffin, M.J., 1998. A comparison of evaluations and
assessments obtained using alternative standards for predicting the hazards of
whole-body vibration and repeated shocks. Journal of Sound and Vibration, vol.
215, no. 4, pp. 804-815.
Li, F., 2007. Constrained multi-body dynamics method to study musculoskeletal
disorders due to human vibration, PhD Thesis, Department of Mechanical,
Industrial, and Nuclear Engineering, University of Cincinnati.
Mandal, B.B., Chatterjee, D., Kulkarni, N.P., Zade, P. D., Vanerkar, A.P.,
Narwadiya, S. and Thote, N.R., 2006. Whole-body vibration exposure of heavy
earth moving machinery operators in Indian mines. Indian Mining & Engineering
Journal, vol. 45, no. 9, pp. 29-31.
Mansfield N.J., 2005. Human response to vibration. CRC Press, pp. 145.
Mansfield N.J., Atkinson S. and Payne G. Effect of increasing measurement
duration on accuracy of whole-body vibration field measurements. 38th United
Kingdom Conference on Human Response to Vibration, held at Institute of Naval
Medicine, Alverstoke, Gosport, England, 17-19 September 2003.

105
Marjanen, Y., 2005. Using ISO 2631-5 as an additional whole-body vibration
evaluation method with ISO 2631-1 to include also transient shocks to the
analysis, Twelfth International Congress on Sound and Vibration, Lisbon,
Portugal.
Mdlazi L., 2008. Assessment of whole-body vibration exposure in Anglo
American (Preliminary measurements). ATD Project 512988.
Mine Health and Safety Council (MHSC), 2004. Newsletter, Issue 2, pp. 1-4.
Morrison, J., Robinson, D., Roddan, G., Nicol, J., Springer, M., Martin, S. and
Cameron, B., 1998. Development of a standard for health hazard assessment of
mechanical shock and repeated impact in army vehicles. USAARL Contract
Report No. CR-98-01.
Newell, G.S. and Mansfield, N.J., 2008. Evaluation of reaction time performance
and subjective workload during whole-body vibration exposure while seated in
upright and twisted postures with and without armrests. International Journal of
Industrial Ergonomics, vol. 38, nos. 5-6, pp. 499-508.
Nicol, J.J., 1996. Modeling the dynamic response of the human spine to
mechanical shock and vibration using an artificial neural network. MSc Thesis,
Simon Fraser University, Canada.
Notini, L., Mansfield, N.J. and Newell, G.S., 2006. An assessment of the
contribution of earth moving machine WBV components below 1Hz to ISO 2631-
1 and ISO 2631-5 metrics. 41st UK Conference on Human Response to
Vibration, Farnham, 20th to 22nd September 2006.
106
Paddan, G. S. and Griffin, M. J., 2002. Effect of seating on exposures to whole-
body vibration in vehicles. Journal of Sound and vibration, vol. 253, no. 1, pp.
215-241.
Paddan, G. S. and Griffin, M. J., 2002. Evaluation of whole-body vibration in
vehicles. Journal of Sound and vibration, vol. 253(1), pp. 195-213.
Phillips, J.I., Heyns, P.S. and Nelson, G., 2007. A comparative study of noise and
vibration emitted by rock drills used in South African mines. Annals of Occupational
Hygiene, vol. 51, no. 3, pp. 305-310.
Rampal, K.G., Gopal, K. and Nizam, J.M., 2006. Developing regulations for
occupational exposures to health hazards in Malaysia. Regulatory Toxicology
and Pharmacology, vol. 46, pp. 131–135.
Rehn, B., Nilsson, T., Olofsson, B. and Lundström, R., 2005. Whole-body
vibration exposure and non-neutral neck postures during occupational use of all-
terrain vehicles. Ann. occup. Hyg., vol. 49, no. 3, pp. 267–275.
Rodean, S. and Arghir, M., 2007. Study about the human body response under
the vertical vibrations action into a vehicle. Annals of DAAAM & Proceedings of
the 18th International DAAAM Symposium, 24th -27th October, 2007, Vienna,
Austria.
Salmoni, A.W., Cann, A.P., Gillin, E.K. and Eger, T.R., 2008. Case studies in
whole-body vibration assessment in transportation industry–Challenges in the
field. International Journal of Industrial Ergonomics, vol. 38, pp. 783-791.

107
Santos, B.R., Lariviere, C., Delisle, A., Plamondon, A., Boileau, P.E., Imbeau, D.
and VibRG., 2008. A laboratory study to quantify the biomechanical responses to
whole-body vibration: The influence on balance, reflex response, muscular
activity and fatigue. International Journal of Industrial Ergonomics, vol. 38, pp.
626–639.
Scarlett, A.J., Price, J.S. and Stayner, R.M., 2007. Whole-body vibration:
Evaluation of emission and exposure levels arising from agricultural tractors.
Journal of Terramechanics, vol. 44, pp. 65–73.
Sese´, A., Palmer, A.L., Cajal, B., Montano, J.J., Jimenez, R. and Llorens, N.,
2000. Occupational safety and health in Spain. Journal of Safety Research, vol.
33, pp. 511– 525.
Teschke K., Trask C., Village J., Chow Y., Cooper J., Davies H., Demers P.,
Hodgson M., Hong K., Hurrell C., Johnson P., Knott M., Luong N., Morrison J.,
Wright G., Xu F. and Koehoorn M., 2008. Back injuries in heavy industries: Risk
factor exposure assessment. Final Report to WorkSafeBC.
Tiemessen, I.J., Hulshof, C.T.J. and Frings-Dresen, M.H.W., 2007. An overview
of strategies to reduce whole-body vibration exposure on drivers: A systematic
review. International Journal of Industrial Ergonomics, vol. 37 pp. 245–256.
Van Niekerk, J.L., Heyns, P.S., and Heyns, M., 2000. Human vibration levels in
the South African mining industry. The Journal of the South African Institute of
Mining and Metallurgy, July/August, pp. 235-242.
Vibration Injury Network, 2001. Guidelines for hand-transmitted vibration health
surveillance. Appendix H1A to Final Report. EC Biomed II concerted action
BMH4-CT98-3251.

108
Whole-body vibration guide to good practice v6.7g English.
http://www.humanvibration.com/EU/VIBGUIDE.htm. Accessed August 10, 2009.
Yränheikki, E. and Savolainen, H., 2000. Occupational safety and health in
Finland. Journal of Safety Research, vol. 31, No. 4, pp. 177–183.
Zeng, S.X., Tam, V.W.Y. and Tam, C.M., 2008. Towards occupational health and
safety systems in the construction industry of China, Safety Science, vol. 46 pp.
1155-1168.

109
Appendices
Appendices A-J:

110
Appendix A Weighted acceleration for x, y & z according to ISO 2631-1 (1997) A1
A2
A3

111
Weighted acceleration for x, y & z according to ISO 2631-1 (1997) A4
A5
A6

112
Weighted acceleration for x, y & z according to ISO 2631-1 (1997)
A7
A8
A9
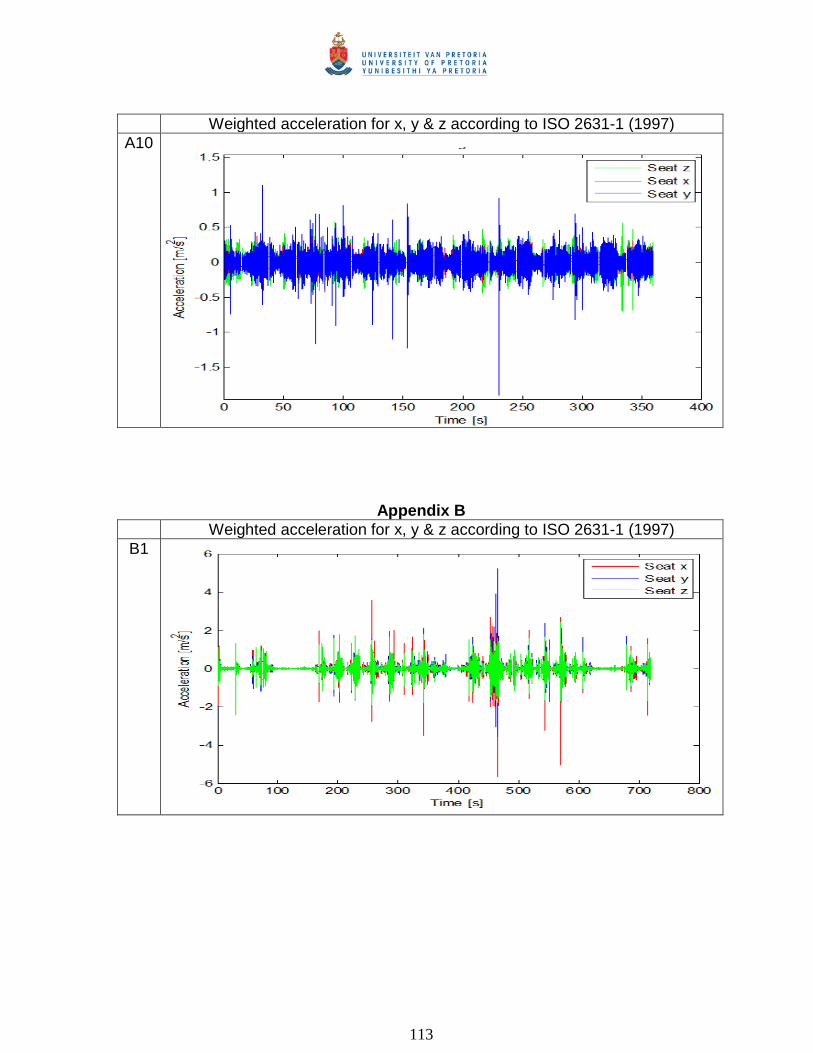
113
Weighted acceleration for x, y & z according to ISO 2631-1 (1997)
A10
Appendix B Weighted acceleration for x, y & z according to ISO 2631-1 (1997)
B1

114
Weighted acceleration for x, y & z according to ISO 2631-1 (1997) B2
B3
B4

115
Weighted acceleration for x, y & z according to ISO 2631-1 (1997) B5
B6
B7

116
Appendix C Weighted acceleration for x, y & z according to ISO 2631-1 (1997)
C1
C2
C3

117
Appendix D Weighted acceleration for x, y & z according to ISO 2631-1 (1997)
D1
D2
D3

118
Weighted acceleration for x, y & z according to ISO 2631-1 (1997) D4
Appendix E Weighted acceleration for x, y & z according to ISO 2631-1 (1997)
E1

119
Weighted acceleration for x, y & z according to ISO 2631-1 (1997) E2
Appendix F Weighted acceleration for x, y & z according to ISO 2631-1 (1997)
F1

120
Weighted acceleration for x, y & z according to ISO 2631-1 (1997) F2
F3

121
Appendix G Weighted acceleration for x, y & z according to ISO 2631-1 (1997)
G1
G2
G3

122
Appendix H
Weighted acceleration for x, y & z according to ISO 2631-1 (1997) H1
Appendix I Weighted acceleration for x, y & z according to ISO 2631-1 (1997)
I1

123
Appendix J: Whole-body vibration questionnaire Basic data: Date: Time: Mine: Section: Section supervisor’s name: Phone no.: Operator’s information: Name: Employer: Mass: Height: Machine information: Machine make and type: Model: P.I.N: Tyre size: Tyre pressure: Track length: Track height: Suspension: Seat suspension: WBV instrumentation (description): Seat: Tri-axial seat pad accelerometers S/N: Floor: ICP industrial accelerometers S/N: Svantek: Version 958 S/N: 15112 Site operation(description): Operational comments: Operator questionnaire: How bad are the following factors in your place of work? Key: 1-No problem 2- Acceptable/Fine; 3- Big problem Temperature How warm or cold is it at work? If hot, then you will sweat a lot. 1 2 3 Vibration Vibration is shaking that you feel when you touch the
equipment or sit on it. 1 2 3
Which equipment do you use most of the time? At what time do you usually get on the equipment? At what time do you usually get off the equipment?
124
How long is your break in total? Did you suffer from regular back pain? (Yes/No) If Yes, How long does the back pain last? What is the primary body orientation? (Sitting, standing, lying etc.)
What material is under the point of contact? (Steel, foam, etc.) Seat Make:
Seat Model No.:
What percentage of working time is the person in actual contact with vibrating equipment?(Time in Actual Contact/Total work time)
Photographs:
Description Time Taken Reference Front view with number on vehicle Side view of whole vehicle Side view of whole vehicle (background) Side view of whole vehicle with Operator Calibration Date:
Measurement Details:
Time: Start Time: End (Stop) Data File WAV File RMS Time (Hrs: Mins)
Time (Hrs: Mins)
Activity: comments