THE SHOCK AND VIBRATION BULLETIN · Bulletin 45 (Part 1) THE SHOCK AND VIBRATION BULLETIN OCTOBER...
81
Bulletin 45 (Part 1) THE SHOCK AND VIBRATION BULLETIN Part 1. Summaries of Presented Papers OCTOBER 1974 A Publication of THE SHOCK AND VIBRATION INFORMATION CENTER Naval Research Laboratory, Washington, D.C. Office of The Director of Defense Research and Engineering I his doctiment has been approved for public releasc and salc its distiihmo, i, unlinwicd
Transcript of THE SHOCK AND VIBRATION BULLETIN · Bulletin 45 (Part 1) THE SHOCK AND VIBRATION BULLETIN OCTOBER...

Bulletin 45(Part 1)
THESHOCK AND VIBRATION
BULLETIN
Part 1.Summaries of Presented Papers
OCTOBER 1974
A Publication ofTHE SHOCK AND VIBRATION
INFORMATION CENTERNaval Research Laboratory, Washington, D.C.
Office ofThe Director of Defense
Research and Engineering
I his doctiment has been approved for public releasc and salc its distiihmo, i, unlinwicd
SYMPOSIUM MANAGEMENT
THE SHOCK AND VIBRATION INFORMATION CENTER
Henry C. Pusey, DirectorEdward H. Schell, CoordinatorRudolph H. Volin, Coordinator
Bulletin Production
Graphic Arts Branch, Technical Information Division,Naval Research Laboratory

Bulletin 45(Part 1)
THESHOCK AND VIBRATION
BULLETIN
OCTOBER 1974
A Publication ofTHE SHOCK AND VIBRATION
INFORMATION CENTERNaval Research Laboratory, Washington, D.C.
45th Shock and Vibration SymposiumConvention Center
Dayton, Ohio22-25 October 1974
HostsAir Force Flight Dynamics Laboratory. Air Force
Materials Laboratory. and Aeronautical Systems Division,Air Force Systems Command. Wright-Patterson AFB. Ohio A
Office ofThe Director of Defense
Research and Engineering

/ /
FOREWORD N ,
This part of the Shock and Vibration Bulletin is published prior to the meeting.Actual papers will be published in later parts.
Several reasons exist for so doing:
(1) The summaries in this part are delivered to registrants in advance of the meetingto enable them to choose more wisely the papers which they wish to hear.
(2) It is our intent that these advance summaries be used to formulate pertinentquestions and comments to be posed during the question and answer sessions at themeeting.
(3) Some of the papers to be presented are not offered for publication in thebulletin.
(4) Papers covering a very useful piece of work may fail to survive the refereeingprocedure for reasons unrelated to the work itself.
In the latter two cases, the summaries provide information not otherwise available,and if one is interested in further details, he may contact the authors. Thus, it becomesimportant to publish this information where it may be referenced in other papers andbecomes a part of the useful body of literature.
In particular, we request you to use these summaries to prepare questions for thediscussion periods following the paper presentation. Nothing adds to a symposium quiteas much as an interesting and informative question and answer session. In controversialareas, it is quite useful to have other views presented. We encourage you to prepare foran active participation in the discussions. Rest assured that your questions and commentswill be appreciated.
iii

CONTENTS:
Part I
Impact,
EXPLOSIVELY PROPELLED ROTATING PLATES FOR OBLIQUEIMPACT EXPERIMENTS ........................................... 1
F. H. Mathews
IMPACT TESTING USING A VARIABLE ANGLE ROCKET LAUNCHER ..........H. W. Nunez
EVALUATION OF THE SHOCK PULSE TECHNIQUE TO THE UH-1SERIES HELICOPTER ............................................. 2
J. A. George, T. C. Mayer and E. F. Covill
STRUCTURAL RESPONSE MODELING OF A FREE-FALL MINE ATW ATER ENTRY ................................................... 3
R. H. Waser, G. L. Matteson and J. W. Honaker
Packaging and Shipping,
HIGHWAY SHOCK INDEX (SI) PROCEDURE FOR DETERMINING (SI) ......... 5J. H. Grier
THE DYNAMIC ENVIRONMENT ON FOUR-INDUSTRIAL FORKLIFTTR U CK S ..................................................... .... 6
M. B. Gens
A STATISTICALLY BASED PROCEDURE FOR TEMPERATURESENSITIVE DYNAMIC CUSHIONING CURVE DEVELOPMENTAND VALIDATION ............................................... 7
D. McDaniel, R. M. Wyskida and M. R. Wilhelm
A COMPARISON OF PACKAGING CUSHION MATERIAL SHOCKPERFORMANCE EVALUATION TECHNIQUES ......................... 8
E. A. Church and D. E. Young
Aerospace Vehicles
AN ANALYTICAL/EXPERIMENTAL DETERMINATION OF TRANSPORTERLOADS ON THE VIKING SPACECRAFT .............................. 9
G. Kachadourian
iv

DETERMINATION OF PROPELLANT EFFECTIVE MASS PROPERTIESUSING MODAL TEST DATA ........................................ 9
J. C. Chen and J. A. Garba
UNIQUE FLIGHT INSTRUMENTATION/DATA REDUCTION TECHNIQUESEMPLOYED ON THE VIKING DYNAMIC SIMULATOR .................. 10
F. D. Day III, B. K. Wada
ANALYTICAL PREDICTION AND CORRELATION FOR THE ORBITERDURING THE VIKING SPACECRAFT SINUSOIDAL VIBRATIONT E ST ............................................................ 12
F. D. Day III, J. A. Garba and G. R. Brownlee
FAIL SAFE VIBRATION TESTING OF THE VIKING 1975DEVELOPMENTAL SPACECRAFT ................................... 14
J. W. Fortenberry, W. P. Rader
' MODALAB-A NEW SYSTEM FOR STRUCTURAL DYNAMIC TESTING,I, BASIC CONCEPTS AND HARDWARE ............................... 15
S. Smith, R. C. Stroud, G. A. Hamma, W. L. Hallaver, R. C. Yee
MODALAB-A NEW SYSTEM FOR STRUCTURAL DYNAMIC TESTING,II, ANALYSIS CONCEPTS AND PROCEDURES ......................... 17
R. C. Stroud, S. Smith, W. L. Hallaver, G. A. Hamma, R. C. Yee
A METHOD FOR DETERMINING TACTICAL MISSILE JOINT COMPLIANCESFROM DYNAMIC TEST DATA ...................................... 19
J. G. Maloney and M. T. Shelton
Blast and Impulsive Loading
DESIGN STUDY OF A NEW BRL EXPERIMENTAL BLAST CHAMBER ......... 21P. A. Cox and W. E. Baker
X-RAY SIMULATION WITH LIGHT-INITIATED EXPLOSIVE ................. 21R. A. Benham and F. H. Mathews
STRUCTURAL DYNAMIC RESPONSE TO HEIGHT-OF-BURST AIRBLAST LOADING ................................................. 22
H. F. Korman, N. Lipner and J. S. Chiu
RESPONSE OF FLAT PLATES SUBJECTED TO MILD IMPULSIVE LOADS ...... 23C. A. Ross, W. S. Strickland
A MATRIX STRUCTURAL DYNAMIC MODEL OF PARACHUTE THERMALCOVER EJECTION BY PYROTECHNIC DEVICES ....................... 24
A. E. Barniskis and R. A. Romanzi
EFFECT OF SHOCK SPECTRUM-SIMILAR SHOCKS ON A LARGE COLLECTIONOF COMPLEX STRUCTURES ....................................... 26
L M. Butzel, and H. C. Merchant
v

STRUCTUREBORNE GUN BLAST SHOCK TEST USING AN ELECTRO-HYDRAULIC VIBRATION EXCITER .................................. 27
R. L. Woodfin, and N. D. Nelson
MEASUREMENTS OF THE DYNAMIC IMPACT LOADING OF CONCRETE ...... 29R. Griner, R. L. Sierakowski, C. A. Ross
Vibro-Acoustics
DYNAMIC STRAIN MEASUREMENT TECHNIQUES AT ELEVATEDTEMPERATURES .................................................. 31
R. C. Taylor
AN ACTIVE LINEAR BRIDGE FOR STRAIN MEASUREMENT ................ 32P. T. Jaquay
LABORATORY VIBROACOUSTIC PROFILE TESTING FOR IMPROVEDAVIONICS EQUIPMENT RELIABILITY IN A GROUND LAUNCHEDR PV -A ........................................................... 33
A. Burkhard and R. Scott
ANALYSIS AND FLIGHT TEST CORRELATION OF VIBROACOUSTICENVIRONMENTS ON A REMOTELY PILOTED VEHICLE ................ 31
S. Zurnaciyan and P. Bockemohle
AEROACOUSTIC ENVIRONMENT OF RECTANGULAR CAVITIES WITHLENGTH TO DEPTH RATIOS IN THE RANGE OF FOUR TOSEV EN .......................................................... 36
L. L. Shaw, Jr., and D. L. Smith
ACOUSTICALLY INDUCED VIBRATION PREDICTION IN TRANSPORTA IR CR A FT ....................................................... 37
H. W. Bartel
SIMPLIFIED TECHNIQUES FOR PREDICTING VIBRO-ACOUSTICENVIRONMENTS ................................................. 38
K. Y. Chang and G. C. Kao
RESPONSE OF SEMI-PERIODICALLY STIFFENED PANELS TO CONVECTEDRANDOM PRESSURE FIELDS ....................................... 39
G. S. Gupta
Isolation and Damping.
MATRIX METHODS FOR THE ANALYSIS OF ELASTICALLY SUPPORTEDISOLATION SYSTEMS ............................................. 41
G. L. Fox
IMPACT ON COMPLEX MECHANICAL STRUCTURES ....................... 42S. F. Jan, and E. A. Ripperger
vi
ENERGY ABSORPTION AND PHASE EFFECTS IN SHOCK EXCITEDCOUPLED SYSTEMS ............................................... 43
C. T. Morrow
USE OF RUBBER WEDGES TO REDUCE FUSELAGE STRUCTUREACOUSTIC RADIATION ............................................ 44
L. M. Butzel
RESPONSE OF THICK STRUCTURES DAMPED BY VISCOELASTICMATERIAL WITH APPLICATION TO LAYERED BEAMS ANDPLA TES ......................................................... 44
M. Lalanne, M. Paulard, P. Trompette
CONTROLLING THE DYNAMIC RESPONSE LEVELS OF JET ENGINECOM PONENTS .................................................... 45
C. M. Cannon and D. I. G. Jones
INVESTIGATION OF THE EFFECT OF DAMPING TREATMENTS ON THERESPONSE OF HEATED FUSELAGE STRUCTURE ...................... 46
M. L. Drake, and J. P. Henderson
AN ALTERNATIVE SYSTEM FOR MEASURING COMPLEX DYNAMICMODULI OF DAMPING MATERIALS ................................. 47
D. I. G. Jones
Classified Session
COMPARISON OF EXPERIMENTAL AND ANALYTICAL LARGEDEFORMATION SHELL STRAINS ON A MISSILE SUBJECTEDTO AN ASYMMETRIC BLAST LOADING .............................. 49
L. J. Mente
THE SHOCK ENVIRONMENT ASSOCIATED WITH THE AIRCRAFTDELIVERY OF A NAVY MINE ...................................... 50
H. M. Cole
ELASTIC RESPONSE OF SUBMARINES TO END-ON NUCLEAR ATTACKS ...... 51T. A. Giacofci
PLASTIC DESIGN ANALYSIS OF SHIPBOARD EQUIPMENT SUBJECTEDTO SHOCK MOTIONS .............................................. 53
L. T. Butt
HIGH PERFORMANCE VIBRATION ISOLATION SYSTEM FOR THE DD963G EA R S .......................................................... 54
P. C. Warner, and D. V. Wr'ght
DESIGN AND MEASUREMENT OF A HIGH IMPEDANCE FOUNDATIONTO 20 KHz AND USE OF DATA IN CORRECTING NOISEM EASUREMENTS ................................................. 56J. R. Hupton
vii

THE DEVELOPMENT OF A WATER PARTICLE VELOCITY METER ........... 57J. D. Gordon
MECHANICAL DESIGN, ANALYSIS, AND TEST OF THE STANDARDELECTRONICS CABINET AND INTEGRATED MULTIFUNCTIONCONSOLE FOR AN/BQQ-5 SONAR SET ............................... 58
J. M. Menichello
Special Problems
EXTENSION OF CONTROL TECHNIQUES FOR DIGITAL CONTROL OFRANDOM VIBRATION TESTS ....................................... 61
J. D. Tebbs and D. 0. Smallwood
EXPERIMENTAL DETERMINATION OF MULTIDIRECTIONAL MOBILITYDATA FOR BEAM S ............................................... 62
D. J. Ewins and P. T. Gleeson
ANALYTICAL EXTRAPOLATION OF EXPERIMENTALLY DETERMINEDMODES OF VIBRATION ............................................ 63
Dr. S. R. Ibrahim
VIBRATION-INDUCED DOPPLER EFFECTS ON AN AIRBORNE SHFCOMMUNICATIONS SYSTEM ....................................... 64
J. Pearson and R. E. Thaller
FATIGUE DAMAGE EQUIVALENCE OF REAL AND SIMULATEDVIBRATIONAL ENVIRONMENTS .................................... 66
D. D. Kana
SEISMIC SIMULATOR FOR SILO CONSTRAINED MISSILE GUIDANCEPLA TFO R M ...................................................... 67
R. Felker
VIKING DYNAMIC SIMULATOR-VIBRATION TESTING ANDANALYSIS MODELING ............................................ 68
A. F. Leondis
AN EVALUATION OF SHOCK RESPONSE TECHNIQUES FOR A SHIPBOARDG AS TURBIN E ................................................... 69
J. R. Manceau and E. Nelson
EARTHQUAKE RESPONSE OF COMMUNICATIONS EQUIPMENT INSM ALL BUILDINGS ............................................... 70
F. X. Prendergast and N. J. Decapua
SEISMIC ANALYSIS OF MOTORS FOR NUCLEAR POWER PLANTS ........... 71L. J. Taylor and N. M. Isada
A NEW STUDY OF THE HARMONIC OSCILLATOR WITH NON LINEARD A M PIN G ....................................................... 72
R. A. Eyman
viii

IMPACT
EXPLOSIVELY PROPELLED ROTATING PLATESFOR OBLIQUE IMPACT EXPERIMENTS
F. H. Mathews
Sandia Laboratories, Albuquerque, New Mexico
Detonating solid explosive is employed to accelerate massive plates to high velocity. Theplate is launched intact with a low rotational velocity. The device being studied is positioned
along the flight path, allowing distance for plate rotation before impact. Thus, any angle
between the plate surface and plate velocity vector can be obtained. Either plastic or metal
plates are employed to study impact response against either hard or soft materials.
This technique is employed as an impact simulator to study the performance of full-
scale fuzing hardware at velocities from 1500 to 3500 meters/second. Experiments are de-
scribed in which 160 kg of explosive are employed to propel 15 kg plates achieving impact at
angles ranging from near normal to oblique conditions. Procedures for explosive system
design and studies of experiment repeatability are described. Plate thickness requirements
are estimated from normal shock relationships. Carefully designed experimental arrange-
ments permit recovery of pulse X-ray imprtct photographs.
It is concluded that explosively accelerated rotating plates provide an accurately con-
trolled and relatively inexpensive impact simulator for fuzing studies at high velocity.
IMPACT TESTING USING A VARIABLE ANGLEROCKET LAUNCHER
H. W. Nunez
Sandia LaboratoriesAlbuquerque, New Mexico
One of the several facilities at Sandia Laboratories for environmental shock testing is
the so-called Rocket Launcher Facility. This is probably a misnomer because rockets arenot actually launched at the facility, but instead are used to propel a sled and test unit
along a guide rail until a predetermined velocity is reached, at which time the test unit is sepa-rated from the sled and allowed to fly free to impact with a target. The relative impactangle between the line of flight and the target face can be varied from 900 to near 00.
The main feature of the facility is the guide rail. This guide rail consists of a 16-inch
deep wide-flange beam, approximately 73-feet long. One end of the beam is welded at
right angles to the flange of an 8-foot long similar wide-flanged shape. The ends of this
-- ' _ , . . ... . ... . ,, li i I III . i

short beam are attached to two upright frame supports by means of hinges. The free endof the long guide rail can then be elevated by a cable passing over pulleys between up-right columns on either side of the rail.
The sled which is propelled along the beam is a welded steel structure designed to rideon the lower flange of the guide rail. The test unit is suspended by special hangers belowthe bottom of the sled. Propulsion is usually provided by 5-inch diameter HVAR solidpropellant rocket motors. The sled has provisions for mounting up to three of these motorson each side of tile center web and between the upper and lower flanges of the guide rail.These motors have a nominal burn time of 1.1 seconds and an impulse of 5200 lb-sec.
A computer program is used to determine the length of travel, velocity and accelerationbased upon weight of the test unit and the number of motors used. The maximum testunit weight is 2500 lbs. and six HVAR motors can propel this weight to a free flight ve-locity of approximately 200 feet per second. Similarly, a 50-lb. test unit can be propelledto approximately 400 feet per second.
In use, the length of travel is adjusted so that when the desired velocity is reached thesled contacts a honeycomb braking material on the guide rail. When this contact is madethe sled begins to slow down and the test unit separates from it and continues in freeflight to impact. The impact target can be varied to suit the test requirements, but nor-mally concrete slabs or dirt banks are used.
Due to the relatively short travel distance (80-100 feet) of the test unit, it is possible tohardwire between transducers in the unit and a bunkered conditioning and recording sta-tion several hundred feet away. High speed motion picture cameras are also used on nearlyall tests to record impact motions.
EVALUATION OF THE SHOCK PULSE TECHNIQUETO THE UH-1 SERIES HELICOPTER
John A. George, Timothy C. Mayer, and Edward F. CovillParks College of St. Louis University, Cahokia, Illinos
The U.S. Army Aviation Systems Command (AVSCOM) has an on-going program todevelop a system which will automatically accomplish inspection, diagnostic and prog-nostic maintenance funtions on related subsystems of the UH-1 helicopter. Past ef-forts have included the collection of vibration data with a subsequent analysis of the re-sulting power spectral densities to determine the condition of the helicopter power train.Another approach, particularly in determining bearing conditions, is to use shock pulse tech-niques. An evalution of this technique to the UH-1 series helicopter was made by ParksCollege under contract to AVSCOM. Initially, the effort concentrated primarily on thehanger bearings of the tail rotor assembly and the 420 gearbox on operational helicoptersof a Reserve Army Aviation Unit. Subsequently, data was collected from the AIDAPShelicopters at Fort Rucker with implants in the 420 gearbox. A standard, off-the-shelf,SKF Industries MEPA-10A Shock Pulse Meter was employed to construct shock emmissionenvelopes of shock rate versus shock level.
2
In constructing the shock emission envelope, the first point plotted on the ordinateaxis is the rate level at a value level of one. A threshold varying dial on the MEPA-10Ameter housing ranges from a level of one to ten thousand in a logarithmic scale. As thethreshold is increased, successive rates were plotted until the wave crossed the abscissa axis.The value at the intercept becomes the highest potentiometer level at which at least oneshock pulse per second can be measured. The curves drawn were then compared to thegeneral curve forms of different types of damage and, coupled with the rate and levelvalues, an assessment of bearing condition was made. Selected hanger bearings and 42 c
gearboxes were removed for teardown analysis.
The hanger bearings had shock rates ranging from 55-340 pulses per second po-tentiometer levels varying from 45 to 6000 units. Those hanger bearings which weredeemed to have excessive levels were removed and new bearings installed. The range oflevels of the new bearings was markedly reduced from 50- 100 units. Teardown analysisshowed damage, primarily pitting and corrosion, to vary from slight to severe. The datahas been summarized in a single shock emission envelope which can be used to separatehanger bearings of normal wear or the onset of damage from those with severe damage.
The tests conducted at Fort Rucker were on 42' gear boxes of known condition.Data was collected on good gear boxes and also from those implanted with damagedbearing elements. Of particular interest was the observation of progressive damage whilea test was in progress. The shape of the shock emission curve changed continuously overa period of minutes in both rate and shock level. The shock level stabilized at a factor of10 higher than the initial readings. Subsequent teardown analysis verified that a ball in theduplex bearing on the input quill had developed a spall possibly from metal fatigue. A newspall was also developing on the outer race.
The use of shock pulse techniques has proven successful in the limited applications todate. Further work is in progress on the other elements of the UH-1 power train.
STRUCTURAL RESPONSE MODELING OF AFREE-FALL MINE AT WATER ENTRY
R. H. Waser, G. L. Matteson, and J. W. HonakerNOL, White Oak, Silver Spring, Maryland
The free-fall mine concept applies to aircraft planting of underwater mines without airretardation devices such as parachutes. The planting of a minefield with retarded mineshas certain advantages over conventional retarded mines. These advantages include higherplacement accuracy and less possibility of the enemy being able to observe and plot theplacement location. The high speed at water entry of the free-fall mine, however, imposessevere structural loading on the mine at water impact as well as generating bottom burialproblems. This study was directed toward defining the water-entry pressures and impulse,the structural response of the mine, the failure modes, and the bottom burial character-istics.
3

A test vehicle was designed by the Naval Ordnance Laboratory to test the free-falldelivery concept. This vehicle was a 21-inch-diameter, 0.5-inch-thick right circular steelcylinder, 113 inches long, with a 1.5-inch-thick flat steel plate 1, _ie and a blunt after endwith four fins. It was ballasted with concrete to a weight of 2,060 pounds. Six of theseunits were built in full-scale size and test dropped. Three of them contained copper balland mechanical oscillator peak shock recorders. Structural deformation in the form ofdishing of the nose due to hydrodynamic pressures and dishing of the tail due to inertialforces occurred at entry velocities of 500 feet per second and above at a nominal verticalentry angle. Bottom impact shocks were considerably lower than water-entry shocks andburial was not a problem.
It was decided to conduct subscale model testing of the water-entry phase to gain abetter understanding of the hydrodynamic forces and resulting vehicle behavior, and alsoto develop and validate modeling techniques as a less expensive means than a full-scaleprototype testing to obtain necessary design data for water-entry vehicles. Since prototypedata were available for the Free-Fall Mine Test Vehicle, this design was modeled geometri-cally to 0.231 scale using materials the same as those of the prototype. The model wassimilarly instumented with copper ball and mechanical oscillator peak shock recorders.'rests were made at velocities of 50 to 300 feet per second with 85 and 90 degree water-entry angles. Data from the recorders were highly reproducible.
Peak shock data from the model and prototype were compared using modified Froudenumber scaling. Good agreement resulted.
The mine design was programmed into the NASTRAN structural response computer code.A water-entry pressure pulse was inferred for the model so the computer-calculated peakshock values resulting from the input of that pulse matched the experimental data. Scalingof this water-entry pulse to prototype values and inputing it to the computer resulted inpeak shock values in good agreement with prototype data. This agreement supports con-fidence in the accuracy of the computer modeling program which includes outputs ofstress, frequency, and acceleration.
As a result of the tests made in this program, it is felt that subscale models can beused to accurately simulate the structural response of vehicles at water entry and thatsubscale models can also be used to generate data in the form of the pressure pulses ex-perienced by bodies for input to structural response computer programs.
4

PACKAGING AND SHIPPING
HIGHWAY SHOCK INDEX (SI) PROCEDURE FOR DETERMINING (SI)
J. H. GrierMTMTSTEA, Newport News, Virginia
Representatives of the United States Army, Navy, Air Force, and Marine Corpsagreed that it should be possible to establish shock indices which would be representativeof the cargo environment for the various transport modes. The Services formed a steer-ing Committee to initiate and guide the development of a highway shock index. The high-way mode was selected because of the relative ease in controlling the environment andrelated variables. Exploratory work was accomplished on a contractual basis and reportedon in papers which were presented at the shock and vibration symposium and annual meet-ing of the Highway Research Board in 1972. The final work, which consisted of a seriesof instrumented field tests on three typical highway cargo vehicles was conducted byMTMTSTEA Engineers at Fort Eustis, Virginia. This work resulted in the developmentof a simple, practical procedure for determing the shock index of a cargo vehicle, and ispresented in the paper "Highway Shock Index (SI), Procedure for Determining (SI)."
The purpose of the Highway Shock Index (SI) is to provide a means for selectinghighway cargo vehicles on the basis of their "rough" riding characteristics. The selectionis based not on the vehicle configuration but on the combined payload spring rate "K" ofthe springs and tires on an axle. SI makes it possible to select a relatively "soft" ridingvehicle for fragile cargo and thus minimize the possibility of damage to the cargo. Theshock index rating system applies to restrained cargo only.
The shock index for a cargo vehicle should be representative of the roughest ridearea on the truck cargo bed. Previous tests have shown, and recent tests have confirmedthat for normal operating conditions the roughest ride on a truck cargo bed is found overthe rear axle for a two axle cargo truck; or, for a truck tractor, semitrailer combinationeither near the rear axle of the trailer or over the fifth wheel of the truck tractor depend-ing on which axle has the higher payload spring rate.
Under normal operating conditions maximum shocks on the cargo bed will occur inthe vertical direction; and, based on extensive tests by MTMTSTEA and other organiza-tions a maximum shock of 10g is considered reasonable for a very rough road surface.Consequently, the Highway Shock Index is based on a scale of 0 to 10g's; the numericalvalues of shock index vary from 5 to 0 with 5 corresponding to Og's, representing thesoftest "ride." •
The dead weight of the vehicle is not involved in the determination of shock index-the unloaded weight of the vehicle is already in place and therefore is not involved in thedetermination of the payload spring rate. The tests have shown that of the three majorvariables percent maximum payload, tire pressure and speed, percent maximum payloadhas a major effect on shock index whereas tire pressure in the practical range and speedcause relatively minor changes.
5

Since percent maximum payload has the most effect on the "ride" on the truckcargo bed, a graph relating the payload axle spring rate, axle payload and shock index wasdeveloped. In order to develop the graph tests were conducted on a range of cargo vehi-cles. The payload capability of these vehicles varied from 13,000 pounds on a two-axletruck; to 24,000 pounds on a two-axle truck tractor, single axle trailer combination; to40,000 pounds on a three-axle truck tractor, two-axle semitrailer combination.
The vehicles were instrumented to measure shock on the cargo bed and were drivenover fixed, unyielding bumps at various speeds at different tire pressures, and with differ-ent payloads.
The repeatability of data measurements recorded on the test course was satisfactoryin spite of the many variables that affect a dynamic test of this type. Approximatelyeighty percent of all data recorded over the axles of the trucks was used in the prepara-tion of the graph and table which can be used to determine the shock index of a highwaycargo vehicle.
THE DYNAMIC ENVIRONMENT OF FOUR-INDUSTRIAL FORKLIFT TRUCKS
Mark B. GensSandia Laboratories, Albuquerque, New Mexico
Th.., forklift truck is in general use throughout the industrial complex as a means ofshort, in-plant transport; but little work has been done to determine the frequency andamplitude of accelerations to which cargo is subjected during the virtually inevitable tripson the forks.
The purpc ;e of this study was to determine the dynamic input to cargo during car-riage on various types (,f forklift trucks. Among the variations examined were trucks withcapacities of 2000 pounds, 3000 pounds, 4000 pounds and 7000 pounds, trucks withpneumatic and solid tires and trucks powered by gasoline engines and electric motors.
The cargo used was a simulated bomb configured to correspond in size, shape,weight and center of gravity to an existing weapon. The shape was mounted on a cradle-like rack which is used to transport and handle weapons. This configuration was, in turn,picked up by a forklift truck and transported over a prescribed route. Accelerometerswere mounted at the base of the rack near the point of contact with the forks.
It was found that there was little steady-state continuous excitation transmittedthrough the forks to the load. Many discrete excitations were present. Data reduction inthe form of shock response spectra showed responses up to 10g in amplitude below 20Iz and up to 40g at 100 liz.
6

A STATISTICALLY BASED PROCEDURE FOR TEMPERATURE SENSITIVEDYNAMIC CUSHIONING CURVE DEVELOPMENT AND VALIDATION
Don McDanielU. S. Army Missile Command, Huntsville, Alabama
Richard M. Wyskida
The University of Alabama in Huntsville, Huntsville, Alabama
and
Mickey R. WilhelmThe University of Alabama in Huntsville, Huntsville, Alabama
SUMMARY
Foamed thermoplastic materials are particularly attractive for use as lightweight, low-cost, easily fabricated cushioning system in shipping containers. However, foamed materi-als have found limited use in military containers, due primarily to the difficulty the con-tainer designer encounters in attempting to predict the dynamic response of the packageditem when a container is exposed to the rigorz of worldwide distribution. Military con-tainers encounter widely varying temperature extremes in worldwide distribution. How-ever, current design practice utilizing available dynamic cushioning curves completelyignores the effect of temperature, due to the absence of temperature sensitive dynamiccushioning design curves.
In an attempt to develop statistically significant design curves which consider tem-peratures in addition to the classical ambient value (70 0 F), an experiment was designed toinvestigate the change in cushion impact absorption characteristics at specified extremetemperature values of -650 and 160 0 F. The basic concept of the experiment was thepremise that an actual drop test program was required to establish the validity of a tem-perature effect hypothesis. It was highly desirable that any experimental data be acquiredwithin the framework of randomization. Since a reasonable number of drops were re-quired to achieve statistical validity, the physical limitations of the drop test program werescrutinized, and it was found that the factors which affected the results were static stresslevel, material type, material density, material thickness, drop height, and temperature.Consequently, predetermined stress levels were set for each material type, density, anddrop height, since it was a relatively time consuming process to vary the stress level aftereach drop. With the existing restrictions on randomization, a split-split plot experimentaldesign was determined to be most pertinent in testing whether temperature does signifi-cantly affect the performance of cushioning materials.
The material chosen for the initial drop tests was Hercules Minicell, a cross-linked,closed cell, polyethylene foam. This material is a relative newcomer to the containercushioning material market.
Prior to initiating full scale drop testing, a pilot test program was conducted to verifythe adequacy of the experimental design, and to also familiarize the drop equipmentoperators with the test procedures and equipment. A computerized data form was de-veloped which included a randomization scheme for identifying the order of experimen-tation.
7
"'he drop test program included drop heights of 12, 18, 24, and 30 inches. Stresslevels were selected for each drop height based upon the expected location of the de-veloped design curve for the specific characteristics under consideration. Consequently,stress levels are not necessarily common for all drop heights.
The data analysis consisted of: 1) the development of an outlier test based on thevariance associated with the three replications of each experimental condition; 2) thedevelopment of design curves for the various temperatures, drop heights, and materialthicknesses based upon a second order polynomial regression of the logarithm of stressversus deceleration at impact; 3) conducting an analysis of variance for each drop heightto determine the effect of temperature differences.
The developed outlier test identified some data values which were statistically invalid;consequently, these values were not utilized in the development of the design curves.Thirty-six design curves were developed, of which thirty-three exhibited a statistically sig-nificant parabolic shape at the .05 alpha level. The analysis of variance concerning thetemperature effect hypothesis was significant for all drop heights at the .05 alpha level.
Experimental results clearly indicate that a temperature effect does, in fact, exist,and should be taken into account by the container cushioning system designer. Thus, henow has available the necessary temperature sensitive design curves for Hercules Minicell.
A COMPARISON OF PACKAGING CUSHION MATERIALSHOCK PERFORMANCE EVALUATION TECHNIQUES
E. A. Church and D. E. YoungLansmont Corp.
Lansing, Michigan
For approximately 30 years, packaging cushioning materials have been scientificallyevaluated in order to quantitatively describe their dynamic performance when subjectedto externally applied mechanical shock. In the main, this testing has been done as massimpacting cushion. The American Society for Testing and Materials has adopted a stand-ard for this type of testing, designated D-1596. Much data on a wide variety of materialsis currently available.
A more recent use of shock test systems to evaluate products and packaging hasgenerated interest in using this vehicle to evaluate cushioning materials. The method un-der consideration utilizes a weighted, instrumented test block in a simulated package todetermine dynamic performance.
This paper compares these two evaluation techniques first from the test design stand-point. They are then examined from an operational orientation. Finally, the two methodsare compared in their generation of data. Several materials, both synthetic and non-synthetic are evaluated, the data presented comparatively and graphically. Differences areanalyzed statistically for significance of variation. In a discussion section, the two evalua-tion techniques are compared for general suitability when used to generate engineeringdata for use in design of protective packaging. The paper is concise with conclusionsheavily supported by empirical data.
8

AEROSPACE VEHICLES
AN ANALYTICAL/EXPERIMENTAL DETERMINATION OFTRANSPORTER LOADS ON THE VIKING SPACECRAFT
G. Kachadourian,General Electric Company, Hampton, Va.
The Viking Spacecraft are to be launched from the John F. Kennedy Space Centerin 1975. The two space vehicles will be assembled in the Spacecraft Assembly and Erec-tion Facility and transported to Launch Complex 41. The transportation is over 13 milesof paved roads of varying texture including a draw bridge and several railroad crossings.The basic requirement on this ground handling phase, with respect to loads, is that handlingor transport loads shall not impose critical loading conditions or cause damage to the spaceflight structure.
That transportation loads are not critical for the Viking Spacecraft was demonstratedin November and December of 1973 during transportation testing of a Viking DynamicSimulator, This paper presents the experimented and analytical methods used in this dem-onstration. The manner in which spacecraft modal data was used to establish allowableloads and to monitor actual loads is felt to be novel and of general interest.
An accurate mathematical model of the Viking Dynamic Simulator had been previ-ously developed and verified through modal survey testing. From this model six membersof primary structure were identified as the critical members which would define the load-ing conditions in the total spacecraft. That is, by assuming that the loads of interest willbe due to response of the spacecraft in its normal modes, it is possible to define modalloads at any point when the load in the six members are known. Working on this basis,allowable loads by modes were established for each of the six structural members.
Strain gages were installed and calibrated in the six structural members, and loadswere monitored during the transportation test. The paper presents the development ofthe allowable load criteria, the loads measurements made in transportation of the VikingDynamic Simulator and results of comparison. An analytical extension of the results topredict loads in the Viking Spacecraft is also reviewed.
DETERMINATION OF PROPELLANT EFFECTIVE MASSPROPERTIES USING MODAL TEST DATA
Jay C. Chen and John A. Garba
The development of finite elements models for dynamic analyses of spacecraft andlaunch vehicle systems requires proper dynamic representation of fluid masses.
Proper mass representation is required for the prediction of loads in structural membersas well as in the data reduction for the modal test. A limited number of effective propellant
9

mass properties can be obtained analytically from the derivation of fluid slosh models usingclassical fluid mechanics. Full scale propellant tank testing provides a means for obtainingcomplete fluid mass properties accounting for such effects as geometric tank irregularities,baffles, and propellant management devices. Due to requirements of elaborate fixturing andinstrumentation such testing tends to be expensive.
Modal vibration testing is required on most spacecraft projects as a means of verifica-tion of the mathematical model. This paper presents a method for the evaluation of theeffective mass of the fluid from modal test results. Overall cost is reduced by elimination ofa special effective mass test and substitution of a slight extension of a required modal test.
First, the effective mass matrices of the fluids are derived analytically from the meas-ured system frequencies and mode shapes. While the derivation is intended for the deter-mination of effective fluid mass the method is equally applicable to other unknown masses.
Next the procedure is demonstrated by computer simulation. Feasibility of the methodis established by applying it to an example problem wherein analytical data is presumed tobe derived from modal test. The fluid effective mass matrix is thus reconstructed and com-pared to known results. The agreement is found to be very good.
To further illustrate the feasibility of the method it is applied to the Viking Orbiter. Inusing Viking modal data it was found that the required modal matrix formulated from testdata can be ill-conditioned if test inaccuracies exist in the test data. This conditioned modalmatrix violated certain assumptions made in the derivation of the method. Based on thepast experiences, it is likely that the inaccuracies existed in the mode shape measurementsrather than the natural frequency measurements. Therefore, a perturbation technique wasdeveloped to "treat" the raw test data to avoid this ill-conditioning and perturb the data toresult in a solution with physical reality. The results of the fluid effective mass obtained bythis method are compared to that obtained from the full scale tank tests.
The Viking Orbiter data is presented to illustrate the application of this method to aspacecraft containing large fluid masses. The advantages of the method are the eliminationof a full scale fluid slosh test and the ability of obtaining the cross-products of the inertiawhich in general are not measured from the full scale'slosh test. This information might beof value to future projects such as the space shuttle.
UNIQUE FLIGHT INSTRUMENTATION/DATA REDUCTIONTECHNIQUES EMPLOYED ON THE VIKING DYNAMIC SIMULATOR
F. D. Day,Martin Marietta Aerospace, Denver, Colorado
B. K. Wada,Jet Propulsion Laboratory, Pasadena, California
The Viking Spacecraft will be launched aboard a new launch vehicle system, the TitanlllE/Centaur in August 1975. The Jet Propulsion Laboratory (JPL) is responsible for the
10

Viking Orbiter System, which is part of the overall Viking Project managed by the VikingProject Office at Langley Research Center (LRC) for NASA.
Although the Viking Spacecraft is not the first hardware designed to fly aboard a newlaunch vehicle system, areas exist where somewhat unique approaches have been taken toengineering problems. These areas include the basic approach to design of the primarystructure; the methods employed in the verification of the design, in particular the flight ofa dynamic simulation of the Viking Spacecraft (referred to as the Viking Dynamic Simulator(VDS)); and the flight instrumentation and data reduction techniques employed.
This paper will emphasize the somewhat unique aspects of flight instrumentation andpost-flight reduction techniques used on the VDS data obtained in February 1974. TheViking Spacecraft design approach is briefly discussed to provide necessary background in-formation.
The Viking Spacecraft is one of the few projects in which, from inception, the basicdesign philosophy has been to use predicted transient flight loads to design the primary loadcarrying structure. This approach has produced some far ranging ramifications in both thetest related and analytical aspects of the program. The testing has been directed towardsverification of the analytical models and techniques through extensive modal test programs,and, for high level tests, using structural response limitations based on the predicted flightinduced loads. This is significantly different from the generally more conservative approachof designing and testing for simulated flight environments. The analytical aspects of the pro-gram have emphasized more detailed coupled launch vehicle shill spacecraft dynamic modelsand responses to external forcing functions. The "closed-loop" aspects of designing foranalytically predicted flight loads, which are functions of the dynamic characteristics of thestructures being designed, provided impetus for complete verification of the design tech-niques.
A flight of the new launch vehicle system provided an unusual opportunity to actuallyfly a dynamic simulation of the spacecraft, the VDS. The main objectives of the VDS wereto verify the mathematical modeling techniques, the methodology employed in coupling thespacecraft and launch vehicle models, and the loads prediction techniques themselves. Tomeet the objectives, the VDS employed a unique set of flight instrumentation, a mixture ofaccelerometers and strain gauges, as well as a specially designed data reduction facility thatincluded sets of phase and amplitude matched filters and analog computers. The specialinstrumentation and data reduction facilities made it possible to obtain significantly moreinformation than normally possible with fifteen channels of FM/FM multiplexed instrumen-tation.
Six pin-ended struts referred to as the Proof Flight Lander Adapter (PFLA) wereinstrumented with strain gauges. These struts were then individually loaded prior to assem-bly and calibrated as axial load cells. The flight data obtained from the six struts were usedto (1) provide direct data for verification of the loads prediction techniques, (2) provide acomplete time history of the forces and moments across an interface by combining the loadswith an analog computer and special filters in demultiplexing equipment, and (3), com-pletely define the accelerations of the structure above the PFLA with processing similar tothat used in (2). The combination and location of thirteen channels of accelerometers andload cells could, with some assumptions, yield over thirty response parameters when com-pletely reduced and manipulated with the specialized playback equipment.
11

The use of calibrated load cells which are an integral part of the primary spacecraftstructure was demonstrated as a feasible approach to flight instrumentation on the VDS.The advantage of using load cells was that a complete force time history was obtained acrossan interface. From this, the complete acceleration time history of the structure above theinterface was derived. In the past, attempts to determine a complete acceleration time his-tory across an interface, with accelerometers, resulted in limited success because of "local"reasonances. The VDS results will be of interest to engineers selecting flight instrumentationand reduction of data for verification of spacecraft loads and environments. A set of loadcell instrumentation similar to that used on the VDS will be employed as the primary res-ponse transducers on two Viking Spacecraft to be launched in 1975.
ANALYTICAL PREDICTION AND CORRELATION FOR THE ORBITERDURING THE VIKING SPACECRAFT SINUSOIDAL VIBRATION TEST
G. R. Brownlee, F. D. Day and J. A. Garba,Jet Propulsion Laboratory, Pasadena, California
ABSTRACT
The Jet Propulsion Laboratory is responsible for the Viking Orbiter System which ispart of the overall Viking Project managed by the Viking Project Office at Langley ResearchCenter for NASA. The Spacecraft will be launched on a Titan IIIE/Centaur Launch Vehiclein August 1975.
The Viking Spacecraft (V-S/C) consists of two major subsystems, the Viking Orbiter(VO) and the Viking Lander Capsule (VLC), built by Martin Marietta Aerospace (MMA).
The Viking Orbiter primary structure was designed for flight loads established by loadsanalysis. Loads analysis is a procedure for obtaining member design loads from transientresponse analyses for various flight events.
Qualification testing for the Viking Spacecraft System was divided into three categories,the low frequency, the middle frequency, and the high frequency regimes.
Structural integrity of the VO system in the low frequency range from 0 to 40 Hz wasverified by a static test.
The middle frequency range, 20 to 200 liz overlaps the low frequency range at thelower end. In this range a sine vibration test was used to qualify the Orbiter system.
Testing in the high frequency range, above 200 tlz, consisted of acoustic excitation andpyrotechnic firings.
All VO test models used in the qualification test program had only a mass simulation of theVLC. Thus these tests did not allow for the evaluation of the VO/VLC dynamic interaction.
Developmental type testing using rel)resentative elastic VO and V,(" hardware wasundertaken to study such interaction. This testing consisted of sinusoidal excitation of the
12

spacecraft in three orthogonal axes. Other objectives of this test were (1) the evaluation ofsecondary structure, (2) a check of the adequacy of component test levels, (3) the compari-son of analytical predictions with test results and (4) to serve as a precursor for the Orbiterqualification test.
The Spacecraft test was implemented such that the responses were limited not toexceed design loads in primary structural members.
Pre-test analysis was required to establish the fixture requirements to prevent a largerotary motion of the V-S/C fixture system that would result in a rotation of the armaturethat may terminate the test.
Additional requirements on the pre-test analyses were to aid in:
1. Location and number of control accelerometers and strain gages.
2. Location and number of peak limit accelerometers and strain gages (accelerom-eters and strain gages that would shut down the test if preselected values areexceeded).
The following instrumentation and test facility restrictions had to be used:
1. Control channels = 36
2. Peak limit channels = 59
3. Channels for recording data = 274
4. Number of strain gages available for monitoring 700
5. Accelerometer locations = 113
6. Minimize the cyclic load on the structure
7. Schedule
8. Data analyses cost.
Computer simulation of the test setup was run to pre-select the parameters and levelsfor control to:
* not exceed load in other members
* estimate the fatigue life used during a sine test
* minimize probability of test termination because of an exceedance of a limit.
Experimental selection of the proper combination of parameters for control (by trial) wouldhave consumed resources in test time, test data analyses, test data evaluation; increasedprobability of test malfunction during numerous shutdowns, as well as consume fatigue lifeof the structure.
13
As a result of a good computer simulation that includes a complex finite element modelof the V-S/C, test fixture/shaker dynamic model, and the control system the V-S/C sinevibration test was completed ahead of schedule and all the objectives were met. The closeinteraction between the analysis and the test directly contributed to a successful program.
This paper deals with the comparison of analytically calculated frequency responsesfor member forces and accelerations to test responses obtained from strain gauge and accel-erometer data.
A summary is presented of the method used in modeling the system, verification ofthe components by test, the selection of damping, the method of calculating controlledresponses and the test implementation.
Since the correlation of modal test results and the mathematical model was consideredto be excellent for Viking Orbiter the comparison of analytical and experimental responsedata produces a measure to which such correlation can be achieved with good data. It alsoprovides insight into the importance of other parameters such as damping.
FAIL SAFE FORCED VIBRATION TESTING OF THE VIKING 1975
DEVELOPMENTAL SPACE CRAFT
James W. Fortenberry JPL, Pasadena, California
Paul Rader, MMA, Denver, Colorado
This paper describes the structural developmental Forced Vibration Test Program ac-complished on the Viking 1975 Spacecraft. Test conduct was complicated since Vikinghardware is furnished by three separate agencies: Jet Propulsion Laboratory (Viking Orbi-ter), Martin Marietta Aerospace (Viking Lander Capsule), and General Dynamics/ConvairAerospace (Interface Adapters to Centaur). The Viking Project Office at the Langley Re-search Center is the Project Manager for the Viking Project.
Considerable doubt existed as to the feasibility of mounting such a large structure on ashaker and maintaining adequate control of the test. The height of the spacecraft coupledwith its C.G. offset would cause large overturning moments. In addition, control systemlimitations observed on previous testing of another spacecraft with similar response charac-teristics (narrow bands with high amplitudes) had resulted in damage to the structure. Ac-cordingly, a response analysis of the entire test set-up and control system experimentspreceded actual test implementation.
The effects of test philosophy on the development of the vibration control system arepresented. Structural design of the spacecraft was accomplished using loads analyses basedon statistical evaluation of previous Titan Booster flights. Since the Viking was "tailored"to meet a specific, limited launch environment, the standard practice of vibration testing thestructure to a large number of loading cycles was rejected. This approach was reinforced bythe fact that portions of the Orbiter structure were scheduled for static testing to ultimateload levels following the vibration test.
14

The two main criteria used to conduct a fail-safe vibration test of the spacecraft were:
1. Vibration input to the test specimen would be controlled so that loads in primarystructure members would not exceed analytically predicted flight loads.
2. The number of loading cycles on selected primary structure would be monitoredfor cumulative damage ratios, a measure of possible fatigue damage to the struc-ture.
To meet these criteria, a 36 channel control and 60 channel limit system were utilized alongwith over 200 other dynamic signals. Control system limitations, including switching capa-bility and overshoot, are described. An analog/digital process was used for computation ofmember loading, bending moments, and cumulative damage ratios.
MODALAB AA NEW SYSTEM FOR STRUCTURAL DYNAMIC TESTING
Strether Smith, Richard C. Stroud, George A. Hlamma, W. L. Hallauer, R. C. YeeLockheed Missiles & Space Company, Palo Alto, California
I. BASIC CONCEPTS AND HARDWARE
The art of ground vibration testing has been advancing steadily since its inception about40 years ago. Several major systems have been constructed to apply variations of the multi-ple shaker dwell technique of Lewis and Wrisley (Ref. 1) and equipment sophistication hasreached a high level as shown in Ref. 2. However, in many cases the results of the tests per-formed have been less than satisfactory and good results have generally been restricted tofrequency ranges of low modal density.
For the past 20 years various researchers have developed techniques based on the sinesweep approach (Refs. 3-5), but these have not been applied in practical large scale testingbecause of the vast quantity of data that must be acquired, stored, and analyzed. Until veryrecently the hardware required to perform tests using this approach has not been available.MODALAB (MObile Dynamic Analysis LABoratory) is the first system capable of perform-ing large scale multiple channel testing using these methods.
Use of sine sweep techniques provides the following capabilities that are not feasiblewith dwell techniques:
1. Determination of appropriate multiple shaker force distributions for modal tuning
by analytical means (Ref. 4).
2. Determination of mode shape from analysis of complex response (Refs. 3, 5).
3. Determination of modal frequency and damping on the basis of overall structurebehavior (Ref. 5).
15

The result of using this approach is considerable improvement in data accuracy and reli-ability and a great reduction in time and cost required for testing.
The MODALAB system includes the following features that are necessary for imple-
mentation of these advanced techniques:
1. Real-time digital filtering.
2. Permanent high speed disk storage of data with immediate accessibility for proc-essing.
3. A highly flexible software oriented system that allows rapid technique develop-ment and program modification.
4. Rapid graphic output for inspection of test progress by real time display and forevaluation of reduced data.
5. The system is capable of standing alone from data collection to comparison ofexperimental and analytical data.
MODALAB will also perform as a conventional high speed data acquisition system.The optimization for sine wave testing (specifically the real time filtering process) does notdegrade general purpose operation.
At present software has been written to perform and analyze the following types oftest:
1. Wide-Band Sine Sweepa. Transfer function (complex or total)b. Transmissibility (complex or total)c. Linear sums of responsesd. Analysis to determine multiple shaker force distributions by Ref. 4
2. Narrow-Band Sine Sweep (Single Shaker)a. Modal analysis by Ref. 3
3. Narrow-Band Sine Sweep (Multiple Shaker)a. Modal analysis by Ref. 5
4. Transient Recording (Short Period)a. Kinetic energy decay analysisb. Fast Fourier transform
5. Random Signal Recording (Long Period)a. Fast Fourier transform
Performance of these tasks using software oriented concepts requires a powerful hard-
ware system. MODALAB is made up of seven basic subsystems:
1. Computer/storage - disk operating system on a medium sized computer.
2. Operator communication through graphic and terminal input/output.
16

3. Analog data acquisition-256 channels at 200,000 ch/sec.
4. Interface system including part of the digital filtering algorithm in hardware.
5. Modal testing shaker control system including amplitude, phase and frequencycontrol of up to 15 shakers by manual or computer control.
6. Instrumentation-240 high resolution accelerometers and 15 load cells and asso-ciated signal conditioning.
7. Shaker system with fifteen 30-lb 6-1/4" stroke shakers, and (urrent controlledD.C. coupled amplifiers.
The hardware system will be detailed in the presentation.
REFERENCES
1. Lewis, R.C., and Wrisley, D.L., "A System for the Excitation of Pure Natural Modes ofComplex Structures," J. Aeronaut. Sci., Vol. 17, No. 11, 1950, pp. 705-722
2. Salyer, R.A., "Hybrid Techniques for Modal Survey Control & Data Appraisal," TheShock & Vibration Bull., Bull No. 41, Part 3, 1970, pp. 25-42
3. Kennedy, C.C., and Pancu, C.D.P., "Use of Vectors in Vibration Measurement & Anal-ysis," J. Aerospace Sci., Vol. 14, No. 11, 1947, pp. 603-625
4. Asher, G.W., A Method of Normal Mode Excitation Utilizing Admittance Measure-ments," Proc. National Specialists' Meeting on Dynamics & Aerolasticity, Ft. Worth,Institute of Aero. Sci., 1958, pp. 69-76
5. Smith, Strether and Woods, A.A., Jr., "A Multiple Driver Admittance Technique forVibration Testing of Complex Structures," The Shock & Vibration Bulletin, Bulletin42, Part 3, p. 15, January 1972
MODALAB B
A NEW SYSTEM FOR STRUCTURAL DYNAMIC TESTING
Richard C. Stroud, Strether Smith, W. L. Hallauer, George A. Ilamma. P C. YeeLockheed Missiles & Space Company, Palo Alto, California
II. ANALYSIS CONCEPTS AND PROCEDURES
It has long been recognized that accurate experimental definition of modal characteris-tics of large structures is enhanced by simultaneous excitation with several coherentlyphased shakers (Ref. 1). However, many factors have piecluded a satisfactory, systematicprocedure for multi-point excitation modal testing. The two most significant problems havebeen 1) the lack of efficient and reliable criterion for identifying modal purity and 2) the
17

absence of a method for determining the proper force distribution to excite a pure modalresponse. Theoretical data-analysis procedures capable of overcoming these obstacles haveexisted but gone unused because of stringent data acquisition/processing requirements. Thedevelopment of MODALAB permits the practical application of many of these techniques.Two of these are of particular importance.
A method first proposed by Asher (Ref. 4), but not previously used in a practicalapplication, is used to identify resonances in high modal density situations and to determinethe appropriate force distributions to tune the associated modes. This technique uses thedata acquired during a series of wideband, single-shaker sinusoidal sweeps. These data areassembled into a coincident-response matr _x, the determinant of which is examined as a func-tion of frequency. Those frequencies for which this detriminant vanishes are resonant fre-quencies and the solution of the corresponding set of homogeneous equations yields the forcedistributions required to tune the respective modes. Modal tuning by this method is a purelyobjective procedure.
The energy admittance method of Smith and Woods (Ref. 5) provides a single concisemeasure of modal response for an entire structure. The total-energy admittance is definedas the complex ratio of kinetic energy of the entire structure to the power input by shakers.This quantity is analogous to the complex displacement/force admittance first discussed byKennedy and Pancu (Ref. 3). Consequently, if the real and imaginary components of thetotal-energy admittance are plotted against each other, the locus of data points will, for awell-tuned mode, form a circle which is centered on the imaginary axis and tangent to thereal axis. Deviations from this pattern indicate a lack of modal purity. The total-energyadmittance is used to determine the modal frequency and damping based on overall struc-ture behavior. Individual-energy admittance data provides the basis for accurate determina-tion of the mode shape.
The analytical techniques implemented in MODALAB depend heavily on the computingpower of the system. In addition to the basic software function of processing data,MODALAB has the hardware required to permit software control of many data acquisitionand system checkout tasks. The computer is a modern, medium-sized unit with an easilyused disk operating system. Programs are constructed on a maodular basis and coded almostentirely in FORTRAN. The software system provides exceptional flexibility and ease ofmodification ideally suited for structural dynamic testing.
The test-support programs can be classified into four categories: (i) header assemblyr tines to establish test parameters and to allocate disk storage space for data; (ii) real-timeprocessors to acquire data and concurrently display selected parameters on a graphics ter-minal; (iii) post-processors to edit and reduce data to final form; and (iv) equipment setup/checkout routines. These programs will be described in the presentation.
The steps in a modal survey conducted with MODALAB are:
1. A series of wide-band, single-shaker, sinusoidal sweeps.
2. Resonance determination and force-distribution analysis.
3. Irt,-ractive refinement of modal tuning.
4. Decay test.
5. A narrow-band, multiple-shaker sinusoidal sweep.
18

6. Immediate postprocessing to determine modal properties and to critique result.".
7. Momentum/orthogonality check.
'The procedure is almost entirely objective and results in a very rapid test with modalanalysis completed within one hour of starting the narrow-band sweep. Average testing timeis about 2-1/2 hours per mode, including all phases of the test in frequency ranges of moder-ate modal density.
The presentation will include data measured on a complex structure having high modaldensity.
REFERENCES
1. Lewis, R.C., and Wrisley, D.L., "A System for the Excitation of Pure Natural Modes ofComplex Structures," J. Aeronaut. Sci., Vol. 17, No. 11, 1950, pp. 705-722
2. Salyer, R.A., "Hybrid Techniques for Modal Survey Control & Data Appraisal," The
Shock & Vibration Bull., Bull. No. 41, Part 3, 1970, pp. 25-42
3. Kennedy, C.C., and Pancu, C.D.P., "Use of Vectors in Vibration Measurement &Analysis," J. Aerospace Sci., Vol. 14, No. 11, 1947, pp. 603-625
4. Asher, G.W., "A Method of Normal Mode Excitation Utilizing Admittance Measure-ments," Proc. National Specialists' Meeting on Dynamics & Aerolasticity, Ft. Worth,Institute of Aero. Sci., 1958, pp. 69-76
5. Smith, Strether and Woods, A.A., Jr., "A Multiple Driver Admittance Technique forVibration Testing of Complex Structures," The Shock & Vibration Bulletin. Bulletin42, Part 3, p. 15, January 1972
A METHOD FOR DETERMINING TACTICAL MISSILE JOINT COMPLIANCESFROM DYNAMIC TEST DATA
John G. Maloney and Michael T. SheltonGeneral Dynamics-Pomona Division, Pomona, California
The modular configuration approach commonly employed in designing tactical missilesresults in the use of numerous separable airframe joints. The compliance of these joints, andin particular the flexural compliances, play an important role in missile structural dynamicresponse characteristics. Exploitation of the modular missile design concept often results inthe need to determine joint compliances for subsequent dynamic response modeling for newmodule combinations or configurations. However, the behavior and complexity of mostairframe joint designs is such that they are not amenable to simple analytical modeling tech-niques. Experimental determination of joint compliances is therefore commonly used. Twoexperimental approaches to determining joint compliances are discusst.
19

Ihe first method of determining joint compliances involves elastic mode testing of spe-cial hardware that embodies one type of joint at a time. The design of the experiment isdiscussed from the standpoint of placement of the joint, control of boundary conditions andminimization of experimental errors. The application of this technique to three differentjoint designs is presented. The three designs are a threaded coupling ring, a marmon clampand a radial shear bolt joint. The advantage of this experimental approach is that it involvesonly a single unknown joint compliance that can be readily deduced with the aid of a beamelastic model. The major limitation of this method is that it requires fabrication and test ofa set of special hardware for each different joint.
The second method of experimentally determining airframe joint compliances involveselastic mode testing of the entire tactical missile. This circumvents the problem of designingand testing special hardware but it leaves one with the problem of extracting the airframejoint compliances from the measured mode shapes and frequencies. This can be a formidableundertaking when using trial and error procedures involving the variation of joint compli-ances in a beam elastic mode model of the test configuration. To simplify the task ofdetermining compliances from elastic mode test data, a method referred to as the joint com-pliance extraction technique has been developed. This technique is based on the premisethat the elastic mode characteristics of a tactical missile can be represented adequately witha beam model and that the mass distribution and, with the exception of the joints, the stiff-ness distribution are known. Thus any errors between the measured and computed modeshapes and measured and computed mode frequencies are attributed to the compliance ofthe joints.
The technique is formulated as a non-linear programnming problem involving a cost orpenalty function that is to be minimized. The cost function consists of the sum of weightedsquares of the differences between measured and computed mode shapes and frequencies.The technique is derived from a general method developed by Hall, Calkin and Sholar.1
The minimization of the cost function is achieved by a modified steepest descentmethod in which the second order terms are approximated by differences. This and otherfeatures designed to insure and speed convergence are presented. The joint complianceextraction technique has been coded in FORTRAN and applied to actual tactical missileelastic mode test data. Four flexural joint compliances were extracted from a set of threemeasured mod- shapes and frequencies. The results of this application agree well withearlier results that were obtained by a laborious trial and error procedure.
Hail, B.M., Calkin, E.D. and Sholar, M.S., "Linear Estimat ion of Structural Parameters from Dynamic
Test Data", AIAA/ASME 11 th Structures, Structural Dynamics, and Materials Conference, Denver,Colorado, April 22-24, 1970.
20
BLAST AND IMPULSIVE LOADING
DESIGN STUI)Y OF A NEW BRLEXPERIMENTAL BLAST CHAMBER
W. E. Baker and P. A. CoxSouth west Research Institute
Sanl Antonio, rexas
'[his paper reports the results of a design study of a blast chaner intended for re-petitive firings of explosive charges up to 30 lb weight with minimal disturbance to per-sonnel in its vicinity. The study includes a survey of past work in blast chamber design,evaluation of several alternate design concepts and analyses to establish chamber material.spherical or cylindrical shape, size and thickness. Responses to initial and reflected blastwaves were predicted, as well as stresses from internal static pressures. Effects of chamberevacuation on modification of loading and chamber stresses were considered. Other factorsconsidered were chamber venting for unevacuated chambers, responses to charges detonatedoff-center, lining with shock-absorbing materials, and spalling effects.
The chamber design was found to be controlled by the initial and reflected blast load-ing, rather than static pressure. Partial evaluation to about 1/3 atmosphere markedly re-duced blast loading and resultant chamber stresses, while off-center charge detonation in-creased stresses considerably. Reflected shocks were nearly in phase with chamber naturalperiods and therefore amplified stresses caused by initial blast loading. Stresses from staticpressure rise were insignificant compared to those from blast loading, and no venting wasnecessary. Recommended construction material was mild steel, and recominmended geom-etry was spherical. A steel vessel required no shock-absorbing lining and coul(d not bespalled by any explosion other than a contact explosion. C(hanber thicknesses were de-termined as a function of radius, and combinations for safe design were recommended.
X-RAY SIMULATION WITH LIGilT-INITIATED EXPLOSIVE
R. A. Benham and F. H. MathewsSandia Laboratories, Albuquerque, New Mexico
When a weapon structure is exposed to X rays, the energy deposited in th, surfacematerial m'iy result in its vaporization and subsequent blowoff. This blowoff impart s animpulse to the structure within a few microseconds. To furnish information about struc-tural behavior caused by this loading, previous laboratory experiments have employedelectron-beam machines, magnetically accelerated flyer plates, and strip explosives to simu-late blowoff impulse. In the method described here, the weapon structure is spray-paintedwith a coating of silver acetylide-silver nitrate (SASN), a light-sensitive explosive. This ex-plosive combines initiation sensitivity and loading simultaneity with the ability to detonatein thin layers. When detonated by an intense flash of light, the explosive delivers a pressure
21

load that simulates X-ray impulse effects on a test structure. This technique is particularlyuseful for structures with irregular surfaces and is employed with other simulation tech-niques and with underground experiments to study weapon vulnerability.
This paper will discuss the facility used for spray-painting SASN. The explosive for-mulation process as well as the spray techniques will be presented. A discussion of theexplosive behavior is included.
The results of a test on a stainless-steel ring are presented. Strain responses are com-pared with predicted responses from a well-known (Humphrey-Winter) theory.
This testing technique is currently being used to conduct impulse tests on varioustypes of structures including reentry vehicle nosetips and aft ends.
STRUCTURAL DYNAMIC RESPONSE TOHEIGHT-OF-BURST AIR BLAST LOADING
H. F. Korman, N. Lipner and J. S. ChiuTRW Systems Group, Redondo Beach, California
With advances in the design of nuclear hardened weapon systems, it has become in-creasingly more important to accurately assess the hardness of protective structures to airblast loads. The traditional technique 1 uses equivalent triangular pressure-time histories torepresent the air blast which introduces a degree of approximation which can result inhardness overestimates or underestimates, depending on the method for determining theload duration time. This paper describes the development of structural dynamic responsefactors for air blast loading which considers the complete pressure history. The loading isbased on the most recent advances in air blast phenomenology 2 which provides a calcula-tional procedure for the determina-ion of the waveform shape as a function of weaponyield, peak pressure and detonation height-of-burst.
The analysis modeled the structure as a single degree of freedom system with anelastic-perfectly plastic spring and no viscous damping. In developing dynamic responsecharts, a series of code calculations were performed to determine the maximum deflectionfor various values of frequency and structure yield resistance force for each of a series ofair blast waveforms. For hardened structure frequencies of interest, the calculation resultsessentially collapsed into one set of parametric curves which relate the following key vari-ables: structural frequency, weapon yield, pressure waveform time scale, allowable duc-tility ratio, and dynamic load factor. These curves provide a technique for hardness eval-uation which is no more complex than using the dynamic load chart for triangular pulses. 1
A comparison of these waveform results with those for the triangular pulse with thesame peak pressure shows that the use of equivalent triangles which preserve the initialslope of the pressure decay produces an unconservative hardness evaluation. On the otherhand, preserving the total specific impulse with a triangular pulse produces results whichare too conservative.
I. Newark, N. M., et. nt. -'Air Force Design Manual," AFSWC-TDR-62-139, December 1962.2. Brode, H. L., "Height-of-Burst Effects at High Overpressures," DASA 2506, July 1970.
22
It is recommended that the technique based on the use of the actual pressure wave-form be used for nuclear hardness assessment of protective structures.
RESPONSE OF FLAT PLATES SUBJECTED TOMILD IMPULSIVE LOADINGS
C. A. RossUniversity of Florida Graduate Engineering Center
Eglin AFB, Florida
and
W. S. StricklandAF Armament Laboratory
Eglin AFB, Florida
This paper presents the results of an effort to determine failure of flat plates subjectedto mild impulsive loadings generated by a fuel air explosive. Mechanisms by which flatplates deform under impulsive loads are usually divided into the two areas, i.e.. a staticmode in which the plate deforms in a continuous pattern involving the entire plate and aplastic hinge mode in which the deformation takes place in a discontinuous pattern bytravelling plastic hinges. The static mode is associated with quasistatic loads of long dura-tion and low pressure whereas the travelling plastic hinge mode is associated with reason-ably high pressures of short duration. The dividing region between these two modes isusually defined in terms of the characteristic period of the structure and the positive pres-sure phase of the loading function. Plates whose characteristic periods are approximatelyequal to or greater than four times the positive pressure phase of the loading are dependenton the shape of the pressure time curve and not just the total impulse. The positive pres-sure phase durations resulting from a reflected detonation wave of a fuel air explosion arein the millisecond range and are approximately equal to or greater than the characteristicperiods of many thin flat plates found in metal buildings, aircraft, radar vans, and otherrelated equipment.
In the case of ductile metals such as some aluminum alloys, mild steel and some stain-less steels, the elastic portion of the stress-strain curve is quite small and the assumption ofa rigid-strain-hardening constitutive relation appears to be quite realistic. A meni branemodel based on a total plastic strain energy function was developed using this type ofconstitutive relation and an assumed final deformed shape. Using a forcing function basedon a measured pressure time history for a fuel air explosion, equations of motion for aflat plate were formulated and the resulting non-linear differential equation was solvedusing an analog simulation program.
Impulsive loads from a fuel air explosion were applied to square aluminum panel."using a gas bag technique. The panels were mounted on a rigid frame at one end of a4' x 4' x 20' plastic bag and a detonation wave was generated at the other end of tile bag
by use of a small explosive charge. Both side on and reflected pressures were recorded.
Plate failure began at the midpoint of one of the edges of the plate and progressedalong the edges of the clamped plate. Examination of the failed surface reveals a simple
23

tensile type failure. The deformation mode was established by observing dynamic Moire'fringes using a parallel lined grid and high speed photography. Plate deformation wasfound to occur by propagation of a plastic hinge, however, the center point deflection atfailure agreed very well with the analytical predictions and for the plates tested was foundto be independent of thickness as indicated by the membrane assumption.
A MATRIX STRUCTURAL DYNAMIC MODEL OF PARACHUTE THERMALCOVER EJECTION BY PYROTECHNIC DEVICES
A. E. Barniskis and R. A. RomanziGeneral Electric CompanyPhiladelphia, Pennsylvania
A method was developed for predicting ejected velocities and structural loadings of aparachute thermal cover ejected by four cartridge type pyrotechnic devices.
Observation of ground test firings of the thermal cover assemblies indicated velocitylosses were as great as 35 to 40 percent of the velocities obtainable in test firings of thepyrotechnic charge adaptors ejecting rigid bodies of equal weight. It was hypothesizedthat these velocity losses were attributable to portions of the available energy from thecharge adaptors being lost to thermal saver structural deformation, acceleration of the re-entry vehicle forebody, local deformation or springing of the charge adaptor-forebodymount ring, and parachute bridle extraction and other frictional or drag losses. It was alsoobserved that non-simultaneous firing of the charge adaptors caused velocity losses that in-creased in severity as the time of non-simultaneity increased. Attempts to assign percentagevalues to the velocity losses attributed to each of these parameters by empirical methodfailed to yield accurate pretest predictions of thermal cover ejection performance. A sec-ond hypothesis was that these parameters affected performance not only by utilizing avail-able energy, but also by reducing the total energy produced by the pyrotechnic devicesduring the ejection event, by decreasing the inertial load on the ejector pistons throughstructural response of the thermal cover.
To test the latter hypothesis, and to provide a means of obtaining improved predic-tions of ejection performance, a computer program was written in Fortran IV utilizing amatrix structural dynamic model of the thermal cover and ejection system which includedall of the parameters cited. A unique problem in the development of the dynamic modelwas the simulation of the pyrotechnic forcing function, since it was necessary that themodel predict the effect of the inertial loading of the ejector piston on the pr-ssure timehistory produced by the charge adaptor. The overall problem was therefore the develop-ment and integration of the equations of motion of a system subjected to a highly non-linear function. The methods used, and the results achieved, are described in the follow-ing sections.
THERMAL COVER EJECTION EQUATION OF MOTION
The dynamic model is simulated as a 6 axial degree of freedom matrix structuralmodel. Five degrees of freedom are related to the structural model of the thermal cover.and one degree of freedom is assigned to the lumped forebody mass. The five thermal
24

cover degrees of freedom consist of one each assigned to the four corners at piston attach-ments, and one for the top center of the parachute cover box structure. Each corner isforced by the piston charge adaptor after charge ignition. The charge adaptor forcingfunction is simulated as described in the following section. Non-simultaneous firing eventsare accommodated by specifying the firing time of each of the four pistons individually.
Parameters that are input into the computer program are forebody weight, thermalcover weight and stiffness matrici , charge adaptor firing times, charge adaptor to fore-body local stiffness, thermal cover structural damping and piston loss damping attributedto the various drag and friction effects. Logic related to each of the force contributorsis contained in separate subroutines which facilitates logic changes without major repro-gramming.
PISTON CHARGE ADAPTOR FORCING FUNCTION
The piston forcing function is a three-dimensional function in tabular form givingpiston force as a function of piston displacement and time since ignition. This was derivedfrom pressure data recorded from rigid body firings of single pistons ejection 1, 2, 3, 5,and 10 lb. weights. The average pressure-time history for each ejected weight was inte-grated twice with respect to time to obtain piston displacement time histories. The forc-ing function table is a tabulation of these time histories. For integration of the equationsof motion, a table look up and bilinear interpolation scheme is used.
THERMAL COVER STRUCTURAL MODEL
Thermal cover stiffness and mass matrices are included in the ejection velocity predic-tion model to simulate the effect of structural response on the energy produced by thecharge adaptors, and to simulate the energy lost to structural deformation. They also en-able the user to obtain structural loadings of the thermal cover during ejection.
The thermal cover structural model is formulated as a multi-degree of freedom free-dom system which is reduced to a five degree of freedom system using the Guyan trans-formation. Stiffness and mass matrices are refined to obtain eigenvalue-eigenvector solu-tions which are calibrated to agree with vibration test data.
CHARGE ADAPTOR TO FOREBODY LOCAL STIFFNESS
Charge adaptor to forebody local stiffness is included to simulate the structural re-sponse of the mounting due to charge adaptor firing forces. Measurements of local stiff-ness were obtained from impedance vibration testing.
MOVING FOREBODY
The moving forebody is included to simulate the loss of energy to accelerating theforebody, and the effect on total energy produced. The forebody is modelled as a lumpedmass free to move in its axial degree of freedom under the sum of the forces of the fourcharge adaptors.
25

DAMPING
Damping includes all forces which are functions of mass point velocity. Included arestructural damping critical damping of the cover center mass point, and losses due to bridleextractions and piston and baffle drag. Drag type damping is modelled as a retarding forceon the corner mass points which is proportional to velocity.
VIBRATION TESTING
Vibration tests were conducted on various thermal cover assemblies. The purposewas to obtain data for refinement of the structural model for better simulation of responseduring ejection.
RESULTS
The simulation of the piston forcing function was verified when the model demon-strated the ability to predict ejected velocities of rigid body single piston firings of variousejected weights.
Initial parametric studies of thermal cover structural characteristics utilizing thedynamic model proved the hypothesis that structural response affected the total energygenerated by the charge adaptors. After calibration and refinement of the structuralmodel, the dynamic model demonstrated the ability to make pretest predictions of veloc-ity accurate to 5 percent.
Extensive parametric studies of thermal cover design has lead to a major redesign ofthe entire ejection system. The modelling technique and program have proven to be use-ful accurate tools for this effort.
EFFECT OF SHOCK SPECTRUM-SIMILAR SHOCKSON A LARGE COLLECTION OF COMPLEX STRUCTURES
Leo M. Butzel
The Boeing Company, Seattle, Washington
and
Howard C. MerchantUniversity of Washington, Seattle, Washington
The problem of two shock tests involving shocks which have different time historiesbut essentially the same shock spectrum is considered. This problem invariably arises inany discussion dealing with a shock test specification stated in terms of a shock spectrumrequirement. A technique, based on the effect of such spectrum-similar shocks on a (lassof ideal systems more general than those involved in the definition of a shock spectnim.is employed.
26
A set of more than 6000 ideal, four-degree-of-freedom, linear oscillators are con-sidered. The maximum response induced in these systems by a classic half-sine accelera-tion shock, and by a spectrum-similar complex shock are compared. The complex shockis made up of sinusoidal acceleration components whose envelopes first grow and th-ndie out exponentially. The effect of system damping is examined. The half-sine --' & ischaracteristic of a drop type tester, the complex shock of an electrodynamic shaker Lypetester.
The results are presented in terms of distributions of maximum response differences.These are compared with a set of distributions based on shock spectrum bounding tech-niques developed previously by the authors. Expected pass/fail statistics for idealizedshock tests performed with the two spectrum-similar shocks are discussed.
STRUCTUREBORNE GUN BLAST SHOCK TEST USINGAN ELECTROHYDRAULIC VIBRATION EXCITER
R. L. WoodfinNaval Weapons CenterChina Lake, California
and
N. D. NelsonHughes Aircraft Company
Fullerton, California
The paper describes a method of simulating the dynamic effects of a specified struc-tureborne gun shock. The shock test levels were derived by others and the validity of thelevels are not reviewed, except that the levels are defined as being applicable to equipmentmounting points which are not exposed directly to the air blast wave. The tests were con-ducted to determine the effect on the operation of sophisticated electronic equipmentduring and after a series of shocks. The equipment under test was designed for MIL-S-901shock environment. No physical damage was expected from the gun shock test and nonehas been observed to date.
The shock requirement was specified in terms of velocity and acceleration levels. Therequirements were interpreted as a nominal shock response spectra and reasonable toler-ance limits were assigned. The tolerance limits were adjusted to allow the use of a shockpulse having zero average velocity and approximately one half sine waveform. The choiceof waveform was made to simplify synthesis and any of a variety of other waveformswould yield an "in-tolerance" response spectra.
27
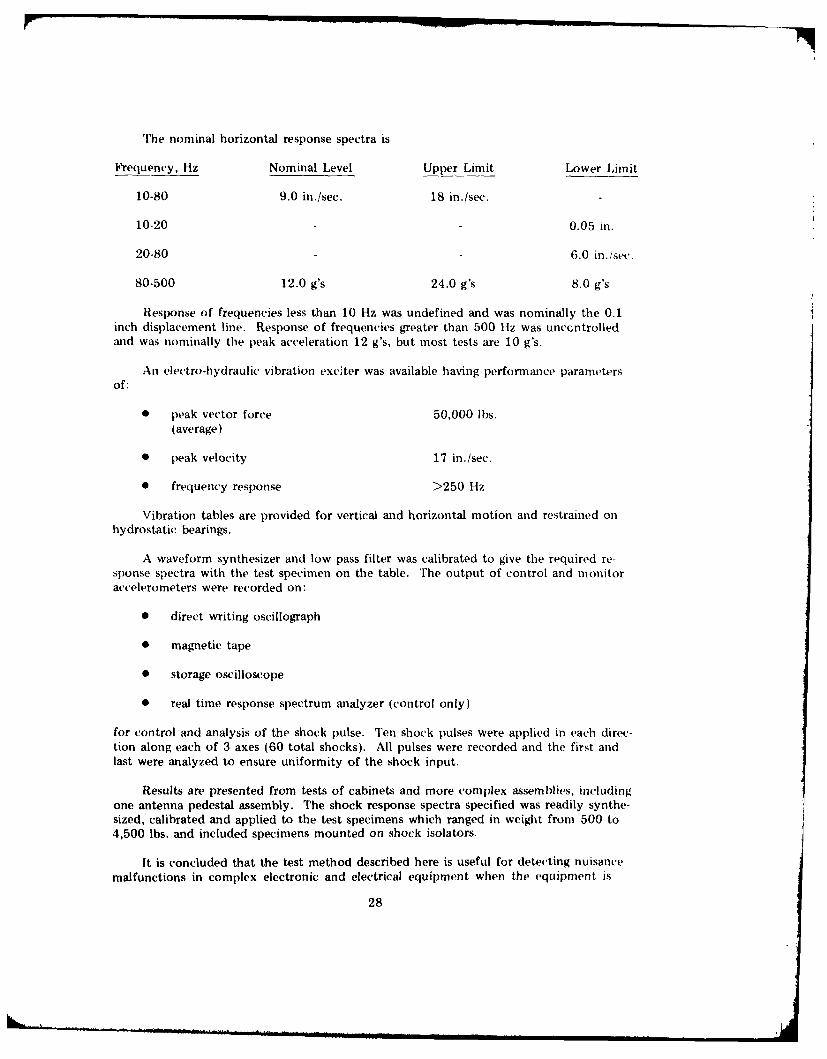
The nominal horizontal response spectra is
Frequency, Hz Nominal Level Upper Limit Lower Limit
10-80 9.0 in./sec. 18 in./sec.
10-20 0.05 in.
20-80 6.0 in./sec.
80-500 12.0 g's 24.0 g's 8.0 g's
Response of frequencies less than 10 Hz was undefined and was nominally the 0.1inch displacement line. Response of frequencies greater than 500 Hz was uncontrolledand was nominally the peak acceleration 12 g's, but most tests are 10 g's.
An electro-hydraulic vibration exciter was available having performance parametersof:
" peak vector force 50,000 lbs.(average)
" peak velocity 17 in./sec.
* frequency response >250 Hz
Vibration tables are provided for vertical and horizontal motion and restrained onhydrostatic bearings.
A waveform synthesizer and low pass filter was calibrated to give the required re-sponse spectra with the test specimen on the table. The output of control and monitoraccelerometers were recorded on:
* direct writing oscillograph
* magnetic tape
* storage oscilloscope
* real time response spectrum analyzer (control only)
for control and analysis of the shock pulse. Ten shock pulses were applied in each direc-tion along each of 3 axes (60 total shocks). All pulses were recorded and tile first andlast were analyzed to ensure uniformity of the shock input.
Results are presented from tests of cabinets and more complex assemblies, includingone antenna pedestal assembly. The shock response spectra specified was readily synthe-sized, calibrated and applied to the test specimens which ranged in weight from 500 to4,500 lbs. and included specimens mounted on shock isolators.
It is concluded that the test method described here is useful for detecting nuisance
malfunctions in complex electronic and electrical equipment when the equipment is
28

subjected to structureborne shocks at levels characteristic of gun firing. The shock levelsare at levels of approximately 1/20 of the level of MIL-S-901C and consequently give ameasure of circuit fragility of levels roughly equivalent to the response to vibration.Vibration per MIL-STD-167 extends through the frequency range of 4 to 33 Hz and doesnot yield data relative to the response in the 33 to 150 Hz region of the spectrum, whichis strongly excited by structureborne gun shock of the type specified.
MEASUREMENTS OF THE DYNAMIC IMPACTLOADING OF CONCRETE
R. GrinerAF Armament Laboratory, Eglin AFB, Florida
R. L. SierakowskiUniversity of Florida, Gainsville, Florida
and
C. A. RossUniversity i_7 Florida Graduate Engineering Center, Eglin AFB, Florida
Ao a structural material, concrete is often used as a protective and/or containmentmedium for impact and blast loadings. For such applications, an assessment of materialdegradation and damage are important failure criteria to establish. Specifically, failuretypes associated with material removal and spall characterization are very dependent uponthe particular loading conditions. These loadings may be classified as air hurst, surfacecontract, or of the buried blast types. The latter loadings may also be considered staticor dynamic in classification depending upon whether the loading charge has been affixedto or dropped onto the specific material medium.
A search of the open literature has evidenced a paucity of data available on thedynamic and impact loading of concrete. Some previously reported studies sealing withthe dynamic loading and response of rock, loose and compacted granular media are re-ported in references 11-3]. Since rock aggregates are brittle in nature, their response isqualitatively similar to concrete. Except for empirical data such as reported on in [4],and laboratory studies conducted in [5, 61, less information on the macroscopic behaviorof concrete is available.
Based upon previously reported studies of material elements of finite size and takinginto account such effects as charge geometry, orientation, stand off, embedment, andcoupling materials, it appears that three distinct loading failure/fracture regions exist forthe impacted concrete media. The first is the pulverized or crater region, the second con-tains crushed aggregate, while the third region consists of numerous macrocracks. Thelatter region may be classified as a region in which elastic waves can be considered im-portant.
In order to obtain more information relative to the macrocrack region, an experi-mental investigation of the dynamic response of concrete bars has been conducted. Spe-cifically, a series of long bar test specimens, approximately eighteen inches in length, have
29

been fabricated and instrumented for impact type studies. The concrete aggregate speci-mens have been impacted at stress levels well below the compressive failure strength ofthe specimens by bars of varying pulse length in order to investigate the extent and natureof the tensile fracture phenomenon occurring within the specimens. The bars have beeninstrumented with surface strain gauges positioned so that the strain pulse propagationcharacteristics in the various bar specimens can be observed. Pulse shape change, pulsewave speed characteristics, and amplitude attenuation due to the impact loading have beencatalogued.
In addition to the above studies, changes in the particle aggregate size of the con-crete mixture have been examined for potential scaling purposes. Such information shouldprovide a basis for predicting the failure/fracture boundaries of concrete specimens sub-jected to impulsive type loads including both the spall and corner fracture phenomena.
REFERENCES
1. Cherry, J. T., "Computer calculations of explosion-produced craters," Int. J. of RockMechanics & Mining Science, V. 4, 1967, pp. 1-22.
2. Haas, C. J. and Rinehart, J. S., "Coupling between unconfined cylindrical explosivecharges and rock," Int. J. of Rock Mechanics & Mining Science, V. 1 n.1, March1965, pp. 13-24.
3. Miller, J. H., "The effect of stress wave duration on brittle fracture," Int. J. Rock
Mechanics & Mining Science, V. 3, 1966, pp. 199-203.
4. Effects of Impact and Explosion, NDRC Report.
5. Goldsmith, W., Polinski, M., and Yard, T., "Dynamic Behavior of Concrete," Experi-mental Mechanics, V. 6, 1966, pp. 65-79.
6. Goldsmith, W., Kenner, V. H., and Ricketts, T. E., "Dynamic Loading of SeveralConcrete-Like Mixtures," J. of the Structural Division ASCE, V. 94, 1968, pp. 1803-1827.
30
VIBRO-ACOUSTICS
DYNAMIC STRAIN MEASUREMENT TECHNIQUESAT ELEVATED TEMPERATURES
R. C. Taylor,AF Flight Dynamics Laboratory, Wright-Patterson AFB, Ohio
The measurement of strain during sonic fatigue tests of aircraft structures is essentialto the determination of structural response and the estimation of fatigue life. Of the manytests that have been performed at the Air Force Flight Dynamics Laboratory (AFFDL)Sonic Fatigue Facility, those that presented a difficult strain measurement situation werethe tests run in conjunction with structural heating. It is in such an environment that highthermal stresses and the dynamic strains of acoustically induced vibration combine to re-duce the life of the most carefully chosen and installed strain gage system. In a typicalhigh temperature acoustic test in the AFFDL, the test article is subjected to a high inten-sity sound field and simultaneously heated to its operational temperature. Many of thesetests have been on aircraft structures that in service are exposed to the noise and heat ofjet engine exhaust. In the test facility, the sound field is simulated using sound generatorsand heat is induced by means of reflective quartz lamps.
The objective of the program was to develop and demonstrate strain and temperaturemeasurement techniques for strain levels approaching 1000 micro inches/inch and temper-atures up to 1400'F. The reliability requirement was specified as one hour of operationallife at these limits of thermal and dynamic loading. Three temperature ranges were selectedfor investigation, 200°F to 5000 F, 500°F to 800 0 F, and 800°F to 14000 F. For the tem-perature range, 200'F to 500'F, commercially available gages were selected. For highertemperatures, many special alloyed gages were fabricated primarily to meet static strainrequirements of the program. Gage attachment methods include organic cements, ceramiccements, and flame sprayed ceramics. Leadwire materials included Nichrome V wire,Nichrome V ribbon, constantan wire, Nickel clad copper wire, and stainless clad copperwire. The assumption was made that strain gage thermocouple installation techniquesused in testing gas turbine engines should also work in a high temperature, high intensityacoustic noise environment. This was verified early in the program in a test conducted inthe Sonic Fatigue Facility.
Three panels were prepared for testing in the progressive wave test section of theSmall Facility. The 1200'F panel consisted of a 14 by 20 in 0.023 in thick sheet ofInconel X alloy. Platinum, 8% tungsten and Nichrome V alloy gages were installed usingceramic cement. Hfigh intensity sound was gensrated by a low-frequency pure tone sirenat a sound pressure level (SPL) of 160 dB. Thermocouple readings were used to controlthe output of the quartz lamp heaters.
The 14000F panel, to be tested next, was cut from a sheet of 0.025 Rene 41. Dy-namic strain gages of platinum, 8% tungsten, Karma, and Nichrome V alloy were installedusing the flame spray technique. For this test the sound source was changed over to anair modulator type capable of producing a wideband spectrum.
31

The lower temperature measuring methods were tested on the 500'F panel, a 0.020thick sheet of 321 stainless. Glass-fiber reinforced epoxy and phenolic backed gages wereinstalled using NI-Bond 610 adhesive.
An analysis of the test results pointed out gaging techniques that should be consideredwhen testing in a high temperature and intense acoustic environment. The ceramic cementand flame spray installed gages on the 500'F and 1200'F test panels had failed becausethe strains had exceeded the limits for these materials. Ceramic cement are suitable forhigh temperature acoustic tests if the static strains do not approach the yield point of thebase material. Flame sprayed ceramic is also highly suitable and should be used wherethe strain may exceed the yield point. Analysis of the 500'F panel indicated that all ofthe epoxy adhesive bonded gages were functional and all failures had occured in the leadwire system.
AN ACTIVE LINEAR BRIDGE FOR STRAIN MEASUREMENT
P. T. Jaquay,Airforce Flight Dynamics Laboratory, Wright-Patterson AFB, Ohio
The Air Force Flight Dynamics Laboratory, Sonic Fatigue Facility, located at Wright-Patterson Air Force Base, operates three acoustic test chambers for experimentation onflight vehicles, missiles, and equipment in a high intensity sound environment.
Effects of the high intensity sound on the test specimen are determined through theuse of transducers on or near the specimen and connected to the data acquisition system.The data acquired from most tests consists of the outputs of microphones, strain gages,accelerometers and displacement transducers. Of particular importance in most experimentsand tests are the stress levels and location thereof in the test specimens. As a consequencemany strain measuring channels are provided in the AFFDL Sonic Fatigue Facility dataacquisition system.
These strain measuring channels consist of constant voltage strain gage bridge modulesof standard configuration. Almost 100% of the strain measurements made in the facilityuse the quarter-bridge circuit. This particular bridge circuit is one of the most commonlyused circuits in strain measurement work. Although other bridge circuits are more advan-tageous under certain conditions in regard to linearity and sensitivity, they are usually moredifficult and often impossible to implement on real structures. This is due to non-acces-sibility to the reverse side of a structure caused by a brace or support member coveringthe area of interest. For these and other reasons the quarter-bridge configuration is theonly one discussed here.
The output from the strain brie~e is a function of the bridge excitation voltage, gagefactor, strain amplitude and the condition of balance. The bridge output equation is com-posed of two terms, one for the active leg and one for the balancing leg. Examination ofthe two terms of the equation reveals the active term to be a non-linear function of theactive element or AR and the second term to be a constant. This shows that the bridgeis non-linear regardless of the state of d-c balance. It is also pointcd out that in a bridgecircuit of this kind there can be two types of balance; a strictly d-c balance that onlyeliminates the d-c offset ana nothing more, and what might be called sensitivity balance.
32

It is this latter type balance that is of primary intere_ to those whose principal concern isdynamic measurement. Most bridge designs do not provide for maintaining this type ofbalance. Sensitivity balance usually is taken to be the condition where the two elementsof the active leg are equal but more specifically it is the ratio of these two elements at thetime calibration was performed which should not change. This equality or ratio is onlyestablished or maintained at the initial set up time and not, of course, during the strainmeasurement.
The testing of specimens at elevated temperatures to 1400OF is often performed at theSonic Fatigue Facility. Such high temperature causes large changes in the strain gage staticresistance and accompanying sensitivity balance. This results in undesirable changes in bridgecalibration. An auto-balancing circuit was designed in an attempt to solve the problem ofsensitivity unbalance and restore room temperature calibration. This circuit successfullyeliminated the d-c offset problem resulting from high temperature operation but thesensitivity unbalance problem remained.
The sensitivity unbalance problem was then corrected by a modification of the auto-
balance bridge circuit which made the output a linear function of AR or strain. This cir-cuit uses one leg composed of two resistors in a divider for one input to a differential op-erational amplifier and a three element leg of which the center element is the strain gage.Feedback input to the amplifier is then taken from the junction of the middle and bottomelements. This circuit is analyzed to show that a constant current in maintained in thegage element to a high degree of accuracy. An additional feature of this circuit is, thatby properly choosing the values and ratios of the bridge elements and/or excitation volt-ages, the output at zero strain can be made zero, which allows the circuit to be used forstatic as well as dynamic strain measurements.
LABORATORY VIBROACOUSTIC PROFILETESTING FOR IMPROVED AVIONICS EQUIPMENT
RELIABILITY IN A GROUND LAUNCHED RPV
A. H. Burkhard and R. A. Scott,AF Flight Dynamics Laboratory, Aeronautical Systems Division,
Wright-Patterson AFB, Ohio
Modification of an existing operational air launched RPV (Remotely Piloted Vehicle)to obtain a rocket assisted ground latinch capability required reasonable pre-launch assur-ance that critical on-board flight control subsystems would continue to function normallyduring the severe launch vibroacoustic environment.
The ground launch environment was analytically predicted and a novel testing tech-nique was devised which allowed the on-board avionics equipment to be "flown" in thelaboratory through this severe environment. This unique approach permitted the test itemto be exposed to its predicted operational environmental profile during which the opera-tional performance of the test item was checked. The use of realistic environmental testlevels provided reasonable assurance of satisfactory flight test performance without un-necessarily stressing the test item which was scheduled for use in the flight test program.
33

Minor failures which occurred during laboratory testing were identified and repaired; thus.giving increased assurance of environmental reliability during launch. Included in thispaper are discussions of the predicted technique, test philosophy, testing method, andtest results.
ANALYSIS AND FLIGHT TESTCORRELATION OF VIBROACOUSTIC ENVIRONMENTS
ON A REMOTELY PILOTED VEHICLE
Stephen Zurnaciyan and Paul Bockemohle,Northrop Corporation, Hawthorne, California
The requirement to specify environmental criteria for the design and testing of air-borne equipment installed in a new aircraft has provided considerable challenge to environ-mental engineers. To satisfy this requirement in terms of a realistic set of specificationscalls for the availability of extensive flight test data encompassing the full range of serviceconditions encountered by the equipment. Whenever this is not possible, environmentalflight data from a similar vehicle are often used for extrapolation to the new design. Inboth cases, however, the requirement for an early or parallel effort to analytically pre-dict the expected service environments and the corresponding equipment response levels isessential to the proper establishment of the objectives specifications.
This paper presents the results of a comprehensive analysis and flight test programconducted to evaluate the vibroacoustic environment on the AQM-34L model jet-poweredRemotely Piloted Vehicle (RPV). The reported activity was performed by Northrop Cor-poration, Electronics Division, under contract to the USAF Aeronautical Systems Divisionfor the specification of vibration, thermal, and climatic environments for airborne equip-*nent installed in a general class of air-launched RPV.
The primary source of structural vibration on a jet-powered flight vehicle is the acous-tic noise field generated by the engine exhaust and the aero-dynamic boundary layer sur-rounding the vehicle surfaces. Another important source of acoustic excitation for anair-launched RPV such as the AQM-34L is the power plant noise of the carrier aircraft. Thevehicle primary structure response to these types of excitation is expressed in broadbandPSD levels and are used as a basis for establishing the environmental vibration specificationsfor equipment payloads.
The analytical prediction of the induced vibration levels was accomplished by partition-ing the vehicle fuselage stations into representative equipment zones where the externalacoustic excitation remains essentially constant. The corresponding octave band soundpressure level for each zone was calculated on the basis of the worst case flight condition.These levels were subsequently converted into wideband acceleration spectral density databy an empirical procedure devised by P. T. Mahaffey and K. W. Smith of Convair/FortWorth.
The analysis of the equipment response levels within the various zones was performedas if each equipment and its associated mounting structure were driven by the vehicle primarystructure at a set of fixed boundary points. Such a procedure, while allowing for the
34

motion of the secondary structure and the mounted equipment to be accurately describedby analysis, does not account for the dynamic coupling which exists between the vehiclestructure and the payload equipment weights. The resulting prediction is therefore analog-ous to the solution of a linear, multi-degree freedom system subjected to a prescribed basemotion. This type of analysis represents a baseline procedure directed at evaluating thevibration levels induced at the various equipment locations while providing the necessaryflexibility for accommodating future modifications of the equipment payloads. The re-quired vibration transmissibility data for the specified equipment/structure subassemb lieswere obtained by constructing the appropriate finite-element dynamic models which wereanalyzed by means of proprietary computer program. The viscous damping constantfor each dynamic model was estimated to vary between 4% to 1W.4 of critical. The equip-ment response levels were obtained by multiplying the primary structure PSD's by thesquare of the transmissibility along each of the three orthogonal axes ad enveloping theresulting curves in the form of tight straight line PSD's.
The scope of the flight test measurement program was planned to reflect both normalas well as extreme operational environments of the RPV and its equipment payloads.These included the ground run-up to the RPV turbojet engine; takeoff, and landing in thecaptive mode; and cruise at various altitudes in the free-flight mode. Vibroacoustic envi-ronmental data were recorded during each of these operational modes by flush-mountedmicrophones and 29 accelerometers. Location of certain accelerometers were selected tocoincide identically with the equipment locations considered in the analysis to facilitatedirect comparison of the results. A real-time spectrum analyzer which incorporated a 6.4Hz constant bandwidth filter was used for data reduction.
The satisfactory correlation between predicted and measured sound pressure levels onthe RPV confirmed the assumptions on the primary sources of acoustic excitation andtheir respective intensities at the various fuselage stations. Thus the prediction techniqueused in the analysis provides a valid basis to estimate the acoustic levels on a general classof jet-powered RPV.
The primary structure vibration levels derived from the sound pressure levels using theMahaffey-Smith 90% confidence data compared favorably with the measured levels exceptat the low and high frequency extremes of the PSD envelopes where discrepancy rangedfrom +10 db to -10 db, respectively. This result demonstrated the need to introduce a cor-rection term to the computed PSD levels the using Mahaffey-Smith approach to achievebetter correlation between the predicted and measured data.
Flight test correlation of equipment vibration levels proved to be considerably moredifficult to obtain on an individual equipment basis due to differences in the physical lo-cation of the vibration transducers as well as limitations on the validity of the preliminaryanalysis results. It was therefore concluded that some of the flight test data could be in-corporated into an updated version of the equipment dynamic models so that a new setof analyses could be performed. This was accomplished and the results demonstrated animproved correlation between the equipment PSD's and the measured levels. These weresubsequently used in the specification of the equipment vibration environments on theRPV.
It is concluded on the basis of the foregoing correlations that analytical predictionmethods can be utilized satisfactorily to establish baseline environmental criteria for future
35

RPV and other flight vehicles. The opportunity to verify the predicted vibroacousticenvironments on th AQM-34L vehicle through a successful flight test program justifiesthis conclusion.
AEROACOUSTIC ENVIRONMENT OF RECTANGULAR CAVITIES WITHLENGTH TO DEPTH RATIOS IN THE RANGE OF FOUR TO SEVEN
L. L. Shaw, Jr., and D. L. Smith,AF Flight Dynamics Laboratory,
Wright-Patterson AFB, Ohio
Ever increasing flight conditions produce high dynamic loadings on both the aircraftand its internally carried stores. The intense oscillating pressure environment encounteredin open weapons bay cavities have resulted in severe vibration and buffeting problems duringsubsonic, transonic, and supersonic speeds. The oscillatory loads on the store, which area result of free stream flow over the open cavity, may result in weapon breakage, whileat the same time produce initial loads on the stores prior to separation that causes uncer-tain weapons trajectories.
This paper describes a series of flight tests in which the aeroacoustic environment offive different cavity configurations was determined. The configurations tested included:three empty cavities with length-to-depth (L/D) ratios of 4, 5, 7; one cavity with a L/Dratio of 7 with an ogive store symmetrically mounted in it; and one closed cavity con-figuration. The cavities were mounted in a modified munitions dispenser pod which wasflown on a RF-4C test aircraft. The test altitudes were 3,000 ft, 20,000 ft, and 30,000ft and the Mach number ranges were 0.61-0.93 for the 3,000 ft altitude and 0.61-1.30for 20,000 ft and 30,000 ft. Data were recorded continuously as the aircraft slowly ac-celerated from the lowest to the highest Mach number.
The cavities were instrumented with nine microphones. three static pressure ports,one accelerometer, and one thermocouple. The aeroacoustic pressure environment in thecavities was defined from these measurements, and typical results are presented. The re-sults were correlated with empirical wind tunnel predictions and formed the basis for amodified prediction method. The prediction scheme includes methods to predict thefirst three resonant frequencies, the fluctuating pressure amplitudes of these frequencies,and the one-third octave broadband spectrum. These are predicted as a function of L/Dratio, longitudinal cavity location, free stream Mach number, and free stream dynamicpressure. The prediction scheme can be applied to nearly rectangular cavities with L/Dratios in the range of 4 to 7 and for a Mach number of 0.6 to 1.3.
Also included in the paper is an example illustrating the application of the predictionscheme. The result of the example are compared with results obtained from a predictionscheme presented in the literature.
36

ACOUSTICALLY INDUCED VIBRATION PREDICTIONIN TRANSPORT AIRCRAFT
H. W. Bartel,Lockheed-Georgia Company, Marietta, Georgia
In transport category aircraft, vibration may be induced by a variety of independentcauses, each sufficiently different to require separate consideration in the vibration pre-diction process. The success of the analyst in predicting the complete vibration environ-ment will, in large part, hinge on the quality of the methods, data, and information hecan assemble to account for these various independent sources. This investigation wasconducted in response to that need for additional and improved methods. The objectivewas to provide a method for estimating acoustically induced structural vibration in jet-powered transport category aircraft. A number of magnetic tape recordings of noise andvibration level which were made recently on two contemporary military transport aircraftwere reassembled for use in this investigation, and processed in a more sophisticated andautomated fashion than accomplished previously. Additionally, a total of 30 flat andcurved structural panels were laboratory tested to obtain recordings of noise and vibra-tion data. The panel test data and the transport aircraft data formed the basis for thiswork, and the results therefrom. The familiar noise-vibration correlation plot was a pri-mary investigative tool in this effort. The measured data were available in sufficient quan-tity and quality to allow correlation of noise and vibration levels in third-octave frequencybands, with confidence lines statistically fitted to the data. These correlations were estab-lished with computerized sorting and plotting techniques for numerous ensembles of data.each having some common trait. The vibration data in these correlations were then op-erated upon in various ways and recorrelated to obtain indications of: (a) the relative re-sponse in three different axes or directions, (b) the relative difference between on-groundoperation and pressurized cruise flight, and (c) the effect of structural mass and rigidity onvibration level.
It was found that a given noise level excites consistently higher vibration levels in lab-oratory test panels than it does in aircraft structure of similar mass, rigidity, and config-uration. Laboratory test panels are suitable for exploring the relative influence of structuraland environmental parameters, but should not be used to predict aircraft vibration level.Until further work has been done to define the effect of various factors peculiar to aircraftstructure and its environment, only aircraft noise and vibration data should be used as abasis for vibration prediction. Vibration levels on the frames and stringers of shell typestructure were found to be of similar magnitude in the normal and lateral directions. Insome frequency bands, normal levels are slightly higher, while in other bands lateral levelsare higher. Vibration in the tangential direction is consistently lower. The ratio of lateral-to-normal and tangential-to-normal vibration level was determined statistically and foundto vary also with sound pressure level. Vibration in the pressurized fuselage was found tobe generally lower, at any given noise level, during pressurized cruise flight than duringengine run-up on the ground. The ratio of flight-to-ground vibration level was determinedstatistically and found to vary with confidence level. At high confidence levels this trend re-verses in the high frequency bands, where vibration during pressurized cruise flight is higher.An empirical expression for mass and rigidity effects was determined, which showed theeffects to be offsetting. The mass and rigidity of the structure used herein is thought to betypical of most conventional aircraft structure, whereby the effects of mass and rigidity onvibration would typically be small. Exceptions are not uncommon, however, and instancesare conceivable where mass and rigidity could deviate greatly from the trend found here(e. g., in high strength-to-weight structure such as honeycomb and composities, and in low
37
strength-to-weight structure such as used in high temperature environments). In such in-stances the effect of mass and rigidity on vibration level could be substantial. The datashowed considerable scatter which the normalizing equation, being limited to mass andrigidity effects, does not detect. Much of this scatter is thought attributable to variationin other factors such as damping, accelerometer positioning on the structure, unconven-tional vibratory response, spatial correlation and autocorrelation of sound pressures, andsound incidence. The outcome of this work was an assembly of charts and graphs foruse in predicting acoustically induced structural vibration in transport aircraft.
SIMPLIFIED TECHNIQUES FOR PREDICTINGVIBRO-ACOUSTIC ENVIRONMENTS
K. Y. Chang and G. C. Kao,Wyle Laboratories, Huntsville, Alabama
Research in seeking practical techniques or methods for predicting vibration environ-ments of flight structures subjected to acoustic environments has gained considerable at-tention in recent years. In this effort, mechanical impedance techniques were adapted totailor dynamic tests of highly critical and expensive components to ensure a highly accuratecontrol of response loads.
A method, based on Thevenins' and Norton's theorems, has been developed to predictbroad frequency range vibration criteria which account for both primary and componentload impedance for structures excited by random acoustic excitations. The force responseswere predicted by a one-dimensional equation which utilizes four types of parameters atequipment mounting locations. These parameters consist of input impedance of supportstructure, acoustic mobility of structural system, input impedance of component package,and blocked pressure spectrum. The accuracy of the equation in predicting force responseshas been verified satisfactorily and the method is currently being used for force-controlenvironments of complex structures.
However, exact analytical computation of these above four parameters are not practicalfor performing quick estimates with adequate accuracies. In order to simplify computationalprocedures of this method and to gain a wider application by engineers, a series of designcharts and nomograms was developed to eliminate the need for computer requirements andto provide adequate information with acceptable tolerance limits. This is accomplished bythe use of simplified equations derived from existing analytical solutions. The computationof structural impedances is evaluated in three different frequency ranges, namely: lowfrequency range or frequencies below the fundamental frequency of the shell, intermediatefrequency range, and high frequency range or frequencies above the ring frequency of theshell. The resulting impedance equation generally contains a frequency dependent and afrequency independent term. By employing logarithmic summation techniques, the com-putation and summation of individual impedance terms can be made graphically throughnomograms and design charts. Meanwhile, the blocked pressure can be converted fromeither far-field sound pressure or near-field sound pressure from a design chart. The acousticmobility term is determined from existing experimental data which is based on the nature
38

of similarity of the structural response. Finally, the summing of all the terms, as definedfor the force response computation, is carried out by the use of a logarithmic computa-tional chart.
Two example problems with different structural configurations were used to demon-strate computation procedures. Satisfactory agreements between analytical predictionsand experimental measurements were observed.
RESPONSE OF SEMI-PERIODICALLY STIFFENED PANELS TO CONVECTEDRANDOM PRESSURE FIELDS
G. Sen Gupta,The Boeing Company, Seattle, Washington
A lightweight panel stiffened by a set of stiffeners at regular intervals is used in manystructural constructions. Such panels are often subjected to various dynamic disturhan(es,e. g., random pressure fluctuations due to boundary layer turbulence, noise from jet engines.etc. A wave-propagation method applicable to such spatially periodic structures has beelndeveloped during the recent years. The purpose of the present work was to study the ef-fect of any deviations from periodicity in stiffener locations on the panel response: inparticular, the object was to see if any such non-periodicity in stiffener locations, eitherby design or due to difficulty (and cost) of fabricating an exactly periodic structure, hasany beneficial or adverse effect on the response and sonic fatigue lift of the structure.
For this purpose the existing wave-propagation method has been combined with thetransfer-matrix method to generate a new method which retains the desirable features ofboth and is also free from some of their limitations. This method is applicable to "seni-periodic" structural configurations consisting of repetition of a basis unit which containssections of unequal length and/or stiffness properties.
In this study, this method has been applied to predict the response of a structure inwhich the basic unit is made up of two sections of unequal lengths. The excitation con-sidered is band-limited white noise at normal incidence. The response of this semi-periodicstructure has then been compared with that of a periodic structure of equal weight.
The low frequency response of a semi-periodic structure is controlled by two modesof the basic two-span unit. When the span lengths are equal (i.e., the structure is peri-odic), the higher mode is very strongly excited. The lower mode is antisymmetricand therefore it does not contribute to the total response. As the span lengths are changed.the contribution of lower mode increases and that of the higher mode decreas(s. Thetotal response passes through a minimum for a configuration in which one span length isabout 33% shorter than the other (i. e., for a span ratio of about .67). For this config-uration, the maximum r.m.s. stress is reduced by about 18%, compared to the res)pons,of the periodic structure of equal weight. The sonic fatigue life is iorrespondingly in-creased by a factor of three to five. For various other ratios of span lengths, the responseis higher than that of the periodic structure.
Using the proposed configuration, therefore, the sonic fatigue life of a stiffened panelcan be improved. Alternatively, for a given level of excitation, the skin thickness can hereduced, resulting in total weight saving.
39

REFERENCES
1. G. Sen Gupta, "Natural Frequencies of Skin-Stringer Structures Using a Wave Ap-proach," J. Sound Vib., v16, n4, 1971.
2. D. J. Mead, "Vibration Response and Wave Propagation in Periodic Structures,"ASME Paper No. 70-WA/D3-3, Winter Annual Meeting of ASME, N. Y., Novem-ber 29-December 3, 1970.
3. G. Sen Gupta, "Dynamics of Periodically-Stiffened Structures, Using a Wave Ap-proach," Ph. D. Thesis, Univ. of Southampton, England, July 1970. Also avail-able as: AFML-TR-71-99, Wright-Patterson Air Force Base, Ohio, May 1971.
4. E. C. Pestel, F. A. Leckie, "Matrix Methods in Elastomechanics," McGraw-Hill, 1963.
5. G. Sen Gupta, "On the Relation Between the Propagation Constant and the Trans-fer Matrix Used in the Analysis of Periodically Stiffened Structures," J. Sound Vib.,vIl, n4, 1970.
40

ISOLATION AND DAMPING
MATRIX METHODS FOR THE ANALYSIS OF ELASTICALLYSUPPORTED ISOLATION SYSTEMS
G. L. Fox, Barry Wright Corporation, Burbank, California
It has been shown 1 , 2 ,3 that when a rigid body is supported by a number of linear springsand dampers, the resulting six coupled, linear, second order differential equations can be writ-ten in matrix notation. With the availability of matrix routines in most digital computer li-braries, this has become a popular representation.
To be presented is a scheme whereby the matrices of coefficients in the equations aredeveloped using six-rank square matrices. The advantage of this technique is that instead ofcomputing four or five three-rank submatrices which must be placed in the proper locationsof the six-rank matrix, the six-rank matrix is computed directly. This is accomplished byallowing the translational and rotational coordinates to appear on an equal footing. Becausetorques or rotations do not have to be "added in," but appear automatically in the equa-tions, a greater unity and simplicity is achieved and the meanings of the terms become moretransparent.
The basic problem is to transform vectors, e.g. forces, displacements, small rotations;and matrices, e.g. inertia, stiffness or damping, from one point and orientation in space toanother. This is accomplished by applying a rotation transformation and then a positiontransformation. The transformations are performed, as usual, by matrix multiplication, ex-cept that in the scheme presented the vectors have six components, three translational andthree rotational, and the matrices are all square and of six rank.
The rotational transformation is developed in detail. Rotations about all three axes areincluded for generality. The inverse of the displacement transformation is derived and shownto transform vectors in the reverse direction. For completeness, the final matrices are writ-ten out in detail.
If the isolators themselves are mounted on a resilient support of negligible inertia anddescribed by its own stiffness and damping matrices, a second set of six coupled differentialequations must be solved simultaneously with the first set. It is shown that these twelveequations reduce to six equations but are of third order. For steady-state sinusoidal excita-tion or free vibration the equations of motion are shown to reduce still further to a formidentical to that of a rigid support, but with an equivalent stiffness-damping matrix whichhas elements that are complex numbers.
The solution of the differential equations are discussed for various types of cases. Freevibration results in an eigenvalue equation. It is shown that the eigenvalues and eigenvectorsare complex if the damping is not zero. This gives rise to phase differences and exponen-tional decays of the modes. A special case of a two degree of freedom system with couplingbetween the rotational and translational modes is considered and is shown to agree with anearlier work. t
41

For forced sine excitation the single degree of freedom system with a resilient supportis also solved algebraically and shown to agree with published results. 5 The differences inthe transfer matrix for foundation motion and a force applied directly to the mass are com-pared and shown to be identical as in the case when the matrices are diagonal, that is, wheneach degree of freedom is independent of the others. The most general case is that of tran-sient excitation. The differential equations can then be solved usiig the Runga-Cutta nuner-ical integration technique which is usually found in computer program libraries.
REFERENCES
1. Stephen H. Crandall and Robert B. McCalley, Jr., "Numerical Methods of Analysis," inShock and Vibration Handbook, C. Crede and C. Harris, Eds. (McGraw-Hill Book Co.,Inc., New York, 1961) Vol. 2, Chapter 28.
2. Leonard E. Smollen, "Generalized Matrix Method for the Design and Analysis ofVibration-Isolation Systems," The Journal of the Acoustical Society of America, Vol.40, No. 1, 195-204 (July 1966).
3. Thomas F. Derby, "Decoupling the Three Translational Modes from the Three Rota-tional Modes of a Rigid Body Supported by Four Corner-Located Isolators," The Shockand Vibration Bulletin, Bulletin 43, Part 4, 91-108 (June 1973).
4. Francis H. Collopy, "Damped Vibrations of Elastically Supported Rigid Body withCoupling Between Translation and Rotation," The Shock and Vibration Bulletin, Bul-letin 36, Part 7, 135-144 (Feb. 1967).
5. Jerome E. Ruzicka and Richard D. Cavanaugh, "Elastically Supported Damper SystemProvides a New Method for Vibration Isolation," Machine Design (October 6, 1958).
IMPACT ON COMPLEX MECHANICAL STRUCTURES
S. F. Jan and E. A. RippergerUniversity of Texas, Austin, Texas
The finite element method appears to be ideally suited to the problem of computingthe displacements, velocities, and accelerations at selected points in a complex structure sub-jected to impulsive loading. To apply this method of analysis one must first prepare or selecta conceptual representation of the continuous structure as an assemblage of structural ele-ments interconnected at nodal points. The idealized structure is assumed to be acted on byexternal equivalent forces and to possess equivalent inertial properties only at the nodalpoints. Thus the continuous structure is replaced for analytical purposes, by a lumped param-eter system. The accuracy of the predicted dynamic response of a structure will dependon how well the structure is represented by the selected lumped-parameter model. It hasbeen reported that even for a very simple beam or uniform plate with boundary conditionsthat can be exactly expressed in mathematics, errors in the predicted responses can easily beas much as 35 percent. Although no investigation of the validity of lumped parametermodels for complex structures, such as vehicles, has been reported in the literature, it may beassumed that discrepancies of even more than 35 percent can be expected for poorly
42
represented structures. The general details of the finite element method have been discussedin the literature. However, the nature of the model which will best represent a structuresuch as a vehicle, with its varied elements, irregular geometry and discrete masses, is not atall clear. The primary objective in this study has been to select a model and then determineby computation and by experiment how valid the model is. A model for representing a spe-cific vehicle, namely the M-37 military truck cushioned for airdrop, is used to illustrate theprocedure.
It is found that the response of a structure such as the M-37 and subject to impact load-ing is not sensitive to the elastic properties of the interconnecting members. Thus the devel-opment of a suitable lumped parameter model is simplified. Special attention must be given,however, to the more important components of the vehicle.
Experimental results show that an appreciable portion of the energy at impact is dissi-pated in structural damping. Hence damping must be included in the equations of motion.
The most essential factor affecting the dynamic response of the system is the inputforce. Thus this force must be carefully simulated.
ENERGY ABSORPTION AND PHASE EFFECTSIN SHOCK EXCITED COUPLED SYSTEMS
Charles T. MorrowAdvanced Technology Center, Inc., Dallas Texas
The analysis of energy absorption and phase-related uncertainties is based on an ideal-ized model consisting of two simple damped resonators, the second resonator being attachedto the mass of the first. If the first resonance frequency is allowed to increase beyond limit,the model becomes a single simple resonator, as a special case. The focus of the analysis ison the peak acceleration of the second mass and the energy absorbed in the second damper.To simplify the mathematics and make the model correspond to a critical case for reliability,it is assumed that the second resonator does not load the first, but the conclusions are notlimited to this assumption. The analysis is limited to shock pulses (such as the terminal peaksawtooth) whose dominant feature is a terminal step function, so that we can assume for thetwo-resonator model a residual response consisting of two transients at the natural frequen-cies of the two resonators, and these transients become the primary cause of energy dissi-pation and peak response.
It is shown that the energy dissipated in a single simple resonator is simply related tothe undamped residual spectrum. In the two-resonator model, both the peak response ofthe second mass and the energy dissipated in the second damper are simply related to the un-damped residual spectrum except for an uncertainty from an unspecified relative phase forthe two transients.
The introduction of energy dissipated as an additional factor in the severity of a shockmakes the residual spectrum a more general criterion, less dependent on the assumption offailure modes resembling brittle fracture. If energy increases with peak response, a ductilematerial that could otherwise survive one extreme strain becomes more likely to fail. Mal-functions that might be insensitive to one peak response become more likely to occur.
43

In addition, consideration of energy dissipated as well as peak response provides addi-tional reason to focus on residual spectra rather than initial spectra, even if these are inter-preted as representative responses rather than descriptions of the excitation. Relatively littleenergy is dissipated during typical standard pulses.
The phase-related uncertainty results in part from the fact that two transients differingsomewhat in frequency can beat against each other so that the peak response does not occuruntil after some energy has been dissipated. This effect becomes particularly evident if the twotransients are similar in duration and initial peak value. In addition, if two transients differwidely in frequency, the peak response can be rather sensitive to the phase of the lower.Finally, it can be shown that if the phase characteristic of the excitation is not proportionalto frequency, one transient will dissipate some energy before the other is initiated.
It is shown that variability of response energy and peak response can be held withinreasonable limits by tolerances placed on a nominal phase versus frequency characteristic aswell as a nominal magnitude versus frequency characteristic. The best way to establish thenominal phase characteristic for the simulation of particular shocks would require furtheranalysis.
USE OF RUBBER WEDGES TO REDUCE FUSELAGESTRUCTURE ACOUSTIC RADIATION
Leo M. ButzelBoeing Commercial Airplane Company, Seattle, Washington
The use of thick, zig-zag shaped foam rubber pads-referred to as "rubber wedges"-toreduce interior acoustic radiation of aircraft fuselage structures has been irregularly understudy at Boeing for some time. A fair amount of experimental data dealing with the effectof these devices when applied to structure has been accrued. In certain instances, includingan actual flight test, the acoustic attenuation produced by these devices has been impressive,much greater than could be produced by an equal weight of damping tape. It is conjecturedthat in these instances the wedges functioned primarily as viscoelastic tuned dampers whichresonated in a thickness-wise mode. A basic theory, its predicted qualitative impact on thedynamic and acoustic behavior of laboratory and actual aircraft structures is discussed. Theobserved behavior of actual structure is present and is qualitatively compared to that pre-dicted from theory. A comparison with damping tape type treatment is made.
RESPONSE OF THICK STRUCTURES DAMPED BY VISCOELASTICMATERIAL WITH APPLICATION TO LAYERED BEAMS AND PLATES
M. Paulard, P. Trompette, and M. LalanneInstitut National Des Sciences Appliquees, Villeurbanne, France
Addition of viscoelastic material is now often used to damp structures. In this way, thelevel of vibration can be significantly lowered in a wide range of frequencies.
44

In the paper, we present, using finite element modelisation, the prediction of the re-sponse to harmonic forces of thick layered damped structures with application to thickbeams and plates.
These three dimensional structures are described by a very large number of degrees offreedom. In order to reduce this number, the response is calculat d as follows:
First, frequencies and mode shapes of the structure are calculated neglecting viscoelasticdamping ratio. Then, using these frequencies, mode shapes, and including the damping ratio,a pseudo modal response of the structure is obtained. We call this response pseudo modalbecause for the whole structure, the damping matrix is only proportional to. the stiffnessmatrix of the viscoelastic material.
Damping ratio and Young's modulus of viscoelastic materials are known to be func-tions of temperature and frequency. To get numerical values of these characteristics, a thicklayered beam is tested and calculated using the method previously described. The results areused to predict the response of the structure damped with thick viscoelastic layers.
The structures studied here are thick plates, but the method can be applied to morecomplicated devices. Various types of finite elements with co:sistent mass matrices havebeen tested; mode shapes and frequencies have been obtained using a simultaneous iterativetechnique. Computer programs have been written in FORTRAN IV, and experiments havebeen performed with a Spectral Dynamics SD 1002 system.
The thick beam and plate have been tested under free-free conditions and excited sym-metrically. The agreement be, xeen calculated and measured driving point impedance mod-ulus is good in a wide range of frequencies.
In conclusion, we think that thib method can be used to get dynamical behaviour ofvarious systems and more specially of possible pratical dampers.
CONTROLLING THE DYNAMIC RESPONSE LEVELS OF
JET ENGINE COMPONENTS
David I. G. Jones and C. M. CannonAir Force Materials Laboratory, Wright-Patterson AFB, Ohio .45433
University of Dayton, Dayton, Ohio 45469
Most jet engine components, such as turbine blades, compressor blades, stators, inletvanes etc., suffer from vibration problems. As engines become ever more complex, andthrust to weight ratios increase, it will become progressively more difficult to design thesecomponents so that their natural frequencies do not lie close to some multiple of the bladepassage excitation frequency under some operational condition or other. For this reason, thealternative of using damping technology to control peak response levels even at the conjunc-tion of natural and excitation frequencies will eventually become evident to designers for atleast the most critical components in each engine.
The purpose of this paper is to (a) discuss the modal response behavior of typical ex-
amples of the aforementioned cc 2onents, (I-) show for each case how one or more typical
45

damping techniques can reduce resonant vibration amplitudes significantly, through the ap-plication of suitable room temperature damping treatments, (c) demonstrate how the sametypes of treatment can be used in conjunction with appropriate damping materials, such asenamels, to give the same amplitude reductions at other temperatures even up to 2000'F,and (d) discuss the critical engineering problems to be overcome before each type of treat-ment can be used successfully under operational conditions.
INVESTIGATION OF THE EFFECT OF DAMPING TREATMENTSON THE RESPONSE OF HEATED FUSELAGE STRUCTURE
J. P. Henderson and M. L. DrakeAir Force Materials Laboratory, Wright-Patterson AFB, Ohio
University of Dayton Research Institute, Dayton, Ohio
The Air Force Materials Laboratory, in conjunction with the University of DaytonResearch Institute, is in the process of completing an experimental program to developvibration damping treatments for possible use in the reduction of sonic fatigue in aircraftstructures operating at elevated temperatures. Resonant frequencies, mode shapes, anddamping of a structural specimen, representative of the aft fuselage of the B-i, were deter-mined for configurations with and without damping treatments. The goal of this program isto determine specific damping treatments that would be effective on this type of structurein the service environment which includes elevated temperatures up to 3000 F (from jet plumeradiation during take-off operations), exposure to fuel (since materials would be located in-side of an integral fuel tank) and long term exposure to moisture. This investigation was di-vided into essentially four stages.
1. Measurement of natural frequencies and mode shapes in an undamped specimenrepresentative of the full scale structure.
2. Evaluation of effects of elevated temperature, fuel, and water environment on theperformance of candidate damping materials.
3. Measurement of the effect of room temperature damping material on the responseof the structural specimen.
4. Measurement of the effects of high temperature on the undamped specimen andevaluation of candidate damping materials on the test specimen at high tem-perature.
This paper will describe the structural response measurement portions of this investiga-tion, including the application of impact testing techniques utilizing digital fast Fourier anal-ysis. Techniques for rapidly determining resonant frequencies, mode shapes and structuraldamping will be discussed. Frequency response and damping data measured with analog sinesweep methods are compared with similar data obtained with the faster digital techniques.A method for determining modal damping by eurve fitting in the complex plane will be dis-cussed along with the limitations of this method. Data will be presented which illustratestransfer functions (showing resonant response peaks), mode shape plots (illustrating in boththree dimensions and one dimension the displacements of the structure associated with
46

specific resonant peaks) and Nyquist plots (relating the real and imaginary response vectorsin the complex plane) of both damped and undamped structures.
AN ALTERNATIVE SYSTEM FOR MEASURING COMPLEXDYNAMIC MODULI OF DAMPING MATERIALS
David 1. G. JonesAir Force Materials Laboratory, Wright-Patterson AFB, Ohio
Despite over two decades of progress in developing techniques for measuring complexdynamic moduli of elastomeric, plastic and enamel-like materials, it is still difficult at timesto ensure that accurate results are obtained. For example, the vibrating beam type tech-niques are difficult to use for measuring Young's moduli whose real parts are less than10,000 Lb/in 2 , and most techniques not using beams need expensive instrumentation for re-liable use.
In this paper a new variation on these well known themes is examined, namely a com-promise between the vibrating beam and nonbeam techniques. The system considered com-prises a rigid rod supported horizontally by two beam-like metallic springs at the two ends.and free to move horizontally only. The specimen to be tested is then placed between thecenter of the rod and a rigid block, either in the form of a shear link or a short beam. Thesystem is excited by a transducer at one end and the response picked up at the other end.The technique can be used for high or low temperature measurements by enclosing the spec-imen in an environmental chamber or a furnace. In order to establish the advantages andlimitations of the technique, tests were conducted on several soft and stiff materials at vari-ous temperatures and the results, which will be presented in the paper, show considerablepromise.
47

CLASSIFIED SESSION
COMPARISON OF EXPERIMENTAL AND ANALYTICAL LARGEDEFORMATION SHELL STRAINS ON A MISSILE SUBJECTED
TO AN ASYMMETRIC BLAST LOADING
Lawrence J. MenteKaman AviDyne, Burlington, Massachusetts
Several blast tests were performed on an instrumented full-scale missile oriented side-onto the blast in the Sandia THUNDERPIPE blast tube facility. These tests provided measuredpressure and strain time history data on the body of the test vehicle at various blast incident
overpressure levels. These data are used to evaluate the DEPICS nonlinear shell response codeas an adequate analytical tool for predicting shell response of a missile subjected to direct
blast pressure loading and undergoing overall bending. The primary instrumented shell sec-tion of the missile consisted of a nearly cylindrical shell with three material layers. The innerfilament-wound fiberglass layer is the main structural layer and is separated from an outer
heat shield by a layer of syntatic foam. Near the center of this shell section the pressureswere measured at 22.50 intervals on the outer surface and the axial and circumferentialstrains were measured at 300 intervals on the structural layer. From these pressure data andother pressure measurements along the body, a pressure model was constructed to describethe spatial and temporal pressure variations on the shell section and the total running normalloads on the missile for determining the overall bending response. A vehicle bending codewas used to determine the bending moment time history at the shell section of the missile.Thus, the shell section is considered to be simultaneously loaded by the direct blast pressureand the blast induced bending moment.
The DEPICS shell response code used in this correlation effort is based on theNovozhilov nonlinear strain-displacement relations for large displacements of cylindricalshells and can treat multiple layers of linear, elastic, isotropic or orthotropic material. TheLagrangian equations of motion are developed through an energy formulation and are solvedthrough numerical methods using a modal-type analysis. Both time-dependent lateral pres-sure loading and end bending ,nnments can be applied to the cylindrical section which issimply supported with or without axial constraints at the ends. The aforementioned pressuremodel and the analytically determined end bending moments are used with DEPICS to de-termine analytically the circumferential and axial strain time histories on the shell sectionfor comparison with the corresponding experimental strain responses. Refinements were in-troduced into DEPICS to investigate the effects of including rotary inertia, nonlinearities inthe change of curvature quantities and conical shell geometry for the test condition pro-ducing the largest shell response. It was found that these effects were not overly significant,except for the differences in the axial strain between a cylindrical and conical shell represen-tation.
The correlation presents direct comparisons of the major experimental and analyticalcircumferential and axial strain time histories at 0 = 00 and 180", where 0 = 0" defines thewindward ray, on the outer and inner surfaces of the structural fiberglass wall of the shellsection. The tests where performed at various pressure levels that produced geometric linear
49
i hILOa. ' pAai MA~hI& -NOT F1 TIA
and nonlinear deformations of the elastic shell section. The DEPICS shell code gave veryfavorable predictions of the changing strain pattern in the shell section associated with thelinear res)onse observed at the low pressure test levels in contrast to the nonlinear responseol)served at the high pressure test levels. The strain pattern is characterized by the largestcirC umferential strain occurring at 0 = 180 on the leeward side in the linear response testsand at 0 = 0° on the windward side in the nonlinear response tests. The time of maximumresponse at 0 = 00 increases significantly as the strain response becomes geometrically non-linear.
Acceptable agreement was obtained from comparisons of the analytical and experimen-tal major circumferential and axial strain response time histories on the shell section for thevarious test conditions. The DEPICS shell code demonstrated the capability of predictingstrain response in both geometric linear and nonlinear regions. It was found that strain re-sponse time histories are very sensitive to the pressure distributions around the body duringthe engulfment of the blast wave. Thus, the major uncertainties in analytically predictingthe strain responses stem from the pressure loading model based on limited experimental dataand the axial end boundary conditions on a shell section which is part of a vehicle under-going overall bending.
THE SHOCK ENVIRONMENT ASSOCIATED WITHTHE AIRCRAFT DELIVERY OF A NAVY MINE
Houston M. ColeNaval Ordnance Laboratory
White Oak, Silver Spring, Maryland
Most Navy mines are designed so that they can be delivered by aircraft. The shocks as-sociated with this aircraft delivery include: (a) bomb-rack ejection, (b) parachute actuationand deployment, and (c) water entry. These shocks are complex in nature, and are not easilydescribed by a single value of peak acceleration or pulse duration.
The accelerations associated with each of these aircraft-deliverv shocks were measuredduring field tests of a new 2000-pound Navy mine. Field tests were conducted over a two-year period using several different types of test vehicles. Acceleration- iere measured at sev-eral locations within the test vehicles and recorded on magnetic tape using a small, self-contained instrumentation system. The heart of the instrumentation oystem is a rugged, 14-channel tape recorder with FM record electronics. Acceleration is recorded on tape for play-back in the laboratory after the test vehicle is recovered. Total recording time is limited toabout 40 seconds since tape capacity is small. This recording time is sufficient, however, torecord each of the delivery shocks on a single tape record for many delivery conditions. Theacceleration records obtained are believed to represent some of the most complete recordsavailable on the tactical shock environment associated with the aircraft delivery of a Navyweapon.
Acceleration records obtained were digitized and then analyzed in various forms toassess the effects of these shocks and to establish tests to simulate these effects in the labo-ratory. Sample acceleration records, along with the velocity-time records obtained by theintegration of these acceleration records, are presented. Shock spectrum analyses of recordswere conducted and were the primary tool used for assessing the results of these tests. Anal-ysis indicates that, for all practical considerations, water entry can be considered to he the
50

most damaging shock associated with the aircraft-delivery environment. This statement isbased on shock spectrum analysis between frequencies of 1 and 2500 Hz-analysis at thesefrequencies indicates that water entry consistently excites the highest responses of the deliv-ery shocks considered. The impact and drag phases associated with the classical water-entryshock pulse are clearly visible on the records obtained. The velocity changes associated withthe impact and drag phases of a particular shock are visible on the shock spectrum of thatshock. The impact phase becomes insignificant, however, and virtually disappears for lowwater-entry angles.
This new mine has several large subsystems or components associated with it. Recordswere obtained under similar delivery conditions for vehicles with and without these compo-nents. The components produce secondary impacts at water entry which can be detected onthe acceleration-time records and produce a noticeable increase in the computed responsesover a wide range of frequencies.
The effects of water-entry shock are simulated at NOL using air guns with two-phasepistons. Impact of the two parts of the piston produces a high acceleration, short durationshock simulating the impact phase of water entry. The two parts of the piston then lock to-gether and accelerate down the barrel of the air gun as a single unit, simulating the low g, longduration drag phase associated with water entry. The shock spectrum produced by this labo-ratory simulation was computed and compared to the spectrum obtained from field meas-urements. Initial test levels proved to be overly conservative and new test levels were estab-lished. The new tests produce spectra which closely approximate the ones obtained duringthe field tests. While air guns have been used by NOL to simulate the effects of water entryfor many years, test levels have traditionally been selected by comparing the velocity changesof the impact phases and the peak accelerations of the drag phases of the respective shocks.This effort is believed to be one of the most complete and accurate attempts, to date, byNOL to characterize a complex water-entry shock by its shock spectrum and then produce asimilar shock spectrum in the laboratory with its air guns.
ELASTIC RESPONSE OF SUBMARINES TO END-ON NUCLEAR ATTACKS
T. A. GiancofciNaval Ship Research Development Center
Portsmouth, Virginia
INTRODUCTION
A knowledge of the shock motions that underwater weapon attacks produce in a sub-marine is a necessary prerequisite for the design of shock resistant pressure hulls and internalequipment installations. It must be expected that end-on attacks by long-duration nuclearshock waves can produce shock motions throughout the submarine which are comparable inmagnitude to those which result from side-on attacks of equivalent severity. The end-on re-sponse of a submarine to nuclear attacks has not, however, been well documented, eitheranalytically or experimentally, and a reliable method for predicting a submarine's overall re-sponse to such attacks is needed.
In a recent investigation, conducted by the Naval Ship Research and Development Cen-ter, the loading environment for submarines subjected to end-on attacks was studied and a
51

simplified method to predict the shock motions in the longitudinal direction was developed.The results of that study suggested that a satisfactory description of the axial response of asubmarine may be obtained by mathematically modeling the pressure hull as a one-dimensional, lumped, spring-mass system with all motion restricted to the longitudinal direc-tion; that is, the direction of the propagating wave front.
A recent series of underwater explosion (UNDEX) trials against a stiffened, cylindricalmodel has provided an excellent opportunity to determine, under well controlled circum-stances, the end-on response of a submarine-like model and to fully evaluate the accuracyand suitability of the prediction method.
OBJECTIVE
The objective of this research was to develop a reliable method for predicting the longi-tudinal response motions of a submarine pressure hull and internal equipment installationswhich have been subjected to end-on attacks from a nuclear weapon.
SCOPE OF PAPER
The development and application of the lumped-parameter prediction method for end-on nuclear attacks will be presented in two parts. Initially, the loading environment and shellresponse analyses will be discussed. Also, the simplifications, assumptions and limitations ofthe lumped-parameter appr,)ach will be cited. In the second part of the paper, the UNDEXtrials against the cylindrical model will be described and the measured and predicted longitu-dinal response motions will be compared. A brief descriptiW, if i):..nned modifications andexpansion of the method will also be included.
LUMPED-MASS PREDICTION METHOD
In applying the lumped-mass prediction method, the submarine is modeled mathemati-cally as a discrete, undamped system with unrestrained boundaries. The system is composedof lumped masses, connected by linear springs having a finite number of degrees of freedom.The familiar method of modal analysis is then used to determine the transient response ofthe system.
It should be pointed out that the spring-mass prediction method is not restricted to auniform cylindrical shell but can take into account structural and mass variations along thelongitudinal axis. Also, the method can readily be extended to include the response of elasti-cally mounted internal equipments.
DISCUSSION
The predicted response motions for the end-on attacks correlated quite well with theexperimentally obtained velocity and strain gauge data even though rather significant simpli-fying assumptions have been introduced.
Most notably the results of this study indicate that for end-on nuclear attacks inter-action effects of the impinging shock wave can be minimized and that an accurate des'ription
52

of the response of such a complex structure as a submarine can be obtained using a muchsimplified lumped, spring-mass approach. Furthermore, it was observed that longitudinalshock motions due to end-on attacks can, in fact, equal or exceed similar motions from side-on attacks of equivalent severity.
PLASTIC DESIGN ANALYSIS OF SHIPBOARD EQUIPMENTSUBJECTED TO SHOCK MOTIONS
L. T. ButtNaval Ship Research and Development Center
Portsmouth, Virginia
INTRODUCTION
The complexity of modem naval ships and submarines requires constant updating of de-sign methods and procedures. This is particularly true of light high-speed advanced designs.New design methods and design criteria which will result in weight and space savings are es-sential. In current naval vessels there exist structures which are obviously overdesigned andwould allow significant savings in weight and space; foundations in particular.
Shipboard equipment can be divided into three categories of design. One category (anbe classified as those equipments which always require a close alignment. For these equip-ments it is necessary that response to operating and shock loads be confined to the elasticrange. Equipments such as SINS, turbines, reduction gears, shafting, turbogenerators andsimilar items fall in this category. A second category which includes a large majority of ship-board structures and equipment may be classified as those items which do not require align-ment and can allow small deformations. Piping, resiliently-mounted equipments and manyfoundations for example can be considered for this category. The enormity of this categoryin particular warrants a careful consideration of new methods which may lessen costs, weightand space requirements. A third category may be classified as those items which can toleratelarge deformations (deformations greater than four elastic limit displacements). Foundationsfor electronic cabinets, weapon cradles and dollies, decks, stanchions and other support struc-tures can be considered for this category. As can be seen from these examples that "hard-to-harden" and shock sensitive item support structures are major items in this category. Meth-ods which result in significant shock protection are advantageous and necessary for manyitems in this category.
Little attention has been given to the efficiency of equipment design. Over-designedfoundations for example can be improved significantly by taking advantage of the reservestrength in the material above its yield point. This reserve strength comhined with the re-dundancy generally encountered in foundation design can serve to optimize foundation effi-ciency. To make use of the reserve strength requires plastic design proce(lures. ('urrently.plastic design procedures are practically nonexistent for dynamic loads.
Simple one degree-of-freedom beam structures are plastically desiglned using the limitload procedure (see DDS 9110-7). More complex structures may be designed using an elasticanalysis procedure (DDAM) but using reduced inputs. This procedure results in a structurewhich will deform plastically at the unreduced shock level. The resulting deformation or
53

response of the structure is of course unknown. This limited usage of the plastic design con-cept does not allow optimization of design efficiency.
PU RPOSE
The purpose of this paper is to delineate the plastic design method for shipboard appli-cation application and the expected gains.
PLASTIC DESIGN METHODOLOGY
Plastic design is the art of utilizing the reserve strength of ductile materials to optimizethe efficiency of structures and to simplify the required analysis. In general this is accom-plished by designing a structure for a collapse load greater than the working load. The result-ing structure bears the working load with negligible permanent deformation. The formationof a plastic hinge in a structure does not necessarily allow collapse but merely allows a re-distribution of stresses. The reserve strength beyond yield allows rotation of the plastic hingeas the load is increased. Redistribution and the increase in load will ultimately result in acollapse mechanism. The collapse mechanism in terms of a static load constitutes catas-trophic failure; however, the collapse mechanism also constitutes energy dissipation greaterthan the elastic strain energy per unit of displacement. For example, the energy dissipatedat a displacement twice the elastic limit in a simple structure may be four times that absorbedelastically. At two elastic limit displacements, deflections are not likely to be visible.
CONCILUSION
The inherent reserve strength in structural steels will allow optimization of the strut-tural efficiency of shipboard structures. It is expected that foundation weights can be, re-duced from that required for elastic design if maximum set displacements are allowed toreach three elastic limit displacements. Similar weight reductions can be expected in struc'-tures other than foundations where plastic design is applicable. The weight savings dependon the trade-off allowances for all the factors involved. Considerations for noise, vibration,and maximum set deformations must enter the trade-off allowances.
In addition to the savings in weight which relates to costs, there is also an expect(d costreduction due to the simplicity of plastic design analysis methods.
Additional gains are possible employing i)lasti( deformation concepts in shock miti-gation.
HIGH PERFORMANCE VIBRATION ISOLATION SYSTEMFOR THE )1) 963 GEARS
P. C. Warner, Westinghouse Electric Corporation, Sunnyvale, CaliforniaD. V. Wright, Westinghouse 1 & I) ('enter, Pittsburgh, Pennsylvania
Specifications for main reduction gears for the D) 963 ChLss of destroyers calle(l forstructureborne vibration levels markedly lower than vibration levels measured on the similar.though smaller, reduction gears supplied for the I)E 1052 ('lass of destroyer escorts. It was
5.1

judged that such a large incremental improvement in structureborne noise levels could notbe obtained with assurance by any conventional gear design and manufacturing techniqueparticularly in view of weight and cost limitations. Thus, a populsion gear vibration isola-tion system was proposed. For a number of reasons, a standard Navy rubber mount typeof system was not acceptable. An unconventional but much stiffer isolation system fea-turing damped tension-compression metallic isolators was developed. Although it has notyet been tested at sea, its performance has been determined in extensive shop tests onfully loaded gears.
It was required of the new isolation system that it produce 20 dB of insertion loss inthose critical frequency ranges where both first and second reduction mesh frequency oc-cur. This goal has been met. Further, since the basic stiffness of the isolation system isan order of magnitude larger than that of a typical rubber mount system, (vertical naturalfrequency of 19 cps) care had to be exercised so that neither unbalance vibrations in thegear shafting, nor propeller blade rate excited motions would be unduly magnified byrigid body modes of the gear case. Since the frequency range of interest extends into thehigh frequency region where no valid structureborne noise data were available, it wasdeemed prudent to maintain good vibration isolation up to 20 KC. These considerationsrequire that isolator surge frequencies be reasonably damped, and that the isolator highfrequency impedance be small compared to the high frequency impedance of both the re-duction gear and the ship's foundation.
To demonstrate the performance of such an isolation system in a shop test requiresa test foundation whose impedance characteristics approximate those of the ship's founda-tion on which the isolated gear system is to be mointed. Such a foundation was designedand tested. It is described in this particular paper only in general terms sufficient to per-mit proper interpretation of given test results.
Since it is not possible for an isolation system to be soft enough to have high isola-tion performance yet strong enough to carry the maximum values of normal loads plusshock loads, a snubber system had to be designed and carefully integrated with the isola-tion system. In fact, snubber clearance considerations strongly influence isolator designand determine the cyclic life of the isolators.
The isolator system is described and information on its vibration transmission chara-teristics is presented. The reasons behind key choices in the design are discussed as arecertain limitations of the design and the reasons for them.
Eight 7075 aluminum vertical isolators carry vertical loads and torque reactions.These isolators consist of a central compression member which bolts to the ship's founda-tion, and pierces the gear flange. At the top of the inner member, an outer tension mem-ber 'folds back' and bolts to the top of the gear case flange. This complicated and exlpensive design was dictated by time and geometry considerations. Both the inner and outertubes, the flexible members, are damped with a heavy layer of Lord's LD502 dampingmaterial. Design features required to use this material successfully are discussed. Thehorizontal isolators are made from 6AL4V titanium and are simple tension-compressionrods. They also are damped by the LD 502 damping material.
Important properties of the isolator such as first surge frequency and Q were determined by calculation and confirmed by test. The shop test vibration performance of theoverall system is described and conclusions are drawn. In order to estinmate the per-formance of the isolator system as distinct from the overall i'rforman(e of the gear and
55

isolation system, special stiff steel connectors were made. These replaced the isolators fora series of tests so that estimates of insertion loss could be made. Reasonable estimates ofinsertion loss and ansmission loss are made.
DESIGN AND MEASUREMENT OF A HIGH IMPEDANCE FOUNDATION TO20 KHz AND USE OF DATA IN CORRECTING NOISE MEASUREMENTS
J. R. HuptonWestinghouse Electric Corporation, Sunnyvale, California
When structureborne noise measurements are made on a component for shipboarduse they are normally conducted in accordance with MIL-STD-740B. Under this normalprocedure, the component is mounted on some type of Navy standard mount for the pur-pose of reducing the impact of extraneous shop background noise and insuring that all ofthe components of a similar nature are tested in similar environmental conditions. Thismeans that each component is exposed to approximately the same impedance (i.e., theresilient mounts).
This procedure is quite satisfactory when an acceptance criterion is available for thesetest conditions. Such a criterion might be based on historical data of like or similar com-ponents. If such an acceptance criterion is established by means of analytical computa-tion based upon a desired sound pressure level in the water and transfer functions betweenthe hull and the components foundation, then it becomes more desirable to eliminate theisolator as an unknown. This is especially true if the isolator is of a new design and littleis known about its insertion loss.
This paper deals with such a program in which a new metal isolator was used toisolate the noise of a shipboard reduction gear and the noise measurements had to be madebelow the isolators on a foundation whose impedance had to be measured and controlled.
A foundation (106 lb) was designed such that the point impedances of each isolatortermination point could be controlled from 14 Hz to 20 KHz. The objective was to haveeach termination impedance approximate a reference impedance and then measure eachtermination point impedance such that the measured structureborne noise of the gearcould be corrected to the reference impedance. This reference impedance is itself anapproximation of a typical destroyer engine room foundation and was used as a designobjective by the shipbuilder for their engine room foundation.
The design and construction of a large foundation with a controlled impedance ashigh as 20 KHz presented many technical problems. Similarly, the measurement of thepoint impedance up to 20 Klfz also presented several technical problems.
The paper describes the basic method used to obtain the required impedance. it de-scribes the viso-elastic terminators imbedded in concrete and the associated calculationsused to predict the resulting impedance.
The test program that followed the design and construction is also described, Thisincludes the relationship between termination impedance and temperature as well as ai com-plete discussion of the problems associated with obtaining valid impedance measurements
56

at frequencies above 10 KHz. It became virtually impossible to obtain completely validimpedance measurements at frequencies greater than 18 KHz. Therefore, a correctiontechnique was used and it too is described in the paper.
Finally, the paper includes a description of the method used to take and correctstructureborne noise on a power average basis. This is a relatively unique method in thatall frequencies and all measurement points must be corrected for the difference between areference impedance and each specific termination impedance. A brief description of theDD963 reduction gear test setup is included to illustrate the application of this structure-borne test method.
THE DEVELOPMENT OF A WATER PARTICLE VELOCITY METER
J. D. GordonNaval Ship Research and Development Center
Portsmouth, Virginia
INTRODUCTION
The design of marine structures which are resistant to the shock of underwater ex-plosions is facilitated when accurate computations of the response of the structures tounderwater shock loading can be made. To verify a structural analysis technique or pro-vide information necessary for the further development of the technique, experimentsmust be performed in which both the loading and structural response are measured. Waterparticle velocity as well as shock wave pressure is part of the specification of underwatershock wave loading. When the form of the wave propagation (plane, spherical, etc.) isnot known or reflections are involved, the relationship between vector particle velocityand scalar pressure is not known well enough to determine the particle velocity loadingfrom the pressure measurement alone. Under these conditions a direct measurement ofparticle velocity should be made to determine the particle velocity loading.
In September 1973 the Naval Ship Research and Development Center (NSRDC) con-ducted experiments in the Chesapeake Bay to determine the loading and response of asmall scale submarine model subjected to the shock wave of a tapered charge. Becausethe relationship between water pressure and water particle velocity for tapered chargeshock waves is not exactly known, the loading was determined by free field measurementsof both pressure and particle velocity. The unavailability of a suitable water particle veloc-ity meter previous to this application necessitated the development of a particle velocitymeter at NSRDC especially for this project.
PURPOSE OF PAPER
The purpose of this paper is to give the characteristics of the water particle velocitymeter recently developed at NSRDC and to demonstrate its effectiveness in measuring theparticle velocity of shock waves resulting from the underwater explosion of compact andtapered charges.
57

THE PARTICLE VELOCITY METER
The velocity meter normally used by NSRDC to measure structural velocity transientsprovides the basis for the water particle velocity meter design. This structural velocitymeter has a cylindrical shape with an output voltage proportional to the velocity compo-nent in the direction of the axis of the cylinder. The light weight of the cylinder allowsit to be waterproofed and made neutrally buoyant by the addition of appropriately de-signed aluminum end caps. For the measurement of water particle velocity, the modifiedmeter is seismically mounted from an underwater structure with the meter axis in the di-rection of the desired particle velocity component. Because the cylinder is neutrally buoy-ant, it moves with the surrounding water under the influence of a shock wave. Th( out-put of the meter is a voltage proportional to the average water particle velocity along thelength of the cylinder.
MEASUREMENTS OF PARTICLE VELOCITY
The particle velocity and corresponding pressure in underwater shock waves producedby the explosion of compact and tapered charges have been measured using the NSID("particle velocity meter and a commercial tourmaline pressure gage. A computation ofparticle velocity from measured pressure assuming a spherical wave has been made forcomparison with the measured particle velocity. Since the compact charge produces aspherical wave, the comparison of measured particle velocity with that computed frommeasured pressure provides a check for inconsistency between the particle velocity andpressure measurements. Because the particle velocity measurement is made using an un-tested meter, the good agreement obtained between computed and measured velocity istaken as a verification of the operation of the particle velocity meter.
Having demonstrated the operation of the particle velocity meter in the sphericalshock wave of a compact charge, the meter was used in the tapered charge experimentsfor which it was developed. The data from the tapered charge experiments show thatthe spherical wave assumption applies and the comparison of computed and measuredparticle velocities further strengthens confidence in the water particle velocity meter.
MECHANICAL DESIGN, ANALYSIS, AND TEST OF THE STANDARD ELECTRONICSCABINET AND INTEGRATED MULTIFUNCTION CONSOLE FOR AN/BQQ-5
Joseph NI. MenichelloIBM Corporation, Owego, New York
The AN/BQQ-5 shipboard system is a sonar signal processor comprised of electronicscabinets whose function is to detect, track, and classify targets in the ocean.
With this system are two basic structural designs which will be discussed, the "stand-ard" electronics cabinet and the Integrated Multifunction Console (IMC). The "standard"electronics cabinet design concept is utilized as the basis for a large percentage of the totalsystem structure while the INIC mechanical design is the most unique and complex withinthe system.
58

The units are designed to meet the requirements of MIL-E-16400, which requiresqualification to MIL-STD-167 and MIL-S-901 for vibration and shock environments, re-spectively.
To insure compliance to these requirements, a basic design philosophy was established
early in the development stage of design. The governing mechanical design philosophyfor shipboard equipment within IBM is twofold:
1. design sufficient structural rigidity, or stiffness to insure that fundamental equip-ment resonances are substantially greater than the maximum forcing frequencyspecified in MIL-STD-167. In this manner, the increases i.i vibratory amplitudesassociated with structural resonances are avoided and the corresponding poten-tial fatigue damage precluded, and
2. design sufficient strength in the structural elements to keep stresses resultingfrom the NAVY Hi-Impact shock testing of MIL-S-901C within allowable mate-rial limits.
To accomplish these objectives, computer aided structural analysis techniques wereemployed. The MECHA (MECHanical Analysis) and STRUDL (STRUctural Design Lan-
guage) computer programs were used to provide continual monitoring of the mechanicaldesign. The results of the analysis of the final mechanical designs compared very favorablewith both empirical data obtained during engineering evaluation testing and with independ-ent computerized analysis performed by the Navy Underwater Sound Laboratory. Thisestablished a high level of confidence in the structural integrity of the units.
As a result of the extensive structural analysis and engineering evaluation testing per-formed upon the units during development, these two units passed the shock and vibrationqualification tests with a minimum of mechanical problems or redesign.
The discussion will also include quantitative details of the development and qualifica-tion testing which could prove helpful to those engaged in the mechanical design of ship-board equipment.
The standard electronics cabinet is designed with two vertical slide-out chassis which
carry most of the electronics. When in the closed position, each slide-out chassis mateswith the cabinet housing by means of five bullpins in the rear and nine bullpins aroundthe front latch. In addition, each front latch contains 16 bolts and strikers to positivelyattach the chassis to the cabinet housing.
The primary load-carrying structure consists of a casting of A357 aluminum alloyboth top and bottom. Both sides are extruded 6061-T6 aluminum alloy, which forms anintegral wall incorporating corner posts, inner and outer skins, and longitudinal flutes for
cooling air. The extrusions are welded to the top and bottom castings. The cabinet is
divided into two sections by a vertical partition which is designed to form fluted ductsfor cooling air. The rear of the cabinet is a removable 1/8-inch thick panel which attaches
by flathead screws.
The two slide-out chassis are each cast in one piece of K01 aluminum alloy. The
casting is machined to accept the full length latch on front, slides on top and bottom, and
electronic subassemblies on each side.
59
The IMC is designed with five slide-out chassis-two separate CRT chassis, one com-bined drum unit and drum power supply chassis, and two NAFI chassis. The structure isdesigned in two halves to comply with installation size restrictions. Each half is con-structed in a similar fashion and they are permanently bolted together to form one integralunit. The desk top then is bolted to the frame.
Each half has an aluminum casting of A357 at the base. The top is a solid plate of6061-T6 aluminum. The main frame members are generally 6061-T6 aluminym extru-sions. The top plate, bottom casting, and extrusions are welded together to form the basicframe. The sides and rear are 1/8-inch thick aluminum panels of 6061-T6 alloy, which areattached by flathead screws. An additional doghouse extends the full height on the rearto form an air duct for cooling the electronics.
The lower half of the IMC contains two similar NAFI slide-out chassis. The entirechassis slides out on two slides located one above the other on the side of the chassis.ThTe slides are attached to the K01 T43 aluminum "L"-shaped single NAFI gate casting.The double NAFI gate is attached by a hinge to the single NAFI frame.
The single NAFI gate, double NAFI gate, hinged door, and IMC frame are integrallylocked together, when in the closed position, by bullpins and specially designed wedgesand toggle latches.
The upper and lower CRT chassis are constructed on a one piece A356-T6 aluminumcasting supported on each side with a slide. When in the closed position, the castingmates with the frame by means of high-strength bullpins, two bullpins at the rear andtwo bullpins at the front. The chassis is held in the closed position by four thumbscrews.
The drum chassis extends from the IMC frame on two slides located one above theother along the side of the unit. When in the closed position, the unit is supported byfour high-strength bullpins, both front and rear. The chassis is held in the closed positionby six thumbscrews. The chassis is a cast A356-T6 aluminum frame. The front panel isa separate casting of the same material. The drum itself is mounted in the lower sectionof the drawer. The upper half contains the drum power supply and the static inverter.
60

SPECIAL PROBLEMS
EXTENSION OF CONTROL TECHNIQUES FOR DIGITAL CONTROLOF RANDOM VIBRATION TESTS
J. D. Tebbs and D. 0. SmallwoodSandia Laboratories, Albiquerque, New Mexico
In addition to faster test setup, increased spectral resolution, and greater control ac-curacy, a digital random vibration control system can be easily reprogrammed for new con-trol algorithms that are designed to control mure complex test requirements than thesingle control channel test common on most analog and digital systems. This paper de-scribes three control techniques that have been implemented at the System EnvironmentalTesting Facilities in Area II, Sandia Laboratories, Albuquerque, New Mexico. The randomcontrol programs (J. D. Tebbs and N. F. Hunter, "Digital Control of Random VibrationTests Using a Sigma V Computer," IES 1974 Proceedings, pp 36-43) were modified toinclude these control techniques.
1. Averaging- -The averaging of several input channels in place of a single input canprovide a better input definition on larger test items. Input averaging is implemented bysampling each of the inputs for one or more frames during the control loop. The PSDestimates for each input are then summed to provide an estimate of the average PSD. Theaverage PSD estimate is then compared with the stored reference spectrum and the drivesignal is modified in the same manner as for a single channel test. Implementation of thetechnique and an example are discussed.
2. Random-on-Random-This technique provides for super-imposing several sweptnarrow band random signals on a background stationary random spectrum. This techniqueis useful for simulating environments where a significant amount of energy is concentratedin a few narrow bands, but where the center frequency of the bands is somewhat un-certain.
Briefly, the technique is implemented by dynamically changing the referencespectrum during the test. The normal control system changes the drive spectrum to matchthe changing reference spectrum.
Options include the selection of the number of bands, their sweep rates, band-widths, levels, start frequencies, and stop frequencies. Included in the paper is the imple-mentation method and a discussion of the interactive effects of varying the test param-eters. Several examples are discussed.
3. Response Limiting-In many cases, it is desirable to limit the response spectrumof components on a large system during a random vibration test by lowering the input inselected frequency bands. Response limiting was implemented by first estimating thetransfer function between the input and the response point by using a transient calibra-tion pulse. Using this transfer function and the reference spectrum of the input, thespectrum of the response is computed. If the response spectrum estimate exceeds the
61

allowable spectrum, the input reference spectrum is reduced an apl)ropriate amount. Therandom test is then run, using this modified reference spectrum. The advantages of thisimplementation include: any number of response channels can be limited without slowingdown the control response time, and the technique is relatively easy to implement. Theprincipal disadvantages include the assumption of a linear system and the inability for"real-time" limiting of the response channels. The implementation is discussed and anexample is shown.
EXPERIMENTAL DETERMINATION OF MULTIDIRECTIONALMOBILITY DATA FOR BEAMS
D. J. Ewins and P. T. GleesonImperial College, London, England
In order to undertake the vibration analysis of a complex structure it is usually most
convenient to consider the structure in terms of its component parts. Each part, or sub-structure, may be analysed individually by whatever method is best suited to it and amathematical model of the complete structure may then be built up from the results ofthese individual analyses using an impedance coupling technique. Clearly, it is importantthat the data for all substructures should be of the same order of accuracy, and indeedthis may generally be achieved with data which are derived from a theoretical analysis.However, there are many cases for which it is necessary to obtain at least some of the re-quired data by experimental measurement, and for these, achieving the necessary degree ofaccuracy can be very difficult. This paper is concerned with the experimental determina-tion of suitable data for a component by measurement of its mobility or mechanical im-pedance characteristics.
Previous work has demonstrated the need to include (and thus to obtain data for)vibration in as many directions as the complexity of the component or structure demands.This may involve as many as 6 directions at each point of interest, but is often confinedto just 2 or 3 directions, depending upon the degree of symmetry possessed by the struc-ture. However, it is rarely possible to confine interest to just one direction and for thisreason, conventional experimental mobility measurement procedures (which only measuretranslational motion) are generally inadequate for the task of obtaining data required forthe analysis of complex structures. There have been few successful attempts to measurethe multidirectional mobility data which is required, and both of those reported to date(1) (2) are lengthy and complex.
Following earlier work (1), the present paper describes the development of a morestraightforward method for measuring multidirectional mobility data and uses uniformbeams (whose properties are known accurately from theory) as test cases. The study isbased . the simple concept of (a) measuring the mobility at the end of beiam A. (b)measuring similar data at the end of beam B, and then from these two sets of data, (c)predicting the properties of the combined beam A + B formed by joining A and Ii end toend. This case involves just two coordinates at each point - lateral translation (x) androtation (0) - and so the required data are contained in a 2 x 2 mobility matrix for eachbeam, the elements of which are (IF.,), (*/M,, ). (I/F,) an( (6/M),,.
62

Measurements of the individual elements of this matrix generally agree very well withtheory, although the (O/MO ) term is less accurate than the others, especially at low fre-quencies. However, the combined beam (A + B) properties predicted using these data aremuch less satisfactory. An attempt to 'smooth' out the effects of random experimentalerrors using a modal identification procedure (3) improved the predictions slightly, butnot substantially.
The limiting factor is found to be the relatively low accuracy of the (O/Mo) mobility,which in turn is due to difficulty in measuring the angular motion 0. To overcome thisproblem, an alternative means of deriving the (0/M O ) mobility term is proposed. Themethod is based on the fundamental relationship which exists between the contributionsto each mobility term from each mode of vibration. Using this relationship, it is shownthat all four mobility terms may be derived from measurements of only two of them (the(k/F,) and (/Mo) being chosen here as they prove to be the easiest to measure accurately)in conjunction with a straightforward modal identification analysis. Predictions for the com-bined properties using data obtained by the technique show a marked improvement over theearlier results. Moreover, there is a significant reduction in the quantity, complexity and re-quired accuracy of the experimental measurements which need to be made, so that thesemay be obtained with standard impedance measurement apparatus.
Although the results presented in the paper are for beams, the technique describedmay be used for any structure whose multidirectional mobility data need to be measured.
REFERENCES
1. Ewins, D. J. and Sainsbury, M. G., "Mobility Measurements for the Vibration Analy-sis of Connected Structures" S.V.B. (42). 1972
2. Smith, J. E., "Measurement of the Total Structural Mobility Matrix" S.V.B. (40). 1970
3. Klostermam, A. L. and Lemon, J. R., "Building Block Approach to Structural I)ynam-ics" ASME paper 69-VIBR-30.
ANALYTICAL EXTRAPOLATION OF EXPERIMENTALLY DETERMINEDMODES OF VIBRATION
S. R. Ibrahim
NASA Langley Research CenterHampton, Virginia
The purpose of this work is to develop a method which can reduce the cost of vibra-tion testing by limiting its use to obtaining a minimum number of the lower modes of atest structure. These lower order modes are then to be used in an analytical procedure topredict the higher order modes. The experimental data required for such a procedure istwo modes at all the coordinates of a lumped parameter system; for continuous (distrib-uted parameter) structures, a minimum of one mode is required to be known.
63

The primary goal of structural dynamic analysis, theoretical or experimental, is todetermine the natural frequencies and mode shapes and/or a mathematical model for thestructure being considered. This information is essential to predict and control the re-sponse of the structure under different types of dynamic loadings. Theoretical analysisis usually based on a set of assumptions which reduce the very complex structure to a setof equations that will presumably represent the behavior of the real structure. Uncertain-ties in theoretical analysis make vibration testing a necessity.
In spite of advances in modern dynamic testing procedures and technology, a perfect,reliable and economical technique for vibration testing is still far out of reach. One ofthe most serious limitations in vibration testing is not being able to determine experi-mentally a number of modes equal to the desired number of measuring stations (degreesof freedom). At the same time a structure in operation might be subjected to excitingforces that contain frequency components beyond those that can be handled by the exist-ing vibration testing methods and equipment.
This paper suggests a method in which a limited number of experimentally deter-mined modes are used to predict analytically the higher order modes of the structureunder consideration. As an illustration, the first two modes of a simulated three-degree-of-freedom lumped parameter system were used to predict the system's third mode. Themethod is also applied to results obtained from a shake test of the 1/10-scale Apollo/Saturn V replica model. In this application, the first experimentally determined mode isused to analytically predict the higher order modes of the model. The analytically pre-dicted second, third and fourth modes are compared to those that were already experi-mentally determined.
VIBRATION-INDUCED DOPPLER EFFECTS ONAN AIRBORNE SHF COMMUNICATIONS SYSTEM
Jerome Pearson
an,.
Roger E. ThallerAir Force Flight Dynamics LaboratoryWright-Patterson Air Force Base, Ohio
The Air Force Flight Dynamics Laboratory has recently been investigating a newvibration problem in airborne communications systems-the Doppler effects on the signalcaused by the vibration of the airborne antenna. These effects are proportional to the sig-nal frequency and are becoming more important as higher frequency bands are used, as incommunications with airborne command posts,
To develop secure, reliable communications for such airborne command posts, the AirForce Avionics Laboratory has been investigating the use of super-high-frequency (StIF)
64

communications terminals to communicate I[ 'ween aircraft and synchronous satellites.At these frequencies, near 8 GHz, Doppler effects from the aircraft motion may shift thesignal frequency by several kilohertz. This shifted signal must be accurately followed bythe modem (modulator/demodulator); to do this, the aircraft motions are measured bythe inertial navigatiot. iystem (INS) and the resulting Doppler shift is allowed for by acomputer. The adaitional Doppler effects due to antenna vibration are uncorrected andare thus limiting factors on system performance. Degradation of signal strength or loss oflock can result from excessive Doppler effects due to vibration.
To measure these vibration-induced Doppler effects, the Flight Dynamics Laboratoryperformed a flight test program on an Avionics Laboratory transport aircraft equippedwith an SHF terminal communicating with a synchronous satellite. To completely definethe Doppler effects, four parameters of the antenna vibration were needed: the displace-ment, which causes a phase shift in the signal; the velocity, which causes a frequencyshift; the acceleration, which determines the rate of change of the Doppler shift; andthe jerk (rate of change of acceleration) which determines the abruptness of the Dopplerrate. Each of these parameters affects a feedback loop of the modem; the full four-parameter environment was therefore needed to define all the feedback loop values. Inorder to provide the greatest accuracy, the antenna line-of-sight acceleration was measuredsimultaneously with the accelerations of the inertial navigation system. Measurements were
recorded for all expected aircraft maneuvers, to ensure reliable communications from be-fore takeoff until after landing.
The data were analyzed initially in terms of acceleration in narrow frequency bands.The jerk, velocity, and displacement were derived from these acceleration spectra by apply-ing the proper factors as functions of frequency. The modem operational criteria werethen compared to these results. This comparison indicated the critical frequencies atwhich difficulties would be expected. A more detailed analysis derived measures of theexpected number and duration of exceedances of the criteria for the four parameters ofdisplacement, velocity, acceleration, and jerk. This required the development of newcomputer programs for time-history analysis of the terminal accelerations. The analysisindicated that for the particular modem the observed flight vibrations created a problem.This was expected, since the modem had originally been designed for a ground base. Twosolutions to the problem are being investigated-the reduction of the antenna vibration it-self, and the relocation of the INS near the antenna to reduce the uncorrected componentof the vibration.
This program has indicated the potential severity of the vibration Doppler problem inSHF communications by airborne terminals. The first step in solving the present problemwas to derive improved tracking loop characteristics from the measured vibration param-eters. However, the accurate measurement of all four motion parameters is a stringentinstrumentation problem. Future systems will need to be designed from inception withvibration in mind. This will become more critical with higher communication frequen-cies, since the Doppler effects are directly proportional to communication frequency.
65

FATIGUE DAMAGE EQUIVALENCE OF REAL ANDSIMULATED VIBRATIONAL ENVIRONMENTS
Daniel D. KanaSouthwest Research Institute
San Antonio, Texas
INTRODUCTION
The development of better laboratory test specifications is a continuing goal for thevibrations engineer. His objective must be to simulate a field environment in such a waythat high probability of in-service failure in a typical specimen will result in a similar fail-ure in the test environment. This paper describes a method of comparing the damage poten-tial of two such environments when the failure mechanism is fatigue. The method involvestesting of an instrumented specimen in both environments, recording and analyzing the spec-imen responses in each case, and comparing the direct fatigue potential from the two results.
MODEL HARDWARE SPECIMEN
A model hardware specimen (MHS) is designed in the form of a small box that canbe fastened into typical avionics equipment racks. The box contains eight cantilever beamshaving resonances respectively at about 37, 48, 76, 105, 132, and 156 Hz. These frequen-cies, as well as the spatial orientation of the beams inside the box were selected fromrandom values. Thus, each beam represents some arbitrary mode of a typical hardwarespecimen. Each beam is instrumented with strain gages so that strain histories can be re-corded when the box is subjected to a dynamic environment.
METHOD OF PREDICTING FATIGUE ENVIRONMENT
Strain time histories from a given environment in which the MHS is tested are usedto predict fatigue. Thi, i accomplished ultimately through the use of Micro Measurements,Inc. fatigue gages. Twe different methods can be employed. If the strain history is suffi-ciently narrow band, tikon a peak counting process is employed along with calibrationcurves for the fatigue gages, to produce the fatigue prediction for each environment. Ifthe strain history is relatively complex, the fatigue gage is used directly to predict the en-vironment by subjecting another beam specimen to the exact strain time history. Thisbeam is instrumented with the fatigue gage so that a direct computation of the fatiguepotential is performed. A comparison of the potential of the two environments providesa numerical evaluation of the laboratory test specification in terms of the equivalent num-ber of service hours, missions, etc. This method is particularly useful for comparing com-plex environments resulting from nonstationary operation of vehicles, aircraft, etc.
SAMPLE RESULTS
The method is applied to evaluation of typical laboratory simulations of helicopter,truck, and tracked vehicle environments. In each case, the numerical fatigue potential ispresented. It is shown that the results vary considerably with frequency and vibration
66
level. Thus, no exact simulation can be achieved at all frequencies and levels in any actualhardware, and the resulting limitations on interpretation of results from typical tests mustbe recognized.
SEISMIC SIMULATOR FOR SILO CONSTRAINEDMISSILE GUIDANCE PLATFORM
R. FelkerRockwell InternationalAnaheim, California
The Autonetics Environmental Test Laboratory acquired the responsibility for the de-sign and development of a test facility for simulating silo constrained missile response toground motion. The test item was to be a 22" diameter inertial guidance platform. The re-quirements were: accuracy of 1 arc second, 80 db dynamic range, DC to 5 Hz frequency re-sponse, simultaneous multiaxis motion, and a motion derived from a complex waveformequation. The requirements dictated a digital approach and with precision equipment. Also,the guidance platform is North oriented, and a change of direction for a possible single linearinput would require that ti e motion actuator change location and that the fixture baserotate. A four degree of freedom test system (3 rotational, 1 linear) with flexibility of lineardirection was conceived as being possible to build in the time frame and cost allowed. Utili-zation of an existing 32K bit computer and analog recorders would be necessary for pro-gramming.
The seismic simulation test hardware that was built consists of four major componentsplus a group of ancillary items. These major components are (1) seismic reaction mass, (2)a linear motion system, (3) a three-axis gimbal system, and (4) an Integrated Control Console.
The Seismic Reaction Mass is a 14' by 14' by 8' deep steel reinforced concrete block.Included in this mass is a two piece granite mounting base. The bottom granite base plate is5' square and 16" thick and is precision leveled and bonde! uo the concrete mass. The topgranite plate, which is 91/2" thick, is designed to rotate on an air bearing and has index pinslocated at 00, 450, and 900. In the center of the mass is a cavity containing a bi-axialtiltmeter with readability to 1/100 arc second.
The Linear System consists of two major parts. One part is the slip table mounted
on four 16" stroke slip bearings which in turn are mounted on the rotatable granite topplate. The second part is the 15" stroke hydraulic actuator which can be mounted onany one of three steel pads that are bonded in the reaction mass. The minimum motionfor digital control is .001" and analog is .0002" peak displacement. The table has a dualLinear Variable Differential Transformer (20" and 1") for feedback, a displacement dialwith .0005" resolution and a linear accelerometer monitoring from 100 micro g's to 1 g.
The Three Axis Gimbal System utilizes the slip table as its base. The requirementfor a large, precision 3-gimbaled structure to sustain side forces and maintain accuracy,required special design. Also, three optical access holes were built into the gimbals toallow guidance platforn, monitoring. The range of digitally programmed motion for the 3gimbals is ±30 to ±.0001' with a .00020 mechanical uncertainty (I arc second program-ming). Each axis has a 1 rad/Sec 2 maximum angular accelerometer.
67

The 5-bay Integrated Control Console consists of program control and monitor proc-essing circuits for the input and output signals, hydraulic actuator electronic control,monitoring pen recorder, gimbal control and monitor electronics, and other miscellaneouscircuits. The program information (80 db range digital code with 5 motions multiplexedB C D-Serial-Parallel on analog magnetic tape) is processed through demultiplex andarithmetic circuits. Digital and analog signals are processed to recorders for records oftest.
This unique equipment has been in service for over one year and has been a successfuladjunct to inertial platform improvements. Because of built-in flexibility, numerous specialtests beyond the original concept have also been performed.
VIKING DYNAMIC SIMULATORVIBRATION TESTING AND ANALYSIS MODELING
A. F. LeondisGeneral Dynamics, Convair Aerospace Division
San Diego, California
The Viking Dynamic Simulator (VDS) was flown from Cape Kennedy on the firstTitan Centaur, February 11, 1974. In addition to the value of this flight to verify com-patibility of the Titan and Centaur vehicles, the dynamic responses of the VDS are im-portant for complete understanding of the loads and vibrations expected to act on theViking when it is launched to Mars in 1975.
VIBRATION TEST PROGRAM
The VDS, a product of General Dynamics, was vibration tested in San Diego duringthe First Quarter, 1973, so that test data would be available for final pre-flight calculationsduring the summer and fall. This paper includes a description of the vibration testingconducted on the VDS to describe its dynamic characteristics and methods used to sepa-rate modes which were close to each other in frequency and also somewhat nonlinear.
Vibration test procedures used are explained together with the rationale used toselect test equipment and, in particular, the configuration of the cantilevered boundary.
One objective of the test was to attempt to resolve all modes up to 50 liz with lessthan five percent modal coupling. Twelve modes were predicted below 50 Hz so that the66 independent coupling terms together with the five percent objective was the cause ofmuch concern. It is believed that use of the Spectral Dynamics Corporation "Co/QuadAnalyzer" was instrumental in very largely achieving this objective.
Damping constants for the various modes are discussed including a comparison of thedamping by means of the free amplitude decay and by means of the steady state (non-decay) method of C. C. Kennedy and C. D. P. Pancu.
Loads for 18 truss members were also experimentally determined for all modes. The
data obtained in the above vibration test program were the source of information used in
68

numerous pre-flight calculations required in the normal course of dynamic response andstability studies. In some instances the actual test data have been used directly withoutalteration, but in general, it is recognized that this manner of use of the data is not en-tirely correct because of neglect of the attachment flexibility of the structurally redundantinterface and other secondary problems related to test artificialities. This paper considersthese questions and describes the methods used to generate analytical modal data eliminat-ing nonlinear effects but retaining as much as possible of the nature of the test data.Comments are made on the use of the Nastran Computer Program which was used in theprocess of optimization of the analysis (or mathematical) model. The criteria used forselection of the optimum fit are considered of possible value to other investigators espe-cially in the area of modal force coefficients for member loads, where large percentageerrors are expected in those coefficients having small numerical values.
The final analysis model data are described including figures of modal deflectionsfrom test and analysis for comparison.
The final modal data were expanded to include deflections at all locations whereflight measurements were to be made. References are included for all reports of test andanalysis data published.
AN EVALUATION OF SHOCK RESPONSE TECHNIQUESFOR A SHIPBOARD GAS TURBINE
J. R. Manceau and E. NelsonAiResearch Manufacturing Company of Arizona
Phoenix, Arizona
When demonstration of combat durability is required, shipboard equipment of greaterthan 4500 lbs must be tested on the Navy Floating Shock Platform (FSP) as specified byMIL-S-901C. Of particular concern on a gas turbine engine is the integrity of enginestructure, engine mounts, accessory mounts and bearings during shock. A detailed shockanalysis during development can indicate potential problem areas and through redesignminimize the number of areas requiring post test corrective design. The study hereinsummarized was made to compare the results of the shock spectrum and transient re-sponse normal mode methods as applied to a shipboard gas turbine, to give some indica-tion of the required degree of detall required in modeling and to obtain engine case accel-erations, bearing loads and mount loads.
The gas turbine considered in this study consists of a straddle mounted, 470 lb gasgenerator and a straddle mounted, 404 lb power turbine transmitting shaft power coaxiallythrough the gas generator to a forward gearbox. The total engine weight is about 4700lbs. In the model the engine was mounted to a rigid substructure which was centrallymounted to the FSP on two beams to simulate a deck mounting. The substructure mount-ing beams and substructure weight of 15,000 lbs were chosen to give a fundamental fre-quency of 29.5 cps. The gas generator, power turbine and case were modeled by five, sixand seven masses respectively and connected by beams. The total length of the systemwas 18 feet 4 inches. The rotors were connected to the case by appropriate spring rates.Two models were constructed, one with 98 degrees of freedom and flexible rotors andcase and another much simpler model with effectively 22 degrees of freedom and rigid
69

rotors and case. Both models were three dimensional and in general the masses possessed6 degrees of freedom. Vertical FSP shock on a deck was considered.
Eigenvalues and vectors were obtained for both models. Shock spectrum maximumaccelerations, deflections and bearing loads were obtained for the flexible rotor model bythree methods of modal summation. The first summation method used was the summa-tion of modal responses, the second method was the square root of the sum of the squaresof the modal responses (root square summation) and the third method was the largestmodal response plus the square root of the sum of the squares of all other modal re-sponses (modified root square summation). Transient accelerations, deflections and bear-ing loads were obtained for both models.
Excitation was provided by a square pulse of 0.005 sec. duration and 67.54 gs ampli-tude. This excitation was chosen since its shock spectrum agrees very well with that ofthe design shock spectrum for vertical deck mounting on the FSP as given in NRL report7396, Shock spectrum maximum accelerations, deflections and bearing loads were alsoobtained for the FSP design shock spectrum and summed by modified root square sum-mation method for comparison with the square pulse shock spectrum results.
When compared to the flexible rotor transient response analysis, the best method ofmodal summation was the modified root square summation. In general, this method wassomewhat conservative, whereas the root square summation was anticonservative and thesummation of modal responses was very conservative. Because of the simplicity of analy-sis, the modified root square summation approach is recommended for shock analysis whenmaximum values rather than time responses are required.
The shock spectrum of the square pulse agrees very well with that of the design shockspectrum of the FSP. For applications requiring a transient response, this pulse is recom-mended.
Comparison of the flexible and rigid rotor transient responses indicated that the caseand substructure accelerations and deflections agreed very well. Mount loads on the twomodels also agreed very well. Bearing loads, however, particularly on the more flexiblepower turbine did not agree as well. As indicated by this model, if the lower modes inthe system contain bending, variables associated with the parts in bending require detailedmodeling. Experience must be relied on to make a model as simple as possible to takeadvantage of reduced time for analysis and to minimize the opportunity for undetectedmistakes.
EARTHQUAKE RESPONSE OF COMMUNICATIONSEQUIPMENT IN SMALL BUILDINGS
N. J. DeCapua and F. X. PrendergastBell Laboratories
Whippany, New Jersey
Telephone communications facilities are so vitally important to public health andsafety that special efforts must be made to prevent disruption of these services by a de-structive earthquake. For this reason, and in order to protect extremely expensive plant
70

investments, it is important to incorporate earthquake resistant design into telephone facil-ities. One category of equipment that seems extremely vulnerable to seismic motions con-sists of wall-braced 9 ft. equipment frames installed in small buildings. If the loadings inthe bracing system, at the top of the equipment frames, becomes excessive it is )ossiblefor the equipment to lose its entire support structure. The result could be a catastroplicfailure with all the equipment frames toppling over.
A finite element dynamic analysis was performed on a wide variety of these smallone-story buildings and the equipment within them. The unique part of the analyticalstudy was the inclusion of coupled building and equipment motions. In most of theprevious documented earthquake studies of equipment response, it was justifiable to un-couple the buildinig and the equipment because the equipment mass was much less thanthe building mass and there was no significant feedback. However, it was found that forthe building and equipment configurations considered in this study the loads in the bracingsystem were significantly underestimated when building-equipment coupling was not in-cluded.
From the analyses and tests, general recommendations were developed which areapplicable to any equipment layout of the category of equipment and buildings beingconsidered. These recommendations consist of guidelines for determining if a particularequipment configuration is properly earthquake braced, and if it is not, the procedures forupgradfilg.
SEISMIC ANALYSIS OF MOTORS FOR NUCLEAR POWER PLANTS
L. J. Taylor and N. M. IsadaUniversity of Buffalo
Buffalo, New York
Before atomic power became a practical large scale energy source, consideration ofseismic design was generally restricted to buildings and other tall, flexible structures. Withthe recent construction and licensing of nuclear power plants, the potential hazard of anuncontrollable release of excess radio-activity as the result of an earthquake is of greatconcern. It is of the utmost importance that those components of the plant which arevital to safe operation or shutdown maintain both structural and functional integrityduring and after a seismic disturbance. Included in this category are alternating-currentinduction motors for driving pumps and cooling and recirculating fans.
To determine whether or not a motor meets the requirements of a particular plantor location, it has previously been necessary to subject the motor and driven equipmentto a simulated earthquake and measure the appropriate parameters. Special facilities arerequired and the testing is costly.
Equipment can, however, be qualified for Seismic Class I service through suitableanalytical techniques. In general, a dynamic rather than a static analysis will be required.A Mathematical Model of the system to be studied is first developed-it is possible to con-sider an AC motor as a multi-degree-of-freedom, lumped-mass system with mass-free in-terconnections. This step in the analysis requires extreme care and good engineering
71

judgement since the accuracy of the results depend strongly on how well the model repre-sents the actual physical system.
Once a satisfactory model has been established, a modal analysis can be performedin conjunction with a response spectrum analysis. The analytical procedure involves writ-ing the equations of motion of the system, solving these equations for the natural fre-quencies and mode shapes, and evaluating the modal participation factors. Seismic acceler-ations are then determined from the appropriate floor response spectrum curves. Aresponse spectrum is a plot of the maximum response of a single-degree-of-freedom systemat a damping value expressed as a per cent of critical damping, of different natural fre-quencies, mounted on the surface of interest when that surface is subjected to a givenearthquake motion.
For each mode, equivalent static forces are calculated as the products of the mass,coordinate, participation factor and seismic acceleration at each mass point. These forceswill result in stresses and deflections which are combined with the normal operatingstresses and deflections. If these combined values do not exceed the allowable limits, theequipment has been qualified for Seismic Class I service. Limits are established to insurethat the motor will remain functional during the worst anticipated earthquake for theplant site. Some permanent deformation may even be acceptable as long as the motormaintains operability and structural integrity. Redesign or modification are, of course,necessary should any of the stresses or deflections be excessive.
This procedure satisfies the requirements of IEEE No. 344, The Guide for SeismicQualification of Class I Electrical Equipment for Nuclear Power Generating Stations. IEEENo. 344 is the generally accepted industry standard and is also approved by the governingregulatory bodies for nuclear power plant licensing.
This analytical approach can easily be adapted to suit other rotating equipment andsimilar devices.
A NEW STUDY OF THE HARMONIC OSCILLATORWITH NON LINEAR DAMPING
Ralph A. EymanMartin Marietta Aerospace
Orlando, Florida
The damped harmonic oscillator represented by a mass, spring, dashpot system istreated extensively in most applied mathematics and mechanics texts. The retarding forceis known as viscous friction and is proportional to the velocity of the mass. This relation,when expressed by an equation of motion, results in a second order linear differentialequation which may be solved in closed form.
Comprehensive studies of the solutions result in such familiar terms as viscous damp-ing, under damping, over damping, critical damping and damped frequency. However, nodashpot behaves precisely as linear resistance and, with the exception of electrical ana-logues, these terms, as defined, exist only in the mathematics. Theoretically, when threedimensional flow is considered, resistance provided by the dashpot is proportional to the
72

fluid density and the square of the piston velocity, and at large velocities, has been con-sidered to be proportional to nearly the cube of the velocity. Non linear damping iselegantly treated by various mathematical techniques in many advanced mechanics andcontrol theory texts. The author presents the results of a new study done with the aidof computer techniques.
We consider the equation,
x + X 2 y1xli + x = 0
The equation was solved by numerical integration for various values of e and the partic-ular value of y = 1, (which is the critical damped case in the viscous or linear dampedequation).
For the value c = 1 the solution is,
x - 't( 1 + t).
For the value of E = 1.2 the system oscillates with an initial period slightly larger than theperiod of the natural frequency and is observed to approach the natural frequency as timebecomes larger. For the value of c = 2 the initial period after the first overshoot is verynearly but still larger than 27r and for the value of e = 3 it is very nearly but smaller than21r. In each case it approaches 27r quite rapidly. Other values of 'Y produce similar results.The system always oscillates except where y = 1 and E = 1, the linear critical damped con-dition. The system even oscillates for some values of -y > 1 provided e > 1 and in thosecases the frequency also converges on the natural frequency as time becomes large.
By trial and error a constant E = e, was found such that after the first overshoot thesystem aiways oscillates at precisely its natural frequency for all values of -. Its value, tofour significant figures is
c, = 2.586
For values of E < 2.586 the initial period after the first overshoot is always greaterthan 21r and for values of E > 2.586 it is always less than 21r.
Since it seems reasonable that no damped oscillator would oscillate at a frequencygreater than its natural frequency the results of this study strongly suggests that e, is anatural constant limiting the proportionality of the dependence of resistance on velocity,v, to the value,
V2.586
It may even suggest that the dependence of all fluid friction on velocity is limited to this
value.
The conclusions drawn from this study are:
The frequency of all oscillating spring mass systems which rely on fluid damping willapproach the natural frequency of the system as time becomes large. The dependence ofresistance on velocity is limited by the value of Pc where 1 < c < 2.856.
73