
Evaluation of Lead/Carbon Devices for Utility Applications
78
SANDIA REPORT SAND2009-5537 Unlimited Release Printed June 2009 Evaluation of Lead/Carbon Devices for Utility Applications A Study for the DOE Energy Storage Program Paula S. Walmet Sandia Contract No. 65-9172 Prepared by Sandia National Laboratories Albuquerque, New Mexico 87185 and Livermore, California 94550 Sandia is a multiprogram laboratory operated by Sandia Corporation, a Lockheed Martin Company, for the United States Department of Energy’s National Nuclear Security Administration under Contract DE-AC04-94AL85000. Approved for public release; further dissemination unlimited.
Transcript of Evaluation of Lead/Carbon Devices for Utility Applications
SANDIA REPORT SAND2009-5537 Unlimited Release Printed June 2009
Evaluation of Lead/Carbon Devices for Utility Applications
A Study for the DOE Energy Storage Program
Paula S. Walmet Sandia Contract No. 65-9172
Prepared by Sandia National Laboratories Albuquerque, New Mexico 87185 and Livermore, California 94550
Sandia is a multiprogram laboratory operated by Sandia Corporation, a Lockheed Martin Company, for the United States Department of Energy’s National Nuclear Security Administration under Contract DE-AC04-94AL85000.
Approved for public release; further dissemination unlimited.

2

3
Issued by Sandia National Laboratories, operated for the United States Department of Energy by Sandia Corporation. NOTICE: This report was prepared as an account of work sponsored by an agency of the United States Government. Neither the United States Government, nor any agency thereof, nor any of their employees, nor any of their contractors, subcontractors, or their employees, make any warranty, express or implied, or assume any legal liability or responsibility for the accuracy, completeness, or usefulness of any information, apparatus, product, or process disclosed, or represent that its use would not infringe privately owned rights. Reference herein to any specific commercial product, process, or service by trade name, trademark, manufacturer, or otherwise, does not necessarily constitute or imply its endorsement, recommendation, or favoring by the United States Government, any agency thereof, or any of their contractors or subcontractors. The views and opinions expressed herein do not necessarily state or reflect those of the United States Government, any agency thereof, or any of their contractors. Printed in the United States of America. This report has been reproduced directly from the best available copy. Available to DOE and DOE contractors from U.S. Department of Energy Office of Scientific and Technical Information P.O. Box 62 Oak Ridge, TN 37831 Telephone: (865) 576-8401 Facsimile: (865) 576-5728 E-Mail: [email protected] Online ordering: http://www.osti.gov/bridge Available to the public from U.S. Department of Commerce National Technical Information Service 5285 Port Royal Rd. Springfield, VA 22161 Telephone: (800) 553-6847 Facsimile: (703) 605-6900 E-Mail: [email protected] Online order: http://www.ntis.gov/help/ordermethods.asp?loc=7-4-0#online

4
SAND2009-XXXX Unlimited Release Printed June 2009
Evaluation of Lead/Carbon Devices for Utility Applications
A Study for the DOE Energy Storage Program
Paula S. Walmet, Ph.D. MWV Specialty Chemicals Division
MeadWestvaco Corporation 5255 Virginia Ave.
North Charleston, SC 29046
Abstract
This report describes the results of a three-phase project that evaluated lead-based energy storage technologies for utility-scale applications and developed carbon materials to improve the performance of lead-based energy storage technologies. In Phase I, lead/carbon asymmetric capacitors were compared to other technologies that used the same or similar materials. At the end of Phase I (in 2005) it was found that lead/carbon asymmetric capacitors were not yet fully developed and optimized (cost/performance) to be a viable option for utility-scale applications. It was, however, determined that adding carbon to the negative electrode of a standard lead-acid battery showed promise for performance improvements that could be beneficial for use in utility-scale applications. In Phase II various carbon types were developed and evaluated in lead-acid batteries. Overall it was found that mesoporous activated carbon at low loadings and graphite at high loadings gave the best cycle performance in shallow PSoC cycling. Phase III studied cost/performance benefits for a specific utility application (frequency regulation) and the full details of this analysis are included as an appendix to this report.

5
ACKNOWLEDGMENTS
The author wishes to acknowledge the U.S. Department of Energy’s Energy Storage Program and Dr. Imre Gyuk for support of this project. The author wishes to acknowledge the project manager for this study, Nancy Clark of Sandia National Laboratories, as well as John Boyes of Sandia for his support of this project. This project was initiated and initially led by Ben Craft (currently at NorthStar Battery) and subsequently by Enders Dickinson (currently at Axion Power). Ben and Enders completed the bulk of the work. Subcontractors and contributors to this project include the following:
• Sandia National Laboratories (Albuquerque, New Mexico)—Tom Hund and Jim van den Avyle
• NorthStar Battery (Springfield, Missouri)—Frank Fleming, Bob Shirk, and Michelle Cantrell
• Battery Energy (Fairfield, Australia)—Dave Brown • JBI Corporation (Genoa, Ohio)—Joe Badger • Hammond Expanders (Hammond, Indiana)—Dave Boden and
Matthew Spence • Electric Transportation Applications (Phoenix, Arizona)—Don
Karner and Russell Newnham • Integrys Energy Services (Iselin, New Jersey)—Charles Koontz
The information in the Introduction was gathered from various authors in the Proceedings of the following conferences:
• 2003 Annual ESA Meeting, Chicago, Illinois • 2004 Annual ESA Meeting, Columbus, Ohio • Advanced Capacitors World Summit 2003, Washington, DC • Advanced Capacitors World Summit 2004, Washington, DC • 13th International Seminar on Double-layer Capacitors, Deerfield
Beach, Florida, 2003 • 14th International Seminar on Double-layer Capacitors, Deerfield
Beach, Florida, 2004
Portions of this report were adapted from work by other authors:
• Much of the Introduction was originally written by Ed Buiel (currently at Axion Power) while he was at MeadWestvaco.
• Phase I and Phase II documentation was adapted from reports and presentations prepared by Ben Craft and Enders Dickinson while they were at MeadWestvaco.
• The summary of Aker-Wade cycling and utility cycling was adapted from reports and presentations prepared by Don Karner and Russell Newnham of Electric Transportation Applications.
• The summary of cycle testing at Sandia National Laboratories was adapted from reports and presentations prepared by Tom Hund.

6
CONTENTS
Acronyms and Abbreviations ..................................................................................................10
Executive Summary .................................................................................................................12
Introduction..............................................................................................................................14 Utility-based Energy Storage Applications .......................................................................14 Energy Storage Devices.....................................................................................................17 Background – Lead-acid Batteries.....................................................................................18 Lead/Carbon Capacitors.....................................................................................................19
Phase I—Lead/Carbon Energy Storage Devices .....................................................................20 Carbon Additives in Lead-acid Batteries...........................................................................22
Phase II—Developing a Further Understanding of Carbon Additives in Lead-acid Batteries26 Hammond Test Cells..........................................................................................................26
Cell Preparation.......................................................................................................26 Cell Performance.....................................................................................................27 Observations............................................................................................................30
NorthStar December 2006 Build .......................................................................................31 Matrix Background and Details ..............................................................................31 Battery Characterization..........................................................................................32 Cycling Results........................................................................................................36
Battery Energy Gel Batteries .............................................................................................38 Battery Build ...........................................................................................................39 Initial Capacity ........................................................................................................40 Advanced PSOC Cycling Results ...........................................................................41 Aker Wade Motive Power Cycling Results ............................................................43 Utility Frequency Regulation Profile and Cycling..................................................51
Phase III—Utility Application and Design..............................................................................62
References................................................................................................................................64
Distribution ..............................................................................................................................66
Appendix—Utility Frequency Regulator Design Final Report ............................................ A-1

7
FIGURES
Figure 1. Break-even cost of storage by application [1]. ........................................................ 15 Figure 2. Energy storage charge/discharge time characteristics by application [2]. .............. 15 Figure 3. Representative daily power use [3]. ........................................................................ 16 Figure 4. Pb/C energy storage devices.................................................................................... 19 Figure 5. Current collectors molded to lead lug. .................................................................... 21 Figure 6. Lead aymmetric test cells composed of one negative and two positive electrodes (built with Independent Labs). ................................................................................................ 21 Figure 7. Capacity of Pb/C capacitors (hybrid energy storage, or HES, device) built with different types of current collectors. At the 5-hour rate the capacity was roughly 1/3 that of the lead-acid battery................................................................................................................ 22 Figure 8. Three-plate negative limited (two positives, one negative) test cell fixture............ 26 Figure 9. Initial capacity of Hammond test cells. ................................................................... 28 Figure 10. Simple PSOC cycling performance of Hammond test cells.................................. 29 Figure 11. Post-cycling capacity retention (5 cycle sets). ...................................................... 30 Figure 12. Raw and normalized initial capacities (C/1 rate). ................................................. 33 Figure 13. Self-discharge stand losses over 100 days............................................................. 33 Figure 14. Shelf life of standard NorthStar Battery product................................................... 34 Figure 15. Phase I recharge time curves (top: standard; bottom: carbon-modified). ............. 35 Figure 16. Recharge time for Phase II batteries...................................................................... 36 Figure 17. Initial capacity of Battery Energy gel batteries. .................................................... 40 Figure 18. Advanced PSOC cycling performance of Battery Energy gel batteries................ 42 Figure 19. Schematic representation of data from Aker Wade............................................... 43 Figure 20. Voltage of yellow battery operated under Aker Wade schedule. .......................... 47 Figure 21. Voltage of red battery operated under Aker Wade schedule................................. 47 Figure 22. Voltage of blue battery operated under Aker Wade schedule............................... 48 Figure 23. Voltage of orange battery operated under Aker Wade schedule. .......................... 48 Figure 24. Voltage of white battery operated under Aker Wade schedule. ............................ 49 Figure 25. Voltage of green battery operated under Aker Wade schedule. ............................ 49 Figure 26. Temperature of the blue battery operated under Aker Wade schedule. ................ 51 Figure 27. Two repeats of the 12-hour profile developed to simulate utilities frequency regulation duty. ....................................................................................................................... 52 Figure 28. Data from a utility application (24-hour period) supplied by Charles Koontz...... 52 Figure 29. Performance of standard AGM battery under simulated utility duty. ................... 54 Figure 30. Performance of orange BEPS gel battery (0.17-weight% carbon) under simulated utility duty............................................................................................................................... 54 Figure 31. Performance of blue BEPS gel battery (3-weight % MWV carbon) under simulated utility duty. ............................................................................................................. 55 Figure 32. Typical Utility Energy Pulses (Charles Koontz, WPS)......................................... 56 Figure 33. NorthStar Run 3 Battery from December 2006 build. .......................................... 57 Figure 34. NorthStar Run 7 from December 2006 build. ....................................................... 58 Figure 35. Battery Energy green battery (1% graphite).......................................................... 58 Figure 36. Battery Energy yellow battery (1% activated carbon). ......................................... 59 Figure 37. Battery Energy blue battery (3% activated carbon). ............................................. 59 Figure 38. Battery Energy orange battery (0.17% carbon black, standard)............................ 60

8
TABLES
Table 1. Applicable Technologies for Various Energy Storage Devices [2].......................... 17 Table 2. Lead-acid Battery Storage Facilities [4] ................................................................... 18 Table 3. Generalized Properties for Three Carbon Types ...................................................... 23 Table 4. Batteries from Initial Trial at NorthStar (% by weight in negative plate based on lead oxide) ...................................................................................................................................... 23 Table 5. Summary of Battery Performance ............................................................................ 24 Table 6. Carbon Properties ..................................................................................................... 27 Table 7. Carbon Purity (ppm) ................................................................................................. 27 Table 8. Negative Plate Expander Details Relative to Oxide (% by weight oxide) ............... 32 Table 9. Float, Recharge, and PSOC Cycle Rankings............................................................ 38 Table 10. Carbon Matrix for Battery Energy Gel Batteries.................................................... 39 Table 11. Battery Product Specifications................................................................................ 39 Table 12. One-hour (~8 A) Capacity Trends During Advanced Cycling Protocol ................ 42 Table 13. Shift Schedule for Motive-power Profile (based on 6-day work week) ................. 43 Table 14. Module Capacity (7.9 A discharge to 1.8 V/cell) Before/After Aker Wade Cycling................................................................................................................................................. 50 Table 15. Module Capacity (7.9 A discharge to 1.8 V/cell) After Both Aker Wade and Utility Cycling.................................................................................................................................... 53 Table 16. Summary of Test Results........................................................................................ 57

9

10
ACRONYMS AND ABBREVIATIONS
ALABC Advanced Lead-acid Battery Consortium
BEPS Battery Energy South Pacific
CAES compressed-air energy storage
CSIRO Commonwealth Scientific and Industrial Research Organization
DOD depth of discharge
EDLC electrochemical double-layer capacitor
EODV end-of-discharge voltage
ESA Electricity Storage Association
ETA Electric Transportation Applications
HEV hybrid electric vehicle
NAM negative active material
Na/S sodium/sulfur
Ni/Cd nickel/cadmium
OCV open circuit voltage
Pb/C lead/carbon
PSB polysulfide bromide
PSOC partial state of charge
SLI starting, lighting, and ignition
SMES superconducting magnetic energy storage
SNL Sandia National Laboratories
SOC state of charge
TOCV top-of-charge voltage
VRLA valve-regulated lead-acid
UFR utility frequency regulator
VRB vanadium redox battery
Zn/Br zinc/bromine

11
12
EXECUTIVE SUMMARY
This project focused on evaluating lead-based energy storage technologies appropriate for utility applications and developing carbon materials that improve the performance of lead-based energy storage technologies. In Phase I, lead/carbon (Pb/C) asymmetric capacitors were identified as having the potential to deliver energy for less than $250/kWh (including both the energy storage device and a power conditioning system specifically designed for the Pb/C technology). Thus, this project’s original goals were to compare the Pb/C technology to other technologies that use the same or similar materials and to select the most promising technologies for commercialization and use in a utility application.
During Phase I (in 2005), it was found that Pb/C asymmetric capacitors were not currently economical using commercially available non-proprietary materials and were, at that time, too far from commercialization to be a viable technology for evaluation in high-power utility applications. Initial research indicated that a hybrid energy storage device created by adding carbon to the negative electrode of a standard lead-acid battery showed more promise in the near term for high-power applications than a true Pb/C asymmetric capacitor. The project then re-focused on evaluating carbon-modified lead-acid batteries that could be made on current lead-acid battery manufacturing equipment. In Phase I, prototype carbon-modified batteries were manufactured on commercial battery lines and evaluated. Some performance properties of the carbon-modified batteries improved (e.g., life under shallow partial-state-of-charge [PSOC] cycling and overcharge acceptance) compared with standard lead-acid batteries, while other properties degraded (e.g., life under broader PSOC cycling, cold cranking amps, and gassing/float) compared with standard lead-acid batteries. Optimization of the carbon-modified negative electrodes was needed to improve device performance for the utility application of interest.
In Phase II, various carbon types were evaluated as additives to the negative plates of lead-acid batteries, and the carbons that gave the best performance were identified based on evaluations in test cells under a simple PSOC cycle (shallow 6% SOC window). It was found that activated carbons perform better at low loadings (1% by weight) and graphitic carbons perform better at mid to high loadings (2%, 5%). Activated carbon properties that gave the best performance included larger particle size, unwashed, and mesoporous. Synthetic expanded graphite performed better than natural flake graphite at the mid loading (2%), and natural flake graphite performed better than synthetic expanded graphite at the higher loading (5%). Overall, mesoporous activated carbon at low loadings and graphite at high loadings gave the best cycle performance.
Performance verification was then completed for various lead-acid battery types (valve-regulated lead-acid [VRLA] and gel) with carbon additives in the negative plate. Conclusions from a VRLA study were that a mixture of carbon black (2% by weight) and graphite (2% by weight) in the negative plate gave the best performance under advanced PSOC cycling (shallow SOC window of 3%). A second battery study used VRLA gel batteries. In that study, a 3% (by weight) mesoporous activated carbon loading in the negative plate gave the best performance under advanced PSOC cycling. When these gel batteries were cycled under a wider PSOC cycle, however, the standard gel battery gave the best performance and additional carbon did not realize any benefit for cycle performance.

13
In Phase III, using energy storage in a 1-MW/1-MWh Utility Frequency Regulator (UFR) application was studied and the cost/performance benefit of using gel lead-acid batteries as the storage technology was quantified. Based on the results, the Battery Energy STD 1 gel battery should provide at least 2 to 3 years of continuous service at the assumed power-to-energy ratio. The capital cost estimate for the UFR was $3,728,000 total recurring cost and $439,200 non-recurring costs. The suggested next steps are to estimate the revenue that could be made with the UFR, optimize the power-to-energy ratio, and adjust the design accordingly to provide a complete economic analysis of the system for this application.

14
INTRODUCTION
Energy storage for the utility industry is currently receiving increased attention. The Electricity Storage Association (ESA) meets annually to discuss the progress being made towards the development of various energy storage technologies. Some key goals to be achieved by the development of these energy storage devices for utility-based energy storage applications include—
• Damping of grid disturbances and eliminating cascading failures such as the northeast outage of 2003;
• Higher power quality; • Enhanced value/market penetration from renewable resources such as wind and solar
energy; and • Improved utilization of existing utility assets including generation stations,
transmission lines, substations, etc.
Although energy storage is becoming increasing desirable, no feasible solution exists today that meets cost targets necessary for widespread technology adoption. Second, there is a wide range of energy storage applications that have significantly different performance requirements for energy storage devices. As a result, it is unlikely that any single technology will attain widespread adoption and technologies will need to be developed on a case-by-case basis. The following sections summarize information on the different energy storage applications and energy storage devices.
Utility-based Energy Storage Applications
Break-even cost targets for different forms of energy storage were analyzed by John Boyes of Sandia National Laboratories (SNL) [1]. The results identify the capacity for the various energy storage applications and are shown in Figure 1. The cumulative market for energy storage comprised many different applications. No single application comprises more than 20% of the total market.

15
0
5,000
10,000
15,000
20,000
25,000
0 200 400 600 800 1,000 1,200
Breakeven Cost of Storage ($/kW)
Cum
ulat
ive
Mar
ket (
MW
)
T&D Congestion
Ancillary ServicesT Access Charge Reduction
T&D Support
Renewables Firming
Central Capacity
Arbitrage
Customer Reliability
Demand Charge Reduction
Transmission Upgrade Deferral
Renewables Time-of-Production PaymentsD Deferral – median CA cost
End-user PQ T.O.U. + DemandCharge Reduction
T.O.U. Energy-only
D Deferral –highest 10% cost
Figure 1. Break-even cost of storage by application [1].
These applications will require charge/discharge cycles that range from seconds for power quality applications, hours for power arbitrage and peak shifting applications, to days for renewable energy firming. Figure 2 outlines the charge/discharge time characteristics for various different energy storage applications.
Mitigation of Transmission Congestion,
Arbitrage
Dispatchabilityfor Renewables,
Village Power
Voltage Support,Transients
Peak Shavingto Avoid
Demand Charges
DER Support forLoad Following
PQ,Digital
Reliability
Mitigation of Transmission Congestion,
Arbitrage
Dispatchabilityfor Renewables,
Village Power
Voltage Support,Transients
Peak Shavingto Avoid
Demand Charges
DER Support forLoad Following
PQ,Digital
Reliability
LOAD
GRID
POWER ENERGYSeconds minutes – hours diurnal
Figure 2. Energy storage charge/discharge time characteristics by application [2].
At the high end of the spectrum, cost targets from $500 to $1500/kWh may be justified in cases such as the transmission line and power station upgrade deferrals [1, 2]. Over half of the energy storage applications require target costs for devices below $400/kWh, which is a difficult target for emerging energy storage technologies. Based on the results shown in Figure 1, it is therefore likely that high-cost upgrade deferrals will be the first application for energy storage based on the higher acceptable technology cost. End user power quality will likely occur next, followed by power arbitrage applications. Applications that require energy storage with charge/discharge times greater than 3 to 5 hours include power arbitrage, renewable energy firming, peak shaving, many upgrade deferral applications, etc.
16
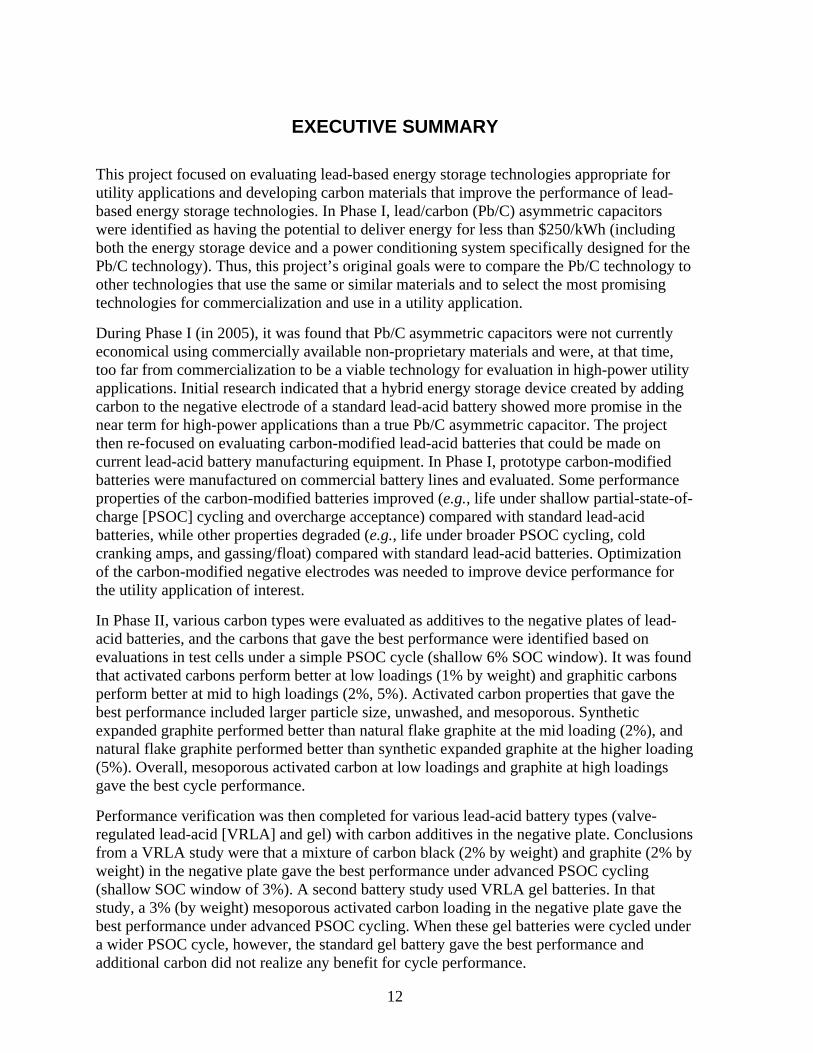
Peak shaving has recently received a significant amount of attention [3]. Energy is stored during times of low demand and then released to reduce peak demands. As shown in Figure 3, a typically daily load will vary between a minimum of about 50,000 MW at 3:00 a.m. to a maximum of 70,000 MW at 7:30 p.m. The peak load occurs over a period of about 4 to 5 hours. Therefore an energy storage device can be expected to charge for a period of about 4 hours from 1 a.m. to 5 a.m., float at the fully charged state for 12 hours until 5 p.m., discharge for 4 hours until 9 p.m., and then float in the discharged state for 4 hours until 1 a.m. when the cycle starts again.
Figure 3. Representative daily power use [3].
For power arbitrage applications, a simple calculation can be used to estimate the allowable cost of an energy storage device based on the following assumptions:
1. Total cost of ownership of an energy storage system must be lower than the market cost of electricity (assume $0.08/kWh to be economically feasible).
2. Lifespan of the system is 10 years or 3000 cycles. 3. Charge/discharge energy efficiency is 80%.
Therefore, the maximum system cost can be calculated as follows:
$/kWh 1920.80$/kwh 0.08 cycles 3000 Cost SystemMax =××=
$200/kWh is a difficult target to meet and compares with the value of $300/kWh shown in Figure 1. The difference is likely due to the lifespan used in the application (i.e., 10 years). Most available data for energy storage applications will specify a system cost in $/kWh. The cost of an energy storage device will need to be paid off over the lifespan of the device. Consequently, the cycle life of an energy storage device is an important parameter in determining its economic feasibility. Furthermore, expensive energy storage devices that exhibit extremely long cycle life may not be feasible if the capital cost of the energy storage system cannot be recovered in 10 to 20 years.

17
Energy Storage Devices
Many energy storage devices are currently available or are being developed for utility applications. Some of the more promising energy storage devices include [1, 2]—
• Lead-acid batteries • Nickel/cadmium (Ni/Cd) batteries • High-temperature sodium/sulfur (Na/S) batteries • Polysulfide bromide (PSB or Regenesys) flow batteries • Vanadium redox (or VRB) flow batteries • Zinc/bromine (Zn/Br) flow batteries • Electric double-layer capacitors (EDLCs) • Superconducting magnetic energy storage (SMES) • Flywheels • Pb/C asymmetric capacitors • Compressed-air energy storage (CAES) • Pumped hydro
Lead-acid, Ni/Cd, and Na/S batteries have already been demonstrated in large energy storage devices (>10 MWh). Flow batteries (e.g., PSB, VRB, and Zn/Br) usually become economically feasible for extremely large applications (>100 MWh). EDLCs, SMES, flywheels, and Pb/C asymmetric capacitors are emerging technologies. CAES and pumped hydro energy storage systems are mature technologies that have been demonstrated in large-scale applications but require specific geological conditions that restrict their use. The applications for various energy storage devices are shown in Table 1.
Table 1. Applicable Technologies for Various Energy Storage Devices [2]
Energy Storage Technology
Power Quality
3-hour Load Shift
10-hour Load Shift
Approximate Cost* ($/kw)
Lead-acid Batteries X X 500
Ni/Cd Batteries X X 900
Na/S Batteries X X X 800
PSB Flow Batteries X X 900
VRB Flow Batteries X X 900
Zn/Br Flow Batteries X X 1000
EDLCs X 600
SMES X 800
Flywheels X 700
CAES X 700 *Total capitalized costs in 2006 including both initial capital and annual expected costs [2]. Cost depends strongly on application and may increase by as much as a factor of 3.
18
Background – Lead-acid Batteries
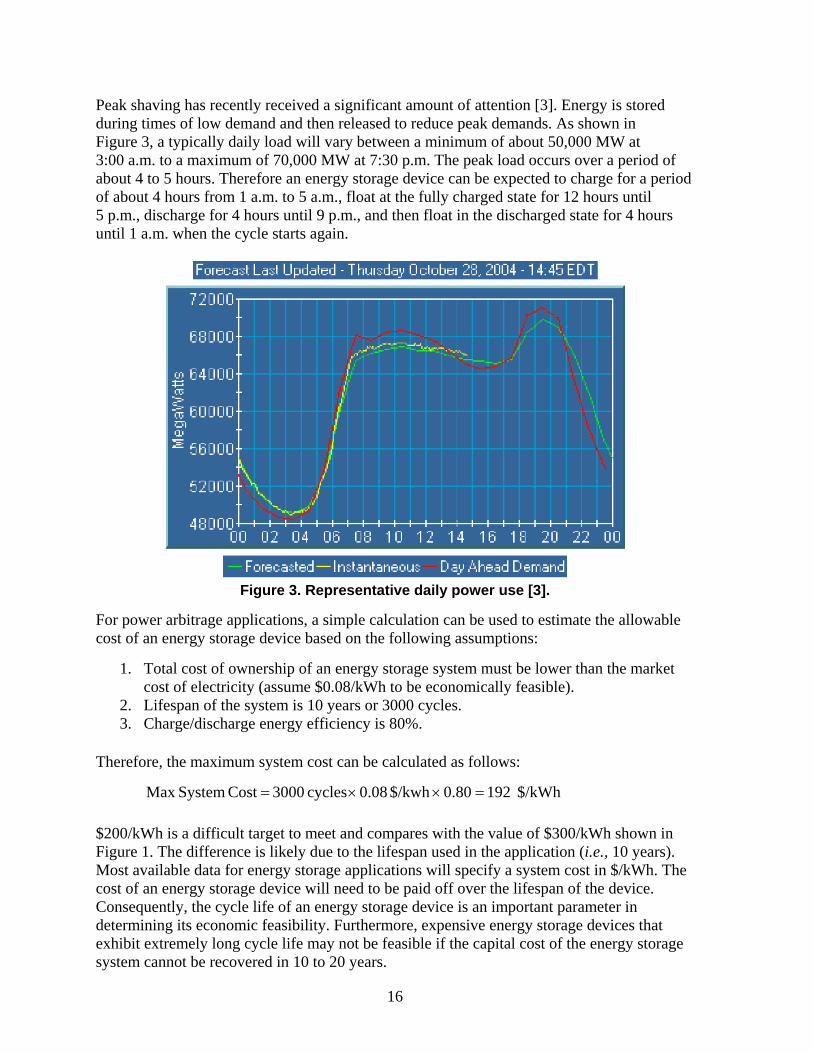
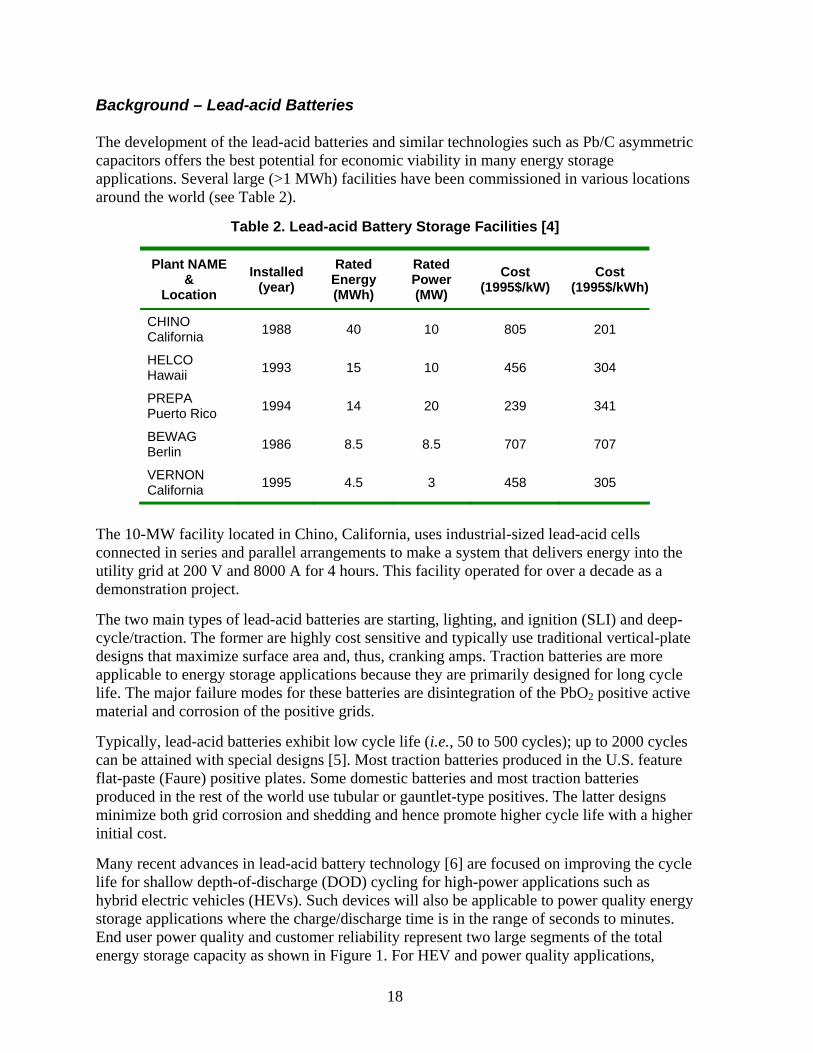
The development of the lead-acid batteries and similar technologies such as Pb/C asymmetric capacitors offers the best potential for economic viability in many energy storage applications. Several large (>1 MWh) facilities have been commissioned in various locations around the world (see Table 2).
Table 2. Lead-acid Battery Storage Facilities [4]
Plant NAME &
Location Installed
(year) Rated
Energy (MWh)
Rated Power (MW)
Cost (1995$/kW)
Cost (1995$/kWh)
CHINO California 1988 40 10 805 201
HELCO Hawaii 1993 15 10 456 304
PREPA Puerto Rico 1994 14 20 239 341
BEWAG Berlin 1986 8.5 8.5 707 707
VERNON California 1995 4.5 3 458 305
The 10-MW facility located in Chino, California, uses industrial-sized lead-acid cells connected in series and parallel arrangements to make a system that delivers energy into the utility grid at 200 V and 8000 A for 4 hours. This facility operated for over a decade as a demonstration project.
The two main types of lead-acid batteries are starting, lighting, and ignition (SLI) and deep-cycle/traction. The former are highly cost sensitive and typically use traditional vertical-plate designs that maximize surface area and, thus, cranking amps. Traction batteries are more applicable to energy storage applications because they are primarily designed for long cycle life. The major failure modes for these batteries are disintegration of the PbO2 positive active material and corrosion of the positive grids.
Typically, lead-acid batteries exhibit low cycle life (i.e., 50 to 500 cycles); up to 2000 cycles can be attained with special designs [5]. Most traction batteries produced in the U.S. feature flat-paste (Faure) positive plates. Some domestic batteries and most traction batteries produced in the rest of the world use tubular or gauntlet-type positives. The latter designs minimize both grid corrosion and shedding and hence promote higher cycle life with a higher initial cost.
Many recent advances in lead-acid battery technology [6] are focused on improving the cycle life for shallow depth-of-discharge (DOD) cycling for high-power applications such as hybrid electric vehicles (HEVs). Such devices will also be applicable to power quality energy storage applications where the charge/discharge time is in the range of seconds to minutes. End user power quality and customer reliability represent two large segments of the total energy storage capacity as shown in Figure 1. For HEV and power quality applications,
19
where high-rate PSOC operation occurs, the lower surface area negative electrode tends be the main problem with sulfation occurring in lead-acid batteries.
Lead/Carbon Capacitors
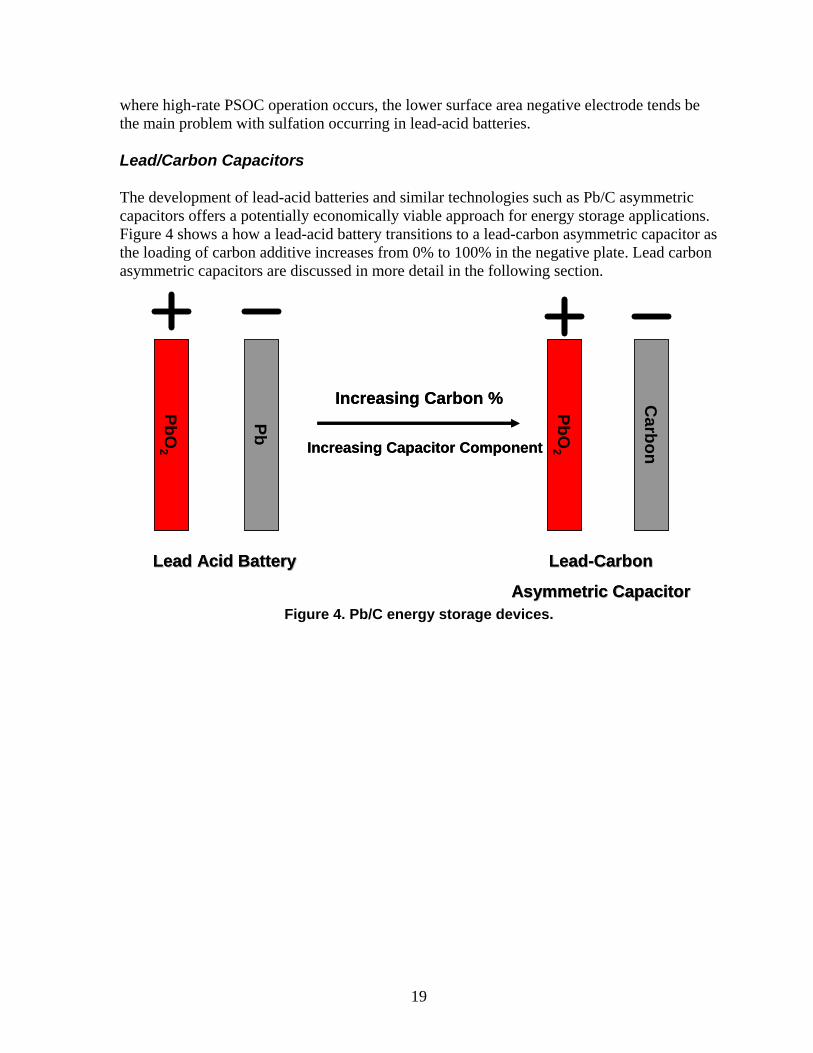
The development of lead-acid batteries and similar technologies such as Pb/C asymmetric capacitors offers a potentially economically viable approach for energy storage applications. Figure 4 shows a how a lead-acid battery transitions to a lead-carbon asymmetric capacitor as the loading of carbon additive increases from 0% to 100% in the negative plate. Lead carbon asymmetric capacitors are discussed in more detail in the following section.
PbO2
Pb
PbO2
Carbon
Increasing Carbon %
Lead Acid BatteryLead Acid Battery LeadLead--CarbonCarbon
Asymmetric CapacitorAsymmetric Capacitor
Increasing Capacitor Component
PbO2
Pb
PbO2
Carbon
Increasing Carbon %
Lead Acid BatteryLead Acid Battery LeadLead--CarbonCarbon
Asymmetric CapacitorAsymmetric Capacitor
Increasing Capacitor Component
Figure 4. Pb/C energy storage devices.

20
PHASE I—LEAD/CARBON ENERGY STORAGE DEVICES
The Pb/C asymmetric device contains a traditional lead-acid battery positive electrode and an activated carbon negative electrode. The electrolyte is aqueous (e.g., sulfuric acid). Four main U.S. patents relate to this technology: 6,222,723; 6,195,252; 6,426,862; and 6,466,429. A number of companies are developing and working toward commercially producing these types of devices, including ESMA/Universal Supercapacitors, Axion Power, and Furukawa (licensee of the ‘ultrabattery’ technology developed at the Commonwealth Scientific and Industrial Research Organization, or CSIRO). Because the materials being developed are proprietary, components for building test-scale versions of these devices were difficult to obtain.
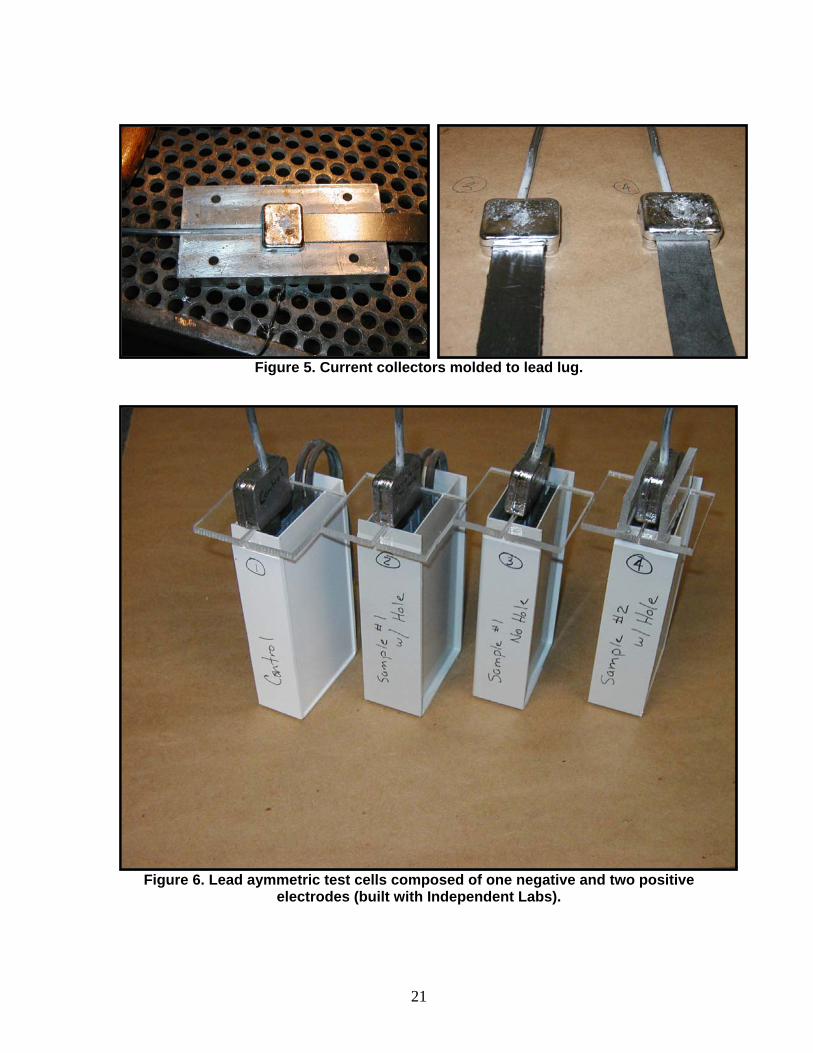
Nevertheless, our goal was to investigate device designs that could be integrated into the existing commercial lead-acid battery manufacturing base to minimize costs. To evaluate this possibility, we attempted to build test cells on our own. We had difficulty finding a source that could supply or fabricate current collectors for the activated carbon electrode that could be integrated into current lead-acid battery cast on strap manufacturing. The options considered included polymer coated metals, carbon, and titanium. Ultimately we chose graphite sheet, but the graphite current collectors (Figure 5) ultimately failed due to poor mechanical strength, or they were not compatible with the molten lead used in cast on strap manufacturing.
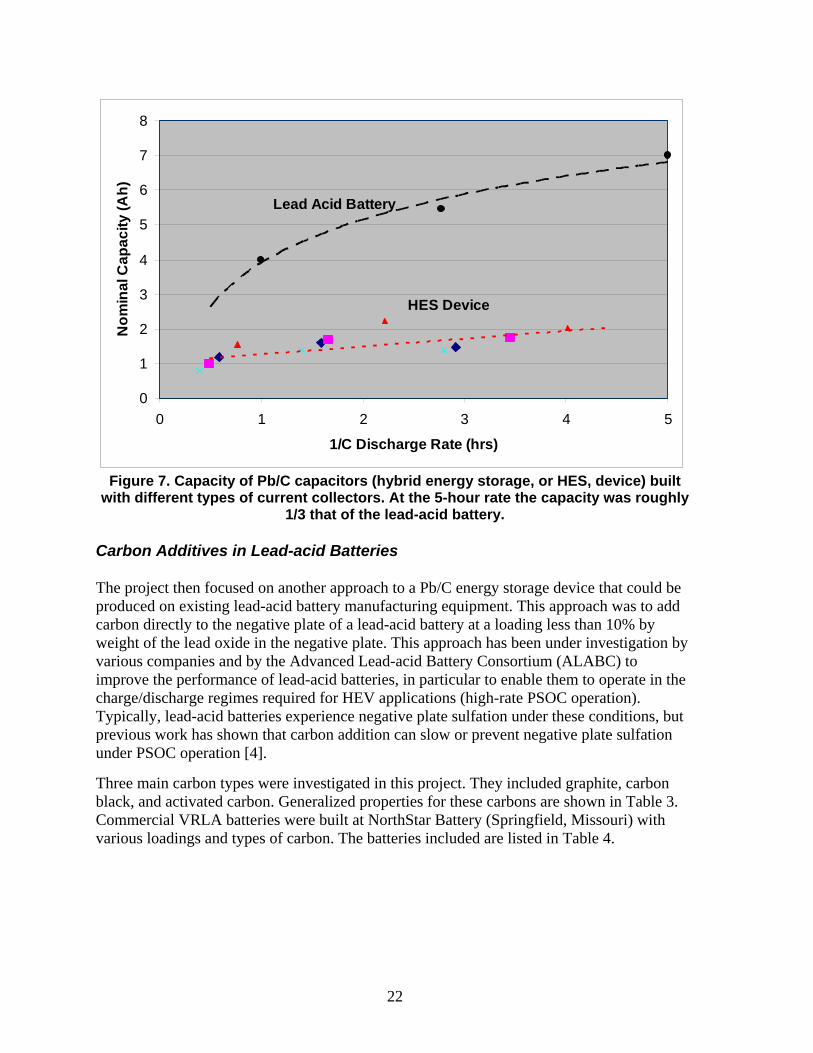
We built some lead-carbon asymmetric test cells (Figure 6), and compared their capacity to a traditional lead-acid battery. The lead-carbon asymmetric test cells had lower capacity compared with a lead-acid battery (Figure 7). Based on the difficulties encountered with this technology and the lack of available materials and information, we decided to refocus the program on carbon additives to the negative plates of lead-acid batteries. This approach appeared to be more economical, and devices could be readily produced on existing lead-acid battery manufacturing equipment.
21
Figure 5. Current collectors molded to lead lug.
Figure 6. Lead aymmetric test cells composed of one negative and two positive
electrodes (built with Independent Labs).
22
0
1
2
3
4
5
6
7
8
0 1 2 3 4 5
1/C Discharge Rate (hrs)
Nom
inal
Cap
acity
(Ah)
Lead Acid Battery
HES Device
Figure 7. Capacity of Pb/C capacitors (hybrid energy storage, or HES, device) built
with different types of current collectors. At the 5-hour rate the capacity was roughly 1/3 that of the lead-acid battery.
Carbon Additives in Lead-acid Batteries
The project then focused on another approach to a Pb/C energy storage device that could be produced on existing lead-acid battery manufacturing equipment. This approach was to add carbon directly to the negative plate of a lead-acid battery at a loading less than 10% by weight of the lead oxide in the negative plate. This approach has been under investigation by various companies and by the Advanced Lead-acid Battery Consortium (ALABC) to improve the performance of lead-acid batteries, in particular to enable them to operate in the charge/discharge regimes required for HEV applications (high-rate PSOC operation). Typically, lead-acid batteries experience negative plate sulfation under these conditions, but previous work has shown that carbon addition can slow or prevent negative plate sulfation under PSOC operation [4].
Three main carbon types were investigated in this project. They included graphite, carbon black, and activated carbon. Generalized properties for these carbons are shown in Table 3. Commercial VRLA batteries were built at NorthStar Battery (Springfield, Missouri) with various loadings and types of carbon. The batteries included are listed in Table 4.

23
Table 3. Generalized Properties for Three Carbon Types
Carbon Surface Area (m2/g)
Capacitance (F/g) Conductivity Pore Volume
(cc/g)
Graphite 1 to 20 1 to 5 +++ 0 to 0.1
Carbon Black 50 to 1700 5 to 100 +++ 0.1 to 0.3
Activated Carbon 500 to 2000 50 to 200 ++ 0.5 to 1.3
Table 4. Batteries from Initial Trial at NorthStar (% by weight in negative plate based on lead oxide)
% by weight Battery Carbon
Black 1 Carbon Black 2 Lignin Graphite Activated
Carbon
Activated Carbon Type
Standard 0.25 - 0.18 - - -
MWV0 - 2.00 0.30 2.00 - -
MWV1 0.25 - 0.18 - 4.00 Microporous*
MWV2 1.50 - 0.18 - 4.00 Microporous*
MWV3 0.25 - 0.18 - 3.00 Mesoporous**
MWV4 1.50 - 0.18 - 3.00 Mesoporous**
* Microporous carbon refers to carbon that has the majority of its pore volume within pores less than 20 Angstrom in size.
** Mesoporous carbon refers to carbon that has the majority of its pore volume within pores between 20 Angstrom and 500 Angstrom in size.
The batteries were tested for a variety of properties, including life cycle under a simple PSOC cycle (see Page 28 and Figure 10 for details), charge acceptance under fast charge (108% cycling), life cycle under a simulated utility cycle (see Page 52 for details), J240 SAE life test for automotive batteries, gas/float testing, cold cranking amps, and Tafel plots. A summary of the test results are shown in Table V. Carbon addition led to improved performance for some properties, including increased cycle life for shallow PSOC cycling and increased overcharge acceptance. Carbon addition led to decreased performance for other properties, including broader SOC window PSOC cycling, gas/float, and cold cranking amps. Further work was needed at this point to determine what carbon types, properties, and loadings would realize performance improvements without the accompanying performance decreases. This became the focus of the Phase II work.

24
Table 5. Summary of Battery Performance
Battery Size (Ah)
Simple PSOC
Cycling
108% Cycling Charge
Acceptance
Utility Cycling J240 Gas/Float CCA Tafel
Standard 30 × × × × × × ×
Standard 40 × × × × × × ×
Standard 50 × × × × × × ×
MWV0 30 >6× 10× 0.8× 0.8× 20/20× 0.8× 20×
MWV0 70 6× 10× - - - 0.8× -
MWV1 30 4× 10× 0.8× 0.3× 20/20× 0.8× 20×
MWV2 30 2× 10× - - - 0.7× -
MWV3 50 6× 10× - 0.9× 2/10× 0.8× -
MWV4 50 3× - - - - 0.7× -

25

26
PHASE II—DEVELOPING A FURTHER UNDERSTANDING OF CARBON ADDITIVES IN LEAD-ACID BATTERIES
Hammond Test Cells
Cell Preparation
In an effort to determine the best carbon and loading level for lead-acid batteries in the PSOC application (i.e., frequency regulation), Hammond Expanders constructed and formed 72 three-plate negative limited test cells (Figure 8). These cells were capacity characterized and cycled with the simple PSOC cycling algorithm to investigate performance differences between seven specific types of carbon materials.
Figure 8. Three-plate negative limited (two positives, one negative) test cell fixture.
Negative plates with 24 paste mix variables (carbon type and loading) were pasted and cured at Hammond Expanders. Matching positive plates (two positives per negative) were obtained from NorthStar Batteries.
The goal of this study was to determine the optimum loading, particle size, and carbon type for activated carbon additives in lead-acid batteries. The carbon loadings were 1%, 2%, and 5% by weight; the target particle sizes were 10 µm and 30 µm; and the carbon types included mesoporous and microporous activated carbons, graphite (expanded and flake), and Hammond 2:2 Mix (flake graphite:carbon black). Material properties are listed in Table 6 and Table 7.

27
Table 6. Carbon Properties
General Type Carbon Code
BET Surface
Area (m2/g)
Particle Size
(d50, μm)
Total Pore Volume (cm3/g)
Micropore Volume (cm3/g)
Acid Washed (Yes/No)
Type A-200 1757 12 1.32 0.20 Yes
Type A-198 1761 29 1.32 0.20 Yes Mesoporous Activated Carbon
Type A1-202 1820 27 1.33 0.23 No
Type B-702 1169 9.6 0.55 0.47 Yes Microporous Activated Carbon Type B-701 1221 6.6 0.57 0.49 Yes
Flake Graphite* APH 2939 8 11.4 -- -- No
Expanded Graphite* ABG 1010 22 -- 0.12 0.01 No
Hammond 2:2 Mix** 2:2 91 3.5 NA NA No
* Flake graphite (natural) and expanded graphite (synthetic) obtained from Superior Graphite via Hammond Expanders.
** Hammond 2:2 mix is mixture of flake graphite (APH 2939) and carbon black (N-136, Sid Richardson Carbon & Energy Company).
Table 7. Carbon Purity (ppm)
Element A-200 (washed)
A-198 (washed)
A1-202 (unwashed)
B702 (washed)
B-701 (washed)
APH 2939 (unwashed)
ABG 1010 (unwashed)
2:2 Mix (unwashed)
Cr 0 0 6 2 2 0 1 2 Cu 0 0 1 5 3 0 0 0 Fe 5 4 106 10 9 43 15 36 Mn 1 1 2 0 0 0 0 0 Ni 2 0 1 1 1 1 1 0 Ti 3 3 5 1 1 33 4 12 V 0 0 0 0 0 3 1 1 Zn 0 1 1 18 9 12 20 13
Cell Performance
The carbon-additive-containing negative plates were assembled into three-plate VRLA cells with 4.35 Ah and 1.74 Ah of positive and negative capacity, respectively (C/1 rate). This cell design has been adopted from past research projects done by both Hammond (Dave Boden) and CSIRO (Russell Newnham).

28
Capacity Results
As shown in Figure 9, the capacity of the cells at the C/1 rate following ten conditioning charge/discharge cycles shows little variation in performance among the various carbon types and loadings. This is expected, as each electrode was pasted to weight and contains the same amount of negative active material (regardless of density) and an excess of positive active material.
Hammond Test Cell Initial Capacities
0.00
0.50
1.00
1.50
2.00
2.50
Contro
l
Type
A-20
0 -1%
Type A
-200- 2
%
Type
A-20
0- 5%
Type
A-19
8 - 1%
Type A
-198 - 2
%
Type A
-198 - 5
%
APH 2939 -
1%
APH 2939 -
2%
APH 2939 -
5%
Type B
-702 - 1
%
Type B
-702 - 2
%
Type B
-702 - 5
%
Type B
-701 - 1
%
Type B
-701 - 2
%
Type B
-701 - 5
% 2-2
Type A
1-202
- 1%
Type
A1-20
2 - 2%
Type A
1-202 -
5%
ABG1010
- 1%
ABG1010-
2%
ABG1010
- 5%
A1 - 5% 10
10 - 1
%
AH
Figure 9. Initial capacity of Hammond test cells.
Cycling Results
The cells were cycled with a PSOC protocol used in past research projects: ‘simple HEV’ or ‘simple PSOC’ screening algorithm (6% SOC window). A general description of the cycling protocol is shown below (maximum current = 3.48 A, maximum voltage = 2.5 V).
• CHARGE: Fully charge the cell. • DISCHARGE: Measure capacity at C/1 between each cycle set. • CHARGE: Fully charge the cell. • DISCHARGE: 30 minutes at C/1 (i.e., to 50% DOD).
Begin PSOC Cycling
• CHARGE: 1 minute at 2C. • REST: 10 seconds. • DISCHARGE: 1 minute at 2C. • REST: 10 seconds.
Repeat PSOC Cycling—Record every 100th cycle until V < 1.7 V.

29
As shown in Figure 10, cells were cycled for a total of five cycle sets. Each color block is a separate cycle set, indicating the change in performance of the various carbon types as cycling progressed.
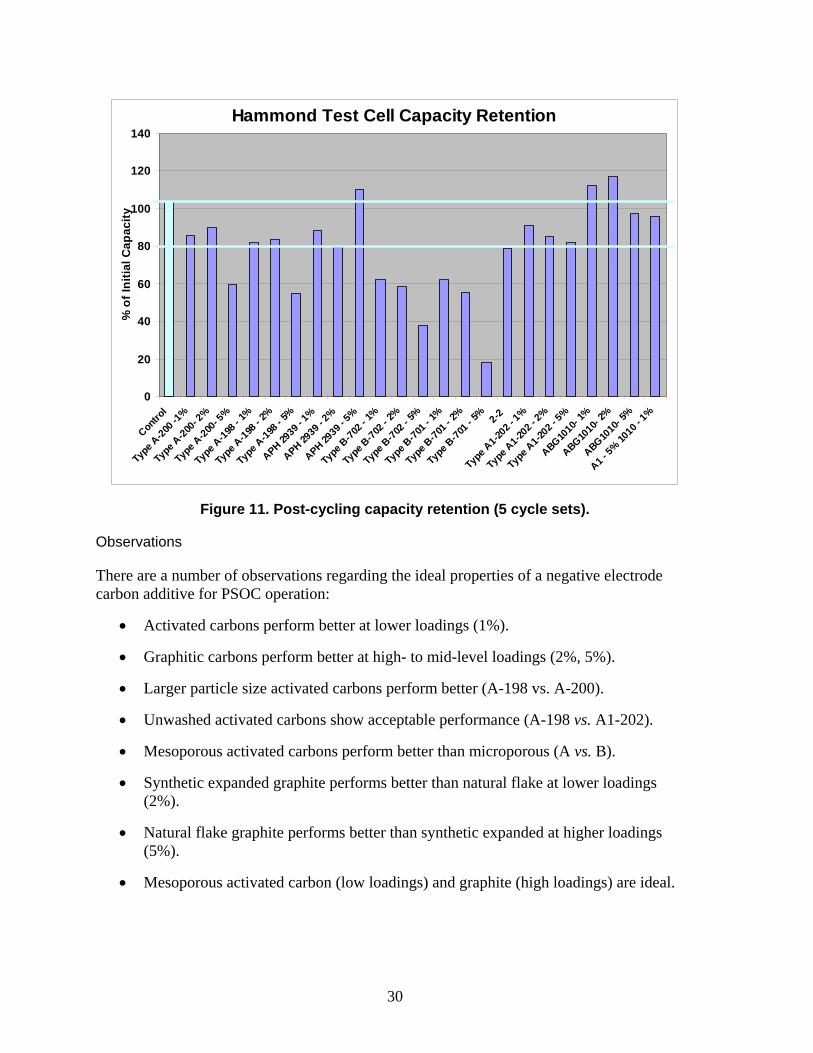
Additionally, Figure 11 indicates the percent of initial capacity retained after the five cycle sets. This suggests a trend in the ability to remove sulfate during full recharge, where the heavily cycled electrodes see some irreversible capacity loss, yet the best cycling additive plates retain at least 80% of their initial capacity (Type A-198-1%, Type A1-202-1%, and ABG1010-2% as well as APH2939-5%). Poor cycling electrodes that show low retained capacity suggest no enhanced route for the removal of hard sulfate (activated carbon Type B), while those with lower cycle numbers and acceptable retained capacities require a full-charge to maintain capacity, but cannot cycle long without this charge.
Hammond Test Cell Cycling Performance
0
10000
20000
30000
40000
50000
60000
Control
Type A
-200 -1
%
Type A
-200- 2
%
Type A
-200- 5
%
Type A
-198 - 1
%
Type A
-198 - 2
%
Type A
-198 - 5
%
APH 2939
- 1%
APH 2939
- 2%
APH 2939
- 5%
Type B
-702 - 1
%
Type B
-702 - 2
%
Type B
-702 - 5
%
Type B
-701 - 1
%
Type B
-701 - 2
%
Type B
-701 - 5
% 2-2
Type A
1-202
- 1%
Type A
1-202
- 2%
Type A
1-202
- 5%
ABG1010-
1%
ABG1010-
2%
ABG1010-
5%
A1 - 5%
1010
- 1%
Sim
ple
PSoC
Cyc
les
Figure 10. Simple PSOC cycling performance of Hammond test cells.
30
Hammond Test Cell Capacity Retention
0
20
40
60
80
100
120
140
Contro
l
Type A
-200 -1
%
Type
A-20
0- 2%
Type A
-200- 5
%
Type A
-198 - 1
%
Type A
-198 - 2
%
Type A
-198 - 5
%
APH 2939
- 1%
APH 2939
- 2%
APH 2939
- 5%
Type B
-702 - 1
%
Type
B-70
2 - 2%
Type B
-702 - 5
%
Type
B-70
1 - 1%
Type B
-701 - 2
%
Type
B-70
1 - 5% 2-2
Type A
1-202 -
1%
Type
A1-20
2 - 2%
Type A
1-202 -
5%
ABG1010
- 1%
ABG1010-
2%
ABG1010
- 5%
A1 - 5% 10
10 - 1
%
% o
f Ini
tial C
apac
ity
Figure 11. Post-cycling capacity retention (5 cycle sets).
Observations
There are a number of observations regarding the ideal properties of a negative electrode carbon additive for PSOC operation:
• Activated carbons perform better at lower loadings (1%).
• Graphitic carbons perform better at high- to mid-level loadings (2%, 5%).
• Larger particle size activated carbons perform better (A-198 vs. A-200).
• Unwashed activated carbons show acceptable performance (A-198 vs. A1-202).
• Mesoporous activated carbons perform better than microporous (A vs. B).
• Synthetic expanded graphite performs better than natural flake at lower loadings (2%).
• Natural flake graphite performs better than synthetic expanded at higher loadings (5%).
• Mesoporous activated carbon (low loadings) and graphite (high loadings) are ideal.

31
NorthStar December 2006 Build
Matrix Background and Details
The goal of this battery trial was to further our understanding of how carbon performs in VRLA batteries, specifically addressing the issues raised in Phase I by looking at the following:
• Carbon loadings—original loadings (2%, 3%, and 4%) perhaps too high?
• Carbon purity—high impurity levels possibly lowering the hydrogen overpotential and increasing gassing; and
• Carbon modifications—is it possible to change properties to enhance performance?
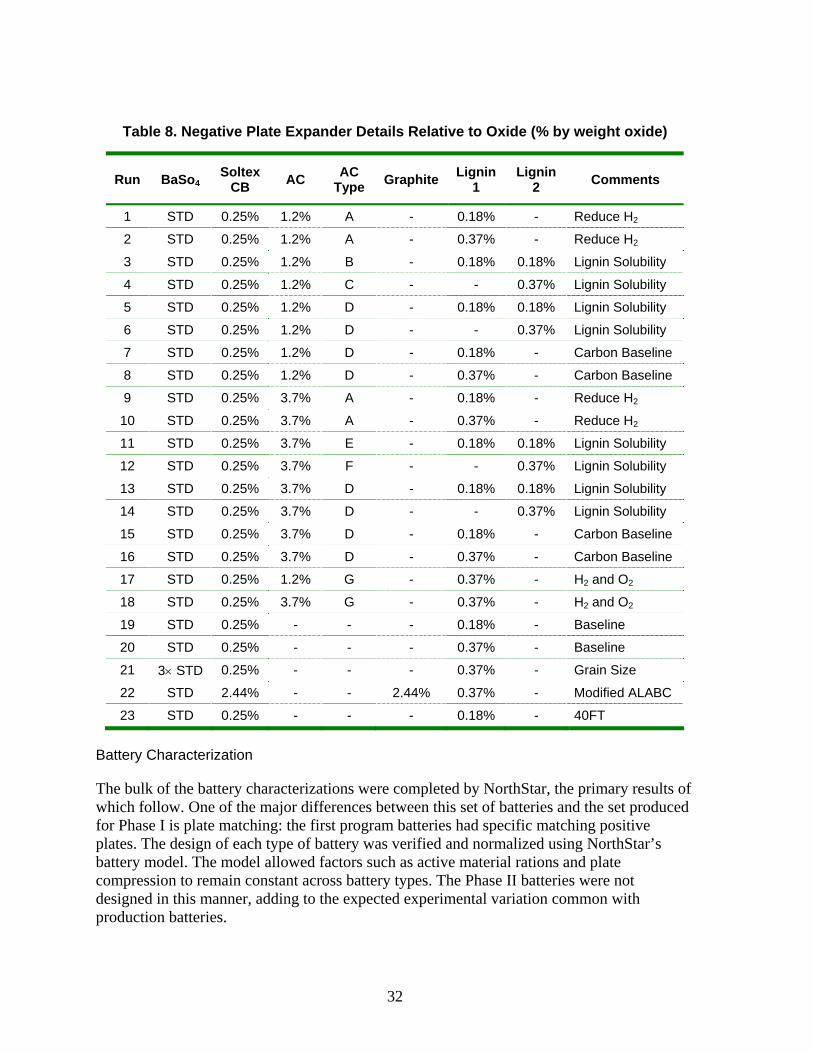
The matrix consisted of 23 runs, and batteries were manufactured based on the NorthStar Battery front terminal (2 × 3 cell) design. This design is different than that used in Phase I since NorthStar had discontinued manufacturing the industrial product. The front terminal design had plates that were taller and narrower than the industrial design and was more susceptible to heating at higher charge/discharge rates (thus the eventual need for the modified ‘advanced HEV’ cycling schedule). The 23 battery types and the carbons used are summarized in Table 8.
All of the activated carbon types used in the study were purified mesoporous carbons with and without further modifications. Various modifications were made to test the hypotheses that said modification would address a potential performance concern. Carbon A was impregnated with 1%-by-weight silver to decrease gassing, Carbon B was impregnated with 15%-by-weight lignin to prevent the carbon from soaking up the lignin from the expander, Carbon C was impregnated with 30% lignin, Carbon D was unmodified, Carbon E was impregnated with 5% lignin, Carbon F was impregnated with 10% lignin, and Carbon G was impregnated with 10%-by-weight non-detergent oil to reduce gassing.
32
Table 8. Negative Plate Expander Details Relative to Oxide (% by weight oxide)
Run BaSo4 Soltex
CB AC AC Type Graphite Lignin
1 Lignin
2 Comments
1 STD 0.25% 1.2% A - 0.18% - Reduce H2
2 STD 0.25% 1.2% A - 0.37% - Reduce H2
3 STD 0.25% 1.2% B - 0.18% 0.18% Lignin Solubility
4 STD 0.25% 1.2% C - - 0.37% Lignin Solubility
5 STD 0.25% 1.2% D - 0.18% 0.18% Lignin Solubility
6 STD 0.25% 1.2% D - - 0.37% Lignin Solubility
7 STD 0.25% 1.2% D - 0.18% - Carbon Baseline
8 STD 0.25% 1.2% D - 0.37% - Carbon Baseline
9 STD 0.25% 3.7% A - 0.18% - Reduce H2
10 STD 0.25% 3.7% A - 0.37% - Reduce H2
11 STD 0.25% 3.7% E - 0.18% 0.18% Lignin Solubility
12 STD 0.25% 3.7% F - - 0.37% Lignin Solubility
13 STD 0.25% 3.7% D - 0.18% 0.18% Lignin Solubility
14 STD 0.25% 3.7% D - - 0.37% Lignin Solubility
15 STD 0.25% 3.7% D - 0.18% - Carbon Baseline
16 STD 0.25% 3.7% D - 0.37% - Carbon Baseline
17 STD 0.25% 1.2% G - 0.37% - H2 and O2
18 STD 0.25% 3.7% G - 0.37% - H2 and O2
19 STD 0.25% - - - 0.18% - Baseline
20 STD 0.25% - - - 0.37% - Baseline
21 3× STD 0.25% - - - 0.37% - Grain Size
22 STD 2.44% - - 2.44% 0.37% - Modified ALABC
23 STD 0.25% - - - 0.18% - 40FT
Battery Characterization
The bulk of the battery characterizations were completed by NorthStar, the primary results of which follow. One of the major differences between this set of batteries and the set produced for Phase I is plate matching: the first program batteries had specific matching positive plates. The design of each type of battery was verified and normalized using NorthStar’s battery model. The model allowed factors such as active material rations and plate compression to remain constant across battery types. The Phase II batteries were not designed in this manner, adding to the expected experimental variation common with production batteries.
33
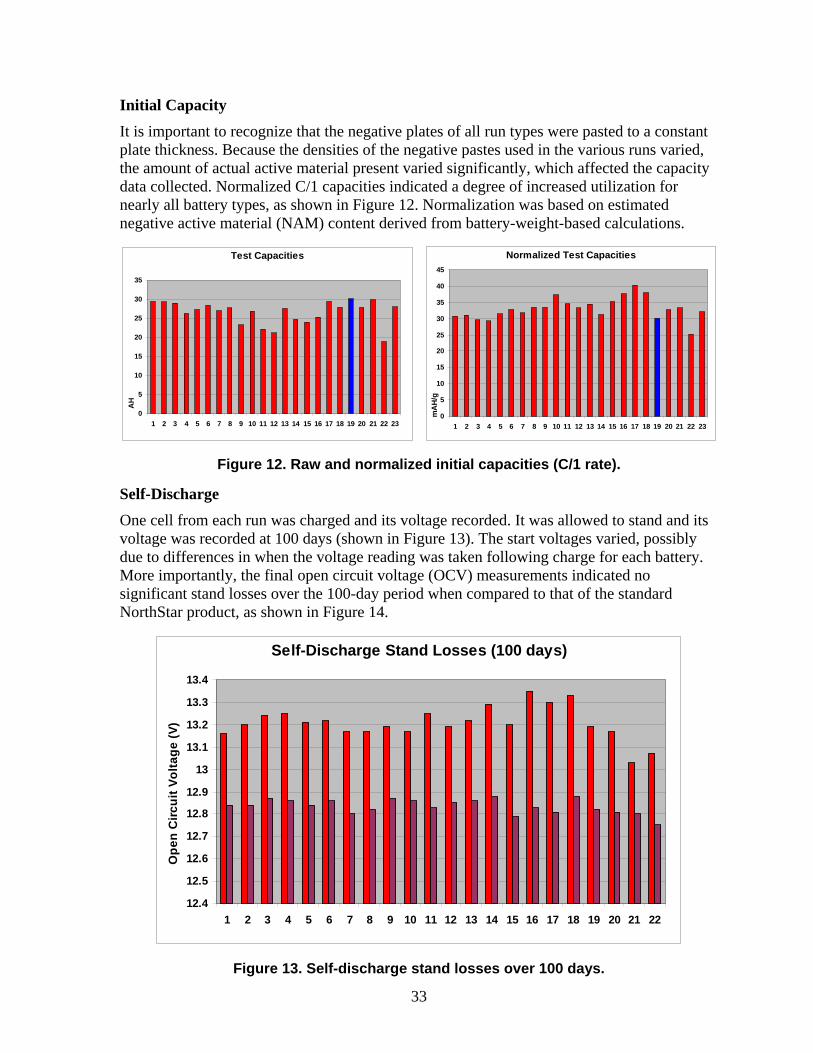
Initial Capacity
It is important to recognize that the negative plates of all run types were pasted to a constant plate thickness. Because the densities of the negative pastes used in the various runs varied, the amount of actual active material present varied significantly, which affected the capacity data collected. Normalized C/1 capacities indicated a degree of increased utilization for nearly all battery types, as shown in Figure 12. Normalization was based on estimated negative active material (NAM) content derived from battery-weight-based calculations.
Test Capacities
0
5
10
15
20
25
30
35
1 2 3 4 5 6 7 8 9 10 11 12 13 14 15 16 17 18 19 20 21 22 23
AH
Normalized Test Capacities
0
5
10
15
20
25
30
35
40
45
1 2 3 4 5 6 7 8 9 10 11 12 13 14 15 16 17 18 19 20 21 22 23m
AH
/g
Figure 12. Raw and normalized initial capacities (C/1 rate).
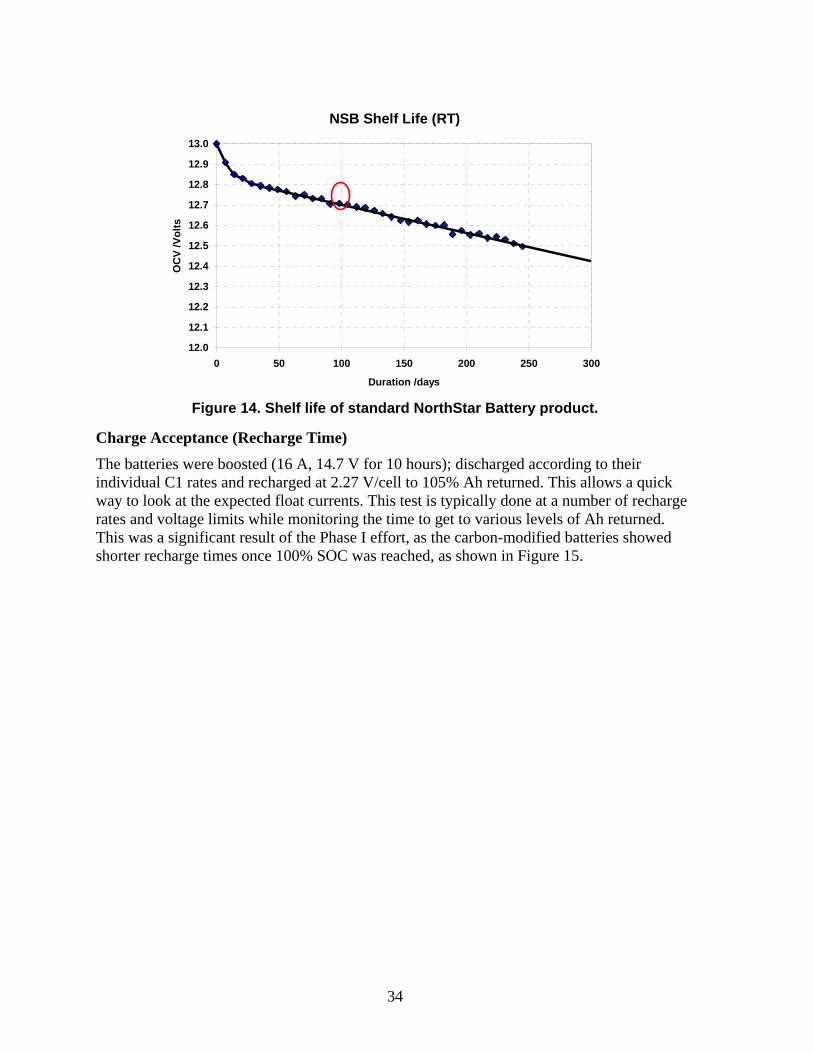
Self-Discharge
One cell from each run was charged and its voltage recorded. It was allowed to stand and its voltage was recorded at 100 days (shown in Figure 13). The start voltages varied, possibly due to differences in when the voltage reading was taken following charge for each battery. More importantly, the final open circuit voltage (OCV) measurements indicated no significant stand losses over the 100-day period when compared to that of the standard NorthStar product, as shown in Figure 14.
Self-Discharge Stand Losses (100 days)
12.4
12.5
12.6
12.7
12.8
12.9
13
13.1
13.2
13.3
13.4
1 2 3 4 5 6 7 8 9 10 11 12 13 14 15 16 17 18 19 20 21 22
Ope
n C
ircui
t Vol
tage
(V)
Figure 13. Self-discharge stand losses over 100 days.
34
Figure 14. Shelf life of standard NorthStar Battery product.
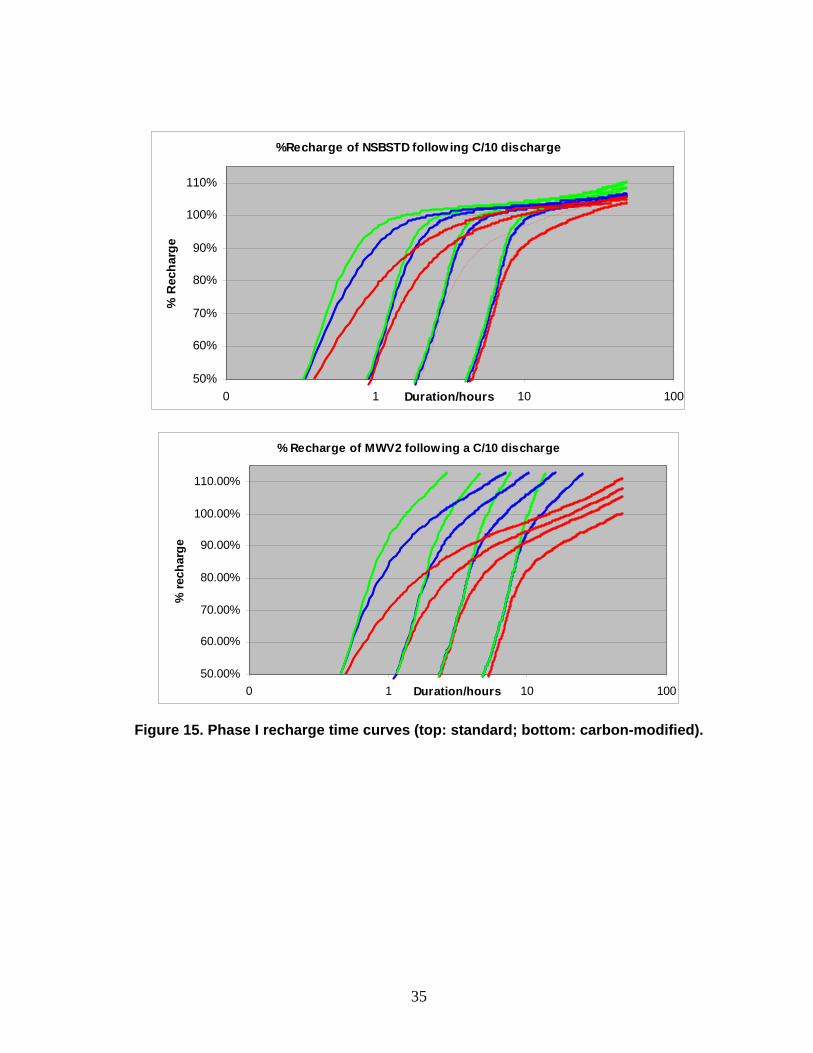
Charge Acceptance (Recharge Time)
The batteries were boosted (16 A, 14.7 V for 10 hours); discharged according to their individual C1 rates and recharged at 2.27 V/cell to 105% Ah returned. This allows a quick way to look at the expected float currents. This test is typically done at a number of recharge rates and voltage limits while monitoring the time to get to various levels of Ah returned. This was a significant result of the Phase I effort, as the carbon-modified batteries showed shorter recharge times once 100% SOC was reached, as shown in Figure 15.
NSB Shelf Life (RT)
12.0
12.1
12.2
12.3
12.4
12.5
12.6
12.7
12.8
12.9
13.0
0 50 100 150 200 250 300
Duration /days
OC
V /V
olts
35
%Recharge of NSBSTD following C/10 discharge
50%
60%
70%
80%
90%
100%
110%
0 1 10 100Duration/hours
% R
echa
rge
% Recharge of MWV2 following a C/10 discharge
50.00%
60.00%
70.00%
80.00%
90.00%
100.00%
110.00%
0 1 10 100Duration/hours
% re
char
ge
Figure 15. Phase I recharge time curves (top: standard; bottom: carbon-modified).
36
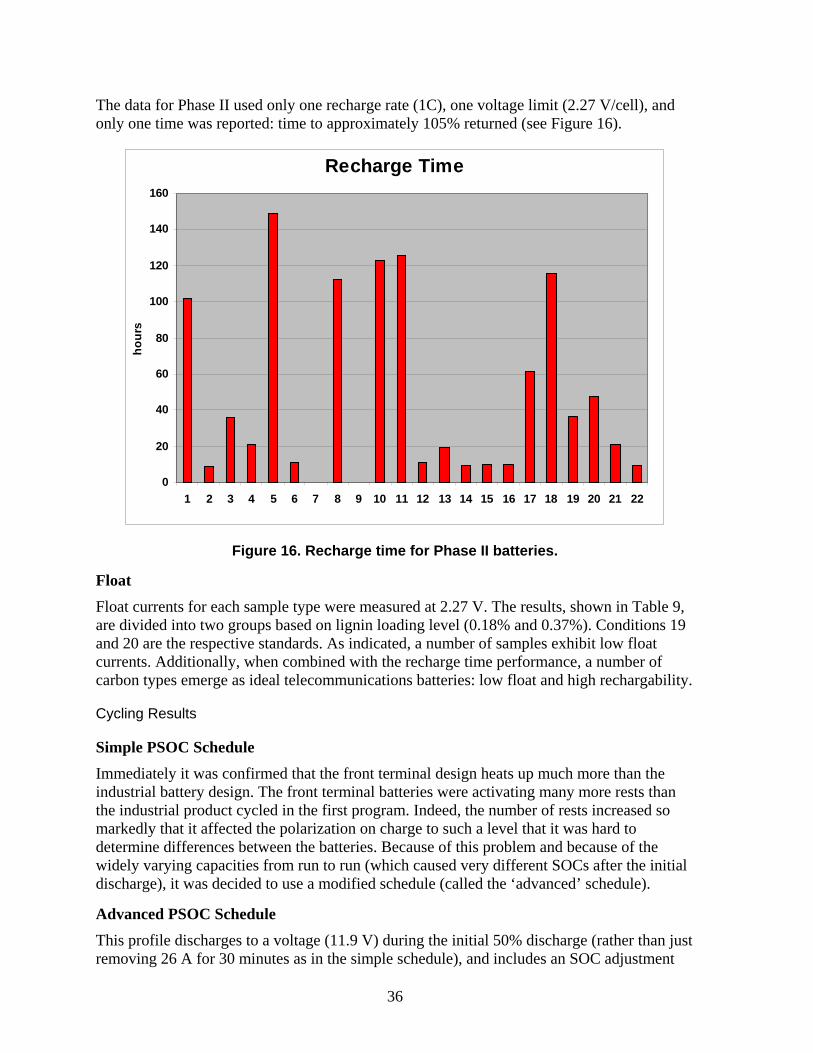
The data for Phase II used only one recharge rate (1C), one voltage limit (2.27 V/cell), and only one time was reported: time to approximately 105% returned (see Figure 16).
Recharge Time
0
20
40
60
80
100
120
140
160
1 2 3 4 5 6 7 8 9 10 11 12 13 14 15 16 17 18 19 20 21 22
hour
s
Figure 16. Recharge time for Phase II batteries.
Float
Float currents for each sample type were measured at 2.27 V. The results, shown in Table 9, are divided into two groups based on lignin loading level (0.18% and 0.37%). Conditions 19 and 20 are the respective standards. As indicated, a number of samples exhibit low float currents. Additionally, when combined with the recharge time performance, a number of carbon types emerge as ideal telecommunications batteries: low float and high rechargability.
Cycling Results
Simple PSOC Schedule
Immediately it was confirmed that the front terminal design heats up much more than the industrial battery design. The front terminal batteries were activating many more rests than the industrial product cycled in the first program. Indeed, the number of rests increased so markedly that it affected the polarization on charge to such a level that it was hard to determine differences between the batteries. Because of this problem and because of the widely varying capacities from run to run (which caused very different SOCs after the initial discharge), it was decided to use a modified schedule (called the ‘advanced’ schedule).
Advanced PSOC Schedule
This profile discharges to a voltage (11.9 V) during the initial 50% discharge (rather than just removing 26 A for 30 minutes as in the simple schedule), and includes an SOC adjustment

37
based on the discharge voltage that results in the batteries receiving a recharge of 15% when their SOC drops to approximately 40% SOC. In other words, the advanced schedule results in batteries from different batches being treated more evenly so that a more accurate comparison between run types can be obtained. Details of this cycling protocol are as follows:
(i) DISCHARGE at 26 A to 11. 9 V (~ 50% SOC). (ii) REST for 10 seconds. (iii) CHARGE at 60 A for 60 seconds; terminate test if voltage hits 17.5 V. (iv) REST for 10 seconds. (v) DISCHARGE at 60 A for 60 seconds; if battery temperature exceeds 50 oC,
suspend cycling until the temperature drops to 49.5 oC.
(vi) REPEAT Steps (ii) through (v) until the voltage during Step (v) drops to 11.5 V; PROCEED to Step (vii).
(vii) REST for 10 seconds. (viii) CHARGE at 60 A with a top-of-charge voltage (TOCV) of 15 V until the
equivalent of a 60 A for 60 seconds (i.e., 1 Ah) has been returned. (ix) REST for 10 seconds. (x) DISCHARGE at 60 A for 58 seconds; if battery temperature exceeds 50 ºC,
suspend cycling until the temperature drops to 49.5 oC.
(xi) REPEAT Steps (vii) through (x) 115 times (note, changing the discharge time from 60 to 58 seconds results in the SOC of the cell increasing by 15% over the 115 cycles); RETURN to Step (ii). After repeating Steps (ii) through (x) for a total of two weeks, PROCEED to Step (xii).
(xii) CHARGE at 6.7 A with a TOCV of 14.7 V for a total of 12 hours. (xiii) DISCHARGE at 30 A to 10.5 V. (xiv) CHARGE at 6.7 A with a TOCV of 14.7 V for a total of 12 hours.
The results of the advanced PSOC cycling are summarized in Table 9. It was clear from the voltage plots that the 2.4% carbon black:2.4% graphite mix (Sample 22) was the best performer (fewer SOC adjustments and nearly no increase in TOCV). Furthermore, Battery 19 (the standard but with a higher purity – and possibly surface area – carbon black than commercially used) also performed well. The batteries made with activated carbon in the negative plates showed no significant performance enhancement; however, batteries from Runs 3, 5, 6, and 7 outperformed the batteries made with the other activated carbon conditions. The higher loading of activated carbon (3.7% by weight) showed no benefits versus the standard performance, and batteries produced with the lower loading of activated carbon (1.2% by weight) had the best cycling performance among the activated-carbon-containing batteries. Batteries with the best recharge performance included Conditions 2 (1.2% silver impregnated activated carbon), 22 (2.4% carbon black:2.4% graphite), 14 (3.7% activated carbon), and 16 (3.7% activated carbon). These results suggest that higher loadings of carbon in the negative plate may have a positive effect on battery rechargability.

38
Table 9. Float, Recharge, and PSOC Cycle Rankings
Run # % Lignin Float
Current (mA)
Float Rank
Recharge Rank
Advanced PSOC
Cycling 7 15
9 11
15 11
19 4 Std. Good
1
0.18
3 Best
22 44 Best Best
16 16 Best
13 13
12 11
11 10
17 10
18 10
5 9 OK OK
4 9 OK
14 8 OK Best
10 8 OK
20 8 Std.
3 8 OK OK
2 7 Good Best
8 6 Good
21 6 Good
6
0.37
3 Best OK
Battery Energy Gel Batteries
The objective of this study was to evaluate the effect on performance of adding various levels/types of carbons to the negative-active material in commercial gel-electrolyte batteries operated under PSOC conditions. Three types of PSOC cycles were used to evaluate these batteries: the Advanced PSOC cycle from the previous study (50% to 53% SOC window), a motive power/opportunity-charging cycle (35% to 65% SOC window), and a utility frequency-regulation duty (30% to 80% SOC window). The gel-electrolyte batteries were manufactured at Battery Energy South Pacific (BEPS) in Australia and cycle tested at Electric Transportation Applications (ETA) in Phoenix, Arizona.

39
Battery Build
A series of six different gel-electrolyte batteries containing various carbon additives were manufactured at BEPS. The 4EG100 gel battery is a 2-cell, 4-V module built with the variables described in Table 10 and Table 11. Carbon additives included commercially available graphite, carbon black, and mesoporous activated carbon.
Table 10. Carbon Matrix for Battery Energy Gel Batteries
Battery Code Carbon Additive Color
Code
Carbon Loading
% by weight
Paste Density (g/in3)
Avg. Plate
Weight (g)
% Weight Difference (grid = 547 g)
Voltage (V)
MWV-TS Carbon Black Orange 0.16 73 1495 100.00 1.906 MWV-A Activated Carbon Yellow 1 74 1503 100.90 1.924 MWV-B Activated Carbon Red 2 73 1514 102.03 1.927 MWV-C Activated Carbon Blue 3 70 1460 96.30 1.932 MWV-D Graphite Green 1 73 1505 101.07 1.938 Standard Carbon Black White 1 73 1495 100.2 1.915
Table 11. Battery Product Specifications
Positive grid thickness 5.2 mm Positive plate thickness 5.3 mm Positive plate height 185 mm Positive plate width 158 mm
Positive grid composition Calcium 0.04 weight% Sn 1.0 weight%
Number of positive plates per cell 2
Negative grid thickness 3.8 mm Negative plate thickness 4.0 mm Negative plate height 185 mm Negative plate width 158 mm
Negative grid composition Calcium 0.04 weight% Sn 1.0 weight%
Number of negative plates per cell 3 Separator type Sintered PVC (Amersil)
Separator thickness 2.9 mm
Positive active material VRLA oxide 80 weight% Red lead 20 weight%
Acid density before formation 1.220 g/cm3
Acid density after formation 1.270 g/cm3 (estimated)
Battery capacity (1-h rate nominal) 56 Ah (1.8 V/cell)
40
Voltage in the table refers to the end-of-discharge voltage (EODV) for 20-A discharge for 3 hours and 20 minutes at 23 °C (standard BEPS end-of-line capacity test, nominal EODV is 1.9 V). This end-of-line testing shows a capacity improvement for the carbon additives compared to the lower carbon black standard (MWV-TS). Note: A 50-mV difference is taken as an 8% capacity difference; however, conclusions beyond the standard are less significant due to operator error in this manual measurement. Additional capacity data from both JBI and ETA appears in the next section.
Density is typically expected to decrease 20 to 25% at a 3%-by-weight activated carbon loading—here the density only changed by approximately 5%. The difference may be related to the use of roller mill mixing, which is not used domestically. This difference should be investigated further to verify the role mixing equipment has in carbon’s effect on density.
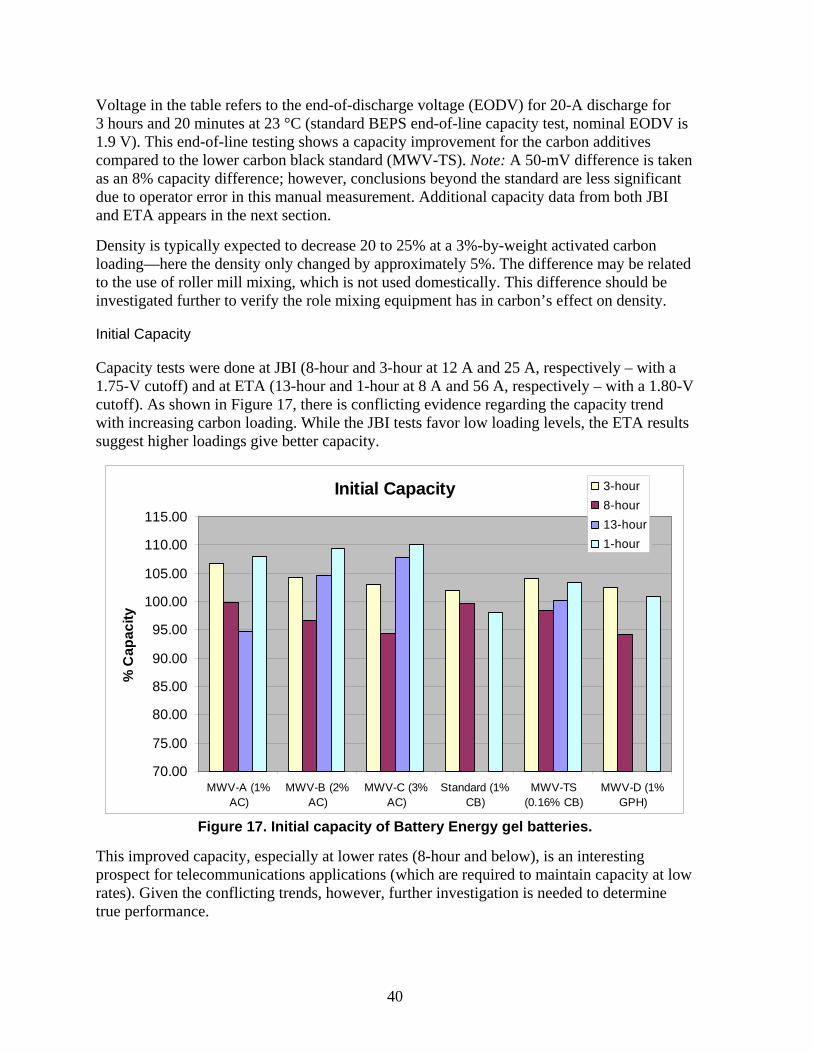
Initial Capacity
Capacity tests were done at JBI (8-hour and 3-hour at 12 A and 25 A, respectively – with a 1.75-V cutoff) and at ETA (13-hour and 1-hour at 8 A and 56 A, respectively – with a 1.80-V cutoff). As shown in Figure 17, there is conflicting evidence regarding the capacity trend with increasing carbon loading. While the JBI tests favor low loading levels, the ETA results suggest higher loadings give better capacity.
Initial Capacity
70.00
75.00
80.00
85.00
90.00
95.00
100.00
105.00
110.00
115.00
MWV-A (1%AC)
MWV-B (2%AC)
MWV-C (3%AC)
Standard (1%CB)
MWV-TS(0.16% CB)
MWV-D (1%GPH)
% C
apac
ity
3-hour8-hour13-hour1-hour
Figure 17. Initial capacity of Battery Energy gel batteries.
This improved capacity, especially at lower rates (8-hour and below), is an interesting prospect for telecommunications applications (which are required to maintain capacity at low rates). Given the conflicting trends, however, further investigation is needed to determine true performance.
41
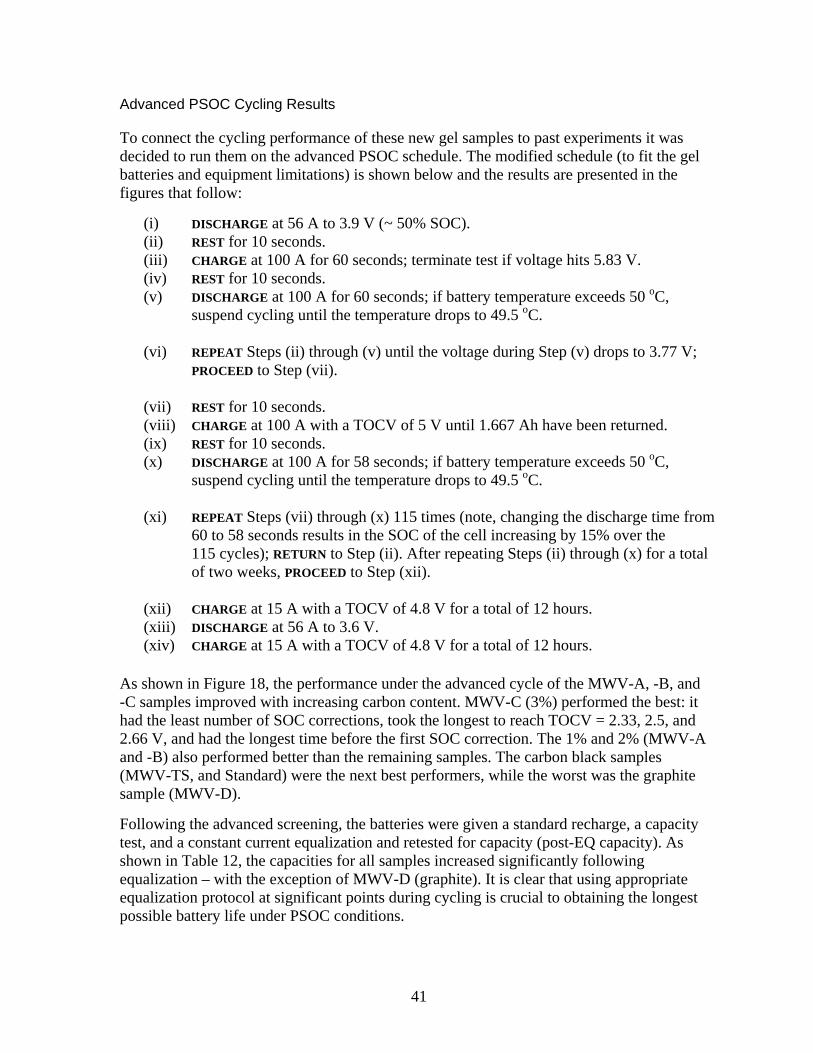
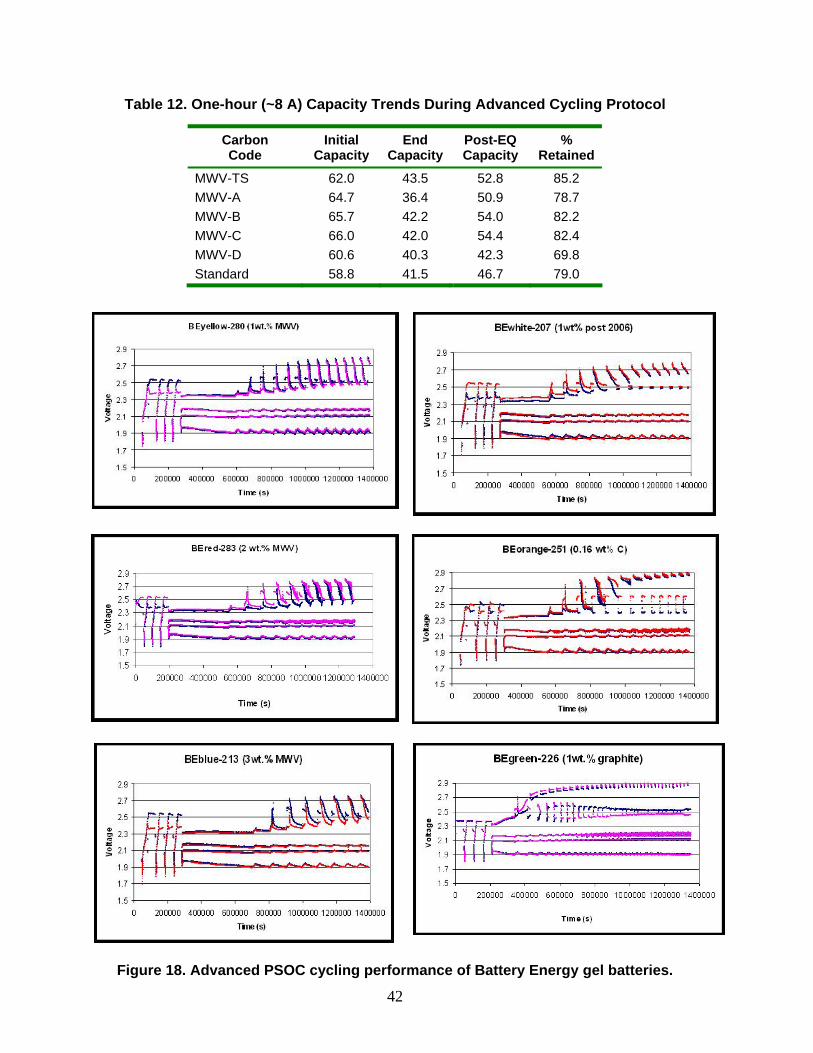
Advanced PSOC Cycling Results
To connect the cycling performance of these new gel samples to past experiments it was decided to run them on the advanced PSOC schedule. The modified schedule (to fit the gel batteries and equipment limitations) is shown below and the results are presented in the figures that follow:
(i) DISCHARGE at 56 A to 3.9 V (~ 50% SOC). (ii) REST for 10 seconds. (iii) CHARGE at 100 A for 60 seconds; terminate test if voltage hits 5.83 V. (iv) REST for 10 seconds. (v) DISCHARGE at 100 A for 60 seconds; if battery temperature exceeds 50 oC,
suspend cycling until the temperature drops to 49.5 oC.
(vi) REPEAT Steps (ii) through (v) until the voltage during Step (v) drops to 3.77 V; PROCEED to Step (vii).
(vii) REST for 10 seconds. (viii) CHARGE at 100 A with a TOCV of 5 V until 1.667 Ah have been returned. (ix) REST for 10 seconds. (x) DISCHARGE at 100 A for 58 seconds; if battery temperature exceeds 50 oC,
suspend cycling until the temperature drops to 49.5 oC.
(xi) REPEAT Steps (vii) through (x) 115 times (note, changing the discharge time from 60 to 58 seconds results in the SOC of the cell increasing by 15% over the 115 cycles); RETURN to Step (ii). After repeating Steps (ii) through (x) for a total of two weeks, PROCEED to Step (xii).
(xii) CHARGE at 15 A with a TOCV of 4.8 V for a total of 12 hours. (xiii) DISCHARGE at 56 A to 3.6 V. (xiv) CHARGE at 15 A with a TOCV of 4.8 V for a total of 12 hours.
As shown in Figure 18, the performance under the advanced cycle of the MWV-A, -B, and -C samples improved with increasing carbon content. MWV-C (3%) performed the best: it had the least number of SOC corrections, took the longest to reach TOCV = 2.33, 2.5, and 2.66 V, and had the longest time before the first SOC correction. The 1% and 2% (MWV-A and -B) also performed better than the remaining samples. The carbon black samples (MWV-TS, and Standard) were the next best performers, while the worst was the graphite sample (MWV-D).
Following the advanced screening, the batteries were given a standard recharge, a capacity test, and a constant current equalization and retested for capacity (post-EQ capacity). As shown in Table 12, the capacities for all samples increased significantly following equalization – with the exception of MWV-D (graphite). It is clear that using appropriate equalization protocol at significant points during cycling is crucial to obtaining the longest possible battery life under PSOC conditions.
42
Table 12. One-hour (~8 A) Capacity Trends During Advanced Cycling Protocol
Carbon Code
Initial Capacity
End Capacity
Post-EQ Capacity
% Retained
MWV-TS 62.0 43.5 52.8 85.2 MWV-A 64.7 36.4 50.9 78.7 MWV-B 65.7 42.2 54.0 82.2 MWV-C 66.0 42.0 54.4 82.4 MWV-D 60.6 40.3 42.3 69.8 Standard 58.8 41.5 46.7 79.0
Figure 18. Advanced PSOC cycling performance of Battery Energy gel batteries.
43
Aker Wade Motive Power Cycling Results
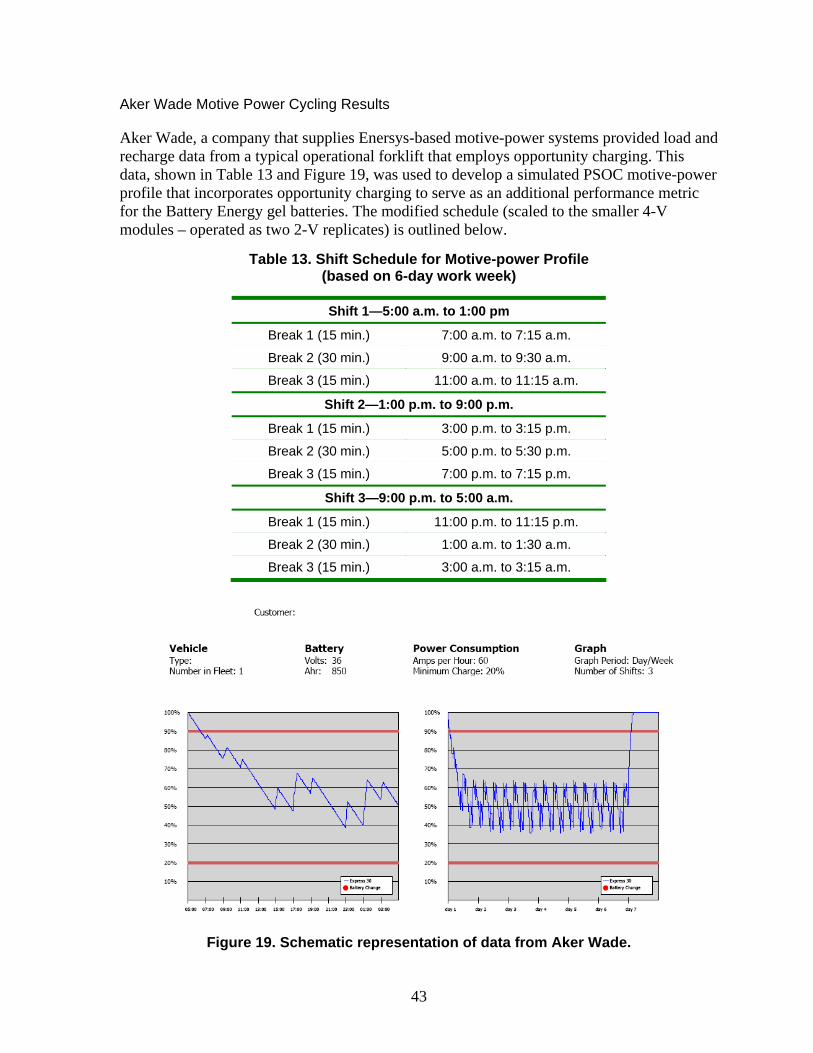
Aker Wade, a company that supplies Enersys-based motive-power systems provided load and recharge data from a typical operational forklift that employs opportunity charging. This data, shown in Table 13 and Figure 19, was used to develop a simulated PSOC motive-power profile that incorporates opportunity charging to serve as an additional performance metric for the Battery Energy gel batteries. The modified schedule (scaled to the smaller 4-V modules – operated as two 2-V replicates) is outlined below.
Table 13. Shift Schedule for Motive-power Profile (based on 6-day work week)
Shift 1—5:00 a.m. to 1:00 pm
Break 1 (15 min.) 7:00 a.m. to 7:15 a.m.
Break 2 (30 min.) 9:00 a.m. to 9:30 a.m.
Break 3 (15 min.) 11:00 a.m. to 11:15 a.m.
Shift 2—1:00 p.m. to 9:00 p.m.
Break 1 (15 min.) 3:00 p.m. to 3:15 p.m.
Break 2 (30 min.) 5:00 p.m. to 5:30 p.m.
Break 3 (15 min.) 7:00 p.m. to 7:15 p.m.
Shift 3—9:00 p.m. to 5:00 a.m.
Break 1 (15 min.) 11:00 p.m. to 11:15 p.m.
Break 2 (30 min.) 1:00 a.m. to 1:30 a.m.
Break 3 (15 min.) 3:00 a.m. to 3:15 a.m.
Figure 19. Schematic representation of data from Aker Wade.
44
Simulated Operating Schedule:
(i) FIRST DISCHARGE—DISCHARGE 60 A for 2 hours (-120 Ah) with EODV of 1.75 V/cell.
(ii) FIRST BREAK—CHARGE 425 A for 15 minutes (+106.25 Ah) with TOCV of 2.43 V/cell.
(iii) SECOND DISCHARGE—DISCHARGE 60 A for 1.75 hours (-105 Ah) with EODV of 1.75 V/cell.
(iv) SECOND BREAK—CHARGE 425 A for 30 minutes (+212.5 Ah) with TOCV of 2.43 V/cell.
(v) THIRD DISCHARGE—DISCHARGE 60 A for 1.5 hours (-90 Ah) with EODV of 1.75 V/cell.
(vi) THIRD BREAK—CHARGE 425 A for 15 minutes (+106.25 Ah) with TOCV of 2.43 V/cell.
(vii) FOURTH DISCHARGE—DISCHARGE 60 A for 1.65 hours (-105 Ah) with EODV of 1.75 V/cell.
(viii) REST—REST for 6 minutes.
(ix) REPEAT Steps (i) through (viii) 18 times (3 repeats represents one shift × 6 days) to represent 6 days of PSOC duty.
(x) COOL DOWN AND WEEKLY SOC MEASUREMENT USING OCV—REST for 5 hours. (xi) WEEKLY EQUALIZATION—RECHARGE at 425 A for 10 hours with a TOCV of
2.43 V/cell. (xii) REST AFTER WEEKLY EQUALIZATION—REST until total time is 168 hours
(7 days). (xiii) RESTART WEEKLY SCHEDULE—REPEAT Steps (i) through (xi) and reset timer to
zero.
Notes:
• Three repeats of Steps (i) through (viii) represents one shift (i.e., 8 hours). • Cycling is terminated when an EODV of 1.75 V/cell is reached during Steps (i), (iii),
(v), or (vii). • The following parameters should be monitored/measured during testing:
o Voltage at the end of each step (including rests); o Ah returned or removed during each step; and o Time at TOCV for each charge step.
The capacity of the BEPS gel-electrolyte batteries (56 Ah, 1-hour rate) used in this study is considerably smaller than the Aker Wade module (425 Ah, 1-hour rate; 850 Ah, 6-hour rate). As Aker Wade based its charge rate on the 1-hour current (425 A), the equivalent current was selected for the BEPS batteries (i.e., 56 A). A scaling factor of 0.13 (56/425 = 0.13) was then used to calculate the discharge current of 7.9 A for the BEPS batteries. Also, the weekly equalization process for the BEPS batteries involves a constant voltage charge, followed by a constant current step, as well as two rest steps.
45
The full profile for the BEPS batteries is as follows:
(i) FIRST DISCHARGE—DISCHARGE 7.9 A for 2 hours (-15.8 Ah) with EODV of 1.75 V/cell.
(ii) FIRST BREAK—CHARGE 56 A for 15 minutes (+14 Ah nominal) with TOCV of 2.43 V/cell.
(iii) SECOND DISCHARGE—DISCHARGE 7.9 A for 1.75 hours (-13.83 Ah) with EODV of 1.75 V/cell.
(iv) SECOND BREAK—CHARGE 56 A for 30 minutes with TOCV of 2.43 V/cell (+28 Ah nominal).
(v) THIRD DISCHARGE—DISCHARGE 7.9 A for 1.5 hours (-11.85 Ah) with EODV of 1.75 V/cell.
(vi) THIRD BREAK—CHARGE 56 A for 15 minutes (+14 Ah nominal) with TOCV of 2.43 V/cell.
(vii) FOURTH DISCHARGE—DISCHARGE 7.9 A 1.65 hours (-13.03 Ah) with EODV of 1.75 V/cell.
(viii) REST—REST for 6 minutes.
(ix) REPEAT Steps (i) through (viii) 18 times (3 repeats represents one shift × 6 days) to represent 6 days of PSOC duty.
(x) COOL DOWN AND WEEKLY STATE-OF-CHARGE MEASUREMENT USING OPEN-CIRCUIT VOLTAGE—REST for 3 hours and 6 minutes.
(xi) WEEKLY EQUALIZATION—RECHARGE at 15 A for 10 hours with a TOCV of 2.40 V/cell; then RECHARGE at 1.5 A for 4 hours with no TOCV limit.
(xii) REST AFTER WEEKLY EQUALIZATION—REST for 5 hours until total time is 168 hours (i.e., 7 days).
(xiii) RESTART WEEKLY SCHEDULE—REPEAT Steps (i) through (xii).
Notes:
• Each repeat of Steps (i) through (viii) represents one PSOC cycle (8 hours duration) and results in 54.4 Ah of discharge.
• Each repeat of Steps (i) through (xii) represents one master cycle (1 week duration) and results in 979 Ah of discharge.
Optimization of SOC window
The SOC window in which the batteries will operate depends on a number of parameters, but the most important for these tests is the TOCV. TOCV determines how much energy can be returned for a given charge current, given discharge current, and given time. If the TOCV is lowered, less energy is returned during charge, and because the energy removed during each PSOC cycle is always the same, a lower TOCV will lower the SOC window. The charging efficiency of a particular battery can also have an effect on the SOC window. Given that the charging efficiency of the larger (850-Ah) batteries should be lower than that of the BEPS gel batteries, it was expected that the TOCV in these experiments would require optimization so that the BEPS battery would operate in a similar SOC window to that of the 850-Ah units at Aker Wade.

46
Different TOCV limits (2.37, 2.40, and 2.43 V/cell) were evaluated on the orange and blue batteries. A TOCV of 2.43 V/cell was found to operate the battery closest to the target SOC window (i.e., 35% to 65%). This is the same limit as that used by Aker Wade, which is surprising given that the larger batteries (850 Ah) will have lower charge efficiency than the gel batteries operated in these experiments. This outcome suggests that Aker Wade may actually be operating their battery systems at a lower SOC window than they predict based on the data provided in Figure 19.
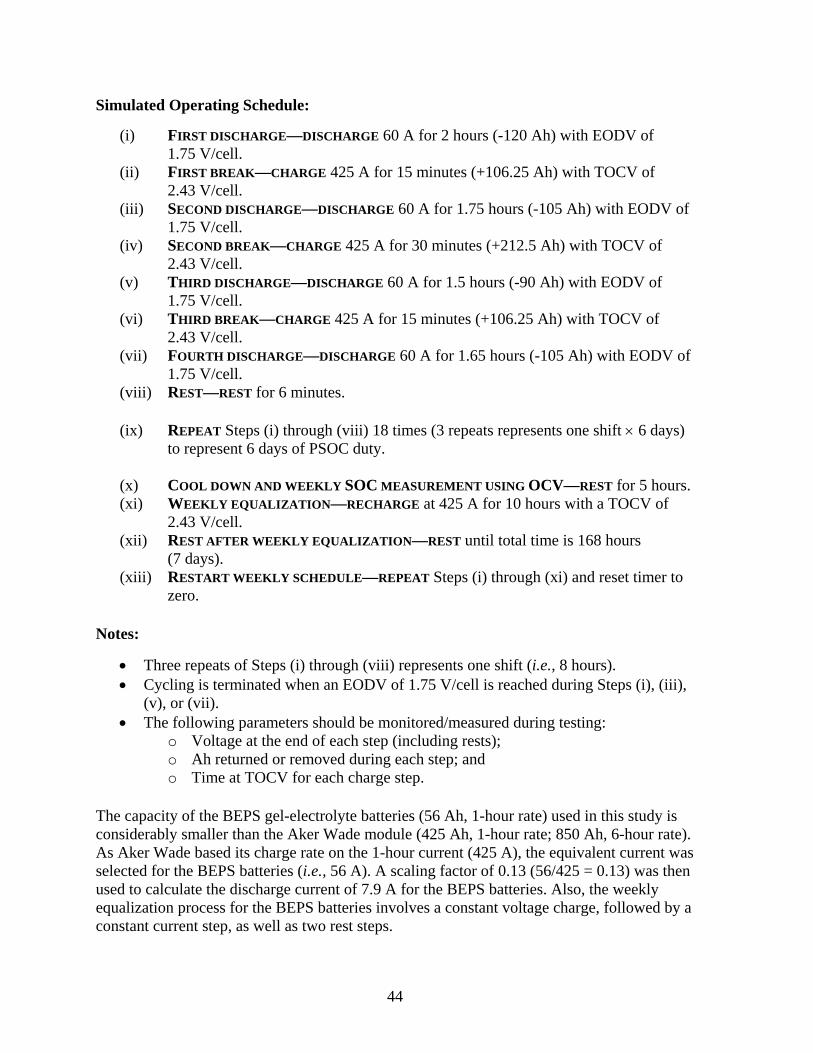
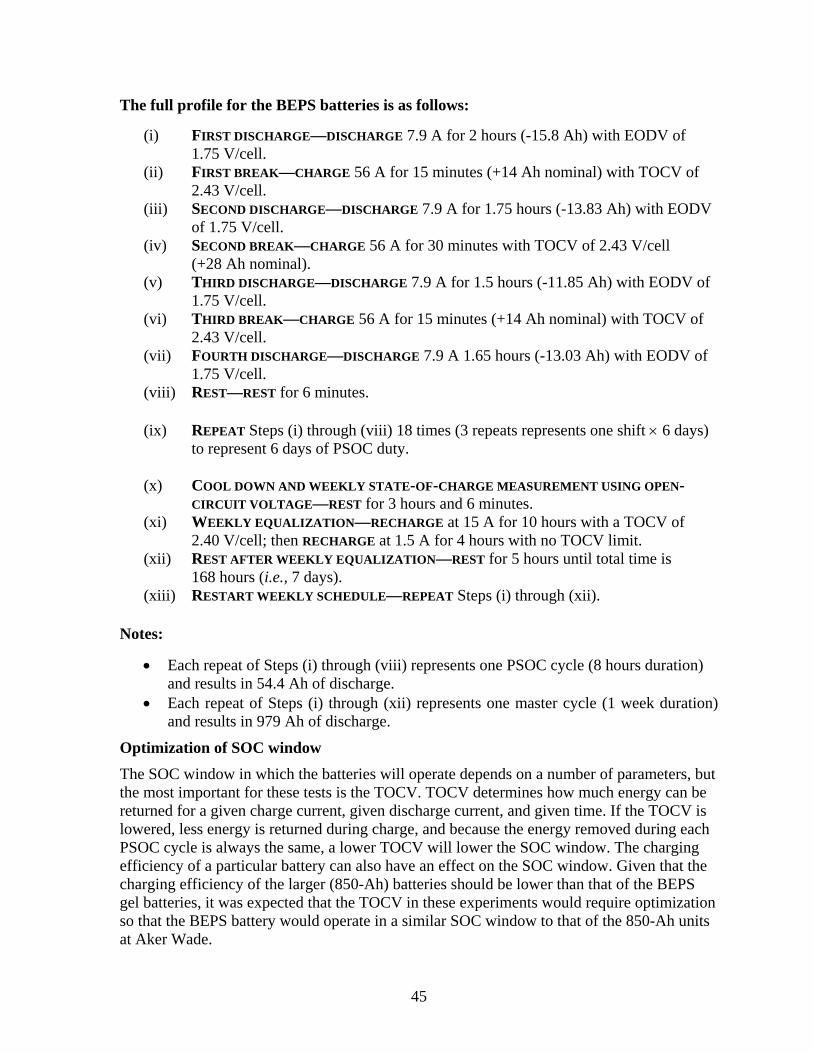
Results of Aker Wade cycling
The six gel-electrolyte batteries (4-V modules) were operated under the simulated Aker Wade schedule. Voltage values were recorded at the end of both discharge and charge steps, rest steps, and more frequently during the equalization process, and are shown in Figure 20 through Figure 25.
The overall voltage trends and behavior of the various units were very similar. It should be noted that during initial operation, minor modifications were made to the TOCV for the orange and blue modules to optimize the SOC window–the most suitable TOCV was found to be 2.43 V/cell.
The EODVs decrease gradually during each weekly set of 18 PSOC cycles, starting at approximately 4.10 V, and dropping to between 3.90 and 3.80 V, depending upon battery type. This gradual decrease is a result of the profile removing more Ah from the batteries during discharge than are returned during charge combined with the charging inefficiencies of the batteries. Based on the voltage-time curves recorded during the three initial capacity tests, the above EODVs correspond to the bottom of the SOC window–starting at approximately 44% SOC (4.1 V) and gradually decreasing to approximately 30% SOC (3.80 V) during the weekly 18 PSOC cycles. Given that the PSOC window is 27%, in reality the batteries are cycling between 71 and 44% SOC at the start of each weekly cycle, and between 57 and 30% SOC at the end of each weekly cycle—this operating range is close to the SOC window estimated by Aker Wade (i.e., 62 -36%) and shown in Figure 19.
All batteries completed the scheduled 13 weeks of service, with each delivering 12,753 Ah during this period. Based on a 1-hour capacity of 56 Ah, this is the equivalent of 228 cycles to 100% DOD. The initial and final capacities of the batteries (discharged at 7.9 A to 1.8 V/cell) for all the units are given in Table 14. The capacity of the battery types decreased slightly, except for the orange variant, which had a final capacity slightly higher than the initial.
As mentioned above, the EODV of all battery types decreases gradually during each weekly 18 PSOC cycle set. This decrease was greatest for the blue battery (3%-by-weight activated carbon) and lowest for the orange battery (0.17 %-by-weight carbon). Further, the voltage attained during the final charging period of each 18 PSOC weekly cycles (i.e., just before the weekly equalization charge) remained constant for the orange battery, but decreased gradually for the others. The decrease in SOC associated with this decrease can be attributed to two factors. First, the charge efficiency of the orange battery is known to be higher than that of the others (as determined in previous cycling experiments)—this is supported by the fact that the drift downwards in SOC during each 18 PSOC cycle increased with the carbon concentration (i.e., the higher the carbon, the lower the PSOC cycle and the lower the charging efficiency). Second, analysis of the data showed that the current at the end of a
47
specific charge period when a TOCV limit had been activated, was higher for the orange battery than the other types and, as a result, this unit recorded a higher charge return. In summary, however, all battery types easily supported the required duty and performed well under the combined fast-charge/PSOC motive power duty.
Yellow MWV 1%
3.5
4
4.5
5
5.5
0 2000000 4000000 6000000 8000000 10000000
Time (s)
Volta
ge
Figure 20. Voltage of yellow battery operated under Aker Wade schedule.
Red MWV 2%
3.5
4
4.5
5
5.5
0 2000000 4000000 6000000 8000000 10000000
Time (s)
Volta
ge
Figure 21. Voltage of red battery operated under Aker Wade schedule.
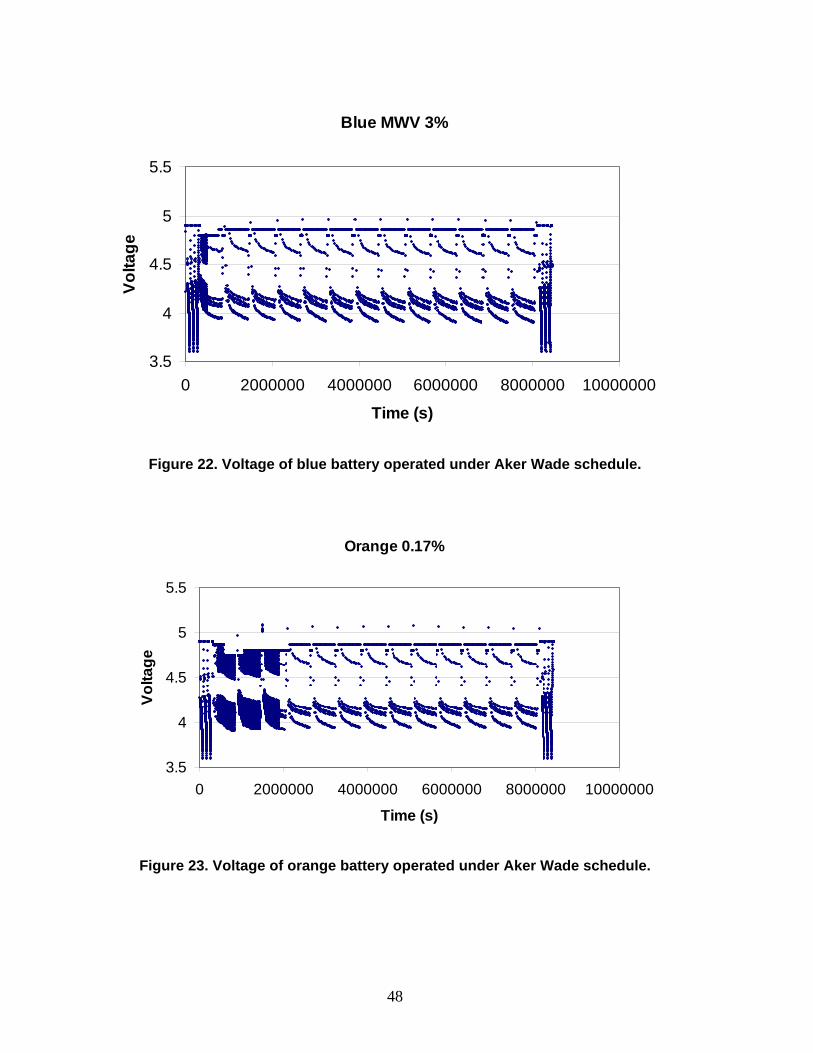
48
Blue MWV 3%
3.5
4
4.5
5
5.5
0 2000000 4000000 6000000 8000000 10000000
Time (s)
Volta
ge
Figure 22. Voltage of blue battery operated under Aker Wade schedule.
Orange 0.17%
3.5
4
4.5
5
5.5
0 2000000 4000000 6000000 8000000 10000000
Time (s)
Volta
ge
Figure 23. Voltage of orange battery operated under Aker Wade schedule.

49
White BEPS 1%
3.5
4
4.5
5
5.5
0 2000000 4000000 6000000 8000000 10000000
Time (s)
Volta
ge
Figure 24. Voltage of white battery operated under Aker Wade schedule.
Green Hammond 1%
3.5
4
4.5
5
5.5
0 2000000 4000000 6000000 8000000 10000000
Time (s)
Volta
ge
Figure 25. Voltage of green battery operated under Aker Wade schedule.

50
Table 14. Module Capacity (7.9 A discharge to 1.8 V/cell) Before/After Aker Wade Cycling
Battery Description
Battery Designation
Carbon Type
Carbon loading
(weight %)
Initial capacity
(Ah)
Final capacity
(Ah) %
Retained
MWV-A Yellow MWV-A 1 92.4 94.9
91.8 92.9
99% 98%
MWV-B Red MWV-A 2 105.4 103.9
97.6 98.3
93% 95%
MWV-C Blue MWV-A 3 109.3 106.9 106.8
102.3 101.8 101.7
94% 95% 95%
MWV-D Green Graphite 1 109.5 108.3 108.3
105.3 106.5 107.1
96% 98% 99%
BEPS Standard
(up to 2006) Orange Carbon
black A 0.17 99.7 100.2 101.0
103.5 104.0 104.7
104% 104% 104%
BEPS Standard
(after 2006) White Carbon
black B 1 104.1 102.8 102.9
100.1 101.8 102.7
96% 99%
100%
Another important factor to consider is the level of overcharge required to maintain the batteries in good condition while operating under longer term PSOC duty. The level of overcharge delivered during each week of operation (i.e., between each full, conditioning charge) has been calculated by simply summing the total Ahs delivered and accepted by the batteries during each master cycle/week of duty. The value for all battery types was 101.0 to 01.5%. This would normally be considered acceptable for PSOC duty, but the gradual drift downwards in the EODV of all batteries except the orange unit, suggest that higher values may be appropriate. Also, as the batteries age, overcharge may need to be increased due to water loss and a related decrease in charging efficiency.
The temperature of the batteries during cycling is also of interest as excessive heating during the fast-charging components of the profile can shorten battery life. The temperature of all the batteries during cycling was similar, and is shown for the blue battery in Figure 26. It can be seen that temperature does not rise significantly above ambient (23 ºC) until the fast-charging steps, during which time it rises to approximately 28 ºC. This rise in temperature is considered minimal. Nevertheless, it should be noted that actual battery packs used in motive power applications comprise up to 24 larger cells, compressed together in a container. Consequently, the insulating effect of the pack and the higher internal resistance of the larger cell will result in cell temperatures in the field that are considerably higher than those observed in this study.
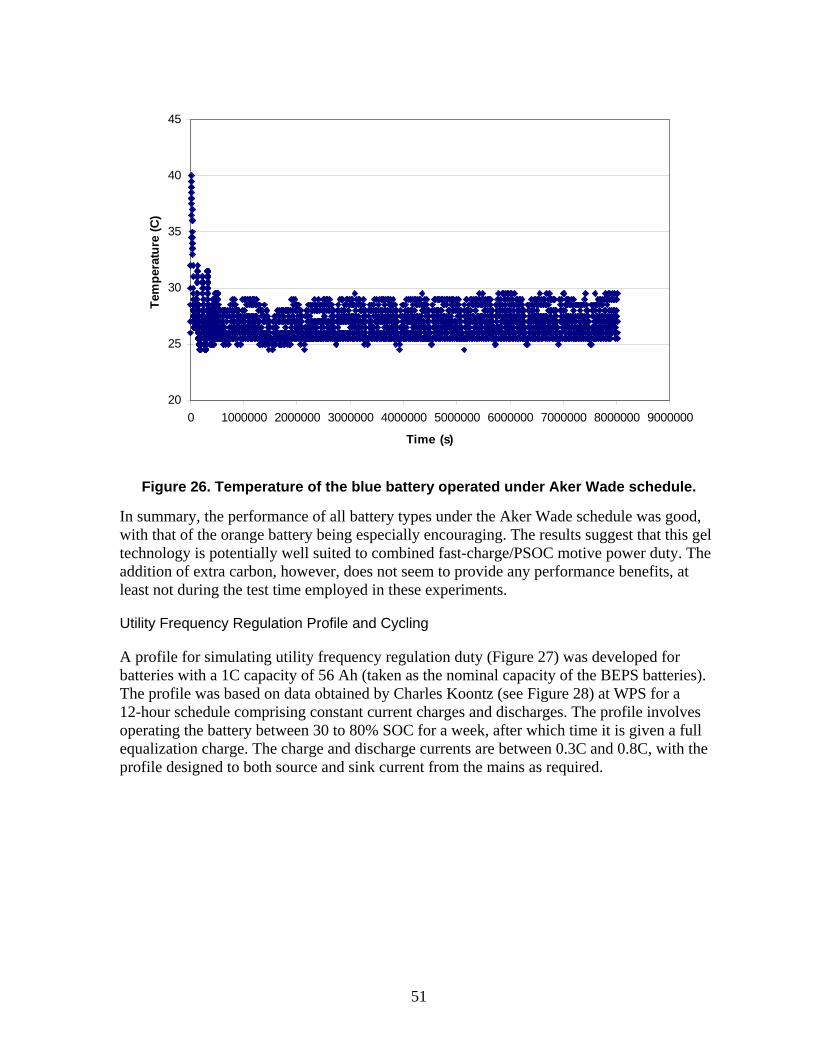
51
20
25
30
35
40
45
0 1000000 2000000 3000000 4000000 5000000 6000000 7000000 8000000 9000000
Time (s)
Tem
pera
ture
(C)
Figure 26. Temperature of the blue battery operated under Aker Wade schedule.
In summary, the performance of all battery types under the Aker Wade schedule was good, with that of the orange battery being especially encouraging. The results suggest that this gel technology is potentially well suited to combined fast-charge/PSOC motive power duty. The addition of extra carbon, however, does not seem to provide any performance benefits, at least not during the test time employed in these experiments.
Utility Frequency Regulation Profile and Cycling
A profile for simulating utility frequency regulation duty (Figure 27) was developed for batteries with a 1C capacity of 56 Ah (taken as the nominal capacity of the BEPS batteries). The profile was based on data obtained by Charles Koontz (see Figure 28) at WPS for a 12-hour schedule comprising constant current charges and discharges. The profile involves operating the battery between 30 to 80% SOC for a week, after which time it is given a full equalization charge. The charge and discharge currents are between 0.3C and 0.8C, with the profile designed to both source and sink current from the mains as required.
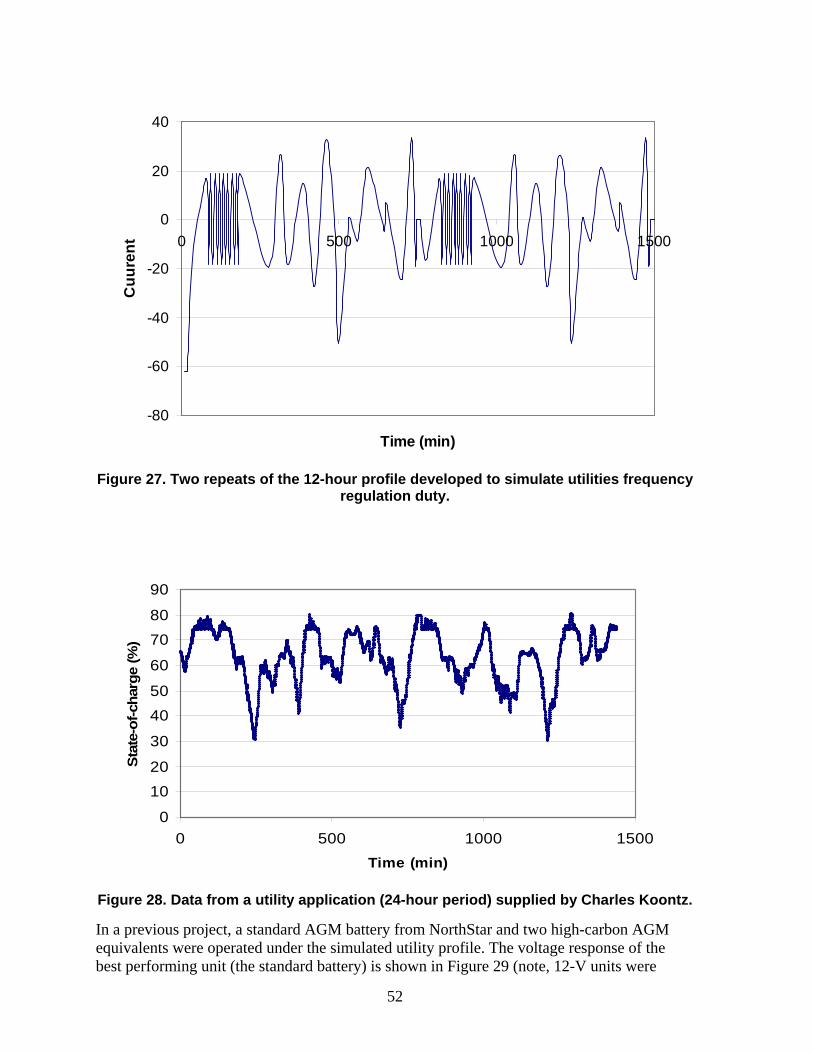
52
-80
-60
-40
-20
0
20
40
0 500 1000 1500
Time (min)
Cuu
rent
Figure 27. Two repeats of the 12-hour profile developed to simulate utilities frequency
regulation duty.
0
1020
30
4050
60
7080
90
0 500 1000 1500Time (min)
Stat
e-of
-cha
rge
(%)
Figure 28. Data from a utility application (24-hour period) supplied by Charles Koontz.
In a previous project, a standard AGM battery from NorthStar and two high-carbon AGM equivalents were operated under the simulated utility profile. The voltage response of the best performing unit (the standard battery) is shown in Figure 29 (note, 12-V units were

53
cycled, but the voltage given is based on two cells to allow an easy comparison with the 4-V gel modules). The battery was unable to supply the required load after just 10 weeks of service at which time the battery capacity dropped to less than 40% of its initial value. Consequently, this AGM technology, in its current state of development, is not considered suitable for this type of duty.
Selected gel-electrolyte batteries tested under the Aker Wade cycle were then tested under the simulated utility schedule. The orange and the blue batteries that had already completed 3 months of service under the Aker Wade schedule (see above) were operated under the simulated utility schedule for an additional 13 weeks, and the results, in terms of the voltage response, are shown in Figure 30 and Figure 31.
The batteries delivered a total of 20,073 Ah during the 13 weeks of service. In terms of the lifetime Ah delivered, this equates to 358 cycles to 100% DOD, based on a 1-hour capacity of 56 Ah. If the lifetime Ah delivered during the initial Aker Wade duty are added to this (228, 100% DOD cycle equivalent Ah), the batteries have completed the equivalent of 586 cycles to 100% DOD.
The capacity of the orange battery at the end of the second 3-month test period (six months total) was the same as the initial value, which is an excellent result (see Table 15). The blue module, however, did not perform quite as well and its final capacity was some 10% less than the initial value. While it is difficult to predict a lifetime when there has been no capacity loss (and, therefore no capacity trend available), the fact that the final capacity of the orange battery was the same as the initial, and that the voltage characteristics of this unit were stable during the entire six months, leaves us confident that a minimum of two to three years of continuous service should be available.
Table 15. Module Capacity (7.9 A discharge to 1.8 V/cell) After Both Aker Wade and Utility Cycling
Battery Description
Battery Designation
Carbon Type
Carbon Loading
(weight %)
Initial Capacity
(Ah)
Capacity after Aker Wade
Cycling (Ah)
Capacity after
Utility Cycling
(Ah)
% Retained after all cycling
MWV-C Blue MWV-A 3 109.3 106.9 106.8
102.3 101.8 101.7
94.8 93.9
87% 88%
BEPS standard
(up to 2006) Orange Carbon
black A 0.17 99.7 100.2
103.5 104.0
101.0 103.0
101% 103%
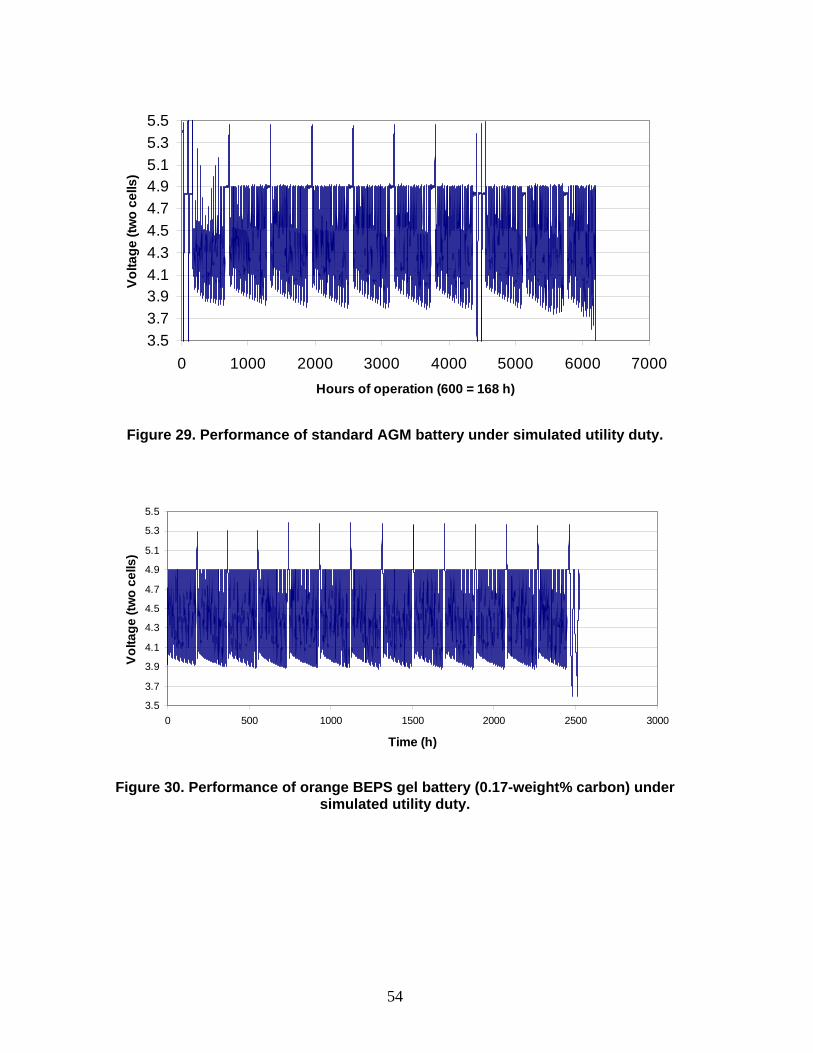
54
3.53.73.94.14.34.54.74.95.15.35.5
0 1000 2000 3000 4000 5000 6000 7000Hours of operation (600 = 168 h)
Volta
ge (t
wo
cells
)
Figure 29. Performance of standard AGM battery under simulated utility duty.
3.5
3.7
3.9
4.1
4.3
4.5
4.7
4.9
5.1
5.3
5.5
0 500 1000 1500 2000 2500 3000
Time (h)
Volta
ge (t
wo
cells
)
Figure 30. Performance of orange BEPS gel battery (0.17-weight% carbon) under simulated utility duty.
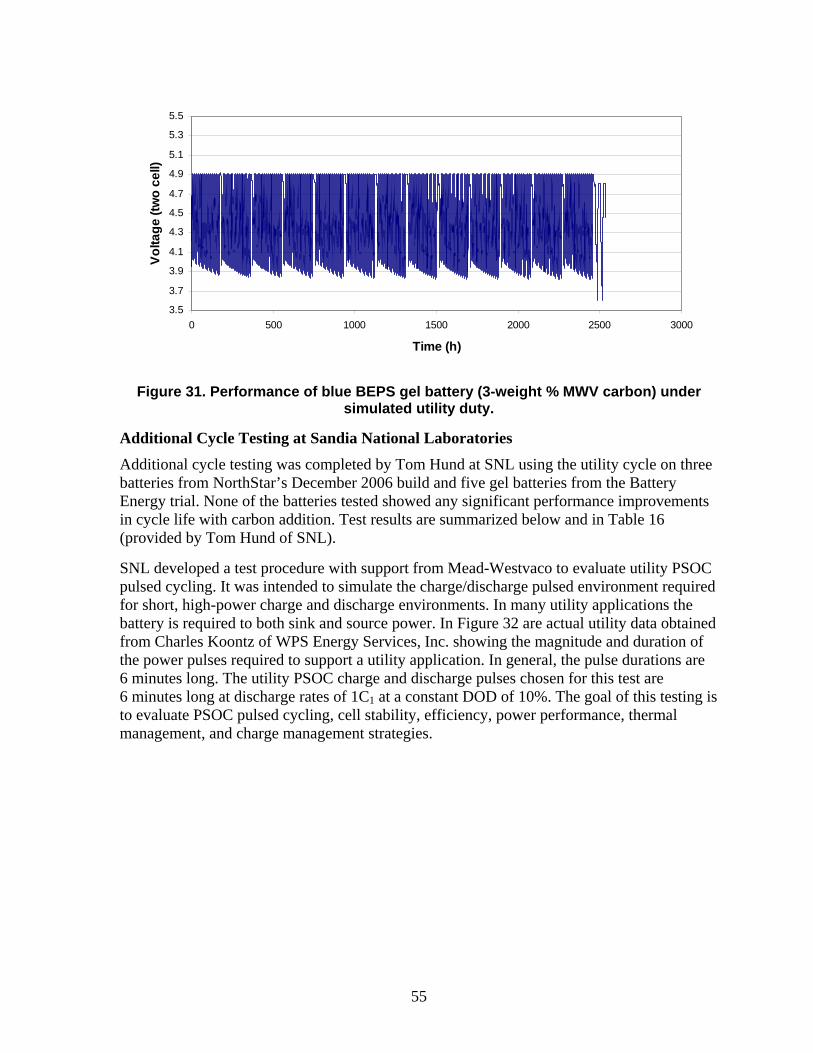
55
3.5
3.7
3.9
4.1
4.3
4.5
4.7
4.9
5.1
5.3
5.5
0 500 1000 1500 2000 2500 3000
Time (h)
Volta
ge (t
wo
cell)
Figure 31. Performance of blue BEPS gel battery (3-weight % MWV carbon) under simulated utility duty.
Additional Cycle Testing at Sandia National Laboratories
Additional cycle testing was completed by Tom Hund at SNL using the utility cycle on three batteries from NorthStar’s December 2006 build and five gel batteries from the Battery Energy trial. None of the batteries tested showed any significant performance improvements in cycle life with carbon addition. Test results are summarized below and in Table 16 (provided by Tom Hund of SNL).
SNL developed a test procedure with support from Mead-Westvaco to evaluate utility PSOC pulsed cycling. It was intended to simulate the charge/discharge pulsed environment required for short, high-power charge and discharge environments. In many utility applications the battery is required to both sink and source power. In Figure 32 are actual utility data obtained from Charles Koontz of WPS Energy Services, Inc. showing the magnitude and duration of the power pulses required to support a utility application. In general, the pulse durations are 6 minutes long. The utility PSOC charge and discharge pulses chosen for this test are 6 minutes long at discharge rates of 1C1 at a constant DOD of 10%. The goal of this testing is to evaluate PSOC pulsed cycling, cell stability, efficiency, power performance, thermal management, and charge management strategies.

56
-1.0
-0.8
-0.6
-0.4
-0.2
0.0
0.2
0.4
0.6
0.8
1.0
0 250 500 750 1000 1250 1500 1750 2000 2250 2500 2750 3000 3250
Time (Min)
% O
utpu
t
250 min.
Figure 32. Typical Utility Energy Pulses (Charles Koontz, WPS).
Previous experience has demonstrated that normal VRLA battery technology will tolerate about 100 PSOC cycles before requiring a recovery charge and discharge. In addition to sulfation caused by the PSOC cycle, most VRLA batteries will suffer constant capacity fade after each recovery cycle. To date, the high-performance VRLA batteries and some devices using the carbon additions to the negative electrode will cycle in excess of 1,000 PSOC cycles without excessive sulfation or capacity loss. A goal of this project is to design a large-format VRLA battery that can PSOC cycle without capacity fade.
Table 16 summarizes SNL’s test results. The results indicate that in some cases the gassing current was very high and the utility PSOC cycle test did not show significant improvement in the ability of the battery to PSOC cycle. The batteries demonstrated significant voltage increases during PSOC cycling, indicating negative plate sulfation similar to the standard products produced by the two battery manufacturers (see Figure 33 through Figure 38).

57
Table 16. Summary of Test Results
Manufacturer ID Gassing Current at 2.45 V Comments: Utility PSOC Cycling
NSB Run 3 0.2 A at 25C Only able to PSOC cycle to 80 cycles before high voltage. Capacity fading quickly.
NSB Run 7 0.1 A at 25C Only able to PSOC cycle to 88 cycles before high voltage. Capacity fading.
NSB Run 22 11 A at 45C Not tested because of high temperatures on charge.
Battery Energy Green 10.6 A at 30C Only able to PSOC cycle to 62 cycles before high voltage. Capacity increasing.
Battery Energy Yellow 1.0 A at 23C Only able to PSOC cycle to 95 cycles before high voltage. Capaicty increasing.
Battery Energy Blue 4.2 A at 25C Only able to PSOC cycle to 95 cycles before high voltage. Capacity increasing.
Battery Energy Orange 1.8 A at 25C Only able to PSOC cycle to 100 cycles before high voltage. Capacity increasing.
Battery Energy White NA NA
MWV/NorthStar #276 (Run #3) Utility Cycle PSOC Cycle Life100 Cycles 1C 6M, 30A Chr/Dch
10.00
10.50
11.00
11.50
12.00
12.50
13.00
13.50
14.00
14.50
15.00
0:00:00 24:00:00 48:00:00 72:00:00 96:00:00 120:00:00 144:00:00 168:00:00 192:00:00
Time (hh:mm:ss)
Volts
-40.00
-35.00
-30.00
-25.00
-20.00
-15.00
-10.00
-5.00
0.00
5.00
10.00
Am
p-H
ours
Voltage (V)Amp Hours (AH)
28.7 Ah 28.7 Ah 27.9 Ah 27.6 Ah 26.2 Ah
87 Cy 73 Cy 80 Cy
Figure 33. NorthStar Run 3 Battery from December 2006 build.

58
MWV/NorthStar #242 (Run #7) Utility Cycle PSOC Cycle Life100 Cycles 1C 6M, 30A Chr/Dch
10.00
10.50
11.00
11.50
12.00
12.50
13.00
13.50
14.00
14.50
15.00
0:00:00 24:00:00 48:00:00 72:00:00 96:00:00 120:00:00 144:00:00 168:00:00 192:00:00
Time (hh:mm:ss)
Volts
-40.00
-35.00
-30.00
-25.00
-20.00
-15.00
-10.00
-5.00
0.00
5.00
10.00
Am
p-H
ours
Voltage (V)Amp Hours (AH)
100 Cy 88 Cy 88 Cy
26.7 Ah 26.3 Ah 26.8 Ah 25.5 Ah 25.9 Ah
Figure 34. NorthStar Run 7 from December 2006 build.
Battery Energy #228 (Green) Utility Cycle PSOC Life100 Cycles 1C 6M, 70A Chr/Dch
1.40
1.50
1.60
1.70
1.80
1.90
2.00
2.10
2.20
2.30
2.40
2.50
2.60
0:00:00 24:00:00 48:00:00 72:00:00 96:00:00 120:00:00 144:00:00 168:00:00 192:00:00
Time (hh:mm:ss)
Volts
-80.00
-60.00
-40.00
-20.00
0.00
20.00
40.00A
mp-
Hou
rs
Voltage (V)Amp Hours (AH)
65 Ah 67 Ah 67 Ah 67 Ah 67 Ah 67 Ah
92 Cy 8 Cy 67 Cy 33 Cy 62 Cy
Max Temp = 29C
Figure 35. Battery Energy green battery (1% graphite).

59
Battery Energy #272 (Yellow) Utility Cycle PSOC Life100 Cycles 1C 6M, 70A Chr/Dch
1.40
1.50
1.60
1.70
1.80
1.90
2.00
2.10
2.20
2.30
2.40
2.50
2.60
0:00:00 24:00:00 48:00:00 72:00:00 96:00:00 120:00:00 144:00:00 168:00:00 192:00:00 216:00:00
Time (hh:mm:ss)
Volts
-80.00
-60.00
-40.00
-20.00
0.00
20.00
40.00
Am
p-H
ours
Voltage (V)Amp Hours (AH)
61 Ah 66 Ah 67 Ah 66 Ah 67 Ah 66 Ah
100 Cy 94 Cy 6 Cy 95 Cy 5 Cy
Figure 36. Battery Energy yellow battery (1% activated carbon).
Battery Energy #221 (Blue) Utility Cycle PSOC Life100 Cycles 1C 6M, 70A Chr/Dch
1.40
1.50
1.60
1.70
1.80
1.90
2.00
2.10
2.20
2.30
2.40
2.50
2.60
0:00:00 24:00:00 48:00:00 72:00:00 96:00:00 120:00:00 144:00:00 168:00:00
Time (hh:mm:ss)
Volts
-80.00
-60.00
-40.00
-20.00
0.00
20.00
40.00
Am
p-H
ours
Voltage (V)Amp Hours (AH)
100 Cy 100 Cy 95 Cy
61.5 Ah 65.8 Ah 66.2 Ah
Figure 37. Battery Energy blue battery (3% activated carbon).

60
Battery Energy #236 (Orange) Utility Cycle PSOC Life100 Cycles 1C 6M, 70A Chr/Dch
1.40
1.50
1.60
1.70
1.80
1.90
2.00
2.10
2.20
2.30
2.40
2.50
2.60
0:00:00 24:00:00 48:00:00 72:00:00 96:00:00 120:00:00 144:00:00 168:00:00
Time (hh:mm:ss)
Volts
-80.00
-60.00
-40.00
-20.00
0.00
20.00
40.00
Am
p-H
ours
Voltage (V)Amp Hours (AH)
100 Cy 100 Cy 59 Cy
57.6 Ah 63.5 Ah
64.3 Ah 64.1 Ah
Figure 38. Battery Energy orange battery (0.17% carbon black, standard).

61

62
PHASE III—UTILITY APPLICATION AND DESIGN
Don Karner at ETA prepared a design and cost forecast for a 1-MW/1-MWh UFR that uses battery energy storage. He completed the design assuming the use of gel batteries as the energy storage technology based on the results from the cycling studies above. Based on the utility cycling results, the Battery Energy STD 1 gel battery should provide a minimum of two to three years of continuous service at the assumed regulator power to energy ratio. The capital cost estimates for the UFR are $3,728,000 total recurring cost and $439,200 non-recurring costs. The suggested next steps from this design work and cost estimate is estimate the revenue that could be made with the UFR, optimize the power-to-energy ratio, and adjust the design accordingly so that the economic analysis can be completed. The complete final report written by Don Karner is included as an Appendix.

63

64
REFERENCES
1. Boyes, J., D., “Energy Storage Systems Program Annual Peer review – Sandia National
Laboratories,” DOE Annual Peer Review, Washington, DC, November 10-11, 2004. 2. Nourai, A., “Comparison of the Costs of Energy Storage Technologies for T & D
Applications,” American Electric Power Corporation, www.ElectricityStorage.org, July, 2004.
3. Koontz, C., “AEP Program Summary,” Proceedings of the Energy Storage Systems
Program Annual Peer Review, November 10-11, 2004. 4. Moseley, P., “ALABC Program Options for 2007 and Beyond,” February 2006. 5. Linden, D., Reddy, T., B., “Handbook of Batteries,” 3rd Edition, ISBN 0-07-135978-8,
McGraw-Hill, New York, 2002. 6. Moseley, P., “Advanced Lead-Acid Battery Consortium Update,” Proceedings of the
Energy Storage Systems Program Annual Peer Review, November 10-11, 2004.

65

66
DISTRIBUTION
Hard Copies
Technical Library Sandia National Laboratories M/S 0899
Energy Storage Program Sandia National Laboratories M/S 1108
Central Technical Files Sandia National Laboratories M/S 9018
Butler, Paul C.
OUSD(AT&L)/PSA/LW&M
3090 Defense Pentagon, Room 5C756
Washington, DC 20301-3090
Electronic Copies—Internal
Atcitty, Stan [email protected]
Borneo, Dan [email protected]
Bower, Ward I. [email protected]
Boyes, John [email protected]
Cameron, Christopher P. [email protected]
Clark, Nancy [email protected]
Corey, Garth [email protected]
Gonzalez, Sigifredo [email protected]
Hund, Tom [email protected]
Ingersoll, David [email protected]
Jungst, Rudolph G. [email protected]
Peek, Georgianne [email protected]
Prairie, Michael [email protected]
Ragland, Don B. [email protected]
Roehrig, Stephen [email protected]
Roth, Peter [email protected]
van den Avyle, Jim [email protected]

67
Electronic Copies—External
Badger, Joe JBI Corporation [email protected]
Baldwin, Samuel F. U.S. Department of Energy [email protected]
Baxter, Richard Ardour Capital Investments, LLC [email protected]
Beardsworth, Ed Energy Technology Advisors [email protected]
Benke, Michael Xantrex Technology, Inc. [email protected]
Bertagnolli, David ISO New England [email protected]
Bindewald, Gil U.S. Department of Energy [email protected]
Bloom, Ira D. Argonne National Laboratories [email protected]
Boden, Dave Hammond Expanders [email protected]
Braun, Gerald W. California Energy Commission [email protected]
Brown, Dave Battery Energy [email protected]
Burnham, Jeff NGK [email protected]
Butler, Paul C. OUSD(AT&L)/PSA/LW&M [email protected]
Camm, Ernest S&C Electric Company [email protected]
Cantrell, Michelle NorthStar Battery [email protected]
Capp, Bill Beacon Power Corp [email protected]
Cole, Jerome F. International Lead Zinc Research Organization, Inc. [email protected]
Craft, Ben NorthStar Battery [email protected]
Crimp, Peter Alaska Energy Authority/AIDEA [email protected]
Crow, Mariesa University of Missouri-Rolla [email protected]
Dailey, John Electro Energy, Inc. [email protected]
68
Davis, Murray W. DTE Energy [email protected]
Deshpande, Sanjay EnerSys Inc [email protected]
Dickinson, Enders Axion Power [email protected]
Djogo, Goran S&C Electric Company [email protected]
Donalek, Peter Montgomery Watson Harza (MWH) Global [email protected]
Dossey, Tom Southern California Edison [email protected]
Drake, Richard NYSERDA [email protected]
Dudney, Kevin California Public Utilities Commission [email protected]
Duncan, David Georgia Power Company [email protected]
Duncan, Paul Gridpoint, Inc. [email protected]
Duong, Tien Q. U.S. Department of Energy [email protected]
Eilertsen, Thor Custom Electronics, Inc. [email protected]
Enbar, Nadv Energy Insights [email protected]
Eto, Joseph H. Lawrence Berkeley National Laboratory [email protected]
Farber-DeAnda, Mindi SAIC [email protected]
Fiske, Jim Power Ring [email protected]
Fleming, Frank NorthStar Battery [email protected]
Geist, Thomas EPRI Solutions [email protected]
Gotschall, Harold Technology Insights [email protected]
Gray-Fenner, Amber Energy Communications Consulting [email protected]
Gyuk, Imre U.S. Department of Energy [email protected]
Hassenzahl, William Advanced Energy Analysis [email protected]
Haught, Deborah U.S. Department of Energy [email protected]
69
Hayden, Herbert Arizona Public Service [email protected]
Hennessey, Tim VRB Power Systems Inc. [email protected]
Herbst, John University of Texas [email protected]
Hoagland, Joseph TVA/Public Power Institute [email protected]
Hoffman, Michael Bonneville Power Administration [email protected]
Horgan, Susan Distributed Utility Associates Inc. [email protected]
Huang, Alex North Carolina State University - ECE - SPEC [email protected]
Hughes, Michael ZBB Technologies Inc. [email protected]
Jaffe, Todd Energy Business Brokers and Consultants [email protected]
Jensen, James Alaska Energy Authority [email protected]
Johnson, Brad [email protected]
Kalafala, A. Kamal Intermagnetics General Corp. [email protected]
Kamath, Haresh EPRI Solutions [email protected]
Karner, Don Electric Transportation Applications [email protected]
Key, Tom EPRI [email protected]
King, Richard J. U.S. Department of Energy [email protected]
Kirby, Brendan J. Oak Ridge National Laboratory [email protected]
Koontz, Charles Integrys Energy Services [email protected]
Kristiansen, R. EnerSys, Inc. [email protected]
Kulkarni, Pramod Industrial Energy Efficiency [email protected]
Lasseter, Bob University of Wisconsin [email protected]
Lex, Peter ZBB Technologies, Inc. [email protected]
Liaw, Bor Yann University of Hawaii [email protected]
70
Lightner, Eric M. U.S. Department of Energy [email protected]
Magnani, Nick [email protected]
Marnay, Chris Lawrence Berkeley National Laboratory [email protected]
McDowall, James SAFT [email protected]
McGinn, Patrick Satcon [email protected]
Mears, Daniel Technology Insights [email protected]
Moore, Jeffrey S&C Electric Company [email protected]
Moseley, Patrick ILZRO [email protected]
Newnham, Russell CSIRO [email protected]
Norris, Ben Norris Energy Consulting Company [email protected]
Nourai, Ali AEP [email protected]
O'Leary, Ray S&C Electric Company [email protected]
Oshima, Taku NGK Insulators, LTD. [email protected]
Overholt, Philip N. U.S. Department of Energy [email protected]
Parker, Carl International Lead Zinc Research Organization Inc. [email protected]
Phillips, Maryann Electro Energy, Inc. [email protected]
Porter, Dave S&C Electric Company [email protected]
Ranade, Satish New Mexico State University [email protected]
Rannels, James E. U.S. Department of Energy [email protected]
Reed, Michael Electro Energy, Inc. [email protected]
Reilly, James T. Reilly Associates [email protected]
Roberts, Bradford S&C Electric Company, Power Quality Products Division [email protected]
Rosenthal, Andrew L. New Mexico State University [email protected]

71
Rossmeissl, Neil P. U.S. Department of Energy [email protected]
Rufer, Alfred Ecole Polytechnique Federale de Lausanne (EPFL) [email protected]
Saft, Michael C. Saft America, Inc. [email protected]
Sanchez, Dan U.S. DOE - Albuquerque Operations Office [email protected]
Scheer, Rich Energetics, Inc. [email protected]
Schmitt, Robert GNB Industrial Power [email protected]
Schoenung, Susan Longitude 122 West, Inc [email protected]
Shahidehpour, Mohammad Illinois Institute of Technology [email protected]
Shirk, Bob NorthStar Battery [email protected]
Singhal. Amit NEI Corporation [email protected]
Skolnik, Edward Energetics–A Subsidiary of VSE Corporation [email protected]
Skowronski, Mark Electric Power Group [email protected]
Smith, Paul Smith Aerospace Marketing and Consulting [email protected]
Sostrom, Stan Power Engineers, Inc. [email protected]
Spence, Matthew Hammond Expanders [email protected]
Srinivasan, Devarajan APS STAR Center [email protected]
Srinivasan, Venkat Lawrence Berkeley National Lab [email protected]
Steffel, Stephen J. Pepco Holdings, Inc [email protected]
Stoval, John Oak Ridge National Laboratory [email protected]
Takayama, Toyoo Ted NGK Insulators, Ltd. [email protected]
Thijssen, Gerard STORM [email protected]
Ton, Dan T. U.S. Department of Energy [email protected]
Torrero, Edward NRECA Cooperative Research Network [email protected]

72
Udo, Victor E. Conectiv [email protected]
van der Linden, Septimus BRULIN Associates, LLC. [email protected]
Walmet, Paula Mead-Westvaco [email protected]
Waligorski, Joseph First Energy Corporation [email protected]
Weaver, Robert D. [email protected]
Whitaker, Chuck Endecon Engineering [email protected]
Winter, Rick Deeya Energy [email protected]
Woolf, Gerry BEST Magazine [email protected]
Zaininger, Henry Zaininger Engineering Co. [email protected]

73


A-1
APPENDIX—UTILITY FREQUENCY REGULATOR DESIGN FINAL REPORT
Please note: This Appendix has retained the original page numbering.

A-2

[inside back cover]