Evaluation of Earthquake Liquefaction …jgtte.com/issues/6/Issue 6 -3.pdf · 2001 Bhuj Earthquake...
10
www.jgtte.com 52 Received 6/7/2017 Accepted 10/4/2017 Published 12/1/2017 Corresponding Author: Majid Hussain; [email protected] Journal of Geotechnical and Transportation Engineering Volume 3 | Issue 2 Evaluation of Earthquake Liquefaction Hazard of Kutch Region Hussain and Sachan Evaluation of Earthquake Liquefaction Hazard of Kutch Region Majid Hussain Ph.D. Scholar, Civil Engineering, Indian Institute of Technology Gandhinagar, Gujarat, India. E-mail: [email protected] Ajanta Sachan Assistant Professor, Civil Engineering, Indian Institute of Technology Gandhinagar, Gujarat, India. E-mail: [email protected] Abstract Soil liquefaction during earthquakes is a common phenomenon. Liquefaction occurs when waterlogged sediments are agitated by earthquake shaking. Liquefaction is the mixing of sandy soils and groundwater during the shaking of a moderate or strong earthquake. If liquefaction occurs under a building, it may start to lean, tip over, or sink several feet. Liquefaction earthquake hazard occurs in areas that have low groundwater level and consist of sandy soil strata. 2001 Bhuj Earthquake produced major liquefaction in Great & Little Rann of Kutch, Banni plains, Kandla, and Gulf of Kutch; and these areas contained low-lying salt flats, estuaries, intertidal zones, and young alluvial deposits typically known for high susceptibility zones of liquefaction due to earthquake. Severe damage of many bridges, ports, buildings, embankment dams was reported in Kutch region due to liquefaction of underneath soils. The present study aims to conduct an extensive experimental investigation of soils from Kutch region to access liquefaction susceptibility and liquefaction potential of the region. Basic geotechnical characterization of soils from the region was carried out to evaluate its vulnerability to liquefaction. In the current research, 32 soil samples from 10 locations, including 5 major dams, at different depths were collected from the region to conduct a detailed geotechnical investigation. Most soils in the region were found to be cohesionless loose soil and classified as silty-sand. Results from geotechnical investigation were connected to liquefaction aspects of the region. Liquefaction vulnerability was related to grain size parameters and indices. Variation of grain size index (I GS ) with fines content & d 50 of Kutch soils exhibited high susceptibility to liquefaction. Shear strength parameters of soils in the region exhibited low friction angle (average 31 deg). Low shear strength parameters combined with the large settlement during saturation & shearing indicated the contractive behaviour of Kutch soils leading to large pore pressure evolution during earthquake shaking resulting to liquefaction in the region. Most soil samples from various locations of Kutch region exhibited lower FOS values indicating soils prone to liquefaction. Results from the current experimental investigation showed high susceptibility of soils in the Kutch region to liquefaction. Soil behaviour and performance of structures during 2001 Bhuj earthquake were in agreement with the conclusions made in the current study. Keywords: Liquefaction susceptibility, Grain size index, Shear strength, Kutch region. 1. Introduction Over the past four decades, liquefaction of saturated sands has been the topic of extensive research using field techniques to study the liquefaction potential of susceptible soil deposits post-earthquake. Liquefaction and related failures include all the phenomenon involving excessive deformation of saturated cohesionless soil deposits. Deformation may result from static as well as cyclic loading. Liquefaction under static loading may manifest in the form of strain softening under undrained loading resulting in either limited or flow liquefaction, depending upon the material state of the soil. Behavior under undrained cyclic loading may be exhibited either in the form of strain softening or cyclic mobility. Liquefaction under earthquake loading has been the focus of both in-situ testing as well as numerical simulations. Earthquake- induced liquefaction has resulted in catastrophic damages all around the world. Some of the well-documented case histories of liquefaction include 1964 Niigata Earthquake, 1966 Aberfan Wales landslide, 1971 Lower San Fernando Dam, 1938 Fort Peck Dam,1979 Imperial Valley Earthquake, 1983 Nerleck Berm, 1995 Kobe Earthquake, 1999 Chi-Chi earthquake, 2001 Bhuj Earthquake, 2011 Christchurch Earthquake & many others. In all the mentioned events, except 1966 Aberfan Wales landslide, seismic waves in one way or the other were observed to lead to significant damages with varied intensity. Earthquake liquefaction events in the western part of the globe have been well documented and a number of post-liquefaction studies were carried out. 2001 Bhuj Earthquake struck the Indian state of Gujarat on 26 th of Jan. With a magnitude of 7.7M w, it created havoc within a radius of 400 km from the epicenter, Bhuj. Extensive liquefaction was reported resulting in damage to dams, embankments, ports, bridges, buildings, and pipelines. Most of the dams damaged were within a radius of 150 km from the epicenter with peak ground acceleration, a max , reaching as high as 0.5g at Chang Dam and Shivlakha Dam, Singh et al. [1]. Liquefaction and liquefaction-related damage such as widespread liquefaction in the form of lateral spreading, water spouts and ground cracks were reported by various researchers (Mistry et al. [2]; Sitharam et al. [3]; Srivastav [4]; Jain et al. [5]).
Transcript of Evaluation of Earthquake Liquefaction …jgtte.com/issues/6/Issue 6 -3.pdf · 2001 Bhuj Earthquake...

www.jgtte.com
52
Received 6/7/2017 Accepted 10/4/2017
Published 12/1/2017
Corresponding Author:
Majid Hussain;
Journal of Geotechnical and Transportation Engineering
Volume 3 | Issue 2
Evaluation of Earthquake Liquefaction Hazard of Kutch
Region
Hussain and Sachan
Evaluation of Earthquake Liquefaction Hazard of
Kutch Region
Majid Hussain Ph.D. Scholar, Civil Engineering, Indian Institute of Technology Gandhinagar, Gujarat, India.
E-mail: [email protected]
Ajanta Sachan
Assistant Professor, Civil Engineering, Indian Institute of Technology Gandhinagar, Gujarat, India.
E-mail: [email protected]
Abstract
Soil liquefaction during earthquakes is a common phenomenon.
Liquefaction occurs when waterlogged sediments are agitated by
earthquake shaking. Liquefaction is the mixing of sandy soils and
groundwater during the shaking of a moderate or strong earthquake.
If liquefaction occurs under a building, it may start to lean, tip over,
or sink several feet. Liquefaction earthquake hazard occurs in areas
that have low groundwater level and consist of sandy soil strata.
2001 Bhuj Earthquake produced major liquefaction in Great &
Little Rann of Kutch, Banni plains, Kandla, and Gulf of Kutch; and
these areas contained low-lying salt flats, estuaries, intertidal zones,
and young alluvial deposits typically known for high susceptibility
zones of liquefaction due to earthquake. Severe damage of many
bridges, ports, buildings, embankment dams was reported in Kutch
region due to liquefaction of underneath soils. The present study
aims to conduct an extensive experimental investigation of soils
from Kutch region to access liquefaction susceptibility and
liquefaction potential of the region. Basic geotechnical
characterization of soils from the region was carried out to evaluate
its vulnerability to liquefaction. In the current research, 32 soil
samples from 10 locations, including 5 major dams, at different
depths were collected from the region to conduct a detailed
geotechnical investigation. Most soils in the region were found to
be cohesionless loose soil and classified as silty-sand. Results from
geotechnical investigation were connected to liquefaction aspects
of the region. Liquefaction vulnerability was related to grain size
parameters and indices. Variation of grain size index (IGS) with
fines content & d50 of Kutch soils exhibited high susceptibility to
liquefaction. Shear strength parameters of soils in the region
exhibited low friction angle (average 31 deg). Low shear strength
parameters combined with the large settlement during saturation &
shearing indicated the contractive behaviour of Kutch soils leading
to large pore pressure evolution during earthquake shaking
resulting to liquefaction in the region. Most soil samples from
various locations of Kutch region exhibited lower FOS values
indicating soils prone to liquefaction. Results from the current
experimental investigation showed high susceptibility of soils in
the Kutch region to liquefaction. Soil behaviour and performance
of structures during 2001 Bhuj earthquake were in agreement with
the conclusions made in the current study.
Keywords: Liquefaction susceptibility, Grain size index, Shear
strength, Kutch region.
1. Introduction Over the past four decades, liquefaction of saturated sands has been
the topic of extensive research using field techniques to study the
liquefaction potential of susceptible soil deposits post-earthquake.
Liquefaction and related failures include all the phenomenon
involving excessive deformation of saturated cohesionless soil
deposits. Deformation may result from static as well as cyclic
loading. Liquefaction under static loading may manifest in the form
of strain softening under undrained loading resulting in either
limited or flow liquefaction, depending upon the material state of
the soil. Behavior under undrained cyclic loading may be exhibited
either in the form of strain softening or cyclic mobility.
Liquefaction under earthquake loading has been the focus of both
in-situ testing as well as numerical simulations. Earthquake-
induced liquefaction has resulted in catastrophic damages all
around the world. Some of the well-documented case histories of
liquefaction include 1964 Niigata Earthquake, 1966 Aberfan Wales
landslide, 1971 Lower San Fernando Dam, 1938 Fort Peck
Dam,1979 Imperial Valley Earthquake, 1983 Nerleck Berm, 1995
Kobe Earthquake, 1999 Chi-Chi earthquake, 2001 Bhuj
Earthquake, 2011 Christchurch Earthquake & many others. In all
the mentioned events, except 1966 Aberfan Wales landslide,
seismic waves in one way or the other were observed to lead to
significant damages with varied intensity. Earthquake liquefaction
events in the western part of the globe have been well documented
and a number of post-liquefaction studies were carried out.
2001 Bhuj Earthquake struck the Indian state of Gujarat on 26th
of
Jan. With a magnitude of 7.7Mw, it created havoc within a radius of
400 km from the epicenter, Bhuj. Extensive liquefaction was
reported resulting in damage to dams, embankments, ports, bridges,
buildings, and pipelines. Most of the dams damaged were within a
radius of 150 km from the epicenter with peak ground acceleration,
amax, reaching as high as 0.5g at Chang Dam and Shivlakha Dam,
Singh et al. [1]. Liquefaction and liquefaction-related damage such
as widespread liquefaction in the form of lateral spreading, water
spouts and ground cracks were reported by various researchers
(Mistry et al. [2]; Sitharam et al. [3]; Srivastav [4]; Jain et al. [5]).

53
Hussain and Sachan
In spite of several evidences of soil liquefaction & related damage
reported in the region, an extensive experimental work focused on
soils at various locations of Kutch region is yet to be explored.
Sitharam et al. [6] , Ravishankar et al. [7] & Sitharam et al. [8]
performed extensive research work on soil collected from a location
near the epicenter of the Bhuj Earthquake. The extensive
experimental research work was performed in the above studies to
evaluate the cyclic undrained response and dynamic properties of
liquefied soil to evaluate shear modulus and damping ratio at large
strains. The effect of fines, density, the amplitude of cyclic shear
stress, and drainage condition on the post-liquefaction undrained
response of sand-silt mixtures was also studied for soil collected
from the epicenter of Bhuj Earthquake. Little has been done to carry
out an extensive study of the region. This motivated the authors to
perform an extensive experimental work on various soils collected
from different locations of Kutch region, which had experienced
liquefaction in the past. In the current research, soil samples were
collected from the locations, where liquefaction was reported
during 2001 Bhuj Earthquake. 32 soil samples from 10 locations,
including 5 major dams, at different depths were collected from
Kutch region, and detailed geotechnical investigation of all soil
samples was carried out. While soil sample collection, In-situ
density & In-situ water content of all the soil samples were
determined at the soil site itself along with the measurement of the
depth of ground water table. 32 samples at different depths from 10
selected locations cover the spatial variability, both horizontal and
vertical, of the soils in the region. Soils in the region have great
variability in terms of gradations and index properties. Fines
content which affects liquefaction behavior of soils to great extent
varies significantly with depth and horizontal distance. Spiral auger
was used to drill boreholes and to collect disturbed representative
soil samples. Boreholes were drilled up to different depths and
samples retrieved from the helical lift of the spiral auger. The
liquefaction susceptibility of these soil samples in the region was
evaluated with various geotechnical properties of soils like grain
size distribution, consistency limits, shear strength parameters
along with liquefaction potential evaluation using SPT N.
2. Sample collection & Experimental Program
Based on the published literature and reconnaissance surveys
conducted after 2001 seismic event, [5], a total of 10 locations were
identified including 5 major dams. Fig. 1 shows the details of the
study area and the epicenter, Bhuj Earthquake 2001. Disturbed
representative soil samples from each location were collected from
a depth of 0.5m, 1.5m & 2.5m using auger boring. Major dams
covered include Chang Dam, Fatehgarh Dam, Suvai Dam, Tappar
Dam and Shivlakha Dam with the remaining five locations being
Chobari, Budharmora, Kharoi, Khadir, & Banniari. The depth of
sample collection varied at few locations, as mentioned in Table 1.
Samples were collected during Jan-Feb 2015, which might give a
more relevant picture of the water table and moisture content as the
seismic event struck around the same time of the year in 2001. Fig.
2 shows sample collection at 4 of the 10 selected locations of Kutch
region. In-situ density and in-situ water content were determined
during the sample collection along with latitude & longitude of the
locations using Garmin GPS etrex10. GWT depth was also
measured, wherever it was within 2.5m from the ground surface.
Fig.1. Study area showing sample collection locations experienced liquefaction in Bhuj Earthquake 2001
54
Journal of Geotechnical and Transportation Engineering - 2017 vol. 3 (2)
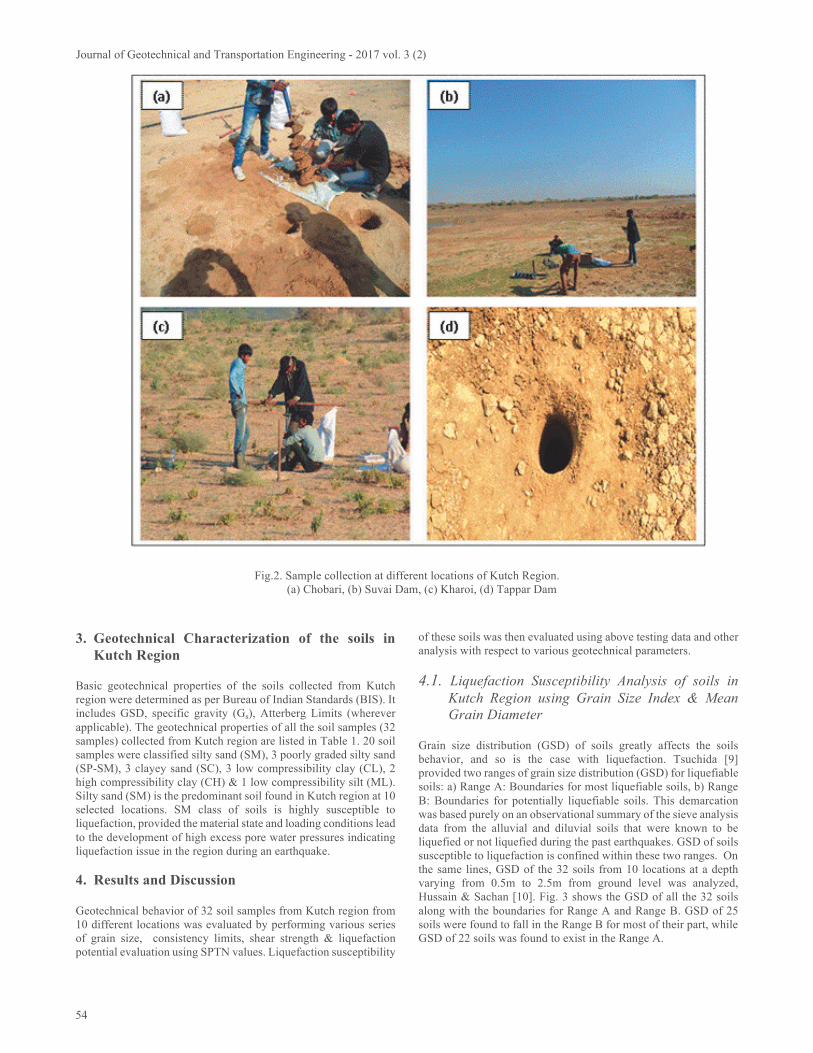
Fig.2. Sample collection at different locations of Kutch Region.
(a) Chobari, (b) Suvai Dam, (c) Kharoi, (d) Tappar Dam
3. Geotechnical Characterization of the soils in
Kutch Region
Basic geotechnical properties of the soils collected from Kutch
region were determined as per Bureau of Indian Standards (BIS). It
includes GSD, specific gravity (Gs), Atterberg Limits (wherever
applicable). The geotechnical properties of all the soil samples (32
samples) collected from Kutch region are listed in Table 1. 20 soil
samples were classified silty sand (SM), 3 poorly graded silty sand
(SP-SM), 3 clayey sand (SC), 3 low compressibility clay (CL), 2
high compressibility clay (CH) & 1 low compressibility silt (ML).
Silty sand (SM) is the predominant soil found in Kutch region at 10
selected locations. SM class of soils is highly susceptible to
liquefaction, provided the material state and loading conditions lead
to the development of high excess pore water pressures indicating
liquefaction issue in the region during an earthquake.
4. Results and Discussion
Geotechnical behavior of 32 soil samples from Kutch region from
10 different locations was evaluated by performing various series
of grain size, consistency limits, shear strength & liquefaction
potential evaluation using SPTN values. Liquefaction susceptibility
of these soils was then evaluated using above testing data and other
analysis with respect to various geotechnical parameters.
4.1. Liquefaction Susceptibility Analysis of soils in
Kutch Region using Grain Size Index & Mean
Grain Diameter Grain size distribution (GSD) of soils greatly affects the soils
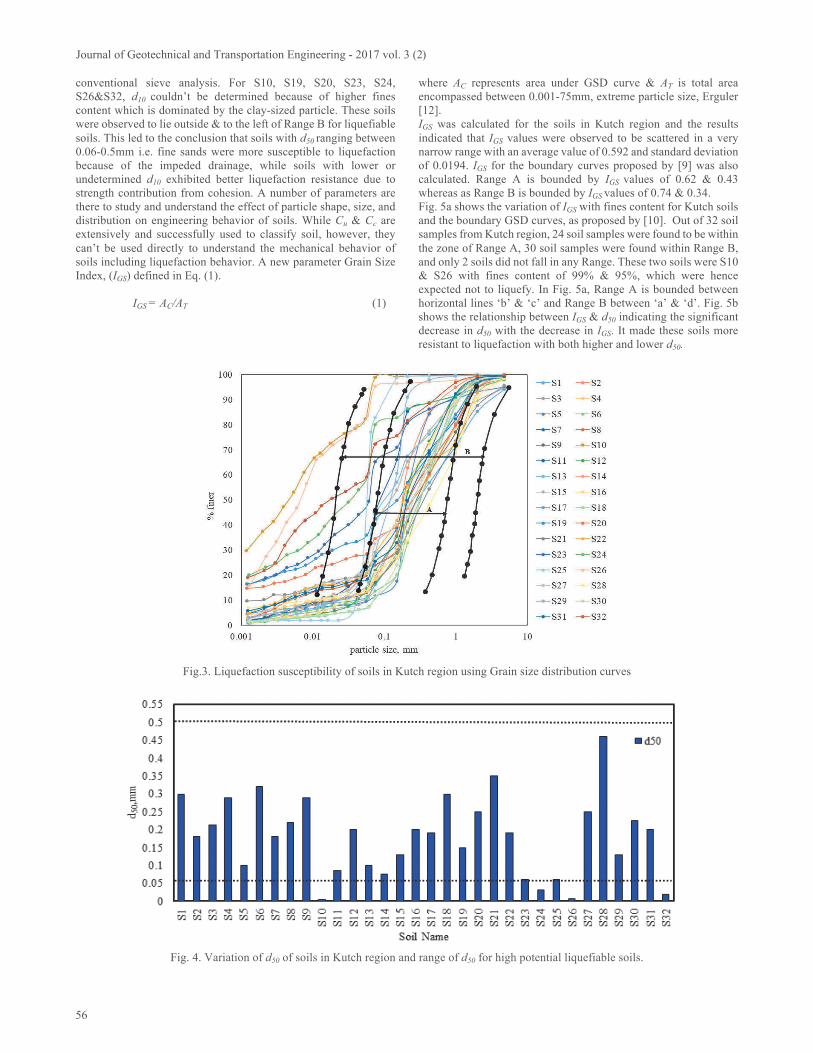
behavior, and so is the case with liquefaction. Tsuchida [9]
provided two ranges of grain size distribution (GSD) for liquefiable
soils: a) Range A: Boundaries for most liquefiable soils, b) Range
B: Boundaries for potentially liquefiable soils. This demarcation
was based purely on an observational summary of the sieve analysis
data from the alluvial and diluvial soils that were known to be
liquefied or not liquefied during the past earthquakes. GSD of soils
susceptible to liquefaction is confined within these two ranges. On
the same lines, GSD of the 32 soils from 10 locations at a depth
varying from 0.5m to 2.5m from ground level was analyzed,
Hussain & Sachan [10]. Fig. 3 shows the GSD of all the 32 soils
along with the boundaries for Range A and Range B. GSD of 25
soils were found to fall in the Range B for most of their part, while
GSD of 22 soils was found to exist in the Range A.

55
Hussain and Sachan
Table 1: Geotechnical properties of soils in Kutch region
Soil Name
D
(m)
di
kN/m3 (Gs) (e)
GSD FC
%
Atterberg
Limits
LL/PI
ratio Soil
Class
G S M C LL PL
% % % % % %
Chang Dam 23 27.591' N 70 24.408' E
S1 (L1) 0.5 15 2.67 0.75 6 78 11 6 16 NA NA - SM
S2 (L2) 0.5 15.69 2.66 0.66 0 82 15 3 18 NA NA - SM
S3 (L2) 1.5 15.70 2.68 0.67 5 75 17 2 19 NA NA - SM
Kharoi 23 28.367' N 70 23.330' E
S4 0.5 16.01 2.67 0.64 0 82 13 5 18 NA NA - SM
S5 1.5 16.90 2.67 0.55 5 84 9 3 12 NA NA - SP-SM
S6 2.5 16.00 2.67 0.64 1 86 11 2 14 NA NA - SM
Suvai Dam 23 36.428' N 70 29.821' E
S7 0.5 17.03 2.67 0.54 1 72 21 7 28 NA NA - SM
S8 1 14.37 2.66 0.82 2 74 19 5 24 NA NA - SM
S9 1.5 13.55 2.66 0.93 1 82 14 3 17 NA NA - SM
Fatehgarh Dam 23 41.369' N 70 48.057' E
S10 0.5 17.17 2.72 0.55 0 1 61 37 99 54 19 1.54 CH
S11 1.5 15.53 2.67 0.69 1 54 42 3 45 NA NA - SM
S12 2.5 15.45 2.69 0.71 0 78 20 1 22 NA NA - SM
Chobari 23 30.722' N 70 20.881' E
S13 0.5 17.51 2.7 0.51 0 56 42 2 44 NA NA - SM
S14 1.5 16.96 2.71 0.57 0 51 42 7 49 NA NA - SM
S15 2.5 17.57 2.7 0.51 1 59 36 4 41 NA NA - SM
Khadir 23 50.82' N 70 14.39' E
S16 0.5 15.94 2.66 0.64 2 79 17 2 19 NA NA - SM
S17 1.5 16.82 2.66 0.55 1 74 22 3 25 NA NA - SM
S18 2.5 16.96 2.66 0.54 2 88 9 2 11 NA NA - SP-SM
Tappar Dam 23 15.017' N 70 07.586' E
S19 0.5 17.36 2.67 0.51 0 57 24 18 42 34 11 1.48 SC
S20 1.5 16.39 2.66 0.59 5 66 14 15 28 31 10 1.48 SC
S21 2.5 17.67 2.68 0.49 4 72 14 10 24 22 11 2.00 SC
Budhar mora 23 20.634' N 70 11.501' E
S22 0.5 17.71 2.68 0.48 2 69 21 8 29 NA NA SM
S23 1.5 14.27 2.71 0.86 1 34 46 19 65 44 16 1.57 CL
S24 2.5 12.26 2.7 1.16 2 18 57 23 80 66 27 1.7 CH
Banniari 23 24.299' N 70 09.910' E
S25 0.5 13.37 2.74 1.01 0 17 81 2 83 NA NA - ML
S26 1.5 14.59 2.75 0.85 0 4 68 27 95 42 19 1.83 CL
S27 2 16.26 2.68 0.62 0 68 26 6 32 NA NA - SM
S28 2.5 17.60 2.69 0.50 1 78 13 8 21 NA NA - SM
Shivlakha Dam 23 24.659' N 70 35.128' E
S29 0.5 14.43 2.69 0.83 0 71 25 4 29 NA NA - SM
S30 1.5 14.88 2.7 0.78 1 88 9 2 11 NA NA - SP-SM
S31 2 16.37 2.69 0.61 1 74 18 7 25 NA NA - SM
S32 2.5 13.40 2.68 0.96 0 27 50 22 72 39 15 1.62 CL
Given the nature of gradation of soils of the Kutch Region, the
region was observed to be highly susceptible to liquefaction
provided other important conditions like high value of saturation &
sufficient seismic excitation experienced by given soil strata. Lee
& Fitton [11] proposed a term “liquefaction difficulty ratio”. It was
reported to be dependent on mean grain diameter (d50) and was
proposed for preliminary liquefaction potential investigation. Sands
with d50 in the range of 0.06-0.5mm and Cu < 5 were reported to be
more susceptible to liquefaction. As such d50 for the soils from
Kutch region are plotted in Fig. 4. Except for S10, S23, S24.S25,
S26 & S32, d50 of other Kutch soils was found to be in the range of
0.06-0.5mm indicating a high potential for liquefaction.
Effective grain diameter, d10 is also an indicator of GSD of soil.
Soils rich in fines, many times d10 can’t be determined from
56
Journal of Geotechnical and Transportation Engineering - 2017 vol. 3 (2)
conventional sieve analysis. For S10, S19, S20, S23, S24,
S26&S32, d10 couldn’t be determined because of higher fines
content which is dominated by the clay-sized particle. These soils
were observed to lie outside & to the left of Range B for liquefiable
soils. This led to the conclusion that soils with d50 ranging between
0.06-0.5mm i.e. fine sands were more susceptible to liquefaction
because of the impeded drainage, while soils with lower or
undetermined d10 exhibited better liquefaction resistance due to
strength contribution from cohesion. A number of parameters are
there to study and understand the effect of particle shape, size, and
distribution on engineering behavior of soils. While Cu & Cc are
extensively and successfully used to classify soil, however, they
can’t be used directly to understand the mechanical behavior of
soils including liquefaction behavior. A new parameter Grain Size
Index, (IGS) defined in Eq. (1).
IGS = AC/AT (1)
where AC represents area under GSD curve & AT is total area
encompassed between 0.001-75mm, extreme particle size, Erguler
[12].
IGS was calculated for the soils in Kutch region and the results
indicated that IGS values were observed to be scattered in a very
narrow range with an average value of 0.592 and standard deviation
of 0.0194. IGS for the boundary curves proposed by [9] was also
calculated. Range A is bounded by IGS values of 0.62 & 0.43
whereas as Range B is bounded by IGS values of 0.74 & 0.34.
Fig. 5a shows the variation of IGS with fines content for Kutch soils
and the boundary GSD curves, as proposed by [10]. Out of 32 soil
samples from Kutch region, 24 soil samples were found to be within
the zone of Range A, 30 soil samples were found within Range B,
and only 2 soils did not fall in any Range. These two soils were S10
& S26 with fines content of 99% & 95%, which were hence
expected not to liquefy. In Fig. 5a, Range A is bounded between
horizontal lines ‘b’ & ‘c’ and Range B between ‘a’ & ‘d’. Fig. 5b
shows the relationship between IGS & d50 indicating the significant
decrease in d50 with the decrease in IGS. It made these soils more
resistant to liquefaction with both higher and lower d50.
Fig.3. Liquefaction susceptibility of soils in Kutch region using Grain size distribution curves
Fig. 4. Variation of d50 of soils in Kutch region and range of d50 for high potential liquefiable soils.

57
Hussain and Sachan
(a)
(b)
Fig.5. Liquefaction susceptibility of soils in Kutch region using grain size index (IGS). (a) IGS & fines content, (b) IGS & d50
4.2. Liquefaction Susceptibility Analysis of soils in
Kutch Region using Index Properties LL & PL could be obtained for 8 soils out of which 3 classified as
SC, 3 as CL & 2 as CH. Soil behaviour during liquefaction depends
on fines content & type of fines: Non-plastic & Plastic. Soils with
significant plasticity are known to have better liquefaction
resistance. Fines content for the soils in Kutch region varied over a
wide range with a minimum of 11% & maximum of 99%. Plastic
and non-plastic fines have an altogether different effect on the
liquefaction behavior of soils. The soils with high plastic fine
content exhibit low liquefaction potential as compared to soils with
non-plastic fines. In the present study, LL & PL could be
determined for 8 soils and ratio of LL & PI values were obtained
for these 8 soils from the Kutch region (Table1). These soils
contained higher plastic fines as compared to others; hence they
showed better liquefaction resistance. Two soils with LL > 50%
classified as CH and rest of the 6 soils with LL < 50% classified as
clayey sand and low compressibility clay (3 each). A significant
portion of GSD of these soils was observed to exist outside the
Range B at its left side (Fig. 3). As the soils lying outside Range B
considered not to be prone to liquefaction, thus these soils were
expected not to liquefy primarily because of high plastic fines
content. Seed & Idriss [13] defined criteria known as Chinese
Criteria, which was reported to be the function of clay content, LL
& natural moisture content to confirm a soil to be non-liquefiable.
A soil could be liquefiable, only if all the three conditions were met:
i) clay content less than 15%, ii) LL less than 35%, and iii) Natural
moisture content greater than 0.9*LL. With this criterion in place
and the assumption that water content > 0.9*LL were observed to
meet in case of dam locations. The soils below GWT (S10, S23,
S24, S26 & S32) were observed to have low susceptibility to
liquefaction; whereas (S19, S20 &S21) were observed to be highly
prone to liquefaction.
4.3. Liquefaction Potential of soils in Kutch Region
using SPTN Simplified Procedure Simplified Procedure Youd et al. [14] was used for evaluating
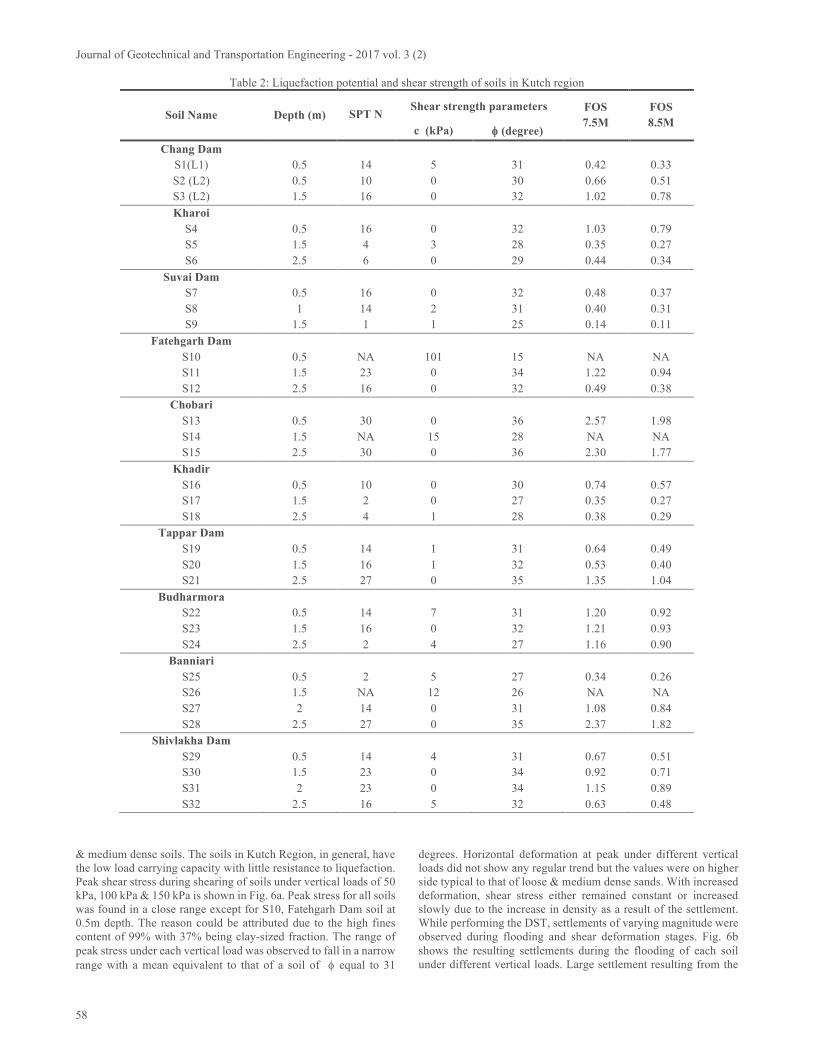
liquefaction potential of soil samples collected from different
locations of Kutch region for 7.5M & 8.5M earthquake magnitudes.
Factor of Safety (FOS) against liquefaction was determined as the
ratio of CRR (Cyclic Resistance Ratio) and CSR (Cyclic Stress
Ratio) using SPT-N values. FOS of Kutch soil samples collected
from different locations & different depths were calculated for
7.5M & 8.5M earthquake magnitudes considering no static shear
stress near the soil strata. 0.36g of peak ground acceleration (amax)
was used in liquefaction potential analysis of Kutch region (seismic
zone V). The FOS values of all soil samples for 7.5M & 8.5M
earthquake magnitudes are listed in Table 2. High liquefaction
potential (low FOS) was observed for all the locations for 7.5M
earthquake magnitude. Liquefaction susceptibility of soil strata at
1.5m was observed to be increased with increase in earthquake
magnitude from 7.5M to 8.5M. For 7.5M earthquake magnitude,
most of the Kutch soil strata were observed to be susceptible to
liquefaction, except Chobari (S13 & S15) and Banniari 2.5m (S28).
Soils with loose to medium density were found to be more
susceptible to liquefaction such as Khadir, Kharoi, Suvai Dam. FOS
values for 8.5M magnitude of earthquake were found to be
decreased at a given location indicating more susceptibility to
liquefaction as compared to 7.5M magnitude of earthquake. Dam
locations (Chang Dam, Fatehgarh Dam, Suvai Dam, Tappar Dam
and Shivlakha Dam) were observed to be more susceptible to
liquefaction as compared to non-dam locations (Chobari,
Budharmora, Kharoi, Khadir, & Banniari) in the Kutch region.
4.4. Shear Strength Behavior of Kutch soils & their
Relationships with Liquefaction Susceptibility Shear strength parameters for the soils in Kutch region were
determined by performing Direct Shear Tests (DST) as per IS 2720-
13 [18]. For each soil, three tests were performed simulating
overburden pressure of 50kPa, 100kPa &150kPa. All the samples
were sheared at 0.25mm/min of deformation rate. The tests were
performed in inundated/flooded conditions under each vertical
load. Shear strength parameters obtained from the DST are listed in
Table 2. From the DST data, shear strength parameters (c & ) were
obtained for all the soils of the Kutch region. values were
observed to be in the range of 25-36 degrees with an average value
of 31 degrees and standard deviation of 2.88 degrees, excluding S10
from the analysis. S10 has value of 15 degrees and cohesion value
of 104 kPa.
S10 was observed to have low potential to liquefaction as can be
seen from the GSD and high plasticity with the plastic fine content
of 37%. Only 7 soils were found to exhibit significant cohesion of
5 kPa or greater. Three soils; Fatehgarh Dam 0.5m (S10), Chobari
1.5m(S14) & Banniari 1.5m(S26); exhibited cohesion of 104 kPa,
15kPa & 12kPa respectively. These soils were observed not to be
susceptible to liquefaction as per their GSD, while S10 & S26 found
outside Range B and S14 in the Range A. S14 had high fines
content of 49% with 42% silt fraction. With shear strength
parameters of Kutch soil lying in the range that is typical of loose
58
Journal of Geotechnical and Transportation Engineering - 2017 vol. 3 (2)
Table 2: Liquefaction potential and shear strength of soils in Kutch region
Soil Name Depth (m)
SPT N Shear strength parameters FOS
7.5M
FOS
8.5M c (kPa) (degree)
Chang Dam
S1(L1) 0.5 14 5 31 0.42 0.33
S2 (L2) 0.5 10 0 30 0.66 0.51
S3 (L2) 1.5 16 0 32 1.02 0.78
Kharoi
S4 0.5 16 0 32 1.03 0.79
S5 1.5 4 3 28 0.35 0.27
S6 2.5 6 0 29 0.44 0.34
Suvai Dam
S7 0.5 16 0 32 0.48 0.37
S8 1 14 2 31 0.40 0.31
S9 1.5 1 1 25 0.14 0.11
Fatehgarh Dam
S10 0.5 NA 101 15 NA NA
S11 1.5 23 0 34 1.22 0.94
S12 2.5 16 0 32 0.49 0.38
Chobari
S13 0.5 30 0 36 2.57 1.98
S14 1.5 NA 15 28 NA NA
S15 2.5 30 0 36 2.30 1.77
Khadir
S16 0.5 10 0 30 0.74 0.57
S17 1.5 2 0 27 0.35 0.27
S18 2.5 4 1 28 0.38 0.29
Tappar Dam
S19 0.5 14 1 31 0.64 0.49
S20 1.5 16 1 32 0.53 0.40
S21 2.5 27 0 35 1.35 1.04
Budharmora
S22 0.5 14 7 31 1.20 0.92
S23 1.5 16 0 32 1.21 0.93
S24 2.5 2 4 27 1.16 0.90
Banniari
S25 0.5 2 5 27 0.34 0.26
S26 1.5 NA 12 26 NA NA
S27 2 14 0 31 1.08 0.84
S28 2.5 27 0 35 2.37 1.82
Shivlakha Dam
S29 0.5 14 4 31 0.67 0.51
S30 1.5 23 0 34 0.92 0.71
S31 2 23 0 34 1.15 0.89
S32 2.5 16 5 32 0.63 0.48
& medium dense soils. The soils in Kutch Region, in general, have
the low load carrying capacity with little resistance to liquefaction.
Peak shear stress during shearing of soils under vertical loads of 50
kPa, 100 kPa & 150 kPa is shown in Fig. 6a. Peak stress for all soils
was found in a close range except for S10, Fatehgarh Dam soil at
0.5m depth. The reason could be attributed due to the high fines
content of 99% with 37% being clay-sized fraction. The range of
peak stress under each vertical load was observed to fall in a narrow
range with a mean equivalent to that of a soil of equal to 31
degrees. Horizontal deformation at peak under different vertical
loads did not show any regular trend but the values were on higher
side typical to that of loose & medium dense sands. With increased
deformation, shear stress either remained constant or increased
slowly due to the increase in density as a result of the settlement.
While performing the DST, settlements of varying magnitude were
observed during flooding and shear deformation stages. Fig. 6b
shows the resulting settlements during the flooding of each soil
under different vertical loads. Large settlement resulting from the

59
Hussain and Sachan
flooding of the specimens indicated the tendency to densify. This
tendency of soil under undrained loading conditions contributed to
liquefaction during an earthquake due to large pore water pressure
evolution within the soil mass. Fig. 6c shows the resulting
settlements during shear deformation stage. Except for S10,
remaining soils showed contractive behavior under all vertical
loads applied to the specimens. Soils with comparatively higher
settlements contributed to the generation of higher excess pore
water pressure to make the soils more susceptible to liquefaction.
(a)
(b)
(c)
Fig.6. Shear behavior of Kutch soils under different over burden pressures. (a) Peak shear stress, (b) Settlement during saturation, (c)
Settlement during shear deformation
60
Journal of Geotechnical and Transportation Engineering - 2017 vol. 3 (2)
5. Conclusions
An extensive experimental study was performed on soils of various
locations of Kutch region. Ten locations were chosen to perform
the experimental investigation based on the liquefaction damage
experienced by the soil sites during past earthquake, as per the
reports published in post-earthquake survey of the region. Evident
& widespread liquefaction during the 2001 Bhuj earthquake were
reported including damage in dams, ports, embankments, pipeline
etc. 32 soil samples were collected from 10 identified locations of
Kutch Region, including 5 dam locations. The following
conclusions can be drawn from the present study:
1. Soils in Kutch region were mostly determined to be SM type.
Grain size index (IGS) & mean grain diameter (d50) of Kutch
soils were observed to lie in the narrow ranges of these
parameters, typical to those of liquefaction prone soils.
2. FOS against liquefaction of Kutch soils for 7.5M & 8.5M
magnitude earthquakes were obtained to be low (FOS <1 for
most soils) indicating susceptibility of the soils to liquefaction
in the region.
3. Shear strength behavior of Kutch soils showed behavior typical
to those of loose-medium dense soils. Friction angle values
were obtained to be in the range of 25-36 deg with an average
value of 31 deg. Low peak stress accompanied with large
settlement during saturation and shearing implied that
liquefaction might happen under earthquake loading conditions
in the region.
4. Liquefaction potential of soils at dam locations was observed
to be higher as compared to non-dam locations indicating dam
locations at more risk of liquefaction hazard as compared to
non-dam locations during future earthquakes.
Acknowledgements
Financial Support from IIT Gandhinagar is gratefully
acknowledged. Any opinions, findings, & conclusions or
recommendations expressed in this material are those of authors &
do not necessarily reflect the views of IIT Gandhinagar.
Notations
Mw Moment Magnitude
g Acceleration due to gravity, 9.81m/s2
amax Peak ground acceleration
GWT Ground Water Table
GSD Grain Size Distribution
Gs Specific Gravity
d50 Mean Grain Diameter
d10 Effective Grain Diameter
Cu Coeffiecient of uniformity
Cc Coeffiecitne of curvature
IGS Grain Size Index
LL Liquid Limit
PL
PI
Plastc Limit
Plasticity Index
c Cohesion
Friction angle
DST Direct Shear Test
e Void Ratio
G Gravel
S Sand
M Silt
C Clay
FOS Factor of Safety
wi In-situ water content
di In-situ dry density
FC Fines Content
References
[1] Singh, R., Roy, D. and Jain, S.K, “Investigation of liquefaction
failure in Earthen Dams during Bhuj Earthquake,” Special Session
on Seismic Aspects of Dam Design, 5th international R&D
conference, India, Vol. 15, pp. 40-48, 2005.
[2] Mistry, R., Shah, H., Dong, W, “Interdisciplinary observations
on the January 2001 Bhuj, Gujarat Earthquake,” World Seismic
Safety Initiative and Earthquakes and Megacities Initiative, pp. 1-
127, 2001.
[3] Sitharam, T. G., Srinivasa Murthy, B. R. & Kolge, A. M, “A
Post-Mortem Report of the Collapse of the Structures in
Ahmedabad during Bhuj Earthquake,” Indian Geotechnical
Conference, India, 2001, pp. 344–347.
[4] Srivastav, S. K, “Bhuj Earthquake of 26th January, 2001—
Some Pertinent Questions,” International Conference on Seismic
Hazard with Particular Reference to Bhuj Earthquake of January
26, 2001, India, 2001, pp. 3-5.
[5] Jain, S. K., Lettis, W. R., Murty, C. V. R., and Bardet, J. P,
“Bhuj, India Earthquake of January 26, 2001 Reconnaissance
Report,” Earthquake Spectra (EERI), Vol. 18, pp. 1-398, 2002.
[6] Sitharam, T.G., Govindaraju, L. and Murthy, B.S, “Evaluation
of liquefaction potential and dynamic properties of silty sand using
cyclic triaxial testing,” Geotechnical Testing Journal, ASTM,
Vol.27 (5), pp. 423-429, 2004.
[7] Ravishankar, B. V., Sitharam, T. G., and Govindaraju, L,
“Dynamic properties of Ahmedabad sands at large strains,”
In Proceedings, Indian Geotechnical Conference-2005,
Ahmedabad, India, 2005, pp. 369-372.
[8] Sitharam, T. G., Dash, H. K., and Jakka, R. S, “Postliquefaction
undrained shear behavior of sand-silt mixtures at constant void
ratio,” International Journal of Geomechanics, ASCE, Vol.13 (4),
pp. 421-429, 2013.
[9] Tsuchida, H, “Evaluation of liquefaction potential of sandy
deposits and measures against liquefaction-induced damage,”
Proceedings of the annual seminar of the Port and Harbour
Research Institute, pp. (3-1)-(3-33), 1970. (In Japanese).
[10] Hussain, M. and Sachan, A, “Liquefaction Susceptibility of
Soils in Kutch Region,” presented at International Geotechnical
Engineering Conference on Sustainability in Geotechnical
Engineering Practices and Related Urban Issues, India, 2016.
[11] Lee, K.L. and Fitton, J.A, “Factors affecting the cyclic loading
strength of soil,” Vibration Effects of Earthquakes on Soils and
Foundations, ASTM STP 450, pp. 71-95, 1969.
[12] Erguler, Z. A, “A quantitative method of describing grain size
distribution of soils and some examples for its
applications,” Bulletin of Engineering Geology and the
Environment, Vol. 75(2), pp. 807-819, 2016.
[13] Seed, H. B., and Idriss, I. M, “Ground motions and soil
liquefaction during earthquakes,” Earthquake Engineering
Research Institute, Monograph, Berkeley, Calif., 1982.
[14] Toud, T.L., Idriss, I.M., Andrus, R.R., Arango, I., Castro, G.,
Christian, J.T., Dobry, R., Finn, W.L., Harder Jr, L.F., Hynes, M.E.
and Ishihara, K, “Liquefaction resistance of soils: summary report
from the 1996 NCEER and 1998 NCEER/NSF workshops on
61
Hussain and Sachan
evaluation of liquefaction resistance of soils,” Journal of
Geotechnical and Geoenvironmental Engineering, ASCE, Vol.127
(10), pp. 817-833, 2001.
[15] IS: 2720 Part 4, Methods of test for soils: Grain Size Analysis
(second revision), Bureau of Indian Standards, New Delhi, India,
1985.
[16] IS: 2720 Part 3, Methods of test for soils: Determination of
Specific Gravity, Section: 2 Fine, medium and coarse grained soils
(first revision), Bureau of Indian Standards, New Delhi, India,
1980.
[17] IS: 2720 Part 13, Methods of test for soils: Direct Shear Test
(second revision), Bureau of Indian Standards, New Delhi, India,
1986.
[18] IS: 2720 Part 5, Methods of test for soils: Determination of
liquid limit & plastic limit (second revision, Bureau of Indian
Standards, New Delhi, India, 1985.
[19] IS: 6403, Code of practice for determination of bearing
capacity of shallow foundations (first revision), Bureau of Indian
Standards, New Delhi, India, 1981.