EVALUATION OF COMPLEX SITUATIONS FROM AIRPLANE’S …
85
VYSOKÉ UČENÍ TECHNICKÉ V BRNĚ BRNO UNIVERSITY OF TECHNOLOGY FAKULTA ELEKTROTECHNIKY A KOMUNIKAČNÍCH TECHNOLOGIÍ ÚSTAV AUTOMATIZACE A MĚŘICÍ TECHNIKY FACULTY OF ELECTRICAL ENGINEERING AND COMMUNICATION DEPARTMENT OF CONTROL AND INSTRUMENTATION EVALUATION OF COMPLEX SITUATIONS FROM AIRPLANE’S AVIONICS VYHODNOCOVANÍ KOMPLEXNÍCH SITUACÍ Z ÚDAJŮ LETECKÉ AVIONIKY DIPLOMOVÁ PRÁCE MASTER'S THESIS AUTOR PRÁCE Bc. ONDŘEJ VYSLOUŽIL AUTHOR VEDOUCÍ PRÁCE Ing. PETR HONZÍK, Ph.D. SUPERVISOR BRNO 2009 brought to you by CORE View metadata, citation and similar papers at core.ac.uk provided by Digital library of Brno University of Technology
Transcript of EVALUATION OF COMPLEX SITUATIONS FROM AIRPLANE’S …

VYSOKÉ UČENÍ TECHNICKÉ V BRNĚBRNO UNIVERSITY OF TECHNOLOGY
FAKULTA ELEKTROTECHNIKY A KOMUNIKAČNÍCHTECHNOLOGIÍÚSTAV AUTOMATIZACE A MĚŘICÍ TECHNIKY
FACULTY OF ELECTRICAL ENGINEERING AND COMMUNICATIONDEPARTMENT OF CONTROL AND INSTRUMENTATION
EVALUATION OF COMPLEX SITUATIONS FROMAIRPLANE’S AVIONICS
VYHODNOCOVANÍ KOMPLEXNÍCH SITUACÍ Z ÚDAJŮ LETECKÉ AVIONIKY
DIPLOMOVÁ PRÁCEMASTER'S THESIS
AUTOR PRÁCE Bc. ONDŘEJ VYSLOUŽILAUTHOR
VEDOUCÍ PRÁCE Ing. PETR HONZÍK, Ph.D.SUPERVISOR
BRNO 2009
brought to you by COREView metadata, citation and similar papers at core.ac.uk
provided by Digital library of Brno University of Technology

VYSOKÉ UČENÍTECHNICKÉ V BRNĚ
Fakulta elektrotechniky a komunikačních technologií
Ústav automatizace a měřicí techniky
Diplomová prácemagisterský navazující studijní obor
Kybernetika, automatizace a měření
Student: Bc. Ondřej Vysloužil ID: 83128Ročník: 2 Akademický rok: 2008/2009
NÁZEV TÉMATU:
Vyhodnocovaní komplexních situací z údajů letecké avioniky
POKYNY PRO VYPRACOVÁNÍ:
Zpracujte studii a přehled údajů shromaždovaných leteckou avionikou. Na základě znalostí zesimulovaných letů vyberte dvě vhodné komplexní situace a identifikujte důležité vstupní proměnné.Navrhněte testovací aplikace v prostředí Matlab a poté je implementujte do simulátoru pomocíprůmyslového jazyku SSL (Super Script Language).
DOPORUČENÁ LITERATURA:
Dle vlastního literárního průzkumu a doporučení vedoucího práce.
Termín zadání: 9.2.2009 Termín odevzdání: 25.5.2009
Vedoucí práce: Ing. Petr Honzík, Ph.D.
prof. Ing. Pavel Jura, CSc.Předseda oborové rady
UPOZORNĚNÍ:
Autor diplomové práce nesmí při vytváření diplomové práce porušit autorská práve třetích osob,zejména nesmí zasahovat nedovoleným způsobem do cizích autorských práv osobnostních a musí sibýt plně vědom následků porušení ustanovení § 11 a následujících autorského zákona č. 121/2000 Sb.,včetně možných trestněprávních důsledků vyplývajících z ustanovení § 152 trestního zákona č.140/1961 Sb.

Abstrakt česky: Tento projekt se podrobně zaměřuje na data z avioniky a může být chápán jako horní vrstva nad systémy monitorujícími poruchy, která poskytuje dodatečné informace o letu. Pro konkrétní návrh byly vybrány Airbus A320 a A340 jako zástupci moderních a rozšířených dopravních letadel. Vyvíjená aplikace analyzuje dvě vybrané komplexní situace z toku dat palubní avioniky a hledá podmínky, které vedou k abnormálnímu chování letadla (nikoliv poruchám). Práce je primárně zaměřena na letové fáze, strukturu dat (a jejich kategorizaci) a na vývoj aplikace na bázi fuzzy systému s expertní znalostí uloženou v jeho pravidlech. Abstrakt anglicky: This project takes a look on avionics data more comprehensively and it can be understood as an upper layer over fault monitoring systems providing extra information about flight. For concrete design were selected Airbus A320 a A340 to represent modern, widely used transport types of aircraft. Developed application analyzes two chosen complex situations from avionics dataflow and looks for conditions which lead to abnormal aircraft behaviour (but not faults). This work is primarily focused on flight phases, data structure and categorization and application development based on fuzzy system with expert knowledge represented by its rules. Klíčová slova česky: avionika, sběrnice letadla, fuzzy logika, FMS, letové fáze, SSL, HMI Klíčová slova anglicky: avionics, aircraft buses, fuzzy logic, FMS, flight phases, SSL, HMI

VYSLOUŽIL, O. Vyhodnocovaní komplexních situací z údajů letecké avioniky. Brno: Vysoké učení technické v Brně, Fakulta elektrotechniky a komunikačních technologií, 2009. 80 s. Vedoucí diplomové práce Ing. Petr Honzík, Ph.D.

Prohlášení
„Prohlašuji, že svou diplomovou práci na téma Vyhodnocování komplexních situací z letecké avioniky jsem vypracoval samostatně pod vedením vedoucího diplomové práce a s použitím odborné literatury a dalších informačních zdrojů, které jsou všechny citovány v práci a uvedeny v seznamu literatury na konci práce.
Jako autor uvedené diplomové práce dále prohlašuji, že v souvislosti s vytvořením této diplomové práce jsem neporušil autorská práva třetích osob, zejména jsem nezasáhl nedovoleným způsobem do cizích autorských práv osobnostních a jsem si plně vědom následků porušení ustanovení § 11 a následujících autorského zákona č. 121/2000 Sb., včetně možných trestněprávních důsledků vyplývajících z ustanovení § 152 trestního zákona č. 140/1961 Sb.“ V Brně dne: 25. května 2009 ………………………… podpis autora
Poděkování
Děkuji vedoucím diplomové práce Ing. Petru Honzíkovi, Ph.D. a Ing. Petru Krupanskému, Ph.D. za účinnou metodickou, pedagogickou a odbornou pomoc a další cenné rady při zpracování mé diplomové práce. V Brně dne: 25. května 2009 ………………………… podpis autora

Department of Control and Instrumentation Faculty of Electrical Engineering and Communication
Brno University of Technology
1
1. INTRODUCTION.............................................................................................3
2. FLIGHT PHASES.............................................................................................4
2.1 Takeoff ..............................................................................................................6
2.2 Climb.................................................................................................................8
2.3 Cruise ................................................................................................................9
2.4 Descent............................................................................................................10
2.5 Approach.........................................................................................................12
2.6 Go-Around ......................................................................................................12
3. DATA................................................................................................................14
3.1 FMS Menus.....................................................................................................14
3.2 Buses ...............................................................................................................22
4. APPLICATION...............................................................................................25
4.1 System comparison .........................................................................................25
4.1.1 Neural network .............................................................................................25
4.1.2 Fuzzy system ................................................................................................26
4.1.3 Expert system ...............................................................................................27
4.2 Rules for HMI design......................................................................................28
4.3 Visual appearence ...........................................................................................29
5. SYSTEM ALGORITHM................................................................................31
5.1 Fuzzy system design .......................................................................................32
5.2 Definition of complex situation ......................................................................36
5.3 Chosen situations overview ............................................................................36
5.3.1 Trajectory Deviation.....................................................................................36
5.3.2 Fuel Consumption Difference ......................................................................40
5.4 Development tools and implementation .........................................................46
5.4.1 Matlab application ........................................................................................47
5.4.2 C language application .................................................................................49
5.4.3 Super Script Language Application..............................................................50
6. TEST OF COMPLEX SITUATION ANALYSIS ........................................53
6.1 HLSIS Trajectory Deviation ...........................................................................53
6.2 HLSIS Fuel Consumption Difference.............................................................54

Department of Control and Instrumentation Faculty of Electrical Engineering and Communication
Brno University of Technology
2
6.3 Test results ......................................................................................................55
7. CONCLUSION................................................................................................56
APPENDIX A .......................................................................................................60
A.1 Fuel Consumption Difference decision tree....................................................60
A.2 Trajectory Deviation decision tree ..................................................................70
A.3 Diploma from EEICT Competition.................................................................80

Department of Control and Instrumentation Faculty of Electrical Engineering and Communication
Brno University of Technology
3
1. INTRODUCTION
Modern aircrafts have a lot of systems to find faults during flight. This project
takes a look on avionics data more comprehensively and it can be understood as an
upper layer over fault monitoring systems providing extra information about flight.
Airbus A320 and A340 were selected to represent modern, widely used, medium-
range and long-range civil transport types of aircraft.
First part is aimed at description of available data in avionics and their
categorization, choosing suitable evaluation system for application development and
list of basic HMI design rules.
Second part is focused on gradational test application development.
Developed application has to analyze complex situation from avionics dataflow and
look for conditions which can lead to abnormal aircraft behaviour (but not faults) in
real time, therefore this work is primarily focused on flight phases, data structure,
categorization and system algorithm.
Aim is not to find all complex situations during flight, but design system for
two chosen complex situations. This system will run in Honeywell aircraft simulator
to prove the concept in semi-realistic environment.

Department of Control and Instrumentation Faculty of Electrical Engineering and Communication
Brno University of Technology
4
2. FLIGHT PHASES
This chapter will provide information about flight phases. Small introduction
to mentioned flight systems will follow.
Flight Management System (FMS) is system used for flight planning,
navigation, performance management, aircraft guidance, datalink communication
and flight progress monitor. Its display is placed on pedestal by captain right hand. It
is shown in detail on figure 3-1.
Primary Flight Display (PFD) is graphical screen in front of the pilot with
speed, altitude and guidance information.
Autopilot (AP) is one of the most important systems, it can guide aircraft by
following selected settings without manual control. Its controls are on the glareshield
between pilots.
Particular positions in cockpit are shown on following figure 2-1.
Flight can be divided into five main phases – take-off, climb, cruise, descent
and approach. These phases are listed in the CDU’s Performance menu.
Typical FMS profile is shown on figure 2-2. It begins with the pre-flight
phase at the origin airport, through takeoff, climb, cruise (it can include several climb
steps), descent, approach and finishes with done (roll out) phase at the destination
airport. And possibly go around phases for missed approach. The FMS operation is
defined by these flight phases. The FMS automatically sequences through each phase
during the flight. In addition to guiding the aircraft laterally to follow waypoints
along a predefined route, the system guides the aircraft vertically, and optimizes the
flight based on aircraft performance [2].

Department of Control and Instrumentation Faculty of Electrical Engineering and Communication
Brno University of Technology
5
Figure 2-1: A340 cockpit with highlighted systems [2]
Figure 2-2: Flight profile [2]
Suitability of message appearance will be discussed in each phase in general.
More detailed information about message display will provide section 4.2.

Department of Control and Instrumentation Faculty of Electrical Engineering and Communication
Brno University of Technology
6
2.1 TAKEOFF
Pre-flight phase is prior to takeoff but pre-flight and done phases are not
major for this project and will not be discussed.
Takeoff and approach phase are relatively short but the most dangerous
phases and without any discussion they demand the most pilot’s attention. Only high
priority messages can appear during these phases, so it must be wisely considered
which messages (if any) from this project can be displayed during takeoff and
approach.
The takeoff phase extends to the acceleration altitude. The system is capable
of autopilot engagement on takeoff as low as 50 feet or 5 seconds after takeoff,
whichever is later. At thrust reduction altitude, the throttle levers are normally set to
the climb thrust detent. At this point when the aircraft control is in managed mode, it
guides the aircraft both vertically and laterally along the flight plan [2].
This procedure starts with thrust setting. Auto throttle system (A/THR button
on the FCU) can be armed. Throttle levers must be manually set to TOGA even with
auto throttle system engaged. Aircraft ground speed is rising greatly. In airspeed data
zone on PFD and when it reaches sufficient speed (indicated by yellow line and
calculated from initialization data), pilot pulls stick shortly and brings it back to
central position – over control of the stick must be avoided. It can lead into tail
strike.
Autopilot engagement can be selected shortly after takeoff, as it was
mentioned before (applies to A330/340). Prior to AP switch on, flight level should be
set by ALT control. After that AP1, SPD, HDG and ALT knobs must be pressed –
confirmation that these parameters will be changed according to flight plan. It
changes profiles from engaged to managed. From that moment AP follows the flight
plan, however, if during the cruise phase some new vertical (altitude) changes of
Flight Plan are prepared, further operation of Autopilot is required.
The FMS transitions from takeoff to climb phase when the aircraft altitude is
greater than the acceleration altitude (all engines operating) or when aircraft speed is
equal to or greater than VFTO (single engine out). The thrust reduction altitude is
defined by the airline policy file and can be changed on the PERF takeoff page. At
Department of Control and Instrumentation Faculty of Electrical Engineering and Communication
Brno University of Technology
7
the acceleration altitude and after flap/slat retraction, thrust energy is divided into
approximately 60% for acceleration and 40% for climb. [2]
As it was written before vertical profile is engaged or managed by pushing
ALT button on the FCU. Managed profile is cancelled by any of the following [2]:
• Pulling the V/S knob or FPA knob on the FCU
• Pulling the altitude select knob to select an altitude hold, open climb, or open
descent
• Applying TOGA thrust lever angle.
Managed vertical profile cannot engage unless the FMS can determine that:
• Clearance altitude exists
• The aircraft CAS, Mach, vertical speed, FPA, altitude, and positron are valid
• Predictions are not possible (if some of these - valid gross weight, cost index,
cruise flight level for the TAKEOFF, CLIMB and CRUISE phases missing)
• The onside MCDU for the engaged autopilot is functional (if an MCDU fails,
the autopilot must be switched to be the functioning master)
• A destination exists in the DESCENT phase.
At thrust reduction altitude, the FMA displays LVR CLB (indicating
managed vertical mode).
The FMS automatically transitions to the climb phase when the acceleration
phase of takeoff begins. Climb phase becomes active when one of the following
three criteria exists [2]:
• The engine out mode is not active and the aircraft altitude is greater than or
equal to the acceleration altitude.
• The engine out mode is active and the aircraft speed (CAS) is greater than or
equal to VFTO.
• One of the following modes is engaged:
- Vertical speed (V/S)
- Flight path angle (FPA)
- Altitude (ALT)
- Altitude acquire (ALT*)

Department of Control and Instrumentation Faculty of Electrical Engineering and Communication
Brno University of Technology
8
- Climb (CLB)
- Open climb (OP CLB).
2.2 CLIMB
From now on autopilot is engaged and pilot is not controlling aircraft
manually and he can take more attention to flight deck systems so messages can
appear on the screen more freely.
The climb phase extends from the acceleration altitude to the top of climb
(T/C) cruise flight level (displayed and modifiable on the PROG page). The FMS
guides the aircraft and commands acceleration when it is above the terminal area
speed restriction altitude. The system observes speed/altitude constraints that have
been entered in the flight plan. If all managed modes have been selected and
confirmed, the FMS gives speed, altitude, and lateral guidance during climb [2].
Vertical modes can be [2]:
• Managed Climb or Descent - A fully managed profile confirmed by CLB or
DES on the FMA and enabled by pushing the altitude set knob on the FCU.
• Open Climb or Descent - Enabled by pulling the altitude set knob on the
FCU.
Vertical performance can either be managed (strategic) or selected (tactical).
Climb performance can be changed on the PERF pages prior to that phase becoming
active [2].
Selected (tactical) vertical performance modes are [2]:
• Flight path angle
• Vertical speed
• Selected speed
• Open climb or descent - The FMS maintains speed/Mach at climb thrust or
idle thrust on the elevator. No vertical path is generated. The climb or descent
speed limits (for example, 250/10,000) are honoured. Above the speed limit
altitude ECON SPD/Mach or SPD as defined by the pilot is maintained.
• Green dot - This is the speed that gives the best lift/drag ratio.

Department of Control and Instrumentation Faculty of Electrical Engineering and Communication
Brno University of Technology
9
Managed (strategic) performance parameters include [2]:
• ECON - This is the speed computed by the system based on the cost index
and aerodynamic model for this aircraft.
• Climb and descent speed limits (i.e., 250/10,000)
• Waypoint Constraints - Altitude and speed constraints on the F-PLN pages.
2.3 CRUISE
This phase is the longest and the calmest from all mentioned. Additional
information messages can be displayed even more freely than in previous climb
phase.
The cruise phase extends from the top of climb point to the top of descent
(T/D). Cruise can include intermediate climbs as well as en route descents. When the
PROG page indicates that the aircraft is capable of an optimum altitude above the
current cruise altitude, a step climb may be desirable. Step climbs and descents are
entered from a vertical revision page or directly on the F-PLN page. A step climb (or
descent) requires setting a new altitude target on the FCU. The altitude change is
initiated by pushing or pulling the ALT knob. En route descents can be initiated
beyond 200 NM from the destination by an altitude change or vertical speed change,
then reinserting the new cruise altitude on the PROG page. The system transitions to
descent if a subsequent descent is initiated within 200NM of the destination and no
pre-planned step descent exists in front of the aircraft. [2]
During CRUISE, the pilot may be required to make navigation changes,
position updates, position reports, monitor flight progress, change cruise altitudes,
and prepare for descent to the destination airport. [2]
To minimize pilot workload during critical phases of flight, it is advantageous
to prepare for the descent, approach and go-around. This includes entering the
following [2]:
• Expected runway
• Approach type
• Transitions
Department of Control and Instrumentation Faculty of Electrical Engineering and Communication
Brno University of Technology
10
• Standard Terminal Arrival Route (STAR) – air route defined by particular
runway to ensure safe approach
• Via
• Approach performance data (minimums, temperature, winds, etc.).
2.4 DESCENT
More concentration demanding phase, information messages should be
reduced.
The descent phase starts at the top of descent point (which is less than 200 nm
from destination) by pushing the ALT knob for a managed descent or pulling the
ALT knob for an open or selected descent from the cruise altitude. The FMS
calculates the appropriate point for the start of descent. The pilot is required to
confirm and initiate all descents from cruise altitude by pushing or pulling the ALT
knob on the FCU. The managed descent does not occur until the pilot initiates it
following clearance from ATC. The predicted top of descent is based on a managed
profile. All database airspeed and altitude constrains are sequenced when on the
descent profile and in the managed mode as the aircraft proceeds to the clearance
limit. [2]
The managed descent profile is built backwards from the destination runway
threshold crossing height, MAP, or final end-point, to the top-of-descent. However,
from top-of-descent, it is built assuming idle thrust, a repressurization segment (if
required), followed by geometric segments between all known constraints (speed and
altitude) during the descent and approach phases [2].
Summary of the aircraft performance predictions [2]:
• Time, speed, altitude, leg distances with predicted transitions
• F-PLN page A
• Fuel and wind on the F-PLN page B
• Optimized top-of-descent
• All engines running or engine out recommended maximum altitude
• on the PROGRESS page

Department of Control and Instrumentation Faculty of Electrical Engineering and Communication
Brno University of Technology
11
• Time and distance to an altitude on the PERF page
• Distance-to-land/direct distance-to-destination on the PROGRESS page or
vertical profile deviation during managed descent
• Altitude error or deviation indications displayed on PROG DES page
unmanaged vertical flight
• Speed error if a constraint is predicted to be missed
A descent path profile can be flown in one of three ways:
• On path
• Early descent (below path - also called immediate descent)
• Late descent (above path - decelerate)
There are some cases when constrains may not be met. For example if
managed speed and altitude modes are activated when approaching a speed or
altitude constraint in V/S or SPEED mode in descent, and there is not enough
distance and time for the FMS to comply with the speed and/or altitude constraints.
[2]
The type of descent initiated can either be a cruise descent or a descent to
destination [2]:
• Cruise Descent - The FMS remains in cruise flight phase.
It is initiated by lowering the FCU altitude below the existing cruise altitude
when the aircraft is more than 200 NM from the destination, or if a pre-
planned step exists (and if the lowered FCU altitude is above FL200 and the
highest descent constraint altitude) [2].
• Descent to Destination - The FMS transitions to descent flight phase.
It is descent to a new lower cruise altitude results in using an ECON speed
profile based on gross weight, cost index, and winds. Once the aircraft is at
the new cruise altitude, the cruise flight level is re-established and a newly
computed ECON cruise speed/Mach is flown. This results in a smooth
transition to the new cruise altitude and speeds [2].

Department of Control and Instrumentation Faculty of Electrical Engineering and Communication
Brno University of Technology
12
2.5 APPROACH
As it was mentioned previously it must be wisely considered which messages
(if any) from this project can be displayed at this moment.
The approach phase starts when the pilot activates and confirms the approach
on the PERF descent page, or when the approach deceleration pseudo waypoint is
passed and the aircraft is below 7200 ft above ground level (AGL) in lateral control.
A pseudo waypoint is a point in the flight plan where a designated event is
predicted/prescribed to occur. The approach deceleration pseudo waypoint is
computed backwards from the landing point based on optimized flap/slat
configuration changes, altitude/speed constraints, and flight path. In managed profile
mode, the system manages the guidance to the clearance altitude or final approach
fix altitude as cleared and set on the FCU. When cleared for an ILS or localizer
approach, the approach (APPR) or location (LOC) button on the Flight Control Unit
(FCU) must be pushed (managed) to arm the system. FMS guidance stops when the
ILS localizer and glide slope are captured, provided APPR or LOC is armed [2].
2.6 GO-AROUND
Go-around phase is consequent to missed approach. In comparison to other
flight procedures Go-around procedure happens less commonly. However in airports
with challenging weather condition it can happens quite often.
Information messages should be reduced greatly for pilot’s full concentration.
The aircraft transitions to the Go-Around phase when the thrust levers are
moved to the TOGA position and the flaps/slats are not clean. The FMS then guides
the aircraft through the missed approach procedure. [2]
Managed vertical flight is not available in the Go-Around flight phase, so the
pilot must select intermediate altitude constraints on the FCU or activate another
flight phase. [2]
The FMS automatically re-strings the previous approach when the Go-
Around phase is sequenced. [2]

Department of Control and Instrumentation Faculty of Electrical Engineering and Communication
Brno University of Technology
13
The FMS stays in the Go-Around phase until the approach phase is activated
on the PERF page. Entering a new destination on the LAT REV page causes the
FMS to transition from the Go-Around to the climb phase. [2]
Department of Control and Instrumentation Faculty of Electrical Engineering and Communication
Brno University of Technology
14
3. DATA
There are two suitable data sources for this project, FMS internal data and
signals from buses. This chapter will introduce them both.
For aircraft simulation was used Host based Simulation System (HSS). The
HSS is complex development software running on PC with added PCI card with real
FMS CPU. Application simulates all cockpit major screens and controls. The FMS
module is one to one to real FMS. The HSS has powerful tools to monitor aircraft
behaviour in variety of tasks. Bus Monitor and Bus Display were used for buses
scanning.
3.1 FMS MENUS
The FMS itself stores many data from aircraft equipments. It will be my
primary data source. In this chapter the FMS menu for Airbus A340 will be
described.
The MCDU is used for several tasks, from weather information to flight plan
setting. Menu is divided into several sections; they are represented by buttons under
the screen. Navigation from one section to another is possible also by pressing one of
the twelve buttons on left and right side of the MCDU screen, because some signs
are acting like links. In this particular example (A340) it is hard to see which one will
lead us to another section and which one is a simple text. This a bit confusing issue
was rectified in newer FMS (A380).
Each section can have several pages and also columns so horizontal and
vertical scrolling is needed.
Following figure 3-1 shows the FMS screen and controls.

Department of Control and Instrumentation Faculty of Electrical Engineering and Communication
Brno University of Technology
15
Figure 3-1: Control Display Unit [2]
Following information makes a list of section with available data.

Department of Control and Instrumentation Faculty of Electrical Engineering and Communication
Brno University of Technology
16
Radio navigation page (RAD NAV Key)
It displays the RADIO NAV tuning page that displays identification,
frequency, and course for navaids (Navigation Aids – Waypoints form Navigation
Database) selected either by the pilot or automatically by the FMS. It shows radio
frequencies and courses.
Figure 3-2: Radio navigation page [2]
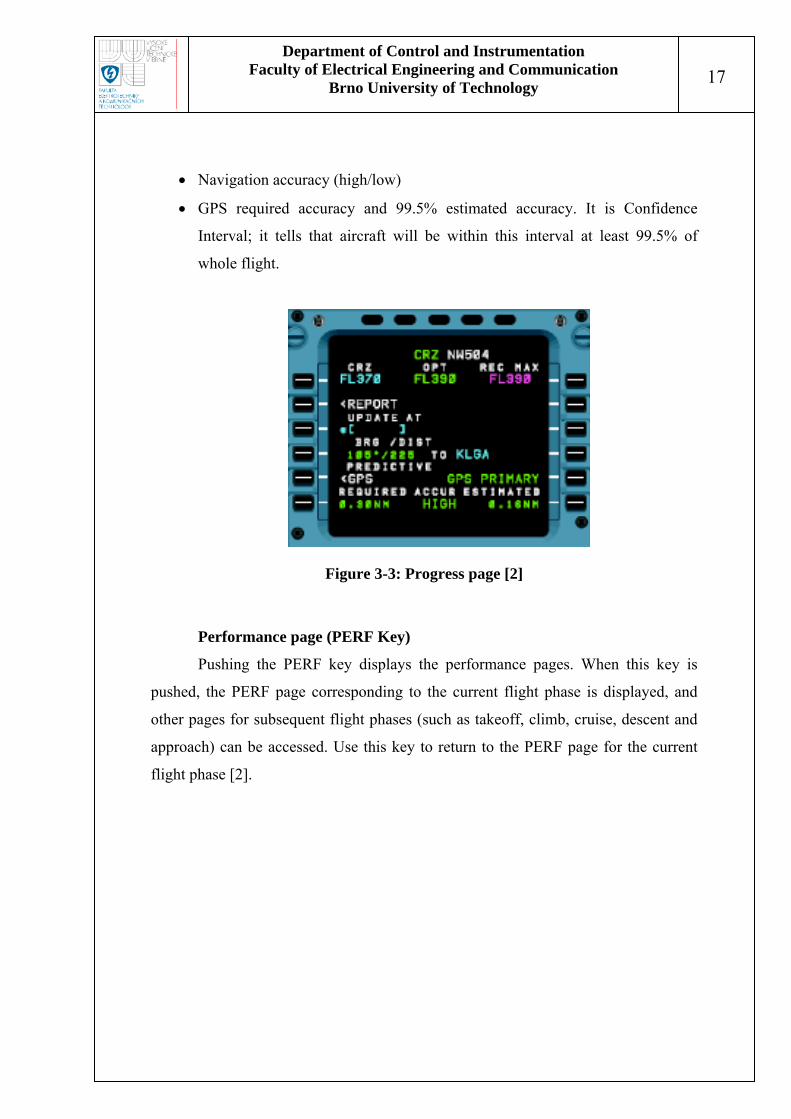
Progress page (PROG Key)
The progress page lets the pilot monitor the bearing and distance to a
waypoint, update the aircraft position, and change the cruise flight level [2].
Pushing the PROG key displays the PROG (progress) CRZ, OPT, or REC
MAX page. This page displays dynamic flight information about the active flight
plan, and bearing and distance to a specified location. It also displays required
navigation accuracy, estimated position uncertainty (EPU), current accuracy of the
navigation solution (high or low), and a prompt for accessing the REPORT page [2].
This page displays the following dynamic information about the active flight
plan:
• Cruise flight level
• Optimum flight level
• Recommended max flight level
• Vertical flight phase
Department of Control and Instrumentation Faculty of Electrical Engineering and Communication
Brno University of Technology
17
• Navigation accuracy (high/low)
• GPS required accuracy and 99.5% estimated accuracy. It is Confidence
Interval; it tells that aircraft will be within this interval at least 99.5% of
whole flight.
Figure 3-3: Progress page [2]
Performance page (PERF Key)
Pushing the PERF key displays the performance pages. When this key is
pushed, the PERF page corresponding to the current flight phase is displayed, and
other pages for subsequent flight phases (such as takeoff, climb, cruise, descent and
approach) can be accessed. Use this key to return to the PERF page for the current
flight phase [2].

Department of Control and Instrumentation Faculty of Electrical Engineering and Communication
Brno University of Technology
18
Figure 3-4: Performance page [2]
Direction page (DIR Key)
Pushing the DIR key displays the DIR TO page on the MCDU. On this page
the pilot can initiate a ‘direct to’ leg for a selected waypoint (in the active primary
flight plan only) [2].
Figure 3-5: Direction page [2]
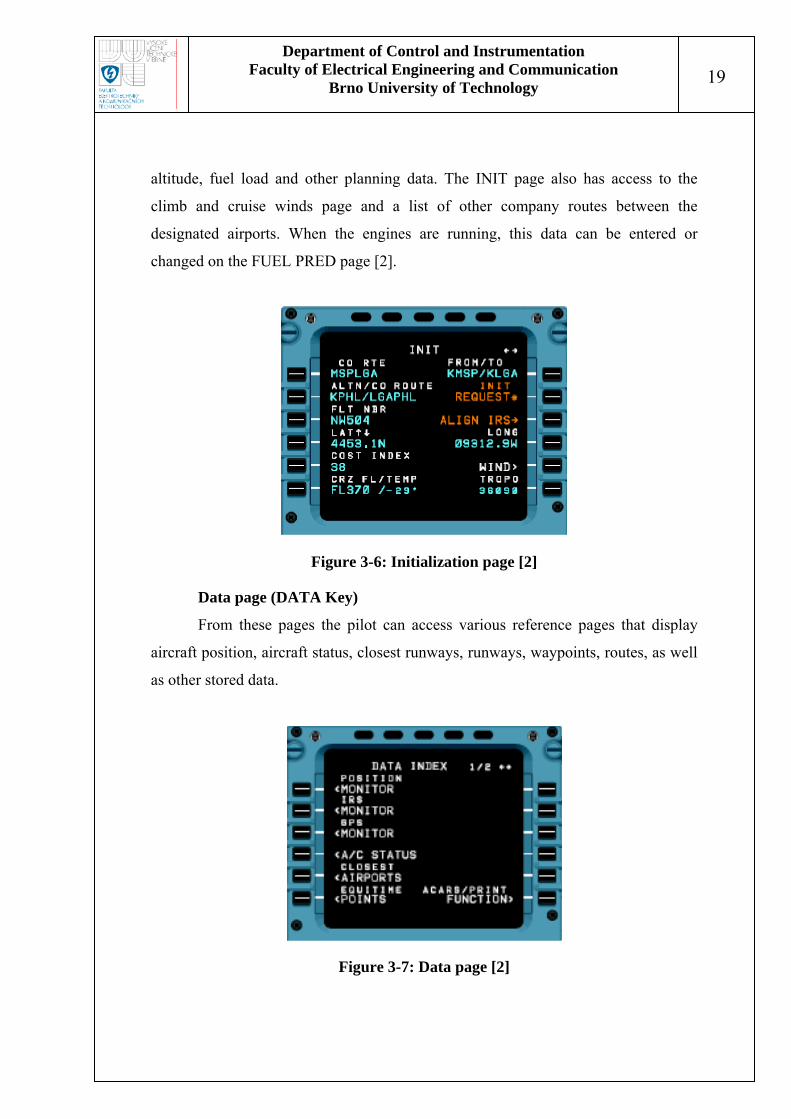
Initialization page (INIT Key)
Pushing the INIT key displays the flight plan initialization page if the aircraft
is on the ground. The INIT page is used to initialize the origin/destination or
company route, alternate destination, flight number, latitude and longitude, cost
index, cruise flight level and temperature, IRS alignment, WIND pages, tropopause
Department of Control and Instrumentation Faculty of Electrical Engineering and Communication
Brno University of Technology
19
altitude, fuel load and other planning data. The INIT page also has access to the
climb and cruise winds page and a list of other company routes between the
designated airports. When the engines are running, this data can be entered or
changed on the FUEL PRED page [2].
Figure 3-6: Initialization page [2]
Data page (DATA Key)
From these pages the pilot can access various reference pages that display
aircraft position, aircraft status, closest runways, runways, waypoints, routes, as well
as other stored data.
Figure 3-7: Data page [2]
Department of Control and Instrumentation Faculty of Electrical Engineering and Communication
Brno University of Technology
20
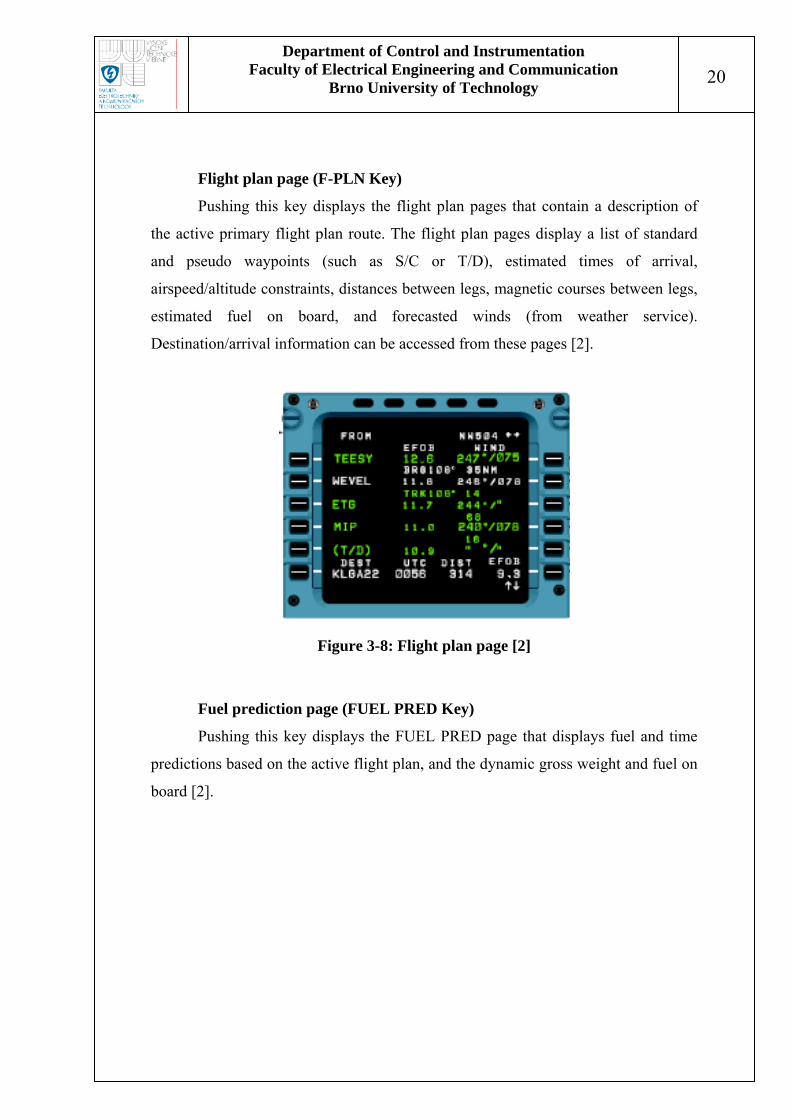
Flight plan page (F-PLN Key)
Pushing this key displays the flight plan pages that contain a description of
the active primary flight plan route. The flight plan pages display a list of standard
and pseudo waypoints (such as S/C or T/D), estimated times of arrival,
airspeed/altitude constraints, distances between legs, magnetic courses between legs,
estimated fuel on board, and forecasted winds (from weather service).
Destination/arrival information can be accessed from these pages [2].
Figure 3-8: Flight plan page [2]
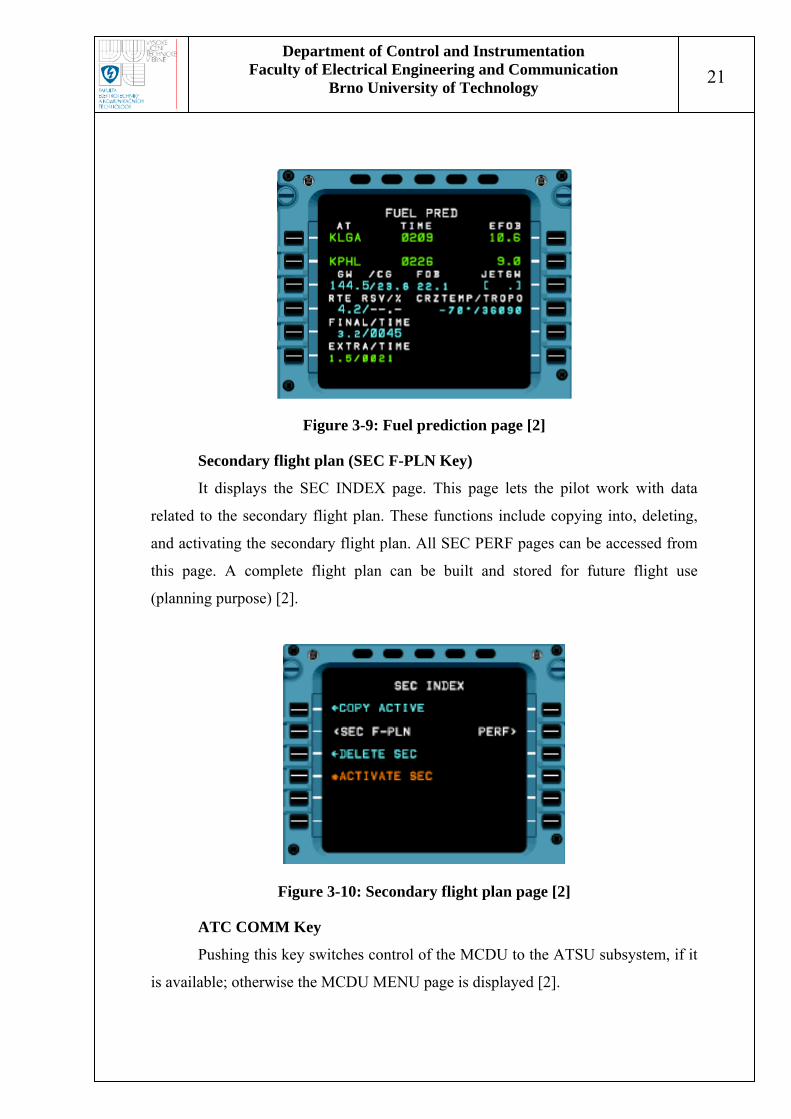
Fuel prediction page (FUEL PRED Key)
Pushing this key displays the FUEL PRED page that displays fuel and time
predictions based on the active flight plan, and the dynamic gross weight and fuel on
board [2].
Department of Control and Instrumentation Faculty of Electrical Engineering and Communication
Brno University of Technology
21
Figure 3-9: Fuel prediction page [2]
Secondary flight plan (SEC F-PLN Key)
It displays the SEC INDEX page. This page lets the pilot work with data
related to the secondary flight plan. These functions include copying into, deleting,
and activating the secondary flight plan. All SEC PERF pages can be accessed from
this page. A complete flight plan can be built and stored for future flight use
(planning purpose) [2].
Figure 3-10: Secondary flight plan page [2]
ATC COMM Key
Pushing this key switches control of the MCDU to the ATSU subsystem, if it
is available; otherwise the MCDU MENU page is displayed [2].

Department of Control and Instrumentation Faculty of Electrical Engineering and Communication
Brno University of Technology
22
CDU menu (MCDU MENU Key)
It displays the MCDU MENU page. This page lists subsystems that use the
MCDU for display. From the MCDU MENU, the pilot can initiate communications
with the FMGEC and other optional equipment (ATSU/ACARS or other datalink
equipment) [2].
Figure 3-11: CDU menu [2]
AIRPORT Key
Pushing the AIRPORT key when the active primary flight plan page is
displayed, cycles the display through the origin, primary destination, and alternate
destination airport pages. If the AIRPORT key is pushed when another page is
displayed, then the active primary flight plan page is displayed [2].
3.2 BUSES
A340 series avionics systems are decentralized and connected with special
communication protocol ARINC – in this case version 429.
ARINC 429 is a two-wire data bus that is application-specific for commercial
and transport aircraft. The connection wires are twisted pairs. Words are 32 bits in
length and most messages consist of a single data word. The specification defines the
electrical and data characteristics and protocols. ARINC 429 uses a unidirectional
data bus standard. Messages are transmitted at either 12.5 or 100 kbit/s to other
Department of Control and Instrumentation Faculty of Electrical Engineering and Communication
Brno University of Technology
23
system elements that are monitoring the bus messages. The transmitter is always
transmitting either 32-bit data words or the NULL state. No more than 20 receivers
can be connected to a single bus (wire pair) and no more than one transmitter [7].
In modern aircrafts higher versions of ARINC are implemented and their
basics are more similar to ethernet protocol.
The HSS Bus Display contains all available buses and their particular signals.
Buses are strictly oriented to particular task, others are mixed. Many varied
information can be found and it would be more lucid to divide them logically rather
than describe each bus. Buses data can be separated into five categories:
• position and navigation:
This section includes position data; they can be obtained from GPS, IRS and
radio beacons. It is closely connected to navigation part. One particular bus is
focused on all data for navigation display. Data about Distance-Measuring
Equipment (DME is a combination of ground and airborne equipment which
gives a continuous slant range distance-from-station readout by measuring
time-lapse of a signal transmitted by the aircraft to the station and responded
back.) and Very High Frequency Omni directional Range (VOR is a radio
navigation aid.) waypoints can be found on buses as well.
• flight controls:
This category contains status of flight controls such as flaps, spoilers,
elevators, gear etc. Data about fuel, weight, aircraft speeds (from
minimal/maximal to approach or actual ground/air speed), angles, altitude etc.
can be add in this category.
• weather:
It covers several vital data such as pressure, temperature, wind speed which
are important for flight.
• display settings:
Many buses contain some information relating to display screens (e.g. scale
on navigation display).

Department of Control and Instrumentation Faculty of Electrical Engineering and Communication
Brno University of Technology
24
• AP:
AP is vital aircraft system, therefore two buses are devoted to this application.
All necessary data for AP function are included. Many of these data logically
coincident with flight control category.
• Guidance data:
This group contains data for higher level control of aircraft – predicted
trajectory, navigation database, etc. All current state data can be included
here.
Generally all available data (FMS included) can be divided like this.
The FMS and buses cover up all available data in aircraft, which is possible to
use for complex situation evaluation. In the FMS internal data storages can be found
majority of data, but buses contain more detailed information of aircraft current state.

Department of Control and Instrumentation Faculty of Electrical Engineering and Communication
Brno University of Technology
25
4. APPLICATION
This chapter will compare neural network, fuzzy and expert systems to
choose the most convenient system for the application of advisory system which
should be able assess complex situation from aircraft data. At the end of this section
the HMI design rules will be mentioned.
4.1 SYSTEM COMPARISON
4.1.1 Neural network
An artificial neural network is an interconnected group of artificial neurons
that uses a mathematical or computational model for information processing based
on a connectionistic approach to computation. In most cases it is an adaptive system
that changes its structure based on external or internal information that flows through
the network [7].
In more practical terms neural networks are non-linear statistical data
modelling or decision making tools. They can be used to model complex
relationships between inputs and outputs or to find patterns in data [7].
Neural networks are a form of multiprocessor computer system, with simple
processing elements, a high degree of interconnection, simple scalar messages and
adaptive interaction between elements [7].
Figure 4-1: Simplified view of an artificial neural network [7]

Department of Control and Instrumentation Faculty of Electrical Engineering and Communication
Brno University of Technology
26
The utility of artificial neural network models lies in the fact that they can be
used to infer a function from observations and also to use it. This is particularly
useful in applications where the complexity of the data or task makes the design of
such a function by hand impractical [7].
Useful for scenarios [7]:
• Where we can't formulate an algorithmic solution.
• Where we can get lots of examples of the behaviour we require.
• Where we need to pick out the structure from existing data.
4.1.2 Fuzzy system
A fuzzy control system is a control system based on fuzzy logic - a
mathematical system that analyzes analogue input values in terms of logical variables
that take on continuous values between 0 and 1, in contrast to classical or digital
logic [7].
Fuzzy controllers are very simple conceptually. They consist of an input
stage, a processing stage, and an output stage. The input stage maps sensor or other
inputs, such as switches, thumbwheels, and so on, to the appropriate membership
functions and truth values. The processing stage invokes each appropriate rule and
generates a result for each, then combines the results of the rules. Finally, the output
stage converts the combined result back into a specific control output value [7].
Typical structure of fuzzy system can be divided into three phases (as shown on
Figure 4-2) [3]:
• fuzzification – digital value of input variable is converted into verity of one or
several input fuzzy variables – input terms
• logical core – set of rules or logical terms describing logical relations between
input and output terms
• defuzzification – process opposite to fuzzification, it assigns one specified value
to the set of output terms

Department of Control and Instrumentation Faculty of Electrical Engineering and Communication
Brno University of Technology
27
Similar procedure is used when fuzzy system implements control, decision-
making or optimization algorithm, regulator, regulator adjuster, diagnostic or control
system, model, expert system or another function [3].
Figure 4-2: Scheme of typical fuzzy system
4.1.3 Expert system
Expert systems are computer programs, which simulates expert decision-
making for solving of complex task. It uses appropriately coded special knowledge
gained from expert. Focus is to achieve decision-making at the expert level – in the
field of that specific task [8].
Characteristic features of expert system are [8]:
• separation of knowledge and control mechanism
• expert knowledge expressed explicitly in knowledge base, only utilization strategy
is known in advance
• indeterminateness in knowledge base
• indeterminateness in database
• dialog mode
• explanatory function
Characteristics of tasks solved by expert systems [8]:
• problem has to be enough strict
• structured problem
• availability of proper data (and experts)

Department of Control and Instrumentation Faculty of Electrical Engineering and Communication
Brno University of Technology
28
In this particular application using of neural net seems to be inappropriate.
Project tasks can be defined quite exactly as well as formulation of an algorithmic
solution. Indeterminism of neural net in aerospace application, which must have the
highest possible safeness, is nonconforming issue. Neural net demand training set
with many similar examples, this requirement can not be met. These properties make
neural net wrong choice.
For this application is fuzzy system the best solution. Fuzzy logic is
convenient to classify inputs. Knowledge will be stored in fuzzy rules. For rules
construction is decision tree very useful, because bindings between inputs and
outputs are more visible.
4.2 RULES FOR HMI DESIGN
There are several crucial conditions that must be met if this application will
be added to aircraft systems. Task is not to interfere with actual software or
hardware, but to enrich them with this particular project.
Simple rules for HMI design are:
• Not to distract pilot: Output information from this project has character of
additional performance data so there is no need to attract too much attention.
• Logical structure: Extra information should be implemented in same style (colour,
font, height etc.) and graphic as other pages.
• Display choice: This is connected with both upper rules. The FMS screen will be
the best place, it contains aircraft vital data and it is logical to place the
application here.
Accordingly to these simple rules adding one page to Performance section
seems to be a good way how to gently embed this application to the FMS. The FMS
appearance will not be changed (at first sight). Text style will be chosen similarly to
other pages.
HMI should be designed regarding to human factor studies.

Department of Control and Instrumentation Faculty of Electrical Engineering and Communication
Brno University of Technology
29
4.3 VISUAL APPEARENCE
Output from described applications will be text message (e.g. warning sign).
Intended place is on MCDU as shown on Figure 4-3.
Figure 4-3: Position of information on MCDU [1]
MCDU gather another performance data about aircraft – connected with fuel
prediction, navigation, flight plan etc. And it is logical to put such information here.
In will be shown only when system finds anything unusual. Text message can
contain only few words, because limit is one line. Future version can add new page
to MCDU, where can be displayed outputs from implemented application. This page
can be accessible by touching side buttons next to the displayed message, which is
logical for pilot.
Another possible location is ECAM (Electronic Centralized Aircraft Monitor)
screens. ECAM system has two screens – primary and secondary. Their positions are
shown on Figure 4-4; they are more in pilots view angle than MCDU.
Figure 4-4: Positions of ECAM primary (upper) and secondary screens [9]
Department of Control and Instrumentation Faculty of Electrical Engineering and Communication
Brno University of Technology
30
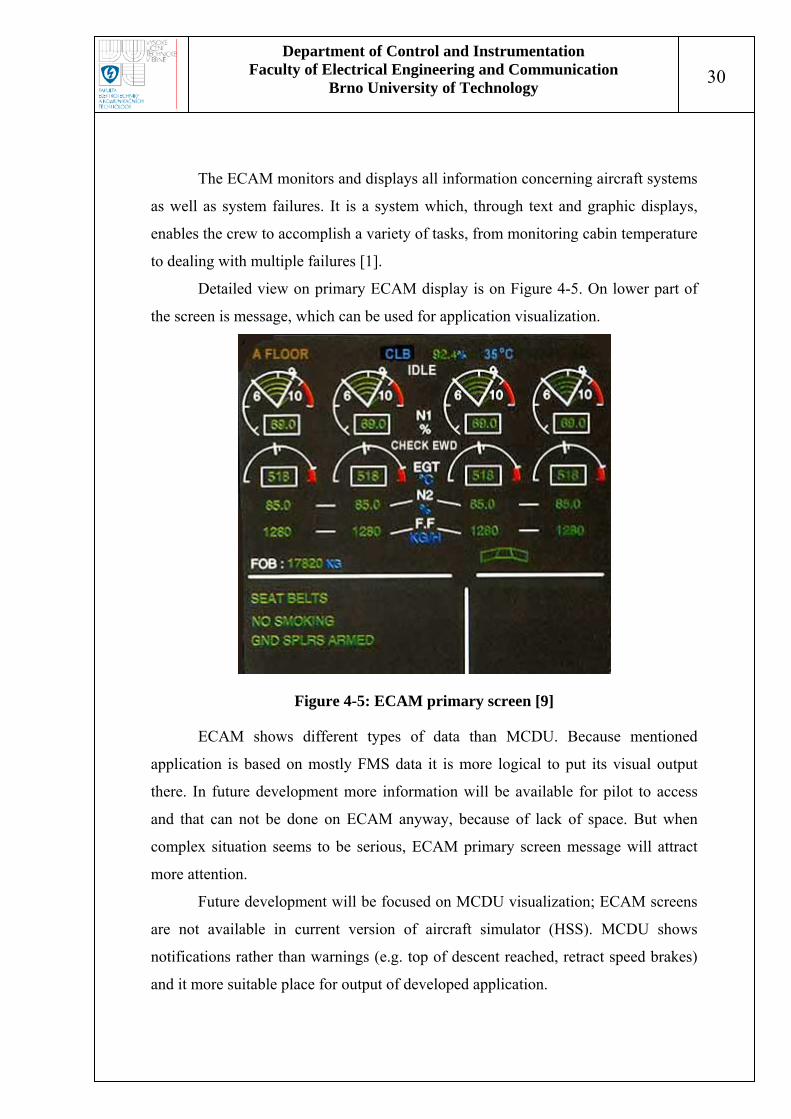
The ECAM monitors and displays all information concerning aircraft systems
as well as system failures. It is a system which, through text and graphic displays,
enables the crew to accomplish a variety of tasks, from monitoring cabin temperature
to dealing with multiple failures [1].
Detailed view on primary ECAM display is on Figure 4-5. On lower part of
the screen is message, which can be used for application visualization.
Figure 4-5: ECAM primary screen [9]
ECAM shows different types of data than MCDU. Because mentioned
application is based on mostly FMS data it is more logical to put its visual output
there. In future development more information will be available for pilot to access
and that can not be done on ECAM anyway, because of lack of space. But when
complex situation seems to be serious, ECAM primary screen message will attract
more attention.
Future development will be focused on MCDU visualization; ECAM screens
are not available in current version of aircraft simulator (HSS). MCDU shows
notifications rather than warnings (e.g. top of descent reached, retract speed brakes)
and it more suitable place for output of developed application.

Department of Control and Instrumentation Faculty of Electrical Engineering and Communication
Brno University of Technology
31
5. SYSTEM ALGORITHM
This system can be understood as high-level of aircraft data monitoring.
Nowadays avionics systems can discover faults in particular system or sensor, vital
systems are doubled or even tripled to reach highest possible safety. This system is
aimed to discover unusual situations which can be potentially unsafe and cannot be
discovered by any system itself, general faults recognition is left to other systems. It
is designed as separate extension to presently used avionics data and interface. Main
point is to determine which situations are unusual. This system is developed as
flexible as possible. It can work during flight; this is described in following chapters.
Another way how it can operate is even before flight (during pre-flight settings) to
check entered parameters and recommend optimal settings for particular flight.
Algorithm is based on fuzzy system. Its rules were designed on basis of
decision tree (see Appendix A), which is perfect to show bindings between inputs
and outputs in more understandable visual way. Knowledge base is included in fuzzy
rules. It was formed on basis of flights on HSS, when aircraft buses were observed.
Hundreds of hours were spent flying with HSS to study aircraft behaviour at specific
conditions. HSS contains valuable tools for avionics data display and record. After
these studies two possible unusual situations were chosen and fully described by
fuzzy logic.
Inputs and outputs are represented by fuzzy sets divided into appropriate
number of membership functions for each variable.
The main aim was to design suitable type of application for this purpose and
demonstrate its function on sufficiently well described two complex situations, but
obviously not to cover all possible abnormal situations.
For developed application was chosen name HLSIS (High Level Support
Information System). This label is proposed regarding to possible future extensions.
Although aerospace units are imperial, all described values were converted to
SI units for better orientation and comprehensibility.

Department of Control and Instrumentation Faculty of Electrical Engineering and Communication
Brno University of Technology
32
5.1 FUZZY SYSTEM DESIGN
Recent studies show that the best solution is fuzzy system. Decision trees
were constructed for both following complex situation as the first step.
Fuzzy rules were entered on the basis of decision trees (see Appendix A).
Number of rules rises rapidly with number of input variables and theirs membership
functions. Vital is to determine appropriate number of input variables, because their
addition to fuzzy system is more complicated (every previous rule has to be changed)
than division of existing input variable into more membership functions. That is why
majority of input variables has three membership function, which represents for
example low, medium and high, they can be extended as project continues. Impact of
each variable was judged separately, because sometimes separation into three
membership functions is sufficient, but in some cases it seems to be too broad. For
example trajectory cross track error input (will be discussed later in chapter 5.3.1) is
different for each flight phase, that why it was separated into five membership
functions. Similar situation occurred in other situation (fuel prediction difference –
see chapter 5.3.2), where important input fuel flow was divided into seven functions.
System algorithm is visualized on Figure 5-1.
Figure 5-1: Diagram of algorithm design (for situation Trajectory Deviation)
Department of Control and Instrumentation Faculty of Electrical Engineering and Communication
Brno University of Technology
33
Input variables come from avionics, represented by HSS buses (avionics data
for particular aircraft). First test applications will have only offline static variables
input. Offline means no direct input from HSS is defined, data are inserted manually
(on basis of monitored data from HSS). Final application will have real-time inputs
entry, because of link with HSS via SSL (Super Script Language) application
running in debug window.
Fuzzy system itself has common design (see Figure 5-1) composed from:
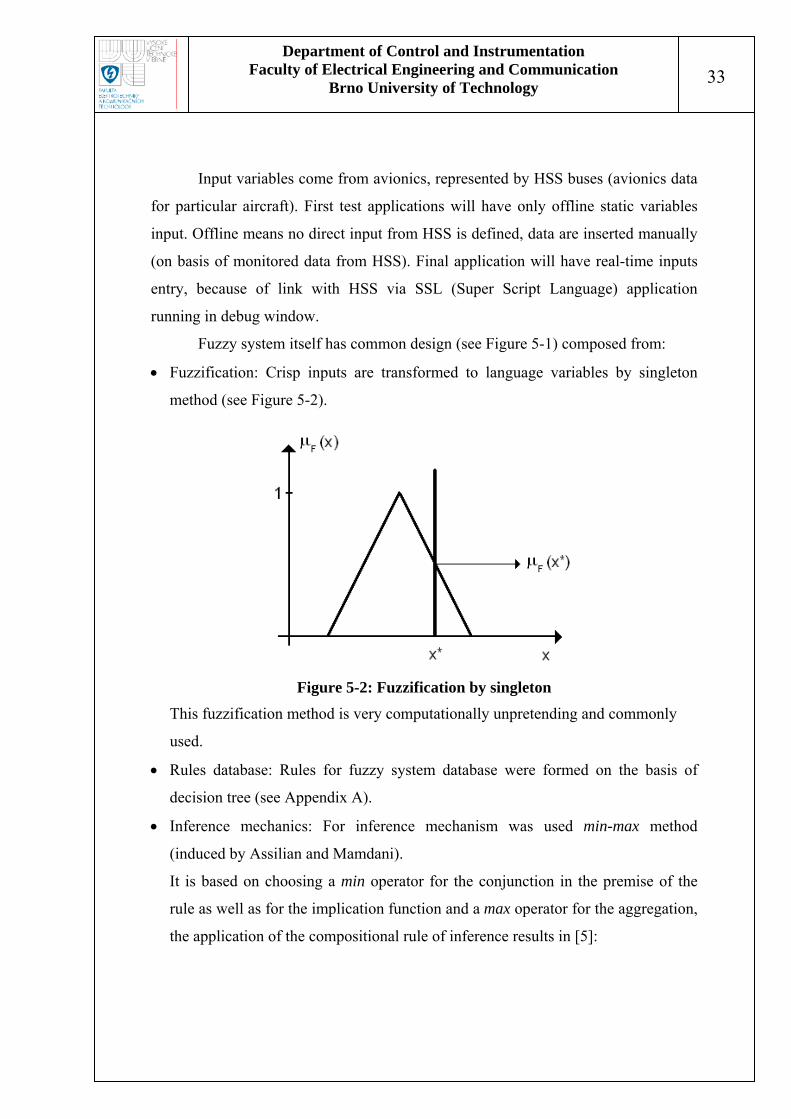
• Fuzzification: Crisp inputs are transformed to language variables by singleton
method (see Figure 5-2).
Figure 5-2: Fuzzification by singleton
This fuzzification method is very computationally unpretending and commonly
used.
• Rules database: Rules for fuzzy system database were formed on the basis of
decision tree (see Appendix A).
• Inference mechanics: For inference mechanism was used min-max method
(induced by Assilian and Mamdani).
It is based on choosing a min operator for the conjunction in the premise of the
rule as well as for the implication function and a max operator for the aggregation,
the application of the compositional rule of inference results in [5]:
Department of Control and Instrumentation Faculty of Electrical Engineering and Communication
Brno University of Technology
34
}{ ( )( )yy Bkk
nimplicatio
naggregatio
kB μβμ ,minmax)(' = , (5-1)
with:
}ki
premiseinnconjunctio
ik ,
__
min αβ = , (5-2)
}{ ( ) ( )( )iAiA
coposition
ncombinatio
projection
xki xx
kii ,,minsup ', μμα
4434421=
. (5-3)
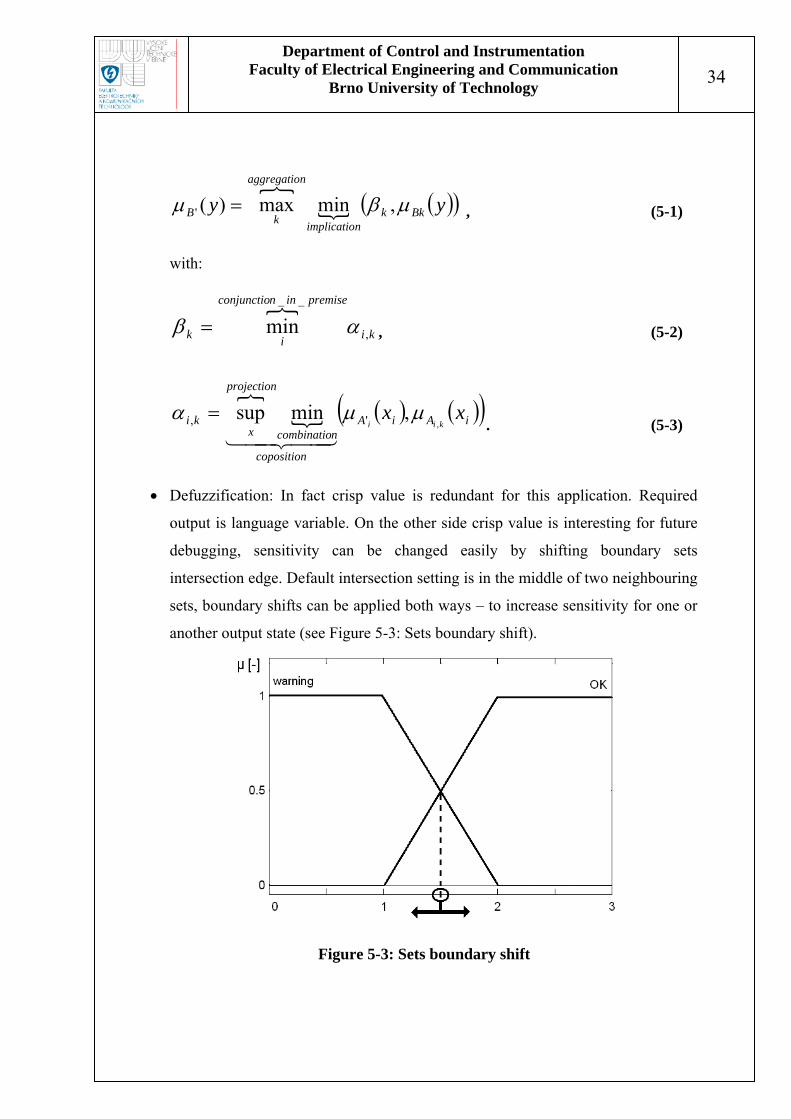
• Defuzzification: In fact crisp value is redundant for this application. Required
output is language variable. On the other side crisp value is interesting for future
debugging, sensitivity can be changed easily by shifting boundary sets
intersection edge. Default intersection setting is in the middle of two neighbouring
sets, boundary shifts can be applied both ways – to increase sensitivity for one or
another output state (see Figure 5-3: Sets boundary shift).
Figure 5-3: Sets boundary shift

Department of Control and Instrumentation Faculty of Electrical Engineering and Communication
Brno University of Technology
35
For defuzzification was chosen CAM (Centre Average Method) for its extremely
low computational demands and still sufficient results.
Figure 5-4: Centre Average Method
This method (see Figure 5-4) considers peak values (centres) of each fuzzy set,
they are weighted by height particular fuzzy set. Crisp output is weighted average
of peak values
∑
∑
=
== r
k
k
kr
k
k
w
wxx
1
1*, (5-4)
where k
x is fuzzy set peak value, which is present in consecutive of k rule, and kw is its height given by value of rules antecedent [4].
Discrete COG (Centre of Gravity) method was also considered, but its
implementation in SSL (Super Script Language) (see chapter 5.4.3) was infective
from code length and computational demands point of view.

Department of Control and Instrumentation Faculty of Electrical Engineering and Communication
Brno University of Technology
36
5.2 DEFINITION OF COMPLEX SITUATION
Complex situation in this context is specific aircraft behaviour, which is not
standard under concrete input conditions. What is abnormal under conditions alpha,
can be standard (or even typical) behaviour under conditions beta. It is about flight
abnormality, that can cause flight inconvenience or inefficiency or even point to (or
lead to) particular system failure.
Abnormal aircraft response can occur even if all systems working without any
error.
5.3 CHOSEN SITUATIONS OVERVIEW
In this part there will be two abnormal situations described – Trajectory
Deviation and Fuel Consumption Difference.
5.3.1 Trajectory Deviation
First application is dealing with Trajectory Deviation. Modern airplanes are
designed to fly very accurately and hold on desired trajectory accordingly to flight
plan. Flying with near absolute accuracy (means nearly zero deviation) brings
increased demands on fuel consumption and it makes flight expensive. Airlines
endeavour to lower fuel expenses – this at most influences cost index. That is why
certain trajectory deviation is normal. Specific conditions can lead to smaller or
bigger deviations. The purpose of this application is to determine which deviations
(at actual conditions) are normal and which are abnormal. Deviations are common
during flights, but they always have reasons, which have to be communicated out
with air traffic controller. If airplane deviates from planned trajectory without any
reason it can be consequence of for example system malfunction or wrong setting of
flight parameters.
This fuzzy system has four inputs (flight phase, wind speed, wind direction
change and trajectory deviation) and one output.
• flight phase:
This is variable gives information about actual flight phase. It is not fuzzy
set, it has three possible values (climb, cruise and descent) to determine which

Department of Control and Instrumentation Faculty of Electrical Engineering and Communication
Brno University of Technology
37
flight phase is aircraft currently flying. Approach, go-around and take-off flight
phases are not included, because work load on pilot is high and he can be
distracted only with serious warnings.
Each flight phase has different maximum trajectory deviation, which can
be considered as normal. At cruise phase this deviation is minimal, at descent and
climb is higher.
• wind speed:
This input variable is simply wind speed around aircraft. Units are meters
per second (ms-1). Lower limit is 0 ms-1 and upper limit is sufficiently high (at
cruise altitude wind speed up to 100 ms-1). Input is wind speed from HSS buses
and it is mapped onto three input membership functions to determine the resultant
truth value for each membership function. There are labelled L (for low), M (for
medium) and H (for high). Their shapes are trapezoidal membership functions
shown on Figure 5-5.
Figure 5-5: Wind speed fuzzy set
For aircraft guidance systems is easier to compensate lower wind speed
than higher. Modern aircrafts can hold desired trajectory even if wind magnitude
is very high. Wind speed itself does not cause any trajectory deviations if other
variables remain in normal range.

Department of Control and Instrumentation Faculty of Electrical Engineering and Communication
Brno University of Technology
38
• wind direction change:
This input variable evaluates change of wind in 3 seconds time span. Units
are degrees.
It is vital to choose appropriate time interval, short will be cause higher
sensitivity than needed, too long will cause exact opposite. It is mapped onto three
input membership functions to determine the resultant truth value for each
membership function. There are labelled L (for low), M (for medium) and H (for
high). Their shapes are trapezoidal membership functions shown on Figure 5-6.
Figure 5-6: Wind direction change fuzzy set
Wind bearing changes are common, but their rate greatly influences
trajectory deviation. Aircraft can deal with low changes easily even during strong
winds, but high change of wind bearing can cause noticeable trajectory deviation
even when wind speed does not exceed 25 ms-1.
For this application wind direction itself is unimportant. Constant wind
bearing does not influence guidance system, but its quick changes do so.
• cross track error:
This variable is distance from desired trajectory. Approximate value and
direction of deviation (left or right to flight trajectory) always appears on
Navigation Display, when it exceeds 0,1 km. Units are kilometres (km).
It is mapped onto five input membership functions to determine the
resultant truth value for each membership function. There are labelled VL (for

Department of Control and Instrumentation Faculty of Electrical Engineering and Communication
Brno University of Technology
39
very low), L (for very low), M (for medium), H (for high) and VH (for very high).
Their shapes are trapezoidal membership functions shown on Figure 5-7.
Range is not divided symmetrically because lower deviations (less than 0.7
km) are more common and it is important to distinguish more states. Each flight
phase has its normal trajectory deviation. At cruise it is 0.09 km, at descent it is
0.2 km and during climb it rises up to 1 km – if other conditions are normal.
Figure 5-7: Cross track error fuzzy set
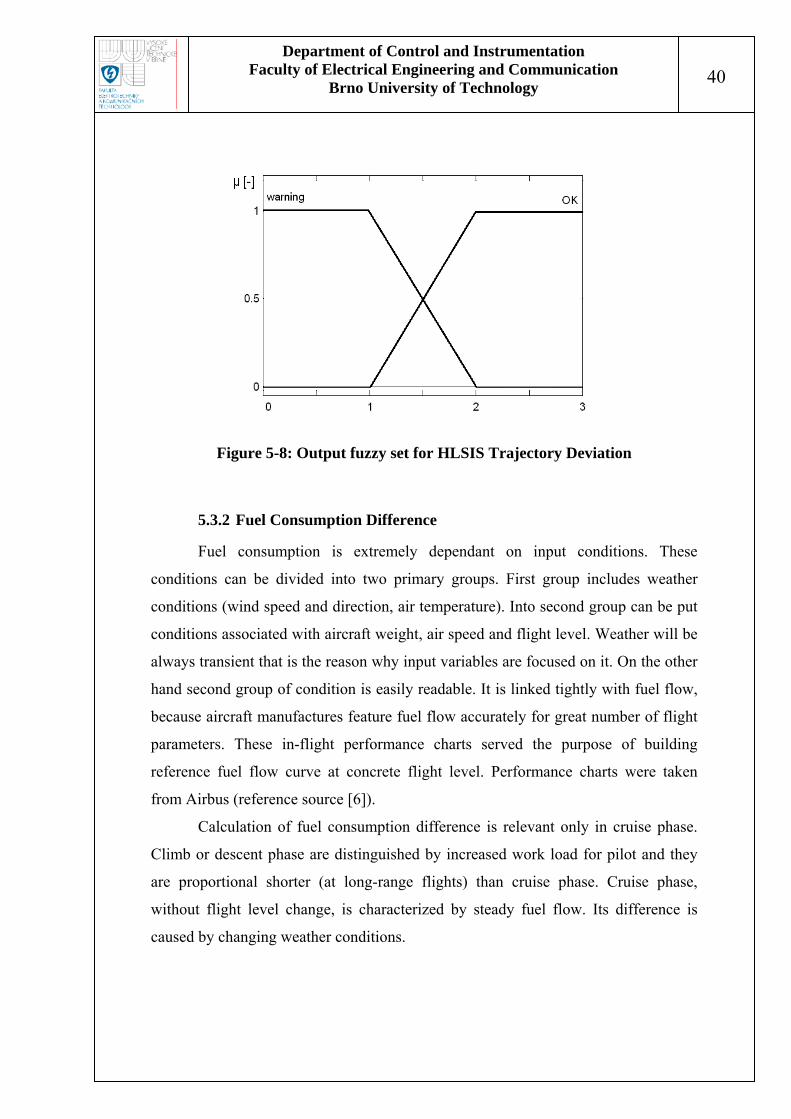
• output:
Output variable has two membership functions (see Figure 5-8),
representing two states with shape of Γ-function (for warning) and L-function (for
OK). OK state means that all monitored input variables imply correct aircraft
behaviour. Warning means exact opposite.
Department of Control and Instrumentation Faculty of Electrical Engineering and Communication
Brno University of Technology
40
Figure 5-8: Output fuzzy set for HLSIS Trajectory Deviation
5.3.2 Fuel Consumption Difference
Fuel consumption is extremely dependant on input conditions. These
conditions can be divided into two primary groups. First group includes weather
conditions (wind speed and direction, air temperature). Into second group can be put
conditions associated with aircraft weight, air speed and flight level. Weather will be
always transient that is the reason why input variables are focused on it. On the other
hand second group of condition is easily readable. It is linked tightly with fuel flow,
because aircraft manufactures feature fuel flow accurately for great number of flight
parameters. These in-flight performance charts served the purpose of building
reference fuel flow curve at concrete flight level. Performance charts were taken
from Airbus (reference source [6]).
Calculation of fuel consumption difference is relevant only in cruise phase.
Climb or descent phase are distinguished by increased work load for pilot and they
are proportional shorter (at long-range flights) than cruise phase. Cruise phase,
without flight level change, is characterized by steady fuel flow. Its difference is
caused by changing weather conditions.

Department of Control and Instrumentation Faculty of Electrical Engineering and Communication
Brno University of Technology
41
This fuzzy system has four inputs (wind speed, wind direction, air
temperature and fuel flow difference) and one output variable. This application
evaluates inputs from aspect of fuel consumption.
• wind speed:
This input variable is simply wind speed around aircraft. Units are meters
per second (ms-1). Lower limit is 0 ms-1 and upper limit is sufficiently high (at
cruise altitude wind speed about 100 ms-1). Input is wind speed from HSS buses
and it is mapped onto three input membership functions. There are labelled L (for
low), M (for medium) and H (for high). Their shapes are trapezoidal membership
functions shown on Figure 5-9. Everything above 50 ms-1 is defined as high speed
wind.
Figure 5-9: Wind speed fuzzy set
Wind speed greatly influences fuel consumption. Higher speed means
higher impact to fuel.
• wind direction:
This input variable is wind direction relatively to aircraft bearing. Wind
direction from FMS or buses has 360o range and its output is absolute wind
Department of Control and Instrumentation Faculty of Electrical Engineering and Communication
Brno University of Technology
42
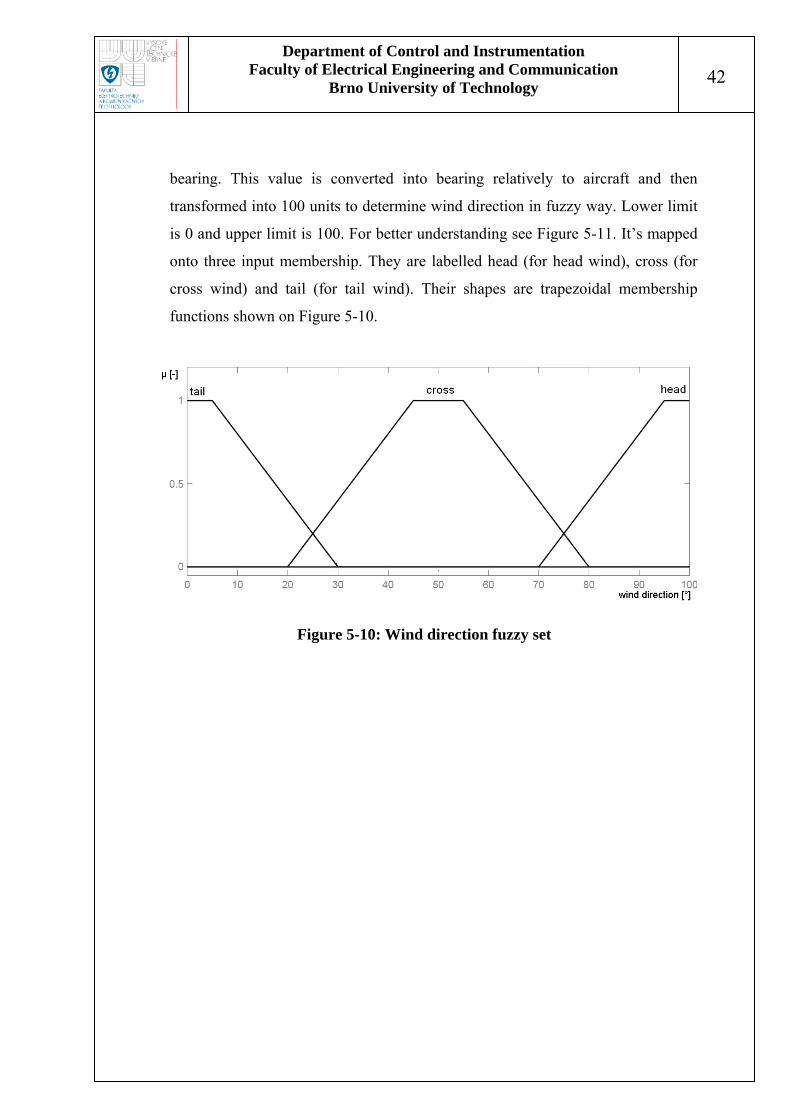
bearing. This value is converted into bearing relatively to aircraft and then
transformed into 100 units to determine wind direction in fuzzy way. Lower limit
is 0 and upper limit is 100. For better understanding see Figure 5-11. It’s mapped
onto three input membership. They are labelled head (for head wind), cross (for
cross wind) and tail (for tail wind). Their shapes are trapezoidal membership
functions shown on Figure 5-10.
Figure 5-10: Wind direction fuzzy set
Department of Control and Instrumentation Faculty of Electrical Engineering and Communication
Brno University of Technology
43
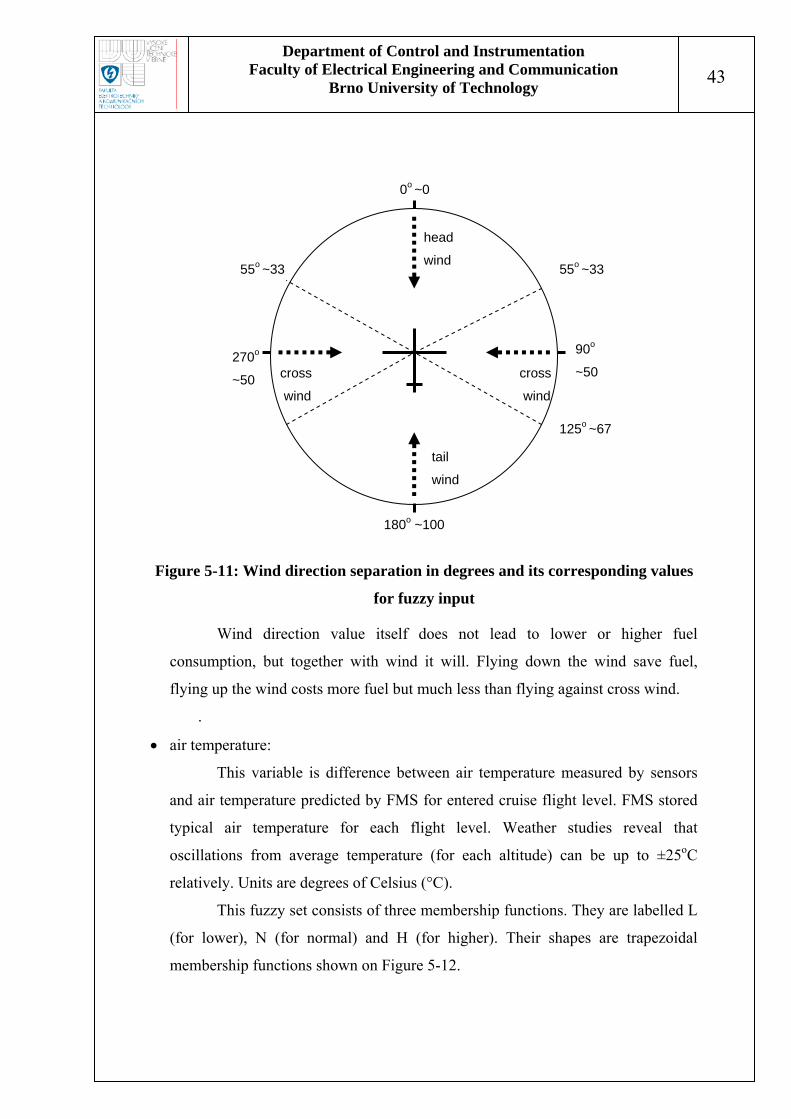
Figure 5-11: Wind direction separation in degrees and its corresponding values
for fuzzy input
Wind direction value itself does not lead to lower or higher fuel
consumption, but together with wind it will. Flying down the wind save fuel,
flying up the wind costs more fuel but much less than flying against cross wind.
.
• air temperature:
This variable is difference between air temperature measured by sensors
and air temperature predicted by FMS for entered cruise flight level. FMS stored
typical air temperature for each flight level. Weather studies reveal that
oscillations from average temperature (for each altitude) can be up to ±25oC
relatively. Units are degrees of Celsius (°C).
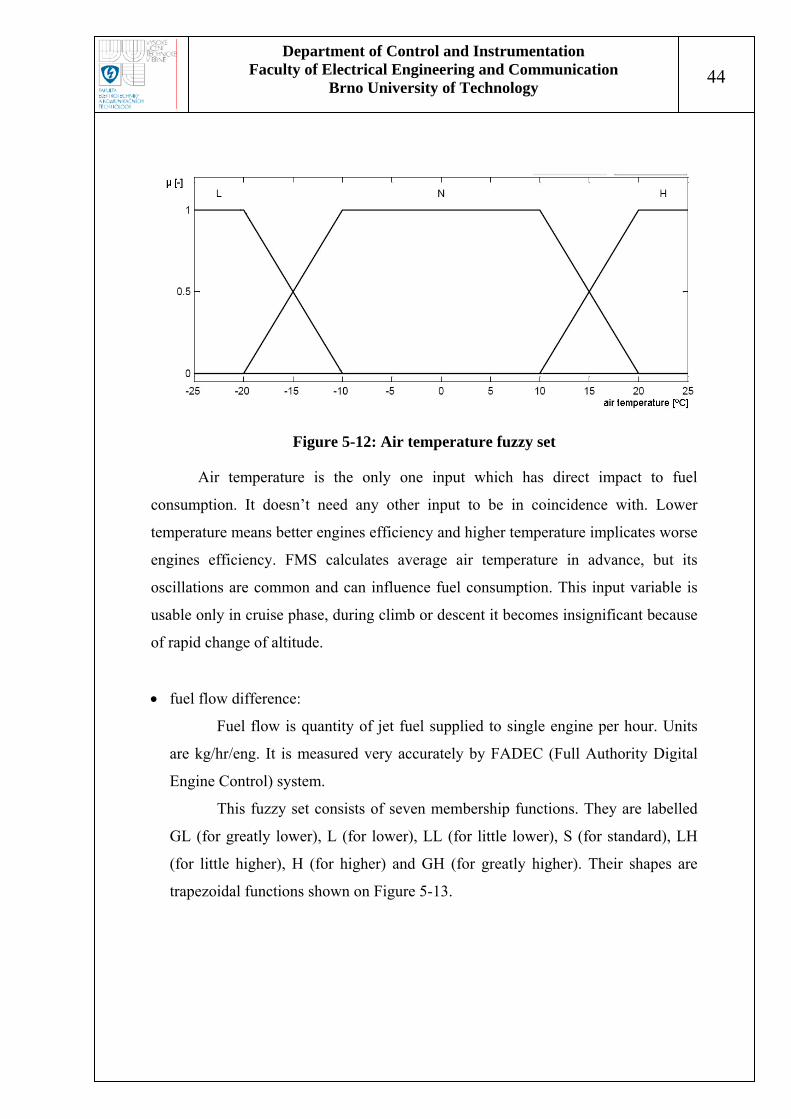
This fuzzy set consists of three membership functions. They are labelled L
(for lower), N (for normal) and H (for higher). Their shapes are trapezoidal
membership functions shown on Figure 5-12.
tail
wind
head
wind
cross
wind
cross
wind
180o ~100
90o
~50 270o
~50
0o ~0
55o ~33 55o ~33
125o ~67
Department of Control and Instrumentation Faculty of Electrical Engineering and Communication
Brno University of Technology
44
Figure 5-12: Air temperature fuzzy set
Air temperature is the only one input which has direct impact to fuel
consumption. It doesn’t need any other input to be in coincidence with. Lower
temperature means better engines efficiency and higher temperature implicates worse
engines efficiency. FMS calculates average air temperature in advance, but its
oscillations are common and can influence fuel consumption. This input variable is
usable only in cruise phase, during climb or descent it becomes insignificant because
of rapid change of altitude.
• fuel flow difference:
Fuel flow is quantity of jet fuel supplied to single engine per hour. Units
are kg/hr/eng. It is measured very accurately by FADEC (Full Authority Digital
Engine Control) system.
This fuzzy set consists of seven membership functions. They are labelled
GL (for greatly lower), L (for lower), LL (for little lower), S (for standard), LH
(for little higher), H (for higher) and GH (for greatly higher). Their shapes are
trapezoidal functions shown on Figure 5-13.

Department of Control and Instrumentation Faculty of Electrical Engineering and Communication
Brno University of Technology
45
Figure 5-13: Fuel flow difference
Reference fuel flow was taken from Airbus performance charts [6]. Reference
fuel flow depends for aircraft total weight, air speed, centre of gravity and flight
level. For test application was chosen flight level 306, air speed 0.78 Mach, centre of
gravity 33%. This simplification allows finding regression equation of fuel flow and
total weight dependency.
• output:
Output variable has three membership functions, representing three states
with shape of Γ-function (for warning (lower)), triangular membership function
(for OK) and L-function (for warning (higher)). OK state means that all entered
input variables imply correct fuel prediction. Warning (lower) means that current
fuel flow is lower than it should. Warning (higher) implies that fuel flow is higher
than it should be at input conditions.

Department of Control and Instrumentation Faculty of Electrical Engineering and Communication
Brno University of Technology
46
Figure 5-14: Output fuzzy set for HLSIS FCD
5.4 DEVELOPMENT TOOLS AND IMPLEMENTATION
This chapter obtains overview about tools used for test application
development.
Development was gradational as you can see on Figure 5-15.
Figure 5-15: Application implementation

Department of Control and Instrumentation Faculty of Electrical Engineering and Communication
Brno University of Technology
47
5.4.1 Matlab application
Applications, for both mentioned complex situations, were made in Matlab
using Fuzzy Toolbox. This tool provides fast development of fuzzy system, it was
shortest way how to verify idea of using fuzzy system.
All membership functions were at the beginning of fuzzy system design set as
Gauss functions – see Figure 5-16.
Figure 5-16: Wind direction fuzzy set – Gauss function
For future implementation is Gauss function too computational demanding
Computing capacity in aircraft avionics is low and requirements of all running
systems must be limited. In fact to decide right degree of membership of inputs is
Gauss function unnecessary and it was replaced by trapezoidal function as shown in
example on Figure 5-17.

Department of Control and Instrumentation Faculty of Electrical Engineering and Communication
Brno University of Technology
48
Figure 5-17: Wind direction fuzzy set – trapezoidal function
Rules were inserted by Rules Editor using language variables. Quantity of
rules depends on number of inputs (and membership functions). Trajectory deviation
fuzzy system has 380 rules and Fuel consumption difference has 189 rules. Rules are
represented by conditions with language variables.
Fuzzy rule example for Trajectory Deviation: if(flight phase=CRZ) and
if(wind dir. change=medium) and if(wind speed=high) and if(deviation=high) then
(output=warning).
Number of rules is sufficient for this part of project and it can be raised in
future.
Fuzzy system was connected with GUI for easy input of data sets. Interface
for Trajectory deviation situation is shown on Figure 5-18, GUI for Fuel
consumption difference is shown on Figure 5-19. For matrix based data input was
created m-file, where trends of inputs and output are shown in graphical way.

Department of Control and Instrumentation Faculty of Electrical Engineering and Communication
Brno University of Technology
49
Figure 5-18: Fuzzy system GUI in Matlab – Trajectory deviation
Figure 5-19: Fuzzy system GUI in Matlab – Fuel prediction difference
Decision trees (see Appendix A) were used for basic tests to discover
wrongly entered fuzzy rules. It also allow expert to check rules setting.
Applications were tested with data from HSS and with simulated data sets,
which examined different progress of inputs. All tests proved that fuzzy system is
good choice and project can proceed to other phase.
5.4.2 C language application
From beginning Matlab was used only for evaluation of chosen concept,
future progress needs to be based on simple programming language without any

Department of Control and Instrumentation Faculty of Electrical Engineering and Communication
Brno University of Technology
50
enhanced tools (e.g. Matlab Fuzzy Toolbox). This step can be understood as
realization of primary idea under industrial programming language.
Both fuzzy test applications were programmed in C language with simple
user interface (console application appearance), because it is only interstage in this
project leading to different programming language.
Defuzzification was implemented on the basis of Centre Average Method
(see chapter 5.1). It brings only small computational demands, which cannot be
problem in future HSS implementation. It gives option to tune output sensitivity
level, which is convenient and it will be added to project.
Application can be implemented into HSS using two ways. HSS contains SUI
(Script User Interface) interface window with script language SSL (Super Script
Language). Its output can be text only without access graphical parts of HSS (e.g.
MCDU).
At this point the fundamental decision was made to choose SSL path of
project completion.
5.4.3 Super Script Language Application
Development of SSL based application is final step in project progress. It
brought proof of concept in semi-realistic environment – HSS. Both SSL
applications were used for final evaluation.
SSL is industrial programming language used in HSS. Variables and
functions declarations and definitions are different from C language, extensive code
makeover was needed, but fundamentals of code structure were preserved. C
language application (previous development step) speeds up the SSL application
development.
HSS environment contains SSL window (SUI) for research and development
use. Typical tasks are parameters setting for simulations, applications debugging and
data logging. SSL application of this size and complexity is exceptional for HSS
usage.
Main modification, in comparison with Matlab or C language test
applications, is running in infinite loop. For evaluation reason 20 seconds loop was

Department of Control and Instrumentation Faculty of Electrical Engineering and Communication
Brno University of Technology
51
chosen. This time window allows sufficient period for inputs reading, fuzzification,
inference mechanism, defuzzification and comfortable reading from SUI window.
The shortest possible period is estimated in units of seconds. Computation itself is
faster, but text output costs extra time – it is dependant on rows count. In eventual
case of future pre-prototyping in FMS, this restriction will lose its significance,
because text output to MCDU will not take much time and it is assumed that text
message will appear only in case of warning state.
After successful completion of SSL application, it was decided by Honeywell
supervisor to terminate this project (see Figure 5-15). Additional development will
definitely bring extensive amount of time and afford, which is beyond diploma thesis
possibilities. Nevertheless this stage (of SSL application) validated this project and
met the requirements for eventual future development.
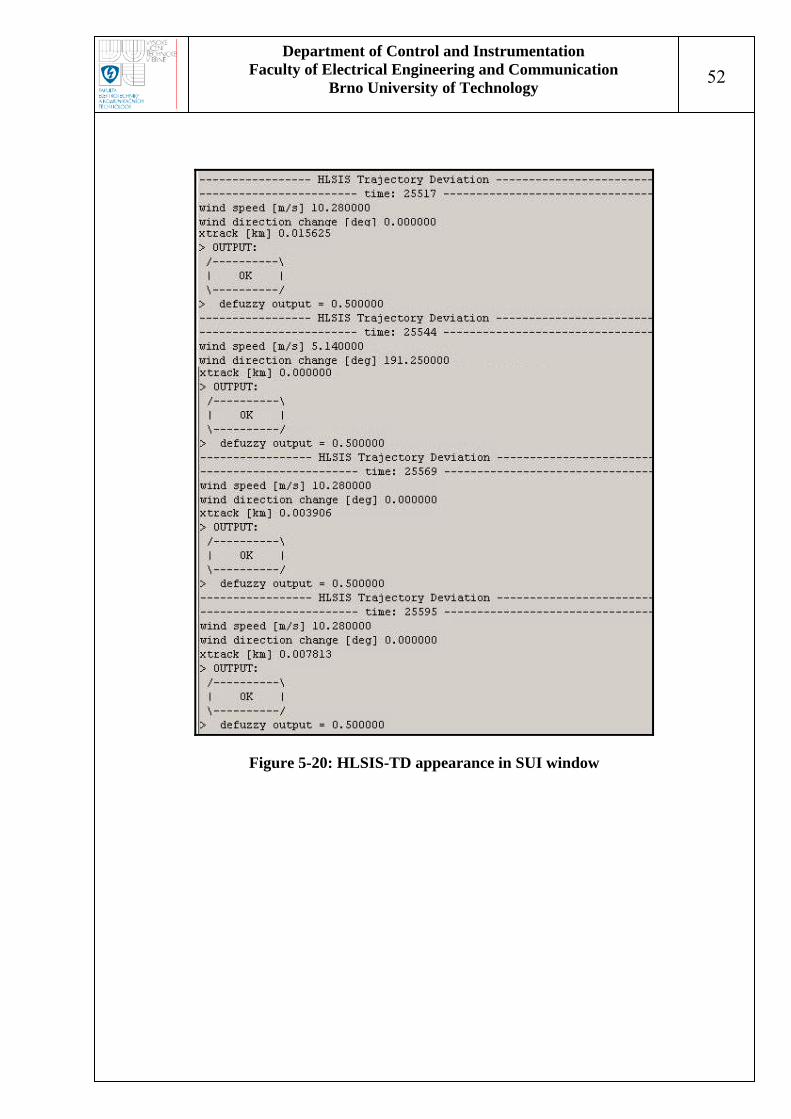
Example of application appearance in SUI window is visualized on Figure
5-20.
Department of Control and Instrumentation Faculty of Electrical Engineering and Communication
Brno University of Technology
52
Figure 5-20: HLSIS-TD appearance in SUI window

Department of Control and Instrumentation Faculty of Electrical Engineering and Communication
Brno University of Technology
53
6. TEST OF COMPLEX SITUATION ANALYSIS
This chapter will discuss behaviour of both applications during tests in semi-
realistic environment of HSS separately. Results are described in this chapter as well.
6.1 HLSIS TRAJECTORY DEVIATION
Input variables for this complex situation were described in detail in chapter
5.3.1.
This application is active from climb phase (after take-off phase) until descent
phase. It is switched off at the beginning of approach phase, because of increased
workload on pilot, same reason is to start HLSIS-TD (High Level Support
Information System – Trajectory Deviation) from climb phase and not from take-off.
Primary evaluated parameter is cross track error - distance from desired
trajectory. It is matter of course that in some contrary conditions cross track error can
rise up and it still will not mean any abnormality. HLSIS-TD catches situations,
when cross track error value is high without any reason.
Important condition for HLSIS-TD work is active flight plan in FMS, because
cross track error is measured from flight plan trajectory.
HLSIS-TD was tested during short and long flights in HSS simulator. Normal
flight progress does not generally bring abnormal situation, when aircraft’s cross
track error raises rapidly or remains high.
Suitable for HLSIS-TD analysis were composition of two scenarios - short
and long simulated flights. First scenario with five short flights was chosen for tests
in climb and descent phase. Second scenario with five long flights was included for
cruise tests. In each flight were simulated ten trajectory deviation complex situations,
results are described in Table 6-1.
For climb and descent phase are typical short flight plan legs (straight part of
trajectory) with common high bearing changes. In cruise phase are legs incomparable
longer with minimum bearing changes.

Department of Control and Instrumentation Faculty of Electrical Engineering and Communication
Brno University of Technology
54
Wind speed and bearing were changed in both scenarios. First test set were
focused to simulate normal weather (wind) conditions. In second test set, conditions
were changed to induce very rare, but possible wind behavior (e.g. crosswinds).
To simulate rapid cross track error increase, aircraft was deviated from its
trajectory by flight stick handling with auto pilot switched off (then switched on
again).
system output
presumed output OK warning
OK 100 0
warning 0 100
Table 6-1: HLSIS-TD test results
In all performed complex situations were analyzed correctly without any
mistakes. For final sensitivity debugging can be output thresholds (between warning
(lower), OK and warning (higher) states) changed.
6.2 HLSIS FUEL CONSUMPTION DIFFERENCE
Input variables for this complex situation were described in detail in chapter
5.3.2.
This HLSIS-FCD (High Level Support Information System – Fuel
Consumption Difference) is active only in cruise phase, because sufficient reference
performance data were available only for this phase.
Primary evaluated parameter is fuel flow – current value of fuel consumed
per hour per engine [kg/hr/eng]. It is matter of course that in some contrary
conditions fuel flow can rise up and it still will not mean any abnormality. HLSIS-
FCD catches situations, when fuel flow level is high without any reason.
For tests were chosen ten long cruise flights. As reference flight level was
chosen FL 306 to represent commonly used altitude. Each flight contained ten fuel
consumption difference complex situations, which were evaluated by HLSIS-FCD –
see results in Table 6-2.

Department of Control and Instrumentation Faculty of Electrical Engineering and Communication
Brno University of Technology
55
Weather conditions were changed to test correct output state. The greatest
impact on fuel flow has wind speed together with wind bearing. This can influence
fuel flow greatly.
Conditions without significant wind speed offer overview on precision of
implemented fuel consumption model of Airbus A320. Fuel flow values from HSS
were compared with official values from Airbus. Difference was significant and for
tested FL 306 reached 200 kg/hr/eng. This difference was set as offset to continue in
tests without this error.
system output
presumed output
warning
(lower) OK
warning
(higher)
warning (lower) 100 0 0
OK 0 100 0
warning (higher) 0 0 100
Table 6-2: HLSIS-FCD test results
All passed test had shown, that HLSIS-FCD is working correctly. For final
sensitivity debugging can be output thresholds (between OK and warning states)
changed.
6.3 TEST RESULTS
Excellent (100%) successfulness is reflecting only transformation of my
expert knowledge into mathematical model. Both complex situations were defined on
the basis of my knowledge gained from simulated flights (can be understood as
training data). Model was made from this data and applied on testing data (test
flights), evaluated by developed fuzzy system and checked by me. Determine which
situation is all right and which is abnormal is matter of expert decision. Model has
expert knowledge database on the level of my knowledge and from this point of view
it is working correctly.
Model precision in complex situation evaluation can be increased by
consulting with aerospace experts – aircraft engineers and pilots.

Department of Control and Instrumentation Faculty of Electrical Engineering and Communication
Brno University of Technology
56
7. CONCLUSION
Experience gained during many simulated flights helped to form basic
knowledge base for application development.
Application is based on fuzzy system that can assure determinism needed in
aerospace industry. Decision trees construction affords opportunity to check the
variables bindings before forming of fuzzy rules. Expert knowledge was gained by
simulation flights monitoring and represented by fuzzy rules. Two complex
situations were well described by decision trees and converted into fuzzy system
rules. Membership functions are trapezoidal instead of Gauss functions, because of
lower computational requirements and still sufficient accuracy. From the same
reason was chosen defuzzification method Centre of Average, instead of more
demanding Centre of Gravity.
Final application, called HLSIS (High Level Support Information System), is
programmed in SSL (Super Script Language) and runs in HSS (Host-based
Simulation System) debug environment. Performed tests proved that it can
effectively evaluate chosen complex situations in real-time use. Application is
sufficiently flexible for more complex situations additions, future modifications or
upgrades (e.g. consultations with experts).
This diploma thesis has proven the concept of fuzzy system usage in this task.
Diploma thesis was presented on Student EEICT competition and it won 1st
place in category Cybernetics and Automation.

Department of Control and Instrumentation Faculty of Electrical Engineering and Communication
Brno University of Technology
57
References:
[1] Composite authors A330 & A340 Flight Crew Training Manual, 2007
[2] Composite authors Flight Management System, Pilot’s Guide, Airbus A330/340,
2006
[3] ŠMEJKAL, L. PLC a automatizace. 2. díl, Sekvenční logické systémy a základy
fuzzy logiky, 2003
[4] JURA, P. Základy fuzzy logiky a modelování, 2002
[5] JAGER, R. Fuzzy logic in control, 1995
[6] Composite authors A318/A319/A320/A321 Flight Crew Operating Manual
Flight Operations, 2005
[7] online source: Wikipedia
[8] JIRSÍK, V. electronical support for subject BMPA
[9] online source: Jerome Meriweather aircraft’s decks (www.meriweather.com)

Department of Control and Instrumentation Faculty of Electrical Engineering and Communication
Brno University of Technology
58
Acronyms and abbreviations:
ACARS - aircraft communication addressing and reporting system.
AFS – auto flight system
AGL - above ground level
ALT – altitude
AP - autopilot
ATC – air traffic control
CLB – climb
ECAM - electronic centralized aircraft monitor
ECON - speed computed by the system based on the cost index and aerodynamic
model
FCU – flight control unit
FMGEC - flight management guidance and envelope computers
FMS – flight management system
FPA - flight path angle
F-PLN – flight plan
FRC - Federal Radio Commission
GPS – global positioning system
HDG – heading
HLSIS – High Level Support Information System
HLSIS-TD – High Level Support Information System - Trajectory Deviation
HLSIS-FCD – High Level Support Information System - Fuel Consumption
Difference
HMI – human-machine interface
HSS - host based simulation system
ILS – instrument landing system
IRS – inertial reference system
LVR – lever
MCDU - multifunction control display unit
OP CLB - open climb
PERF – performance

Department of Control and Instrumentation Faculty of Electrical Engineering and Communication
Brno University of Technology
59
PFD - primary flight display
SSL - super script language
SPD – speed
STAR - standard terminal arrival route
SUI - script user interface
T/C - top of climb
T/D - top of descent
TOGA – takeoff and go around
V/S - vertical speed

Department of Control and Instrumentation Faculty of Electrical Engineering and Communication
Brno University of Technology
60
APPENDIX A
A.1 FUEL CONSUMPTION DIFFERENCE DECISION TREE
Complete decision tree for Fuel Consumption Difference fuzzy system.
Following tree is just starting part; numbers will lead you to linked parts of tree.
Values underneath some boxes indicate value where concrete membership function
has its maximum.
This visualization is for rules check and verification; all variables have fuzzy
logic nature - described in detail in chapter 5 (System algorithm).

Department of Control and Instrumentation Faculty of Electrical Engineering and Communication
Brno University of Technology
61

Department of Control and Instrumentation Faculty of Electrical Engineering and Communication
Brno University of Technology
62

Department of Control and Instrumentation Faculty of Electrical Engineering and Communication
Brno University of Technology
63

Department of Control and Instrumentation Faculty of Electrical Engineering and Communication
Brno University of Technology
64

Department of Control and Instrumentation Faculty of Electrical Engineering and Communication
Brno University of Technology
65

Department of Control and Instrumentation Faculty of Electrical Engineering and Communication
Brno University of Technology
66

Department of Control and Instrumentation Faculty of Electrical Engineering and Communication
Brno University of Technology
67

Department of Control and Instrumentation Faculty of Electrical Engineering and Communication
Brno University of Technology
68

Department of Control and Instrumentation Faculty of Electrical Engineering and Communication
Brno University of Technology
69

Department of Control and Instrumentation Faculty of Electrical Engineering and Communication
Brno University of Technology
70
A.2 TRAJECTORY DEVIATION DECISION TREE
Complete decision tree for Trajectory Deviation fuzzy system. Following
tree is just starting part; letters will lead you to linked parts of tree. Values
underneath some boxes indicate value where concrete membership function has its
maximum.
This visualization is for rules check and verification; all variables have fuzzy
logic nature - described in detail in chapter 5 (System algorithm).

Department of Control and Instrumentation Faculty of Electrical Engineering and Communication
Brno University of Technology
71

Department of Control and Instrumentation Faculty of Electrical Engineering and Communication
Brno University of Technology
72

Department of Control and Instrumentation Faculty of Electrical Engineering and Communication
Brno University of Technology
73

Department of Control and Instrumentation Faculty of Electrical Engineering and Communication
Brno University of Technology
74

Department of Control and Instrumentation Faculty of Electrical Engineering and Communication
Brno University of Technology
75

Department of Control and Instrumentation Faculty of Electrical Engineering and Communication
Brno University of Technology
76

Department of Control and Instrumentation Faculty of Electrical Engineering and Communication
Brno University of Technology
77

Department of Control and Instrumentation Faculty of Electrical Engineering and Communication
Brno University of Technology
78

Department of Control and Instrumentation Faculty of Electrical Engineering and Communication
Brno University of Technology
79

Department of Control and Instrumentation Faculty of Electrical Engineering and Communication
Brno University of Technology
80


![Simulations [& games] help students understand complex ideas/concepts while allowing practice of real-life situations (Aldrich, 2005). Game-based formats.](https://static.fdocuments.us/doc/165x107/56649e7a5503460f94b7a7d0/-simulations-games-help-students-understand-complex-ideasconcepts-while.jpg)