Evaluation Of Aeration Outline Control - WordPress.com · Evaluation Of Aeration Control PNCWA...
13
1 Evaluation Of Aeration Control PNCWA ANNUAL CONFERENCE 2004 Randal Samstag - Carollo Engineers Carol Nelson and Curtis Steinke – King County DNRP 2 Pncwa2004Samstag.ppt Outline • Introduction • Aeration control – Why is it important? • Control system levels and strategies • South Plant testing and modeling Aeration Control - Simplified Process Diagram 4 Pncwa2004Samstag.ppt Why is Aeration Control Important? • High operating cost • Crucial to the process
Transcript of Evaluation Of Aeration Outline Control - WordPress.com · Evaluation Of Aeration Control PNCWA...
1
Evaluation Of Aeration
Control
PNCWA ANNUAL CONFERENCE 2004
Randal Samstag - Carollo EngineersCarol Nelson and Curtis Steinke – King County DNRP
2Pncwa2004Samstag.ppt
Outline
• Introduction
• Aeration control – Why is it important?
• Control system levels and strategies
• South Plant testing and modeling
Aeration Control - Simplified ProcessDiagram
4Pncwa2004Samstag.ppt
Why is Aeration Control Important?
• High operating cost
• Crucial to the process
2
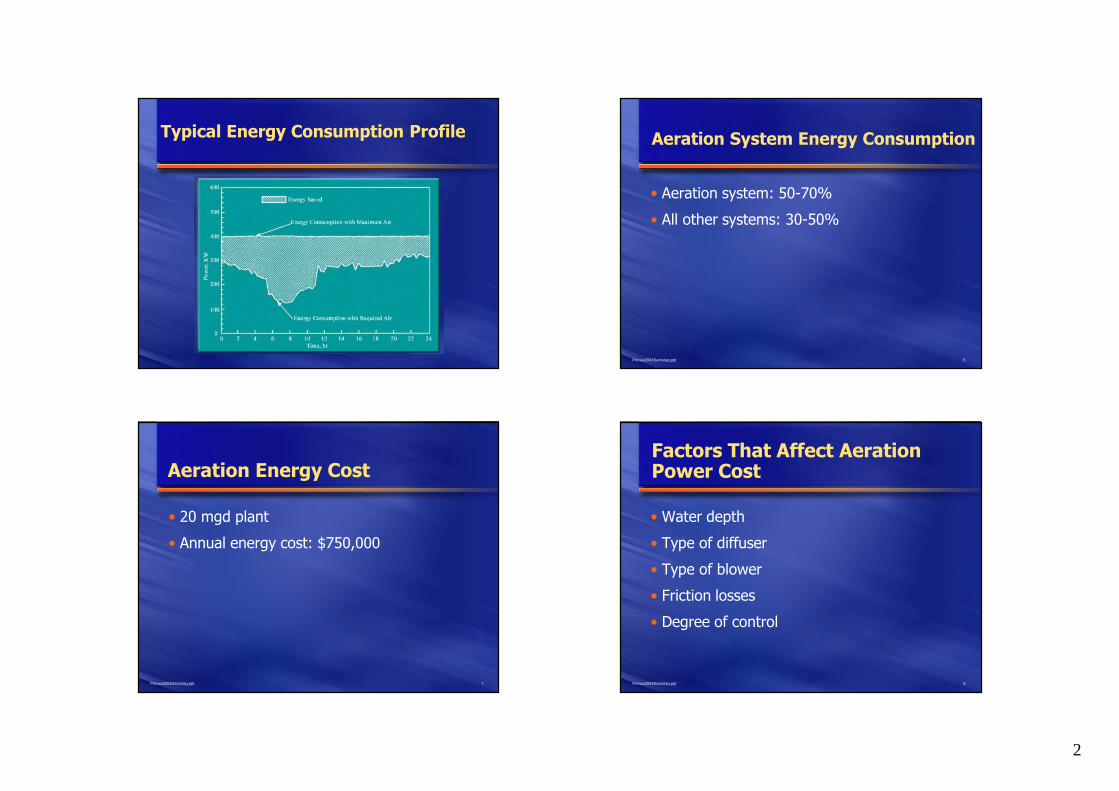
Typical Energy Consumption Profile
6Pncwa2004Samstag.ppt
Aeration System Energy Consumption
• Aeration system: 50-70%
• All other systems: 30-50%
7Pncwa2004Samstag.ppt
Aeration Energy Cost
• 20 mgd plant
• Annual energy cost: $750,000
8Pncwa2004Samstag.ppt
Factors That Affect AerationPower Cost
• Water depth
• Type of diffuser
• Type of blower
• Friction losses
• Degree of control
3
9Pncwa2004Samstag.ppt
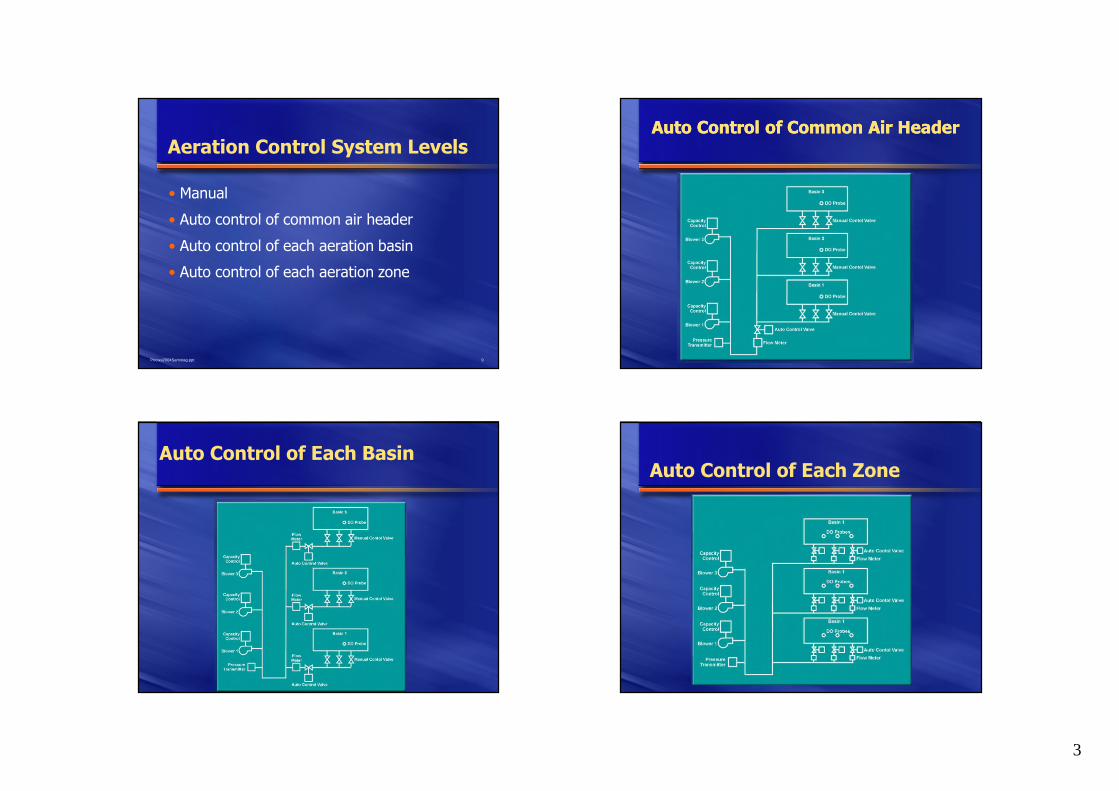
Aeration Control System Levels
• Manual
• Auto control of common air header
• Auto control of each aeration basin
• Auto control of each aeration zone
Auto Control of Common Air HeaderAuto Control of Common Air Header
Auto Control of Each BasinAuto Control of Each Zone
4
13Pncwa2004Samstag.ppt
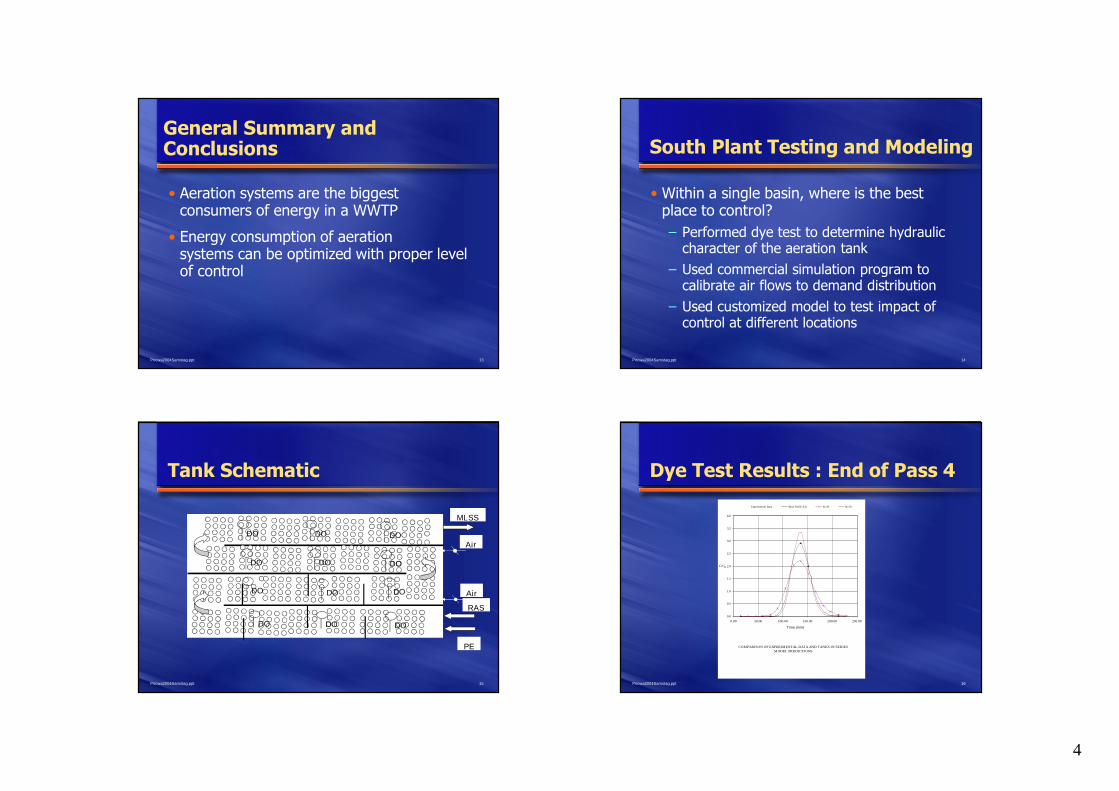
General Summary andConclusions
• Aeration systems are the biggestconsumers of energy in a WWTP
• Energy consumption of aerationsystems can be optimized with proper levelof control
14Pncwa2004Samstag.ppt
South Plant Testing and Modeling
• Within a single basin, where is the bestplace to control?
– Performed dye test to determine hydrauliccharacter of the aeration tank
– Used commercial simulation program tocalibrate air flows to demand distribution
– Used customized model to test impact ofcontrol at different locations
15Pncwa2004Samstag.ppt
Tank Schematic
MLSS
PE
RAS
Air
AirDO
DO DO DO
DO
DO
DO DO DO
DO
DO
DO
16Pncwa2004Samstag.ppt
Dye Test Results : End of Pass 4
COMPARISON OF EXPERIMENTAL DATA AND TANKS IN SERIES
MODEL PREDICTIONS
0.0
0.5
1.0
1.5
2.0
2.5
3.0
3.5
4.0
0.00 50.00 100.00 150.00 200.00 250.00
Time (min)
C/C
Experimental Data Best Fit (N=53) N=30 N=70
5
17Pncwa2004Samstag.ppt
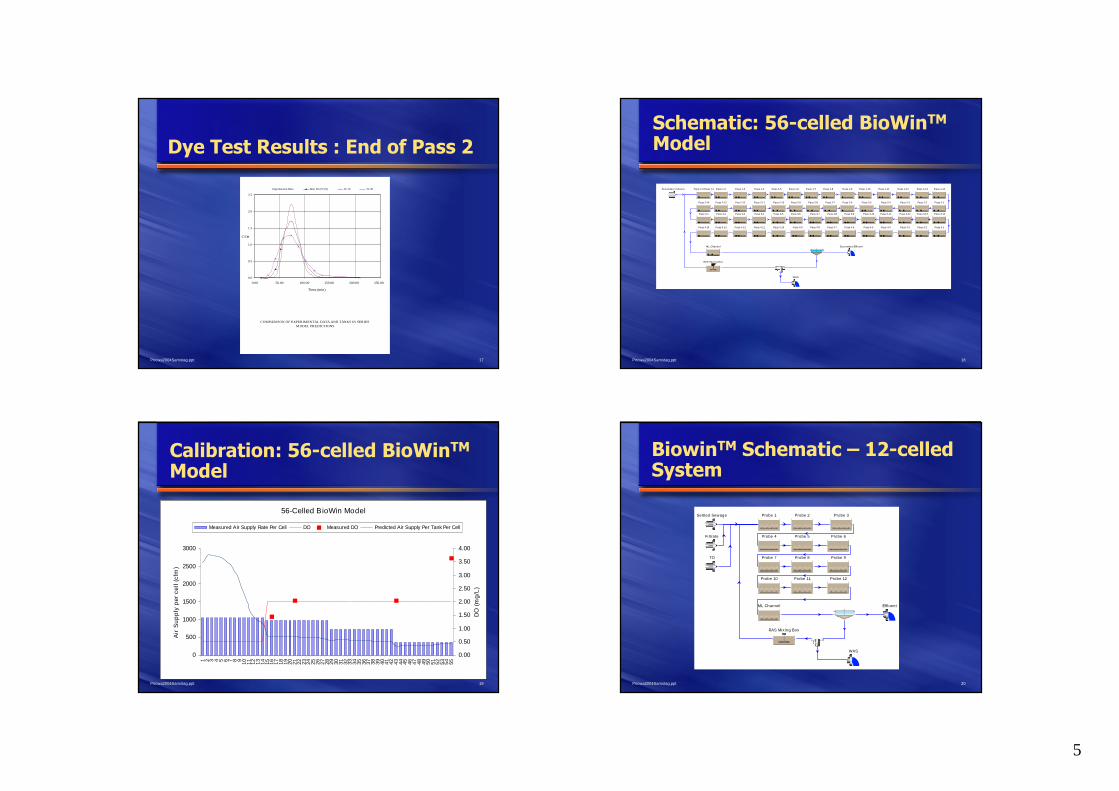
Dye Test Results : End of Pass 2
COMPARISON OF EXPERIMENTAL DATA AND TANKS IN SERIES
MODEL PREDICTIONS
0.0
0.5
1.0
1.5
2.0
2.5
0.00 50.00 100.00 150.00 200.00 250.00
Time (min)
C/C
Experimental Data Best Fit (N=18) N=10 N=30
18Pncwa2004Samstag.ppt
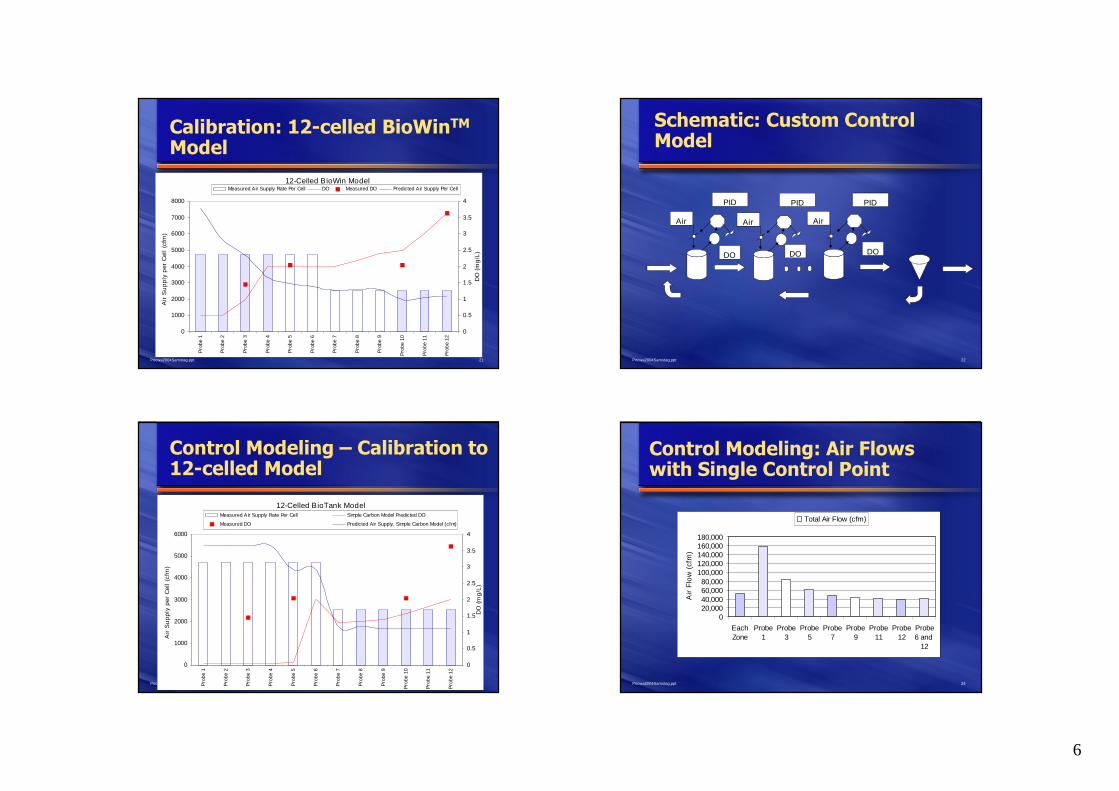
Schematic: 56-celled BioWinTM
Model
Secondary Influent Tank 2-4 Pass 1-1
Pass 2-14
Pass 3-1
Pass 4-14
ML Channel Secondary Effluent
RAS Mixing Box
WAS
Pass 1-2 Pass 1-3 Pass 1-4 Pass 1-5 Pass 1-6 Pass 1-7 Pass 1-8 Pass 1-9 Pass 1-10 Pass 1-11 Pass 1-12 Pass 1-13 Pass 1-14
Pass 2-1Pass 2-2Pass 2-3Pass 2-4Pass 2-5Pass 2-6Pass 2-7Pass 2-8Pass 2-9Pass 2-10Pass 2-11Pas 2-12Pass 2-13
Pass 3-2 Pass 3-3 Pass 3-4 Pass 3-5 Pass 3-6 Pass 3-7 Pass 3-8
Pass 4-13 Pass 4-12 Pass 4-11 Pass 4-10 Pass 4-9 Pass 4-8 Pass 4-7
Pass 3-9 Pass 3-10 Pass 3-11 Pass 3-12 Pass 3-13 Pass 3-14
Pass 4-6 Pass 4-5 Pass 4-4 Pass 4-3 Pass 4-2 Pass 4-1
19Pncwa2004Samstag.ppt
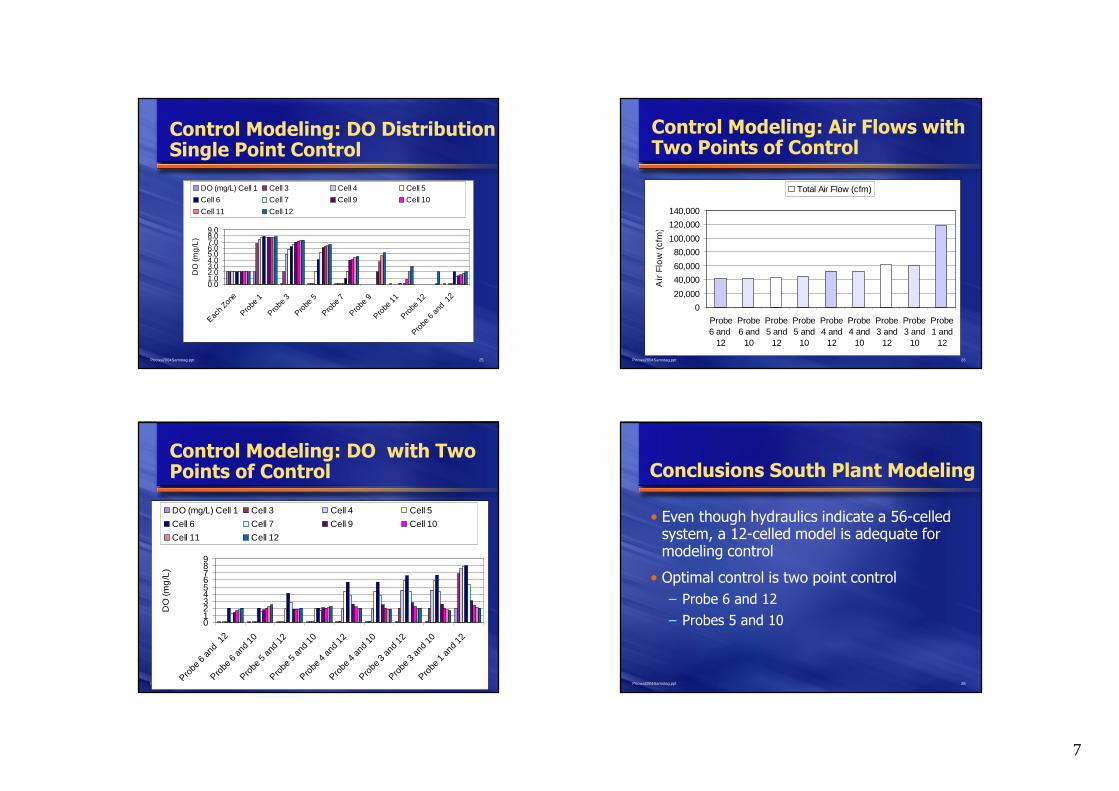
Calibration: 56-celled BioWinTM
Model
56-Celled BioWin Model
0
500
1000
1500
2000
2500
3000
1 2 3 4 5 6 7 8 910
11
12
13
14
15
16
17
18
19
20
21
22
23
24
25
26
27
28
29
30
31
32
33
34
35
36
37
38
39
40
41
42
43
44
45
46
47
48
49
50
51
52
53
54
55
Air
Su
pp
lyp
er
cell
(cfm
)
0.00
0.50
1.00
1.50
2.00
2.50
3.00
3.50
4.00
DO
(mg
/L)
Measured Air Supply Rate Per Cell DO Measured DO Predicted Air Supply Per Tank Per Cell
20Pncwa2004Samstag.ppt
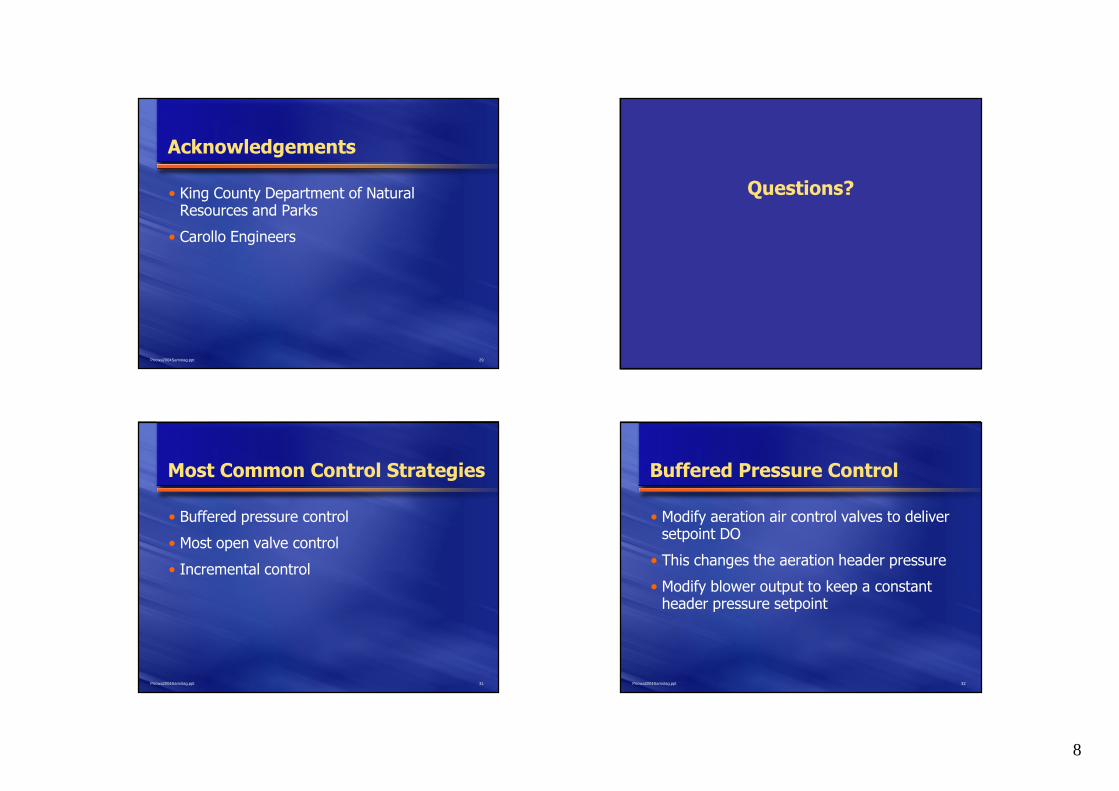
BiowinTM Schematic – 12-celledSystem
Settled Sewage Probe 1
Probe 7
Probe 10
ML Channel Effluent
RAS Mixing Box
WAS
Filtrate
TO
Probe 2 Probe 3
Probe 5 Probe 6Probe 4
Probe 8 Probe 9
Probe 11 Probe 12
6
21Pncwa2004Samstag.ppt
Calibration: 12-celled BioWinTM
Model
12-Celled BioWin Model
0
1000
2000
3000
4000
5000
6000
7000
8000P
robe
1
Pro
be
2
Pro
be
3
Pro
be
4
Pro
be
5
Pro
be
6
Pro
be
7
Pro
be
8
Pro
be
9
Pro
be
10
Pro
be
11
Pro
be
12
Air
Su
pp
lyp
er
Cell
(cfm
)
0
0.5
1
1.5
2
2.5
3
3.5
4
DO
(mg
/L)
Measured Air Supply Rate Per Cell DO Measured DO Predicted Air Supply Per Cell
22Pncwa2004Samstag.ppt
Schematic: Custom ControlModel
PID
DO
Air
PID
DO
Air
PID
DO
Air
23Pncwa2004Samstag.ppt
Control Modeling – Calibration to12-celled Model
12-Celled BioTank Model
0
1000
2000
3000
4000
5000
6000
Pro
be
1
Pro
be
2
Pro
be
3
Pro
be
4
Pro
be
5
Pro
be
6
Pro
be
7
Pro
be
8
Pro
be
9
Pro
be
10
Pro
be
11
Pro
be
12
Air
Su
pp
lyp
er
Cell
(cfm
)
0
0.5
1
1.5
2
2.5
3
3.5
4
DO
(mg
/L)
Measured Air Supply Rate Per Cell Simple Carbon Model Predicted DO
Measured DO Predicted Air Supply, Simple Carbon Model (cfm)
24Pncwa2004Samstag.ppt
Control Modeling: Air Flowswith Single Control Point
020,00040,00060,00080,000
100,000120,000140,000160,000180,000
Each
Zone
Probe
1
Probe
3
Probe
5
Probe
7
Probe
9
Probe
11
Probe
12
Probe
6 and
12
Air
Flo
w(c
fm)
Total Air Flow (cfm)
7
25Pncwa2004Samstag.ppt
Control Modeling: DO DistributionSingle Point Control
0.01.02.03.04.05.06.07.08.09.0
Each
Zone
Probe
1
Probe
3
Probe
5
Probe
7
Probe
9
Probe
11
Probe
12
Probe
6an
d12
DO
(mg
/L)
DO (mg/L) Cell 1 Cell 3 Cell 4 Cell 5
Cell 6 Cell 7 Cell 9 Cell 10
Cell 11 Cell 12
26Pncwa2004Samstag.ppt
Control Modeling: Air Flows withTwo Points of Control
0
20,000
40,000
60,000
80,000
100,000
120,000
140,000
Probe
6 and
12
Probe
6 and
10
Probe
5 and
12
Probe
5 and
10
Probe
4 and
12
Probe
4 and
10
Probe
3 and
12
Probe
3 and
10
Probe
1 and
12
Air
Flo
w(c
fm)
Total Air Flow (cfm)
27Pncwa2004Samstag.ppt
Control Modeling: DO with TwoPoints of Control
0123456789
Probe
6an
d12
Probe
6an
d10
Probe
5an
d12
Probe
5an
d10
Probe
4an
d12
Probe
4an
d10
Probe
3an
d12
Probe
3an
d10
Probe
1an
d12
DO
(mg
/L)
DO (mg/L) Cell 1 Cell 3 Cell 4 Cell 5
Cell 6 Cell 7 Cell 9 Cell 10
Cell 11 Cell 12
28Pncwa2004Samstag.ppt
Conclusions South Plant Modeling
• Even though hydraulics indicate a 56-celledsystem, a 12-celled model is adequate formodeling control
• Optimal control is two point control
– Probe 6 and 12
– Probes 5 and 10
8
29Pncwa2004Samstag.ppt
Acknowledgements
• King County Department of NaturalResources and Parks
• Carollo Engineers
Questions?
31Pncwa2004Samstag.ppt
Most Common Control Strategies
• Buffered pressure control
• Most open valve control
• Incremental control
32Pncwa2004Samstag.ppt
Buffered Pressure Control
• Modify aeration air control valves to deliversetpoint DO
• This changes the aeration header pressure
• Modify blower output to keep a constantheader pressure setpoint
9
33Pncwa2004Samstag.ppt
Most Open Valve Control
• Designed to minimize pressure losses
• Adjust control valves to maintain DOsetpoints in the tanks
• Poll the valves and adjust blower capacityto keep at least one valve in the desiredopen condition (80-95% open)
34Pncwa2004Samstag.ppt
Incremental Control
• Abandon PI and/or pressure control
• Vary airflow in increments based on stepchanges in DO
35Pncwa2004Samstag.ppt
Effect of Water Depth
• Transfer efficiency goes up with increaseddepth
• But so does blower head
• Net wire to water difference usually small
36Pncwa2004Samstag.ppt
Factors that Affect DiffuserTransfer Efficiency
• Type of diffuser
– Coarse bubble• Tray or Bubble Cap
– Fine bubble• Tube
• Disc
• Panels
• Air rate per diffuser
• Area Loading Rate
• MLSS Concentration
10
37Pncwa2004Samstag.ppt
Aeration Air System
• Air Supply System
• Air Distribution System
38Pncwa2004Samstag.ppt
Air Supply System
• Filters
• Silencers
• Piping and Valves
• Blowers
39Pncwa2004Samstag.ppt
Flow/Pressure Table
Minimum 10,000 7.6
Average 20,000 8.2
Maximum 30,000 9.0
CONDITIONCONDITION FLOWFLOW PRESSUREPRESSURE
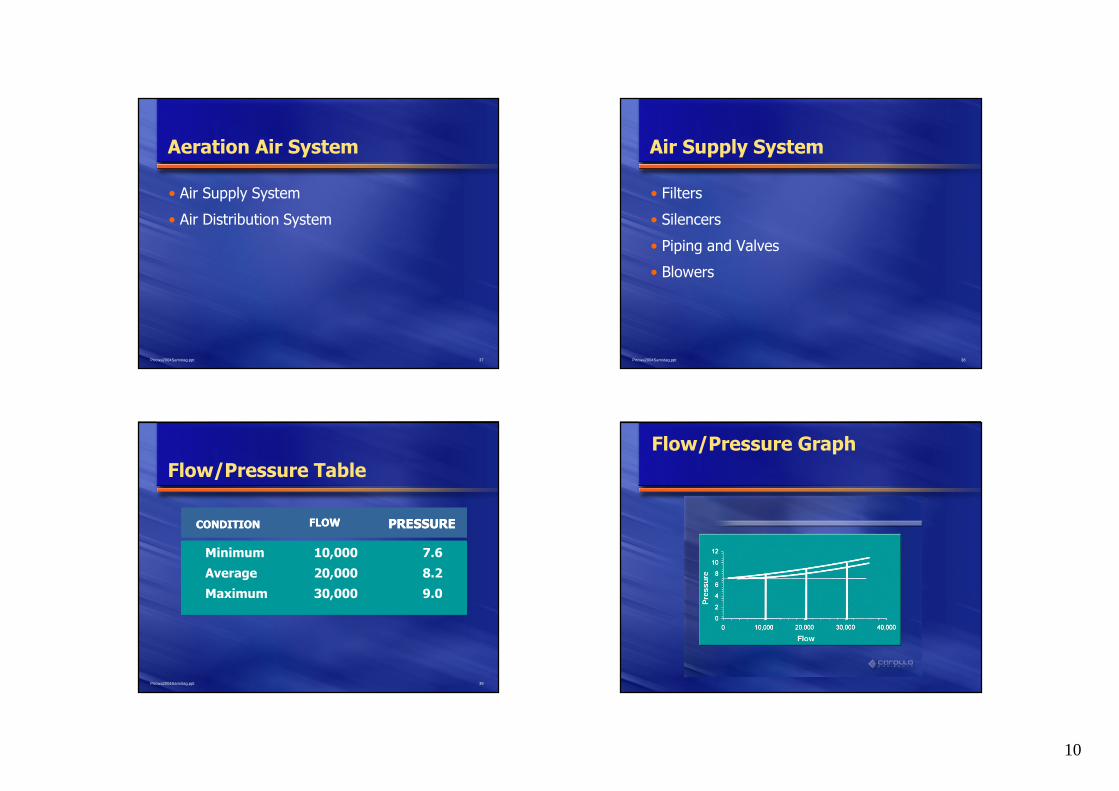
Flow/Pressure Graph
11
41Pncwa2004Samstag.ppt
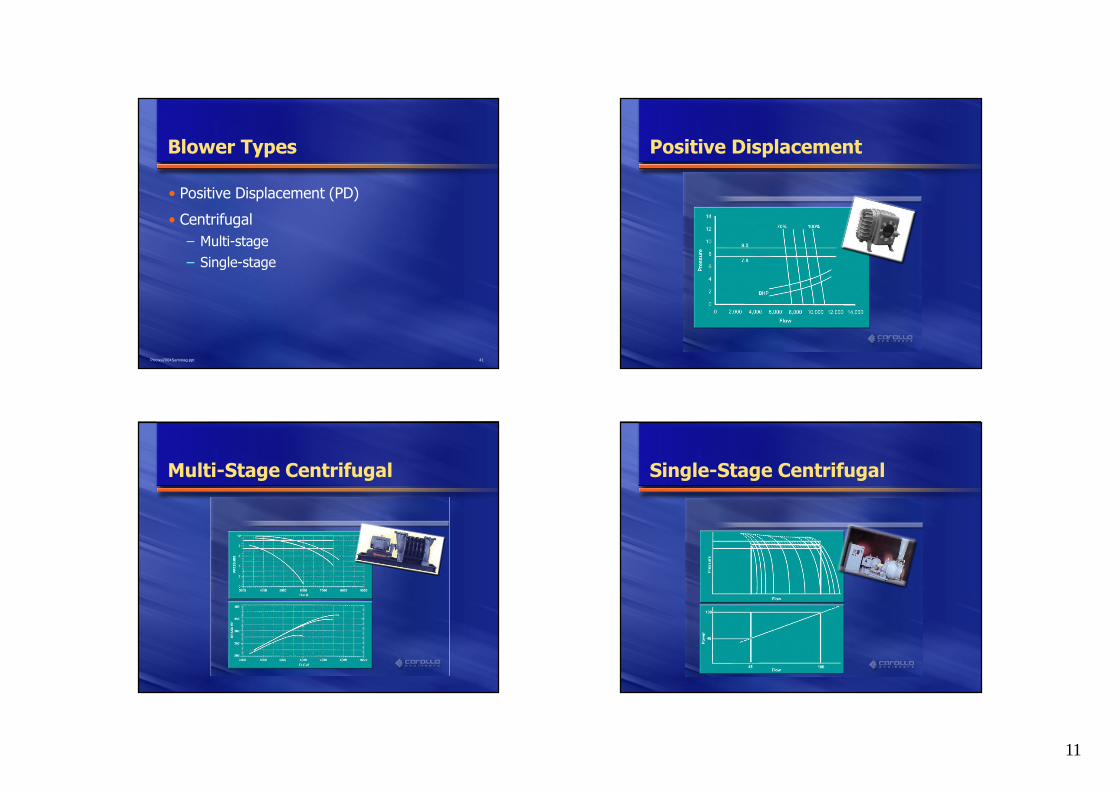
Blower Types
• Positive Displacement (PD)
• Centrifugal
– Multi-stage
– Single-stage
Positive Displacement
Multi-Stage Centrifugal Single-Stage Centrifugal
12
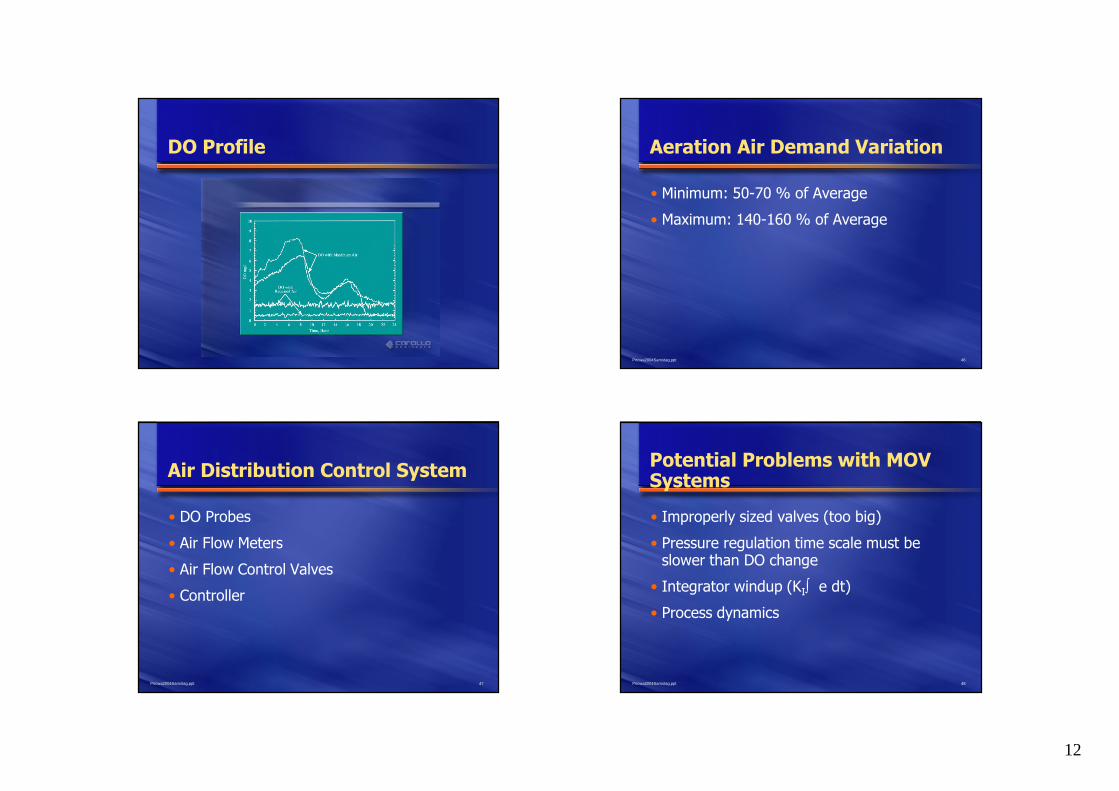
DO Profile
46Pncwa2004Samstag.ppt
Aeration Air Demand Variation
• Minimum: 50-70 % of Average
• Maximum: 140-160 % of Average
47Pncwa2004Samstag.ppt
Air Distribution Control System
• DO Probes
• Air Flow Meters
• Air Flow Control Valves
• Controller
48Pncwa2004Samstag.ppt
Potential Problems with MOVSystems
• Improperly sized valves (too big)
• Pressure regulation time scale must beslower than DO change
• Integrator windup (KI e dt)
• Process dynamics
13
49Pncwa2004Samstag.ppt
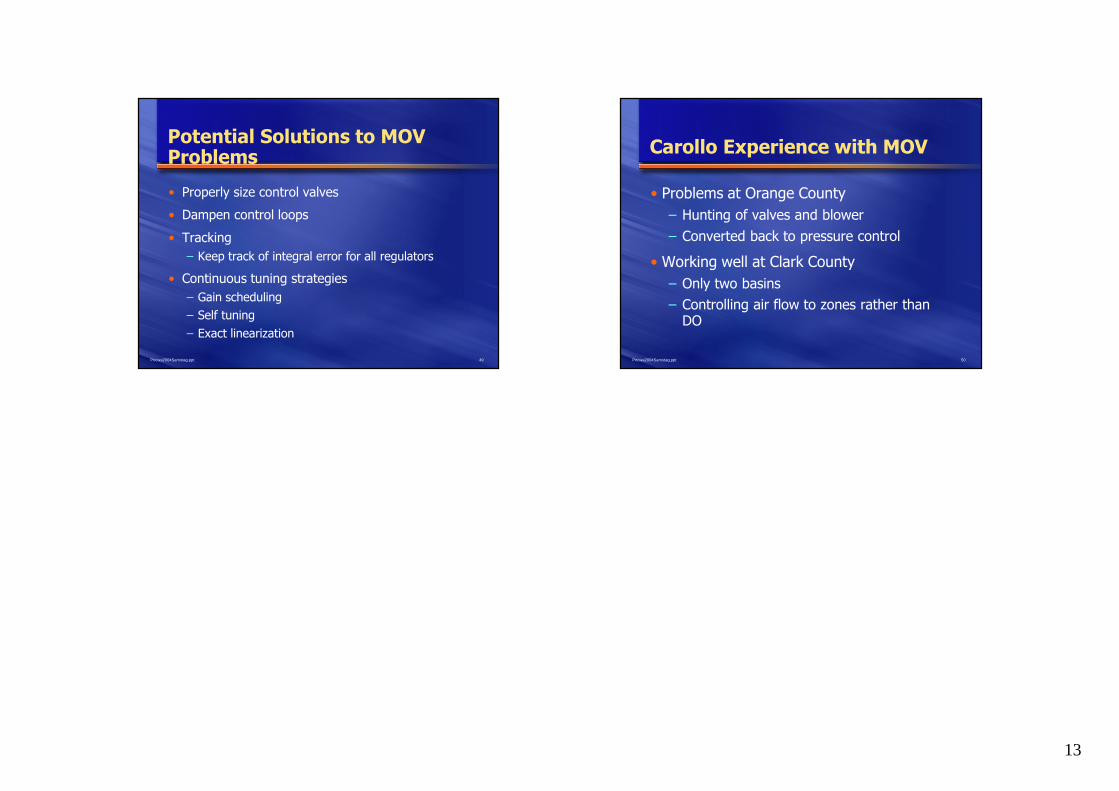
Potential Solutions to MOVProblems
• Properly size control valves
• Dampen control loops
• Tracking
– Keep track of integral error for all regulators
• Continuous tuning strategies
– Gain scheduling
– Self tuning
– Exact linearization
50Pncwa2004Samstag.ppt
Carollo Experience with MOV
• Problems at Orange County
– Hunting of valves and blower
– Converted back to pressure control
• Working well at Clark County
– Only two basins
– Controlling air flow to zones rather thanDO