Evaluation of a Buried Cable Roadside Animal Detection … · deer and bear, are often observed in...
45
VIRGINIA CENTER FOR TRANSPORTATION INNOVATION AND RESEARCH 530 Edgemont Road, Charlottesville, VA 22903-2454 www. VTRC .net Evaluation of a Buried Cable Roadside Animal Detection System http://www.virginiadot.org/vtrc/main/online_reports/pdf/15-r25.pdf CRISTIAN DRUTA, Ph.D. Senior Research Associate ANDREW S. ALDEN, P.E. Group Leader Eco-Transportation and Alternative Technologies Group Virginia Tech Transportation Institute Final Report VCTIR 15-R25
Transcript of Evaluation of a Buried Cable Roadside Animal Detection … · deer and bear, are often observed in...
VIRGINIA CENTER FOR TRANSPORTATION INNOVATION AND RESEARCH
530 Edgemont Road, Charlottesville, VA 22903-2454
www. VTRC.net
Evaluation of a Buried Cable Roadside Animal Detection System http://www.virginiadot.org/vtrc/main/online_reports/pdf/15-r25.pdf CRISTIAN DRUTA, Ph.D. Senior Research Associate ANDREW S. ALDEN, P.E. Group Leader Eco-Transportation and Alternative Technologies Group Virginia Tech Transportation Institute
Final Report VCTIR 15-R25

Standard Title Page - Report on Federally Funded Project
1. Report No.: 2. Government Accession No.: 3. Recipient’s Catalog No.: FHWA/VCTIR 15-R25
4. Title and Subtitle: 5. Report Date: Evaluation of a Buried Cable Roadside Animal Detection System June 2015
6. Performing Organization Code:
7. Author(s): Cristian Druta, Ph.D., and Andrew S. Alden, P.E.
8. Performing Organization Report No.: VCTIR 15-R25
9. Performing Organization and Address: Virginia Center for Transportation Innovation and Research 530 Edgemont Road Charlottesville, VA 22903
10. Work Unit No. (TRAIS):
11. Contract or Grant No.: 105215
12. Sponsoring Agencies’ Name and Address: 13. Type of Report and Period Covered: Virginia Department of Transportation 1401 E. Broad Street Richmond, VA 23219
Federal Highway Administration 400 North 8th Street, Room 750 Richmond, VA 23219-4825
Final Contract
14. Sponsoring Agency Code:
15. Supplementary Notes:
16. Abstract: Animal-vehicle collisions (AVC) are a concern for departments of transportation as they translate into hundreds of human fatalities and billions of dollars in property damage each year. A recently published report states that the Virginia Department of Transportation (VDOT) currently spends over $4 million yearly to remove about 55,000 deer carcasses from its roadways. Currently, one of the most effective existing methods to reduce AVCs is the use of animal detection systems, which can detect animals near the roadway and alert approaching drivers accordingly. In order to reduce AVCs in Virginia, VDOT, in collaboration with the Virginia Tech Transportation Institute, proposed the evaluation of an innovative roadside animal detection system in naturalistic and controlled conditions. This type of system offers numerous apparent advantages over aboveground animal detection technologies when environmental interferences, such as precipitation and vegetation, and site-specific characteristics, such as topology, subsidence, and road curvature, are considered. The subject animal detection system (ADS), a 300-m-long buried dual-cable sensor, detects the crossing of large and medium-sized animals and provides data on their location along the length of the cable. The system has a central processor unit for control and communication and generates an invisible electromagnetic detection field around buried cables. When the detection field is perturbed, an alarm is declared and the location of the intrusion is determined. Target animals are detected based on their conductivity, size, and movement, with multiple simultaneous intrusions being detected during a crossing event. The system was installed and tested at a highly suitable site on the Virginia Smart Road where large wild animals, including deer and bear, are often observed in a roadside environment. This report describes the installation of the ADS, data collection and analysis methodology, evaluation of the system’s reliability and effectiveness, cost analysis, and implementation prospects. The system used continuous, all-weather and nighttime video surveillance to monitor animal movement and to gauge system detections, and potential non-detections of the ADS. Also, a communication link between the buried ADS and the Virginia Smart Road fiber optic network was established to allow operation and monitoring of the system from a dedicated server in the Virginia Smart Road Control Room. A performance verification of the network communication was successfully conducted through continuous data collection and transfer to a storage unit. Data were collected continuously for a period of 10 months that included winter, and then analyzed to determine overall detection performance of the system. Data analyses indicate that the ADS, if properly installed and calibrated, is capable of detecting animals such as deer and bear, and possibly smaller animals, such as fox and coyotes, with over 95% reliability. The ADS also performed well even when covered by 3 ft of snow. Moreover, the system was tested under various traffic conditions and no vehicle interferences were noted during the same monitoring period. The acquired data can be used to improve highway safety through driver warning systems installed along roadway sections where high wildlife activity has been observed. Additionally, this system may be integrated with the connected vehicle framework to provide advance, in-vehicle warnings to motorists approaching locations where animals have been detected in or near the roadway.
17 Key Words: 18. Distribution Statement: Animal detection system, buried cable detection system, deer-vehicle collisions, animal-vehicle collisions, mitigation
No restrictions. This document is available to the public through NTIS, Springfield, VA 22161.
19. Security Classif. (of this report): 20. Security Classif. (of this page): 21. No. of Pages: 22. Price: Unclassified Unclassified 43
Form DOT F 1700.7 (8-72) Reproduction of completed page authorized

FINAL REPORT
EVALUATION OF A BURIED CABLE ROADSIDE ANIMAL DETECTION SYSTEM
Cristian Druta, Ph.D.
Senior Research Associate
Andrew S. Alden, P.E.
Group Leader
Eco-Transportation and Alternative Technologies Group
Virginia Tech Transportation Institute
VCTIR Project Manager
Bridget M. Donaldson, Virginia Center for Transportation Innovation and Research
In Cooperation with the U.S. Department of Transportation Federal Highway Administration
Virginia Center for Transportation Innovation and Research (A partnership of the Virginia Department of Transportation
and the University of Virginia since 1948)
Charlottesville, Virginia
June 2015 VCTIR 15-R25
ii
DISCLAIMER
The project that is the subject of this report was done under contract for the Virginia Department of Transportation, Virginia Center for Transportation Innovation and Research. The contents of this report reflect the views of the authors, who are responsible for the facts and the accuracy of the data presented herein. The contents do not necessarily reflect the official views or policies of the Virginia Department of Transportation, the Commonwealth Transportation Board, or the Federal Highway Administration. This report does not constitute a standard, specification, or regulation. Any inclusion of manufacturer names, trade names, or trademarks is for identification purposes only and is not to be considered an endorsement.
Each contract report is peer reviewed and accepted for publication by staff of Virginia Center for Transportation Innovation and Research with expertise in related technical areas. Final editing and proofreading of the report are performed by the contractor.
Copyright 2015 by the Commonwealth of Virginia. All rights reserved.
iii
ABSTRACT
Animal-vehicle collisions (AVC) are a concern for departments of transportation as they translate into hundreds of human fatalities and billions of dollars in property damage each year. A recently published report states that the Virginia Department of Transportation (VDOT) currently spends over $4 million yearly to remove about 55,000 deer carcasses from its roadways. Currently, one of the most effective existing methods to reduce AVCs is the use of animal detection systems, which can detect animals near the roadway and alert approaching drivers accordingly. In order to reduce AVCs in Virginia, VDOT, in collaboration with the Virginia Tech Transportation Institute, proposed the evaluation of an innovative roadside animal detection system in naturalistic and controlled conditions. This type of system offers numerous apparent advantages over aboveground animal detection technologies when environmental interferences, such as precipitation and vegetation, and site-specific characteristics, such as topology, subsidence, and road curvature, are considered.
The subject animal detection system (ADS), a 300-m-long buried dual-cable sensor, detects the crossing of large and medium-sized animals and provides data on their location along the length of the cable. The system has a central processor unit for control and communication and generates an invisible electromagnetic detection field around buried cables. When the detection field is perturbed, an alarm is declared and the location of the intrusion is determined. Target animals are detected based on their conductivity, size, and movement, with multiple simultaneous intrusions being detected during a crossing event. The system was installed and tested at a highly suitable site on the Virginia Smart Road where large wild animals, including deer and bear, are often observed in a roadside environment. This report describes the installation of the ADS, data collection and analysis methodology, evaluation of the system’s reliability and effectiveness, cost analysis, and implementation prospects. The system used continuous, all-weather and nighttime video surveillance to monitor animal movement and to gauge system detections, and potential non-detections of the ADS. Also, a communication link between the buried ADS and the Virginia Smart Road fiber optic network was established to allow operation and monitoring of the system from a dedicated server in the Virginia Smart Road Control Room. A performance verification of the network communication was successfully conducted through continuous data collection and transfer to a storage unit. Data were collected continuously for a period of 10 months that included winter, and then analyzed to determine overall detection performance of the system. Data analyses indicate that the ADS, if properly installed and calibrated, is capable of detecting animals such as deer and bear, and possibly smaller animals, such as fox and coyotes, with over 95% reliability. The ADS also performed well even when covered by 3 ft of snow. Moreover, the system was tested under various traffic conditions and no vehicle interferences were noted during the same monitoring period. The acquired data can be used to improve highway safety through driver warning systems installed along roadway sections where high wildlife activity has been observed. Additionally, this system may be integrated with the connected vehicle framework to provide advance, in-vehicle warnings to motorists approaching locations where animals have been detected in or near the roadway.
FINAL REPORT
EVALUATION OF A BURIED CABLE ROADSIDE ANIMAL DETECTION SYSTEM
Cristian Druta, Ph.D.
Senior Research Associate
Andrew S. Alden, P.E.
Group Leader
Eco-Transportation and Alternative Technologies Group
Virginia Tech Transportation Institute
INTRODUCTION
Animal-vehicle conflicts (AVCs) are a common occurrence and a significant safety and environmental problem in America. These conflicts include collisions and near-collisions and may result in elevated risks to drivers, animals, and other road users. Roads create disruptions in the natural movement of wildlife along with physical isolation due to loss of habitat connectivity, a situation that leads to increased animal mortality and traffic hazards (Ahern et al., 2009). With a national roadway system of almost 4 million miles, a higher number of these occurrences is expected due to an increase in the number of vehicles on the road along with increases in vehicle speed limits (Defenders of Wildlife, 2014; Huijser et al., 2008; Huijser et al., 2009a; Sharafsaleh et al., 2010). Typically, the incidence of AVCs exceeds 1 million per year, even as the rate of overall motor vehicle crashes has decreased in comparison (State Farm, 2012). Approximately 4% to 10% of AVCs involving large animals result in human injury. In many cases, the evasive actions of drivers who encounter animals in the roadway result in injuries to themselves or others and may cause property damage costs exceeding $4 billion annually (State Farm, 2012). These costs do not include related costs such as medical care, crash management, animal carcass management, or costs related to traffic delays, emergency management, litigation, and infrastructure damage. Moreover, a 2008 report to Congress (Huijser et al., 2008) suggests that AVCs are underreported because carcass counts and insurance reports are the primary data sources, and struck animals frequently leave the incident scene, possibly to die elsewhere, or are removed by scavengers. Furthermore, those AVCs resulting in little or no damage to vehicles are frequently unreported by drivers (Huijser et al., 2008). In Virginia, the insurer State Farm estimates that nearly 56,000 deer-vehicle collisions (DVCs) occurred in the state from 2011-2012, the third highest number of DVCs of all U.S. states (B. Donaldson, personal communication). DVCs accounted for over 30% of the reported collisions in some areas. According to studies by Donaldson and Moruza (2010) and Donaldson and White (2013), the Virginia Department of Transportation (VDOT) spends approximately $4.4 million per year for carcass removal and disposal. The problem has become so extensive that three composting methods were evaluated as a carcass management alternative for VDOT.

2
As AVC incidents continue to rise due to both vehicle-miles traveled and an increase in wildlife numbers, many departments of transportation (DOTs) have sought out crash reduction solutions in recent years to mitigate the problem. These solutions included fencing, overpasses and underpasses, and various warning and deterrence systems, such as flashing signs and electronic deterrents (Curtis and Hedlund, 2005; Maine Interagency Work Group on Wildlife/Motor Vehicle Collisions, 2001; Romin and Bissonette, 1996). According to Huijser et al. (2008), in the last decade, more than 40 different mitigation approaches have been evaluated and implemented to reduce AVCs. Investigations revealed that most of the methods rendered substandard results, with the following exceptions: wildlife fencing, fencing combined with overpasses or underpasses (Clevenger and Huijser, 2009; Dodd and Gagnon, 2008), and several animal detection systems (Dai et al., 2008; Huijser et al., 2008). Other vehicle-based systems that employ far infrared (heat) imaging or radar show promise for future applications, but are at present uncommon, expensive, and largely unproven with respect to AVC prevention/mitigation. Some studies indicated that AVCs were reduced by more than 80%, and up to 90%, when warning systems were installed by the roadside (Dodd and Gagnon, 2008). Previous studies have attributed the success of the warning systems to a reduction in driver speed and stopping distance (Huijser and McGowen, 2003; Huijser et al., 2006). Other systems have been found effective at reducing the vehicle speeds of passenger cars, pickup trucks, vans, and trucks with two or more units (Huijser et al., 2009). In order to reduce the number of AVCs, these detection systems must detect animals reliably and should also be able to influence driver behavior so that drivers can avoid potential collisions. Typically, ADSs are designed to detect large animals such as deer, elk, and/or moose as they approach the road, so that drivers are warned that these animals may be on or near the road when the respective system declares an alarm. Huijser et al. (2006, 2009b, c) and Gray (2009) have evaluated several ADSs installed at various locations throughout Europe and North America. They classified the systems into three main groups: area coverage, break-the-beam, and intrusion detection sensors. Extensive research has been conducted on many of these systems, and not all aboveground systems have been shown to be effective. While the first two types of sensors may be affected by the elements (e.g., snow, ice, etc.), trees, traffic, or other objects, the third type appears to be more reliable under these conditions, as the sensors are buried. Reported problems included blind spots resulting from steep slopes and road curvatures, as well as maintenance challenges, such as dirt and vegetation affecting the detection sensitivity (Huijser et al., 2006). Therefore, an unobtrusive system that is both protected from and effective in various weather conditions and has minimal impact on wildlife habitat is the most viable option for AVC mitigation.
The study was initiated by the Virginia Center for Transportation Innovation and Research (VCTIR) as a response to the VDOT Staunton District’s request to help identify measures and strategic locations for AVC mitigation along certain highway sections of I-81 and I-64 with high rates of collisions. The literature indicates mixed results when employing the buried cable sensor for animal detection, depending on the location of testing sites, and concluded that the detection technology can reliably detect deer, but that the system settings, system integration, or faulty equipment can affect the reliability of the system (Huijser et al., 2012). Therefore, further testing was needed to determine the system’s effectiveness.

3
PURPOSE AND SCOPE
The purpose of this study was to evaluate an OmniTrax® buried cable intrusion detection system to determine its ability to detect large animals under controlled conditions at a roadside site. If the study determines the detection system is effective, a subsequent evaluation of the ADS on a public road will be proposed. This evaluation was conducted on the Virginia Smart Road (hereinafter Smart Road), a closed test track facility owned by VDOT and operated by Virginia Tech Transportation Institute (VTTI). The southern end of the Smart Road lies in a largely undeveloped and heavily wooded area and has been observed to be heavily trafficked by deer, bear, coyote, fox, and turkey. The buried cable animal detection system was installed at the proposed location and monitored continually for 10 months.
METHODS
Five tasks were performed to achieve the study objectives.
1. Select the animal detection system and review the characteristics. 2. Select and survey the test site. 3. Install and operate the system. 4. Calibrate the cable system and set up the parameter 5. Collect data and validate the cable performance.
System Selection and Characteristics
The selection of the animal detection system was led by VTTI researchers in consultation with VCTIR environmental staff. After careful review of several different alternatives and based on the topology, animal migratory paths, and other characteristics of the selected site, the decision was made to purchase and install a buried cable Animal Detection System (ADS) from Senstar Corporation. The Senstar – OmniTrax® SC2 intrusion buried cable detection sensor was chosen for its superior capabilities and compatibility with the testing protocol of this study, in that it is composed of variable cable lengths available in different installment configurations (e.g., single vs. separate trenches, various cable spacing, etc.) that cover almost all testing requirements. Also, its ranging technology offers high accuracy in animal intrusion location and separate thresholding calibration. The ADS is a modular ranging buried coaxial cable outdoor intrusion detection sensor system based on ported coaxial cable (SC2) technology. This sensor cable is a dual cable system that can be supplied in 500 to 800 ft (300 to 400 m) lengths with 70 ft (20 m) of integral lead-in cable. The detection field is formed by radio frequency (RF) signals carried by the sensor cables (one transmit and one receive) that are buried along a selected area or perimeter. The transmit

4
(TX) cable distributes RF signals along the cable path and the receive (RX) cable picks up the signals and carries them back to the processor as shown in Figure 1. The RF signals form an invisible electromagnetic detection field around the sensor cables that can locate and detect an intruder passing through the field, while the processor triggers an alarm when an intruder disturbs the field. Cable spacing can vary depending on the site conditions and burial depth. The system can detect animals or intruders weighing over 75 lb when installed and calibrated according to the manufacturer’s directions (Senstar, 2013).
The data network supported by the system communicates through a central network interface unit (NIU) that provides standard communications interfaces for connection to computer equipment. Via the NIU and associated network management software, the system provides all the alarm and status information needed to implement the operator interface. In addition, configuration software is available so that all system calibration and adjustments can be performed over the data network from a central location. Concurrently, a security management system (SMS) can monitor the OmniTrax® sensor and report alarms to an operator on a graphical site map.
Figure 1. Schematic of Detection System Cable Spacing and Detection Field Characteristics
Site Surveying and Selection Prior to the system installation, a detailed Smart Road site survey was conducted by VTTI researchers to assess existing conditions and to determine the specific installation requirements, including the perimeter length, zone layouts, sensor cable route, cable spacing, type of sensor cable, and the locations for the system’s components. The survey covered aspects regarding possible aboveground and underground obstacles (e.g., pipes, electrical conduits, cables, etc.), soil characteristics, moving objects, paths, access roads, utility vaults, drainage ditches, and other relevant issues. Also, photographs of the proposed cable path and surrounding area were taken and sent to the cable manufacturer for review and subsequent discussion.
5
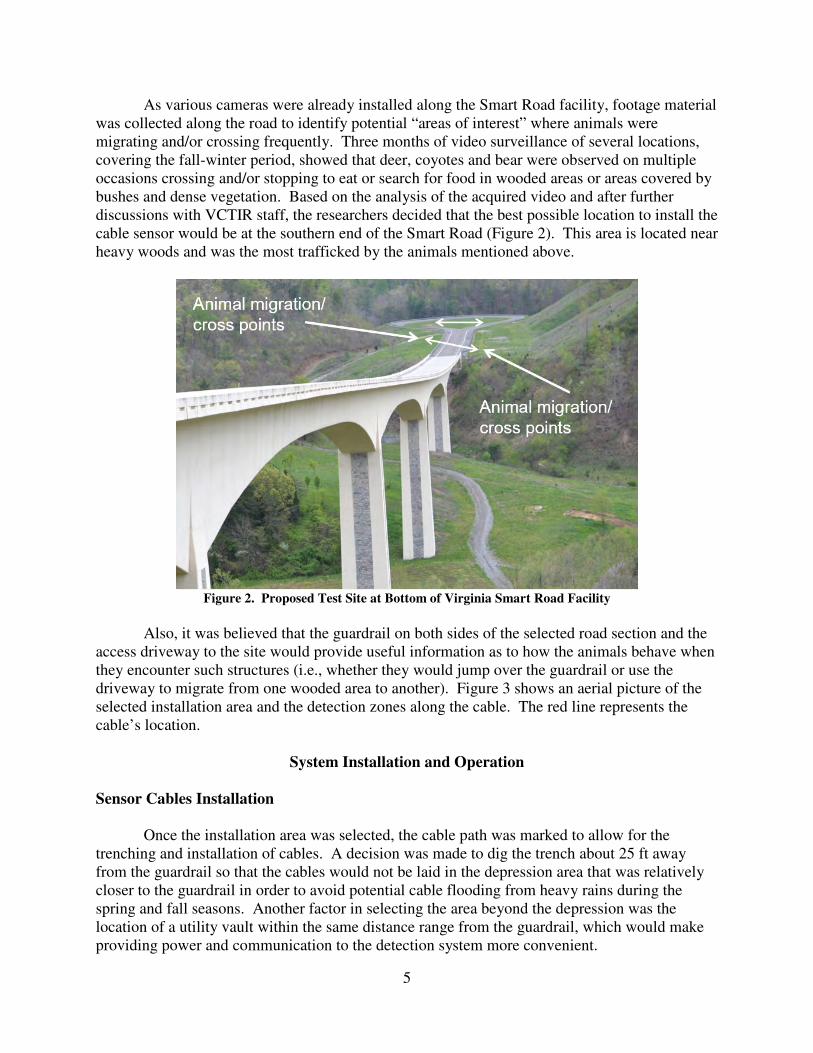
As various cameras were already installed along the Smart Road facility, footage material was collected along the road to identify potential “areas of interest” where animals were migrating and/or crossing frequently. Three months of video surveillance of several locations, covering the fall-winter period, showed that deer, coyotes and bear were observed on multiple occasions crossing and/or stopping to eat or search for food in wooded areas or areas covered by bushes and dense vegetation. Based on the analysis of the acquired video and after further discussions with VCTIR staff, the researchers decided that the best possible location to install the cable sensor would be at the southern end of the Smart Road (Figure 2). This area is located near heavy woods and was the most trafficked by the animals mentioned above.
Figure 2. Proposed Test Site at Bottom of Virginia Smart Road Facility
Also, it was believed that the guardrail on both sides of the selected road section and the access driveway to the site would provide useful information as to how the animals behave when they encounter such structures (i.e., whether they would jump over the guardrail or use the driveway to migrate from one wooded area to another). Figure 3 shows an aerial picture of the selected installation area and the detection zones along the cable. The red line represents the cable’s location.
System Installation and Operation
Sensor Cables Installation
Once the installation area was selected, the cable path was marked to allow for the trenching and installation of cables. A decision was made to dig the trench about 25 ft away from the guardrail so that the cables would not be laid in the depression area that was relatively closer to the guardrail in order to avoid potential cable flooding from heavy rains during the spring and fall seasons. Another factor in selecting the area beyond the depression was the location of a utility vault within the same distance range from the guardrail, which would make providing power and communication to the detection system more convenient.

Figure 3. ADS Installation Location and Detection Zones

Additionally, the flat gravelly area extending toward the wooded zone on the left (see Figure 3) allowed for utility vehicles to be driven near the cable for maintenance activities or snow removal. A 12-in wide by 11-in deep trench was dug so that the cables could be installed 6 in apart on the bottom. Before laying the cables in the trench, a 2-in layer of small-sized crushed stone was used as bedding per the manufacturer’s recommendation (Figure 4). Cables were then placed on top of the aggregate layer at about 9 in deep with marker tape positioned between them. The tape was buried slightly higher than the sensor cables to prevent cable damage that might result from any excavating activities.
Figure 4. Buried Cable Installation. Trench being filled with fine aggregate (top left) and trench bedding
after material was leveled (top right); cable placement on top of bedding material (middle left) and trench
backfilling (middle right); lead-in cables overlapping along the detection line (bottom left) and processor
enclosure location (bottom right).
8
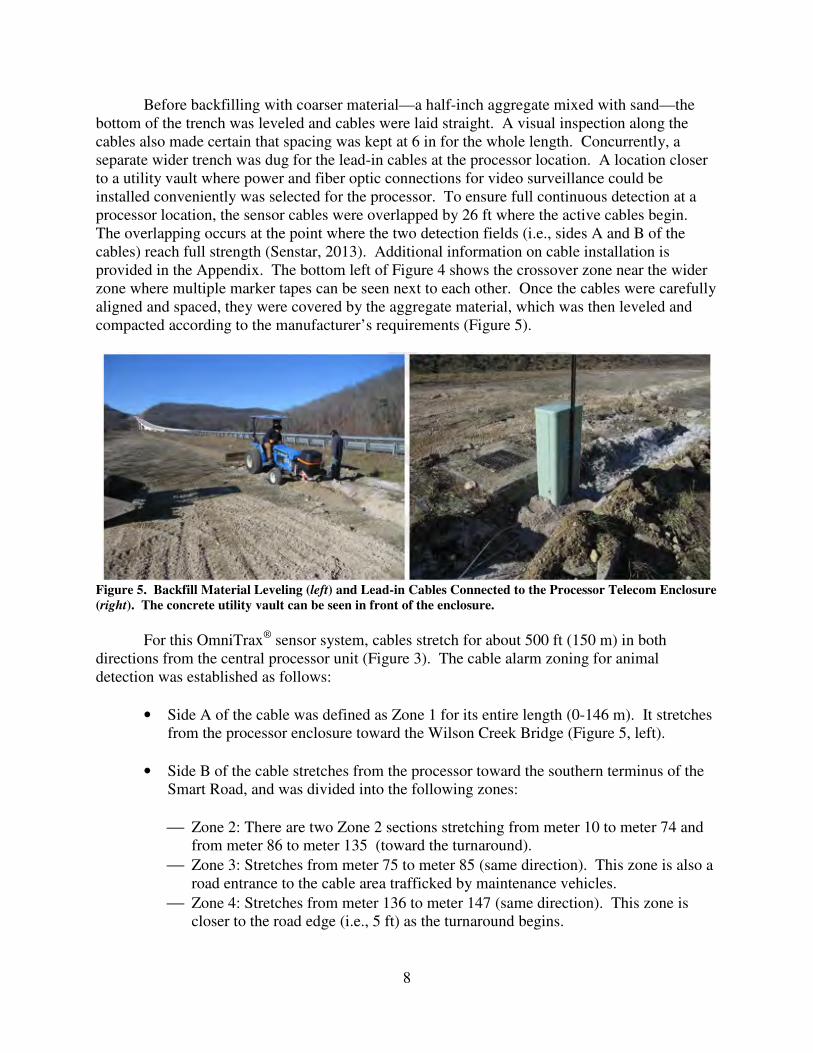
Before backfilling with coarser material—a half-inch aggregate mixed with sand—the bottom of the trench was leveled and cables were laid straight. A visual inspection along the cables also made certain that spacing was kept at 6 in for the whole length. Concurrently, a separate wider trench was dug for the lead-in cables at the processor location. A location closer to a utility vault where power and fiber optic connections for video surveillance could be installed conveniently was selected for the processor. To ensure full continuous detection at a processor location, the sensor cables were overlapped by 26 ft where the active cables begin. The overlapping occurs at the point where the two detection fields (i.e., sides A and B of the cables) reach full strength (Senstar, 2013). Additional information on cable installation is provided in the Appendix. The bottom left of Figure 4 shows the crossover zone near the wider zone where multiple marker tapes can be seen next to each other. Once the cables were carefully aligned and spaced, they were covered by the aggregate material, which was then leveled and compacted according to the manufacturer’s requirements (Figure 5).
Figure 5. Backfill Material Leveling (left) and Lead-in Cables Connected to the Processor Telecom Enclosure
(right). The concrete utility vault can be seen in front of the enclosure.
For this OmniTrax® sensor system, cables stretch for about 500 ft (150 m) in both directions from the central processor unit (Figure 3). The cable alarm zoning for animal detection was established as follows:
• Side A of the cable was defined as Zone 1 for its entire length (0-146 m). It stretches from the processor enclosure toward the Wilson Creek Bridge (Figure 5, left).
• Side B of the cable stretches from the processor toward the southern terminus of the Smart Road, and was divided into the following zones:
Zone 2: There are two Zone 2 sections stretching from meter 10 to meter 74 and from meter 86 to meter 135 (toward the turnaround).
Zone 3: Stretches from meter 75 to meter 85 (same direction). This zone is also a road entrance to the cable area trafficked by maintenance vehicles.
Zone 4: Stretches from meter 136 to meter 147 (same direction). This zone is closer to the road edge (i.e., 5 ft) as the turnaround begins.
9
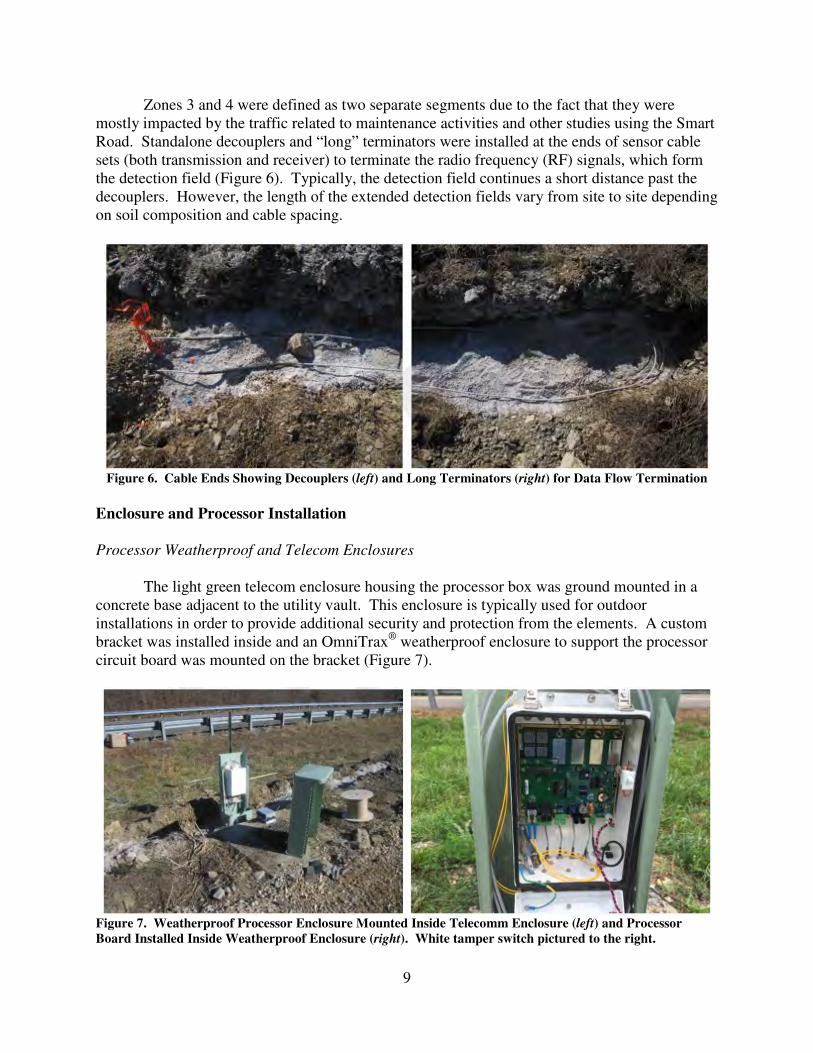
Zones 3 and 4 were defined as two separate segments due to the fact that they were mostly impacted by the traffic related to maintenance activities and other studies using the Smart Road. Standalone decouplers and “long” terminators were installed at the ends of sensor cable sets (both transmission and receiver) to terminate the radio frequency (RF) signals, which form the detection field (Figure 6). Typically, the detection field continues a short distance past the decouplers. However, the length of the extended detection fields vary from site to site depending on soil composition and cable spacing.
Figure 6. Cable Ends Showing Decouplers (left) and Long Terminators (right) for Data Flow Termination
Enclosure and Processor Installation
Processor Weatherproof and Telecom Enclosures
The light green telecom enclosure housing the processor box was ground mounted in a
concrete base adjacent to the utility vault. This enclosure is typically used for outdoor installations in order to provide additional security and protection from the elements. A custom bracket was installed inside and an OmniTrax® weatherproof enclosure to support the processor circuit board was mounted on the bracket (Figure 7).
Figure 7. Weatherproof Processor Enclosure Mounted Inside Telecomm Enclosure (left) and Processor
Board Installed Inside Weatherproof Enclosure (right). White tamper switch pictured to the right.

10
A battery compartment was also provided on the door to house a 6 VDC backup battery, and a vent was installed to prevent gas build-up from battery charging. The backup battery provides approximately 2 hours of emergency backup power. An enclosure tamper switch was included, along with a harness that connects directly to the processor. A tamper alert is displayed in the Event Log software each time the enclosure is opened during data collection. OmniTrax Processor
The OmniTrax® processor can support two separate SC2 sensor cable sets, and can monitor up to 50 distinct alarm zones over up to 2,600 ft (800 m) of detecting cables. For the Smart Road installation, the processor supports 4 alarm zones over 1,000 ft of cable length. The alarm zones are defined in the software by the manufacturer with input from the client/purchaser, and are not dependent on cable length, or cable side. They are defined functions of the terrain, threat level, utilities, traffic, maintenance activities, etc. The processor operates on 12 VDC (10W) power and can communicate alarm conditions with contact closure outputs or via the fiber optic network. The 12 V power supply was installed in the concrete vault to power both the processor card and the auxiliary battery. Mini-coax cables inside the enclosure connect the bulkhead connectors to the processor circuit card. Four cable glands on the bottom of the enclosure provide access for the power cable, ground wire, alarm communication wiring, and the self-test or auxiliary device wiring (Figure 8).
Moreover, all power and data circuits on the OmniTrax® processor and the network interface units include gas capsule lightning and transient protection. A connection to a low resistance earth ground was established to ensure the system’s grounding.
Figure 8. Mini-coax Cable Connections at Bottom of Processor (left) and Transmission-Receiving
Connections for Sides A and B of Cable Sensors at Top of Processor (right).
Cable System Calibration and Parameter Setup
Before applying power to calibrate the system, the sensor cable connections and the wiring connections to the processor had to be verified to ensure that there were not any loose, unfastened, or moving parts. To calibrate the OmniTrax® cable sensor, a setup of the initial configuration parameters such as network type, device type, Internet Protocol (IP) address, etc.,

11
was required, followed by a sensitivity profile (SP) procedure. Also, depending on the site conditions, a fine tune of the OmniTrax® sensor can be performed by adjusting the processor’s configuration parameters. Details on system calibration and parameter setup are provided in the Appendix.
Network Communication A communication link between the BCADS and the Smart Road fiber optic network was established to allow operation and monitoring of the system from a dedicated server in the Smart Road Control Room. For this purpose, two single-mode fiber optic cables were connected to the network interface card (NIC) which was readily mounted on the processor card. The fiber cables are shown in yellow at the bottom left-corner of the right-hand photo in Figure 7. The NIC manages all network communications for the processor and includes a regenerative repeater, which reshapes and retimes the network data. In addition to the NIC, a network interface unit (NIU) was provided to establish communication with a computer running UCM and Silver Network Manager (SNM) software. The NIU (Figure 9), which operates on a 12 VDC/USB connection, translates the alarm data and passes it on to the Windows-based SNM, which then interprets the alarm data and passes it on to a PC-based security management system (i.e., Senstar’s Alarm Integration Module or StarNeT network).
Figure 9. Network Interface Unit (NIU) Used for Establishing Network Communication
Network communication enables precise target location and software controlled alarm zone configuration. The NIU is equipped with both Ethernet and USB connectors to access NMs and other network devices. Two fiber optic cable connectors (TX/RX) are provided as well. To connect via the NM application, the processor address or the address field must first be located in the software connection window to specify the processor address (previously specified IP address and Network Manager ID are also required). Once the communication link between the NM server and the processor is established, a control window (Figure 10) displays, allowing for further system configuration (e.g., node synchronization, network interface selection, etc.) and connection to the UCM program. The connection to the UCM program will permit the NM server to send alarm data to the Event Log box (see Appendix) during data collection events.

12
Figure 10. Network Manager Program That Ensures Communication Between Processor and Data Storage
Computer. Communication was established through a single-mode fiber optic cable available on the Smart
Road.
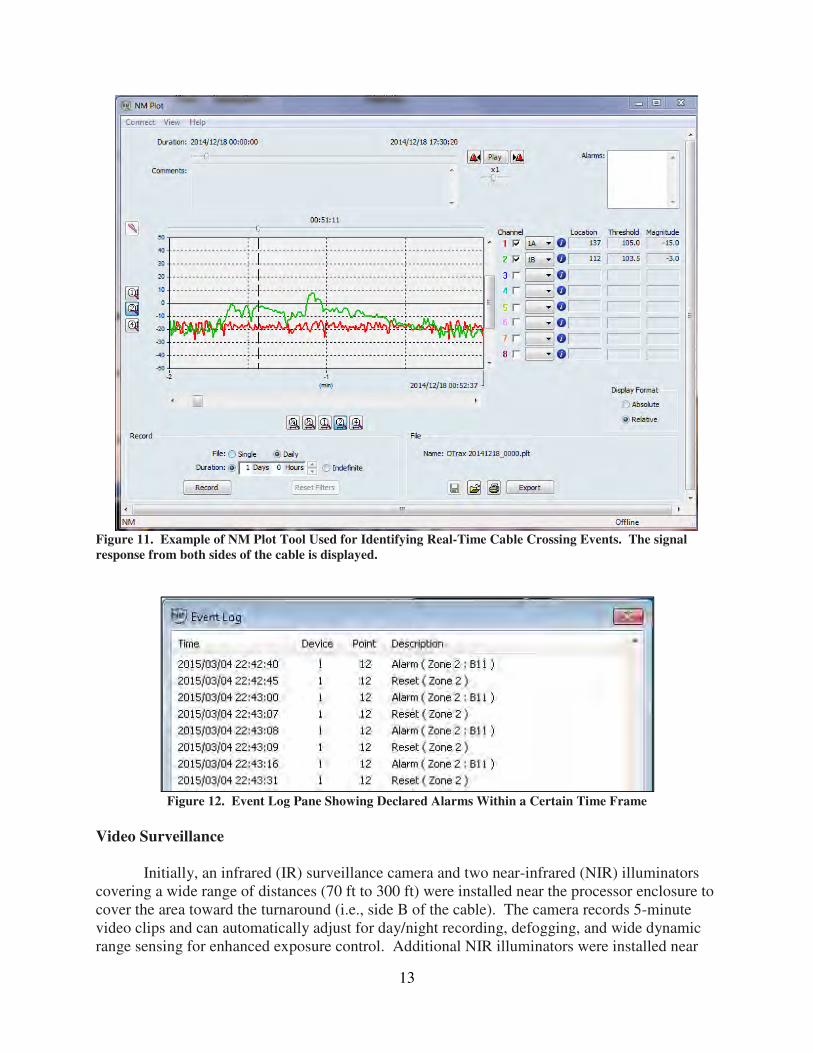
This communication is useful when event history files have to be saved for future reference. Separate NM Plot (Figure 11) and Event Log (Figure 12) windows can be opened to monitor animal activity in real-time. The NM plot process can be programed so that continuous data can be collected and files generated on a daily basis for both sides of the cable. Relevant information from NM files and Event Logs aids in the development of data reduction methods. The plots offer details on the time and date of the cable monitoring, as well as on the crossing location, threshold at that specific location, and magnitude of the signal.
Furthermore, if a list of declared alarms is needed for a certain period of time (e.g., several days to a week), an Event Log pane (Figure 12) can be retrieved by accessing the View tab in the SNM window as shown in Figure A1 in the Appendix. Events can be viewed by selecting a start-end date/time range within the pane.
13
Figure 11. Example of NM Plot Tool Used for Identifying Real-Time Cable Crossing Events. The signal
response from both sides of the cable is displayed.
Figure 12. Event Log Pane Showing Declared Alarms Within a Certain Time Frame
Video Surveillance
Initially, an infrared (IR) surveillance camera and two near-infrared (NIR) illuminators covering a wide range of distances (70 ft to 300 ft) were installed near the processor enclosure to cover the area toward the turnaround (i.e., side B of the cable). The camera records 5-minute video clips and can automatically adjust for day/night recording, defogging, and wide dynamic range sensing for enhanced exposure control. Additional NIR illuminators were installed near
14
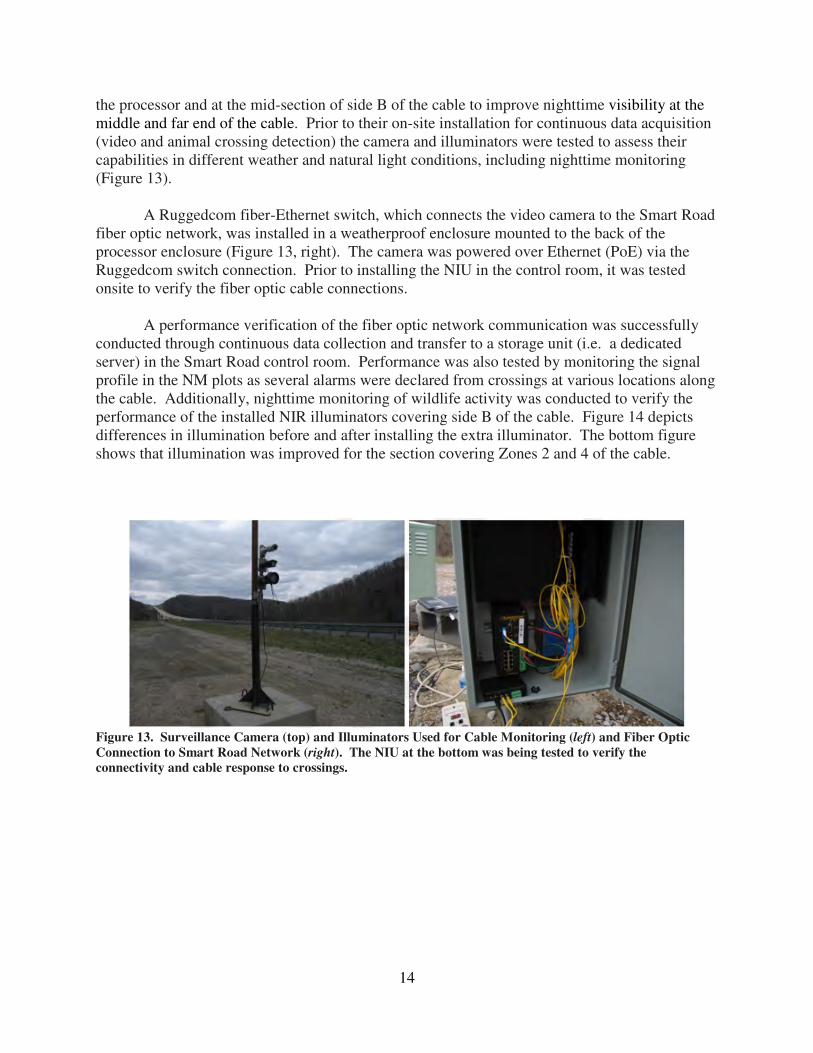
the processor and at the mid-section of side B of the cable to improve nighttime visibility at the middle and far end of the cable. Prior to their on-site installation for continuous data acquisition (video and animal crossing detection) the camera and illuminators were tested to assess their capabilities in different weather and natural light conditions, including nighttime monitoring (Figure 13). A Ruggedcom fiber-Ethernet switch, which connects the video camera to the Smart Road fiber optic network, was installed in a weatherproof enclosure mounted to the back of the processor enclosure (Figure 13, right). The camera was powered over Ethernet (PoE) via the Ruggedcom switch connection. Prior to installing the NIU in the control room, it was tested onsite to verify the fiber optic cable connections.
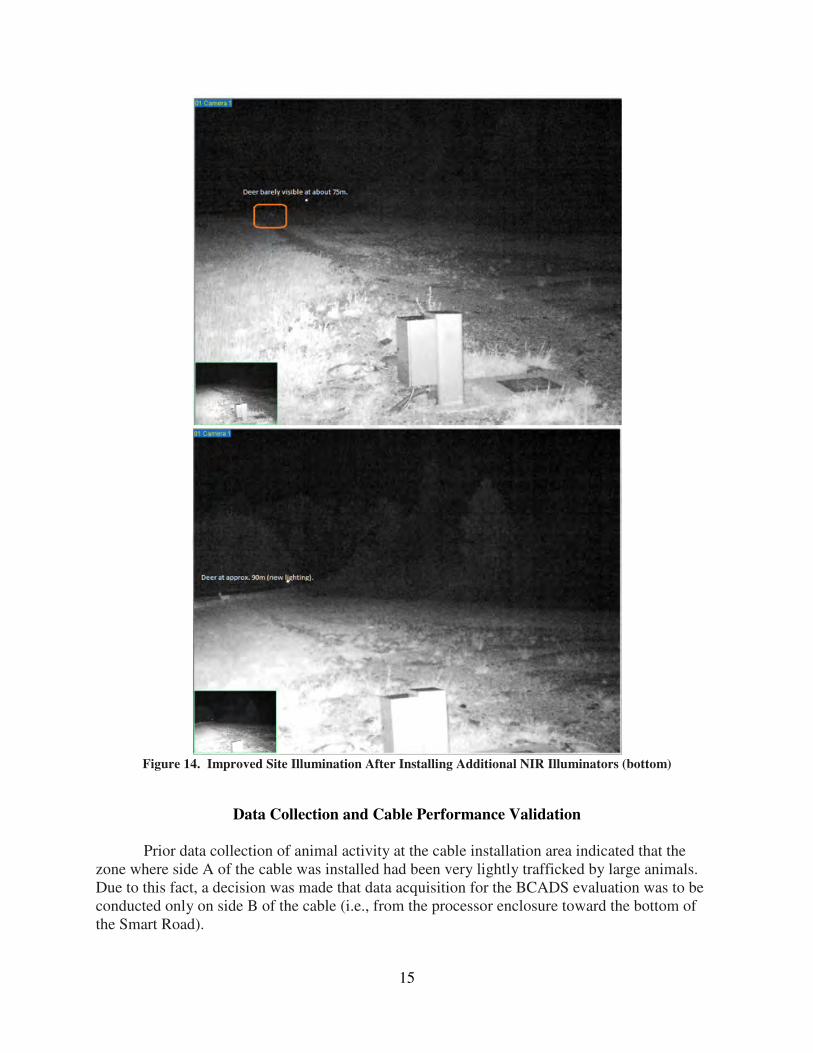
A performance verification of the fiber optic network communication was successfully conducted through continuous data collection and transfer to a storage unit (i.e. a dedicated server) in the Smart Road control room. Performance was also tested by monitoring the signal profile in the NM plots as several alarms were declared from crossings at various locations along the cable. Additionally, nighttime monitoring of wildlife activity was conducted to verify the performance of the installed NIR illuminators covering side B of the cable. Figure 14 depicts differences in illumination before and after installing the extra illuminator. The bottom figure shows that illumination was improved for the section covering Zones 2 and 4 of the cable.
Figure 13. Surveillance Camera (top) and Illuminators Used for Cable Monitoring (left) and Fiber Optic
Connection to Smart Road Network (right). The NIU at the bottom was being tested to verify the
connectivity and cable response to crossings.
15
Figure 14. Improved Site Illumination After Installing Additional NIR Illuminators (bottom)
Data Collection and Cable Performance Validation
Prior data collection of animal activity at the cable installation area indicated that the zone where side A of the cable was installed had been very lightly trafficked by large animals. Due to this fact, a decision was made that data acquisition for the BCADS evaluation was to be conducted only on side B of the cable (i.e., from the processor enclosure toward the bottom of the Smart Road).
16
Data Collection Methodology
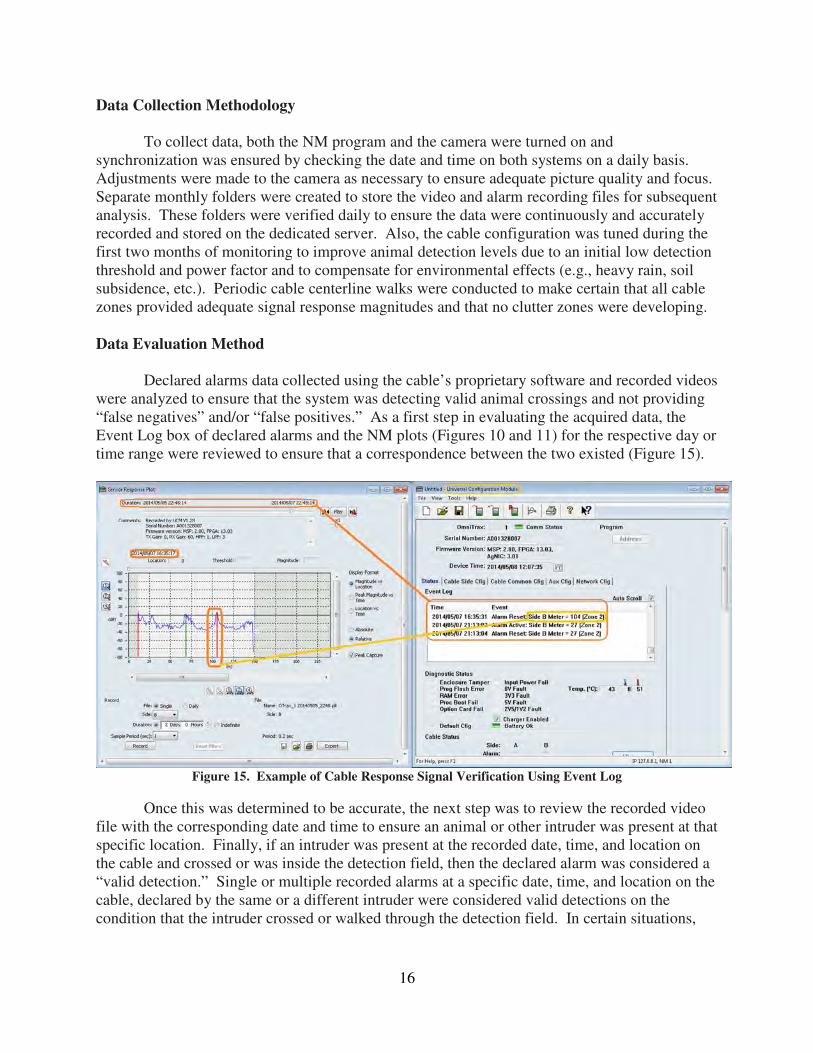
To collect data, both the NM program and the camera were turned on and synchronization was ensured by checking the date and time on both systems on a daily basis. Adjustments were made to the camera as necessary to ensure adequate picture quality and focus. Separate monthly folders were created to store the video and alarm recording files for subsequent analysis. These folders were verified daily to ensure the data were continuously and accurately recorded and stored on the dedicated server. Also, the cable configuration was tuned during the first two months of monitoring to improve animal detection levels due to an initial low detection threshold and power factor and to compensate for environmental effects (e.g., heavy rain, soil subsidence, etc.). Periodic cable centerline walks were conducted to make certain that all cable zones provided adequate signal response magnitudes and that no clutter zones were developing. Data Evaluation Method
Declared alarms data collected using the cable’s proprietary software and recorded videos were analyzed to ensure that the system was detecting valid animal crossings and not providing “false negatives” and/or “false positives.” As a first step in evaluating the acquired data, the Event Log box of declared alarms and the NM plots (Figures 10 and 11) for the respective day or time range were reviewed to ensure that a correspondence between the two existed (Figure 15).
Figure 15. Example of Cable Response Signal Verification Using Event Log
Once this was determined to be accurate, the next step was to review the recorded video file with the corresponding date and time to ensure an animal or other intruder was present at that specific location. Finally, if an intruder was present at the recorded date, time, and location on the cable and crossed or was inside the detection field, then the declared alarm was considered a “valid detection.” Single or multiple recorded alarms at a specific date, time, and location on the cable, declared by the same or a different intruder were considered valid detections on the condition that the intruder crossed or walked through the detection field. In certain situations,
17
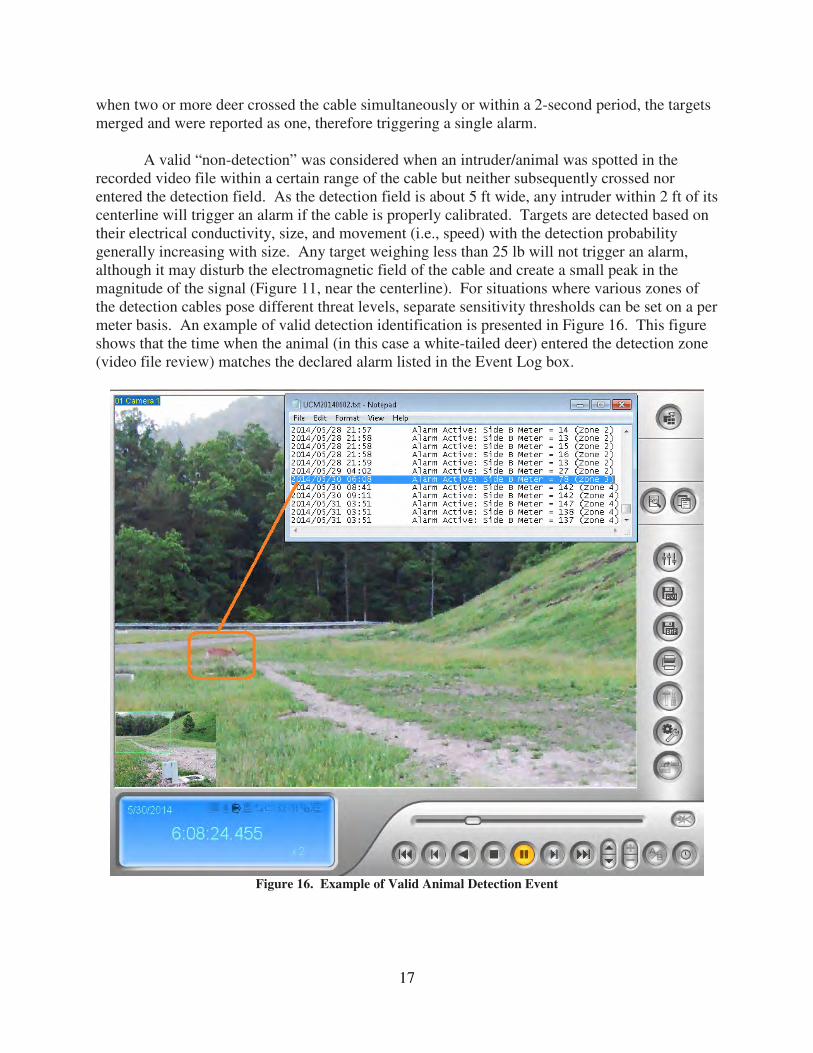
when two or more deer crossed the cable simultaneously or within a 2-second period, the targets merged and were reported as one, therefore triggering a single alarm. A valid “non-detection” was considered when an intruder/animal was spotted in the recorded video file within a certain range of the cable but neither subsequently crossed nor entered the detection field. As the detection field is about 5 ft wide, any intruder within 2 ft of its centerline will trigger an alarm if the cable is properly calibrated. Targets are detected based on their electrical conductivity, size, and movement (i.e., speed) with the detection probability generally increasing with size. Any target weighing less than 25 lb will not trigger an alarm, although it may disturb the electromagnetic field of the cable and create a small peak in the magnitude of the signal (Figure 11, near the centerline). For situations where various zones of the detection cables pose different threat levels, separate sensitivity thresholds can be set on a per meter basis. An example of valid detection identification is presented in Figure 16. This figure shows that the time when the animal (in this case a white-tailed deer) entered the detection zone (video file review) matches the declared alarm listed in the Event Log box.
Figure 16. Example of Valid Animal Detection Event

18
Figure 17 illustrates a valid non-detection case where a coyote was present near the cable but never entered the detection field or crossed the cable, and thus an alarm was never declared. Also, the alarms Event Log shows that the last declared alarm was at 10:13, while the coyote was spotted at 17:25.
Figure 17. Example of Valid Non-Detection. Coyote stands outside the detection zone.
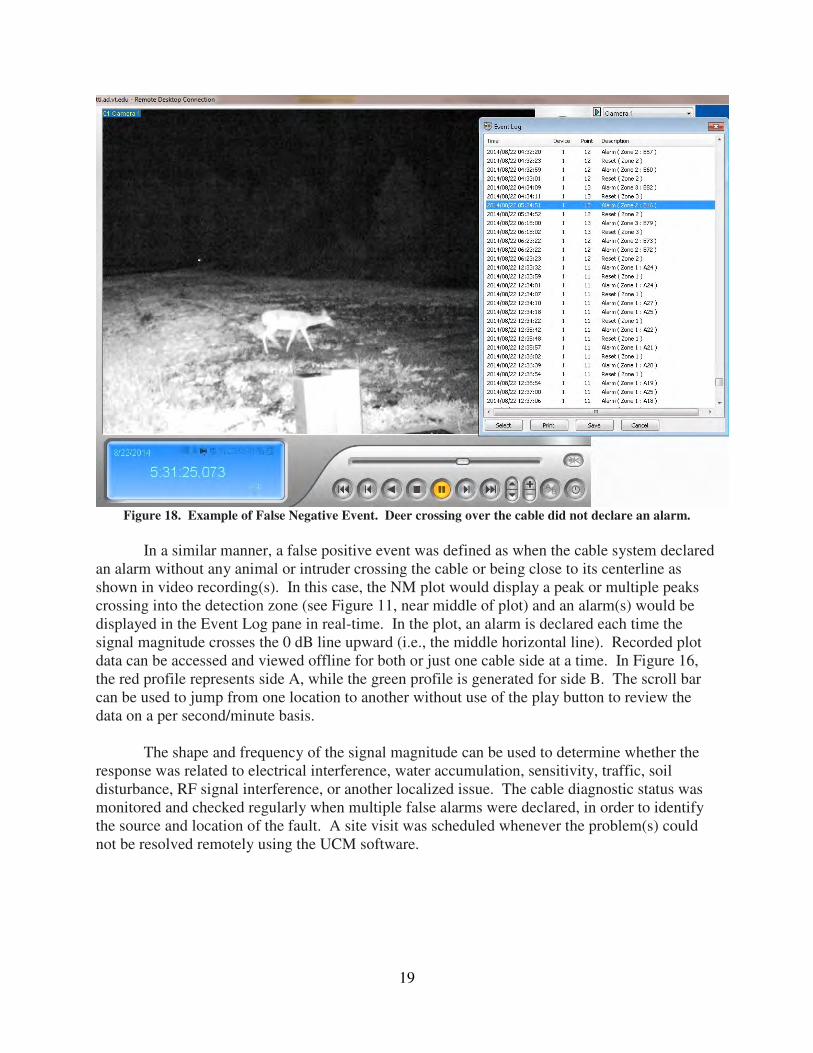
A false negative event occurred when an intruder (animal) crossed over the cable or was inside the detection zone (see Figure 16) and an alarm was not declared. This scenario can take place under two conditions: (1) the detection threshold is set too low or (2) the target speed setting is not tuned for very slow or very fast moving intruders. Figure 18 illustrates this situation occurring when a deer did not trigger an alarm while crossing the cable near the processor at 05:31. In this case, the false negative occurred due to a low detection threshold and power factor. For a false negative to occur, an animal must cross the cable or walk within a 2-ft distance of its centerline as shown in the recorded video file (in Figure 16, the deer was captured just over the cable centerline).
A situation when an animal is observed walking along the cable but outside the detection field is not considered a false negative, as the conditions described above are not met. It is treated as a valid non-detection and not taken into account when evaluating the cable for reliability. Although no alarms are declared when false negatives occur, the NM plots can be programed to record all activity near the cable for subsequent analysis. In this way, based on the video files and cable responses, adjustments can be made in the software so that this type of event may be avoided.
19
Figure 18. Example of False Negative Event. Deer crossing over the cable did not declare an alarm.
In a similar manner, a false positive event was defined as when the cable system declared an alarm without any animal or intruder crossing the cable or being close to its centerline as shown in video recording(s). In this case, the NM plot would display a peak or multiple peaks crossing into the detection zone (see Figure 11, near middle of plot) and an alarm(s) would be displayed in the Event Log pane in real-time. In the plot, an alarm is declared each time the signal magnitude crosses the 0 dB line upward (i.e., the middle horizontal line). Recorded plot data can be accessed and viewed offline for both or just one cable side at a time. In Figure 16, the red profile represents side A, while the green profile is generated for side B. The scroll bar can be used to jump from one location to another without use of the play button to review the data on a per second/minute basis.
The shape and frequency of the signal magnitude can be used to determine whether the response was related to electrical interference, water accumulation, sensitivity, traffic, soil disturbance, RF signal interference, or another localized issue. The cable diagnostic status was monitored and checked regularly when multiple false alarms were declared, in order to identify the source and location of the fault. A site visit was scheduled whenever the problem(s) could not be resolved remotely using the UCM software.

20
RESULTS AND DISCUSSION
System Operation and Data Analysis
Detection Threshold Adjustments
Cable response plots (i.e., NM plots) and video footage were collected continuously for
10 months, starting in May 2014 and ending in February 2015. Tuning was performed on the cable system for the first three months, as issues related to fiber optic communication and power outages affected the detection process. In this regard, the detection threshold was increased from an initial value of 13.5 dB (set during May) to 15.8 dB by mid-August, and kept at this level for the rest of the testing period. Each increase phase was combined with a target speed adjustment in the UCM program. For the final speed setting, sliders were moved to the slowest and fastest positions (i.e., the far left position for low speed and the far right position for high speed). The last threshold increase was associated with an increase in the cable power from 2.5 dBm to 3 dBm to compensate for the soil subsidence (i.e., soil settlement due to rain) which, in some cases, affected the detection. This was also reflected in the “False Negatives” column (Table 1) especially during the months of July and August.
As an example of how threshold settings work, when using the default setting of 13.5 dB
for the cable margin, the alarm threshold is 13.5 dB below the cable’s peak reading (see calibration profile in the Appendix). Whenever the processor detects a target with a signal that is within the set threshold value of the recorded sensitivity profile, an alarm is declared. In this study, only events when the animal(s) were crossing or were within the detection field were considered as one of the three possible scenarios described previously: valid detection, false negative, or false positive. Valid non-detections (i.e., no triggered alarms) were not taken into account as the animals were not crossing nor were they inside the cable detection field.
Data Analysis
Cable Reliability
A detection log containing the most relevant variables needed for the cable performance
evaluation (e.g., animal kind, valid detection, crossing time, etc.) was created and updated regularly for all events of interest (e.g., declared alarm, animal crossing, traffic, etc.) during the cable-monitoring period. The raw data, including the false negatives and positives, were acquired only for side B of the cable. Video recordings of Side A of the cable, taken using a different camera, were verified each time alarms were declared to ensure that not all the declared alarms were false positives and that the animal crossings did not yield false negatives. The events that occurred on side A of the cable made up about 1% of the events recorded on side B. The random verifications of side A indicated that the cable was accurately detecting (85% or better) most of the animals that were crossing or walking near the cable.
Reliability, or system performance, was defined as the capability of the ADS to provide an adequate number of valid detections while properly installed and calibrated. Table 1 presents

21
the data collected and used to perform a reliability analysis of the cable. Over 95% of the data collected per month were related to white-tailed deer activity in the area, followed by coyote (about 4%), and bear and fox (less than 1%). Reliability (R) percentage was calculated using the following equation:
R = NVD / NRE = NVD / (NVD + NFN + NFP) where NVD = the total number of valid detections (as defined in the previous section)
NRE = the total number of recorded events that occurred during the 10 month monitoring period
NFN = the total number of false negative events
NFP = the total number of false positive events. This number was considered zero due to a temporary issue with the cable detection, which was resolved in a timely manner.
As shown in Table 1, the number of valid detections was much higher than the number of animals detected due to the fact that one particular animal could trigger multiple alarms if it crossed multiple times or just walked or ran along the cable. The number of false negatives was relatively low for May and June, as the system was not fully operational due to technical and communication issues. This is reflected by the low number of analyzed hours during that period. Also, some of the animals crossing the cable were fawns, and were therefore lighter than an adult white-tailed deer, which typically weighs around 160 lb or more. Moreover, this period coincided with the time frame when the detection threshold was at a low level.
Table 1. Animal Detection Recorded Events to Evaluate the System Reliability
Month
Total No. of Animals Valid
Detections
False
Negatives
False
Positives
Hours
Analyzed
Reliability
R (%) Deer Coyote Bear Fox
May 10 4 0 0 14 5 0 360b 74 @ 13.5 dB
Jun 18 3 2 0 26 22 0 420 54 @ 13.5 dB
Jul 254 3 0 0 374 156a 0 672 70.6 @ 14.3 dB
Aug 146 4 1 1 295 72 0 744 80.4 @ 14.3 dB
Sep 88 2 0 2 202 14 0 720 93.5 @ 15.8 dB
Oct 170 5 0 0 389 14 0 696 96.5 @ 15.8 dB
Nov 150 8 0 0 383 10 0 720 97.5 @ 15.8 dB
Dec 184 3 0 0 645 18 0 720 97.3 @ 15.8 dB
Jan 82 11 0 0 326 5 0 720 98.5 @ 15.8 dB
Feb 56 4 0 0 196 1 0 720 99.5 @ 15.8 dB
Total 1158 47 3 3 2850 317 0 6492 - a The high number of false negatives was due to the fact that the 14.3 dB detection threshold was used in combination with four target speed adjustments (one per week), and most of the deer (92%) walked over or along the cable. The lowest target speed (left slider), which would have sensed more of the slow moving deer, was selected in the last week, while higher speed settings were used for most of the month. b Fewer hours were analyzed during some months (especially May and June) due to water infiltrations and rodents in the bunkers where the fiber cable’s converters were installed, causing the fiber optic network to be faulty.

22
A decrease in the number of false negatives occurred beginning in mid-August after the detection threshold was raised to 15.8 dB and the cable power factor increased to 3 dBm. This led to improved reliability, from approximately 70% in August to over 93% starting in September. The reason there were still some false negatives after this tuning was attributable to the ground subsidence of a cable section from meter 105 to meter 122, which affected the overall density of the soil layer covering the cables. Additional compaction of the soil in that area did not improve the detection, although a slight improvement took place after the first snowfall in November. It appeared that some of the air voids were filled with finer material from the top, which made the detection signal flatter. One method that could have slightly improved the detection level of the cable would have been to further increase the detection threshold to an even higher value; however, this would have increased the cable sensitivity excessively. After such an increase in sensitivity, Zone 4 of the cable may have potentially detected some of the passing vehicles, creating interference and eventually causing a surge in nuisance alarms. The false positives recorded by the ADS were not taken into consideration when calculating reliability. They were considered a temporary issue due to water accumulation in the depressions over the cable created by maintenance vehicles. Once they were leveled and compacted, water did not create further problems, and the false positives were eliminated. Infrequent false positives were declared in the NM software only when regular maintenance work was performed on the power lines feeding the system’s power supplies. The data collected also provided some information on the cable zones that were trafficked the most during the 10-month monitoring period (Table 2). The data in the table indicates that deer mainly preferred to cross the half of the cable located closer to the wooded margins near the turnaround (i.e., 2nd Zone 2 and Zone 4, as shown in Figure 19). It is possible they felt safer in those zones while eating and crossing back and forth from one side of the road to the other. They may have also been reluctant to cross at the first Zone 2 due to the presence of two guardrails on each side of the road and/or the lengthy travel distance to the wooded area on the other side of the road.
Table 2. Animal Detection Recorded Events by Trafficked Cable Zonea
Month
1st Zone 2
(10m to 74m)
Zone 3
(75m to 85m)
2nd Zone 2
(86m to 135m)
Zone 4
(136m to 147m)
May 4 2 5 3
Jun 12 3 15 6
Jul 36 18 137 59
Aug 36 4 78 20
Sep 9 9 62 17
Oct 24 10 95 31
Nov 21 7 86 28
Dec 18 6 102 42
Jan 5 8 59 25
Feb 8 1 23 23
Total 173 68 662 254 a Zone crossing occurrences only (not the number of animals that crossed or the number of detections within a certain zone).
23
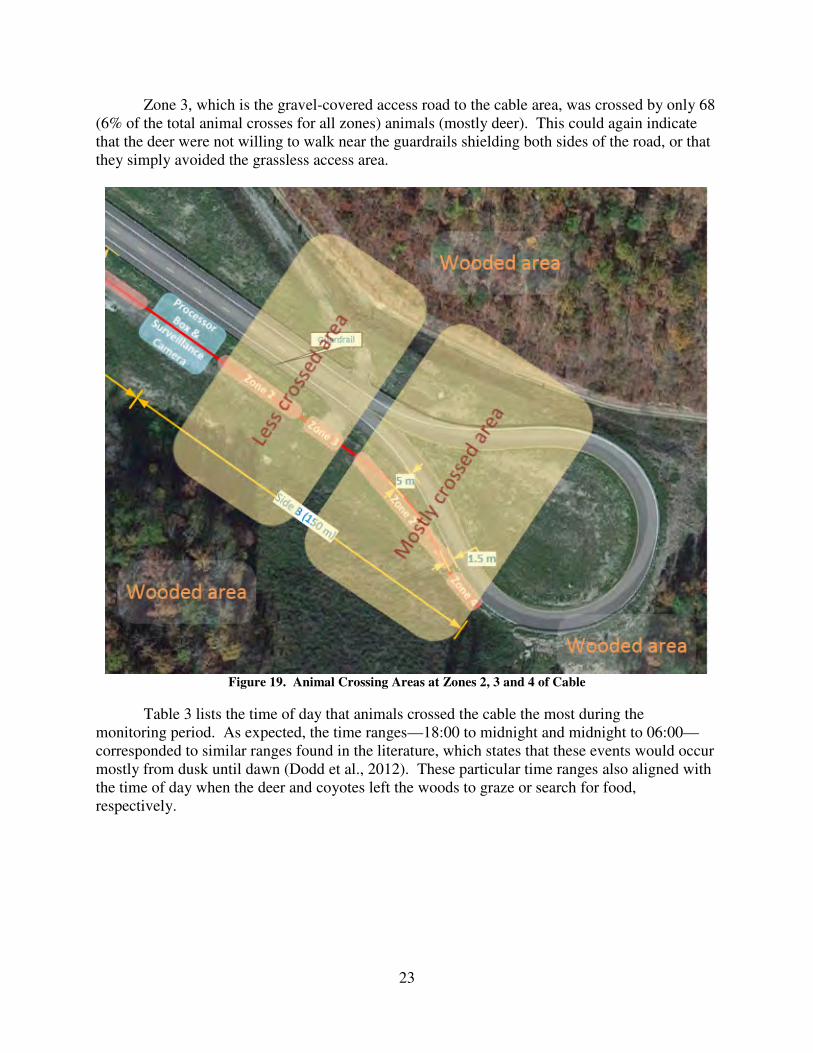
Zone 3, which is the gravel-covered access road to the cable area, was crossed by only 68 (6% of the total animal crosses for all zones) animals (mostly deer). This could again indicate that the deer were not willing to walk near the guardrails shielding both sides of the road, or that they simply avoided the grassless access area.
Figure 19. Animal Crossing Areas at Zones 2, 3 and 4 of Cable
Table 3 lists the time of day that animals crossed the cable the most during the monitoring period. As expected, the time ranges—18:00 to midnight and midnight to 06:00—corresponded to similar ranges found in the literature, which states that these events would occur mostly from dusk until dawn (Dodd et al., 2012). These particular time ranges also aligned with the time of day when the deer and coyotes left the woods to graze or search for food, respectively.
24
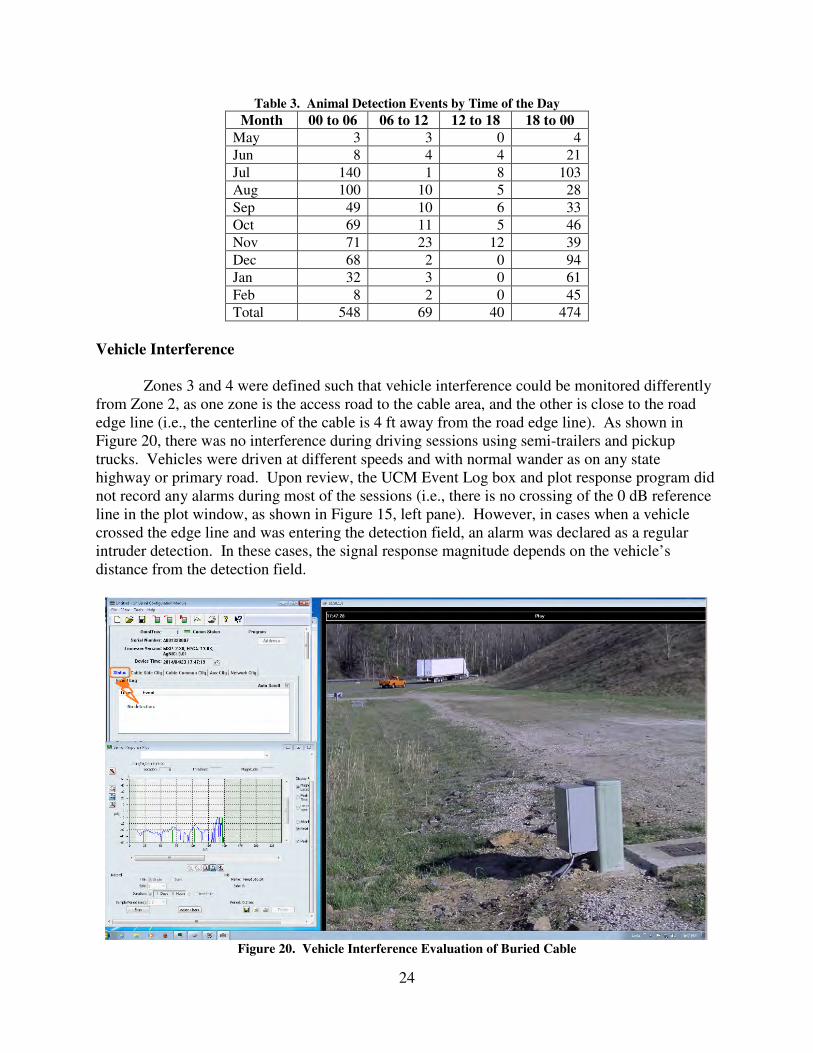
Table 3. Animal Detection Events by Time of the Day
Month 00 to 06 06 to 12 12 to 18 18 to 00
May 3 3 0 4
Jun 8 4 4 21
Jul 140 1 8 103
Aug 100 10 5 28
Sep 49 10 6 33
Oct 69 11 5 46
Nov 71 23 12 39
Dec 68 2 0 94
Jan 32 3 0 61
Feb 8 2 0 45
Total 548 69 40 474
Vehicle Interference
Zones 3 and 4 were defined such that vehicle interference could be monitored differently from Zone 2, as one zone is the access road to the cable area, and the other is close to the road edge line (i.e., the centerline of the cable is 4 ft away from the road edge line). As shown in Figure 20, there was no interference during driving sessions using semi-trailers and pickup trucks. Vehicles were driven at different speeds and with normal wander as on any state highway or primary road. Upon review, the UCM Event Log box and plot response program did not record any alarms during most of the sessions (i.e., there is no crossing of the 0 dB reference line in the plot window, as shown in Figure 15, left pane). However, in cases when a vehicle crossed the edge line and was entering the detection field, an alarm was declared as a regular intruder detection. In these cases, the signal response magnitude depends on the vehicle’s distance from the detection field.
Figure 20. Vehicle Interference Evaluation of Buried Cable
25
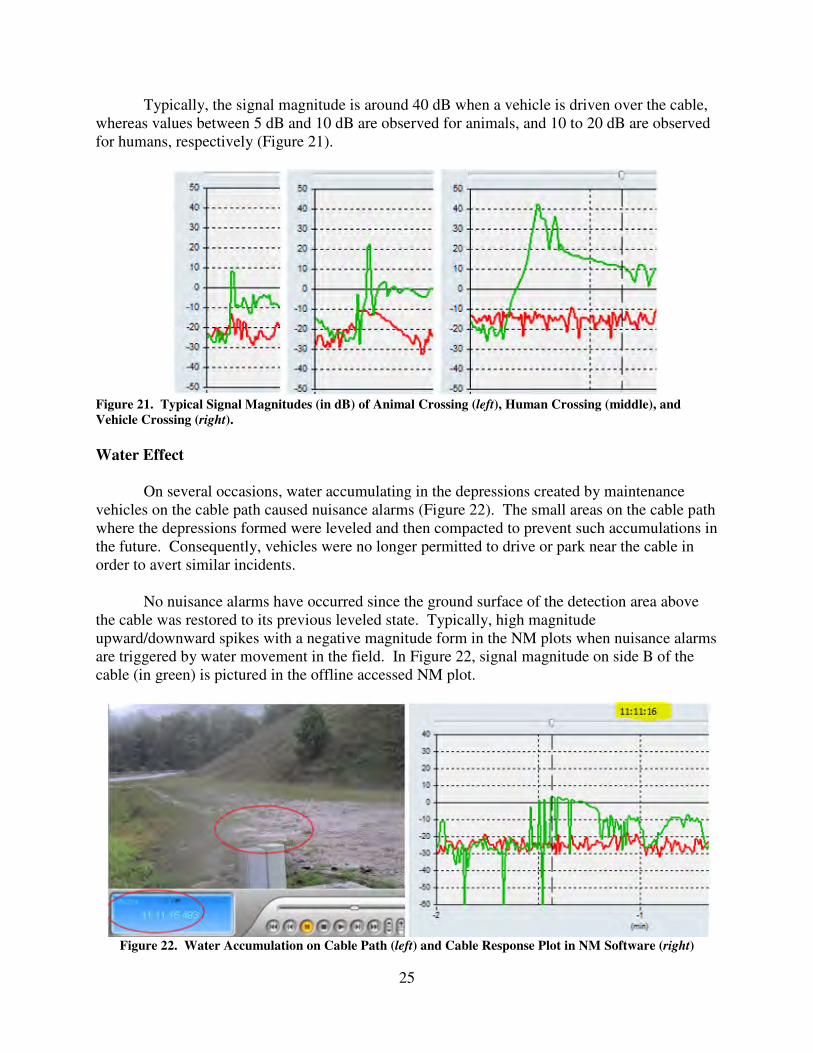
Typically, the signal magnitude is around 40 dB when a vehicle is driven over the cable, whereas values between 5 dB and 10 dB are observed for animals, and 10 to 20 dB are observed for humans, respectively (Figure 21).
Figure 21. Typical Signal Magnitudes (in dB) of Animal Crossing (left), Human Crossing (middle), and
Vehicle Crossing (right).
Water Effect
On several occasions, water accumulating in the depressions created by maintenance vehicles on the cable path caused nuisance alarms (Figure 22). The small areas on the cable path where the depressions formed were leveled and then compacted to prevent such accumulations in the future. Consequently, vehicles were no longer permitted to drive or park near the cable in order to avert similar incidents.
No nuisance alarms have occurred since the ground surface of the detection area above the cable was restored to its previous leveled state. Typically, high magnitude upward/downward spikes with a negative magnitude form in the NM plots when nuisance alarms are triggered by water movement in the field. In Figure 22, signal magnitude on side B of the cable (in green) is pictured in the offline accessed NM plot.
Figure 22. Water Accumulation on Cable Path (left) and Cable Response Plot in NM Software (right)

26
Snowfall Effect
The threshold was not adjusted to compensate for any adverse snow effects, and system performance indicated that snow coverage of the cable as deep as 3 ft did not affect its detection field. In Figure 23, a VDOT maintenance truck is plowing an additional 2-ft layer of snow on top of an already existing 1-ft thick blanket of snow. Snow coverage as a result of plowing occurred twice subsequent to snow events during the period between February 18 and February 26. In addition, no false positives or other events occurred during or after the snowfall.
Figure 23. Maintenance Truck Plowing Snow Over Cable
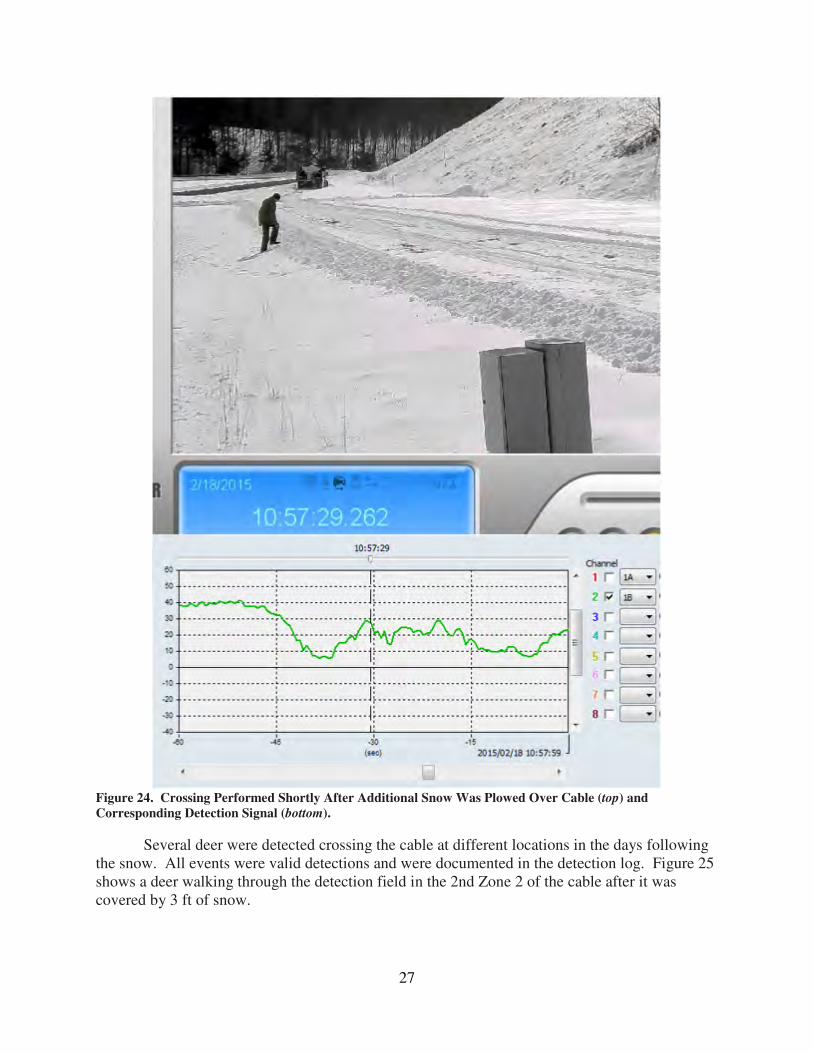
Shortly after being covered by snow, several crossings were performed over the cable by human subjects to further verify its detection capabilities in such conditions (Figure 24). Crossings were executed at different speeds every 20 ft on side B of the cable. The data were analyzed following the same procedures previously described. Cable responses (i.e., signal magnitudes in dB) similar to those recorded before the cable was covered by snow were recorded during tests from both human and vehicle crossings. The signal peaks in Figure 24 correspond to side B only. A walk along the cable path in 1-ft snow depth was performed for the entire side B prior to plowing additional snow over the cable to ensure there were no locations with a weaker detection signal. Furthermore, no false positive or nuisance alarms were triggered by the melting snow during the first week in March when the temperatures had significantly increased.
27
Figure 24. Crossing Performed Shortly After Additional Snow Was Plowed Over Cable (top) and
Corresponding Detection Signal (bottom).
Several deer were detected crossing the cable at different locations in the days following the snow. All events were valid detections and were documented in the detection log. Figure 25 shows a deer walking through the detection field in the 2nd Zone 2 of the cable after it was covered by 3 ft of snow.

28
Figure 25. Event Log Alarm Data (top) and NM Plot (bottom) of Deer Crossing Over Snow-Covered Cable
The screen shots in Figure 25 show a similar time for and location of a deer crossing the cable, rendering the cross as a valid detection. A second deer crossed the cable at the same location (also a valid detection) several seconds later, as shown by both the event log window and the second peak to the right in the NM plot window.
29
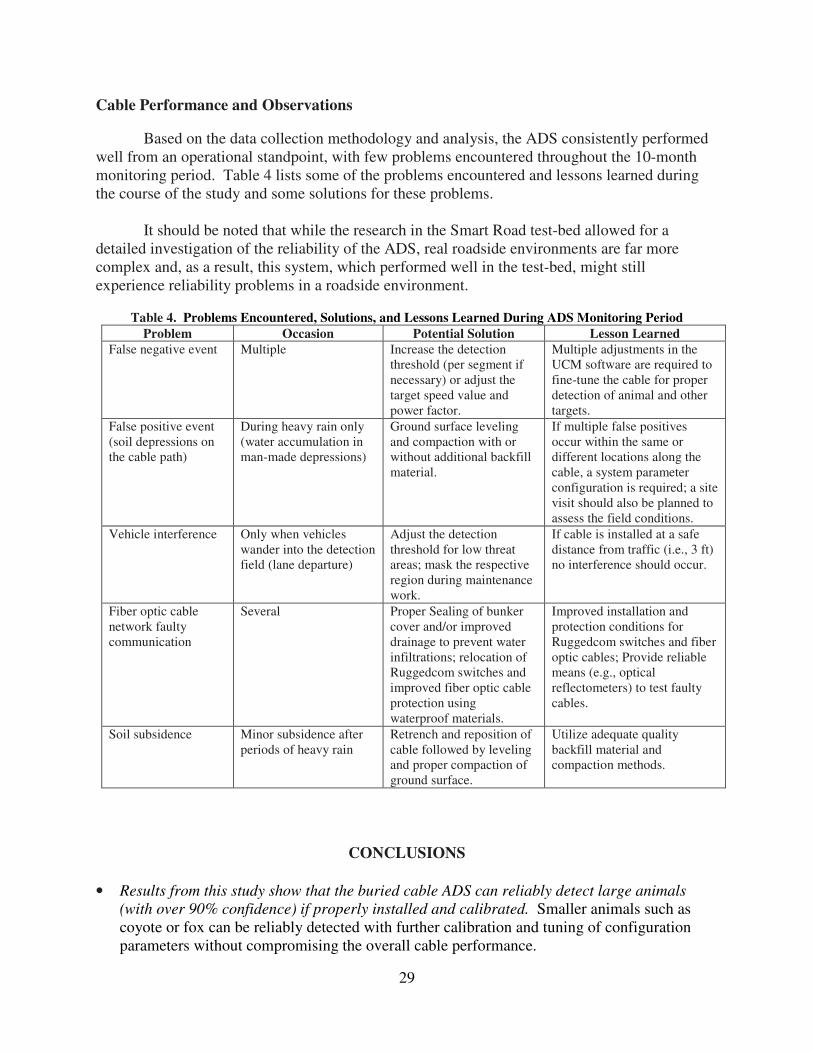
Cable Performance and Observations
Based on the data collection methodology and analysis, the ADS consistently performed well from an operational standpoint, with few problems encountered throughout the 10-month monitoring period. Table 4 lists some of the problems encountered and lessons learned during the course of the study and some solutions for these problems. It should be noted that while the research in the Smart Road test-bed allowed for a detailed investigation of the reliability of the ADS, real roadside environments are far more complex and, as a result, this system, which performed well in the test-bed, might still experience reliability problems in a roadside environment.
Table 4. Problems Encountered, Solutions, and Lessons Learned During ADS Monitoring Period Problem Occasion Potential Solution Lesson Learned
False negative event Multiple Increase the detection threshold (per segment if necessary) or adjust the target speed value and power factor.
Multiple adjustments in the UCM software are required to fine-tune the cable for proper detection of animal and other targets.
False positive event (soil depressions on the cable path)
During heavy rain only (water accumulation in man-made depressions)
Ground surface leveling and compaction with or without additional backfill material.
If multiple false positives occur within the same or different locations along the cable, a system parameter configuration is required; a site visit should also be planned to assess the field conditions.
Vehicle interference Only when vehicles wander into the detection field (lane departure)
Adjust the detection threshold for low threat areas; mask the respective region during maintenance work.
If cable is installed at a safe distance from traffic (i.e., 3 ft) no interference should occur.
Fiber optic cable network faulty communication
Several Proper Sealing of bunker cover and/or improved drainage to prevent water infiltrations; relocation of Ruggedcom switches and improved fiber optic cable protection using waterproof materials.
Improved installation and protection conditions for Ruggedcom switches and fiber optic cables; Provide reliable means (e.g., optical reflectometers) to test faulty cables.
Soil subsidence Minor subsidence after periods of heavy rain
Retrench and reposition of cable followed by leveling and proper compaction of ground surface.
Utilize adequate quality backfill material and compaction methods.
CONCLUSIONS
• Results from this study show that the buried cable ADS can reliably detect large animals
(with over 90% confidence) if properly installed and calibrated. Smaller animals such as coyote or fox can be reliably detected with further calibration and tuning of configuration parameters without compromising the overall cable performance.

30
• The ADS detection response (signal magnitude) can differentiate between animals, humans,
and vehicle intruders. Based on these responses, cable parameter settings can be adjusted so that certain zones or segments can be configured differently in the software. For instance, the detection threshold can be increased/decreased, and various cable segments can be defined as inactive depending on the level of threat for the respective zone.
• The ADS performs well under various traffic conditions. Only vehicles that cross the edge line and enter the detection field trigger the alarm. The magnitude of the signal depends on how far the vehicle extends into the detection field. The closer to the cable centerline the vehicle is, the higher the signal magnitude will be.
• The ADS detection threshold is not affected by snowfall. The ADS provides valid detections when covered by 3 ft of snow. False or nuisance alarms are not triggered by wind-blown or melted snow.
RECOMMENDATIONS
1. Operations staff of VDOT’s Staunton District should support VCTIR in sponsoring a pilot
study to perform a “real world” evaluation of the ADS on a public road at a location known
to have a high rate of AVCs. The study should evaluate the following:
• The reliability, installation and maintenance issues, and potential safety impacts of ADS.
• An ADS driver warning algorithm using the Smart Road test site. This algorithm would use raw data from the ADS along with other factors such as yearly season, time of day, etc., to generate more reliable alerts to present to approaching drivers. This algorithm would be developed and tested at the Smart Road and later tested at the site implemented as recommended here.
2. If the ADS is found to detect large animals reliably on a section of public road, the
operations staff of VDOT’s Staunton District should deploy a driver alerting system at the
ADS test site and the effect of these alerts on driver behavior and AVC occurrence should be
determined.
BENEFITS AND IMPLEMENTION PLAN
Benefits
The costs associated with the buried cable ADS are very low compared to other similar
systems, as little maintenance and only a short training session on how to operate the system are required. Collecting and analyzing the data is also a straightforward and simple process involving basic computer and video imaging and analysis knowledge. Also, according to an

31
AVC reduction report to Congress (Huijser et al., 2008), the estimated cost per AVC, including factors such as property damage, human injury, and carcass removal and disposal, is $8,388. In this regard, financial costs to implement the buried cable system are expected to be offset by savings to drivers and the commonwealth. A simple calculation indicates that at approximately $120-per-meter of installed cable, including training and video surveillance, the prevention of just four AVCs by the buried cable would suffice to cover the costs for the installation of a similar detection system. Successful implementation of the ADS will result in improved safety and decreased property damage, congestion, and traffic delays. At the same time, the advent of connected vehicle technology offers new opportunities for preventing and mitigating AVCs through the capability to provide in-vehicle alerts based on infrastructure-based animal detection.
Implementation Plan
Given the success of the ADS on the Virginia Smart Road, VCTIR and VTTI have initiated discussions with the transportation operations staff of VDOT’s Northwest Region for a potential real-world evaluation of the ADS. Important considerations in the selection of a road section for the ADS evaluation have been communicated to VDOT operations staff. If contract study funding allows, VCTIR will continue to coordinate with VDOT’s Northwest Region and the appropriate VDOT Transportation Operations Center for site selection and ADS installation.
ACKNOWLEDGMENTS
Research staff at VTTI, in cooperation with VCTIR, conducted this project. The authors acknowledge the cooperation of engineers at VTTI’s Center for Technology Development (CTD) for their valuable input and for sharing their experience regarding network communication and data collection and storage. The authors also acknowledge the assistance and direction from the VDOT and VCTIR technical review panel and other reviewers: Lance Dougald, Linda Evans, Michael Fitch, Teresa Gardner, Jose Gomez, Noah Goodall, Vernon Hoke, David Morris, and Amy O’Leary.
REFERENCES
Ahern, J., Jennings, L., Fenstermacher, B., Warren, P., Charney, N., Jackson, S., Mullin, J.,
Kotval, Z., Brena, S., Civjan, S., and Carr, E. Issues and Methods for Transdisciplinary Planning of Combined Wildlife and Pedestrian Highway Crossings. In Transportation
Research Record: Journal of the Transportation Research Board, No. 2123.
Transportation Research Board of the National Academies, Washington, DC, 2009, pp. 129-136.

32
Clevenger, A.P., and Huijser, M.P. Handbook for Design and Evaluation of Wildlife
Crossing Structures in North America. Federal Highway Administration, Washington DC, 2009. Colorado Department of Transportation. Invitation for Bid: Research Project on Animal-Vehicle
Collisions. IFB # HAA 08- 038-TW. Denver, 2008. Conover, M.R., Pitt, W.C., Kessler, K.K., DuBow, T.J., and Sanborn, W.A. Review of Human Injuries, Illnesses, and Economic Losses Caused by Wildlife in the United States.
Wildlife Society Bulletin, Vol. 23, 1995, pp. 407-414. Curtis, P.D., and Hedlund, J.H. Reducing Deer-Vehicle Crashes. Wildlife Damage Management
Fact Sheet Series. Cornell Cooperative Extension, Ithaca, NY, 2005, pp. 1-6. Dai, Q., Young, R., and Giessen, S.V. Evaluation of an Active Wildlife-Sensing and Driver
Warning System at Trapper’s Point. FHWA-WY-09/03F. Department of Civil and Architectural Engineering, University of Wyoming, Laramie, 2008.
Defenders of Wildlife. Wildlife Facts Fact Sheet, 2007. www.WatchOutforWildlife.org. Accessed July 16, 2014.
Dodd, N.L., and Gagnon, J.W. Preacher Canyon Wildlife Fence and Crosswalk Enhancement
Project, State Route 260, Arizona. Project JPA 04-088. Arizona Game and Fish Department, Research Branch, Phoenix, 2008.
Dodd, N.L., Gagnon, J.W., Sprague, S., Boe, S., and Schweinsburg, R.E. Wildlife Accident
Reduction Study and Monitoring: Arizona State Route 64. FHWA-AZ-12-626. Arizona Game and Fish Department and Arizona Department of Transportation, Phoenix, 2012.
Donaldson, B.M., and Moruza, A.K. An Assessment of the Animal Carcass Disposal Practices
of the Virginia Department of Transportation and Guidance for the Selection of
Alternative Carcass Management Options. VTRC 10-R7. Virginia Transportation Research Council, Charlottesville, 2010. Donaldson, B.M., and White, J.W. Composting Animal Mortality Removed From Roads: A Pilot
Study of Rotary Drum and Forced Aeration Compost Vessels. VTRC 13-R8. Virginia Transportation Research Council, Charlottesville, 2013.
Gray, M. Advances in Wildlife Crossing Technologies. Public Roads, Vol. 73, No. 2, 2009, pp.
14-21. Hughes, W.E., Saremi, A.R., and Paniati, J.F. Vehicle-Animal Crashes: An Increasing Safety Problem. Institute of Transportation Engineers Journal, Vol. 66, 1996, pp. 24-28.
33
Huijser, M.P., and McGowen, P.T. Overview of Animal Detection and Animal Warning Systems in North America and Europe. In 2003 Proceedings of the International
Conference on Ecology and Transportation, C.L. Irwin, P. Garrett, and K.P. McDermott, Eds., 2003, pp. 368-382.
Huijser, M.P., McGowen, P.T., Camel, W., Hardy, A., Wright, P., Clevenger, A.P., Salsman, L.,
and Wilson, T. Animal Vehicle Crash Mitigation Using Advanced Technology: Phase I:
Review, Design and Implementation. FHWA-OR-TPF-07-01. Western Transportation Institute, Montana State University, Bozeman, 2006.
Huijser, M.P., McGowen, P., Fuller, J., Hardy, A, Kociolek, A, Clevenger, A.P., Smith, D., and Ament, R. Wildlife-Vehicle Collision Reduction Study. Report to Congress. Federal
Highway Administration, Washington DC, 2008. Huijser, M.P., Duffield, J.W., Clevenger, A.P., Ament, R.J., and McGowen, P.T. Cost-Benefit
Analyses of Mitigation Measures Aimed at Reducing Collisions with Large Ungulates in the United States and Canada: A Decision Support Tool. Ecology and Society, Vol. 14, No. 2, 2009a, pp. 15-22.
Huijser, M.P., Holland, T.D., Kociolek, A.V., Barkdoll, A.M., and Schwalm, J.D. Animal-
Vehicle Crash Mitigation Using Advanced Technology: Phase II: System Effectiveness
and System Acceptance. FHWA-OR-TPF-09-14. Western Transportation Institute, Montana State University, Bozeman, 2009b.
Huijser, M.P., Holland, T.D., Blank, M., Greenwood, M.C., McGowen, P.T., Hubbard, B., and
Wang, S. The Comparison of Animal Detection Systems in a Test-Bed: A Quantitative
Comparison of System Reliability and Experiences with Operation and Maintenance. FHWA/MT-09-002/5048. Western Transportation Institute, Montana State University, Bozeman, 2009c.
Maine Interagency Work Group on Wildlife/Motor Vehicle Collisions. Collisions Between Large
Wildlife Species and Motor Vehicles in Maine: Interim Report, 2001. http://www.maine.gov/mdot/safety/documents/pdf/moosereport.pdf. Accessed June 18, 2015.
Romin, L.A., and Bissonette, J.A. Deer-Vehicle Collisions: Status of State Monitoring Activities and Mitigation Efforts. Wildlife Society Bulletin, Vol. 24, 1996, pp. 276-283. Senstar OmniTrax®. Ranging Buried Cable Intrusion Detection Sensor, Product Guide. Rev.
Ed. Senstar Corporation, 2013. Sharafsaleh, M., Huijser, M., Kuhn, T., Spring, J., and Felder, J. Evaluation of an Animal
Warning System Effectiveness. California PATH Research Report, UCB-ITS-PRR-2010-22. California Department of Transportation, 2010.

34
Valitzski, S.A., D’Angelo, G.J., Gallagher, G.R., Osborn, D.A., Miller, K.V., and Warren, R.J. Deer Responses to Sounds from a Vehicle-Mounted Sound-Production System. The
Journal of Wildlife Management, Vol. 73, No. 7, 2009, pp. 1072-1076.
35
APPENDIX
BURIED CABLE SYSTEM INSTALLATION AND CALIBRATION GUIDELINES
Cable System Installation Procedure
Once the telecom enclosure is installed in a concrete base, the OmniTrax® weatherproof enclosure housing the system’s processor is mounted inside and the alarm communication wiring is connected. Non-detecting lead-in cables connect to the external bulkhead connectors on the bottom of the OmniTrax® enclosure. Also, mini-coax cables inside the enclosure connect the bulkhead connectors to the processor circuit card. During installation, the lead-in and detecting cables must cross each other at a 90° angle with the detecting cable installed above the lead-in cable. The detecting and 70-ft long lead-in cables must not touch at the crossover zone as this will create electromagnetic cross-talk that contributes to nuisance alarms. Therefore, a vertical separation of at least 2 in over a 2-ft distance should be provided between the cables, with the lead-in portion of the cable being buried deeper than the detection cable.
Moreover, laying the cables in areas that are filled with debris containing large metallic objects should be avoided as these objects usually have electrical properties that can affect the detection field. Typically, metallic objects will generate nuisance alarms due to the fact that their electrical properties get altered as ground conditions change in time. In addition, metal objects can also interfere with the sensitivity of the cable, thus causing variations in the detection field size. Likewise, rocks and sharp debris should be removed from the trench during the installation to avoid subsequent damage to the cable following the backfill operation. These factors coupled with environmental factors such as loose, uncompacted soil, and/or variances in cable depth and spacing can lead to an increase in false alarms, thereby affecting the overall reliability of the system. In general, following these recommended installation procedures will prevent any cable cross-talk interference that could potentially disrupt the normal operation of the system.
Cable System Calibration and Parameter Setup
Before applying power to calibrate the system, the sensor cable connections and the wiring connections to the processor must be verified to ensure that there are not any loose, unfastened, or moving parts. To calibrate the OmniTrax® cable sensor, a setup of the initial configuration parameters such as network type, device type, Internet protocol (IP) address, etc. is required, followed by a sensitivity profile (SP) procedure. Also, depending on the site conditions, a fine tune of the OmniTrax® sensor can be performed by adjusting the processor’s configuration parameters.
Cable Calibration Procedure
The cable sensor calibration can be accomplished by using the Universal Configuration Module (UCM), a Windows-based software application, which serves as the calibration, setup, and maintenance tool for the OmniTrax® system (Figure A1).

36
Figure A1. Screenshot of UCM Main Window Showing Cable Status Menu
The UCM communicates with the OmniTrax® processor directly through a USB connection on the processor, or remotely via a Silver Network Manager. When starting the UCM, a window display allows the user to specify the device to which the connection needs to be established (i.e., USB direct connection or network connection). Once the initial setup of the parameters is complete, the main UCM window for the OmniTrax® processor displays. This window allows the user to perform various tasks, such as checking the status of the cable, changing parameter configurations, scrolling through event history, and/or saving data files – including plots – for offline access and manipulation. To record a plot file in the UCM software, one of the researchers walked the full length of the centerline cable with the processor on and the UCM program running. The recorded response plot, or the sensitivity profile (SP), was then analyzed to ensure a uniform cable response to the person’s body weight (about 170 lb in this case). The SP plot was also analyzed to identify any obvious signs of excessive noise (i.e., cable’s response in the absence of a valid target) near the processor enclosure and/or the ends of the cable. This verification is required to ensure that the lead-in and termination cable portions are not detecting any crossing events.

37
Typically, the SP created during this procedure becomes the baseline for setting the cable margin for the full length of the buried detecting cable (Figure A2) as will be explained in the following section. Side B zoning of the cable (Z2, Z3, Z4) can be seen in the figure along with the profile margin (gray line) and detection thresholds (red line). The meter 0 to meter 10 of the plot indicates the non-detecting area corresponding to the lead-in cable section.
Figure A2. Cable Sensitivity Profile (Grey Line) for Side B. The blue pointer above the plot indicates the
locations along the cable to check threshold, in this case meter 120 in the second Zone 2 at 105 dB.
The x-axis represents the cable length in meters (m), whereas the y-axis shows the signal magnitude in decibels (dB). The overall cable and segment (red line in the plot) detection thresholds are similar (i.e., they overlap), as the cable response to the test crossings was constant along its whole length. Threshold changes to certain segments of the cable would have been made if the cable response had showed major peaks or valleys while being tested. The centerline cable walk was stopped once the walker went 20 ft past the decouplers at both ends of the cable. After analysis, the SP was considered acceptable, and the recorded file was updated and then downloaded to the processor. The SP can be also edited so that weaker detection or high clutter signals are trimmed out, especially near cable ends. Figure A3 shows how the cable responds to test crossings (here, on side B of the cable) in order to validate the proper SP before a calibration file is uploaded to the processor. This program also offers discrete signal pulses for each meter of cable, with peak captures, which closely follow the cable burial location centerline during a calibration walk. The profile saves the last signal magnitude recorded during testing. Several display formats are available depending on the user’s requirements (e.g., perform calibration, check a signal problem
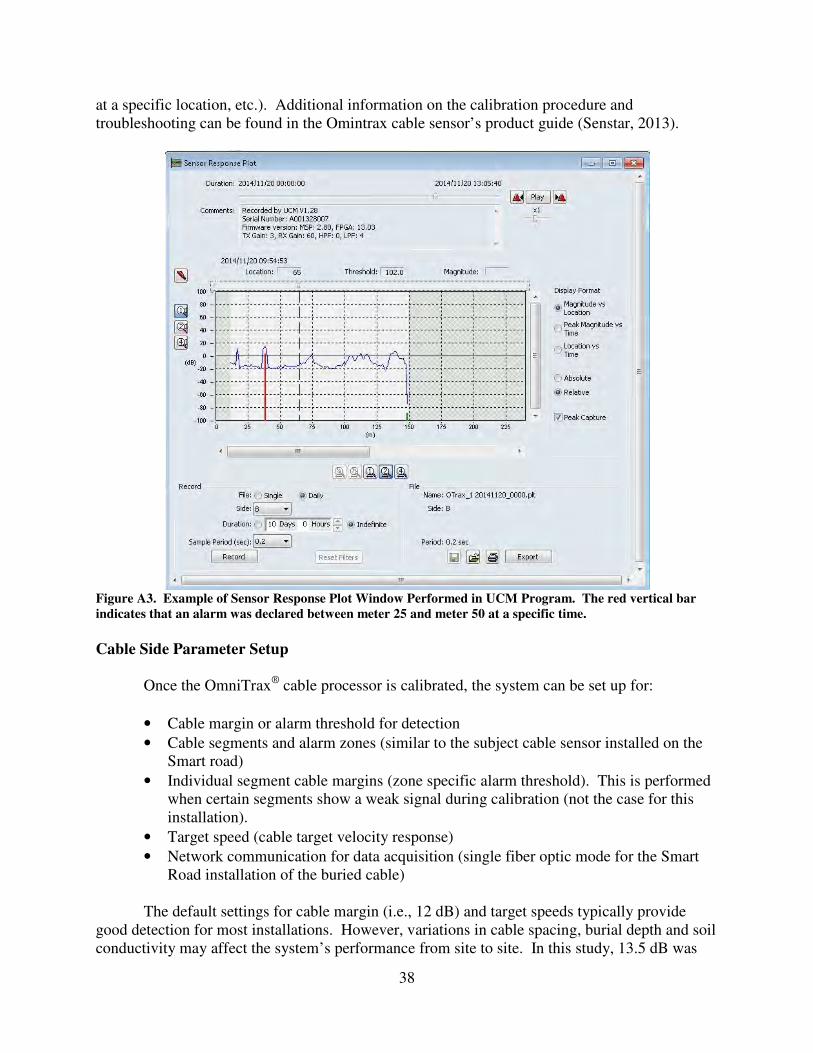
38
at a specific location, etc.). Additional information on the calibration procedure and troubleshooting can be found in the Omintrax cable sensor’s product guide (Senstar, 2013).
Figure A3. Example of Sensor Response Plot Window Performed in UCM Program. The red vertical bar
indicates that an alarm was declared between meter 25 and meter 50 at a specific time.
Cable Side Parameter Setup
Once the OmniTrax® cable processor is calibrated, the system can be set up for:
• Cable margin or alarm threshold for detection
• Cable segments and alarm zones (similar to the subject cable sensor installed on the Smart road)
• Individual segment cable margins (zone specific alarm threshold). This is performed when certain segments show a weak signal during calibration (not the case for this installation).
• Target speed (cable target velocity response)
• Network communication for data acquisition (single fiber optic mode for the Smart Road installation of the buried cable)
The default settings for cable margin (i.e., 12 dB) and target speeds typically provide
good detection for most installations. However, variations in cable spacing, burial depth and soil conductivity may affect the system’s performance from site to site. In this study, 13.5 dB was

39
selected as the default setting for cable margin due to the rocky soil characteristics. Subsequent adjustments were made during the evaluation period using the Cable Side Configuration feature in the UCM software (Figure A4) due to issues related to heavy rain and soil subsidence Typically, the alarm threshold adjustment for the full length of the detecting cable is attained when setting up the cable margin.
Figure A4. Cable Sensor Margin Adjusted at 15.8 dB for Side B of Cable
The cable margin defines the number of decibels below the recorded sensitivity profile’s peak response that will trigger a sensor alarm (Figure 10). The sensitivity profile serves as the baseline for the cable margin, enabling a consistent alarm threshold for each meter of detecting cable, as the cable margin closely follows the peaks and valleys of the sensitivity profile. By setting the cable margin below the recorded sensitivity profile, the alarm threshold is always lower than the known sensitivity of the cable. In this case, the cable overlapping area (Figure A4) was also set to trigger alarms on both sides of the cable system for each crossing. Target speed settings were configured concurrently with cable margins by adjusting the detection frequency filters to adequately detect fast and slow moving targets on the selected cable side. A series of intrusion tests at different locations along the cable path at the slowest and the fastest speeds were successfully performed, as the cable detected all the crossings. Testing was performed by individuals of various masses who were walking and running across the cable. During the target speed testing, the two sliders in the UCM program (one for low speed on the left and one for high speed on the right) were adjusted several times to evaluate the speed effect (Figure A5). It should be noted that cable calibration and parameter setup was performed on site at the time of the installation (December 2013) with a laptop connected directly to the processor via USB. Some of the parameters were subsequently adjusted due to weather effects (mostly heavy rains) and subsidence of the coarse aggregate backfill material.
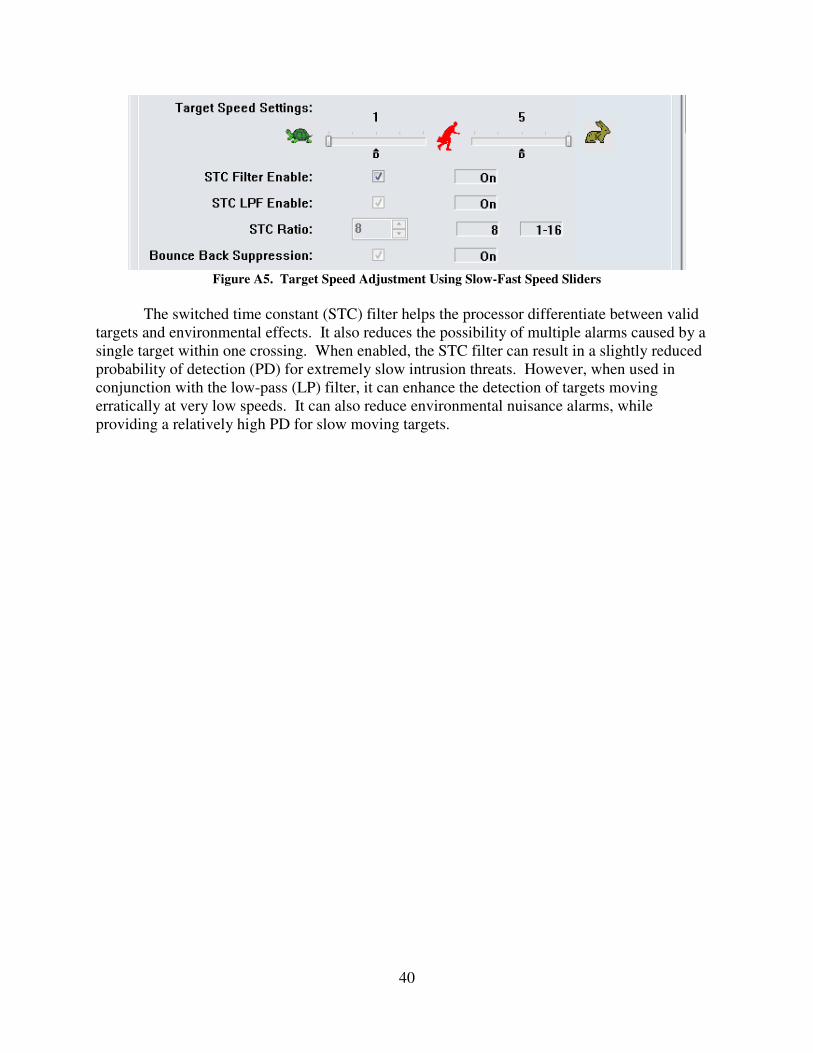
40
Figure A5. Target Speed Adjustment Using Slow-Fast Speed Sliders
The switched time constant (STC) filter helps the processor differentiate between valid targets and environmental effects. It also reduces the possibility of multiple alarms caused by a single target within one crossing. When enabled, the STC filter can result in a slightly reduced probability of detection (PD) for extremely slow intrusion threats. However, when used in conjunction with the low-pass (LP) filter, it can enhance the detection of targets moving erratically at very low speeds. It can also reduce environmental nuisance alarms, while providing a relatively high PD for slow moving targets.