Evaluating the effectiveness of carp exclusion screens at ... · screens at wetland inlets in the...
91
Evaluating the effectiveness of carp exclusion screens at wetland inlets in the River Murray, South Australia Leigh Thwaites and David Schmarr SARDI Publication No. F2019/000113-1 SARDI Research Report Series No. 1017 SARDI Aquatics Sciences PO Box 120 Henley Beach SA 5022 May 2019
Transcript of Evaluating the effectiveness of carp exclusion screens at ... · screens at wetland inlets in the...

Evaluating the effectiveness of carp exclusion
screens at wetland inlets in the River Murray, South Australia
Leigh Thwaites and David Schmarr
SARDI Publication No. F2019/000113-1
SARDI Research Report Series No. 1017
SARDI Aquatics Sciences PO Box 120 Henley Beach SA 5022
May 2019

Thwaites, L. and Schmarr, D. (2019) Carp Exclusions at Wetland Inlets in the River Murray
I
Evaluating the effectiveness of carp exclusion screens at wetland inlets in the River Murray, South Australia
Leigh Thwaites and David Schmarr
SARDI Publication No. F2019/000113-1
SARDI Research Report Series No. 1017
May 2019

Thwaites, L. and Schmarr, D. (2019) Carp Exclusions at Wetland Inlets in the River Murray
II
This publication may be cited as: Thwaites, L. and Schmarr, D. (2019). Evaluating the effectiveness of carp exclusion screens at wetland inlets in the River Murray, South Australia. South Australian Research and Development Institute (Aquatic Sciences), Adelaide. SARDI Publication No. F2019/000113-1. SARDI Research Report Series No. 1017. 80pp. South Australian Research and Development Institute SARDI Aquatic Sciences 2 Hamra Avenue West Beach SA 5024
Telephone: (08) 8207 5400 Facsimile: (08) 8207 5415 http://www.pir.sa.gov.au/research DISCLAIMER The authors warrant that they have taken all reasonable care in producing this report. The report has been through the SARDI internal review process, and has been formally approved for release by the Research Director, Aquatic Sciences. Although all reasonable efforts have been made to ensure quality, SARDI does not warrant that the information in this report is free from errors or omissions. SARDI and its employees do not warrant or make any representation regarding the use, or results of the use, of the information contained herein as regards to its correctness, accuracy, reliability and currency or otherwise. SARDI and its employees expressly disclaim all liability or responsibility to any person using the information or advice. Use of the information and data contained in this report is at the user’s sole risk. If users rely on the information they are responsible for ensuring by independent verification its accuracy, currency or completeness. The SARDI Report Series is an Administrative Report Series which has not been reviewed outside the department and is not considered peer-reviewed literature. Material presented in these Administrative Reports may later be published in formal peer-reviewed scientific literature. © 2019 SARDI This work is copyright. Apart from any use as permitted under the Copyright Act 1968 (Cth), no part may be reproduced by any process, electronic or otherwise, without the specific written permission of the copyright owner. Neither may information be stored electronically in any form whatsoever without such permission. SARDI Publication No. F2019/000113-1 SARDI Research Report Series No. 1017 Author(s): Leigh Thwaites and David Schmarr Reviewer(s): Qifeng Ye (SARDI), David Cheshire and Karl Hillyard (DEW) Approved by: Assoc Prof. Qifeng Ye Science Leader – Inland Waters & Catchment Ecology Signed: Date: 22 May 2019 Distribution: DEW, SAASC Library, Parliamentary Library, State Library and National
Library Circulation: Public Domain

Thwaites, L. and Schmarr, D. (2019) Carp Exclusions at Wetland Inlets in the River Murray
III
TABLE OF CONTENTS
ACKNOWLEDGEMENTS ......................................................................................................... IX
ACRONYMS .............................................................................................................................. X
EXECUTIVE SUMMARY ........................................................................................................... 1
1. INTRODUCTION ................................................................................................................ 5
1.1. Background.................................................................................................................. 5
1.2. Objectives .................................................................................................................... 9
1.3. Limitations ..................................................................................................................10
2. METHODS .........................................................................................................................12
2.1. Study Sites .................................................................................................................12
2.2. Fish assemblage .........................................................................................................14
2.3. Monitoring the frequency, timing and duration of wetland carp aggregations ..............17
2.4. Monitoring carp exiting screened wetlands via one-way gates ....................................20
3. RESULTS AND DISCUSSION ...........................................................................................22
3.1. Fish assemblage .........................................................................................................22
3.2. Carp abundance and size structure ............................................................................29
3.3. Monitoring the frequency, timing and duration of wetland carp aggregations ..............38
3.4. Monitoring carp exiting screened wetlands via one-way gates ....................................47
4. CONCLUSION AND RECOMMENDATIONS .....................................................................52
REFERENCES .........................................................................................................................56
APPENDIX 1. STUDY WETLANDS ..........................................................................................66
APPENDIX 2. CATCH SUMMARY, CARP LENGTH FREQUENCY HISTOGRAMS AND WATER
QUALITY ..................................................................................................................................75

Thwaites, L. and Schmarr, D. (2019) Carp Exclusions at Wetland Inlets in the River Murray
IV
LIST OF FIGURES
Figure 1. Map showing the location of all wetlands used for the study. .....................................12
Figure 2. Camera setup showing mounting pole (left), security box, solar panel and external aerial
(bottom right) and mounted camera and finger movement sensor battery and data logger (top
right). ........................................................................................................................................19
Figure 3. New carp screen incorporating horizontal ‘venetian’ bars and one-way gate (left) and
finger movement sensor mechanism showing inductive proximity sensor and hinged stainless
steel rod (right). .........................................................................................................................20
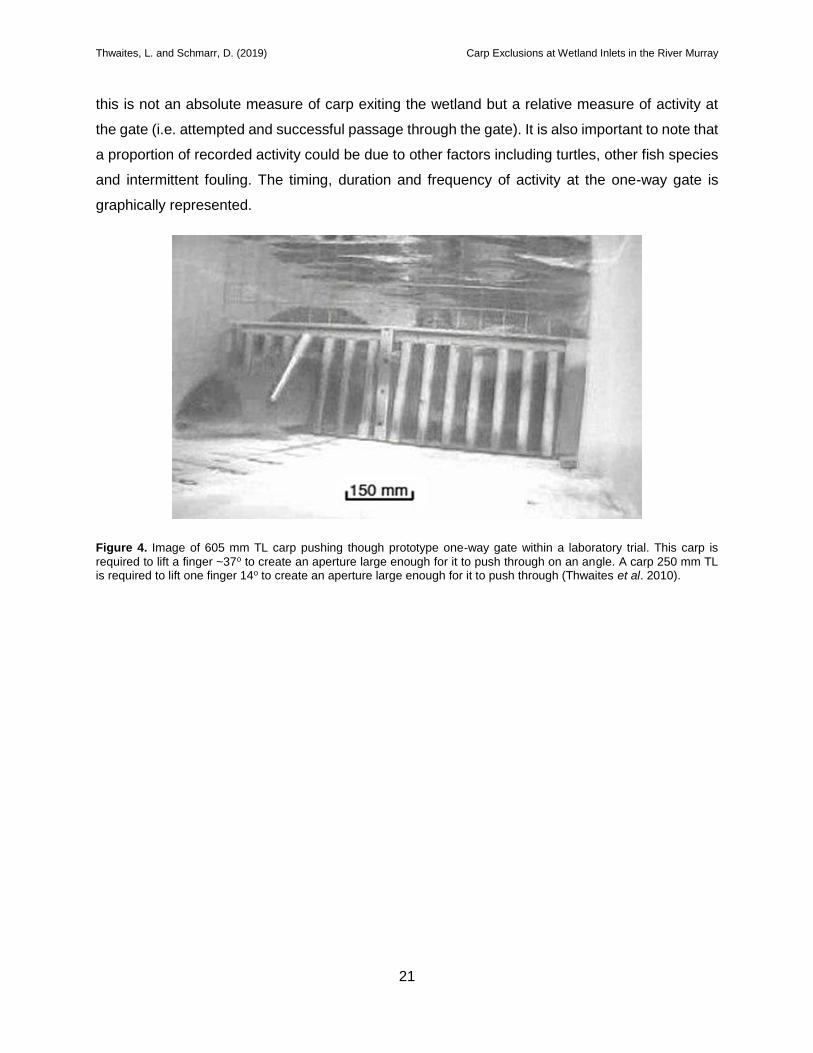
Figure 4. Image of 605 mm TL carp pushing though prototype one-way gate within a laboratory
trial. This carp is required to lift a finger ~37o to create an aperture large enough for it to push
through on an angle. A carp 250 mm TL is required to lift one finger 14o to create an aperture
large enough for it to push through (Thwaites et al. 2010). ........................................................21
Figure 5. Images of fyke net catch including a tiger snake captured at Riverglades. ................22
Figure 6. Non-metric multidimensional scaling (NMDS) based on fish assemblage data
(abundance) from sampling rounds one to four. Plot is overlaid with species correlates.
Treatments:▲= NCES, ● = Unscreened, = OCES; Sampling Rounds: 1 = Black, 2 = Blue, 3 =
Grey, 4 = Orange. .....................................................................................................................24
Figure 7. Non-metric multidimensional scaling (NMDS) based on fish assemblage data
(abundance) from sampling rounds one to four. Plot is overlaid with environmental correlates.
Treatments:▲= NCES, ● = Unscreened, = OCES; Sampling Rounds: 1 = Black, 2 = Blue, 3 =
Grey, 4 = Orange. .....................................................................................................................25
Figure 8. Non-metric multidimensional scaling (NMDS) based on fish assemblage data
(presence-absence) from all five sampling rounds. Plot is overlaid with species correlates.
Treatments:▲= NCES, ● = Unscreened, = OCES; Sampling Rounds: 1 = Black, 2 = Blue, 3 =
Grey, 4 = Orange, 5 = Green. ...................................................................................................26
Figure 9. Non-metric multidimensional scaling (NMDS) based on fish assemblage data
(presence-absence) from all five sampling rounds. Plot is overlaid with environmental correlates.
Treatments:▲= NCES, ● = Unscreened, = OCES; Sampling Rounds: 1 = Black, 2 = Blue, 3 =
Grey, 4 = Orange, 5 = Green. ...................................................................................................26
Figure 10. Mean carp relative abundance (CPUE ± 95% C.I.) within each sampling round for
treatment and control wetlands (Black = NCES, Orange = OCES, Grey = Unscreened). SR1: 20
Nov-01 Dec 2017; SR2: 05-13 Feb 2018; SR3: 16-27 April 2018; SR4: 14-29 June 2018; SR5: 1-

Thwaites, L. and Schmarr, D. (2019) Carp Exclusions at Wetland Inlets in the River Murray
V
9 Nov 2018. Note: relative abundances and C.I. based upon least squares means from the within
sampling round GLMM. .............................................................................................................30
Figure 11. Mean carp relative abundance (CPUE ± 95% C.I.) for treatment and control wetlands
(Black = NCES, Orange = OCES, Grey = Unscreened) over the duration of the study from left to
right within each treatment: SR1: 20 Nov-01 Dec 2017; SR2: 05-13 Feb 2018; SR3: 16-27 April
2018; SR4: 14-29 June 2018; SR5: 1-9 Nov 2018. Note: relative abundances and C.I. based upon
least squares means from the within treatment GLMM. .............................................................31
Figure 12. Mean carp length (± 95% C.I.) within each sampling round for treatment and control
wetlands (Black = NCES, Orange = OCES, Grey = Unscreened). SR1: 20 Nov-01 Dec 2017; SR2:
05-13 Feb 2018; SR3: 16-27 April 2018; SR4: 14-29 June 2018; SR5: 1-9 Nov 2018. Note: carp
length and C.I. based upon least squares means from the within sampling round GLMM. ........32
Figure 13. Mean carp length (± 95% C.I.) for treatment and control wetlands (Black = NCES,
Orange = OCES, Grey = Unscreened) over the duration of the study from left to right within each
treatment: SR1: 20 Nov-01 Dec 2017; SR2: 05-13 Feb 2018; SR3: 16-27 April 2018; SR4: 14-29
June 2018; SR5: 1-9 Nov 2018. Note: carp length and C.I. based upon least squares means from
the within treatment GLMM. ......................................................................................................32
Figure 14. Date of birth for Juvenile carp (130-250 mm TL) captured within each treatment across
the duration of the study. Blue line is discharge into South Australia (ML day-1) showing the flood
peak that occurred during 2016-17. ...........................................................................................34
Figure 15. Carp aggregations at Hart Lagoon (left) and Beldora 2 (right) captured by remote trail
cameras. ...................................................................................................................................38
Figure 16. Monthly mean (± S.E.) of daily maximum carp counts for Beldora 1 (light grey columns)
and Beldora 2 (dark grey columns) carp exclusion screens. Blue line is average monthly river
temperatures (oC), green line is average monthly wetland water temperatures (oC) and red line
indicates 16oC. For comparative purposes, the light grey shaded area indicates when carp
screens are recommended to be open while white area indicates when screens should be closed
according to the WMP for Murbko South, Hart, Morgan’s and Mussels Lagoons (Wegener 2012a;
Wegener 2012b; Tesoriero et al. 2013; DEWNR 2015b). ..........................................................39
Figure 17. Monthly mean (± S.E.) of daily maximum carp counts for Hart Lagoon carp exclusion
screen. Blue line is average monthly river temperatures (oC), green line is average monthly
wetland water temperatures (oC) and red line indicates 16oC. Light grey shaded area indicates
when the Hart Lagoon WMP recommends carp screens are opened while white area indicates
when screens should be closed (Wegener 2012a). ...................................................................40

Thwaites, L. and Schmarr, D. (2019) Carp Exclusions at Wetland Inlets in the River Murray
VI
Figure 18. Monthly mean (± S.E.) of daily maximum carp counts for Murbko South 1 (light grey
columns) and Murbko South 2 (dark grey columns) carp exclusion screens. Blue line is average
monthly river temperatures (oC), green line is average monthly wetland water temperatures (oC)
and red line indicates 16oC. Light grey shaded area indicates when the Murbko South WMP
recommends carp screens are opened while white area indicates when screens should be closed
(DEWNR 2015b). ......................................................................................................................41
Figure 19. Monthly mean (± S.E.) of daily maximum carp counts for North Purnong carp exclusion
screen. Blue line is average monthly river temperatures (oC), green line is average monthly
wetland water temperatures (oC) and red line indicates 16oC. For comparative purposes, the light
grey shaded area indicates when carp screens are recommended to be open while white area
indicates when screens should be closed according to the WMP for Murbko South, Hart, Morgan’s
and Mussels Lagoons (Wegener 2012a; Wegener 2012b; Tesoriero et al. 2013; DEWNR 2015b).
.................................................................................................................................................41
Figure 20. Images captured by remote trail cameras showing Azolla spp. fouling at Murbko South
(A), a brown snake on top of the CES at Beldora (B), the public interacting with the CES at Beldora
and North Purnong (C, D), an aggregation of birds preying on fish outside the CES at North
Purnong (E) and a turtle against the NCES at North Purnong (F). ............................................46
Figure 21. Monthly mean (± S.E.) of daily one-way gate finger sensor counts for Beldora 1 (light
grey columns) and Beldora 2 (dark grey columns) carp exclusion screens. Blue line is average
monthly river temperatures (oC) and green line is average monthly wetland water temperatures
(oC). For comparative purposes, the light grey shaded area indicates when carp screens are
recommended to be open while white area indicates when screens should be closed according
to the WMP for Murbko South, Hart, Morgan’s and Mussels Lagoons (Wegener 2012a; Wegener
2012b; Tesoriero et al. 2013; DEWNR 2015b). Note: data logging commenced on the 19/12/2017
but the graph is presented from October 2017 for comparative purposes. ................................48
Figure 22. Monthly mean (± S.E.) of daily one-way gate finger sensor counts for Murbko South 1
(light grey columns) and Murbko South 2 (dark grey columns) carp exclusion screens. Blue line
is average monthly river temperatures (oC) and green line is average monthly wetland water
temperatures (oC). Light grey shaded area indicates when the Murbko South WMP recommends
carp screens are opened while white area indicates when screens should be closed (DEWNR
2015b). Note: data logging commenced on the 25/01/2018 but the graph is presented from
October 2017 for comparative purposes. ..................................................................................48
Figure 23. Monthly mean (± S.E.) of daily one-way gate finger sensor counts for North Purnong
carp exclusion screen. Blue line is average monthly river temperatures (oC) and green line is

Thwaites, L. and Schmarr, D. (2019) Carp Exclusions at Wetland Inlets in the River Murray
VII
average monthly wetland water temperatures (oC). For comparative purposes, the light grey
shaded area indicates when carp screens are recommended to be open while white area
indicates when screens should be closed according to the WMP for Murbko South, Hart, Morgan’s
and Mussels Lagoons (Wegener 2012a; Wegener 2012b; Tesoriero et al. 2013; DEWNR 2015b).
Note: data logging commenced on the 24/12/2018 but the graph is presented from October 2017
for comparative purposes. .........................................................................................................49
Figure 24. Beldora Wetland has a surface area of ~156.6 ha and is situated ~426 km from the
river mouth in the Valley section of the River Murray (top). It contains six box culverts (three box
culverts in two adjacent structures, Beldora 1 and 2; three 1.5 x 2.1 x 3.4 m box culverts, one with
open grid top) with horizontal ‘venetian’ bar carp screens (31 mm) and one-way gates (bottom).
.................................................................................................................................................66
Figure 25. Mussels Lagoon has a surface area of ~146.9 ha and is situated ~420 km from river
mouth in the Valley section of the River Murray (top). Its inlet creek contains six box culverts (1.2
x 1.2 x 1.2 m) fitted with reinforced Alu-Tread carp screens (bottom). .......................................67
Figure 26. Hart Lagoon has a surface area of ~72.8 ha and is situated ~269 km from the river
mouth in the Gorge section of the River Murray (top). Its inlet structure comprises six box culverts
(1.2 x 1.2 x 1.2 m) fitted with Alu-tread carp screens (34 x 97 mm) (bottom). ............................68
Figure 27. Murbko South has a surface area of ~129.1 ha and is situated ~288 km from river
mouth in the Gorge section of the River Murray (top). Its river structure (Murbko 1) and creek
structure (Murbko 2) contain two box culverts (1.5 x 1.5 x 3.4 m box culverts, one with open grid
top) with horizontal ‘venetian’ bar carp screens and one-way gates (bottom). ...........................69
Figure 28. Yarramundi North (Morgan’s Lagoon) has a surface area of ~35.2 ha and is situated
~254 km from river mouth in the Gorge section of the River Murray (top). Its river structure
comprises six box culverts with security mesh carp screens (1.2 x 1.2 x 1.2 m) and its creek
structure is smaller but comprises two similar box culverts with security mesh carp screens
(bottom). ...................................................................................................................................70
Figure 29. North Purnong has a surface area of ~95.5 ha and is situated ~190 km from river
mouth in the Gorge section of the River Murray (top). North Purnongs inlet structure contains two
box culverts (1.5 x 1.5 x 3.4 m box culverts, one with open grid top) with horizontal ‘venetian’ bar
carp screens and one-way gates (bottom). ...............................................................................71
Figure 30. Riverglades has a surface are of ~44.6 ha and is situated ~114 km from river mouth
in the Swamplands section of the River Murray (top). Its river structure comprises four box culverts
(1.5 x 2.1 x 1.5 m) with Alu-Tread carp screens (34 x 97 mm) and its Cause-way structure
comprises pipe culverts with Alu-Tread carp screens (bottom and bottom insert). ....................72
Thwaites, L. and Schmarr, D. (2019) Carp Exclusions at Wetland Inlets in the River Murray
VIII
Figure 31. Yarra Lagoon has a surface area of ~137.5 ha and is situated ~372 km from river
mouth in the Gorge section of the River Murray. Yarra is an unscreened wetland with no
infrastructure. ............................................................................................................................73
Figure 32. Murbko Flat has a surface area of ~194.8 ha and is situated ~291 km from river mouth
in the Gorge section of the River Murray. Murbko Flat is an unscreened wetland with no
infrastructure. ............................................................................................................................73
Figure 33. Craignook has a surface area of ~54.7 ha and is situated ~180 km from river mouth in
the Gorge section of the River Murray. Craignook is an unscreened wetland with no infrastructure.
.................................................................................................................................................74
Figure 34. Length frequency distribution for carp sampled within screened and unscreened
wetlands for each sampling round. ............................................................................................77
LIST OF TABLES
Table 1. Summary information for all wetlands. ........................................................................13
Table 2. Project timeline. ..........................................................................................................14
Table 3. Catch summary for all treatments across each sampling round. * indicates presence of
species within the fifth sampling round (SR5). SR1: 20 Nov-01 Dec 2017; SR2: 05-13 Feb 2018;
SR3: 16-27 April 2018; SR4: 14-29 June 2018; SR5: 1-9 Nov 2018. N = NCES, O = OCES, U =
Unscreened. .............................................................................................................................23
Table 4. Predictive GLMMs for Carp abundance and length collected during year-long field
sampling. Model selection results include the intercept and random effect for sample site. The
stronger models are those with the lowest AIC. ΔAIC values compare the selected model AIC
with all other model. Models marked with * failed to converge on a solution and were discounted.
.................................................................................................................................................29
Table 5. Daily mean of maximum daily carp counts (± S.E.) for all CES monitoring with remote
trail cameras and mean water depth (m, range) for each inlet culvert. ......................................38
Table 6. Catch summary for all wetlands across each sampling round. * indicates presence of
species within the fifth sampling round (SR5). SR1: 20 Nov-01 Dec 2017; SR2: 05-13 Feb 2018;
SR3: 16-27 April 2018; SR4: 14-29 June 2018; SR5: 1-9 Nov 2018. N = NCES (light grey), O =
OCES (grey), U = Unscreened (dark grey). ...............................................................................75
Table 7. Water quality parameters for all wetlands across each sampling round. * indicates nil
data due to faulty probes (SR1: 20 Nov–01 Dec 2017; SR2: 05–13 Feb 2018; SR3: 16–27 April
2018; SR4: 14–29 June 2018; SR5: 1–9 Nov 2018). .................................................................79
Thwaites, L. and Schmarr, D. (2019) Carp Exclusions at Wetland Inlets in the River Murray
IX
ACKNOWLEDGEMENTS
This project was funded by the Riverine Recovery Project, a $98 million joint Australian and
South Australian Government initiative to improve the health of the River Murray and its
wetlands and floodplains from the South Australian border to Wellington. The authors would
like to thank staff of the Department for Environment and Water for their considerable help
through development and implementation of this project. In particular Karl Hillyard, Andrew
Rettig, Sally Maxwell, Courtney Monk, James Donaldson, Kate Mason, David Cheshire,
Rebecca Tuner, Richard Brown, Terri Minge, Hayden Smith, Said Khelwaty and Maria
Marklund. Thanks to Neil Wellman, Kate Frahn and Zygmunt Lorenz from SARDI Aquatic
Sciences for their assistance in the field. Thanks to the reviewers for improving earlier versions
of this report. Finally thanks to landholders and property managers who generously gave us
wetland access and support. The project was conducted under the South Australian Fisheries
Management Act 2007: Section 115, Ministerial Exemption ME9903001. Fish data to support
this project is available at the Biological Databases of South Australia (BDBSA, Project
Number=1202, Project Name=Carp exclusion screens-River Murray).

Thwaites, L. and Schmarr, D. (2019) Carp Exclusions at Wetland Inlets in the River Murray
X
ACRONYMS
AIC Akaike information criterion
CES Carp exclusion screen
CPUE Catch per unit effort (relative abundance)
DEW Department for Environment and Water
DIDSON Dual-frequency identification sonar
DO Dissolved oxygen
GLMM Generalised linear mixed model
MDB Murray Darling Basin
NCES New carp exclusion screen
NTU Nephelometric Turbidity Units
OCES Old carp exclusion screen
PERMANOVA Permutational analysis of variance
RRP Riverine Recovery Project
SARDI South Australian Research and Development Institute
SIMPER Similarity percentages analysis
TL Total length (mm)
YOY Young-of-year
Thwaites, L. and Schmarr, D. (2019) Carp Exclusions at Wetland Inlets in the River Murray
1
EXECUTIVE SUMMARY
The objectives of this project were to conduct a field investigation to evaluate the effectiveness of
new and existing carp exclusion screens (CES) and inform the ongoing management of CES at
various Department for Environment and Water (DEW) managed Riverine Recovery Project
(RRP) Wetlands. To achieve these objectives, the differences in the fish assemblage and relative
abundance and size structure of carp between un-screened wetlands and wetlands fitted with
new carp exclusion screens (NCES) and old carp exclusion screens (OCES) were assessed. The
annual cycle of carp activity (i.e. aggregation behaviour) at screened wetland inlets under
regulated conditions (i.e. non-flood, non-drought) was monitored and recorded using remote trail
cameras. Finally, the utility of one-way gates within NCES as a passive carp control measure was
evaluated. Key findings from the study are:
Evaluating the effectiveness of carp exclusion screens.
Differences were detected between treatments for carp abundance in sampling round one
with significantly higher abundance in wetlands fitted with NCES in comparison to unscreened
wetlands. There was no difference between NCES and OCES wetlands or between OCES
and unscreened wetlands in sampling round one. No differences were detected for the
remaining sampling rounds.
Carp total length (TL) in sampling round one was significantly smaller in NCES compared with
unscreened wetlands, but there were no significant effects of treatment in all other sampling
rounds.
Treatment had no effect on fish assemblage structure based on abundance data but had a
significant effect on the presence or absence of species within wetlands with golden perch,
smelt and goldfish less prevalent in wetlands with NCES. This suggests that NCES may be
affecting these species and this warrants further investigation.
Monitoring the frequency, timing and duration of wetland carp aggregations via remote cameras
to inform wetland CES management.
Remote trail cameras successfully recorded the presence of carp and the formation of
aggregations at wetland inlets with CES. Observed patterns of carp activity were highly
variable between wetlands. For example, high numbers of carp were observed attempting to

Thwaites, L. and Schmarr, D. (2019) Carp Exclusions at Wetland Inlets in the River Murray
2
migrate into Beldora and North Purnong wetlands during a period when they were expected
to be exiting these wetlands (March–August) to overwinter in the main channel.
CES appeared to create fish aggregations (likely carp, bony herring and golden perch) that
attracted piscivorous birds. The regular occurrence of these birds at inlets fitted with CES
suggests screened inlets may make fish vulnerable to predation. While this is not an issue if
they are consuming carp, increased levels of predation on native fish (i.e. golden perch) is a
concern and this warrants further investigation.
The rationale for the NCES design was to minimise any adverse effects on turtles, primarily
the chance of being trapped against the screen by the incoming water. Low numbers of turtles
were observed within close proximity to OCES and NCES but only one was captured
interacting with the screen. This turtle was not present in subsequent images indicating it
could freely move away. As such, both types of screens observed in this study did not appear
to affect turtles under normal flow conditions.
There were several images of the public interacting with infrastructure which appeared to be
associated with recreational activities including fishing, yabbying and canoeing. This provides
an opportunity for public education via signage on the face of these structures.
Fouling from aquatic vegetation was generally in low densities, which would only remain on
the screens for a short period and did not appear to affect screen function.
Monitoring carp exiting screened wetlands via one-way gates fitted in NCES
One-way gate finger movement sensors successfully logged activity at all three NCES sites.
One-way gates appear to be working as intended and may even be allowing non-target native
species to exit wetlands. However, it is difficult to estimate the precise numbers that exited
via the gates as some counts are likely a result of carp and other fauna nudging a finger (i.e.
lifting the finger to the detection angle) without exiting. Further investigation is required to
assess which species and the total numbers of each species that are exiting.
Conclusions and recommendations
This study evaluated the effectiveness of closed NCES and OCES over a 12 month period
approximately one year following extensive overbank flooding. The timing of the study did not
allow for a drying phase or screen manipulations (i.e. opening) to be instigated in any of the
wetlands which are a key component of wetland management plans with CES. Future

Thwaites, L. and Schmarr, D. (2019) Carp Exclusions at Wetland Inlets in the River Murray
3
research should aim to monitor changes in wetland fish assemblages and carp abundance
that occur as a result of these management practices. This is critical next step for the study.
Some wetland management plans recommend opening CES once carp become abundant to
allow carp to exit but do not specify an abundance, biomass or timeframe to trigger these
screen manipulations. This could be set using impact thresholds (e.g. carp density >50–75 kg
ha−1) or abundance comparisons between screened and unscreened wetlands and this
requires further investigation.
The results of this study suggest carp and potentially other species are interacting with the
one-way gates but it is unclear what proportion of interactions result in carp or other fauna
exiting the wetlands. Long-term monitoring of wetland carp abundance and size structure will
aid in understanding the overall effectiveness of one-way gates. As it is difficult to estimate
precise carp numbers that exited via the one-way gate, an experiment to calibrate/validate the
one-way gate finger movement sensor data should be undertaken.
While this study suggests ‘venetian’ bars in NCES may not affect the passage of small-bodied
species, it also suggests the rates of emigration of medium-bodied species and juveniles of
large-bodied species may be impacted. As such, it is recommended to evaluate fish passage
though horizontal ‘venetian’ bars. This experiment should evaluate small-, medium- and large-
bodied native fish (juveniles and adults) as well as carp within the 250 mm TL size class and
should also evaluate the differences between the ‘venetian’ bar and the optimised jail bar
design proposed by Hillyard et al. (2010).
This study demonstrated that off-channel movements can occur during periods that do not
align with some CES management protocols, suggesting protocols may need to be tailored to
individual wetlands. As this study occurred over a twelve month period one year following
flood, and off-channel movements may change annually, it is recommended monitoring
continue at wetlands fitted with remote trail cameras and be expanded to other wetlands fitted
with CES. If annually predictable migration patterns are observed then appropriated screen
manipulation protocols can be developed.
The results of this study suggest under normal flow conditions CES pose little risk to turtles,
only one turtle was observed interacting with a screen and it appeared to have freely moved
away. The primary risk is likely associated with wetland filling events under high velocities,
which should be mitigated by filling under low velocities. Experiments designed to evaluate
velocity thresholds for turtles should be undertaken. These experiments should also seek to
understand if turtles can escape from ‘venetian’ bars and jail bars under sub-optimal flows.

Thwaites, L. and Schmarr, D. (2019) Carp Exclusions at Wetland Inlets in the River Murray
4
With this knowledge, appropriate wetland filling protocols can be implemented and the
application of the optimised jail bar CES re-evaluated.
Prior to establishing long-term CES management protocols or installing further CES it is
strongly recommended further research and monitoring be undertaken. This is particularly
important as the results of the current study and previous research suggest CES have minimal
impact on wetland carp abundances while restricting large-bodied native fish and turtle access
to wetlands. If CES optimisation and long-term CES management practices (i.e. wetting and
drying, screen manipulations, operation of NCES) cannot maintain a significantly lower
abundance of carp and control within wetland impacts in comparison to unscreened wetlands,
then their continued application must be re-evaluated.
Keywords: Carp, exclusion screens, wetland, management, aggregation, movement.

Thwaites, L. and Schmarr, D. (2019) Carp Exclusions at Wetland Inlets in the River Murray
5
1. INTRODUCTION
1.1. Background
Common carp (Cyprinus carpio L.) are a successful invader and a declared pest in several
countries including Australia, New Zealand, Canada and the United States (Koehn 2004). The
success of carp stems from their intermediate life history strategy (opportunistic/periodic), high
fecundity (100,000 eggs kg-1; up to 1 million eggs y-1), longevity (28+ years), ability to occupy a
broad range of habitats and tolerance to extreme environmental conditions (Winemiller and Rose
1992; Brown et al. 2003; Koehn 2004; Smith 2005). Carp are “ecosystem engineers” and when
in high abundance, cause detrimental changes to benthic habitats, water quality and the
distribution and abundance of native flora and fauna (Gehrke and Harris 1994; Miller and Crowl
2006; Matsuzaki et al. 2009). Previous research has demonstrated a significant increase in
turbidity at carp densities of 50–75 kg ha−1 (Zambrano and Hinojosa 1999), a significant negative
effect on water transparency at a mean density of 68 kg ha-1 (Vilizzi et al. 2014), decline in
vegetation cover and waterfowl at ~100 kg ha-1 (Bajer et al. 2009), a shift from clear to turbid
water state at 174–300 kg ha-1 (Williams et al. 2002; Parkos et al. 2003; Haas et al. 2007;
Matsuzaki et al. 2009) and effects on aquatic macrophytes at 68–450 kg ha-1 (Hume et al. 1983;
Fletcher et al. 1985; Osborne et al. 2005; Pinto et al. 2005; Vilizzi et al. 2014). These impacts
stem largely from carp’s bottom-feeding behaviour (Sibbing et al. 1986) and are most commonly
reported in shallow off-stream wetland habitats (Parkos et al. 2003).
Carp generally occupy two broad habitats: shallow wetland habitats during spring through autumn
and deep-water habitats during winter. Shallow wetlands are source habitats that enable feeding,
spawning and the production of up to 98% of carp recruits (Smith and Walker 2004a; Crook and
Gillanders 2006; Stuart and Jones 2006). The deep-water habitat maintains warmer stable
temperatures in comparison with surface waters (Johnsen and Hasler 1977; Inland Fisheries
Service 2008; Penne and Pierce 2008). Migrations between these two habitats occur annually
(Penne and Pierce 2008). Conallin et al. (2012) reported adult carp movements into wetlands
commenced during August in response to increasing water temperatures, peaked in mid-
September before spawning, then declined and were close to zero by December.
Carp are asynchronous, multiple batch spawners that can spawn two or three times per year
when mean water temperatures exceed 15–16oC (Sivakumaran et al. 2003; Smith and Walker
2004b; Smith 2005). Within South Australia, this threshold can be exceeded for up to 9 months
each year providing extended opportunity for multiple spawning events (Smith and Walker
Thwaites, L. and Schmarr, D. (2019) Carp Exclusions at Wetland Inlets in the River Murray
6
2004b). The South Australian section of the River Murray contains 250 wetland complexes
comprising 1100 wetlands (Jenson et al. 1996). As a result of river regulation (i.e. locks, weirs,
floodplain levees), approximately 70% of these wetlands are permanently inundated (Pressey
1990). Given the favourable climate, the extensive availability of wetland habitat, their importance
to carp population dynamics and the environmental impacts associated with carp,
control/management in wetlands is an important component of an integrated carp management
strategy.
Carp management methods rely on a strong understanding of carp ecology and aim to target or
sabotage exploitable behaviours (i.e. migrations, spawning). The utility of each method is site
specific and dependent on several factors including season (i.e. spring vs. winter), scale (i.e.
individual wetlands, river reach, whole of system), hydrology (i.e. base flow vs. flood) and
resource availability. Specific options for carp management include operational and intervention
techniques or a combination of both. To date, these largely rely on commercial fishing, metal
mesh carp exclusion screens (CES) installed in wetland inlets to restrict access of large breeding
carp to spawning sites (French et al. 1999; Hillyard et al. 2010), electrical barriers to restrict
movements (Verrill and Berry 1995), barrier netting to exclude carp from preferred spawning
habitat (Inland Fisheries Service 2008), applying lime to destroy eggs (Inland Fisheries Service
2008), tracking acoustic or radio tagged carp to locate and harvest aggregations (Inland Fisheries
Service 2008), jumping traps (William’s carp separation cages; Stuart et al. 2006; Thwaites 2011),
push traps (Thwaites et al. 2010), pheromone traps (Sorensen and Stacey 2004), chemical
piscicides (Clearwater et al. 2008) and water level manipulations to reduce access to littoral
spawning sites and expose eggs to desiccation (Shields 1957; Yamamoto et al. 2006). The
strategic delivery of water to disadvantage carp by providing a non-preferred inundation regime
or mosaics of fast- and slow-flowing habitats has been proposed, but is yet to be fully evaluated
(Stuart et al. 2011). Genetic (‘daughterless’ carp; Thresher 2008) and biological (Cyprinid Herpes
Virus, CHV-3; McColl et al. 2007) technologies are also in development and although these
techniques may promise large-scale population impacts (Brown and Gilligan 2014) they are still
many years from deployment.
Within Australia, CES are one of the more commonly deployed wetland-scale carp management
strategies. A recent survey of existing CES within the Murray Darling Basin (MDB) recorded 54
screens with the majority of these (83%; n=45) installed at wetland inlets within the South
Australian section of the River Murray (Hillyard 2010). In reviewing the work of others, Hillyard
(2011) summarised the perceived benefits and potential disadvantages associated with CES.

Thwaites, L. and Schmarr, D. (2019) Carp Exclusions at Wetland Inlets in the River Murray
7
Benefits include limiting carp access to spawning habitat, minimising within wetland impacts
associated with carp, the ability to desiccate adult carp via stranding during drying and allowing
the passage of small-bodied native fishes. Disadvantages include exclusion of large-bodied
aquatic species such as native fish and turtles, injury to small fish due to contact with the CES,
entrapment of large-bodied carp and native species that enter as juveniles and grow too large to
exit via the CES, stranding native species during drying, ineffectiveness during flooding, fouling
and the requirement for ongoing maintenance. While CES may be beneficial, without careful
design and management (e.g. wetting and drying, seasonal screen manipulations; Wegener
2012; Tesoriero et al. 2013), they may have significant impacts on other fish and fauna and may
actually concentrate carp and large-bodied native species within wetlands (Nichols and Gilligan
2003; Hillyard et al. 2010).
Historically, CES have been fabricated from various forms of metal mesh including walk-way, grid
and Alu-tread mesh (hereafter old CES, OCES) and their design gave little consideration to
broader wetland fish and fauna assemblages (Hillyard 2011). Hillyard et al. (2010) proposed two
“optimised” screen designs: vertical ‘jail’ bars with 31 mm apertures and grid mesh with 44 mm
across each axis of the mesh. These screens are designed to restrict the passage of sexually
mature carp ≥250 mm TL, while allowing the passage of small-bodied native fishes, juveniles of
large-bodied native fishes (e.g. golden perch, Macquaria ambigua) and >95% of bony herring
Nematalosa erebi, the most abundant large-bodied native fish in wetlands). Following these
developments and concurrent research conducted by the South Australian Research and
Development Institute (SARDI; Thwaites et al. 2010), the Department for Environment and Water
(DEW; formerly Department of Environment, Water and Natural Resources) via the Riverine
Recovery Project (RRP) applied a novel and improved CES design in new wetland management
infrastructure. The new CES (NCES) incorporate horizontal ‘venetian’ bars with a 31 mm aperture
(50 mm depth) which, although untested, is expected to have similar benefits to the vertical jail
bar design recommended by Hillyard et al. (2010) while allowing turtles that may become trapped
on the screen to escape (Karl Hillyard 2019, pers. comm.). The NCES also incorporate a one-
way finger style push gate within the lower section (based on the carp push trap, Thwaites et al.
2010). The gate prevents the entry of carp ≥250 mm TL while allowing carp that entered the
wetland as juveniles (<250 mm TL) and grew to ≥250 mm TL to push out of the wetland and not
return (Smith et al. 2009b; Thwaites et al. 2010). Laboratory (Thwaites et al. 2010) and field
experiments (Conallin et al. 2016; Thwaites and Cheshire 2016) confirm carp are willing to push
through these one-way gates but their utility as a passive carp control strategy integrated with

Thwaites, L. and Schmarr, D. (2019) Carp Exclusions at Wetland Inlets in the River Murray
8
CES is yet to be evaluated. Although the new design promises to be a significant improvement
over historic designs, they will still exclude native fauna with body dimensions similar to carp (e.g.
adult golden perch and turtles) (Hillyard et al. 2010) and this will require careful management.
Within South Australia (SA), CES management is an integral component of wetland management
plans (WMP) (EAC 2005; Wegener 2012a; Wegener 2012b; DEWNR 2013; Tesoriero et al. 2013,
DEWNR 2015a; DEWNR 2015b). CES management practices are based on the current
understanding of carp ecology and aim to minimise within wetland carp abundance and impacts.
In general, WMPs recommend periodic wetting and drying cycles to extirpate stranded carp but
differ in how CES are managed. This is largely dependent on the type of screen with seasonal
screen manipulations recommended for OCES and permanent closure for wetlands fitted with
NCES (EAC 2005; Wegener 2012a; Wegener 2012b; DEWNR 2013; Tesoriero et al. 2013,
DEWNR 2015a; DEWNR 2015b). However, it is important to note that these strategies are not
consistent across all managed wetlands. For example, Riverglades wetland (SA) is fitted with an
OCES but its WMP recommends permanent closure (EAC 2005) while Murbko South (SA) is
fitted with NCES which are recommended to be seasonally manipulated (DEWNR 2015b).
Wetlands fitted with NCES rely on the one-way gates as a passive control strategy during wetted
periods (i.e. large carp exit via the gate to overwinter, DEWNR 2013; DEWNR 2015a). Seasonal
screen manipulations aim to control within wetland carp abundance by exploiting carp movement
patterns. CES are closed during wetland filling events and remain closed until carp become
abundant within the wetland. Once this occurs, seasonal opening and closing is undertaken. CES
are opened in autumn to allow any carp and large-bodied native fauna to migrate back into the
river and then closed in early spring to restrict carp access during off-channel spawning migrations
(Wegener 2012a; Wegener 2012b; Tesoriero et al. 2013, DEWNR 2015b). While these
management strategies may aid in minimising wetland carp abundances by exploiting innate
behaviours, they are largely based on international observations (Johnsen and Hasler 1977;
Penne and Pierce 2008) and limited Australian studies that have recorded lateral spawning
migrations during an environmental water allocation (Conallin et al. 2012) or during drought
conditions (Hillyard 2011). The utility of these management practices is yet to be evaluated over
an annual cycle under regulated conditions (i.e. non-flood, non-drought).
The RRP is the $98 million component of South Australia’s $610 million Murray Futures program,
funded by the Australian Government’s Sustainable Rural Water Use and Infrastructure Program.
The RRP aims to improve the river’s health and resilience of its wetlands and floodplains from the
South Australian border to Wellington. The Wetlands Project Element of the RRP focuses on
Thwaites, L. and Schmarr, D. (2019) Carp Exclusions at Wetland Inlets in the River Murray
9
management of pool-connected wetlands, typically implementing a regime of drying and re-
wetting otherwise permanently inundated wetlands to mimic the natural/historical annual variation
in river level. It also supports investigations to improve wetland management outcomes. These
investigations aim to refine infrastructure management and identify complementary measures to
optimise environmental benefit and minimise risk.
In March 2016, DEW engaged SARDI Aquatic Sciences to undertake a pilot study to develop a
rigorous method of monitoring carp screens at RRP sites. The pilot study used an experimental
system designed to test and recommend suitable equipment for recording carp interaction with
carp screens with a view to applying this method to a more comprehensive investigation. SARDI
Aquatic Sciences provided a report that confirmed proof of concept for the trialled equipment and
approach (Thwaites and Cheshire 2016). The report also provided recommendations for a
subsequent study designed to evaluate the effect of CES on wetland fish assemblages in situ at
RRP wetlands and to inform ongoing management of the new and existing CES designs. The
resultant recommended specifications and standards underpin the present investigation.
As a component of DEW’s ongoing commitment, RRP engaged SARDI Aquatic Sciences to
undertake a field investigation into the effectiveness of CES installed on wetland inlets. Of
particular interest to the RRP was the efficacy of NCES with novel one-way finger gates, designed
to prevent ingress of sexually mature carp (≥250 mm TL) during the spawning season (spring
through autumn) but facilitate egress to passively reduce within wetland carp abundance.
Currently, three RRP wetlands have NCES installed and it is proposed to install several more.
RRP sought to validate the NCES designs in a ‘real world’ setting and compare them with existing
screen types. Further, they sought to assess interactions between native biota and carp screens,
and potentially wetland regulating infrastructure in general. Without this investigation, WMPs rely
on the assumed efficacy of NCES, which, if proven incorrect, may cause greater negative impact
than benefit to the managed wetlands. RRP will use the outcomes of the project to guide future
infrastructure investment and operation. The validation of the utility of CES will also provide
data/evidence to ensure DEW is able to mitigate any adverse public media should turtle deaths
or restriction to passage of large-bodied native fish regain attention.
1.2. Objectives
The objectives of this project are to conduct a field investigation to evaluate new and existing CES
and inform the ongoing management of CES at various DEW managed RRP Wetlands. From
prior observations, we anticipate that:

Thwaites, L. and Schmarr, D. (2019) Carp Exclusions at Wetland Inlets in the River Murray
10
1. During the carp spawning season (spring–autumn), the relative abundance of carp will be
higher in non-screened wetlands compared to wetlands fitted with OCES and wetlands
fitted with NCES. Non-screened wetlands will present no barrier to movement, while
screened wetlands will prevent the entry of carp ≥250 mm TL.
2. At the completion of the carp spawning season, the relative abundance of carp will be
higher in wetlands fitted with OCES compared to unscreened wetlands and wetlands fitted
with NCES. Carp ≥250 mm TL will be unable to exit wetlands fitted with OCES but will exit
unscreened wetlands and wetlands fitted with NCES.
3. Carp ≥250 mm TL will aggregate at wetland inlets fitted with CES while attempting to
migrate into wetlands during the first half of the carp spawning season (spring–early
summer) and these aggregations will diminish in the second half of the season. Activity at
CES will be minimal in late autumn and winter as carp migrate back into the main river
channel to overwinter in deep water habitats.
4. Activity at the one-way gates will peak toward the end of the carp spawning season
(autumn) and continue into winter as carp attempt to exit the wetland to find overwintering
habitat in the main river channel. Activity will be low during spring as carp commence their
annual off-channel spawning migrations into wetlands.
5. The overall fish assemblage (abundance and diversity) will be similar between screened
and unscreened wetlands (despite the potential impacts of CES on carp abundance).
1.3. Limitations
This study commenced ~12 months after the 2016 floods when all monitored wetlands were
inundated and screens became ineffective. Overbank flows (>50,000 ML day-1) occurred for
approximately two months between October and December 2016 allowing carp and other fish
to freely exit or enter all monitored wetlands. The timing and duration of flows coincided with
the carp spawning season which suggests carp may have preferentially moved into wetland
habitats as floodwaters receded. This provided the opportunity for similar densities of carp
within all monitored wetlands immediately post flood. Thus, the results presented herein
represent monitoring of screened wetlands over a twelve-month period following
approximately twelve months of continuous screening. This is particularly important as under
normal wetland management practices, CES would have either been opened immediately
post flood to allow carp to exit or the wetland would have undergone a drying phase to
extirpate stranded carp.

Thwaites, L. and Schmarr, D. (2019) Carp Exclusions at Wetland Inlets in the River Murray
11
The style of CES varied across the three wetlands fitted with OCES, which may have
differentially altered the size range of small-bodied fish that could move through these
screens.

Thwaites, L. and Schmarr, D. (2019) Carp Exclusions at Wetland Inlets in the River Murray
12
2. METHODS
2.1. Study Sites
This study was conducted at ten wetlands situated along the South Australian section of the River
Murray (Figure 1; Table 1; Appendix 1). The wetlands included: three wetlands fitted with NCES
with one-way gates (Beldora, Murbko South and North Purnong), three wetlands fitted with OCES
(Mussels Lagoon, Yarramundi North and Riverglades) and three control/unscreened wetlands
with no CES (Yarra, Murbko Flat and Craignook). The tenth wetland, Hart Lagoon, was fitted with
an OCES but was only used to monitor carp aggregations with remote cameras (see below).
Study wetlands ranged in size from 35–195 ha and were characterised by similar within wetland
habitat.
Figure 1. Map showing the location of all wetlands used for the study.

Thwaites, L. and Schmarr, D. (2019) Carp Exclusions at Wetland Inlets in the River Murray
13
Table 1. Summary information for all wetlands.
Wetland Location* (AMG coordinate, Zone 54)
Area (ha)* Infrastructure
Beldora 444452 E 6200065 N
156.5 River structure - Six box culverts (three 1.5 x 2.1 x 3.4 m box culverts, one with open grid top, in two adjacent structures) with horizontal ‘venetian’ bar carp screens (31 mm) and one-way gates
Mussels Lagoon 442907 E 6207018 N
146.9 Inlet creek structure - Six box culverts (1.2 x 1.2 x 1.2 m) with reinforced Alu-Tread carp screens (34 x 43 mm)
Yarra 417035 E 6218344 N
137.5 No infrastructure
Hart Lagoon 404302 E 6218482 N
72.8 Inlet creek structure - Box culvert fitted (1.5 x 1.5 x 5 m) with Alu-tread carp screens (34 x 97 mm)
Murbko Flat 376279 E 6220520 N
194.8 No infrastructure
Murbko South 375973 E 6216376 N
129.1 River structure - two box culverts (1.5 x 1.5 x 3.4 m box culverts, one with open grid top) with horizontal ‘venetian’ bar carp screens (31 mm) and one-way gates Creek structure - two box culverts (1.5 x 1.5 x 3.4 m box culverts, one with open grid top) with horizontal ‘venetian’ bar carp screens and one-way gates
Yarramundi North (Morgan’s Lagoon)
371169 E 6184388 N
35.2 River structure - six box culverts (1.2 x 1.2 x 1.2 m) with security mesh carp screens (58 x 63 mm) Creek structure - two box culverts (1.2 x 1.2 x 3.0 m) with security mesh carp screens
North Purnong 370452 E 6144217 N
95.5 River structure - two box culverts (1.5 x 1.5 x 3.4 m box culverts, one with open grid top) with horizontal ‘venetian’ bar carp screens (31 mm) and one-way gates
Craignook 374055 E 6138899 N
54.7 No infrastructure
Riverglades 344707 E
6114745 N 44.6 River structure - four box culverts (1.5 x 2.1 x 1.5 m)
with Alu-Tread carp screens (34 x 97 mm) Cause-way structure - pipe culverts with Alu-Tread carp screens
*Adapted from Jensen et al. (1996) Wetlands Atlas of the South Australian Murray Valley.

Thwaites, L. and Schmarr, D. (2019) Carp Exclusions at Wetland Inlets in the River Murray
14
Table 2. Project timeline.
Date Action
6/09/2017 Camera installation at North Purnong
18–20/10/2017 Camera installation at Murbko South and Beldora
2/11/2017 Camera installation at Hart Lagoon
Wetland reconnaissance to select final study wetlands
20/11/2017–01/12/2017 1st wetland sampling round- SR1 (all wetlands)
19/12/2017 Finger movement sensors installation at Beldora Wetland
24–25/01/2018 Finger movement sensor installation at North Purnong and Murbko South
05–13/02/2018 2nd wetland sampling round- SR2 (all wetlands)
One-way gate finger movement sensor download
Camera download
16–27/04/2018 3rd wetland sampling round- SR3 (all wetlands with the exception of Yarramundi North which was too shallow due to wind-induced river level fluctuation; cf. Webster et al. 1997)
One-way gate finger movement sensor download
14–29/06/2018 4th wetland sampling round- SR4 (all wetlands)
One-way gate finger movement sensor download
Camera download
1–9/11/2018 5th wetland sampling round- SR5 (all wetlands)
One-way gate finger movement sensor download
Camera download
2.2. Fish assemblage
To evaluate the effectiveness of CES, the fish assemblage of each wetland was sampled on five
occasions (Nov–Dec 2017, Feb 2018, April 2018, June 2018, Nov 2018) (Table 2). Within each
wetland, a total of nine single wing fyke nets (5 m wing, 70 cm drop, with 70 cm high 'D' and 3
compartments (funnels), 6 hoops with 6 mm mesh without exclusion grills) and three gill nets (15
m long, 3 panels per net including 45 mm, 75 mm and 115 mm stretched mesh) were deployed.
Prior to setting gear, each wetland was surveyed to determine which habitat types exist and where
best to sample each of these. Once the full range of potential sampling sites was identified, the
final three sample sites were strategically selected. To ensure the most comprehensive
assessment of the wetland fish community, each site within each wetland was characterised by
the presence of emergent and submerged macrophytes, snags, bare banks and open water. Sites
were also chosen to maximise the distance between them. These same locations were targeted
during each subsequent sampling round. Within each of the three sites, a total of one gill and

Thwaites, L. and Schmarr, D. (2019) Carp Exclusions at Wetland Inlets in the River Murray
15
three fyke nets were set in relatively close proximity (~100 m). Each gear type was set within the
particular habitat and depth where they are most effective; fyke nets were set in littoral habitats
(i.e. macrophytes, snags, bare bank) while the gill net was set in open water (>1 m depth) adjacent
to the fyke nets. Nets were set overnight with setting and hauling times recorded to calculate total
soak time and allow catch per unit effort (CPUE) calculations as a measure of relative abundance.
Catches from all nets within each wetland were grouped before fish were sorted and identified to
species level (with the exception of the unresolved carp gudgeon species complex, Hypseleotris
spp., Bertozzi et al. 2000). For total length (TL, mm) and weight (g) measurements, a random
selection of up to 30 fish was measured from each species collected across all nets within a
wetland. Multiple sets of scales were used to cover the range of different body weights (e.g.
AND®SK-5001WP for 1 g to 5000 g, and Ohaus®Scout Pro SPE 202 for fish <1 g). If a species
was too numerous to count they were bulk weighed and the average weight of sub-sampled fish
used to calculate abundance. For the fifth sampling round, only carp and turtles were measured
and the presence of other species recorded. All captured fish were released back into the wetland.
Water Quality and Flow
At each wetland and during each sampling round, five water quality parameters were recorded:
turbidity (NTU), dissolved oxygen (DO, mg L-1), conductivity (concentration of soluble ions, µs/ms
cm-1), pH, and water temperature (°C). All parameters were recorded on a pre-calibrated Horiba
U-52G water quality meter (Horiba Ltd, Kyoto, Japan). River height, flow and temperature data
for Locks 1–4 was downloaded from the https://riverdata.mdba.gov.au.

Thwaites, L. and Schmarr, D. (2019) Carp Exclusions at Wetland Inlets in the River Murray
16
Data analysis
Fish assemblage
Multivariate analyses were undertaken using the statistical software packages PRIMER v. 7.0.13
and PERMANOVA+ (Anderson et al. 2008). Permutational analysis of variance (PERMANOVA)
(Anderson 2001) was used to test whether the fish assemblage structure differed between
treatments (NCES, OCES, unscreened) and sampling rounds. Fish assemblage structure based
on relative abundance data was analysed for the first four sampling rounds. Prior to analyses,
data transformation (log(x+1)) was performed to reduce the influence of highly abundant species.
As presence and absence data was collected in the fifth sampling round, analysis of the fish
assemblage structure for all five rounds using presence and absence was also conducted. When
differences occurred between fish assemblages in control and treatment wetlands or sampling
rounds, similarity percentages (SIMPER) analysis was undertaken to determine the fish species
contributing most to the dissimilarities (Clarke and Warwick 2001).
Carp abundance and size
To identify the influence of different variables on carp abundance and size in these wetlands, we
employed a generalised linear mixed model (GLMM) using the lme4 package (Bates et al. 2015)
in the R statistical program (R Core Team 2018). This method allows analysis of linear and
nonlinear effects of continuous and categorical predictor variables on a discrete or continuous
dependent variable for non-normally distributed data (Bolker et al. 2009). Two dependent
variables were tested: fish abundance (fish per day per wetland) and fish TL. Young-of-year
(YOY) carp were excluded from the analyses due to their unpredictable occurrence and high
mortality rates (Koehn et al. 2016). The fixed effects included in the model were screen type,
sampling round, distance from sea and weir pool. Distance from sea and weir pool were included
to determine if spatial patterns were influencing carp abundance. Interactions between fixed
effects were also added to the model. The random effect was wetland site. As the data were not
normally distributed, error distributions for the model were Poisson for carp abundance (for
overdispersed count data) and Gamma for carp TL (for continuous non-negative data). Model
selection proceeded by including all fixed and random effects and relevant interactions in a full
GLMM and then reducing model complexity to minimise the Akaike information criterion (AIC)
(Akaike 1973, Burnham and Anderson 2002). The effect of fixed effects within the GLMM were
tested using the “mixed” function from the afex package (Singmann et al. 2018) via a likelihood
ratio test. To summarise the effects of factors in the mixed model, predictions of least-squares
Thwaites, L. and Schmarr, D. (2019) Carp Exclusions at Wetland Inlets in the River Murray
17
(LS) means were generated from the model in the emmeans package (Lenth 2018). Least
squares means (also known as estimated marginal means) are means for groups that are
adjusted for means of other factors in the model. In unbalanced factorial models, LS means are
calculated across a reference grid and provide an estimate of main effects means adjusted for
imbalance (Lenth 2016).
2.3. Monitoring the frequency, timing and duration of wetland carp aggregations
To capture the frequency, timing and duration of carp aggregations at screened wetlands,
programmable trail cameras (X-trail HD-3Gw Telstra 12 MP, AC-3GW) were installed on the inlet
culverts of four wetlands (Beldora, Murbko South, Hart Lagoon and North Purnong) (after
Thwaites and Cheshire 2016). A total of six cameras were deployed: two cameras at Beldora,
one on each of the adjacent culverts (Beldora 1 and 2); two at Murbko South, one on the river
culvert (Murbko 1) and one on the creek culvert (Murbko 2); and a single camera was installed on
the inlet culvert of both North Purnong and Hart Lagoon (Appendix 1). Cameras were installed
between September and November 2017 with the final download occurring during November
2018 (Table 2). Cameras were fitted with 100o field of view lenses, elevated ~5 m above water
level, located in a central position on each culvert and angled to capture images of an area directly
adjacent to the CES. Each camera was telemetered using the 3G mobile network, fitted with range
extending aerials, equipped with 32 GB of internal storage (~10,000 images) and powered by an
external power supply incorporating rechargeable batteries and a solar recharge system (X-Trail
10v Solar Panel Kit, LTL-sol). Each camera and power supply was mounted in a sturdy theft
resistant metal enclosure (Figure 2). To increase the probability of capturing images of
aggregating carp, cameras were programmed to take images at 30 minute intervals during
daylight hours for the duration of the study. Captured images were sent to a dedicated e-mail
address via the 3G network and backed-up on the camera’s internal storage. To ensure internal
storage did not reach capacity, cameras were downloaded regularly (Table 2). Water depth was
measured directly in front of each CES and mean water depth calculated from daily water levels
taken from Locks 1–4 (https://riverdata.mdba.gov.au).
Image analysis
Photos were evaluated to identify the image that captured the most carp at each location per day.
All visible carp were then manually counted and numbered using image analysis software (Image
J 1.52a) and the total recorded. Images were also inspected to record the presence of fouling or

Thwaites, L. and Schmarr, D. (2019) Carp Exclusions at Wetland Inlets in the River Murray
18
entrapment of native fauna (i.e. turtles). The timing, duration and frequency of captured
aggregations is graphically represented.

Thwaites, L. and Schmarr, D. (2019) Carp Exclusions at Wetland Inlets in the River Murray
19
Monitoring the operational performance of the carp screens
The operational performance of each carp screen was evaluated for the duration of the project.
This included monitoring and recording fouling, structural integrity and entrapment of native
species (e.g. turtles). This evaluation relied on visual inspections during sampling rounds and
camera downloads, interrogation of camera data and consultation with DEW/NRM staff.
Figure 2. Camera setup showing mounting pole (left), security box, solar panel and external aerial (bottom right) and
mounted camera and finger movement sensor battery and data logger (top right).

Thwaites, L. and Schmarr, D. (2019) Carp Exclusions at Wetland Inlets in the River Murray
20
2.4. Monitoring carp exiting screened wetlands via one-way gates
To determine timing, duration and frequency of carp activity at the NCES one-way gates, finger
movement sensors/counters were installed on the gates at Beldora (1 and 2), Murbko South (1
and 2) and North Purnong (after Thwaites and Cheshire 2016) (Appendix 1). Each finger
movement sensor/counter incorporated an inductive proximity sensor (Allen-Bradley 871TM-
DH5NP18-H2), switch activation mechanism and an event data logger (Event 101A, MadgeTech
Inc.). As carp attempted to push through the gate, the lifted finger activated the switching
mechanism by lifting a hinged stainless steel rod fitted across all the fingers (Figure 3). As the rod
was lifted, it was detected by the proximity sensor and the activity logged. The logger was
programmed to read at a maximum of 4 readings s-1 (4Hz) and the proximity sensor set to trigger
once a finger was lifted past 14o, the lift angle required to create a gap wide enough for a 250 mm
TL carp to pass through the gate (Figure 4) (Thwaites et al. 2010; Thwaites and Cheshire 2016).
Figure 3. New carp screen incorporating horizontal ‘venetian’ bars and one-way gate (left) and finger movement sensor
mechanism showing inductive proximity sensor and hinged stainless steel rod (right).
As carp could lift a finger without pushing through and the logger would read continuously if the
trigger mechanism was held at 14o, the data was filtered within Excel to record readings that
occurred at ≥1 second apart, the time taken for the smallest carp to push through the one-way
gate in a laboratory trial (Thwaites et al. 2010). These criteria ensured the data recorded is
indicative of carp activity consistent with attempts to push through the gate. It should be noted
Thwaites, L. and Schmarr, D. (2019) Carp Exclusions at Wetland Inlets in the River Murray
21
this is not an absolute measure of carp exiting the wetland but a relative measure of activity at
the gate (i.e. attempted and successful passage through the gate). It is also important to note that
a proportion of recorded activity could be due to other factors including turtles, other fish species
and intermittent fouling. The timing, duration and frequency of activity at the one-way gate is
graphically represented.
Figure 4. Image of 605 mm TL carp pushing though prototype one-way gate within a laboratory trial. This carp is
required to lift a finger ~37o to create an aperture large enough for it to push through on an angle. A carp 250 mm TL is required to lift one finger 14o to create an aperture large enough for it to push through (Thwaites et al. 2010).

Thwaites, L. and Schmarr, D. (2019) Carp Exclusions at Wetland Inlets in the River Murray
22
3. RESULTS AND DISCUSSION
3.1. Fish assemblage
A total of 59,112 fish from 14 species, including 9 native species (n=53,708; ~91.5% of total catch,
TC; ~67.6% of total biomass, TB) and 5 invasive species (n=5,404; ~8.5% TC; ~32.4% TB) were
captured during five sampling rounds (Table 3, Figure 5, Table 6-Appendix 2). Carp gudgeons
(n=41,811; ~71.3% TC; ~0.92% TB) and bony herring (n=7,196; ~12.3% TC; ~64.8% TB) were
the most abundant native species, while common carp (n=2,493; ~3.5% TC; ~32.1% TB) and
eastern gambusia (Gambusia holbrooki) (n=2,750; ~4.7% TC; ~0.06% TB) the most abundant
invasive species. A total of 103 turtles from 3 species were captured across 5 sampling rounds.
Long-necked turtles (Chelodina longicollis) were the most abundant (n=86; 86% TC) followed by
short-neck Macquarie River turtles (Emydura macquarii) (n=13; 12% TC) and broad-shelled
turtles (Chelodina expansa) (n=4; 4% TC) (Table 3, Figure 5, Table 6-Appendix 2).
Figure 5. Images of fyke net catch including a tiger snake captured at Riverglades.

Thwaites, L. and Schmarr, D. (2019) Carp Exclusions at Wetland Inlets in the River Murray
23
Table 3. Catch summary for all treatments across each sampling round. * indicates presence of species within the fifth sampling round (SR5). SR1: 20 Nov-01 Dec
2017; SR2: 05-13 Feb 2018; SR3: 16-27 April 2018; SR4: 14-29 June 2018; SR5: 1-9 Nov 2018. N = NCES, O = OCES, U = Unscreened.
CAR AUR
CHE EXP
CHE LON
CRA FUL
CYP CAR
CYP CAR (YOY)
EMY MAC
GAM HOL
HYP SPP
MAC AMB
MEL FLU
MIS ANG
NEM ERE
PER FLU
PHI GRA
PHI MAC
RET SEM
TAN TAN
SR1-N 7 0 2 196 324 108 0 16 5434 1 10 5 528 1 111 2 3 0
SR1-O 18 0 5 258 207 257 1 44 9596 6 1 2 945 3 18 9 2 0
SR1-U 11 0 12 182 98 199 2 6 5692 5 10 6 1054 11 16 1 10 0
SR2-N 4 0 2 162 133 0 0 136 3615 0 16 1 1194 3 541 1 0 1
SR2-O 27 0 20 509 76 9 6 678 2241 0 4 5 814 0 163 10 8 0
SR2-U 8 0 4 595 35 11 1 11 3588 2 132 0 1182 0 312 7 2 1
SR3-N 2 1 6 40 27 1 0 513 3594 0 18 2 471 3 41 1 0 0
SR3-O 3 0 2 282 33 0 0 1098 2407 1 0 0 373 0 23 1 21 0
SR3-U 4 1 8 516 41 0 1 184 3839 3 18 1 361 2 76 0 16 1
SR4-N 16 0 1 36 32 1 0 40 554 2 0 0 85 0 38 4 3 0
SR4-O 13 0 0 88 14 0 0 24 695 3 0 0 123 0 8 0 45 0
SR4-U 3 0 3 16 18 11 0 0 556 8 5 0 66 0 3 0 65 0
SR5-N * 0 7 * 48 148 0 * * 2 * * * * * * *
SR5-O * 0 8 * 32 524 1 * * 5 * * * * * *
SR5-U * 2 6 * 46 60 1 * * 6 * * * * * * *
Grand Total
116 4 86 2879 1164 1329 13 2750 41811 44 214 22 7196 23 1351 36 175 3
Species list: CAR AUR = goldfish, CHE EXP = broadshell turtle, CHE LON = long-neck turtle, CRA FUL = unspecked hardyhead CYP CAR = common carp (>130
mm TL), CYP CAR (YOY) = young-of-year carp (<130 mm TL), EMY MAC = short-neck turtle, GAM HOL = mosquito fish, HYP SPP = carp gudgeon, MAC AMB=
golden perch, MEL FLU = rainbowfish, MIS ANG = oriental weatherloach, NEM ERE = bony herring, PER FLU = redfin perch, PHI GRA = flathead gudgeon, PHI
MAC = dwarf flathead gudgeon, RET SEM = Australian smelt, TAN TAN = eel-tailed catfish.

Thwaites, L. and Schmarr, D. (2019) Carp Exclusions at Wetland Inlets in the River Murray
24
Multivariate analysis of the fish assemblage (composition and abundance) data in the first four
sampling rounds found no significant difference across treatments (PERMANOVA: F2,34=0.636,
p=0.751); however, there was a significant difference across sampling rounds (PERMANOVA:
F3,34=6.130, p=0.001). There was no significant interaction detected between treatment and
sampling round (PERMANOVA: F6,34=0.320, p=0.999). Significant differences (p<0.05) between
sampling rounds one and two, one and three and one and four, between sampling round two and
four and between sampling round three and four were mostly driven by decreasing abundance of
carp gudgeon, bony herring, unspecked hardyhead (Craterocephalus fulvus) and Gambusia
(Figure 6). Changes in fish assemblage structure were correlated with decreases in water
temperature (Figure 7).
Figure 6. Non-metric multidimensional scaling (NMDS) based on fish assemblage data (abundance) from sampling
rounds one to four. Plot is overlaid with species correlates. Treatments:▲= NCES, ● = Unscreened, = OCES;
Sampling Rounds: 1 = Black, 2 = Blue, 3 = Grey, 4 = Orange.

Thwaites, L. and Schmarr, D. (2019) Carp Exclusions at Wetland Inlets in the River Murray
25
Figure 7. Non-metric multidimensional scaling (NMDS) based on fish assemblage data (abundance) from sampling
rounds one to four. Plot is overlaid with environmental correlates. Treatments:▲= NCES, ● = Unscreened, = OCES; Sampling Rounds: 1 = Black, 2 = Blue, 3 = Grey, 4 = Orange.
Analysis of fish assemblage (presence-absence) in all five sampling rounds found a significant
difference across treatments (PERMANOVA: F2,43=3.177, p=0.007) and across sampling rounds
(PERMANOVA: F4,43=12.166, p=0.015) (Figure 8). There was no significant interaction detected
between treatment and sampling round (PERMANOVA: F8,43=0.608, p=0.921). The significant
differences in treatment (p<0.05) were a result of differences in the fish assemblage in wetlands
fitted with NCES, while there was no significant difference between OCES and unscreened
wetlands. The difference between new screened wetlands and unscreened wetlands was driven
by lower prevalence of golden perch, Murray rainbowfish (Melanotaenia fluviatilis) and smelt
(Retropinna semoni), and higher prevalence of dwarf flatheaded gudgeon (Philypnodon
macrostomus), Gambusia (Gambusia holbrooki), flatheaded gudgeon (Philypnodon grandiceps),
goldfish (Carassius auratus) and redfin perch (Perca fluviatilis) (Figure 8). The difference between
new screened wetlands and old screened wetlands was driven by lower prevalence of smelt,
golden perch and goldfish, and higher prevalence of dwarf flatheaded gudgeon, Murray
rainbowfish and redfin perch (Figure 8). The significant differences in sampling rounds (p<0.05)
were a result of differences in the fish assemblage between sampling round two and four, two
and five, and also between sampling round four and five. The difference between sampling round
two and sampling round four was driven by higher prevalence of Murray rainbowfish, dwarf
flatheaded gudgeon, Gambusia and goldfish, and lower prevalence of golden perch and smelt
(Figure 8). The difference between sampling round two and sampling round five was driven by
lower prevalence of oriental weatherloach (Misgurnus anguillicaudatus), golden perch, dwarf

Thwaites, L. and Schmarr, D. (2019) Carp Exclusions at Wetland Inlets in the River Murray
26
flatheaded gudgeon and smelt, and higher prevalence of Murray rainbowfish and Gambusia
(Figure 8). The difference between sampling round four and sampling round five was driven by
lower prevalence of oriental weatherloach, Murray rainbowfish, golden perch, Gambusia and
goldfish, and higher prevalence of smelt. Changes in fish species presence-absence were not
highly correlated with any water quality variables (Figure 9).
Figure 8. Non-metric multidimensional scaling (NMDS) based on fish assemblage data (presence-absence) from all
five sampling rounds. Plot is overlaid with species correlates. Treatments:▲= NCES, ● = Unscreened, = OCES; Sampling Rounds: 1 = Black, 2 = Blue, 3 = Grey, 4 = Orange, 5 = Green.
Figure 9. Non-metric multidimensional scaling (NMDS) based on fish assemblage data (presence-absence) from all
five sampling rounds. Plot is overlaid with environmental correlates. Treatments:▲= NCES, ● = Unscreened, = OCES;
Sampling Rounds: 1 = Black, 2 = Blue, 3 = Grey, 4 = Orange, 5 = Green.

Thwaites, L. and Schmarr, D. (2019) Carp Exclusions at Wetland Inlets in the River Murray
27
Multivariate analysis of turtle assemblage (composition and abundance) in all five sampling
rounds found no significant difference across treatments (PERMANOVA: F2,43=0.980, p=0.41) or
across sampling rounds (PERMANOVA : F4,43=1.590, p=0.132). There was no significant
interaction detected between treatment and sampling round.
The differences in fish assemblage across sampling rounds were largely as a result of seasonal
decline in the abundance of the most common species present in the wetlands. This pattern
reflects the reported seasonal decline in catchability observed in small-bodied species in wetlands
elsewhere in the River Murray (Balcombe and Closs 2004). The driver of this decline can be
related to several factors such as ontogenetic niche shifts in habitat use, spawning and mortality,
or decreased temperature and associated reduction in activity leading to less frequent interaction
with passive sampling equipment such as nets and traps (Swales 1987). Whilst treatment did not
appear to have an effect on the abundance of fish assemblages analysed in the first four sampling
rounds (Figures 6 and 7), wetlands with NCES did appear to have an effect on the presence or
absence of some species analysed across all five sampling rounds (Figures 8 and 9). This study
largely concurs with the findings from previous studies of fish assemblage in the SA River Murray
which found that main channel and permanent wetlands were dominated by the same generalist
native species and invasive species observed in this study (Smith et al. 2009a).
It is unlikely carp and other large-bodied species (i.e. golden perch) were directly impacting the
presence of small-bodied species as there were no significant differences in the abundance of
large-bodied species across treatments (Table 3, Figure 6, Table 6-Appendix 2). The relative
lower presence of golden perch, goldfish and smelt in NCES wetlands in comparison to other
wetlands could be attributed to these species being excluded by CES. Hillyard et al. (2010) found
over 65% of the golden perch in the size range sampled during lateral movement surveys were
excluded by jail bars designed to exclude carp ≥250 mm TL. Indeed, the higher prevalence of
golden perch in unscreened wetlands suggests golden perch are being excluded by CES. Hillyard
et al. (2010) also commented that despite the majority of fish captured in wetlands being small-
bodied and unlikely to be physically restricted by the dimensions of CES, their behaviour may
have been influenced by the screens. However, despite significant differences between fish
communities based on presence-absence, the changes in prevalence of species contributing to
these differences were very low. Although the absence of golden perch, smelt and goldfish was
driving the difference between NCES and unscreened and between NCES and OCES, they were
still observed at least once in every wetland throughout the course of the project (Table 3, Table
6-Appendix 2) suggesting their presence or absence may be a result of sampling stochasticity.

Thwaites, L. and Schmarr, D. (2019) Carp Exclusions at Wetland Inlets in the River Murray
28
Further monitoring will provide an opportunity to confirm differences in fish community between
wetlands with different screen types.

Thwaites, L. and Schmarr, D. (2019) Carp Exclusions at Wetland Inlets in the River Murray
29
3.2. Carp abundance and size structure
Model Selection
The best model fit for carp abundance in the sampled wetlands included sampling round,
treatment and the interaction of the two factors (Table 4). The best model fit for carp length in the
sampled wetlands included all factors input into the model; however, this model failed to converge
at a solution so was discounted. The next best model fit for carp length included sampling round,
treatment and the interaction of the two factors (Table 4). The outcome of model selection enabled
carp abundance and size structure to be tested for the effect of treatment and sampling round.
Table 4. Predictive GLMMs for Carp abundance and length collected during year-long field sampling. Model selection
results include the intercept and random effect for sample site. The stronger models are those with the lowest AIC. ΔAIC values compare the selected model AIC with all other model. Models marked with * failed to converge on a
solution and were discounted.
Variable Model df AIC ΔAIC
Carp abundance Treatment, sampling round, treatment x sampling
round
16 642.3 0
Treatment, sampling round, treatment x sampling
round, Distance from sea
20 642.9* 0.6
Treatment, sampling round, treatment x sampling
round, Weir pool, Distance from sea
17 643.7* 1.4
Sampling round 6 743.1 100.8
Treatment 4 1710.3 1068
Carp Length Treatment, sampling round, treatment x sampling
round
17 14332.7 0
Treatment, sampling round, treatment x sampling
round, Weir pool, Distance from sea
21 14329.7* -3
Treatment, sampling round, treatment x sampling
round, Distance from sea
18 14334.7* 2
Sampling round 7 14349.1 16.4
Treatment 5 14380.4 47.7
Relative Abundance
In testing the effect of treatment and sampling round on carp abundance across all sampling
rounds using GLMM, a significant interaction between treatment and sampling round
(χ2(8)=113.93, p<0.0001) was found. The significant interaction indicates the effect of sampling
round is dependent upon treatment. Because there was a significant interaction, each factor within
the GLMM was analysed individually to assess the differences in carp abundance between
treatments within individual sampling rounds and between sampling rounds within individual

Thwaites, L. and Schmarr, D. (2019) Carp Exclusions at Wetland Inlets in the River Murray
30
treatments. It is important to note that due to the method of calculating least squares means from
a GLMM, the estimated means and confidence intervals for each factor can vary based upon the
subset of data used (Lenth 2016) and this is reflected in Figures 10–13. There was a significant
effect of treatment (χ2(2)=6.32, p=0.04) in sampling round one. Multiple contrasts showed a
significant difference between NCES and unscreened wetlands (z=2.969, p=0.008) but no
significant difference between NCES and OCES (z=1.245, p=0.43) or between OCES and
unscreened wetlands (z=1.739, p=0.19). There was no significant effect of treatment for all other
sampling rounds (Figure 10).
Figure 10. Mean carp relative abundance (CPUE ± 95% C.I.) within each sampling round for treatment and control
wetlands (Black = NCES, Orange = OCES, Grey = Unscreened). SR1: 20 Nov-01 Dec 2017; SR2: 05-13 Feb 2018; SR3: 16-27 April 2018; SR4: 14-29 June 2018; SR5: 1-9 Nov 2018. Note: relative abundances and C.I. based upon least squares means from the within sampling round GLMM.
Assessing differences between sampling rounds within individual treatments for carp abundance
showed for NCES (χ2(4)=654.37, p<0.0001), OCES (χ2(4)=368.7, p<0.0001) and unscreened
wetlands (χ2(4)=68.71, p<0.0001) there was a significant effect of sampling round (Figure 11).
Multiple contrasts within NCES wetlands showed a significant decrease in abundance (p<0.0001)
between sampling round one and sampling round two, three, four and five, and between sampling
round two and sampling round three, four and five (Figure 11). A significant decrease (p<0.001)
was observed within wetlands fitted with OCES between sampling round one and sampling round
two, three, four and five, between sampling round two and sampling round four and five, between
sampling round three and four, and a significant increase (p<0.01) between sampling round four
and five. Unscreened wetlands showed a significant decrease (p<0.01) between sampling round
one and sampling round two, three, four and five, between sampling round two and sampling
0
50
100
150
200
250
300
350
SR1 SR2 SR3 SR4 SR5
Rela
tive
A
bundance (
CP
UE
95%
C.I.)

Thwaites, L. and Schmarr, D. (2019) Carp Exclusions at Wetland Inlets in the River Murray
31
round four, between sampling round three and four, and a significant increase (p<0.001) between
sampling round four and five.
Figure 11. Mean carp relative abundance (CPUE ± 95% C.I.) for treatment and control wetlands (Black = NCES,
Orange = OCES, Grey = Unscreened) over the duration of the study from left to right within each treatment: SR1: 20 Nov-01 Dec 2017; SR2: 05-13 Feb 2018; SR3: 16-27 April 2018; SR4: 14-29 June 2018; SR5: 1-9 Nov 2018. Note:
relative abundances and C.I. based upon least squares means from the within treatment GLMM.
Size structure
GLMM of carp length showed there was a significant interaction between treatment and sampling
round (χ2(4)=31.43, p<0.001) (Figure 12). Due to this significant interaction, each factor within
the GLMM was analysed individually to assess the differences in size structure between
treatments within individual sampling rounds and between sampling rounds within individual
treatments. There was a significant effect of treatment (χ2(2)=7.28, p=0.03) in sampling round one
(Figure 12). Multiple contrasts showed a significant difference between NCES and unscreened
wetlands (z=-3.804, p<0.001) but no significant difference between NCES and OCES (z=-2.249,
p=0.06) or between OCES and unscreened wetlands (z=-2.249, p=0.25). There was no significant
effect of treatment for all other sampling rounds (Figure 12).
0
20
40
60
80
100
120
140
160
180
200
NCES OCES Unscreened
Rela
tive
A
bundance (
CP
UE
95%
C.I.)

Thwaites, L. and Schmarr, D. (2019) Carp Exclusions at Wetland Inlets in the River Murray
32
Figure 12. Mean carp length (± 95% C.I.) within each sampling round for treatment and control wetlands (Black = NCES, Orange = OCES, Grey = Unscreened). SR1: 20 Nov-01 Dec 2017; SR2: 05-13 Feb 2018; SR3: 16-27 April 2018; SR4: 14-29 June 2018; SR5: 1-9 Nov 2018. Note: carp length and C.I. based upon least squares means from the within sampling round GLMM.
Multiple contrasts within the NCES treatment showed there were significant differences in carp
length between sampling round one and three (z=-3.037, p=0.02), one and five (z=-5.416,
p<0.0001), two and five (z=-4.583, p<0.0001) and four and five (z=-3.477, p=0.0046) (Figure 13).
Within the OCES treatment there were significant differences between sampling rounds one and
three (z=-2.768, p=0.0447) and sampling round one and five (z=-3.039, p=0.0201). Within the
Unscreened treatment there were significant differences between sampling round one and four
(z=2.908, p=0.03) and four and five (z=-3.403, p=0.006).
Figure 13. Mean carp length (± 95% C.I.) for treatment and control wetlands (Black = NCES, Orange = OCES, Grey =
Unscreened) over the duration of the study from left to right within each treatment: SR1: 20 Nov-01 Dec 2017; SR2: 05-13 Feb 2018; SR3: 16-27 April 2018; SR4: 14-29 June 2018; SR5: 1-9 Nov 2018. Note: carp length and C.I. based
upon least squares means from the within treatment GLMM.
0
100
200
300
400
500
600
SR1 SR2 SR3 SR4 SR5
Carp
Length
(TL,
mm
95%
C.I.)
0
100
200
300
400
500
600
NCES OCES Unscreened
Carp
Length
(TL,
mm
95%
C.I.)

Thwaites, L. and Schmarr, D. (2019) Carp Exclusions at Wetland Inlets in the River Murray
33
This study evaluated differences in the abundance and size structure of carp between un-
screened wetlands, wetlands fitted with NCES (horizontal “venetian” bar and one-way gates) and
wetlands fitted with OCES (Alu-tread, reinforced Alu-tread and security mesh). From previous
research, it was anticipated that during the carp spawning season, the abundance of carp would
be higher in unscreened wetlands compared to wetlands fitted with OCES and wetlands fitted
with NCES. Unscreened wetlands would present no barrier to movement, while screened
wetlands would prevent the entry and exit of carp ≥250 mm TL. It was also anticipated that the
abundance of carp would be higher in wetlands fitted with OCES compared to unscreened
wetlands and wetlands fitted with NCES at the completion of the carp spawning season. Carp
≥250 mm TL would be unable to exit wetlands fitted with OCES but would exit unscreened
wetlands and wetlands fitted NCES (via the one-way gates). As CES are designed to restrict the
passage of large carp it was also anticipated that carp would be smaller in screened versus
unscreened wetlands.
Differences were detected between treatments for carp abundance in sampling round one with
significantly higher abundance in wetlands fitted with NCES in comparison to unscreened
wetlands. No significant effect was detected for the remaining sampling rounds. The differences
in sampling round one was driven by a higher abundance of juvenile carp within wetlands fitted
with NCES (Figure 12; Figure 34-Appendix 2). Age-at-length relationships (Smith 2005) indicate
immature carp (130-250 mm TL) captured during the present study were spawned during the
2016 floods (Figure 14). The floodplain inundation associated with the floods coincided with the
carp spawning season (spring-summer), providing ideal conditions for successful spawning and
recruitment. Indeed, carp numbers are commonly reported to increase as a result of floodplain
inundation (Brown et al. 2003; Stuart and Jones 2006; Bice 2014; Thwaites 2014; Koehn et al.
2016). This response is primarily associated with increases in available spawning habitat
including inundated submerged, terrestrial and amphibious vegetation (Nicol et al. 2013; Thwaites
2014), enhanced primary and secondary production through nutrient release (Junk et al. 1989;
Ribeiro et al. 2004; Balcombe and Arthington 2009) and decreased predation risk (Bajer and
Sorenson 2010).

Thwaites, L. and Schmarr, D. (2019) Carp Exclusions at Wetland Inlets in the River Murray
34
Figure 14. Date of birth for Juvenile carp (130-250 mm TL) captured within each treatment across the duration of the
study. Blue line is discharge into South Australia (ML day-1) showing the flood peak that occurred during 2016-17.
As the 2016 floodwaters receded, juvenile carp are likely to have concentrated into warm, shallow,
slow-flowing and well vegetated habitats within the mainstream and off-stream areas where they
generally remain until they became strong swimmers at ~70 mm TL or ~4.2 months old (Smith
and Walker 2004b; Jones and Stuart 2007). Carp <200 mm TL (<14 months old) are thought to
move out of backwaters to colonise new areas (Reynolds 1983). At this size class, all juvenile
carp should have been able to exit both screened and unscreened wetlands. However, at ~120
mm TL (~31.5 mm body depth ~8 months, July 2017 for carp spawned on peak flows) juvenile
carp are reaching a size class that could be retained by the NCES (and some OCES). If carp are
unable or unwilling to roll on their side to pass through CES then passage is restricted by body
depth. Using length vs. depth regression analysis and applying a 10% compression factor to carp
depth data (after Hillyard et al. 2010) results in an exclusion (or retention) threshold of ~120 mm
TL for horizontal “venetian” bars (~31 mm vertical aperture). However, previous research
demonstrated goldfish (6.17 ± 0.56 cm TL), a close relative to carp, would swim on their side
though horizontal slots ~42% wider than their body width when presented with a threat stimulus
(Webb et al. 1996). The slots were cut into an 80 mm thick opaque partition that represented
~1.3% of the TL of the goldfish tested. If carp display similar behaviour and are limited by a similar
width, then carp passage will start to be restricted at ~150 mm TL (~21 mm body width without

Thwaites, L. and Schmarr, D. (2019) Carp Exclusions at Wetland Inlets in the River Murray
35
compression). Even if carp are willing to roll on their side, passage through the “venetian” style
bars is likely to present a greater challenge. Constructed using a 50 mm flat bar, the “venetian”
bar is ~33% of the TL of a 150 mm TL carp, which would require greater control of posture when
compared to a shorter bar (Webb et al. 1996). While the one-way gates (31 mm horizontal
aperture) in the NCES are designed to permit the passage of carp <250 mm TL, the gate is only
a relatively small proportion of the screen that would require greater exploration to locate in turbid
waters. Thus, the significantly higher abundance within wetlands fitted with NCES during the first
sampling round could be associated with the retention threshold of the horizontal “venetian” bars.
The decline in abundance within NCES wetlands over subsequent sampling rounds is partly
associated with natural mortality as young-of-year and one-year-old carp have an estimated
mortality rate of ~80% within permanently connected wetlands (Koehn et al. 2016). The decline
also suggests juvenile carp and potentially adult carp (see one-way gate below) may be exiting
the wetlands. However, the rates of emigration for juvenile carp appear to be slower than
unscreened wetlands and this may ultimately result in the retention of a higher abundance of carp
within wetlands fitted with NCES. If NCES are altering rates in immigration/emigration for juvenile
carp, then there are likely to be increased impacts on large-bodied native species in comparison
to the initial optimized jail bar design proposed by Hillyard et al. (2010). This design permitted
passage of >95% of bony herring and ~35% of golden perch in the range of lengths recorded
moving laterally between river and wetlands in their study (Hillyard et al. 2010).
Although abundance in wetlands fitted with OCES was not significantly different to unscreened
wetlands, the higher abundance (Figure 10) of carp in sampling round one and higher abundance
of juveniles (Figure 34-Appendix 2) suggest rates of emigration may also be slow in these
wetlands. If carp are unwilling to roll on their side then the exclusion/retention threshold is ~130
mm TL for Alu-tread (34 mm vertical aperture) while the threshold for reinforced Alu-tread is likely
to be <130 mm TL due to the vertical reinforcing bar. Considerably larger carp (~250 mm TL) can
pass security mesh, as it is a diamond pattern (58x63 mm). The exclusion/retention threshold if
carp display similar behaviour to the goldfish reported by Webb et al. (1996) would be ~170 mm
TL for Alu-tread and ~140 mm TL for the reinforced Alu-tread due to the reinforcing bar. There
would be little difference in the security mesh due to its square/diamond pattern. A potential key
difference between the NCES and OCES is the thickness of the screens. Alu-tread has a
thickness of 13 mm and security mesh is ~10 mm, which represents 8.7% and 6.7% the body
length of a 150 mm TL carp, respectively. The initial optimized vertical jail bar design utilised
10 mm diameter rod (Karl Hillyard 2019, pers. comm.) which represented only ~6.7% of the body

Thwaites, L. and Schmarr, D. (2019) Carp Exclusions at Wetland Inlets in the River Murray
36
length of a 150 mm TL carp. It is possible screen or bar thickness affects passage through CES
and this warrants further investigation.
The trends in abundance across sampling rounds are partly associated with changes in carp
activity (Figure 11). Carp activity varies seasonally with increased activity during spring-summer
and decreased activity during the winter months (Conallin et al. 2012; Taylor et al. 2012). Activity
within wetlands also changes seasonally with peak activity occurring during spring/summer
spawning season before declining during winter as carp seek overwinter habitat in the main river
channel (Smith and Walker 2004a; Crook and Gillanders 2006; Stuart and Jones 2006, Penne
and Pierce 2008). During periods of increased activity, carp are more vulnerable to capture by
passive gears such as fyke and gill nets (Taylor et al. 2012). The decline in abundance observed
after the first sampling round may also be associated with levels of natural mortality. Young-of-
year and one year old carp have an estimated mortality rate of ~80% within permanently
connected wetlands (Koehn et al. 2016). Mortality decreases to 46% for two-year-old carp and
decreases to <20% for carp 6+ years old where it remains until carp reach 23+ years (Koehn et
al. 2016).
Treatment only had an effect on carp TL within sampling round one; however, there were
significant differences between sampling rounds within each treatment. For NCES, carp TL was
variable but showed an overall increase between sampling rounds one and five. For wetlands
fitted with OCES, an overall increase in TL was observed between sampling rounds one and five.
Unscreened wetlands behaved differently showing an overall decrease in carp TL between
sampling rounds one and four before a significant increase in sampling round five.
The general pattern of increased carp TL in screened wetlands is associated with a level of
emigration (see above) and natural mortality of juvenile carp (80%) as well as increases in TL
relating to growth (Koehn et al. 2016; Vilizzi and Walker 1999). Indeed, the increases in TL are
reasonably consistent with reported growth rates of carp within the lower River Murray (Vilizzi and
Walker 1999). Using length-at-age relationships and mean TL from the first sampling round
suggests carp TL by the fifth sampling round should be 361 mm TL and 398 mm TL for NCES
and OCES wetlands, respectively (Vilizzi and Walker 1999). The recorded mean within new and
old screened wetlands during sampling round five was 357 mm TL and 397 mm TL, respectively.
The decrease in TL in unscreened wetlands across the first four sampling rounds suggests larger
carp were exiting the wetlands while the relative proportion of juvenile carp increased. The
increase in TL between rounds four and five indicates large breeding carp had moved back into

Thwaites, L. and Schmarr, D. (2019) Carp Exclusions at Wetland Inlets in the River Murray
37
the wetland while juvenile carp had exited (Figure 34-Appendix 2). The observed patterns in
unscreened wetlands are consistent with seasonal movement patterns of carp (Sivakumaran et
al. 2003; Smith and Walker 2004b; Smith 2005; Stuart and Jones 2006; Conallin et al. 2012).
Juvenile carp have been captured attempting to move into a wetland during July and June prior
to the peak movement of adult carp in September as water temperatures approached 16oC
(Conallin et al. 2012). In contrast, the observed growth patterns within screened wetlands indicate
they contain a relatively static carp population and seasonal shifts in juvenile and adult carp
abundance is limited. While this suggests screens are beneficial by limiting the level of
immigration, it also indicates both NCES and OCES are trapping carp within wetlands. Similar
results were reported by Nichols and Gilligan (2003), who found that despite screens effectively
excluding carp >300 mm TL they were recorded in similar abundances in adjacent wetlands with
and without CES. In addition, they reported carp >250 mm TL were in similar frequencies in
wetlands fitted with CES and the adjacent river channel. Further, Smith et al. (2009a) reported
that CES had a limited effect on overall patterns in the occurrence and abundance of common
carp in comparison to unscreened wetlands.

Thwaites, L. and Schmarr, D. (2019) Carp Exclusions at Wetland Inlets in the River Murray
38
3.3. Monitoring the frequency, timing and duration of wetland carp aggregations
Remote trail cameras successfully recorded the presence of carp and the formation of
aggregations at wetland inlets (Figure 15). A total of 30,852 pictures were captured at Beldora 1,
Beldora 2, Hart Lagoon, Murbko South 1, Murbko South 2 and North Purnong. These were filtered
to a total of 2,319 pictures containing the maximum daily carp counts for each camera and
resulted in a total of 9,698 observations of carp (Figure 15). There was considerable variation in
the numbers of carp observed across wetlands with the highest overall daily activity recorded at
Beldora 1 (mean ± S.E. = 9.0 ± 0.5 carp, n=383) and the lowest at Murbko South 2 (0.05 ± 0.01
carp, n=387) (Table 5). Water depth did not appear to affect fish visibility or activity with the highest
mean daily counts observed in the deepest and the shallowest inlets (Table 5).
Table 5. Daily mean of maximum daily carp counts (± S.E.) for all CES monitoring with remote trail cameras and mean
water depth (m, range) for each inlet culvert.
Site Mean daily carp count ± S.E (n) Mean water depth at CES (m, range)
Beldora 1 9.0 ± 0.5 (383) 1.47 (1.46–1.48)
Beldora 2 6.8 ± 0.4 (383) 1.47 (1.46–1.48)
Hart Lagoon 8.0 ± 1.0 (383) 0.74 (0.73–0.80)
Murbko 1 0.06 ± 0.01 (387) 0.9 (0.87–0.98)
Murbko 2 0.05 ± 0.01 (387) 0.82 (0.79–0.89)
North Purnong 1.3 ± 0.1 (396) 1.0 (0.62–1.36)
Figure 15. Carp aggregations at Hart Lagoon (left) and Beldora 2 (right) captured by remote trail cameras.

Thwaites, L. and Schmarr, D. (2019) Carp Exclusions at Wetland Inlets in the River Murray
39
A total of 3,455 carp were observed across 383 pictures containing the maximum daily counts for
Beldora 1, while 2,621 carp were observed across 383 pictures at Beldora 2. Mean maximum
daily carp counts (carp activity) for Beldora 1 and 2 displayed seasonal variation with greatest
activity recorded during the cooler months (May–June) and relatively lower activity during the
warmer months (November–March) (Figure 16). Activity peaked at Beldora 1 (23.9 ± 2.5 carp)
and Beldora 2 (18.8 ± 1.7 carp) during May 2018 (mean river temperature, MRT~16oC; mean
wetland water temperature, MWT~13.8oC; mean day length, MDL~10.3h) with maximum daily
carp counts occurring in May (n=57 carp) and June (n=42 carp) for Beldora 1 and 2, respectively.
The lowest activity was recorded at Beldora 1 during December 2017 (2.8 ± 1.0 carp; MRT
~24.7oC; MWT~28.0oC; MDL~14.5h) and during February 2018 at Beldora 2 (1.5 ± 0.4 carp; MRT
~25.5oC; MWT~29.8oC; MDL~13.3h). Interestingly, peak activity occurred during a period when
some WMP recommend CES should be open (Figure 16).
Figure 16. Monthly mean (± S.E.) of daily maximum carp counts for Beldora 1 (light grey columns) and Beldora 2 (dark
grey columns) carp exclusion screens. Blue line is average monthly river temperatures (oC), green line is average monthly wetland water temperatures (oC) and red line indicates 16oC. For comparative purposes, the light grey shaded area indicates when carp screens are recommended to be open while white area indicates when screens should be closed according to the WMP for Murbko South, Hart, Morgan’s and Mussels Lagoons (Wegener 2012a; Wegener 2012b; Tesoriero et al. 2013; DEWNR 2015b).
A total of 3,080 carp were observed across 383 pictures containing the maximum daily counts for
Hart Lagoon. Peak carp activity was recorded during September 2018 (40.0 ± 10.5 carp;
MRT~14.5oC; MWT~11.8oC; MDL~11.8h) with the maximum daily count of 199 carp also
occurring in September (Figure 17). The lowest activity was observed during October 2017 with
zero carp recorded (MRT~20.6oC; MWT~19.6oC; MDL~13h) (Figure 17).
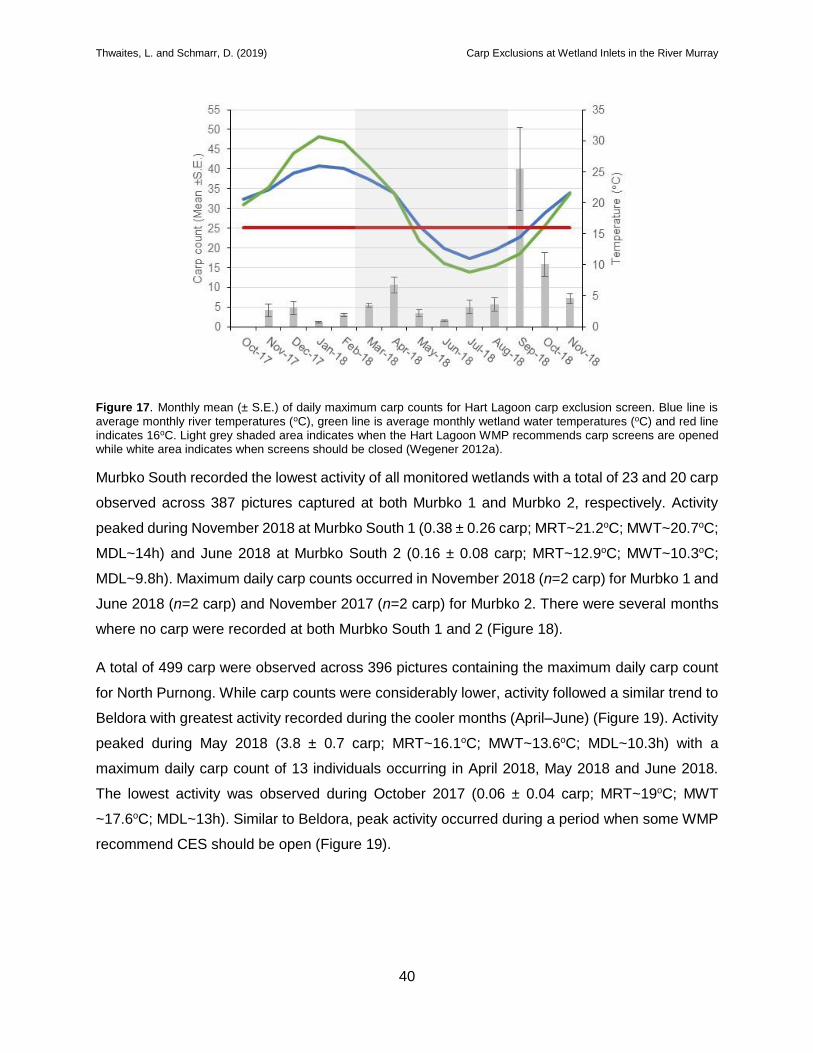
Thwaites, L. and Schmarr, D. (2019) Carp Exclusions at Wetland Inlets in the River Murray
40
Figure 17. Monthly mean (± S.E.) of daily maximum carp counts for Hart Lagoon carp exclusion screen. Blue line is
average monthly river temperatures (oC), green line is average monthly wetland water temperatures (oC) and red line indicates 16oC. Light grey shaded area indicates when the Hart Lagoon WMP recommends carp screens are opened while white area indicates when screens should be closed (Wegener 2012a).
Murbko South recorded the lowest activity of all monitored wetlands with a total of 23 and 20 carp
observed across 387 pictures captured at both Murbko 1 and Murbko 2, respectively. Activity
peaked during November 2018 at Murbko South 1 (0.38 ± 0.26 carp; MRT~21.2oC; MWT~20.7oC;
MDL~14h) and June 2018 at Murbko South 2 (0.16 ± 0.08 carp; MRT~12.9oC; MWT~10.3oC;
MDL~9.8h). Maximum daily carp counts occurred in November 2018 (n=2 carp) for Murbko 1 and
June 2018 (n=2 carp) and November 2017 (n=2 carp) for Murbko 2. There were several months
where no carp were recorded at both Murbko South 1 and 2 (Figure 18).
A total of 499 carp were observed across 396 pictures containing the maximum daily carp count
for North Purnong. While carp counts were considerably lower, activity followed a similar trend to
Beldora with greatest activity recorded during the cooler months (April–June) (Figure 19). Activity
peaked during May 2018 (3.8 ± 0.7 carp; MRT~16.1oC; MWT~13.6oC; MDL~10.3h) with a
maximum daily carp count of 13 individuals occurring in April 2018, May 2018 and June 2018.
The lowest activity was observed during October 2017 (0.06 ± 0.04 carp; MRT~19oC; MWT
~17.6oC; MDL~13h). Similar to Beldora, peak activity occurred during a period when some WMP
recommend CES should be open (Figure 19).

Thwaites, L. and Schmarr, D. (2019) Carp Exclusions at Wetland Inlets in the River Murray
41
Figure 18. Monthly mean (± S.E.) of daily maximum carp counts for Murbko South 1 (light grey columns) and Murbko
South 2 (dark grey columns) carp exclusion screens. Blue line is average monthly river temperatures (oC), green line is average monthly wetland water temperatures (oC) and red line indicates 16oC. Light grey shaded area indicates when the Murbko South WMP recommends carp screens are opened while white area indicates when screens should be closed (DEWNR 2015b).
Figure 19. Monthly mean (± S.E.) of daily maximum carp counts for North Purnong carp exclusion screen. Blue line is
average monthly river temperatures (oC), green line is average monthly wetland water temperatures (oC) and red line indicates 16oC. For comparative purposes, the light grey shaded area indicates when carp screens are recommended to be open while white area indicates when screens should be closed according to the WMP for Murbko South, Hart, Morgan’s and Mussels Lagoons (Wegener 2012a; Wegener 2012b; Tesoriero et al. 2013; DEWNR 2015b).
This study represents the first attempt to monitor and record the annual cycle of carp activity at
screened wetland inlets under regulated conditions (i.e. non-flood, non-drought). Based on
previous research it was anticipated that carp would attempt to migrate into wetlands and form
aggregations at CES during the first half of the carp spawning season as water temperatures and

Thwaites, L. and Schmarr, D. (2019) Carp Exclusions at Wetland Inlets in the River Murray
42
day lengths approached ~16oC and 12h, respectively (spring spawning cue) (Smith 2005; Stuart
and Jones 2006; Conallin et al. 2012). It was also anticipated that these aggregations would
diminish in the second half of the season and activity would be minimal in late autumn and winter
as carp migrate back into the main river channel to overwinter in deep-water habitats (Johnsen
and Hasler 1977; Inland Fisheries Service 2008; Penne and Pierce 2008). However, the observed
patterns of carp activity were highly variable with only one wetland (Hart Lagoon) displaying
activity patterns similar to the anticipated pattern.
Activity at Hart Lagoon peaked in September 2018 as water temperatures and day length were
approaching 16oC and 12h (MRT~14.5oC; MDL~11.8h) before declining through October and
November as water temperatures continued to rise. Although carp activity continued throughout
the year, it remained relatively low. The peak activity in September is consistent with commonly
reported off-channel migration and spawning behaviour at temperatures >15–16oC (Sivakumaran
et al. 2003; Smith and Walker 2004b; Smith 2005; Stuart and Jones 2006; Conallin et al. 2012).
Conallin et al. (2012) monitored the response of carp to an environmental water allocation at a
flow-through wetland within the South Australian section of the River Murray. They reported
similar activity with peak abundance of carp in prime spawning condition occurring in mid-
September (water temperature ~16oC; day length 12h) before declining to almost zero in
December as water temperatures continued to rise. The authors also report spawning
commenced in late September. Using age-at-length relationships for larval and juvenile carp in
the lower River Murray (Smith 2005) and length data collected from juvenile carp during the
present study shows peak spawning occurred in late September on 27/09/17 and 23/09/18.
While peak activity at Hart Lagoon coincided with a period when the CES are recommended to
be closed, several carp were observed between early-March and late-August indicating carp may
enter the wetland during a period when CES opening may be trialled (Wegener 2012a). As water
quality did not exceed critical levels during this period (Koehn 2004; Smith 2005; Table 7-
Appendix 2), these carp are likely to survive until spawning commences in spring.
Notwithstanding, the numbers that may enter are low compared to those attempting to enter
during the annual spawning migrations, and opening the CES between March and August will
allow free passage for large-bodied native fish species and other aquatic fauna (i.e. turtles).
Beldora and North Purnong displayed activity patterns that were distinctly different to anticipated
patterns and to those observed at Hart Lagoon. Peak activity at both wetlands occurred during

Thwaites, L. and Schmarr, D. (2019) Carp Exclusions at Wetland Inlets in the River Murray
43
May 2018 coinciding with declining mean river water temperatures and day length reaching ~16oC
and 10h, respectively. Activity at Beldora steadily declined from May to November with no
increase in activity as water temperature reached ~16oC in spring when spawning migrations are
expected (MDL~12h; late-September/early-October). Interestingly, monthly mean activity at
Beldora 1 and 2 was inversely correlated with mean monthly day length (r=0.83 and 0.85, n=14)
and mean monthly water temperature (r=0.78 and 0.80, n=14). There was a sharp decline in
activity from May to June at North Purnong and no increase in activity as temperatures
approached ~16oC (MDL~13h; mid-October). The peak activity in May could be associated with
a late spawning migration. Carp are asynchronous, multiple batch spawners that can spawn up
to two or three times per year when mean water temperatures exceed 15–16oC (Sivakumaran et
al. 2003; Smith and Walker 2004b; Smith 2005). In studying the spawning dynamics of carp in
the River Murray (South Australia), Smith and Walker (2004b) found spawning occurred initially
over at least 7 months, from mid-November 2001 to mid-May 2002 before commencing again in
mid-September 2002. While the authors found evidence of successful carp spawning in May, they
found no evidence of successful recruitment. Age-at-length calculations for juveniles captured
within Beldora and North Purnong during the present study indicate no recruitment occurred in
conjunction with the observed peaks in activity, the earliest successful spawning dates for 2018
were the 28/09/18 and 20/09/18, respectively (Smith 2005).
Activity patterns at Beldora and North Purnong were out of phase with the anticipated patterns.
Higher numbers of carp were observed attempting to enter the wetlands between March and
August; a period when carp are thought to seek overwinter habitat in the main river channel
(Johnsen and Hasler 1977; Inland Fisheries Service 2008; Penne and Pierce 2008). This poses
little risk to both wetlands as their WMPs recommend the NCES remain closed; however, if these
patterns occur at wetlands that undergo seasonal screen manipulations it is possible large
numbers of carp could enter. For example, the WMP for Morgan’s and Mussels Lagoons
recommend screens are opened during autumn to allow carp to exit the wetland and closed in
spring to intercept off-channel spawning migrations (Wegener 2012b; Tesoriero et al. 2013). If
water quality does not exceed critical levels during this period (Koehn 2004; Smith 2005), carp
that enter will survive until spawning commences in spring and potentially become trapped when
CES are closed (September; Wegener 2012a; Wegener 2012b; Tesoriero et al. 2013; DEWNR
2015b). Given out of phase patterns were observed at two wetlands located approximately 236
km apart, it is possible they could be occurring elsewhere across the SA section of the River
Murray. As such, it is important to conduct long-term monitoring at wetlands where screen

Thwaites, L. and Schmarr, D. (2019) Carp Exclusions at Wetland Inlets in the River Murray
44
manipulations form a component of the WMP. Monitoring should be conducted over several
seasons under different hydrological/environmental conditions to ensure movement patterns are
predictable before current management strategies are verified or new screen manipulation
protocols established.
Activity patterns at Murbko South were distinctly different from all other monitored wetlands.
Activity was comparatively low with only 43 observations of carp across both the river and channel
inlets. There was no peak in activity during September/October when off-channel spawning
migrations are expected (Smith and Walker 2004b; Smith 2005; Stuart and Jones 2006; Conallin
et al. 2012). The reasons for this level of activity are unclear as Murbko South provides
predominately shallow, relatively well-vegetated, slow-flowing habitat which is characteristic of
areas carp actively seek for spawning and nursery sites (Koehn and Nichol 1998; Smith and
Walker 2004b; Stuart and Jones 2006; Conallin et al. 2012). There are also no obvious water
quality or habitat variables to suggest the wetland is unsuitable for carp (Koehn 2004; Smith 2005;
Table 7, Appendix 1). In addition, Murbko South is subject to wind set-up, which can create
outflows that contain chemical cues known to attract carp to specific locations (Webster et al.
1997; Elkins et al. 2009). While Murbko South appears to be suitable habitat for carp spawning
and recruitment, it is possible the wetland is currently acting as a carp spawning “cold-spot”
(Gilligan 2012; Gehrig and Thwaites 2013). Indeed, of all YOY carp captured across 2017–18
(n=1329) only 0.23% (n=3) were captured within Murbko South. The mechanism limiting the
numbers of carp attempting to enter Murbko South and limiting recruitment may provide a carp
management option and this requires further investigation.
The low numbers of carp attempting to access Murbko South suggests a CES may not be required
at this site. Indeed, a key disadvantage of CES is inhibiting the passage of large-bodied native
species (Hillyard et al. 2010; Hillyard 2011) which would be mitigated if CES remained open. The
benefits of allowing native species wetland access at Murbko South is likely to outweigh the risk
associated with allowing low numbers of carp to enter and warrants further investigation.
Carp activity across wetlands does not appear to be related to geographic location. Two wetlands
that displayed similar patterns are located in distinctly different sections of the River Murray.
Beldora is situated between locks 3 and 4 in the Valley section while North Purnong is situated
approximately 236 km downstream below lock 1 within the Gorge section (Walker 2006). Both
Harts Lagoon and Murbko South are located within the Gorge Section but displayed distinctly

Thwaites, L. and Schmarr, D. (2019) Carp Exclusions at Wetland Inlets in the River Murray
45
different patterns to North Purnong. This suggests CES management should not take a system
wide approach but rather be tailored for carp activity at individual wetlands. Management plans
should be based on long-term observations at wetlands fitted with or identified for the installation
of CES.
Interactions between native biota and fouling
All images captured by the remote trail cameras (n=30,852) were evaluated to identify interactions
between native biota, the CES and associated wetland management infrastructure. Images were
also evaluated to determine the degree of fouling associated with CES. The CES appeared to
create aggregations of fish species (likely carp, bony herring and golden perch) that attracted
piscivorous birds including pelicans, egrets, cormorants, white face herons and nankeen night
herons (Figure 20E). Several pelicans were observed lunging for prey and cormorants were
observed at the surface with juvenile bony herring in their beaks. The regular occurrence of
piscivorous birds at inlets fitted with CES suggests that screened inlets may make fish vulnerable
to predation. While this is not an issue if they are consuming carp, increased levels of predation
on native fish (i.e. golden perch) is a concern and this warrants further investigation. Low numbers
of turtles were observed within close proximity to the CES but only one was captured interacting
with the screen (Figure 20F). This turtle was not present in subsequent images indicating it could
freely move away. A brown snake was captured moving across the top of CES at Beldora and
water rats were captured periodically but they were not observed interacting with the CES or
wetland management infrastructure. There were multiple images of the public interacting with
infrastructure which appeared to be associated with recreational activities including fishing,
yabbying and canoeing (Figure 20C and D). This provides an opportunity for public education via
signage on the face of these structures. Fouling from aquatic vegetation was largely due to Azolla
spp., Vallisneria spp., Typha spp. and Phragmites australis. Azolla spp. was particularly prevalent
at Murbko 2 and would regularly drift into and away from the CES (Figure 20A); however, given
this is a floating plant it is unlikely to affect CES function. Other forms of aquatic vegetation were
in low densities and would generally remain on the screen for a short period before decomposing
or drifting away.

Thwaites, L. and Schmarr, D. (2019) Carp Exclusions at Wetland Inlets in the River Murray
46
A.
B.
C.
D.
E.
F.
Figure 20. Images captured by remote trail cameras showing Azolla spp. fouling at Murbko South (A), a brown snake
on top of the CES at Beldora (B), the public interacting with the CES at Beldora and North Purnong (C, D), an aggregation of birds preying on fish outside the CES at North Purnong (E) and a turtle against the NCES at North Purnong (F).

Thwaites, L. and Schmarr, D. (2019) Carp Exclusions at Wetland Inlets in the River Murray
47
3.4. Monitoring carp exiting screened wetlands via one-way gates
One-way gate finger movement sensors successfully recorded activity at one-way gates installed
at Beldora, Murbko South and North Purnong. It was anticipated that activity at the gates would
peak toward the end of the carp spawning season (autumn) and continue into winter as carp
attempted to exit the wetland to find overwintering habitat in the main river channel. It was also
anticipated that activity would be low during spring as carp commence their annual off-channel
spawning migrations. However, activity was variable across monitored wetlands with Beldora
displaying patterns similar to the anticipated patterns while activity at Murbko South was relatively
consistent with peaks in activity occurring during autumn and spring. The highest activity observed
across all wetlands was recorded at North Purnong during January but complications with the
sensor/data-loggers resulted in resulted in lost data during March–May 2018 and after July 2018.
A total of 4,996 sensor counts were logged across all five gates. Beldora 1 logged 221 counts
with the highest activity and highest daily count occurring in January 2018 (mean ± S.E. = 5.4 ±
1.1 counts; daily count=20; MRT~25.9oC; MWT~30.7oC) (Figure 21). A total of 354 counts were
recorded at Beldora 2 with highest activity occurring in March 2018 (3.2 ± 0.6 counts;
MRT~23.8oC; MWT~25.8oC) and the highest daily count in May 2018 (n=31; MRT~16.2oC;
MWT~13.8oC) (Figure 21). The most consistent activity was observed at Murbko 1 (1,853 counts)
and Murbko 2 (1,771 counts) with the highest activity occurring in November 2018 (12.9 ± 2.4
counts; MRT~21.2oC; MWT~20.7oC) and September 2018 (11.5 ± 3.1 counts MRT~14.4oC;
MWT~11.8oC), respectively (Figure 22). The highest daily counts for Murbko 1 and Murbko 2 were
recorded in July 2018 (n=40; MRT~11.0oC; MWT~8.8oC) and September 2018 (n=102;
MRT~14.4oC; MWT~11.8oC), respectively. A total of 797 counts were recorded at North Purnong
with the highest activity and highest maximum daily count across all gates occurring in January
2018 (66.9 ± 8.2 counts; max count=153; MRT~24.7oC; MWT~27.7oC) (Figure 23).

Thwaites, L. and Schmarr, D. (2019) Carp Exclusions at Wetland Inlets in the River Murray
48
Figure 21. Monthly mean (± S.E.) of daily one-way gate finger sensor counts for Beldora 1 (light grey columns) and
Beldora 2 (dark grey columns) carp exclusion screens. Blue line is average monthly river temperatures (oC) and green line is average monthly wetland water temperatures (oC). For comparative purposes, the light grey shaded area indicates when carp screens are recommended to be open while white area indicates when screens should be closed according to the WMP for Murbko South, Hart, Morgan’s and Mussels Lagoons (Wegener 2012a; Wegener 2012b; Tesoriero et al. 2013; DEWNR 2015b). Note: data logging commenced on the 19/12/2017 but the graph is presented
from October 2017 for comparative purposes.
Figure 22. Monthly mean (± S.E.) of daily one-way gate finger sensor counts for Murbko South 1 (light grey columns)
and Murbko South 2 (dark grey columns) carp exclusion screens. Blue line is average monthly river temperatures (oC) and green line is average monthly wetland water temperatures (oC). Light grey shaded area indicates when the Murbko South WMP recommends carp screens are opened while white area indicates when screens should be closed (DEWNR 2015b). Note: data logging commenced on the 25/01/2018 but the graph is presented from October 2017 for comparative purposes.

Thwaites, L. and Schmarr, D. (2019) Carp Exclusions at Wetland Inlets in the River Murray
49
Figure 23. Monthly mean (± S.E.) of daily one-way gate finger sensor counts for North Purnong carp exclusion screen.
Blue line is average monthly river temperatures (oC) and green line is average monthly wetland water temperatures (oC). For comparative purposes, the light grey shaded area indicates when carp screens are recommended to be open while white area indicates when screens should be closed according to the WMP for Murbko South, Hart, Morgan ’s and Mussels Lagoons (Wegener 2012a; Wegener 2012b; Tesoriero et al. 2013; DEWNR 2015b). Note: data logging
commenced on the 24/12/2018 but the graph is presented from October 2017 for comparative purposes.
The levels of activity indicate carp and potentially other species are attempting to exit the wetlands
and it is likely a proportion of these attempts resulted in passage through the one-way gate. While
it is difficult to estimate absolute numbers of carp that may have exited, previous research
demonstrated carp are willing and able to push through one-way gates. In a flume trial to evaluate
the carp push trap (predecessor of the one-way gate), Thwaites et al. (2010) reported 91.1% of
carp pushed through the trap over a 16h period. The authors reported only an average of ~5% of
carp’s known pushing capacity was needed to push through the ‘fingers’, and modelling
suggested a 250 mm TL carp would need to exert ~22% of its pushing capacity. While a large
proportion of carp pushed through the fingers, there were several unsuccessful attempts where a
carp would “nudge” a finger without actually pushing through (SARDI, unpub. data). Tempero et
al. (2015) installed a one-way gate based on the push trap design at the outlet of Lake Ohinewai
in New Zealand’s North Island. They recorded ~50 kg ha-1 (~49%) reduction in carp biomass
between May 2011–February 2012 and suggested this is likely due to downstream movement of
carp through the one-way gate (also see Daniel et al. 2014). Conallin et al. (2016) utilised a push
trap (Thwaites et al. 2010) in conjunction with a jumping trap (Stuart et al. 2006) to target migrating
carp during an environmental water allocation at a flow through wetland in South Australia section
of the River Murray. They captured 2,323 carp with 1,213 (~52%) of these captured within the
push trap compartment. The authors also reported captures of bony herring (n=1), longneck

Thwaites, L. and Schmarr, D. (2019) Carp Exclusions at Wetland Inlets in the River Murray
50
turtles (n=12) and a broad-shelled turtle (n=1) within the push trap compartment indicating these
species will push through a one-way gate or pass through the aperture. As bony herring and
longneck turtles were captured within all wetlands fitted with one-way gates, it is possible a
proportion of the observed activity is a result of these species attempting to exit the wetland. Thus,
although it is difficult to estimate numbers, the results of previous research, coupled with the
activity observed in the present study suggest the one-way gates are working as intended and
may even be allowing non-target native species to exit the wetland. Notwithstanding, no
significant differences in carp relative abundance were detected between all treatments across
the final four sampling rounds indicating the actual numbers of carp exiting via the one-way gates
are not as high as the finger sensor counts suggests.
Activity at Beldora peaked during January when mean wetland water temperatures were ~30.7oC
before declining steadily with decreasing water temperatures. The peak activity could be
associated with carp attempting to exit the wetland as water temperatures become unsuitable for
spawning. While carp withstand temperatures of 2–40oC and have an optimal range of 12–32oC
(Smith 2004), egg and larval development can be limited by temperatures >26oC (Sapkale et al.
2011) and spawning is reported to cease at 28oC (Shields 1957; Smith 2004). The decline in
activity during May/June coincides with the peak activity of carp attempting to enter the wetland
(see above) indicating there may be distinct lateral migration patterns into and out of the wetland.
However, this pattern is out of phase with the anticipated migration patterns.
One-way gate activity at Murbko South was considerably higher than Beldora. In contrast to
Beldora, activity was relatively consistent across the monitoring period with activity peaking in
early spring when carp are reported to migrate into wetlands (Smith and Walker 2004b; Smith
2005; Stuart and Jones 2006; Conallin et al. 2012). The reasons for the high level of activity are
unclear as there are no obvious water quality or habitat variables to suggest Murbko South is
unsuitable for carp (Table 7-Appendix 2). Notwithstanding, the high level of activity at the one-
way gates, the low abundance of carp attempting to enter the wetland (see above) and the low
number of YOY captured within the wetland during the present study (n=3) supports the notion
that Murbko South is currently acting as carp “cold-spot” (Gilligan 2012; Gehrig and Thwaites
2013) and that the use of CES at this wetland may not be warranted.
While complications with the sensor/data-loggers resulted in an incomplete dataset for North
Purnong, the activity recorded during January and February was considerably higher than peak
activity at both Beldora and Murbko South. Similar to Beldora, the highest level of activity was

Thwaites, L. and Schmarr, D. (2019) Carp Exclusions at Wetland Inlets in the River Murray
51
recorded in January as water temperatures peaked (~27.7oC) suggesting the wetland was also
becoming unsuitable for spawning.

Thwaites, L. and Schmarr, D. (2019) Carp Exclusions at Wetland Inlets in the River Murray
52
4. CONCLUSION AND RECOMMENDATIONS
The objectives of this project were to conduct a field investigation to evaluate new and existing
CES and inform the ongoing management of CES at various DEW managed RRP wetlands. To
achieve these objectives, the differences in the fish assemblage and relative abundance and size
structure of carp between un-screened wetlands and wetlands fitted with NCES and OCES were
assessed. The annual cycle of carp activity at screened wetland inlets under regulated conditions
(i.e. non-flood, non-drought) was monitored and recorded using remote trail cameras. Finally, the
utility of one-way gates within NCES as a passive carp control measure was evaluated.
The evaluation of closed NCES and OCES occurred over a 12 month period approximately one
year post-flood. However, some WMP incorporate wetting and drying cycles and screen
manipulations. Typically, CES are closed during wetland filling events and reopened when carp
become abundant within the wetland to allow them to exit. After this occurs, CES are closed in
early spring to restrict carp access during off-channel spawning migrations and reopened in
autumn to allow any carp and large-bodied native fauna trapped within the wetland to migrate
back into the river (Wegener 2012a; Wegener 2012b; Tesoriero et al. 2013, DEWNR 2015b). As
drying eradicates stranded carp and potentially native species via desiccation, and CES restrict
wetland access during filling events, it is likely wetlands will remain relatively free from carp ≥250
mm TL and large-bodied native fish for a period post filling. Some WMP recommend opening CES
once carp become abundant but do not specify an abundance, biomass or timeframe to trigger
these screen manipulations. This could be set using impact thresholds (e.g. >50–75 kg ha−1,
Zambrano and Hinojosa 1999) or relative abundance comparisons between screened and
unscreened wetlands. The former would require greater effort to calculate densities from mark-
recapture experiments while the latter could be achieved via standard wetland monitoring
techniques. Future monitoring should evaluate changes in the wetland fish assemblage, carp
abundance, water quality and environmental parameters (i.e. aquatic macrophyte cover) that
occur as a result of current CES management practices (i.e. wetting and drying, seasonal screen
manipulations and/or permanent screen closure). Concurrent monitoring of unscreened control
wetlands should also be undertaken in order to determine when carp abundance between
screened and unscreened wetland are comparable. Once carp abundance in screened wetlands
exceeds that of unscreened wetlands, then screens are concentrating carp and having a greater
impact on wetland condition. At this point screens should be opened to allow free passage for
native species. However, the actual period when screens should be opened is more complex than
some WMP suggest and this requires further investigation (see below).

Thwaites, L. and Schmarr, D. (2019) Carp Exclusions at Wetland Inlets in the River Murray
53
The results of this study suggest carp, and potentially other species, are interacting with the one-
way gates in the NCES. However, it is not clear what proportion of interactions result in carp or
other fauna exiting the wetlands. It is also not clear if the abundance of carp exiting is exceeding
the number of carp entering as juveniles. Indeed, the relative abundance of carp was similar
between screened and unscreened wetlands across the final four sampling rounds of this study.
Long-term monitoring of wetland carp abundance and size structure will aid in understanding the
overall effectiveness of one-way gates. Ideally, this monitoring should occur in wetlands that
undergo seasonal screen manipulation and within wetlands where screens remain closed.
Calibrating the one-way gate finger movement sensor will support this monitoring. The calibration
should employ underwater imaging technology such as dual frequency identification sonar
(DIDSON) in conjunction with netting or trapping. The DIDSON will permit observations of activity
and passages through the one-way gate which can be related to the activity captured by the finger
movement sensors. Setting nets/traps immediately outside the gates to capture fish that pass
through will support the observations captured by the DIDSON. Carp should be captured
(electrofishing and fyke netting) and released into a culvert fitted with one-way gates. By closing
the culverts sluice gates, carp will only be able exit via the gate. If possible, the behaviour of large-
bodied native species (i.e. bony herring, golden perch) and turtles should also be evaluated. The
proportion of attempted to successful passages will enable a better understanding of the
abundance and size class of carp that are exiting wetlands via the gate. This is particularly
important as wetlands fitted NCES rely on the one-way gates as a passive carp control measure
between wetting and drying cycles (DEWNR 2015a; DEWNR 2015b). If within wetland carp
abundances are not controlled by this technique then other measures may need to be re-
evaluated (i.e. screen manipulations).
While this study suggests ‘venetian’ bars may not affect the passage of small-bodied species, it
also suggests the rates of emigration of medium-bodied species and juveniles of large-bodied
species may be impacted. As such, it is recommended to evaluate fish passage though horizontal
‘venetian’ bars. This experiment should evaluate small-, medium- and large-bodied native fish
(juveniles and adults) as well as carp >120 mm TL and should also evaluate the differences
between the ‘venetian’ bar and the optimised jail bar design proposed by Hillyard et al. (2010).
This work could be conducted via flume trials or field trials using fyke net techniques developed
by Hillyard (2011). Fyke net trials would involve attaching various screen types within the entrance
of the nets. These nets would then be deployed within the inlet/outlet of wetlands for ~24h and
the composition and size range of the catch compared to that of unscreened fyke nets.

Thwaites, L. and Schmarr, D. (2019) Carp Exclusions at Wetland Inlets in the River Murray
54
Alternatively, a representative sample of the wetland fish community could be released into
screened culverts with closed sluice gates. The activity and passage of fish could be monitored
using traps set outside the screen and by using a DIDSON sonar. This sonar can provide detailed
images of fish in turbid waters and will permit observations of activity and passages though the
screens in real time. Flume trials are logistically more difficult as fish need to be captured,
transported, acclimated and held in aquaria for the duration of the experiment. However, these
trials are conducted in clear water using under water surveillance equipment that can provide
detailed information of fish interaction with various screen types. These trials will help further
validate the jail bar design and provide new information of how ‘venetian’ bars effect fish passage.
This study demonstrated off-channel movements of carp can occur during periods that do not
align with some CES management protocols. For example, high numbers of carp were observed
attempting to enter Beldora and North Purnong wetlands between March and August; a period
when CES are recommended to be opened in some managed wetlands (Wegener 2012a;
Wegener 2012b; Tesoriero et al. 2013, DEWNR 2015b). These results suggest CES manipulation
protocols may need to be tailored to individual wetlands. However, as this project monitored carp
activity at wetland inlets over a 12 month period, it is unclear if activity patterns at individual
wetlands are seasonally predictable or if changes occur annually. As such, it is recommended
monitoring continue at wetlands fitted with remote trail cameras and be expanded to other
wetlands fitted with CES. Monitoring on the wetland side of culverts to capture potential
aggregations associated with carp attempting to exit the wetland should also be conducted. In
addition, monitoring should be considered at temporary screens installed at wetlands designated
for the installation of new flow control structures and CES. If annually predictable migration
patterns are observed then appropriated screen manipulation protocols can be developed.
The ‘venetian’ style design was chosen in preferences to the optimised jail bar design
recommended by Hillyard et al. (2010) in an attempt to mitigate impacts on turtles. Although
untested, it was reasoned that turtles trapped on the ‘venetian’ screens would be able to escape
(Karl Hillyard 2019, pers. comm.). The results of this study suggest that under normal flow
conditions, CES pose little risk to turtles with only one turtle observed interacting with a screen
before it freely moved away. The primary risk is likely associated with wetland filling events under
high velocities, which should be mitigated by filling under low velocities. Experiments designed to
evaluate velocity threshold for turtles should be undertaken. These experiments should also seek
to understand if turtles can escape from ‘venetian’ bars and jail bars under sub-optimal flows.

Thwaites, L. and Schmarr, D. (2019) Carp Exclusions at Wetland Inlets in the River Murray
55
With this knowledge, appropriate wetland filling protocols can be implemented and the application
of the optimised jail bar CES reassessed.
Prior to establishing long-term CES management protocols or installing new CES it is strongly
recommended further research and monitoring be undertaken. This is particularly important as
the results of the current study and previous research suggest CES have minimal impact on
wetland carp abundances while restricting large-bodied native fish and turtle access to wetlands.
If CES optimisation and long-term CES management practices (i.e. wetting and drying, screen
manipulations, permanent closure in conjunction with one-way gates) cannot maintain a
significantly lower abundance of carp and control within wetland impacts in comparison to
unscreened wetlands then their continued application must be re-evaluated.

Thwaites, L. and Schmarr, D. (2019) Carp Exclusions at Wetland Inlets in the River Murray
56
REFERENCES
Akaike, H. (1973). Information theory as an extension of the maximum likelihood principle. In
Proceedings, 2nd International Symposium on Information Theory (Petrov, B. N. & Caski, F., eds),
pp 267–281. Akademiai Kiado, Budapest.
Anderson, M.J. (2001). A new method for non-parametric multivariate analysis of variance.
Austral Ecology, 26: 32–46.
Anderson, M.J., Gorley, R.N., and Clarke, K.R. (2008). PERMANOVA+ for PRIMER: Guide to
Software and Statistical Methods. PRIMER-E, Plymouth, UK.
Bajer, P.G, Sullivan, G., and Sorensen, P.W. (2009). Effects of a rapidly increasing population of
common carp on vegetative cover and waterfowl in a recently restored Midwestern shallow lake.
Hydrobiologia, 12: 1101–1112.
Bajer, P.G., and Sorensen, P.W. (2010). Recruitment and abundance of an invasive fish, the
common carp, is driven by its propensity to invade and reproduce in basins that experience winter-
time hypoxia in interconnected lakes. Biological Invasions, 12:1101–1112.
Balcombe, S.R., and Arthington, A.H. (2009). Temporal changes in fish abundance in response
to hydrological variability in a dryland floodplain river. Australian Journal of Marine and Freshwater
Research, 60:146–159.
Balcombe, S.R., and Closs, G.P. (2004). Spatial relationships and temporal variability in a littoral
macrophyte fish assemblage. Marine and Freshwater Research, 55(6): 609–617.
Bates, D., Maechler, M., Bolker, B., and Walker, S. (2015). Fitting Linear Mixed-Effects Models
Using lme4. Journal of Statistical Software, 67(1): 1–48.
Bertozzi, T., Adams, M., and Walker, K.F. (2000). Species boundaries in carp gudgeons
(Eleotrididae : Hypseleotris) from the River Murray, South Australia: evidence for multiple species
and extensive hybridisation. Marine and Freshwater Research, 51(8): 805–815.
Bice, C.M., Gehrig, S.L., Zampatti, B.P., Nicol, J.M., Wilson, P., Leigh, S.L., and Marsland, K.
(2014). Flow-induced alterations to fish assemblages, habitat and fish–habitat associations in a
regulated lowland river. Hydrobiologia, 722: 205–222.

Thwaites, L. and Schmarr, D. (2019) Carp Exclusions at Wetland Inlets in the River Murray
57
Bolker, B.M., Brooks, M.E., Clark, C.J., Geange, S.W., Poulsen, J.R., Stevens, M.H.H., and
White, J.S.S. (2009). Generalised linear mixed models: a practical guide for ecology and
evolution. Trends in Ecology & Evolution, 24: 127–135.
Brown, P., and Gilligan, D. (2014). Optimising an integrated pest-management strategy for a
spatially structured population of common Carp (Cyprinus Carpio) using meta-population
modelling. Marine and Freshwater Research, 65: 538–550.
Brown, P., Sivakumaran, K.P., Stoessel, D., Giles, A., Green, C., and Walker, T. (2003). Carp
Population Biology in Victoria. Marine and Freshwater Resources Institute, Department of Primary
Industries, Snobs Creek, Victoria.
Burnham, K.P., and Anderson, D.R. (2002). Model Selection and Multi-model Inference: a
Practical Theoretic-Information Approach, 2nd Edition. Springer, New York.
Clarke, K.R., and Warwick, R.M. (2001). Change in Marine Communities: An Approach to
Statistical Analysis and Interpretation. PRIMER-E Ltd: Plymouth, UK.
Clearwater, S.J., Hickey, C.W., and Martin, M.L. (2008). Overview of potential piscicides and
molluscicides for controlling aquatic pest species in New Zealand.
Conallin, A., Smith, B., Thwaites, L. Walker, K., and Gillanders, B. (2012). Environmental water
allocations in regulated lowland rivers may encourage offstream movements and spawning by
common carp, Cyprinus carpio: implications for wetland rehabilitation. Marine and Freshwater
Research, 63: 865–877.
Conallin, A.J., Smith, B.B., Thwaites, L.A., Walker, K.F., and Gillanders, B.M. (2016) Exploiting
the innate behaviour of common carp, Cyprinus carpio, to limit invasion and spawning in wetlands
of the River Murray, Australia. Fisheries Management and Ecology, 23 (6): 431–449.
Crook, D.A., and Gillanders, B. M. (2006). Use of otolith chemical signatures to estimate carp
recruitment sources in the mid-Murray River, Australia. River Research and Applications 22: 871–
879.
Daniel, A.J., Morgan, D.K.J., and Ling, N. (2014). Get out, stay out! Restoring a small New
Zealand floodplain lake: removal and exclusion of carp. In W. Fulton & K. Hall (Eds.), Forum
proceedings: Carp management in Australia — state of knowledge (pp. 132–139). Canberra,
Australia: Invasive Animals Cooperative Research Centre.

Thwaites, L. and Schmarr, D. (2019) Carp Exclusions at Wetland Inlets in the River Murray
58
DEWNR (2013). Riverine Recovery North Purnong Wetland Management Plan. Department of
Environment, Water and Natural Resources, South Australia. 76pp.
DEWNR (2015a). Riverine Recovery Beldora–Spectacle Lakes Wetland Management Plan.
Department of Environment, Water and Natural Resources, South Australia. 127pp.
DEWNR (2015b). Riverine Recovery Murbko South wetland management plan. Department of
Environment, Water and Natural Resources, South Australia. 78pp.
EAC (2005). Riverglades Wetlands Wetland Management Plan. Riverglades Community
Wetlands Incorporated. Ecological Associates Report AQ003-C1. 54pp.
Elkins, A., Barrow, R., and Rochfort, S. (2009). Carp chemical sensing and the potential of natural
environmental attractants for control of carp: a review. Environmental Chemistry, 6(5): 357–368.
Fletcher, A.R., Morison, A.K., and Hume, D.J. (1985). Effects of carp (Cyprinus carpio L.) on
aquatic vegetation and turbidity of waterbodies in the lower Goulburn River Basin. Australian
Journal of Marine and Freshwater Research, 36: 311–327.
French, J.R.P., Wilcox, D.A., and Nicols, S.J. (1999). Passing of northern pike and common carp
through experimental barriers designed for use in wetland restoration. Wetlands, 19: 883–888.
Gehrig, S.L., and Thwaites, L.A. (2013). Exploitable Biological Vulnerabilities of Common Carp.
PestSmart Toolkit publication, Invasive Animals Cooperative Research Centre, Canberra,
Australia.
Gehrke, P.C., and Harris, J.H. (1994). The role of fish in cyanobacterial blooms in Australia.
Australian Journal of Marine and Freshwater Research, 45: 905–915.
Gilligan, D. (2012). ‘Case Study: Carp Spawning Hotspots.’ Case study on the identification of
carp spawning and recruitment hotspots in the Murray–Darling Basin. Available at
http://www.feral.org.au/pestsmart/carp/ [accessed 01 November 2017].
Haas, K., Köhler, U., Diehl, S., Köhler, P., Dietrich, S., Holler, S., Jensch, A., Niedermaier, M.,
and Vilsmeier, J. (2007). Influence of fish on habitat choice of water birds: a whole-system
experiment. Ecology, 88: 2915–2925.

Thwaites, L. and Schmarr, D. (2019) Carp Exclusions at Wetland Inlets in the River Murray
59
Hillyard, K.A., Smith, B.B., Conallin, A.J., and Gillanders, B.M. (2010). Optimising exclusion
screens to control exotic carp in an Australian lowland river. Marine and Freshwater Research,
61(4): 418–429.
Hillyard, K.A. (2011). Carp exclusion screens on wetland inlets: their value for control of common
carp (Cyprinus carpio L.) and effects on offstream movements by other species in the River
Murray, Australia. Presented for the degree of Doctor of Philosophy in the School of Earth and
Environmental Sciences, University of Adelaide. 159pp.
Hume, D.J., Fletcher, A.R., and Morison, A.K. (1983). Carp Program - Final Report. Arthur Rylah
Institute for Environmental Research, Fisheries and Wildlife Division, Ministry for Conservation
Victoria, Australia. 214pp.
Inland Fisheries Service (2008). Carp management program annual report for 2007/ 2008. Inland
Fisheries Service, New Norfolk, Tasmania.
Jensen, A., Paton, P., Mowbray, T., Simpson, D., Kinnear, S., and Nichols, S. (1996). Wetlands
atlas of the South Australian Murray Valley: a summary of current knowledge of Murray Valley
wetlands as a basis for integrated catchment management. South Australian River Murray
Wetlands Management Committee, Department of Environment and Natural Resources. 153pp.
Johnsen, P.B., and Hasler, A.D. (1977). Winter aggregations of carp (Cyprinus carpio) as
revealed by ultrasonic tracking. Transactions of the American Fisheries Society, 106: 556–59.
Jones, M.J., and Stuart, I.G. (2007). Movements and habitat use of common carp (Cyprinus
carpio) and Murray cod (Maccullochella peelii peelii) juveniles in a large lowland Australian river.
Ecology of Freshwater Fish, 16: 210–220.
Junk, W.J., Bayley, P.B., and Sparks, R.E. (1989). The flood pulse concept in river–floodplain
systems. Canadian Special Publication of Fisheries and Aquatic Sciences, 106: 110–127.
Koehn, J.D. (2004). Carp (Cyprinus carpio) as a powerful invader in Australian waterways.
Freshwater Biology, 49: 882–894.
Koehn, J.D., and Nichol, S.J. (1998). Habitat and movement requirements of fish. In proc. 1996
Riverine Environment Forum Eds. R.J. Banens and R. Lehane) pp. 1–6. October 1996, Brisbane
Queensland. Publ. Murray Darling Basin Commission.
Thwaites, L. and Schmarr, D. (2019) Carp Exclusions at Wetland Inlets in the River Murray
60
Koehn, J., Todd, C., Thwaites, L., Stuart, I., Zampatti, B., Ye, Q., Conallin, A., Dodd, L., and
Stamation, K. (2016). Managing flows and Carp. Arthur Rylah Institute for Environmental
Research Technical Report Series No. 255. Arthur Rylah Institute for Environmental Research,
Department of Environment, Land, Water and Planning, Heidelberg, Victoria.
Lenth, R. (2016). Least-Squares Means: The R Package lsmeans. Journal of Statistical Software,
69: 1–33.
Lenth, R. (2018). emmeans: Estimated Marginal Means, aka Least-Squares Means. R package
version 1.3.0. https://CRAN.R-project.org/package=emmeans
Matsuzaki, S.S., Usio, N., Takamura, N., and Washitani, I. (2009). Contrasting impacts of invasive
engineers on freshwater ecosystems: an experiment and meta-analysis. Oecologia, 158: 673–
86.
McColl, K.A., Sunarto, A., Williams, L.M., and Crane, M. (2007). Koi herpes virus: dreaded
pathogen or white knight? Aquaculture Health International, 9: 4–6.
Miller, S.A., and Crowl, T.A. (2006). Effects of common carp (Cyprinus carpio) on macrophytes
and invertebrate communities in a shallow lake. Freshwater Biology, 51: 85–94.
Nicol, J.M., Gehrig, S.L., Frahn, K.A., and Strawbridge, A.D. (2013). Resilience and resistance of
aquatic plant communities downstream of Lock 1 in the Murray River. Goyder Institute for Water
Research, Technical Report Series No. 13/5, Adelaide, South Australia.
Nichols, S., and Gilligan, D. (2003). What about the fish? Improving fish passage through wetland
flow control structures in the lower River Murray. Australian Landscape Trust, Renmark.
Osborne, M., Ling, N., and Hicks, B. (2005). Abundance and movement of koi carp (Cyprinus
carpio haematopterus) in the lower Waikato River system. 13th Australian Vertebrate Pest
Conference Proceedings, Te Papa, Wellington, New Zealand, 2–6 May 2005, p. 56.
Parkos, J.J., Santucci, V.J., and Wahl, D.H. (2003). Effects of adult common carp (Cyprinus
carpio) on multiple trophic levels in shallow mesocosms. Canadian Journal of Fisheries and
Aquatic Sciences, 60: 182–192.
Penne, C.R., and Pierce, C.L. (2008). Seasonal distribution, aggregation, and habitat selection of
common carp in Clear Lake, Iowa. Transactions of the American Fisheries Society, 137: 1050–
62.

Thwaites, L. and Schmarr, D. (2019) Carp Exclusions at Wetland Inlets in the River Murray
61
Pinto, L., Chandrasena, N., Pera, J., Hawkins, P., Eccles, D., and Sim, R. (2005). Managing
invasive carp (Cyprinus carpio L.) for habitat enhancement at Botany Wetlands, Australia. Aquatic
Conservation: Marine and Freshwater Ecosystems, 15: 447–462.
Pressey, B. (1990). Wetlands. In ‘The Murray’. (Eds N. Mackay and D. Eastburn.) pp. 167–181.
(Murray–Darling Basin Commission: Canberra).
R Core Team (2018). R: A language and environment for statistical computing. R Foundation for
Statistical Computing, Vienna, Austria. URL https://www.R-project.org/.
Reynolds, L.F. (1983). Migration patterns of five fish species in the Murray-Darling river system.
Australian Journal of Marine and Freshwater Research, 34: 857–871.
Ribeiro, F., Crain, P.K., and Moyle, P.B. (2004). Variation in condition factor and growth in young-
of-year fishes in floodplain and riverine habitats of the Consumnes River, California.
Hydrobiologia, 527: 77–84.
Sapkale, P.H., Singh, R.K., and Desai, A.S. (2011). Optimal water temperature and pH for
development of eggs and growth of spawn of common carp (Cyprinus carpio). Journal of Applied
Animal Research, 39(4): 339–345.
Shields, J.T. (1957). Experimental control of carp reproduction through water drawdowns in Fort
Randall Reservoir, South Dakota. Transactions of the American Fisheries Society, 87: 23–32.
Sibbing, F.A., Osse, J.W.M., and Terlouw, A. (1986). Food handling in the carp (Cyprinus carpio):
Its movement patterns, mechanisms and limitations. Journal of the Zoological Society of London,
210: 161–203.
Singmann, H., Bolker, B., Westfall, J. and Aust, F. (2018). afex: Analysis of Factorial Experiments.
R package version 0.22-1. https://CRAN.R-project.org/package=afex
Sivakumaran, K.P., Brown, P., Stoessel, D. and Giles, A. (2003). Maturation and reproductive
biology of female wild carp, Cyprinus carpio, in Victoria, Australia. Environmental Biology of
Fishes, 68: 321–332
Smith, B.B. (2004). Carp (Cyprinus carpio L.) spawning dynamics and early growth in the lower
River Murray, South Australia. Presented for the degree of Doctor of Philosophy in the School of
Earth and Environmental Sciences, University of Adelaide. 108pp.

Thwaites, L. and Schmarr, D. (2019) Carp Exclusions at Wetland Inlets in the River Murray
62
Smith, B.B. (2005). The state of the art: a synopsis of information on common carp (Cyprinus
carpio) in Australia. SARDI Aquatic Sciences, Publication No. RD04/0064-2; SARDI Research
Report Series No. 77, Adelaide. 68pp.
Smith, B.B., and Walker, K.F. (2004a). Reproduction of common carp in South Australia, shown
by young-of-the-year samples, gonadosomatic index and the histological staging of ovaries.
Transactions of the Royal Society of South Australia, 128: 249–257.
Smith, B.B., and Walker, K.F. (2004b). Spawning dynamics of common carp in the River Murray,
South Australia, shown by macroscopic and histological staging of gonads. Journal of Fish
Biology. 64: 336–354.
Smith, B.B, Conallin, A., and Vilizzi, L. (2009a). Regional patterns in the distribution, diversity and
relative abundance of wetland fishes of the River Murray, South Australia. Transactions of the
Royal Society of South Australia. 133(2): 339–360.
Smith, B., Thwaites, L., and Conallin, A. (2009b). Guidelines to inform the selection and
implementation of carp management options at wetland inlets: a test case for South Australia.
Prepared by the South Australian Research and Development Institute (Aquatic Sciences) for the
Invasive Animals Cooperative Research Centre, Canberra.
Sorensen, P.W., and Stacey, N.E. (2004). Brief review of fish pheromones and discussion of their
possible uses in the control of non-indigenous teleost fishes. New Zealand Journal of Marine and
Freshwater Research, 38: 399–417.
Stuart, I.G., and Jones, M. (2006). Large, regulated forest floodplain is an ideal recruitment zone
for non-native common carp (Cyprinus carpio L.). Marine and Freshwater Research, 57: 333–
347.
Stuart, I.G., Williams, A., Mckenzie, J., and Holt, T. (2006). Managing a migratory pest species: a
selective trap for common carp. North American Journal of Fisheries Management, 26: 888–893.
Stuart, I., Mallen-Cooper, M., Leigh, S., Thwaites, L., and Zampatti, B. (2011). Carp management
strategy for the Chowilla floodplain. A report to the South Australian Murray-Darling Basin Natural
Resources Management Board by Kingfisher Research, Fishway Consulting Services and
SARDI.

Thwaites, L. and Schmarr, D. (2019) Carp Exclusions at Wetland Inlets in the River Murray
63
Swales, S. (1987). The use of small wire‐mesh traps in sampling juvenile salmonids. Aquaculture
Research, 18(2): 187–196.
Taylor, A.H., Tracey, S.R., Hartmann, K. and Patil, J.G. (2012). Exploiting seasonal habitat use
of the common carp, Cyprinus carpio, in a lacustrine system for management and eradication.
Marine and Freshwater Research, 63: 587–597.
Tempero, G., Ling, N., Daniel, A.J., and Morgan, D. (2015). Removal of Invasive Fish and
Exclusion of Koi Carp from Lake Ohinewai. In K.J. Collier and N.P.J. Grainger (Eds.), New
Zealand Invasive Fish Management Handbook (pp. 91–95). Lake Ecosystem Restoration New
Zealand (LERNZ; The University of Waikato) and Department of Conservation, Hamilton, New
Zealand. 212pp.
Tesoriero, J., Mason, K., and Tucker, M. (2013). Morgan’s Lagoon Wetland Management Plan
Update 2012, Department of Environment, Water and Natural Resources, Murray Bridge, South
Australia.
Thresher, R.E. (2008). Autocidal technology for the control of invasive fish. Fisheries, 33: 114–
120.
Thwaites, L.A., Smith, B.B., Decelis, M., Fleer, D., and Conallin, A. (2010). A novel push trap
element to manage carp (Cyprinus carpio L.): a laboratory trial. Marine and Freshwater Research,
61: 42–48.
Thwaites, L.A. (2011). Proof of concept of a novel wetland carp separation cage at Lake Bonney,
South Australia. A summary report for the Invasive Animals Cooperative Research Centre and
the South Australian Murray-Darling Basin Natural Resources Management Board. South
Australian Research and Development Institute (Aquatic Sciences), Adelaide. SARDI Publication
No. F2011/000086-1. SARDI Research Report Series No. 530. 38 pp.
Thwaites, L., and Cheshire, D. (2016). A pilot trial to evaluate novel carp monitoring techniques
at wetland carp exclusion screens. A technical report to the Department of Environment, Water
and Natural Resources. South Australian Research and Development Institute (Aquatic
Sciences), Adelaide. SARDI Publication No. F2016/000323-1. SARDI Research Report Series
No. 903. 24pp.
Thwaites, L.A., and Fredberg, J.F. (2014). The response patterns of wetland fish communities
following prolonged drought and widespread flooding. Prepared by the South Australian Research

Thwaites, L. and Schmarr, D. (2019) Carp Exclusions at Wetland Inlets in the River Murray
64
and Development Institute (Aquatic Sciences) for the Goyder Institute for Water Research.
Goyder Institute for Water Research Technical Report Series No. 14/9.
Verrill, D.D., and Berry, C.R. (1995). Effectiveness of an electrical barrier and lake drawdown for
reducing common carp and bigmouth buffalo abundances. North American Journal of Fisheries
Management, 15: 137–41.
Vilizzi, L., and Walker, K.F. (1999). Age and growth of common carp Cyprinus carpio, in the River
Murray, Australia: Validation, consistency of age interpretation, and growth models.
Environmental Biology of Fishes, 54:77–106.
Vilizzi, L., Thwaites, L., Smith, B., Nicol, J., and Madden, C. (2014). Ecological effects of common
carp (Cyprinus carpio) in a semi-arid floodplain wetlands. Marine and Freshwater Research, 65:
802–817
Walker, K.F. (2006). Serial weirs, cumulative effects: the Lower River Murray, Australia. Ecology
of Desert Rivers. Ed. Richard Kingsford. Cambridge University Press, New York. 248–279.
Webb, P.W., LaLiberte, G.D., and Schrank, A.J. (1996). Does body and fin form affect the
manoeuvrability of fish traversing vertical and horizontal slits? Environmental Biology of Fishes
46: 7–14.
Webster, I.T., Maier, H., Baker, P., and Burch, M. (1997) Influence of wind on waters levels and
lagoon-river exchange in the River Murray, Australia. Marine and Freshwater Research, 48: 541-
550.
Wegener, I.K. (2012a). Hart Lagoon Wetland Management Plan Review and Update 2012,
Natural Resources–SA Murray-Darling Basin: Department of Environment, Water and Natural
Resources, Berri, South Australia.
Wegener, I.K. (2012b). Loveday Mussels Lagoons Wetland Complex Management Plan Review
and Update 2012, Natural Resources–SA Murray-Darling Basin: Department of Environment,
Water and Natural Resources, Berri, South Australia
Williams, A.E., Moss, B., and Eaton, J. (2002). Fish induced macrophyte loss in shallow lakes:
Top-down and bottom-up processes in mesocosm experiments. Freshwater Biology, 47: 2216–
2232.

Thwaites, L. and Schmarr, D. (2019) Carp Exclusions at Wetland Inlets in the River Murray
65
Winemiller, K.O., and Rose, K.A. (1992). Patterns of life-history diversification in North-American
fishes- Implications for population regulation. Canadian Journal of Fisheries and Aquatic
Sciences, 49: 2196–2218.
Yamamoto, T., Kohmatsu, Y., and Yuma, M. (2006). Effects of summer drawdown on Cyprinid
fish larvae in Lake Biwa, Japan. Limnology, 7: 75–82.
Zambrano, L., and Hinojosa, D. (1999). Direct and indirect effects of carp (Cyprinus carpio) on
macrophytes and benthic communities in experimental shallow ponds in central Mexico.
Hydrobiologia, 408/409: 131–138.

Thwaites, L. and Schmarr, D. (2019) Carp Exclusions at Wetland Inlets in the River Murray
66
APPENDIX 1. STUDY WETLANDS
Figure 24. Beldora Wetland has a surface area of ~156.6 ha and is situated ~426 km from the river mouth in the Valley
section of the River Murray (top). It contains six box culverts (three box culverts in two adjacent structures, Beldora 1 and 2; three 1.5 x 2.1 x 3.4 m box culverts, one with open grid top) with horizontal ‘venetian’ bar carp screens (31 mm) and one-way gates (bottom).
Beldora 1 Beldora 2
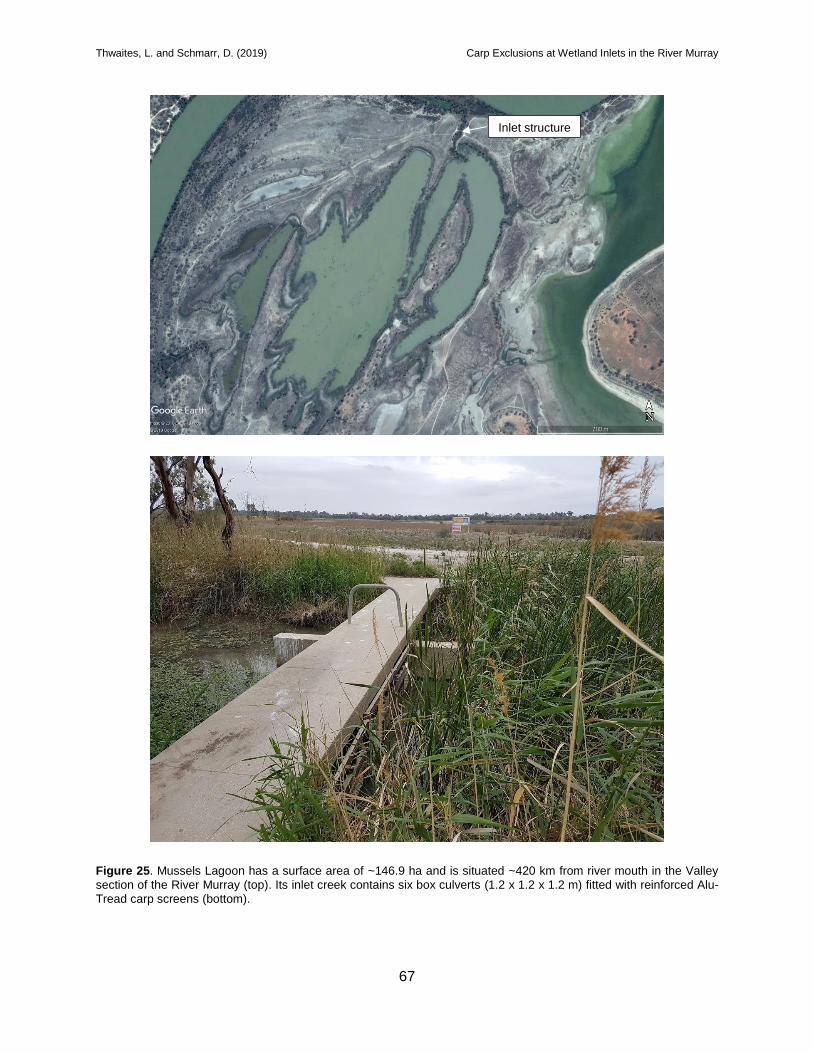
Thwaites, L. and Schmarr, D. (2019) Carp Exclusions at Wetland Inlets in the River Murray
67
Figure 25. Mussels Lagoon has a surface area of ~146.9 ha and is situated ~420 km from river mouth in the Valley
section of the River Murray (top). Its inlet creek contains six box culverts (1.2 x 1.2 x 1.2 m) fitted with reinforced Alu-
Tread carp screens (bottom).
Inlet structure

Thwaites, L. and Schmarr, D. (2019) Carp Exclusions at Wetland Inlets in the River Murray
68
Figure 26. Hart Lagoon has a surface area of ~72.8 ha and is situated ~269 km from the river mouth in the Gorge
section of the River Murray (top). Its inlet structure comprises six box culverts (1.2 x 1.2 x 1.2 m) fitted with Alu-tread carp screens (34 x 97 mm) (bottom).
Inlet structure

Thwaites, L. and Schmarr, D. (2019) Carp Exclusions at Wetland Inlets in the River Murray
69
Figure 27. Murbko South has a surface area of ~129.1 ha and is situated ~288 km from river mouth in the Gorge
section of the River Murray (top). Its river structure (Murbko 1) and creek structure (Murbko 2) contain two box culverts (1.5 x 1.5 x 3.4 m box culverts, one with open grid top) with horizontal ‘venetian’ bar carp screens and one-way gates
(bottom).
Murbko 2
Murbko 1

Thwaites, L. and Schmarr, D. (2019) Carp Exclusions at Wetland Inlets in the River Murray
70
Figure 28. Yarramundi North (Morgan’s Lagoon) has a surface area of ~35.2 ha and is situated ~254 km from river
mouth in the Gorge section of the River Murray (top). Its river structure comprises six box culverts with security mesh carp screens (1.2 x 1.2 x 1.2 m) and its creek structure is smaller but comprises two similar box culverts with security mesh carp screens (bottom).
Creek structure
River structure

Thwaites, L. and Schmarr, D. (2019) Carp Exclusions at Wetland Inlets in the River Murray
71
Figure 29. North Purnong has a surface area of ~95.5 ha and is situated ~190 km from river mouth in the Gorge section
of the River Murray (top). North Purnongs inlet structure contains two box culverts (1.5 x 1.5 x 3.4 m box culverts, one
with open grid top) with horizontal ‘venetian’ bar carp screens and one-way gates (bottom).
Inlet structure
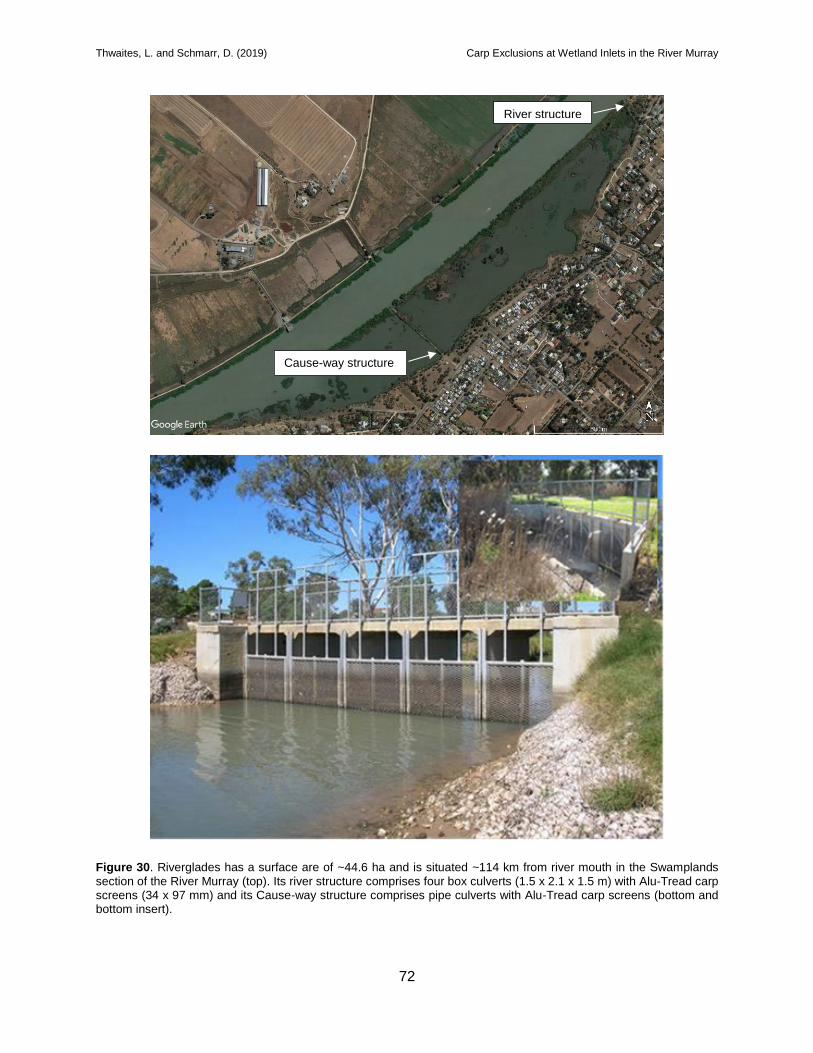
Thwaites, L. and Schmarr, D. (2019) Carp Exclusions at Wetland Inlets in the River Murray
72
Figure 30. Riverglades has a surface are of ~44.6 ha and is situated ~114 km from river mouth in the Swamplands
section of the River Murray (top). Its river structure comprises four box culverts (1.5 x 2.1 x 1.5 m) with Alu-Tread carp screens (34 x 97 mm) and its Cause-way structure comprises pipe culverts with Alu-Tread carp screens (bottom and bottom insert).
River structure
Cause-way structure
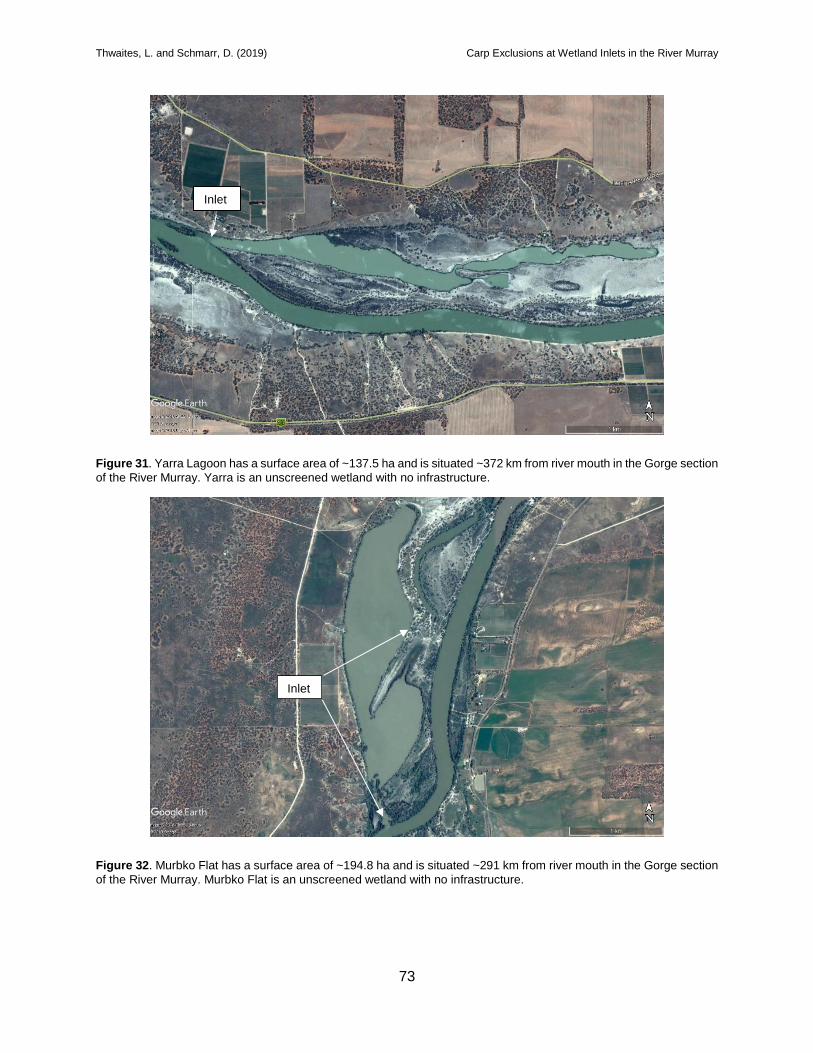
Thwaites, L. and Schmarr, D. (2019) Carp Exclusions at Wetland Inlets in the River Murray
73
Figure 31. Yarra Lagoon has a surface area of ~137.5 ha and is situated ~372 km from river mouth in the Gorge section
of the River Murray. Yarra is an unscreened wetland with no infrastructure.
Figure 32. Murbko Flat has a surface area of ~194.8 ha and is situated ~291 km from river mouth in the Gorge section
of the River Murray. Murbko Flat is an unscreened wetland with no infrastructure.
Inlet
Inlet
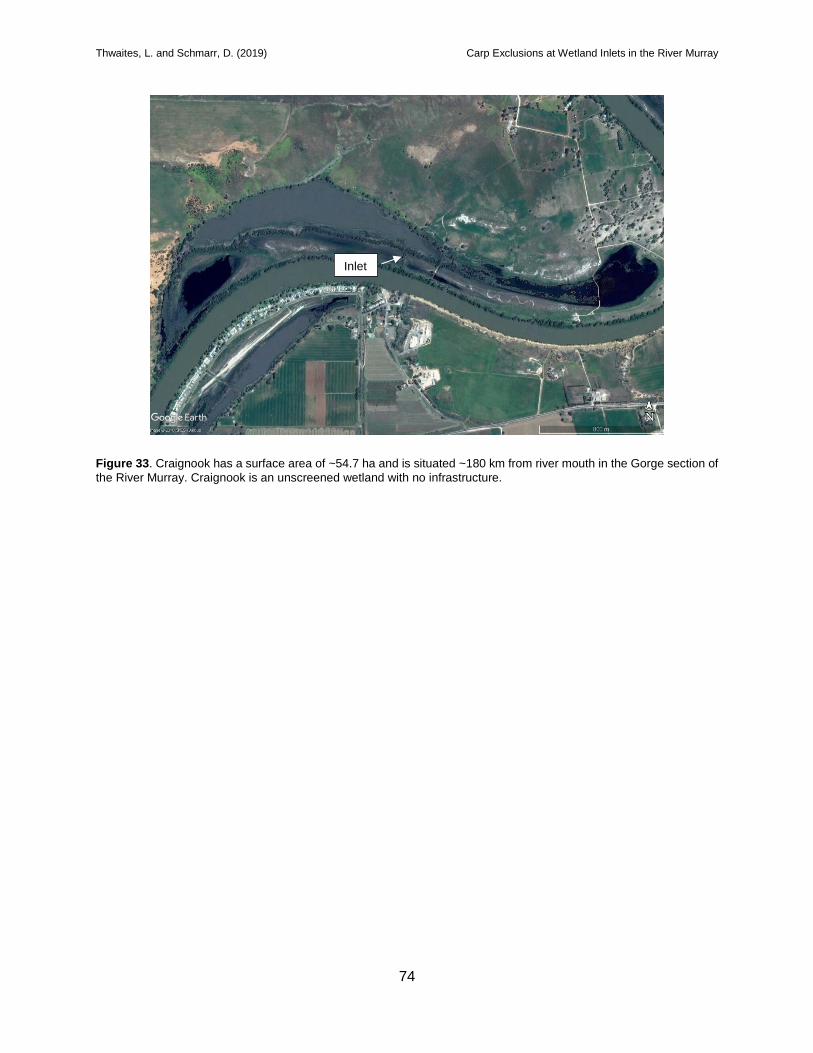
Thwaites, L. and Schmarr, D. (2019) Carp Exclusions at Wetland Inlets in the River Murray
74
Figure 33. Craignook has a surface area of ~54.7 ha and is situated ~180 km from river mouth in the Gorge section of
the River Murray. Craignook is an unscreened wetland with no infrastructure.
Inlet

Thwaites, L. and Schmarr, D. (2019) Carp Exclusions at Wetland Inlets in the River Murray
75
APPENDIX 2. CATCH SUMMARY, CARP LENGTH FREQUENCY HISTOGRAMS AND WATER QUALITY
Table 6. Catch summary for all wetlands across each sampling round. * indicates presence of species within the fifth sampling round (SR5). SR1: 20 Nov-01 Dec
2017; SR2: 05-13 Feb 2018; SR3: 16-27 April 2018; SR4: 14-29 June 2018; SR5: 1-9 Nov 2018. N = NCES (light grey), O = OCES (grey), U = Unscreened (dark
grey).
CAR AUR
CHE EXP
CHE LON
CRA FUL
CYP CAR
CYP CAR (YOY)
EMY MAC
GAM HOL
HYP SPP
MAC AMB
MEL FLU
MIS ANG
NEM ERE
PER FLU
PHI GRA
PHI MAC
RET SEM
TAN TAN
SR1-N Beldora 6 1 1 139 8 2125 64 2 3 Murbko South 1 1 100 100 1 2 1696 1 10 5 269 95 North Purnong 95 85 107 6 1613 195 1 14 2
SR1-O Mussels Lagoon 10 19 26 7 6 6230 5 2 21 2 6 2 Riverglades 6 4 228 33 62 1 4 1991 1 566 11 3 Yarramundi North 2 1 11 148 188 34 1375 1 358 3 5
SR1-U Craignook 2 9 18 29 37 2 6 4394 3 166 3 16 1 Murbko Flat 1 76 63 141 329 2 3 777 2 Yarra 9 2 88 6 21 969 2 8 3 111 8 8
SR2-N Beldora 2 2 12 90 2718 459 5 Murbko South 12 19 4 512 7 495 2 118 1 1 North Purnong 2 150 102 42 385 9 1 240 1 418
SR2-O Mussels Lagoon 9 1 28 21 6 467 1197 2 2 202 3 Riverglades 7 8 453 41 19 826 1 244 151 10 7 Yarramundi North 11 11 28 14 9 192 218 1 3 368 9 1
SR2-U Craignook 3 1 505 11 1 2443 1 112 122 290 6 1 Murbko Flat 5 37 19 11 4 135 5 861 17 1 Yarra 3 53 5 7 1010 1 15 199 5 2
SR3-N Beldora 2 4 2 10 1 2203 2 155 7 Murbko South 1 2 10 28 90 6 193 3 2 North Purnong 38 7 485 1301 12 123 32 1
SR3-O Mussels Lagoon 1 2 32 4 1097 2274 1 98 17 Riverglades 2 250 29 1 133 275 23 1 4
SR3-U Craignook 2 4 499 13 1 3511 1 125 76 Murbko Flat 2 6 24 123 42 4 1 139 1 1 Yarra 1 4 11 4 1 60 286 2 14 97 2 15
Species list: CAR AUR = goldfish, CHE EXP = broadshell turtle, CHE LON = long-neck turtle, CRA FUL = unspecked hardyhead CYP CAR = common carp (>130
mm TL), CYP CAR (YOY) = young-of-year carp (<130 mm TL), EMY MAC = short-neck turtle, GAM HOL = mosquito fish, HYP SPP = carp gudgeon, MAC AMB=
golden perch, MEL FLU = rainbowfish, MIS ANG = oriental weatherloach, NEM ERE = bony herring, PER FLU = redfin perch, PHI GRA = flathead gudgeon, PHI
MAC = dwarf flathead gudgeon, RET SEM = Australian smelt, TAN TAN = eel-tailed catfish.

Thwaites, L. and Schmarr, D. (2019) Carp Exclusions at Wetland Inlets in the River Murray
76
Table 6. Continued. Catch summary for all wetlands across each sampling round. * indicates presence of species within the fifth sampling round (SR5). SR1: 20
Nov-01 Dec 2017; SR2: 05-13 Feb 2018; SR3: 16-27 April 2018; SR4: 14-29 June 2018; SR5: 1-9 Nov 2018. N = NCES (light grey), O = OCES (grey), U = Unscreened (dark grey).
CAR AUR
CHE EXP
CHE LON
CRA FUL
CYP CAR
CYP CAR (YOY)
EMY MAC
GAM HOL
HYP SPP
MAC AMB
MEL FLU
MIS ANG
NEM ERE
PER FLU
PHI GRA
PHI MAC
RET SEM
TAN TAN
SR4-N Beldora 15 1 3 5 4 482 1 30 1 1 3 Murbko South 1 5 42 13 21 North Purnong 1 32 22 1 36 30 1 42 16 3
SR4-O Mussels Lagoon 10 2 2 2 602 3 79 1 16 Riverglades 3 86 8 84 32 7 14 Yarramundi North 4 22 9 12 15
SR4-U Craignook 7 4 450 1 14 2 Murbko Flat 3 5 10 11 44 1 36 1 6 Yarra 3 4 4 62 7 4 16 59
SR5-N Beldora * 6 * 20 137 * * * * * * * * * Murbko South * * 5 2 * * 2 * * * * * North Purnong * 1 * 23 9 * * * * * * * *
SR5-O Mussels Lagoon * 1 * 10 2 1 * * 2 * * * * * * Riverglades * 2 * 16 2 * 2 * * * Yarramundi North * 5 * 6 520 * * 1 * * * *
SR5-U Craignook * 1 * 5 * 2 * * * * Murbko Flat * 1 3 * 10 11 1 * * * * Yarra * 3 * 31 49 * * 4 * * * * *
Grand Total 116 4 86 2879 1164 1329 13 2750 41811 44 214 22 7196 23 1351 36 175 3
Species list: CAR AUR = goldfish, CHE EXP = broadshell turtle, CHE LON = long-neck turtle, CRA FUL = unspecked hardyhead CYP CAR = common carp (>130
mm TL), CYP CAR (YOY) = young-of-year carp (<130 mm TL), EMY MAC = short-neck turtle, GAM HOL = mosquito fish, HYP SPP = carp gudgeon, MAC AMB=
golden perch, MEL FLU = rainbowfish, MIS ANG = oriental weatherloach, NEM ERE = bony herring, PER FLU = redfin perch, PHI GRA = flathead gudgeon, PHI
MAC = dwarf flathead gudgeon, RET SEM = Australian smelt, TAN TAN = eel-tailed catfish.

Thwaites, L. and Schmarr, D. (2019) Carp Exclusions at Wetland Inlets in the River Murray
77
Figure 34. Length frequency distribution for carp sampled within screened and unscreened wetlands for each sampling round.

Thwaites, L. and Schmarr, D. (2019) Carp Exclusions at Wetland Inlets in the River Murray
78
Figure 34 (cont.). Length frequency distribution for carp sampled within screened and unscreened wetlands for each sampling round.

Thwaites, L. and Schmarr, D. (2019) Carp Exclusions at Wetland Inlets in the River Murray
79
Table 7. Water quality parameters for all wetlands across each sampling round. * indicates nil data due to faulty probes (SR1: 20 Nov–01 Dec 2017; SR2: 05–13
Feb 2018; SR3: 16–27 April 2018; SR4: 14–29 June 2018; SR5: 1–9 Nov 2018).
Temperature Conductivity Turbidity pH Dissolved Oxygen DO%
SR1 Beldora 26.41 0.311 137 8.11 * *
Craignook 28.25 0.407 179 6.22 * *
Murbko Flat 25.55 0.551 408 8.34 * *
Murbko South 25.42 0.584 369 8.08 * *
Mussels Lagoon 23.11 0.571 348 7.48 * *
North Purnong 24.88 0.637 262 8.02 * *
Riverglades 24.18 0.539 149 6.33 * *
Yarra 19.12 0.378 222 8.1 * *
Yarramundi North 24.32 0.337 169 8.25 * *
SR2 Beldora 27.38 0.289 111 7.41 11.48 146.9
Craignook 24.6 0.311 90 7.34 6.3 77.2
Murbko Flat 25.42 0.496 371 7.85 8.3 103
Murbko South 31.12 0.585 256 8.58 8.81 118.9
Mussels Lagoon 28.96 0.553 327 8.18 9.34 122.4
North Purnong 24.14 0.692 201 8.07 5.76 70.2
Riverglades 28.17 0.441 106 9.1 10.91 141.3
Yarra 27.66 0.293 109 8.68 9.2 118.2
Yarramundi North 29.57 0.284 235 9.01 9.52 125.8
SR3 Beldora * * * * * *
Craignook 16.59 0.491 133 7.16 7.58 80.3
Murbko Flat 19.93 0.547 248 8.38 10.16 114.8
Murbko South 19.94 0.546 131 8.37 11.44 129.4
Mussels Lagoon 19.26 0.416 108 8.11 7.21 80.5
North Purnong 20.13 0.852 193 8.38 11.12 126.4
Riverglades 20.25 0.552 157 7.44 8.5 96.7
Yarra 17.7 0.799 396 8.66 8.35 90.5

Thwaites, L. and Schmarr, D. (2019) Carp Exclusions at Wetland Inlets in the River Murray
80
Table 7. Continued. Water quality parameters for all wetlands across each sampling round. * indicates nil data due to faulty probes (SR1: 20 Nov–01 Dec 2017;
SR2: 05–13 Feb 2018; SR3: 16–27 April 2018; SR4: 14–29 June 2018; SR5: 1–9 Nov 2018).
Temperature Conductivity Turbidity pH Dissolved Oxygen DO%
SR4 Beldora 8.78 0.369 43.1 8.01 10.18 90.6
Craignook 8.7 0.449 154 7.39 8.64 76.7
Murbko Flat 9.77 0.507 156 7.89 9.75 88.9
Murbko South 10.39 0.511 115 7.58 6.96 64.4
Mussels Lagoon 9.54 0.501 116 7.45 7.39 66.9
North Purnong 9.18 0.752 155 7.96 8.7 78.2
Riverglades 11.55 0.612 259 7.32 8.68 82.5
Yarra 9.55 0.384 120 7.68 9.05 82.1
Yarramundi North 8.72 0.405 300 7.61 9.04 80.3
SR5 Beldora 24.18 0.278 194 7.85 5.64 68.6
Craignook 21.14 0.354 178 7.1 6.5 75
Murbko Flat 20.53 0.449 294 7.86 7.3 83.5
Murbko South 19.83 0.624 246 7.99 6.59 74.4
Mussels Lagoon 22.81 0.495 164 7.32 7.34 87.3
North Purnong 22.43 0.561 72.1 6.8 7.93 93.8
Riverglades 22.77 0.381 217 7.2 7.76 92.3
Yarra Lagoon 20.64 0.318 333 6.32 8.14 93.2
Yarramundi North 21.03 0.343 352 7.59 6.29 72.5