Evaluating Retention Strategies for At-Risk Undergraduate ...
178
Walden University ScholarWorks Walden Dissertations and Doctoral Studies Walden Dissertations and Doctoral Studies Collection 2015 Evaluating Retention Strategies for At-Risk Undergraduate Nursing Students Joanna L. Ramsden-Meier Walden University Follow this and additional works at: hps://scholarworks.waldenu.edu/dissertations Part of the Educational Assessment, Evaluation, and Research Commons , Higher Education Administration Commons , Higher Education and Teaching Commons , and the Public Health Education and Promotion Commons is Dissertation is brought to you for free and open access by the Walden Dissertations and Doctoral Studies Collection at ScholarWorks. It has been accepted for inclusion in Walden Dissertations and Doctoral Studies by an authorized administrator of ScholarWorks. For more information, please contact [email protected].
Transcript of Evaluating Retention Strategies for At-Risk Undergraduate ...

Walden UniversityScholarWorks
Walden Dissertations and Doctoral Studies Walden Dissertations and Doctoral StudiesCollection
2015
Evaluating Retention Strategies for At-RiskUndergraduate Nursing StudentsJoanna L. Ramsden-MeierWalden University
Follow this and additional works at: https://scholarworks.waldenu.edu/dissertations
Part of the Educational Assessment, Evaluation, and Research Commons, Higher EducationAdministration Commons, Higher Education and Teaching Commons, and the Public HealthEducation and Promotion Commons
This Dissertation is brought to you for free and open access by the Walden Dissertations and Doctoral Studies Collection at ScholarWorks. It has beenaccepted for inclusion in Walden Dissertations and Doctoral Studies by an authorized administrator of ScholarWorks. For more information, pleasecontact [email protected].

Walden University
COLLEGE OF EDUCATION
This is to certify that the doctoral study by
Joanna Ramsden-Meier
has been found to be complete and satisfactory in all respects,
and that any and all revisions required by
the review committee have been made.
Review Committee
Dr. Wendy Edson, Committee Chairperson, Education Faculty
Dr. Marianne Borja, Committee Member, Education Faculty
Dr. Amy Hanson, University Reviewer, Education Faculty
Chief Academic Officer
Eric Riedel, Ph.D.
Walden University
2015

Abstract
Evaluating Retention Strategies for At-Risk Undergraduate Nursing Students
by
Joanna Ramsden-Meier
MBA, Upper Iowa University, 2001
BA, University of Northern Iowa, 1996
Doctoral Study Submitted in Partial Fulfillment
of the Requirements for the Degree of
Doctor of Education
Walden University
May 2015
Abstract
As there continues to be a nursing shortage and a lack of diversity in the nursing
profession, it is important to retain at-risk students who have been admitted to nursing
programs. The purpose of this program evaluation was to compare at-risk students who
had not received retention services to at-risk students who had received retention services
at a Midwestern college. A formative evaluation was conducted using information from
three sources: the college, the students, and the community. Guided by a constructivist
theory defined by Ponticell, this study examined the effectiveness of the retention
program in terms of its impact on course completion rates, semester, and cumulative
GPAs, and number of students on probation and dismissed from the college. Using a
retrospective quasi-experimental design, data from 72 students in 2 groups were
compared using chi-square, t tests, and one-way repeated-measures ANOVA. Although
the results were not significant, students who received retention services were less
frequently on probation and dismissed, had higher course completion rates, and had
higher GPAs. In addition, 54 graduating students were surveyed, and their perceptions of
the retention services were positive, with an overall mean score of 4.02 out of 5.0.
Themes identified through a community key informant interview included
student/personal responsibility, family responsibility, and community responsibility. The
program evaluation was summarized in an evaluation report that included the results and
recommendations for continuation or the addition of retention services. This study may
impact social change as the retention services are reviewed and adjusted in order to
produce an increased number of qualified, diverse registered nurses.
Evaluating Retention Strategies for At-Risk Undergraduate Nursing Students
by
Joanna Ramsden-Meier
MBA, Upper Iowa University, 2001
BA, University of Northern Iowa, 1996
Doctoral Study Submitted in Partial Fulfillment
of the Requirements for the Degree of
Doctor of Education
Walden University
April 2015

Dedication
This work is dedicated to my grandparents, Bob and Joan Nohre. While they
began this journey with me, they will help me celebrate this accomplishment from a place
greater than I can even imagine. Thanks to my husband, Kevin, who is and always will
be the calm to my storm. And to the rest of my family, including my coworkers, thank
you for your part in my doctoral journey through words of encouragement, tolerance,
understanding, and helpfulness as this “paper” took the front seat. My heart is filled with
gratitude.

Acknowledgments
I would like to express my gratitude and thankfulness to numerous individuals
listed below. I am truly blessed.
Dr. Wendy Edson, faculty member at Walden University, who served as my
chair and offered words of encouragement and motivation to keep me going
through this process. She is appreciated more than she can know.
Dr. Marianne Borja, faculty member at Walden University, who served as my
committee member and helped me dig just a little bit deeper with each review.
Dr. Jerry Durham, Chancellor at Allen College, who both encouraged and
supported my doctoral journey.
Dr. Lisa Brodersen, faculty member at Allen College, who helped me tackle
SPSS and provided much-needed encouragement.
Dina Dowden, administrative assistant at Allen College, who helped me with
formatting, as formatting sometimes got the best of me.
David Wu, instructional technology specialist at Allen College, who helped
with various technical aspects that I could not have figured out on my own.
Panera Bread staff and friends, for keeping me full of coffee, power
sandwiches, and sodas every weekend morning.
Next Level Extreme Fitness trainers for giving me a place to punch out my
frustrations.

i
Table of Contents
List of Tables .......................................................................................................................v
List of Figures .................................................................................................................... vi
Section 1: The Problem ........................................................................................................1
Introduction ....................................................................................................................1
Definition of the Problem ..............................................................................................2
Rationale ........................................................................................................................5
Evidence of the Problem at the Local Level ........................................................... 5
Evidence of the Problem From the Professional Literature .................................. 11
Definitions....................................................................................................................13
Significance..................................................................................................................15
Guiding/Research Question .........................................................................................16
Review of the Literature ..............................................................................................19
Evaluation of Retention Programs ........................................................................ 24
Retention Efforts in Preadmission and Admission ............................................... 25
Engagement Programs .......................................................................................... 27
Progression ............................................................................................................ 29
Program Evaluation Based on Requirements (Legislative, Grant, etc.) ............... 30
Transition From Student to Employee .................................................................. 31
Implications..................................................................................................................32
Summary ......................................................................................................................33
Section 2: The Methodology ..............................................................................................34

ii
Introduction ..................................................................................................................34
Research Design and Approach ...................................................................................34
Setting and Sample ......................................................................................................37
Data Collection ..................................................................................................................40
Retrospective Data ................................................................................................ 41
Student Perception Data ........................................................................................ 49
Community Interview Data................................................................................... 53
Data Analysis ...............................................................................................................54
Results ..........................................................................................................................58
Student Survey Results ......................................................................................... 65
Community Key Informant Interview Results ...................................................... 67
Assumptions, Limitations, Scope, and Delimitations ..................................................69
Limitations of Evaluation ............................................................................................70
Protection of Participants .............................................................................................71
Recommendations ........................................................................................................72
Conclusion ...................................................................................................................75
Section 3: The Project ........................................................................................................77
Introduction ..................................................................................................................77
Description and Goals ..................................................................................................77
Evaluation Report ................................................................................................. 78
Review of the Literature ..............................................................................................81
Formative Evaluation ............................................................................................ 81
iii
Research-Based Recommendations for Program Evaluators ............................... 84
Evaluation Reports ................................................................................................ 91
Using Evaluation Results to Impact Policies ........................................................ 92
Implementation ............................................................................................................97
Resources and Existing Supports .......................................................................... 97
Potential Barriers .................................................................................................. 98
Proposal for Implementation and Time Table ...................................................... 98
Roles and Responsibilities of Students and Others............................................... 99
Project Implications and Social Change ....................................................................100
College Implications ........................................................................................... 100
Community Implications .................................................................................... 100
Far-Reaching Implications .................................................................................. 101
Conclusion .................................................................................................................101
Section 4: Reflections and Conclusions ...........................................................................103
Introduction ................................................................................................................103
Project Strengths ........................................................................................................103
Weaknesses and Limitations ......................................................................................104
Alternative Solutions .................................................................................................105
Scholarship .................................................................................................................106
Project Development and Evaluation .........................................................................107
Leadership and Change ..............................................................................................108
Reflection on the Importance of the Work ................................................................110

iv
Implications, Applications, and Directions for Future Research ...............................111
Conclusions ................................................................................................................112
References ........................................................................................................................114
Appendix A: Evaluation ..................................................................................................128
Appendix B: Consent Form .............................................................................................155
Appendix C: Survey of Student Perception of Support Services, Persistence, and
Belongingness ......................................................................................................158
Appendix D: Permission Agreement ...............................................................................160
Appendix E: Consent Form .............................................................................................162
Appendix F: Interview Guide ..........................................................................................164
Appendix G: Study Variables Obtained From College Records .....................................165

v
List of Tables
Table 1. Study Variables for Archival Academic Data….……………………………… 46
Table 2. Results of Archival Academic Data……………………………………………59
Table 3. Means and Standards Deviations of GPAs …………………………………… 62
Table 4. Summary of Survey of Student Perceptions of Support Services, Persistence and
Belongingness ……………………………………………….……………………………66
Table A1. Study Variables for Archival Academic Data………………………………134
Table A2. Summary of Student Perceptions of Support Services, Persistence and
Belongingness…………………………………………………………………………..140

vi
List of Figures
Figure 1. Difference in GPAs between groups.……………………………………….....63
Figure A1: Average percentage of courses completed…………………………………136
Figure A2: Difference in GPAs between groups……………………………………….137
Figure A3: Percent of students on probation…………………………………………...138
Figure A4: Percent of students dismissed………………………………………………139
Figure A5: Retention based on shared responsibility…………………………………..141

1
Section 1: The Problem
Introduction
The Nursing Workforce Diversity Scholars (NWD Scholars) retention programs
were created in 2011, funded by a grant. Participating students were selected based on
specific criteria as defined by the grant. During the last 2 years, NWD Scholars have
received funding in the form of scholarships and stipends (Nursing Workforce
Development Guidelines, 2010). In order for the students to keep scholarships and
stipends, students must attend specific retention programs. These programs include
meeting with a financial aid counselor, meeting with an academic mentor, and attending
seminars that focus on academic enrichment (Nursing Workforce Development
Guidelines, 2010). Prior to the NWD grant, at-risk students were not identified, and there
were limited services available to them aiding their progression through the nursing
program. In this project study, I evaluated the retention programs that have been
implemented since the grant monies were received, allowing the college administration to
determine if the services are effective and what changes need to be made.
This project study was done to evaluate the retention services provided at a
Midwestern college to students defined as at-risk. A formative evaluation was used to
collect data from three sources: the college, the students, and the community. The
Midwestern college received a grant in 2011 to provide retention services for students
who are educationally or economically disadvantaged. The results of the formative
evaluation will assist in informing the grant administrators during the final year of
funding by the grant and as the college continues the services without grant funding.

2
Historically, the college did not admit minority students at the same rate as
nonminority students (Nursing Workforce Development Guidelines, 2010). From 2007
through 2009, minority students were admitted at a rate of 23-29% of those who applied,
compared to a rate of 53-70% for nonminority students (Nursing Workforce
Development Guidelines, 2010). While minority students were underrepresented in the
admissions of the college, retention, graduation, and NCLEX-RN pass-rates for minority
students were typically higher than nonminority rates (Nursing Workforce Development
Guidelines, 2010). However, at-risk students are not exclusively minority students. The
definition of at-risk student encompasses more than racial or ethnic diversity.
Definition of the Problem
At this small college of nursing and health sciences in the Midwest, creating a
diverse student body is part of the institutional mission. In order for the college to
become more diversified, grant funding was sought in order to develop retention
programs that would assist nursing students who come with disadvantages that may put
them at risk. The Nursing Workforce Diversity Scholars (NWD Scholars) retention
programs were created in 2011 and funded by a grant. Once grant funding had been
secured and students had been admitted and funded through grant dollars, an evaluation
of the program was needed to determine whether the services introduced were having an
effect on the identified at-risk students.
This project study took place at a Midwestern college in the United States. This
institution is categorized by the Carnegie Foundation for the Advancement of Teaching
as a special focus institution and is a private, not-for-profit institution (Carnegie, n.d.).

3
Offering degrees in nursing and health sciences, the college’s Bachelor of Science in
Nursing (BSN) program enrolls the most students. In Spring 2013, the college
enrollment was 610 students, of which 358 were BSN students (Ramsden-Meier, 2013).
While the college’s first year retention rate is high at 94%, the attrition rate for the BSN
program has ranged from 6–10% over the last 6 years (Ramsden-Meier, Hanson, &
Kramer, 2012). Of those students who left the college in 2011-2012, 44% left for
academic reasons (Ramsden-Meier et al., 2012). While some students do not return to
the college to pursue a BSN degree, others petition the school for readmission.
This institution is a private, not-for-profit institution that grew from a hospital-
based nursing diploma program. While separately incorporated, the college has
significant ties to the hospital. General education courses are not offered at this
institution, so students must complete pre-requisite courses at another accredited
institution prior to enrollment. The students who are accepted and who enroll here are
highly qualified and have the ability to be successful in the curriculum and on NCLEX-
RN. Transfer students admitted to the nursing program in Fall 2012 had an average high
school GPA of 3.44 and a composite ACT average of 22.20 (Ramsden-Meier, 2012).
From 2009 to 2012, the college’s first-time NCLEX-RN pass rates ranged from 88.88%
to 97.85% (Iowa Board of Nursing, 2013). The national first-time pass rate for 2009–
2011 ranged between 87.42 and 88.80%, and the Iowa first-time pass rate for 2009–2011
ranged between 82.99% and 85.30% (Iowa Board of Nursing, 2011a). In addition, from
2008–2011, this college obtained the second highest NCLEX-RN pass rates among
baccalaureate programs testing more than one student in the state of Iowa for 3 of the 4

4
years (Iowa Board of Nursing, 2011b). Students who are not successful in a class or
semester or who are dismissed academically may have other intervening variables
preventing them from being successful. It is important for the students to have an
opportunity to resolve barriers that may prevent them from being successful in their
nursing courses (Goff, 2011).
While the retention strategies are immediate resources that are designed to assist
students in their present course(s), they are also solidifying information that will be useful
as the student prepares for NCLEX-RN. Retention services had not been evaluated
officially by the Midwestern College since they were first offered. While comments were
welcomed from students, faculty, or staff, a formal evaluation had not been conducted.
Conducting an evaluation of the students’ perceptions of the retention services that were
offered and how the retention services aided in the students’ success was likely to assist
in making recommendations for changes or enhancements to services for future students.
For this research study, I requested perceptions of retention services from the students
who had received them.
In an attempt to evaluate the different types of remediation programs that are
available, Pennington and Spurlock (2010) conducted an evaluation of eight remediation
programs to determine their effectiveness in improving NCLEX-RN outcomes. Of the
eight remediation programs evaluated, all of them reported using more than one
remediation tactic, which included interventions such as teaching study skills and stress
management, taking practice NCLEX-RN exams, and involving faculty advisors in the
development of personalized plans of action (Pennington & Spurlock, 2010). This study

5
lends evidence that creating remediation programs may benefit students’ further
academic ability and provide assistance that is needed to be successful on NCLEX-RN.
According to Darussalam (2010), all programs need to be evaluated, and in
education, it is the evaluation that determines whether a program is effective or
ineffective. An evaluation should focus on four aspects of the program: the view of the
participants, the learning that takes place, the behavior of participants, and the results of
evaluation (Darussalam, 2010). This information is useful to plan the next stages of the
program. Kalra, Nelson, Dave, and Wadhwa (2011) expressed agreement concerning
the value of program evaluation: “To determine the effectiveness of any teaching
program, it is essential to get feedback from participants and analyze it to further improve
the teaching curriculum” (p. 506). It is important to ensure that the program is doing
what it is supposed to do. Time and other resources are wasted if programs are not
getting the intended outcomes.
Rationale
Evidence of the Problem at the Local Level
Since the addition of retention services directly related to assisting at-risk students
at the Midwestern college, a thorough review and evaluation of the services had not been
done. Taking inventory of what services are provided and reviewing the success of
students who took advantage of the services may allow the local institution to move
forward with what is working and make adjustments to what is not. Analyzing the
remediation activities, such as time management, study skills, emotional health, nursing

6
course GPA, cumulative GPA, and being successful in each course is a concept that has
not yet been a strategy used with at-risk students.
The definition of at-risk students at the Midwestern college is two-fold. Students
may be classified at-risk for either economic or education reasons. Economically
disadvantaged students are identified as coming from a family with an annual income
that does not exceed 200% of the U.S. Census Bureau’s adjusted annual income (Nursing
Workforce Development Guidelines, 2010). Educationally disadvantaged students are
identified as coming from a high school with a lower ACT/SAT average than the state
test results, coming from a high school where 50% or fewer graduates attend college,
having a diagnosed physical or mental impairment that limits participation in educational
experiences, being a person for whom English is not the primary language and language
is a barrier for academic performance, being a person who is a first-generation college
student, and/or being a person who comes from a high school where at least 30% of
enrolled students were eligible for free or reduced-price lunch (Nursing Workforce
Development Guidelines, 2010).
Based on the college’s admissions policies, students are well prepared for success
in the nursing program; however, other nonacademic factors may get in the way of their
academic success, therefore putting them at risk. This college’s undergraduate nursing
programs are full. This impacts the institution’s retention rate and revenue. It is
important to identify at-risk students and determine what resources are needed in order to
help them succeed. The evaluation of the resources provided by retention services is
meant to assist at-risk students, and it is necessary to ensure that these services are

7
impacting the at-risk students. Students who are not successful at this Midwestern
college also impact the community’s ability to fill open nursing positions in the area.
This college is important to the community.
Currently, the local institution classifies prelicensure nursing students who do not
obtain a semester grade point average (GPA) of 2.5 or above as on probation. (Students
who fail to obtain a semester GPA of 2.5 or above in any subsequent semester are
academically dismissed. Academic dismissal may also occur if the student fails to meet
program requirements in three or more required courses, or fails to successfully repeat a
nursing course. Automatic dismissal occurs when a student’s cumulative GPA is below
2.0 at any time.
Due to the importance of passing NCLEX-RN on the first attempt to students and
colleges, identification of at-risk students is crucial. Identifying students early in their
college careers as at-risk students is important, but it is also important to continuously
monitor students who are not initially identified as at-risk due to potential additional at-
risk behaviors. At-risk behaviors can include failing an exam, missing an excessive
number of classes, failing a course, experiencing a semester on probation, or being
readmitted to the nursing program after a dismissal (Goff, 2011). The current definition
of an at-risk student includes a student who is economically or educationally
disadvantaged and does not currently take into account additional at-risk behaviors. The
current retention services need to be evaluated to determine whether at-risk students
receiving retention services are more successful when compared to a group of at-risk

8
students who were not previously identified as at-risk and who received no retention
services.
Some types of retention strategies implemented in institutions nationwide have
been described as high-stakes testing. High-stakes testing is defined by Heubert and
Hauser in Spurlock (2006) as an exam given to students where the results will be used to
make decisions regarding tracking, promoting, or graduating students. Nursing faculty
are under pressure to graduate only students who are likely to pass NCLEX-RN;
therefore, high-stakes testing retention strategies have been implemented in colleges and
universities to determine which students are likely to pass NCLEX-RN (Shultz, 2010).
These strategies include increasingly difficult admission requirements, progression
policies, and additional testing products to validate the faculty’s assessment of the
student’s ability to pass and progress to future nursing courses (Shultz, 2010).
Many nursing programs have implemented some type of prepackaged NCLEX-
RN preparatory exam(s) as part of the nursing program (Shultz, 2010). The Midwestern
college uses ATI’s Comprehensive Assessment and Review Program (CARP) as a
NCLEX-RN preparatory package that begins preparing students to take NCLEX-RN in
their second semester of nursing. Nursing faculty find themselves under a great deal of
pressure to graduate only those likely to pass NCLEX-RN (Shultz, 2010). This includes
using the high-stakes testing strategies as well as increasing admission requirements
(Shultz, 2010).
Since 2000, retention strategies have been implemented; however, until 2009, the
strategies only addressed NCLEX-RN pass rates directly by requiring students to

9
remediate during their final semester if NCLEX-RN predictor test scores were not at the
required level. Since the grant was implemented in 2011, retention services have
expanded to include offerings that assist students who are struggling with progression in
the nursing curriculum. Ultimately, passing NCLEX-RN is the goal for all stakeholders:
students, their family members, faculty, and staff. As the college purposefully aimed at a
more diverse population of students, retention efforts followed in order to give all
students the resources needed to be successful in the nursing program.
One retention strategy includes the use of Assessment Technologies Institute®
(ATI®) testing throughout the nursing program. ATI’s CARP tool allows students to
take NCLEX-RN-like exams during the nursing program. The students take a proctored
exam in most nursing courses that accounts for 3% of their grade. Feedback reports are
provided to students through their ATI account. These reports provide information
regarding areas of improvement to the student. Students are able to take subsequent
nonproctored exams where they receive immediate feedback regarding the answer(s)
selected.
Additional retention strategies are available through the retention office. In 2009,
a retention coordinator was added to the student services staff. The retention office offers
weekly seminars that include topics such as APA formatting, time management, test-
taking strategies, and study skills, test anxiety, reading texts, and taking notes. Tips of
the day are posted in the student services online course, which provides students with
one-sentence advice about how to be a more effective student. During the last year, the
retention office has added Tutor.com® and StudentLingo® as online help offerings.

10
Tutor.com allows students to submit writing samples for evaluation at any time and offers
assistance in writing and grammar. StudentLingo offers modules that assist students in
study habits. StudentLingo has four categories of online workshops: academic and career
exploration, learning to learn, personal management, and reading and writing samples
(StudentLingo, n.d.).
The local institution can provide evidence of the retention strategies that are
currently in place, including admission and progression criteria, as well as services
provided from the retention coordinator. In addition, the student services office student
database can provide the data necessary to determine at-risk students, passed course
percentages, GPA, students on probation status, or students who have been dismissed.
Another source of evidence may be institutions similar to the local institution as
identified by American Health Science Education Consortium (AHSEC). AHSEC is a
group of institutions of higher education that are hospital based. The purpose of AHSEC
is “to advance and support quality hospital and healthcare system related health sciences
education in the United States” (AHSEC, 2013, para. 1). This group of institutions is a
resource to gather policies and procedures on admission criteria, progression criteria,
definitions of at-risk students, and retention strategies.
Grant funding typically requires reporting of how funding was spent. At this
juncture in the grant calendar, it is necessary to collect data to determine the value of the
retention services that have been implemented since receipt of the grant. It is important
to determine whether the services that were expected to retain at-risk students are
retaining at-risk students. It is also important to understand whether the at-risk students
11
find the services of value and whether the members of the community that is served by
the Midwestern college think that the college is adequately supporting students in degree
completion. A program evaluation may offer data that can determine whether at-risk
students are assisted by the retention services offered on campus.
Evidence of the Problem From the Professional Literature
A program evaluation involves, quite simply, determining whether a program is
doing what its designers said it was going to do. If positive results were not achieved,
why were they not achieved? In contrast, if positive results were achieved, why were
they achieved (Young, Denny, & Donnelly, 2012)? Since receipt of the grant, evaluation
to determine whether change is occurring in at-risk students based on the additional
retention services in place had not been conducted. As described by Frye and Hemmer
(2012), collecting data to determine whether a program is successful must be deliberate
and methodical. The data selected for collection must be able to connect to a success
indicator. The inability to retain a student in college is a lose-lose situation. The student
loses time, money, and self-esteem. The college loses revenue and may develop a
reputation for poor persistence rates if too many students withdraw (Cameron, Roxburgh,
Taylor, & Lauder, 2011). The shortage of nurses in the United States creates an urgency
that relates to the successful program completion of registered nurses. While the shortage
of nurses varies from state to state, this college’s contribution to address factors that may
produce additional Bachelor of Science-prepared nurses for the workforce may have an
impact on health care (Cameron et al., 2011). In addition, diverse nurses are not equally
represented in the nursing workforce. According to a fact sheet published by the

12
American Association of Colleges of Nursing (American Association of Colleges of
Nursing, 2013), in 2012, 37% of the U.S. population were ethnic and racial minorities
while only 16.8% of the registered nurses were ethnic and racial minorities. Mulholland,
Anionwu, Atkins, Tappern, and Franks (2008) reviewed past student records to determine
whether diversity played a role in the attrition rate of nursing programs. This study
determined that ethnicity was one of the factors with a relationship to a higher rate of
attrition. In addition, retaining nursing students aligns with increasing the number of
nursing graduates. Graduates of nursing programs can create social change by filling
nursing vacancies in hospitals and clinics to alleviate the shortage.
The purpose of this program evaluation is to determine the strengths and
opportunities of the retention program developed as a result of the NWD Scholars grant.
In order to determine where there are strengths and opportunities, I compared at-risk
students who had received retention services with at-risk students who had not received
retention services by evaluating course completion rates, semester and cumulative GPAs,
and number of students on probation and dismissed from the college. This comparison
will assist in making data-driven decisions regarding how to proceed with retention
services for at-risk students. In addition, a survey was offered to students who had
received retention services in order to obtain their perceptions of the services that are
offered. A key informant was interviewed to determine one perspective of a community
member with regard to the local college’s efforts of educating nursing students in the
community.

13
Definitions
At-risk students: At-risk students are students who have met the Midwestern
college’s criteria of economically disadvantaged or educationally disadvantaged. At-risk
students were the population used in this study (Nursing Workforce Development
Guidelines, 2010).
Attrition: Attrition refers to a student who stops making progress toward a degree
for any reason. Reasons for attrition typically include a student who withdraws from a
college or university, either voluntarily or through dismissal (Nursing Workforce
Development Guidelines, 2010).
Course completion rate: The course completion rate was calculated by dividing
the number of completed credit hours by the number of attempted credit hours (Austin
Community College District, n.d.).
Cumulative GPA (grade point average): The cumulative grade point average is
calculated by dividing the total grade points by the total graded hours (Coastal Carolina
University, n.d.). In this study, the cumulative GPA was calculated to reflect all courses
taken during the student’s enrollment in a nursing program.
Dismissal: Dismissal indicates that a student is no longer able to enroll in the
Midwestern college because the student is not making satisfactory progression in the
nursing program. The Midwestern college dismisses students for the following reasons:
(a) failure to obtain a 2.5 semester GPA for two semesters, (b) failure to meet program
requirements in three required courses, (c) failure to successfully repeat a nursing course,
or (d) a cumulative GPA of below 2.0 at any time.

14
Economically disadvantaged: An economically disadvantaged student is
identified as coming from a family with an annual income that does not exceed 200% of
the U.S. Census Bureau’s adjusted annual income (Nursing Workforce Development
Guidelines, 2010).
Educationally disadvantaged: Educationally disadvantaged students are identified
as coming from a high school with a lower ACT/SAT average than the state test results,
coming from a high school where 50% or fewer graduates attend college, having a
diagnosed physical or mental impairment that limits participation in educational
experiences, being a person for whom English is not the primary language and language
is a barrier for academic performance, being a person who is a first-generation college
student, and/or coming from a high school where at least 30% of enrolled students were
eligible for free or reduced-price lunch (Nursing Workforce Development Guidelines,
2010).
Nursing Workforce Diversity: A project at the Midwestern college that is
designed to increase the number of individuals from educationally and/or economically
disadvantaged backgrounds as well as other populations, such as racial and ethnic
minorities who are underrepresented in the population of registered nurses (Nursing
Workforce Development Guidelines, 2010).
Persistence: Persistence indicates that a student is making progress toward a
degree or has completed a degree (Tinto & Cullen, 1973).
Probation: A student is considered on probation if the student does not obtain a
semester GPA of 2.5 or above.
15
Retention services: Retention services are services that have been developed to
assist students who are at risk. Services include the development of life skills such as
time management, controlling anxiety, interview skills, and preparation to enter the
workforce. In addition, academic-skill services include services related to writing,
reading texts, taking lecture notes, study techniques, test anxiety, and test-taking
techniques (Nursing Workforce Development Guidelines, 2010).
Semester GPA (grade point average): The semester grade point average is
calculated by dividing the semester’s grade points by the semester’s graded hours
(Coastal Carolina University, n.d.).
Significance
Colleges and universities admit students with the goal of producing quality
graduates. Admissions requirements are the first step toward producing quality
graduates. Once students have been admitted, progression policies are put into place to
further identify students who may be at risk of not becoming quality graduates. The
impact of a student who is unable to progress is negative for both the student and the
institution. Identifying at-risk students early in their careers may give them an
opportunity to be connected with services that will lessen or even eliminate at-risk
behaviors or their consequences.
Retention services are put in place to help students be successful. Evaluating
services is one method by which to determine whether students engaging in retention
services are successful. In order to establish whether retention services are valuable to
students, it must first be determined whether students are taking advantage of the services
16
offered (Gill, Mac an Bhaird, & Fhloinn, (2010). Participation information should be
shared with college stakeholders as well as students. It is important for students on
campus to know the level of participation in retention services by their peers (Gill et al.,
2010).
Once participation levels are determined, further evaluation is needed to
determine whether the services have an impact on the students’ grades, GPAs, and
retention (Gill et al., 2010). The desired outcome of this project study was to develop
retention services that meet the challenges experienced by at-risk students in order for the
students to graduate and pass NCLEX-RN.
In an attempt to evaluate the different types of remediation programs that are
available, Pennington and Spurlock (2010) conducted an evaluation of eight remediation
programs to determine their effectiveness in improving NCLEX-RN outcomes. Of the
eight remediation programs evaluated, all of them reported using more than one
remediation tactic, including interventions such as teaching study skills and stress
management, taking practice NCLEX-RN exams, and involving faculty advisors in the
development of personalized plans of action (Pennington & Spurlock, 2010). This study
lends evidence that creating remediation programs may benefit students’ further
academic ability and provide assistance that is needed to be successful on NCLEX-RN.
Guiding/Research Question
After the review of literature and the objectives of the NWD grant relating to
retention, the guiding question was whether the retention programs that had been
17
implemented since the grant monies were received were effective and whether changes
needed to be made to the current retention services.
When this study began, retention services had been implemented at the local
institution but had not yet been evaluated. In addition, the success of the retention
services implemented had not been reviewed to determine whether the implementation of
these services had made an impact on the success of at-risk students on this campus.
In order to determine whether retention services are beneficial to at-risk students,
several research questions were developed.
Research Question 1: Do at-risk students who received retention services have a
significantly higher percentage of passed courses than at-risk students who did not
receive retention services?
H1a : There is a significant difference in the percentage of passed courses between
at-risk students who received retention services and at-risk students who did not receive
retention services.
H10: There is no difference in the percentage of passed courses between at-risk
students who received retention services and at-risk students who did not receive
retention services.
Research Question 2: Did identified at-risk students who received retention
services have a significantly higher semester and cumulative GPA than at-risk students
who did not receive retention services?

18
H2a: There is a significant difference in semester and cumulative GPAs between
at-risk students who received retention services and at-risk students who did not receive
retention services.
H20: There is no difference in semester and cumulative GPA between at-risk
students who received retention services and at-risk students who did not receive
retention services.
Research Question 3: Were there significantly fewer identified at-risk students
who received retention services on probation compared to identified at-risk students who
did not receive retention services?
H3a: There is a significant difference in the instance of probation between at-risk
students who received retention services and at-risk students who did not receive
retention services.
H30: There is no difference in probation status between at-risk students who
received retention services and at-risk students who did not receive retention services.
Research Question 4: Were identified at-risk students who received retention
services dismissed significantly less often than at-risk students who did not receive
retention services?
H4a: There is a significant difference in the instance of dismissal between at-risk
students who received retention services and at-risk students who did not receive
retention services.
H40: There is no difference in dismissals between at-risk students who received
retention services and at-risk students who did not receive retention services.

19
Research Question 5: How did students rate their retention services on the Survey
of Student Perception of Support Services, Persistence, and Belongingness?
Research Question 6: What perceptions were offered by the key informant
regarding how the Midwestern college supports students toward degree completion?
Review of the Literature
In order to obtain information related to this program study, several literature
searches were conducted. Databases used to conduct the literature review included
ERIC, MEDLINE, CINAHL, Nursing & Allied Health Source, Health and Medical
Complete, PubMed, Academic Search Complete, PsycARTICLES, and PsycINFO.
Terms used in the search for literature focused on program evaluation, retention, and at-
risk students. This study used a constructivist theoretical approach. A constructivist
approach was defined by Ponticell (2006) as learners using existing and new knowledge
to shape their perceptions. There are five key skills used by learners, including awareness
of their abilities to learn and memory capabilities (Ponticell, 2006). In addition, learners
evaluated whether they were able to accomplish a learning task, understand which
learning strategies work best for them, use those strategies, and then evaluate whether the
strategy was successful (Ponticell, 2006). The final skill was knowing which strategy to
use in which situation (Ponticell, 2006). As students are able to make the connection
between past or current academic success and future academic success and NCLEX-RN
success, they will increase their awareness of their own knowledge base and how to use it
to increase their future successes.

20
The constructivist approach has been used in other studies. Lyons (2008) used a
constructivist approach to determine how critical thinking was impacted when using
problem-based learning to teach a NCLEX-RN review course to associate degree nursing
students. There is additional research that suggests that learning is progressive and that
learning one concept is crucial to learning the next concept (Krajcik, 2011). The
constructivist approach is also apparent in most nursing curricula, as they are linear in
nature. Students often cannot progress to the next semester without successful
completion of the current coursework. Constructively learning the current semester
content is required for progression, as the future semester content will build on the
concepts already learned.
Although the concept of constructivist theory can be understood, actually
applying this theory to individuals and their experiences with learning takes practice.
Constructivist theory defines the need for individuals to understand their learning
processes in order to successfully use learning techniques to gain further knowledge.
This is important for nursing students because the nursing curriculum starts with basic
information about the human body and then builds with more complex information as the
curriculum progresses. The ability for students to learn different learning strategies by
putting them into practice and then evaluating them to determine which strategies are the
most effective for them is beneficial for progression within the curriculum. Students who
were exposed to retention services were given the opportunity to be exposed to different
learning strategies and to evaluate them and use them in future courses. Students who did
not have access to retention services did not have the same opportunity for exposure to

21
possible learning strategies and therefore could not evaluate which strategy might work
the best for their progression.
Since the grant was initiated, there had not been an evaluation of the retention
services that are offered for at-risk students. The outcomes of the grant include creating a
learning environment by offering academic enrichment activities and social support,
improving the retention rate of at-risk students, and improving the graduation rate of at-
risk students (Nursing Workforce Development Guidelines, 2010). If the current services
offered to improve retention are not showing the desired results, then additional research
needs to occur to determine how to meet the needs of at-risk students. Kalra et al. (2011)
suggested that the evaluation of any teaching program requires analyzing the participants
in order to make improvements. To determine whether retention rates of at-risk students
were improving, an evaluation of those services was needed. According to Berk and
Rossi (1999), there are six steps to designing and testing new programs: identification of
issues, formulating policy responses, designing a program, improving the program,
assessment of the program, and determinations of cost effectiveness. Not all steps may
be relevant to every evaluation. For this study’s purpose, Step 4, improving the program,
was where the evaluation began, as Steps 1 through 3 had already been completed. In
improving the program, it was necessary first to determine what needed to be enhanced.
However, understanding whether a program is effective may be difficult because there
are other, nonprogram factors that are going on in the students’ lives that may also be the
reason for the impact (Berk & Rossi, 1999).
22
Program evaluations are valuable tools when information is needed regarding
program success or when improvements of a program need to be determined. Program
evaluations can be conducted in the middle of a program, as in this research, or at the
conclusion of a program. A program evaluation can be defined as understanding the
program well enough through information gathering and review to determine what is
contributing to the success of the program and any possible improvements (Frye &
Hemmer, 2012). Specific measurements are often identified to determine what is
considered “success.” A primary reason for conducting a program evaluation is
accreditation requirements or funding requirements, such as grant funding or other
educational groups (Frye & Hemmer, 2012). However, more recently, educators have
become more interested in the process of evaluation due to the changing approaches to
educate students. In order to learn about the dynamic education system, educators must
first understand the new approaches to education, and program evaluations are becoming
more common in all aspects of learning (Frye & Hemmer, 2012).
Possibility of Limited Published Studies on Program Evaluations
While program evaluations may be occurring frequently in education, it is
possible that very few are published. In a study conducted by Nestel et al. (2012),
discussion regarding why program evaluation is often not published was presented. One
reason posited by the study is that program evaluations are sometimes not conducted until
after program development and are not thought of as research; they are thought of as
having value only to the institution. In addition, research articles are often limited to
2,500 words, and program evaluations can often produce a great deal of output, which

23
makes editing to the word limit difficult (Nestel et al., 2012). The program evaluations
that are described in the following literature review include those specific to the
importance of program evaluation; retention programs; program reviews conducted as a
result of a set of requirements, such as legislative requirements, grant requirements, or
graduate outcomes; the timing of the retention program; and problem-based learning and
retention of employees.
Importance of Program Evaluations
There may be a “feeling” of whether a program is successful or unsuccessful, but
unless there is data to back the “feeling,” there is no evidence that a program is producing
expected outcomes. A program evaluation can provide needed evidence, such as what is
making a program successful, what is not working, or opportunities for growth. Grigal,
Dwyre, Emmett, and Emmett (2012) created a tool to evaluate a new initiative that
supported students with intellectual disabilities. Pogrund, Darst, and Boland (2013) used
interviews to review with participants their experiences in a program to assist blind and
visually impaired students in connecting with their peers and learning new skills. Both
program evaluations were conducted to determine whether their programs were doing
what was intended.
The evaluation of a retention program has four categories, according to a study by
Moscoso, Sanduvente Chaves, Portell Vidal, and Argilaga (2013). Included in the
categories were dealing with urgent needs first and rationalizing using some retention
programs for some groups of students but not others. In addition, if a program is no
longer needed or effective, it should be discontinued or replaced. Effectiveness is what is

24
being evaluated, and decisions need to be made based on whether there is value in the
program (Darussalam, 2010). It is also important to make sure that the data that are
collected are assessing what they are intended to assess. Passy, Morris and Waldman
(2009) conducted a program evaluation that started with making sure the data collected
included useful data that could be used to evaluate the program.
Evaluation of Retention Programs
Some retention strategies are implemented before a student is admitted or through
orientation programs. Other retention efforts begin when a student shows signs of a
challenge. Challenges can include academic factors, such as a low GPA or failure of
course, or nonacademic factors such as challenges adjusting to college, lack of study
skills, or formal and informal socialization (Domina, 2009; Moses et al., 2011).
Sometimes, specific agencies such as accreditors or governmental regulations require
program evaluations, and other times administrators at an institution want to better
understand the transition from student to employee (Haggerty, Holloway, & Wilson,
2013; Igbo et al., 2011; Morris & Hancock, 2013). Regardless of the reason for program
evaluation, conducting such an evaluation can steer a program in a new direction or
indicate that current efforts are successful.
Whether one is attempting to retain students or employees, retaining those
individuals who have already been recruited to a campus or employer is more cost
efficient than recruiting new students or employees (Mulholland et al., 2008). Retention
is an important part of any campus or company. The evaluation of retention programs
can be done in several ways, as in the current study—using archival data, gathering data

25
on perceptions of those in the program, and using interviews. There are various points in
a student’s journey where retention efforts can take place.
Retention Efforts in Preadmission and Admission
Admission criteria are often put in place to ensure success. This is the first step in
retaining students (Domina, 2009). However, many times the admission criteria are
specific to GPA and standardized test scores. While this can help predict future academic
success, nonacademic success may be more difficult to predict. Administrators at
colleges and universities may invest time in reviewing personality or demographic
characteristics to determine whether a student may be at risk in relation to degree
completion. There are programs that review at-risk characteristics in high school.
Domina (2009) investigated high school programs that were developed to increase at-risk
high school students’ skills in order to help them succeed in high school and be more
likely to attend college. While the results were not statistically significant, students who
were involved in a retention program at the high school level did improve their
performance in high school and increase their chances of enrolling in a postsecondary
institution (Domina, 2009).
Personality characteristics are sometimes deemed important for determining
success. Moses et al. (2011) reviewed factors indicative of success in engineering
students to determine whether there were also personality indicators in addition to
academic factors that could predict success. Openness was the personality factor that did
have a significant influence on retention. Another study also indicated that important
factors for success included gender, race, degree, and participation in the college’s

26
mentoring program or first-year retention program (Mills et al., 2009). It is not
uncommon for personality characteristics to be used to make admissions decisions.
Orientation programs are often used as an opportunity to have new students on
campus to inform them of policies and processes and to get them accustomed to the
campus and meet fellow students and instructors (Mills et al., 2009). Gilmore and Lyons
(2012) determined that an orientation program increased retention. Attrition rates after a
redesigned orientation program were less than 2%. The program focused on orienting
students to their new environment, resources such as library registration, and other
support services (Mills et al., 2009). After students attend an orientation program, the
college or university may then conduct a program evaluation to determine whether the
orientation program is retaining students. Bliss, Webb, and St. Andre (2012) reported
positive results from the Learning, Achievement, Engagement, and Progress (LEAP)
program based on performance indicators such as first and second semester GPA,
retention, and graduation rates. This first-year experience program results also indicated
that results for women in the LEAP program were significant, while the results for men in
the LEAP program were not significant (Bliss et al., 2012). Different groups of students
may benefit from different retention programs, as indicated in the LEAP program.
A retention program may be conducted over the admission and orientation stages
of a student’s educational journey and may continue once the student has completed a
semester. Noonan, Lundy, Smith, and Livingston (2012) reviewed a retention program
that consisted of data collected prearrival, at orientation, and then while in the program.
This model included an academic warning system made up of preadmission data such as

27
admission GPA, required participation in the orientation program, and then peer tutoring
once students were on campus. This retention model was successful and retained a
higher percentage of students than did the preretention program (Noonan et al., 2012).
Engagement Programs
Many colleges use engagement of students as a method of retention. Davidson,
Metzger, and Lindgren (2011) found that when online students were intentionally
engaged in occasional face-to-face meetings and classes, students were able to interact
with one another, get support from the faculty, and obtain technology assistance. The
graduation rate of this program grew significantly after the introduction of the program
(Davidson et al., 2011). Another retention program also used face-to-face retention
strategies that included mentorship and technology support and also successfully retained
students at a higher rate than previous cohorts of students. This retention program was
specifically targeted to underrepresented, disadvantaged, and minority undergraduates
(Escallier & Fullerton, 2009).
Peer mentoring or other mentoring is a theme in the literature for retention
programs. Robinson and Niemer (2010) evaluated a peer mentor tutor program (PMTP)
put in place to retain nursing students in a BSN program. The PMTP groups met weekly
to collaborate on course content as well as time management, test-taking skills, study
strategies, and how to reduce stress and anxiety (Robinson & Niemer, 2010). Peer
support is seen as valuable by students. Mesues (2011) reviewed a program that also
used peers in retention. One of the four themes that emerged from this program was
strong networking, both formal and information, as a contributor to retaining students

28
(Mesues, 2011). Miller and Dalton (2011) evaluated a retention program that used
mentors from the student’s profession to instill leadership and the personal skills of a
clinician, the student’s desired occupation. The students indicated on a survey that this
type of mentoring was beneficial for understanding what would be expected of them as
clinicians (Miller & Dalton, 2011).
Other types of socializing have also been used in retention programs. Salazar
(2012) reviewed a retention program for postsecondary students who grew up in the
foster system and found that participation in extracurricular and college-sponsored social
events was an indicator of retention. While the Salazar study focused on nonacademic
socialization, other studies have focused on academic socialization. At-risk medical
students in South Africa were engaged in additional coursework and lengthened class
times for foundational topics in the hope of retaining them at a higher rate (Sikakana,
2010). In addition, writing seminars and opportunities to develop supplementary skills
such as study and examination skills were offered to the at-risk students. In a similar
study, underrepresented minority students and first-generation college students were
given additional assistance in a basic biology course (Harackiewicz et al., 2013). An
attempt to focus on positive factors rather than negative factors was purposely instilled in
students during the biology course (Harackiewicz et al., 2013). Both retention programs
were able to retain students at a higher rate than before the programs were put into place
(Harackiewicz et al., 2013; Sikakana, 2010). Finally, nontraditional students can also be
retained at a higher rate by engagement (Goncalves & Trunk, 2014). Students in this
study indicated that programs that are targeted for nontraditional students may help them
29
feel a sense of belonging. The engagement of students may require the college to target
the specific groups that are most likely to withdraw. Further understanding the reasons
why students leave will help to determine what services to offer.
Progression
Some students do not enter colleges and universities as at-risk students.
Sometimes during the student’s progression through their program of study, something
occurs that makes the student at-risk for attrition. Progression policies are one example
of retention efforts. Heroff (2009) described a retention program for students enrolled in a
BSN program. The retention program included the addition of a progression policy,
which indicated specific remediation activities for students who had not yet met program
standards. Academic indicators, such as GPA, are often included in progression policies.
A meta-analysis was done by Valentine et al. (2011) where most of the 19 studies
evaluated used GPA as a success indicator. Sophomore retention programs were one
example of retention strategies that occur once the student has taken courses at their
current institution. As indicated in a study by Sanchez-Leguelinel (2008), students had a
positive view of the retention program on campus, but the results of the retention
program did not indicate there was a significant relationship between the student’s
participation in the program and retention. The retention program needed to be changed
to ensure the students were both positive about the program and the program was
successful (Sanchez-Leguelinel, 2008). Valentine et al. (2011) also found no significant
difference in at-risk students who were in retention programs.

30
The addition or changing of course content may be done for retention purposes.
Focus groups were used in a study by Thomson and Hilton (2011) to obtain student
perceptions of a progression-focused retention program. Content was moved in the
curriculum in order to present it to students earlier rather than later in a physiotherapy
program. In this study, moving the content earlier in the program increased the student’s
learning and success later in the program (Thomson & Hilton, 2011). In a study
conducted by Pourshanazari, Roohbakhsh, Khazaei, and Tajadini (2013) it was content
delivery that was altered. Study skills were introduced in a basic level physiology course
and the results showed that students who were taught study skills performed better and
were retained at a higher rate than those who did not receive study skills during their
physiology course (Pourshanazari et al., 2013). Finding a solution to retention as
students progress through a program is another type of retention program.
Program Evaluation Based on Requirements (Legislative, Grant, etc.)
It is not uncommon in health care or education for regulations to change or
improvements to be made to current practice. As a result, programs change and then
evaluations may follow. In this research project, a program evaluation was needed to
determine if outcomes of a grant were being met. While the grant outcomes were not
being led by a legislative change, they were requirements set forth by the grant and
needed to be addressed appropriately. If a program evaluation had not been conducted,
providing evidence that the retention program was meeting the outcomes set forth by the
grant would be difficult. Program evaluations appear in the literature to address change
31
in regulations, whether they are dictated by grant requirements, changes from the
Department of Education, or another governmental agency.
When new regulations are introduced, sometimes a program evaluation is the best
method to determine whether the regulations are met or whether there needs to be
improvement. Morris and Hancock (2013) completed a program evaluation when new
competencies were established by the Institute of Medicine. The new competencies were
required for all health related programs, including nursing programs throughout the
United States. Evaluating the competencies was completed to determine what
competencies were present in the current curriculum and which competencies needed
additional attention (Morris & Hancock, 2013). Igbo et al. (2011) received grant dollars
from Health Resources and Services Administration (HRSA) to focus on a retention
program for at-risk students. In order to determine if the criteria for the grant and
outcomes stipulated by the grant were met, a program evaluation was conducted.
Transition From Student to Employee
Once the student has been retained through graduation as a student, a new
retention process begins. Employers want to retain their employees just as colleges and
universities want to retain students. Haggerty, Holloway, and Wilson (2013) reviewed a
new registered nurse retention program that was in place to help transition new graduates
of nursing programs into new nurses. A transition program was evaluated and while the
majority of students were satisfied with their experience in the program, there were still
some new nurses who were not satisfied (Haggerty, Holloway, & Wilson, 2013). This
evaluation found that the program had some very good retention strategies, while there

32
were other strategies that were not working for some of the new nurses (Haggerty et al.,
2013).
Implications
There are many possible outcomes that may occur as a result of this program
evaluation. One possibility is that a significant difference between the at-risk students
who received retention services and the at-risk students who did not receive retention
services, will indicate that the retention services offered are beneficial.
A second possible outcome may be that weaknesses in the retention program are
identified. If weaknesses are identified, the program evaluation results can be reviewed
at a higher level to determine what has contributed to this weakness. In addition, the
program evaluation will help identify areas of opportunity for future at-risk students.
While many institutions, including the Midwestern college, have developed
retention services in order to assist students, it is important to evaluate the services to
determine whether the correct services are offered to the correct group of students. Since
student needs differ, offering a wide array of services may increase the likelihood of
having the correct resources for each student. In addition, it is important to hire retention
staff that understands how to connect each student to services that will best support their
needs.
This evaluation may benefit several individuals and institutions. First, this
evaluation may benefit students who need assistance in addressing barriers to success in a
nursing program. Weaknesses or gaps in services can be identified in the current services
offered, therefore opportunities for improvement may be a benefit gained from a program

33
evaluation. In addition, colleges of nursing will also benefit from this evaluation as the
methodology may be duplicated to review or add services at any institution. Evaluating
retention services may help nursing schools increase graduation rates and first-time
NCLEX-RN pass rates.
Summary
Identifying at-risk students early in their college career can have an impact on
their ability to persist in an academic program. There have been many studies conducted
in the past indicating what makes students successful and what factors may impact
persistence. In addition, there are many studies that attempt to identify at-risk students
prior to failing a course or being on a probationary status. Remediation and retention
strategies at colleges and universities have been introduced to students who have been
identified as at-risk by the institution. The evaluation of retention services at the local
institution was conducted to determine if the services were making a difference in the
performance of at-risk students.
This evaluation compared two groups of students who are identified as at-risk by
the local institution. One group of at-risk students did not have access to retention
services because they attended their first and second semester prior to the availability of
retention services that were targeted specifically for at-risk students. The second group
of at-risk students was required to participate in prescribed retention services as part of a
grant received by the local institution. The two groups of students were compared to
determine differences between course completion rates, GPAs, and probations and
dismissals.

34
Section 2: The Methodology
Introduction
Evaluating retention services offered to at-risk nursing students was an attempt to
determine whether the retention services were effective. Using a mixed methods design,
I collected both quantitative and qualitative data in a formative evaluation using three
sources: the college, students, and the community. Retrospective data were collected
from the college’s database to obtain student GPAs, course completion rates, and receipt
of probation or dismissal letters. A survey was given to students who had received
retention services in order to collect their perceptions of the retention services and how
they assisted them in being successful. Finally, an interview took place with a key
informant in the community to obtain perceptions of how the college is able to fill the
needs of the community in relation to healthcare.
Research Design and Approach
I conducted a formative program evaluation that included reviewing retrospective
data of at-risk students, collecting information from current at-risk students who received
retention services regarding their perceptions on the effectiveness of the retention
services in promoting their success, and interviewing a key informant regarding the
perceptions of the community about the local college. A mixed methods approach was
used to combine both quantitative and qualitative data collection in a concurrent strategy.
Creswell (2012) described concurrent data collection in mixed methods research as
collecting data using the qualitative and quantitative methods simultaneously to better
understand the research problem. Since the retrospective data, survey data, and interview

35
did not rely on one another during data collection, they were collected separately, and did
not impact the results of one another.
Retention services at the local college had not been evaluated since their
inception, and collecting the data listed above provided information regarding the success
and perceptions of the current retention services, addressing all three key stakeholders:
the college, the students, and the community.
A program evaluation was designed to evaluate the retention services offered to
at-risk students. In this program evaluation, a mixed methods design was applied in
collecting both quantitative and qualitative data using a formative evaluation involving
three types of information: college information, student information, and community
information. Frye and Hemmer (2012) described conducting a formative evaluation as
collecting data while a program is taking place and sharing results from the collected data
with the program administrators so that changes can be made during the program. A
formative evaluation was chosen due to the timing of this project with relation to the
grant. As described in Patton (1982), the Evaluation Research Society Standards
Committee identified six types of evaluation that are defined by the type of evaluation
that is conducted as well as the types of activities conducted during the evaluation.
Formative evaluation is one of those six types identified and is further described as
finding methods for further improvement or management of a program (Patton, 1982).
Methods for improvement were determined by offering at-risk students a short survey to
evaluate the current retention services. Results will be communicated to the program
administrators in order to make changes to retention services, if necessary, in a white
36
paper format. The overall goals of this program evaluation included determining whether
students benefitted from the retention activities prescribed in the grant. Student GPA,
course completion rates, and the instances of probation and dismissal were also
evaluated.
Berk and Rossi (1999) suggested a seven-phase process of evaluation for
programs that are ongoing. Phase 1 includes determining whether the program is
reaching its intended participants (Berk & Rossi, 1999). Next, the evaluation determines
whether the program is being properly administered based on the population served,
followed by insuring that any funding is properly used (Berk & Rossi, 1999). Phase 4
involves evaluating whether the effectiveness of the program can be estimated, and Phase
5 evaluates whether the program was effective. Phase 5 was the primary focus of this
research, as the first 4 phases have been reviewed based on the receipt and requirements
of the grant. Phases 6 and 7 relate to evaluation after the effectiveness of the program has
been evaluated. Specifically, Phase 6 determines whether the program was cost-
effective, and Phase 7 moves the program into a bigger picture and involves asking
whether this program could be valuable for other populations (Berk & Rossi, 1999).
The most compelling justification for using a formative evaluation instead of a
different type of evaluation included the timing of the evaluation. As the evaluation was
conducted while the program was in progress, several types of evaluations were
eliminated. For example, a front-end evaluation takes place prior to the program’s
beginning (Patton, 1982). As this program had already begun, this type of evaluation was
not feasible. A second type of evaluation is the evaluability assessment, which involves
37
evaluating the ability to evaluate the program. This type of evaluation entails
determining whether it is feasible to conduct a more formative evaluation, so was not in
the scope of evaluation that was conducted (Patton, 1982). An impact evaluation is a
summative evaluation that involves evaluating the outcomes of a program at its
conclusion (Patton, 1982). As this program was not at its conclusion, it was not feasible
for this research to be a summative evaluation. A program monitoring evaluation was a
possible method of evaluation that might have been feasible for this study; however, I
sought to categorically check on participants in the program and whether the participants
were in compliance with policy (Patton, 1982). As this research was intended to seek
improvement based on services offered between two groups of participants, the program
monitoring evaluation was not the best match. Finally, an evaluation of the evaluation
was not a feasible program evaluation, as the program had not been evaluated in the past
(Patton, 1982).
Setting and Sample
A convenience sample was used to select the participants for gathering
retrospective data, as the students were already part of their respective groups. This
resulted in a sample size of 72 prelicensure nursing students. The population was
prelicensure nursing students. The sample included only prelicensure students enrolled in
the undergraduate nursing program due to the scope of this study. Fifty-four students had
access to retention services, while 18 students were in their first two semesters of the
prelicensure nursing program prior to the receipt of the nursing grant. Using G Power 3.1
software, the adequate sample size was calculated. Based on a .3 effect size and power at

38
.90, the sample size should have been 117. The sample size used in this doctoral study
was 72, which was not adequate.
Students attending the Midwestern college between Fall 2010 and Spring 2013
were selected by determining whether they met the criteria of an at-risk student and were
enrolled in an undergraduate nursing program for at least two semesters. A student may
be at risk for economic or educational reasons. Economically disadvantaged students are
identified as coming from a family with an annual income that does not exceed 200% of
the U.S. Census Bureau’s adjusted annual income (Nursing Workforce Development
Guidelines, 2010). Educationally disadvantaged students are identified as coming from a
high school with a lower ACT/SAT average than the state test results, coming from a
high school where 50% or fewer graduates attend college, having a diagnosed physical or
mental impairment that limits participation in educational experiences, being a person for
whom English is not the primary language and language is a barrier for academic
performance, being a person who is a first-generation college student, and/or coming
from a high school where at least 30% of enrolled students were eligible for free or
reduced-price lunch (Nursing Workforce Development Guidelines, 2010).
Convenience sampling was used by Yucha, Kowalski, and Cross (2009) to divide
a population of nursing students into two groups for the purpose of assigning students to
two different types of clinical groups. Although Yucha et al. did not use a retrospective
data collection method, convenience sampling was used because this group of students
was available to participate due to their enrollment in a clinical course. Convenience
sampling was used in this research because the students were or had been enrolled in the

39
nursing program during the semesters that were being evaluated. Random sampling was
not possible due to the retrospective design. Tipton et al. (2008) also used the
convenience sampling method in their retrospective study and divided the groups based
on their past performance. Convenience sampling allowed me to use the existing groups
of students to evaluate the difference between them depending on whether retention
services were available.
In order for students to be eligible for inclusion in this study, they must have been
in attendance for their first two semesters in the nursing program at the local institution
between the Fall 2010 and Spring 2013 semesters. In addition, the students needed to
meet the criteria determined by the grant to be eligible for inclusion in this study. The
group of selected participants was 78% female and 22% male. This gender distribution
differs from that of the local institution’s nursing program, which is currently 94.5%
female (Ramsden-Meier, 2012). Students were educationally disadvantaged,
economically disadvantaged as described by the grant, or both. The group of students
who received the retention services was larger than the group of students who did not
receive retention services. There were 54 students in this study who received retention
services and 18 students who did not receive retention services. The population included
six semesters of students, and retention services were offered for four of the six
semesters. Using further past students was considered, but the admission criteria of the
Midwestern college were consistent using this group of students. Only students who had
received retention services had the opportunity to take the survey related to their

40
perceptions of the retention services offered. Fifty-four students received the survey, and
one community member was interviewed.
Permission was granted from the chancellor of the local institution. Because
sensitive information, such as family income and grades, was needed from the student
database at the institution, all names were removed to ensure anonymity and privacy of
the students. Because these data were collected retrospectively, it was not possible to get
permission from students. In a retrospective study by Kruzicevic et al. (2012), data
collection was deemed exempt from student permission because the data were archival
and could be used for analysis. However, a data use agreement was entered into with the
chancellor of the local institution.
Participants in the survey and interview component of the study were given an
informed consent form explaining the purpose of the study and informing them that their
participation in the study was voluntary.
Data Collection
The overall goals of this program evaluation were to determine whether at-risk
students who received retention services had higher GPAs, better course completion
rates, and lower instances of receipt of probation and/or dismissal letters than at-risk
students who did not receive retention services. Another goal was to determine whether
the students perceived that the retention services that are offered were assisting them in
succeeding in the nursing program. An additional goal of this program evaluation was to
understand how the community perceived the college’s engagement in the community
with relation to preparing future healthcare providers.

41
In order to capture data regarding retention services from the three stakeholders—
the college, the students, and the community—three types of data were collected. First,
secondary data were collected based on students’ course completion rates, GPAs, and
receipt of probation and/or dismissal letters. These data make up the retrospective aspect
of the research design, as the data existed already in the college’s database, and I
reorganized the data for the purpose of this research. A survey was distributed to
students who had received retention services to determine their perceptions of the
services and how they viewed them as aiding their success in the nursing program. In
addition, the opinions of a community member were recorded to get an informant’s view
of how the community viewed the local college in relation to filling a need in health care.
The results from the three sources were presented to the college administration and the
grant administrators for review.
Retrospective Data
A program evaluation from the perspective of the college used a quasi-
experimental design using retrospective data. This method was used to evaluate
Research Questions 1 through 4, which were related to student GPAs, course completion
rates, and receipt of probation or suspension letters. As the at-risk students were grouped
as determined by the retention services available, random assignment was not possible
(Creswell, 2012). All students were enrolled for at least two semesters in a prelicensure
program between Fall 2010 and Spring 2013. The students were followed for two
semesters. GPAs were collected before entry into the nursing program and after the first

42
and second semesters of enrollment. Course completion rates and receipt of probation
and/or dismissal letters were collected for both Semester 1 and Semester 2.
The experimental group included at-risk students who enrolled in the prelicensure
nursing program after 2011 and received retention services. The control group used was
a historical control group composed of at-risk students who enrolled in the prelicensure
nursing program prior to 2011 and who did not receive retention services due to the
reasons mentioned above. These students did not have access to the retention services
because these services did not exist at the time the students were enrolled in the program.
Quasi-experiments are often used in educational settings when the research
involves groups that are already intact (Creswell, 2012). The quasi-experiment has been
used in other nursing education research. In a study by Yucha et al. (2009), students’
stress levels were measured to determine whether clinical assignment within one hospital
would decrease their anxiety when compared with students who did clinical rotations at
several clinical sites. However, the students were not able to be randomly assigned to
groups; this created a threat to the internal validity of the research, as there were selection
factors of the two groups that were not controlled (Creswell, 2012). According to Cook
and Campbell (1979) quasi-experiments required the researcher to review the potential
threats to internal validity and rule them out one by one.
Retrospective studies have also been used in nursing education research. Data
collection in retrospective studies can be accomplished using existing databases. Tipton
et al. (2008) used the retrospective design to review previous academic performance to
make predictions of future academic performance. A retrospective study was also used

43
by Kruzicevic et al. (2012) to determine predictors of academic success and reasons for
attrition in medical students. Retrospective studies have been used to collect past data in
order to evaluate whether changes in the educational setting have made an impact. The
limitations of a retrospective study are similar to the limitations of quasi-experiments: the
inability to randomly assign students to groups in addition to the disadvantage of working
with past data, which may be no longer relevant, compared to live data.
Several quasi-experimental designs were used to compare the experimental group
with the historical control group. A no-treatment control group design with pretest and
posttest was used to compare cumulative GPA before, during, and after entry into the
prelicensure nursing program. This type of design was used in order to rule out threats to
validity and to strengthen the proposed hypotheses (Cook & Campbell, 1979). As both
groups were enrolled in the same courses during their first two semesters in the
prelicensure nursing program, the difference between the two groups was that one group
received prescribed retention services and the other group did not. The no-treatment
control group may have moved in the same direction as the treatment group, but at a
different rate (Cook & Campbell, 1979).
A posttest-only design with nonequivalent groups was used to compare course
completion rates and receipt of a probation or dismissal letter. The posttest-only design
with nonequivalent groups was used because these data were not available prior to entry
into the nursing program. Pretest data for course completion rates and receipts of
probation or dismissal letters were not available due to the nature of the local institution.
As the local institution is an upper division institution and does not offer general

44
education courses, all students were transferring to the nursing program from various
institutions. Comparing course completion rates and instances of probation or dismissal
from many different institutions would have been inconsistent due to the various policies
regarding course completion requirements and probation and dismissal requirements.
At-risk students are identified during their first semester on campus; therefore
measuring the receipt of probation and/or dismissal letters from the nursing program is
not feasible in the scope of this proposal. The nonequivalent group of students was
identified by using the same at-risk definitions in place once the grant was in place. The
researcher used the criteria to identify those students who would qualify as at-risk in the
year prior to the addition to retention services. The potential threats to using the posttest
only design include the inability to evaluate the student’s potential prior to the retention
services. While the admission criteria of the college give guidance to the standards the
students must meet to enter the prelicensure nursing program, admission criteria do not
give a clear picture of the student’s abilities prior to receiving the benefits of the retention
services.
A retrospective cohort method was used to collect the data from Fall 2010
through Spring 2013. Factual information was collected from the college’s database.
Factual information is described by Creswell (2012) as data that is obtained from school
records that provide information on a population. The first step of data collection
included determining which students were considered at-risk based on the definition of
at-risk students defined above. Reports were run from the college’s database to include
the students who met the at-risk criteria. Once the at-risk students were identified, a

45
spreadsheet was created using the college’s database in order to collect data on the
variables that were defined in the research questions. An excel spreadsheet was used to
record the data that were collected. The data were stored on a password and firewall
protected server. Once the data were compiled, any identifying student information was
deleted. An example of the spreadsheet is in Appendix G.
All students who met the at-risk criteria were included in the study, including all
full-time and part-time students. Students enrolled in the nursing program at this college
are enrolled as a cohort, so all students take the same courses throughout the nursing
curriculum. All pre-requisite nonnursing courses are completed prior to taking any
nursing courses. It is possible that students may take nonnursing elective courses during
the semester. Nonnursing elective courses will not be taken into consideration for this
research.
The dependent variables that were measured included course completion,
semester and cumulative GPAs, and the receipt of a letter of probation or a letter of
dismissal. Table 1 identifies the variable, and explains how it was measured and when it
was measured.

46
Table 1
Study Variables for Archival Academic Data
Variable
Type of variable
How is it measured?
When is it measured?
Course completion ratio Percentage. Number of courses completed divided by the total number of courses.
At the conclusion of semester one and at the conclusion of semester two.
Admission GPA ratio Cumulative GPA upon admission.
Prior to taking courses at Midwestern college.
Semester One GPA ratio Semester GPA using only semester one nursing courses.
At the conclusion of semester one.
Semester Two GPA ratio Semester GPA using only semester two nursing courses.
At the conclusion of semester two.
Cumulative GPA at conclusion of Semester Two
ratio Cumulative GPA using semesters one and two nursing courses.
At the conclusion of semester two.
Receipt of letter of probation
nominal Review of academic file to determine if student was placed on probation during semester one or two.
At the conclusion of semester two.
Dismissal nominal Review of academic file to determine if student was dismissed during semester one or two.
At the conclusion of semester two.

47
A no-treatment control group design with pretest and posttest was used to
compare cumulative GPA before, during, and after entry into the nursing program. A
posttest-only design with nonequivalent groups was used to determine the number of
students from each group that completed each enrolled course, received a probation or
dismissal letter, and semester and cumulative GPA. Data collected regarding semester
and cumulative GPAs were measured using a ratio scale. An interval scale, or continuous
scale, makes the assumption that there are equal distances between each of the intervals
(Creswell, 2012). The GPAs collected ranged between 0.0 and 4.0.
Data collected regarding whether a student completed courses in which they were
enrolled and data regarding whether a student received a letter of probation or dismissal
were measured using a nominal scale. Nominal scales, or categorical scales, are used to
provide a category from which to choose the characteristic of the variable (Creswell,
2012). For this study, the percentage of courses completed were tracked and ranged from
0% - 100% and students either received a letter of probation or dismissal or did not
receive a letter of probation or dismissal.
The independent variable that was measured was whether or not the at-risk
student received retention services. Undergraduate nursing students who met the at-risk
criteria and who enrolled during the Fall 2011 or after were invited to participate in the
NWD Scholars opportunity. Qualified students were offered a monthly stipend for
adhering to all NWD Scholar activities, which includes retention services via mail by
grant administrators prior to the beginning of the student’s first semester at the
Midwestern College. Attendance is taken at the seminars and that information is

48
forwarded to the grant administrators. Students who did not comply with the attendance
requirements were omitted from this study. In addition, students who were identified as
at-risk but turned down the opportunity were omitted from this study. Full-time students
are required to attend four seminars each year, but may attend as many as they wish. For
the purpose of this study, student’s success was tracked for two semesters.
Data were scored by recording the dependent variable information into a
spreadsheet. The course completion data indicated the percentage of courses the student
completed during the second semester of enrollment. The two semester GPAs indicated
the student’s performance during their first and second semester of enrollment. The
cumulative GPA indicated the student’s performance on all coursework taken during the
nursing program through their second semester of enrollment. This GPA was compared
to the student’s cumulative GPA prior to entering the nursing program and to the
semester GPAs. If a student has received a probation letter, this will indicate that the
student’s GPA has dropped below an acceptable level and is on notice for dismissal. If
the student has been dismissed, this indicates that the student has not been able to obtain
an acceptable GPA and no longer qualifies to be a student at the Midwestern college.
The data that were collected are often used in the evaluation of success in
academic programs and are considered reliable measurements. Reliability is defined as
scores that are stable and consistent (Creswell, 2012). Carrick (2011) uses student
outcomes, such as GPA, to determine the effectiveness of nursing education. In a study
by Kruzicevic et al. (2012) the researchers used GPA, dismissal, and course completion
as standards to determine success in passing medical exams and graduation rates.

49
Although probation was not specifically identified, this measurement is determined by
the student’s GPA and the course completion.
The measurements that were used for this study: GPAs, course completion, and
probation and dismissal notices are valid measurements. Creswell (2012) defined
validity as the use of the instrument to measure what it is intended to measure. GPA,
course completion, and probation and dismissal notices are intended to determine the
success of students. As discussed in the above paragraph, these are common measures of
student success and have been used as valid measures in previous studies.
Student Perception Data
A survey was used to collect data to evaluate the perceptions of students currently
receiving retention services. The type of survey used was a cross-sectional survey
design. Creswell (2012) defined a cross-sectional survey design as a survey that is given
at one point in time to gather participants’ viewpoints at that moment. Creswell (2012)
also described cross-sectional surveys as useful tools in program evaluations for their
ability to provide information to decision makers regarding future plans for a program.
The survey was sent to students via email, and was created using SurveyMonkey.
This survey is an existing tool that has been used to gather self-reported information from
students to measure student perceptions on engagement. The survey included 11
questions which measured the students’ responses on a 5-point Likert scale. A Likert
scale is described in Creswell (2012) as an interval scale which provides continuous
responses for participants that have an assumed equal distance between each choice.
Scores from the survey will range from 1 to 5, with “1” representing strongly disagree

50
and “5” representing strongly agree. Four additional open-ended questions asked for the
participant’s perceptions regarding what was useful, and which retention strategies were
not used. In addition, participants were asked to recommend additional resources for
future students.
The population of students who were eligible to receive this survey included only
students who had received retention services. Students who were identified as at-risk but
who had not received retention services were omitted from the list of recipients. All
students who had received retention services received the survey through email. Students
were also reminded of the survey through the researcher in person or by phone. The
population included at-risk students enrolled at the Midwestern college. Fifty-four
students received retention services, and 22 students responded to the survey. Students
who have received retention services were asked to take an anonymous survey in order to
gain insight into whether they perceive the retention services as positive influences on
their academic performance.
Students were asked to sign a consent form (see Appendix B) which indicated the
student’s participation was voluntary. The survey entitled Survey of Student Perceptions
of Support Services, Persistence, and Belongingness (Appendix C) was an existing tool
that has been used to gather self-reported information from students to measure student
perceptions on engagement (Reiner, 2012). Scores from the survey ranged from 1 to 5,
with “1” representing strongly disagree and “5” representing strongly agree. Scores can
range from 11 to 55. If a survey result is closer to 11 than to 55, this indicates the student
does not perceive that the retention services are assisting in their success in the nursing

51
program. However, if a survey result is closer to 55 than to 11, this indicates the student
perceives that the retention services are assisting in their success in the nursing program.
Survey responses were initially recorded in Microsoft Excel, and then later transferred to
SPSS. Descriptive statistics were used for each question to determine the opinions of the
at-risk students who have received retention services.
The survey used in this research is a collection of two surveys that were merged
together to form the Survey of Student Perceptions of Support Services, Persistence, and
Belongingness (Reiner, 2012). Dr. Reiner merged the two surveys during research, and
granted permission to use this survey (see Appendix D). The two surveys were tested for
internal consistency by the original creators. The first survey, adapted from a tool
developed by Johnson et al. (2007) established face validity for the survey by consulting
with two survey development experts and 15 living-learning program administrators
regarding the clarity of questionnaire development. In addition, the survey was piloted in
2001 and 2003 with students from five separate universities (Johnson et al., 2007).
“Tests of consistency (Cronbach’s alpha) on the instrument developed by Johnson, et al.
ranged from .62 to .90” (Reiner, 2012, p. 55). The second survey was developed by
Hoffman, Richmond, Morrow, and Salamone (2003) and included questions related to a
student’s perceived sense of belonging to their college or university. In order to develop
face validity, once the 85-item survey was developed using the literature, the researchers
held 24 focus groups consisting of 15-30 students in each group. The students in the
focus groups took the survey, assessing the survey items for relevancy, clarity, and
conciseness and changes were made to items as necessary (Hoffman et al., 2003). “The

52
Kaiser-Meyer-Olkin measure of inter-relatedness for this instrument was calculated at
0.92” (Reiner, 2012, p. 55).
Since the students who receive retention services are identified at-risk students
and are part of the NWD grant, I have access to this list due to my position at the
Midwestern college. The students can be accessed by their college-issued email address.
Creswell (2012) indicated that a 50% response rate is often published in leading
education journals. A three-phase procedure was followed, adding additional steps in an
attempt for a higher return rate. The three-phase procedure included notifying students in
advance of the survey, sending the survey, and then sending a follow-up to the survey
(See Appendix B). The additional steps proposed included a verbal reminder to students
to complete the survey.
There were 54 students who had access to retention services since Fall 2011.
Surveys were sent to all 54 students who had received retention services. Eight emails
were returned as undeliverable. Phone calls were made to the students who had invalid
emails, and two additional correct emails were obtained. Of the 54 students who received
the survey, 48 students had valid emails. Three follow-up emails were sent to the students
requesting their participation over a four week time period. Twenty-two students
completed the survey, which is a 40.74% return rate. This return rate was lower than
expected, possibly because many of the students who had received retention services
during their first and second semesters had already graduated.

53
Community Interview Data
A one-on-one interview was conducted in order to gain insight from a key
informant of the community’s perspective of the Midwestern college’s role in preparing
for the future in healthcare. Creswell (2012) described a one-on-one interview as a form
of survey collection where the researcher meets with an individual and collects responses
to prepared questions. A semistructured interview was conducted. The semistructured
interview included a list of prepared questions, but allowed for additional questions or
dialogue during the interview as topics flowed in the conversation (Creswell, 2012).
The interview with a key informant was conducted to determine what perceptions
the community held with regards to the Midwestern college and its role in health care,
offering services to at-risk students, and assisting in opportunities or gaps in the
community. The Midwestern college is a community oriented organization, and meeting
the needs of the community is part of its mission. Seven open-ended questions were
discussed with the key informant during the interview process, although additional
questions were added during the conversation. The consent form and interview guide are
referenced in Appendices E and F.
The interviewee was a human rights leader in the Midwestern community, and
serves as a member of the college’s diversity council. The community informant has
been involved in many college and community activities and can speak to community
issues and viewpoints. The informant also has enough working knowledge of the
college’s mission, goals, and actions to understand the connections between the college
and the community and can provide insight on the community’s behalf of strengths and

54
opportunities. I have served as a representative on a community committee with this
individual for approximately 5 years, and had a professional relationship with the
community member for 5 years. I approached this individual for input as we move
forward in planning future programs and services, and he agreed to the interview. The
interview took place at the informant’s office, where the informant would feel more
comfortable and able to focus on answering my questions. After the interview, I typed
the notes and emailed them to him to check the content. Creswell (2012) suggested that
member checking is one way to validate findings from an interview. To validate the
dialogue in this interview, I sent the key informant a typed version of our interview and
asked that the information be confirmed.
Data Analysis
Once data were collected in the spreadsheet, they were transferred to SPSS. The
data were reviewed to assure that they were entered accurately and that no data were
missing. This process is called cleaning data, and is described by Creswell (2012) as
inspecting data for values that appear to be missing or outside of the range. The SPSS
spreadsheet that was used to contain the data could be sorted in order to find data entered
that was outside of the range. In addition, I sorted for missing data to ensure that all data
were entered.
Using SPSS software, inferential statistics were used to determine the significance
of the difference between at-risk students who had not received retention services as
compared with at-risk students who had received retention services. Inferential statistics

55
are used when comparing two groups, reviewing the differences in the scores between the
two groups and making inferences based on the differences (Creswell, 2012).
Inferential statistics are used to determine whether the scores obtained by the
sample group are significant enough to make inferences to the entire population
(Creswell, 2012). When testing a hypothesis, researchers set a confidence level that
determines whether it is likely or not that the results obtained in the sample group can be
generalized to the larger population (Creswell, 2012). Tipton et al. (2008) used
inferential statistics in their research studies to determine if there was a statistically
significant difference in students’ nursing course grades and passing NCLEX-RN on the
first attempt. In addition, inferential statistics were used to determine if there was a
statistically significant difference between student’s stress levels and their clinical
assignments (Yucha et al., 2009). In this research, inferential statistics were used to
determine if there was a statistically significant difference in student’s course completion
percentages, semester, and cumulative GPA, and receipt of a probation notice or
dismissal notice, and their use of retention services. Students were placed in groups
depending on whether or not they had the opportunity to participate in retention services.
In addition, one key informant from the community was interviewed to gather the
perceptions on the efforts of the Midwestern college to fulfill the needs of the prepared
nurses in the community. The perceptions of the interviewee recorded below are
included to address Research Question 6. The key informant was purposefully selected
due to the role played in the community and knowledge of the Midwestern college and
the students, faculty, and staff. Purposeful sampling is defined as selecting an individual

56
based on the information they hold (Creswell, 2012). A one-on-one interview took place
in person and included open-ended questions from an interview guide (see Appendix F).
I asked the interviewee permission to record the interview. Once the interview took
place, I transcribed the interview and sent it to the interviewee to check its accuracy.
This process is called member checking (Creswell, 2012). The key informant’s
perceptions provided information relevant to Research Question 6.
The data analysis approach I used for the interview was coding process. Coding
process is referred to by Creswell (2012) as a method to make sense out of text by
dividing it into categories or subcategories. I took notes of the interview on a computer;
therefore the typed notes were available for immediate review. As I reviewed the notes, I
noted what pieces of the text could be coded together because they were related.
Creswell (2012) also noted that often as the interviewer reviews the notes multiple times,
the codes may increase and get more detailed. The quantitative data in this doctoral study
represented a larger proportion of the data and the qualitative data were used as an
additional resource.
As described earlier, the research questions and the corresponding hypotheses,
and null hypotheses were as follows:
Research Question 1: Did at-risk students who received retention services have a
significantly higher percentage of passed courses than at-risk students who do not receive
retention services?

57
H1a : There is a significant difference in the percentage of passed courses
between at-risk students who have received retention services and at-risk students who
have not received retention services.
H10: There is no difference in the percentage of passed courses between at-risk
students who have received retention services and at-risk students who have not received
retention services.
Research Question 2: Did identified at-risk students who received retention
services have a significantly higher semester and cumulative GPAs than at-risk students
who do not receive retention services?
H2a: There is a significant difference in semester and cumulative GPAs between
students who have received retention services and at-risk students who have not received
retention services.
H20: There is no difference in semester and cumulative GPAs between at-risk
students who have received retention services and at-risk students who have not received
retention services.
Research Question 3: Were identified at-risk students who received retention
services on probation significantly less than identified at-risk students who do not receive
retention services?
H3a: There is a significant difference of instance of probation between at-risk
students who have received retention services and at-risk students who have not received
retention services.
58
H30: There is no difference in probation status between at-risk students who have
received retention services and at-risk students who have not received retention services.
Research Question 4: Were identified at-risk students who receive retention
services dismissed significantly less than at-risk students who have not received retention
services?
H4a: There is a significant difference of instance of dismissal between at-risk
students who have received retention services and at-risk students who have not received
retention services.
H40: There is no difference in dismissals between at-risk students who have
received retention services and at-risk students who have not received retention services.
Research Question 5: How did students rate their retentions services on the
Survey of Student Perception of Support Services, Persistence, and Belongingness?
Research Question 6: What perceptions were offered by the key informant
regarding how the Midwestern College supports students towards degree completion?
Results
The gender and age of the participants were included for descriptive purposes.
Eighteen at-risk students were included in the group that did not receive retention
services. This included 17 females (94%) and one male (6%), and their average age was
28.0 years. Fifty-four at-risk students were included in the group that received retention
services. This included 39 females (72%) and 15 males (28%) and their average age was
29.94 years. An independent samples t test was conducted to evaluate whether student
age for the groups was equal. The test was not significant, t(70) = 1.02, p = .31. A chi-

59
square test was conducted to determine whether there was a difference in gender between
groups. The results of the test were significant, χ² (1, N = 72) = 3.86, p = .05. When
describing the age of the participants, the mean age was calculated between group one
and two to compare whether the groups were similar, while when describing the gender
of the two groups, a percentage was calculated to compare the two groups. When
describing the groups further with respect to the independent variables used to identify
students based on economically or educationally disadvantaged, Table 2 indicates the
descriptive statistics that were used and whether the test was parametric or
nonparametric.
Table 2
Results of Archival Academic Data
Variable Group 1 - Received retention services
Group 2 - Did NOT receive retention services
Total Test statistic Sig level
Parametric/ Nonparametric test
Research question
Percentage of passed courses at conclusion of semester two
96.59% 94.17% Not calculated t = .648 p = .52
nonparametric RQ 1
Cumulative GPA at enrollment
3.14 2.98 3.11 t = 1.492, p = .140 parametric RQ 2
Semester GPA at end of semester one
3.27 3.20 3.30 t = .504, p = .616 parametric RQ 2
Semester GPA at end of semester two
3.26 3.26 3.26 t = -.002, p = .998 parametric RQ 2
Cumulative GPA at end of semester two
3.30 3.20 3.28 t = .881, p = .381 parametric RQ 2
Number of students on probation at conclusion of semester two
7.4% 22.2% Not calculated χ², p= .083 nonparametric RQ 3
Number of students dismissed at conclusion of semester two
3.7% 5.6% Not calculated χ², p= .733 nonparametric RQ4

60
In the first research question, an independent samples t test was done to determine
if the percentage of courses completed was significantly different between the at-risk
students who received retention services and the at-risk students who did not receive
retention services. The scale used for both the first and second research questions were
ratio scales. In measuring both percentages of courses completed and GPAs, there are
equal distances between units. Creswell (2012) describes ratio scales as having a true
zero and having equal distances between units of measure.
An independent samples t test was conducted to evaluate the hypothesis that at-
risk students who received retention services had a significantly different percentage of
passed courses than at-risk students who did not receive retention services. Although the
percentage of courses passed by at-risk students who received retention services was
higher than the at-risk students who did not receive retention services, there was no
significant difference, t(70) = .648, p = .52. The mean of courses passed by at-risk
students who received retention services (m = 96.59%, sd = 14.23) was not significantly
different from the mean of courses passed by at-risk students who did not receive
retention services (m = 94.17%, sd = 12.17).
For the second research question, a repeated-measures ANOVA test was used to
determine whether there was a significant difference in the means of GPAs over time
between at-risk students who had received retention services and at-risk students who had
not received retention services. Repeated-measures ANOVA tests may be useful when
the same measure is observed over time under different conditions (Green & Salkind,
2011). A one-way within-subjects ANOVA was conducted. The dependent variable was

61
grade point average (GPA) measured four times: upon admission to an undergraduate
nursing program, after semester one of the nursing program, after semester two of the
nursing program, and the cumulative GPA at the conclusion of semester two. The
independent variable was whether or not the at-risk student received retention services
during semesters one and two of the nursing program. The means and standard deviations
for GPAs are presented in Table 3. The one-way repeated measures ANOVA was
calculated comparing the GPAs of participants four times: before admission, after
semester one, after semester two, and the cumulative GPA at the conclusion of semester
two (see Figure 1). The ANOVA showed that no significant effect was found, F(2.00,
135.68) = 6.69, p = .11). No significant difference existed among GPA means before
admission, after semester one, after semester two, and the cumulative GPA at the
conclusion of semester two. At the conclusion of semester two, the two groups of
students’ semester GPA’s were almost identical, regardless of whether the student
received retention services or did not receive retention services. This may indicate that
retention services assisted students more effectively during the first semester than later in
the nursing program. This may also indicate that retention services are the most effective
for students at the beginning of a program than they are later in the program.

62
Table 3
Means and Standard Deviations of GPAs
Received retention services Mean Standard
Deviation
N
Pre-Nursing GPA No 2.98 .32 18
Yes 3.14 .43 53
Semester GPA end of
semester one
No 3.20 .56 18
Yes 3.34 .44 54
Semester GPA end of
semester two
No 3.26 .40 18
53 Yes 3.26 .47
Cumulative GPA end of
semester two
No 3.20 .52 18
Yes 3.30 .38 53
Repeated-measures ANOVA require a test for sphericity (Tabachnick & Fidell,
2007). Sphericity can be defined as measuring the correlation scores between the
dependent variables that occur over time to determine if they are similar. Since
correlations are more likely to be similar between variables that are measured closer
together in time, Mauchley’s test can determine sphericity. If there is a violation of
sphericity, additional statistical tests can be used to correct for the error (Tabachnick &
Fidell, 2007). Using Mauchley’s test statistic, sphericity can be either significant (p <
.05) or nonsignificant (p > .05). Mauchley’s test was run, and the result was p < .001.
This means that in this study, Mauchly’s test statistic is significant and it is reasonable to
conclude that the variances of the difference between GPAs are not significantly
different.

63
Figure 1. Difference in GPAs between groups.
The third and fourth research questions measured a category within a group
comparison. A chi-square test was used since the research question was measuring a
category within a group comparison of one independent variable and one dependent
variable (Creswell, 2012). The scale used for the third and fourth research questions
were nominal scales because the data were categorical. Creswell (2012) described
nominal scales as having categories from which to choose to determine the characteristics
or traits and have no order.
The chi-square test was done in Research Question 3 to determine whether at-risk
students who received retention services were on probation less often than students who
did not receive retention services. Of the 54 students who received retention services, 50
3.144
3.3402
3.2636 3.2989
2.9794
3.1967
3.2639 3.1972
Pre-Nursing GPA Semester GPA end ofsemester one
Semester GPA end ofsemester two
Cumulative GPA endof semester two
Received Retention Services Did Not Receive Retention Services
64
students were not on probation and four students were on probation. Of the 18 students
who did not receive retention services, 14 students were not on probation and four
students were on probation. An independent chi-square test was conducted to assess
whether at-risk students who received retention services were less likely to be on
probation during semesters one and two in the nursing program than at-risk students who
did not receive retention services. The results of the test were not significant, χ² (1, N =
72) = 3.00, p = .08. The proportion of at-risk students who received retention services
who were not on probation was greater than the proportion of at-risk students who did not
receive retention services, however the result was not statistically significant.
The chi-square test was done in Research Question 4 to determine whether at-risk
students who received retention services were dismissed less often than students who did
not receive retention services. Of the 54 students who received retention services, 52
students were not dismissed and two students were dismissed. Of the 18 students who
did not receive retention services, 17 students were not dismissed and 1 student was
dismissed. An independent chi-square test was conducted to assess whether at-risk
students who received retention services were less likely to be dismissed during
semesters one and two in the nursing program than at-risk students who did not receive
retention services. The results of the test were not significant, χ² (1, N = 72) = .12, p =
.73. The proportion of dismissed at-risk students who received retention services was
fewer than the proportion of dismissed at-risk students who did not receive retention
services, however, the result was not statistically significant.
65
Student Survey Results
The survey data were used to determine whether at-risk students perceived
retention services have assisted them in the nursing program. The survey was conducted
using a cross-sectional survey design. This type of survey design is described by
Creswell (2012) as surveying a group of individuals to gather their perceptions at one
point in time. SurveyMonkey was used for the collection method, and data were moved
to SPSS for further analysis. Student responses to this survey reported below address
Research Question 5.
Of the 54 students who were eligible to take the survey, 48 of them had valid
email addresses on file. Twenty-two students responded to the survey, including 15
females, and 6 males. One respondent did not answer this question. Question 2 asked
the respondents how many credit hours they had completed to date. Fourteen students
responded to this question, and the answers ranged from 37 to 100. Some respondents
did not answer with a numeric response, but indicated “graduated” or “too many to
count.”
Scores from the survey can range from 11 to 55. If a survey result was closer to
11 than to 55, this indicated the student did not perceive that the retention services were
assisting in their success in the nursing program. However, if a survey result was closer
to 55 than to 11, this indicated the student perceived that the retention services were
assisting in their success in the nursing program. Final scores on this survey ranged from
17 to 55. The average score was 44.23. Based on the Likert scale used, the average score
for all questions of 4.02 fell between the responses agree (4) and strongly agree (5). The

66
mode score was 55, and the median score was 43. Table 4 reflects the mean and standard
deviation for each survey question.
Table 4
Summary Survey of Student Perception of Support Services, Persistence, and
Belongingness, N = 23 Survey Question Mean Std. deviation
I feel comfortable seeing the NWD advisor about my academic progress and coursework. 4.27 0.91
I believe the support services mentioned above (tutoring, retention seminars, NWD advisor and retention coordinator) are important to my academic progress. 4.23 0.73
I believe offering these support services demonstrates that my college supports me. 4.23 0.90
I feel comfortable meeting with the retention coordinator. 4.18 0.98
I feel comfortable using tutoring services and retention seminars to assist me in my coursework. 4.18 0.89
Meeting with the retention coordinator is helpful. 4.14 0.99
Tutoring/retention seminars are helpful. 4.09 0.79
I believe using these services (tutoring, retention seminars, NWD advisor, and retention coordinator) have already helped me achieve academic success. 4.09 0.73
Meeting with the NWD advisor is helpful. 4.00 0.95
I intend to return to the Midwestern College next semester. 3.59 1.56
I believe my experience using the services (tutoring, retention seminars, NWD advisor, and retention coordinator) have influenced my decision to return to the college next semester. 3.41 1.27
Although all but two questions received scores between 4.0 and 5.0, which
correlates to agree and strongly agree, the highest score received in the survey (4.27) was
in answer to the question “I feel comfortable seeing the NWD advisor about my academic
progress and coursework.” Two additional questions that also scored high (4.23) were “I
believe the support services mentioned above (tutoring, retention seminars, NWD

67
advisor, and retention coordinator) are important to my academic progress,” and “I
believe offering these support services demonstrates that my college supports me.”
The two questions that did not receive a mean score of at least 4.0 included “I
intend to return to the Midwestern College next semester” and “I believe my experience
using the services (tutoring, retention seminars, NWD advisor, and retention coordinator)
have influenced my decision to return to the college next semester.” As will be discussed
in the limitations section, these questions no longer had the same relevance because most
of the at-risk students who received retention services had already graduated from the
Midwestern College. Therefore, their intent to return to the college was likely due to
graduation, not because of academic issues.
Community Key Informant Interview Results
Several themes emerged from the interview notes. The most common themes
included student/personal responsibility, family responsibility, and community
responsibility. The interviewee discussed the importance of those three types of
responsibilities and how their alignment is essential to the success of at-risk students.
Student/personal responsibility was the theme that emerged most frequently
during the interview. “If you think the student is not successful, you wonder, did they
have a realistic grasp of what is entailed in completing the program of study? Did they
give it their all? Did they use resources?” The interviewee discussed the personal
characteristics of students he knows, and described their most powerful characteristic as
persistence. “They came in with a high intelligence level to allow adaptation into the
profession.” The interviewee also indicated it is important for students, regardless of

68
what profession he or she might pursue, to learn how to take personal responsibility for
what is important to them.
Family responsibility was a second major theme that emerged from the interview.
“We want the babies (children) to have a fighting chance, then we will focus on the
structural constraints later, but it starts in the home and in the community.” The theme
of family responsibility went hand in hand with both personal responsibility and
community responsibility. In fact, the three themes, personal responsibility, family
responsibility, and community responsibility need to connect in order for our young
people to be successful.
The final major theme from the interview was community responsibility. While
the focus of this theme included the Midwestern college’s commitment to the
community, there were also suggestions on how families and communities need to work
together. The interviewee suggested that academic preparation needs to happen very
early. “Head Start programs are the current start, but we need more of them. Not all
parents read to their children. We need to transfer our social values to our children and
plant the seed of desire for our children to succeed.”
In addition, the interviewee discussed the role of the Midwestern College in
supporting students academically as well as socially. While the interviewee believes that
the college is improving in its relationships with at-risk students, there is room for
improvement. Since the Midwestern college is community oriented, it has an obligation
to continue its outreach to the community it serves.

69
Assumptions, Limitations, Scope, and Delimitations
Certain assumptions were made regarding the populations that were studied. The
first assumption included that the groups of students were similar to one another. Since
the Midwestern college’s admission criteria were the same between Fall 2010 and Fall
2013 admissions, the student’s characteristics should have been similar to one another.
In addition, as part of the data analysis, I conducted an analysis on the groups’
characteristics, such as gender, age, and admission GPA to demonstrate that the groups
were similar.
In addition to the assumptions listed above, there were assumptions made with
regards to statistical tests. There is a possibility that the sample used does not accurately
represent the population, which is called a sampling error (Creswell, 2012). Another
assumption that was made is that the results of this research had the characteristics of a
normal curve. A confidence level of .05 was used; however, this means there is still a
possibility of error in the results.
Potential weaknesses of this program evaluation included the broad definition of
educationally or economically at-risk students. It is possible that there were students who
fit into the definition of educationally or economically at-risk, but have performed
exceptionally well despite their circumstances. These participants may have impacted the
outcomes of this study by making the results of retention services appear to have a
positive effect on at-risk students when they may not have. In addition, although all
identified at-risk students are required to participate in the same retention services, it is
70
likely that some did not take away the intended value that other participants took away
from the services.
Another weakness is the low response rate from the survey sent to at-risk students
who had received retention services. Since many students who had received retention
services had already graduated from the Midwestern College, some of the email
addresses were invalid. Although phone calls were made to potential participants with
invalid email addresses, only two of the eight potential participants returned phone calls
or provided a valid email address.
Delimitations of this study include the omission of evaluating the perceptions of
the retention services by the participants through interviews. For the scope of this project
study, I sought input from the participants through a questionnaire and while I did receive
some valuable feedback from the students, it was limited regarding their perceived value
of the retention services offered.
Limitations of Evaluation
Limitations of this program evaluation included, as discussed earlier, the
possibility that there were students who have been classified as at-risk students who have
overcome obstacles without the assistance of retention services, therefore skewing the
results. In addition, it was also possible that since this program evaluation was conducted
at the Midwestern College at which I am employed that I have insight into the possible
outcomes of this evaluation and may not be able to be as objective as an external
evaluator. However, an external evaluator also has challenges. External evaluators may
have had difficulties establishing trust at the institution and the stakeholders in the

71
program may have felt as though an external evaluator did not have enough knowledge
about the setting to understand the program to make a valuable evaluation (Creswell,
2012).
An additional limitation is the small population of students who were available to
participate in this doctoral study. Of the students who were identified as at-risk students
and offered participation in the grant funding, 54 students agreed to participate. In
addition, there were only 18 students who were at-risk students admitted during the fall
2010. Finally, the response rate to the survey was not adequate. As discussed in the
results section, using G Power 3.1 software, the adequate sample size was calculated.
Based on a .03 effect size, and power at .90, the sample size should be 117. The sample
size used in this doctoral study was 72, which was not adequate.
Protection of Participants
A variety of methods were used to protect the data collected on the participants.
This doctoral study was approved by Walden University’s Institutional Review Board as
well as the Midwestern college’s Institutional Review Board and permission to conduct
the study was granted. Participants in the survey and interview component of the study
were given an informed consent form explaining the purpose of the study and informing
them that their participation in the study was voluntary. To help participants understand
the voluntary nature of their participation, the consent form indicated that they could
withdraw their participation at any time, and there would be no reward for participation
or punishment for nonparticipation. The informed consent form for the survey is

72
included in Appendix B and the informed consent form for the key informant interview is
included in Appendix E.
In addition, a data agreement was in place with the Midwestern college, and the
only individual with access to the data was me. Due to my position within the
Midwestern college, I already had access to the database where all relevant data were
stored. The participant’s names were removed from the data as soon as all of the data
were collected. During the time when the participant’s names were attached to the data,
the data were stored on a password and firewall protected server. After the data were
compiled, any identifying student information was deleted. Data were stored
electronically on my personal drive on the Midwestern college’s server, which is
password and firewall protected. After the five year minimum, all data containing
identifying student information will be deleted from its electronic location.
Recommendations
In the evaluator role during this program evaluation, several recommendations
were identified. Included are recommendations for pre-college programming, and the
continuation of retention services. In addition, there is a recommendation for an added
service that may increase retention as well as updates to how and when retention data are
collected from students and how “at-risk” students are defined.
The first recommendation is the continuation of nurse camp for at-risk high
school students in this community. This program has been a great opportunity to bring
high school students from diverse backgrounds to campus and immerse them in the
nursing profession for 6 weeks. This program also provides instruction in math and
73
science skills so the students can excel in future classes that are essential for high school
success and entry to college. The students who attend nurse camp are given a stipend,
which is key for initial enrollment in the program. Although nurse camp is free for
attendees, the stipend is offered to students so they do not feel they need to choose
between attending nurse camp and working during the summer months.
An additional recommendation involving nurse camp is to have reunions annually
to reconnect the students with one another and with the campus. An attempt to keep
these potential nurses connected may help motivate the students to stay on track for high
school success and to continue in college-bound high school classes. Mentoring these
students after they have graduated from nurse camp may also encourage them to take
courses at community colleges while a high school student. Nurse camp advisors could
assist these students with the process on enrolling in college-level courses during their
junior and senior years in high school.
Since the timing of when surveys were collected from students was not ideal, it is
recommended to add questions regarding student perceptions of retention services to the
exit interview that is conducted by the department dean. Changing the timing of the data
collection may result in a higher return rate, therefore including the perceptions of more
students.
The definitions used for “at-risk” students and “success” were very broad in this
doctoral study. It is recommended that more specific definitions be used, and students
classified in levels, such as “very at-risk” and “somewhat at-risk” and that the levels of
success also be broadened to include “passed class,” “graduated” and “passed NCLEX-

74
RN.” This may assist in determining future retention services for students who come to
the Midwestern college with multiple “at-risk” identifiers when compared with students
who have only one or two identifiers.
Although the results of archival data did not indicate there was a statistically
significant difference between at-risk students who received retention services and at-risk
students who did not have access to those services, the survey results indicated a positive
view of the services offered and of the college for offering services. Retention services
have expanded since their inception, and should continue to do so based on the needs of
the students. It is recommended that an evaluation of archival data continue each year.
In addition, conducting a survey of the students who received retention services is also
recommended to ensure the services offered are used and that students feel positively
about the services.
An additional recommendation is to add an advising or mentoring component to
retention services. Students who have received the grant dollars have been assigned to
the same advisor. As the students move beyond semesters one and two in the nursing
program, the addition of peer advising or mentoring may also benefit retention rates of
this group of students. This addition will take resources, as the advising or mentoring
will need to be developed, advisors or mentors will need to be trained, and someone will
need to monitor the program. This could result in additional staff in the office of
retention services.
Finally, including retention services in orientation activities may promote the
services to students who may not otherwise take advantage of them. Asking students to

75
identify what helps them succeed academically and connecting those successes to the
services offered in the retention office may help the students understand the purpose of
the retention office. The word “retention” sometimes creates a negative connotation.
Renaming the office may also help with a more positive view of the services offered.
Conclusion
This research was conducted to determine whether there was a difference between
at-risk students who had received retention services and at-risk students who did not
receive retention services. To investigate this question, a formative program evaluation
was done to determine the differences between the two groups of students in GPA, course
completion rate, and instances of probation and dismissal. The design was a
retrospective quasi-experimental study, which included data from the Midwestern
college’s database. Using the data collected, the researcher determined whether a
significant difference existed using t tests, a one-way repeated measures ANOVA and
chi-square. In addition, the students who had received retention services were surveyed
to determine if they perceived that the retention services helped them succeed in the
nursing program. Finally, a member of the community was interviewed to obtain their
viewpoint on the contribution the Midwestern College was making to health care in the
community.
As part of the doctoral study project, results were compared with the outcomes of
a grant received by the Midwestern college to determine whether the outcomes were
being met. The results comparison with the grant outcomes were reported to the

76
stakeholders of the Midwestern college in a white paper format. The stakeholders can
use this information to determine the future of the retention services offered.

77
Section 3: The Project
Introduction
This project study was an evaluation of retention services offered at a Midwestern
college, which targeted students who were considered educationally or economically
disadvantaged. The program evaluation was designed to determine whether the retention
services offered to educationally or economically disadvantaged students improved the
students’ GPA and course completion rates or lowered the instance of probation and
dismissal. A formative evaluation design was used to determine possible opportunities
for future at-risk students. A mixed methods design was used to collect data.
Quantitative methods included collecting archival data regarding the students’ grade
point averages and instances of probation and/or dismissal. In addition, a survey link was
sent to students via email to collect perceptions of the retention services available.
Qualitative data included an interview of a key informant in the community to determine
the perceptions of the community regarding the Midwestern college. The findings of the
data collected were generated to give the Midwestern college feedback regarding past
student success and perceptions as well as to find opportunities for improvement for
future students.
Description and Goals
As part of my project study, I developed a program evaluation of retention
services offered to at-risk students enrolled in a prelicensure nursing program at a
Midwestern college. The program evaluation was developed to determine whether the
retention services offered by the college were increasing the likelihood of success of

78
identified at-risk students. Success was defined in several ways, including the student’s
percentage of passed classes, first and second semester GPAs, and instances of probation
or dismissal. In addition, a survey was presented to students who had received retention
services to determine their perceptions of the services offered. Finally, an interview was
conducted with a key informant to gain insight on the perceptions of the community
regarding the Midwestern college. The results of the program evaluation will be
presented to the grant administrators as an evaluation report. The goals of the evaluation
report are to communicate the results of the program evaluation and provide data relevant
to the retention services offered and the impact on the students who received those
services. In addition, the evaluation report will include feedback from students who have
received retention services, feedback from a community member, as well as
recommendations that I formed while completing this program evaluation.
Evaluation Report
A formative evaluation design was used in this project study due to the nature and
timing of the evaluation. Frye and Hemmer (2012) described a conducting a formative
evaluation as collecting data while a program is taking place and sharing results from the
collected data with the program administrators so that changes can be made during the
program. While retention services were developed, implemented, and paid for as part of a
grant, the retention services were designed to continue indefinitely. The evaluation was
conducted to determine whether the at-risk students who received retention services had a
higher percentage of passed classes and higher semester GPAs during their first and
second semesters, as well as whether they were less likely to be on probation or
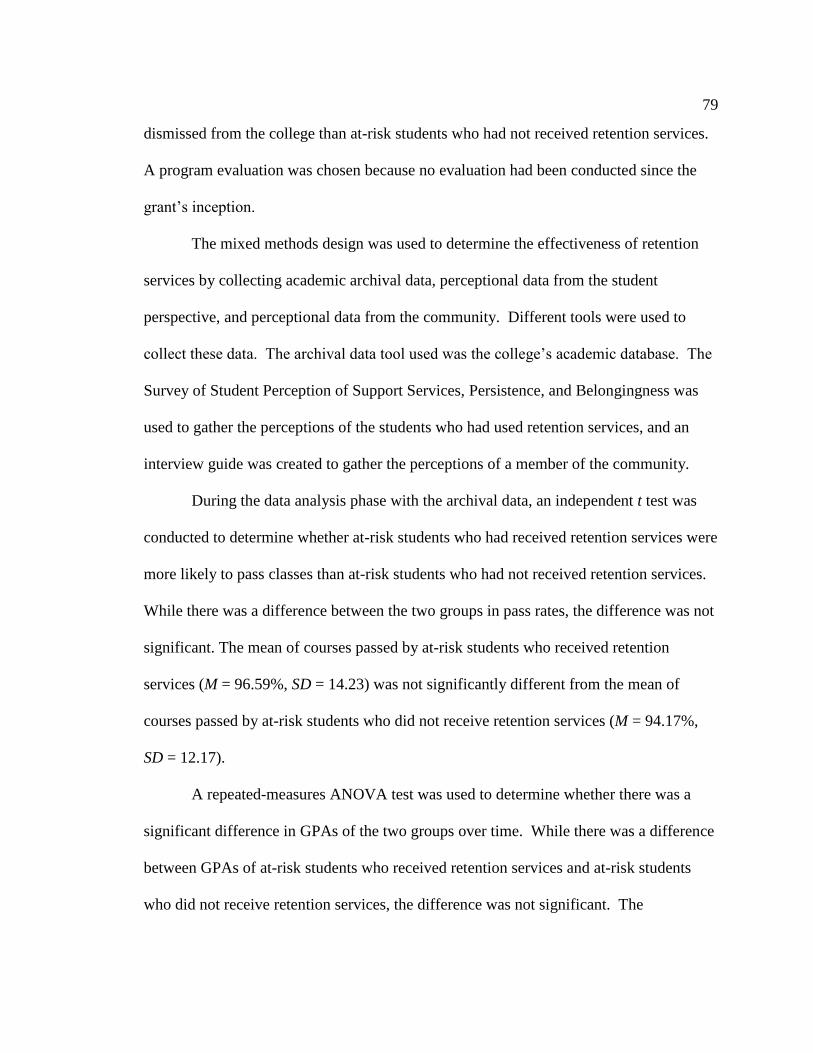
79
dismissed from the college than at-risk students who had not received retention services.
A program evaluation was chosen because no evaluation had been conducted since the
grant’s inception.
The mixed methods design was used to determine the effectiveness of retention
services by collecting academic archival data, perceptional data from the student
perspective, and perceptional data from the community. Different tools were used to
collect these data. The archival data tool used was the college’s academic database. The
Survey of Student Perception of Support Services, Persistence, and Belongingness was
used to gather the perceptions of the students who had used retention services, and an
interview guide was created to gather the perceptions of a member of the community.
During the data analysis phase with the archival data, an independent t test was
conducted to determine whether at-risk students who had received retention services were
more likely to pass classes than at-risk students who had not received retention services.
While there was a difference between the two groups in pass rates, the difference was not
significant. The mean of courses passed by at-risk students who received retention
services (M = 96.59%, SD = 14.23) was not significantly different from the mean of
courses passed by at-risk students who did not receive retention services (M = 94.17%,
SD = 12.17).
A repeated-measures ANOVA test was used to determine whether there was a
significant difference in GPAs of the two groups over time. While there was a difference
between GPAs of at-risk students who received retention services and at-risk students
who did not receive retention services, the difference was not significant. The

80
cumulative GPA at the conclusion of the second semester for at-risk students who
received retention services was 3.30, which was greater than the 3.20 cumulative GPA of
at-risk students who did not receive retention services.
Chi-square tests were used to determine whether at-risk students who received
retention services were on probation and dismissed less often than at-risk students who
did not receive retention services. Again, the results indicated that at-risk students who
received retention services were on probation or were dismissed less often than at-risk
students who did not receive retention services; however, the results were not statistically
significant.
During the data analysis phase with the survey data, a one-sample statistical test
was conducted to determine the mean and standard deviation of each question. Nine of
the 11 questions received scores between 4.0 and 5.0, which correlates to agree and
strongly agree. Finally, coding was used in the interview data to determine themes
throughout the interview, which included personal responsibility, family responsibility,
and community responsibility.
As retention services had not been evaluated since their inception in the fall of
2011, the evaluation report will provide data that will speak to strengths and weaknesses
in existing retention services and will offer recommendations for future programming. In
a study conducted by Casstevens, Waites, and Outlaw (2012), a retention program for
nontraditional students was evaluated. A formative evaluation was conducted to
determine whether support group meetings for Master of Science in Social Work (MSW)
students increased their perception of social support. When the formative evaluation took

81
place, very few students were attending the support group meetings. Due to evaluating
this retention effort, it was discovered this tactic was not increasing the students’
perceptions of social support, as was intended. In this study, the evaluation process was
important in order to identify weaknesses in the retention program and to move forward
with different tactics (Casstevens et al., 2012). The evaluation report in the current study
was designed to identify tactics that were increasing retention and tactics that were not
having an impact. The evaluation report will address the statistical findings so that the
staff of the retention office can make data-based decisions for future retention services.
Review of the Literature
In order to obtain information related to this program study, several literature
searches were conducted. Databases used to conduct the literature review included
ERIC, MEDLINE, CINAHL, Nursing & Allied Health Source, Health and Medical
Complete, PubMed, and Academic Search Complete. Terms used in the search for
literature focused on program evaluation and evaluation reports. This review of
literature is organized to include formative evaluations, recommendations for program
evaluators, evaluation reports, and using evaluation reports to impact policy.
Formative Evaluation
Darussalam (2010) indicated that all programs need to be evaluated in order to
determine whether they are effective or not effective. A program evaluation can be
defined as understanding the program well enough through information gathering and
review to determine what is contributing to the success of the program and any possible
improvements (Frye & Hemmer, 2012). A program evaluation can be conducted before
82
beginning a program; in the middle of a program, as in this research; or at the conclusion
of a program. The most compelling reason for using a formative evaluation in this study
was the timing of the evaluation. A formative evaluation is described as finding methods
for further improvement or management of a program (Patton, 1982). As the retention
services will be offered to students moving forward, it was the most logical type of
evaluation to conduct.
As discussed in Section 2, the Evaluation Research Society Standards Committee
has identified six types of evaluation that are defined by the type of evaluation that is
conducted as well as the types of activities conducted during the evaluation (Patton,
1982). Formative evaluation is one of the six types of evaluations described. Other types
of evaluation include front-end evaluation, evaluability assessment, impact evaluation,
program impact evaluation, and evaluation of the evaluation (Patton, 1982). Based on the
six types of evaluation identified previously, the formative evaluation was the most
logical choice.
A formative evaluation was conducted by Enterkin, Robb, and McLaren (2013) in
order to determine whether leadership training was effective for training potential ward
leaders. After the first cohort of students went through the training, a change was made
due to the evaluation of the program by that cohort. In addition, a formative evaluation
process was used in an evaluation of a distance-based chemistry laboratory (Brewer,
Cinel, Harrison, & Mohr, 2013). After a group of students took a distance-based
chemistry lab, an evaluation was done of their experiences in order to make changes to
future distance-based lab sections. Another study involved students enrolled in a

83
residency program for family practice who were required to do a simulation experience
as part of the residency. As the program progressed, a formative evaluation method was
used to determine whether the simulation was effective (Curran et al., 2012). The
formative evaluation model used in all three of these evaluations had an impact on how
the program continued for future students or residents.
Although none of the evaluations described above eliminated parts of the
respective programs, there were changes made. Leadership training was changed to a
more accommodating time for the participants (Enterkin et al., 2013). The distance-
based chemistry labs underwent changes in several of the separate experiments to ensure
that students’ distance labs would result in intended outcomes just as an on-ground lab
would (Brewer et al., 2013). The simulation done by residents in a family practice
program determined that the simulation was effective, but moved it in the curriculum
placement to use for the first exposures to family practice rather than using it throughout
the residency (Curran et al., 2012). If a formative evaluation process had not been used,
each of these evaluations would have continued to use an ineffective method during the
evaluation.
A program evaluation can provide data that will help determine whether a
program is doing what it should be doing. Frye and Hemmer (2012) described a program
evaluation in terms of having enough understanding of a program to ask questions related
to the program that will determine its success. This program evaluation was conducted in
order to determine whether retention services were effective and whether the goals and

84
outcomes of a grant were being met. As the retention services had not been evaluated in
the past, it was important to find out whether the program was succeeding.
There are many models of program evaluation. While the grant received by the
college has specific goals and objectives, there are many other outcomes that can be
determined by evaluating the retention services. Through data collection, the formative
evaluation model is used to determine whether the program can be improved (Patton,
1982). Although the intent of this program evaluation was to help determine whether the
goals of the grant were met, the evaluation has also brought forth information that is not
part of the grant’s goals and outcomes. Sandahl (2010) conducted a program evaluation
to determine whether a collaborative testing environment would increase testing scores.
While increased testing scores were the goal of this program evaluation, additional
information was learned about collaborative testing that might not have been learned had
no program evaluation taken place. Other information was gleaned from this study,
including the finding that students who tested collaboratively fostered knowledge, critical
thinking skills, and group process skills (Sandahl, 2010). The formative evaluation model
allows the evaluator to make recommendations about what might make the program
better (Patton, 1982). Part of the rationale for conducting a formative evaluation in this
doctoral study was to include improvements to the current structure of retention services.
Research-Based Recommendations for Program Evaluators
Effective program evaluations are done by asking the right questions. Haji,
Morin, and Parker (2013) discussed the importance of asking questions regarding
program evaluation that extend beyond whether or not a program achieved the outcomes

85
put in place prior to the program evaluation. Understanding that there is worth beyond
the intended purpose of a program evaluation opens the doors to determine what is
happening within programs and why certain strategies within programs are working or
not working (Haji et al., 2013). In this doctoral study, while the hypotheses were not
supported by the archival data collected, there were growth opportunities for retention
services. Even though the hypotheses were not supported, there are still lessons to learn
with regards to the retention services at the Midwestern college. Once the decision has
been made to conduct a program evaluation, determining the best outline to follow can be
an important first step.
There is other literature that indicates that an effective evaluation asks questions
that go beyond the program’s identified outcomes. A medical ethics course was
evaluated to determine whether attendance in the course had a long-term impact on
physician ethics (Parran, Pisman, Youngner, & Levin, 2013). This course had specific
outcomes related to the future performance of physicians; however, additional
information was gathered from this program evaluation that was not an identified
outcome. Another study reviewed satisfaction of MBA programs worldwide. Very
specific questions were delivered by survey to MBA students to determine specific
information regarding processes, academics, support services, and socialization. Through
this semistructured survey, the researchers also gained information that went beyond the
outcomes of this study (Bentley, Selassie, & Shegunshi, 2012).
In a peer-mentoring program among researchers in Canada, Furimsky, Arts, and
Lampson (2014) discovered that although their program evaluation had clear outcomes,

86
interactions between the two people in a mentoring situation are not always predictable.
The physicians who took part in the medical ethics course mentioned above also created
their own outcomes and wrote about them in a reflective summary after the course was
completed (Parran et al., 2013). Similarly, the information gained from the students in
the MBA programs not only indicated a high level of satisfaction with the program, but
also indicated that the worldwide sample used to evaluate the program was aiding in the
evaluation of global eLearning (Bentley et al., 2012). All three of these studies are
examples of how program evaluations often evaluate far more than the outcomes of the
program.
Once the outline of the program evaluation has been determined, the researcher
must then determine the methodology. In this program evaluation, a mixed methods
design was used, and both quantitative and qualitative data were collected. In the
literature, there were several studies that used mixed methods to conduct a program
evaluation. In a study by Wallis and Kennedy (2013), standardized tests, participant
observations, and group interviews were used to collect data for the evaluation of a
training program that was designed to promote retention in nurses. The results were two-
fold, because this evaluation involved reviewing the success of nurses as a group, as well
as the success of retaining individual nurses. The researchers found that if the group was
not successful at retention, it was less likely that the individuals within that group would
be successfully retained (Wallis & Kennedy, 2013).
In this study, student perceptions were collected by using a survey to determine
the success of retention services. Other studies have also used self-assessments to

87
determine the success of a program. In a study by Hosseini, Ghalamkari, Yousefshahi,
Mireskandari, and Rezaei Hamami (2013), a survey was used to determine whether a
training program for cardiopulmonary-cerebral resuscitation (CPCR) was more
successful using a problem-based method or a lecture-based method. The participants in
the CPCR training were asked to do a self-assessment after their training, and the self-
assessment was the same for both groups of participants. The researchers found that the
participants who attended the problem-based training rated themselves as more
knowledgeable than the participants of the lecture-based training (Hosseini et al., 2013).
The researchers also found that self-assessment scores were high based on the students’
perceptions of retention services. While self-assessment scores may not be as black and
white as standardized tests, the information can be useful for evaluations.
Literature indicates that program evaluations typically follow a specific plan,
regardless of the type of program evaluated. Patton (1982) suggested that many times
evaluations begin with specific objectives, but as the evaluation is conducted, additional
information materializes. Patton (1982) focused on goal-free evaluations, and while this
is not a goal-free evaluation, important information has come to light that goes beyond
the goals of the evaluation. In a program evaluation conducted by Spielberg et al. (2011),
an initial evaluation plan was formed regarding mobile outreach and HIV testing and
motivating individuals in an at-risk community by bringing the screening to them. The
evaluation plan that was formulated in a study by Dudek et al. (2012) included specific
training of how to complete clinical evaluations of students in a clinical-based course.
The plan used by Dando, d’Avray, Colman, Hoy, and Todd (2011) was to evaluate the

88
integration of students in multiple health care disciplines to work together during clinical
experiences. In all three examples, the program evaluation had a specific plan in place
prior to the program evaluation taking place.
The evaluation conducted by Spielberg et al. (2011) did show positive results
regarding reaching out to a population that historically did not go to a static site for HIV
testing. The clinical evaluation training done in the Dudeck et al. (2012) study was also
reported as a success. After attending a faculty development workshop to perform
clinical evaluations, the scores of the evaluations represented the impact of the workshop
on the faculty’s ability to be trained in assessment. As the evaluation of integrating
students from multi-disciplinary health care programs concluded, the students
participating indicated a better understanding of how the different facets of a health care
team work together (Dando et al., 2011). The student’s responses to this program were
positive for students, faculty, and staff. All three of these program evaluations as well as
the program evaluation in this doctoral study began with an evaluation plan in place to
conduct the evaluation in a structured way to make sure the information was useful for
the future.
Once the methodology and evaluation plan are in place, data collection for the
program evaluation can begin. Using a variety of methods of data collection can make
the evaluation richer and more in-depth. Patton (1982) indicated that a mixed methods
approach is less vulnerable to error since using only one method relies so heavily on that
one source. Using multiple methods allows for multiple perspectives. Sandahl (2010)
used a mixed methods approach and collected data which included using scores from

89
standardized tests as well as the perceptions of nursing students who were exposed to
collaborative testing. In addition, in an evaluation by Brewer et al. (2013), the data
collected included quantitative data from laboratory reports and quiz scores as well as
qualitative data collected from reflective journaling while evaluating how taking a lab
course online would compare with taking a face-to-face on-ground lab course. Haan,
Britt, McClellan, and Parks (2010) used course evaluation results to describe the
perceptions of students who completed course evaluations and the expectations that the
evaluation process was their voice in curriculum. The evaluation done in this research
project also used a mixed methods design to include both quantitative data, including
student GPAs and course completion ratios, and qualitative data which included student
and community perceptions of the Midwest college.
In the evaluation of collaborative testing conducted by Sandahl (2010), there was
no statistically significant difference between students who experienced testing
collaboratively and students who tested on their own. However, qualitative data
regarding the student’s perceptions of collaborative testing were very positive and the
students felt they learned more and had positive interactions with their classmates. The
positive interactions are an asset for nurses to acquire prior to working in hospital or
clinic settings (Sandahl, 2010). Similarly, in the evaluation conducted by Brewer et al.
(2013), the quantitative data were not statistically significant for students who completed
the distance chemistry lab when compared with students who completed the face-to-face
lab. However, students reported increased satisfaction with the distance chemistry lab, as
it allowed them more freedom for completion during a time that best fit the student’s

90
schedule. Haan et al. (2010) also indicated that students were satisfied with the input
they had in coursework due to the course evaluation process. In the evaluation done in
this doctoral study, the quantitative research was not statistically significant with regards
to student performance, however, the student and community perceptions were positive.
This indicated that while statistically significant differences were not found with regards
to the data analysis, the positive nature of the participants should be taken into
consideration.
The results section should include both findings as well as recommendations
(Patton, 1982). It is important for the findings to be presented clearly and separately
from the recommendations. The findings that are presented are based on the evaluation
that was conducted and presents the data that were collected. Presenting these data in
graphs and tables allows the stakeholder audience to have a vision of what the data
showed. Recommendations are not the same as data. The recommendations may be
made based on the data presented, but they are opinions of the evaluator regarding what
might improve the program given the data presented (Patton, 1982). Including the
findings prior to recommendations will allow the audience to first understand the facts of
this evaluation followed by opinions of the evaluator based on the facts. Enterkin et al.
(2013) presented results in a study about preparing future unit leaders in a hospital that
was inclusive of both findings and recommendations. Another study focused on
increasing retention for students enrolled in a doctor of physical therapy program by
implementing a student success program (Noonan et al., 2012). The results section in
this study also included both the findings as well as recommendations for program

91
improvement. Kenny, Kidd, Nankervis, and Connell (2011) highlighted both findings
and results from a questionnaire prior to discussing the recommendations in their study
involving differences in nursing education for mature students. Finally, Curran et al.
(2012) presented results in both graph and table form by using findings as well as
recommendations in the study conducted using simulated labs in a family practice
program. The sequence of the presentation is important to gain the trust in the audience
presenting the evaluation results prior to delivering recommendations (Curren et al.
2012).
Evaluation Reports
According to Young et al. (2012), evaluation reports are most helpful when
presented using visual aids as well as verbiage so the audience is able to visualize the
results of the research. While response rates, descriptive, and inferential statistics are
necessary, simple graphs and tables can be understood if your audience has not had
statistical training (Young et al., 2012). An evaluation report was submitted to the United
States Department of Education (2013) by the Institute of Education Sciences and was
organized to include both detailed statistical information as well as visual aids.
Understanding the audience who will receive the evaluation report is important in order
to make sure the findings of the evaluation are communicated effectively.
The format of the different evaluation reports reviewed had a similar template.
The evaluation report includes an executive summary, background, and design, findings
of the evaluation, tables and figures, a reference list, and appendices (United States
Department of Education, 2012; United States Department of Education, 2013; United

92
States Department of Education, 2014). While there were variations in the evaluation
reports, there were consistent themes that can be used as part of the evaluation report
submitted to the Midwestern college.
Using Evaluation Results to Impact Policies
In order to make changes and keep resources in retention services, the evaluation
report must present the information in a compelling way. While the archival data were
not statistically significant in this study, there were data to support that retention services
have an impact on students. The survey delivered to students who had received retention
services evaluated the services positively and the community member indicated that
support for at-risk students was noticed in the community. These aspects of the
evaluation indicate the positive impact retention services have on students and the
reputation of the college in the community. One way to gain the support of program
directors or other stakeholders in the continuation and improvement in retention services
is to keep them informed.
There is literature indicating that minority or underrepresented students have
unique retention needs. Muma and Pries (2010) were able to address the ethnic, racial,
and social representation among healthcare workers in a predominately white community
with the results of their program evaluation. After receipt of a Workforce Diversity
Grant, an evaluation was conducted to determine how the grant enhanced training
culturally competent students, the number of minority or underrepresented healthcare
workers serving as preceptors or faculty members of a Physician’s Assistant program and
whether the number of minority and/or disadvantaged applicants rose. Ultimately, the

93
goal was to graduate more minorities and/or underrepresented Physicians into the local
workforce (Muma & Pries, 2010). Another study specifically addressed African-
American men in a retention program seeking to assist the students during their first year
of college (Brooks, Jones, & Burt, 2013). This study also focused on the importance of
minority or underrepresented students finding a connection on campus as a tool for
success. Similarly, Strayhorn, and DeVita (2010) investigated what the specific
educational needs of African-American males were and how they were met differently at
historically black colleges compared with other types of institutions. Kramer, Roemer,
Liljenquist, Shin, and Hart (2014) evaluated a program that encouraged at-risk students to
determine barriers and address them on their own.
McGonagle et al. (2014) reviewed a program called “STRONG-CT” in
Connecticut that attempted to increase the interest in minority and underrepresented
students into the Science, Technology, Engineering, and Mathematics (STEM) majors.
The retention program in this study focused on psychological variables such as self-
efficacy, sense of belonging, stress, and study habits. Another study focused on
International student success when studying nursing in a new country. After retention
issues were identified, a retention program was developed called “Opportunity for
Success” (Arieli & Hirschfeld, 2013). This retention program was similar to the Brooks
et al. (2013) study as it identified that a connection to campus was a necessary aspect of
success. Grant funding was also used to develop a program that is similar to the program
at the Midwest College and similar to the programs by Arieli and Hirschfeld (2013) and
Brooks et al. (2013). The scholars program focused on mentoring African American
94
students in STEM fields (Kendricks, Nedunuri, & Arment, 2013). Historically at this
college, the number of STEM degrees awarded to African Americans had been declining.
Muma and Pries (2010) reported that the results from their study indicated an
increase in cultural competency, exposure to clinicians that are underrepresented in the
Physician Assistant profession, and the number of minority or underrepresented
applicants increased. Brooks et al. (2013) had similar positive results. There was a
statistically significant difference between African-American males with regards to
academic acculturation and in the mentor/mentee relationships that were evaluated in this
study compared to others that were not receiving these services (Brooks et al, 2013).
Students in the “STRONG-CT” program performed better academically than the control
group (McGonagle et al., 2014).
Arieli and Hirschfeld (2013) found that the implementation of “Opportunity for
Success” was a benefit to the International students on campus. While there was not a
comparison group with which to compare, the International students’ performance was
better than the International students’ prior to the inception of this program (Arieli &
Hirschfeld, 2013). Strayhorn and DeVita (2010) were also able to find specific niches
where African-American males were more successful, although the type of institution
was not what the researchers hypothesized. These men had better success at a master’s
institution and the least success at liberal arts colleges. Using self-identification
strategies, Teens making Activity and Environmental Modifications (TEAM) taught the
individuals to identify the systematic barriers and determine what modifications or
strategies they could use to help address the barriers (Kramer et al., 2014).

95
Kendricks et al. (2013) found that the African American students who received
stipends from the grant evaluated the mentoring services positively. Results of this study
also indicated that students gradually improved in STEM courses over the semester, with
the greatest improvement shown during the last 5 weeks of the semester (Kendricks et al.,
2013). While minority and underrepresented student retention is most predominant in the
literature regarding retention rates in postsecondary institutions, there have been other
groups of students who may be considered at-risk and may need special services in order
to be successful. This includes nontraditional students, second year students, and
students who have been unsuccessful in the past.
Casstevens et al. (2012) indicated that the needs of a nontraditional student differ
from traditional students because they are often juggling families, work as well as school
responsibilities. Using a formative evaluation process, the institution determined that
offering optional services to this group of students was counterproductive (Casstevens et
al., 2012). Students who have been unsuccessful in the past, either due to withdrawal or
failing a course, are also at-risk. Peer tutoring was implemented for this group of at-risk
students, and the goal of peer tutoring was to offer academic and emotional support
(Bryer, 2011). Kennedy-Phillips and Uhrig, (2013) also found a group of students who
were at-risk. Sophomore students at campuses where first-year programs were in place
sometimes felt abandoned which created a retention issue.
While none of these studies indicated that the students felt a lack of connection
with the college or university, as the minority or underrepresented students felt, there was
mention of connection with faculty members or mentors (Bryer, 2011; Casstevens et al.,

96
2012; Kennedy-Phillips & Uhrig, 2013). Evaluations of these groups were quite
different. The nontraditional students indicated there was not a significant impact on
their success that could be tied to the retention services offered (Casstevens et al., 2012).
However, the evaluation done with peer mentors and second year students did indicate an
impact on retention with increased faculty involvement and mentorship (Bryer, 2011;
Kennedy-Phillips & Uhrig, 2013). Retention programs are often unique to a specific
population of students, and when evaluations of the programs are done then changes can
be made to increase their effectiveness.
Often, when services are developed for any group of students, other students not
considered at-risk may benefit as well. Fontaine (2014) evaluated a retention program
that was in place for all students on campus where the goal of the retention program was
to increase graduation rates of a nursing program. After the evaluation, it was determined
that the biggest impact of the retention services was the mandatory orientation prior to
arriving on campus. Other services such as peer-counseling, tutoring, community nurse
mentoring, and academic planning were not all mandatory programs (Fontaine, 2014).
Results indicated that some of the retention services offered did increase the graduation
rates, but not all of the activities expected to increase graduation rates did so. The
evaluation of this program may be increasingly useful if subgroups were evaluated to
determine if certain groups of students benefited from the retention services, therefore
increasing the graduation rates of those groups.
97
Implementation
Resources and Existing Supports
Since the inception of retention services and receipt of the grant, the services
which support at-risk student success have increased. Although grant funding ended in
October 2014, retention services will continue at the expense of the college. This means
that many of the services that were initially paid for by grant dollars have now been
absorbed into the college’s operating budget. The evaluation report will report success
indicators and data that will help the Midwestern college make decisions regarding what
services may be attributed to student success. In addition, the evaluation report will
report perceptions of the students who received retention services and will include the
comments made by the community member who was interviewed.
Resources needed to continue with the existing retention services include funding
that will be both indirect and direct. The indirect costs will be the salaries of the
individuals who have the most contact with the students who are considered at-risk.
While the salaries will be paid to these employees regardless of whether the grant tactics
are maintained, this does mean that additional employees may be needed to assist with
the additional services that are offered. The individuals whose salary, at least in part, has
been paid for by the grant include the Office of Diversity Services Coordinator, the
Retention Coordinator, and the Financial Aid Coordinator. Portions of each of these
individuals’ salaries were charged to the grant over the last three years. The retention and
financial aid offices have or will have to hire additional staff within the next year to
ensure the workload is manageable.

98
Additional resources include the maintenance fees for retention aids, such as
Tutor.com and StudentLingo. While the upfront costs for these types of retention aids
were initially paid for with grant dollars, maintaining them will be part of the required
resources needed to continue with the existing services. Finally, student scholarships and
stipends will also be part of what was previously funded in the grant that will now either
be eliminated or will be a part of the college’s operating budget.
Potential Barriers
Potentially, the largest barriers for the continuation of retention services will be
the funding that comes from the college’s operating budget and the ability to find
employees for the retention office. If the scholarships and stipends are not funded, then
part of the grant’s intent will be compromised as students may need to work additional
hours to make up for the money. In addition, with the increased visibility of the retention
office by at-risk students, additional employees are needed to cover the demand. If
trained employees cannot be found, this could also be a barrier for the continuation of
retention services.
Proposal for Implementation and Time Table
The evaluation report will be distributed to the leadership of the Midwestern
college by the end of 2014-2015 academic year. The report will include the suggestion
for continuous evaluation and inclusion on the college’s assessment plan so retention
services can be evaluated annually. In order to be included on the college’s assessment
plan (CAP), outcomes of retention services will need to be linked to the goals of the
college. This will require discussion and collaboration with the college’s Coordinator for
99
Institutional Research and Effectiveness. The recommendation will be for inclusion of
retention services on the CAP for the 2015-2016 academic year.
The implementation of other retention services, as presented to the leadership of
the Midwestern college will ultimately be determined by that group. Since this college’s
budget cycle is done in a calendar year and not an academic year, most services have
already been budgeted for during the 2015 year. Budgeting for 2016 will begin in June
2015, so I will encourage the leadership team to make final decisions by the end of May
2015. I will include suggestions for continuation of certain retention programs and
possible adjustments in other retention programs.
Roles and Responsibilities of Students and Others
The roles and responsibilities of others are defined in the evaluation report. Many
of the responsibilities will fall upon the Retention Coordinator since retention services are
based out of the retention office. In addition, some responsibility will also fall on the
Director of Student Services, as the director in charge of retention services and retention
staff. Faculty also play a key role in retention services, as it is often necessary that
students are identified by the faculty and referred to the retention office for assistance.
Very few students self-identify and seek out services offered in the retention office on
their own. In Spring 2014, 75% of students were referred by a faculty member while
only 25% of students sought services on their own.

100
Project Implications and Social Change
College Implications
The implications of this program evaluation for the Midwestern college are to
continue to develop resources for at-risk students. In addition, while meeting the needs
of at-risk students, the needs of all students attending this college can be met. Retention
services and the retention office have grown since the grant was received in 2011. Part of
the growth is due to recognition of a retention office on campus. Initially, the retention
services were developed for students who received grant funding due to an at-risk status.
However, opening these services to the greater student population as well as word of
mouth has expanded the use of the retention office. In addition, due to the growth in the
use of retention services, additional services have been added based on data collection by
the retention coordinator to better serve all students. As more students use the retention
office and the services offered, continued assistance for struggling students may impact
the retention, graduation, and job placement rates of the college.
Community Implications
The big impact on this community is the perceptions of those who are
underrepresented in the nursing profession. The grant dollars were partially spent on
stipends or scholarships for at-risk students, and many of the at-risk students were
underrepresented minorities in the community. As the students benefit from the grant
dollars and the retention services offered, they may tell other students about the services
they have used. Word of mouth will indicate to their peers that this college is supportive
of at-risk students. In addition, as underrepresented students graduate and begin taking

101
their place in the workforce, there will be more underrepresented nurses as role models
for future students. As the students succeed in their nursing degree and in their careers,
recruitment is done for the college. Removing retention services at this point would be
counterproductive.
Far-Reaching Implications
Although the nursing shortage does not have a great impact on this community,
research has shown that a shortage of nurses will be nation-wide in the next decade
(Culver Clark & Allison-Jones, 2011). While many of the graduates stay within the
community, nursing graduates from this college are recruited nationally. As the students
graduate from this college, they are asked to remember their roots, and to serve in the
future as a preceptor or clinical instructor for student nurses as they get comfortable in
their career. The request is not to necessarily serve in this capacity at the Midwestern
college, but to serve where they practice. As is true for all students, underrepresented
students benefit from working with nurses are from the same minority group are the same
gender. Planting this seed with new graduates also gives them a future mission for their
profession and plays a role in retention of the future students in nursing.
Conclusion
This program evaluation integrated three types of data: archival data from the
Midwestern college’s academic database, data from a survey of student perceptions, and
data from an interview with a key informant in the community. Using three types of data
to review retention services allowed for an in depth evaluation of how retention services
are delivered, whether they increased student’s success, how students perceived the
102
services offered, and how the community perceived the Midwestern college’s
commitment to the community. This evaluation will assist the Midwestern college make
data driven decisions regarding future retention programs and will encourage additional
evaluations of the retention program for nursing students. This program evaluation
revealed some important findings about the retention program that would not have been
learned if an evaluation had not taken place. Continued evaluation of retention services
is recommended and upon completion of this project study, I have further investment in
the evaluation process at this institution. Finally, Section 4 will include the strengths,
limitations, and my reflections of this program evaluation as well as suggestions for
additional research on this topic and the importance of the study to the Midwestern
college.
103
Section 4: Reflections and Conclusions
Introduction
This evaluation report was completed in an attempt to remedy the lack of an
evaluation on a new retention program that was implemented as part of a grant. The
rationale for conducting this program evaluation went beyond the lack of an evaluation in
the past; I also sought to gather information that would be helpful in making decisions
regarding the continuation or addition of retention services. The strengths and limitations
of this program evaluation added to my personal growth throughout this project study, as
did the discovery of other possibilities for evaluation of retention services. Finally,
reflecting on this process in its entirety allowed me to understand how social change is
created.
Project Strengths
The first strength of this program evaluation was that it served to remedy the
problem that an evaluation of retention services had not been conducted since the receipt
of grant dollars that helped form the services. This evaluation was conducted to
determine whether the services developed under the grant were assisting at-risk students
as the grant intended. Without an evaluation of the services, it could not be determined
with certainty whether the grant-funded activities were retaining at-risk students.
One of the greatest strengths of this program evaluation was the evaluation of
many different types of data. A formative evaluation was conducted because the
evaluation was done while retention services were offered to students receiving stipends
or scholarships for their participation. The retention services are still offered at this time,

104
even though many of the students who have received the grant have graduated. The
evaluation included using archival data, such as GPAs, course completion rates, and
instances of probation or dismissal. In addition, the evaluation involved a review of the
perceptions of the students who received retention services, which brought another
dimension to the evaluation. By completing a survey, the students rated the services
provided and provided answers to open-ended questions that are valuable data to review
when making further decisions for the continuation or addition of retention services.
Finally, an interview was conducted with a community member who had
knowledge regarding the Midwestern college and students who are in attendance. Again,
this additional resource brought yet another dimension to the evaluation by including
qualitative data. The insights from the community member are useful in that they
represent another perspective on retention services.
Weaknesses and Limitations
One of the weaknesses identified in the program evaluation was the limited
participant pool and the low number of responses to the survey that was sent to students
who had received retention services. As discussed earlier in this doctoral study, both
numbers were not adequate according to what was recommended using G Power software
calculations. The survey response rate was low due to timing resulting from the survey
approval date. By the time the survey was approved, many of the students who had
received retention services had graduated. There might have been a higher return rate if
the students had still been enrolled at the institution. As the retention services continue at
the Midwestern college, the pool of participants will increase and the surveys can be sent

105
to the at-risk students prior to their graduation from the college, thus increasing the
response rate.
Another limitation is the possibility that students who were labeled at-risk were
able to overcome this definition without retention services and may have skewed the
results. In addition, it was also possible that because this program evaluation was
conducted at the Midwestern College at which I am employed, I had insight into the
possible outcomes of this evaluation and might not have been able to be as objective as
an external evaluator would have been. However, an external evaluator also has
challenges. External evaluators might have had difficulties establishing trust at the
institution, and the stakeholders in the program might have felt as though an external
evaluator did not have enough knowledge about the setting to understand the program to
make a valuable evaluation (Creswell, 2012).
A weakness identified in this program evaluation was the focus only on students
who were classified as at-risk by the grant definitions. It is possible that a student was at
risk for failure due to factors that were not listed by the grant. Additional data could be
collected in the future from all students who used retention services to determine whether
all students benefit from retention services and the retention office.
Alternative Solutions
While reviewing the literature, I read multiple studies that included tactics for at-
risk students that were not used in the retention services at the Midwestern college
(Domina, 2009; Haggerty, Holloway & Wilson, 2013; Igbo et al., 2011; Morris &
Hancock, 2013; Moses et al., 2011). While many of the different services overlapped in

106
one way or another, each having a type of retention tactic, none were exactly the same.
As this evaluation was conducted, there were themes that emerged that were included in
the recommendations of this paper to be used in the future. Many retention services
include peer tutoring or peer mentoring as part of their retention efforts, which is not
currently done at the Midwestern college. In addition, there were a variety of definitions
of what determined a student being labeled at-risk in the literature. Both the definition of
at-risk and the population studied in the literature had an impact on what solutions were
attempted by those researchers. Further review of the groups of students at the
Midwestern college might also alter the definition of at-risk and provide alternative
solutions.
Scholarship
As the true problem addressed in this doctoral study was the lack of a program
evaluation of retention services at the Midwestern college, conducting a thorough
literature review about program evaluations was necessary to understand what evaluating
a program meant. While literature and tactics in retention change over time, it was
important that current literature be predominant while also tracing back the ideas of
retention of students to its beginning research.
The literature review included the use of many databases, including ERIC,
MEDLINE, CINAHL, Nursing & Allied Health Source, Health and Medical Complete,
PubMed, Academic Search Complete, PsycARTICLES, and PsycINFO. I relied on these
databases a great deal while seeking literature about specific topics throughout the
program evaluation. As the Midwestern college offers majors only in the health

107
professions, I was able to find a great deal of literature in the health databases. I was also
able to use educational databases such as Academic Search Complete and ERIC because
the problem being addressed was educational in nature. These databases offered a great
deal of literature that I used to develop a rich review of literature for program evaluation
and retaining students.
While reviewing the literature, I was surprised to find that much of the literature
was focused on health professions. As the Midwestern college includes only programs in
the health professions, much of the literature was very relevant. In contrast, I was also
surprised that there was very little literature focused on nonhealth professions. I found
very little, if any, literature focused on how to retain history students or education majors.
Mathematics and science students were addressed, but not at the depth of health
professions. With so much focus on health professions, I was able to piece together the
final project by reviewing several program reports of other health science programs and
using those most relevant to the Midwestern college. Although the final program report
does not look identical to others reviewed in the literature, it is most meaningful to the
Midwestern college, as it was developed based on that culture.
Project Development and Evaluation
As mentioned above, the problem addressed in this doctoral study was the lack of
a program evaluation for retention services. In going through this process, I have learned
about the different types of program evaluations and how to determine the best type of
evaluation for a specific program. Using the six steps identified by Berk and Rossi
(1999) introduced in Section 1, I started at Step 4, improving the program, as Steps 1

108
through 3had already been completed. Step 1 was identification of issues, Step 2 was
formulating policy responses, and Step 3 was designing a program (Berk & Rossi, 1999).
In improving the program, potential changes must first be determined. However,
understanding whether a program is effective may be difficult because there are other,
nonprogram factors in the students’ lives that may also be the reason for the impact (Berk
& Rossi, 1999).
I discovered during the review of the literature that the primary reason for
conducting a program evaluation is accreditation requirements or funding requirements,
such as those related to grant funding or to other educational groups (Frye & Hemmer,
2012). However, more recently, educators have become more interested in the process of
evaluation due to the changing approaches to educating students. In order to learn about
the dynamic education system, educators must first understand the new approaches to
education, and program evaluations are becoming more common in all aspects of
learning (Frye & Hemmer, 2012). This in-depth exploration of the literature has paved
the way for the development of the evaluation tools and the program report that will be
submitted to the Midwestern college. It is clear to me that evaluation is ongoing. No
report is final; rather, a report is the beginning of the next evaluation.
Leadership and Change
One of my greatest personal accomplishments from this process is that I feel that I
am able to use evaluation throughout a nonacademic department in an institution of
higher education. I am employed in student services at the Midwestern college, where a
variety of services are offered to students that are not necessarily academic in nature, but
109
rather function as support systems so that students are able to focus on their academics.
The support offered to students is not curriculum based; student services staff do not use
syllabi and rubrics or evaluate services as regularly as the academic departments do. I
feel that as the leader of this department, I am now able to develop evaluations for many
of the services offered so that change can occur as the needs of the students change.
As evaluations are developed throughout the student services department, the
basis for change will become clear. Data-driven decisions can be made that will impact
future semesters. As evaluations are conducted, some of the focus and priorities in the
department will also change. As a culture focused on evaluation is developed, the data
collection and evaluations will seem more natural, and the student services staff will also
rely on data to move forward with other services beyond retention. During this doctoral
study, a rubric for use in the holistic admissions process was developed. Starting in the
spring of 2015, an evaluation process on this admissions rubric will take place. After the
process is evaluated, staff will be encouraged to present the findings of the evaluation at
conferences so that success stories, challenges, and lessons learned can be shared with
other institutions. This will further impact social change through relaying information to
like institutions that do work similar to ours.
Additional social change may occur as retention services are able to retain
students who might not have been retained without these services. As addressed in
Section 1, there is a nursing shortage in the United States that creates urgency to educate
future nurses to fill the gaps that appear in staffing, most often in hospitals and long-term
care facilities (Cameron et al, 2011).

110
Reflection on the Importance of the Work
As I reflect on the program evaluation, I feel that I must comment on the process,
definitions of at-risk and success, and how the importance of retention services goes well
beyond staffing. The process of developing the program evaluation included reviewing
literature on many other program evaluations and designing an evaluation that best fit
with the culture of the Midwestern college. As there were many different types of
evaluations reviewed, piecing together the ideal type of program evaluation for the
Midwestern college was done very intentionally.
Although at-risk and success were largely defined by the grant received, as data
collection occurred it became clear that their definitions could be altered. As retention
services are reviewed in the future, it is likely that those definitions will evolve. Given
that the term at-risk was broadly defined per the grant, there were some students who met
only one criterion to be labeled at-risk whereas other students met all criteria. I can see
that it would be possible to further define at-risk students and put them in levels, such as
very at-risk or somewhat at-risk. I can also see that the definition of success may be
further refined to include levels. While success may ultimately mean that a student is
retained in the nursing program, this may not speak to the student’s future success in
higher level semesters or success on NCLEX.
Finally, through the progression of this program evaluation, I can see the
importance of the success of students in nursing programs. Beyond the importance of
having well-prepared nurses in the community lies the passion of the students who enter
the nursing field. In very few professions is there a self-proclaimed calling to do the

111
work. Nursing students can often pinpoint a time in their lives when they knew that they
wanted to be nurses. The students I have worked with describe this moment with great
passion. The need for retention services to be available to at-risk students is not limited
to staffing hospitals; such services are important in helping these passion-filled students
achieve their dream of becoming a nurse.
Implications, Applications, and Directions for Future Research
As I collected data and reviewed the analysis, I developed a better understanding
of the reasons for the program evaluation. Ideas began to flow about how to use what I
had learned, and possibilities for future research at the Midwestern college came into
view. As discussed above, the implications for the students who are assisted with
retention services are two-fold. Not only does the workforce need well-trained nurses,
but the students who are assisted due to the receipt of retention services may experience a
new level of success themselves. In addition, the impact of failure on all students,
including those who are at risk, can be devastating. Using retention services as a basis
for support for students is one positive implication of retention services.
The data analysis was described in an evaluation report for the stakeholders at the
Midwestern college. In order to apply the results, the evaluation report was used to
compare the specific successes of the students who received the retention services to
those who did not receive the retention services. Although the results of the archival data
were not statistically significant, the stakeholders will be able to view the actual data to
determine whether results are moving in the right direction. In addition, the results of the
survey showed that the recipients of retention services viewed them positively and

112
believed that they had an impact on their success. Finally, the data from the interview
indicate that members of the community view the Midwestern college positively and that
the use of retention services has an impact on the nursing students.
During data collection and analysis, I was already forming ideas for additional
evaluations that can take place at the Midwestern college. As discussed earlier, the
definitions of at-risk and success are quite broad, and retention services may have a
greater impact on students who meet multiple at-risk criteria. In addition, the definition
of success may need to be adjusted, as success may mean short-term success (passing a
course) or long-term success (passing NCLEX). Future evaluation of retention services
may also include a review of all students who use the services voluntarily compared to
those who are directed to use the services. It would also be interesting to review the
evaluation report with the stakeholders of the Midwestern college to determine what
types of services should remain, what services should be added, and what services should
be discontinued.
Conclusions
Throughout this doctoral study, from the beginning of the proposal to the actual
evaluation data to the evaluation report, important discussions occurred at the
Midwestern college related to retention services. This dialogue has emerged into many
facets of the college’s departments, including the targeted at-risk students in the nursing
program for which this evaluation was conducted, to expansion of retention services to
the master and doctoral levels and how to evaluate nonacademic services and programs.
These discussions have been inclusive across the two schools at the Midwestern college,

113
which has also created solidarity in the subject of retention. The combination of
quantitative and qualitative data has allowed for a depth in the research that can be
appreciated and appeal to different types of individuals. The evaluation report includes
visual representations of the data as well as description of the process used to determine
the type of evaluation conducted, the tools used in the evaluation, and the findings.
Educators are committed to continuous improvement through data collection and analysis
and evaluating results by using a circular process to embrace constant change.

114
References
American Association of Colleges of Nursing. (2013). Fact sheet: Enhancing diversity in
the nursing workforce. Retrieved June 19, 2013., from
http://www.aacn.nche.edu/media-relations/diversityFS.pdf
American Health Science Education Consortium. (n.d.). AHSEC— American Health
Science Education Consortium. Retrieved January 16, 2013, from
http://www.ahsec.org/about.asp
Arieli, D., & Hirschfeld, M. J. (2013). Supporting minority nursing students:
Opportunity for success for Ethiopian immigrants in Israel. International Nursing
Review, 2013, 213–220.
Austin Community College District. (n.d.). Completion rate calculator. Retrieved April 9,
2014, from http://www.austincc.edu/support-and-services/services-for-
students/completion-rate-calculator
Bentley, Y., Selassie, H., & Shegunshi, A. (2012). Design and evaluation of student-
focused eLearning. Electronic Journal of eLearning, 10(1), 1–12.
Berk, R. A., & Rossi, P. H. (1999). Thinking about program evaluation 2. Thousand
Oaks, CA: Sage.
Bliss, C., Webb, J., & St. Andre, M. (2012). The impact of the University of Utah’s
LEAP program on student performance. Journal of General Education, 61(1), 39-
58.
Brewer, S. E., Cinel, B., Harrison, M., & Mohr, C. L. (2013). First year chemistry
115
laboratory courses for distance learners: Development and transfer credit
acceptance. International Review of Research in Open and Distance Learning,
14(3), 488-507.
Brooks, M., Jones, C., & Burt, I. (2013). Are African-American male undergraduate
retention programs successful? An evaluation of an undergraduate African-
American male retention program. Journal of African American Studies, 17, 206-
221.
Bryer, J. (2011). Peer tutoring program for academic success of returning nursing
students. Journal of the New York State Nurses Association, 43(1), 20-22.
Cameron, J., Roxburgh, M., Taylor, J., & Lauder, W. (2011). An integrative literature
review of student retention in programmes of nursing and midwifery education:
Why do students stay? Journal of Clinical Nursing, 20, 1372-1382.
doi:10.111/j.1365-2702.2010.03336.x
Carnegie. (n.d.). Carnegie Foundation for the Advancement of Teaching. Retrieved
February 27, 2013, from http://classifications.carnegiefoundation.org
/lookup_listings/view_institution.php?unit_id=152798&start_page=institution.ph
p&clq
Carrick, J. (2011). Student achievement and NCLEX-RN success: Problems that persist.
Nursing Education Perspectives, 32(2), 78-83.
Casstevens, W. J., Waites, C., & Outlaw, N. (2012). Nontraditional student retention:
Exploring perceptions of support in a social work graduate program. Social Work
Education, 31(3), 256-268. doi:10.1080/02615479.2011.556188

116
Coastal Carolina University. (n.d.). Projected cumulative GPA calculator. Retrieved
June 19, 2013, from http://www.coastal.edu/registrar/cumgpacalc.html
Cook, T. D., & Campbell, D. T. (1979). Quasi-experimentation: Design & analysis
issues for field settings. Boston, MA: Houghton Mifflin.
Creswell, J. W. (2012). Educational research: Planning, conducting, and evaluating
quantitative and qualitative research (4th
ed.). Upper Saddle River, NJ: Pearson
Education.
Culver Clark, R., & Allison-Jones, L. (2011). Investing in human capital: An academic-
service partnership to address the nursing shortage. Nursing Education
Perspectives, 32(1), 18-21. Retrieved from Walden Library.
Curran, V. R., Butler, R., Duke, P., Eaton, W. H., Moffat, S. M., Sherman, G. P., &
Pottle, M. (2012). Effectiveness of a simulated clinical examination in the
assessment of the clinical competencies of entry-level trainees in a family
medicine residency programme. Assessment & Evaluation in Higher Education,
37(1), 99-112.
Dando, N., d’Avray, L., Colman, J., Hoy, A., & Todd, J. (2011). Evaluation of an
interprofessional practice placement in a UK in-patient palliative care unit.
Palliative Care, 26(2), 178-184. doi:10.1177/0269216311400479
Darussalam, G. (2010). Program evaluation in higher education. The International
Journal of Research and Review (5)2, 56-65.
Davidson, S. C., Metzger, R., & Lindgren, K. S. (2011). A hybrid classroom-online
curriculum format for RN-BSN students: Cohort support and curriculum structure
117
improve graduation rates. The Journal for Continuing Education in Nursing,
42(5), 223-232.
Domina, T. (2009). What works in college outreach: Assessing targeted and schoolwide
interventions for disadvantaged students. Educational Evaluation and Policy
Analysis, 31(2), 127-152. doi:10.3102/016237370933387
Dudek, N. L., Marks, M. B., Wood, T. J., Dojeiji, S., Bandiera, G., Hatala, R., Cooke, L.,
… Sadownik, L. (2012). Quality evaluation reports: Can a faculty development
program make a difference? Medical Teacher, 34, e725–e731. doi:
10.3109/0142159X2012.689444
Enterkin, J., Robb, E., & McLaren, S. (2013). Clinical leadership for high-quality care:
Developing future ward leaders. Journal of Nursing Management, 21, 206– 206.
doi:10.111.j.1365-2834.2012.01408.x
Escallier, L. A. & Fullerton, J. T. (2009). Process and outcomes evaluation of retention
strategies within a nursing workforce diversity project. Journal of Nursing
Education, 48(9), 488-494. doi:10.3928/01484834-20090610-02
Fontaine, K. (2014). Effects of a retention intervention program for associate degree
nursing students. Nursing Education Perspectives, 35(2), 94–99. doi:
10.5480/12-815.1
Frye, A. W., & Hemmer, P. A. (2012). Program evaluation models and related theories:
AMEE guide No. 67. Medical Teacher, 34, 288-299.
Furimsky, I., Arts, K., & Lampson, S. (2013). Developing a successful peer-to-peer
118
mentoring program. Applied Clinical Trials, December 2013/January 2014, 27 –
30.
Gill, O., Mac An Bhaird, C., & Fhloinn, E. (2010). The origins, development and
evaluation of mathematics support services. Irish Math. Soc. Bulletin, 66(2010),
51-63.
Gilmore, M., & Lyons, E. M. (2012). Nursing 911: An orientation program to improve
retention of online RN-BSN students. Nursing Education Perspectives, 33(1), 45-
47.
Goff, A. (2011). Stressors, academic performance, and learned resourcefulness in
baccalaureate nursing students. International Journal of Nursing Education
Scholarship, 8(1), 1-20. doi:10.2202/1548-923X.2114
Goncalves, S. A., & Trunk, D. (2014). Obstacles for success for the nontraditional
student in higher education. Psi Chi Journal of Psychological Research, 19(4),
164-172.
Green, S. B., & Salkind, N. J. (2011). Using SPSS for Windows and Macintosh:
Analyzing and understanding data (6th
ed.). Upper Saddle River, NJ: Pearson
Education.
Grigal, M., Dwyre, A., Emmett, J., & Emmett, R. (2012). A program evaluation too for
dual enrollment transition programs. Teaching Exceptional Children, May/June,
36-45.
Haan, P., Britt, M., McClellan, S., & Parks, T. H. (2010). Business students’ perceptions
of course evaluations. College Student Journal, 44(4), 1-7.

119
Haggerty, C., Holloway, K., & Wilson, D. (2013). How to grow our own: An
evaluation of preceptorship in New Zealand graduate nursing progammes.
Contemporary Nurse, 43(2), 162-171.
Haji, F., Morin, M. P., and Parker, K. (2013). Rethinking programme evaluation in health
professions education: Beyond ‘did it work?’ Medical Education, 47, 342–351.
doi:10.1111/medu.12091
Harackiewicz, J. M., Canning, E. A., Tibbetts, Y., Giffen, C. J., Blair, S. S., Rouse, D. I.,
& Hyde, J. S. (2013). Closing the social class achievement gap for first-generation
students in undergraduate biology. Journal of Educational Psychology, 4, 1-15.
doi: 10.1037/a0034679
Heroff, K. (2009). Guidelines for a Professional and Remediation Policy Using
Standardized Tests to Prepare Associate Degree Nursing Students for the
NCLEX-RN at a Rural Community College (Unpublished master’s thesis).
Washington State University.
Hoffman, M., Richmond, J., Morrow, J., & Salamone, K. (2003). Investigating “sense of
belonging” in first-year college students. Journal of College Student Retention,
4(3), 227-256.
Hosseini, S. K., Ghalamkari, M., Yousefshahi, F., Mireskandari, S. M., & Rezaei
Hamami, M. (2013). Advanced cardiac life support training by problem-based
method: Effect on the trainee’s skills, knowledge, and evaluation of trainers. The
Journal of Tehran University Heart Center, 8(4), 187-191.

120
Igbo, I. N., Straker, K. C., Landson, M. J., Symes, L., Bernanrd, L. F., Hughes, L. A., &
Carroll, T. L. (2011). An innovative, multidisciplinary strategy to improve
retention of nursing students from disadvantaged backgrounds. Nursing
Education Perspectives, 32(6), 375-379.
Iowa Board of Nursing. (2011a). Licensure. Retrieved March 22, 2013 from
http://nursing.iowa.gov/images/pdf/Licensure%202011.pdf
Iowa Board of Nursing. (2011b). Number of Candidates and Percent Passing of First-
Time NCLEX-RN Candidates Prepared in Iowa Programs for Registered Nurse
Licensure. Retrieved March 22, 2013, from
http://nursing.iowa.gov/images/pdf/program_statistics/NCLEXprogramdata_rn.pd
f
Iowa Board of Nursing. (2013). 2013 NCLEX Report Form for Registered Nurse
Candidates. Retrieved March 22, 2013, from http://nursing.iowa.gov
Johnson, D. R., Soldner, M., Leonard, J. B., Alvarez, P., Inkelas, K. K., Rowan-Kenyon,
H., & Longerbeam, S. (2007). Examining sense of belonging among first-year
undergraduates from different racial/ethnic groups. Journal of College Student
Development, 48(5), 525-542.
Kalra, S., Nelson, Y., Dave, P., & Wadhwa, R. (2011). Student assessment of teaching
effectiveness of “bundle of changes” – A paired, controlled trial. Journal of
Anaesthesiology Clinical Pharmacology, 27(4), 506-510.
Kendricks, K. D., Nedunuri, K. V., & Arment, A. R. (2013). Minority student perceptions
121
of the impact of mentoring to enhance academic performance in STEM
disciplines. Journal of STEM Education, 14(2), 38-46.
Kennedy-Phillips, L. C., & Uhrig, K. J. (2013). Measuring the second-year
transformation experience program (STEP) at The Ohio State University. New
Directions for Student Services, 142, 83-88. doi:10.1002/ss
Kenny, A., Kidd, T., Nankervis, K., & Connell, S. (2011). Mature age students access,
entry, and success in nurse education: An action research study. Contemporary
Nurse, 38(1-2), 106-118.
Krajcik, J. (2011). Learning progressions provide road maps for the development and
validity of assessment, and curriculum materials. Measurement, 9, 155-158. doi:
10.1080.15366367.2011.603617
Kramer, J. M., Roemer, K., Liljenquist, K., Shin, J., & Hart, S. (2014). Evaluation of
project TEAM (Teens making environment and activity modifications.)
Intellectual and Developmental Disabilities, 52(4), 258-272.
Kruzicevic, S. M., Barisic, K. J., Banozic, A., Esteban, C. D., Sapunar, D., & Puljak, L.
(2012). Predictors of attrition and academic success of medical students: A 30-
year retrospective study. Plos One,7(6), 1-4. doi:10.1371/journal.pone.0039144
Lyons, E. M. (2008). Examining the effects of problem-based learning and the NCLEX-
RN scores on the critical thinking skills of associate degree nursing students in a
southeastern community college. International Journal of Nursing Education
Scholarship, 5(1), 1-17.
MACORR Research Solutions Online. (n.d.). Sample size calculator. Retrieved April

122
16, 2013, from http://www.macorr.com/sample-size-calculator.htm
McGonagle, A. K., Freake, H. C., Zinn, S. Bauerle, T., Winston, J., Lewicki, G., …
Philion, M. (2014). Evaluation of STRONG-CT: A program supporting minority
and first-generation U.S. science students. Journal of STEM Education, 15(1), 52-
61.
Mills, C., Heyworth, J., Rosenwax, L., Carr, S., & Rosenberg, M. (2009). Factors
associated with the academic success of first year health science students.
Advances in Health Sciences Education, 14, 205-217. doi:10.1007/s10459-008-
9103-9
Morris, T. L., & Hancock, D. R. (2013). Institute of medicine core competencies as a
foundation for nursing program evaluation. Nursing Education Research, 34(1),
29-33.
Moscoso, S., Sanduvete Chaves, S., Portell Vidal, M., & Argilaga, T. A. (2013).
Reporting a program evaluation: Needs, program plan, intervention and decisions.
International Journal of Clinical and Health Psychology, 13, 58-66.
Moses, L., Hall, C., Wuensch, K., De Urquidi, K., Kauffmann, P., Swart, W., Duncan, S.,
& Dixon, G. (2011). Are math readiness and personality predictive of first-year
retention in engineering? The Journal of Psychology, 145(3), 229-245.
Mulholland, J., Anionwu, E.N., Atkins, R., Tappern, M., & Franks, P. J. (2008).
Diversity, attrition and transition into nursing. Journal of Advanced Nursing,
64(1), 49-59.
Muma, R. D., & Pries, P. (2010). Evaluation of a diversity intervention funded by title
123
VII. The Journal of Physician Assistant Education, 21(4), 5-17.
Nestel, D., Ivkovic, A., Hill, R. A., Warrens, A. N., Paraskevas, A. P., McDonnell, J. A.,
… Browne, C. (2012). Benefits and challenges of focus groups in the evaluation
of a new graduate entry medical programme. Assessment & Evaluation in Higher
Education, 37(1), 1-17. doi:10.1080/02602938.2010.494232
Noonan, A. C., Lundy, M., Smith, A. R., & Livingston, B.P. (2012). A successful model
for improving student retention in physical therapist education programs: A case
report. Journal of Physical Therapy Education, 26(2), 74-80.
Nursing Workforce Development Guidelines. (2010). Nursing Workforce Diversity
Project. Unpublished manuscript, Allen College, Waterloo, Iowa.
Parran, T. V., Pisman, A. R., Youngner, S. J., & Levine, S. B. (2013). Evolution of a
remedial CME course in professionalism: Addressing learner needs, developing
content, and evaluating outcomes. Journal of Continuing Education in the Health
Professions, 33(3), 174 – 179. doi:10.1002/chp
Passy, R., Morris, M., & Waldman, J. (2009). Evaluation of the impact of Aimhigher and
widening participation outreach programmes on learner attainment and
progression, (Interim report). National Foundation for Educational Research.
Patton, M. Q. (1982). Practical evaluation. Beverly Hills, CA: Sage.
Pearson Vue. (2013). The NCLEX Examination. Retrieved January 26, 2013, from
http://www.pearsonvue.com/NCLEX-RN

124
Pennington, T. D., & Spurlock, D. (2010). A systematic review of the effectiveness of
remediation interventions to improve NCLEX-RN pass rates. Journal of Nursing
Education, 49(9), 485-492.
Pogrund, R. L., Darst, S., & Boland, T. (2013). Evaluation study of short-term programs
at residential schools for students who are blind and visually impaired. Journal of
Visual Impairment & Blindness, January-February, 30-42.
Ponticell, J. A. (2006). Learning, theories of English (Ed.), Encyclopedia of educational
leadership and administration, 605-608. Thousand Oaks, CA: SAGE
Publications. doi:10.4135/9781412939584.n338
Pourshanazari, A. A., Roohbakhsh, A., Khazaei, M., & Tajadini (2013). Comparing the
long-term retention of a physiology course for medical students with the
traditional and problem-based learning. Advances in Health Science Education,
18, 91-97.
Ramsden-Meier, J. (2012). [Dashboard Statistics] Unpublished raw data.
Ramsden-Meier, J. (2013). [January 31, 2013 Registrar’s Report] Unpublished raw data.
Ramsden-Meier, J., Hanson, D., & Kramer, N (2012). [Dashboard Indicators].
Unpublished raw data.
Reiner, V. (2012). The Relationship between perception of academic support services
and persistence and integration of undeclared students. (Doctoral Dissertation).
Retrieved from ProQuest. UMI Number: 3505020.
Robinson, E., & Niemer, L. (2010). A peer mentor tutor program for academic success
in nursing. Nursing Education Perspectives, 31(5), 286-289.

125
Salazar, A. M. (2012). Supporting college success in foster care alumni: Salient factors
related to postsecondary retention. Child Welfare, 91(5), 139-167.
Sanchez-Leguelinel, C. (2008). Supporting slumping sophomores: Programmatic peer
initiatives designed to enhance retention in the crucial second year of college.
College Student Journal, 42(2), 637-646.
Sandahl, S. S. (2010). Collaborative testing as a learning strategy in nursing education.
Nursing Education Perspectives, 31(3), 142-147.
Shultz, C. M. (2010). High stakes testing!? Help is on the way. Nursing Education
Perspectives, 31(4), 205.
Sikakana, C. N. T. (2010). Supporting student-doctors from under-resourced educational
backgrounds: An academic development programme. Medical Education (44),
917-925.
Spielberg, F., Kurth, A., Reidy, W., McKnight, T., Dikobe, W., & Wilson, C. (2011).
Interactive evaluation in a mobile counseling and testing program to reach people
of color at risk for HIV – New strategies improve program acceptability,
effectiveness, and evaluation capabilities. AIDS Education and Prevention, 23(3),
110-116.
Spurlock, D. (2006). Do no harm: Progression policies and high-stakes testing in nursing
education. Journal of Nursing Education, 45(8), 297-302.
Student Lingo. (n.d.). Complimentary StudenLingo workshop trial – Winter 2013.
Retrieved March 22, 2013, from http://www.studentlingo.com/winter2013
Strayhorn, T. L., & DeVita, J. M. (2010). African American males’ student engagement:

126
A comparison of good practices by institutional type. Journal of African
American Studies, 14, 87-105. doi:10.1007/s12111-009-9110-9
Tabachnick, B. G., & Fidell, L. S. (2007). Using multivariate statistics (5th
ed.). Boston,
MA: Pearson Education.
Tinto, V., & Cullen, J. (1973). Dropout in higher education: A review and theoretical
synthesis of recent research. U.S. Department of Education Report.
Tipton, P., Pulliam, M., Beckworth, C., Illich, P., Griffin, R., & Tibbitt, A. (2008).
Predictors of associate degree nursing students’ success students. Southern Online
Journal of Nursing Research, 8(1), 1-8.
Thomson, D., & Hilton, R. (2011). An evaluation of students’ perceptions of a college-
based programme that involves patients, careers and service users in
physiotherapy education. Physiother. Res. Int., 17 (2012), 36-47.
doi:10.1002/pri.510
U.S. Department of Education. (2012). Lessons in Character Impact Evaluation.
NCEE 2012-4000. Washington, D.C.: National Center for Education Evaluation
and Regional Assistance, Institute of Education Sciences, U.S. Department of
Education.
U.S. Department of Education. (2013). National evaluation of the IDEA technical
assistance and dissemination program. NCEE 2014-4000. Washington, D.C.:
National Center for Education Evaluation and Regional Assistance, Institute of
Education Sciences, U.S. Department of Education.

127
U.S. Department of Education. (2014). Evaluation of the DC Opportunity Scholarship
Program. NCEE 2014-4000. Washington, D.C.: National Center for Education
Evaluation and Regional Assistance, Institute of Education Sciences, U.S.
Department of Education.
Valentine, J. C., Hirschy, A. S., Bremer, C. D., Norvillo, W., Castellano, M., & Banister,
A. (2011). Keeping at-risk students in school: A systematic review of college
retention programs. Educational Evaluation and Policy Analysis, 33(2), 214-234.
doi:10.3102/0162373711398126
Wallis, A., and Kennedy, K. L. (2013). Leadership training to improve nurse retention.
Journal of Nursing Management, 21, 624-632.
Young, M., Denny, G., & Donnelly, J. (2012). Lessons from the trenches: Meeting
evaluation challenges in school health education. Journal of School Health, 82
(11), 528-535.
Yucha, C. B., Kowalski, S., & Cross, C. (2009). Student stress and academic
performance: Home hospital program. Journal of Nursing Education, 48(11),
631-637.

128
Appendix A: Evaluation Findings and Recommendations
Purpose of Evaluation
As there continues to be a nursing shortage and a lack of diversity in the nursing
profession, it is important to retain at-risk students who have been admitted to nursing
programs. The purpose of this program evaluation was to compare at-risk students who
had not received retention services to at-risk students who had received retention services
at a Midwestern college. This project study evaluated the retention services provided at a
Midwestern college to students defined as at-risk. A formative evaluation was conducted
using information from three sources; the college, the students, and the community. This
evaluation report format is adapted from an evaluation report by Haji, Morin, and Parker
(2013), who described using the evaluation to achieve the stated goals. This format then
included going beyond the stated goals by creating a holistic evaluation report that
encompasses a combination of methods and models to meet the needs of the organization.
The Midwestern College received a grant in 2011 to provide retention services for
students who are educationally or economically disadvantaged. The results of the
formative evaluation may assist in informing the grant administrators during the final
year of funding by the grant as the college continues the services without grant funding.
At this small college of nursing and health sciences in the Midwest, creating a
diverse student body is part of the institutional mission. To become more diversified,
grant funding was sought in order to develop retention programs that would assist nursing
students who come with disadvantages that may put them at-risk. The Nursing
Workforce Diversity Scholars (NWD Scholars) retention programs were created in 2011

129
and funded by a grant. Once grant funding had been secured and students had been
admitted, and funded through grant dollars, an evaluation of the program was needed to
determine whether the services introduced were having an effect on the identified at-risk
students.
Research Questions
In order to determine if retention services are beneficial to at-risk students, six
research questions were developed.
1. Did at-risk students who received retention services have a significantly higher
percentage of passed courses than at-risk students who did not receive retention services?
2. Did identified at-risk students who received retention services have a significantly
higher semester and cumulative GPAs than at-risk students who did not receive retention
services?
3. Were there significantly fewer identified at-risk students who received retention
services on probation compared to identified at-risk students who did not receive
retention services?
4. Were identified at-risk students who received retention services dismissed significantly
less often than at-risk students who did not receive retention services?
5. How did students rate their retention services on the Survey of Student Perception of
Support Services, Persistence, and Belongingness?
6. What perceptions were offered by the key informant regarding how the Midwestern
college supports students toward degree completion? An analysis was conducted to
determine if at-risk nursing students who received retention services were more

130
successful than at-risk nursing students who did not receive retention services based on
course completion rates, GPAs, and instances of probation and dismissal. Retention
services have been ongoing and increasing in nature at the local institution over the last 5
years, but they had not yet been evaluated. In addition, the success of the retention
services implemented had not been reviewed to determine whether the implementation of
these services have made an impact on the success of at-risk students on this campus.
Population and Sample
I have conducted a formative program evaluation which included reviewing
retrospective data of at-risk students, collecting information from current at-risk students
who received retention services regarding their perceptions on the effectiveness of the
retention services on their success, and interviewing a key informant regarding the
perceptions of the community about the local college. A mixed methods approach was
used to combine both quantitative and qualitative data collection in a concurrent strategy.
Creswell (2012) described concurrent data collection in mixed methods research as
collecting data using the qualitative and quantitative methods simultaneously to bring
together to better understand the research problem. The three types of data were
collected for this evaluation in order to produce a rich understanding of the benefits of
retention services based on quantifiable data, perceptions of the students using the
retention services, and perceptions of the community.
A student may be at-risk for economical or educational reasons. Economically
disadvantaged students are identified as coming from a family with an annual income that
does not exceed 200% of the U.S Census Bureau’s adjusted annual income (Nursing

131
Workforce Development Guidelines, 2010). Educationally disadvantaged students are
identified by coming from a high school with a lower ACT/SAT average than the state
test results, coming from a high school where 50% or fewer graduates attend college,
having a diagnosed physical or mental impairment that limits participation in educational
experiences, being a person for whom English is not the primary language and language
is a barrier for academic performance, being a person who is a first-generation college
student and/or a coming from a high school where at least 30% of enrolled students were
eligible for free or reduced-price lunch (Nursing Workforce Development Guidelines,
2010).
The entire population included all prelicensure students, but this study focused on
only at-risk students enrolled in a prelicensure program between Fall 2010 and Spring
2013. This resulted in a sample size of 72 prelicensure nursing students. Fifty-four
students had access to retention services available after the receipt of grant funding, while
18 students were in their first two semesters of the prelicensure nursing program prior to
the receipt of the nursing grant.
All students who met the at-risk criteria were included in the study, including all
full-time and part-time students. Students enrolled in the nursing program at this college
are enrolled as a cohort, so all students take the same courses throughout the nursing
curriculum. All pre-requisite nonnursing courses are completed prior to taking any
nursing courses. It is possible that students may take nonnursing elective courses during
the semester. Nonnursing elective courses will not be taken into consideration for this
research.

132
Data Collection
In order to capture data regarding retention services from the three stakeholders,
the college, the students, and the community - three types of data were collected. First,
secondary data were collected based on student’s course completion rates, GPAs, and
receipt of probation and/or dismissal letters. These data make up the retrospective aspect
of the research design, as the data existed already in the college’s database, and I
reorganized the data for the purpose of this research. A survey was distributed to
students who had received retention services to determine their perceptions of the
services and how they viewed them as aiding their success in the nursing program. In
addition, the opinions of a community member were recorded to get an informants’ view
of how the community views the local college in relation to filling a need in health care.
A program evaluation from the perspective of the college used a quasi-
experimental design using retrospective data. This method was used to evaluate
Research Questions 1 through 4, which are related to student GPAs, course completion
rates, and receipt of probation or suspension letters. As the at-risk students were grouped
as determined by the retention services available, random assignment was not possible
(Creswell, 2012). All students were enrolled for at least two semesters in a prelicensure
program between Fall 2010 and Spring 2013. The students were followed for two
semesters. GPAs were collected before entry into the nursing program and after the first
and second semester of enrollment. Course completion rates and receipt of probation
and/or dismissal letters were collected for both Semester 1 and Semester 2.

133
The dependent variables that were measured included course completion,
semester and cumulative GPAs, and the receipt of a letter of probation or a letter of
dismissal. Table A1 identifies the variable, and explains how it was measured and when
it was measured.

134
Table A1
Study Variables for Archival Academic Data
Variable
Type of
variable
How is it measured? When is it
measured?
Course
completion
ratio Percentage. Number
of courses completed
divided by the total
number of courses.
At the conclusion
of semester one and
at the conclusion of
semester two.
Admission GPA ratio Cumulative GPA
upon admission.
Prior to taking
courses at
Midwestern
college.
Semester One
GPA
ratio Semester GPA using
only semester one
nursing courses.
At the conclusion
of semester one.
Semester Two
GPA
ratio Semester GPA using
only semester two
nursing courses.
At the conclusion
of semester two.
Cumulative GPA
at conclusion of
Semester Two
ratio Cumulative GPA
using semesters one
and two nursing
courses.
At the conclusion
of semester two.
Receipt of letter
of probation
nominal Review of academic
file to determine if
student was placed on
probation during
semester one or two.
At the conclusion
of semester two.
Dismissal nominal Review of academic
file to determine if
student was dismissed
during semester one
or two.
At the conclusion
of semester two.

135
Evaluation Outcomes
The gender and age of the participants were included for descriptive purposes.
Eighteen at-risk students were included in the group that did not receive retention
services. This included 17 females (94%) and one male (6%), and their average age was
28.0 years. Fifty-four at-risk students were included in the group that received retention
services. This included 39 females (72%) and fifteen males (28%) and their average age
was 29.94 years.
In the first research question, an independent samples t test was done to determine
if the percentage of courses completed was significantly different between the at-risk
students who received retention services and the at-risk students who did not receive
retention services. While the at-risk students who received retention services did have a
higher percentage of passed courses when compared to at-risk students who did not
receive retention services, the results were not significant. Ninety-seven percent of
courses were completed by students who received retention services, while ninety-four
percent of courses were completed by students who did not receive retention services, as
indicated in Figure A1.

136
Figure A1. Average percentage of courses completed
For the second research question, a repeated-measures ANOVA test was used to
determine whether there was a significant difference in the means of GPAs over time
between at-risk students who had received retention services and at-risk students who had
not received retention services. Most GPA check points did indicate that at-risk students
who received retention services had a higher GPA than at-risk students who did not
receive retention services, but again, the difference was not statistically significant (See
Figure A2).
97%
94%
Received Retention Services Did not Receive Retention Services

137
Figure A2. Difference in GPAs between groups
The chi-square test was done in Research Question 3 to determine whether at-risk
students who received retention services were on probation less often than students who
did not receive retention services. Of the 54 students who received retention services, 50
students were not on probation and four students were on probation. Of the 18 students
who did not receive retention services, 14 students were not on probation and four
students were on probation. While students who received retention services were on
probation less than students who did not receive retention services, the difference was not
statistically significant. Seven percent of students who received retention services were
on probation, while 22 percent of students who did not receive retention services were on
3.144
3.3402
3.2636 3.2989
2.9794
3.1967
3.2639 3.1972
Pre-Nursing GPA Semester GPA end ofsemester one
Semester GPA end ofsemester two
Cumulative GPA endof semester two
Received Retention Services Did Not Receive Retention Services

138
probation. Figure A3 illustrates the percentage of students who were on probation by
group.
Figure A3. Percent of students on probation
The chi-square test was done in Research Question 4 to determine whether at-risk
students who received retention services were dismissed less often than students who did
not receive retention services. Of the 54 students who received retention services, two
students (4%) were dismissed. Of the 18 students who did not receive retention services,
1 student (6%) was dismissed. While the students who received retention services were
dismissed less than students who did not receive retention services, the difference was not
statistically significant. Figure A4 illustrates the percent of students who were dismissed
during semesters one and two by group.
7%
22%
0%
10%
20%
30%
Received Retention Services
Did not Receive RetentionServices

139
Figure A4. Percent of students dismissed
Student responses to this survey reported below address Research Question 5. Of
the 54 students who were eligible to take the survey, 48 of them had valid email
addresses on file. Twenty-two students responded to the survey, including 15 females,
and 6 males. One respondent did not answer this question. The results of the survey are
shown in table A2. Although all but two questions received scores between 4.0 and 5.0,
which correlates to “agree” and “strongly agree,’ the highest score received in the
survey (4.27) was in answer to the question “I feel comfortable seeing the NWD advisor
about my academic progress and coursework.” The two questions that did not receive a
mean score of at least 4.0 included “I intend to return to the Midwestern College next
semester” and “I believe my experience using the services (tutoring, retention seminars,
NWD advisor, and retention coordinator) have influenced my decision to return to the
college next semester.” As will be discussed in the limitations section, these questions no
longer had the same relevance because most of the at-risk students who received
retention services had already graduated from the Midwestern College. Therefore, their
4%
6%
0%
1%
2%
3%
4%
5%
6%
7%
Received Retention Services
Did not Receive RetentionServices

140
intent to return to the college was likely due to graduation, not because of academic
issues.
Table A2
Summary Survey of Student Perception of Support Services, Persistence, and
Belongingness, N= 23
Survey Question Mean Std. Deviation
I feel comfortable seeing the NWD advisor about my academic progress and coursework. 4.2727 0.91363
I believe the support services mentioned above (tutoring, retention
seminars, NWD advisor, and retention coordinator) are important
to my academic progress. 4.2273 0.73434
I believe offering these support services demonstrates that my
college supports me. 4.2273 0.9011
I feel comfortable meeting with the retention coordinator. 4.1818 0.98333
I feel comfortable using tutoring services and retention seminars to assist me in my coursework. 4.1818 0.88607
Meeting with the retention coordinator is helpful. 4.1429 0.98974
Tutoring/retention seminars are helpful. 4.0909 0.79253
I believe using these services (tutoring, retention seminars, NWD
advisor, and retention coordinator) have already helped me achieve
academic success. 4.0900 0.733
Meeting with the NWD advisor is helpful. 4.0000 0.95346
I intend to return to the Midwestern College next semester. 3.5909 1.55678
I believe my experience using the services (tutoring, retention seminars, NWD advisor, and retention coordinator) have
influenced my decision to return to the college next semester. 3.4091 1.26703
Several themes emerged from the interview notes. The most common themes
included student/personal responsibility, family responsibility, and community
responsibility. The interviewee discussed the importance of those three types of
responsibilities and how their alignment is essential to the success of at-risk students.

141
Figure A5. Retention based on shared responsibility
Student/personal responsibility was the theme that emerged most frequently
during the interview. “If you think the student is not successful, you wonder, did they
have a realistic grasp of what is entailed in completing the program of study? Did they
give it their all? Did they use resources?” The interviewee discussed the personal
characteristics of students he knows, and described their most powerful characteristic as
persistence. “They came in with a high intelligence level to allow adaptation into the
profession.” The interviewee also indicated it is important for students, regardless of
what profession he or she might pursue, to learn how to take personal responsibility for
what is important to them.
Family responsibility was a second major theme that emerged from the interview.
“We want the babies (children) to have a fighting chance, then we will focus on the
structural constraints later, but it starts in the home and in the community.” The theme
of family responsibility went hand in hand with both personal responsibility, and
Personal Responsibility
Family Responsibility
Community Responsibility

142
community responsibility. In fact, the three themes, personal responsibility, family
responsibility, and community responsibility need to connect in order for our young
people to be successful.
The final major theme from the interview was community responsibility. While
the focus of this theme included the Midwestern College’s commitment to the
community, there were also suggestions on how families and communities need to work
together. The interviewee suggested that academic preparation needs to happen very
early. “Head Start programs are the current start, but we need more of them. Not all
parents read to their children. We need to transfer our social values to our children and
plant the seed of desire for our children to succeed.”
In addition, the interviewee discussed the role of the Midwestern College in
supporting students academically as well as socially. While the interviewee believes that
the college is improving in its relationships with at-risk students, there is room for
improvement. Since the Midwestern College is community oriented, it has an obligation
to continue its outreach to the community it serves.
While the results discussed in research questions 1 through 4 were not statistically
significant, they do indicate that retention services are assisting at-risk students in
movement towards success. However, the information that was obtained from the survey
and the community member includes information that will allow the retention services
offered to move forward for future students at the Midwestern College.
Weaknesses and Limitations
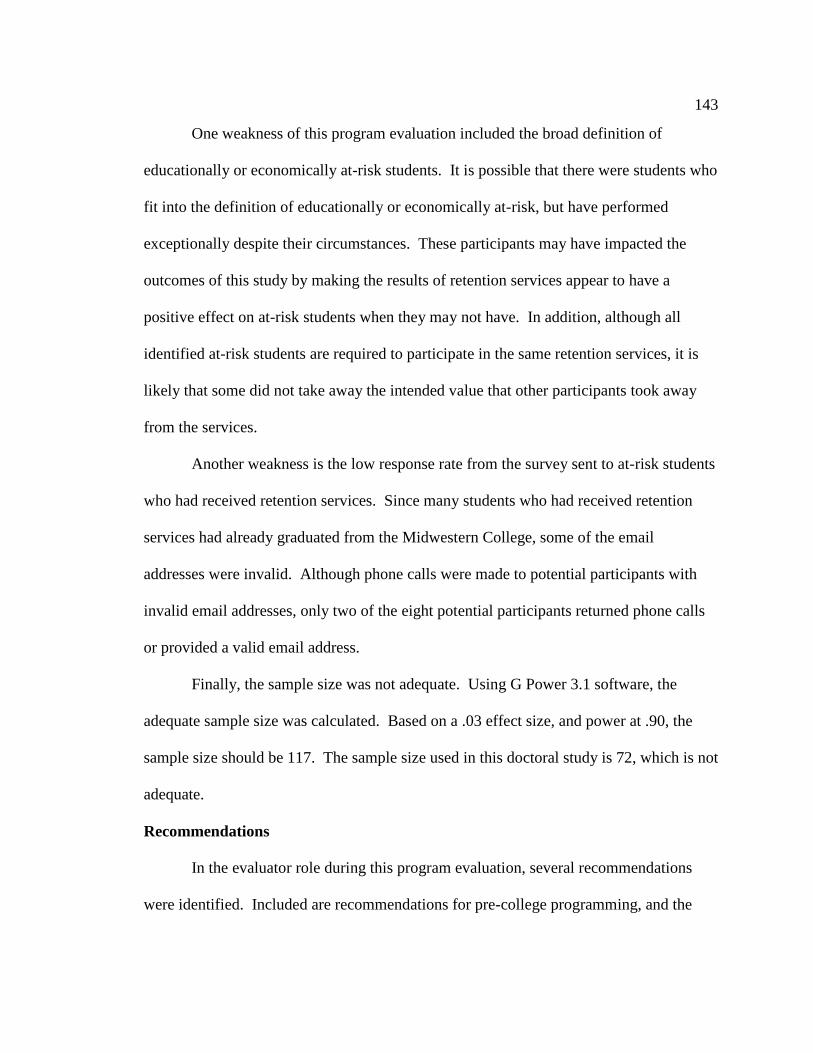
143
One weakness of this program evaluation included the broad definition of
educationally or economically at-risk students. It is possible that there were students who
fit into the definition of educationally or economically at-risk, but have performed
exceptionally despite their circumstances. These participants may have impacted the
outcomes of this study by making the results of retention services appear to have a
positive effect on at-risk students when they may not have. In addition, although all
identified at-risk students are required to participate in the same retention services, it is
likely that some did not take away the intended value that other participants took away
from the services.
Another weakness is the low response rate from the survey sent to at-risk students
who had received retention services. Since many students who had received retention
services had already graduated from the Midwestern College, some of the email
addresses were invalid. Although phone calls were made to potential participants with
invalid email addresses, only two of the eight potential participants returned phone calls
or provided a valid email address.
Finally, the sample size was not adequate. Using G Power 3.1 software, the
adequate sample size was calculated. Based on a .03 effect size, and power at .90, the
sample size should be 117. The sample size used in this doctoral study is 72, which is not
adequate.
Recommendations
In the evaluator role during this program evaluation, several recommendations
were identified. Included are recommendations for pre-college programming, and the

144
continuation of retention services. In addition, there is a recommendation for an added
service that may increase retention as well as updates to how and when retention data are
collected from students and how “at-risk” students are defined.
The first recommendation is the continuation of nurse camp for at-risk high
school students in this community. This program has been a great opportunity to bring
high school students from diverse backgrounds to campus and immerse them in the
nursing profession for six weeks. This program also provides instruction in math and
science skills so the students can excel in future classes that are essential for high school
success and entry to college. The students who attend nurse camp are given a stipend,
which is a key for initial enrollment in the program. Although nurse camp is free for
attendees, the stipend is offered to students so they do not feel they need to choose
between attending nurse camp and working during the summer months.
An additional recommendation involving nurse camp is to have reunions annually
to reconnect the students with one another and with the campus. An attempt to keep
these potential nurses connected may help motivate the students to stay on track for high
school success and to continue in college-bound high school classes. Mentoring these
students after they have graduated from nurse camp may also encourage them to take
courses at community colleges while a high school student. Nurse camp advisors could
assist these students with the process on enrolling in college-level courses during their
junior and senior years in high school.
Since the timing of when surveys were collected from students was not ideal, it is
recommended to add questions regarding student perceptions of retention services to the

145
exit interview that is conducted by the department dean. Changing the timing of the data
collection may result in a higher return rate, therefore including the perceptions of more
students.
The definitions used for “at-risk” students and “success” were very broad in this
doctoral study. It is recommended that more specific definitions be used, and students be
classified in levels, such as “very at-risk” and “somewhat at-risk” and that the levels of
success also be broadened to include “passed class,” “graduated” and “passed NCLEX-
RN.” This may assist in determining future retention services for students who come to
the Midwestern College with multiple “at-risk” identifiers when compared with students
who have only one or two identifiers.
Although the results of archival data did not indicate there is a statistically
significant difference between at-risk students who received retention services and at-risk
students who did not have access to those services, the survey results indicated a positive
view of the services offered and of the college for offering services. Retention services
have expanded since its inception, and should continue to do so based on the needs of the
students. It is recommended that an evaluation of archival data continue each year. In
addition, conducting a survey of the students who received retention services is also
recommended to ensure the services offered are used and that students feel positively
about the services.
An additional recommendation is to add an advising or mentoring component to
retention services. Students who have received the grant dollars have been assigned to
the same advisor. As the students move beyond semesters one and two in the nursing

146
program, the addition of peer advising or mentoring may also benefit retention rates of
this group of students. This addition will take resources, as the advising or mentoring
will need to be developed, advisors or mentors will need to be trained, and someone will
need to monitor the program. This could include additional staff needs in the office of
retention services.
Finally, including retention services in orientation activities may promote the
services to students who may not otherwise take advantage of them. Asking students to
identify what helps them succeed academically and connecting those successes to the
services offered in the retention office may help the students understand the purpose of
the retention office. The word “retention” sometimes creates a negative connotation.
Renaming the office may also help with a more positive view of the services offered.
Conclusion
This research was conducted to determine whether there is a difference between
at-risk students who have received retention services and at-risk students who did not
receive retention services. To investigate this question, a formative program evaluation
was done to determine the differences between the two groups of students in GPA, course
completion rate, and instances of probation and dismissal. The design was a
retrospective quasi-experimental study, which included data from the Midwestern
College’s database. Using the data collected, the researcher determined whether a
significant difference existed using t-tests, repeated measures ANOVA, and chi-squared.
In addition, the students who had received retention services were surveyed to determine
if they perceived that the retention services helped them succeed in the nursing program.

147
Finally, a member of the community was interviewed to get a viewpoint on the
contribution the Midwestern College is making to health care in the community.
As part of the doctoral study project, results were compared with the outcomes of
a grant received by the Midwestern College to determine whether the outcomes are being
met. The results comparison with the grant outcomes were reported to the stakeholders
of the Midwestern College in a white paper format. The stakeholders can use this
information to determine the future of the retention services offered.
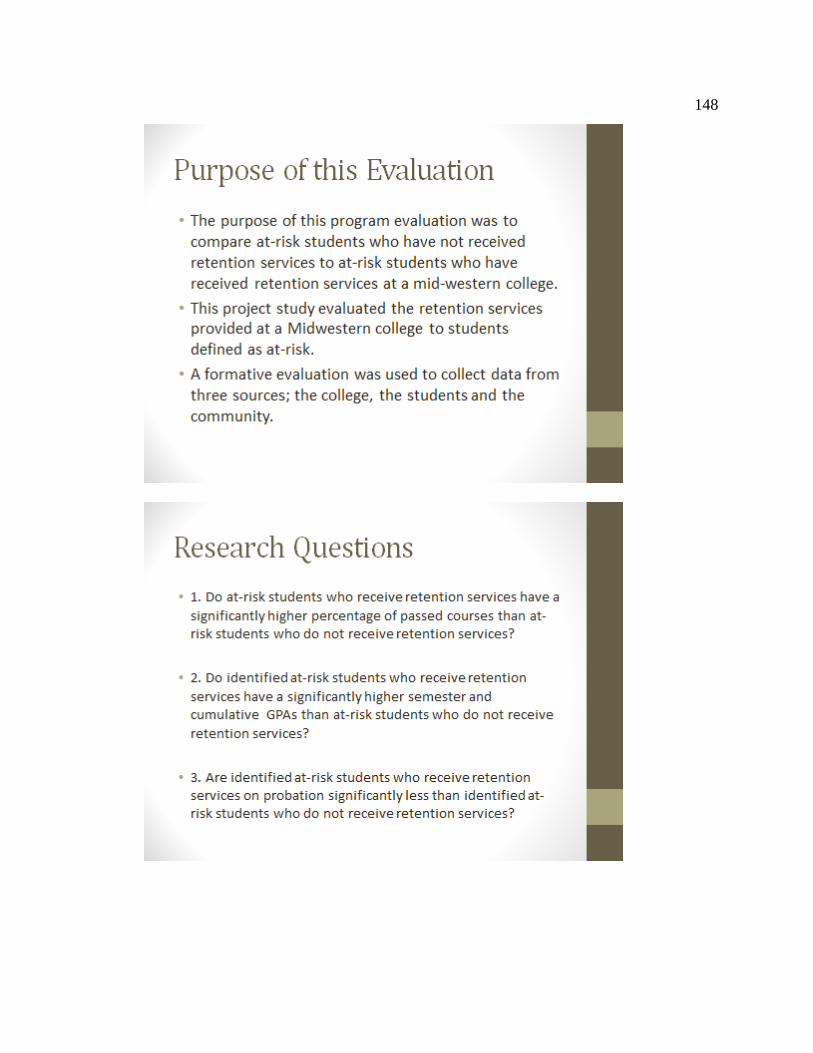
148

149
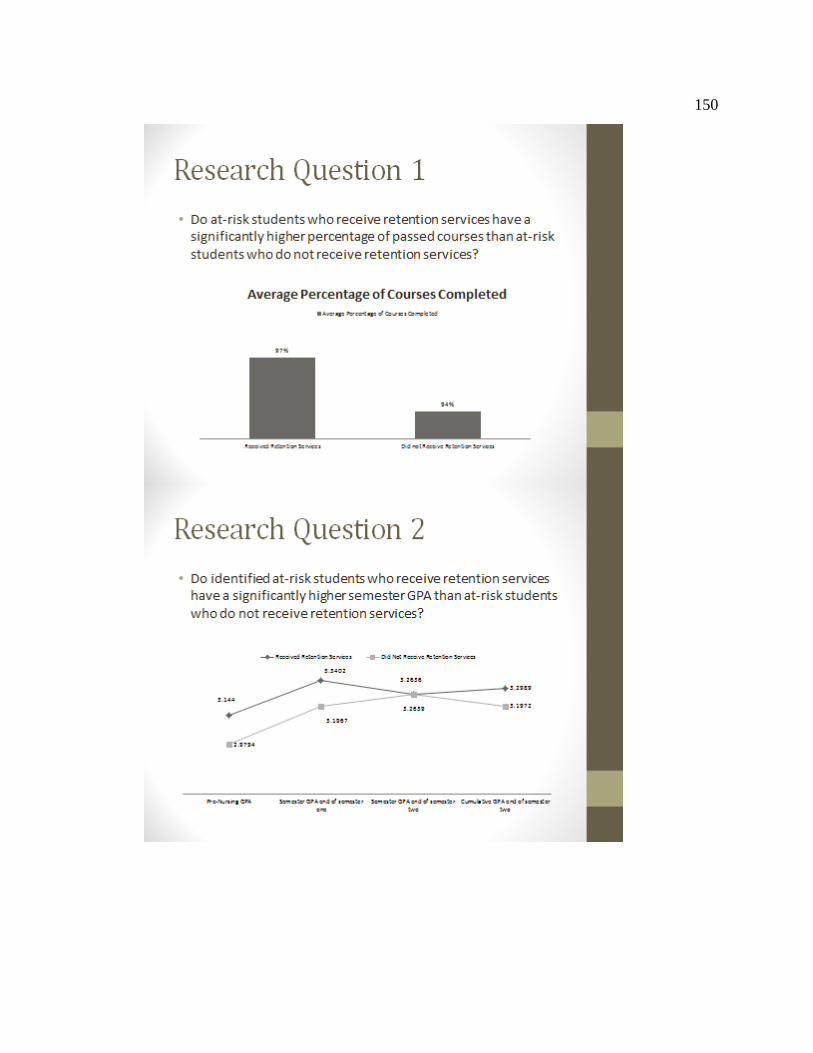
150

151

152

153

154

155
Appendix B: Consent Form for Survey of Student Perception of Support Services,
Persistence and Belongingness
CONSENT FORM You are invited to take part in a research study of retention services at the Midwestern College.
The researcher is inviting NWD Scholars who have received retention services participate in the
study. This form is part of a process called “informed consent” to allow you to understand this
study before deciding whether to take part.
This study is being conducted by a researcher named Joanna Ramsden-Meier, who is a doctoral
student at Walden University. Joanna is also the Director of Student Services here at the
Midwestern College, but this study is separate from that role.
Background Information: The purpose of this study is to determine the effect of retention services on the success of NWD
scholars.
Procedures: If you agree to be in this study, you will be asked to take five minutes and respond to the
questions on this short survey.
Voluntary Nature of the Study: This study is voluntary. Everyone will respect your decision of whether or not you choose to be in
the study. No one at The Midwestern College will treat you differently if you decide not to be in
the study. If you decide to join the study now, you can still change your mind later. You may stop
at any time.
Risks and Benefits of Being in the Study: Being in this type of study involves some risk of the minor discomforts that can be encountered in
daily life, such as stress or fatigue. Being in this study would not pose risk to your safety or
wellbeing.
The benefits of your participation include providing valuable input for future students.
Privacy: Any information you provide will be kept anonymous. The researcher will not use your personal
information for any purposes outside of this research project. Also, the researcher will not include
your name or anything else that could identify you in the study reports. Data will be kept secure
on a database on a password protected server accessed only by the researcher. Data will be kept
for a period of at least 5 years, as required by the university.
Contacts and Questions: You may ask any questions you have now. Or if you have questions later, you may contact the
researcher via phone at xxx.xxx.xxxx or [email protected]. If you want to talk privately
about your rights as a participant, you can call the IRB representative. She is the Midwestern
College representative who can discuss this with you. Her phone number is xxx.xxx.xxxx Her

156
email is [email protected] . The Midwestern College’s approval numbers for this
study are 14-0121 and 14-0124 and they expire on June 30, 2015.
Please print or save this consent form for your records.
Statement of Consent:
I have read the above information and I feel I understand the study well enough to make a
decision about my involvement. By clicking the link below, I understand that I am agreeing to the
terms described above.
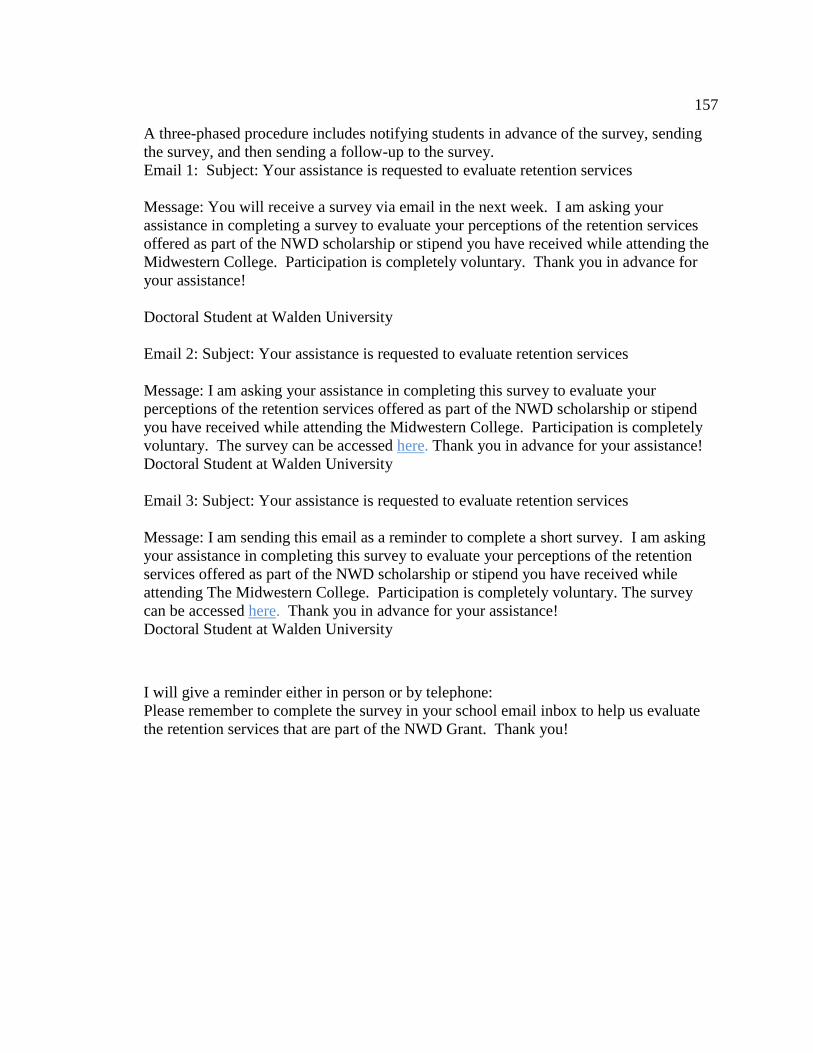
157
A three-phased procedure includes notifying students in advance of the survey, sending
the survey, and then sending a follow-up to the survey.
Email 1: Subject: Your assistance is requested to evaluate retention services
Message: You will receive a survey via email in the next week. I am asking your
assistance in completing a survey to evaluate your perceptions of the retention services
offered as part of the NWD scholarship or stipend you have received while attending the
Midwestern College. Participation is completely voluntary. Thank you in advance for
your assistance!
Doctoral Student at Walden University
Email 2: Subject: Your assistance is requested to evaluate retention services
Message: I am asking your assistance in completing this survey to evaluate your
perceptions of the retention services offered as part of the NWD scholarship or stipend
you have received while attending the Midwestern College. Participation is completely
voluntary. The survey can be accessed here. Thank you in advance for your assistance!
Doctoral Student at Walden University
Email 3: Subject: Your assistance is requested to evaluate retention services
Message: I am sending this email as a reminder to complete a short survey. I am asking
your assistance in completing this survey to evaluate your perceptions of the retention
services offered as part of the NWD scholarship or stipend you have received while
attending The Midwestern College. Participation is completely voluntary. The survey
can be accessed here. Thank you in advance for your assistance!
Doctoral Student at Walden University
I will give a reminder either in person or by telephone:
Please remember to complete the survey in your school email inbox to help us evaluate
the retention services that are part of the NWD Grant. Thank you!

158
Appendix C: Survey of Student Perception of Support Services, Persistence, and
Belongingness
DISREGARD THIS SURVEY IF YOU ARE UNDER 18 YEARS OF AGE
Circle: Gender: Male Female
Number of credits completed at the Midwestern College (NOT including current
semester) _______
Circle the number that best describes your response to each statement.
1 = Strongly Disagree
2 = Disagree
3 = Neither Agree nor Disagree
4 = Agree
5 = Strongly Agree
1. I feel comfortable using tutoring services and retention seminars to assist me in
my coursework.
1 2 3 4 5
2. Tutoring/retention seminars are helpful.
1 2 3 4 5
3. I feel comfortable seeing the NWD advisor about my academic progress and
coursework.
1 2 3 4 5
4. Meeting with the NWD advisor is helpful.
1 2 3 4 5
5. I feel comfortable meeting with the retention coordinator.
1 2 3 4 5
6. Meeting with the retention coordinator is helpful.
1 2 3 4 5
7. I believe the support services mentioned above (tutoring, retention seminars,
NWD advisor, and retention coordinator) are important to my academic progress.

159
1 2 3 4 5
8. I believe using these services (tutoring, retention seminars, NWD advisor, and
retention coordinator) have already helped me achieve academic success.
1 2 3 4 5
9. I intend to return to the Midwestern College next semester.
1 2 3 4 5
10. I believe my experience using the services (tutoring, retention seminars, NWD
advisor, and retention coordinator) have influenced my decision to return to the
college next semester.
1 2 3 4 5
11. I believe offering these support services demonstrates that my college supports
me.
1 2 3 4 5
12. What tools or resources have you found useful towards your success in your
program of study?
13. What tools or resources are available to you, but you have not used?
14. What tools or resources are available to you, but you have not found useful?
15. What recommendations do you have for additional tools or resources that could
be used for success in the future?
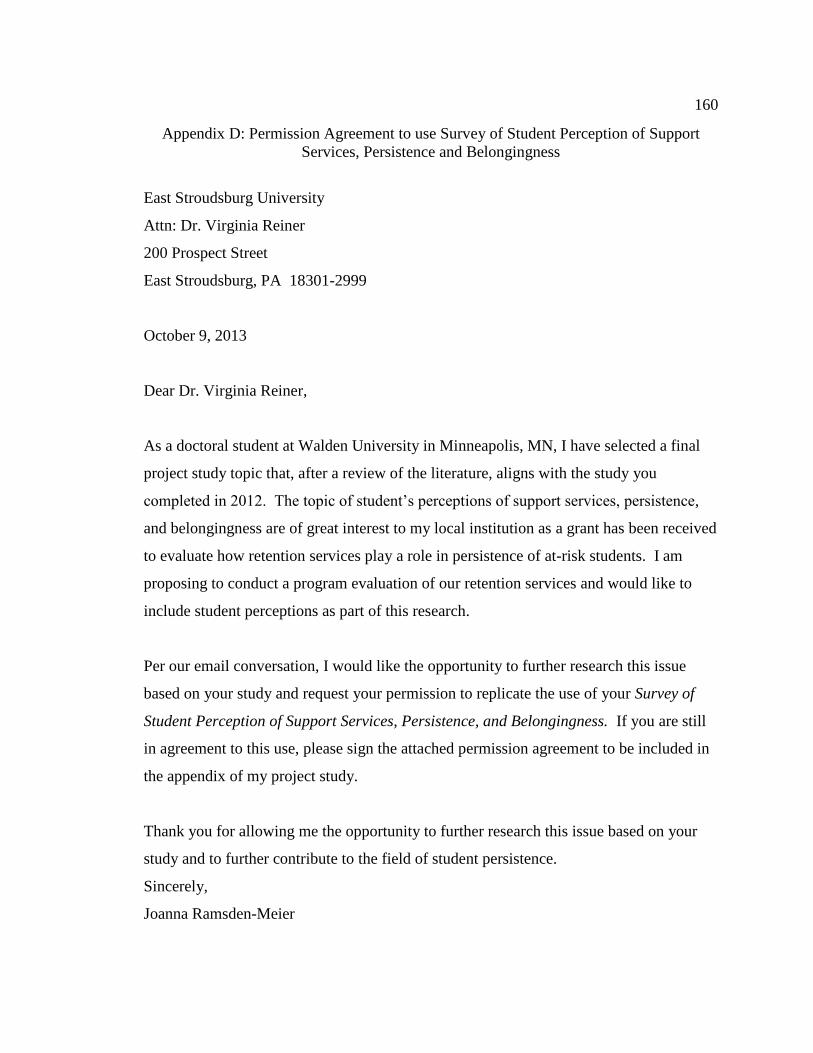
160
Appendix D: Permission Agreement to use Survey of Student Perception of Support
Services, Persistence and Belongingness
East Stroudsburg University
Attn: Dr. Virginia Reiner
200 Prospect Street
East Stroudsburg, PA 18301-2999
October 9, 2013
Dear Dr. Virginia Reiner,
As a doctoral student at Walden University in Minneapolis, MN, I have selected a final
project study topic that, after a review of the literature, aligns with the study you
completed in 2012. The topic of student’s perceptions of support services, persistence,
and belongingness are of great interest to my local institution as a grant has been received
to evaluate how retention services play a role in persistence of at-risk students. I am
proposing to conduct a program evaluation of our retention services and would like to
include student perceptions as part of this research.
Per our email conversation, I would like the opportunity to further research this issue
based on your study and request your permission to replicate the use of your Survey of
Student Perception of Support Services, Persistence, and Belongingness. If you are still
in agreement to this use, please sign the attached permission agreement to be included in
the appendix of my project study.
Thank you for allowing me the opportunity to further research this issue based on your
study and to further contribute to the field of student persistence.
Sincerely,
Joanna Ramsden-Meier

161
Permission Agreement
As the copyright holder of Survey of Student Perception of Support Services, Persistence,
and Belongingness (2012), I, Dr. Virginia Reiner, grant permission for Joanna Ramsden-
Meier to replicate the developed survey for the purpose of further research.
Dr. Virginia Reiner Date

162
Appendix E: Consent Form for Interview
CONSENT FORM You are invited to take part in a research study of retention services and at-risk students
in health care. The researcher is inviting a key informant involved in the community with
knowledge of the Midwestern College to be in the study. This form is part of a process called
“informed consent” to allow you to understand this study before deciding whether to take part.
This study is being conducted by a researcher named Joanna Ramsden-Meier, who is a doctoral
student at Walden University. You may already know the researcher as the Director of Student
Services at the Midwestern College, but this study is separate from that role.
Background Information: The purpose of this study is to determine the effect of retention services on the success of NWD
scholars.
Procedures: If you agree to be in this study, you will be asked to:
Take approximately one hour of time to have a conversation with the researcher
regarding your perceptions of the Midwestern College and its role in the future of health
care in this community.
Here is a sample question:
What types of activities do you see the Midwestern college engaging in to encourage at-
risk student success?
Voluntary Nature of the Study: This study is voluntary. Everyone will respect your decision of whether or not you choose to be in
the study. No one at the Midwestern College will treat you differently if you decide not to be in
the study. If you decide to join the study now, you can still change your mind later. You may stop
at any time.
Risks and Benefits of Being in the Study: Being in this type of study involves some risk of the minor discomforts that can be encountered in
daily life, such as fatigue, stress or becoming upset. Being in this study would not pose risk to
your safety or wellbeing.
The benefits of your participation include providing valuable input for future students.
Privacy: Any information you provide will be kept anonymous. The researcher will not use your personal
information for any purposes outside of this research project. Also, the researcher will not include
your name or anything else that could identify you in the study reports. Data will be kept secure
on a database on a password protected server accessed only by the researcher. Data will be kept
for a period of at least 5 years, as required by the university.
Contacts and Questions:

163
You may ask any questions you have now. Or if you have questions later, you may contact the
researcher via phone at 319.226.2004 or [email protected]. If you want to
talk privately about your rights as a participant, you can call Dr. Lisa Brodersen at 319-226-2034
or email [email protected]. the Midwestern College’s approval numbers for this
study are 14-0121 and 14-0124 and they expire on June 30, 2015.
The researcher will give you a copy of this form to keep.
Statement of Consent:
I have read the above information and I feel I understand the study well enough to make a
decision about my involvement. By signing below, I understand that I am agreeing to the terms
described above.
Only include the signature section below if using paper consent forms.
Printed Name of Participant
Date of consent
Participant’s Signature
Researcher’s Signature

164
Appendix F: Interview Guide
1. What are your perceptions of the Midwestern college and their commitment to the
community?
2. Where do you think the responsibility lies when a student does not finish their
program of study at the Midwestern college?
3. What negative impact do you see when a student does not finish their program of
study? (i.e. To the student, the Midwestern college, the community, the
profession).
4. How do you think students who finish their program of study are supported while
they are at the Midwestern college?
5. How do you think the students who do not complete their program of study are
failed by the Midwestern college?
6. What do you think the Midwestern college could do better to support all students?
7. What do you think students could do better to support themselves while attending
the Midwestern college?
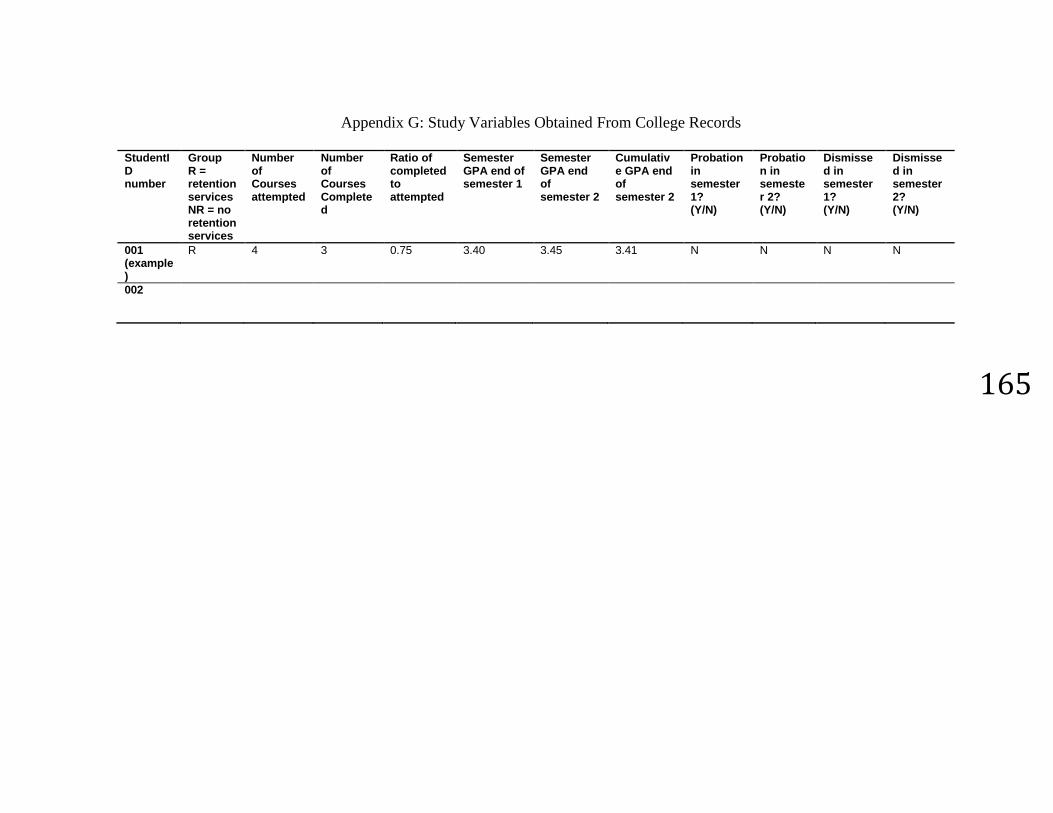
165
Appendix G: Study Variables Obtained From College Records
StudentID number
Group R = retention services NR = no retention services
Number of Courses attempted
Number of Courses Completed
Ratio of completed to attempted
Semester GPA end of semester 1
Semester GPA end of semester 2
Cumulative GPA end of semester 2
Probation in semester 1? (Y/N)
Probation in semester 2? (Y/N)
Dismissed in semester 1? (Y/N)
Dismissed in semester 2? (Y/N)
001 (example)
R 4 3 0.75 3.40 3.45 3.41 N N N N
002