1MEASURING AND EVALUATING TEAMWORK …ilin.asee.org/Conference2006program/Papers/Gaddini-P80.pdf ·...
16
1 MEASURING AND EVALUATING TEAMWORK EFFECTIVENESS IN UNDERGRADUATE PROJECT TEAMS AND EVALUATING TEAMWORK ENHANCEMENT INTERVENTIONS Anthony R. Gaddini 1 , Margaret Huyck 2 , Nishi Gupta 3 1 Illinois Institute of Technology, Chicago, Illinois; Email: [email protected] 2 Illinois Institute of Technology, Chicago, Illinois; Email: [email protected] 3 [email protected] 1. INTRODUCTION 1.1 Abstract All undergraduate students in Illinois Institute of Technology are required to complete two InterProfessional (IPRO®) projects as part of their General Education Requirement. One of the important meta-objectives of the IPRO program is the development of individual skills need to assure team competency. A Teamwork Functioning survey followed by a very brief intervention protocol for developing team effectiveness is now in its third semester of implementation; results from the first two semesters (Trial 1 and Trial 2) are reported here. During Trial 1, students from a subset of eleven teams completed the Survey in week 5, received prompt feedback of their own responses compared with other teams, had a facilitated discussion on how to improve team functioning, and created an Action Plan for improvement; at the end of the semester they again completed the Survey. The remaining 23 teams participated only in the last step by completing the Teamwork functioning survey at the end of the semester. Results indicated that the Intervention Teams significantly improved their perceived teamwork functioning. During Trial 2, all teams completed the Teamwork Survey about four weeks after teams were formed, and again at the end of the semester (week 15). Although results showed an overall improvement in perception of team functioning between weeks 4 and 15, the Intervention subset overall did not show a larger increase than the “control” teams. One interpretation of this result is that simply assessing teamwork functioning may provide sufficient intervention to prompt teamwork improvement. Future efforts, guided by the current semester’s results, will focus on how to identify teams that are most in need of intervention and the most efficient and effective way to provide it. Item analyses were conducted to determine the major challenges to effective team functioning. We compared the highest and lowest scoring items across two semesters and found consistent 1 American Society for Engineering Education March 31-April 1, 2006 – Indiana University Purdue University Fort Wayne (IPFW) 2006 Illinois-Indiana and North Central Joint Section Conference
-
Upload
hoangthien -
Category
Documents
-
view
219 -
download
2
Transcript of 1MEASURING AND EVALUATING TEAMWORK …ilin.asee.org/Conference2006program/Papers/Gaddini-P80.pdf ·...

1MEASURING AND EVALUATING TEAMWORK EFFECTIVENESS INUNDERGRADUATE PROJECT TEAMS AND EVALUATING TEAMWORK
ENHANCEMENT INTERVENTIONS
Anthony R. Gaddini1, Margaret Huyck2, Nishi Gupta3
1Illinois Institute of Technology, Chicago, Illinois; Email: [email protected] Institute of Technology, Chicago, Illinois; Email: [email protected]
1. INTRODUCTION
1.1 Abstract
All undergraduate students in Illinois Institute of Technology are required to complete twoInterProfessional (IPRO®) projects as part of their General Education Requirement. One of theimportant meta-objectives of the IPRO program is the development of individual skills need toassure team competency. A Teamwork Functioning survey followed by a very brief interventionprotocol for developing team effectiveness is now in its third semester of implementation; resultsfrom the first two semesters (Trial 1 and Trial 2) are reported here. During Trial 1, students froma subset of eleven teams completed the Survey in week 5, received prompt feedback of their ownresponses compared with other teams, had a facilitated discussion on how to improve teamfunctioning, and created an Action Plan for improvement; at the end of the semester they againcompleted the Survey. The remaining 23 teams participated only in the last step by completingthe Teamwork functioning survey at the end of the semester. Results indicated that theIntervention Teams significantly improved their perceived teamwork functioning. During Trial 2,all teams completed the Teamwork Survey about four weeks after teams were formed, and againat the end of the semester (week 15). Although results showed an overall improvement inperception of team functioning between weeks 4 and 15, the Intervention subset overall did notshow a larger increase than the “control” teams. One interpretation of this result is that simplyassessing teamwork functioning may provide sufficient intervention to prompt teamworkimprovement. Future efforts, guided by the current semester’s results, will focus on how toidentify teams that are most in need of intervention and the most efficient and effective way toprovide it.
Item analyses were conducted to determine the major challenges to effective team functioning.We compared the highest and lowest scoring items across two semesters and found consistent
1 American Society for Engineering Education
March 31-April 1, 2006 – Indiana University Purdue University Fort Wayne (IPFW)2006 Illinois-Indiana and North Central Joint Section Conference

patterns. The highest scoring items reflected confidence in student and faculty team leadershipand in having a worthwhile project goal. The lowest scoring items reflected relative concernabout external support and recognition, unified commitment, and results-driven structurecategories. The low-scoring items can be used to guide changes in the intervention program.
1.2 Overview of the Program
The purpose of the teamwork intervention program was to improve the functioning ofinterprofessional project (IPRO) teams at the Illinois Institute of Technology (IIT), with theultimate objective of building the competencies identified by Criterion 3 of the Criteria forAccrediting Engineering Programs for 2006-2007 (similar to those identified earlier, in 2000)(ABET, 2005) and meeting the expectations of employers that our graduates will understand howto work and learn effectively in multi-disciplinary teams. Unfortunately there is little consensuson how to develop these skills, although there are some excellent guidelines on incorporatingteamwork into existing courses (Oakley et al., 2004). IPROs were added to the IITundergraduate colleges in 1995 with the goals of developing multidisciplinary teamwork,communication, and project management skills, an awareness of ethical issues practice, and adesire for continued learning. These five goals are presented as Learning Objectives for theIPRO program, and all students are expected to significantly develop these skills after taking twoIPRO courses.
Each semester 30-35 IPRO teams are formed (involving about 24 instructors and approximately400 students from across the university). Most students are juniors or seniors, though a fewsophomores and first year students enroll. Each team consists of seven to fifteen students, andone or more faculty. Some of the projects also involve sponsors from various organizations,ranging from entrepreneurial businesses to non-profit health care agencies. These clients andsponsors propose a real world problem for each IPRO team to investigate. Faculty and studentsfrom the university are also encouraged to submit project proposals. All the proposals arereviewed before each semester commences and voted upon by chosen faculty and students. Thereview of proposals process is done in order to ensure quality projects that will engageparticipants and offer the chance to acquire knowledge of the Learning Objectives. Types ofIPRO projects include research, design, process improvement, and business planning, performingas service learning projects, entrepreneurial projects, consulting projects and internationalservice. The majority of students are engineering or science majors with significant minorities ofarchitecture and computer science majors; students also come from majors in psychology,humanities, social science and business. Some graduate students (especially in design, law, orbusiness) take an IPRO as an elective. Teams must be composed of at least three differentmajors, in order to satisfy the criteria of being a “multi-disciplinary” learning experience.
All teams participate in IPRO Day at the end of the semester, when they present a coherentdescription of their project and discuss their project via an Exhibit. The presentations andexhibits are judged by a panel of 3-6 judges (drawn from faculty, IIT graduates, sponsors, andgraduate students); some teams are also judged on their website and/or technical achievement.Significant cash prizes are awarded to the winning teams, and winners in each track arepublished. This creates incentives for the teams to do well enough to be competitive with theother teams.

Projects are designed to have a single-semester cycle, though some projects continue (in someform) for more than one semester. Many projects begin with the majority, or all, of the studentsnew to the project. There is rarely a “group process” into which new members can beassimilated. While this may not be ideal, Oakley et. al. (2004) certainly suggest that single-semester team projects can be useful vehicles for developing teamwork competencies.
Over the past few years, the IPRO Program has begun to establish systematic evaluation of thevarious parts of the program in order to strengthen areas that need improvement or revision. Seehttp://ipro.iit.edu for more background information. One of the major challenges is to developways of measuring whether the intended learning goals are being met. An important guide todeveloping self-report instruments to measure the professional outcomes specified by the ABETCriterion 3 has been provided by Immekus et al. (2004). They point out the importance of (a)identifying existing measures that are appropriate for assessing progress, (b) modifying existingmeasures, or (c) developing new measures. We have chosen to modify an existing measure forteamwork effectiveness and a strategy for improving team excellence.
2. METHODS
2.1 The Measure of Teamwork Effectiveness
We initially worked with a volunteer consultant (James Austin) from St. Aubin, HaggertyAssociates, Inc. and we decided to modify a survey developed by his firm to measure teamworkfunctioning in industry work groups. The survey was developed on the basis of research byLaFasto and Larson (1989) reporting on extensive studies of work groups. The survey measureincludes 20 statements; response options are 1 = False, 2 = More False than True, 3 = More Truethan False, 4 = True. Statements are phrased so that True statements describe teams assessed tobe well-functioning in business settings.
They identified seven dimensions differentiating poorly functioning and effective teams: (1) aclear, elevating goal (items 1,2), (2) results-driven structure (items 3, 4, 5), (3) competent teammembers (items 6, 7, 8), (4) unified commitment (items 9, 10), (5) collaborative climate (items11, 12), (6) standards of excellence (items 13, 14), and (7) external support and recognition(items 15, 16). The original survey included seventeen Likert-scaled items, with items designedto correspond to these dimensions. We added two dimensions specifically adapted to the IPROprogram: (8) the performance of the student team leader (items 17, 18, 19) and (9) appropriateautonomy provided by the faculty advisor (item 20). The measure is shown in Figure 1, with thedimensions noted.

Figure 1: The Survey Measure of Team Excellence, With Dimensions Noted
2.2 Population and Sample
For the pre-pilot, feasibility study, five teams were selected to receive the intervention becausethe faculty leader was very interested in the process. We recognized that we would need todemonstrate the usefulness of even this minor intervention before introducing it as a required (oroptional) part of the IPRO program overall. For the first pilot (Trial 1, spring semester 2005) theoriginal goal was to get most of the IPRO faculty join the study (in either an intervention orcontrol mode) and assign their teams randomly to the two modes. Our plan was to randomlyselect one half of the IPRO teams and request them to receive the intervention; the other half
Clear, elevating goal
Results-drivenstructure
Competent teammembers
Unified commitment
Collaborative climate
Standards of excellence
External support andrecognition
Team leadership(modification)

serving as the control group. Unfortunately, very few of the invited faculty advisors agreed toparticipate. We then enlisted eleven teams (99 students) with cooperative faculty advisors andused the remaining 23 as control teams (218 students). (Procedures and results of the pre-pilotand Trial 1 are detailed in Gutpta, 2005.)
A similar procedure with Trial 2 (fall 2005) resulted in ten intervention teams (77 students) and24 control teams. The cooperative faculty in Trial 1 included two Senior Lecturers each advisingfive IPRO teams and one faculty member advising one team; during Trial 2 the same two SeniorLecturers participated with their ten teams. (We recognize that this is not a desirable samplingstrategy but it seemed to be the only way to begin the process of assessing a potentialintervention.)
There were two trial semesters from which data was collected. The first semester was spring2005 and second was fall of 2005. In trial 1, eleven of thirty-four teams participated. In trial 2,ten of thirty-four teams participated. Teams are approximately twelve students.
2.3 Teamwork Intervention Methods
Many strategies have been described for improving the functioning of various kinds of teams.Some seem to have good outcomes but involve elaborate, time-intensive combinations ofinformation, role playing, and feedback – approaches that seemed unsuited to our student projectteams. Our Teamwork effectiveness intervention strategy was adapted from one developed andused in industry (Larson and LaFasto, 1989). We specifically adapted a “classical intervention”technique based upon four steps: identifying themes that characterize effective team functioning,presenting such themes to the team, identifying strengths and weaknesses, and generating areport using the identified strengths and weaknesses aimed at improving team functioning (Jonesand Bearly, 2001). We also strove to have members of the team highlight their differences anddiscuss them constructively, as recommended by Jabri (2004). The facilitators for theseinterventions were professionals experienced in these types of exercises. The facilitator’spurpose is to emphasize open discussion and setting and maintaining a constructive tone.
In each trial, Time 1 assessments were made after the project teams had been meeting for 4-5weeks, to allow time to develop some level of group process. The administration of the Surveywas done as part of the regular team meeting, and was accomplished in approximately 10minutes. Students completed an Informed Consent, in which results were described asanonymous and confidential. The survey results were processed by the University Center forPsychological Services, who provided an SPSS data base and summary indicators for each team.From these data, individualized Team Reports were constructed, showing the five Survey itemswith the highest mean scores for the team (“Strengths”), the five items with the lowest scores(“Areas for Development”), and the mean scores, distribution of responses for each of the items,and the mean score for the total intervention cohort to enable peer comparisons. For Trial 2, themean scores for all teams were provided. A copy of one Team Report is included as Appendix 1.
After the Team Reports were generated, each of the participant teams scheduled a 45 minutefeedback session to review and discuss the results. These discussions were led by a persontrained and experienced in facilitating group discussion. We decided that this person should not

be the faculty advisor, since some sources of tension arise with the role or style of that person;and that it not be an undergraduate student. Some faculty advisors chose to remain for thediscussion; others decided not to attend. The discussion leader (usually one of the evaluationspecialists for the program) distributed the reports to each of the team members, emphasizingthat the results reflected simply how they, collectively, evaluated their team experience at thatpoint. Discussion questions centered on whether results were surprising or expected, and whetherthere were any ratings that were hard to interpret. Discussion of strengths focused onunderstanding what behaviors were reflected in the ratings. Similarly, discussion of problematicareas focused on factors that might have already changed, or could change in the future. Thefinal step in the intervention was to have students make a three-column spread on the board, withheaders for “Continue”, “Stop” and “Start” doing in order to enhance their team functioning bythe end of the semester. The facilitator made sure that each student had an opportunity tocontribute to each column. This became their Action Plan. One student was designated totranscribe the notes, and send them to all team members, the faculty advisor, and the IPROoffice.
Ideally, the facilitated discussions should be done soon after the initial teamwork assessment. ForTrial 1, because we were only dealing with data for 11 teams, surveys were collected during the5th week and we scheduled feedback discussions during the 6th or 7th weeks. For Trial 2, becausewe surveyed all 34 teams and wanted to use the norms from all teams, most of the data collectionwas accomplished during week 5, but the intervention teams did not have a discussion of theirresults until week 8.
From the time of the discussion to the end of the semester, decisions related to the teamworkintervention protocol were made exclusively by the team members and their faculty advisors. Wehave no direct knowledge of the extent they may have used the Action Plan as a guide. In the lastweek (Time 2) all teams completed the same Teamwork Functioning Survey that they had doneafter the first 4-5 weeks.
3. RESULTS
3.1 Survey Samples
The study included sixty-eight teams involving approximately 532 students. Not all studentscompleted one or both surveys, despite our good efforts to encourage participation. The numberof surveys available for Trial 1 and Trial 2 are shown in Table 1.
As the table shows, during Trial 1 we collected teamwork surveys from the control teams only atthe end of the semester. During Trial 2 we collected the surveys from all teams at Time 1 andTime 2.

Table 1: Teamwork Survey Samples
Trial 1(spring ’05)
Trial 2(fall ’05)
Total
Number of Teams Total 34 34 68 Intervention 11 10 21 Control 23 24 47
Number of Students 301 231 532 Intervention Time 1 111 77 188 Intervention Time 2 83 72 155 Control Time 1 Not Available 112 112 Control T 2 218 159 377
3.2 Reliability and Validity
The modified Teamwork Function survey has robust internal reliability as measured by theAlpha statistic; split-half values range from .88 to .93 for the administrations. Evidence ofconstruct validity was established by the researchers who initially constructed the measure(LaFasto & Larson, 1989). Additional evidence comes from the facilitated discussions with theintervention teams. While teams often indicated that “things had changed” (for the better) sincethe survey was administered, very few challenged the interpretations or meanings of the surveyresults as a reflection of their team at the time of initial assessment.
3.3 Least and Most Challenging Aspects of Teamwork
In order to better understand the ways in which students are experiencing IPRO teams, weexamined the overall reports of items in the survey, to identify consistent issues about which ourteams seem to feel comfortable, and areas in which they feel challenged and presumably need themost help. There were substantial consistencies for the two semesters, both early in the term andat the end of the term. Teams feel most confident about there being a clear need for their teamproject, and that their student team leader is fair, open to new ideas, and personally committed tothe project. These results suggest that overall the processes of selecting IPRO projects, and ofidentifying student leadership, are effective.
Overall, students are less confident that they have adequate methods in place for monitoringindividual performance and giving feedback, or that they have the resources available to them toaccomplish their projects. They are not confident that “team members are willing to devotewhatever effort is necessary to achieve Team success” and they are not, overall, likely to feel thattheir team is “sufficiently recognized for its accomplishments.” These results suggest that theseare developmental goals for the program as a whole; the “overall program” cannot be changedwith interventions.

3.4 Intervention Outcomes
In order to assess the possible impact of our facilitated discussion intervention on teamfunctioning, we compared the Teamwork survey responses at Time 1 (approximately 4 weeksafter team formation) and Time 2 (approximately 15 weeks after team formation). During Trial 1(spring) we administered the Teamwork survey at the end of the semester to all team members,providing a Time 2 comparison of the Intervention and Control Teams. During Trial 2 (fall) wedecided to administer the survey at both times to all teams, but provide the facilitated discussiononly to the Intervention teams. Independent sample T-tests were used to compare Interventionand Control Groups; paired sample T-tests were used to Time 1 and Time 2 responses.
Average scores (Mean and Standard Deviation) for the overall Team Excellence survey, and thenine dimensions are shown in Table 2. This is a composite table showing results from theIntervention and Control teams, at Time 1 and Time 2, for Trials 1 and 2. The table indicates thelevel of significance of differences between the Intervention and Control teams for each time andeach trial, and the statistical difference between Time 1 and Time 2 assessments.
As this shows, for Trial 1 the Intervention teams improved significantly from Time 1 to Time 2testing, and at Time 2 they felt their teams were functioning more positively than did the Controlteams. However, results for Trial 2 indicate that all teams generally improved from the firstassessment to the second assessment (although not a statistically significant level).
Because data were (unfortunately) not collected for the Control teams at Time 1 during Trial 1,we can compare initial attributions of the teams only for Trial 2. For Trial 2, at Time 1 the onlystatistically significant difference between the control and intervention teams was that the controlteams were more likely to indicate they already had high standards of excellence for themselvesand were willing to expert pressure on themselves to improve performance (items 13 and 14 inthe questionnaire). It is difficult to estimate how important this initial difference was. By the endof the semester, the control teams and the intervention teams were equal on this dimension.
We looked more closely at the dimensions included in the Teamwork Survey. As shown inTables 2 & 3, by the end of the semester, the Intervention teams in Trial 1 were more likely tofeel they had a clear, elevating goal, had competent team members, held themselves to highstandards of excellence, and received more external support and recognition. These are certainlyamong the results we would like to see for the intervention. However, during Trial 2, the ControlTeams reported more unified commitment, and were more likely to feel their faculty leaderprovided the autonomy necessary for learning and achievement. During Trial 1 there were nodifferences between the sets of teams on four of the dimensions, and during Trial 2 there were nodifferences on six of the eight dimensions.

Table 2: Teamwork Excellence Dimensions for Intervention and Control Teams:Trial 1 (Spring ’05) and Trial 2 (Fall ’05) Semesters
Trial 1 Spring Sig Trial 2 Fall SigIntervent Control I-C Intervent Control I-C
Dimension Mean(SD)
Mean(SD)
Mean(SD)
Mean(SD)
Average Time 1 3.20 (.59) ---- 3.13 (.57) 3.19 (.69) nsAverage Time 2 3.30 (.38) 3.17 (.50) <.02 3.22 (63) 3.33 (.68) ns
Significance Time 1 – Time 2 <.001 Ns NsClear goal Time 1 3.27 (.82) ---- 3.25 (.72) 3.34 (.78) nsClear goal Time 2 3.51 (.49) 3.37 (.69) <.05 3.36 (.59) 3.52 (.61) .058
Significance <.003 Ns <.001Results-driven structure Time 1 3.12 (.67) ---- 3.03 (.59) 3.09 (.68) nsStructure Time 2 3.14 (.49) 3.08 (.63) ns 3.12 (.51) 3.26 (.60) ns
Significance ns Ns <.001Competent team members Time 1 3.15 (.71) ---- 3.17 (.58) 3.11 (.70) nsTeam members Time 2 3.49 (.51) 3.29 (.63) <.01 3.26 (.54) 3.25 (.63) ns
Significance <.001 Ns <.001Unified commitment Time 1 3.08 (.76) ---- 3.12 (.65) 3.10 (.68) nsUnified commitment Time 2 3.20 (.60) 3.11 (.66) ns 3.11 (.60) 3.28 (.67) .055
Significance ns Ns <.001High standards of excellence set by teamTime 1
3.15 (.79) ---- 2.98 (.62) 3.16 (.72) <.05
Excellence Time 2 3.38 (.54) 3.18 (.75) <.01 3.23 (.65) 3.28 (.68) nsSignificance <.003 <.001 <.022
External support & recognition Time 1 3.02 (.72) ---- 2.95 (.57) 2.94 (.76) nsExternal support Time 2 3.07 (.70) 2.90 (.85) <.05 2.94 (.65) 3.09 (1.5) ns
Significance ns Ns NsStudent team leader Time 1 3.43 (.80) ---- 3.41 (.72) 3.41 (.77) nsStudent team leader Time 2 3.54 (.56) 3.48 (.64) ns 3.54 (.57) 3.43 (.67) ns
Significance ns <.04 NsFaculty leader provides right amount ofautonomy Time 1
3.18 ---- 3.28 (.81) 3.38 (.83) ns
Faculty leader Time 2 3.51 (.49) 3.37 (.69) ns 3.10 (.96) 3.48 (.74) <.001Significance <.001 Ns ns
Table 3 also lists the dimensions that showed improved team functioning, an important analysissince we recognize that most (if not all) teams go through a normal developmental process.Indeed, both intervention teams and control teams feel more confident about their project goal,about the competence of their team members, and about setting high standards of excellence forthemselves. During Trial 1, the intervention teams were also more likely to increase their ratingsof their faculty leaders; during Trial 2 they increased ratings of student leaders.
We are now collecting data for Trial 3, during the spring semester of 2006; we have tenintervention teams and 24 control teams. Results from these teams will provide clarification onthe potential for this minimal intervention.

Table 3: Teamwork Excellence Scores for Intervention and Control Teams
A. Dimensions Showing Different Functioning at End of SemesterBetween Intervention and Control Teams
Better Functioning of Intervention Teams Better Functioning of Control Teams
Clear, elevating goal (Trial 1) Unified commitment (Trial 2)Competent team members (Trial 1) Faculty leader provides autonomy
(Trial 2)High standards of excellence (Trial 1)External support & recognition (Trial 1)
B. Dimensions Showing Improved Team Functioning
Intervention Teams Control Teams (Only Trial 2)
Clear, elevating goal (Trial 1) Clear, elevating goalResults-driven structure
Competent team members (Trial 1) Competent team membersUnified commitment
High standards of excellence (Trials 1, 2) High standards of excellenceEffective student team leader(s) (Trial 2)Effective faculty leader (Trial 1)
4. SUMMARIES AND DISCUSSION
4.1 Goals
We have described what may be the most challenging situation for those interested in developingeffective teamwork skills among a group of individuals. While most of the literature dealing withassessing and nurturing multi-disciplinary teamwork has developed within the context of realwork challenges, we (and many others) are trying to prepare the workers before they reach the“world of work.” We are dealing with undergraduate students, most of whom are in their earlyphases of adult development. While they have selected an academic major, most of them are notyet launched into a job which they may hope will become a career. A survey of theundergraduate students at IIT indicates that they are signing on to an IPRO Project because it is arequirement, and/or because they hope to gain something from the experience. Students selectprojects for a wide variety of reasons, and it is difficult to shift them out of a project once theyare enrolled (for various academic/bureaucratic reasons). The faculty advisors are expected toguide their somewhat-randomly-selected teams toward technical proficiency, a valuable product(for a client, IPRO-Day judges, and themselves), and to help all the students develop the range of“soft” skills captured by the goals of teamwork, project management, ethical decision-making,communication and capacity to become a lifelong learner. This is an ambitious educationalagenda.

We have carried out other evaluations that indicate that the IPRO Program is largely effective, asjudged by the students, faculty, alumni, and IPRO-Day judges who have been and are nowinvolved with the Program.
4.2 Outcomes: Does the Intervention Work?
This particular report has focused on one significant challenge: how to facilitate the developmentof effective teamwork given the diversity of students, teams, faculty, sponsors, and particularcircumstances. We have given a very minimal intervention a trial – and the results are somewhatpromising. For the minimal intervention strategy employed to improve team functioning, thespring’s results were promising—there was improvement. Unfortunately, there were no mid-semester control data to benchmark our improvements. We expected the fall semester to be evenmore successful than the first since we were more experienced in our interventions. Surprisingly,the control teams in the fall improved about the same amount as intervention teams. Because ofthis surprising outcome we examined different circumstances in the two semesters that may havecontributed to these results.
4.3 Possible Special Problems with Trial 2
The first possibility is that the two semesters are not, in fact, equivalent. During the Trial 2, we ineffect had two interventions: administering the Teamwork Effectiveness Survey around weekfour after team formation is a form of intervention, possibly leading students to think morecarefully about these dimensions than they might have otherwise. This might better beconceptualized as “Intervention Lite” rather than a “non-intervention” or control situation. Theintervention teams had the benefit of additional processing of their team issues with thefacilitator, but this appears to have had no measurable impact. The second possibility is that thereis enough variability in initial team strengths to mask possible effects of the intervention. In fact,at least two of the teams in the intervention group would be considered quite dysfunctional (bymost measures, even for short-term academic teams); while their issues were discussed andAction Plans were formulated, it is unlikely that these teams benefited sufficiently to make adifference by the end of the semester. Third, the timing of the intervention may be important.During Trial 2 the intervention discussions were not carried out until week 8 of the semester, oneor two weeks later than for Trial 1. (During Trial 3 we have managed to have survey collectionin week 5 and intervention discussions during week 6, by processing the data for the interventionteams as soon as it is received and using norms from prior semesters.) Finally, perceived facultyguidance styles may be important. The intervention teams were all guided by two primaryfaculty members, though in most cases a second faculty member shared the team guidance. Wewill check out this possibility by more careful analysis of results team by team.
4.4 Some Issues in the Program
An intervention such as this has more potential to address some aspects of team functioning thanothers. The improvements noted in team functioning during Trial 1 concerned the internalworkings of the team itself. It is notable, however, that the intervention seemed ineffective inaddressing the most troubling issue of whether all team members “are willing to devote whatever

effort is necessary to achieve Team success.” Discussion sessions made it clear that studentsconsider this to be an unrealistic goal, given their other academic (and personal) demands – andthat they are not “compensated” for their project work (as they are, or will be, in employment).Finally, we can note the issue of “sufficient recognition for team accomplishments.” Thisremains an issue of disquiet for many students. While the students who are recognized (andrewarded) by the honors ensuing from IPRO Day judging feel good, those who feel they haveworked hard on important projects but are not so recognized feel let down. We probably need toinclude additional, ongoing mechanisms of recognition, from the sponsors, the universitycommunity as a whole, from the faculty advisors, and from the IPRO Program staff to enhancethe IPRO project experience. Some aspects that have been identified as central to effective teamfunction are beyond the scope of student participants to effect, even though we can encouragethem to be creative about possible strategies for effecting desired outcomes. For example, theimportance of the initial project conceptualization, to a client or some other interestedstakeholder, is usually set before a student signs onto the project. Fortunately, most of the IPROstudents believed that their project was worthwhile, though there were some who came toappreciate the importance of the project as they became more involved.
The intervention described is a relatively minimalist, cost-effective intervention, with an averagetime investment for the intervention teams of one hour during the semester. This makes itpossible to implement on a larger scale, provided that the necessary production support isavailable for survey reproduction, distribution, collection and analysis, and that appropriateskilled personnel are available to conduct the facilitated discussions during a short time frame.
4.5 Limitations
We recognize several limitations in the current implementation and assessment process. (1) Theintervention teams were not randomly selected, and thus the results may be biased by includingteams whose faculty guides and student leaders were willing to cooperate. (2) The interventionmay be very effective for some teams, but not needed for others. Further analyses of our datawill help us identify teams that benefited more, with the intention of developing “early warning”systems that will allow us to provide teamwork intervention on a timely basis only for thoseteams likely to benefit. (3) The intervention described is probably more effective for addressing asubset of the issues of less functional teams, primarily those dealing with internal teamnegotiations; one of the most troubling issues is dealing with less-committed/ productive teammembers. Other matters, such as selecting worthwhile projects, identifying competent studentteam leaders, helping faculty to provide the right amount of autonomy so the students learn andachieve results, and arranging appropriate resources and recognition are probably best left to theprogram organizers.
4.6 Summary of conclusions
The Teamwork Effectiveness Intervention for undergraduate student multidisciplinary projectteams described in this report has shown some promise. It is a brief intervention, requiringapproximately one hour of team participation time. The measure used to assess teamworkfunctioning has good reliability and evidence of validity. Further work with this tool iswarranted.

REFERENCES
ABET (2005). Criteria for Accrediting Engineering programs Effective for the Evaluations During the 2006-2007 Accreditation Cycle. The Engineering Accreditatation Board for Engineering and Technology. http://www.abet.org/eac/eac/htm.
Gupta, N. (2005) Evaluating a Teamwork Effectiveness Intervention: a Review ofLiterature on Effective Teamwork and a Pilot Project for the IIT IPRO Program. SeniorTheses. Institute of Psychology. 3101 South Dearborn Street
Suite 252 Chicago, IllinoisImmekus, Jason C., Tracy, Sara, Yoo, Jin Eun, Maller, Susan J., French, Brian F., & Oakes,
William C. (2004). Developing self-report instruments to measure ABET EC 2000 Criterion 3 professional outcomes. In Proceeding of ASEE Annual Conference. American Society for Engineering Education.
Jabri, M. (2004) Team feedback based on dialogue: Implications for changeManagement. The Journal of Management Development, 23 (2), 141
Jones, J. E. and Bearly, W. L. (2001) Facilitating team development: A view from thefield. Group Facilitation, 3, 56-66.
LaFasto, F. M. J. and Larson, C. E. (1989) Teamwork: What Must Go Right/What CanGo Wrong. Sage Publications, Inc., Newbury Park, California.
Oakley, Barbara, Felder, Richard, Brent, Rebecca & Elhajj, Imad (2004). Turning student groupsinto effective teams. Journal of Student Centered Learning, 2 (1), 9-34.

APPENDIX 1SAMPLE REPORT FOR INTERVENTION TEAMS
[spacing altered]
TEAMWORK EFFECTIVENESSFEEDBACK REPORT
IPRO PROGRAM FALL 2005
TEAM # 999
Number of students responding: 11
Surveys Completed during Week 5Discussion of Surveys Week 8
Dr. Margaret H. Huyck, Institute of PsychologyAnthony Gaddini, IPRO Scholar
NOTE ON THIS REPORT: Responses from your team are presented as means (average) scoresfor all the students responding. In addition, we provide the number of students who said that astatement was True, Mostly True, Mostly False, or False.
The means for your team are compared with:• the means for all the IPRO teams who completed the questionnaire in October, 2005 (181
students in all), and• a grand mean for students responding to the questionnaire over three semesters (314
students) at the end of the semester.
We have organized the responses to indicate the Strengths of your team, and the items on whichyou indicate some need to Improve your functioning. You can use this information to identifystrategies for making your team even more effective.
During our discussion, your team identify that you will:• CONTINUE doing because the practices are effective• STOP doing because the practices are interfering with your team effectiveness• START doing to improve your teamwork by the end of the semester

STRENGTHS OF TEAM 999: October, 2005
ITEM TeamMean
All Fall05
Teams
3-SemesterMean
T MT MF F
1. Clearly defined need 3.91 3.42 3.11 10 1 0 019. Our Leader is open to new ideas andinformation from Team members.
3.80 3.46 3.48 7 3 1 0
18. Team leader is fair and impartial 3.60 3.45 3.48 8 2 0 0 7. Each individual on the Teamdemonstrates a strong desire to contribute tothe Team’s success.
3.55 3.04 3.11 7 3 1 0
8. Team members are capable ofcollaborating effectively with each other.
3.55 3.24 3.17 7 3 1 0
9. Achieving our team goal is a higherpriority than any individual objective.
3.55 3.30 3.28 6 5 0 0
AREAS TO IMPROVE FOR TEAM 999: October, 2005
ITEM TeamMean
All Fall05
Teams
3-SemesterMean
T MT MF F
16. Our team is sufficiently recognized for itsaccomplishments. .
2.55 2.87 2.95 0 6 5 0
14. Our Team exerts pressure on itself toimprove performance.
2.64 2.97 3.06 1 5 6 0
6. Team members possess the essential skillsand abilities to accomplish the team’sobjectives.
3.09 3.15 3.16 2 8 1 0
13. Our team has high standards ofexcellence.
3.09 3.20 3.16 2 8 1 0
15. Our Team is given the resources it needsto get the job done.
3.09 3.02 3.06 2 8 1 0
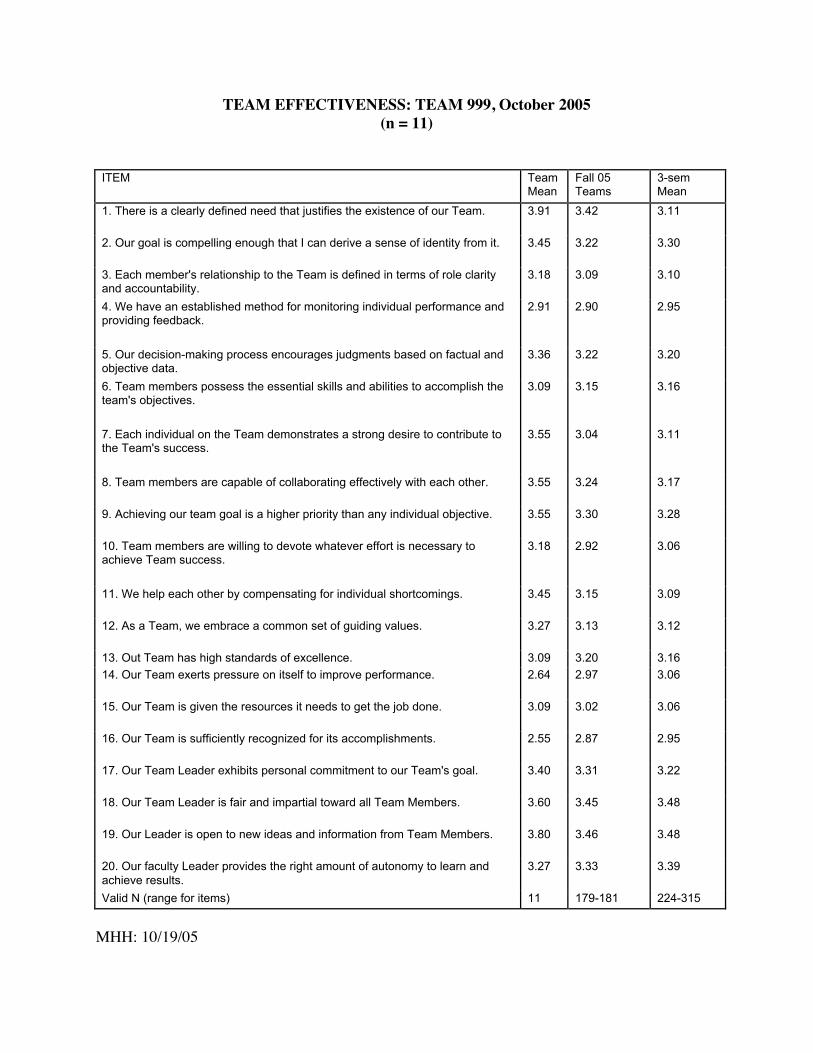
TEAM EFFECTIVENESS: TEAM 999, October 2005(n = 11)
ITEM TeamMean
Fall 05Teams
3-semMean
1. There is a clearly defined need that justifies the existence of our Team. 3.91 3.42 3.11
2. Our goal is compelling enough that I can derive a sense of identity from it. 3.45 3.22 3.30
3. Each member's relationship to the Team is defined in terms of role clarityand accountability.
3.18 3.09 3.10
4. We have an established method for monitoring individual performance andproviding feedback.
2.91 2.90 2.95
5. Our decision-making process encourages judgments based on factual andobjective data.
3.36 3.22 3.20
6. Team members possess the essential skills and abilities to accomplish theteam's objectives.
3.09 3.15 3.16
7. Each individual on the Team demonstrates a strong desire to contribute tothe Team's success.
3.55 3.04 3.11
8. Team members are capable of collaborating effectively with each other. 3.55 3.24 3.17
9. Achieving our team goal is a higher priority than any individual objective. 3.55 3.30 3.28
10. Team members are willing to devote whatever effort is necessary toachieve Team success.
3.18 2.92 3.06
11. We help each other by compensating for individual shortcomings. 3.45 3.15 3.09
12. As a Team, we embrace a common set of guiding values. 3.27 3.13 3.12
13. Out Team has high standards of excellence. 3.09 3.20 3.16
14. Our Team exerts pressure on itself to improve performance. 2.64 2.97 3.06
15. Our Team is given the resources it needs to get the job done. 3.09 3.02 3.06
16. Our Team is sufficiently recognized for its accomplishments. 2.55 2.87 2.95
17. Our Team Leader exhibits personal commitment to our Team's goal. 3.40 3.31 3.22
18. Our Team Leader is fair and impartial toward all Team Members. 3.60 3.45 3.48
19. Our Leader is open to new ideas and information from Team Members. 3.80 3.46 3.48
20. Our faculty Leader provides the right amount of autonomy to learn andachieve results.
3.27 3.33 3.39
Valid N (range for items) 11 179-181 224-315
MHH: 10/19/05