EVALUATING FREE SHRINKAGE OF CONCRETE FOR CONTROL …iri/projects/concrete/SM89.pdf · EVALUATING...
290
EVALUATING FREE SHRINKAGE OF CONCRETE FOR CONTROL OF CRACKING IN BRIDGE DECKS By Swapnil Deshpande David Darwin JoAnn Browning A Report on Research Sponsored by CONSTRUCTION OF CRACK-FREE BRIDGE DECKS TRANSPORTATION POOLED FUND STUDY Project No. TPF-5(051) Structural Engineering and Engineering Materials SM Report No. 89 THE UNIVERSITY OF KANSAS CENTER FOR RESEARCH, INC. LAWRENCE, KANSAS January 2007
Transcript of EVALUATING FREE SHRINKAGE OF CONCRETE FOR CONTROL …iri/projects/concrete/SM89.pdf · EVALUATING...

EVALUATING FREE SHRINKAGE OF CONCRETE FOR
CONTROL OF CRACKING IN BRIDGE DECKS
By
Swapnil Deshpande
David Darwin
JoAnn Browning
A Report on Research Sponsored by
CONSTRUCTION OF CRACK-FREE BRIDGE DECKS TRANSPORTATION POOLED FUND STUDY
Project No. TPF-5(051)
Structural Engineering and Engineering Materials SM Report No. 89
THE UNIVERSITY OF KANSAS CENTER FOR RESEARCH, INC. LAWRENCE, KANSAS
January 2007

i
ABSTRACT
The effects of paste volume, water-cement ratio, aggregate type, cement type,
curing period, and the use of mineral admixtures and superplasticizers on the free
shrinkage of concrete are evaluated with the goal of establishing guidelines to reduce
cracking in reinforced concrete bridge decks. Three concrete prisms were cast and
tested in accordance with ASTM C 157 for each mixture up to an age of 365 days
under controlled conditions of 23 ± 2°C (73 ± 3°F) and 50 ± 4 percent relative
humidity. The work was organized in five test programs. The first program included
mixes with water-cement ratios of 0.40, 0.45, and 0.50, and aggregate contents of 60,
70, and 80 percent, with Type I/II cement and Type II coarse-ground cement. The
second program included the mixes with one of three coarse aggregate types, granite,
limestone, and quartzite. The third program evaluated the effects of Class C fly ash,
ground granulated blast-furnace slag, and silica fume as partial volume replacements
for portland cement. The fourth and fifth programs were used, respectively, to
evaluate the effect of curing period (3, 7, 14, or 28 days) and the use of different
superplasticizer types and dosages.
The results indicate that concrete shrinkage decreases with an increase in the
aggregate content (and a decrease in the paste content) of the mix. For a given
aggregate content, no clear effect of water-cement ratio on the shrinkage is observed.
In general, granite coarse aggregates result in lower shrinkage than limestone coarse
aggregates. A similar conclusion cannot be made with quartzite coarse aggregate,
although in some cases shrinkage of concrete containing quartzite coarse aggregate

ii
was lower than that of concrete containing limestone. The use of partial volume
replacement of portland cement by Class C fly ash without changing the water or
aggregate content generally leads to increased shrinkage. The use of partial volume
replacement of portland cement by blast furnace slag without changing the water or
aggregate content can lead to increased early-age shrinkage, although the ultimate
shrinkage is not significantly affected. An increase in the curing period helps to
reduce shrinkage. The use of Type II coarse ground cement results in significantly
less shrinkage compared to Type I/II cement. The use of superplasticizers in concrete
appears to increase in shrinkage to a certain degree. The results, however, do not
present a clear picture of the effect of superplasticizer dosage on shrinkage.
Keywords: aggregates, cement fineness, concrete, cracking, curing, fly ash, paste
content, shrinkage, silica fume, slag, superplasticizers

iii
ACKNOWLEDGEMENTS
This report is based on research performed by Swapnil S. Deshpande in
partial fulfillment of the requirements for the MSCE degree from the University of
Kansas. This research project was sponsored by the Kansas Department of
Transportation serving as the lead agency for the “Construction of Crack-Free Bridge
Decks” Transportation Pooled Fund Study, Project No. TPF-5(051). The Federal
Highway Administration (FHWA) of the U.S. Department of Transportation, the
Delaware Department of Transportation, the Idaho Department of Transportation, the
Indiana Department of Transportation, the Michigan Department of Transportation,
the Minnesota Department of Transportation, the Mississippi Department of
Transportation, the Missouri Department of Transportation, the Montana Department
of Transportation, the New Hampshire Department of Transportation, the North
Dakota Department of Transportation, the Oklahoma Department of Transportation,
the South Dakota Department of Transportation, the Texas Department of
Transportation, and the Wyoming Department of Transportation provided funding to
the pooled fund. Representatives from each state and the FHWA served on a
Technical Advisory Committee that provided advice and oversight to the project.
Maria Voelker, Will Lindquist, and Heather McLeod helped in laboratory
work and data collection. Jim Weaver helped with the test setup. LRM Industries
provided concrete materials.

iv

v
TABLE OF CONTENTS
ABSTRACT........................................................................................................................ i
ACKNOWLEDGEMENTS ............................................................................................ iii
LIST OF TABLES .......................................................................................................... vii
LIST OF FIGURES ......................................................................................................... xi
CHAPTER 1: INTRODUCTION.................................................................................... 1
1.1 GENERAL ................................................................................................................ 1
1.2 SHRINKAGE: DEFINITION AND CLASSIFICATION ........................................ 2
1.3 FREE SHRINKAGE: MEANING AND SIGNIFICANCE ...................................... 4
1.4 FREE SHRINKAGE TEST....................................................................................... 6
1.5 PREVIOUS WORK .................................................................................................. 7
1.6 SUMMARY OF PREVIOUS WORK..................................................................... 31
1.7 OBJECTIVE AND SCOPE..................................................................................... 32
CHAPTER 2: EXPERIMENTAL PROGRAM ........................................................... 35
2.1 GENERAL .............................................................................................................. 35
2.2 FREE SHRINKAGE TEST..................................................................................... 36
2.3 MATERIALS.......................................................................................................... 36
2.4 MIX PROPORTIONING ........................................................................................ 42
2.5 MIXING EQUIPMENT .......................................................................................... 43
2.6 PROGRAM I (AGGREGATE CONTENT, WATER-CEMENT RATIO,
CEMENT TYPE) .......................................................................................................... 43
2.7 PROGRAM II (COARSE AGGREGATE TYPES) ................................................ 44
2.8 PROGRAM III (MINERAL ADMIXTURES)........................................................ 45
2.9 PROGRAM IV (CURING PERIOD) ...................................................................... 47
2.10 PROGRAM V (SUPERPLASTICIZERS) ............................................................ 48
2.11 MIXING................................................................................................................ 52

vi
2.12 CASTING ............................................................................................................. 55
2.13 CURING ............................................................................................................... 55
2.14 DRYING ............................................................................................................... 56
2.15 DATA COLLECTION.......................................................................................... 57
CHAPTER 3: RESULTS AND EVALUATION.......................................................... 59
3.1 GENERAL .............................................................................................................. 59
3.2 STATISTICAL ANALYSIS................................................................................... 60
3.3 PROGRAM I (AGGREGATE CONTENT, WATER-CEMENT RATIO,
CEMENT TYPE) .......................................................................................................... 61
3.4 PROGRAM II (COARSE AGGREGATE TYPES) ................................................ 64
3.5 PROGRAM III (MINERAL ADMIXTURES)........................................................ 67
3.6 PROGRAM IV (CURING PERIOD AND CEMENT TYPE) ................................ 73
3.7 PROGRAM V (SUPERPLASTICIZERS) .............................................................. 79
3.8 COMPARISON OF RESULTS WITH PREVIOUS WORK.................................. 85
CHAPTER 4: SUMMARY AND CONCLUSIONS .................................................... 90
4.1 SUMMARY ............................................................................................................ 90
4.2 CONCLUSIONS..................................................................................................... 93
4.3 RECOMMENDATIONS ........................................................................................ 94
REFERENCES................................................................................................................ 96
TABLES ........................................................................................................................... 99
FIGURES ....................................................................................................................... 170
APPENDIX A ................................................................................................................ 223

vii
LIST OF TABLES Table 2.1 – Program I (Aggregate Content, Water-Cement Ratio, Cement Type) test
matrix ........................................................................................................................ 99 Table 2.2 – Program II (Coarse Aggregate Types) test matrix......................................... 99 Table 2.3 – Program III (Mineral Admixtures) test matrix............................................. 100 Table 2.4 – Program IV (Curing Period) test matrix ...................................................... 100 Table 2.5 – Program V (Superplasticizers) test matrix................................................... 101 Table 2.6– Pea gravel gradations .................................................................................... 102 Table 2.7 – Sand gradations............................................................................................ 103 Table 2.8 – 19-mm (3/4-in.) Granite gradations ............................................................. 104 Table 2.9 – 25-mm (1-in.) Limestone gradations ........................................................... 104 Table 2.10 – 19-mm (3/4-in.) Limestone gradations ...................................................... 105 Table 2.11 – Quartzite gradations ................................................................................... 106 Table 2.12 Chemical composition of mineral admixtures .............................................. 107 Table 2.13 – Mix Proportions-Program I-Aggregate Content, Water-Cement Ratio,
Cement Type ........................................................................................................... 108 Table 2.14 – Mix Proportions-Program II-Aggregate Types.......................................... 110 Table 2.15 – Mix Proportions-Program III-Mineral admixtures .................................... 113 Table 2.16 – Mix Proportions-Program IV-Curing Period............................................. 116 Table 2.17 – Mix Proportions-Program V-Superplasticizers ......................................... 117 Table 3.1 - Summary of free shrinkage measurements for Program I........................ 10525 Table 3.2 - Comparison of free shrinkage measurements for various water cement
ratios for Program I ................................................................................................. 125

viii
Table 3.3a - Summary of free shrinkage measurements for Program II (Non-air-entrained Batches)................................................................................................... 126
Table 3.3b - Summary of free shrinkage measurements for Program II (Air-Entrained
Batches)................................................................................................................... 127 Table 3.4 - Summary of free shrinkage measurements for Program III ......................... 128 Table 3.5 - Summary of free shrinkage measurements for Program IV......................... 129 Table 3.6 - Summary of free shrinkage measurements for based on drying period for
Program IV.............................................................................................................. 130 Table 3.7a - Summary of free shrinkage measurement for Program V (Non-air-
entrained concrete).................................................................................................. 131 Table 3.7b - Summary of Free Shrinkage Measurement from Program V for air-
entrained batches..................................................................................................... 133 Table 3.8-Program I Student’s t-test results for concretes with different water-cement
ratios containing Type I/II cement and 60% aggregate content, 30, 180, and 365 days after casting..................................................................................................... 134
Table 3.9-Program I Student’s t-test results for concretes with different water-cement
ratios containing Type I/II cement and 70% aggregate content, 30, 180, and 365 days after casting..................................................................................................... 135
Table 3.10-Program I Student’s t-test results for concretes with different water-
cement ratios containing Type I/II cement and 80% aggregate content, 30, 180, and 365 days after casting....................................................................................... 136
Table 3.11-Program I Student’s t-test results for concretes with different water-
cement ratios containing Type II coarse-ground cement and 60% aggregate content, 30, 180, and 365 days after casting ........................................................... 137
Table 3.12-Program I Student’s t-test results for concretes with different water-
cement ratios containing Type II coarse-ground cement and 70% aggregate content, 30, 180, and 365 days after casting ........................................................... 138
Table 3.13-Program I Student’s t-test results for concretes with different water-
cement ratios containing Type II coarse-ground cement and 80% aggregate content, 30, 180, and 365 days after casting ........................................................... 139

ix
Table 3.14-Program I Student’s t-test results for concretes with different aggregate contents at a constant water-cement ratio of 0.40 and containing Type I/II cement, 30, 180, and 365 days after casting ........................................................... 140
Table 3.15-Program I Student’s t-test results for concretes with different aggregate
contents at a constant water-cement ratio of 0.45 and containing Type I/II cement, 30, 180, and 365 days after casting ........................................................... 141
Table 3.16-Program I Student’s t-test results for concretes with different aggregate
contents at a constant water-cement ratio of 0.50 and containing Type I/II cement, 30, 180, and 365 days after casting ........................................................... 142
Table 3.17-Program I Student’s t-test results for concretes with different aggregate
contents at a constant water-cement ratio of 0.40 and containing Type II coarse-ground cement, 30, 180, and 365 days after casting............................................... 143
Table 3.18-Program I Student’s t-test results for concretes with different aggregate
contents at a constant water-cement ratio of 0.45 and containing Type II coarse-ground cement, 30, 180, and 365 days after casting............................................... 144
Table 3.19-Program I Student’s t-test results for concretes with different aggregate
contents at a constant water-cement ratio of 0.50 and containing Type II coarse-ground cement, 30, 180, and 365 days after casting............................................... 145
Table 3.20a-Program II Student’s t-test results for non-air-entrained concrete
containing different aggregate types 30, 180, and 365 days after casting .............. 146 Table 3.21a-Program III Student’s t-test results for concrete containing Type I/II
cement with mineral admixtures by volume replacement at 30, 180, and 365 days after casting..................................................................................................... 150
Table 3.22-Program IV Student’s t-test results (Batch 165) for different curing
periods, for non-air-entrained concrete containing Type I/II cement ..................... 153 Table 3.23-Program IV Student’s t-test (Batch 166) results for different curing
periods, for non-air-entrained concrete containing Type II coarse-ground cement 154 Table 3.24 Program IV Student’s t-test results (Batch 201) for different curing
periods, for air-entrained concrete containing Type I/II cement ............................ 155 Table 3.25-Program IV Student’s t-test (Batch 207) results for different curing
periods, for air-entrained concrete containing Type II coarse-ground cement ....... 156

x
Table 3.26-Program IV Student’s t-test results (Batch 165 and 166) comparing cement type with curing periods, for different drying periods of non-air-entrained concrete ................................................................................................... 157
Table 3.27-Program IV Student’s t-test results (Batch 201 and 207) comparing
cement type with curing periods, for different drying periods of air-entrained concrete ................................................................................................................... 158
Table 3.28a-Program V Student’s t-test results for concrete containing Glenium
3000NS for different dosage rates, 30, 180, and 365 days after casting................. 159 Table 3.28b-Program V Student’s t-test results for concrete containing Rheobuild
1000 for different dosage rates, 30, 180, and 365 days after casting...................... 160 Table 3.29a-Program V Student’s t-test results for concrete containing Glenium
3000NS for different dosage rates, 30, 180, and 365 days after casting, cont........ 161 Table 3.29b-Program V Student’s t-test results for concrete containing Rheobuild
1000 for different dosage rates, 30, 180, and 365 days after casting, cont............. 162 Table 3.30-Program V Student’s t-test results for concrete containing Adva 100 for
different dosage rates, 30, 180, and 365 days after casting .................................... 163 Table 3.31a-Program V Student’s t-test results for concrete containing different
superplasticizers (low dosage) for different dosage rates, 30, 180, and 365 days after casting............................................................................................................. 165
Table 3.31b-Program V Student’s t-test results for concrete containing different
superplasticizers (medium dosage) for different dosage rates, 30, 180, and 365 days after casting..................................................................................................... 166
Table 3.31c-Program V Student’s t-test results for concrete containing different
superplasticizers (high dosage) for different dosage rates, 30, 180, and 365 days after casting............................................................................................................. 167
Table 3.32a-Program V Student’s t-test results for non-air-entrained concrete
containing different superplasticizers (dosage rates for same slump), 30, 180, and 365 days after casting....................................................................................... 168
Table 3.32b-Program V Student’s t-test results for air-entrained concrete containing
different superplasticizers (dosage rates for same slump), 30, 180, and 365 days after casting............................................................................................................. 169

xi
LIST OF FIGURES Figure 2.1 Free Shrinkage Specimen Mold. ......................................................................... 170 Figure 2.2 Cross-section of Free Shrinkage Specimen. ........................................................ 170 Figure 2.3 Mechanical Dial Gage Length Comparator......................................................... 171 Figure 3.1 Free Shrinkage Test, Program I. Average free shrinkage vs. time through
30 days. Type I/II cement. ........................................................................................... 172 Figure 3.2 Free Shrinkage Test, Program I. Average free shrinkage vs. time through
180 days. Type I/II cement. ......................................................................................... 173 Figure 3.3 Free Shrinkage Test, Program I. Average free shrinkage vs. time through
365 days. Type I/II cement. ......................................................................................... 174 Figure 3.4 Free Shrinkage Test, Program I. Average free shrinkage vs. time through
30 days. Type II CG cement. ....................................................................................... 175 Figure 3.5 Free Shrinkage Test, Program I. Average free shrinkage vs. time through
180 days. Type II coarse ground (CG) cement. ........................................................... 176 Figure 3.6 Free Shrinkage Test, Program I. Average free shrinkage vs. time through
30 days. Type II coarse ground (CG) cement. ............................................................. 177 Figure 3.7 Free Shrinkage Test, Program I. Average free shrinkage vs. time through
180 days. Type I/II and Type II coarse ground (CG) cement. w/c ratio = 0.40............ 178 Figure 3.8 Free Shrinkage Test, Program I. Average free shrinkage vs. time through
365 days. Type I/II and Type II coarse ground (CG) cement. w/c ratio = 0.40............ 179 Figure 3.9 Free Shrinkage Test, Program I. Average free shrinkage vs. time through
180 days. Type I/II and Type II coarse ground (CG) cement. w/c ratio = 0.45............ 180 Figure 3.10 Free Shrinkage Test, Program I. Average free shrinkage vs. time through
365 days. Type I/II and Type II coarse ground (CG) cement. w/c ratio = 0.45............ 181 Figure 3.11 Free Shrinkage Test, Program I. Average free shrinkage vs. time through
180 days. Type I/II and Type II coarse ground (CG) cement. w/c ratio = 0.50............ 182 Figure 3.12 Free Shrinkage Test, Program I. Average free shrinkage vs. time through
365 days. Type I/II and Type II coarse ground (CG) cement. w/c ratio = 0.50............ 183

xii
Figure 3.13 Free Shrinkage Test, Program II. Comparison of different aggregate types through 30 days....................................................................................................... 184
Figure 3.14 Free Shrinkage Test, Program II. Comparison of different aggregate types
through 180 days..................................................................................................... 184 Figure 3.15 Free Shrinkage Test, Program II. Comparison of different aggregate types
through 365 days..................................................................................................... 185 Figure 3.16 Free Shrinkage Test, Program II. Comparison of different aggregate types
through 30 days....................................................................................................... 185 Figure 3.17 Free Shrinkage Test, Program II. Comparison of different aggregate types
through 180 days..................................................................................................... 186 Figure 3.18 Free Shrinkage Test, Program II. Comparison of different aggregate types
through 365 days..................................................................................................... 186 Figure 3.19 Free Shrinkage Test, Program II. Comparison of different aggregate types
through 30 days....................................................................................................... 187 Figure 3.20 Free Shrinkage Test, Program II. Comparison of different aggregate types
through 180 days..................................................................................................... 187 Figure 3.21 Free Shrinkage Test, Program II. Comparison of different aggregate types
through 365 days..................................................................................................... 188 Figure 3.22 Free Shrinkage Test, Program II. Comparison of different aggregate types
through 30 days....................................................................................................... 188 Figure 3.23 Free Shrinkage Test, Program II. Comparison of different aggregate type
through 180 days..................................................................................................... 189 Figure 3.24 Free Shrinkage Test, Program II. Comparison of different aggregate types
through 365 days..................................................................................................... 189 Figure 3.25 Free Shrinkage Test, Program III. Comparing mineral admixtures
through 30 days....................................................................................................... 190 Figure 3.26 Free Shrinkage Test, Program III. Comparing mineral admixtures
through 180 days..................................................................................................... 190 Figure 3.27 Free Shrinkage Test, Program III. Comparing mineral admixtures
through 365 days..................................................................................................... 191

xiii
Figure 3.28 Free Shrinkage Test, Program III. Comparing mineral admixtures
through 30 days....................................................................................................... 191 Figure 3.29 Free Shrinkage Test, Program III. Comparing mineral admixtures
through 180 days..................................................................................................... 192 Figure 3.30 Free Shrinkage Test, Program III. Comparing mineral admixtures
through 365 days..................................................................................................... 192 Figure 3.31 Free Shrinkage Test, Program III. Comparing Silica Fume and controls
through 30 days....................................................................................................... 193 Figure 3.32 Free Shrinkage Test, Program III. Comparing Silica Fume and controls
through 180 days..................................................................................................... 193 Figure 3.33 Free Shrinkage Test, Program III. Comparing Silica Fume and controls
through 365 days..................................................................................................... 194 Figure 3.34 - Free Shrinkage, Program IV. Average free shrinkage vs. time for
different curing times. Batch 165. Type I/II cement through 30 days. ................... 194 Figure 3.35 - Free Shrinkage, Program IV. Average free shrinkage vs. time for
different curing times. Batch 165. Type I/II cement through 30 days. Drying only. ........................................................................................................................ 195
Figure 3.36 - Free Shrinkage, Program IV. Average free shrinkage vs. time for
different curing times. Batch 165. Type I/II cement through 180 days. ................. 195 Figure 3.37 - Free Shrinkage, Program IV. Average free shrinkage vs. time for
different curing times. Batch 165. Type I/II cement through 180 days. Drying only. ........................................................................................................................ 196
Figure 3.38 - Free Shrinkage, Program IV. Average free shrinkage vs. time for
different curing times. Batch 165. Type I/II cement through 365 days. ................. 196 Figure 3.39 - Free Shrinkage, Program IV. Average free shrinkage vs. time for
different curing times. Batch 165. Type I/II cement through 365 days. Drying only. ........................................................................................................................ 197
Figure 3.40 - Free Shrinkage, Program IV. Average free shrinkage vs. time for
different curing times. Batch 166 through 30 days. Type II coarse ground (CG) cement. .................................................................................................................... 197
xiv
Figure 3.41 - Free Shrinkage, Program IV. Average free shrinkage vs. time for different curing times. Batch 166. Type II coarse ground (CG) cement through 30 days. Drying only............................................................................................... 198
Figure 3.42 - Free Shrinkage, Program IV. Average free shrinkage vs. time for
different curing times. Batch 166 through 180 days. Type II coarse ground (CG) cement. .................................................................................................................... 198
Figure 3.43 - Free Shrinkage, Program IV. Average free shrinkage vs. time for
different curing times. Batch 166. Type II coarse ground (CG) cement through 180 days. Drying only............................................................................................. 199
Figure 3.44 - Free Shrinkage, Program IV. Average free shrinkage vs. time for different curing times. Batch 166 through 365 days. Type II coarse ground (CG) cement. .................................................................................................................... 199
Figure 3.45 - Free Shrinkage, Program IV. Average free shrinkage vs. time for
different curing times. Batch 166. Type II coarse ground (CG) cement through 365 days. Drying only............................................................................................. 200
Figure 3.46 - Free Shrinkage, Program IV. Average free shrinkage vs. time for
different curing times. Type I/II cement. Batch 201 through 30 days. .................. 200 Figure 3.47 - Free Shrinkage, Program IV. Average free shrinkage vs. time for
different curing times. Type I/II cement. Batch 201 through 30 days. Drying only. ........................................................................................................................ 201
Figure 3.48 - Free Shrinkage, Program IV. Average free shrinkage vs. time for
different curing times. Type I/II cement. Batch 201 through 180 days. ................ 201 Figure 3.49 - Free Shrinkage, Program IV. Average free shrinkage vs. time for
different curing times. Type I/II cement. Batch 201 through 180 days. Drying only. ........................................................................................................................ 202
Figure 3.50 - Free Shrinkage, Program IV. Average free shrinkage vs. time for
different curing times. Type I/II cement. Batch 201 through 365 days. ................ 202 Figure 3.51 - Free Shrinkage, Program IV. Average free shrinkage vs. time for
different curing times. Type I/II cement. Batch 201 through 365 days. Drying only. ........................................................................................................................ 203
Figure 3.52 - Free Shrinkage, Program IV. Average free shrinkage vs. time for
different curing times. Type II coarse ground (CG) cement. Batch 207 through 30 days. ................................................................................................................... 203

xv
Figure 3.53 - Free Shrinkage, Program IV. Average free shrinkage vs. time for different curing times. Type II coarse ground (CG) cement. Batch 207 through 30 days. Drying only............................................................................................... 204
Figure 3.54 - Free Shrinkage, Program IV. Average free shrinkage vs. time for
different curing times. Type II coarse ground (CG) cement through 180 days. Batch 207. ............................................................................................................... 204
Figure 3.55 - Free Shrinkage, Program IV. Average free shrinkage vs. time for
different curing times. Type II coarse ground (CG) cement. Batch 207 through 180 days. Drying only............................................................................................. 205
Figure 3.56 - Free Shrinkage, Program IV. Average free shrinkage vs. time for
different curing times. Type II coarse ground (CG) cement. Batch 207 through 365 days. ................................................................................................................. 205
Figure 3.57 - Free Shrinkage, Program IV. Average free shrinkage vs. time for
different curing times. Type II coarse ground (CG) cement. Batch 207 through 365 days. Drying only............................................................................................. 206
Figure 3.58 - Free Shrinkage, Program IV. Average free shrinkage vs. time for 3-day
cure specimens. Comparing cement type through 365 days................................... 206 Figure 3.59 - Free Shrinkage, Program IV. Average free shrinkage vs. time for 7-day
cure specimens. Comparing cement type through 365 days................................... 207 Figure 3.60 - Free Shrinkage, Program IV. Average free shrinkage vs. time for 14-day
cure specimens. Comparing cement type through 365 days................................... 207 Figure 3.61 - Free Shrinkage, Program IV. Average free shrinkage vs. time for 28-day
cure specimens. Comparing cement type through 365 days................................... 208 Figure 3.62 - Free Shrinkage, Program IV. Average free shrinkage vs. time for 3-day
cure specimens. Comparing cement type through 365 days................................... 208 Figure 3.63 - Free Shrinkage, Program IV. Average free shrinkage vs. time for 7-day
cure specimens. Comparing cement type through 365 days................................... 209 Figure 3.64 - Free Shrinkage, Program IV. Average free shrinkage vs. time for 14-day
cure specimens. Comparing cement type through 365 days................................... 209 Figure 3.65 - Free Shrinkage, Program IV. Average free shrinkage vs. time for 28-day
cure specimens. Comparing cement type through 365 days................................... 210

xvi
Figure 3.66 Free Shrinkage Test, Program V. Average free shrinkage vs. time. Comparing different dosages of Glenium 3000 NS through 30 days. .................... 210
Figure 3.67 Free Shrinkage Test, Program V. Average free shrinkage vs. time.
Comparing different dosages of Glenium 3000 NS through 180 days. .................. 211 Figure 3.68 Free Shrinkage Test, Program V. Average free shrinkage vs. time.
Comparing different dosages of Glenium 3000 NS through 365 days. .................. 211 Figure 3.69 Free Shrinkage Test, Program V. Average free shrinkage vs. time.
Comparing different dosages of Rheobuild 1000 through 30 days. ....................... 212 Figure 3.70 Free Shrinkage Test, Program V. Average free shrinkage vs. time.
Comparing different dosages of Rheobuild 1000 through 180 days. ..................... 212 Figure 3.71 Free Shrinkage Test, Program V. Average free shrinkage vs. time.
Comparing different dosages of Rheobuild 1000 through 365 days. ..................... 213 Figure 3.72 Free Shrinkage Test, Program V. Average free shrinkage vs. time.
Comparing different dosages of Glenium 3000 NS through 30 days. .................... 213 Figure 3.73 Free Shrinkage Test, Program V. Average free shrinkage vs. time.
Comparing different dosages of Glenium 3000 NS through 180 days. .................. 214 Figure 3.74 Free Shrinkage Test, Program V. Average free shrinkage vs. time.
Comparing different dosages of Glenium 3000 NS through 365 days. .................. 214 Figure 3.75 Free Shrinkage Test, Program V. Average free shrinkage vs. time.
Comparing different dosages of Rheobuild 1000 through 30 days. ....................... 215 Figure 3.76 Free Shrinkage Test, Program V. Average free shrinkage vs. time.
Comparing different dosages of Rheobuild 1000 through 180 days. ..................... 215 Figure 3.77 Free Shrinkage Test, Program V. Average free shrinkage vs. time.
Comparing different dosages of Rheobuild 1000 through 365 days. ..................... 216 Figure 3.78 Free Shrinkage Test, Program V. Average free shrinkage vs. time.
Comparing different dosages of Adva 100 through 30 days. ................................. 216 Figure 3.79 Free Shrinkage Test, Program V. Average free shrinkage vs. time.
Comparing different dosages of Adva 100 through 180 days. ............................... 217 Figure 3.80 Free Shrinkage Test, Program V. Average free shrinkage vs. time.
Comparing different dosages of Adva 100 through 365 days. ............................... 217

xvii
Figure 3.81 Free Shrinkage Test, Program V. Average free shrinkage vs. time.
Comparing different dosages of Adva 100 through 30 days. ................................. 218 Figure 3.82 Free Shrinkage Test, Program V. Average free shrinkage vs. time.
Comparing different dosages of Adva 100 through 180 days. ............................... 218 Figure 3.83 Free Shrinkage Test, Program V. Average free shrinkage vs. time.
Comparing different dosages of Adva 100 through 365 days. ............................... 219 Figure 3.84 Free Shrinkage Test, Program V. Average free shrinkage vs. time.
Comparing different Superplasticizers (Dosages for same slump) through 30 days. ........................................................................................................................ 219
Figure 3.85 Free Shrinkage Test, Program V. Average free shrinkage vs. time.
Comparing different Superplasticizers (Dosages for same slump) through 180 days. ........................................................................................................................ 220
Figure 3.86 Free Shrinkage Test, Program V. Average free shrinkage vs. time.
Comparing different Superplasticizers (Dosages for same slump) through 365 days. ........................................................................................................................ 220
Figure 3.87 Free Shrinkage Test, Program V. Average free shrinkage vs. time.
Comparing different Superplasticizers (Dosages for same slump) through 30 days. ........................................................................................................................ 221
Figure 3.88 Free Shrinkage Test, Program V. Average free shrinkage vs. time. Comparing different Superplasticizers (Dosages for same slump) through 180 days. ........................................................................................................................ 221
Figure 3.89 Free Shrinkage Test, Program V. Average free shrinkage vs. time.
Comparing different Superplasticizers (Dosages for same slump) through 365 days. ........................................................................................................................ 222
Figure A3.1 - Free Shrinkage, Batch 62. 80% Aggregate, 0.40 w/c. Type I/II cement.
Drying begins at 3 days........................................................................................... 223 Figure A3.2 - Free Shrinkage, Batch 63. 80% Aggregate, 0.45 w/c. Type I/II cement.
Drying begins at 3 days........................................................................................... 223 Figure A3.3 - Free Shrinkage, Batch 64. 70% Aggregate, 0.45 w/c. Type I/II cement.
Drying begins at 3 days........................................................................................... 224 Figure A3.4 - Free Shrinkage, Batch 65. 70% Aggregate, 0.50 w/c. Type I/II cement.
Drying begins on day 3. .......................................................................................... 224
xviii
Figure A3.5 - Free Shrinkage, Batch 66. 70% Aggregate, 0.40 w/c. Type I/II cement.
Drying begins on day 3. .......................................................................................... 225 Figure A3.6 - Free Shrinkage, Batch 67. 80% Aggregate, 0.50 w/c. Type I/II cement.
Drying begins on day 3. .......................................................................................... 225 Figure A3.7 - Free Shrinkage, Batch 68. 60% Aggregate, 0.40 w/c. Type I/II cement.
Drying begins on day 3. .......................................................................................... 226 Figure A3.8 - Free Shrinkage, Batch 69. 60% Aggregate, 0.45 w/c., Type I/II cement.
Drying begins on day 3. .......................................................................................... 226 Figure A3.9- Free Shrinkage, Batch 70. 60% Aggregate, 0.50 w/c. Type I/II cement.
Drying begins on day 3. .......................................................................................... 227 Figure A3.10 - Free Shrinkage, Batch 71. 80% Aggregate, 0.40 w/c. Type II coarse
ground (CG) cement. Drying begins on day 3. ...................................................... 227 Figure A3.11 - Free Shrinkage, Batch 72. 80% Aggregate, 0.45 w/c. Type II coarse
ground (CG) cement. Drying begins on day 3. ...................................................... 228 Figure A3.12 - Free Shrinkage, Batch 73. 80% Aggregate, 0.50 w/c. Type II coarse
ground (CG) cement. Drying begins on day 3. ...................................................... 228 Figure A3.13 - Free Shrinkage, Batch 74. 70% Aggregate, 0.40 w/c. Type II CG
cement. Drying begins on day 3. ........................................................................... 229 Figure A3.14 - Free Shrinkage, Batch 75. 70% Aggregate, 0.45 w/c. Type II coarse
ground (CG) cement. Drying begins on day 3. ...................................................... 229 Figure A3.15 - Free Shrinkage, Batch 76. 70% Aggregate, 0.50 w/c. Type II coarse
ground (CG) cement. Drying begins on day 3. ...................................................... 230 Figure A3.16 - Free Shrinkage, Batch 77. 60% Aggregate, 0.40 w/c. Type II coarse
ground (CG) cement. Drying begins on day 3. ...................................................... 230 Figure A3.17 - Free Shrinkage, Batch 78. 60% Aggregate, 0.45 w/c. Type II coarse
ground (CG) cement. Drying begins on day 3. ...................................................... 231 Figure A3.18 - Free Shrinkage, Batch 79. 60% Aggregate, 0.50 w/c. Type II coarse
ground (CG) cement. Drying begins on day 3. ...................................................... 231

xix
Figure A3.19 - Free Shrinkage, Batch 94. 70% Aggregate, 0.45 w/c. Type I/II cement. Drying begins at 3 days. Quartzite. .......................................................... 232
Figure A3.20 - Free Shrinkage, Batch 95. 70% Aggregate, 0.45 w/c. Type I/II
cement. Drying begins at 3 days. Limestone. ........................................................ 232 Figure A3.21 - Free Shrinkage, Batch 187. 70% Aggregate, 0.45 w/c. Type I/II
cement. Drying begins at 3 days. Quartzite. .......................................................... 233 Figure A3.22 - Free Shrinkage, Batch 188. 70% Aggregate, 0.45 w/c. Type I/II
cement. Drying begins at 3 days. Limestone. ....................................................... 233 Figure A3.23 - Free Shrinkage, Batch 189. 70% Aggregate, 0.45 w/c. Type I/II
cement. Drying begins at 3 days. Granite. ............................................................. 234 Figure A3.24 - Free Shrinkage, Batch 198. 70% Aggregate, 0.45 w/c. Type I/II
cement. Drying begins at 3 days. Quartzite. .......................................................... 234 Figure A3.25 - Free Shrinkage, Batch 199. 70% Aggregate, 0.45 w/c. Type I/II
cement. Drying begins at 3 days. Limestone. ........................................................ 235 Figure A3.26 - Free Shrinkage, Batch 200. 70% Aggregate, 0.45 w/c. Type I/II
cement. Drying begins at 3 days. Granite. ............................................................. 235 Figure A3.27 - Free Shrinkage, Batch 262. 68.8% Aggregate, 0.45 w/c. Type I/II
cement. Air-entrained concrete. Drying begins at 3 days. Quartzite. .................... 236 Figure A3.28 - Free Shrinkage, Batch 263. 68.8% Aggregate, 0.45 w/c. Type I/II
cement. Air-entrained concrete. Drying begins at 3 days. Limestone. ................... 236 Figure A3.29 - Free Shrinkage, Batch 264. 68.8% Aggregate, 0.45 w/c., Type I/II
cement. Air-entrained concrete. Drying begins at 3 days. Granite. ........................ 237 Figure A3.30 - Free Shrinkage, Batch 85. 70% Aggregate, 0.45 w/c. Type I/II
cement. Drying begins at 3 days. Control, no mineral admixtures........................ 237 Figure A3.31 - Free Shrinkage, Batch 86. 70% Aggregate, 0.45 w/c. Type I/II
cement. Drying begins at 3 days. 30% slag replacement...................................... 238 Figure A3.32 - Free Shrinkage, Batch 87. 70% Aggregate, 0.45 w/c. Type I/II
cement. Drying begins at 3 days. 30% Class C Fly Ash replacement. .................. 238 Figure A3.33 - Free Shrinkage, Batch 88. 70% Aggregate, 0.45 w/c. Type I/II
cement. Drying begins at 3 days. 10% silica fume replacement........................... 239

xx
Figure A3.34 - Free Shrinkage, Batch 194. 70% Aggregate, 0.45 w/c. Type I/II
cement. Drying begins at 3 days. Control, no mineral admixtures........................ 239 Figure A3.35 - Free Shrinkage, Batch 195. 70% Aggregate, 0.45 w/c. Type I/II
cement. Drying begins at 3 days. 30% Replacement by Slag................................ 240 Figure A3.36 - Free Shrinkage, Batch 196. 70% Aggregate, 0.45 w/c. Type I/II
cement. Drying begins at 3 days. 30% Replacement by Class C Fly Ash............. 240 Figure A3.37 - Free Shrinkage, Batch 197. 70% Aggregate, 0.45 w/c. Type I/II
cement. Drying begins at 3 days. 10% Replacement by Silica Fume.................... 241 Figure A3.38 - Free Shrinkage, Batch 202. 70% Aggregate, 0.45 w/c. Type I/II
cement. Drying begins at 3 days. Control, no mineral admixtures........................ 241 Figure A3.39 - Free Shrinkage, Batch 203. 70% Aggregate, 0.45 w/c. Type I/II
cement. Drying begins at 3 days. Control, no mineral admixtures. Adva superplasticizer. ...................................................................................................... 242
Figure A3.40 - Free Shrinkage, Batch 204. 70% Aggregate, 0.45 w/c. Type I/II
cement. Drying begins at 3 days. 10% Replacement by Silica Fume. Adva superplasticizer ....................................................................................................... 242
Figure A3.41 - Free Shrinkage, Batch 165, 3-day cure. 70% Aggregate, 0.45 w/c.
Type I/II cement. Drying begins at 3 days............................................................. 243 Figure A3.42 - Free Shrinkage, Batch 165, 7-day cure. 70% Aggregate, 0.45 w/c.
Type I/II cement. Drying begins at 7 days............................................................. 243 Figure A3.43 - Free Shrinkage, Batch 165, 14-day cure. 70% Aggregate, 0.45 w/c.
Type I/II cement. Drying begins at 14 days........................................................... 244 Figure A3.44 - Free Shrinkage, Batch 165, 28-day cure. 70% Aggregate, 0.45 w/c.
Type I/II cement. Drying begins at 28 days........................................................... 244 Figure A3.45 - Free Shrinkage, Batch 166, 3-day cure. 70% Aggregate, 0.45 w/c.
Type II coarse ground (CG) cement. Drying begins at 3 days. ............................. 245 Figure A3.46 - Free Shrinkage, Batch 166, 7-day cure. 70% Aggregate, 0.45 w/c.
Type II coarse ground (CG) cement. Drying begins at 7 days. ............................. 245 Figure A3.47 - Free Shrinkage, Batch 166, 14-day cure. 70% Aggregate, 0.45 w/c.
Type II coarse ground (CG) cement. Drying begins at 14 days. ........................... 246

xxi
Figure A3.48 - Free Shrinkage, Batch 166, 28-day cure. 70% Aggregate, 0.45 w/c.
Type II coarse ground (CG) cement. Drying begins at 28 days. ........................... 246 Figure A3.49 Free Shrinkage, Batch 201(3-days-cured), 70% Aggregate, 0.45 w/c
ratio, Type I/II Cement Drying begins at 3 days. ................................................... 247 Figure A3.50 Free Shrinkage, Batch 201(7-days-cured), 70% Aggregate, 0.45 w/c
ratio, Type I/II Cement Drying begins at 7 days. ................................................... 247 Figure A3.51 Free Shrinkage, Batch 201(14-days-cured), 70% Aggregate, 0.45 w/c
ratio, Type I/II Cement Drying begins at 14 days. ................................................. 248 Figure A3.52 Free Shrinkage, Batch 201(28-days-cured), 70% Aggregate, 0.45 w/c
ratio, Type I/II Cement Drying begins at 28 days. ................................................. 248 Figure A3.53 Free Shrinkage, Batch 207(3-days-cured), 70% Aggregate, 0.45 w/c
ratio, Type II coarse ground (CG) cement. Drying begins at 3 days. ..................... 249 Figure A3.54 Free Shrinkage, Batch 207(7-days-cured), 70% Aggregate, 0.45 w/c
ratio, Type II coarse ground (CG) cement. Drying begins at 7 days. ..................... 249 Figure A3.55 Free Shrinkage, Batch 207(14-days-cured), 70% Aggregate, 0.45 w/c
ratio, Type II coarse ground (CG) cement. Drying begins at 14 days. ................... 250 Figure A3.56 Free Shrinkage, Batch 207(28-days-cured), 70% Aggregate, 0.45 w/c
ratio, Type II coarse ground (CG) cement. Drying begins at 28 days. ................... 250 Figure A3.57 - Free Shrinkage, Batch 167. 75% Aggregate, 0.45 w/c. Type I/II
cement. Drying begins at 3 days. Control, no chemical admixtures...................... 251 Figure A3.58 - Free Shrinkage, Batch 168. 75% Aggregate, 0.45 w/c. Type I/II
cement. Drying begins at 3 days. Low dosage of Glenium 3000NS. .................... 251 Figure A3.59 - Free Shrinkage, Batch 169. 75% Aggregate, 0.45 w/c. Type I/II
cement. Drying begins at 3 days. Medium dosage of Glenium 3000NS. .............. 252 Figure A3.60 - Free Shrinkage, Batch 170. 75% Aggregate, 0.45 w/c. Type I/II
cement. Drying begins at 3 days. High dosage of Glenium 3000NS. ................... 252 Figure A3.61 - Free Shrinkage, Batch 171. 75% Aggregate, 0.45 w/c. Type I/II
cement. Drying begins at 3 days. Low dosage of Rheobuild 1000........................ 253

xxii
Figure A3.62 - Free Shrinkage, Batch 172. 75% Aggregate, 0.45 w/c. Type I/II cement. Drying begins at 3 days. Medium dosage of Rheobuild 1000. ................ 253
Figure A3.63 - Free Shrinkage, Batch 173. 75% Aggregate, 0.45 w/c. Type I/II
cement. Drying begins at 3 days. High dosage of Rheobuild 1000. ...................... 254 Figure A3.64 - Free Shrinkage, Batch 174. 75% Aggregate, 0.45 w/c. Type I/II
cement. Drying begins at 3 days. High dosage of Glenium 3000NS. ................... 254 Figure A3.65 - Free Shrinkage, Batch 175. 75% Aggregate, 0.45 w/c. Type I/II
cement. Drying begins at 3 days. Control, no chemical admixtures...................... 255 Figure A3.66 - Free Shrinkage, Batch 176. 75% Aggregate, 0.45 w/c. Type I/II
cement. Drying begins at 3 days. Low dosage of Glenium 3000NS. .................... 255 Figure A3.67 - Free Shrinkage, Batch 177. 75% Aggregate, 0.45 w/c. Type I/II
cement. Drying begins at 3 days. Medium dosage of Glenium 3000NS. .............. 256 Figure A3.68 - Free Shrinkage, Batch 178. 75% Aggregate, 0.45 w/c. Type I/II
cement. Drying begins at 3 days. High dosage of Glenium 3000NS. ................... 256 Figure A3.69 - Free Shrinkage, Batch 179. 75% Aggregate, 0.45 w/c. Type I/II
cement. Drying begins at 3 days. Low dosage of Rheobuild 1000........................ 257 Figure A3.70 - Free Shrinkage, Batch 180. 75% Aggregate, 0.45 w/c. Type I/II
cement. Drying begins at 3 days. Medium dosage of Rheobuild 1000. ................ 257 Figure A3.71 - Free Shrinkage, Batch 181. 75% Aggregate, 0.45 w/c. Type I/II
cement. Drying begins at 3 days. High dosage of Rheobuild 1000. ...................... 258 Figure A3.72 - Free Shrinkage, Batch 182. 75% Aggregate, 0.45 w/c. Type I/II
cement. Drying begins at 3 days. High dosage of Rheobuild 1000. ...................... 258 Figure A3.73 - Free Shrinkage, Batch 183. 75% Aggregate, 0.45 w/c. Type I/II
cement. Drying begins at 3 days. Control, no chemical admixtures...................... 259 Figure A3.74 - Free Shrinkage, Batch 184. 75% Aggregate, 0.45 w/c. Type I/II
cement. Drying begins at 3 days. Low dosage of Adva 100.................................. 259 Figure A3.75 - Free Shrinkage, Batch 185. 75% Aggregate, 0.45 w/c. Type I/II
cement. Drying begins at 3 days. Medium dosage of Adva 100. .......................... 260 Figure A3.76 - Free Shrinkage, Batch 186. 75% Aggregate, 0.45 w/c. Type I/II
cement. Drying begins at 3 days. High dosage of Adva 100. ................................ 260
xxiii
Figure A3.77 - Free Shrinkage, Batch 190. 75% Aggregate, 0.45 w/c. Type I/II
cement. Drying begins at 3 days. Low dosage of Adva 100.................................. 261 Figure A3.78 - Free Shrinkage, Batch 191. 75% Aggregate, 0.45 w/c. Type I/II
cement. Drying begins at 3 days. Medium dosage of Adva 100. .......................... 261 Figure A3.79 - Free Shrinkage, Batch 192. 75% Aggregate, 0.45 w/c. Type I/II
cement. Drying begins at 3 days. High dosage of Adva 100. ................................ 262 Figure A3.80 - Free Shrinkage, Batch 193. 75% Aggregate, 0.45 w/c. Type I/II
cement. Drying begins at 3 days. Control, no chemical admixture. ...................... 262 Figure A3.81 - Free Shrinkage, Batch 208. 70% Aggregate, 0.45 w/c. Type I/II
cement. Drying begins at 3 days. Control, no chemical admixtures...................... 263 Figure A3.82 - Free Shrinkage, Batch 209. 70% Aggregate, 0.45 w/c. Type I/II
cement. Drying begins at 3 days, Adva 100. ......................................................... 263 Figure A3.83 - Free Shrinkage, Batch 210. 70% Aggregate, 0.45 w/c. Type I/II
cement. Drying begins at 3 days, Glenium 3000 NS. ............................................ 264 Figure A3.84 - Free Shrinkage, Batch 211. 70% Aggregate, 0.45 w/c. Type I/II
cement. Drying begins at 3 days, Rheobuild 1000. ............................................... 264 Figure A3.85 - Free Shrinkage, Batch 260. 63.5% Aggregate, 0.45 w/c. Type I/II
cement. Air-entrained concrete. Drying begins at 3 days. Control, no superplasticizer, increased paste content for same slump....................................... 265
Figure A3.86- Free Shrinkage, Batch 249. 67.8% Aggregate, 0.45 w/c. Type I/II
cement. Air-entrained concrete. Drying begins at 3 days. Glenium 3000 NS........ 265 Figure A3.87 - Free Shrinkage, Batch 256. 67.8% Aggregate, 0.45 w/c. Type I/II
cement. Air-entrained concrete. Drying begins at 3 days. Rheobuild 1000. .......... 266 Figure A3.88 - Free Shrinkage, Batch 259 67.8% Aggregate, 0.45 w/c. Type I/II
cement. Air-entrained concrete. Drying begins at 3 days. Adva 100. .................... 266

CHAPTER 1: INTRODUCTION
1.1 GENERAL
Cracking in the concrete bridge decks is a well documented problem.
Cracking contributes to the deterioration of bridge decks and allows the ingress of
water to the reinforcement, which may lead to corrosion. Cracking increases the
maintenance costs, reduces the service life, and may result in disruptive and costly
repairs. Experience shows that a combination of shrinkage and thermal stresses
causes most deck cracking. Efforts have been made to reduce the cracking by
designing concrete mixes for minimal shrinkage and improving methods of
construction, placement, and finishing. Many departments of transportation in United
States provide strict specifications regarding mix design, construction, and curing
procedures, but bridge deck cracking remains a problem. According to a study
conducted by Federal Highway Administration (FHWA) in 2005, 27 percent of the
bridges in the United States are structurally inefficient or functionally obsolete.
Although these classifications are not based exclusively on the condition of bridge
decks, the bridge decks are the primary factors affecting this rating. According to
infrastructure report card of 2005 (American Society of Civil Engineers), it will cost
$9.4 billion a year for 20 years to eliminate all bridge deficiencies in United States.
Among the other factors that effect cracking on bridge decks are age, type of
construction, girder type, ambient air temperature, and compressive strength
(Lindquist, Darwin, Browning 2005). This study, however, focuses only on the
1

reduction of cracking through the development of concrete mixes with minimal
shrinkage.
Various researchers have studied the effect of different factors that affect
restrained and unrestrained shrinkage of concrete. This report reviews some of that
work and describes an experimental study that evaluates the effect of various
ingredients and admixtures in concrete on the unrestrained (free) shrinkage of
concrete.
1.2 SHRINKAGE: DEFINITION AND CLASSIFICATION
Shrinkage is a reduction in volume, and in concrete, it is mainly caused by the
loss of water. In most cases, shrinkage is measured by monitoring longitudinal strain.
When tensile stresses due to restrained volume contraction exceed the tensile strength
of concrete, the shrinkage leads to cracking, which is called shrinkage cracking.
Shrinkage is classified based on the causes of volume change and the state of
concrete.
Plastic shrinkage is the shrinkage that occurs due to loss of moisture from
fresh concrete. This loss may in be in form of surface evaporation or moisture loss to
the subgrade, for slabs on the ground. The loss of moisture leads to the formation of
menisci. These menisci generate negative capillary pressures, which cause a volume
reduction in the cement paste (Mindess, Young, and Darwin 2003). Because the loss
of moisture is concentrated at the exposed surfaces, the volume contraction is uneven.
Differential volume changes produce tensile stresses in concrete, which may result in
2

3
the formation of cracks in the plastic concrete. This type of cracking generally
appears in random patterns and is shallow.
Autogenous Shrinkage (also known as chemical shrinkage) is a volume
change that occurs without moisture loss to the surrounding environment. It occurs
when water in cement paste is consumed by the hydration reactions, and results due
to self desiccation of the concrete. This type of shrinkage mainly occurs in the mixes
with low water-cement (w/c) ratios and may be increased by the use of reactive
pozzolans. For the concretes with w/c ratios of 0.42 and greater, autogenous
shrinkage is normally small and can be considered as a part of drying shrinkage.
Drying shrinkage occurs due to the loss of moisture from hardened concrete.
Among the different types of shrinkage, drying shrinkage usually results in the largest
volume change. Moisture loss causes volume changes based on three mechanisms
that result in changes in capillary stress, disjoining pressure, and surface free energy.
Capillary stress occurs between relative humidities of 45 and 95 percent, when a
meniscus forms in the pore water within pores in cement paste. The meniscus is
under hydrostatic tension, and adopts a curved surface. The water exerts the
corresponding compression on the solid skeleton, reducing the size of the pores.
Capillary stress (Pcap) is a function of the pore radius (r), the surface tension of the
water (γ), and the relative humidity (RH), and is given by the equation
K
rP
)RH(ln
2cap
=
=γ
(1.1)

4
where K is a constant.
Disjoining pressure is the pressure caused by adsorbed water confined within
the small spaces of capillary pores. In this narrow space, water exerts pressure on the
adjacent cement surfaces. When the adsorbed water is lost, the disjoining pressure is
reduced and the cement particles are drawn closer together, which results in
shrinkage. As with capillary stress, disjoining pressure is significant down to about 45
percent relative humidity. Below 45 percent RH, shrinkage is explained by changes in
surface energy. As the most strongly adsorbed water surrounding the cement particles
is removed, the free surface energy of the solid increases significantly. This water has
high surface tension and exerts a compressive pressure on cement particle, causing a
reduction in volume (Mindess, Young, and Darwin, 2003).
Carbonation shrinkage occurs as the result of chemical reactions between
hardened cement paste and carbon dioxide. It is believed that CO2 reacts with calcium
silicate hydrate (C-S-H) inducing a decrease in its calcium-silica (C/S) ratio with a
concomitant water loss. Carbonation shrinkage is a function of relative humidity and
is greatest around 50 percent relative humidity. Carbonation shrinkage, although not
very significant itself, can add to the effect of drying shrinkage and thereby lead to
cracking.
1.3 FREE SHRINKAGE: MEANING AND SIGNIFICANCE
If allowed to shrink freely, concrete will usually not crack. Concrete in the
bridge decks, however, is not allowed to shrink freely, due to various bridge

5
components, such as reinforcing bars, fixed supports, and girders, that tend to restrain
volume change in the deck and eventually lead to cracking. In some cases, differential
movement can occur between the top and the bottom of the deck due to temperature
or drying conditions.
“Free shrinkage” is the term associated with the method of test used to
evaluate the shrinkage of concrete. In this method, unrestrained concrete specimens
are allowed to shrink in a controlled environment. The shrinkage strain, normally the
longitudinal strain, is measured at regular intervals. To evaluate the cracking
tendency of concrete, another test method, in which shrinkage is restrained, is
employed. The most common restrained shrinkage test involves a concrete ring that is
cast on the outside of a restraining steel ring. The stresses due to shrinkage and the
age of specimen when the first crack appears are monitored. In a number of studies,
free and restrained shrinkage tests are performed simultaneously.
The free shrinkage test does not, by itself, evaluate the cracking tendency of
concrete. There is, however, a correlation between free shrinkage and the cracking
tendency of concrete. Mokarem, Weyers, and Lane (2004) reported that the potential
for cracking could be minimized by limiting the unrestrained shrinkage of concrete.
They stated that, length change should be limited to 0.0400 percent (400 με) at 28
days and 0.0500 percent (500 με) at 90 days to reduce the probability of cracking due
to drying shrinkage. Thus, although the free shrinkage test does not directly evaluate
cracking tendency, it has the potential to be used in a performance-based specification
for restrained concrete systems like bridge decks.

6
1.4 FREE SHRINKAGE TEST
There are different ways in which the free shrinkage of concrete can be
measured, and several test configurations, with different types of specimens, have
been employed to evaluate the unrestrained shrinkage of concrete. Mang et al. (2005)
compared four different methods to evaluate free shrinkage, including the standard
test (ASTM C 157) for shrinkage measurement, a test using an embedded strain gage,
a test using a Whittemore gage for the same type of specimen used with the
embedded strain gage, and a test using a Whittemore gage on cylindrical specimens.
The standard test followed ASTM C 157, except instead of a mechanical dial gage
length comparator, the test used LVDTs (Linear Variable Differential Transformers)
to measure length change. The second method used a dog-bone shaped specimen with
an overall length of 694 mm (27.30 in.). The change in length was recorded over a
length of 120 mm (4.68 in.) using an electrical strain gage embedded in the specimen.
The third method used specimens similar to those used in the second method and a
Whittemore gage to measure the change in length over a gage length of 254 mm (10
in.). The last method used 152 × 304 mm (6 × 12 in.) cylindrical specimens and a
Whittemore gage to measure the change in length. Upon comparison of the standard
deviation of the different test methods, the study concluded that strain measurements
using the embedded strain gage had the best repeatability with the lowest standard
deviation of 16.2 με, followed by the ASTM C 157 method using LVDT, which had a
standard deviation of 25.7 με.

7
This study will employ ASTM C 157, “Standard Test Method for Length
Change of Hardened Hydraulic Cement Mortar and Concrete” to measure free
shrinkage of concrete. This method uses rectangular concrete prisms with gage studs
at each end. A mechanical dial gage length comparator is used to measure length
change over time.
1.5 PREVIOUS WORK
Several studies have evaluated the shrinkage and cracking behavior of
concrete, using restrained and free shrinkage tests. Many of the conclusions from
these studies are, however, contradictory, demanding more work in this area.
A number of factors affect the drying shrinkage of concrete, including the
materials, construction procedures, and environmental conditions. This study will
focus on the effects of concrete materials and curing period on the drying shrinkage.
Tests related to cracking tendency of concrete from previous work will also be
reviewed.
Effect of water-cementitious material ratio and paste content:
Shrinkage is normally controlled by the cement paste (cementitious materials
and water) constituent of concrete. The cement content and water content of a
concrete mix, along with the water-cementitious material (w/cm) ratio have a great
influence on shrinkage of concrete. Hindy et al. (1994) conducted a study of the
drying shrinkage of high performance concrete (HPC). They considered the effects of
8
the w/cm ratio, curing time, and silica fume content on concrete shrinkage.
Laboratory tests on small specimens and field tests on HPC columns were performed.
Concretes were made with low w/cm ratios, 0.22 and 0.28. The lower w/cm ratio was
achieved by reducing the water content (from 220 lb/yd3 to 200 lb/yd3) and increasing
the cementitious material content including silica fume (from 800 lb/yd3 to 940
lb/yd3), thereby increasing the volume of paste from 28.1 percent to 29.7 percent. A
blended cement containing 7 to 8 percent of silica fume was used in the lower w/cm
ratio mixture, whereas the cement used in the other concrete mix contained no silica
fume. A naphthalene-based superplasticizer was used to obtain a slump of 200 mm (8
in.). Laboratory tests conformed to ASTM C 157. Shrinkage measurements of actual
columns in the field were taken using IRAD® vibrating wire extensometers.
Laboratory specimens included 100 × 375 mm (3.9 × 14.8 in.) cylinders and 100 ×
100 × 375 mm (3.9 × 3.9 × 14.8 in.) prisms. The curing conditions included storage
in lime-saturated water at 20° C (68° F), and storage in the air at a relative humidity
(RH) of 50 percent and an ambient temperature of 20° C (68° F). Some of the
specimens stored in air were sealed with plastic sheet and aluminum foil to prevent
moisture loss. The duration of curing varied from four days to one year. Two prisms
and two cylinders from each mix were placed in lime saturated water for one year,
two prisms and two cylinders were kept in air for one year, and two prisms and two
cylinders were sealed for one year. Two cylinders each were sealed for four, seven,
and 28 days, and then air cured for the rest of the year. Compressive strength and
modulus of elasticity were also tested. The results indicated a reduction in shrinkage
9
of concrete with lower w/cm ratio. The shrinkage of the concrete with the lower w/cm
ratio was lower than the concrete with higher w/cm ratio under each of the different
curing conditions. Hindy et al. attributed the reduction in shrinkage to both the
reduced w/cm ratio and the silica fume. According to the authors, an increase in the
w/cm ratio increases the total drying shrinkage and the rate of shrinkage of the cement
paste by providing more space for free water diffusion and reducing the rigidity of the
solid matrix to resist deformation. Silica fume densifies the hydrated cementitious
paste, thereby slowing down the rate of water evaporation and, hence, drying
shrinkage. In the study, the curing conditions significantly affected shrinkage. The
air-cured specimens experienced the highest shrinkage, followed by the sealed
specimens. The specimens that were cured in water for one year experienced slight
swelling. The concrete with the low w/cm ratio was less susceptible to expansion. The
specimens that were sealed for some time and then air cured showed that the
prolonged sealed curing helped to reduce the shrinkage significantly. It was also
observed that the reduction in shrinkage was more pronounced for specimens that
were sealed longer as the w/cm ratio increased.
Not all researchers have obtained the same results as Hindy et al. (1994) in
regard to the effect of the w/c ratio on shrinkage. Bissonnette, Pierre, and Pigeon
(1999) found that the influence of w/c ratio on the shrinkage of cementitious materials
was relatively small. An average reduction in shrinkage for 0.35 w/c ratio (over 0.5
w/c ratio) pastes, mortars, and concretes was 7 to 10 percent. Bissonnette et al. used
smaller prismatic specimens than Hindy et al. (1994), 4 × 8 × 32 mm (0.16 × 0.32 ×
10
1.28 in.) for pastes and mortars, and 50 × 50 × 400 mm (1.97 × 1.97 × 15.75 in.) for
concrete. The purpose of using smaller specimens was to obtain approximately
gradient-free shrinkage. ASTM Type I cement was used along with a granitic sand
and crushed limestone with a maximum nominal size of 10 mm (0.39 in.). For mortar,
two different sand to binder ratios, 1 and 2, were used with each w/c ratio (0.35 and
0.5). For concrete, the two different w/c ratios were used with two paste volume
fractions each, 0.30 and 0.35. The specimens were cured in lime-saturated water for
the first 28 days, and thereafter, in a room with a relative humidity (RH) of 48 percent
at 23° C (73° F). Overall, while the influence of w/c ratio on shrinkage, for a given
paste content, was observed to be in the 7 to 10 percent range. The effect of paste
volume on shrinkage was significant, with drying shrinkage directly proportional to
the paste volume content.
The effects of w/c ratio, silica fume and superplasticizer content on free and
restrained shrinkage of normal and high-strength concretes were studied by Bloom
and Bentur (1995). Concrete mixtures containing ASTM Type I cement, crushed
dolomite, and siliceous sand were used to cast 40 × 40 × 1000 mm (1.57 × 1.57 ×
39.37 in.) long bar specimens. The same specimens were used for free and restrained
shrinkage tests. A total of five mixes were cast, one mix with w/cm ratio of 0.5, three
mixes with w/cm ratio of 0.4, and two mixes with w/cm ratio of 0.33. Two of the 0.4
w/cm mixes and one of the 0.33 w/cm mix used 15 percent silica fume by mass of
cement. The paste content of 0.5 w/cm mix was 38.4 percent, while the paste contents
of 0.4 and 0.33 w/cm mixes (without silica fume) were 35.8 percent and 33.0 percent,

11
respectively. Because silica fume was used as an admixture (not a cement
replacement), mixes using silica fume had paste contents of 39.3 percent (for 0.4
w/cm) and 37.1 percent (for 0.33 w/cm). Concretes were either exposed to hot dry
conditions, 40° C (104° F) and 45 percent relative humidity, or sealed to prevent the
evaporation. One end of the specimens was fixed, while the movement of the free end
was monitored using a dial gage. For restrained shrinkage, the movable end (attached
to the specimen) was brought back to original position using a screw assembly, and
the load (and calculated stress) developed under the fully restrained condition was
monitored. For concretes with w/cm ratios of 0.33, 0.4 and 0.5, results indicated no
drastic changes in shrinkage for the different mixes. No clear trend of w/cm was
found, with the 0.5 w/cm concrete showing highest shrinkage, the 0.4 w/cm concrete
the lowest, and the 0.33 w/cm concrete in between. For all specimens, the concretes
exposed to the hot dry environment (45 percent relative humidity at 45 °C) exhibited
greater shrinkage than the sealed concretes. The shrinkage of concrete containing
silica fume was significantly higher than that of concrete without silica fume at a
constant w/cm ratio of 0.33, the difference being about 300 με at 4 days of exposed
curing. This could have been the effect of higher paste content of concrete containing
silica fume. The two 0.4 w/cm mixes using silica fume used exactly identical
proportions, except for the superplasticizer content. The concrete with the higher
dosage of superplasticizer (3 percent of cement by weight superplasticizer content vs.
1.8 percent) experienced higher shrinkage. For the restrained shrinkage tests, none of
the sealed concretes cracked, while all of the low w/cm exposed concretes exhibited

12
cracking, regardless of silica fume content. According to the authors, silica fume
accelerated the setting rate, and resulted in earlier cracking.
Effect of fineness of cement:
The fineness of the cement also affects the shrinkage of concrete. The rate of
hydration of portland cement depends on the surface area of the clinker particles;
finer cements develop strength more rapidly. The finer pore structure of finer cements
leads to higher early age shrinkage in concrete.
Bennett and Loat (1970) studied the influence of cement fineness on
shrinkage and creep of concrete. They used unrestrained and restrained ring tests to
evaluate shrinkage and a constant stress pneumatic loading test to evaluate creep.
Concretes were made with cement with three different grades of fineness, but similar
compositions. Aggregates consisted of pit sand and 19 mm (¾ in.) irregular crushed
quartzite. Four different w/c ratios in the range of 0.300 to 0.525 and aggregate to
cement ratios of 3.0, 4.0 and 5.0 were used for the test mixes. Although the batch
weights of different materials were not provided by the authors, it is understood that
when the w/c ratio was increased for a constant aggregate-cement ratio, the paste
content of the mix also increased. Free shrinkage specimens consisted of 483 × 102 ×
102 mm (19 × 4 × 4 in.) prisms with mild-steel studs at the ends. Restrained
shrinkage tests included 102 mm (4 in.) high ring specimens with a 328 mm (12.9 in.)
outside diameter and 76 mm (3 in.) thickness. A 32 mm (1¼ in.) thick steel ring on
the inside of concrete ring was used to provide restraint. Silicon semiconductor strain

13
gages were used to measure strains in the steel ring. Creep tests used prismatic
specimens of 508 × 102 × 102 mm (20 × 4 × 4 in.). A pneumatic loading system was
used to maintain the creep specimens at a constant stress. Tests were run at relative
humidities of 55 percent and 100 percent. The results indicated that, for given w/c and
aggregate-cement ratios, finer cement results in an increase in free shrinkage but that,
owing to the higher strength, there is no tendency of rapid shrinkage cracking. Only
in a limited number of restrained shrinkage tests did the use of finer cement result in
somewhat earlier cracking. They also observed that, based on equal workability, the
higher water demand of finer cements resulted in increased shrinkage. Shrinkage
versus Vebe time (workability) curves were plotted for mixes with different w/c ratios
for the coarsest and the finest cements. At a Vebe time of 7 s, the difference in
shrinkage was 200 με, which further increased for high workability mixes with high
water contents. For a constant aggregate-cement ratio, an increase in w/c ratio caused
an increase in shrinkage for all the mixes, possibly due to the increased paste contents
of the higher w/c ratio mixes. In the restrained shrinkage ring tests, concretes made
with finer cements tended to crack earlier, though not excessively so, the age at
cracking being greater than 40 days, except with the finest cement at the highest w/c
ratio. The concrete with the finest portland cement developed a high early age (3 to 5
days) shrinkage stress, but was sufficiently strong to withstand it without cracking
(cracking occurred at an age of 40 days). The results of the creep tests indicated an
increase in creep with the use of finer cements.

14
Effect of Aggregate:
The volume and type of aggregates in the concrete mix is another factor that
affects the shrinkage of concrete. Aggregates restrain the shrinkage of cement paste.
Hence an increase in aggregate volume and the commensurate reduction in the
volume of cement paste will lead to a reduction in shrinkage. In a progress report on a
long-term research program on drying shrinkage of concrete, Carlson (1938)
described the effect of type of aggregate on shrinkage. The shrinkage of concretes
containing different types of coarse aggregate, including quartzite, limestone,
dolomite, granite, and feldspar along with several types of natural sands and gravels,
was evaluated. At an age of six months, large differences were observed in the
shrinkage of concretes containing different aggregates. The highest shrinkage (870
με) was observed with the concrete containing crushed mixed gravel and the lowest
(450 με) was observed with the concrete containing quartzite. Some differences
resulted from the fact that some aggregates required more mixing water than others to
obtain a constant slump of 76 mm (3 in.), but the greater difference was due to the
physical properties of aggregate itself. The water cement ratios used for the mixes
were very high, varying from 0.62 to 0.87, and the paste content was 27 to 35
percent. After correction for the w/c ratio (shrinkage was corrected to a w/c ratio of
0.65 using factor of 1.75 percent change in shrinkage for each 1 percent difference in
water content, the cement content being constant for all mixes), it was noted that the
compressibility of the aggregates was a major factor influencing the shrinkage of
concrete. Natural sands and gravel, including sandstone and dolomite pebbles,

15
showed higher shrinkage than crushed aggregates, including granite, limestone, and
quartz. Among the crushed aggregates, the shrinkage was higher for concretes
containing aggregates with higher absorptions. For example, the concrete made with
quartz (specific gravity 2.65 and absorption 0.1 percent) had the lowest shrinkage
(450 με), while concrete made with crushed mixed gravel (specific gravity 2.74 and
absorption 1.0 percent) had the highest shrinkage (870 με). It should be noted that the
aggregates were in dry condition prior to mixing, and could possibly have absorbed
some mix water, thereby increasing the water demand. Carlson also reported very
little effect of maximum aggregate size and aggregate gradation on the shrinkage.
Alexander (1996) reported that elastic modulus, shrinkage, and creep of
concrete can vary by as much as 100 percent, depending on the aggregate type. He
studied the effects of 23 aggregate types including dolomites, quartz, granites, and
siltstones on the properties of hardened concrete. The work consisted of two series of
tests: one designed to obtain desired compressive strengths of 20, 30, 40, and 60 MPa
(2.9, 4.5, 5.8, and 8.7 ksi) and the other designed to use fixed w/c ratios of 0.74, 0.61,
0.51, and 0.41. Free shrinkage tests used 100 × 100 × 200 mm (3.93 × 3.93 × 7.87
in.) prisms with “DEMEC” (demountable mechanical) gages on two opposite faces
with a 100 mm (3.93 in.) gage length. The specimens were cured in lime-saturated
water for the first 28 days and then stored at a temperature of 23° C (73° F) and 60
percent relative humidity (RH). The results indicated that aggregate influences the
shrinkage in two ways: through the mixing water demand and through the stiffness of
the aggregate. The mixing water demand also decided the cement and paste content

16
of a given mix for given strength grade. The aggregates with more water demand
tended to produce concretes with higher shrinkage. The basis for determining the
“mixing water demand,” however, was not clear in the study, and the slump for
different mixes ranged from 25 to 95 mm (1 to 3.75 in.). The paste content of the
mixes ranged from 26 to 30 percent. The influence of different paste contents was
“eliminated” by the authors by normalizing the measured shrinkage values to a mean
paste volume using Pickett’s equation (Picket 1956).
1.5
p1c1
c2 p2
VSS V
⎡ ⎤= ⎢ ⎥⎢ ⎥⎣ ⎦
(1.2)
where Sc is the shrinkage of concrete, and Vp is volume fraction of paste. Subscript 2
was used for a mean paste volume, and individual results were normalized to the
mean paste volume. Despite normalization, aggregate type had a marked effect on
shrinkage. It was observed that concretes containing aggregate with higher elastic
moduli tended to restrain the shrinkage of paste, and produced concretes with lower
shrinkage. Concrete made with dolomite (the aggregate with highest elastic modulus)
exhibited the lowest shrinkage, whereas the concrete made with siltstone (the
aggregate with lowest elastic modulus) showed the highest shrinkage. Most types of
quartz and granite imparted values in between.
Effect of Mineral Admixtures:
Different mineral admixtures are often used in concrete to improve
compressive strength and other mechanical properties. There are different opinions on

17
the effect of these materials on drying shrinkage and cracking. Theoretically, one
might expect an increase in drying shrinkage due to the increased proportion of C-S-
H and the finer pore structure (Mindess, Young, and Darwin 2003). The findings of
various studies, however, are conflicting.
Three major types of mineral admixtures are popularly used in concrete, fly
ash, slag, and silica fume. A study by Khatri and Sirivivatnanon (1995) included all
three materials to evaluate their effect on the mechanical properties of concrete.
Seven mixes with a constant w/cm ratio of 0.35 and a constant cementitious material
content of 430 kg/m3 (725 lb/yd3) were used with different percentages of mineral
admixtures. The mineral admixture mixes contained 1 to 1.5 percent higher paste
volume due to the difference in specific gravities. The mixes included a control mix
with no mineral admixture, 10 percent silica fume with and without 10 to 25 percent
fly ash, and 10 percent silica fume with two different slag cements. One of the slag
cements contained 35 percent slag and the other contained 65 percent slag. A
superplasticizer was used to achieve a minimum slump of 120 mm (4.7 in.). The
actual slump of the mixes was in the range of 120-210 mm (4.7-8.3 in.). Drying
shrinkage tests were performed using 75 × 75 × 285 mm (2.95 × 2.95 × 11.22 in.)
prisms, and shrinkage was reported as the average of three specimens. The specimens
were cured in lime-saturated water for the first seven days and stored thereafter in a
controlled environment at 23° C (73° F) and 50 percent relative humidity. The results
indicate an increase in early age shrinkage for concrete containing silica fume over
the control mix. The long-term shrinkage, however, was less for the concrete using

18
silica fume than the control concrete. Khatri et al. suggested that, although long-term
shrinkage is reduced with the use of silica fume, the early age increase in shrinkage
may lead to significant cracking because the tensile strength of concrete is low at
early ages. The drying shrinkage of all slag mixes were found to be higher than the
mixes prepared from ordinary cement. The fly ash mixes also showed higher drying
shrinkage than the control concrete. The amount of fly ash, however, did not appear
to affect the shrinkage characteristics. The increased shrinkage of mineral admixture
mixes could have been partly contributed by the higher paste volume of these mixes.
In another study using fly ash, Atis (2003) reported a decrease in drying
shrinkage with the use of fly ash. In this work, drying shrinkage and other properties
of concrete containing high volumes of fly ash were tested. Fifty and 70 percent
replacements by mass of the ordinary portland cement using low calcium Class F fly
ash (ASTM C 618). A total of six mixtures were made, two each with 100 percent
portland cement (control mixtures), 70 percent fly ash replacement and 50 percent fly
ash replacement. The optimum water content required for maximum compactabilty
was determined using the vibrating slump test (Cabrera and Atis 1999). The optimum
water content was then used to produce concrete mixtures with zero slump. The
mixtures were made workable using a carboxylic type superplasticizer. The actual
w/cm ratios ranged from 0.28 to 0.34. The optimum water content and actual w/cm
ratios for the fly ash mixtures were less than those for the control mixes. Due to the
differences in specific gravities, however, the paste volume in fly ash mixes was
higher (27.3 percent in 50 percent fly ash mix and 26.9 percent in 70 percent fly ash

19
mix as compared to 25.9 percent in the control mix). Changes in length due to drying
shrinkage of 50 × 50 × 200 mm (2 × 2 × 8 in.) concrete prisms were measured with a
mechanical dial gage. The specimens were demolded one day after casting and stored
at 20° C (68º F) and 65 percent relative humidity until the final measurement was
taken at an age of six months. Two prisms were cast for each concrete mix, and the
average concrete shrinkage was reported. It should be noted that with one day of
curing, the reaction of fly ash with calcium hydroxide should be limited. Significantly
lower shrinkage was observed for the high volume fly ash concrete than for the
control concrete. The reduction was greater with the 70 percent fly ash replacement
than with the 50 percent replacement. The shrinkage at an age of six months was
lowest (294 με) with 70 percent fly ash concrete, medium (263 με) for the 50 percent
fly ash concrete, and highest (385 με) for the concrete made with ordinary portland
cement. It was also observed that the concrete made with superplasticizers showed
about 50 percent higher shrinkage than the concrete made without superplasticizers.
For the control concrete and the concrete containing 70 percent fly ash, the mixes
with the higher w/cm ratio (0.34 versus 0.32 in the control concrete and 0.33 versus
0.30 in the concrete containing 70 percent fly ash) also contained the superplasticizer.
The author attributed the higher shrinkage of higher w/cm concrete (554 με versus
385 με in the control concrete and 413 με versus 294 με in the concrete containing 70
percent fly ash) to the superplasticizer, rather than the w/cm ratio. For the concrete
containing 50 percent fly ash, higher shrinkage (394 με versus 263 με) was recorded
with the superplasticized concrete, although it had the lower w/cm ratio (0.28 versus

20
0.29) than non-superplasticized concrete containing 50 percent fly ash. The
compressive strengths of the mixtures containing 70 percent fly ash were lower than
the compressive strengths of the corresponding control mixtures at all ages. The
compressive strengths of mixtures containing 50 percent fly ash, however, were
comparable or higher than the strengths of the corresponding control mixtures at 7
days of age and beyond. At 28 days, the compressive strength of control concrete was
65 MPa (9430 psi), that of the concrete containing 50 percent fly ash was 67 MPa
(9720 psi), while that of the concrete containing 70 percent fly ash was only 31 MPa
(4500 psi). The author claimed that the low shrinkage properties and high strength of
the high volume (up to 50 percent) fly ash concrete make this type of material a
possible alternative to the ordinary portland cement concrete used on concrete
pavements and bridge decks, where shrinkage cracking is a critical consideration.
A significant increase in shrinkage with silica fume replacement was observed
in a study by Rao (1998). The work included drying shrinkage tests on mortar 25 ×
25 × 250 mm (0.98 × 0.98 × 9.84 in.) prisms. The silica fume was used at
replacement rates for cement ranging from 0 to 30 percent by weight. A constant
w/cm ratio of 0.5 was used for mortars, with a cementitious material to sand ratio of
1:3 by mass. Because the specific gravity of silica fume is lower than that of cement,
a constant w/cm ratio and cementitious material to sand ratio led to increased paste
volumes in silica fume mortars. Drying shrinkage at 28 days was considered. The
results indicated a significant increase in shrinkage with the use of silica fume, which
further increased with the quatity of silica fume. The author concluded that the

21
addition of silica fume increases the content of calcium silicate hydrate, which is the
most important factor causing shrinkage at an age of 28 days. The increased paste
volume of silica fume mortars, which could have been one of the factors contributing
to the increased shrinkage of these mortars, was not considered by the author.
Whiting, Detwiler, and Lagergren (2000) studied the effects of silica fume on
drying shrinkage and the cracking tendency of concrete bridge decks. Concrete mixes
were developed for use in full depth and overlay placements. The overlay mixes used
higher cementitious material contents and air contents and lower w/cm ratios than the
full-depth mixes. The w/cm ratios ranged from 0.35 to 0.45 for full-depth mixes and
from 0.30 to 0.35 for overlay mixes. The silica fume content ranged from 0 to 12
percent of the total weight of cementitious materials. For a given w/cm ratio, the paste
volume in a mix was approximately same (within 0.3 percent) for mixtures with and
without silica fume. Both unrestrained shrinkage and ring tests were performed to
evaluate the cracking tendency of concrete. Unrestrained drying shrinkage tests
followed AASHTO T 160 (ASTM C 157). Three prismatic 75 × 75 × 285 mm (3 × 3
× 11.25 in.) unrestrained shrinkage specimens were prepared for each mix. Overlay
specimens were cured in lime-saturated water for three days and full depth specimens
for seven days, after which both types of specimen were stored at 23°C (73°F) and 50
percent relative humidity. The restrained specimen was a 75 mm (3 in.) thick, and
150 mm (6 in.) high concrete ring around the outside of a 19 mm (0.75 in.) thick steel
cylinder with an outside diameter of 300 mm (11.75 in.). The ring specimens were
cured for one and seven days, representing the worst case scenario and good practice,
22
respectively. Four strain gages placed on the steel ring recorded the strains once every
30 minutes using a data acquisition system. Crack formation was identified by a local
decrease in the strain recorded by a strain gage. In the study, the overlay concretes
exhibited more shrinkage than the full depth concretes because of their higher paste
content and lower period of moist curing. For a given percentage of silica fume
replacement, shrinkage was low for the mixes with low w/cm ratios. It should be
noted, however, that the higher w/cm ratio mixes contained a higher paste volume for
a given silica fume replacement. For example, for 1.8 percent replacement mixes,
paste volume was 25.2 percent in 0.36 w/cm mix, while that in 0.43 w/cm mix was
27.5 percent. For the silica fume concretes, there was a little effect of silica fume
content on the ultimate shrinkage (450 days) of concrete. At 4 days of drying,
however, the shrinkage was higher for the concretes made with silica fume. Also,
shrinkage increased with increased silica fume content at this age. Whiting et al.
observed that concretes containing silica fume are more sensitive to the changes in
w/cm ratio. A small change in w/cm ratio in a concrete containing silica fume can
lead to significantly higher shrinkage. The cracking tendency of concrete was
affected by silica fume only when concrete was not properly cured. For the specimens
cured for one day, the silica fume concretes cracked sooner than the control
specimens (also cured for one day) with same w/cm ratio. Statistical studies to obtain
more definitive conclusions indicated that, for concretes cured for one day, increasing
the silica fume content from zero to six percent and zero to nine percent was the only
significant factor affecting cracking. The use of silica fume significantly decreased

23
the time to first crack for mixes cured for one day. Increasing silica fume content
from 6 to 9 percent, however, did not decrease the time to first crack. The authors
concluded that, to achieve optimum results, the amount of silica fume used should be
limited. Unless demanded by the situation, silica fume above a range of 6 to 8 percent
should not be used. The authors, however, gave no clear justification for this
conclusion.
ACI Committee 232 on use of fly ash in concrete reports that where the
addition of fly ash increases the paste volume in a concrete mix, shrinkage may be
increased slightly if the water content remains constant. If the water content is
reduced, shrinkage should be about the same as concrete without fly ash. ACI
Committee 233 on use of slag cement in concrete and mortars offers a similar opinion
on the effect of slag on shrinkage, that is, shrinkage can be reduced when the lower
paste contents are used with slag mixes The committee found that published data on
the effects of slag on shrinkage indicate conflicting results, and overall, drying
shrinkage is similar in portland cement concrete and concrete containing slag. ACI
Committee 234 on use of silica fume in concrete reports that the drying shrinkage of
concrete containing silica fume is generally comparable to that of the portland cement
concrete. The committee reports that slightly higher shrinkage may be expected at
early ages for mixtures with w/cm ratios of more than 0.60 and for concrete
containing higher silica fume contents (more than 10 percent by mass of cement).

24
Effect of superplasticizers:
Chemical admixtures, such as superplasticizers, water reducers, air-entraining
agents, and shrinkage reducing admixtures, are often used with concrete. The effect
of superplasticizers on the shrinkage of concrete is of main concern because
superplasticizers help to reduce the water content of concrete, which is one of the
important factors affecting shrinkage. There are different ways in which mixes are
proportioned when studying the effect of superplasticizers on shrinkage of concrete.
Some studies design the mixes for same w/c ratio, but reduce the cement content (and
in turn the paste content) and others design for a reduced w/c ratio. Phelan and Martin
(1995) offered different opinions regarding the effect of superplasticizers on
shrinkage. Phelan argued that a good superplasticizer can reduce the water content of
concrete by 10 to 18 percent and that this reduction in water will lead to reduced
shrinkage. He also contended that it is impossible to increase the shrinkage of any
mix by reducing the water content of the mix and replacing its volume with
aggregate. In same article, however, the other author, Martin contended that the use
of many chemical admixtures will indeed reduce the mix-water content, but will not
reduce the shrinkage. ACI 224R (2001) also supports this opinion. Past studies have
led to conflicting opinions about the effects of superplasticizers on shrinkage.
Qi, Li, and Ma (2002) reported a reduction in free shrinkage with use of a
high superplasticizer content. Ring specimens were used for both free and restrained
shrinkage tests in the study. Type I portland cement was used along with a w/cm ratio
of 0.4 and superplasticizer contents of 1.38 and 2.76 percent by weight of

25
cementitious materials. For all of the mixtures, the mix proportion by weight of
cement: sand: coarse aggregate was 1:1.84:2.67. Therefore, water content and paste
content of all mixes remained constant. The ring specimen was a 35 mm (1.38 in.)
thick, 140 mm (5.11 in.) high concrete ring with a 375 mm (14.76 in.) outer diameter
cast around a 51 mm (2.0 in.) thick steel ring. For the free shrinkage specimen, this
ring was cut into four pieces and removed during demolding. Both specimen types
were cured for 4 days at 100 percent relative humidity and exposed to drying
conditions of 40 percent relative humidity at 20°C (68°F) thereafter. Free shrinkage
was measured using a dial-gage extensometer and DEMEC (demountable
mechanical) studs fixed on the top surface of the specimen along the circumferential
direction. For the restrained shrinkage specimens, the onset time of a new crack was
recorded and the crack width was measured using a 30 magnification microscope.
The results of these tests indicated that the shrinkage of the concrete with higher
superplasticizer content (2.37 percent by weight of cement) was lower than the
shrinkage of the concrete with the lower superplasticizer content (1.39 percent by
weight of cement). Moreover, the major advantage of the higher dosage was a
significant delay in occurrence of the first visible crack in restrained shrinkage
specimens, when compared to the lower dosage. The test results showed that the
higher superplasticizer content was effective in inhibiting crack opening and
propagation. The authors explained these results with a theory that the action of high-
range water reducers mainly derives from a better particle dispersion as admixture is
adsorbed on the cement particles, and as a result, a reduction in the surface tension of
26
water leads to lower capillary pressure. The reduced pressure can decrease the free
shrinkage and shrinkage cracking width. As will be seen next, however, most other
researchers have found that the use of superplasticizers in concrete leads to increased
shrinkage.
Johnston, Gamble, and Malhotra (1979) studied the effects of
superplasticizers on the properties of fresh and hardened concrete. The effects on
shrinkage and creep were considered along with several other properties.
Superplasticizers were used to reduce the cement content while maintaining the w/c
ratio (0.5) and workability constant. Four commercially available superplasticizers
were used. Three mixes were prepared for each type of superplasticizer: a mix
containing no superplasticizer with 100 mm (4 in.) slump, a zero slump mix with no
superplasticizer, and a 100 mm (4 in.) slump mix with a superplasticizer. The paste
content of the first mix was 32.1 percent while that of the latter mixes was 23.7
percent. Shrinkage was measured using 100 × 300 mm (4 × 12 in.) cylinders with the
help of DEMEC (demountable mechanical) extensometers. The specimens were
moist cured for 56 days and dried at 20ºC (68ºF) and 50 percent relative humidity
thereafter. The zero slump mix without a superplasticizer (with paste content of 23.7
percent) exhibited less shrinkage than the 100 mm (4 in.) slump mix without
superplasticizer. The difference was 10 με at 7 days and 95 με at 365 days. All
mixtures containing superplasticizers, except the mixture containing high-molecular-
weight sulfoaryl alkylene, exhibited higher shrinkage than the mixes containing no
superplasticizers. Melamine formaldehyde condensate (admixture I) and high-
27
molecular-weight sulfoaryl alkylene (admixture II) had little effect on shrinkage. But
sulfonated polymer (admixture III) and polymerized naphthalene condensate
(admixture IV) increased the shrinkage. At seven days of drying, the difference
between the mix containing admixture III and the mixes without superplasticizer was
35 με and 45 με for the 100 mm (4 in.) slump mix and the zero slump mix,
respectively. At the same age, the difference between the mix containing admixture
IV and the mixes without superplasticizer was 50 με and 60 με for the 100 mm (4 in.)
slump mix and the zero slump mix, respectively. Similar results were obtained with
the creep tests, admixtures I and II induced little change in total creep while
admixtures III and IV increased total creep. It should be noted that the results could
have been significantly affected by the difference in paste contents of the mixes,
which is not considered by authors.
Brooks (1989) suggested that if measured shrinkage values are not available
from specific tests for concrete containing superplasticizers, estimated long-term
deformations should be increased by 20 percent. Brooks ran an analysis of the
available data to develop an approximate method to estimate the shrinkage of
concrete containing superplasticizers. The analysis concluded that the use of
superplasticizers increases the creep and shrinkage of concrete by 3 to 132 percent.
Due to limited data, no definite conclusion could be made regarding the effect of
superplasticizer type on shrinkage.
ACI Committee 212 reports that superplasticizers may increase concrete
drying shrinkage at a given w/cm ratio and cement content. If there is any

28
simultaneous reduction in cement content and w/cm ratio, when the superplasticizer is
used, less shrinkage may be expected than the concrete made with no
superplasticizer.
Effect of curing:
One of the factors often discussed while studying the shrinkage and cracking
of concrete is the curing period. The effects of curing conditions on concrete
shrinkage were studied by Alsayed and Amjad (1994). Reinforced concrete slabs on
grade were exposed to a hot, dry climate, and the effects of intermittent wet and dry
curing were considered. During the first seven days, four methods were used to cure
four different groups of specimens. Group A was sprinkled with water twice a day;
Group B was covered with burlap and sprinkled with water twice a day; Group C was
covered with impervious polyethylene sheet; and Group D exposed to air with no
curing. In Groups A and B, no efforts were made to keep the concrete surface
continuously wet. The specimens were left on the ground uncovered, and with no
curing for the rest of 360 days. During the curing period, the slab specimens were
stored on ground and no protection against moisture loss was provided to the sides.
The specimens were provided with DEMEC gage points in both directions to measure
shrinkage. Maximum shrinkage of the specimens during the test period of 360 days
was 330, 343, 420, and 456 με for Group A, B, C and D, respectively. The study
concluded that intermittent wet curing reduces the ultimate shrinkage of concrete, and
also increases the exposure time needed to develop it, but none of the methods used

29
in the study effectively reduced the rate of shrinkage at early stages (up to 30 days) of
curing. For all the curing methods used, the shrinkage rate was about 5 με per day
during the first 30 days.
The effect of curing conditions on the shrinkage of normal and lightweight
concrete containing pozzolanic admixtures was investigated by Nassif, Suksawang,
and Mohammed (2003). Water-cementitious material ratios of 0.29 and 0.35 were
used with varying percentages of silica fume, slag, and fly ash. All of the mixes
contained silica fume; fly ash and slag were added to some of the mixes. 76 × 76 ×
279 mm (3 × 3 × 11 in.) prisms with vibrating-wire strain gages embedded in center
were used for shrinkage measurement. Stainless steel studs were also embedded on
each end to measure free drying shrinkage using a length comparator. Three different
curing methods, air curing, air curing after coating with a curing compound, and
moist curing with wet burlap were used. The air-cured specimens were stored in a
controlled environment of 25°C (77°F) and 50 percent relative humidity after
demolding. In method 2, the specimens were coated with the curing compound using
a brush. The moist cured specimens were wrapped with wet burlap after demolding
until 28 days. The shrinkage of the air cured concrete was highest, followed by the
specimens coated with the curing compound, and then the burlap-wrapped specimens.
Nassif et al. concluded that effective curing reduces autogenous and drying shrinkage
of concrete. To prevent autogenous shrinkage, concrete needs to be covered with wet
burlap immediately after finishing, since autogenous shrinkage mainly occurs in the
first 7 hours.

30
Powers (1959) contended that moist curing conditions are not important for
controlling volume changes. Cement paste is partly restrained by unhydrated cement,
and since prolonging the curing period reduces the amount of unhydrated cement, it
should increase the amount of shrinkage in cement paste. The overall shrinkage of
concrete, however, might be diminished by the prolonged moist curing. The reason
behind this is that prolonged curing makes paste more prone to internal cracks when
severely restrained, and if cracking relieves the stress around aggregate particles, the
overall shrinkage might be reduced with a longer curing period. He claimed that, in
general, the length of moist curing is a relatively unimportant factor in the control of
shrinkage.
Darwin, Browning, and Lindquist (2004) used field observations to assess the
factors that affect cracking in bridge decks. Crack surveys of steel girder bridges in
Kansas were preformed over a period of 10 years by Schmitt and Darwin (1995,
1999), Miller and Darwin (2000) and Darwin, Browning, and Lindquist (2004).
Crack densities on the reinforced concrete bridge decks were calculated based on
crack maps prepared according to standard procedures developed by the researchers.
Parameters, such as age, bridge deck type, material effects, girder end conditions, and
date of construction, were found to affect cracking. It was observed that cracking in
bridge decks increases over time, but most of the cracking occurs at an early age.
Crack density for monolithic bridge decks was found to be lowest compared to that
observed for decks with conventional high-density overlays and decks with silica
fume overlays. Improved construction procedures, however, such as efforts to limit

31
the evaporation prior to the initiation of wet curing, led to decreased cracking in more
recently constructed silica fume overlay bridge decks. While considering the effects
of materials, it was observed that decreases in the water content, cement content, and
paste volume of concrete led to decreased cracking. This observation reconfirmed the
well understood fact that the paste constituent of concrete controls shrinkage.
1.6 SUMMARY OF PREVIOUS WORK
Researchers have used different methods to investigate the shrinkage and
cracking tendencies of concrete. The conclusions of these studies are contradictory in
a number of cases.
It is generally agreed that an increase in the paste volume of concrete leads to
an increase in drying shrinkage. Some of the studies have observed increased
shrinkage with a higher w/c ratio, while others have found little or no clear effect of
w/c ratio on shrinkage. Increases in water content, cement content, and paste volume
leads to an increase in shrinkage and cracking. Aggregates affect shrinkage as a
function of their stiffness, with stiffer aggregates providing more restraint to the
shrinkage of the paste. Some aggregate types may have a higher water demand and,
thereby, increase shrinkage. Use of aggregates with higher absorption values may
lead to increased shrinkage, unless the aggregates are completely saturated. An
increase in aggregate content of a mix will result in a decrease in shrinkage, but the
gradation of aggregate does not influence shrinkage. Concretes containing fine
cements tend to shrink more than those containing coarser cements. Other
32
considerations, however, such as increased permeability and reduced compressive
strength, should be given a due regard when using coarse cements. Most conflicting
opinions deal with the effect of mineral admixtures on shrinkage. Most studies
concluded that the use of mineral admixtures will increase shrinkage in concrete,
while a few have found lower drying shrinkage with concrete containing mineral
admixtures. Some of the studies concluded that concrete containing mineral
admixtures will have an increased cracking tendency only if not properly cured. The
use of mineral admixtures was found to increase the early age shrinkage in most
cases, increasing the possibility of early age cracking. Some studies reported
increased shrinkage with the use of superplasticizers. In general, however, because
superplasticizers allow a reduction in the water content of concrete, their use is
believed by some to result in a reduction in shrinkage. Many experts including ACI
Committee 224, believe that a reduction in water content achieved by use of
superplasticizer will not reduce shrinkage. Moist curing is usually required for control
of early age shrinkage and cracking. Although some concrete experts claim that
prolonged curing will have little effect on shrinkage, most studies have found a
reduction in shrinkage with the use of an increased curing period.
1.7 OBJECTIVE AND SCOPE
The objective of this study is to assess the effects of different parameters,
including paste volume, w/c ratio, aggregate type, cement type, curing period, and use
of mineral admixtures and superplasticizers on the shrinkage of concrete for use in

33
bridge decks. Free shrinkage tests are used to evaluate the shrinkage behavior of
different concrete mixes subjected to standard drying conditions. Aggregate
optimization is used for the concrete mixtures.
A series of concrete mixes is tested in total of five test programs. Program I
consists of 18 mixes with three w/c ratios (0.40, 0.45, and 0.50), three aggregate
contents (60, 70, and 80 percent), and two cement types (Type I/II and Type II
coarse-ground). Program II consists of 11 mixes using three types of coarse
aggregate, quartzite, limestone, and granite. A total of eight non-air-entrained and
three air-entrained mixes are tested in this program. Program III contains 11 non-air-
entrained concrete mixes with cement replacement by three types of mineral
admixture, Class C fly ash, slag, and silica fume. In Program IV, a total of four mixes
are made in two groups, non-air-entrained and air-entrained. Each group consists of
two mixes, one with Type I/II cement and the other with Type II coarse ground
cement. These mixes are used to evaluate the effect of differences in curing period (3,
7, 14 and 28 days). The effect of superplasticizer type, (carboxylated polyether and
napthalene) is evaluated in Program V. Each set contains a control mix with no
superplasticizer. In two sets, dosage levels are determined to obtain a slump of 76
mm (3 in.). In one of these sets, the control mix uses no superplasticizer and is not
required to achieve the specified slump, while in the other set, the control mix uses an
increased paste content to obtain the specified slump. In other sets, low, medium, and
high dosage levels of the superplasticizers, based on the manufacturer’s
recommended dosage range, are used. This program contains a total of 32 mixes.
34
Three free shrinkage specimens are cast and tested for each mix. All
specimens are cured in lime-saturated water for 3 days after casting, except for the
specimens in Program IV, which are cured for 3, 7, 14, or 28 days. Shrinkage
measurements are taken once every day for the first 30 days after casting. The
interval of measurement is then increased to once every other day to an age of 90
days, once every week to an age of 180 days, and once every month, thereafter, until
the final reading is taken at an age of 365 days.
CHAPTER 2: EXPERIMENTAL PROGRAM
2.1 GENERAL
The experimental work performed in the study, including the materials,
equipment, and procedures, is described in this chapter. Performance in free
shrinkage tests is measured as a function of water-cementitious material (w/cm) ratio,
aggregate content, aggregate type, mineral admixture replacement of cement, use of
superplasticizers, cement type, and duration of curing. All mixtures, except those
used to evaluate the effects of aggregate type, contained limestone coarse aggregate,
Kansas River sand, and pea gravel. Specimens were cured in lime-saturated water.
All specimens, except those used to evaluate the effect of curing time on shrinkage,
were cured for 3 days before drying started in a controlled environment. The study
includes a total of five test programs, which are listed in Tables 2.1 through 2.5.
Program I addresses the effects of water-cement (w/c) ratio, aggregate content, and
cement type on concrete shrinkage. Program II addresses the effects of three types of
coarse aggregates on shrinkage. The effects of three mineral admixtures (slag, silica
fume, and Class C fly ash) on shrinkage are evaluated in Program III. The shrinkage
behavior of concrete with different curing periods is studied in Program IV. Program
V addresses the effects of superplasticizer type and dosage rate on shrinkage.
Aggregate gradations and the mix proportions are given in Tables 2.6 through 2.17.
35
36
2.2 FREE SHRINKAGE TEST
The procedure specified in ASTM C 157 was used for casting and testing the
free shrinkage specimens. Cold-rolled steel molds (Figure 2.1) from the Humboldt
Manufacturing Company were used to cast the specimens. To facilitate the
measurement of length change, gage studs that were knurled at one end and threaded
at the other were embedded in both ends of the specimens. The specimens measured
76 × 76 × 286 mm (3 × 3 × 11¼ in.) and the gage length between the gage studs was
254 mm (10 in.). The specimens are shown in Figure 2.2. The specimens were stored
in a controlled environment and measurements were taken up to 365 days. The
storage conditions and frequency of measurement will be described in Sections 2.14
and 2.15, respectively. A mechanical dial gage length comparator (Figure 2.3) from
the Humboldt Manufacturing Company with a least count of 0.0001 in. (0.00254
mm) and a total range of 0.4 in. (10 mm) was used to monitor the change in length of
the specimens.
2.3 MATERIALS
The materials used in this study include two types of portland cement, Type
I/II and Type II coarse-ground, two types of limestone, three types of quartzite, and
one type of granite as coarse aggregates, and sand and pea gravel as fine aggregates.
Mineral admixtures included Class C fly ash, ground granulated blast furnace slag,
and silica fume. Chemical admixtures included three types of superplasticizer and an
air-entraining agent.

37
2.3.1 CEMENT
The Type I/II cement had a specific gravity of 3.2 and a Blaine fineness of
378 m2/kg. It was produced by Lafarge North America in Sugar Creek, MO and had a
Bogue composition of 55 percent C3S, 18 percent C2S, 7 percent C3A, and 10 percent
C4AF.
The coarse ground Type II cement had a specific gravity of 3.2 and a Blaine
fineness of 306 m2/kg. It was produced by Ash Grove Cement Company in Seattle,
WA and had a Bogue composition of 61.5 percent C3S, 13.44 percent C2S, 7.69
percent C3A, and 8.94 percent C4AF.
2.3.2 FINE AGGREGATES
All programs used optimized aggregate gradations with combinations of sand
and pea gravel as fine aggregates.
The pea gravel was KDOT classification UD-1 from Midwest Concrete
Materials in Manhattan, KS. The saturated surface dry (SSD) specific gravity was
2.62, and the absorption (dry) was 0.7 percent. As listed in Table 2.6, Gradation 1
was used in all batches in Program I, Batches 85 through 88 in Program III, and
Batches 94 and 95 in Program II. Gradation 2 was used in Batches 165 and 166 in
Program IV, and Batches 175 through 186 in Program V. Gradation 3 was used in
Batches 187 through 189 and Batches 198 through 200 in Program II, Batches 194
through 197 in Program III, Batches 201 and 207 in Program IV, and Batches 190
through 193, and Batches 208 through 211 in Program V. Gradation 4 was used in

38
Batches 249, 256, 259, and 260 in Program V. Gradation 5 was used in Batches 262
though 264 in Program II.
The Kansas River sand was from Victory Sand and Gravel Company in
Topeka, KS. It had a saturated surface dry (SSD) specific gravity of 2.63 and 0.35
percent absorption (dry). A total of 6 gradations were used, as listed in Table 2.7.
Gradation 1 was used in all batches in Program I, Batches 85 through 88 in Program
III, and Batches 94 and 95 in Program II. Gradation 2 was used in Batches 167
through 174 in Program V, and Batches 165 and 166 in Program IV. Gradation 3 was
used in Batches 175 through 186 in Program V. Gradation 4 was used in Batches 187
through 189, and Batches 198 through 200 in Program II, Batches 194 through 197 in
Program III, Batches 201 and 207 in Program IV, and Batches 190 through 193 and
Batches 208 through 211 in Program V. Gradation 5 was used in Batches 249, 256,
259, and 260 in Program V. Gradation 6 was used in Batches 262 though 264 in
Program II.
2.3.3 COARSE AGGREGATES
The coarse aggregates include 19 mm (¾ in.) granite, 25 mm (1 in.)
limestone, 19 mm (¾ in.) limestone, 25 mm (1 in.) quartzite, quartzite chip, and 19
mm (¾ in.) quartzite.
Granite:
The 19 mm (¾ in.) granite was obtained from Granite Mountain Quarries in
Little Rock, AR. The SSD specific gravity was 2.61 and the absorption (dry) was

39
0.56 percent. Granite was only used in Program II. The gradations are given in Table
2.8. Gradation 1 was used in Batches 189 and 200 and Gradation 2 was used in Batch
264 in Program II.
Limestone:
The 25 mm (1 in.) limestone was a Class I limestone from the Martin Marietta
Quarry in De Soto, KS. It had a SSD specific gravity of 2.57 and 2.92 percent
absorption (dry). The gradations are given in Table 2.9. Gradation 1 was used in all
batches in Program I, Batches 85 through 88 in Program III, and Batch 94 in Program
II.
The 19 mm (¾ in.) limestone was KDOT approved Class I limestone from the
Hunts Midwest Mining Sunflower Quarry in De Soto, KS. It had a SSD specific
gravity of 2.58 and 3.0 percent absorption (dry). The gradations are given in Table
2.10. Gradation 1 was used in all batches in Program I, Batches 85 through 88 in
Program III, and Batch 95 in Program II. Gradation 2 was used in Batches 165 and
166 in Program IV and Batches 167 through 174 in Program V. Gradation 3 was used
in Batches 175 through 186 in Program V. Gradation 4 was used in Batches 188 and
199 in Program II, Batches 194 through 197 and 202 through 204 in Program III,
Batch 201 in Program IV, and Batches 190 through 193 in Program V. Gradation 5
was used in Batches 208 through 211 in Program V. Gradation 6 was used in Batches
249, 256, 259, and 260 in Program V, and Batch 263 in Program II.
40
Quartzite:
Three types of quartzite were used in Program II, all from L. G. Everist Inc. in
Dell Rapids, SD. The 25 mm (1 in.) quartzite had an SSD specific gravity of 2.63 and
absorption (dry) of 0.44 percent. The quartzite chip had an SSD specific gravity of
2.63 and absorption of 0.49 percent. The 19 mm (¾ in.) quartzite had an SSD specific
gravity of 2.64 and absorption (dry) of 0.44 percent. The gradations for quartzite are
given in Table 2.11. Quartzite was used as coarse aggregate in Program II. Gradation
1 was used in Batches 187 and 198, Gradation 2 in Batch 262, and Gradations 3 and 4
in Batch 94.
2.3.4 MINERAL ADMIXTURES
Program III used three types of mineral admixture, fly ash, slag, and silica
fume. The fly ash was a Class C fly ash and had a specific gravity of 2.83. It
was obtained from Ash Grove Resources, LLC in Topeka, KS. The ground
granulated blast-furnace slag had a specific gravity of 2.86 and was obtained from
Holcim Inc. in Chicago, IL. The silica fume was Force 10,000 D densified
microsilica from Grace Construction Products in Cambridge, MA. It had a specific
gravity of 2.20. The chemical composition of all three mineral admixtures is given in
Table 2.12.

41
2.3.5 CHEMICAL ADMIXTURES
Three types of superplasticizer were used in Program V to compare the effect
of different superplasticizers on shrinkage. Superplasticizers were also used in other
programs to obtain the desired workability. An air-entraining agent was used in
Program IV and in some batches in Program II and V.
Superplasticizers:
Glenium 3000 NS, a carboxylated polyether based superplasticizer, is
produced by BASF Admixtures, Inc. It conforms to the requirements of ASTM C 494
as a Type A and a Type F admixture. The solids content ranges from 27 to 33 percent,
and the specific gravity is 1.08. The manufacturer recommends a dosage range of 260
to 780 ml/100 kg (4 to 12 fl oz/cwt) of cementitious material.
Rheobuild 1000, a naphthalene based superplasticizer, is produced by BASF
Admixtures, Inc. It conforms to the requirements of ASTM C 494 as a Type A and a
Type F admixture. The solids content ranges from 38.5 to 42.5 percent, and the
specific gravity is 1.20. The manufacturer recommends a dosage range of 650 to 1600
ml/100 kg (10-25 fl oz/cwt) of cementitious material.
Adva 100, a carboxylated polyether based superplasticizer, is produced by
Grace Construction Products. It conforms to the requirements of ASTM C 494 as a
Type F admixture. The solids content ranges from 27.5 to 32.5 percent, and the
specific gravity is 1.10. The manufacturer recommends a dosage range of 195 to 650
ml/100 kg (3 to 10 fl oz/cwt) of cementitious material.

42
Air-Entraining Agent:
The air-entraining agent was Micro Air, produced by BASF Admixtures, Inc.
It conforms to the requirements of ASTM C 260. The solids content is 13 percent,
and the specific gravity is 1.01. The manufacturer recommends a dosage range of 8 to
98 ml/100 kg (0.125 to 1.5 fl oz/cwt) of cementitious material.
2.4 MIX PROPORTIONING
An optimized blend of aggregates was obtained using 3 aggregates (coarse
aggregates, pea gravel, and sand) for mix proportioning of all batches in this study.
Aggregates were blended using a computer program (McLeod 2005) to obtain an
effective gradation that was close to an ideal gradation. An ideal gradation is one in
which the weights retained on each sieve are adjusted so that the Coarseness and
Workability Factors (Shilstone 1990) equal preselected values. An optimized blend is
the combination of aggregates resulting in a gradation that matches closely with the
ideal gradation (McLeod 2005). Intermediate size aggregate particles (pea gravel)
were used in all batches to reduce the voids in the matrix, thereby reducing the
cement paste requirement while maintaining workability. This should help in
controlling the shrinkage, as amount of cement paste in a mix is a major factor
affecting shrinkage. For mix design, either the aggregate content or the cement
content of mix was first selected. The computer program was used to calculate the
optimum percentages of each aggregate type. Weights of respective ingredients were
then determined based on the volume using the specific gravities of each material.
43
While designing the mixes to determine the effect of mineral admixtures on shrinkage
(Program III), cement was replaced by volume and the water content was held
constant. The air content was assumed to be 1.5 percent for all non air-entrained
batches to account for the entrapped air in the concrete. For air-entrained concrete,
the batch weights were based on the desired air content of 7 percent for air-entrained
batches in Program II, 5 percent for Program IV, and 8 percent for the air-entrained
batches of Program V. Deviations from these air contents will change the weights of
mix ingredients slightly on a cubic meter or cubic yard basis.
2.5 MIXING EQUIPMENT
Most of non-air-entrained batches were hand mixed in mixing trays.
Containers with lids were used for batches with superplasticizer that exhibited
delayed set to avoid the loss of moisture. The air-entrained concrete batches and some
of the superplasticized concrete batches were mixed in a counter current pan mixer.
The description of respective programs in subsequent sections includes the volume of
batches and types of mixing used. Mixing procedures are described in Section 2.13.
2.6 PROGRAM I (AGGREGATE CONTENT, WATER-CEMENT RATIO,
CEMENT TYPE)
The variables included in Program I were aggregate content, water-cement
ratio, and cement type (fineness of cement). A total of 18 batches were cast with three
specimens in each batch. Batches 62 through 70 were made with Type I/II cement,
44
and Batches 70 through 79 were made with Type II coarse ground cement. Three
water cement (w/c) ratios, 0.40, 0.45, and 0.50, were used with aggregate contents of
60, 70, and 80 percent by volume of the concrete. No mineral or chemical admixtures
were used for this program. All mixes used an optimized aggregate gradation
containing 25 mm (1 in.) limestone, 19 mm (¾ in.) limestone, pea gravel, and sand.
All batches were hand mixed, and the batch volume was 0.008 m3 (0.01 yd3). The test
matrix for this program is shown in Table 2.1, and mix proportions are given in Table
2.13.
2.7 PROGRAM II (COARSE AGGREGATE TYPES)
The effect of coarse aggregate type on shrinkage was evaluated in Program II.
Three types of coarse aggregate were used, including quartzite, granite, and
limestone. A total of eight non-air-entrained and three air-entrained batches were
made, with three specimens in each batch. The test matrix is given in Table 2.2. The
non-air-entrained batches had a volume of 0.008 m3 and were hand mixed. For air-
entrained batches, concrete was machine mixed in 0.016 m³ (0.02 yd³) batches. Three
specimens were cast for each batch.
Batches 94 and 95 were made with Type I/II cement and a w/c ratio of 0.45.
The aggregate content was 70 percent. Batch 94 had an optimized gradation
containing 25- mm (1 in.) quartzite, quartzite chip, pea gravel, and sand. Batch 95 had
an optimized gradation containing 25 mm (1 in.) limestone, 19 mm (¾ in.) limestone,
pea gravel, and sand. No chemical or mineral admixtures were used for these batches.

45
Batches 187, 188, and 189 were made with Type I/II cement and a 70 percent
aggregate content. The w/c ratio was 0.45. No mineral or chemical admixtures were
used. Batches 187, 188, and 189 contained 19 mm (1 in.) quartzite, limestone, and
granite as coarse aggregates, respectively. The coarse aggregates were blended with
pea gravel and sand in each batch to obtain an optimized gradation.
Batches 198, 199, and 200 were replications of batches 187, 188, and 189,
respectively. A slight change in quantities of aggregates between batches 188 and 199
was due to small change in gradation of the coarse aggregates.
Batches 262, 263, and 264 were air-entrained with 7.4 percent air. 19 mm (¾
in.) quartzite, limestone, and granite were used as coarse aggregates for batches 262,
263 and 264, respectively. An optimized gradation was obtained using pea gravel and
sand. The aggregate content was 68.8 percent by volume for all three batches. Type
I/II cement was used with 0.45 w/c ratio. These batches used Adva 100
superplasticizer to obtain the desired workability. The air entraining agent was Micro
Air.
The mix proportions for the Program II batches are given in Table 2.14.
2.8 PROGRAM III (MINERAL ADMIXTURES)
Three types of mineral admixture, fly ash, ground granulated blast-furnace
slag, and silica fume were used in Program III to evaluate their effect on shrinkage. A
total of 11 batches were made with three specimens in each batch. All batches were
hand mixed, and had a volume of 0.008 m³ (0.01 yd³). Type I/II cement was used

46
with a partial replacement of cement by mineral admixtures. The replacement was
made by volume to maintain constant water and aggregate contents. Because the
mineral admixtures have a lower specific gravity than portland cement, water-
cementitious material (w/cm) ratio by weight, deviated from the control w/c ratio of
0.45. The test matrix for this program is shown in Table 2.3.
Batches 85 through 88 used an optimized blend of 25 mm (1 in.) limestone,
19 mm (¾ in.) limestone, pea gravel, and sand with an aggregate content of 70
percent. No chemical admixtures were used in these batches. The control batch
(Batch 85) contained no mineral admixture and had a w/c ratio of 0.45. In Batch 86,
30 percent of the cement was replaced on a volume basis by slag, giving a w/cm ratio
based on weight of 0.465. Class C fly ash was used to replace 30 percent cement on a
volume basis in Batch 87, giving a w/cm ratio of 0.469. Batch 88 used a 10 percent
replacement by volume of cement by silica fume, giving a w/cm ratio of 0.470.
In Batches 94 through 97, an optimized blend of 19 mm (¾ in.) limestone, pea
gravel, and sand with an aggregate content of 70 percent was used. These batches
used the same replacements and w/cm ratios as Batches 85 through 88. Batch 94 was
the control batch, with no mineral admixture, and Batches 96, 97, and 98 used slag,
fly ash, and silica fume, respectively. In Batches 96 and 97, the mineral admixtures
were added to the dry mixed aggregates along with the cement. In Batch 98, silica
fume was premixed with cement before the concrete was mixed. A low dosage of
Adva 100 superplasticizer was used in Batch 98 to improve workability.

47
To investigate the effect on shrinkage of a better distribution of silica fume in
the concrete mix than obtained in previous batches, three additional batches (Batches
202 through 204) were made. Batch 202 served as the control batch with no mineral
or chemical admixture. Batch 203 was similar to Batch 202, except that it contained a
low dosage of Adva 100 superplasticizer. Batch 204 used silica fume to replace 10
percent of the cement by volume and used a low dosage of Adva 100 superplasticizer
to improve workability. The silica fume was premixed with the fine aggregate to
obtain a better dispersion of particles in the concrete matrix.
The mix proportions for Program III are given in Table 2.15.
2.9 PROGRAM IV (CURING PERIOD)
The effects of increased curing periods on the shrinkage of concrete with two
different cement types were studied in Program IV. Table 2.4 shows the test matrix
for this program.
Batches 165 and 166 were non-air-entrained, machine mixed batches with a
volume of 0.0325 m³ (0.0425 yd³). These batches used a w/c ratio of 0.45 and an
aggregate content of 70 percent. Both batches contained an optimized blend of 25
mm (1 in.) limestone, 19 mm (¾ in.) limestone, pea gravel, and sand. No chemical or
mineral admixtures were used. Batches 165 and 166 were made with Type I/II
cement and Type II coarse ground cement, respectively. For both batches, specimens
were cured for 3, 7, 14, and 28 days in sets of 3 specimens for each curing period.

48
Batch 201 was air-entrained concrete made with Type I/II cement. A total of
12 specimens were cast and cured for 3, 7, 14 and 28 days in sets of three specimens
for each curing period. The mix had a w/c ratio of 0.45, and the aggregate content was
70 percent. An optimized aggregate blend containing 19 mm (¾ in.) limestone, pea
gravel, and sand was used. The mix had an air content of 5.5 percent. Micro Air
served as the air entraining agent. Batch 201 was machine mixed and had a volume of
0.0325 m³ (0.0425 yd³).
Batch 207 was made with Type II coarse-ground cement. It was machine
mixed and air-entrained. As with Batch 201, 12 specimens were cast with three each
cured for 3, 7, 14 and 28 days. The w/c ratio and aggregate content were 0.45 and 70
percent, respectively. The batch contained the same aggregates as Batch 201. Micro
Air was used for air entrainment, and the actual air content of mix was 4.75 percent,
deviating somewhat from the design value of 5 percent. The batch volume was
0.0325 m³ (0.0425 yd³).
Table 2.15 lists the mix proportions used for Program IV.
2.10 PROGRAM V (SUPERPLASTICIZERS)
The effect of superplasticizers on shrinkage was evaluated in Program V. The
variables included the type and dosage of the superplasticizers. Test matrix is shown
in Table 2.5.
Batches 167 through 174 had a w/c ratio of 0.45 and an aggregate content of
75 percent. The aggregates were an optimized blend of 25 mm (1 in.) limestone, 19

49
mm (¾ in.) limestone, pea gravel, and sand. Type I/II cement was used and the batch
volume was 0.008 m³ (0.01yd³). All batches were hand mixed with three specimens
cast for each batch. The dosage range recommended by manufacturer was used to
determine dosages levels. In addition to a control batch with no superplasticizer, three
batches were made for each of two superplasticizers, Glenium 3000 NS and
Rheobuild 1000, with low, medium, and high dosages. The two superplasticizers
represent different chemical types, namely, carboxylated polyether and naphthalene.
The concrete in Batch 167 contained no superplasticizer. This batch served as
the control batch for batches 168 through 174. Batches 168, 169, and 170 used low,
medium and high dosages of Glenium 3000 NS, respectively. Batch 174 was a
replication of Batch 170, because Batch 170 was not cast correctly. Low, medium and
high dosages of Rheobuild 1000 were used, respectively, in Batches 171, 172, and
173. Concrete set was significantly retarded in Batches 168 through 174. The
retardation was significantly greater for the higher dosages. The mixes were retarded
for 5 to 7 hours at high dosages, 2 to 5 hours at medium dosages, and 1 to 1.5 hours at
low dosages. The fact that the admixtures were both Type A and Type F
superplasticizers (and not purely Type F high-range water reducers) might have
caused the retardation. Also, the dosage levels recommended by manufacturer
seemed to be upper bound estimates.
Batches 175 through 182 also contained Glenium 3000 NS and Rheobuild
1000 with same dosage values as batches 168 through 174. Batch 175 was a control
batch, and batches 176, 177, and 178 contained low, medium, and high dosages of

50
Glenium 3000 NS respectively. Batches 179 through 181 contained low, medium and
high dosages of Rheobuild 1000. Batch 182 was a replication of Batch 181, because
one of the specimens was damaged while demolding Batch 181. The mixes were
similar to the mixes in Batches 167 through 174, except aggregates consisted of an
optimized blend of 19 mm (¾ in.) limestone, pea gravel, and sand. The concrete was
mixed in 0.008 m³ (0.01 yd³) hand batches. The concrete in these batches was also
retarded, as observed for Batches 168 through 174.
Another carboxylated polyether based superplasticizer, Adva 100 was used in
Batches 183 through 186 and Batches 190 through 193. Batch 183 served as a control
batch with no superplasticizer. Batches 184, 185, and 186, respectively, used low,
medium, and high dosages of Adva 100. The mix design was similar to Batches 175
through 182. Batches 190, 191, 192, and 193 were replications of Batches 184, 185,
186, and 183, respectively. The concrete was hand mixed in 0.008 m³ (0.01 yd³)
batches. Although this superplasticizer is a Type F superplasticizer, retardation of
concrete still occurred, probably due to the upper bound estimate of dosage levels
recommended by manufacturer. Concrete set was retarded by 4 to 5 hours for high
dosages, 2 to 2.5 hours for medium dosages, and 45 minutes to 1 hour for low
dosages.
In batches 208 through 211, superplasticizer dosages were adjusted to obtain
a slump of 76 ± 13 mm (3 ± ½ in.). Batch 208 served as the control batch without any
superplasticizer. Type I/II cement was used with a w/c ratio of 0.45 and an aggregate
content of 70 percent. The batches were non-air-entrained and machine mixed with a

51
batch volume of 0.016 m³ (0.02 yd³). An optimized blend of aggregates containing 19
mm (¾ in.) limestone, pea gravel, and sand was used. In batches 209, 210, and 211,
appropriate dosages of Adva 100, Glenium 3000 NS, and Rheobuild 1000 were used
respectively. The measured concrete slump was 2¼, 2¾, 3, and 3¼ in., respectively,
for Batches 208, 209, 210, and 211. The purpose of using mixes with equal slumps
was to make realistic concrete and obtain a fairer comparison between concrete
containing the different superplasticizers than obtained in the previous batches.
Air-entrained concrete was used to study the effect of superplasticizers on
shrinkage in Batches 249, 256, 259, and 260. The mixes were designed for an air
content of 8 ± ½ percent. For batches 249, 256, and 259 (Glenium 3000 NS,
Rheobuild 1000, and Adva 100, respectively), an aggregate content of 67.8 percent
was used, with a w/c ratio of 0.45. Appropriate dosages of superplasticizers were used
to obtain a slump of 76 ± 13 mm (3 ± ½ in.). The air entraining agent was Micro Air.
In Batch 260, no superplasticizer was used, but the percentage of paste was increased
to obtain a slump in the same range as the superplasticizer mixes. The aggregate
content for Batch 260 was 63.5 percent, and the water cement ratio was 0.45. The
increase in paste volume to obtain the same slump was used to compare the shrinkage
of concrete of similar workability, with and without a superplasticizer. The concrete
was machine mixed with a batch volume of 0.016 m³ (0.02 yd³).
Mix proportions for all batches in Program V are shown in Table 2.17.

52
2.11 MIXING
Hand mixing was used for the concrete in Program I, all batches in Program
II, except 262 through 264, Program III, and Batches 175 through 186 and 190
through 193 of Program V. The volume for all hand mixed batches was 0.008 m³
(0.01 yd³). The free surface moisture of fine aggregates, measured in accordance with
ASTM C 70, was used to calculate batch weights. Coarse aggregates were soaked in
water for 24 hours before mixing and prepared to a saturated surface dry (SSD)
condition in accordance with ASTM C 127. A 533 × 787 × 76 mm (21 × 31 × 3 in.)
steel pan was used for hand mixing. The surface of the pan was dampened and coarse
and fine aggregates were combined and mixed in the pan without adding water. The
cementitious materials were then added to the mixed aggregates and thoroughly
mixed until a uniform mixture was obtained. A ring was formed with the dry mix in
the pan, and the water was added in the middle of the ring. As the water soaked in,
the rest of the dry material was moved to the center from the sides. After all water
was added, the batch was thoroughly mixed using two trowels for three minutes.
After a rest period of three minutes, the concrete was mixed thoroughly for another
two minutes.
For the hand mixed batches in Program V, the mixing pan was an 864 × 406 ×
140 mm (34 × 16 × 5.5 in.) Rubbermaid® plastic container with a lid. This change
was made to avoid moisture loss after mixing since the concrete was significantly
retarded due to use of superplasticizers. Prior to mixing, the superplasticizer was
mixed with ten percent of the mix water. After combining aggregates and mixing

53
with cement, as described earlier, the other 90 percent of the mix water was added to
the dry mixture and mixed thoroughly for one minute. The water with the
superplasticizer was then added, and the concrete was mixed for three minutes. After
resting three minutes, the concrete was mixed thoroughly for another two minutes. If
the mix was not stiff enough to cast, the concrete was kept in the containers covered
with the lid. While in the containers, the concrete was mixed for one minute every 30
to 45 minutes until it was ready to cast.
For Batches 262 to 264 in Program II, the concrete was mixed in the pan
mixer using a batch volume of 0.016 m³ (0.02 yd³). The weights of the fine
aggregates and water were corrected for the free surface moisture on fine aggregates.
To obtain an optimized aggregate gradation, the coarse aggregates were sieved
through a 9.1 mm (⅜ in.) sieve, and the fraction retained on that sieve and fraction
passing through it were treated as two different size aggregates while proportioning
the mix. The superplasticizer was combined with 10 percent of the mix water and the
air entraining agent was combined with another 10 percent. The coarse aggregate and
80 percent of the mix water were first added to the dampened mixer. The mixer was
started and the fine aggregate and cement were added to the revolving pan. The
concrete was mixed for one minute followed by the addition of the water with the
superplasticizer. The concrete was again mixed for one minute, and finally, the water
containing the air-entraining agent was added. Mixing was continued for three
minutes. The mixer was stopped, and the concrete was allowed to rest in the mixer for
three minutes. The pan was covered with a plastic sheet during the rest period to
54
avoid the moisture loss. The mixer was restarted, and mixing continued for another
two minutes. During the three minute rest period, a preliminary reading of
temperature was recorded. After the mixing was completed, the plastic concrete was
tested for slump (ASTM C 143), air content by the volumetric method (ASTM C
173), and temperature (ASTM C 1064). If the requirements for air content and slump
were met, the concrete was then transported to the casting room in a 533 × 787 × 76
mm (21 × 31 × 3 in.) steel pan. The pan was covered with a plastic sheet until casting
was complete, to avoid the moisture loss.
The concrete in Program IV was machine mixed in 0.035 m³ (0.0425 yd³)
batches as just described. The only differences were that the concrete contained no
superplasticizer, 90 percent of mix water was mixed with the coarse aggregates, and
the remaining 10 percent water was added with the air entraining agent. Concrete was
tested for both slump and air content, but there was no specific requirement for
slump.
The non-air-entrained machine mixed batches in Program V (Batches 208
through 211) were mixed using a procedure similar to the one described for Program
IV. Superplasticizers were added to the mixture using a procedure similar to that used
for the air entraining agent. Air-entrained machine mixed batches (Batches 249, 256,
259, and 260) were mixed as described for the machine mixed batches of Program II.

55
2.12 CASTING
A vibrating table was used to cast the specimens. The steel molds were coated
with mineral oil before placing the concrete. Concrete was briefly hand-mixed in the
pan and placed in the molds in two layers of approximately equal depth. After placing
the first layer, the concrete was packed underneath the gage studs by hand. The first
layer was then vibrated using the vibrating table. The vibration time and frequency
varied depending on the stiffness of the mix. Typically the first layer was vibrated for
15 to 20 seconds. The second layer of concrete was then placed, and the concrete was
packed in the corners of the molds by hand. The second layer was also vibrated.
Excess concrete was then removed with a 51 × 133 mm (2 × 5½ in.) handmade steel
strike-off screed. The outside and top edges of the molds were then cleaned to remove
excess concrete using a moist sponge, and specimens were moved from vibrating
table to the casting room floor for initial curing.
2.13 CURING
Immediately after casting, 152 μm (6 mil) Marlex® plastic strips were used to
cover the exposed concrete surface of the specimens. Then the entire mold (top and
sides) was covered with 89 μm (3.5 mil) plastic sheets. The plastic sheets were
secured to the molds using rubber bands. The specimens were grouped in sets of three
(for each batch) and a 12.7 mm (½ in.) thick square piece of Plexiglas® was placed
on the top of each set of three specimens. Four 152 × 305 mm (6 × 12 in.) concrete
cylinders were then placed on the Plexiglas® to hold it firmly in place. The goal was

56
to avoid any moisture loss from the top surface of concrete specimens before
demolding. In accordance with ASTM C 157, the specimens were demolded 23½ ±
½ hours after casting. The initial reading was taken on the specimens using the length
comparator at this time. The specimens were then placed in lime-saturated water in a
curing tank for additional two days at 23 ± 0.5 °C (73 ± 1 °F), giving a total curing
period of three days for each specimen. Curing periods of 3, 7, 14, and 28 days were
used for the specimens in Program IV. After curing in lime-saturated water, the
specimens were allowed to dry in standard conditions described in next section, and
the length measurements were recorded, as described in Section 2.14.
2.14 DRYING
An environmental room fabricated with structural lumber and 89 μm (3.5 mil)
plastic sheeting was used to store the specimens during drying and data collection.
The room was located in a temperature and humidity controlled laboratory. The
dimensions of the room were 3.7 × 3.7 × 2.1 m (12 × 12 × 6.8 ft), and the specimens
were stored on wooden racks with a minimum clearance of 25 mm (1 in.). The
specimens were allowed to dry from all sides in accordance with ASTM C 157. The
relative humidity inside the drying room was maintained at 50 ± 4 percent using a
humidifier during winter and a dehumidifier during summer. The temperature was
maintained at 23 ± 2°C (73 ± 3°F). The length comparator was located in the drying
room, and the readings were taken in the drying room.

57
2.15 DATA COLLECTION
The lengths of the specimens were determined using a length comparator in
accordance with ASTM C 157. A reference bar was used to establish a reference
reading before the specimens in each batch were read. The dial gage was read with
the reference bar in the comparator for each batch of specimens and then the
comparator dial was read with the specimens in the comparator. Care was taken to
position the specimen in such a way that the same side of the specimen was at top
during the measurement every time.. The initial CRD (Comparator Reading
Difference, difference between the comparator reading of a specimen and that of the
bar) was recorded immediately after demolding. The length change at a given age
was calculated as the difference between the CRD at that age and the initial CRD.
The strain was calculated as the length change divided by the gage length of 254 mm
(10 in.). The shrinkage, in microstrain, for any batch is reported as the average strain
of three specimens at a given age.
According to ASTM C 157, measurements should be taken at ages of 4, 7, 14
and 28 days and 8, 16, 32 and 64 weeks for the specimens stored in air. More
frequent measurements were made in this study to obtain a better comparison
between the shrinkage behaviors of the batches. After removing the specimens from
the curing tank, readings were recorded every day for a period of 30 days. The
reading interval then increased to every other day between 30 and 90 days. Readings
were taken once a week from 91 to 180 days and once a month from 181 to 365 days.
The final reading was recorded at 365 days.
58
In Program IV, for the specimens that were stored in curing tank for more
than three days, comparator readings were also taken 3, 7, 14, and 28 days after
casting. For example, for the specimens that were cured for 28 days, readings were
recorded at 3 days, 7 days and 14 days, and the specimens were then returned to the
curing tank. For these readings, the specimens were temporarily kept in a bucket of
water to avoid drying. In this case, after taking the 28-day reading, drying and data
collection proceeded as described for other specimens.

CHAPTER 3: RESULTS AND EVALUATION
3.1 GENERAL
This chapter presents the results of the free shrinkage tests. The effects of
aggregate content, water-cement ratio, aggregate type, mineral admixtures, curing
times, cement type, and the use of superplasticizers are evaluated. Comparisons are
made over the full test period and at specific ages ranging from 30 days to one year.
The values of free shrinkage reported in the chapter represent the average of
the three specimens for each batch. The individual specimen free shrinkage curves are
presented in Figures A3.1 through A3.88 in Appendix A. Figures 3.1 through 3.89
compare the batches in each program. As explained in Chapter 2, the specimens were
cured for three days for all batches, except for selected batches in Program IV, which
is used to evaluate the effects on shrinkage for curing periods of 3, 7, 14, and 28 days.
The specimens were stored in a controlled environment at 23 ± 2°C (73 ± 3°F) and 50
± 4 percent relative humidity. Free shrinkage was recorded as the change in length
over a gage length (distance between tips of gage studs) of 254 mm (10in.) up to a
period of one year.
The specimens were cast and protected against moisture loss during the first
24 hours. The specimens were demolded 23½ ± ½ hours after casting, and the initial
length reading was recorded as the day 1 reading. The specimens were then cured in
lime saturated water for 2 additional days. Drying started on day three, except as
noted for Program IV. The reading on day three was taken before the specimens were
59

60
subjected to drying. For Program IV, drying started upon completion of the curing
period. The
comparisons based on the drying period for Program IV are shown in figures
identified as “drying only”, where the reading on day 1 indicates the reading recorded
one day after drying began.
3.2 STATISTICAL ANALYSIS
Because the sample size for each variable is small (three specimens per
batch), the Student’s t-test is used to determine if the observed differences are
statistically significant. This test is used when the population variance is not known
and the sample size is small. The test determines if the difference in the sample
means (X1 and X2) represents an actual difference in the population means (μ1 and μ2)
at a particular level of confidence (α). At a 95 percent confidence level (that is at a
level of significance α = 0.05), there is a five percent probability that the test will
(incorrectly) indicate a statistically significant difference in sample means when,
actually, there is no difference (or a 95 percent probability that it will correctly
indicate a difference in sample means when there is a difference). A two-sided t-test
is used in the analyses performed in this study. This means that there is a probability
of α/2 that μ1 < μ2 and α/2 that μ1 > μ2 when, in fact, μ1 and μ2 are equal. A “Y” in the
tables indicates that there is a statistical difference between two samples at a
confidence level of 95 percent (α = 0.05), and an “N” indicates that there is no
statistical difference between samples at the lowest confidence level, 80 percent

61
(α=0.20). Statistical differences at confidence levels of, but not exceeding 90 and 80
percent confidence levels are indicated by “90” and “80,” respectively.
3.3 PROGRAM I (AGGREGATE CONTENT, WATER-CEMENT RATIO,
CEMENT TYPE)
The effect of aggregate content (60, 70, and 80 percent), and water-cement
ratio (0.40, 0.45 and 0.50) on concrete shrinkage was evaluated in Program I using
two cements, Type I/II and Type II coarse-ground. The test matrix and mix
proportions for the corresponding batches are presented in Tables 2.1 and 2.13
respectively. Free shrinkage for individual specimens is presented in Figures A3.1
through A3.18 in Appendix A.
3.3.1 COMPARISON BETWEEN BATCHES
The average free shrinkage curves for Program I are presented in Figures 3.1
through 3.12. The legend to the right of the plots in Figures 3.1 through 3.6 indicates
the aggregate content, as a percent of concrete volume, and the water-cement ratio,
also expressed in percent. For example, 70-45 in the legend indicates that the concrete
had an aggregate content volume of 70 percent and a water-cement ratio of 0.45 by
weight. For Figures 3.7 through 3.12, the legend indicates the cement type and
aggregate content.
Figure 3.1 shows the average free shrinkage strain versus time during the first
30 days after casting for batches containing Type I/II cement with varying water-

62
cement ratios and aggregate contents. The greatest shrinkage is observed for the
concrete with lowest aggregate content (60 percent) and a water-cement ratio of 0.40.
For a given water-cement ratio, the shrinkage decreases with an increase in aggregate
content. Shrinkage is lowest with the highest aggregate content (80 percent) and a
water-cement ratio of 0.5. No clear trend of change in shrinkage is observed as a
function of water-cement ratio. Figures 3.2 and 3.3 present the same data up to ages
of 180 and 365 days, respectively. The effect of aggregate content on shrinkage
becomes more prominent and the trend can be easily observed in these figures. It is
also observed that for a given aggregate content, there is no significant effect of
water-cement ratio on shrinkage. The data in Figures 3.1 through 3.3 is summarized
in Table 3.1 and the average free shrinkage values are provided at 3, 7, 30, 90, 180
and 365 days after casting.
The free shrinkage of batches with Type II coarse-ground cement is compared
in Figures 3.4 through 3.6. The trend is similar to that observed for Type I/II cement
in regard to aggregate content, that is, shrinkage decreased as the aggregate content
increased. The data from these batches is also summarized in Table 3.1.
Results of Student’s t-test for various water-cement ratios are presented in
Tables 3.8 through 3.13. The differences between shrinkage of various batches are, in
fact, statistically significant in many cases. Due to the lack of a clear trend between
shrinkage and water-cement ratio, however, these differences do not lead to any
significant conclusions. Tables 3.14 through 3.19 present the Student’s t-test results
for different aggregate contents. Results of the Student’s t-test confirm the

63
observation that shrinkage decreases as the aggregate content increases. With few
exceptions, the differences observed between the free shrinkage at various aggregate
contents are statistically significant.
Figures 3.7 through 3.12 compare the shrinkage of concretes containing Type
I/II and Type II coarse-ground cement. It is easily observed that for a given
aggregate content and water-cement ratio, concrete containing Type II coarse-ground
cement exhibits significantly lower shrinkage than concrete containing Type I/II
cement. This trend is consistent at all aggregate contents and water-cement ratios.
The difference as a function of cement type is highest for aggregate content of 60
percent and water-cement ratio of 0.40 (206 με) and lowest for 80 percent aggregate
content and 0.50 water-cement ratio (50 με). A summary of shrinkage data presented
in Figures 3.7 through 3.12 is given in Table 3.2.
3.3.2 SUMMARY OF PROGRAM I
It is observed that concrete shrinkage decreases as the aggregate content is
increased. This is attributed, not only to the restraint provided by aggregates to
shrinkage, but also to the reduction in cement paste with the increase in aggregate
content. The trend is consistent with different water-cement ratios and cement types.
Shrinkage is reduced significantly with use of Type II coarse-ground cement when
compared with Type I/II cement. This can be explained by the fact that the
unhydrated portion of larger cement particles in Type II coarse-ground cement act as
aggregates, which provides restraint to shrinkage, and the coarser pore structure,

64
which results in decreased surface tension when a meniscus is formed and, thus,
lower shrinkage forces exerted on the surrounding cement paste.
3.4 PROGRAM II (COARSE AGGREGATE TYPES)
Three different types of coarse aggregate, quartzite, limestone and granite,
were evaluated in Program II. Both non-air-entrained and air-entrained concrete were
tested using batches cast in four sets. The test matrix and mix proportions are given in
Tables 2.2 and 2.14, respectively. The aggregate gradations used are given in Tables
2.6 through 2.11. Individual specimen free shrinkage curves are presented in Figures
A3.19 through A3.29.
3.4.1 COMPARISON BETWEEN BATCHES
Two coarse aggregates were used in the first set, quartzite and limestone. As
shown in Figures 3.13-3.15, the shrinkage of concrete made with quartzite is
significantly lower than that of concrete made with limestone. Free shrinkage
measurements for Program II are summarized in Table 3.3. The difference in
shrinkage is 54 με at 30 days, 80 με at 180 days and 74 με at 365 days. The results of
Student’s t-test (Table 3.20a) indicate that these differences are statistically
significant at all ages.
The second set of specimens included limestone, quartzite, and a third coarse
aggregate, granite. As shown in Figures 3.16 through 3.18, the differences in
shrinkage for concrete made with the different coarse aggregates are small. The

65
average shrinkage values are within 37 με at all ages, and the differences in
shrinkage are not statistically significant (Table 3.20b), except at 180 days, where the
shrinkage of the limestone batch (387 με) exhibits a small, but statistically significant
higher shrinkage than the quartzite (350 με) and granite (350 με) batches.
Because the results of the second set differ considerably from the results of
the first set, a third set was cast with the three coarse aggregates. The average free
shrinkage curves for this set are shown in Figures 3.19-3.21. Through an age of 30
days (Fig. 3.19), concrete containing granite (283 με) is observed to have less
shrinkage than that containing limestone (320 με) or quartzite (340 με). The results of
the statistical analysis (Table 3.20c) show that, at 30 days, the difference in shrinkage
of concrete containing quartzite and that containing granite is statistically significant
at a confidence level of 80 percent, while the difference in shrinkage between the
concrete containing limestone and that containing granite is not statistically
significant. At an age of 365 days, the relative order of average shrinkage remains the
same, the difference between the shrinkage of concrete containing granite and that
containing quartzite is statistically significant at the highest confidence level of 95
percent, and the difference between the shrinkage of concrete containing granite and
that containing limestone is significant at the lowest confidence level of 80 percent.
Again, the results of the third set are not consistent with the previous results;
the difference in shrinkage between the limestone and quartzite batches observed in
the first set is not present in the third set. Also, the difference in shrinkage observed
between the quartzite and granite batches was not observed in the second set.
66
Therefore, a fourth set was cast to evaluate the effects of types of coarse aggregate on
shrinkage in batches 262-264, using air entrained concrete. Figures 3.22 -3.24
compare the average free shrinkage of different batches. The free shrinkage
measurements at different ages are summarized in Table 3.3b. At an age of 30 days,
the limestone batch experienced the highest shrinkage (377 με), followed by the
quartzite (347 με) and granite (313 με) batches. The difference in shrinkage for the
limestone and quartzite batches is 30 με and is statistically significant at the
confidence level of 90 percent (Table 3.20d). The difference between quartzite and
granite batches is 34 με and is significant at the confidence level of 80 percent. The
difference of 64 με between limestone and granite batches is statistically significant at
95 percent confidence level. Differences similar to those observed at 30 days are
observed at 180 and 365 days. At 365 days, the differences between quartzite and
granite, and limestone and granite are statistically significant at 95 percent confidence
level. The difference between granite and quartzite is significant at 80 percent
confidence level.
3.4.2 SUMMARY OF PROGRAM II
As the aggregates in concrete offer restraint to the shrinkage, it is expected of
aggregates with a higher modulus of elasticity should help in reducing the shrinkage.
The limestone aggregates used in this program are more porous and have a lower
modulus of elasticity than the quartzite and granite aggregates. Hence, it is expected
that concrete made from limestone would shrink more than concrete made from the

67
other two aggregates. The results of first non-air-entrained set are according to these
expectations, and the limestone batch in this set experienced significantly more
shrinkage than the quartzite batch at all ages. In the air-entrained (fourth) set, it is
observed that the concrete containing limestone shrinks more than either of the other
two concretes, but the difference between limestone and quartzite batches decreased
with age and is statistically significant at confidence level of 80 percent at 180 and
365 days. The results for sets one and four are not consistent with the second and
third non-air-entrained sets. In the second set, the differences observed between
different batches were not significant, and in the third set, the granite batch exhibited
significantly lower shrinkage than either of the other two batches, but the quartzite
batch shrank more than the limestone batch. Hence, while it appears that concrete
containing denser aggregates exhibits less shrinkage than concrete containing more
porous aggregates, the results for individual batches are not always consistent with
this observation.
3.5 PROGRAM III (MINERAL ADMIXTURES)
The effect of mineral admixtures on shrinkage was evaluated in Program III.
The mineral admixtures used included Class C fly ash, ground granulated blast-
furnace slag, and silica fume. Type I/II cement was partially replaced by 30 percent
Class C fly ash (Batches 87 and 196), 30 percent slag (Batches 86 and 195) or 10
percent silica fume (Batches 88, 197 and 204). The replacements were based on
volume, and as a result, the w/cm ratio by weight increased for the concretes

68
containing mineral admixtures from 0.45 for the control batches to 0.465 for the slag
batches, 0.469 for the Class C fly ash batches, and 0.470 for the silica fume batches.
Four control batches (Batches 85, 194, 202 and 203) were made. Control batches 85,
194, and 202 did not contain a superplasticizer, while Control batch 203 did for better
comparison with Batch 204, which contained a 10 percent silica fume volume
replacement of cement and was also superplasticized to obtain better workability. The
test matrix is given in Table 2.3 and mix proportions are listed in Table 2.15. Free
shrinkage measurements at different ages are summarized in Table 3.4. Individual
specimen shrinkage curves are presented in Figures A3.30-A3.40.
3.5.1 COMPARISON BETWEEN BATCHES
A total of three sets of specimens were cast. The average free shrinkage
curves comparing batches in first set are presented in Figures 3.25-3.27. As shown in
Figure 3.25, during the first 30 days, the slag and fly ash mixes shrank more than the
control and silica fume mixes. The difference in shrinkage between the slag and
control mix was 30 με and was statistically significant at the confidence level of 90
percent (Table 3.21a). The shrinkage of the fly ash mix was higher than that of the
control mix by 34 με, and this difference was statistically significant at a confidence
level of 95 percent. The silica fume mix shrank significantly less than slag mix (by 40
με) and fly ash mix (by 44 με). The silica fume mix also shrank less than the control
mix (by 10 με), but the difference was not statistically significant. Figure 3.26
compares the shrinkage of same batches up to an age of 180 days. The results of

69
Student’s t-test are presented in Table 3.21a. At 180 days, the shrinkage values of the
control, slag and silica fume mixes are within 12 με of each other. The shrinkage of
the fly ash mix is higher than the other three mixes, with differences between 31 to 43
με. At 365 days, however, the silica fume and slag mixes shrink more than the control
mix (Figure 3.27), while the fly ash mix continued to exhibit the greatest shrinkage;
the differences between the shrinkage of the fly ash mix and that of other mixes are
statistically significant at confidence levels of 95, 90, and 80 percent for the control,
slag and silica fume mixes, respectively (Table 3.21a). There is no significant
difference in shrinkage between the slag and silica fume mixes. At 365 days, the
control mix shrinks less than the silica fume mix by 39 με and the slag mix by 33 με;
the differences are significant at a confidence level of 80 percent in both cases.
A second set of specimens using same mineral admixtures and similar mix
proportions was cast (Batches 194-197). As compared to the silica fume batch in the
previous set (Batch 88), silica fume was premixed with cement in this set and a low
dosage of the superplasticizer Adva 100 was used to obtain better workability (for
Batch 197). Superplasticizer was not used for the control batch or the concrete
containing other mineral admixtures. Figures 3.28-3.30 compare the average values
of free shrinkage for the batches in the second set. As shown in Figure 3.28, the
shrinkage of the fly ash and slag batches is higher than that of the control batch. This
observation is similar to that for the first set (Batches 85-88). At 30 days, the
difference between the slag mix and control mix is just 20 με, however, the difference
between the fly ash and control mixes is 54 με. The silica fume mix, however,

70
exhibits 36 με less shrinkage than the control mix at 30 days. The results of Student’s
t-test for these batches are presented in Table 3.21b and indicate that none of the
differences observed between control batch and other three batches is statistically
significant. The differences between the slag and silica fume mixes and the fly ash
and silica fume mixes are statistically significant at a confidence level of 80 percent.
Figure 3.29 shows the corresponding plots up to an age of 180 days. It is easily seen
that the fly ash mix shrinks more than the control mix throughout this period. The
slag mix exhibits higher shrinkage up to an age of 90 days and, thereafter, exhibits a
value that is similar to the control mix. The silica fume mix consistently shrinks less
than the control mix, but the difference appears to decrease after of 60 days. None of
the differences observed at an age of 180 days is statistically significant. The
shrinkage plots for these batches up to an age of 365 days are shown in Figure 3.30.
Similar observations are made, in that the fly ash mix shrinks more than the control
mix, the slag mix shrinks about the same as the control mix, and the silica fume mix
shrinks less than the control mix. The difference between the shrinkage of the control
mix and those of the corresponding mixes is 50 με for the fly ash mix, 6 με for the
slag mix (slag mix shrinks slightly less than control mix), and 43 με for silica fume
mix. However, none of these differences is statistically significant. This could be due
to the large scatter of data points in individual batches, as shown in Figures A3.30
through A3.40, but trends in the data appear to be consistent, with fly ash mix
exhibiting higher shrinkage than the control mix, the slag mix exhibiting shrinkage
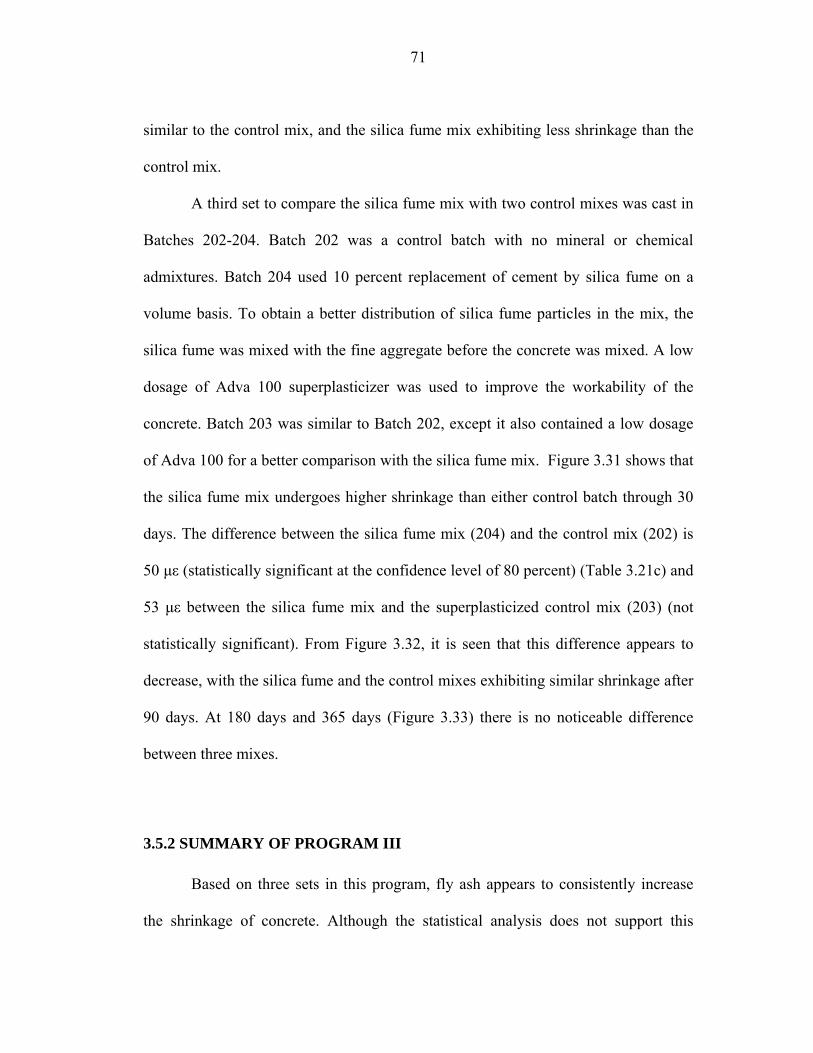
71
similar to the control mix, and the silica fume mix exhibiting less shrinkage than the
control mix.
A third set to compare the silica fume mix with two control mixes was cast in
Batches 202-204. Batch 202 was a control batch with no mineral or chemical
admixtures. Batch 204 used 10 percent replacement of cement by silica fume on a
volume basis. To obtain a better distribution of silica fume particles in the mix, the
silica fume was mixed with the fine aggregate before the concrete was mixed. A low
dosage of Adva 100 superplasticizer was used to improve the workability of the
concrete. Batch 203 was similar to Batch 202, except it also contained a low dosage
of Adva 100 for a better comparison with the silica fume mix. Figure 3.31 shows that
the silica fume mix undergoes higher shrinkage than either control batch through 30
days. The difference between the silica fume mix (204) and the control mix (202) is
50 με (statistically significant at the confidence level of 80 percent) (Table 3.21c) and
53 με between the silica fume mix and the superplasticized control mix (203) (not
statistically significant). From Figure 3.32, it is seen that this difference appears to
decrease, with the silica fume and the control mixes exhibiting similar shrinkage after
90 days. At 180 days and 365 days (Figure 3.33) there is no noticeable difference
between three mixes.
3.5.2 SUMMARY OF PROGRAM III
Based on three sets in this program, fly ash appears to consistently increase
the shrinkage of concrete. Although the statistical analysis does not support this

72
conclusion, there are reasons to believe that fly ash does not help in reducing the
shrinkage. Slag does not appear to affect the ultimate shrinkage of concrete to great
extent, but the early age shrinkage may be increased with the use of slag. No certain
conclusions can be made about the use of silica fume, as it did not increase the
shrinkage of concrete in the first two sets, but the early age shrinkage was increased
with use of silica fume in the third set. It should be noted that, when the mixes were
designed, cement was replaced by volume while the water content was held constant.
As a result, the w/cm ratios of the mineral admixture mixes were slightly higher than
the control mix. The results could have been affected to a certain degree due to the
higher w/cm ratios.
In general, the results of the tests are not consistent, and future testing is
needed before firm conclusions can be made. Because the mineral admixtures react
more slowly than the portland cement alone, the effect of the curing period on
concrete containing mineral admixtures is known to be significant. Future batches
made with mineral admixtures should be cured for a longer period. A standard
mixing procedure should be used when using silica fume in dry densified form to
obtain a consistent distribution of particles in the mix. The effects of Class F fly ash,
as well as Class C fly ash from other sources on shrinkage should be evaluated before
general conclusions about use of fly ash are made.

73
3.6 PROGRAM IV (CURING PERIOD AND CEMENT TYPE)
Non-air-entrained and air-entrained concrete was tested for effects of curing
period and cement type on shrinkage in Program IV. Type I/II and Type/II coarse-
ground cements were used with curing periods of 3, 7, 14, and 28 days. The
individual specimen free shrinkage curves are shown in Figures A3.41 through
A3.56. The test matrix and mix proportions are given in Tables 2.4 and 2.16,
respectively.
3.6.1 EFFECT OF CURING PERIOD
The effect of the length of the curing period on shrinkage of non-air-entrained
concrete is presented in Figures 3.34-3.45. For concrete made with Type I/II cement,
the results up to an age of 30 days are shown in Figure 3.34. Tables 3.5 and 3.6
summarize the free shrinkage measurements. Some specimens from this program
exhibited swelling during the curing period. As shown in Figure 3.34, the specimens
cured for three days did not experience any swelling during the curing period, but
those cured longer did, and the amount of swelling increased with the length of
curing period. Also, at a given age, the longer the curing period, the lower the
shrinkage. Figure 3.35 shows the same batches based on the drying period. Thirty
days after drying began, the concrete cured for 3, 7, 14, and 28 days exhibited
average shrinkage strains of 333, 337, 320 and 227 με, respectively. The differences
between the specimens cured for 3, 7, and 14 days, however, are not statistically
significant at this age (Table 3.22). Differences between the specimens cured for 28

74
days and those cured shorter periods are statistically significant. Figures 3.36 and
3.38 show results for these batches up to ages of 180 and 365 days after casting,
respectively. Figures 3.37 and 3.39 show the results based on drying period. The
results are similar to those observed at 30 days. Shrinkage decreased with longer
curing periods, except the concrete cured for seven days shrank consistently more
than the concrete cured for three days. The statistical analysis of the results is
presented in Table 3.22. The shrinkage values based on drying period are used for the
statistical analysis. Three hundred days after drying began, the difference between
concrete cured for seven days and that cured for 14 days is statistically significant at
the 95 percent confidence level. Also, the differences between concrete cured for 28
days and concrete cured for shorter periods are statistically significant at the 95
percent confidence level. There is no significant difference between the shrinkage of
concrete cured for three days and that cured for 14 days.
The average free shrinkage plots for non-air-entrained batches made with
Type II coarse-ground cement are presented in Figures 3.40-3.45. Figures 3.40, 3.42,
and 3.44 show the results based on age after casting, while Figures 3.41, 3.43, and
3.45 show the results based on drying period. The concrete cured for longer periods
exhibited consistently less shrinkage throughout the test. When comparison is based
on the drying period, however, the differences between different batches are smaller.
The results of Student’s t-test are presented in Table 3.23. The difference between the
concrete cured for three days and that cured for seven days as well as the difference
between the concrete cured for seven days and that cured for 14 days is not
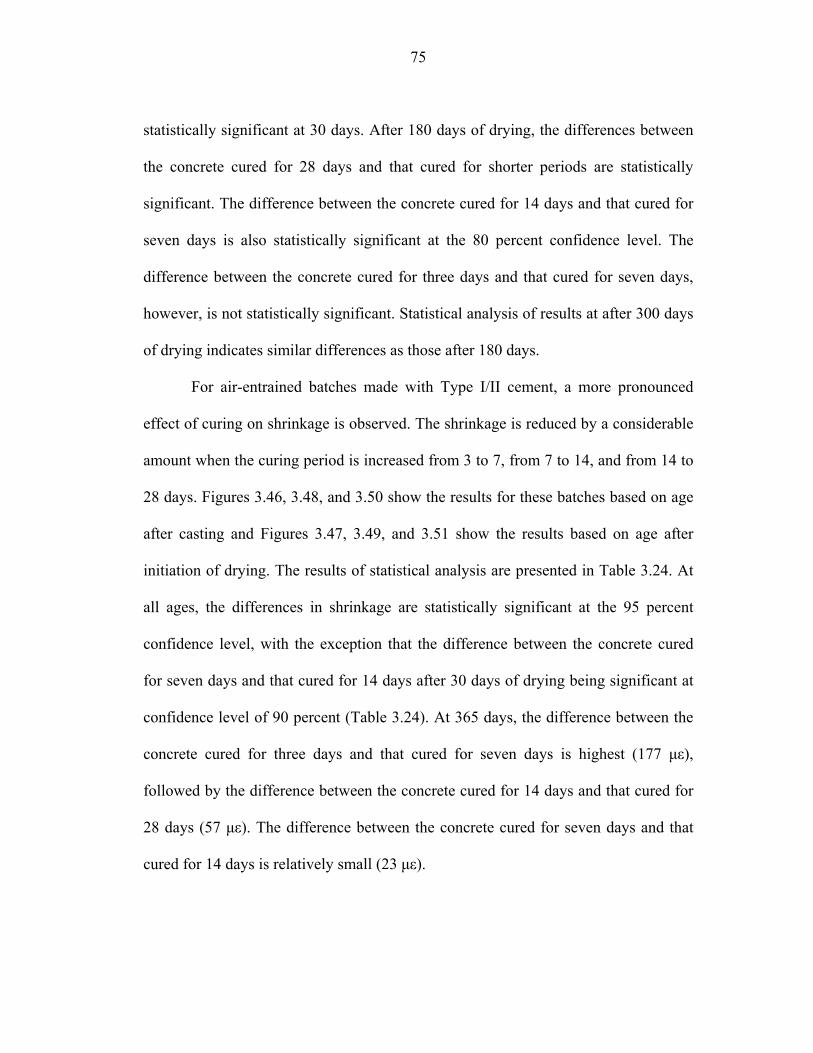
75
statistically significant at 30 days. After 180 days of drying, the differences between
the concrete cured for 28 days and that cured for shorter periods are statistically
significant. The difference between the concrete cured for 14 days and that cured for
seven days is also statistically significant at the 80 percent confidence level. The
difference between the concrete cured for three days and that cured for seven days,
however, is not statistically significant. Statistical analysis of results at after 300 days
of drying indicates similar differences as those after 180 days.
For air-entrained batches made with Type I/II cement, a more pronounced
effect of curing on shrinkage is observed. The shrinkage is reduced by a considerable
amount when the curing period is increased from 3 to 7, from 7 to 14, and from 14 to
28 days. Figures 3.46, 3.48, and 3.50 show the results for these batches based on age
after casting and Figures 3.47, 3.49, and 3.51 show the results based on age after
initiation of drying. The results of statistical analysis are presented in Table 3.24. At
all ages, the differences in shrinkage are statistically significant at the 95 percent
confidence level, with the exception that the difference between the concrete cured
for seven days and that cured for 14 days after 30 days of drying being significant at
confidence level of 90 percent (Table 3.24). At 365 days, the difference between the
concrete cured for three days and that cured for seven days is highest (177 με),
followed by the difference between the concrete cured for 14 days and that cured for
28 days (57 με). The difference between the concrete cured for seven days and that
cured for 14 days is relatively small (23 με).

76
The effect of increased curing on the air-entrained concrete made with Type
II coarse-ground cement is similar to that observed for concrete made with Type I/II
cement. Figures 3.52 and 3.53 show the results for these batches up to age of 30 days.
Shrinkage decreases with increased curing period at this age. The difference between
the shrinkage of concrete cured for three days and that of concrete cured for seven
days, as well as that between concrete cured for 14 days and 28 days, is not
statistically significant, while all of the other differences in shrinkage are statistically
significant at the 95 percent confidence level (Table 3.25). From Figures 3.55 and
3.57, it is seen that concrete cured for seven days experiences less shrinkage than
concrete cured for 3 days up to age of 70 to 75 days. After this age, however, there is
no noticeable difference between the shrinkage of these batches. Similar behavior is
observed with concrete cured for 14 days and 28 days. The shrinkage of concrete
cured for 28 days is less than that of concrete cured for 14 days up to an age of 136
days. After this age the difference between the shrinkage of these two batches is not
noticeable. The results of statistical analysis (Table 3.25) support the observation that
there is no significant difference between the shrinkage of concrete cured for 14 days
and that cured for 28 days. The other differences in shrinkage, however, are
statistically significant.
3.6.2 EFFECT OF CEMENT TYPE
In addition to the evaluation described in Program I, the effect of type of
cement on shrinkage was also evaluated in Program IV. Figures 3.58 through 3.65

77
show comparisons between the shrinkage of concrete made with Type I/II and Type
II coarse ground cements cured for different periods. For the non-air-entrained
concrete (Figures 3.58 through 3.61), there is no apparent effect of cement type on
shrinkage of the concrete cured for three days. For the longer curing periods,
however, the concrete made with Type II coarse-ground cement exhibits less
shrinkage than the concrete made with Type I/II cement. The statistical analysis
(Table 3.26) also indicates that there is no significant difference between the
shrinkage of concrete made with two types of cement for concrete cured for three
days. The difference for the concrete cured for seven days is significant at confidence
levels of 90, 80, and 90 percent, respectively, at 30, 180, and 300 days of drying. For
the concrete cured for 14 days, the difference is significant at a confidence level of 95
percent at all ages. For the concrete cured for 28 days, the difference is significant at
a confidence level of 90 percent at 30 days, and at a confidence level of 95 percent at
180 and 300 days of drying, respectively. For air-entrained concrete (Figures 3.62
through 3.65), cement type affects shrinkage more significantly. The difference in
shrinkage for concrete made with the two types of cement is statistically significant
(Table 3.27) at the confidence level of 95 percent for most of the batches and at all
ages. The exceptions are concrete cured for 28 days at 180 and 300 days, with the
difference being significant at confidence level of 80 percent. Interestingly, the Type
I/II cement concrete cured for 14 days shrinks significantly (80 percent confidence
level) more than the Type II coarse-ground cement concrete cured for seven days.

78
Hence, the higher shrinkage experienced due to the limited curing period could be
compensated by using Type II coarse-ground cement in place of Type I/II cement.
3.6.3 SUMMARY OF PROGRAM IV
With a few exceptions, increased curing reduces shrinkage. The effect is more
clearly noticeable for concrete made with Type I/II cement, although a similar trend
is observed for concrete made with Type II coarse-ground cement. The difference
between shrinkage of concrete cured for seven days and that cured for 14 days, as
well as concrete cured for 14 days and that cured for 28 days is significant for most of
the batches made. The difference between the concrete cured for three days and seven
days, however, is not significant in many cases. Hence, increasing the duration of
moist curing from seven to 14 days can be a major step in controlling the shrinkage.
Also, the use of Type II coarse-ground cement can significantly help in reducing the
shrinkage. The shrinkage of air-entrained concrete made with Type II coarse ground
cement cured for seven days was less than that of air-entrained concrete made with
Type I/II cement cured for 14 days. Use of coarse ground cement in concrete can
effectively help in crack control on bridge decks. It should be confirmed, however,
that the use of coarse ground cement does not reduce the compressive strength or
increase the permeability beyond the acceptable limits.

79
3.7 PROGRAM V (SUPERPLASTICIZERS)
Three superplasticizers were tested for their effect on shrinkage in Program V.
A total of four sets of non-air-entrained concrete and one set of air-entrained concrete
were cast. The individual specimen free shrinkage curves are presented in Figures
A3.57 through A3.89. The test matrix and mix proportions are given in Table 2.5 and
2.17, respectively. Free shrinkage measurements are summarized in Table 3.7.
3.7.1 EFFECT OF SUPERPLASTICIZER TYPE AND DOSAGE
In the first set (Batches 167 through 174), two superplasticizers, Glenium
3000 NS and Rheobuild 1000 were used. The range recommended by the
manufacturer was used to determine the three dosage levels, low, medium and high.
The low and high dosages were the lower and upper limits of the range, respectively,
and the medium dosage was the average of the two. Concrete set was significantly
retarded in concrete containing superplasticizer for Batches 167 through 174.
Retardation was significantly greater for the higher dosages. The mixes were retarded
for 5 to 7 hours at high dosages, 2 to 5 hours at medium dosages, and 1 to 1.5 hours at
low dosages. The fact that the admixtures were classified as both Type A and Type F
admixtures (and not purely Type F high-range water reducers) might have caused the
retardation. Figures 3.66 through 3.71 present the results for this set. As shown in
Figures 3.66-3.68 for Glenium 3000 NS, shrinkage was not affected by the dosage
rate of superplasticizer up to 180 days. The statistical analysis supports this
observation (Table 3.28a). At 365 days, the results indicate that the batches with low

80
and high dosages of superplasticizer shrank more than the control batch and the batch
with medium dosage shrank less than the control batch. None of the differences is
significant at the highest confidence level. Also, there is no clear trend in shrinkage
behavior with the increase in superplasticizer dosage. The concrete with high dosage
of Glenium 3000 NS experienced the highest shrinkage, followed by the concrete
with low dosage, no superplasticizer (control), and medium dosage. Figures 3.69-3.71
present the results for different dosages of Rheobuild 1000. The batch with high
dosage of superplasticizer experienced more shrinkage than the rest of the batches
containing superplasticizer. The differences are significant at the 95 percent
confidence level at 30 days and at the 90 percent confidence level at 180 and 365
days. The difference between the concrete containing high dosage and control
concrete was not significant at 30 days, but at 180 and 365 days, the former exhibited
higher shrinkage (difference significant at 95 percent confidence level) than the later
(Table 3.28b). However, there is no clear trend of change in shrinkage with increase
in amount of superplasticizer.
A third type of superplasticizer, Adva 100 was added to the study in the
second set of Program V (Batches 175 through 186), which also included Glenium
3000 NS and Rheobuild 1000. Concrete set was retarded in a similar way, for similar
periods, to that described for the first set for concrete containing Glenium 3000 NS
and Rheobuild 1000. Set retardation of the concrete containing Adva 100 was less
than that containing the other superplasticizers. For concrete containing Adva 100,
concrete set was retarded by 2 to 3 hours for high dosages, 1 to 1.5 hours for medium
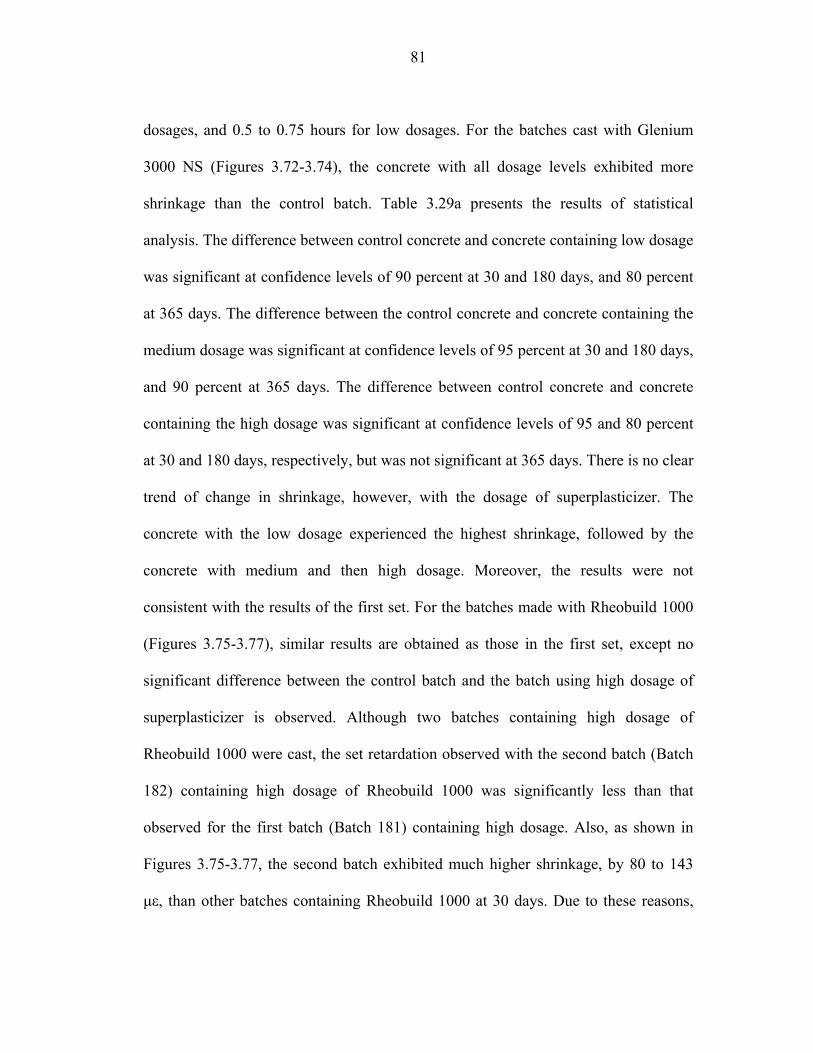
81
dosages, and 0.5 to 0.75 hours for low dosages. For the batches cast with Glenium
3000 NS (Figures 3.72-3.74), the concrete with all dosage levels exhibited more
shrinkage than the control batch. Table 3.29a presents the results of statistical
analysis. The difference between control concrete and concrete containing low dosage
was significant at confidence levels of 90 percent at 30 and 180 days, and 80 percent
at 365 days. The difference between the control concrete and concrete containing the
medium dosage was significant at confidence levels of 95 percent at 30 and 180 days,
and 90 percent at 365 days. The difference between control concrete and concrete
containing the high dosage was significant at confidence levels of 95 and 80 percent
at 30 and 180 days, respectively, but was not significant at 365 days. There is no clear
trend of change in shrinkage, however, with the dosage of superplasticizer. The
concrete with the low dosage experienced the highest shrinkage, followed by the
concrete with medium and then high dosage. Moreover, the results were not
consistent with the results of the first set. For the batches made with Rheobuild 1000
(Figures 3.75-3.77), similar results are obtained as those in the first set, except no
significant difference between the control batch and the batch using high dosage of
superplasticizer is observed. Although two batches containing high dosage of
Rheobuild 1000 were cast, the set retardation observed with the second batch (Batch
182) containing high dosage of Rheobuild 1000 was significantly less than that
observed for the first batch (Batch 181) containing high dosage. Also, as shown in
Figures 3.75-3.77, the second batch exhibited much higher shrinkage, by 80 to 143
με, than other batches containing Rheobuild 1000 at 30 days. Due to these reasons,

82
the results for the first batch (which was cast at the same time as the batches
containing low and medium dosages of Rheobuild 1000 were cast) are used for the
comparison. The results of the Student’s t-test are presented in Table 3.29b. Again,
there is no clear trend of shrinkage with the change in dosage. For the batches
containing Adva 100 (Figures 3.78-3.80), the effect of superplasticizer on shrinkage
is not noticeable. The differences observed are within 10 με and are not statistically
significant (Table 3.30a), with the exception of the difference between batches with
low and high dosages being statistically significant at 30 days. This difference
disappears at later ages. For concrete containing Glenium 3000 NS, and Rheobuild
1000, it is generally observed that the concrete containing low dosage exhibits higher
shrinkage than the control concrete as well as the concrete containing medium and
high dosage. This could be a result of significant set retardation observed with
concrete containing high and medium dosages of superplasticizers.
The third set consisted of additional batches with different dosages of Adva
100. Figures 3.81-3.83 present the average free shrinkage curves for this set. The
results of Student’s t-test are presented in Table 3.30b. The results obtained are very
similar to the results of previous batches made with Adva 100. No apparent or
significant difference was observed between the control batch and batches with three
dosages of superplasticizer.
Batches with different types of superplasticizer at the same dosage level are
compared using Student’s t-test. Tables 3.31a, 3.31b, and 3.31c present the results of
Student’s t-test for low, medium, and high dosages, respectively. At low and medium

83
dosages, there is no significant difference between the shrinkage of concrete made
with the different superplasticizers. At the high dosage, the difference is not
significant at 30 days. At 180 days, concrete containing Rheobuild 1000 exhibited the
least shrinkage, followed by Glenium 3000 NS, and Adva 100. All of these
differences were significant at the confidence level of 95 percent. Similar differences
are observed at 365 days at confidence level of 90 percent for the difference between
Rheobuild 1000 and Glenium 3000 NS, and that between Glenium 3000 NS and
Adva 100 and at confidence level of 95 percent for the difference between Rheobuild
1000 and Adva 100.
In the fourth set, all three superplasticizer were used, and the dosages were
based on the quantity of superplasticizer required to obtain a slump of 76 ± 12 mm (3
± ½ in.). Figures 3.84-3.86 present the average free shrinkage curves for this set. The
batches using different superplasticizers exhibited significantly more shrinkage than
the control batch at all ages. The difference is statistically significant at the highest
level of confidence for all three types of superplasticizers (Table 3.32a). Figure 3.85
shows that, up to age of 180 days, there appears to be no noticeable difference among
the shrinkage values exhibited by the concretes containing superplasticizers. After
180 days (Figure 3.86), the concrete containing Rheobuild 1000 experienced more
shrinkage than the other batches containing a superplasticizer; the difference is
statistically significant. Also, the results of Student’s t-test (Table 3.32a) indicate that
the concrete containing Glenium 3000 NS exhibited higher shrinkage than the batch
containing Adva 100 (difference of 10 με, statistically significant at 80 percent

84
confidence level) at 30 days. This difference, however, is not statistically significant
at later ages.
For the air-entrained concrete in Program V, the superplasticizer dosages were
adjusted to obtain the same slump for all batches. The control batch did not contain a
superplasticizer; rather, an increased paste content was used to obtain the same slump
as the other batches with superplasticizers. The results for this set are presented in
Figures 3.87-3.89. At 30 days (Figure 3.87), there is little difference between the
shrinkage of different batches. The results of Student’s t-test (Table 3.32b) support
this observation, indicating that the use of superplasticizers increases the shrinkage of
concrete, but that, for this comparison, the shrinkage is increased to an extent that it
would be experienced by increasing the paste content (from 24.5 percent to 28.7
percent) to obtain a similar slump. From 30 to 180 days, the batch containing
Rheobuild 1000 exhibited less shrinkage than rest of the batches (Figure 3.88). At
180 and 365 days, the concrete containing Rheobuild exhibited less shrinkage than
rest of the batches, while the highest shrinkage was exhibited by control concrete.
The differences are relatively small (40 to 54 με) and are not statistically significant.
The lack of a significant difference could be due to the large scatter of data observed
in the individual specimens of this set.
3.7.2 SUMMARY OF PROGRAM V
Although the results of different sets in the superplasticizer program are
inconsistent, there are reasons to believe that the superplasticizers increased the

85
shrinkage of concrete. For most of non-air-entrained batches, the concrete containing
a superplasticizer experienced higher shrinkage than the control concrete. However,
no clear trend could be obtained for change in shrinkage with change in dosage of
superplasticizers. The lack of a trend could be due to the increased set retardation for
the mixes with the higher dosages, as discussed earlier. For the batches in which the
superplasticizer dosages were based on the quantity required to obtain a slump of 76
± 12 mm (3 ± ½ in.), an increase in shrinkage was observed for superplasticized
batches compared to the control batch for non-air-entrained concrete. For the air-
entrained batches, because the control batch contained significantly more paste to
obtain similar slump to the superplasticized batches, it was expected that the
superplasticized batches would experience less shrinkage than the control batches, but
no difference was observed. This indicates that the superplasticizers increased the
shrinkage of concrete. Additional batches designed in a similar manner are needed,
however, to fully justify such a conclusion.
3.8 COMPARISON OF RESULTS WITH PREVIOUS WORK
Most researchers agree that an increase in the volume of cement paste in
concrete will lead to higher drying shrinkage. The effect of w/c ratio on shrinkage is
not clearly understood, and different studies have led to conflicting conclusions.
Hindy et al. (1994) observed increased shrinkage with a higher w/c ratio. A relatively
small reduction in shrinkage was observed with a lower w/c ratio by Bissonnette,
Pierre, and Pigeon (1999). No clear trend of shrinkage with w/c ratio was found by

86
Bloom and Bentur (1995). Bennett and Loat (1970) reported an increase in shrinkage
with higher w/c ratios and paste contents. The current results indicate no clear trend
of shrinkage with w/c ratio. The effect of increased aggregate content (and, in turn,
reduced cement paste), however, is clearly observed. An increased aggregate content
resulted in lower shrinkage in all concrete mixes. It is worth noting that in many of
the previous studies, a change in the w/c ratio was associated with a change in paste
content. As a result, no firm conclusions can be made in regard to the effect of w/c
ratio based on past work, but it appears to have, at most, a minor effect for mixes with
equal paste content.
An increase in shrinkage with finer cements was reported by Bennett and Loat
(1970). They also observed that the finer cements, however, did not lead to
significant increase in cracking tendency. This study compared the shrinkage of
concrete containing coarse ground Type II cement (Blaine fineness = 306 m2/kg) with
that occurring for concrete containing Type I/II cement (Blaine Fineness = 378
m2/kg) in Programs I and IV. In both programs, shrinkage was lower when Type II
coarse ground cement was used.
Most of the previous researchers reported that shrinkage decreases with use of
stiffer and less porous aggregates. Carlson (1938) reported that the compressibility of
aggregates was a major factor influencing the shrinkage of concrete. In that study,
some aggregates affected the shrinkage through increased water demand for constant
workability, but many of the aggregates affected the shrinkage through the physical
properties of aggregate itself. Alexander (1996) reported lower shrinkage for concrete

87
made with aggregates that had higher moduli of elasticity. Overall in this study,
concrete containing denser aggregates (quartzite and granite) exhibited less shrinkage
than concrete containing a more porous aggregate (limestone). The results for
individual batches, however, were not always consistent with this observation.
Conflicting conclusions have been made by various researchers regarding the
effect of mineral admixtures on concrete shrinkage. Khatri and Sirivivatnanon (1995)
reported higher shrinkage with the use of slag or fly ash. The use of silica fume led to
higher early age shrinkage, but the long-term shrinkage decrease when silica fume
was used. They suggested that, although long-term shrinkage is decreased, the higher
early age shrinkage could lead to significant cracking because of low tensile strength
of concrete at early age. Atis (2003), however, reported a decrease in drying
shrinkage with the use of fly ash. The reduction was greater with higher percentages
of fly ash replacement. A significant increase in shrinkage with silica fume
replacement was observed in a study by Rao (1998). Whiting, Detwiler, and
Lagergren (2000) also reported high early age shrinkage with the use of silica fume.
They observed that the cracking tendency was affected only when silica fume
concrete were not properly cured. In this study, fly ash appears to consistently
increase the shrinkage of concrete. Slag, however, does not appear to affect the
ultimate shrinkage of concrete to a great extent, but early age shrinkage may be
increased with the use of slag. No certain conclusions can be made about the use of
silica fume. In most previous studies, the effect of differences in specific gravities of
mineral admixtures and cement, and in turn, the effect on the change in the paste

88
content of the mixes were not considered by researchers when reaching their
conclusions, and in many cases, the concrete containing mineral admixtures was
cured for only a short period. In future studies, the paste content of mixes should be
held constant when studying the effect of mineral admixtures on shrinkage.
Specimens should also be cured for longer times in studies evaluating the effect of
mineral admixtures on shrinkage.
Alsayed and Amjad (1994) observed reduced shrinkage with intermittent wet
curing as compared to dry curing. They reported that none of the curing methods,
however, effectively reduced the early age shrinkage of concrete. Nassif, Suksawang,
and Mohammed (2003) reported that moist curing with wet burlap led to lower
shrinkage as compared to air curing or curing using a curing compound. They also
reported that concrete needs to be covered immediately with wet burlap after
finishing to effectively limit shrinkage. T. C. Powers (1959), however, claimed that
moist curing has no significant effect on shrinkage. A significant effect of curing
period on both air-entrained and non-air-entrained concrete containing either Type
I/II or Type II coarse ground cement was observed in this study. Longer curing
periods allow concrete to swell, delay the initiation of drying and result in increased
hydration, which limits the quantity of water that can be lost due to evaporation. With
few exceptions, concrete cured for longer periods exhibited lower shrinkage than that
cured for shorter periods.
Qi, Li, and Ma (2002) reported a reduction in free shrinkage with the use of a
high superplasticizer content. Johnston, Gamble, and Malhotra (1979), however,

89
observed increased shrinkage with some admixture types and little effect on
shrinkage with other admixture types. An analysis of available data by Brooks (1989)
indicated that the use of superplasticizers increases the creep and shrinkage of
concrete by 3 to 132 percent. The results of this study indicate that superplasticizers
increase the shrinkage of concrete, although the results from different sets in the
superplasticizer program are inconsistent. There is no clear trend of change in
shrinkage, however, with the dosage of superplasticizer.
Overall, most of the studies, including this study, indicate that an increase in
aggregate content (and reduction in paste content) leads to decreased shrinkage. Most
researchers also agree that moist curing, and longer curing periods, as well as coarser
cements help to limit shrinkage. More work is needed to clearly understand the effect
of aggregate type, mineral admixtures, and superplasticizers on shrinkage.

CHAPTER 4: SUMMARY AND CONCLUSIONS
4.1 SUMMARY
The effects of paste volume, water-cement (w/c) ratio, aggregate type, cement
type, curing period, mineral admixtures, and superplasticizers on the free shrinkage of
concrete are evaluated with the goal of establishing guidelines to reduce cracking in
reinforced concrete bridge decks. The work is organized in five test programs. Three
76 × 76 × 286 mm (3 × 3 × 11¼ in.) concrete prisms were cast and tested in
accordance with ASTM C 157 for each mixture up to an age of 365 days under
controlled conditions of 23 ± 2°C (73 ± 3°F) and 50 ± 4 percent relative humidity.
The specimens were cured in lime-saturated water until drying began. Drying in the
controlled environment began on day 3 after casting, except as noted below for
Program IV.
Program I evaluated the effect of aggregate content (and, in turn, paste
content) and water-cement ratio on shrinkage using two types of cement. A total of 18
batches were made with aggregate contents of 60, 70, and 80 percent, water-cement
ratios of 0.40, 0.45, and 0.50, and two either Type I/II or Type II coarse-ground
cement.
Program II was used to evaluate the effect of coarse aggregate type on
shrinkage. Four sets of specimens, three non-air-entrained and one air-entrained, were
cast. In the first set, two types of coarse aggregate, limestone and quartzite, were
used. Granite was added as a third coarse aggregate for the balance of Program II.
90

91
Type I/II cement was used with a w/c ratio of 0.45 and an aggregate content of 70
percent in all batches in this program.
Program III evaluated the effects of mineral admixtures on concrete
shrinkage. A total of three sets were cast, and all of the batches used non-air-
entrained concrete. The first two sets contained concrete with one of three mineral
admixtures, Class C fly ash, blast furnace slag, or silica fume, as a partial replacement
by volume for cement. Volume replacements of 30 percent were used for Class C fly
ash and slag and 10 percent for silica fume. Free shrinkage was compared with that
of a control batch containing no mineral admixture. An aggregate content of 70
percent was used with a w/c ratio of 0.45 by mass for the control batch. For concrete
containing mineral admixtures, the aggregate content was same, but the w/cm ratio
(by weight) varied slightly, because of the difference in specific gravities between
cement and the mineral admixtures. For concrete containing slag, fly ash, and silica
fume, the w/cm ratios were 0.465, 0.469, and 0.470, respectively. In the third set, two
control batches were made, one without any admixtures and one with a low dosage of
Adva 100 superplasticizer. These batches were compared with a batch containing a
10 percent volume replacement of cement by silica fume. The purpose of this
additional set was to evaluate the effect of better distribution of silica fume in the
mix, and to compare the silica fume concrete (containing superplasticizer) with a
control concrete containing superplasticizer, as well as a control concrete containing
no superplasticizer. Silica fume was premixed with fine aggregates before mixing the
concrete to obtain a better dispersion of silica fume particles throughout the mix. This

92
batch also used a low dosage of Adva 100 superplasticizer to improve the workability
of the mix.
Program IV was used to study the effects of increased curing on shrinkage for
concrete containing Type I/II cement and Type II coarse ground cement. Specimens
were cured for 3, 7, 14, and 28 days in lime-saturated water. Shrinkage was compared
based on both the age after casting and drying period. Both non-air-entrained and air-
entrained concretes were tested. All batches used a w/c ratio of 0.45 and aggregate
content of 70 percent.
Program V studied the effects of superplasticizers on shrinkage. The types of
superplasticizers and the dosage rates were compared using five sets of test
specimens. Four sets were non-air-entrained, and one set was air-entrained. In the
first set, three dosage rates of Glenium 3000 NS or Rheobuild 1000 were used in non-
air-entrained concrete. In the second set, a third superplasticizer, Adva 100, was used,
along with the two previous superplasticizers. In the third set, the batches containing
Adva 100 from second set were replicated. In the fourth set, non-air-entrained
concrete was used, and the dosage rates of three superplasticizers were adjusted to
obtain a slump of 76 ± 12 mm (3 ± ½ in.). The control batch used no chemical
admixtures and had no specific slump requirements. In the fifth set, air-entrained
concrete was used. The dosage rates of the superplasticizers were adjusted in a
manner similar to that in fourth set. The control batch did not use a chemical
admixture, but a slump of 76 ± 12 mm (3 ± ½ in.) was obtained by increasing the

93
paste content of the mix. All of the batches in Program V used an aggregate content
of 70 percent and a w/c ratio of 0.45.
4.2 CONCLUSIONS
The following conclusions are based on the test results and the analyses presented
in this report.
1. Concrete shrinkage decreases with an increase in the aggregate content (and
decrease in paste content) of the mix. For a given aggregate content, no clear
effect of water-cement ratio on the shrinkage is observed.
2. In general, granite coarse aggregates result in lower shrinkage than limestone
coarse aggregates. A similar conclusion cannot be made with quartzite coarse
aggregate, although in some cases shrinkage of concrete containing quartzite
coarse aggregate was lower than that of concrete containing limestone.
3. The use of a 30 percent volume replacement of portland cement by Class C
fly ash without changing the water or aggregate content in concrete generally
leads to increased shrinkage. Laboratory mixes using Class C fly ash
exhibited more shrinkage than the control concrete in most cases.
4. The use of a 30 percent volume replacement of portland cement by blast
furnace slag without changing the water or aggregate content in concrete can
lead to increased early age shrinkage, although the ultimate shrinkage does
not appear to be significantly affected.

94
5. An increase in the curing period helps to reduce shrinkage. Possible reasons
include delayed initiation of drying, initial expansion of the concrete, and
increased hydration that limits the quantity of water that can be lost due to
evaporation. In the current study, a significant reduction in shrinkage was
observed when the curing period is increased from 7 to 14 or 28 days. The
difference in shrinkage for concrete cured for three days and concrete cured
for seven days was not large in many cases.
6. The use of Type II coarse ground cement results in significantly less
shrinkage than Type I/II cement. The reduction in shrinkage was observed for
all mixtures and all curing periods.
7. The use of superplasticizers in concrete appears to increase shrinkage to a
degree. The results, however, do not present a clear picture of the effect of
superplasticizer dosage on shrinkage.
4.3 RECOMMENDATIONS
1. To minimize the shrinkage and, in turn, cracking in bridge decks, mixes
with lower paste contents and higher aggregate contents should be used.
2. Granite should be used as coarse aggregate instead of limestone wherever
possible.
3. The use of mineral admixtures in bridge deck concrete should be avoided
until sufficient data indicating a reduction in shrinkage with use of these
materials is available.
95
4. In future testing, Class F fly ash should be tested for its effect on the
shrinkage. The duration of moist curing should be increased if mineral
admixtures are used.
5. The duration of curing should be increased for the tests, with
recommended minimums of 7 and 14 days.
6. Type II coarse-ground cement (Blaine fineness less than approximately
310 m2/kg) should be used wherever available, once test results are
available to demonstrate that the permeability and compressive strength of
the concrete are not adversely affected.

96
REFERENCES
Alexander (1996). “Aggregates and the Deformation Properties of Concrete,” ACI Materials Journal, Nov.-Dec., Vol. 93, No. 6, pp. 569-577. Alsayed, S. and Amjad, M. (1994). “Effect of Curing Conditions on Strength, Porosity, Absorptivity and Shrinkage of Concrete in Hot and Dry Climate,” Cement and Concrete Research, Vol. 24, Jul., No. 7, pp. 1390-1398. American Society of Civil Engineers (2005). “Report Card for America’s Infrastructure,” ASCE website: www.asce.org/reportcard/2005 ASTM C 157-04 (2004). “Standard Test Method for Length Change of Hardened Hydraulic-Cement Mortar and Concrete,” 2005 Annual Book of ASTM Standards, Vol. 4.02, American Society of Testing and materials, West Conshohocken, PA. Bennett, E. and Loat, D. (1970). “Shrinkage and Creep of Concrete as Affected by the Fineness of Portland Cement,” Magazine of Concrete Research, Jun., Vol. 22, No. 71, pp. 69-78. Bissonnette, B., Pierre, P., and Pigeon, M. (1999). “Influence of Key Parameters on Drying Shrinkage of Cementitious Materials,” Cement and Concrete Research, Oct., Vol. 29, No. 10, pp. 1655-1662. Bloom, R. and Bentur, A. (1995). “Free and Restrained Shrinkage of Normal and High-Strength Concretes,” ACI Materials Journal, Mar-Apr., Vol. 92, No. 2, pp. 211-217. Brooks, J. (1989) “Influence of Mix Proportions, Plasticizers, and Superplasticizers on Creep and Drying Shrinkage of Concrete,” Magazine of Concrete Research, Sep., Vol. 41, No. 148, pp. 145-153. Cabrera, J. G., and Atis, C. D. (1999). “Design and Properties of High Volume Fly Ash High-Performance Concrete,” Proc., ACI Int. Conf. On High Performance Concrete and Performance and Quality Control Structures, ACI SP-186, pp. 21-37. Carlson, R. (1938). “Drying Shrinkage of Concrete as Affected by Many Factors,” ASTM Proceedings, Vol. 38, Part II, pp. 419-440. Darwin, D., Browning, J., and Lindquist, W. (2004). “Control of Cracking in Bridge Decks: Observations from the Field,” Cemen., Concrete, and Aggregates, Dec., Vol. 26, No. 2, pp. 148-154.

97
Federal Highway Administration (FHWA) (2005). “FHWA Bridge Programs NBI Data,” FHWA website: www.fhwa.dot.gov/bridge/defbr05.htm Florida Department of Transportation (FDOT), (2005), “Evaluation of Shrinkage Cracking Potential of Concrete Used in Bridge Decks in Florida,” Report No. 4910-4504-797-12, Sep., pp. 87-94. Hindy, E., Miao, B., Chaallal, O., and Aïtcin, P. (1994). “Drying Shrinkage of Ready-Mixed High-Performance Concrete,” ACI Structural Journal, May-Jun., Vol. 91, No. 3, pp. 300-305. Johnston, C., Gamble, B., and Malhotra, V. (1979) “Effects of Superplasticizers on Properties of Fresh and Hardened Concrete,” Transportation Research Record, No. 720, pp. 1-7. Khatri, R. and Sirivivatnanon, V. (1995). “Effect of Different Supplementary Cementitious Materials on Mechanical Properties of High Performance Concrete,” Cement and Concrete Research, Jan., Vol. 25, No. 1, pp. 209-220. Mang, T., Subramanian, R., Brown, D., and Broward, C. (2005). “Evaluation of Shrinkage Cracking Potential of Concretes Used in Bridge Decks in Florida,” University of Florida, Report No. 4910-4504-797-12, pp.39-49, 80-81. McLeod, H. (2005). “Guide for Developing Optimized Concrete Mixtures,” M.S. Thesis, University of Kansas, Lawrence, Kansas, 33 pp. Mindess, S., Young, F., and Darwin, D (2003). Concrete, 2nd ed., Prentice-Hall, Inc., Englewood Cliffs, New Jersey, pp. 417-432. Mokarem, D., Weyers, R., and Lane, D. (2005). “Development of a Shrinkage Performance Specifications and Prediction Model Analysis for supplemental cementitious material concrete mixtures,” Cement and Concrete Research, May, Vol. 35, No. 5, pp. 918-925. Nassif, H., Suksawang, N., and Mohammed, M. (2003). “Effect of Curing Methods on Early-Age and Drying Shrinkage of High-Performance Concrete,” Transportation Research Record, Vol. 1834, Paper No. 03-4120, pp. 48-58. Phelan, W. and Martin, R. (1995). “How Do Admixtures Influence Shrinkage?,” Concrete Construction, Jul., Vol. 40, No. 7, pp. 611-617. Pickett, G. (1956). “Effect of Aggregate on Shrinkage of Concrete and a Hypothesis Concerning Shrinkage,” ACI Journal, Proceedings, Jan.,Vol. 52 No. 1, pp. 581-590.

98
Powers, T. C. (1959). “Causes and Control of Volume Change,” Journal of Portland Cement Association Research and Development Laboratories, Jan., Vol. 1, pp. 29-39. Qi, M., Li, Z., and Ma, B. (2002). “Shrinkage and Cracking Behavior of High Performance Concrete Containing Chemical Admixtures,” Journal of Zhejiang University SCIENCE, Jun., Vol. 3, No. 2, pp. 188-193. Rao, G. (1998). “Influence of Silica Fume Replacement of Cement on Expansion and Drying Shrinkage,” Cement and Concrete Research, Oct., Vol. 28, No. 10, pp. 1505-1509. Shilstone, J. M., Sr. (1990). “Concrete Mixture Optimization,” Concrete International, Jun., Vol. 12, No. 6, pp. 33-39. Whiting, A., Detwiler, R., and Lagergren, E. (2000). “Cracking Tendency and Drying Shrinkage of Silica Fume Concrete for Bridge Deck Applications,” ACI Materials Journal, Jan.-Feb., Vol. 97, No. 1, pp. 71-76.

99
TABLES Table 2.1 – Program I (Aggregate Content, Water-Cement Ratio, Cement Type) test matrix
Aggregate content by volume 60% 70% 80%
Type I/II cement 0.40 Batch 68 Batch 66 Batch 62 0.45 Batch 69 Batch 64 Batch 63 0.50 Batch 70 Batch 65 Batch 67
Type II coarse-ground cement 0.40 Batch 77 Batch 74 Batch 71 0.45 Batch 78 Batch 75 Batch 72
w/c
Rat
io
0.50 Batch 79 Batch 76 Batch 73 0.008 m3 (0.01 yd3) hand batches Mix proportions in Table 2.13 Table 2.2 – Program II (Coarse Aggregate Types) test matrix
Limestone Batch 94 Quartzite Batch 95
Type I/II cement, 0.0478 m3 (0.0625 yd3) hand batches, Mix proportions in Table 2.14
Quartzite Batch 187 Limestone Batch 188
Granite Batch 189
Type I/II cement, 0.008 m3 (0.01 yd3) hand batches, Mix proportions in Table 2.14
Quartzite Batch 198 Limestone Batch 199
Granite Batch 200
Type I/II cement, 0.008 m3 (0.01 yd3) hand batches, Mix proportions in Table 2.14
Quartzite Batch 262 Limestone Batch 263
Granite Batch 264
Type I/II cement, 0.016 m3 (0.02 yd3) hand batches, Mix proportions in Table 2.14
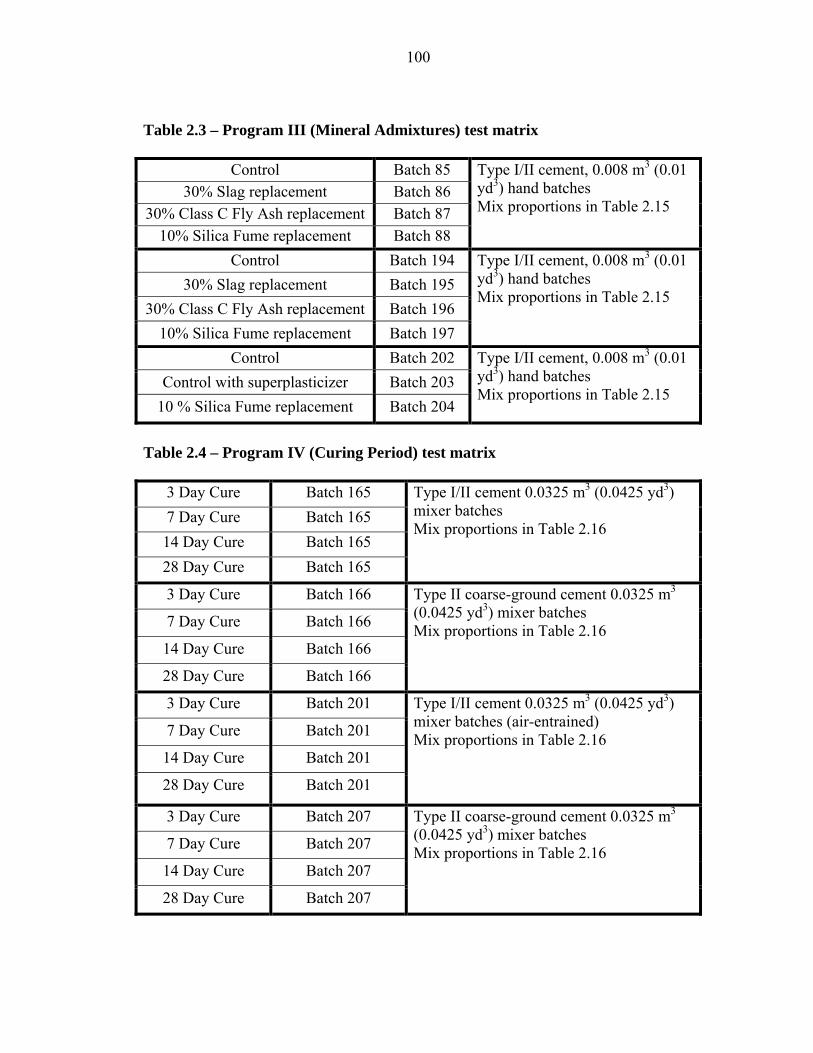
100
Table 2.3 – Program III (Mineral Admixtures) test matrix
Control Batch 85 30% Slag replacement Batch 86
30% Class C Fly Ash replacement Batch 87 10% Silica Fume replacement Batch 88
Type I/II cement, 0.008 m3 (0.01 yd3) hand batches Mix proportions in Table 2.15
Control Batch 194 30% Slag replacement Batch 195
30% Class C Fly Ash replacement Batch 196 10% Silica Fume replacement Batch 197
Type I/II cement, 0.008 m3 (0.01 yd3) hand batches Mix proportions in Table 2.15
Control Batch 202 Control with superplasticizer Batch 203
10 % Silica Fume replacement Batch 204
Type I/II cement, 0.008 m3 (0.01 yd3) hand batches Mix proportions in Table 2.15
Table 2.4 – Program IV (Curing Period) test matrix
3 Day Cure Batch 165 7 Day Cure Batch 165 14 Day Cure Batch 165 28 Day Cure Batch 165
Type I/II cement 0.0325 m3 (0.0425 yd3) mixer batches Mix proportions in Table 2.16
3 Day Cure Batch 166
7 Day Cure Batch 166
14 Day Cure Batch 166
28 Day Cure Batch 166
Type II coarse-ground cement 0.0325 m3 (0.0425 yd3) mixer batches Mix proportions in Table 2.16
3 Day Cure Batch 201
7 Day Cure Batch 201
14 Day Cure Batch 201
28 Day Cure Batch 201
Type I/II cement 0.0325 m3 (0.0425 yd3) mixer batches (air-entrained) Mix proportions in Table 2.16
3 Day Cure Batch 207
7 Day Cure Batch 207
14 Day Cure Batch 207
28 Day Cure Batch 207
Type II coarse-ground cement 0.0325 m3 (0.0425 yd3) mixer batches Mix proportions in Table 2.16

101
Table 2.5 – Program V (Superplasticizers) test matrix
Control Batch 167 Low dosage Glenium 3000NS Batch 168
Medium dosage Glenium 3000NS Batch 169
High dosage Glenium 3000NS Batch 170, Batch 174
Low dosage Rheobuild 1000 Batch 171 Medium dosage Rheobuild 1000 Batch 172
High dosage Rheobuild 1000 Batch 173
Batch 174 was a repeat batch of Batch 170 Type I/II cement, 0.008 m3 (0.01 yd3) hand batches Glenium 3000NS base chemical: Polycarboxalate Rheobuild 1000 base chemical: Naphthalene Mix proportions in Table 2.17
Control Batch 175 Low dosage Glenium 3000NS Batch 176
Medium dosage Glenium 3000NS Batch 177 High dosage Glenium 3000NS Batch 178 Low dosage Rheobuild 1000 Batch 179
Medium dosage Rheobuild 1000 Batch 180
High dosage Rheobuild 1000 Batch 181, Batch 182
Batch 182 was a repeat batch of Batch 181 Type I/II cement, 0.008 m3 (0.01 yd3) hand batches Glenium 3000NS base chemical: Polycarboxalate Rheobuild 1000 base chemical: Naphthalene Mix proportions in Table 2.17
Control Batch 183, Batch 193
Low dosage Adva 100 Batch 184, Batch 190
Medium dosage Adva 100 Batch 185, Batch 191
High dosage Adva 100 Batch 186, Batch 192
Batches 193, 190, 191 and 192 are repeats of batches 183, 184, 185 and 186, respectively. Type I/II cement, 0.008 m3 (0.01 yd3) hand batches Adva 100 base chemical: Polyoxyalkylene Mix proportions in Table 2.17
Control Batch 208
Adva 100 Batch 209
Glenium 3000NS Batch 210
Rheobuild 1000 Batch 211
Superplasticizer dosages for 3±½ in.slump for batches 209, 210, 211 Type I/II cement, 0.016 m3 (0.02 yd3) mixer batches Mix proportions in Table 2.17
Control Batch 260
Adva 100 Batch 259
Glenium 3000NS Batch 249
Rheobuild 1000 Batch 256
Superplasticizer dosages for 3±½ in.slump for batches 249, 256, 259 Type I/II cement, 0.016 m3 (0.02 yd3) mixer batches (air-entrained) Mix proportions in Table 2.17

102
Tab
le 2
.6–
Pea
grav
el g
rada
tions
%
Ret
aine
d
9.51
mm
(3/8
in.)
0 0
0 0
0
600 μm
(No.
30)
8.
6 9.
0 12
.2
8.8
11.0
300 μm
(No.
50)
4.
9 5.
6 7.
4 3.
4 6.
6
75 μ
m (N
o. 2
00)
0.4
0.4
0.4
0.3
0.6
Pan
0.1
0.2
0.1
0.6
0.3
4750
μm
(No.
4)
10.3
12
.5
9.6
9.5
8.4
150 μm
(No.
100
) 1.
8 1.
7 3.
0 1.
3 3.
3
2360
μm
(No.
8)
41.0
40
.5
33.6
40
.9
35.3
1180
μm
(No.
16)
32
.9
30.2
33
.7
35.2
34
.4
Siev
e si
ze
Gra
datio
n 1
Gra
datio
n 2
Gra
datio
n 3
Gra
datio
n 4
Gra
datio
n 5
Gra
datio
n 1:
Pro
gram
I, P
rogr
am II
I: 85
thro
ugh
88, P
rogr
am II
: 94
and
95
Gra
datio
n 2:
Pro
gram
V: 1
75 th
roug
h 18
6, P
rogr
am IV
: 165
and
166
, G
rada
tion
3: P
rogr
am II
187
thro
ugh
189
and
198
thro
ugh
200,
Pro
gram
III 9
4 th
roug
h 19
7, P
rogr
am IV
: 201
and
207
, Pr
ogra
m V
: 190
thro
ugh
193,
208
thro
ugh
211
Gra
datio
n 4:
Pro
gram
V: 2
49, 2
56, 2
59 a
nd 2
60
Gra
datio
n 5:
Pro
gram
II: 2
62 th
roug
h 26
4
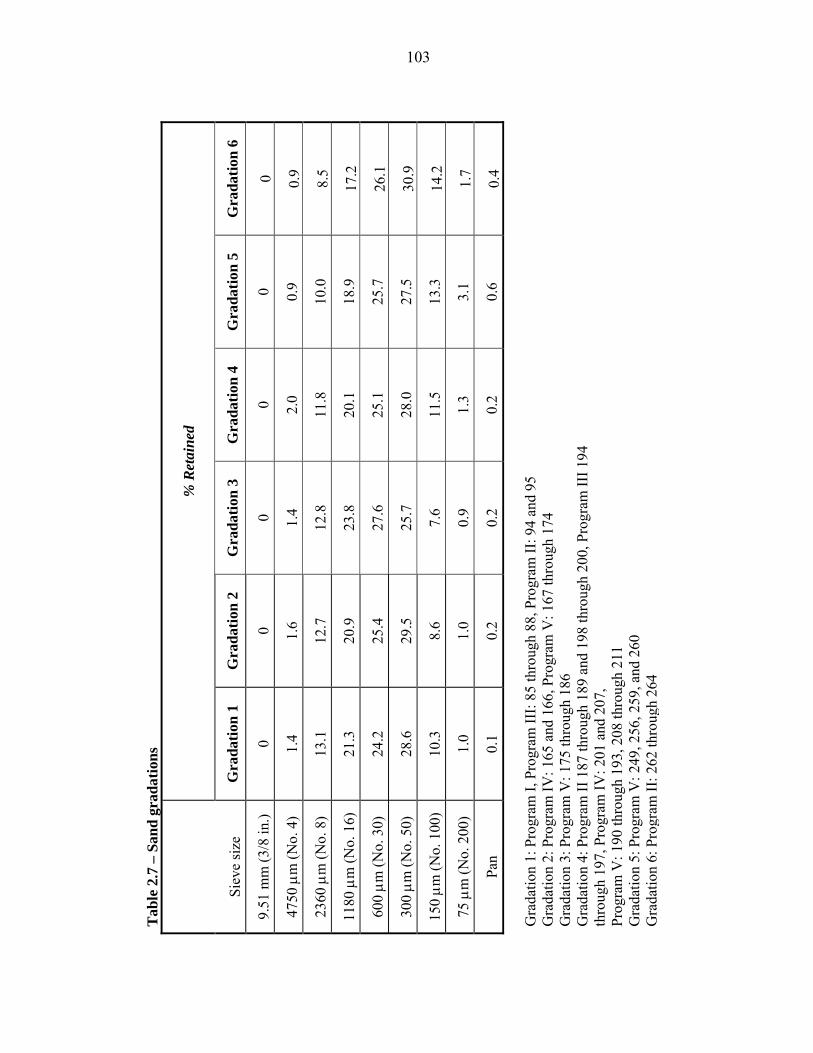
103
Tab
le 2
.7 –
San
d gr
adat
ions
% R
etai
ned
Siev
e si
ze
Gra
datio
n 1
Gra
datio
n 2
Gra
datio
n 3
Gra
datio
n 4
Gra
datio
n 5
Gra
datio
n 6
9.51
mm
(3/8
in.)
0 0
0 0
0 0
4750
μm
(No.
4)
1.4
1.6
1.4
2.0
0.9
0.9
2360
μm
(No.
8)
13.1
12
.7
12.8
11
.8
10.0
8.
5
1180
μm
(No.
16)
21
.3
20.9
23
.8
20.1
18
.9
17.2
600 μm
(No.
30)
24
.2
25.4
27
.6
25.1
25
.7
26.1
300 μm
(No.
50)
28
.6
29.5
25
.7
28.0
27
.5
30.9
150 μm
(No.
100
) 10
.3
8.6
7.6
11.5
13
.3
14.2
75 μ
m (N
o. 2
00)
1.0
1.0
0.9
1.3
3.1
1.7
Pan
0.1
0.2
0.2
0.2
0.6
0.4
Gra
datio
n 1:
Pro
gram
I, P
rogr
am II
I: 85
thro
ugh
88, P
rogr
am II
: 94
and
95
Gra
datio
n 2:
Pro
gram
IV: 1
65 a
nd 1
66, P
rogr
am V
: 167
thro
ugh
174
Gra
datio
n 3:
Pro
gram
V: 1
75 th
roug
h 18
6 G
rada
tion
4: P
rogr
am II
187
thro
ugh
189
and
198
thro
ugh
200,
Pro
gram
III 1
94
thro
ugh
197,
Pro
gram
IV: 2
01 a
nd 2
07,
Prog
ram
V: 1
90 th
roug
h 19
3, 2
08 th
roug
h 21
1 G
rada
tion
5: P
rogr
am V
: 249
, 256
, 259
, and
260
G
rada
tion
6: P
rogr
am II
: 262
thro
ugh
264

104
Table 2.8 – 19-mm (3/4-in.) Granite gradations
% Retained
Sieve size Gradation 1 Gradation 2
38.1 mm (1 ½ in.) 0 0
25.4 mm (1 in.) 0 0
19.0 mm (¾ in.) 1.3 1.3
12.7 mm (½ in.) 20.4 35.8
9.51 mm (3/8 in.) 30.0 32.6
4750 μm (No. 4) 45.5 27.8
2360 μm (No. 8) 1.7 1.1
1180 μm (No. 16) 1.1 1.5 Gradation 1: Program II: 189 and 200 Gradation 2: Program II: 264 Table 2.9 – 25-mm (1-in.) Limestone gradations
% Retained
Sieve size Gradation 1 Gradation 2
38.1 mm (1 ½ in.) 0 0
25.4 mm (1 in.) 0 0
19.0 mm (¾ in.) 25.9 25.9
12.7 mm (½ in.) 71.7 71.7
9.51 mm (3/8 in.) 1.5 1.5
4750 μm (No. 4) 0.2 0.2
2360 μm (No. 8) 0.0 0.0
1180 μm (No. 16) 0.6 0.6 Gradation 1: Program I, Program III: 85 through 88, Program II: 94 Gradation 2: Program IV: 165 and 166

105
38.1
mm
(1 ½
in.)
0 0
0 0
0 0
1180
μm
(No.
16)
2.
3 6.
1 2.
8 1.
5 2.
2 2.
3
12.7
mm
(½ in
.) 23
.0
11.3
17
.5
18.9
22
.6
17.1
9.51
mm
(3/8
in.)
26.5
18
.7
25.8
25
.5
26.1
29
.0
4750
μm
(No.
4)
42.1
48
.7
45.6
46
.4
41.7
47
.7
Tab
le 2
.10
– 19
-mm
(3/4
-in.)
Lim
esto
ne g
rada
tions
% R
etai
ned
Siev
e si
ze
Gra
datio
n 1
Gra
datio
n 2
Gra
datio
n 3
Gra
datio
n 4
Gra
datio
n 5
Gra
datio
n 6
25.4
mm
(1 in
.) 0
0.1
0 0
0 0
19.0
mm
(¾ in
.) 0
0.1
0 0
0 0
2360
μm
(No.
8)
6.1
15.1
6.
1 7.
7 7.
4 3.
8
Gra
datio
n 1:
Pro
gram
I, P
rogr
am II
I: 85
thro
ugh
88, P
rogr
am II
: 95
Gra
datio
n 2:
Pro
gram
IV: 1
65 a
nd 1
66, P
rogr
am V
: 167
thro
ugh
174
Gra
datio
n 3:
Pro
gram
V: 1
75 th
roug
h 18
6 G
rada
tion
4: P
rogr
am II
: 188
and
199
, Pro
gram
V: 1
90 th
roug
h 19
3, P
rogr
am II
I: 19
4 th
roug
h 19
7, 2
02 th
roug
h 20
4, P
rogr
am IV
: 201
G
rada
tion
5: P
rogr
am V
: 208
thro
ugh
211
Gra
datio
n 6:
Pro
gram
II: 2
63gr
am V
: 249
, 256
, 259
and
260
, Pro

106
25.4
mm
(1 in
.) 0
0 0
0
38.1
mm
(1 ½
in.)
0 0
0 0
1180
μm
(No.
16)
0.
3 1.
6 1.
9 0.
7
2360
μm
(No.
8)
0.8
1.4
2.3
5.5
Tab
le 2
.11
– Q
uart
zite
gra
datio
ns
%
Ret
aine
d
Siev
e si
ze
Gra
datio
n 1
19 m
m (3
/4-in
.)
Gra
datio
n 2
19 m
m (3
/4-in
.)
Gra
datio
n 3
25 m
m (1
-in.)
Gra
datio
n 4
(Chi
p)
19.0
mm
(¾ in
.) 2.
0 3.
9 8.
3 0
12.7
mm
(½ in
.) 31
.1
42.8
46
.9
0.3
9.51
mm
(3/8
in.)
34.4
24
.6
23.0
17
.5
4750
μm
(No.
4)
31.4
25
.7
17.6
76
.0
Gra
datio
n 1:
Pro
gram
II: 1
87 a
nd 1
98
Gra
datio
n 2:
Pro
gram
II: 2
62
Gra
datio
n 3:
Pro
gram
II: 9
4 G
rada
tion
4: P
rora
m II
: 94
g
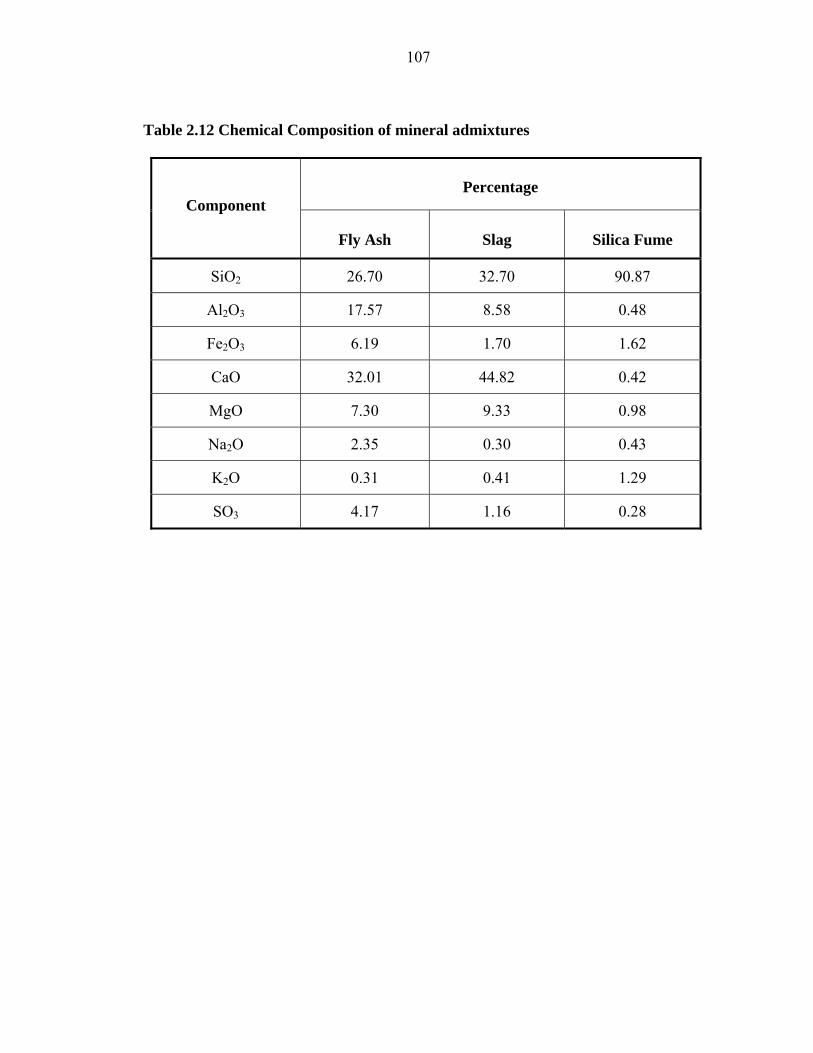
107
Table 2.12 Chemical Composition of mineral admixtures
Percentage
Component
Fly Ash
Slag
Silica Fume
SiO2 26.70 32.70 90.87
Al2O3 17.57 8.58 0.48
Fe2O3 6.19 1.70 1.62
CaO 32.01 44.82 0.42
MgO 7.30 9.33 0.98
Na2O 2.35 0.30 0.43
K2O 0.31 0.41 1.29
SO3 4.17 1.16 0.28
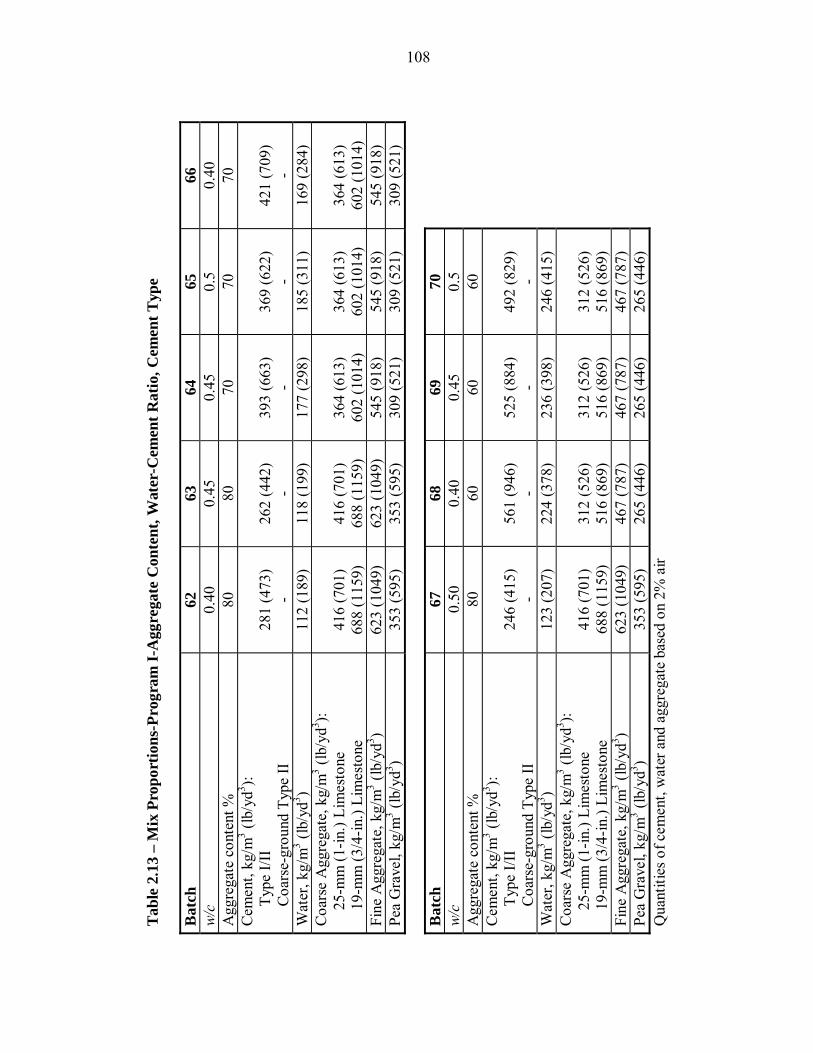
108
Tab
le 2
.13
– M
ix P
ropo
rtio
ns-P
rogr
am I-
Agg
rega
te C
onte
nt, W
ater
-Cem
ent R
atio
, Cem
ent T
ype
B
atch
62
63
64
65
66
w/
c 0.
40
0.45
0.
45
0.5
0.40
A
ggre
gate
con
tent
%
80
80
70
70
70
Cem
ent,
kg/m
3 (lb/
yd3 ):
T
ype
I/II
C
oars
e-gr
ound
Typ
e II
28
1 (4
73)
-
26
2 (4
42)
-
39
3 (6
63)
-
36
9 (6
22)
-
42
1 (7
09)
- W
ater
, kg/
m3 (l
b/yd
3 ) 11
2 (1
89)
118
(199
) 17
7 (2
98)
185
(311
) 16
9 (2
84)
Coa
rse
Agg
rega
te, k
g/m
3 (lb/
yd3 ):
2
5-m
m (1
-in.)
Lim
esto
ne
1
9-m
m (3
/4-in
.) Li
mes
tone
41
6 (7
01)
688
(115
9)
41
6 (7
01)
688
(115
9)
36
4 (6
13)
602
(101
4)
36
4 (6
13)
602
(101
4)
36
4 (6
13)
602
(101
4)
Fine
Agg
rega
te, k
g/m
3 (lb/
yd3 )
623
(104
9)
623
(104
9)
545
(918
) 54
5 (9
18)
545
(918
) Pe
a G
rave
l, kg
/m3 (l
b/yd
3 ) 35
3 (5
95)
353
(595
) 30
9 (5
21)
309
(521
) 30
9 (5
21)
Bat
ch
67
68
69
70
w/c
0.50
0.
40
0.45
0.
5 A
ggre
gate
con
tent
%
80
60
60
60
Cem
ent,
kg/m
3 (lb/
yd3 ):
T
ype
I/II
C
oars
e-gr
ound
Typ
e II
24
6 (4
15)
-
56
1 (9
46)
-
52
5 (8
84)
-
49
2 (8
29)
- W
ater
, kg/
m3 (l
b/yd
3 ) 12
3 (2
07)
224
(378
) 23
6 (3
98)
246
(415
) C
oars
e A
ggre
gate
, kg/
m3 (l
b/yd
3 ):
25-
mm
(1-in
.) Li
mes
tone
19-
mm
(3/4
-in.)
Lim
esto
ne
41
6 (7
01)
688
(115
9)
31
2 (5
26)
516
(869
)
31
2 (5
26)
516
(869
)
31
2 (5
26)
516
(869
) Fi
ne A
ggre
gate
, kg/
m3 (l
b/yd
3 ) 62
3 (1
049)
46
7 (7
87)
467
(787
) 46
7 (7
87)
Pea
Gra
vel,
kg/m
3 (lb/
yd3 )
353
(595
) 26
5 (4
46)
265
(446
) 26
5 (4
46)
Qua
ntiti
es o
f cem
ent,
wat
er a
nd a
ggre
gate
bas
ed o
n 2%
air

109
Tab
le 2
.13
– M
ix P
ropo
rtio
ns-P
rogr
am I-
cont
inue
d B
atch
71
72
73
74
75
w
/c
0.40
0.
45
0.50
0.
40
0.45
A
ggre
gate
con
tent
%
80
80
80
70
70
Cem
ent,
kg/m
3 (lb/
yd3 ):
T
ype
I/II
C
oars
e-gr
ound
Typ
e II
- 28
1 (4
73)
- 26
2 (4
42)
- 24
6 (4
15)
- 42
1 (7
09)
- 39
3 (6
63)
Wat
er, k
g/m
3 (lb/
yd3 )
112
(189
) 11
8 (1
99)
123
(207
) 16
9 (2
84)
177
(298
) C
oars
e A
ggre
gate
, kg/
m3 (l
b/yd
3 ):
25-
mm
(1-in
.) Li
mes
tone
19-
mm
(3/4
-in.)
Lim
esto
ne
41
6 (7
01)
688
(115
9)
41
6 (7
01)
688
(115
9)
41
6 (7
01)
688
(115
9)
36
4 (6
13)
602
(101
4)
36
4 (6
13)
602
(101
4)
Fine
Agg
rega
te, k
g/m
3 (lb/
yd3 )
623
(104
9)
623
(104
9)
623
(104
9)
545
(918
) 54
5 (9
18)
Pea
Gra
vel,
kg/m
3 (lb/
yd3 )
353
(595
) 35
3 (5
95)
353
(595
) 30
9 (5
21)
309
(521
) B
atch
76
77
78
79
w
/c
0.50
0.
40
0.45
0.
50
Agg
rega
te c
onte
nt %
70
60
60
60
C
emen
t, kg
/m3 (l
b/yd
3 ):
Typ
e I/I
I
Coa
rse-
grou
nd T
ype
II
- 36
9 (6
22)
- 56
1 (9
46)
- 52
5 (8
84)
- 49
2 (8
29)
Wat
er, k
g/m
3 (lb/
yd3 )
185
(311
) 22
4 (3
78)
236
(398
) 24
6 (4
15)
Coa
rse
Agg
rega
te, k
g/m
3 (lb/
yd3 ):
2
5-m
m (1
-in.)
Lim
esto
ne
1
9-m
m (3
/4-in
.) L
imes
tone
36
4 (6
13)
602
(101
4)
31
2 (5
26)
516
(869
)
31
2 (5
26)
516
(869
)
31
2 (5
26)
516
(869
) Fi
ne A
ggre
gate
, kg/
m3 (l
b/yd
3 ) 54
5 (9
18)
467
(787
) 46
7 (7
87)
467
(787
) Pe
a G
rave
l, kg
/m3 (l
b/yd
3 ) 30
9 (5
21)
265
(446
) 26
5 (4
46)
265
(446
) Q
uant
ities
of c
emen
t, w
ater
, and
agg
rega
tes b
ased
on
2% a
ir

Tab
le 2
.14
– M
ix P
ropo
rtio
ns-P
rogr
am II
-Agg
rega
te T
ypes
B
atch
94
95
18
7 18
8 18
9
110
w/c
0.
45
0.45
0.
45
0.45
0.
45
Agg
rega
te c
onte
nt %
70
70
70
70
70
C
emen
t, kg
/m3 (l
b/yd
3 ):
Typ
e I/I
I
37
4 (6
30)
37
4 (6
30)
37
4 (6
30)
37
4 (6
30)
37
4 (6
30)
Wat
er, k
g/m
3 (lb/
yd3 )
168
(283
) 16
8 (2
83)
168
(283
) 16
8 (2
83)
168
(283
) C
oars
e A
ggre
gate
, kg/
m3 (l
b/yd
3 ):
25
-mm
(1-in
.) Li
mes
tone
19-
mm
(3/4
-in.)
Lim
esto
ne
2
5-m
m (1
-in.)
Qua
rtzite
Qua
rtzite
Chi
p
19-
mm
(3/4
-in.)
Qua
rtzite
19-
mm
(3/4
-in.)
Gra
nite
- - 88
3 (1
488)
13
0 (2
19)
- -
36
4 (6
13)
635
(107
0)
- - - -
- - - - 89
9 (1
514)
-
- 88
2 (1
485)
- - - -
- - - - - 89
5 (1
508)
Fi
ne A
ggre
gate
, kg/
m3 (l
b/yd
3 ) 58
2 (9
81)
639
(107
6)
521
(877
) 51
1 (8
60)
518
(873
) Pe
a G
rave
l, kg
/m3 (l
b/yd
3 ) 24
5 (4
12)
182
(307
) 42
0 (7
08)
413
(695
) 41
9 (7
06)
Qua
ntiti
es o
f cem
ent,
wat
er, a
nd a
ggre
gate
s bas
ed o
n 2%
air
for b
atch
es 9
4 an
d 95
Q
uant
ities
of c
emen
t, w
ater
, and
agg
rega
tes b
ased
on
1.5%
air
for b
atch
es 1
87 to
189

111
Tab
le 2
.14
– M
ix P
ropo
rtio
ns-P
rogr
am II
- con
tinue
d B
atch
19
8 19
9 20
0 w
/c
0.45
0.
45
0.45
Agg
rega
te c
onte
nt %
70
70
70
C
emen
t, kg
/m3 (l
b/yd
3 ):
Typ
e I/I
I
Coa
rse-
grou
nd T
ype
II
37
4 (6
30)
37
4 (6
30)
37
4 (6
30)
Wat
er, k
g/m
3 (lb/
yd3 )
168
(283
) 16
8 (2
83)
168
(283
) C
oars
e A
ggre
gate
, kg/
m3 (l
b/yd
3 ):
19-
mm
(3/4
-in.)
Lim
esto
ne
1
9-m
m (3
/4-in
.) Q
uartz
ite
1
9-m
m (3
/4-in
.) G
rani
te
- 89
9 (1
514)
-
89
1 (1
500)
- -
- - 89
5 (1
508)
Fi
ne A
ggre
gate
, kg/
m3 (l
b/yd
3 ) 52
1 (8
77)
515
(868
) 51
8 (8
73)
Pea
Gra
vel,
kg/m
3 (lb/
yd3 )
420
(708
) 41
7 (7
02)
419
(706
) r
Qua
ntiti
es o
f cem
ent,
wat
er, a
nd a
ggre
gate
s bas
ed o
n 1.
5% a
i

112
Tab
le 2
.14
– M
ix P
ropo
rtio
ns-P
rogr
am II
- con
tinue
d B
atch
26
2 26
3 26
4
w/c
0.
45
0.45
0.
45
Agg
rega
te c
onte
nt %
68
.8
68.8
68
.8
Cem
ent,
kg/m
3 (lb/
yd3 ):
T
ype
I/II
31
7 (5
35)
31
7 (5
35)
31
7 (5
35)
Wat
er, k
g/m
3 (lb/
yd3 )
143
(241
) 14
3 (2
41)
143
(241
) C
oars
e A
ggre
gate
, kg/
m3 (l
b/yd
3 ):
19-
mm
(3/4
-in.)
Lim
esto
ne: r
etai
ned
on 9
.1 m
m (3
/8-in
.) si
eve
1
9-m
m (3
/4-in
.) Li
mes
tone
: pas
sing
thro
ugh
9.1
mm
(3/8
-in.)
siev
e
19-
mm
(3/4
-in.)
Qua
rtzite
: ret
aine
d on
9.1
mm
(3/8
-in.)
siev
e
19-
mm
(3/4
-in.)
Qua
rtzite
: pas
sing
thro
ugh
9.1
mm
(3/8
-in.)
siev
e
19-
mm
(3/4
-in.)
Gra
nite
: ret
aine
d on
9.1
mm
(3/8
-in.)
siev
e
19-
mm
(3/4
-in.)
Gra
nite
: pas
sing
thro
ugh
9.1
mm
(3/8
-in.)
siev
e
- - 53
9 (9
07)
321
(540
) - -
53
6 (9
02)
319
(537
) - - - -
- - - - 53
9 (9
07)
321
(540
)
Fine
Agg
rega
te, k
g/m
3 (lb/
yd3 )
315
(530
) 31
4 (5
28)
315
(530
) Pe
a G
rave
l, kg
/m3 (l
b/yd
3 ) 62
6 (1
055)
62
4 (1
050)
62
6 (1
055)
Su
perp
last
iciz
er, m
L/m
3 (oz/
yd3 )
786
(20.
3)a
786
(20.
3) a
786
(20.
3) a
Air-
entra
inin
g A
gent
, mL/
m3 (o
z/yd
3 ) 21
0 (5
.4) b
21
0 (5
.4) b
21
0 (5
.4) b
Sl
ump,
mm
(in.
) 70
(2.7
5)
76 (3
) 70
(2.7
5)
Air
Con
tent
, %
7.40
7.
40
7.40
Te
mpe
ratu
re, ˚
C (˚
F)
18 (6
4)
18 (6
5)
18 (6
5)
Qua
ntiti
es o
f cem
ent,
wat
er, a
nd a
ggre
gate
s bas
ed o
n 7
% a
ir a –
Adv
a 10
0 (G
race
Con
stru
ctio
n Pr
oduc
ts)
b – D
arav
air 1
000
)(G
race
Con
stru
ctio
n Pr
oduc
ts

113
Tabl
e 2.
15 –
Mix
Pro
port
ions
-Pro
gram
III
-Min
eral
adm
ixtu
res
Bat
ch
85
86
87
88
w/cm
0.
45
0.46
5 0.
469
0.47
0 A
ggre
gate
con
tent
%
70
70
70
70
Cem
entit
ious
mat
eria
l, kg
/m3 (l
b/yd
3 ):
Typ
e I/I
I
30%
Sla
g
30%
Fly
Ash
10%
Sili
ca F
ume
37
4 (6
30)
- - -
25
3 (4
26)
1
08 (1
82)
- -
25
1 (4
23)
- 10
7 (1
81)
-
32
2 (5
42)
- - 36
(60)
W
ater
, kg/
m3 (l
b/yd
3 ) 16
8 (2
83)
168
(283
) 16
8 (2
83)
168
(283
) Co
arse
Agg
rega
te, k
g/m
3 (lb/
yd3 ):
2
5-m
m (1
-in.)
Lim
esto
ne
1
9-m
m (3
/4-in
.) Li
mes
tone
36
4 (6
13)
635
(107
0)
36
4 (6
13)
635
(107
0)
36
4 (6
13)
635
(107
0)
36
4 (6
13)
635
(107
0)
Fine
Agg
rega
te, k
g/m
3 (lb/
yd3 )
639
(107
6)
639
(107
6)
639
(107
6)
639
(107
6)
Pea
Gra
vel,
kg/m
3 (lb/
yd3 )
182
(307
) 18
2 (3
07)
182
(307
) 18
2 (3
07)
Qua
ntiti
es o
f cem
ent,
wat
er, a
nd a
ggre
gate
s bas
ed o
n 2%
air

114
Tab
le 2
.15
– M
ix P
ropo
rtio
ns-P
rogr
am I
II-c
ontin
ued
Bat
ch
194
195
196
197
w/c
0.45
0.
465
0.46
9 0.
470
Agg
rega
te c
onte
nt %
70
70
70
70
C
emen
titio
us m
ater
ial,
kg/m
3 (lb/
yd3 ):
T
ype
I/II
3
0% S
lag
3
0% F
ly A
sh
1
0% S
ilica
Fum
e
37
4 (6
30)
- - -
25
3 (4
26)
1
08 (1
82)
- -
25
1 (4
23)
- 10
7 (1
81)
-
32
2 (5
42)
- - 36
(60)
W
ater
, kg/
m3 (l
b/yd
3 ) 16
8 (2
83)
168
(283
) 16
8 (2
83)
168
(283
) C
oars
e A
ggre
gate
, kg/
m3 (l
b/yd
3 ):
19-
mm
(3/4
-in.)
Lim
esto
ne
87
2 (1
469)
872
(146
9)
87
2 (1
469)
872
(146
9)
Fine
Agg
rega
te, k
g/m
3 (lb/
yd3 )
702
(118
3)
702
(118
3)
702
(118
3)
702
(118
3)
Pea
Gra
vel,
kg/m
3 (lb/
yd3 )
249
(420
) 24
9 (4
20)
249
(420
) 24
9 (4
20)
Supe
rpla
stic
izer
, mL/
m3 (o
z/yd
3 ) -
- -
699
(18)
a
Qua
ntiti
es o
f cem
ent,
wat
er, a
nd a
ggre
gate
s bas
ed o
n 1.
5% a
ir a –
Adv
a 10
0 (G
race
Con
stru
ctio
n Pr
oduc
ts)
Silic
a fu
me
prem
ixed
with
cem
ent

115
Tab
le 2
.15
– M
ix P
ropo
rtio
ns-P
rogr
am I
II-c
ontin
ued
Bat
ch
202
203
204
w/c
0.45
0.
45
0.47
0
Agg
rega
te c
onte
nt %
70
70
70
C
emen
titio
us m
ater
ial,
kg/m
3 (lb/
yd3 ):
T
ype
I/II
3
0% S
lag
3
0% F
ly A
sh
1
0% S
ilica
Fum
e
37
4 (6
30)
- - -
37
4 (6
30)
- - -
32
2 (5
42)
- - 36
(60)
W
ater
, kg/
m3 (l
b/yd
3 ) 16
8 (2
83)
168
(283
) 16
8 (2
83)
Coa
rse
Agg
rega
te, k
g/m
3 (lb/
yd3 ):
1
9-m
m (3
/4-in
.) Li
mes
tone
872
(146
9)
87
2 (1
469)
872
(146
9)
Fine
Agg
rega
te, k
g/m
3 (lb/
yd3 )
702
(118
3)
702
(118
3)
702
(118
3)
Pea
Gra
vel,
kg/m
3 (lb/
yd3 )
249
(420
) 24
9 (4
20)
249
(420
) Su
perp
last
iciz
er, m
L/m
3 (oz/
yd3 )
- 69
9 (1
8) a
699
(18)
a
Qua
ntiti
es o
f cem
ent,
wat
er, a
nd a
ggre
gate
s bas
ed o
n 1.
5% a
ir a –
Adv
a 10
0 (G
race
Con
stru
ctio
n Pr
oduc
ts)
Silic
a fu
me
prem
ixed
with
fine
agg
rega
te

Tab
le 2
.16
– M
ix P
ropo
rtio
ns-P
rogr
am I
V-C
urin
g Pe
riod
B
atch
16
5 16
6 20
1 20
7
116
w/c
0.45
0.
45
0.45
0.
45
Agg
rega
te c
onte
nt %
70
70
70
70
C
emen
t, kg
/m3 (l
b/yd
3 ):
Typ
e I/I
I
Coa
rse-
grou
nd T
ype
II
37
4 (6
30)
-
- 37
4 (6
30)
32
8 (5
52)
-
- 32
8 (5
52)
Wat
er, k
g/m
3 (lb/
yd3 )
168
(283
) 16
8 (2
83)
148
(249
) 14
8 (2
49)
Coa
rse
Agg
rega
te, k
g/m
3 (lb/
yd3 ):
2
5-m
m (1
-in.)
Lim
esto
ne
2
5-m
m (3
/4-in
.) Li
mes
tone
36
4 (6
13)
635
(107
0)
36
4 (6
13)
635
(107
0)
- 87
2 (1
469)
- 87
2 (1
469)
Fi
ne A
ggre
gate
, kg/
m3 (l
b/yd
3 ) 63
9 (1
076)
63
9 (1
076)
70
2 (1
183)
70
2 (1
183)
Pe
a G
rave
l, kg
/m3 (l
b/yd
3 ) 18
2 (3
07)
182
(307
) 24
9 (4
20)
249
(420
) A
ir-en
train
ing
Age
nt, m
L/m
3 (oz/
yd3 )
- -
186
(4.8
) a
96 (2
.5) a
Sl
ump,
mm
(in.
) -
- 32
(1.2
5)
32 (1
.25)
A
ir C
onte
nt, %
-
- 5.
50
4.75
Te
mpe
ratu
re, ˚
C (˚
F)
- -
25 (7
7)
22 (7
1)
Qua
ntiti
es o
f cem
ent,
wat
er, a
nd a
ggre
gate
s for
bat
ches
165
and
166
bas
ed o
n 2%
air
Qua
ntiti
es o
f cem
ent,
wat
er, a
nd a
ggre
gate
s for
bat
ches
201
and
207
bas
ed o
n 5%
air
a – D
arav
air 1
000
(Gra
ce C
onst
ruct
ion
Prod
ucts
)
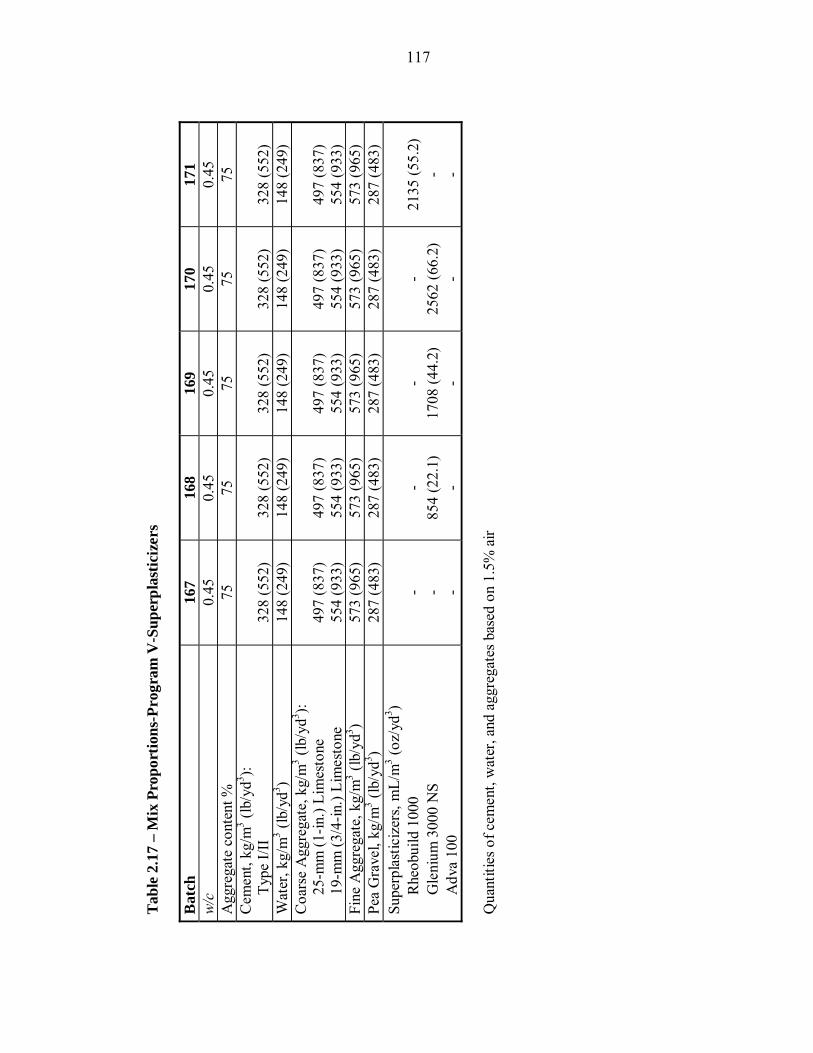
117
Tab
le 2
.17
– M
ix P
ropo
rtio
ns-P
rogr
am V
-Sup
erpl
astic
izer
s B
atch
16
7 16
8 16
9 17
0 17
1 w/
c 0.
45
0.45
0.
45
0.45
0.
45
Agg
rega
te c
onte
nt %
75
75
75
75
75
C
emen
t, kg
/m3 (l
b/yd
3 ):
Typ
e I/I
I
328
(552
)
328
(552
)
328
(552
)
328
(552
)
328
(552
) W
ater
, kg/
m3 (l
b/yd
3 ) 14
8 (2
49)
148
(249
) 14
8 (2
49)
148
(249
) 14
8 (2
49)
Coa
rse
Agg
rega
te, k
g/m
3 (lb/
yd3 ):
2
5-m
m (1
-in.)
Lim
esto
ne
1
9-m
m (3
/4-in
.) Li
mes
tone
49
7 (8
37)
554
(933
)
49
7 (8
37)
554
(933
)
49
7 (8
37)
554
(933
)
49
7 (8
37)
554
(933
)
49
7 (8
37)
554
(933
) Fi
ne A
ggre
gate
, kg/
m3 (l
b/yd
3 ) 57
3 (9
65)
573
(965
) 57
3 (9
65)
573
(965
) 57
3 (9
65)
Pea
Gra
vel,
kg/m
3 (lb/
yd3 )
287
(483
) 28
7 (4
83)
287
(483
) 28
7 (4
83)
287
(483
) Su
perp
last
iciz
ers,
mL/
m3 (o
z/yd
3 )
Rhe
obui
ld 1
000
G
leni
um 3
000
NS
A
dva
100
- - -
-
854
(22.
1)
-
-
1708
(44.
2)
-
-
2562
(66.
2)
-
2135
(55.
2)
- - Q
uant
ities
of c
emen
t, w
ater
, and
agg
rega
tes b
ased
on
1.5%
air
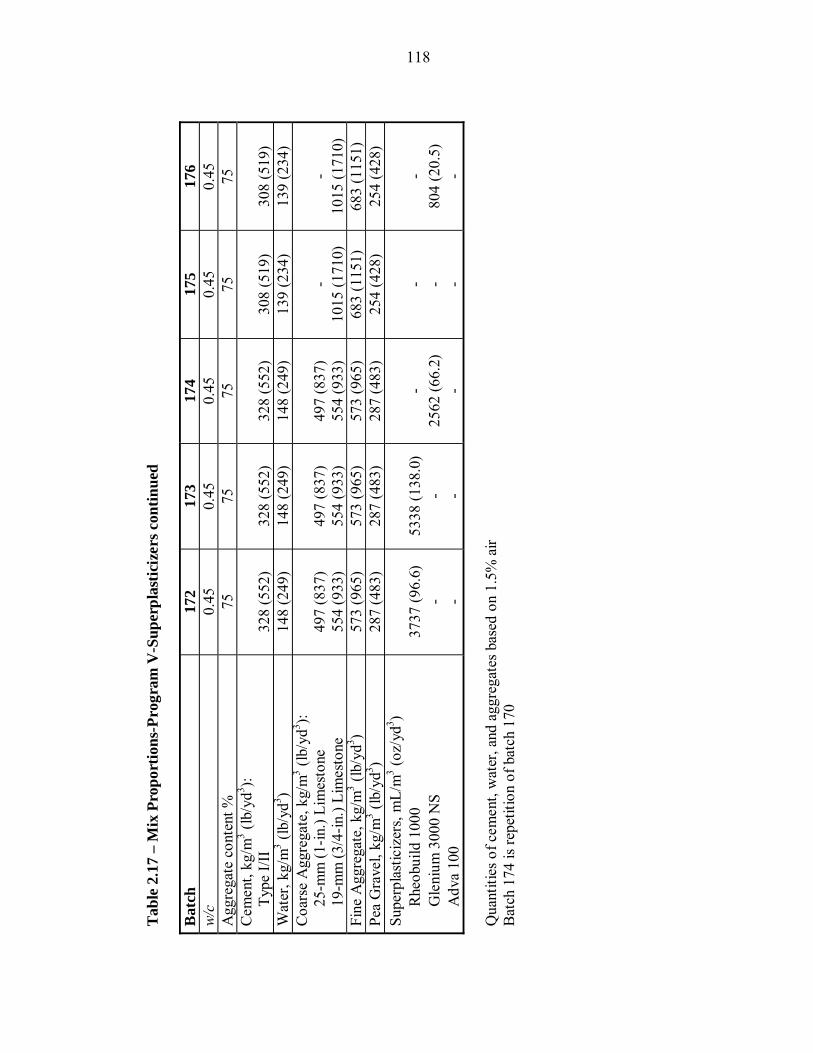
Tab
le 2
.17
– M
ix P
ropo
rtio
ns-P
rogr
am V
-Sup
erpl
astic
izer
s con
tinue
d B
atch
17
2 17
3 17
4 17
5 17
6
118
w/c
0.45
0.
45
0.45
0.
45
0.45
A
ggre
gate
con
tent
%
75
75
75
75
75
Cem
ent,
kg/m
3 (lb/
yd3 ):
T
ype
I/II
32
8 (5
52)
32
8 (5
52)
32
8 (5
52)
30
8 (5
19)
30
8 (5
19)
Wat
er, k
g/m
3 (lb/
yd3 )
148
(249
) 14
8 (2
49)
148
(249
) 13
9 (2
34)
139
(234
) C
oars
e A
ggre
gate
, kg/
m3 (l
b/yd
3 ):
25-
mm
(1-in
.) Li
mes
tone
19-
mm
(3/4
-in.)
Lim
esto
ne
49
7 (8
37)
554
(933
)
49
7 (8
37)
554
(933
)
49
7 (8
37)
554
(933
)
- 10
15 (1
710)
- 10
15 (1
710)
Fi
ne A
ggre
gate
, kg/
m3 (l
b/yd
3 ) 57
3 (9
65)
573
(965
) 57
3 (9
65)
683
(115
1)
683
(115
1)
Pea
Gra
vel,
kg/m
3 (lb/
yd3 )
287
(483
) 28
7 (4
83)
287
(483
) 25
4 (4
28)
254
(428
) Su
perp
last
iciz
ers,
mL/
m3 (o
z/yd
3 )
Rhe
obui
ld 1
000
G
leni
um 3
000
NS
A
dva
100
3737
(96.
6)
- -
5338
(138
.0)
- -
-
2562
(66.
2)
-
- - -
-
804
(20.
5)
- Q
uant
ities
of c
emen
t, w
ater
, and
agg
rega
tes b
ased
on
1.5%
air
Bat
ch 1
74 is
repe
titio
n of
bat
ch 1
70

Tab
le 2
.17–
Mix
Pro
port
ions
-Pro
gram
V-S
uper
plas
ticiz
ers c
ontin
ued
Bat
ch
177
178
179
180
181
119
w/c
0.45
0.
45
0.45
0.
45
0.45
A
ggre
gate
con
tent
%
75
75
75
75
75
Cem
ent,
kg/m
3 (lb/
yd3 ):
T
ype
I/II
30
8 (5
19)
30
8 (5
19)
30
8 (5
19)
30
8 (5
19)
30
8 (5
19)
Wat
er, k
g/m
3 (lb/
yd3 )
139
(234
) 13
9 (2
34)
139
(234
) 13
9 (2
34)
139
(234
) C
oars
e A
ggre
gate
, kg/
m3 (l
b/yd
3 ):
25-
mm
(1-in
.) Li
mes
tone
19-
mm
(3/4
-in.)
Lim
esto
ne
- 10
15 (1
710)
- 10
15 (1
710)
- 10
15 (1
710)
- 10
15 (1
710)
- 10
15 (1
710)
Fi
ne A
ggre
gate
, kg/
m3 (l
b/yd
3 ) 68
3 (1
151)
68
3 (1
151)
68
3 (1
151)
68
3 (1
151)
68
3 (1
151)
Pe
a G
rave
l, kg
/m3 (l
b/yd
3 ) 25
4 (4
28)
254
(428
) 25
4 (4
28)
254
(428
) 25
4 (4
28)
Supe
rpla
stic
izer
s, m
L/m
3 (oz/
yd3 )
R
heob
uild
100
0
Gle
nium
300
0 N
S
Adv
a 10
0
-
1608
(40.
9)
-
-
2412
(61.
4)
-
2010
(51.
2)
- -
35
18 (8
9.5)
- -
5025
(127
.9)
- - Q
uant
ities
of c
emen
t, w
ater
, and
agg
rega
tes b
ased
on
1.5%
air

Tab
le 2
.17
– M
ix P
ropo
rtio
ns-P
rogr
am V
-Sup
erpl
astic
izer
s con
tinue
d B
atch
18
2 18
3 18
4 18
5 18
6
120
w/c
0.45
0.
45
0.45
0.
45
0.45
A
ggre
gate
con
tent
%
75
75
75
75
75
Cem
ent,
kg/m
3 (lb/
yd3 ):
T
ype
I/II
32
8 (5
52)
30
8 (5
19)
30
8 (5
19)
30
8 (5
19)
30
8 (5
19)
Wat
er, k
g/m
3 (lb/
yd3 )
148
(249
) 13
9 (2
34)
139
(234
) 13
9 (2
34)
139
(234
) C
oars
e A
ggre
gate
, kg/
m3 (l
b/yd
3 ):
25-
mm
(1-in
.) Li
mes
tone
19-
mm
(3/4
-in.)
Lim
esto
ne
49
7 (8
37)
554
(933
)
- 10
15 (1
710)
- 10
15 (1
710)
- 10
15 (1
710)
- 10
15 (1
710)
Fi
ne A
ggre
gate
, kg/
m3 (l
b/yd
3 ) 57
3 (9
65)
683
(115
1)
683
(115
1)
683
(115
1)
683
(115
1)
Pea
Gra
vel,
kg/m
3 (lb/
yd3 )
287
(483
) 25
4 (4
28)
254
(428
) 25
4 (4
28)
254
(428
) Su
perp
last
iciz
ers,
mL/
m3 (o
z/yd
3 )
Rhe
obui
ld 1
000
G
leni
um 3
000
NS
A
dva
100
5025
(127
.9)
- -
- - -
- -
602
(15.
3)
- -
1307
(33.
3)
- -
2010
(51.
2)
Qua
ntiti
es o
f cem
ent,
wat
er, a
nd a
ggre
gate
s bas
ed o
n 1.
5% a
ir B
atch
182
is re
petit
ion
of b
atch
181

121
Tab
le 2
.17
– M
ix P
ropo
rtio
ns-P
rogr
am V
-Sup
erpl
astic
izer
s con
tinue
d B
atch
19
0 19
1 19
2 19
3 w/
c 0.
45
0.45
0.
45
0.45
Agg
rega
te c
onte
nt %
75
75
75
75
C
emen
t, kg
/m3 (l
b/yd
3 ):
Typ
e I/I
I
308
(519
)
308
(519
)
308
(519
)
308
(519
) W
ater
, kg/
m3 (l
b/yd
3 ) 13
9 (2
34)
139
(234
) 13
9 (2
34)
139
(234
) C
oars
e A
ggre
gate
, kg/
m3 (l
b/yd
3 ):
25-
mm
(1-in
.) Li
mes
tone
19-
mm
(3/4
-in.)
Lim
esto
ne
- 10
15 (1
710)
- 10
15 (1
710)
- 10
15 (1
710)
- 10
15 (1
710)
Fi
ne A
ggre
gate
, kg/
m3 (l
b/yd
3 ) 68
3 (1
151)
68
3 (1
151)
68
3 (1
151)
68
3 (1
151)
Pe
a G
rave
l, kg
/m3 (l
b/yd
3 ) 25
4 (4
28)
254
(428
) 25
4 (4
28)
254
(428
) Su
perp
last
iciz
ers,
mL/
m3 (o
z/yd
3 )
Rhe
obui
ld 1
000
G
leni
um 3
000
NS
A
dva
100
- - -
- -
602
(15.
3)
- -
1307
(33.
3)
- -
2010
(51.
2)
Qua
ntiti
es o
f cem
ent,
wat
er, a
nd a
ggre
gate
s bas
ed o
n 1.
5% a
ir B
atch
es 1
90, 1
91, 1
92, a
nd 1
93 a
re re
petit
ions
of b
atch
es 1
84, 1
85,1
86 a
nd 1
83 re
spec
tivel
y

122
Tab
le 2
.17
– M
ix P
ropo
rtio
ns-P
rogr
am V
-Sup
erpl
astic
izer
s con
tinue
d B
atch
20
8 20
9 21
0 21
1 w/
c 0.
45
0.45
0.
45
0.45
Agg
rega
te c
onte
nt %
70
70
70
70
C
emen
t, kg
/m3 (l
b/yd
3 ):
Typ
e I/I
I
374
(630
)
374
(630
)
374
(630
)
374
(630
) W
ater
, kg/
m3 (l
b/yd
3 ) 16
8 (2
83)
168
(283
) 16
8 (2
83)
168
(283
) C
oars
e A
ggre
gate
, kg/
m3 (l
b/yd
3 ):
25-
mm
(1-in
.) Li
mes
tone
19-
mm
(3/4
-in.)
Lim
esto
ne
- 92
1 (1
551)
- 92
1 (1
551)
- 92
1 (1
551)
- 92
1 (1
551)
Fi
ne A
ggre
gate
, kg/
m3 (l
b/yd
3 ) 66
6 (1
122)
66
6 (1
122)
66
6 (1
122)
66
6 (1
122)
Pe
a G
rave
l, kg
/m3 (l
b/yd
3 ) 23
6 (3
97)
236
(397
) 23
6 (3
97)
236
(397
) Su
perp
last
iciz
ers,
mL/
m3 (o
z/yd
3 )
Rhe
obui
ld 1
000
G
leni
um 3
000
NS
A
dva
100
- - -
- -
360
(9.2
)
-
360
(9.2
) -
36
0 (9
.2)
- - Sl
ump,
mm
(in.
) 57
(2.2
5)
70 (2
.75)
76
(3.0
0)
83 (3
.25)
Te
mpe
ratu
re, ˚
C (˚
F)
20.6
(69)
20
(68)
20
(68)
20
(68)
Q
uant
ities
of c
emen
t, w
ater
, and
agg
rega
tes b
ased
on
1.5%
air
Supe
rpla
stic
izer
dos
ages
for 3
.0 ±
0.5
in. s
lum
p

123
Tab
le 2
.17
– M
ix P
ropo
rtio
ns-P
rogr
am V
-Sup
erpl
astic
izer
s con
tinue
d B
atch
24
9 25
6 25
9 26
0 w/
c 0.
45
0.45
0.
45
0.45
A
ggre
gate
con
tent
%
67.8
67
.8
67.8
63
.5
Cem
ent,
kg/m
3 (lb/
yd3 ):
T
ype
I/II
31
8 (5
35)
37
4 (6
30)
37
4 (6
30)
37
4 (6
30)
Wat
er, k
g/m
3 (lb/
yd3 )
143
(241
) 16
8 (2
83)
168
(283
) 16
8 (2
83)
Coa
rse
Agg
rega
te, k
g/m
3 (lb/
yd3 ):
19-m
m (3
/4-in
.) Li
mes
tone
: ret
aine
d on
9.1
mm
(3/8
-in.).
sie
ve
19-m
m (3
/4-in
.) Li
mes
tone
: pas
sing
thro
ugh
9.1
mm
(3/8
-in.)
siev
e
43
9 (7
40)
325
(548
)
92
1 (1
551)
921
(155
1)
41
2 (6
93)
305
(514
)
Fine
Agg
rega
te, k
g/m
3 (lb/
yd3 )
438
(737
) 66
6 (1
122)
66
6 (1
122)
41
0 (6
91)
Pea
Gra
vel,
kg/m
3 (lb/
yd3 )
578
(974
) 23
6 (3
97)
236
(397
) 54
2 (9
12)
Supe
rpla
stic
izer
s, m
L/m
3 (oz/
yd3 )
R
heob
uild
100
0
Gle
nium
300
0 N
S
Adv
a 10
0
-
1048
(26.
7)
-
1572
(40)
- -
- -
851
(28.
4)
- - -
Air-
entra
inin
g A
gent
, mL/
m3 (o
z/yd
3 ) 16
4 (4
.2)
393
(10)
26
2 (6
.7)
308
(7.8
) A
ir C
onte
nt, %
8.
15
7.65
8.
40
7.65
Sl
ump,
mm
(in.
) 89
(3.5
0)
64 (2
.50)
70
(2.7
5)
76 (3
.00)
Te
mpe
ratu
re, ˚
C (˚
F)
22.8
(73)
21
.1 (7
0)
21.1
(70)
23
.8 (7
5)
Qua
ntiti
es o
f cem
ent,
wat
er, a
nd a
ggre
gate
s bas
ed o
n 8%
air
Supe
rpla
stic
izer
dos
ages
for 3
.0 ±
0.5
in. s
lum
p fo
r bat
ches
249
, 256
and
259
A
ggre
gate
con
tent
for 3
.0 ±
0.5
in. s
lum
p fo
r bat
ch 2
60
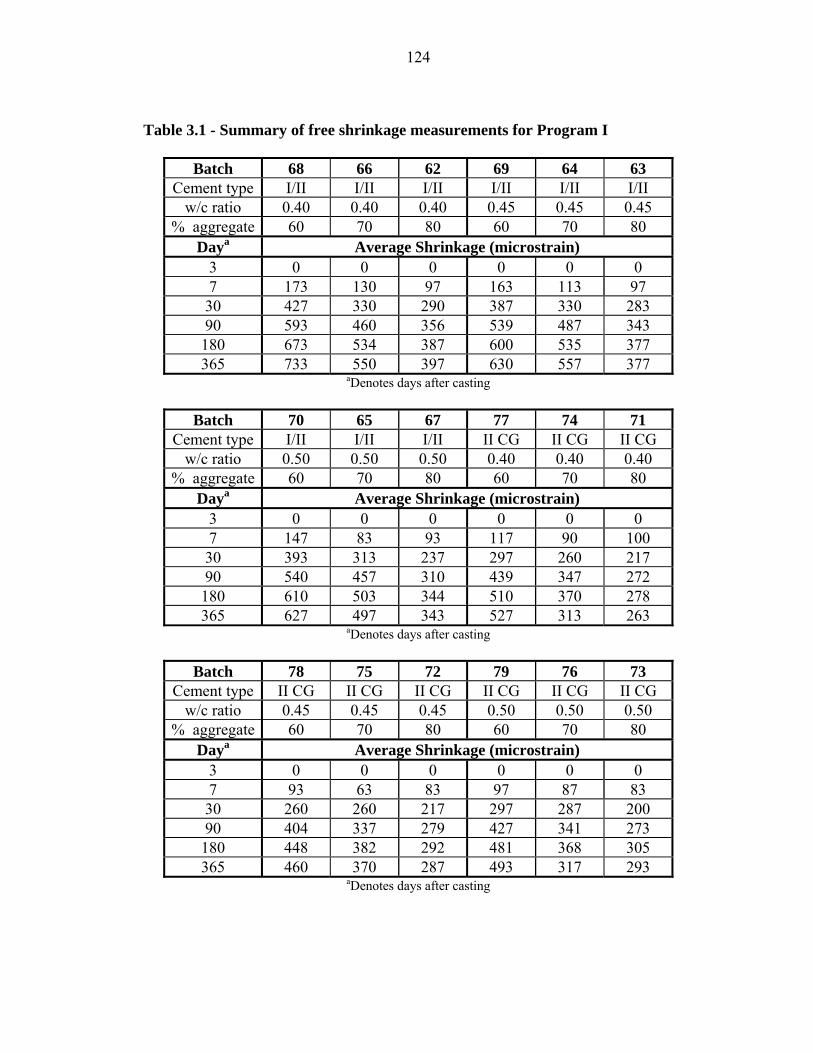
124
Table 3.1 - Summary of free shrinkage measurements for Program I
Batch 68 66 62 69 64 63 Cement type I/II I/II I/II I/II I/II I/II
w/c ratio 0.40 0.40 0.40 0.45 0.45 0.45 % aggregate 60 70 80 60 70 80
Daya Average Shrinkage (microstrain) 3 0 0 0 0 0 0 7 173 130 97 163 113 97 30 427 330 290 387 330 283 90 593 460 356 539 487 343 180 673 534 387 600 535 377 365 733 550 397 630 557 377
aDenotes days after casting
Batch 70 65 67 77 74 71 Cement type I/II I/II I/II II CG II CG II CG
w/c ratio 0.50 0.50 0.50 0.40 0.40 0.40 % aggregate 60 70 80 60 70 80
Daya Average Shrinkage (microstrain) 3 0 0 0 0 0 0 7 147 83 93 117 90 100 30 393 313 237 297 260 217 90 540 457 310 439 347 272 180 610 503 344 510 370 278 365 627 497 343 527 313 263
aDenotes days after casting
Batch 78 75 72 79 76 73 Cement type II CG II CG II CG II CG II CG II CG
w/c ratio 0.45 0.45 0.45 0.50 0.50 0.50 % aggregate 60 70 80 60 70 80
Daya Average Shrinkage (microstrain) 3 0 0 0 0 0 0 7 93 63 83 97 87 83 30 260 260 217 297 287 200 90 404 337 279 427 341 273 180 448 382 292 481 368 305 365 460 370 287 493 317 293
aDenotes days after casting
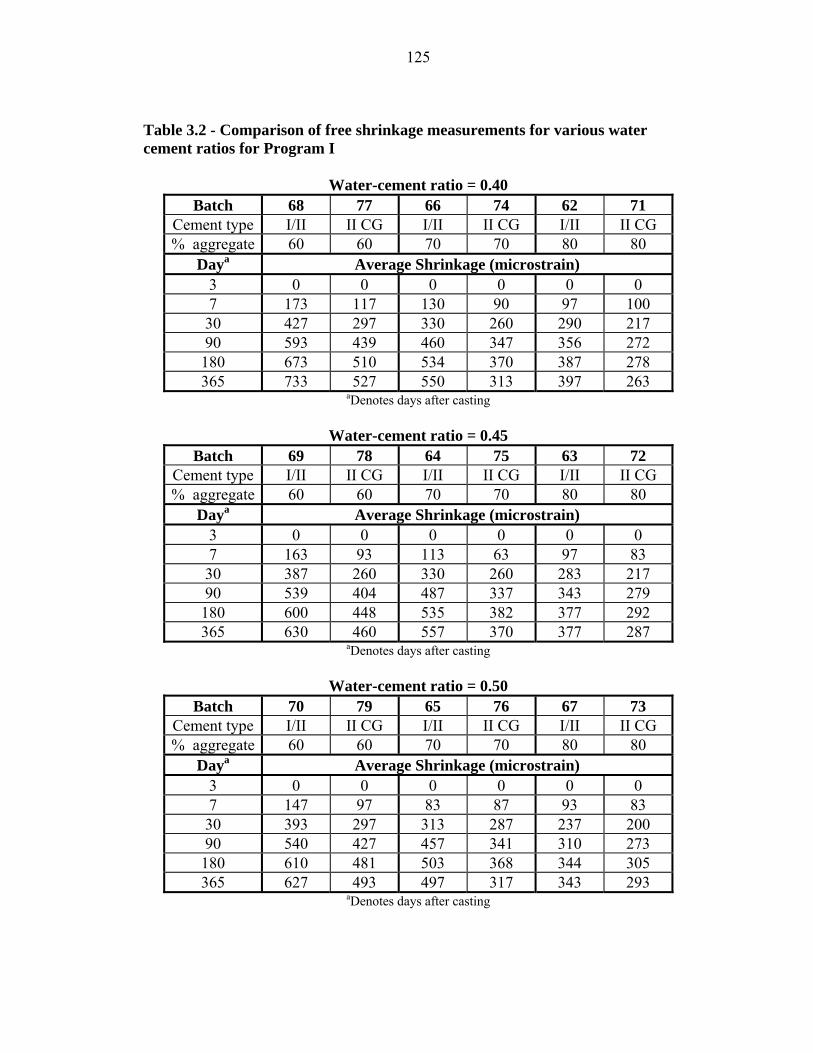
125
Table 3.2 - Comparison of free shrinkage measurements for various water cement ratios for Program I
Water-cement ratio = 0.40
Batch 68 77 66 74 62 71 Cement type I/II II CG I/II II CG I/II II CG % aggregate 60 60 70 70 80 80
Daya Average Shrinkage (microstrain) 3 0 0 0 0 0 0 7 173 117 130 90 97 100 30 427 297 330 260 290 217 90 593 439 460 347 356 272 180 673 510 534 370 387 278 365 733 527 550 313 397 263
aDenotes days after casting
Water-cement ratio = 0.45 Batch 69 78 64 75 63 72
Cement type I/II II CG I/II II CG I/II II CG % aggregate 60 60 70 70 80 80
Daya Average Shrinkage (microstrain) 3 0 0 0 0 0 0 7 163 93 113 63 97 83 30 387 260 330 260 283 217 90 539 404 487 337 343 279 180 600 448 535 382 377 292 365 630 460 557 370 377 287
aDenotes days after casting
Water-cement ratio = 0.50 Batch 70 79 65 76 67 73
Cement type I/II II CG I/II II CG I/II II CG % aggregate 60 60 70 70 80 80
Daya Average Shrinkage (microstrain) 3 0 0 0 0 0 0 7 147 97 83 87 93 83 30 393 297 313 287 237 200 90 540 427 457 341 310 273 180 610 481 503 368 344 305 365 627 493 497 317 343 293
aDenotes days after casting

126
Table 3.3a - Summary of free shrinkage measurements for Program II (Non-air-entrained Batches)
Batch 94 95
Aggregate Type Quartzite Limestone
Daya Average Shrinkage (microstrain)
3 0 0 7 80 80 30 173 227 90 314 378 180 307 387 365 333 407
aDenotes days after casting
Batch 187 188 189 Aggregate
Type Quartzite Limestone Granite
Daya Average Shrinkage (microstrain) 3 -83 -63 -53 7 0 20 27 30 217 237 237 90 310 323 320 180 350 387 350 365 413 427 400 aDenotes days after casting
Batch 198 199 200
Aggregate Type Quartzite Limestone Granite
Daya Average Shrinkage (microstrain) 3 -10 -7 -33 7 130 107 107 30 340 320 283 90 470 447 403 180 473 460 423 365 553 540 493 aDenotes days after casting
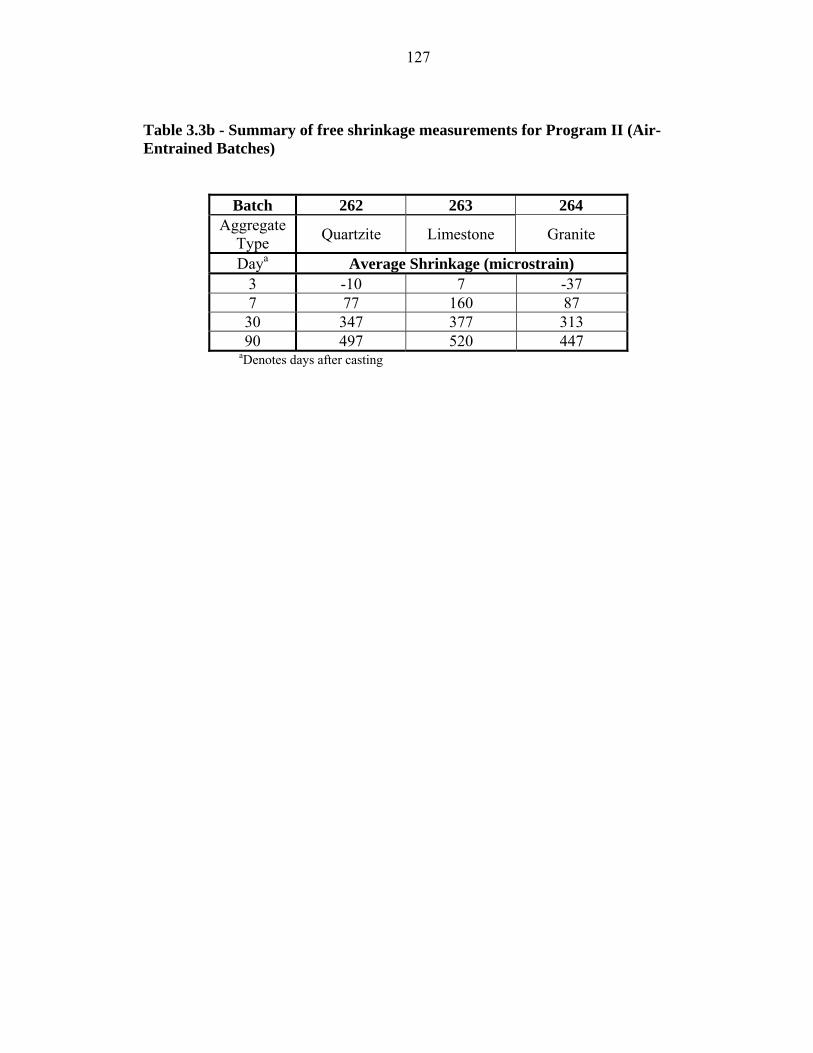
127
Table 3.3b - Summary of free shrinkage measurements for Program II (Air-Entrained Batches)
Batch 262 263 264 Aggregate
Type Quartzite Limestone Granite
Daya Average Shrinkage (microstrain) 3 -10 7 -37 7 77 160 87 30 347 377 313 90 497 520 447
aDenotes days after casting

128
Table 3.4 - Summary of free shrinkage measurements for Program III
Batch 85 86 87 88 Aggregate
Type Control Slag Class C Fly Ash Silica Fume
Daya Average Shrinkage (microstrain) 3 0 0 0 0 7 110 107 113 107 30 303 333 337 293 90 418 420 443 423 180 431 426 462 419 365 402 435 478 441
aDenotes days after casting
Batch 194 195 196 197 Aggregate
Type Control Slag Class C Fly Ash Silica Fume
Daya Average Shrinkage (microstrain) 3 -40 -50 -30 -67 7 90 67 77 37 30 293 313 347 257 90 400 427 487 390 180 443 427 477 393 365 503 497 553 460
aDenotes days after casting
Batch 202 203 204 Aggregate
Type Control Superplasticized Control Silica Fume
Daya Average Shrinkage (microstrain) 3 -20 -17 13 7 107 110 140 30 330 327 377 90 453 457 470 180 480 490 487 365 540 547 543
aDenotes days after casting

129
Table 3.5 - Summary of free shrinkage measurements for Program IV
Batch 165-3d 165-7d 165-14d 165-28d 166-3d 166-7d 166-14d 166-28dCement
type I/II II CG
Cure (days) 3 7 14 28 3 7 14 28
Daya Average Shrinkage (microstrain) 3 0 0 0 0 0 0 0 0 7 83 -3 -30 -43 57 -7 -13 -37 14 217 180 0 -17 173 93 -13 -60 28 287 270 143 -33 267 243 180 -33 30 293 270 157 0 313 250 193 60 90 473 492 463 370 473 423 363 323
180 547 586 533 471 557 513 457 417 365 527 560 510 467 517 510 440 400
aDenotes days after casting
Batch 201-3d 201-7d 201-14d 201-28d 207-3d 207-7d 207-14d 207-28dCement
type I/II II CG
Cure (days) 3 7 14 28 3 7 14 28
Daya Average Shrinkage (microstrain) 3 23 10 13 20 -7 -10 -13 -20 7 183 -7 -10 -10 83 -17 -23 -37 14 323 167 -10 -10 150 70 -27 -37 28 483 363 227 -20 257 207 100 -37 30 483 337 243 -10 257 213 117 -3 90 607 452 423 330 363 367 323 333
180 630 473 437 380 397 400 360 350 365 697 520 497 440 440 457 417 400
aDenotes days after casting

130
Table 3.6 - Summary of free shrinkage measurements for based on drying period for Program IV
Batch 165-3d 165-7d 165-14d 165-28d 166-3d 166-7d 166-14d 166-28d
Cement type I/II II CG
Cure (days) 3 7 14 28 3 7 14 28
Daya Average Shrinkage (microstrain) 3 53 70 63 87 57 40 -17 17 7 140 180 63 110 103 93 67 60 30 333 337 320 227 302 270 237 193 90 480 487 480 423 472 437 404 388
180 543 583 529 465 556 513 457 411 300 540 573 532 466 537 505 458 415
aDenotes days after drying began
Batch 201-3d 201-7d 201-14d 201-28d 207-3d 207-7d 207-14d 207-28d
Cement type I/II II CG
Cure (days) 3 7 14 28 3 7 14 28
Daya Average Shrinkage (microstrain) 3 143 80 57 20 57 47 7 0 7 250 167 103 70 127 70 63 27 30 500b 367 340 275 279 b 280 220 193 90 632 b 456 b 437 370 376 b 383 340 333
180 634 b 478 b 445 b 386 b 400 b 407 b 377 b 378 b
300 695 b 519 b 493 b 440 b 450 b 460 b 423 b 407 b
aDenotes days after drying began bDenotes interpolated value

131
Table 3.7a - Summary of free shrinkage measurement for Program V (Non-air-entrained concrete) Batch 167 168 169 170 174b
Superplasticizer (Dosage)
Control (None)
Glenium 3000NS (Low)
Glenium 3000NS
(Medium)
Glenium 3000NS (High)
Glenium 3000NS (High)
Daya Average Shrinkage (microstrain) 3 0 0 0 0 0 7 53 60 30 23 117 30 237 267 280 193 233 90 387 393 333 310 437 180 457 460 434 357 480 365 413 430 387 293 447
aDenotes days after casting bBatch 174 was a replication of Batch 170
Batch 171 172 173 Superplasticizer
(Dosage) Rheobuild 1000
(Low) Rheobuild 1000
(Medium) Rheobuild 1000
(High) Daya Average Shrinkage (microstrain)
3 0 0 0 7 97 100 127 30 210 217 260 90 397 407 457 180 467 457 513 365 430 423 467
aDenotes days after casting
Batch 175 176 177 178
Superplasticizer (Dosage)
Control (None)
Glenium 3000NS (Low)
Glenium 3000NS
(Medium)
Glenium 3000NS (High)
Daya Average Shrinkage (microstrain) 3 -17 -33 -20 10 7 0 87 3 33 30 200 300 257 260 90 343 447 393 383 180 333 447 403 370 365 363 463 413 386
aDenotes days after casting
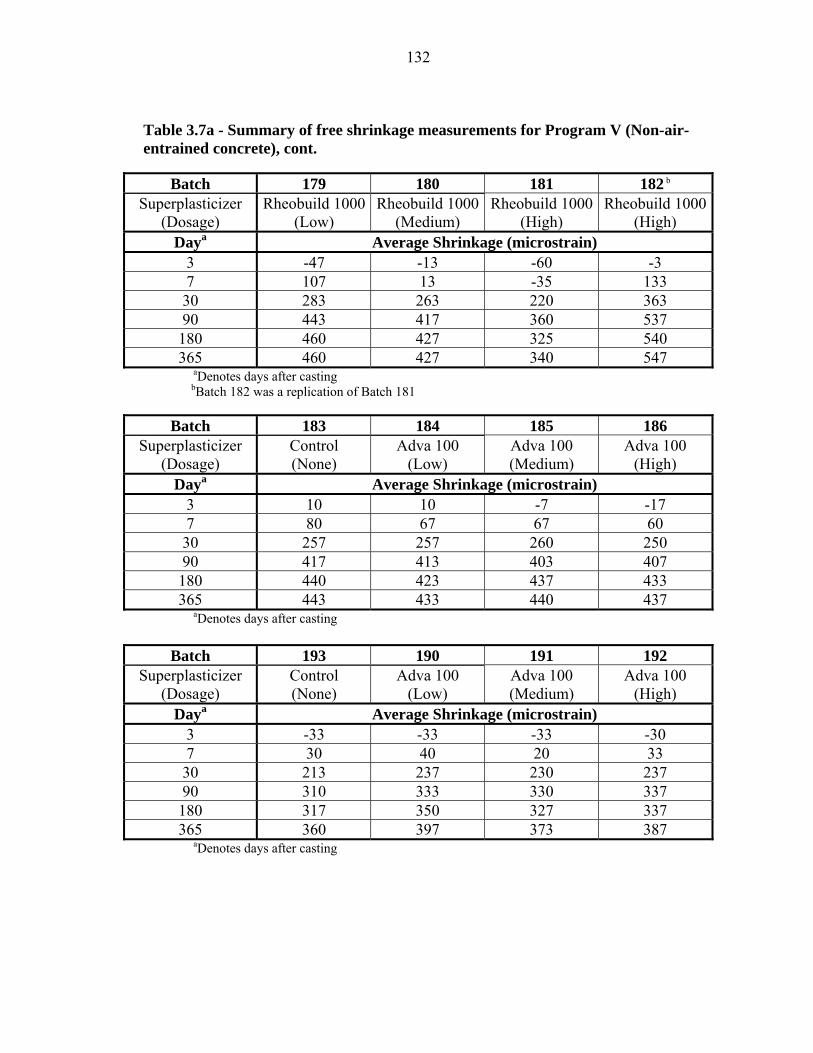
132
Table 3.7a - Summary of free shrinkage measurements for Program V (Non-air-entrained concrete), cont.
Batch 179 180 181 182 b
Superplasticizer (Dosage)
Rheobuild 1000(Low)
Rheobuild 1000(Medium)
Rheobuild 1000 (High)
Rheobuild 1000(High)
Daya Average Shrinkage (microstrain) 3 -47 -13 -60 -3 7 107 13 -35 133 30 283 263 220 363 90 443 417 360 537 180 460 427 325 540 365 460 427 340 547
aDenotes days after casting bBatch 182 was a replication of Batch 181
Batch 183 184 185 186 Superplasticizer
(Dosage) Control (None)
Adva 100 (Low)
Adva 100 (Medium)
Adva 100 (High)
Daya Average Shrinkage (microstrain) 3 10 10 -7 -17 7 80 67 67 60 30 257 257 260 250 90 417 413 403 407 180 440 423 437 433 365 443 433 440 437
aDenotes days after casting
Batch 193 190 191 192 Superplasticizer
(Dosage) Control (None)
Adva 100 (Low)
Adva 100 (Medium)
Adva 100 (High)
Daya Average Shrinkage (microstrain) 3 -33 -33 -33 -30 7 30 40 20 33 30 213 237 230 237 90 310 333 330 337 180 317 350 327 337 365 360 397 373 387
aDenotes days after casting

133
Table 3.7a - Summary of free shrinkage measurements for Program V (Non-air-entrained concrete), cont.
Batch 208 209 210 211 Superplasticizer
Control
Adva 100
Glenium 3000NS
Rheobuild 1000
Daya Average Shrinkage (microstrain)
3 -17 -13 -10 -10 7 83 93 87 107 30 330 357 367 357 90 467 500 507 520 180 507 550 560 573 365 547 590 593 630
aDenotes days after casting Table 3.7b - Summary of Free Shrinkage Measurement from Program V for air-entrained batches
Batch 260 249 256 259 Superplasticizer
Control
Glenium 3000NS
Rheobuild 1000
Adva 100
Daya Average Shrinkage (microstrain)
3 0 30 -33 3 7 187 207 150 187 30 487 523 473 497 90 657 673 600 653 180 700 693 660 697 365 757 737 703 737
aDenotes days after casting

134
Table 3.8-Program I Student’s t-test results for concretes with different water-cement ratios containing Type I/II cement and 60% aggregate content, 30, 180, and 365 days after casting
30 days Average
Shrinkage (με)
0.45 0.50 427 0.40 90 80 387 0.45 N 393 0.50
180 days Average
Shrinkage (με)
0.45 0.50 673 0.40 95 90 600 0.45 N 610 0.50
365 days Average
Shrinkage (με)
0.45 0.50 733 0.40 Y 95 630 0.45 N 627 0.50
Note: “Y” indicates a significant statistical difference between the two samples at a confidence level of 95% (α=0.05) “N” indicates that there is no significant statistical difference between two samples at the lowest confidence level, 80% (α=0.20) Significant statistical differences at confidence levels at, but not exceeding 80% and 90% are indicated by “80” and “90” respectively.

135
Table 3.9-Program I Student’s t-test results for concretes with different water-cement ratios containing Type I/II cement and 70% aggregate content, 30, 180, and 365 days after casting
30 days Average
Shrinkage (με)
0.45 0.50 330 0.40 N N 330 0.45 N 313 0.50
180 days Average
Shrinkage (με)
0.45 0.50 534 0.40 N N 535 0.45 80 503 0.50
365 days Average
Shrinkage (με)
0.45 0.50 550 0.40 N 80 557 0.45 80 497 0.50
Note: “Y” indicates a significant statistical difference between the two samples at a confidence level of 95% (α=0.05) “N” indicates that there is no significant statistical difference between two samples at the lowest confidence level, 80% (α=0.20) Significant statistical differences at confidence levels at, but not exceeding 80% and 90% are indicated by “80” and “90” respectively.
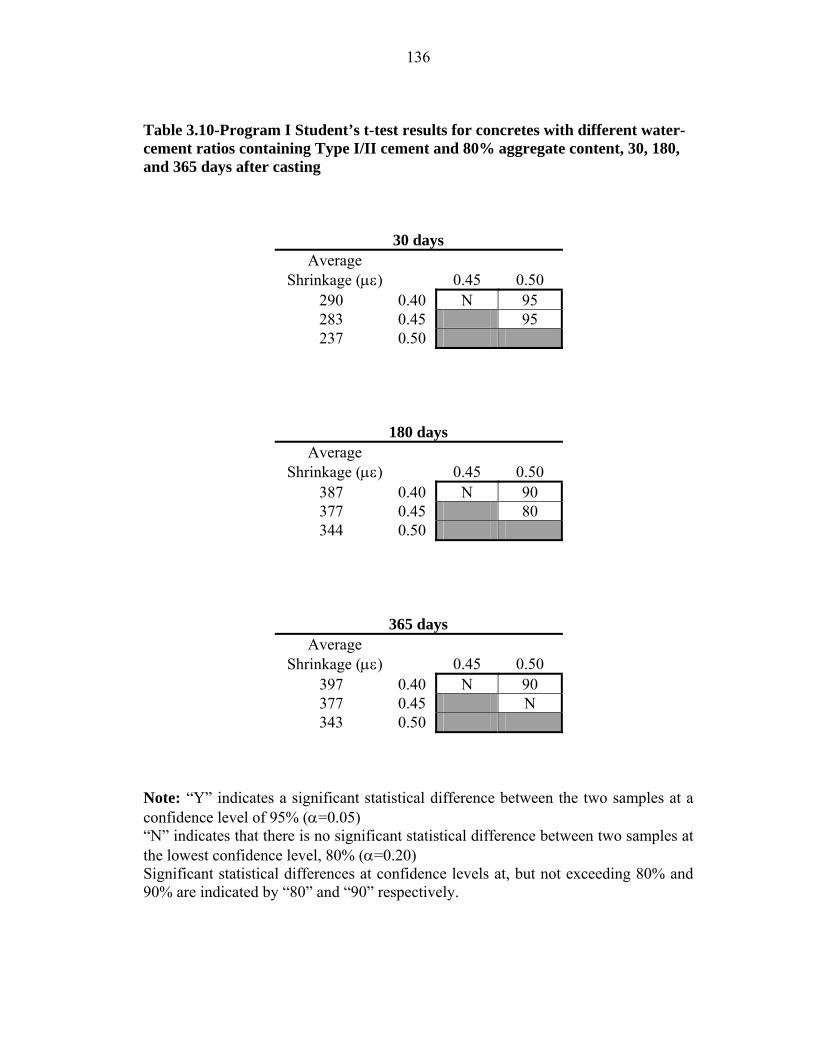
136
Table 3.10-Program I Student’s t-test results for concretes with different water-cement ratios containing Type I/II cement and 80% aggregate content, 30, 180, and 365 days after casting
30 days Average
Shrinkage (με)
0.45 0.50 290 0.40 N 95 283 0.45 95 237 0.50
180 days Average
Shrinkage (με)
0.45 0.50 387 0.40 N 90 377 0.45 80 344 0.50
365 days Average
Shrinkage (με)
0.45 0.50 397 0.40 N 90 377 0.45 N 343 0.50
Note: “Y” indicates a significant statistical difference between the two samples at a confidence level of 95% (α=0.05) “N” indicates that there is no significant statistical difference between two samples at the lowest confidence level, 80% (α=0.20) Significant statistical differences at confidence levels at, but not exceeding 80% and 90% are indicated by “80” and “90” respectively.

137
Table 3.11-Program I Student’s t-test results for concretes with different water-cement ratios containing Type II coarse-ground cement and 60% aggregate content, 30, 180, and 365 days after casting
30 days Average
Shrinkage (με)
0.45 0.50 297 0.40 Y N 260 0.45 95 297 0.50
180 days Average
Shrinkage (με)
0.45 0.50 510 0.40 Y 80 448 0.45 80 481 0.50
365 days Average
Shrinkage (με)
0.45 0.50 527 0.40 Y 90 460 0.45 95 493 0.50
Note: “Y” indicates a significant statistical difference between the two samples at a confidence level of 95% (α=0.05) “N” indicates that there is no significant statistical difference between two samples at the lowest confidence level, 80% (α=0.20) Significant statistical differences at confidence levels at, but not exceeding 80% and 90% are indicated by “80” and “90” respectively.

138
Table 3.12-Program I Student’s t-test results for concretes with different water-cement ratios containing Type II coarse-ground cement and 70% aggregate content, 30, 180, and 365 days after casting
30 days Average
Shrinkage (με)
0.45 0.50 260 0.40 95 95 330 0.45 N 313 0.50
180 days Average
Shrinkage (με)
0.45 0.50 370 0.40 Y Y 535 0.45 80 503 0.50
365 days Average
Shrinkage (με)
0.45 0.50 313 0.40 Y Y 557 0.45 80 497 0.50
Note: “Y” indicates a significant statistical difference between the two samples at a confidence level of 95% (α=0.05) “N” indicates that there is no significant statistical difference between two samples at the lowest confidence level, 80% (α=0.20) Significant statistical differences at confidence levels at, but not exceeding 80% and 90% are indicated by “80” and “90” respectively.

139
Table 3.13-Program I Student’s t-test results for concretes with different water-cement ratios containing Type II coarse-ground cement and 80% aggregate content, 30, 180, and 365 days after casting
30 days Average
Shrinkage (με)
0.45 0.50 217 0.40 N 90 217 0.45 80 200 0.50
180 days Average
Shrinkage (με)
0.45 0.50 278 0.40 N 80 292 0.45 N 305 0.50
365 days Average
Shrinkage (με)
0.45 0.50 263 0.40 N N 287 0.45 N 293 0.50
Note: “Y” indicates a significant statistical difference between the two samples at a confidence level of 95% (α=0.05) “N” indicates that there is no significant statistical difference between two samples at the lowest confidence level, 80% (α=0.20) Significant statistical differences at confidence levels at, but not exceeding 80% and 90% are indicated by “80” and “90” respectively.
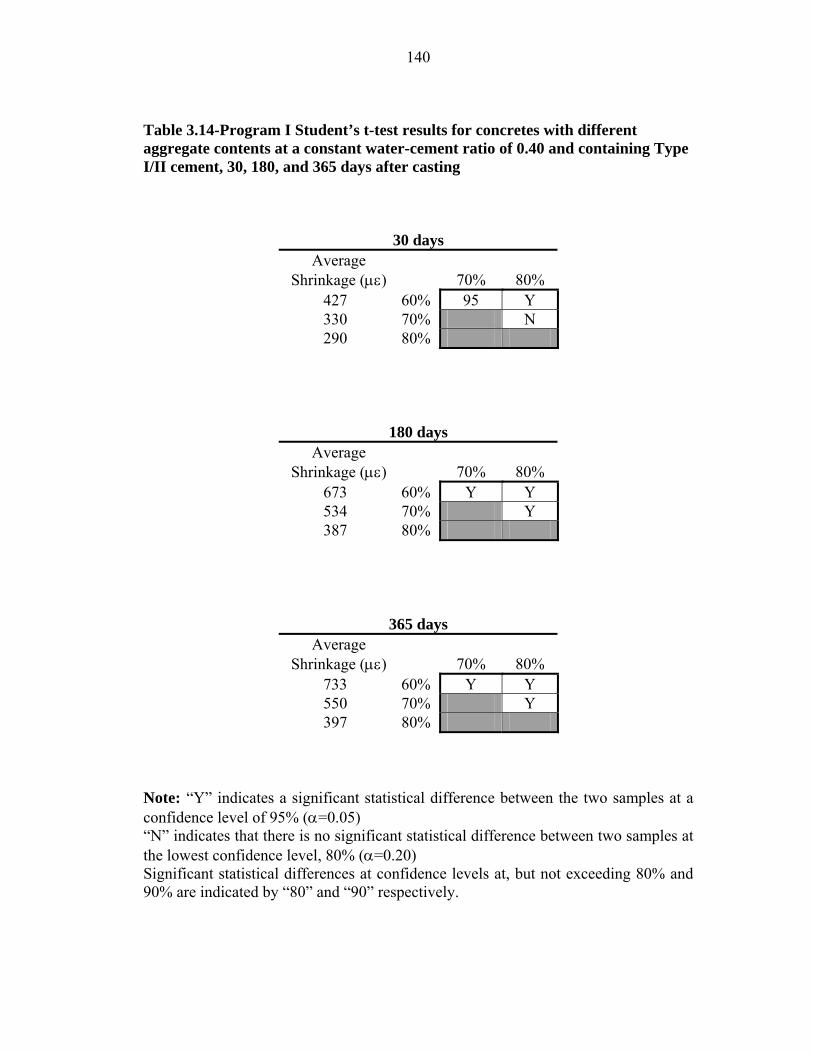
140
Table 3.14-Program I Student’s t-test results for concretes with different aggregate contents at a constant water-cement ratio of 0.40 and containing Type I/II cement, 30, 180, and 365 days after casting
30 days Average
Shrinkage (με)
70% 80% 427 60% 95 Y 330 70% N 290 80%
180 days Average
Shrinkage (με)
70% 80% 673 60% Y Y 534 70% Y 387 80%
365 days Average
Shrinkage (με)
70% 80% 733 60% Y Y 550 70% Y 397 80%
Note: “Y” indicates a significant statistical difference between the two samples at a confidence level of 95% (α=0.05) “N” indicates that there is no significant statistical difference between two samples at the lowest confidence level, 80% (α=0.20) Significant statistical differences at confidence levels at, but not exceeding 80% and 90% are indicated by “80” and “90” respectively.

141
Table 3.15-Program I Student’s t-test results for concretes with different aggregate contents at a constant water-cement ratio of 0.45 and containing Type I/II cement, 30, 180, and 365 days after casting
30 days Average
Shrinkage (με)
70% 80% 387 60% 95 Y 330 70% 90 283 80%
180 days Average
Shrinkage (με)
70% 80% 600 60% 95 Y 535 70% Y 377 80%
365 days Average
Shrinkage (με)
70% 80% 630 60% 90 Y 557 70% Y 377 80%
Note: “Y” indicates a significant statistical difference between the two samples at a confidence level of 95% (α=0.05) “N” indicates that there is no significant statistical difference between two samples at the lowest confidence level, 80% (α=0.20) Significant statistical differences at confidence levels at, but not exceeding 80% and 90% are indicated by “80” and “90” respectively.
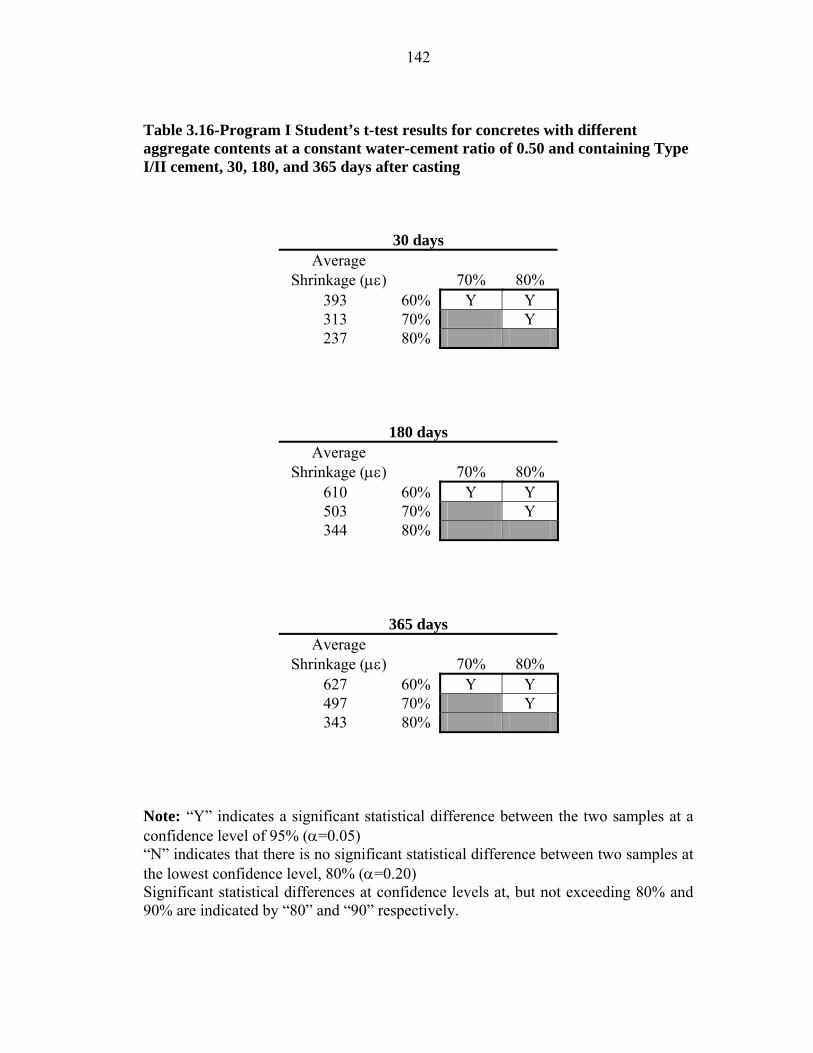
142
Table 3.16-Program I Student’s t-test results for concretes with different aggregate contents at a constant water-cement ratio of 0.50 and containing Type I/II cement, 30, 180, and 365 days after casting
30 days Average
Shrinkage (με)
70% 80% 393 60% Y Y 313 70% Y 237 80%
180 days Average
Shrinkage (με)
70% 80% 610 60% Y Y 503 70% Y 344 80%
365 days Average
Shrinkage (με)
70% 80% 627 60% Y Y 497 70% Y 343 80%
Note: “Y” indicates a significant statistical difference between the two samples at a confidence level of 95% (α=0.05) “N” indicates that there is no significant statistical difference between two samples at the lowest confidence level, 80% (α=0.20) Significant statistical differences at confidence levels at, but not exceeding 80% and 90% are indicated by “80” and “90” respectively.

143
Table 3.17-Program I Student’s t-test results for concretes with different aggregate contents at a constant water-cement ratio of 0.40 and containing Type II coarse-ground cement, 30, 180, and 365 days after casting
30 days Average
Shrinkage (με)
70% 80% 297 60% 90 Y 260 70% 90 217 80%
180 days Average
Shrinkage (με)
70% 80% 510 60% Y Y 370 70% 95 278 80%
365 days Average
Shrinkage (με)
70% 80% 527 60% Y Y 313 70% N 263 80%
Note: “Y” indicates a significant statistical difference between the two samples at a confidence level of 95% (α=0.05) “N” indicates that there is no significant statistical difference between two samples at the lowest confidence level, 80% (α=0.20) Significant statistical differences at confidence levels at, but not exceeding 80% and 90% are indicated by “80” and “90” respectively.

144
Table 3.18-Program I Student’s t-test results for concretes with different aggregate contents at a constant water-cement ratio of 0.45 and containing Type II coarse-ground cement, 30, 180, and 365 days after casting
30 days Average
Shrinkage (με)
70% 80% 260 60% N Y 260 70% 95 217 80%
180 days Average
Shrinkage (με)
70% 80% 448 60% 95 Y 382 70% 95 292 80%
365 days Average
Shrinkage (με)
70% 80% 460 60% 90 Y 370 70% 80 287 80%
Note: “Y” indicates a significant statistical difference between the two samples at a confidence level of 95% (α=0.05) “N” indicates that there is no significant statistical difference between two samples at the lowest confidence level, 80% (α=0.20) Significant statistical differences at confidence levels at, but not exceeding 80% and 90% are indicated by “80” and “90” respectively.

145
Table 3.19-Program I Student’s t-test results for concretes with different aggregate contents at a constant water-cement ratio of 0.50 and containing Type II coarse-ground cement, 30, 180, and 365 days after casting
30 days Average
Shrinkage (με)
70% 80% 297 60% N Y 287 70% Y 200 80%
180 days Average
Shrinkage (με)
70% 80% 481 60% Y Y 368 70% 95 305 80%
365 days Average
Shrinkage (με)
70% 80% 493 60% Y Y 317 70% 80 293 80%
Note: “Y” indicates a significant statistical difference between the two samples at a confidence level of 95% (α=0.05) “N” indicates that there is no significant statistical difference between two samples at the lowest confidence level, 80% (α=0.20) Significant statistical differences at confidence levels at, but not exceeding 80% and 90% are indicated by “80” and “90” respectively.

146
Table 3.20a-Program II Student’s t-test results for non-air-entrained concrete containing different aggregate types 30, 180, and 365 days after casting
30 days Average
Shrinkage (με)
Quartzite (94) 227 Limestone (95) Y 173 Quartzite (94)
180 days Average
Shrinkage (με)
Quartzite (94) 387 Limestone (95) Y 307 Quartzite (94)
365 days Average
Shrinkage (με)
Quartzite (94) 407 Limestone (95) Y 333 Quartzite (94)
Note: “Y” indicates a significant statistical difference between the two samples at a confidence level of 95% (α=0.05) “N” indicates that there is no significant statistical difference between two samples at the lowest confidence level, 80% (α=0.20) Significant statistical differences at confidence levels at, but not exceeding 80% and 90% are indicated by “80” and “90” respectively.

147
Table 3.20b-Program II Student’s t-test results for non-air-entrained concrete containing different aggregate types 30, 180, and 365 days after casting, cont.
30 days Average
Shrinkage (με) Limestone
(188) Granite (189)
217 Quartzite (187) N N 237 Limestone (188) N 237 Granite (189)
180 days Average
Shrinkage (με) Limestone
(188) Granite (189)
350 Quartzite (187) 80 N 387 Limestone (188) Y 350 Granite (189)
365 days Average
Shrinkage (με) Limestone
(188) Granite (189)
413 Quartzite (187) N N 427 Limestone (188) N 400 Granite (189)
Note: “Y” indicates a significant statistical difference between the two samples at a confidence level of 95% (α=0.05) “N” indicates that there is no significant statistical difference between two samples at the lowest confidence level, 80% (α=0.20) Significant statistical differences at confidence levels at, but not exceeding 80% and 90% are indicated by “80” and “90” respectively.

148
Table 3.20c-Program II Student’s t-test results for non-air-entrained concrete containing different aggregate types 30, 180, and 365 days after casting, cont.
30 days Average
Shrinkage (με) Limestone
(199) Granite (200)
340 Quartzite (198) N 80 320 Limestone (199) N 283 Granite (200)
180 days Average
Shrinkage (με) Limestone
(199) Granite (200)
473 Quartzite (198) N 80 460 Limestone (199) N 423 Granite (200)
365 days Average
Shrinkage (με) Limestone
(199) Granite (200)
553 Quartzite (198) N Y 540 Limestone (199) 80 493 Granite (200)
Note: “Y” indicates a significant statistical difference between the two samples at a confidence level of 95% (α=0.05) “N” indicates that there is no significant statistical difference between two samples at the lowest confidence level, 80% (α=0.20) Significant statistical differences at confidence levels at, but not exceeding 80% and 90% are indicated by “80” and “90” respectively.

149
Table 3.20d-Program II Student’s t-test results for air-entrained concrete containing different aggregate types 30, 180, and 365 days after casting, cont.
30 days Average
Shrinkage (με) Limestone
(263) Granite (264)
347 Quartzite (262) 90 80 377 Limestone (263) Y 313 Granite (264)
180 days Average
Shrinkage (με) Limestone
(263) Granite (264)
520 Quartzite (262) 80 80 550 Limestone (263) Y 487 Granite (264)
365 days Average
Shrinkage (με) Limestone
(263) Granite (264)
567 Quartzite (262) 80 Y 590 Limestone (263) Y 523 Granite (264)
Note: “Y” indicates a significant statistical difference between the two samples at a confidence level of 95% (α=0.05) “N” indicates that there is no significant statistical difference between two samples at the lowest confidence level, 80% (α=0.20) Significant statistical differences at confidence levels at, but not exceeding 80% and 90% are indicated by “80” and “90” respectively.

150
Table 3.21a-Program III Student’s t-test results for concrete containing Type I/II cement with mineral admixtures by volume replacement at 30, 180, and 365 days after casting
30 days Average
Shrinkage (με)
Slag (86)
Fly Ash (87)
Silica Fume (88)
303 Control(85) 90 Y N 333 Slag(86) N Y 337 Fly Ash(87) Y 293 Silica Fume(88)
180 days Average
Shrinkage (με)
Slag (86)
Fly Ash (87)
Silica Fume (88)
431 Control(85) N Y N 426 Slag(86) Y N 462 Fly Ash(87) Y 419 Silica Fume(88)
365 days Average
Shrinkage (με)
Slag (86)
Fly Ash (87)
Silica Fume (88)
402 Control(85) 80 Y 80 435 Slag(86) 90 N 478 Fly Ash(87) 80 441 Silica Fume(88)
Note: “Y” indicates a significant statistical difference between the two samples at a confidence level of 95% (α=0.05) “N” indicates that there is no significant statistical difference between two samples at the lowest confidence level, 80% (α=0.20) Significant statistical differences at confidence levels at, but not exceeding 80% and 90% are indicated by “80” and “90” respectively.

151
Table 3.21b-Program III Student’s t-test results for concrete containing Type I/II cement with mineral admixtures by volume replacement at 30, 180, and 365 days after casting, cont.
30 days Average
Shrinkage (με)
Slag (195)
Fly Ash (196)
Silica Fume (197)
293 Control(194) N N N 313 Slag(195) N 80 347 Fly Ash(196) 80 257 Silica Fume(197)
180 days Average
Shrinkage (με)
Slag (195)
Fly Ash (196)
Silica Fume (197)
443 Control(194) N N N 427 Slag(195) N N 477 Fly Ash(196) N 393 Silica Fume(197)
365 days Average
Shrinkage (με)
Slag (195)
Fly Ash (196)
Silica Fume (197)
503 Control(194) N N N 497 Slag(195) N N 553 Fly Ash(196) 80 460 Silica Fume(197)
Note: “Y” indicates a significant statistical difference between the two samples at a confidence level of 95% (α=0.05) “N” indicates that there is no significant statistical difference between two samples at the lowest confidence level, 80% (α=0.20) Significant statistical differences at confidence levels at, but not exceeding 80% and 90% are indicated by “80” and “90” respectively.
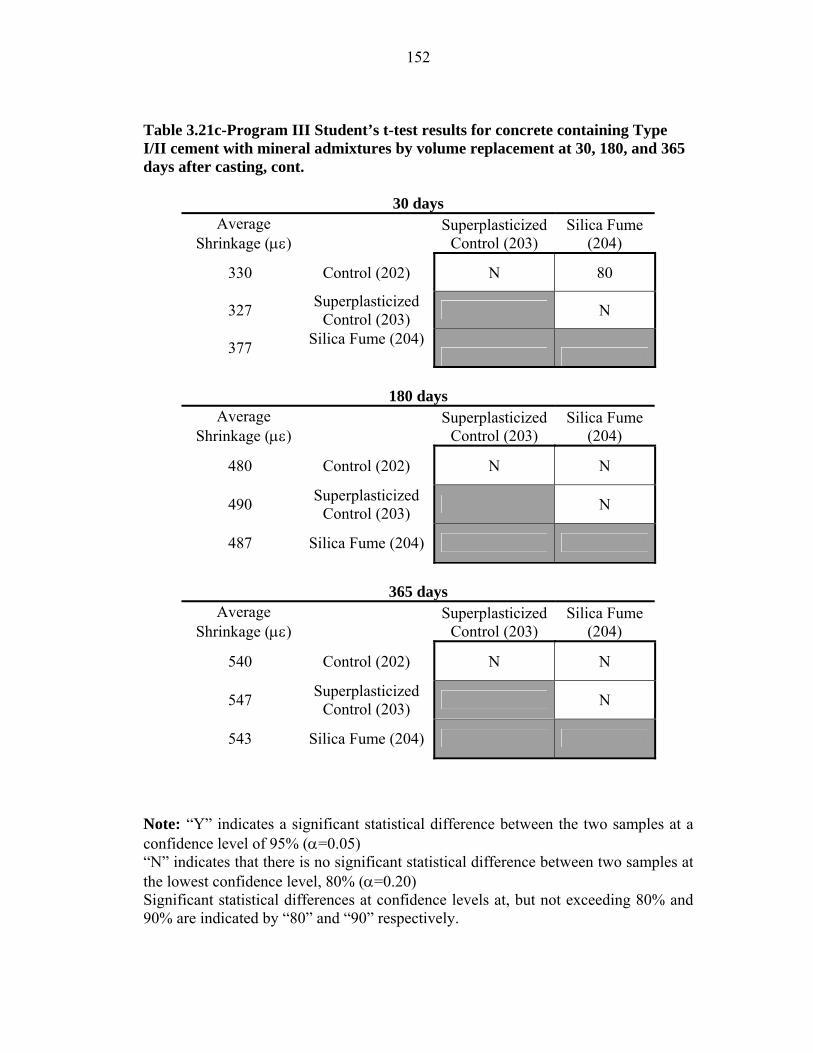
152
Table 3.21c-Program III Student’s t-test results for concrete containing Type I/II cement with mineral admixtures by volume replacement at 30, 180, and 365 days after casting, cont.
30 days
Average Shrinkage (με)
Superplasticized Control (203)
Silica Fume (204)
330 Control (202) N 80
327 Superplasticized Control (203) N
377 Silica Fume (204)
180 days
Average Shrinkage (με)
Superplasticized Control (203)
Silica Fume (204)
480 Control (202) N N
490 Superplasticized Control (203) N
487 Silica Fume (204)
365 days
Average Shrinkage (με)
Superplasticized Control (203)
Silica Fume (204)
540 Control (202) N N
547 Superplasticized Control (203) N
543 Silica Fume (204)
Note: “Y” indicates a significant statistical difference between the two samples at a confidence level of 95% (α=0.05) “N” indicates that there is no significant statistical difference between two samples at the lowest confidence level, 80% (α=0.20) Significant statistical differences at confidence levels at, but not exceeding 80% and 90% are indicated by “80” and “90” respectively.

153
Table 3.22-Program IV Student’s t-test results (Batch 165) for different curing periods, for non-air-entrained concrete containing Type I/II cement
30 daysa
Average Shrinkage (με)
7 days 14 days 28 days
333 3 days N N Y 337 7 days N Y 320 14 days Y 227 28 days
180 daysa
Average Shrinkage (με)
7 days 14 days 28 days
543 3 days 80 N 95 583 7 days 90 Y 529 14 days 90 465 28 days
300 daysa
Average Shrinkage (με)
7 days 14 days 28 days
515 3 days 90 N Y 564 7 days Y Y 506 14 days Y 443 28 days
aDenotes the age after drying began Note: “Y” indicates a significant statistical difference between the two samples at a confidence level of 95% (α=0.05) “N” indicates that there is no significant statistical difference between two samples at the lowest confidence level, 80% (α=0.20) Significant statistical differences at confidence levels at, but not exceeding 80% and 90% are indicated by “80” and “90” respectively.

154
Table 3.23-Program IV Student’s t-test (Batch 166) results for different curing periods, for non-air-entrained concrete containing Type II coarse-ground cement
30 daysa
Average Shrinkage (με)
7 days 14 days 28 days
302 3 days N 90 Y 270 7 days N 90 237 14 days Y 193 28 days
180 daysa
Average Shrinkage (με)
7 days 14 days 28 days
556 3 days N Y Y 513 7 days 80 Y 457 14 days Y 411 28 days
300 daysa
Average Shrinkage (με)
7 days 14 days 28 days
520 3 days N 90 Y 487 7 days 80 Y 433 14 days Y 376 28 days
aDenotes the age after drying began Note: “Y” indicates a significant statistical difference between the two samples at a confidence level of 95% (α=0.05) “N” indicates that there is no significant statistical difference between two samples at the lowest confidence level, 80% (α=0.20) Significant statistical differences at confidence levels at, but not exceeding 80% and 90% are indicated by “80” and “90” respectively.
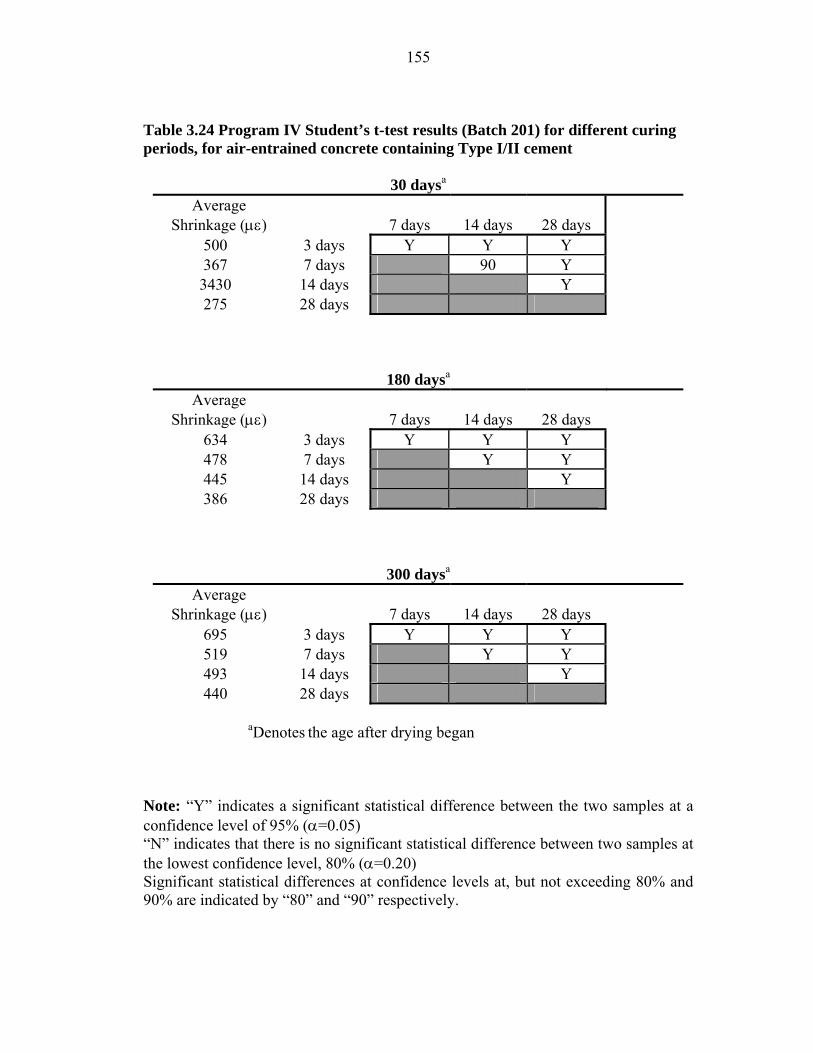
155
Table 3.24 Program IV Student’s t-test results (Batch 201) for different curing periods, for air-entrained concrete containing Type I/II cement
30 daysa
Average Shrinkage (με)
7 days 14 days 28 days
500 3 days Y Y Y 367 7 days 90 Y 3430 14 days Y 275 28 days
180 daysa
Average Shrinkage (με)
7 days 14 days 28 days
634 3 days Y Y Y 478 7 days Y Y 445 14 days Y 386 28 days
300 daysa
Average Shrinkage (με)
7 days 14 days 28 days
695 3 days Y Y Y 519 7 days Y Y 493 14 days Y 440 28 days
aDenotes the age after drying began Note: “Y” indicates a significant statistical difference between the two samples at a confidence level of 95% (α=0.05) “N” indicates that there is no significant statistical difference between two samples at the lowest confidence level, 80% (α=0.20) Significant statistical differences at confidence levels at, but not exceeding 80% and 90% are indicated by “80” and “90” respectively.

156
Table 3.25-Program IV Student’s t-test (Batch 207) results for different curing periods, for air-entrained concrete containing Type II coarse-ground cement
30 daysa
Average Shrinkage (με)
7 days 14 days 28 days
279 3 days N Y Y 280 7 days Y Y 220 14 days N 193 28 days
180 daysa
Average Shrinkage (με)
7 days 14 days 28 days
400 3 days N Y Y 407 7 days 90 Y 377 14 days N 378 28 days
300 daysa
Average Shrinkage (με)
7 days 14 days 28 days
3 days N Y Y 7 days 90 Y 14 days N 28 days
aDenotes the age after drying began Note: “Y” indicates a significant statistical difference between the two samples at a confidence level of 95% (α=0.05) “N” indicates that there is no significant statistical difference between two samples at the lowest confidence level, 80% (α=0.20) Significant statistical differences at confidence levels at, but not exceeding 80% and 90% are indicated by “80” and “90” respectively.
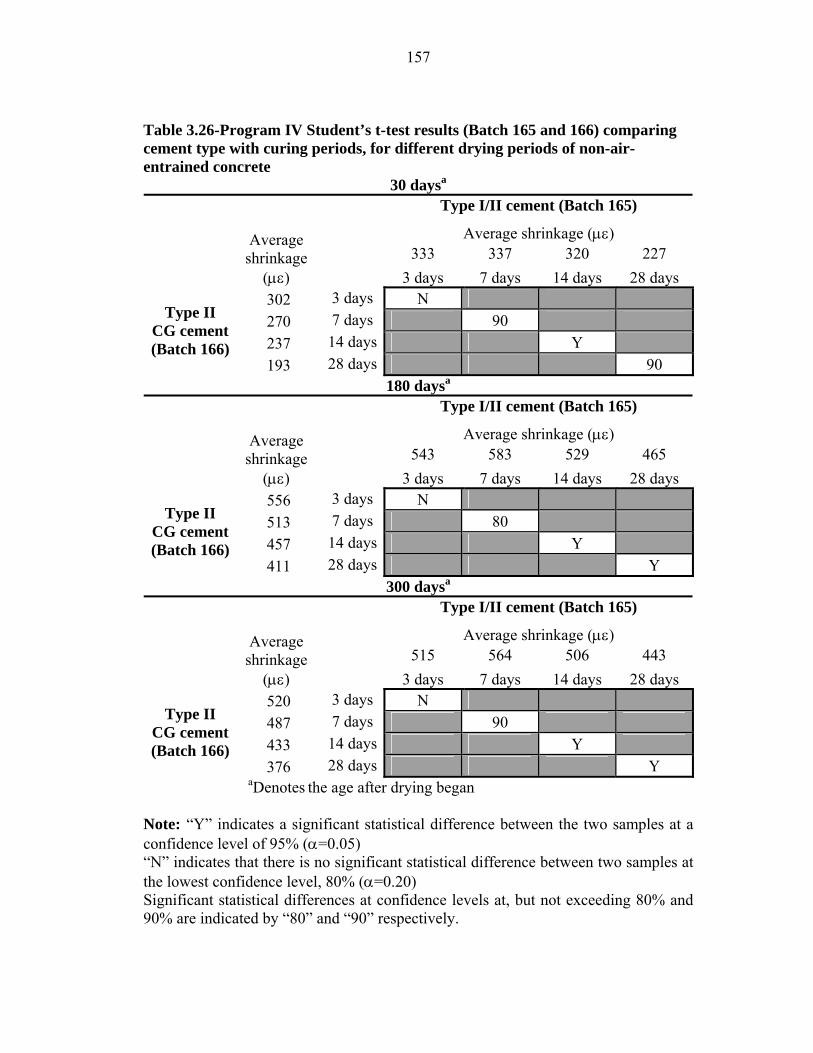
157
Table 3.26-Program IV Student’s t-test results (Batch 165 and 166) comparing cement type with curing periods, for different drying periods of non-air-entrained concrete
30 daysa
Type I/II cement (Batch 165)
Average shrinkage (με) 333 337 320 227
Average
shrinkage (με)
3 days 7 days 14 days 28 days 302 3 days N 270 7 days 90 237 14 days Y
Type II CG cement (Batch 166)
193 28 days 90 180 daysa
Type I/II cement (Batch 165)
Average shrinkage (με) 543 583 529 465
Average
shrinkage (με)
3 days 7 days 14 days 28 days 556 3 days N 513 7 days 80 457 14 days Y
Type II CG cement (Batch 166)
411 28 days Y 300 daysa
Type I/II cement (Batch 165)
Average shrinkage (με) 515 564 506 443
Average
shrinkage (με)
3 days 7 days 14 days 28 days 520 3 days N 487 7 days 90 433 14 days Y
Type II CG cement (Batch 166)
376 28 days Y aDenotes the age after drying began Note: “Y” indicates a significant statistical difference between the two samples at a confidence level of 95% (α=0.05) “N” indicates that there is no significant statistical difference between two samples at the lowest confidence level, 80% (α=0.20) Significant statistical differences at confidence levels at, but not exceeding 80% and 90% are indicated by “80” and “90” respectively.

158
Table 3.27-Program IV Student’s t-test results (Batch 201 and 207) comparing cement type with curing periods, for different drying periods of air-entrained concrete
30 daysa
Type I/II cement (Batch 201)
Average shrinkage (με) 500 367 340 275
Average
shrinkage (με)
3 days 7 days 14 days 28 days 279 3 days Y Y 280 7 days Y Y 220 14 days Y
Type II CG cement (Batch 207)
193 28 days Y 180 daysa
Type I/II cement (Batch 201)
Average shrinkage (με) 634 478 445 386
Average
shrinkage (με)
3 days 7 days 14 days 28 days 400 3 days Y Y 407 7 days Y 80 377 14 days Y
Type II CG cement (Batch 207)
378 28 days 80 300 daysa
Type I/II cement (Batch 201)
Average shrinkage (με) 695 519 493 440
Average
shrinkage (με)
3 days 7 days 14 days 28 days 450 3 days Y Y 460 7 days Y 80 422 14 days Y
Type II CG cement (Batch 207)
412 28 days 80 aDenotes the age after drying began Note: “Y” indicates a significant statistical difference between the two samples at a confidence level of 95% (α=0.05) “N” indicates that there is no significant statistical difference between two samples at the lowest confidence level, 80% (α=0.20) Significant statistical differences at confidence levels at, but not exceeding 80% and 90% are indicated by “80” and “90” respectively.
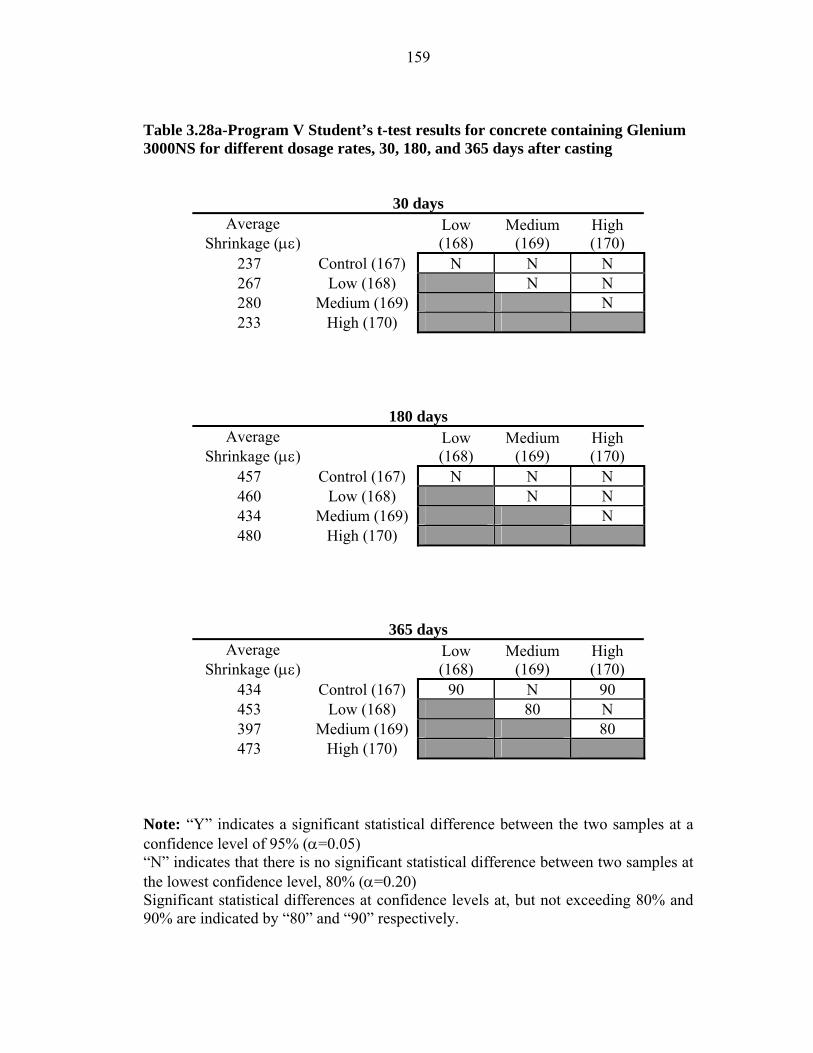
159
Table 3.28a-Program V Student’s t-test results for concrete containing Glenium 3000NS for different dosage rates, 30, 180, and 365 days after casting
30 days Average
Shrinkage (με) Low
(168) Medium
(169) High (170)
237 Control (167) N N N 267 Low (168) N N 280 Medium (169) N 233 High (170)
180 days Average
Shrinkage (με) Low
(168) Medium
(169) High (170)
457 Control (167) N N N 460 Low (168) N N 434 Medium (169) N 480 High (170)
365 days Average
Shrinkage (με) Low
(168) Medium
(169) High (170)
434 Control (167) 90 N 90 453 Low (168) 80 N 397 Medium (169) 80 473 High (170)
Note: “Y” indicates a significant statistical difference between the two samples at a confidence level of 95% (α=0.05) “N” indicates that there is no significant statistical difference between two samples at the lowest confidence level, 80% (α=0.20) Significant statistical differences at confidence levels at, but not exceeding 80% and 90% are indicated by “80” and “90” respectively.

160
Table 3.28b-Program V Student’s t-test results for concrete containing Rheobuild 1000 for different dosage rates, 30, 180, and 365 days after casting
30 days Average
Shrinkage (με) Low
(171) Medium
(172) High (173)
237 Control (167) 80 N N 210 Low (171) N Y 217 Medium (172) Y 260 High (173)
180 days Average
Shrinkage (με) Low
(171) Medium
(172) High (173)
457 Control (167) N N Y 467 Low (171) N 90 457 Medium (172) 90 513 High (173)
365 days Average
Shrinkage (με) Low
(171) Medium
(172) High (173)
434 Control (167) 80 N Y 453 Low (171) N 90 457 Medium (172) 90 503 High (173)
Note: “Y” indicates a significant statistical difference between the two samples at a confidence level of 95% (α=0.05) “N” indicates that there is no significant statistical difference between two samples at the lowest confidence level, 80% (α=0.20) Significant statistical differences at confidence levels at, but not exceeding 80% and 90% are indicated by “80” and “90” respectively.

161
Table 3.29a-Program V Student’s t-test results for concrete containing Glenium 3000NS for different dosage rates, 30, 180, and 365 days after casting, cont.
30 days Average
Shrinkage (με) Low
(176) Medium
(177) High (178)
200 Control (175) 90 Y Y 300 Low (176) N N 257 Medium (177) N 260 High (178)
180 days Average
Shrinkage (με) Low
(176) Medium
(177) High (178)
333 Control (175) 90 Y 80 447 Low (176) N 80 403 Medium (177) 80 370 High (178)
365 days Average
Shrinkage (με) Low
(176) Medium
(177) High (178)
363 Control (175) 80 90 N 463 Low (176) N N 413 Medium (177) 80 386 High (178)
Note: “Y” indicates a significant statistical difference between the two samples at a confidence level of 95% (α=0.05) “N” indicates that there is no significant statistical difference between two samples at the lowest confidence level, 80% (α=0.20) Significant statistical differences at confidence levels at, but not exceeding 80% and 90% are indicated by “80” and “90” respectively.

162
Table 3.29b-Program V Student’s t-test results for concrete containing Rheobuild 1000 for different dosage rates, 30, 180, and 365 days after casting, cont.
30 days Average
Shrinkage (με) Low
(179) Medium
(180) High (181)
200 Control (175) Y Y N 283 Low (179) N Y 263 Medium (180) 80 220 High (181)
180 days Average
Shrinkage (με) Low
(179) Medium
(180) High (181)
333 Control (175) Y Y N 460 Low (179) N Y 427 Medium (180) Y 325 High (181)
365 days Average
Shrinkage (με) Low
(179) Medium
(180) High (181)
363 Control (175) Y 80 N 460 Low (179) N Y 427 Medium (180) 90 340 High (181)
Note: “Y” indicates a significant statistical difference between the two samples at a confidence level of 95% (α=0.05) “N” indicates that there is no significant statistical difference between two samples at the lowest confidence level, 80% (α=0.20) Significant statistical differences at confidence levels at, but not exceeding 80% and 90% are indicated by “80” and “90” respectively.

163
Table 3.30a-Program V Student’s t-test results for concrete containing Adva 100 for different dosage rates, 30, 180, and 365 days after casting
30 days Average
Shrinkage (με) Low
(184) Medium
(185) High (186)
257 Control (183) N N N 257 Low (184) N Y 260 Medium (185) N 250 High (186)
180 days Average
Shrinkage (με) Low
(184) Medium
(185) High (186)
440 Control (183) N N N 423 Low (184) N N 437 Medium (185) N 433 High (186)
365 days Average
Shrinkage (με) Low
(184) Medium
(185) High (186)
443 Control (183) N N N 433 Low (184) N N 440 Medium (185) N 437 High (186)
Note: “Y” indicates a significant statistical difference between the two samples at a confidence level of 95% (α=0.05) “N” indicates that there is no significant statistical difference between two samples at the lowest confidence level, 80% (α=0.20) Significant statistical differences at confidence levels at, but not exceeding 80% and 90% are indicated by “80” and “90” respectively.

164
Table 3.30b-Program V Student’s t-test results for concrete containing Adva 100 for different dosage rates, 30, 180, and 365 days after casting, cont.
30 days Average
Shrinkage (με) Low
(190) Medium
(191) High (192)
213 Control (193) N N N 237 Low (190) N Y 230 Medium (191) N 237 High (192)
180 days Average
Shrinkage (με) Low
(190) Medium
(191) High (192)
317 Control (193) N N N 350 Low (190) N N 327 Medium (191) N 337 High (192)
365 days Average
Shrinkage (με) Low
(190) Medium
(191) High (192)
360 Control (193) N N N 397 Low (190) N N 373 Medium (191) N 387 High (192)
Note: “Y” indicates a significant statistical difference between the two samples at a confidence level of 95% (α=0.05) “N” indicates that there is no significant statistical difference between two samples at the lowest confidence level, 80% (α=0.20) Significant statistical differences at confidence levels at, but not exceeding 80% and 90% are indicated by “80” and “90” respectively.

165
Table 3.31a-Program V Student’s t-test results for concrete containing different superplasticizers (low dosage) for different dosage rates, 30, 180, and 365 days after casting
30 days Average
Shrinkage (με) Rheobuild
(179) Adva (184)
300 Glenium (176) N N 283 Rheobuild (179) N 257 Adva (184)
180 days Average
Shrinkage (με) Rheobuild
(179) Adva (184)
447 Glenium (176) N N 460 Rheobuild (179) 80 423 Adva (184)
365 days Average
Shrinkage (με) Rheobuild
(179) Adva (184)
463 Glenium (176) N N 460 Rheobuild (179) N 433 Adva (184)
Note: “Y” indicates a significant statistical difference between the two samples at a confidence level of 95% (α=0.05) “N” indicates that there is no significant statistical difference between two samples at the lowest confidence level, 80% (α=0.20) Significant statistical differences at confidence levels at, but not exceeding 80% and 90% are indicated by “80” and “90” respectively.
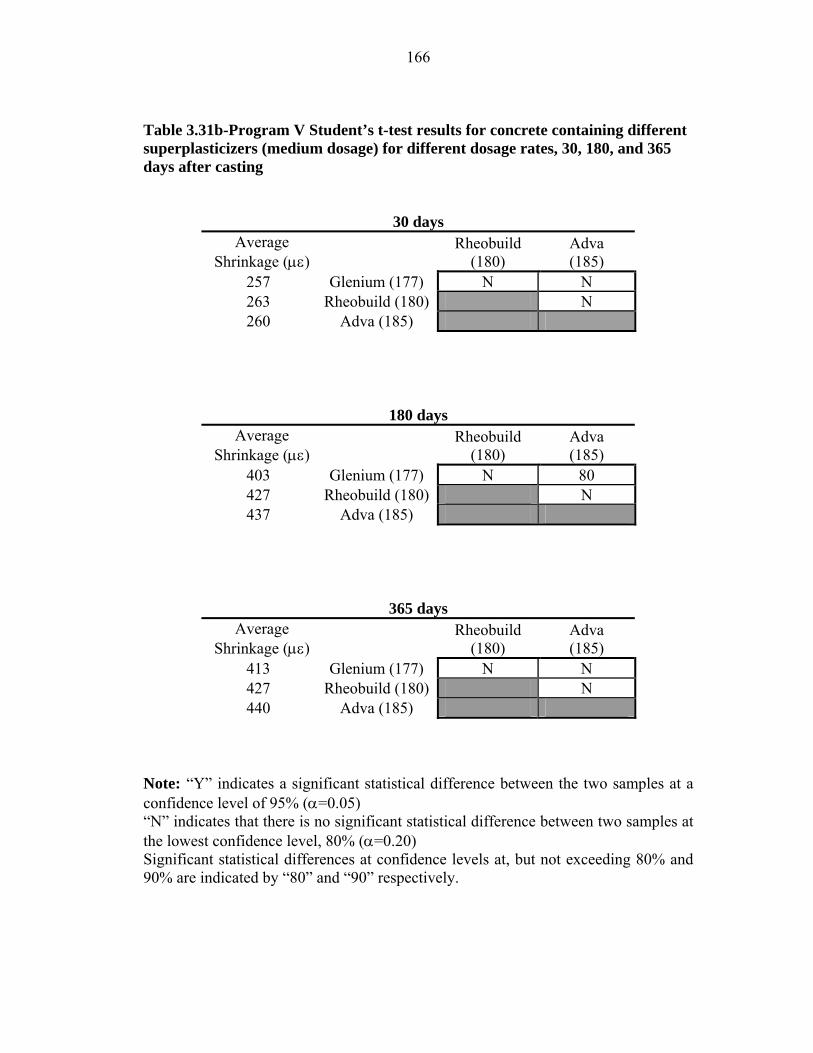
166
Table 3.31b-Program V Student’s t-test results for concrete containing different superplasticizers (medium dosage) for different dosage rates, 30, 180, and 365 days after casting
30 days Average
Shrinkage (με) Rheobuild
(180) Adva (185)
257 Glenium (177) N N 263 Rheobuild (180) N 260 Adva (185)
180 days Average
Shrinkage (με) Rheobuild
(180) Adva (185)
403 Glenium (177) N 80 427 Rheobuild (180) N 437 Adva (185)
365 days Average
Shrinkage (με) Rheobuild
(180) Adva (185)
413 Glenium (177) N N 427 Rheobuild (180) N 440 Adva (185)
Note: “Y” indicates a significant statistical difference between the two samples at a confidence level of 95% (α=0.05) “N” indicates that there is no significant statistical difference between two samples at the lowest confidence level, 80% (α=0.20) Significant statistical differences at confidence levels at, but not exceeding 80% and 90% are indicated by “80” and “90” respectively.

167
Table 3.31c-Program V Student’s t-test results for concrete containing different superplasticizers (high dosage) for different dosage rates, 30, 180, and 365 days after casting
30 days Average
Shrinkage (με) Rheobuild
(181) Adva (186)
257 Glenium (178) 80 N 263 Rheobuild (181) N 260 Adva (186)
180 days Average
Shrinkage (με) Rheobuild
(181) Adva (186)
403 Glenium (178) Y Y 427 Rheobuild (181) Y 437 Adva (186)
365 days Average
Shrinkage (με) Rheobuild
(181) Adva (186)
413 Glenium (178) 90 90 427 Rheobuild (181) Y 440 Adva (186)
Note: “Y” indicates a significant statistical difference between the two samples at a confidence level of 95% (α=0.05) “N” indicates that there is no significant statistical difference between two samples at the lowest confidence level, 80% (α=0.20) Significant statistical differences at confidence levels at, but not exceeding 80% and 90% are indicated by “80” and “90” respectively.

168
Table 3.32a-Program V Student’s t-test results for non-air-entrained concrete containing different superplasticizers (dosage rates for same slump), 30, 180, and 365 days after casting
30 days Average
Shrinkage (με) Glenium
(210) Rheobuild
(211) Adva (209)
330 Control (208) Y Y Y 367 Glenium (210) N 80 357 Rheobuild (211) N 357 Adva (209)
180 days Average
Shrinkage (με) Glenium
(210) Rheobuild
(211) Adva (209)
507 Control (208) Y Y Y 560 Glenium (210) 80 N 573 Rheobuild (211) Y 550 Adva (209)
365 days Average
Shrinkage (με) Glenium
(210) Rheobuild
(211) Adva (209)
Control (208) Y Y 90 Glenium (210) 90 N Rheobuild (211) 80 Adva (209)
Note: “Y” indicates a significant statistical difference between the two samples at a confidence level of 95% (α=0.05) “N” indicates that there is no significant statistical difference between two samples at the lowest confidence level, 80% (α=0.20) Significant statistical differences at confidence levels at, but not exceeding 80% and 90% are indicated by “80” and “90” respectively.

169
Table 3.32b-Program V Student’s t-test results for air-entrained concrete containing different superplasticizers (dosage rates for same slump), 30, 180, and 365 days after casting
30 days Average
Shrinkage (με) Glenium
(249) Rheobuild
(256) Adva (259)
487 Control (260) N N N 523 Glenium (249) N N 473 Rheobuild (256) N 497 Adva (259)
180 days Average
Shrinkage (με) Glenium
(249) Rheobuild
(256) Adva (259)
700 Control (260) N N N 693 Glenium (249) N N 660 Rheobuild (256) N 697 Adva (259)
365 days Average
Shrinkage (με) Glenium
(249) Rheobuild
(256) Adva (259)
757 Control (260) N N N 737 Glenium (249) N N 703 Rheobuild (256) N 737 Adva (259)
Note: “Y” indicates a significant statistical difference between the two samples at a confidence level of 95% (α=0.05) “N” indicates that there is no significant statistical difference between two samples at the lowest confidence level, 80% (α=0.20) Significant statistical differences at confidence levels at, but not exceeding 80% and 90% are indicated by “80” and “90” respectively.

170
FIGURES
Figure 2.1 – Free Shrinkage Specimen Mold (Tritsch 2005)
76 mm
286 mm
254 mm
Gage Studs
Figure 2.2 – Cross-section of Free Shrinkage Specimen (Tritsch 2005)

171
Figure 2.3 – Mechanical Dial Gage Length Comparator (Sourse: Humboldt Manufacturing Company Online Catalog,
http://www.humboldtmfg.com/pdf1/49.pdf)

172
Figu
re 3
.1 -
Free
Shr
inka
ge T
est,
Prog
ram
I. A
vera
ge fr
ee sh
rink
age
vs. t
ime
thro
ugh
30 d
ays.
Typ
e I/
II c
emen
t.
-5050150
250
350
450
550
650
750
05
1015
2025
30
Tim
e (d
)
Shrinkage (microstrain)
60-4
0
60-4
5
60-5
0
70-4
0
70-4
5
70-5
0
80-4
0
80-4
5
80-5
0
agg%
- w
/c ra
tio

173
Figu
re 3
.2 -
Free
Shr
inka
ge T
est,
Prog
ram
I. A
vera
ge fr
ee sh
rink
age
vs. t
ime
thro
ugh
180
days
. T
ype
I/II
cem
ent.
-5050150
250
350
450
550
650
750
030
6090
120
150
180
Tim
e (d
)
Shrinkage (microstrain)
60-4
0
60-4
5
60-5
0
70-4
0
70-4
5
70-5
0
80-4
0
80-4
5
80-5
0
agg%
- w
/c ra
tio

174
-5050150
250
350
450
550
650
750
050
100
150
200
250
300
350
400
Tim
e (d
)
Shrinkage (microstrain)
60-4
0
60-4
5
60-5
0
70-4
0
70-4
5
70-5
0
80-4
0
80-4
5
80-5
0
Figu
re 3
.3 -
Free
Shr
inka
ge T
est,
Prog
ram
I. A
vera
ge fr
ee sh
rink
age
vs. t
ime
thro
ugh
365
days
. T
ype
I/II
cem
ent.
agg%
- w
/c ra
tio

175
Figu
re 3
.4 -
Free
Shr
inka
ge T
est,
Prog
ram
I. A
vera
ge fr
ee sh
rink
age
vs. t
ime
thro
ugh
30 d
ays.
Typ
e II
C
G c
emen
t.
-5050150
250
350
450
550
650
750
05
1015
2025
30
Tim
e (d
)
Shrinkage (microstrain)
60-4
0
60-4
5
60-5
0
70-4
0
70-4
5
70-5
0
80-4
0
80-4
5
80-5
0
agg%
- w
/c ra
tio

176
Figu
re 3
.5 -
Free
Shr
inka
ge T
est,
Prog
ram
I. A
vera
ge fr
ee sh
rink
age
vs. t
ime
thro
ugh
180
days
. T
ype
II
coar
se g
roun
d (C
G) c
emen
t.
-5050150
250
350
450
550
650
750
030
6090
120
150
180
Tim
e (d
)
Shrinkage (microstrain)
60-4
0
60-4
5
60-5
0
70-4
0
70-4
5
70-5
0
80-4
0
80-4
5
80-5
0
agg%
- w
/c ra
tio

177
-5050150
250
350
450
550
650
750
050
100
150
200
250
300
350
400
Tim
e (d
)
Shrinkage (microstrain)
60-4
0
60-4
5
60-5
0
70-4
0
70-4
5
70-5
0
80-4
0
80-4
5
80-5
0
Figu
re 3
.6 -
Free
Shr
inka
ge T
est,
Prog
ram
I. A
vera
ge fr
ee sh
rink
age
vs. t
ime
thro
ugh
365
days
. T
ype
II c
oars
e gr
ound
(CG
) cem
ent.
agg%
-w/c
ratio

178
Figu
re 3
.7 -
Free
Shr
inka
ge T
est,
Prog
ram
I. A
vera
ge fr
ee sh
rink
age
vs. t
ime
thro
ugh
180
days
. Typ
e I/
II
and
Typ
e II
coa
rse
grou
nd (C
G) c
emen
t. w
/c r
atio
= 0
.40.
-5050150
250
350
450
550
650
750
030
6090
120
150
180
Tim
e (d
)
Shrinkage (microstrain)
I/II 6
0
I/II 7
0
II C
G 6
0
I/II 8
0
II C
G 7
0
II C
G 8
0
cem
ent-a
gg%

179
Figu
re 3
.8 -
Free
Shr
inka
ge T
est,
Prog
ram
I. A
vera
ge fr
ee sh
rink
age
vs. t
ime
thro
ugh
365
days
. Typ
e I/
II a
nd T
ype
II c
oars
e gr
ound
(CG
) cem
ent.
w/c
rat
io =
0.4
0.
-5050150
250
350
450
550
650
750
050
100
150
200
250
300
350
400
Tim
e (d
)
Shrinkage (microstrain)
I/II 6
0
I/II 7
0
II C
G 6
0
I/II 8
0
II C
G 7
0
II C
G 8
0
cem
ent-a
gg%

180
-5050150
250
350
450
550
650
750
030
6090
120
150
180
Tim
e (d
)
Shrinkage (microstrain)
I/II-6
0
I/II-7
0
II C
G-6
0
I/II-8
0
II C
G-7
0
II C
G-8
0
Figu
re 3
.9 -
Free
Shr
inka
ge T
est,
Prog
ram
I. A
vera
ge fr
ee sh
rink
age
vs. t
ime
thro
ugh
180
days
. T
ype
I/II
and
Typ
e II
coa
rse
grou
nd (C
G) c
emen
t. w
/c r
atio
= 0
.45.
cem
ent-a
gg%

181
Figu
re 3
.10
- Fre
e Sh
rink
age
Tes
t, Pr
ogra
m I.
Ave
rage
free
shri
nkag
e vs
. tim
e th
roug
h 36
5 da
ys. T
ype
I/II
and
Typ
e II
coa
rse
grou
nd (C
G) c
emen
t. w
/c r
atio
= 0
.45.
-5050150
250
350
450
550
650
750
050
100
150
200
250
300
350
400
Tim
e (d
)
Shrinkage (microstrain)
I/II-
60
I/II-7
0
II C
G-6
0
I/II-8
0
II C
G-7
0
II C
G-8
0
cem
ent-a
gg%
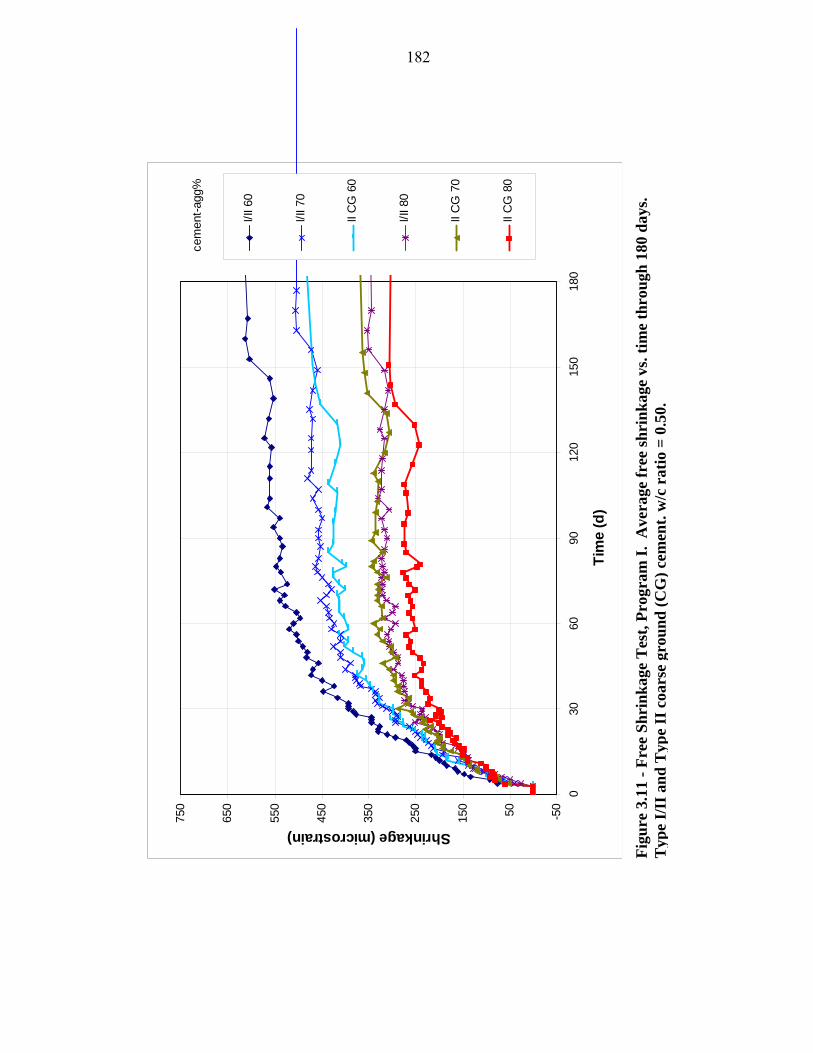
182
-5050150
250
350
450
550
650
750
030
6090
120
150
180
Tim
e (d
)
Shrinkage (microstrain)
I/II 6
0
I/II 7
0
II C
G 6
0
I/II 8
0
II C
G 7
0
II C
G 8
0
Figu
re 3
.11
- Fre
e Sh
rink
age
Tes
t, Pr
ogra
m I.
Ave
rage
free
shri
nkag
e vs
. tim
e th
roug
h 18
0 da
ys.
Typ
e I/
II a
nd T
ype
II c
oars
e gr
ound
(CG
) cem
ent.
w/c
rat
io =
0.5
0.
cem
ent-a
gg%

183
-5050150
250
350
450
550
650
750
050
100
150
200
250
300
350
400
Tim
e (d
)
Shrinkage (microstrain)I/I
I 60
I/II 7
0
II C
G 6
0
I/II 8
0
II C
G 7
0
II C
G 8
0
Figu
re 3
.12
- Fre
e Sh
rink
age
Tes
t, Pr
ogra
m I.
Ave
rage
free
shri
nkag
e vs
. tim
e th
roug
h 36
5 da
ys.
Typ
e I/
II a
nd T
ype
II c
oars
e gr
ound
(CG
) cem
ent.
w/c
rat
io =
0.5
0.
cem
ent-a
gg%

184
-50
50
150
250
350
450
550
650
0 5 10 15 20 25 30
Time (d)
Shrin
kage
(mic
rost
rain
)
Quartzite (94) Limestone (95)
Figure 3.13 Free Shrinkage Test, Program II. Comparison of different aggregate types through 30 days.
-50
50
150
250
350
450
550
650
0 30 60 90 120 150 180
Time (d)
Shrin
kage
(mic
rost
rain
)
Quartzite (94) Limestone (95)
Figure 3.14 Free Shrinkage Test, Program II. Comparison of different aggregate types through 180 days.

185
-50
50
150
250
350
450
550
650
0 50 100 150 200 250 300 350 400
Time (d)
Shrin
kage
(mic
rost
rain
)
Quartzite (94) Limestone (95)
Figure 3.15 Free Shrinkage Test, Program II. Comparison of different aggregate types through 365 days.
-150
-50
50
150
250
350
450
550
650
0 5 10 15 20 25 30
Time (d)
Shrin
kage
(mic
rost
rain
)
Quartzite (187) Limestone (188) Granite (189)
Figure 3.16 Free Shrinkage Test, Program II. Comparison of different aggregate types through 30 days.

186
-150
-50
50
150
250
350
450
550
650
0 30 60 90 120 150 180
Time (d)
Shrin
kage
(mic
rost
rain
)
Quartzite (187) Limestone (188) Granite (189)
Figure 3.17 Free Shrinkage Test, Program II. Comparison of different aggregate types through 180 days.
-150
-50
50
150
250
350
450
550
650
0 50 100 150 200 250 300 350 400
Time (d)
Shrin
kage
(mic
rost
rain
)
Quartzite (187) Limestone (188) Granite (189)
Figure 3.18 Free Shrinkage Test, Program II. Comparison of different aggregate types through 365 days.

187
-50
50
150
250
350
450
550
650
0 5 10 15 20 25 30Time (d)
Shrin
kage
(mic
rost
rain
)
Quartzite (198) Limestone (199) Granite (200)
Figure 3.19 Free Shrinkage Test, Program II. Comparison of different aggregate types through 30 days.
-50
50
150
250
350
450
550
650
0 30 60 90 120 150 180Time (d)
Shrin
kage
(mic
rost
rain
)
Quartzite (198) Limestone (199) Granite (200)
Figure 3.20 Free Shrinkage Test, Program II. Comparison of different aggregate types through 180 days.
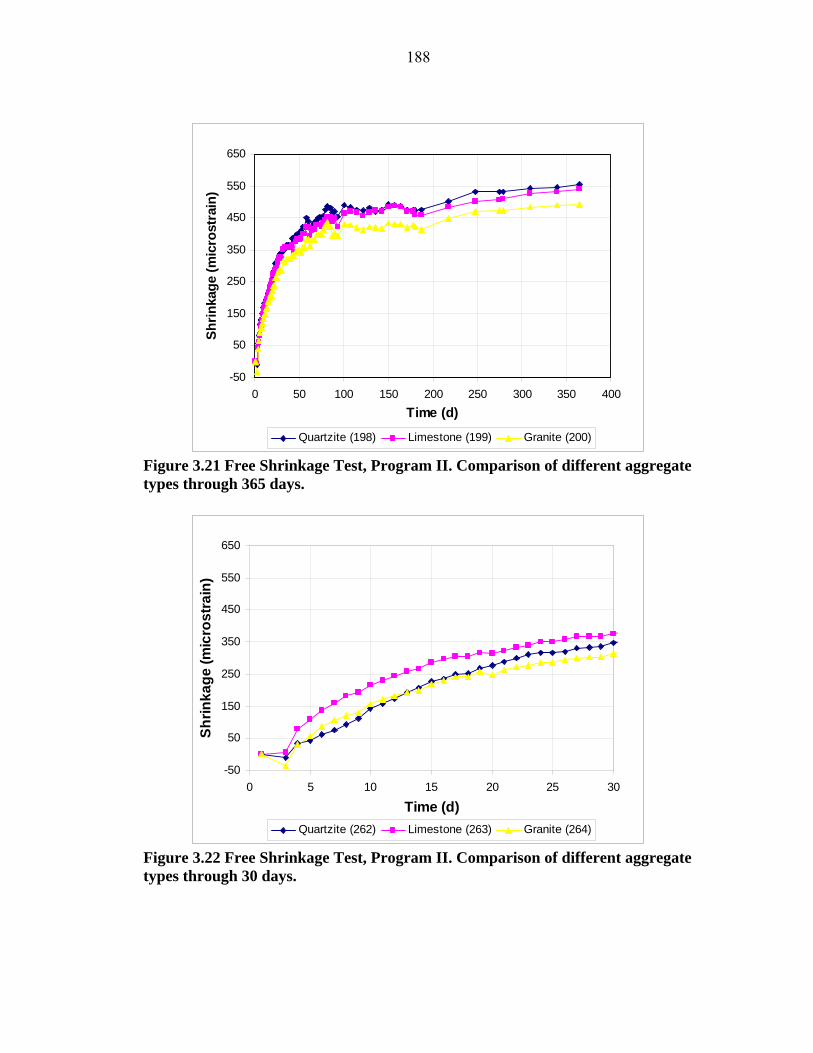
188
-50
50
150
250
350
450
550
650
0 50 100 150 200 250 300 350 400Time (d)
Shrin
kage
(mic
rost
rain
)
Quartzite (198) Limestone (199) Granite (200)
Figure 3.21 Free Shrinkage Test, Program II. Comparison of different aggregate types through 365 days.
-50
50
150
250
350
450
550
650
0 5 10 15 20 25 30
Time (d)
Shrin
kage
(mic
rost
rain
)
Quartzite (262) Limestone (263) Granite (264)
Figure 3.22 Free Shrinkage Test, Program II. Comparison of different aggregate types through 30 days.

189
-50
50
150
250
350
450
550
650
0 30 60 90 120 150 180
Time (d)
Shrin
kage
(mic
rost
rain
)
Quartzite (262) Limestone (263) Granite (264)
Figure 3.23 Free Shrinkage Test, Program II. Comparison of different aggregate type through 180 days.
-50
50
150
250
350
450
550
650
0 50 100 150 200 250 300 350 400
Time (d)
Shrin
kage
(mic
rost
rain
)
Quartzite (262) Limestone (263) Granite (264)
Figure 3.24 Free Shrinkage Test, Program II. Comparison of different aggregate types through 365 days.

190
-50
50
150
250
350
450
550
650
0 5 10 15 20 25 30
Time (d)
Shr
inka
ge (m
icro
stra
in)
Control (85) 30% Slag (86) 30% Class C Fly Ash (87) 10% Silica Fume (88)
Figure 3.25 Free Shrinkage Test, Program III. Comparing mineral admixtures through 30 days.
-50
50
150
250
350
450
550
650
0 30 60 90 120 150 180
Time (d)
Shrin
kage
(mic
rost
rain
)
Control (85) 30% Slag (86) 30% Class C Fly Ash (87) 10% Silica Fume (88)
Figure 3.26 Free Shrinkage Test, Program III. Comparing mineral admixtures through 180 days.

191
-50
50
150
250
350
450
550
650
0 50 100 150 200 250 300 350 400
Time (d)
Shrin
kage
(mic
rost
rain
)
Control (85) 30% Slag (86) 30% Class C Fly Ash (87) 10% Silica Fume (88)
Figure 3.27 Free Shrinkage Test, Program III. Comparing mineral admixtures through 365 days.
-50
50
150
250
350
450
550
650
0 5 10 15 20 25 30Time (d)
Shrin
kage
(mic
rost
rain
)
Control(194) 30% Slag(195) 30% Class C Fly Ash(196) 10% Silica Fume(197)
Figure 3.28 Free Shrinkage Test, Program III. Comparing mineral admixtures through 30 days.
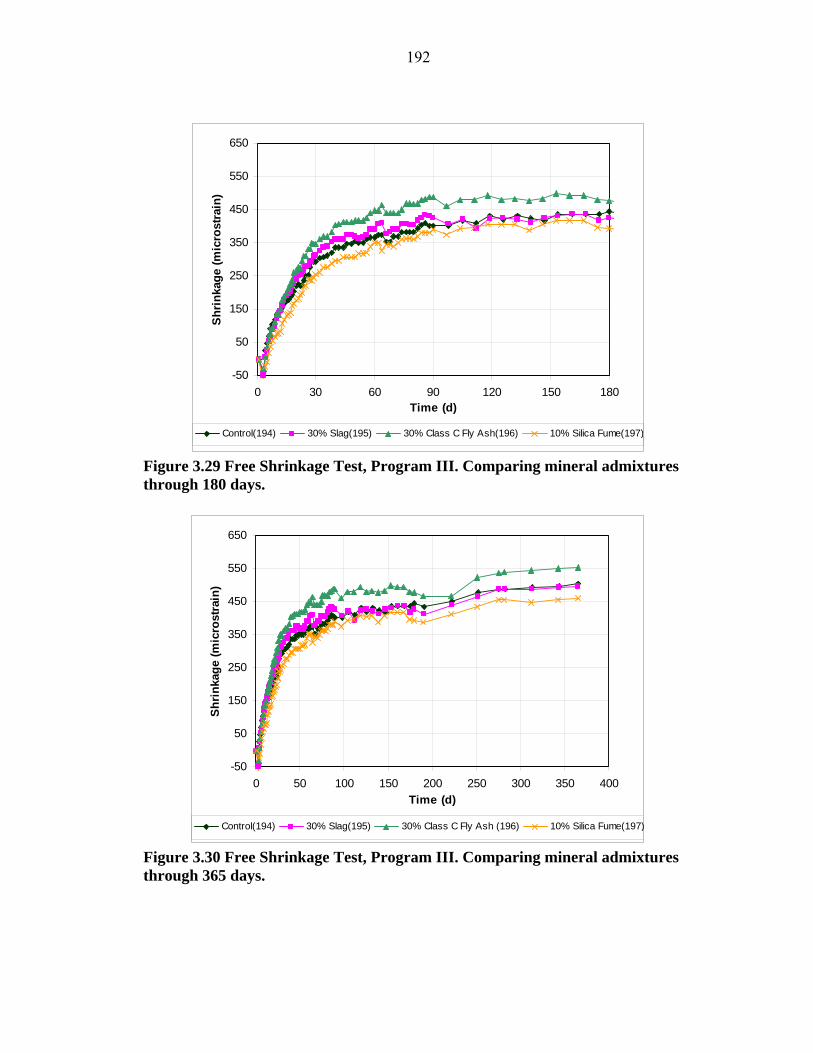
192
-50
50
150
250
350
450
550
650
0 30 60 90 120 150 180Time (d)
Shrin
kage
(mic
rost
rain
)
Control(194) 30% Slag(195) 30% Class C Fly Ash(196) 10% Silica Fume(197)
Figure 3.29 Free Shrinkage Test, Program III. Comparing mineral admixtures through 180 days.
-50
50
150
250
350
450
550
650
0 50 100 150 200 250 300 350 400Time (d)
Shri
nkag
e (m
icro
stra
in)
Control(194) 30% Slag(195) 30% Class C Fly Ash (196) 10% Silica Fume(197)
Figure 3.30 Free Shrinkage Test, Program III. Comparing mineral admixtures through 365 days.

193
-50
50
150
250
350
450
550
650
0 5 10 15 20 25 30
Time (d)
Shrin
kage
(mic
rost
rain
)
Control (202) Control With SP (203) 10% Silica Fume (204)
Figure 3.31 Free Shrinkage Test, Program III. Comparing Silica Fume and controls through 30 days.
-50
50
150
250
350
450
550
650
0 30 60 90 120 150 180
Time (d)
Shrin
kage
(mic
rost
rain
)
Control (202) Control With SP (203) 10% Silica Fume (204)
Figure 3.32 Free Shrinkage Test, Program III. Comparing Silica Fume and controls through 180 days.

194
-50
50
150
250
350
450
550
650
0 50 100 150 200 250 300 350 400
Time (d)
Shrin
kage
(mic
rost
rain
)
Control (202) Control With SP (203) 10% Silica Fume (204)
Figure 3.33 Free Shrinkage Test, Program III. Comparing Silica Fume and controls through 365 days.
-50
50
150
250
350
450
550
650
0 5 10 15 20 25 30
Time (d)
Shrin
kage
(mic
rost
rain
)
3 day 7 day 14 day 28 day
Figure 3.34 - Free Shrinkage, Program IV. Average free shrinkage vs. time for different curing times. Batch 165. Type I/II cement through 30 days.

195
-50
50
150
250
350
450
550
650
0 5 10 15 20 25 30
Time (d)
Shrin
kage
(miro
stra
in)
3 day 7 day 14 day 28 day
Figure 3.35 - Free Shrinkage, Program IV. Average free shrinkage vs. time for different curing times. Batch 165. Type I/II cement through 30 days. Drying only.
-50
50
150
250
350
450
550
650
0 30 60 90 120 150 180
Time (d)
Shrin
kage
(mic
rost
rain
)
3 day 7 day 14 day 28 day
Figure 3.36 - Free Shrinkage, Program IV. Average free shrinkage vs. time for different curing times. Batch 165. Type I/II cement through 180 days.
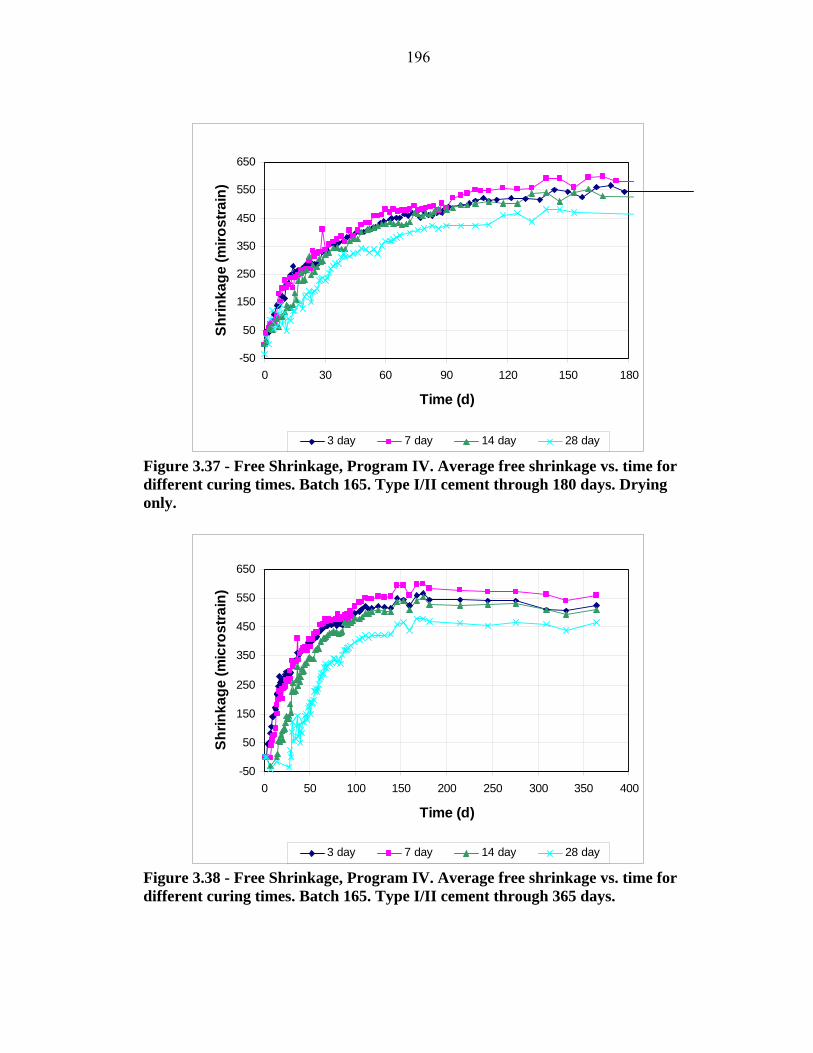
196
-50
50
150
250
350
450
550
650
0 30 60 90 120 150 180
Time (d)
Shrin
kage
(miro
stra
in)
3 day 7 day 14 day 28 day
Figure 3.37 - Free Shrinkage, Program IV. Average free shrinkage vs. time for different curing times. Batch 165. Type I/II cement through 180 days. Drying only.
-50
50
150
250
350
450
550
650
0 50 100 150 200 250 300 350 400
Time (d)
Shrin
kage
(mic
rost
rain
)
3 day 7 day 14 day 28 day
Figure 3.38 - Free Shrinkage, Program IV. Average free shrinkage vs. time for different curing times. Batch 165. Type I/II cement through 365 days.
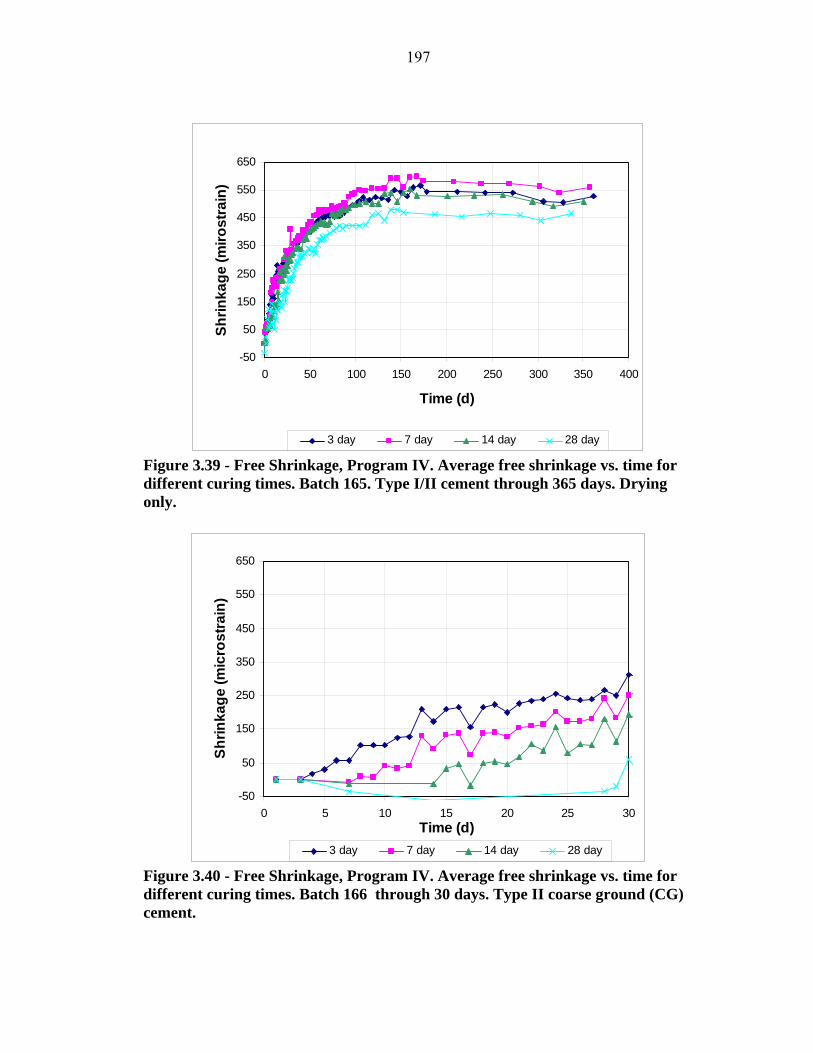
197
-50
50
150
250
350
450
550
650
0 50 100 150 200 250 300 350 400
Time (d)
Shrin
kage
(miro
stra
in)
3 day 7 day 14 day 28 day
Figure 3.39 - Free Shrinkage, Program IV. Average free shrinkage vs. time for different curing times. Batch 165. Type I/II cement through 365 days. Drying only.
-50
50
150
250
350
450
550
650
0 5 10 15 20 25 30Time (d)
Shrin
kage
(mic
rost
rain
)
3 day 7 day 14 day 28 day
Figure 3.40 - Free Shrinkage, Program IV. Average free shrinkage vs. time for different curing times. Batch 166 through 30 days. Type II coarse ground (CG) cement.

198
-50
50
150
250
350
450
550
650
0 5 10 15 20 25 30Time (d)
Shrin
kage
(mic
rost
rain
)
3 day 7 day 14 day 28 day
Figure 3.41 - Free Shrinkage, Program IV. Average free shrinkage vs. time for different curing times. Batch 166. Type II coarse ground (CG) cement through 30 days. Drying only.
-50
50
150
250
350
450
550
650
0 30 60 90 120 150 180Time (d)
Shrin
kage
(mic
rost
rain
)
3 day 7 day 14 day 28 day
Figure 3.42 - Free Shrinkage, Program IV. Average free shrinkage vs. time for different curing times. Batch 166 through 180 days. Type II coarse ground (CG) cement.

199
-50
50
150
250
350
450
550
650
0 30 60 90 120 150 180Time (d)
Shrin
kage
(mic
rost
rain
)
3 day 7 day 14 day 28 day
Figure 3.43 - Free Shrinkage, Program IV. Average free shrinkage vs. time for different curing times. Batch 166. Type II coarse ground (CG) cement through 180 days. Drying only.
-50
50
150
250
350
450
550
650
0 50 100 150 200 250 300 350 400Time (d)
Shrin
kage
(mic
rost
rain
)
3 day 7 day 14 day 28 day
Figure 3.44 - Free Shrinkage, Program IV. Average free shrinkage vs. time for different curing times. Batch 166 through 365 days. Type II coarse ground (CG) cement.

200
-50
50
150
250
350
450
550
650
0 50 100 150 200 250 300 350 400Time (d)
Shrin
kage
(mic
rost
rain
)
3 day 7 day 14 day 28 day
Figure 3.45 - Free Shrinkage, Program IV. Average free shrinkage vs. time for different curing times. Batch 166. Type II coarse ground (CG) cement through 365 days. Drying only.
-50
50
150
250
350
450
550
650
750
0 5 10 15 20 25 30
Time (d)
Shrin
kage
(mic
rost
rain
)
3 day 7 day 14 day 28 day
Figure 3.46 - Free Shrinkage, Program IV. Average free shrinkage vs. time for different curing times. Type I/II cement. Batch 201 through 30 days.

201
-50
50
150
250
350
450
550
650
750
0 5 10 15 20 25 30
Time (d)
Shrin
kage
(mic
rost
rain
)
3 day 7 day 14 day 28 day
Figure 3.47 - Free Shrinkage, Program IV. Average free shrinkage vs. time for different curing times. Type I/II cement. Batch 201 through 30 days. Drying only.
-50
50
150
250
350
450
550
650
750
0 30 60 90 120 150 180
Time (d)
Shrin
kage
(mic
rost
rain
)
3 day 7 day 14 day 28 day
Figure 3.48 - Free Shrinkage, Program IV. Average free shrinkage vs. time for different curing times. Type I/II cement. Batch 201 through 180 days.
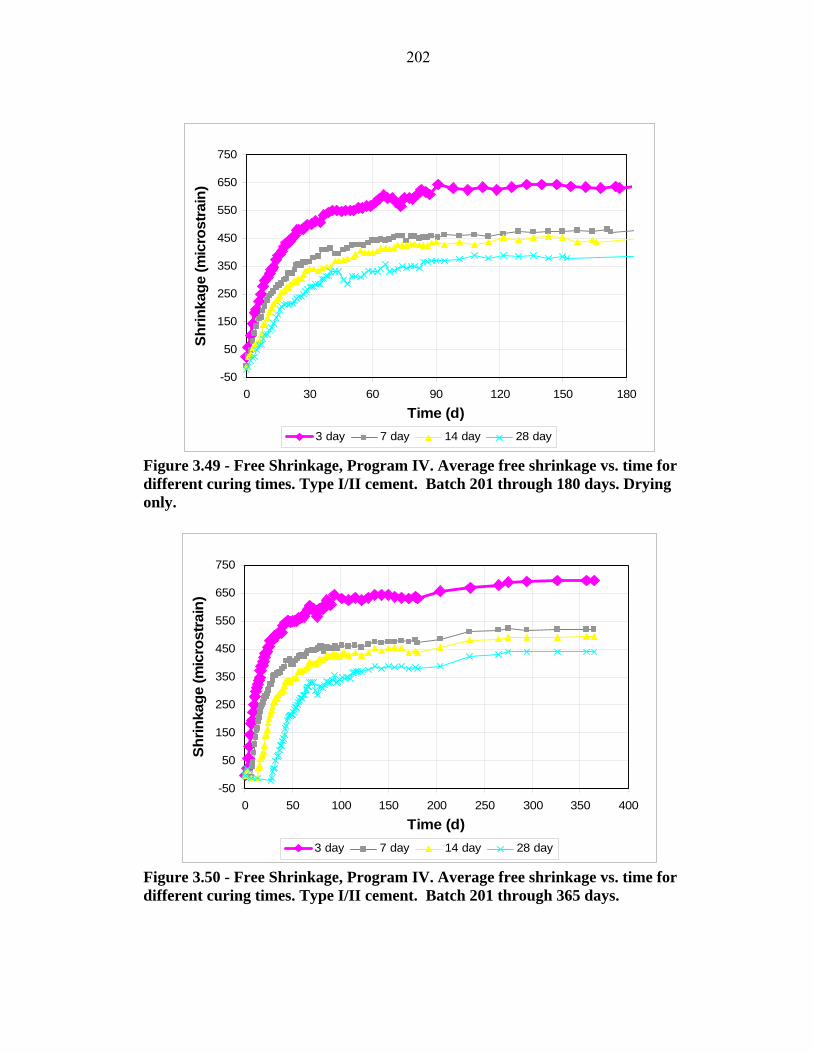
202
-50
50
150
250
350
450
550
650
750
0 30 60 90 120 150 180
Time (d)
Shrin
kage
(mic
rost
rain
)
3 day 7 day 14 day 28 day
Figure 3.49 - Free Shrinkage, Program IV. Average free shrinkage vs. time for different curing times. Type I/II cement. Batch 201 through 180 days. Drying only.
-50
50
150
250
350
450
550
650
750
0 50 100 150 200 250 300 350 400
Time (d)
Shrin
kage
(mic
rost
rain
)
3 day 7 day 14 day 28 day
Figure 3.50 - Free Shrinkage, Program IV. Average free shrinkage vs. time for different curing times. Type I/II cement. Batch 201 through 365 days.

203
-50
50
150
250
350
450
550
650
750
0 50 100 150 200 250 300 350 400Time (d)
Shr
inka
ge (m
icro
stra
in)
3 day 7 day 14 day 28 day
Figure 3.51 - Free Shrinkage, Program IV. Average free shrinkage vs. time for different curing times. Type I/II cement. Batch 201 through 365 days. Drying only.
-50
50
150
250
350
450
550
650
0 5 10 15 20 25 30
Time (d)
Shrin
kage
(mic
rost
rain
)
3 day 7 day 14 day 28 day
Figure 3.52 - Free Shrinkage, Program IV. Average free shrinkage vs. time for different curing times. Type II coarse ground (CG) cement. Batch 207 through 30 days.
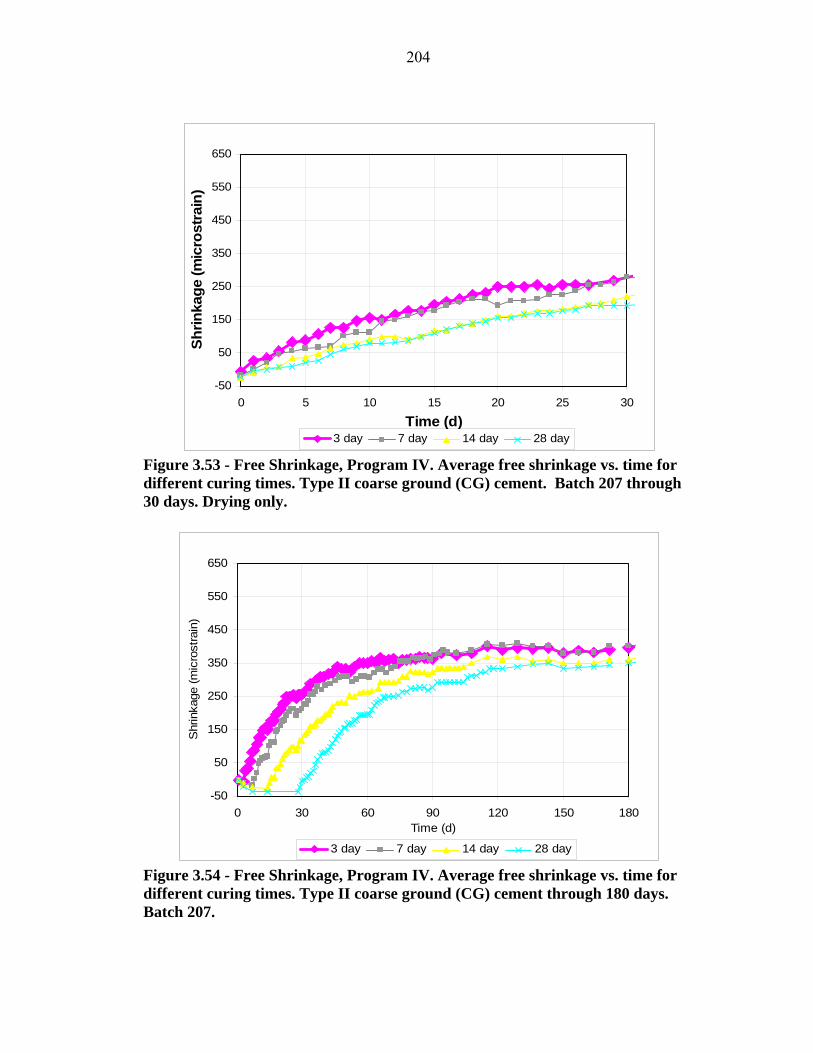
204
-50
50
150
250
350
450
550
650
0 5 10 15 20 25 30
Time (d)
Shrin
kage
(mic
rost
rain
)
3 day 7 day 14 day 28 day
Figure 3.53 - Free Shrinkage, Program IV. Average free shrinkage vs. time for different curing times. Type II coarse ground (CG) cement. Batch 207 through 30 days. Drying only.
-50
50
150
250
350
450
550
650
0 30 60 90 120 150 180Time (d)
Shr
inka
ge (m
icro
stra
in)
3 day 7 day 14 day 28 day
Figure 3.54 - Free Shrinkage, Program IV. Average free shrinkage vs. time for different curing times. Type II coarse ground (CG) cement through 180 days. Batch 207.

205
-50
50
150
250
350
450
550
650
0 30 60 90 120 150 180Time (d)
Shr
inka
ge (m
icro
stra
in)
3 day 7 day 14 day 28 day
Figure 3.55 - Free Shrinkage, Program IV. Average free shrinkage vs. time for different curing times. Type II coarse ground (CG) cement. Batch 207 through 180 days. Drying only.
-50
50
150
250
350
450
550
650
0 50 100 150 200 250 300 350 400Time (d)
Shr
inka
ge (m
icro
stra
in)
3 day 7 day 14 day 28 day
Figure 3.56 - Free Shrinkage, Program IV. Average free shrinkage vs. time for different curing times. Type II coarse ground (CG) cement. Batch 207 through 365 days.

206
-50
50
150
250
350
450
550
650
0 50 100 150 200 250 300 350 400Time (d)
Shr
inka
ge (m
icro
stra
in)
3 day 7 day 14 day 28 day
Figure 3.57 - Free Shrinkage, Program IV. Average free shrinkage vs. time for different curing times. Type II coarse ground (CG) cement. Batch 207 through 365 days. Drying only.
-50
50
150
250
350
450
550
650
0 50 100 150 200 250 300 350 400
Time (d)
Shrin
kage
(mic
rost
rain
)
I/II (165) II CG(166)
Figure 3.58 - Free Shrinkage, Program IV. Average free shrinkage vs. time for 3-day cure specimens. Comparing cement type through 365 days.
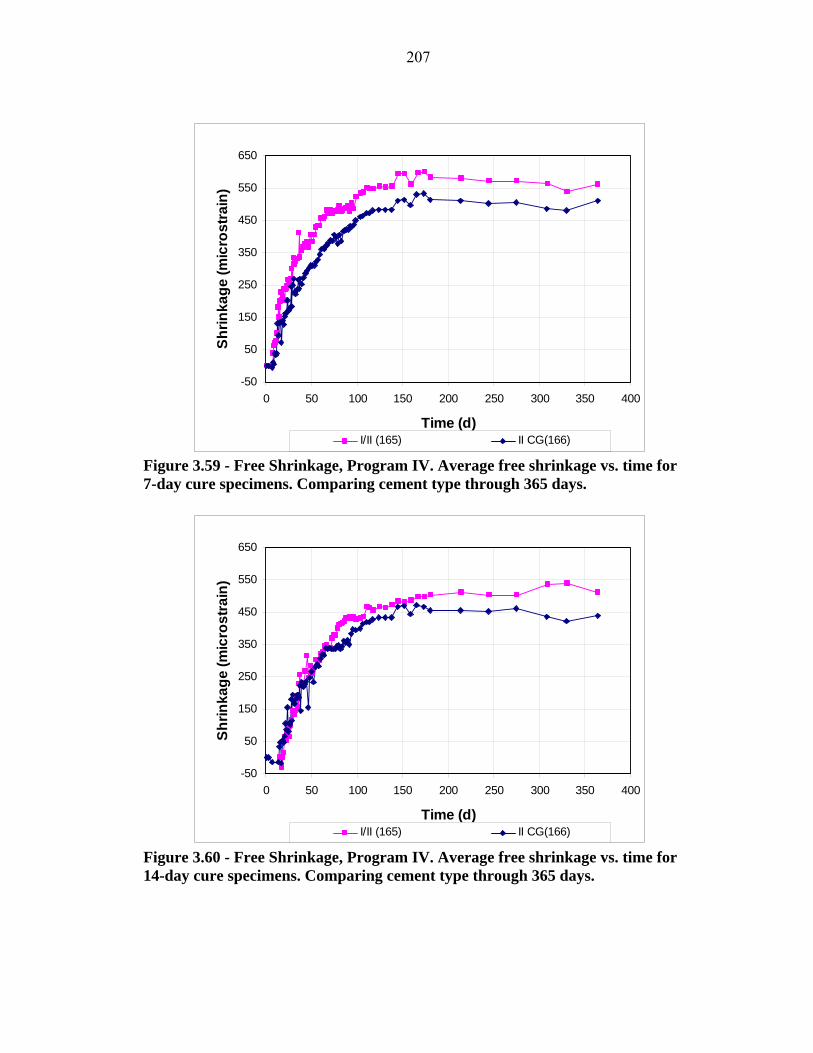
207
-50
50
150
250
350
450
550
650
0 50 100 150 200 250 300 350 400
Time (d)
Shrin
kage
(mic
rost
rain
)
I/II (165) II CG(166)
Figure 3.59 - Free Shrinkage, Program IV. Average free shrinkage vs. time for 7-day cure specimens. Comparing cement type through 365 days.
-50
50
150
250
350
450
550
650
0 50 100 150 200 250 300 350 400
Time (d)
Shrin
kage
(mic
rost
rain
)
I/II (165) II CG(166)
Figure 3.60 - Free Shrinkage, Program IV. Average free shrinkage vs. time for 14-day cure specimens. Comparing cement type through 365 days.

208
-50
50
150
250
350
450
550
650
0 50 100 150 200 250 300 350 400
Time (d)
Shrin
kage
(mic
rost
rain
)
I/II (165) II CG(166)
Figure 3.61 - Free Shrinkage, Program IV. Average free shrinkage vs. time for 28-day cure specimens. Comparing cement type through 365 days.
-50
50
150
250
350
450
550
650
750
0 50 100 150 200 250 300 350 400Time (d)
Shrin
kage
(mic
rost
rain
)
I/II (201) II-CG (207)
Figure 3.62 - Free Shrinkage, Program IV. Average free shrinkage vs. time for 3-day cure specimens. Comparing cement type through 365 days.

209
-50
50
150
250
350
450
550
650
750
0 50 100 150 200 250 300 350 400Time (d)
Shrin
kage
(mic
rost
rain
)
I/II (201) II-CG (207)
Figure 3.63 - Free Shrinkage, Program IV. Average free shrinkage vs. time for 7-day cure specimens. Comparing cement type through 365 days.
-50
50
150
250
350
450
550
650
750
0 50 100 150 200 250 300 350 400Time (d)
Shrin
kage
(mic
rost
rain
)
I/II (201) II-CG (207)
Figure 3.64 - Free Shrinkage, Program IV. Average free shrinkage vs. time for 14-day cure specimens. Comparing cement type through 365 days.

210
-50
50
150
250
350
450
550
650
750
0 50 100 150 200 250 300 350 400Time (d)
Shrin
kage
(mic
rost
rain
)
I/II (201) II-CG (207)
Figure 3.65 - Free Shrinkage, Program IV. Average free shrinkage vs. time for 28-day cure specimens. Comparing cement type through 365 days.
-50
50
150
250
350
450
550
650
0 5 10 15 20 25 30
Time (d)
Shrin
kage
(mic
rost
rain
)
Control (167) Low (168) Medium (169) High (174)
Figure 3.66 Free Shrinkage Test, Program V. Average free shrinkage vs. time. Comparing different dosages of Glenium 3000 NS through 30 days.
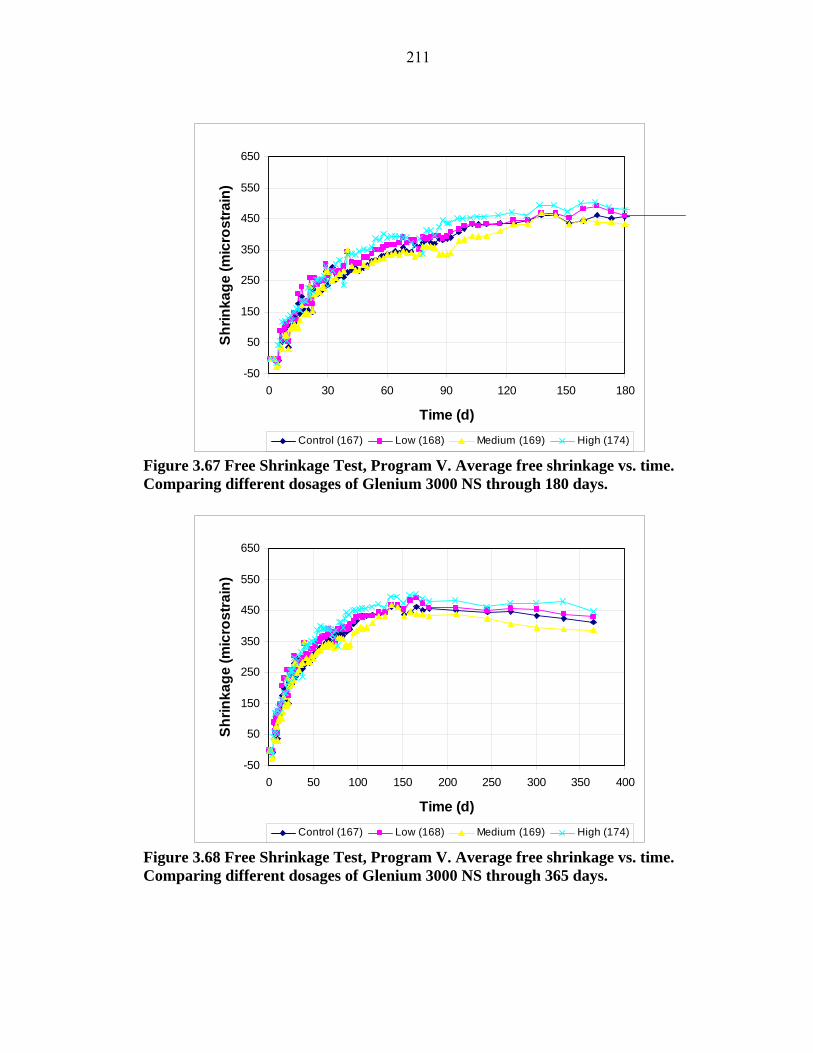
211
-50
50
150
250
350
450
550
650
0 30 60 90 120 150 180
Time (d)
Shrin
kage
(mic
rost
rain
)
Control (167) Low (168) Medium (169) High (174)
Figure 3.67 Free Shrinkage Test, Program V. Average free shrinkage vs. time. Comparing different dosages of Glenium 3000 NS through 180 days.
-50
50
150
250
350
450
550
650
0 50 100 150 200 250 300 350 400
Time (d)
Shrin
kage
(mic
rost
rain
)
Control (167) Low (168) Medium (169) High (174)
Figure 3.68 Free Shrinkage Test, Program V. Average free shrinkage vs. time. Comparing different dosages of Glenium 3000 NS through 365 days.

212
-50
50
150
250
350
450
550
650
0 5 10 15 20 25 30
Time (d)
Shrin
kage
(mic
rost
rain
)
Control (167) Low (171) Medium (172) High (173)
Figure 3.69 Free Shrinkage Test, Program V. Average free shrinkage vs. time. Comparing different dosages of Rheobuild 1000 through 30 days.
-50
50
150
250
350
450
550
650
0 30 60 90 120 150 180
Time (d)
Shrin
kage
(mic
rost
rain
)
Control (167) Low (171) Medium (172) High (173)
Figure 3.70 Free Shrinkage Test, Program V. Average free shrinkage vs. time. Comparing different dosages of Rheobuild 1000 through 180 days.

213
-50
50
150
250
350
450
550
650
0 50 100 150 200 250 300 350 400
Time (d)
Shrin
kage
(mic
rost
rain
)
Control (167) Low (171) Medium (172) High (173)
Figure 3.71 Free Shrinkage Test, Program V. Average free shrinkage vs. time. Comparing different dosages of Rheobuild 1000 through 365 days.
-50
50
150
250
350
450
550
650
0 5 10 15 20 25 30Time (d)
Shr
inka
ge (m
icro
stra
in)
Control (175) Low (176) Medium (177) High (178)
Figure 3.72 Free Shrinkage Test, Program V. Average free shrinkage vs. time. Comparing different dosages of Glenium 3000 NS through 30 days.

214
-50
50
150
250
350
450
550
650
0 30 60 90 120 150 180Time (d)
Shr
inka
ge (m
icro
stra
in)
Control (175) Low (176) Medium (177) High (178)
Figure 3.73 Free Shrinkage Test, Program V. Average free shrinkage vs. time. Comparing different dosages of Glenium 3000 NS through 180 days.
-50
50
150
250
350
450
550
650
0 50 100 150 200 250 300 350 400Time (d)
Shr
inka
ge (m
icro
stra
in)
Control (175) Low (176) Medium (177) High (178)
Figure 3.74 Free Shrinkage Test, Program V. Average free shrinkage vs. time. Comparing different dosages of Glenium 3000 NS through 365 days.

215
-50
50
150
250
350
450
550
650
0 5 10 15 20 25 30
Time (d)
Shrin
kage
(mic
rost
rain
)
Control (175) Low (179) Medium (180) High(181) High (182)
Figure 3.75 Free Shrinkage Test, Program V. Average free shrinkage vs. time. Comparing different dosages of Rheobuild 1000 through 30 days.
-50
50
150
250
350
450
550
650
0 30 60 90 120 150 180
Time (d)
Shrin
kage
(mic
rost
rain
)
Control (175) Low (179) Medium (180) High(181) High (182)
Figure 3.76 Free Shrinkage Test, Program V. Average free shrinkage vs. time. Comparing different dosages of Rheobuild 1000 through 180 days.

216
-50
50
150
250
350
450
550
650
0 50 100 150 200 250 300 350 400
Time (d)
Shrin
kage
(mic
rost
rain
)
Control (175) Low (179) Medium (180) High(181) High (182)
Figure 3.77 Free Shrinkage Test, Program V. Average free shrinkage vs. time. Comparing different dosages of Rheobuild 1000 through 365 days.
-50
50
150
250
350
450
550
650
0 5 10 15 20 25 30
Time (d)
Shrin
kage
(mic
rost
rain
)
Control (183) Low (184) Medium (185) High (186)
Figure 3.78 Free Shrinkage Test, Program V. Average free shrinkage vs. time. Comparing different dosages of Adva 100 through 30 days.

217
-50
50
150
250
350
450
550
650
0 30 60 90 120 150 180
Time (d)
Shrin
kage
(mic
rost
rain
)
Control (183) Low (184) Medium (185) High (186)
Figure 3.79 Free Shrinkage Test, Program V. Average free shrinkage vs. time. Comparing different dosages of Adva 100 through 180 days.
-50
50
150
250
350
450
550
650
0 50 100 150 200 250 300 350 400
Time (d)
Shrin
kage
(mic
rost
rain
)
Control (183) Low (184) Medium (185) High (186)
Figure 3.80 Free Shrinkage Test, Program V. Average free shrinkage vs. time. Comparing different dosages of Adva 100 through 365 days.

218
-50
50
150
250
350
450
550
650
0 5 10 15 20 25 30
Time (d)
Shrin
kage
(mic
rost
rain
)
Control (193) Low (190) Medium (191) High (192)
Figure 3.81 Free Shrinkage Test, Program V. Average free shrinkage vs. time. Comparing different dosages of Adva 100 through 30 days.
-50
50
150
250
350
450
550
650
0 30 60 90 120 150 180
Time (d)
Shrin
kage
(mic
rost
rain
)
Control (193) Low (190) Medium (191) High (192)
Figure 3.82 Free Shrinkage Test, Program V. Average free shrinkage vs. time. Comparing different dosages of Adva 100 through 180 days.

219
-50
50
150
250
350
450
550
650
0 50 100 150 200 250 300 350 400
Time (d)
Shrin
kage
(mic
rost
rain
)
Control (193) Low (190) Medium (191) High (192)
Figure 3.83 Free Shrinkage Test, Program V. Average free shrinkage vs. time. Comparing different dosages of Adva 100 through 365 days.
-50
50
150
250
350
450
550
650
0 5 10 15 20 25 30Time (d)
Shrin
kage
(mic
rost
rain
)
Control (208) Adva 100 (209)Glenium 3000 NS (210) Rheobuild 1000 (211)
Figure 3.84 Free Shrinkage Test, Program V. Average free shrinkage vs. time. Comparing different Superplasticizers (Dosages for same slump) through 30 days.

220
-50
50
150
250
350
450
550
650
0 30 60 90 120 150 180Time (d)
Shrin
kage
(mic
rost
rain
)
Control (208) Adva 100 (209)Glenium 3000 NS (210) Rheobuild 1000 (211)
Figure 3.85 Free Shrinkage Test, Program V. Average free shrinkage vs. time. Comparing different Superplasticizers (Dosages for same slump) through 180 days.
-50
50
150
250
350
450
550
650
0 50 100 150 200 250 300 350 400Time (d)
Shrin
kage
(mic
rost
rain
)
Control (208) Adva 100 (209)Glenium 3000 NS (210) Rheobuild 1000 (211)
Figure 3.86 Free Shrinkage Test, Program V. Average free shrinkage vs. time. Comparing different Superplasticizers (Dosages for same slump) through 365 days.

221
-50
50
150
250
350
450
550
650
750
0 5 10 15 20 25 30Time (d)
Shrin
kage
(mic
rost
rain
)
Control (260) Adva 100 (259)Glenium 3000 NS (249) Rheobuild 1000 (256)
Figure 3.87 Free Shrinkage Test, Program V. Average free shrinkage vs. time. Comparing different Superplasticizers (Dosages for same slump) through 30 days.
-50
50
150
250
350
450
550
650
750
0 30 60 90 120 150 180Time (d)
Shrin
kage
(mic
rost
rain
)
Control (260) Adva 100 (259)Glenium 3000 NS (249) Rheobuild 1000 (256)
Figure 3.88 Free Shrinkage Test, Program V. Average free shrinkage vs. time. Comparing different Superplasticizers (Dosages for same slump) through 180 days.

222
-50
50
150
250
350
450
550
650
750
0 50 100 150 200 250 300 350 400Time (d)
Shrin
kage
(mic
rost
rain
)
Control (260) Adva 100 (259)Glenium 3000 NS (249) Rheobuild 1000 (256)
Figure 3.89 Free Shrinkage Test, Program V. Average free shrinkage vs. time. Comparing different Superplasticizers (Dosages for same slump) through 365 days.

223
APPENDIX A
-50
50
150
250
350
450
550
650
0 50 100 150 200 250 300 350 400
Time (d)
Free
Shr
inka
ge (m
icro
stra
in)
Prism A Prism B Prism C
Figure A3.1 - Free Shrinkage, Batch 62. 80% Aggregate, 0.40 w/c. Type I/II cement. Drying begins at 3 days.
-50
50
150
250
350
450
550
650
0 50 100 150 200 250 300 350 400
Time (d)
Free
Shr
inka
ge (m
icro
stra
in)
Prism A Prism B Prism C
Figure A3.2 - Free Shrinkage, Batch 63. 80% Aggregate, 0.45 w/c. Type I/II cement. Drying begins at 3 days.

224
-50
50
150
250
350
450
550
650
0 50 100 150 200 250 300 350 400
Time (d)
Free
Shr
inka
ge (m
icro
stra
in)
Prism A Prism B Prism C
Figure A3.3 - Free Shrinkage, Batch 64. 70% Aggregate, 0.45 w/c. Type I/II cement. Drying begins at 3 days.
-50
50
150
250
350
450
550
650
0 50 100 150 200 250 300 350 400
Time (d)
Free
Shr
inka
ge (m
icro
stra
in)
Prism A Prism B Prism C
Figure A3.4 - Free Shrinkage, Batch 65. 70% Aggregate, 0.50 w/c. Type I/II cement. Drying begins on day 3.

225
-50
50
150
250
350
450
550
650
0 50 100 150 200 250 300 350 400
Time (d)
Free
Shr
inka
ge (m
icro
stra
in)
Prism A Prism B Prism C
Figure A3.5 - Free Shrinkage, Batch 66. 70% Aggregate, 0.40 w/c. Type I/II cement. Drying begins on day 3.
-50
50
150
250
350
450
550
650
0 50 100 150 200 250 300 350 400
Time (d)
Free
Shr
inka
ge (m
icro
stra
in)
Prism A Prism B Prism C
Figure A3.6 - Free Shrinkage, Batch 67. 80% Aggregate, 0.50 w/c. Type I/II cement. Drying begins on day 3.

226
-50
50
150
250
350
450
550
650
750
850
0 50 100 150 200 250 300 350 400
Time (d)
Free
Shr
inka
ge (m
icro
stra
in)
Prism A Prism B Prism C
Figure A3.7 - Free Shrinkage, Batch 68. 60% Aggregate, 0.40 w/c. Type I/II cement. Drying begins on day 3.
-50
50
150
250
350
450
550
650
750
850
0 50 100 150 200 250 300 350 400
Time (d)
Free
Shr
inka
ge (m
icro
stra
in)
Prism A Prism B Prism C
Figure A3.8 - Free Shrinkage, Batch 69. 60% Aggregate, 0.45 w/c., Type I/II cement. Drying begins on day 3.

227
-50
50
150
250
350
450
550
650
750
850
0 50 100 150 200 250 300 350 400
Time (d)
Free
Shr
inka
ge (m
icro
stra
in)
Prism A Prism B Prism C
Figure A3.9- Free Shrinkage, Batch 70. 60% Aggregate, 0.50 w/c. Type I/II cement. Drying begins on day 3.
-50
50
150
250
350
450
550
650
0 50 100 150 200 250 300 350 400
Time (d)
Free
Shr
inka
ge (m
icro
stra
in)
Prism A Prism B Prism C
Figure A3.10 - Free Shrinkage, Batch 71. 80% Aggregate, 0.40 w/c. Type II coarse ground (CG) cement. Drying begins on day 3.

228
-50
50
150
250
350
450
550
650
0 50 100 150 200 250 300 350 400
Time (d)
Free
Shr
inka
ge (m
icro
stra
in)
Prism A Prism B Prism C
Figure A3.11 - Free Shrinkage, Batch 72. 80% Aggregate, 0.45 w/c. Type II coarse ground (CG) cement. Drying begins on day 3.
-50
50
150
250
350
450
550
650
0 50 100 150 200 250 300 350 400
Time (d)
Free
Shr
inka
ge (m
icro
stra
in)
Prism A Prism B Prism C
Figure A3.12 - Free Shrinkage, Batch 73. 80% Aggregate, 0.50 w/c. Type II coarse ground (CG) cement. Drying begins on day 3.

229
-50
50
150
250
350
450
550
650
0 50 100 150 200 250 300 350 400
Time (d)
Free
Shr
inka
ge (m
icro
stra
in)
Prism A Prism B Prism C
Figure A3.13 - Free Shrinkage, Batch 74. 70% Aggregate, 0.40 w/c. Type II CG cement. Drying begins on day 3.
-50
50
150
250
350
450
550
650
0 50 100 150 200 250 300 350 400
Time (d)
Free
Shr
inka
ge (m
icro
stra
in)
Prism A Prism B Prism C
Figure A3.14 - Free Shrinkage, Batch 75. 70% Aggregate, 0.45 w/c. Type II coarse ground (CG) cement. Drying begins on day 3.

230
-50
50
150
250
350
450
550
650
0 50 100 150 200 250 300 350 400
Time (d)
Free
Shr
inka
ge (m
icro
stra
in)
Prism A Prism B Prism C
Figure A3.15 - Free Shrinkage, Batch 76. 70% Aggregate, 0.50 w/c. Type II coarse ground (CG) cement. Drying begins on day 3.
-50
50
150
250
350
450
550
650
0 50 100 150 200 250 300 350 400
Time (d)
Free
Shr
inka
ge (m
icro
stra
in)
Prism A Prism B Prism C
Figure A3.16 - Free Shrinkage, Batch 77. 60% Aggregate, 0.40 w/c. Type II coarse ground (CG) cement. Drying begins on day 3.

231
-50
50
150
250
350
450
550
650
0 50 100 150 200 250 300 350 400
Time (d)
Free
Shr
inka
ge (m
icro
stra
in)
Prism A Prism B Prism C
Figure A3.17 - Free Shrinkage, Batch 78. 60% Aggregate, 0.45 w/c. Type II coarse ground (CG) cement. Drying begins on day 3.
-50
50
150
250
350
450
550
650
0 50 100 150 200 250 300 350 400
Time (d)
Free
Shr
inka
ge (m
icro
stra
in)
Prism A Prism B Prism C
Figure A3.18 - Free Shrinkage, Batch 79. 60% Aggregate, 0.50 w/c. Type II coarse ground (CG) cement. Drying begins on day 3.

232
-50
50
150
250
350
450
550
650
0 50 100 150 200 250 300 350 400
Time (d)
Free
Shr
inka
ge (m
icro
stra
in)
Prism A Prism B Prism C
Figure A3.19 - Free Shrinkage, Batch 94. 70% Aggregate, 0.45 w/c. Type I/II cement. Drying begins at 3 days. Quartzite.
-50
50
150
250
350
450
550
650
0 50 100 150 200 250 300 350 400
Time (d)
Free
Shr
inka
ge (m
icro
stra
in)
Prism A Prism B Prism C
Figure A3.20 - Free Shrinkage, Batch 95. 70% Aggregate, 0.45 w/c. Type I/II cement. Drying begins at 3 days. Limestone.
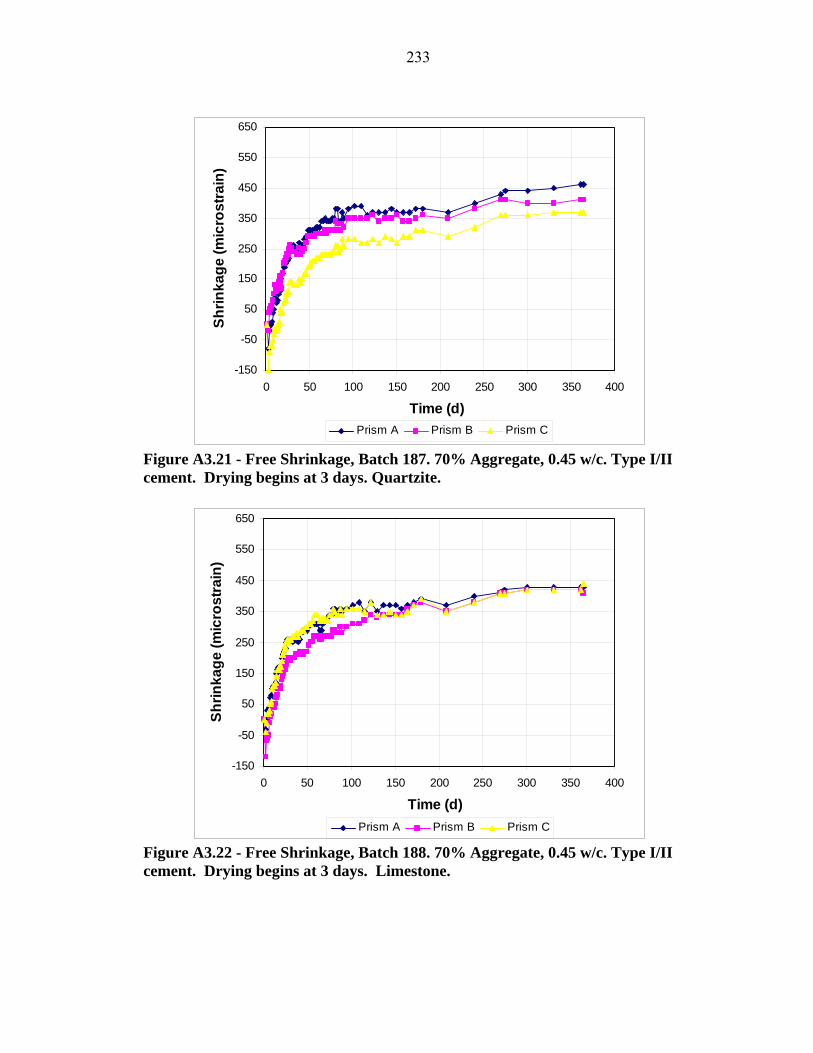
233
-150
-50
50
150
250
350
450
550
650
0 50 100 150 200 250 300 350 400
Time (d)
Shrin
kage
(mic
rost
rain
)
Prism A Prism B Prism C
Figure A3.21 - Free Shrinkage, Batch 187. 70% Aggregate, 0.45 w/c. Type I/II cement. Drying begins at 3 days. Quartzite.
-150
-50
50
150
250
350
450
550
650
0 50 100 150 200 250 300 350 400
Time (d)
Shrin
kage
(mic
rost
rain
)
Prism A Prism B Prism C
Figure A3.22 - Free Shrinkage, Batch 188. 70% Aggregate, 0.45 w/c. Type I/II cement. Drying begins at 3 days. Limestone.

234
-150
-50
50
150
250
350
450
550
650
0 50 100 150 200 250 300 350 400
Time (d)
Shrin
kage
(mic
rost
rain
)
Prism A Prism B Prism C
Figure A3.23 - Free Shrinkage, Batch 189. 70% Aggregate, 0.45 w/c. Type I/II cement. Drying begins at 3 days. Granite.
-50
50
150
250
350
450
550
650
0 50 100 150 200 250 300 350 400
Time (d)
Shrin
kage
(mic
rost
rain
)
Prism A Prism B Prism C Avg
Figure A3.24 - Free Shrinkage, Batch 198. 70% Aggregate, 0.45 w/c. Type I/II cement. Drying begins at 3 days. Quartzite.

235
-50
50
150
250
350
450
550
650
0 50 100 150 200 250 300 350 400
Time (d)
Shrin
kage
(mic
rost
rain
)
Prism A Prism B Prism C Avg
Figure A3.25 - Free Shrinkage, Batch 199. 70% Aggregate, 0.45 w/c. Type I/II cement. Drying begins at 3 days. Limestone.
-50
50
150
250
350
450
550
650
0 50 100 150 200 250 300 350 400
Time (d)
Shrin
kage
(mic
rost
rain
)
Prism A Prism B Prism C Avg
Figure A3.26 - Free Shrinkage, Batch 200. 70% Aggregate, 0.45 w/c. Type I/II cement. Drying begins at 3 days. Granite.

236
-50
50
150
250
350
450
550
650
0 50 100 150 200 250 300 350 400
Time (d)
Shrin
kage
(mic
rost
rain
)
Prism A Prism B Prism C
Figure A3.27 - Free Shrinkage, Batch 262. 68.8% Aggregate, 0.45 w/c. Type I/II cement. Air-entrained concrete. Drying begins at 3 days. Quartzite.
-50
50
150
250
350
450
550
650
0 50 100 150 200 250 300 350 400
Time (d)
Shrin
kage
(mic
rost
rain
)
Prism A Prism B Prism C
Figure A3.28 - Free Shrinkage, Batch 263. 68.8% Aggregate, 0.45 w/c. Type I/II cement. Air-entrained concrete. Drying begins at 3 days. Limestone.

237
-50
50
150
250
350
450
550
650
0 50 100 150 200 250 300 350 400
Time (d)
Shrin
kage
(mic
rost
rain
)
Prism A Prism B Prism C
Figure A3.29 - Free Shrinkage, Batch 264. 68.8% Aggregate, 0.45 w/c., Type I/II cement. Air-entrained concrete. Drying begins at 3 days. Granite.
-50
50
150
250
350
450
550
650
0 50 100 150 200 250 300 350 400
Time (d)
Shrin
kage
(mic
rost
rain
)
Prism A Prism B Prism C
Figure A3.30 - Free Shrinkage, Batch 85. 70% Aggregate, 0.45 w/c. Type I/II cement. Drying begins at 3 days. Control, no mineral admixtures.

238
-50
50
150
250
350
450
550
650
0 50 100 150 200 250 300 350 400
Time (d)
Shr
inka
ge (m
icro
stra
in)
Prism A Prism B Prism C
Figure A3.31 - Free Shrinkage, Batch 86. 70% Aggregate, 0.45 w/c. Type I/II cement. Drying begins at 3 days. 30% slag replacement.
-50
50
150
250
350
450
550
650
0 50 100 150 200 250 300 350 400
Time (d)
Shr
inka
ge (m
icro
stra
in)
Prism A Prism B Prism C
Figure A3.32 - Free Shrinkage, Batch 87. 70% Aggregate, 0.45 w/c. Type I/II cement. Drying begins at 3 days. 30% Class C Fly Ash replacement.
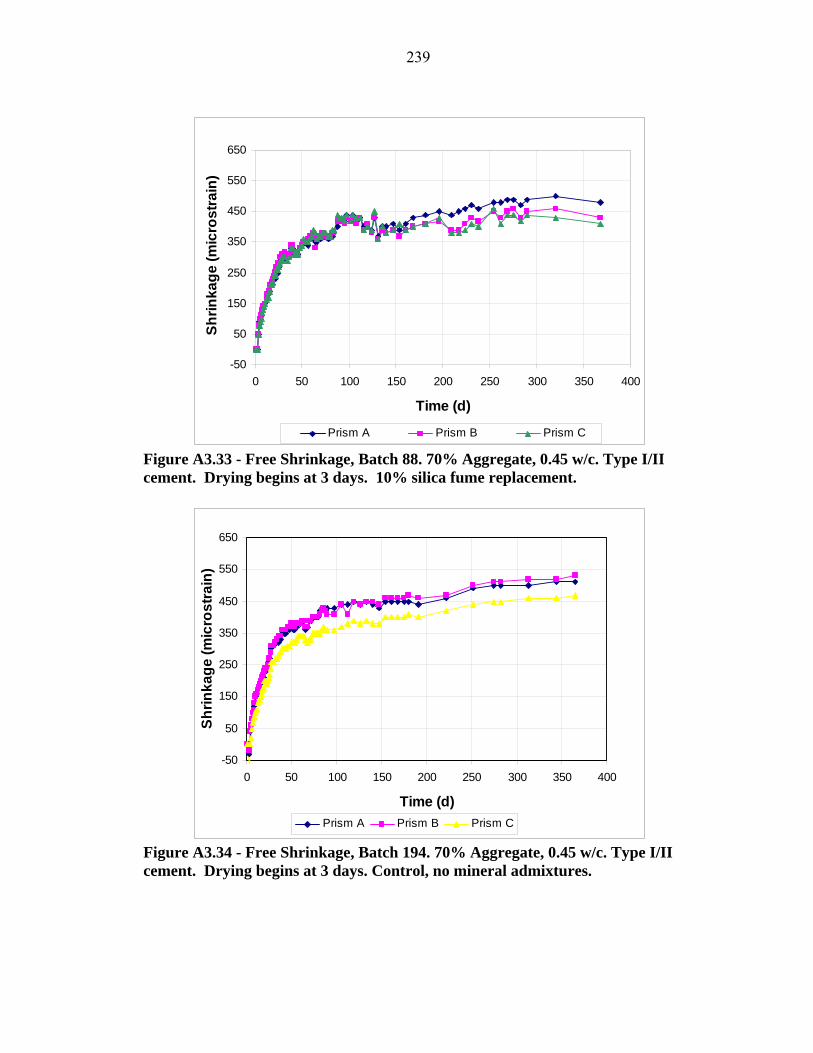
239
-50
50
150
250
350
450
550
650
0 50 100 150 200 250 300 350 400
Time (d)
Shr
inka
ge (m
icro
stra
in)
Prism A Prism B Prism C
Figure A3.33 - Free Shrinkage, Batch 88. 70% Aggregate, 0.45 w/c. Type I/II cement. Drying begins at 3 days. 10% silica fume replacement.
-50
50
150
250
350
450
550
650
0 50 100 150 200 250 300 350 400
Time (d)
Shrin
kage
(mic
rost
rain
)
Prism A Prism B Prism C
Figure A3.34 - Free Shrinkage, Batch 194. 70% Aggregate, 0.45 w/c. Type I/II cement. Drying begins at 3 days. Control, no mineral admixtures.

240
-50
50
150
250
350
450
550
650
0 50 100 150 200 250 300 350 400
Time (d)
Shrin
kage
(mic
rost
rain
)
Prism A Prism B Prism C
Figure A3.35 - Free Shrinkage, Batch 195. 70% Aggregate, 0.45 w/c. Type I/II cement. Drying begins at 3 days. 30% Replacement by Slag.
-50
50
150
250
350
450
550
650
0 50 100 150 200 250 300 350 400
Time (d)
Shrin
kage
(mic
rost
rain
)
Prism A Prism B Prism C
Figure A3.36 - Free Shrinkage, Batch 196. 70% Aggregate, 0.45 w/c. Type I/II cement. Drying begins at 3 days. 30% Replacement by Class C Fly Ash.

241
-50
50
150
250
350
450
550
650
0 50 100 150 200 250 300 350 400
Time (d)
Shrin
kage
(mic
rost
rain
)
Prism A Prism B Prism C
Figure A3.37 - Free Shrinkage, Batch 197. 70% Aggregate, 0.45 w/c. Type I/II cement. Drying begins at 3 days. 10% Replacement by Silica Fume.
-50
50
150
250
350
450
550
650
0 50 100 150 200 250 300 350 400
Time (d)
Shrin
kage
(mic
rost
rain
)
Prism A Prism B Prism C
Figure A3.38 - Free Shrinkage, Batch 202. 70% Aggregate, 0.45 w/c. Type I/II cement. Drying begins at 3 days. Control, no mineral admixtures.

242
-50
50
150
250
350
450
550
650
0 50 100 150 200 250 300 350 400
Time (d)
Shrin
kage
(mic
rost
rain
)
Prism A Prism B Prism C
Figure A3.39 - Free Shrinkage, Batch 203. 70% Aggregate, 0.45 w/c. Type I/II cement. Drying begins at 3 days. Control, no mineral admixtures. Adva superplasticizer.
-50
50
150
250
350
450
550
650
0 50 100 150 200 250 300 350 400
Time (d)
Shrin
kage
(mic
rost
rain
)
Prism A Prism B Prism C
Figure A3.40 - Free Shrinkage, Batch 204. 70% Aggregate, 0.45 w/c. Type I/II cement. Drying begins at 3 days. 10% Replacement by Silica Fume. Adva superplasticizer.

243
-50
50
150
250
350
450
550
650
0 50 100 150 200 250 300 350 400
Time (d)
Shrin
kage
(mic
rost
rain
)
Prism A Prism B Prism C
Figure A3.41 - Free Shrinkage, Batch 165, 3-day cure. 70% Aggregate, 0.45 w/c. Type I/II cement. Drying begins at 3 days.
-50
50
150
250
350
450
550
650
0 50 100 150 200 250 300 350 400
Time (d)
Shrin
kage
(mic
rost
rain
)
Prism A Prism B Prism C
Figure A3.42 - Free Shrinkage, Batch 165, 7-day cure. 70% Aggregate, 0.45 w/c. Type I/II cement. Drying begins at 7 days.

244
-50
50
150
250
350
450
550
650
0 50 100 150 200 250 300 350 400
Time (d)
Shrin
kage
(mic
rost
rain
)
Prism A Prism B Prism C
Figure A3.43 - Free Shrinkage, Batch 165, 14-day cure. 70% Aggregate, 0.45 w/c. Type I/II cement. Drying begins at 14 days.
-50
50
150
250
350
450
550
650
0 50 100 150 200 250 300 350 400
Time (d)
Shrin
kage
(miro
stra
in)
Prism A Prism B Prism C
Figure A3.44 - Free Shrinkage, Batch 165, 28-day cure. 70% Aggregate, 0.45 w/c. Type I/II cement. Drying begins at 28 days.

245
-50
50
150
250
350
450
550
650
0 50 100 150 200 250 300 350 400
Time (d)
Shrin
kage
(mic
rost
rain
)
Prism A Prism B Prism C
Figure A3.45 - Free Shrinkage, Batch 166, 3-day cure. 70% Aggregate, 0.45 w/c. Type II coarse ground (CG) cement. Drying begins at 3 days.
-50
50
150
250
350
450
550
650
0 50 100 150 200 250 300 350 400
Time (d)
Shrin
kage
(mic
rost
rain
)
Prism A Prism B Prism C
Figure A3.46 - Free Shrinkage, Batch 166, 7-day cure. 70% Aggregate, 0.45 w/c. Type II coarse ground (CG) cement. Drying begins at 7 days.

246
-50
50
150
250
350
450
550
650
0 50 100 150 200 250 300 350 400
Time (d)
Shrin
kage
(mic
rost
rain
)
Prism A Prism B Prism C
Figure A3.47 - Free Shrinkage, Batch 166, 14-day cure. 70% Aggregate, 0.45 w/c. Type II coarse ground (CG) cement. Drying begins at 14 days.
-50
50
150
250
350
450
550
650
0 50 100 150 200 250 300 350 400
Time (d)
Shrin
akge
(mic
rost
rain
)
Prism A Prism B Prism C
Figure A3.48 - Free Shrinkage, Batch 166, 28-day cure. 70% Aggregate, 0.45 w/c. Type II coarse ground (CG) cement. Drying begins at 28 days.

247
-50
50
150
250
350
450
550
650
750
0 50 100 150 200 250 300 350 400
Time (d)
Shr
inka
ge (m
icro
stra
in)
Prism A Prism B Prism C
Figure A3.49 Free Shrinkage, Batch 201(3-days-cured), 70% Aggregate, 0.45 w/c ratio, Type I/II Cement. Drying begins at 3 days.
-50
50
150
250
350
450
550
650
750
0 50 100 150 200 250 300 350 400
Time (d)
Shr
inka
ge (m
icro
stra
in)
Prism A Prism B Prism C
Figure A3.50 Free Shrinkage, Batch 201(7-days-cured), 70% Aggregate, 0.45 w/c ratio, Type I/II Cement. Drying begins at 7 days.

248
-50
50
150
250
350
450
550
650
750
0 50 100 150 200 250 300 350 400
Time (d)
Shr
inka
ge (m
icro
stra
in)
Prism A Prism B Prism C
Figure A3.51 Free Shrinkage, Batch 201(14-days-cured), 70% Aggregate, 0.45 w/c ratio, Type I/II Cement. Drying begins at 14 days.
-50
50
150
250
350
450
550
650
750
0 50 100 150 200 250 300 350 400
Time (d)
Shr
inka
ge (m
icro
stra
in)
Prism A Prism B Prism C
Figure A3.52 Free Shrinkage, Batch 201(28-days-cured), 70% Aggregate, 0.45 w/c ratio, Type I/II Cement. Drying begins at 28 days.

249
-50
50
150
250
350
450
550
650
0 50 100 150 200 250 300 350 400
Time (d)
Shr
inka
ge (m
icro
stra
in)
Prism A Prism B Prism C
Figure A3.53 Free Shrinkage, Batch 207(3-days-cured), 70% Aggregate, 0.45 w/c ratio, Type II coarse ground (CG) cement. Drying begins at 3 days.
-50
50
150
250
350
450
550
650
0 50 100 150 200 250 300 350 400
Time (d)
Shr
inka
ge (m
icro
stra
in)
Prism A Prism B Prism C
Figure A3.54 Free Shrinkage, Batch 207(7-days-cured), 70% Aggregate, 0.45 w/c ratio, Type II coarse ground (CG) cement. Drying begins at 7 days.

250
-50
50
150
250
350
450
550
650
0 50 100 150 200 250 300 350 400
Time (d)
Shr
inka
ge (m
icro
stra
in)
Prism A Prism B Prism C
Figure A3.55 Free Shrinkage, Batch 207(14-days-cured), 70% Aggregate, 0.45 w/c ratio, Type II coarse ground (CG) cement. Drying begins at 14 days.
-50
50
150
250
350
450
550
650
0 50 100 150 200 250 300 350 400
Time (d)
Shr
inka
ge (m
icro
stra
in)
Prism A Prism B Prism C
Figure A3.56 Free Shrinkage, Batch 207(28-days-cured), 70% Aggregate, 0.45 w/c ratio, Type II coarse ground (CG) cement. Drying begins at 28 days.

251
-50
50
150
250
350
450
550
650
0 50 100 150 200 250 300 350 400
Time (d)
Free
Shr
inka
ge (m
icro
stra
in)
Prism A Prism B Prism C
Figure A3.57 - Free Shrinkage, Batch 167. 75% Aggregate, 0.45 w/c. Type I/II cement. Drying begins at 3 days. Control, no chemical admixtures.
-50
50
150
250
350
450
550
650
0 50 100 150 200 250 300 350 400
Time (d)
Free
Shr
inka
ge (m
icro
stra
in)
Prism A Prism B Prism C
Figure A3.58 - Free Shrinkage, Batch 168. 75% Aggregate, 0.45 w/c. Type I/II cement. Drying begins at 3 days. Low dosage of Glenium 3000NS.

252
-50
50
150
250
350
450
550
650
0 50 100 150 200 250 300 350 400
Time (d)
Free
Shr
inka
ge (m
icro
stra
in)
Prism A Prism B Prism C
Figure A3.59 - Free Shrinkage, Batch 169. 75% Aggregate, 0.45 w/c. Type I/II cement. Drying begins at 3 days. Medium dosage of Glenium 3000NS.
-50
50
150
250
350
450
550
650
0 50 100 150 200 250 300 350 400
Time (d)
Free
Shr
inka
ge (m
icro
stra
in)
Prism A Prism B Prism C
Figure A3.60 - Free Shrinkage, Batch 170. 75% Aggregate, 0.45 w/c. Type I/II cement. Drying begins at 3 days. High dosage of Glenium 3000NS.

253
-50
50
150
250
350
450
550
650
0 50 100 150 200 250 300 350 400
Time (d)
Free
Shr
inka
ge (m
icro
stra
in)
Prism A Prism B Prism C
Figure A3.61 - Free Shrinkage, Batch 171. 75% Aggregate, 0.45 w/c. Type I/II cement. Drying begins at 3 days. Low dosage of Rheobuild 1000.
-50
50
150
250
350
450
550
650
0 50 100 150 200 250 300 350 400
Time (d)
Free
Shr
inka
ge (m
icro
stra
in)
Prism A Prism B Prism C
Figure A3.62 - Free Shrinkage, Batch 172. 75% Aggregate, 0.45 w/c. Type I/II cement. Drying begins at 3 days. Medium dosage of Rheobuild 1000.

254
-50
50
150
250
350
450
550
650
0 50 100 150 200 250 300 350 400
Time (d)
Free
Shr
inka
ge (m
icro
stra
in)
Prism A Prism B Prism C
Figure A3.63 - Free Shrinkage, Batch 173. 75% Aggregate, 0.45 w/c. Type I/II cement. Drying begins at 3 days. High dosage of Rheobuild 1000.
-50
50
150
250
350
450
550
650
0 50 100 150 200 250 300 350 400
Time (d)
Free
Shr
inka
ge (m
icro
stra
in)
Prism A Prism B Prism C
Figure A3.64 - Free Shrinkage, Batch 174. 75% Aggregate, 0.45 w/c. Type I/II cement. Drying begins at 3 days. High dosage of Glenium 3000NS.

255
-50
50
150
250
350
450
550
650
0 50 100 150 200 250 300 350 400Time (d)
Shrin
kage
(mic
rost
rain
)
Prism A Prism B Prism C
Figure A3.65 - Free Shrinkage, Batch 175. 75% Aggregate, 0.45 w/c. Type I/II cement. Drying begins at 3 days. Control, no chemical admixtures.
-50
50
150
250
350
450
550
650
0 50 100 150 200 250 300 350 400Time (d)
Shrin
kage
(mic
rost
rain
)
Prism A Prism B Prism C
Figure A3.66 - Free Shrinkage, Batch 176. 75% Aggregate, 0.45 w/c. Type I/II cement. Drying begins at 3 days. Low dosage of Glenium 3000NS.

256
-50
50
150
250
350
450
550
650
0 50 100 150 200 250 300 350 400Time (d)
Shrin
kage
(mic
rost
rain
)
Prism A Prism B Prism C
Figure A3.67 - Free Shrinkage, Batch 177. 75% Aggregate, 0.45 w/c. Type I/II cement. Drying begins at 3 days. Medium dosage of Glenium 3000NS.
-50
50
150
250
350
450
550
650
0 50 100 150 200 250 300 350 400Time (d)
Shrin
kage
(mic
rost
rain
)
Prism A Prism B Prism C
Figure A3.68 - Free Shrinkage, Batch 178. 75% Aggregate, 0.45 w/c. Type I/II cement. Drying begins at 3 days. High dosage of Glenium 3000NS.

257
-50
50
150
250
350
450
550
650
0 50 100 150 200 250 300 350 400Time (d)
Shrin
kage
(mic
rost
rain
)
Prism A Prism B Prism C
Figure A3.69 - Free Shrinkage, Batch 179. 75% Aggregate, 0.45 w/c. Type I/II cement. Drying begins at 3 days. Low dosage of Rheobuild 1000.
-50
50
150
250
350
450
550
650
0 50 100 150 200 250 300 350 400Time (d)
Shrin
kage
(mic
rost
rain
)
Prism A Prism B Prism C
Figure A3.70 - Free Shrinkage, Batch 180. 75% Aggregate, 0.45 w/c. Type I/II cement. Drying begins at 3 days. Medium dosage of Rheobuild 1000.

258
-50
50
150
250
350
450
550
650
0 50 100 150 200 250 300 350 400Time (d)
Shrin
kage
(mic
rost
rain
)
Prism A Prism B
Figure A3.71 - Free Shrinkage, Batch 181. 75% Aggregate, 0.45 w/c. Type I/II cement. Drying begins at 3 days. High dosage of Rheobuild 1000.
-50
50
150
250
350
450
550
650
0 50 100 150 200 250 300 350 400Time (d)
Shrin
kage
(mic
rost
rain
)
Prism A Prism B Prism C
Figure A3.72 - Free Shrinkage, Batch 182. 75% Aggregate, 0.45 w/c. Type I/II cement. Drying begins at 3 days. High dosage of Rheobuild 1000.
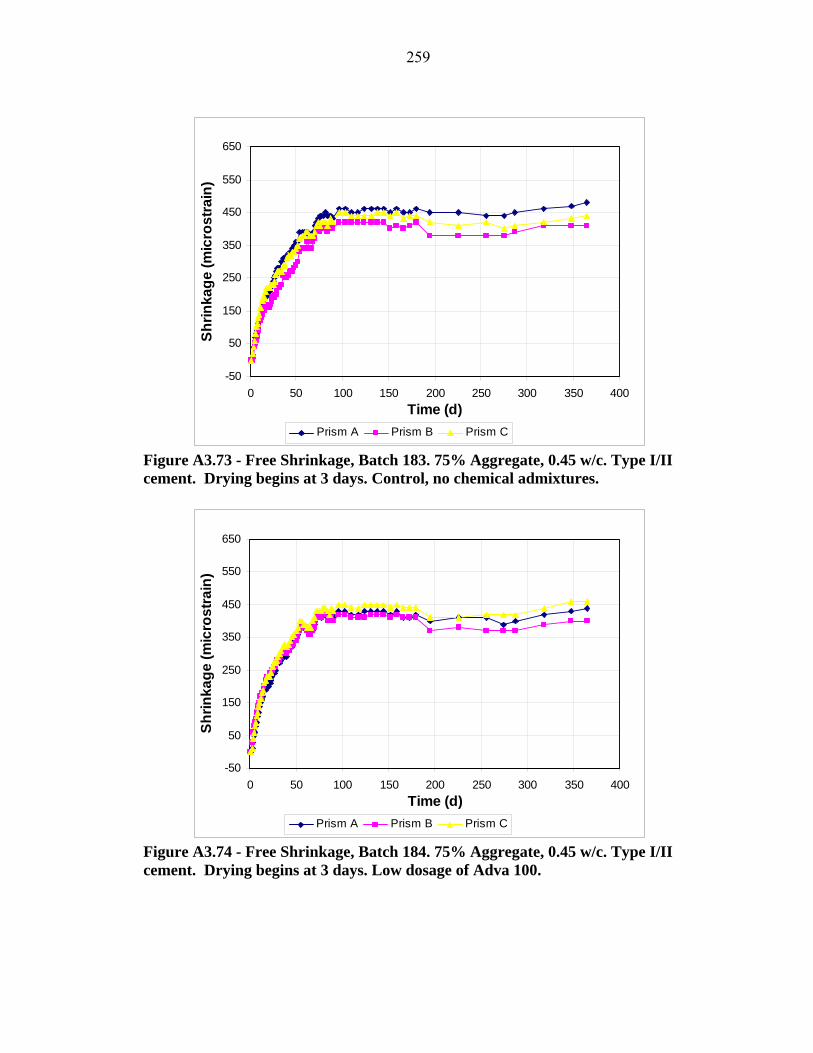
259
-50
50
150
250
350
450
550
650
0 50 100 150 200 250 300 350 400Time (d)
Shrin
kage
(mic
rost
rain
)
Prism A Prism B Prism C
Figure A3.73 - Free Shrinkage, Batch 183. 75% Aggregate, 0.45 w/c. Type I/II cement. Drying begins at 3 days. Control, no chemical admixtures.
-50
50
150
250
350
450
550
650
0 50 100 150 200 250 300 350 400Time (d)
Shrin
kage
(mic
rost
rain
)
Prism A Prism B Prism C
Figure A3.74 - Free Shrinkage, Batch 184. 75% Aggregate, 0.45 w/c. Type I/II cement. Drying begins at 3 days. Low dosage of Adva 100.

260
-50
50
150
250
350
450
550
650
0 50 100 150 200 250 300 350 400Time (d)
Shrin
kage
(mic
rost
rain
)
Prism A Prism B Prism C
Figure A3.75 - Free Shrinkage, Batch 185. 75% Aggregate, 0.45 w/c. Type I/II cement. Drying begins at 3 days. Medium dosage of Adva 100.
-50
50
150
250
350
450
550
650
0 50 100 150 200 250 300 350 400Time (d)
Shrin
kage
(mic
rost
rain
)
Prism A Prism B Prism C
Figure A3.76 - Free Shrinkage, Batch 186. 75% Aggregate, 0.45 w/c. Type I/II cement. Drying begins at 3 days. High dosage of Adva 100.

261
-50
50
150
250
350
450
550
650
0 50 100 150 200 250 300 350 400
Time (d)
Shrin
kage
(mic
rost
rain
)
Prism A Prism B Prism C
Figure A3.77 - Free Shrinkage, Batch 190. 75% Aggregate, 0.45 w/c. Type I/II cement. Drying begins at 3 days. Low dosage of Adva 100.
-50
50
150
250
350
450
550
650
0 50 100 150 200 250 300 350 400
Time (d)
Shrin
kage
(mic
rost
rain
)
Prism A Prism B Prism C
Figure A3.78 - Free Shrinkage, Batch 191. 75% Aggregate, 0.45 w/c. Type I/II cement. Drying begins at 3 days. Medium dosage of Adva 100.
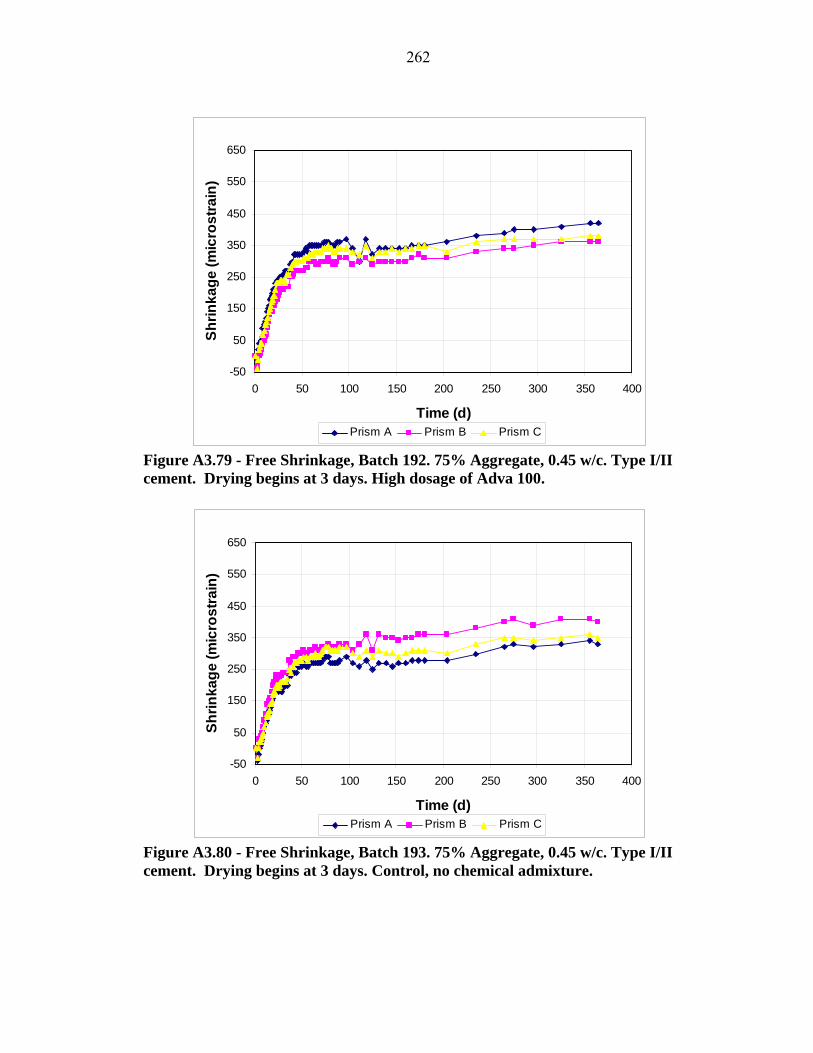
262
-50
50
150
250
350
450
550
650
0 50 100 150 200 250 300 350 400
Time (d)
Shrin
kage
(mic
rost
rain
)
Prism A Prism B Prism C
Figure A3.79 - Free Shrinkage, Batch 192. 75% Aggregate, 0.45 w/c. Type I/II cement. Drying begins at 3 days. High dosage of Adva 100.
-50
50
150
250
350
450
550
650
0 50 100 150 200 250 300 350 400
Time (d)
Shrin
kage
(mic
rost
rain
)
Prism A Prism B Prism C
Figure A3.80 - Free Shrinkage, Batch 193. 75% Aggregate, 0.45 w/c. Type I/II cement. Drying begins at 3 days. Control, no chemical admixture.

263
-50
50
150
250
350
450
550
650
0 50 100 150 200 250 300 350 400
Time (d)
Shrin
kage
(mic
rost
rain
)
Prism A Prism B Prism C Avg
Figure A3.81 - Free Shrinkage, Batch 208. 70% Aggregate, 0.45 w/c. Type I/II cement. Drying begins at 3 days. Control, no chemical admixtures.
-50
50
150
250
350
450
550
650
0 50 100 150 200 250 300 350 400
Time (d)
Shrin
kage
(mic
rost
rain
)
Prism A Prism B Prism C
Figure A3.82 - Free Shrinkage, Batch 209. 70% Aggregate, 0.45 w/c. Type I/II cement. Drying begins at 3 days, Adva 100.

264
-50
50
150
250
350
450
550
650
0 50 100 150 200 250 300 350 400
Time (d)
Shrin
kage
(mic
rost
rain
)
Prism A Prism B Prism C
Figure A3.83 - Free Shrinkage, Batch 210. 70% Aggregate, 0.45 w/c. Type I/II cement. Drying begins at 3 days, Glenium 3000 NS.
-50
50
150
250
350
450
550
650
0 50 100 150 200 250 300 350 400
Time (d)
Shrin
kage
(mic
rost
rain
)
Prism A Prism B Prism C
Figure A3.84 - Free Shrinkage, Batch 211. 70% Aggregate, 0.45 w/c. Type I/II cement. Drying begins at 3 days, Rheobuild 1000.

265
-50
50
150
250
350
450
550
650
750
0 50 100 150 200 250 300 350 400
Time (d)
Shrin
kage
(mic
rost
rain
)
Prism A Prism B Prism C
Figure A3.85 - Free Shrinkage, Batch 260. 63.5% Aggregate, 0.45 w/c. Type I/II cement. Air-entrained concrete. Drying begins at 3 days. Control, no superplasticizer, increased paste content for same slump.
-50
50
150
250
350
450
550
650
750
0 50 100 150 200 250 300 350 400
Time (d)
Shrin
kage
(mic
rost
rain
)
Prism A Prism B Prism C
Figure A3.86- Free Shrinkage, Batch 249. 67.8% Aggregate, 0.45 w/c. Type I/II cement. Air-entrained concrete. Drying begins at 3 days. Glenium 3000 NS.

266
-50
50
150
250
350
450
550
650
750
0 50 100 150 200 250 300 350 400
Time (d)
Shrin
kage
(mic
rost
rain
)
Prism A Prism B Prism C
Figure A3.87 - Free Shrinkage, Batch 256. 67.8% Aggregate, 0.45 w/c. Type I/II cement. Air-entrained concrete. Drying begins at 3 days. Rheobuild 1000.
-50
50
150
250
350
450
550
650
750
0 50 100 150 200 250 300 350 400
Time (d)
Shrin
kage
(mic
rost
rain
)
Prism A Prism B Prism C
Figure A3.88 - Free Shrinkage, Batch 259 67.8% Aggregate, 0.45 w/c. Type I/II cement. Air-entrained concrete. Drying begins at 3 days. Adva 100.