From Local Living Lab to European MVNO Business Frank Bekkers Mobile Vikings
Upload
anabel-crossCategory
view
217download
0
European Perspectives
on Philanthropy
René BekkersVU University Amsterdam
The Netherlands
June 29, 2015
Understanding Philanthropy Conference
University of Kent

June 29, 2015Understanding Philanthropy
Conference2

Wall Street is an early example
of Dutch Philanthropy.
June 29, 2015Understanding Philanthropy
Conference3

June 29, 2015Understanding Philanthropy
Conference4
Stuyvesant called upon the 43 richest residents of New Amsterdam to provide funding to fix up the ailing Fort Amsterdam and to construct a stockade across the island to prevent attacks from the north, while it took New Amsterdam's most oppressed inhabitants -- slave labor from the Dutch West India Company -- to actually build the wall.
Russell Shorto – The Island at the Center of the World

June 29, 2015Understanding Philanthropy
Conference5
This is the ‘Giving house’ in the city of ‘s-Hertogenbosch. In the middle ages, the poor in the city received food and clothing at this house. Funds for the service were obtained through bequests, legacies and other donations from citizens, but also from the city council. Today, the building serves as the city’s library and an arts center.

June 29, 2015Understanding Philanthropy
Conference6
The ‘Sweet Mary’ Fraternity was founded in 1318. Its first members were clergy. The fraternity engaged in charity and cultural activities. Ghisbertus van der Poorten donated his house in 1483. The acceptance of Protestants, including members of the Royal House of Orange, helped resolve religious conflicts that had dominated the city since the Spanish occupation in the 17th century. The current building in neogothic style dates back to 1846.

June 29, 2015Understanding Philanthropy
Conference7
The ‘Sweet Mary’ Fraternity was founded in 1318. Its first members were clergy. The fraternity engaged in charity and cultural activities. Ghisbertus van der Poorten donated his house in 1483. The acceptance of Protestants, including members of the Royal House of Orange, helped resolve religious conflicts that had dominated the city since the Spanish occupation in the 17th century. The current building in neogothic style dates back to 1846.

Amsterdam Concert Hall
June 29, 2015Understanding Philanthropy
Conference8

Amsterdam Concert Hall
June 29, 2015Understanding Philanthropy
Conference9

The Rijksmuseum (1885)
Understanding Philanthropy Conference
10June 29, 2015

1880: VU University founded
Understanding Philanthropy Conference
11June 29, 2015

Willem Hovy (1840-1915), owner of brewery The Crowned Falcon, donated 25.000 guilders for the foundation of the ‘Vrije Universiteit’.
Understanding Philanthropy Conference
12June 29, 2015

June 29, 2015Understanding Philanthropy
Conference13
This is all history.
We have ‘lost’ the philanthropic tradition.
Since World War II, state subsidies dominate funding for nonprofit
organizations. Philanthropy is in our culture – but
institutions have discouraged it.

The Societal Significance of Philanthropy
1. The societal destination of philanthropyHow much time and money do citizens in Europe contribute to which causes?
2. Social originsWho gives what and why?
3. The societal impact of philanthropyWhat does philanthropy achieve?
14June 29, 2015Understanding Philanthropy
Conference

If only we knew…
1. How much time and money?We do not know.
2. How many people give and volunteer?It depends on the data; ‘methodology is destiny’.
3. What does philanthropy achieve?We do not know - it depends on many societal conditions.
15June 29, 2015Understanding Philanthropy
Conference

June 29, 2015Understanding Philanthropy
Conference16
Data from the Gallup World Poll. Map available at http://www.targetmap.com/viewer.aspx?reportId=42492

Research Questions for ‘Giving Europe’
Which is the most generous country in Europe and why?
1. How large are differences in philanthropy (incidence, amounts, causes supported) between nations in Europe?
2. How can these differences be explained?
June 29, 2015 Understanding Philanthropy Conference
17

Giving Prevalence in Europe
GRHU PT ES FR CZ IT PL BE FI DE AT SE LU DK IE NL GB0%
10%
20%
30%
40%
50%
60%
70%
80%
90%
European Social Survey EurobarometerGallup World Poll
June 29, 2015Understanding Philanthropy
Conference18
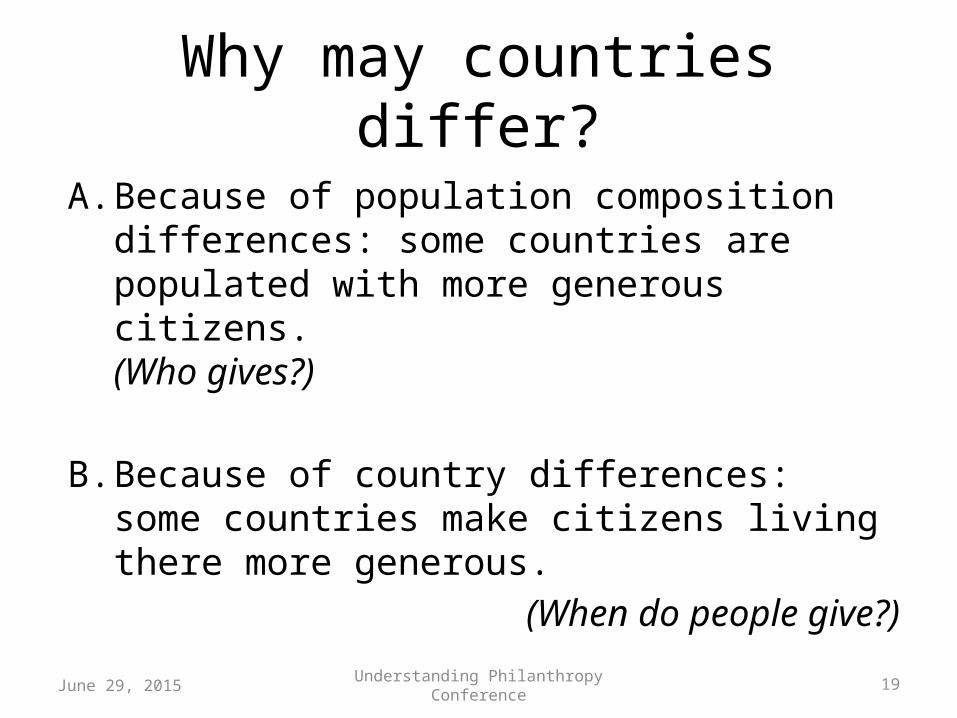
Why may countries differ?
A. Because of population composition differences: some countries are populated with more generous citizens. (Who gives?)
B. Because of country differences: some countries make citizens living there more generous.
(When do people give?)
June 29, 2015Understanding Philanthropy
Conference19

‘Theories’: clusters of variables
• Political: ‘Worlds of Welfare Capitalism’, democracy, civic engagement, inequality
• Economic: ‘Crowding-out’, price of giving, wealth
• Cultural: religious traditions, social norms• Legal: freedom for nonprofit organizations• Psychological: trust, guilt, perceived need• Communication: news consumption• Biological: DNA, signalling, nutrition• Thermoclimatic: adversity in weather
June 29, 2015Understanding Philanthropy
Conference20

‘Theories’: clusters of variables
• Economic: ‘Crowding-out’, price of giving, the wealth of nations
• Political: ‘Worlds of Welfare Capitalism’, democracy, civic engagement, inequality
• Cultural: religious traditions, social norms• Legal: freedom for nonprofit organizations• Psychological: trust, guilt, perceived need• Communication: news consumption• Biological: DNA, signalling, nutrition• Thermoclimatic: adversity in weather
June 29, 2015Understanding Philanthropy
Conference21

June 29, 2015Understanding Philanthropy
Conference22

Mechanisms driving philanthropy
1. Awareness of need2. Being asked to give3. Costs and benefits 4. Altruism: how much others are giving5. Reputation: social pressure and rewards6. Psychological costs and rewards7. Values8. Efficacy
June 29, 2015Understanding Philanthropy
Conference23

June 29, 2015Understanding Philanthropy
Conference24

Why do people give?
People give more (often) when1. There is a clear need need2. They are being asked solicitation3. Costs are lower, and benefits are higher
costs/benefits4. They care about the recipients altruism5. They receive social benefits reputation6. They receive psychological benefits self-
rewards7. The cause matches their values values8. Donations are perceived to be efficient efficacySource: Bekkers, R. & Wiepking, P. (2011). ‘A Literature Review of Empirical
Studies of Philanthropy: Eight Mechanisms that Drive Charitable Giving’. Nonprofit and Voluntary Sector Quarterly, 40(5): 924-973. Available at www.understandingphilanthropy.com
June 29, 2015Understanding Philanthropy
Conference25

Not today
• How much are monozygotic twins alike with respect to their giving?
• Why do people prefer charities with names similar to their own names?
• Why do men and women give differently?• How is political affiliation related to
giving?• How much altruism is there in individual
giving decisions?
June 29, 2015Understanding Philanthropy
Conference26

Mechanisms driving philanthropy
1. Awareness of need2. Being asked to give3. Costs and benefits 4. Altruism: how much others are
giving5. Reputation: social pressure and rewards6. Psychological costs and rewards7. Values8. Efficacy
June 29, 2015Understanding Philanthropy
Conference27

The ‘Crowding-out Effect’
• Occurs when a decrease in government funding leads to an increase in philanthropic funding for a cause.
• Or vice versa, when an increase in philanthropy reduces government funding.
June 29, 2015Understanding Philanthropy
Conference28

The Big Society / Participation State
29June 29, 2015Understanding Philanthropy
Conference

The ‘Waterbed Effect’
Government grants
Private donations
The metaphor assumes the water mass is constant & contained, as if
philanthropy and government funding are a ‘zero-sum game’.
30June 29, 2015Understanding Philanthropy
Conference
Friedman (1962) called this the crowding-out
effect.

Questioning the metaphor
• The metaphor is not born out of research.
• For a researcher, it is a testable hypothesis.
• Empirical tests may as well reveal the reverse effect of ‘crowding-in’: when an increase in government funding increases philanthropic activity.
• The research question is: when and where occurs how much crowding-out?
June 29, 2015Understanding Philanthropy
Conference31

A meta-analysis
June 29, 2015Understanding Philanthropy
Conference32
Crowding-inCrowding-out De Wit, A. & Bekkers, R. (2014). Government support and charitable donations: A meta-analysis of
the crowding-out hypothesis. Paper presented at the 43d ARNOVA Conference, Denver, November 20-22, 2014.
UK
stu
die
s

‘A severe cut in government funding to nonprofit organisations is not likely, on average, to be made up by donations from private donors.’
Abigail Payne (1998)
Across all the published studies, a $1 increase in government support is associated with a $0.18 decrease in private charitable donations on average.
33June 29, 2015Understanding Philanthropy
Conference
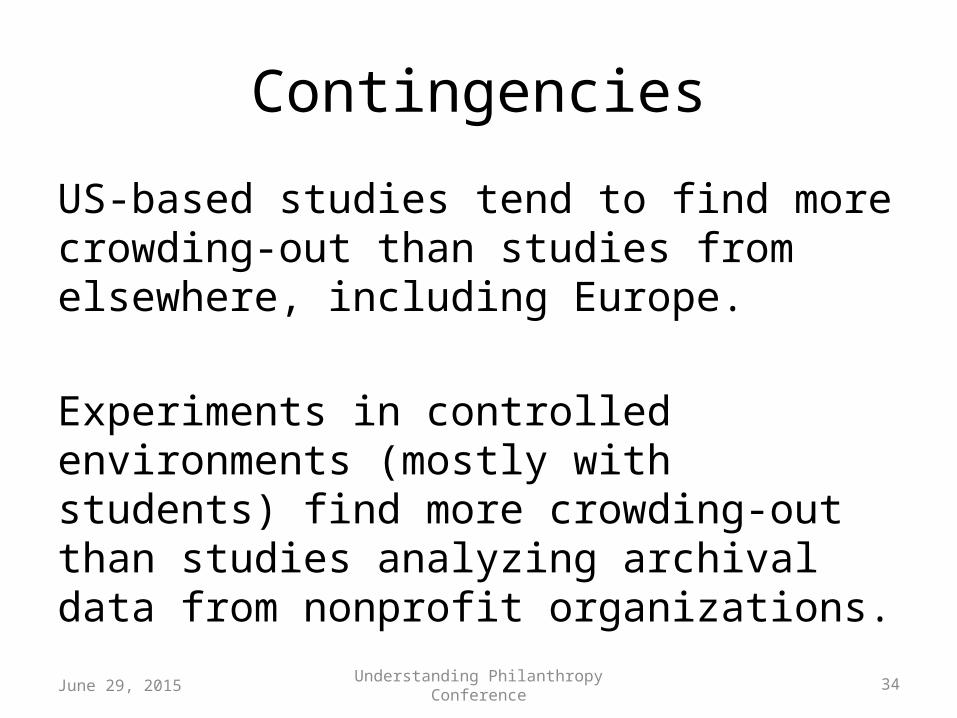
Contingencies
US-based studies tend to find more crowding-out than studies from elsewhere, including Europe.
Experiments in controlled environments (mostly with students) find more crowding-out than studies analyzing archival data from nonprofit organizations.June 29, 2015
Understanding Philanthropy Conference
34

The ‘crowding-out effect’ varies
Between
• World regions and societies (macro-level)
• Organizations (meso-level)• Citizens (micro-level)
• These three levels, and over time.
June 29, 2015Understanding Philanthropy
Conference35

It’s not as simple as rocket science
June 29, 2015Understanding Philanthropy
Conference36

37
Data from the Gallup World Poll show that citizens in countries in which the tax burden is higher are more likely to give to charity, suggesting a crowding-in effect
June 29, 2015Understanding Philanthropy
Conference

June 29, 2015Understanding Philanthropy
Conference38
N = 111, r = .011
Outside Europe, there is no relationship between tax burden and the prevalence of giving

June 29, 2015Understanding Philanthropy
Conference39

June 29, 2015Understanding Philanthropy
Conference40

EU investments in innovation
• In the European Foundations for Research and Innovation (EUFORI) Study, a consortium of 34 national experts documented ~12,000 foundations supporting R&I in Europe.
• In which countries are foundations most active?
• How do foundations view their relationship with government?
June 29, 2015Understanding Philanthropy
Conference41

June 29, 2015Understanding Philanthropy
Conference42
N = 28r = - .176 Remarkably similar to the average ‘crowding-out
effect’

Country characteristics
June 29, 2015Understanding Philanthropy
Conference43

June 29, 2015Understanding Philanthropy
Conference44
N = 27r = 0.567
Countries above the diagonal rank higher in corporate investments than in foundation spending on R&I
The UK is one of the countries that rank higher in foundation than corporate spending on R&I
A strongly positive relation
Scandinavia wins (again)

Flexibility is the rule
• The ‘crowding-out’ effect is flexible, open to modification – and may even become a crowding-in effect.
• Governments, nonprofit organizations, philanthropists and the public at large can influence it.
45June 29, 2015Understanding Philanthropy
Conference

June 29, 2015Understanding Philanthropy
Conference46
Source: Gouwenberg et al., (2015). EUFORI Study

Four models of collaboration
• Competitive: try to do better than government or make government do better
• Initiating: start a program, and export it into government policy
• Substituting: take over government tasks
• Complementary: work towards similar goals and strengthen each other as partners 47June 29, 2015
Understanding Philanthropy Conference

June 29, 2015Understanding Philanthropy
Conference48
Source: Gouwenberg et al., (2015). EUFORI Study

Recreating a ‘Giving Culture’
• Overcome the modesty: “Do not let your left hand know what your right hand is doing” (Matthew 6:3).
• Develop new forms of philanthropy, mixed with business.
• Education could play a role in creating a giving culture, e.g. through service learning.
49June 29, 2015Understanding Philanthropy
Conference

June 29, 2015Understanding Philanthropy
Conference50
The stubborn 2% in the UK: giving as a % of GDP doesn’t change muchSource: Perry (2013), https://philanthropy.com/article/The-Stubborn-2-Giving-Rate/154691

June 29, 2015Understanding Philanthropy
Conference51
The expanding pie in the UK: giving as a % of expenditure increasedSource: Cowley, McKenzie, Pharoah & Smith (2011)

June 29, 2015Understanding Philanthropy
Conference52
The changing pie in the Netherlands: giving as a % of expenditureSources: Schuyt, Gouwenberg & Bekkers, Giving in the Netherlands, https://renebekkers.files.wordpress.com/2015/06/15_06_29_economic_trends_philanthropy.xlsx

Popular concerns• Under- or loss of coverage: the general
level of service provision may suffer when the government retreats.
• Inequality: philanthropy may fund specific causes, but not others; Matthew-effects will help those causes with an early advantage.
• ‘Too much’ influence on public policy for philanthropists leading to arbitrariness, nepotism and inequality.
53June 29, 2015Understanding Philanthropy
Conference

Giving USA
31
16
12
11
7
10
54 3 1 religion
education
human services
foundations
public-society benefit
health
arts, culture, human-ities
international
environment/animals
unallocated
June 29, 2015Understanding Philanthropy
Conference54
Total giving, 2013: $335 billion (2.0% GDP; tax burden: 25%)

Giving in the Netherlands
22
5
13
126
13
8
7
13religion
education
[human services]
[foundations]
public-society benefit and human services
health
arts, culture, humanities
international
environment/animals
unallocated
sports and recreation
June 29, 2015Understanding Philanthropy
Conference55
Total giving, 2013: €4.4 billion (0.8% GDP; tax burden: 38%)

What we need is…
• A serious political discussion about the role of philanthropy in public policy.
• Decent research informing policy decisions, paying attention to undesirable side-effects.
• An Impact Philanthropy Lab (IPL): creation and evaluation of new philanthropic / business investment instruments.
• Knowledge about what works in fundraising, and about failures.
56June 29, 2015Understanding Philanthropy
Conference

June 29, 2015Understanding Philanthropy
Conference57
Published
Unpublished?

These did not work.
• Picture recipients on fundraising letters (-€40k).
• Calling alumni by current fraternity members.
• Reminding people of an event that made them feel grateful.
• Reminding people of an event that made them feel happy.
• Giving people more positive social information.
• Giving students the names of charity ambassadors.
June 29, 2015Understanding Philanthropy
Conference58

Published - Unpublished
• Picture recipients on fundraising letters (-€40k).
• Calling alumni by current fraternity members.
• Reminding people of an event that made them feel grateful.
• Reminding people of an event that made them feel happy.
• Giving people more positive social information.
• Giving students the names of charity ambassadors.
June 29, 2015Understanding Philanthropy
Conference59

These did not work either.
• Reducing the anonymity of donations. • Giving the option of forfeiting anonymity.• Switching the default from ‘giving’ to
‘keeping’.• Telling people they are a helpful person.• Telling people the government lowered its
subsidy, increasing the need for donations.
• Showing students stylized eyespots.
June 29, 2015Understanding Philanthropy
Conference60

61
But real watching eyes….
base0%
10%20%30%40%50%60%70%80%90%
100%
7460 61
19
24 18
717 18
donated 0 donated 5 donated 10
% d
onati
ng
June 29, 2015Understanding Philanthropy
Conference

June 29, 2015 62
Suggesting a €35 contribution
<10 10 15 20 25 30 35 40 45 50 >500
20
40
60
80
100
120
no reference
Fre
quency
Understanding Philanthropy Conference

Framing the incentive as a match
control group 50% rebate: price = 0,50
100% match: price = 0,50
0%
5%
10%
15%
20%
25%
30%
35%
Proportion of the reward for participation in GINPS04 donated by participants
+46%
+90%
63June 29, 2015Understanding Philanthropy
Conference

And finally.
Good food….And a drink.
June 29, 2015Understanding Philanthropy
Conference64

June 29, 2015Understanding Philanthropy
Conference65

June 29, 2015Understanding Philanthropy
Conference66
From my Blog, https://renebekkers.wordpress.com/2014/12/17/the-fishy-business-of-philanthropy/

June 29, 2015Understanding Philanthropy
Conference67
0 10 20 30 40 50 60 70 800
10
20
30
40
50
60
70
80
Series1
f(x) = 0.297965192702035 x + 27.3793574846206R² = 0.0887832560619607
Rank of country per capita fish consumption in kg
Ran
k o
f pro
port
ion
of
popu
lati
on
en
gagin
g i
n
ch
ari
ty
r = 0,298
Sources: http://www.helgilibrary.com/indicators/index/fish-consumption-per-capita and http://www.theguardian.com/news/datablog/2010/sep/08/charitable-giving-country#data
NOTE: a higher rank is closer to the origin but means more fish and more giving

Grams of food required to yield an additional €1 donation
June 29, 2015Understanding Philanthropy
Conference68
spinach chicken salmon eggs chocolate milk0
200
400
600
800
1000
1200
1400
1600
1800
2000

References• Bekkers, R. (2015). The Analysis of Regional Differences in Philanthropy: Evidence
from the European Social Survey, the Eurobarometer and the Giving in the Netherlands Panel Survey. Paper presented at the 5th ESS Workshop, The Hague, May 22, 2015. https://renebekkers.files.wordpress.com/2011/10/15_05_22_ess_regional_differences.pdf
• Bekkers, R. (2015). ‘Regional Differences in Philanthropy’. In: Routledge Companion to Philanthropy, edited by J. Harrow, T. Jung & S. Phillips. Routledge.
• Bekkers, R. (2015). When and Why Matches are More Effective Subsidies Than Rebates. Research in Experimental Economics, Volume 18: Replication in Economic Experiments. Edited by Deck, C. Fatas, E., & Rosenblat, T. Emerald Group Publishing.
• Gouwenberg, B., Karamat Ali, D., Hoolwerf, B., Bekkers, R., Schuyt, T. & Smit, J. (2015). Synthesis Report EUFORI Study: European Foundations for Research and Innovation. Luxembourg: Publications Office of the European Union.
• Bekkers, R. (2014). The Fishy Business of Philanthropy. December 17, 2014. https://renebekkers.wordpress.com/2014/12/17/the-fishy-business-of-philanthropy/
• Bekkers, R. & Wiepking, P. (2011). ‘A Literature Review of Empirical Studies of Philanthropy: Eight Mechanisms that Drive Charitable Giving’. Nonprofit and Voluntary Sector Quarterly, 40(5): 924‐973. http://understandingphilanthropy.com
June 29, 2015Understanding Philanthropy
Conference69

Thanks, saysRené Bekkers
Professor & DirectorCenter for Philanthropic
StudiesVU University Amsterdam
[email protected]: @renebekkers
Blog: renebekkers.wordpress.com
70June 29, 2015Understanding Philanthropy
Conference