European Commission Directorate-General for Agriculture...DG AGRI European Commission,...
65
European agriculture entering the 21 st century 1 European Commission Directorate-General for Agriculture EUROPEAN AGRICULTURE ENTERING THE 21 st CENTURY October 2002
Transcript of European Commission Directorate-General for Agriculture...DG AGRI European Commission,...

European agriculture entering the 21st century 1
European Commission
Directorate-General for Agriculture
EUROPEAN AGRICULTURE
ENTERING THE
21st CENTURY
October 2002

Table of contents
European agriculture entering the 21st century 2
FOREWORD -----------------------------------------------------------7
LIST OF ACRONYMS AND ABBREVIATIONS --------------------------------8
CHAPTER I THE AGRICULTURAL ECONOMY IN THE EU ----------------------10
1. KEY AGRICULTURAL STATISTICS ------------------------------------------------------------10
1.1. Share of agriculture in the GDP ------------------------------------------------------10
1.2. Share of agriculture in employed civilian working population -----------------------10
2. STRUCTURE OF AGRICULTURAL HOLDINGS -------------------------------------------------- 11
2.1. Land use (1 000 ha)--------------------------------------------------------------------- 11
2.2. Agricultural holdings: total number and average agricultural area ----------------- 11
2.3. Total number of holdings by size classes (1 000 holdings) --------------------------12
2.4. Distribution of holdings by size classes (%)------------------------------------------12
2.5. The economic size of agricultural holdings (Economic Size Unit) ------------------13
2.6. Standard Gross Margin per holding (Economic Size Unit) --------------------------13
2.7. Total number of holdings by economic size classes ('000 Economic Size Unit) ---14
2.8. Distribution of holdings by economic size classes (%)-------------------------------14
2.9. Type of tenure -------------------------------------------------------------------------15
2.10. Holdings with livestock -------------------------------------------------------------15
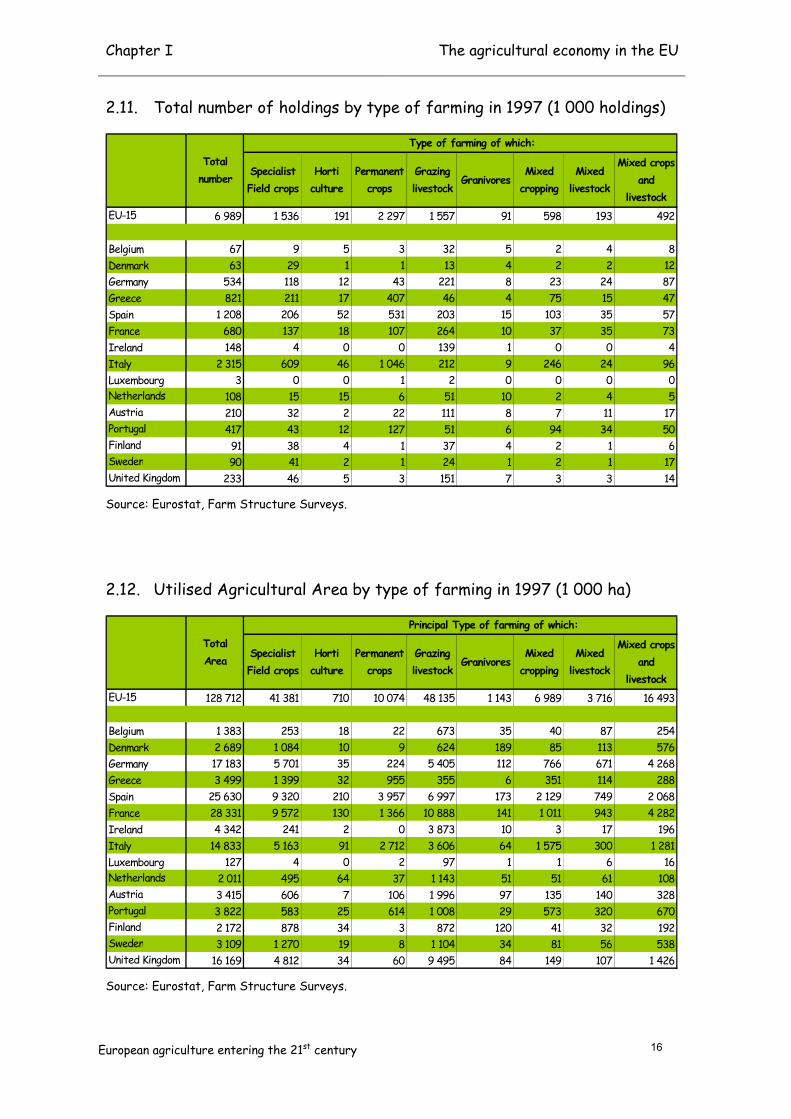
2.11. Total number of holdings by type of farming in 1997 (1 000 holdings) ---------16
2.12. Utilised Agricultural Area by type of farming in 1997 (1 000 ha)---------------16
3. AGRICULTURAL LABOUR ---------------------------------------------------------------------17
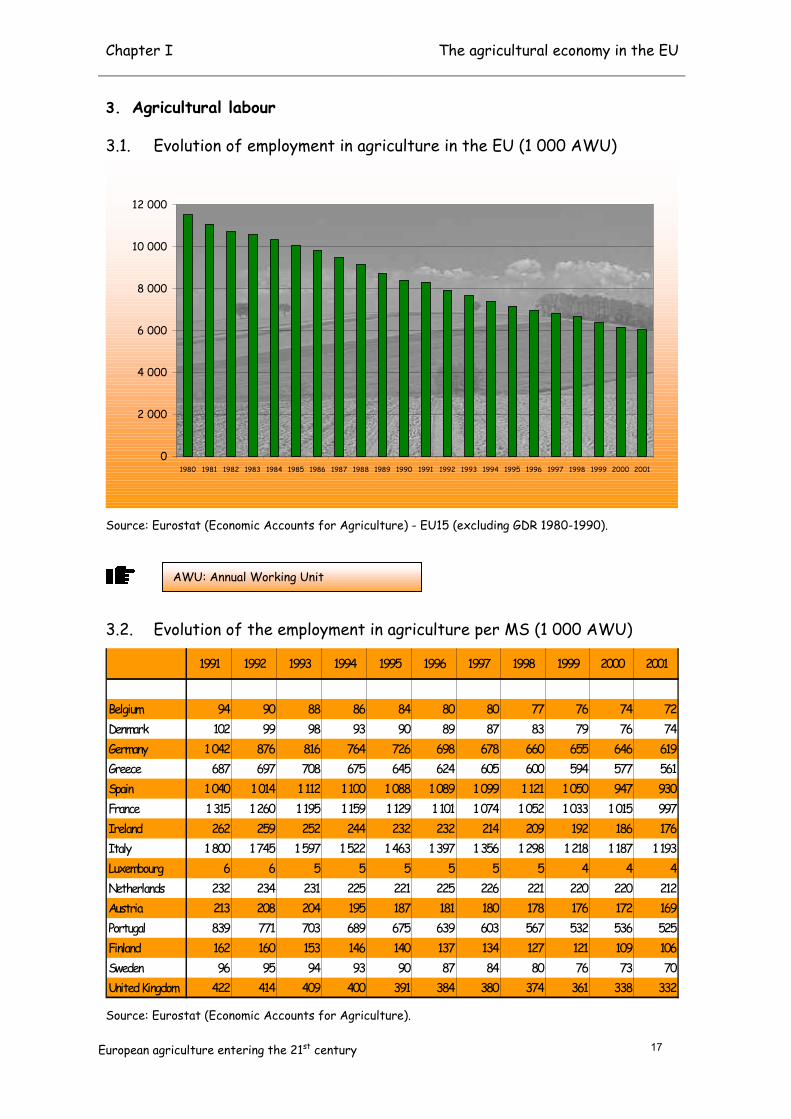
3.1. Evolution of employment in agriculture in the EU (1 000 AWU) --------------------17
3.2. Evolution of the employment in agriculture per MS (1 000 AWU) -----------------17
3.3. Share of women in total employment in the EU agriculture (%) --------------------18
3.4. Distribution of total labour force per holder’s age (1 000 holders) ---------------18
3.5. Evolution of agricultural labour per holding------------------------------------------19
3.6. Total agricultural labour: breakdown by working time (1 000 persons) ------------19
3.7. Holders with other gainful activities (1 000 holders) ------------------------------ 20
4. PRICES AND INCOME IN AGRICULTURE------------------------------------------------------21
4.1. Indices of real output prices for agricultural products (1990=100) ---------------21
4.2. Indices of real purchase prices for goods and services currently consumed inagriculture (1990=100) -------------------------------------------------------------------21
4.3. Comparison between producer prices for agricultural products and consumerprices for food products in the EU (1995=100 in nominal terms) ----------------- 22

Table of contents
European agriculture entering the 21st century 3
4.4. Variation in nominal producer prices for agricultural products and harmonisedconsumer prices for food products from 1991 to 2000 per Member State (%) - 22
4.5. Market value of agricultural land (nominal prices in Euro/ha) --------------------- 23
4.6. Market value of arable land (nominal prices in Euro/ha) --------------------------- 23
4.7. Rents for agricultural land (nominal prices in Euro/ha) ---------------------------- 23
4.8. Development in agricultural income in the EU(index form base 1980=100 and %) -------------------------------------------------- 24
4.9. Indices of the agricultural income per Member State from 1990 to 2001 (1995 = 100) ---------------------------------------------------- 24
4.10. Farm profitability: ratio of gross farm income to total assets, 1991 and 1999 (%) ----------------------------------------------------------------- 25
4.11. Fixed assets as percentage of total assets in 1991 and 1999 (%) -------------- 25
5. EU AND WORLD TRADE -------------------------------------------------------------------- 26
5.1. Total Agricultural World trade and EU market share (billion EUR)--------------- 26
5.2. EU trade in raw and processed products (billion EUR) ----------------------------- 26
5.3. EU and Rest of world export --------------------------------------------------------- 27
5.3.1. Cereals: Total world trade and EU market share (million EUR)-------------- 27
5.3.2. Oilseeds: Total world trade and EU market share (million EUR) ------------ 27
5.3.3. Livestock and meat: Total world trade and EU market share (million EUR) 28
5.3.4. Dairy products: Total world trade and EU market share (million EUR) ----- 28
5.3.5. Fruit and vegetables: Total world trade and EU market share (million EUR)29
5.3.6. Wine, vermouth, alcoholic drinks: Total world trade and EU market share(million EUR) --------------------------------------------------------------------- 29
5.3.7. Food preparation: Total world trade and EU market share (million EUR)--- 30
5.3.8. Other processed products: Total world trade and EU market share(million EUR) --------------------------------------------------------------------- 30
5.4. Total trade in agricultural products per Member State ----------------------------31
5.4.1. Total export of agricultural products (million EUR) and intra-trade (%) ----31
5.4.2. Total import of agricultural products (million EUR) and intra-trade (%) --- 32
5.5. Intra-EU trade: all agriculture------------------------------------------------------- 33
5.5.1. Intra-EU export per Member State - 2001----------------------------------- 33
5.5.2. Intra-EU import per Member State - 2001 ----------------------------------- 33
5.6. Intra-EU import per products (million EUR) 1991-2001---------------------------- 34
5.7. Major products exported and imported intra-EU in 2001 by Member State(million EUR, descending order) ------------------------------------------------------ 34

Table of contents
European agriculture entering the 21st century 4
CHAPTER II AGRICULTURAL MARKETS IN THE EU--------------------------36
1. BALANCE SHEET CEREALS ------------------------------------------------------------------ 36
1.1. Common Wheat – Balance sheet 1999/2000 (thousand t)-------------------------- 36
1.1.1. Development of European balance sheet – Common Wheat ------------------ 36
1.2. Durum Wheat – Balance sheet 1999/2000 (thousand t) --------------------------- 37
1.2.1. Development of European balance sheet – Durum Wheat -------------------- 37
1.3. Total coarse grains - Balance sheet 1999/2000 (thousand t) --------------------- 38
1.3.1. Development of European balance sheet – Total coarse grains -------------- 38
1.4. Barley – Balance sheet 1999/2000 (thousand t) ------------------------------------ 39
1.4.1. Development of European balance sheet – Barley----------------------------- 39
1.5. Grain Maize – Balance sheet 1999/2000 (thousand t)------------------------------ 40
1.5.1. Development of European balance sheet – Grain Maize ---------------------- 40
1.6. Rye – Balance sheet 1999/2000 (thousand t) ----------------------------------------41
1.6.1. Development of European balance sheet – Rye---------------------------------41
2. BALANCE SHEET RICE ---------------------------------------------------------------------- 42
2.1. Rice - Balance sheet 2000 (thousand t: milled equivalent) ------------------------- 42
2.1.1. Development of European balance sheet – Rice(thousand t: milled equivalent)-------------------------------------------------- 42
3. BALANCE SHEET SUGAR-------------------------------------------------------------------- 43
3.1. Sugar – Balance sheet 2000 (thousand t) ------------------------------------------- 43
3.1.1. Development of European balance sheet – Sugar ----------------------------- 43
4. OILSEEDS PRODUCTION (OILSEEDS FOR FOOD AND NON-FOOD PURPOSES) ---------------- 44
4.1. Oilseeds area and production 2001: sunflower, rape seed, soya (thousand ha/t) 44
4.1.1. Development of European area and productionfor soya, sunflower and rape seed (food and non-food purposes) ----------- 44
5. PROTEIN CROPS PRODUCTION -------------------------------------------------------------- 45
5.1. Protein crops - Production 2001/2002 (thousand t)-------------------------------- 45
5.1.1. Development of area and production – Protein crops ------------------------- 45
6. TOMATO AND APPLE PRODUCTION---------------------------------------------------------- 46
6.1. Tomato – Production 2001 (thousand t) --------------------------------------------- 46
6.1.1. Development of European production – Tomato (thousand t) ---------------- 46
6.2. Apple – Production 2001 (thousand t)------------------------------------------------ 47
6.2.1. Development of European production – Apple (thousand t) ------------------ 47
7. TOBACCO PRODUCTION--------------------------------------------------------------------- 48
7.1. Raw Tobacco Production 2000 ------------------------------------------------------- 48
7.1.1. Development of European raw tobacco area----------------------------------- 48

Table of contents
European agriculture entering the 21st century 5
8. COTTON PRODUCTION---------------------------------------------------------------------- 49
8.1. Cotton - Production 2000/2001 (thousand t) --------------------------------------- 49
8.1.1. Development of European production – Cotton (thousand t) ----------------- 49
9. BALANCE SHEET OLIVE OIL AND TABLE WINE --------------------------------------------- 50
9.1. Olive oil - Balance sheet 2001/2002 (thousand t) ---------------------------------- 50
9.1.1. Development of European balance sheet – Olive oil (thousand t) ------------ 50
9.2. Table Wine - Balance sheet 2000/2001 (1 000 hl) ----------------------------------51
9.2.1. Development of European balance sheet – Table wine (1 000 hl) -------------51
10. BALANCE SHEET MEAT--------------------------------------------------------------------- 52
10.1. Total meat – Balance sheet 1999 (thousand t) ----------------------------------- 52
10.1.1. Development of European balance sheet - Total meat (EU-12 until 1994) - 52
10.2. Beef and Veal – Balance sheet 1999 (thousand t)-------------------------------- 53
Development of European balance sheet - Beef and Veal (EU–12 until 1994)-- 53
10.3. Pig – Balance sheet 1999 (thousand t) -------------------------------------------- 54
10.3.1. Development of European balance sheet - Pig (EU–12 until 1994) ---------- 54
10.4. Poultry – Balance sheet 1999 (thousand t) --------------------------------------- 55
10.4.1. Development of European balance sheet - Poultry (EU–12 until 1994)------ 55
10.5. Sheep and goat - Balance sheet 1999 (thousand t) ------------------------------ 56
10.5.1. Development of European balance sheet - Sheep and goat(EU–12 until 1994)--------------------------------------------------------------- 56
11. BALANCE SHEET DAIRY PRODUCTS --------------------------------------------------------- 57
11.1. Butter - Balance sheet 1999 (thousand t) ---------------------------------------- 57
11.1.1. Development of European balance sheet – Butter (thousand t)-------------- 57
11.2. Cheese - Balance sheet 1999 (thousand t) --------------------------------------- 58
11.2.1. Development of European balance sheet – Cheese (thousand t) ------------- 58
11.3. Skimmed Milk Powder - Balance sheet 1999 (thousand t)----------------------- 59
11.3.1. Development of European balance sheet – Skimmed Milk Powder(thousand t)---------------------------------------------------------------------- 59
11.4. Whole Milk Powder - Balance sheet 1999 (thousand t) -------------------------- 60
11.4.1. Development of European balance sheet – Whole Milk Powder (thousand t) 60

Table of contents
European agriculture entering the 21st century 6
CHAPTER III EXPENDITURE AND SUPPORT FOR THE AGRICULTURAL SECTOR INTHE EU--------------------------------------------------62
1. BUDGET BREAKDOWN: EAGGF GUARANTEE SECTION 1993-2001 IN THE EU(MILLION EUR) ---------------------------------------------------------------------------- 62
2. TREND IN EAGGF GUARANTEE SECTION EXPENDITURE BY MEMBER STATE(MILLION EUR) ---------------------------------------------------------------------------- 62
3. EVOLUTION IN EAGGF GUARANTEE SECTION EXPENDITURE BY PRODUCT (MILLION EUR) 63
4. TREND IN EAGGF GUIDANCE SECTION EXPENDITURE BY MEMBER STATE (MILLION EUR)63
5. DIRECT PAYMENTS TO THE PRODUCERS, BY SIZE CLASS, PAID BY THE EAGGF IN THEFINANCIAL YEAR 2000 FOR ARABLE CROPS AND LIVESTOCK PREMIA---------------------- 64
6. NUMBER OF BENEFICIARIES OF DIRECT PAYMENTS, BY SIZE CLASS, PAID BY THE EAGGF INTHE FINANCIAL YEAR 2000 FOR ARABLE CROPS AND LIVESTOCK PREMIA ----------------- 64
7. DEVELOPMENT IN THE PSE OF THE AGRICULTURAL SECTOR AS A WHOLE IN THE EU (%) -- 65
8. DEVELOPMENT IN THE PSE OF SPECIFIC AGRICULTURAL PRODUCTS IN THE EU (%) ------- 65
ANNEX -------------------------------------------------------------------------------------- 66
1. AVERAGE AGRICULTURAL AREA AND AVERAGE STANDARD GROSS MARGIN PER HOLDING -- 67
2. UTILISED AGRICULTURAL AREA BY TYPE OF FARMING ------------------------------------- 68
3. TOTAL NUMBER OF HOLDINGS BY SIZE CLASS---------------------------------------------- 69
4. EMPLOYMENT IN AGRICULTURE ------------------------------------------------------------ 70
5. FARM NET VALUE ADDED PER TOTAL LABOUR INPUT IN THE FADN REGIONS----------------71
6. INTRA-EU TRADE IN AGRICULTURE -------------------------------------------------------- 72

Foreword
European agriculture entering the 21st century 7
Foreword
This publication provides an overview of the evolution of the agricultural situationin the EU and in all Member States over the last 10 years. It can therefore beinterpreted as a dynamic photograph of European agriculture at the beginning ofthe new century.
It is mainly based on statistical information from Eurostat, as available inSeptember 2002. In certain cases, data collected or estimated by theDirectorate-General for Agriculture have also been used.
This report contains three chapters. Chapter I focuses on the agriculturaleconomy in the EU and covers the following aspects: the role of agriculture in theeconomy, structures of agricultural holdings, employment in agriculture, prices,income and trade. Chapter II gives an overview of the market balance sheets for acertain number of agricultural products. Chapter III covers the main budgetaryaspects.

List of acronyms and abbreviations
European agriculture entering the 21st century 8
List of acronyms and abbreviations
A AustriaAWU Annual Working UnitB BelgiumBLEU Belgium and LuxembourgCAP common agricultural policyD GermanyDG AGRI European Commission, Directorate-General for AgricultureDK DenmarkE SpainEAGGF European Agricultural Guidance and Guarantee FundEL GreeceESU Economic Size UnitEU European UnionEurostat Statistical Office of the European CommunitiesF FranceFADN farm accountancy data networkFIN FinlandGDP gross domestic productha hectarehl hectolitreI ItalyIRL IrelandL LuxembourgLSU Livestock Size Unitmio T million metric tonneMS Member StateNL NetherlandsOECD Organisation for Economic Co-operation and DevelopmentP PortugalPSE Producer Support EstimateS SwedenSGM Standard Gross MarginSMP Skimmed Milk Powdert metric tonneUAA Utilised Agricultural AreaUK United KingdomWMP Whole Milk Powder

Chapter I The agricultural economy in the EU
European agriculture entering the 21st century 9
THE AGRICULTURAL ECONOMY
IN THE EUROPEAN UNION

Chapter I The agricultural economy in the EU
European agriculture entering the 21st century 10
Chapter I The agricultural economy in the EU
1. Key agricultural statistics
1.1. Share of agriculture in the GDP
0
1
2
3
4
5
6
7
B DK D EL E F IRL I L NL A P FIN S UK EU15
%
1991 2000
Source: Eurostat National Accounts, Economic Accounts for Agriculture.
1.2. Share of agriculture in employed civilian working population
0
3
6
9
12
15
18
21
B DK D EL E F IRL I L NL A P FIN S UK EU15
%
1994 2001
Source: Eurostat Employment.

Chapter I The agricultural economy in the EU
European agriculture entering the 21st century 11
2. Structure of agricultural holdings
2.1. Land use (1 000 ha)
1991 2000 1991 2000 1991 2000 1991 2000 1991 2000 1991 2000EU-15 323 017 323 538 : : 140 871 : 76 712 73 594 52 096 : 11 624 11 128EU-12 235 820 236 341 : : 131 497 : 69 973 67 436 49 563 : 11 540 11 049
Belgium 3 052 3 053 617 607 1 375 1 396 781 867 556 506 16 21Denmark 4 309 4 309 445 445 2 786 2 641 2 563 2 468 212 166 10 6Germany 35 697 35 703 : : 17 136 17 067 11 559 11 804 5 330 5 048 218 207Greece 13 196 13 196 2 940 : 5 169 3 901 2 329 2 783 1 789 : 1 052 1 113Spain 50 599 50 599 15 858 15 915 30 054 25 386 15 185 13 205 10 037 7 184 4 832 4 965France 54 397 54 909 14 849 15 333 30 441 29 796 17 809 18 339 11 198 10 128 1 207 1 151Ireland 7 029 7 030 : : 4 444 : 754 960 3 687 : 2 2Italy 30 132 30 132 : 6 851 16 946 15 189 9 025 8 211 4 508 4 145 3 323 2 738Luxembourg 259 259 89 88 126 135 55 68 69 65 2 1Netherlands 3 551 3 552 309 322 1 971 1 969 888 1 018 1 044 902 34 34Austria 8 386 8 386 3 229 : 3 477 3 407 1 427 1 381 1 953 1 943 79 73Portugal 9 191 9 191 3 108 3 324 4 121 3 907 2 445 1 730 857 1 390 787 765Finland 33 815 33 815 23 186 : 2 539 2 209 2 521 2 178 15 26 2 4Sweden 44 996 44 996 22 535 22 323 3 358 2 974 2 790 2 599 565 372 3 3UK 24 410 24 410 2 425 : 16 928 15 722 6 580 5 984 10 276 9 693 56 45
Total AreaWooded area UAA
Total area of which: UAA of which:
Arable land Permanent grassland
Land under permanent
crops
Source: Eurostat, Land use.
2.2. Agricultural holdings: total number and average agricultural area
89/90 1993 1995 1997 89/90 1993 1995 1997 89/90 1993 1995 1997
EU-15 : : 7 370 6 989 : : 128 497 128 691 : : 17.4 18.4
EU-12 7 993 7 264 6 959 6 598 119 581 118 953 119 821 119 995 15.0 16.4 17.2 18.2
Belgium 85 76 71 67 1 345 1 344 1 354 1 383 15.8 17.6 19.1 20.6
Denmark 81 74 69 63 2 779 2 739 2 727 2 689 34.2 37.1 39.6 42.5
Germany 654 606 567 534 17 048 17 022 17 157 17 160 26.1 28.1 30.3 32.1
Greece 850 819 802 821 3 661 3 539 3 578 3 499 4.3 4.3 4.5 4.3
Spain 1 594 1 384 1 278 1 208 24 531 24 714 25 230 25 630 15.4 17.9 19.7 21.2
France 924 801 735 680 28 186 28 107 28 267 28 331 30.5 35.1 38.5 41.7
Ireland 171 159 153 148 4 442 4 278 4 325 4 342 26.0 26.8 28.2 29.4
Italy 2 665 2 488 2 482 2 315 14 947 14 736 14 685 14 833 5.6 5.9 5.9 6.4
Luxembourg 4 3 3 3 127 127 127 127 31.8 37.4 39.7 42.3
Netherlands 125 120 113 108 2 011 2 015 1 999 2 011 16.1 16.8 17.7 18.6
Austria : : 222 210 : : 3 425 3 415 : : 15.4 16.3
Portugal 599 489 451 417 4 006 3 950 3 925 3 822 6.7 8.1 8.7 9.2
Finland : : 101 91 : : 2 192 2 172 : : 21.7 23.8
Sweden : : 89 90 : : 3 060 3 109 : : 34.5 34.7
United Kingdom 243 244 235 233 16 499 16 383 16 447 16 169 67.9 67.3 70.1 69.3
Total number of holdings (1000 units)
Total agricultural area (1000 ha)
Agricultural Area per holding (ha)
Source: Eurostat, Farm Structure Surveys.
UAA: Utilised Agricultural Area

Chapter I The agricultural economy in the EU
European agriculture entering the 21st century 12
2.3. Total number of holdings by size classes (1 000 holdings)
89/90 1993 1995 1997 89/90 1993 1995 1997 89/90 1993 1995 1997EU-15 : : 5 154 4 831 : : 1 630 1 560 : : 586 599EU-12 5 816 5 201 4 970 4 661 1 675 1 529 1 436 1 374 503 534 552 563
Belgium 44 38 34 31 35 33 31 29 5 5 6 7Denmark 14 14 13 13 51 44 38 33 16 16 17 18Germany 321 287 263 246 277 254 232 213 56 66 72 76Greece 772 742 723 743 75 74 76 75 4 3 3 3Spain 1 216 1 021 918 845 291 270 263 265 87 93 97 99France 346 299 270 244 398 309 266 234 180 194 199 202Ireland 43 39 35 30 108 102 98 98 20 19 20 21Italy 2 383 2 197 2 196 2 027 243 251 246 247 38 41 40 42Luxembourg 1 1 1 1 2 1 1 1 1 1 1 1Netherlands 62 60 56 52 57 53 51 49 6 7 7 8Austria : : 129 119 : : 85 83 : : 8 9Portugal 549 436 398 366 41 44 43 41 9 10 10 10Finland : : 29 22 : : 66 61 : : 7 8Sweden : : 27 29 : : 44 42 : : 19 19United Kingdom 64 67 62 65 98 96 93 90 81 80 80 79
Number of holdings of 50 ha and more
Number of holdings of less than 10 ha
Number of holdings from 10 to less than 50 ha
Source: Eurostat, Farm Structure Surveys.
2.4. Distribution of holdings by size classes (%)
0%
20%
40%
60%
80%
100%
< 10 ha 10-<50 ha >= 50 ha
1 2 3B
1 2 3 DK
1 2 3D
1 2 3 F
1 2 3 IRL
1 2 3 I
1 2 3 L
1 2 3 NL
3 A
2 3 P
3 FIN
3 S
1 2 3 UK
2 3 EL
1:1975 2:1987 3:1997
2 3 E
Source: Eurostat, Farm Structure Surveys.

Chapter I The agricultural economy in the EU
European agriculture entering the 21st century 13
2.5. The economic size of agricultural holdings (Economic Size Unit)
89/90 1993 1995 1997 89/90 1993 1995 1997 89/90 1993 1995 1997EU-15 : : 109 882 116 586 : : 7 370.0 6 989.2 : : 14.9 16.7EU-12 91 492 103 886 103 800 109 960 7 992.9 7 264.0 6 958.5 6 598.0 11.4 14.3 14.9 16.7
Belgium 2 400 2 980 3 024 3 155 85.0 76.3 71.0 67.2 28.2 39.1 42.6 46.9Denmark 3 032 3 594 3 557 3 615 81.3 73.8 68.8 63.2 37.3 48.7 51.7 57.2Germany 11 990 15 937 15 845 17 301 653.6 606.1 566.9 534.4 18.3 26.3 28.0 32.4Greece 3 766 5 118 4 865 4 739 850.1 819.2 802.4 821.4 4.4 6.2 6.1 5.8Spain 8 889 11 458 10 973 12 837 1 593.6 1 383.9 1 277.6 1 208.3 5.6 8.3 8.6 10.6France 21 916 23 373 23 015 23 992 923.6 801.3 734.8 679.8 23.7 29.2 31.3 35.3Ireland 1 980 2 393 2 526 2 761 170.6 159.4 153.4 147.8 11.6 15.0 16.5 18.7Italy 20 072 18 970 18 535 18 542 2 664.6 2 488.4 2 482.1 2 315.2 7.5 7.6 7.5 8.0Luxembourg 91 99 96 105 4.0 3.4 3.2 3.0 22.8 29.1 30.0 35.0Netherlands 6 441 8 274 8 930 9 077 124.8 119.7 113.2 107.9 51.6 69.1 78.9 84.1Austria 2 462 2 432 221.8 210.1 11.1 11.6Portugal 2 307 2 443 2 438 2 707 598.7 489.0 450.6 416.7 3.9 5.0 5.4 6.5Finland 1 565 2 152 101.0 91.4 15.5 23.5Sweden 2 055 2 041 88.8 89.6 23.1 22.8United Kingdom 8 609 9 247 9 996 11 129 243.1 243.5 234.5 233.2 35.4 38.0 42.6 47.7
Average SGM per holding (ESU)Total Standard Gross Margin
(1000 ESU)Total number of holding
(1000 holdings)
Source: Eurostat, Farm Structure Surveys.
2.6. Standard Gross Margin per holding (Economic Size Unit)
0
15
30
45
60
75
90
B DK D EL E F IRL I L NL A P FIN S UK
1989/90 1997
Source: Eurostat, Farm Structure Surveys.
An Economic Size Unit corresponds to 1 200 EUR of Standard Gross Margin

Chapter I The agricultural economy in the EU
European agriculture entering the 21st century 14
2.7. Total number of holdings by economic size classes (thousand EconomicSize Unit)
1989/990 1993 1995 1997
0 < 4 4 < 40 > 40 0 < 4 4 < 40 > 40 0 < 4 4 < 40 > 40 0 < 4 4 < 40 > 40
EU-15 : : : : : : 3 891 2 793 687 3 531 2 722 736EU-12 4 602 2 824 545 3 889 2 729 646 3 738 2 567 654 3 391 2 516 692
Belgium 20 43 22 16 33 28 13 30 28 12 27 29Denmark 5 51 26 4 41 28 4 38 27 4 34 26Germany 204 345 83 192 304 110 186 268 113 167 246 122Greece 547 300 3 434 378 7 437 359 7 456 360 5Spain 1 107 461 26 832 508 44 754 480 43 662 488 58France 261 505 158 222 393 186 201 344 190 178 296 205Ireland 73 88 10 53 92 14 47 90 16 38 90 19Italy 1 824 754 87 1 696 707 85 1 701 698 83 1 523 713 79Luxembourg 1 2 1 1 2 1 1 1 1 1 1 1Netherlands 4 60 61 2 50 68 2 44 67 1 41 66Austria : : : : : : 93 119 10 89 110 11Portugal 479 114 6 360 122 7 326 116 8 279 128 10Finland : : : : : : 29 65 7 18 56 17Sweden : : : : : : 31 42 16 33 40 16United Kingdom 77 101 64 78 99 67 66 98 71 70 91 71
Number of holdings per class (1000)
Source: Eurostat, Farm Structure Surveys.
2.8. Distribution of holdings by economic size classes (%)
1: 1989/90 2: 1993 3: 1995 4: 1997
0%
20%
40%
60%
80%
100%
% <4 % from 4 to less than 40 ESU % 40 and more
1 2 3 4
B 1 2 3 4
DK 1 2 3 4
D1 2 3 4
EL 1 2 3 4
E 1 2 3 4
F 1 2 3 4
IRL 1 2 3 4
I 1 2 3 4
L1 2 3 4
NL1 2 3 4
A 1 2 3 4
P1 2 3 4
FIN 1 2 3 4
S 1 2 3 4
UK
Source: Eurostat, Farm Structure Surveys.

Chapter I The agricultural economy in the EU
European agriculture entering the 21st century 15
2.9. Type of tenure
1989/90 1993 1995 1997 1989/90 1993 1995 1997EU-15 : : 76 337 75 930 : : 59.4 59.0EU-12 72 505 70 564 70 283 69 859 60.6 59.3 58.7 58.2
Belgium 444 441 438 441 33.0 32.8 32.3 31.9Denmark 2 249 2 160 2 112 2 019 80.9 78.9 77.5 75.1Germany 6 751 6 800 6 531 6 354 39.6 39.9 38.1 37.0Greece 2 799 2 662 2 638 2 581 76.4 75.2 73.7 73.8Spain 17 730 17 961 18 248 18 530 72.3 72.7 72.3 72.3France 12 212 11 055 10 401 9 879 43.3 39.3 36.8 34.9Ireland 3 891 3 767 3 788 3 767 87.6 88.1 87.6 86.7Italy 12 097 11 464 11 470 11 583 80.9 77.8 78.1 78.1Luxembourg 64 61 60 59 50.4 47.6 47.1 46.5Netherlands 1 346 1 302 1 393 1 442 66.9 64.6 69.7 71.7Austria : : 2 671 2 637 : : 78.0 77.2Portugal 2 762 2 749 2 731 2 659 69.0 69.6 69.6 69.6Finland : : 1 708 1 741 : : 77.9 80.2Sweden : : 1 676 1 693 : : 54.8 54.4United Kingdom 10 160 10 143 10 476 10 545 61.6 61.9 63.7 65.2
Percentage of agricultural area owner-farmed
Agricultural area owner-farmed (1000 ha)
Source: Eurostat, Farm Structure Surveys.
2.10. Holdings with livestock
89/90 1993 1995 1997 89/90 1993 1995 1997 89/90 1993 1995 1997EU-15 : : 3 897 3 519 : : 114.9 115.4 : : 29.5 32.8EU-12 4 359 3 844 3 619 3 263 111.6 109.3 108.8 109.2 25.6 28.4 30.0 33.5
Belgium 69 61 57 53 4.3 4.3 4.4 4.4 61.2 70.5 77.9 83.5Denmark 61 54 48 45 3.9 4.5 4.3 4.3 64.9 84.2 89.4 96.0Germany 503 458 422 393 21.6 19.5 19.0 18.9 42.9 42.4 45.2 48.2Greece 483 494 487 446 2.5 2.2 2.3 2.3 5.1 4.5 4.6 5.1Spain 633 515 468 421 10.4 10.6 10.8 11.3 16.5 20.6 23.1 26.7France 708 589 540 493 24.1 23.6 24.2 23.9 34.0 40.1 44.8 48.4Ireland 162 155 147 144 6.5 6.5 6.5 6.9 40.1 41.9 44.1 47.8Italy 968 848 823 697 11.3 10.9 10.6 10.6 11.6 12.8 12.9 15.2Luxembourg 3 3 3 2 0.2 0.2 0.2 0.2 54.5 60.7 65.4 70.8Netherlands 88 84 78 74 7.9 8.1 7.7 7.7 90.5 96.7 99.1 103.6Austria : : 158 148 : : 2.9 2.8 : : 18.1 18.7Portugal 496 392 353 319 2.4 2.4 2.4 2.3 4.9 6.0 6.7 7.3Finland : : 60 52 : : 1.3 1.3 : : 21.2 25.8Sweden : : 59 56 : : 2.1 2.1 : : 34.7 36.8United Kingdom 187 191 195 177 16.6 16.6 16.4 16.6 88.5 86.7 84.4 93.7
Number of holdings with livestock (1000 units)
Livestock (million LSU)
Livestock per holding (LSU)
Source: Eurostat, Farm Structure Surveys.
LSU: Livestock Size Unit
Chapter I The agricultural economy in the EU
European agriculture entering the 21st century 16
2.11. Total number of holdings by type of farming in 1997 (1 000 holdings)
Type of farming of which:
Specialist Field crops
Horti culture
Permanent crops
Grazing livestock
GranivoresMixed
croppingMixed
livestock
Mixed crops and
livestockEU-15 6 989 1 536 191 2 297 1 557 91 598 193 492
Belgium 67 9 5 3 32 5 2 4 8Denmark 63 29 1 1 13 4 2 2 12Germany 534 118 12 43 221 8 23 24 87Greece 821 211 17 407 46 4 75 15 47Spain 1 208 206 52 531 203 15 103 35 57France 680 137 18 107 264 10 37 35 73Ireland 148 4 0 0 139 1 0 0 4Italy 2 315 609 46 1 046 212 9 246 24 96Luxembourg 3 0 0 1 2 0 0 0 0Netherlands 108 15 15 6 51 10 2 4 5Austria 210 32 2 22 111 8 7 11 17Portugal 417 43 12 127 51 6 94 34 50Finland 91 38 4 1 37 4 2 1 6Sweden 90 41 2 1 24 1 2 1 17United Kingdom 233 46 5 3 151 7 3 3 14
Total number
Source: Eurostat, Farm Structure Surveys.
2.12. Utilised Agricultural Area by type of farming in 1997 (1 000 ha)
Principal Type of farming of which:
Specialist Field crops
Horti culture
Permanent crops
Grazing livestock
GranivoresMixed
croppingMixed
livestock
Mixed crops and
livestockEU-15 128 712 41 381 710 10 074 48 135 1 143 6 989 3 716 16 493
Belgium 1 383 253 18 22 673 35 40 87 254Denmark 2 689 1 084 10 9 624 189 85 113 576Germany 17 183 5 701 35 224 5 405 112 766 671 4 268Greece 3 499 1 399 32 955 355 6 351 114 288Spain 25 630 9 320 210 3 957 6 997 173 2 129 749 2 068France 28 331 9 572 130 1 366 10 888 141 1 011 943 4 282Ireland 4 342 241 2 0 3 873 10 3 17 196Italy 14 833 5 163 91 2 712 3 606 64 1 575 300 1 281Luxembourg 127 4 0 2 97 1 1 6 16Netherlands 2 011 495 64 37 1 143 51 51 61 108Austria 3 415 606 7 106 1 996 97 135 140 328Portugal 3 822 583 25 614 1 008 29 573 320 670Finland 2 172 878 34 3 872 120 41 32 192Sweden 3 109 1 270 19 8 1 104 34 81 56 538United Kingdom 16 169 4 812 34 60 9 495 84 149 107 1 426
Total Area
Source: Eurostat, Farm Structure Surveys.
Chapter I The agricultural economy in the EU
European agriculture entering the 21st century 17
3. Agricultural labour
3.1. Evolution of employment in agriculture in the EU (1 000 AWU)
0
2 000
4 000
6 000
8 000
10 000
12 000
1980 1981 1982 1983 1984 1985 1986 1987 1988 1989 1990 1991 1992 1993 1994 1995 1996 1997 1998 1999 2000 2001
Source: Eurostat (Economic Accounts for Agriculture) - EU15 (excluding GDR 1980-1990).
3.2. Evolution of the employment in agriculture per MS (1 000 AWU)
1991 1992 1993 1994 1995 1996 1997 1998 1999 2000 2001
Belgium 94 90 88 86 84 80 80 77 76 74 72Denmark 102 99 98 93 90 89 87 83 79 76 74Germany 1 042 876 816 764 726 698 678 660 655 646 619Greece 687 697 708 675 645 624 605 600 594 577 561Spain 1 040 1 014 1 112 1 100 1 088 1 089 1 099 1 121 1 050 947 930France 1 315 1 260 1 195 1 159 1 129 1 101 1 074 1 052 1 033 1 015 997Ireland 262 259 252 244 232 232 214 209 192 186 176Italy 1 800 1 745 1 597 1 522 1 463 1 397 1 356 1 298 1 218 1 187 1 193Luxembourg 6 6 5 5 5 5 5 5 4 4 4Netherlands 232 234 231 225 221 225 226 221 220 220 212Austria 213 208 204 195 187 181 180 178 176 172 169Portugal 839 771 703 689 675 639 603 567 532 536 525Finland 162 160 153 146 140 137 134 127 121 109 106Sweden 96 95 94 93 90 87 84 80 76 73 70United Kingdom 422 414 409 400 391 384 380 374 361 338 332
Source: Eurostat (Economic Accounts for Agriculture).
AWU: Annual Working Unit

Chapter I The agricultural economy in the EU
European agriculture entering the 21st century 18
3.3. Share of women in total employment in the EU agriculture (%)
0
15
30
45
60
B DK D EL E F IRL I L NL A P FIN S UK EU15
%
1994 2001
Source: Eurostat (Employment).
3.4. Distribution of total labour force per holder’s age (1 000 holders)
89/90 1993 1995 1997 89/90 1993 1995 1997 89/90 1993 1995 1997 89/90 1993 1995 1997EU-15 : : 571 522 : : 2682 2581 : : 1995 1815 : : 2022 1950EU-12 656 578 507 468 3009 2652 2473 2377 2302 2034 1912 1737 1936 1910 1976 1906
Belgium 10 9 11 9 32 29 29 29 25 21 18 15 17 16 12 12Denmark 9 7 7 7 35 32 30 29 21 18 16 14 16 16 16 13Germany 101 103 98 86 317 292 269 260 181 163 153 132 47 42 42 41Greece 74 59 49 44 317 291 278 278 243 228 227 218 216 241 249 281Spain 113 88 77 69 582 482 426 408 489 420 367 323 384 364 371 368France 121 104 92 79 387 353 341 338 276 213 174 140 126 116 110 106Ireland 22 24 21 18 71 66 64 64 38 37 35 33 39 32 33 32Italy 138 133 110 119 895 791 747 699 763 701 701 656 851 851 912 828Luxembourg 0 0 0 0 2 2 1 1 1 1 1 1 1 1 1 1Netherlands 11 12 10 7 58 53 50 47 34 32 30 29 19 19 19 20Austria : : 40 35 : : 110 107 : : 47 43 : : 21 21Portugal 40 23 19 15 213 158 140 124 171 141 129 116 171 161 157 155Finland : : 16 13 : : 60 56 : : 18 16 : : 7 5Sweden : : 7 6 : : 40 40 : : 18 19 : : 18 18United Kingdom 17 15 14 13 100 103 97 101 60 59 59 58 50 51 55 50
<35 years old from 35 to 54 years old from 55 to 64 years old more than 65 years old
Source: Eurostat (Eurofarm).

Chapter I The agricultural economy in the EU
European agriculture entering the 21st century 19
3.5. Evolution of agricultural labour per holding
89/90 1993 1995 1997 89/90 1993 1995 1997 89/90 1993 1995 1997EU-15 : : 7 370 6 989 : : 7 264 7 023 : : 1.0 1.0EU-12 7 993 7 264 6 959 6 598 7 712 7 235 6 857 6 638 1.0 1.0 1.0 1.0
Belgium 85 76 71 67 93 85 79 79 1.1 1.1 1.1 1.2Denmark 81 74 69 63 95 105 105 98 1.2 1.4 1.5 1.5Germany 654 606 567 534 1 030 804 711 657 1.6 1.3 1.3 1.2Greece 850 819 802 821 680 702 638 597 0.8 0.9 0.8 0.7Spain 1 594 1 384 1 278 1 208 1 143 1 112 1 090 1 099 0.7 0.8 0.9 0.9France 924 801 735 680 1 257 1 081 1 015 958 1.4 1.3 1.4 1.4Ireland 171 159 153 148 250 240 218 202 1.5 1.5 1.4 1.4Italy 2 665 2 488 2 482 2 315 1 924 1 837 1 818 1 798 0.7 0.7 0.7 0.8Luxembourg 4 3 3 3 6 6 5 5 1.6 1.7 1.7 1.7Netherlands 125 120 113 108 225 224 210 209 1.8 1.9 1.9 1.9Austria : : 222 210 : : 187 178 : : 0.8 0.8Portugal 599 489 451 417 847 605 584 520 1.4 1.2 1.3 1.2Finland : : 101 91 : : 131 126 : : 1.3 1.4Sweden : : 89 90 : : 88 82 : : 1.0 0.9United Kingdom 243 244 235 233 474 434 384 416 1.9 1.8 1.6 1.8
Number of holdings (1000 units)
Total labour input (1000 AWU)
Labour force per holding (AWU)
Source: Eurostat, Farm Structure Surveys; DG AGRI calculation.
3.6. Total agricultural labour: breakdown by working time (1 000 persons)
89/90 1993 1995 1997 89/90 1993 1995 1997 89/90 1993 1995 1997EU-15 : : 9 539 9 335 : : 2 304 2 129 : : 3 290 3 182EU-12 9 938 9 467 8 975 8 792 2 612 2 192 2 127 1 964 3 592 3 334 3 080 2 986
Belgium 53 55 53 47 22 18 14 13 65 58 55 57Denmark 54 47 44 40 19 17 23 19 65 77 74 70Germany 896 821 751 704 217 161 138 121 663 496 437 405Greece 1 003 1 276 1 114 1 184 351 325 309 289 189 173 143 122Spain 1 759 1 764 1 646 1 635 371 259 299 280 444 548 492 480France 738 658 625 576 401 321 290 267 717 630 591 560Ireland 64 88 83 87 67 62 57 55 182 170 153 140Italy 4 210 3 635 3 652 3 500 562 539 553 515 516 588 568 586Luxembourg 2 2 2 1 3 3 2 3 4 3 3 3Netherlands 73 75 74 90 75 63 65 60 141 152 137 133Austria : : 348 326 : : 113 104 : : 85 82Portugal 853 781 705 667 436 337 302 255 272 146 166 149Finland : : 116 114 : : 36 33 : : 80 76Sweden : : 91 103 : : 28 28 : : 45 38United Kingdom 231 266 227 260 89 88 76 89 334 292 261 280
< 50% * = 50 % < 100% * Full-time
Source: Eurostat, Farm Structure Surveys. * Percentage of annual working time out of a full-timerate. Labour excludes non-family labour force employed on a non-regular basis.
AWU: Annual Work Unit

Chapter I The agricultural economy in the EU
European agriculture entering the 21st century 20
3.7. Holders with other gainful activities (1 000 holders)
of which: of which:
89/90 1993 1995 1997 89/90 1993 1995 1997 89/90 1993 1995 1997EU-15 : : 6 944 6 521 : : 1 665 1 516 : : 347 356EU-12 7 607 6 822 6 559 6 160 1 543 1 413 293 294
Belgium 84 75 69 65 27 12 9 9 2 2 2 2Denmark 80 72 67 62 9 16 16 18 17 5 5 4Germany 626 582 548 505 245 229 216 199 32 32 31 29Greece 847 814 796 813 177 198 170 182 43 44 34 33Spain 1 432 1 179 1 055 990 408 349 246 236 82 58 48 39France 908 785 717 661 135 112 102 92 83 78 75 72Ireland 165 154 148 143 34 30 30 24 9 22 20 23Italy 2 574 2 370 2 423 2 215 717 548 570 479 63 87 39 50Luxembourg 4 3 3 2 1 0 0 0 0 0 0 0Netherlands 119 116 103 104 : 21 19 15 : 7 7 8Austria : : 203 192 : : 68 49 : : 12 25Portugal 569 471 433 400 184 : 129 119 24 : 14 12Finland : : 100 87 : : 23 21 : : 27 22Sweden : : 81 82 : : 29 32 : : 15 16United Kingdom 200 201 197 199 35 43 37 39 25 19 19 21
With another main gainful activity
With another secondary gainful activity
Total holders:
Source: Eurostat, Farm Structure Surveys.

Chapter I The agricultural economy in the EU
European agriculture entering the 21st century 21
4. Prices and Income in Agriculture
4.1. Indices of real output prices* for agricultural products (1990=100)
1991 1992 1993 1994 1995 1996 1997 1998 1999 2000 2001
EU-15 97.2 89.4 84.6 84.8 85.2 83.0 80.0 76.6 72.8 74.0 75.4
Belgium 98.1 92.3 83.8 84.8 79.4 79.2 79.2 74.6 68.3 72.0 71.8Denmark 96.2 92.8 80.0 79.5 77.8 77.3 76.0 66.7 62.6 67.0 70.4Germany 95.2 91.2 80.6 79.4 78.7 76.8 76.1 71.0 67.2 70.6 73.1Greece 100.6 90.5 84.3 87.5 87.7 86.5 84.7 80.9 79.3 80.3 82.4Spain 94.9 83.5 84.1 88.8 94.1 90.5 84.8 81.7 78.9 78.5 79.2France 97.7 89.6 83.5 80.7 80.2 78.6 78.0 77.6 74.5 74.2 74.3Ireland 93.4 91.9 96.7 95.8 95.6 89.3 82.4 79.9 74.6 76.0 76.4Italy 102.8 89.8 87.8 87.5 90.9 89.2 87.4 85.3 81.0 81.4 83.2Luxembourg 89.6 82.3 78.0 75.9 73.6 71.0 71.4 69.6 69.2 67.1 66.9Netherlands 100.8 92.1 83.4 84.2 84.9 84.8 87.0 81.8 74.1 80.1 80.6Austria 97.1 92.5 87.3 85.5 63.2 62.7 63.4 58.7 56.6 59.3 61.7Portugal 87.3 74.3 71.4 73.8 72.2 69.7 64.3 66.6 62.2 62.5 63.8Finland 92.5 89.6 87.7 86.6 63.9 54.4 53.0 51.8 50.2 51.4 50.4Sweden 91.5 86.4 79.3 81.6 79.8 76.2 73.7 74.6 72.2 68.3 69.9United Kingdom 93.7 91.9 94.5 93.2 98.2 94.4 79.1 69.7 65.9 65.9 70.2
Source: Eurostat (Agricultural prices).
*Note: Output prices do not include direct payments granted to partially compensate the reduction insupport prices from 1993 onwards.
4.2. Indices of real purchase prices for goods and services currentlyconsumed in agriculture (1990=100)
1991 1992 1993 1994 1995 1996 1997 1998 1999 2000 2001
EU-15 97.4 95.0 93.4 91.3 90.8 92.2 90.9 86.4 84.1 87.7 88.9
Belgium 97.1 94.5 91.0 88.5 87.4 89.4 89.7 84.4 82.4 87.1 85.7Denmark 96.7 94.1 92.7 89.0 87.6 88.6 88.7 85.5 82.5 83.6 88.4Germany 98.3 96.0 91.9 90.0 88.5 89.8 89.9 85.0 83.7 91.2 92.4Greece 101.7 99.2 96.5 97.4 94.2 94.6 92.0 87.8 86.4 91.2 89.7Spain 96.1 92.0 91.1 89.5 88.4 88.7 89.0 86.4 83.4 85.3 83.4France 97.9 96.2 94.2 92.6 92.6 94.4 94.9 91.6 89.5 92.9 93.9Ireland 97.3 94.3 93.0 91.7 90.8 92.7 90.0 86.1 84.6 85.3 86.2Italy 95.9 92.8 95.6 93.1 97.9 97.0 93.2 89.1 86.1 86.3 88.5Luxembourg 98.7 96.0 91.4 89.5 89.0 91.1 90.4 87.4 85.8 87.9 89.0Netherlands 96.9 95.2 90.9 87.5 88.7 90.9 89.3 84.8 81.3 85.9 88.0Austria 98.8 96.3 93.7 88.8 84.8 87.5 89.6 86.0 83.5 88.4 88.6Portugal 94.5 89.3 79.7 79.2 76.0 73.4 69.0 65.4 63.4 64.0 66.4Finland 102.8 102.4 102.0 96.6 74.7 75.9 77.0 73.9 71.6 74.5 73.1Sweden 95.4 92.9 88.4 88.1 90.8 96.6 98.2 96.5 95.3 97.3 100.8United Kingdom 97.6 97.2 99.7 97.0 97.2 101.2 93.5 83.9 81.1 85.5 89.6
Source: Eurostat (Agricultural prices).

Chapter I The agricultural economy in the EU
European agriculture entering the 21st century 22
4.3. Comparison between producer prices for agricultural products and consumerprices for food products in the EU (1995=100 in nominal terms)
111.0
101.3
50
75
100
125
1995 1996 1997 1998 1999 2000 2001
annual index
producer prices consumer prices
Source: Eurostat, DG AGRI calculation.
4.4. Variation in nominal producer prices for agricultural products andharmonised consumer prices for food products from 1991 to 2000 perMember State (%)
-50
-25
0
25
50
75
100
125
150
B DK D EL E F IRL I L NL A P FIN S UK
%
producer prices consumer prices
Source: Eurostat, DG AGRI calculation.

Chapter I The agricultural economy in the EU
European agriculture entering the 21st century 23
4.5. Market value of agricultural land (nominal prices in EUR/ha)
1991 1992 1993 1994 1995 1996 1997 1998 1999 2000
Denmark 6 537 6 275 5 887 6 483 7 608 8 051 8 552 9 734 10 490 10 867Germany : 11 812 11 423 11 349 11 357 10 646 9 865 9 436 8 939 9 081Ireland 4 918 4 944 4 890 5 311 5 449 6 499 7 276 8 820 11 056 12 170Italy 13 776 13 109 11 634 11 535 10 782 11 971 12 496 12 814 13 181 : Luxembourg 55 420 70 444 61 278 44 845 51 590 55 903 53 499 52 929 53 297 : Finland 5 398 3 444 2 539 2 698 3 011 2 717 2 820 3 122 3 426 3 933Sweden : 1 566 1 107 1 190 1 157 1 362 1 480 1 638 1 749 1 989
Source: Eurostat (Agricultural prices, available data).
4.6. Market value of arable land (nominal prices in EUR/ha)
1991 1992 1993 1994 1995 1996 1997 1998 1999 2000
Belgium 11 308 11 696 11 944 12 148 12 860 12 289 12 380 12 579 13 852 14 145France 3 141 3 096 3 060 3 054 3 142 3 188 3 191 3 287 3 461 3 613Netherlands 17 568 17 496 18 665 17 746 19 725 20 750 22 661 24 869 31 492 36 439
Source: Eurostat (Agricultural prices, available data).
4.7. Rents for agricultural land (nominal prices in EUR/ha)
1991 1992 1993 1994 1995 1996 1997 1998 1999 2000
Denmark : 245 241 260 270 292 292 291 304 309Luxembourg 137 144 142 148 154 151 151 158 159 : Austria : : : 241 248 251 245 243 244 236Finland 182 151 137 150 149 144 135 145 151 : Sweden : : 78 80 80 93 97 97 100 107
Source: Eurostat (Agricultural prices, available data).

Chapter I The agricultural economy in the EU
European agriculture entering the 21st century 24
4.8. Development in agricultural income in the EU (index form : base1980=100 and %)
-0.3%
-3.4%
3.0%
-3.6%
11.8%
-0.8%
1.4%0.5%
4.9%
3.1%
0.7%
-2.6%-1.2%
3.3%3.3%
-1.7%
10.9%9.9%
1.2%3.2%
-2.2%
-6%
-3%
0%
3%
6%
9%
12%
15%
18%
1980 19
8119
8219
8319
8419
8519
8619
8719
8819
8919
90 1991
1992
1993
1994
1995
1996
1997
1998
1999
2000
2001
Annual growth
80
90
100
110
120
130
140
150
160Cumulative growth
Annual growth Cumulative growth
Source: Eurostat, DG AGRI calculation.
4.9. Indices of the agricultural income per Member State from 1990 to2001 (1995 = 100)
1990 1991 1992 1993 1994 1995 1996 1997 1998 1999 2000 2001
EU-15 : : : : : 100.0 103.1 103.8 101.1 99.9 103.2 106.6
Belgium 116.9 116.8 113.6 109.9 111.7 100.0 109.7 113.9 107.7 92.4 103.1 108.6Denmark 84.9 82.0 72.5 74.4 83.9 100.0 99.7 96.6 77.1 74.6 90.1 101.2Germany : 91.6 95.8 90.7 94.3 100.0 110.9 116.1 105.9 96.5 114.7 126.1Greece : : : : 96.1 100.0 95.2 95.5 94.9 96.6 95.1 96.5Spain 102.1 100.6 87.3 90.0 100.4 100.0 112.3 113.5 110.9 107.7 120.0 123.2France 87.8 77.3 83.8 83.4 94.4 100.0 100.2 103.5 108.0 105.7 105.9 106.6Ireland 77.1 77.4 86.1 87.6 89.0 100.0 100.6 97.8 93.9 86.6 91.2 98.3Italy 78.1 83.6 83.0 85.3 91.1 100.0 105.7 108.3 108.5 118.1 113.5 113.7Luxembourg 94.4 87.8 88.2 91.1 87.1 100.0 103.6 95.7 104.5 94.5 96.2 95.6Netherlands 115.2 112.0 103.4 86.1 96.7 100.0 97.0 104.8 94.1 83.0 80.2 82.1Austria 94.4 92.7 85.9 75.6 89.0 100.0 89.7 83.1 82.6 79.3 81.4 90.2Portugal 94.6 93.8 70.1 67.9 91.1 100.0 109.7 104.6 103.1 117.9 106.8 119.4Finland 99.8 91.6 81.0 81.5 87.6 100.0 82.7 82.1 74.0 81.3 103.7 108.7Sweden 105.7 89.2 79.9 85.2 84.5 100.0 92.1 98.1 107.8 97.9 107.5 112.9United Kingdom 67.5 66.4 72.4 85.4 90.6 100.0 93.6 72.6 62.3 61.1 55.4 57.3
Source: Eurostat (Economic Accounts for Agriculture).

Chapter I The agricultural economy in the EU
European agriculture entering the 21st century 25
4.10. Farm profitability: ratio of gross farm income to total assets, 1991and 1999 (%)
0
10
20
30
B DK D EL E F IRL I L NL A P FIN S UK EU15
%
1991 1999
Source: Farm Accountancy Data Network.
4.11. Fixed assets as percentage of total assets in 1991 and 1999 (%)
0
20
40
60
80
100
B DK D EL E F IRL I L NL A P FIN S UK EU15
%
1991 1999
Source: Farm Accountancy Data Network.
Austria, Finland, Sweden: 1995 and 1999

Chapter I The agricultural economy in the EU
European agriculture entering the 21st century 26
5. EU and World trade
5.1. Total Agricultural World trade and EU market share (billion EUR)
0
50
100
150
200
250
300
1991 1992 1993 1994 1995 1996 1997 1998 1999 2000
0.0
5.0
10.0
15.0
20.0
25.0
%
Rest of world export EU export % EU market share
Source: Comtrade.
5.2. EU trade in raw and processed products (billion EUR)
-5.7
-8.7
-6.3 -6.3
-5.1
-7.5-6.7
-2.2
-6.4-7.2
-60
-50
-40
-30
-20
-10
0
10
20
30
40
1991 1992 1993 1994 1995 1996 1997 1998 1999 2000
-12.0
-10.0
-8.0
-6.0
-4.0
-2.0
0.0
2.0
4.0
6.0
8.0al
l agr
icul
ture
: bal
ance
raw products processed products all agriculture: balance
export
import
Source: Eurostat (Comext2).
Processed products: wine, vermouth, alcoholic drinks, food preparation, soft drinks and fruit juices,cigarettes and tobacco products.Raw products: all other agricultural products.

Chapter I The agricultural economy in the EU
European agriculture entering the 21st century 27
5.3. EU and Rest of world export
5.3.1. Cereals: Total world trade and EU market share (million EUR)
0
5
10
15
20
25
30
35
1991 1992 1993 1994 1995 1996 1997 1998 1999 2000
0
2
4
6
8
10
12
14
16
%
Rest of world export EU export % EU market share
Source: Comtrade.
5.3.2. Oilseeds: Total world trade and EU market share (million EUR)
0
5 000
10 000
15 000
20 000
25 000
30 000
35 000
1991 1992 1993 1994 1995 1996 1997 1998 1999 2000
0
1
2
3
4
5
6
7
8
9
%
Rest of world export EU export % EU market share
Source: Comtrade.
Cereals includes cereal flour; Oilseeds includes meals and oil.

Chapter I The agricultural economy in the EU
European agriculture entering the 21st century 28
5.3.3. Livestock and meat: Total world trade and EU market share (million EUR)
0
5 000
10 000
15 000
20 000
25 000
30 000
35 000
40 000
1991 1992 1993 1994 1995 1996 1997 1998 1999 2000
0
2
4
6
8
10
12
14
16
18
20
%
Rest of world export EU export % EU market share
Source: Comtrade.
5.3.4. Dairy products: Total world trade and EU market share (million EUR)
0
2 000
4 000
6 000
8 000
10 000
12 000
14 000
16 000
1991 1992 1993 1994 1995 1996 1997 1998 1999 2000
0
5
10
15
20
25
30
35
40
45
50
%
Rest of world export EU export % EU market share
Source: Comtrade.
Livestock and meat exclude fish; Dairy products include milk and cream, butter,cheese, eggs, casein, albumins.

Chapter I The agricultural economy in the EU
European agriculture entering the 21st century 29
5.3.5. Fruit and vegetables: Total world trade and EU market share(million EUR)
0
5 000
10 000
15 000
20 000
25 000
30 000
35 000
1991 1992 1993 1994 1995 1996 1997 1998 1999 2000
0
2
4
6
8
10
12
14
16
%
Rest of world export EU export % EU market share
Source: Comtrade.
5.3.6. Wine, vermouth, alcoholic drinks: Total world trade and EU market share(million EUR)
0
4 000
8 000
12 000
16 000
20 000
1991 1992 1993 1994 1995 1996 1997 1998 1999 2000
0
10
20
30
40
50
60
70
%
Rest of world export EU export % EU market share
Source: Comtrade.
Fruit and vegetables include frozen vegetable, dried fruit, prepared vegetables.

Chapter I The agricultural economy in the EU
European agriculture entering the 21st century 30
5.3.7. Food preparation: Total world trade and EU market share (million EUR)
0
5 000
10 000
15 000
20 000
25 000
30 000
35 000
1991 1992 1993 1994 1995 1996 1997 1998 1999 2000
0
5
10
15
20
25
30
35
40
%
Rest of world export EU export % EU market share
Source: Comtrade.
5.3.8. Other processed products: Total world trade and EU market share(million EUR)
0
3 000
6 000
9 000
12 000
15 000
18 000
1991 1992 1993 1994 1995 1996 1997 1998 1999 2000
0
5
10
15
20
25
%
Rest of world export EU export % EU market share
Source: Comtrade.
Food preparation includes sugar confectionery, chocolate, jam, soups, condiments,ice cream; Other processed products include cigarettes, tobacco products, fruitjuices, soft drinks, confidential trade.

Chapter I The agricultural economy in the EU
European agriculture entering the 21st century 31
5.4. Total trade in agricultural products per Member State
5.4.1. Total export of agricultural products (million EUR) and intra-trade (%)
EXPORT
1991 1992 1993 1994 1995 1996 1997 1998 1999 2000 2001
BLEU 17 489 18 358 21 142 22 577 25 373 26 505 27 562 29 921 31 425 33 926 35 295
85.0% 84.4% 85.9% 82.3% 83.7% 85.1% 83.0% 85.6% 87.7% 85.7% 86.5%
Denmark 8 303 8 504 8 384 9 083 10 626 10 522 11 743 10 908 10 954 11 933 13 055
59.1% 58.8% 57.2% 55.1% 62.4% 63.5% 62.7% 62.8% 62.2% 60.7% 62.2%
Germany 24 749 25 940 24 432 26 099 29 841 31 873 32 525 35 884 36 592 41 197 40 913
67.4% 67.1% 64.2% 63.0% 68.3% 68.7% 68.4% 70.5% 72.0% 71.7% 70.9%
Greece 3 006 3 501 2 640 2 805 3 456 3 565 3 072 3 177 3 631 2 666 2 451
67.5% 67.9% 58.8% 56.7% 64.8% 60.0% 55.1% 58.9% 61.1% 49.5% 55.6%
Spain 10 558 10 628 11 370 13 564 15 692 18 489 20 728 22 725 20 364 24 899 25 303
68.5% 67.1% 66.9% 68.8% 71.6% 74.1% 76.5% 77.5% 76.4% 77.1% 76.8%
France 39 373 41 161 41 569 43 424 46 776 47 388 50 059 50 419 51 045 52 113 51 508
72.4% 71.6% 70.6% 71.3% 72.5% 71.2% 71.2% 71.4% 71.0% 69.8% 70.4%
Ireland 7 123 8 621 8 665 9 464 10 426 9 379 9 595 10 285 11 514 12 245 12 845
76.8% 76.9% 75.0% 74.2% 74.6% 72.8% 71.4% 71.8% 71.4% 70.8% 70.9%
Italy 13 243 13 124 13 428 14 721 16 728 18 383 18 917 19 994 21 331 21 889 22 931
67.2% 64.3% 64.5% 64.7% 67.7% 66.9% 66.0% 66.8% 68.3% 65.5% 64.4%
Netherlands 40 187 42 222 39 396 47 474 48 522 54 058 53 009 55 901 57 226 60 866 59 243
79.0% 78.7% 75.6% 77.8% 78.4% 80.4% 78.3% 79.3% 79.6% 78.1% 77.6%
Austria __ __ __ __ 2 382 2 785 3 377 3 939 4 754 5 488 6 095
60.8% 63.6% 65.0% 68.8% 71.6% 73.9% 70.4%
Portugal 1 082 1 121 1 071 1 230 1 442 1 620 1 833 1 928 2 012 2 252 2 367
64.0% 62.4% 67.2% 66.6% 67.2% 66.5% 68.2% 70.5% 72.9% 72.2% 71.9%
Finland __ __ __ __ 727 800 917 903 790 954 940
36.8% 32.5% 33.9% 37.4% 41.1% 41.3% 37.3%
Sweden __ __ __ __ 1 311 1 662 1 957 1 823 1 928 2 057 2 228
53.1% 54.6% 53.0% 52.7% 53.3% 49.8% 49.1%
United Kingdom 13 214 14 165 12 653 14 981 16 001 16 301 18 633 18 554 18 198 19 149 17 716
59.3% 59.7% 55.1% 61.6% 65.1% 62.6% 56.8% 60.1% 59.6% 58.2% 57.2%
Source: Eurostat (Comext2).

Chapter I The agricultural economy in the EU
European agriculture entering the 21st century 32
5.4.2. Total import of agricultural products (million EUR) and intra-trade (%)
IMPORT
1991 1992 1993 1994 1995 1996 1997 1998 1999 2000 2001
BLEU 17 175 17 865 17 759 19 029 21 282 20 997 22 743 23 959 25 659 26992.3 28322.9
78.1% 79.2% 79.0% 75.0% 74.9% 72.9% 74.1% 74.6% 77.6% 76.6% 78.5%
Denmark 3 219 3 224 3 588 3 912 4 222 4 502 5 495 5 582 6 314 6 490 6 550
65.4% 66.1% 67.5% 66.5% 73.0% 73.0% 72.4% 72.9% 75.6% 73.9% 74.4%
Germany 36 595 40 119 46 269 49 009 42 175 47 548 52 437 54 664 53 563 56 737 56 637
68.4% 69.6% 67.9% 67.7% 70.6% 72.2% 69.0% 71.2% 72.5% 71.8% 70.4%
Greece 3 598 3 680 3 821 4 384 4 440 4 840 5 341 5 293 5 552 6 117 6 187
77.8% 80.6% 83.3% 83.6% 84.2% 80.5% 80.1% 83.1% 84.3% 81.9% 81.3%
Spain 5 280 6 083 7 653 8 320 8 927 10 629 12 449 12 116 12 652 15 118 14 169
51.8% 53.3% 55.5% 57.2% 59.5% 58.9% 59.1% 63.5% 62.1% 65.0% 64.0%
France 25 132 25 704 27 775 28 778 28 728 32 250 33 162 34 552 35 276 37 250 38 186
72.3% 73.7% 74.2% 73.9% 75.0% 75.6% 75.2% 76.9% 78.6% 78.3% 77.7%
Ireland 3 004 2 998 3 351 3 541 3 188 3 753 3 883 4 251 5 178 5 186 5 772
80.9% 81.8% 78.7% 80.1% 82.1% 80.3% 82.5% 85.3% 85.2% 82.7% 82.2%
Italy 26 941 26 154 28 860 28 041 25 482 26 781 27 260 29 051 30 714 31 257 31 855
71.6% 73.4% 71.8% 68.9% 69.1% 70.6% 70.1% 71.2% 73.5% 70.8% 69.6%
Netherlands 18 461 17 535 18 123 20 057 17 207 20 765 21 065 22 637 23 701 23 861 23 422
62.6% 63.0% 60.7% 59.7% 59.4% 59.6% 61.4% 59.4% 56.3% 56.1% 53.3%
Austria __ __ __ __ 5 278 5 933 6 779 7 049 7 406
79.2% 80.7% 82.5% 81.9% 81.9% 80.6% 79.6%
Portugal 1 909 2 046 3 033 3 449 3 315 3 832 4 068 4 641 4 881 5 665 5 909
60.2% 64.9% 63.4% 62.7% 63.2% 64.1% 66.3% 70.4% 72.5% 72.3% 72.0%
Finland __ __ __ __ 2 177 2 699 3 030 3 167 3 215
73.7% 74.5% 73.5% 76.1% 77.8% 79.2% 80.4%
Sweden __ __ __ __ 4 318 5 256 5 665 5 940 6 348
69.5% 72.8% 72.1% 74.3% 76.3% 76.5% 78.0%
United Kingdom 23 671 24 075 24 336 25 633 23 577 25 903 26 317 29 317 34 584 35 083 36 715
65.8% 67.1% 64.7% 64.4% 65.0% 64.4% 66.2% 66.2% 67.0% 66.7% 65.7%
Source: Eurostat (Comext2).

Chapter I The agricultural economy in the EU
European agriculture entering the 21st century 33
5.5. Intra-EU trade: all agriculture
5.5.1. Intra-EU export per Member State - 2001
Source: Eurostat (Comext2)
5.5.2. Intra-EU import per Member State - 2001
Source: Eurostat (Comext2)
9%
6%
8%
14%
18%
20%
12%
F
BLEU
NLD
I
UK
E
IRL
DK
A
EL
P
FINS
15%
10%
8%
20%12%
14%
F
BLEU
NL
DI
UK
E
IRL
DK
A
EL
P
S
FIN

Chapter I The agricultural economy in the EU
European agriculture entering the 21st century 34
5.6. Intra-EU import per products (million EUR) 1991-2001
0
30 000
60 000
90 000
120 000
150 000
180 000
1991 1992 1993 1994 1995 1996 1997 1998 1999 2000 2001
cereals oilseeds livestock
dairy fruit and vegetables olive oil, etc.
wine, vermouth, alcohl.drinks food preparation other
Source: Eurostat (Comext2).
5.7. Major products exported and imported intra-EU in 2001 by MemberState (million EUR, descending order)
MS million EUR major productsvariation in % from 1991 to
2001MS million EUR major products
variation in % from 1991 to
2001Spain 5 704 Fruits and vegetables 104% Germany 6 199 Fruits and vegetables 6%Germany 4 245 Food preparation 107% Italy 3 975 Livestock -8%Netherlands 4 177 Other crops 20% France 3 851 Food preparation 72%France 3 851 Livestock 18% United Kingdom 3 737 Livestock 53%Belgium 3 571 Food preparation : Belgium 2 130 Dairy :Italy 2 878 Fruits and vegetables 23% Spain 1 464 Food preparation 137%Denmark 2 816 Livestock 49% Netherlands 1 408 Dairy -15%United Kingdom 2 242 Food preparation 87% Ireland 876 Food preparation 80%Ireland 1 766 Other crops 678% Sweden 852 Food preparation 61%Austria 631 Soft drinks 335% Denmark 752 Food preparation 144%Greece 442 Fruits and vegetables -11% Portugal 655 Food preparation 203%Sweden 366 Food preparation 45% Austria 625 Other crops 68%Portugal 355 Wine, vermouth 35% Greece 616 Livestock 24%Luxembourg 158 Cigarettes, tobacco : Finland 435 Food preparation 62%Finland 125 Dairy 45% Luxembourg 170 Food preparation :
Export Import
Source: Eurostat (Comext2).
Variation in % from 1995 to 2001 for Austria, Finland and Sweden.

Chapter II Agricultural markets in the EU
European agriculture entering the 21st century 35
AGRICULTURAL MARKETS
IN THE EUROPEAN UNION

Chapter II Agricultural markets in the EU
European agriculture entering the 21st century 36
Chapter II Agricultural markets in the EU
1. Balance sheet cereals1.1. Common Wheat – Balance sheet 1999/2000 (thousand t)
Totalof which: Human
ConsumptionAnimal feed
EU-15 88 971 2 919 19 831 75 222 32 224 35 644 118Belgium 1 528 3 464 2 695 2 781 930 1 373 55Denmark 4 471 528 1 289 4 091 448 3 380 109Germany 19 258 1 618 7 684 13 593 5 448 6 547 142Greece 621 813 191 1 243 1 183 10 50Spain 4 567 3 178 589 7 180 3 365 3 488 64France 35 463 638 20 324 17 637 5 449 10 351 201Ireland 597 716 173 1 142 282 810 52Italy 3 240 5 132 1 347 7 026 6 038 690 46Luxembourg 46 31 29 49 27 20 94Netherlands 851 3 103 1 141 2 791 885 958 30Austria 1 318 140 489 959 492 386 137Portugal 238 1 450 109 1 547 989 482 15Finland 254 256 25 524 311 77 48Sweden 1 659 88 119 1 644 567 827 101United Kingdom 14 860 1 380 3 243 13 015 5 810 6 245 114
Usable production
Self-sufficiency level (%)
Import Export
Domestic use
Source: Eurostat.
1.1.1. Development of European balance sheet – Common Wheat
83.3
83.2
7.7
9.8
0
10
20
30
40
50
60
70
80
90
100
1991 1992 1993 1994 1995 1996 1997 1998 1999 2000 2001
Usable production Total domestic use Import Export
(mio T)
Source: Eurostat; DG AGRI.
Self-sufficiency level is the ratio between usable production and domestic use.
EU-12 EU-15

Chapter II Agricultural markets in the EU
European agriculture entering the 21st century 37
1.2. Durum Wheat – Balance sheet 1999/2000 (thousand t)
Totalof which: Human
Consumption
Animal feed
EU-15 8 469 1 272 1 335 8 435 7 054 582 100Belgium 0 413 269 169 169 0 0Denmark 0 0 0 0 0 0 : Germany 65 757 100 721 696 9 9Greece 1 400 105 194 1 311 1 141 60 107Spain 726 393 338 831 365 259 87France 1 539 515 968 1 074 892 108 143Ireland 0 100 7 93 93 0 0Italy 4 520 1 435 2 298 3 607 3 217 50 125Luxembourg 0 34 33 2 2 0 0Netherlands 0 70 20 50 50 0 0Austria 98 64 89 79 70 5 124Portugal 115 170 26 271 132 91 42Finland 0 25 1 24 24 0 0Sweden 0 60 1 59 59 0 0United Kingdom 6 194 55 145 145 0 4
Usable production
Self-sufficiency level (%)
Domestic use
Import Export
Source: Eurostat.
1.2.1. Development of European balance sheet – Durum Wheat
8.0
8.8
1.7
0.30
2
4
6
8
10
12
1991 1992 1993 1994 1995 1996 1997 1998 1999 2000 2001
(mio T)
Usable production Total domestic use Import Export
Source: Eurostat; DG AGRI.
EU-12 EU-15

Chapter II Agricultural markets in the EU
European agriculture entering the 21st century 38
1.3. Total coarse grains - Balance sheet 1999/2000 (thousand t)
Totalof which: Human
ConsumptionAnimal feed
EU-15 103 150 3 399 19 709 94 226 5 348 73 663 109Belgium 600 2 660 1 801 1 600 10 1 227 38Denmark 4 304 299 894 3 799 131 3 058 113Germany 24 551 3 367 10 622 19 711 1 860 13 788 125Greece 2 267 943 30 3 130 42 2 990 72Spain 12 033 4 158 1 101 16 923 78 14 455 71France 27 652 855 17 576 12 811 274 11 040 216Ireland 1 510 340 193 1 628 76 1 190 93Italy 11 896 1 976 767 13 257 623 12 243 90Luxembourg 108 28 32 112 9 100 96Netherlands 516 3 476 1 452 2 571 168 1 689 20Austria 3 398 551 676 3 285 243 2 203 103Portugal 1 170 1 570 41 2 711 179 1 958 43Finland 2 616 262 468 2 535 148 1 826 103Sweden 3 272 144 1 165 2 718 155 2 110 120United Kingdom 7 257 3 454 3 574 7 435 1 353 3 786 98
Usable production
Domestic useSelf-
sufficiency level (%)
ExportImport
Source: Eurostat; DG AGRI calculation.
1.3.1. Development of European balance sheet – Total coarse grains
107.2
97.5
3.7
9.8
0
20
40
60
80
100
120
1991 1992 1993 1994 1995 1996 1997 1998 1999 2000 2001
(mio T)
Usable production Total domestic use Import Export
Source: Eurostat; DG AGRI calculation.
EU-12 EU-15

Chapter II Agricultural markets in the EU
European agriculture entering the 21st century 39
1.4. Barley – Balance sheet 1999/2000 (thousand t)
Totalof which: Human
Consumption
Animal feed
EU-15 48 771 301 14 336 40 246 103 30 360 121Belgium 388 1 291 1 013 768 1 443 51Denmark 3 675 125 761 3 125 0 2 561 118Germany 13 179 978 6 382 9 814 24 6 800 134Greece 320 227 0 547 0 495 59Spain 7 460 261 495 8 594 0 7 338 87France 9 539 190 7 093 3 718 22 3 166 257Ireland 1 278 42 106 1 186 0 863 108Italy 1 315 731 9 2 047 8 1 717 64Luxembourg 68 11 21 64 0 61 106Netherlands 365 979 395 950 10 754 38Austria 1 153 80 507 738 3 488 156Portugal 29 227 8 268 6 115 11Finland 1 568 95 235 1 522 9 1 083 103Sweden 1 853 59 745 1 580 8 1 313 117United Kingdom 6 581 1 573 3 134 5 325 12 3 163 124
Usable production
Self-sufficiency level (%)
Import Export
Domestic use
Source: Eurostat.
1.4.1. Development of European balance sheet – Barley
48.3
41.6
1.0
6.7
0
10
20
30
40
50
60
1991 1992 1993 1994 1995 1996 1997 1998 1999 2000 2001
(mio T)
Usable production Total domestic use Import Export
Source: Eurostat; DG AGRI.
EU-12 EU-15
Chapter II Agricultural markets in the EU
European agriculture entering the 21st century 40
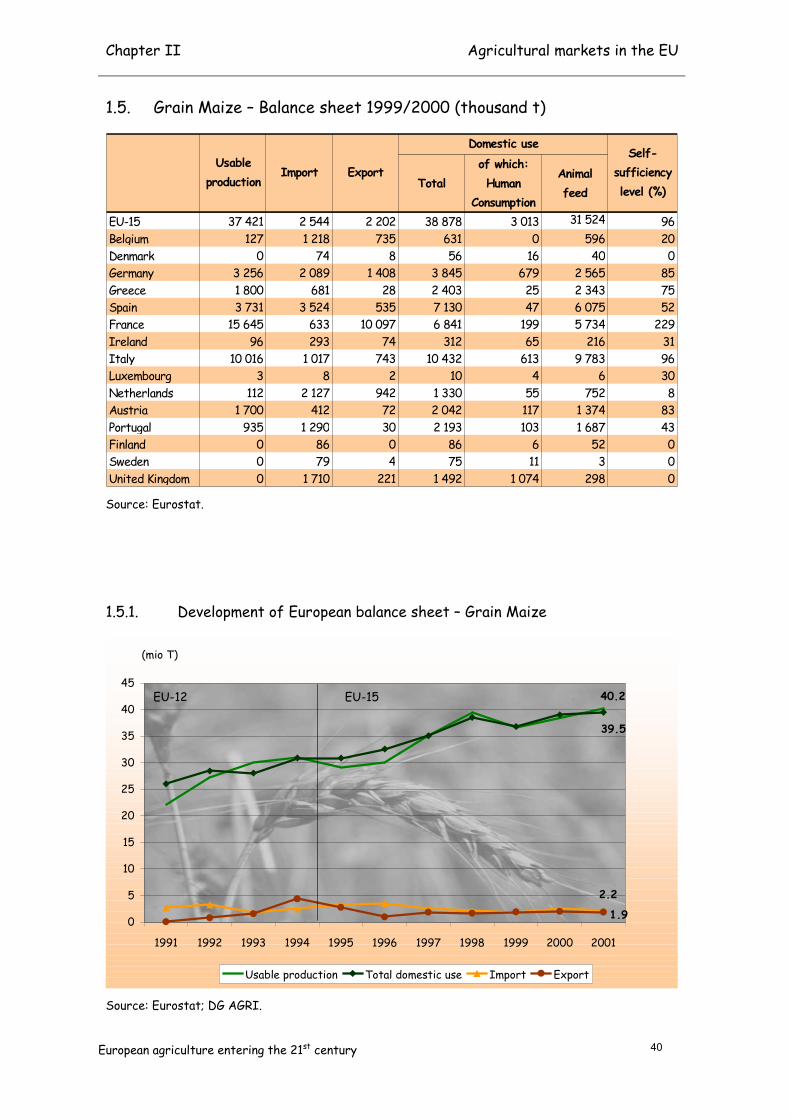
1.5. Grain Maize – Balance sheet 1999/2000 (thousand t)
Totalof which: Human
Consumption
Animal feed
EU-15 37 421 2 544 2 202 38 878 3 013 31 524 96Belgium 127 1 218 735 631 0 596 20Denmark 0 74 8 56 16 40 0Germany 3 256 2 089 1 408 3 845 679 2 565 85Greece 1 800 681 28 2 403 25 2 343 75Spain 3 731 3 524 535 7 130 47 6 075 52France 15 645 633 10 097 6 841 199 5 734 229Ireland 96 293 74 312 65 216 31Italy 10 016 1 017 743 10 432 613 9 783 96Luxembourg 3 8 2 10 4 6 30Netherlands 112 2 127 942 1 330 55 752 8Austria 1 700 412 72 2 042 117 1 374 83Portugal 935 1 290 30 2 193 103 1 687 43Finland 0 86 0 86 6 52 0Sweden 0 79 4 75 11 3 0United Kingdom 0 1 710 221 1 492 1 074 298 0
Usable production
Self-sufficiency level (%)
Import Export
Domestic use
Source: Eurostat.
1.5.1. Development of European balance sheet – Grain Maize
40.2
39.5
2.2
1.90
5
10
15
20
25
30
35
40
45
1991 1992 1993 1994 1995 1996 1997 1998 1999 2000 2001
(mio T)
Usable production Total domestic use Import Export
Source: Eurostat; DG AGRI.
EU-12 EU-15

Chapter II Agricultural markets in the EU
European agriculture entering the 21st century 41
1.6. Rye – Balance sheet 1999/2000 (thousand t)
Totalof which: Human
Consumption
Animal feed
EU-15 5 475 6 2 396 3 483 1 591 1 549 157Belgium 4 18 11 11 9 2 36Denmark 248 52 117 166 83 66 149Germany 4 291 47 2 499 2 240 948 1 038 192Greece 31 1 0 32 10 19 97Spain 218 4 11 217 22 175 100France 186 1 31 165 29 131 113Ireland 0 3 1 2 2 0 :Italy 12 16 5 23 2 20 52Luxembourg 4 1 1 4 2 2 100Netherlands 14 87 7 94 68 23 15Austria 225 39 80 177 111 53 127Portugal 56 12 0 60 52 1 93Finland 24 80 3 103 95 3 23Sweden 117 3 10 124 106 4 94United Kingdom 45 24 2 65 52 12 69
Usable production
Self-sufficiency level (%)
Import Export
Domestic use
Source: Eurostat.
1.6.1. Development of European balance sheet – Rye
6.2
4.0
0.70
1
2
3
4
5
6
7
1991 1992 1993 1994 1995 1996 1997 1998 1999 2000 2001
(mioT)
Usable production Total domestic use Export
Source: Eurostat; DG AGRI.
EU-12 EU-15

Chapter II Agricultural markets in the EU
European agriculture entering the 21st century 42
2. Balance Sheet rice
2.1. Rice - Balance sheet 2000 (thousand t: milled equivalent)
EU-15 398 281 1 436 714 658 1 805 543 214BLEU 0 0 3 3 40 142 102Denmark 0 0 1 0 28 27 1Germany 0 0 17 14 169 214 49Greece 20 000 93 73 62 63 9 50Spain 115 200 455 207 238 282 49 191France 18 779 65 33 45 281 300 73Ireland 0 0 0 0 6 6 0Italy 220 348 734 301 253 322 41 502Netherlands 0 0 16 16 68 137 69Austria 0 0 6 0 28 22 0Portugal 23 954 88 28 15 171 72 2Finland 0 0 4 2 21 19 0Sweden 0 0 4 4 38 39 1United Kingdom 0 0 20 42 240 291 30
Area Ha
ExportUsable
production Beginning stocks
Ending stocks
Internal use Import
Source: estimation DG AGRI + Member States.
2.1.1. Development of European balance sheet – Rice (thousand t: milledequivalent)
1491
554
215
1844
0
500
1 000
1 500
2 000
2 500
1991 1992 1993 1994 1995 1996 1997 1998 1999 2000 2001
Production Import Export Consumption
Source: estimation DG AGRI + Member States.
Chapter II Agricultural markets in the EU
European agriculture entering the 21st century 43
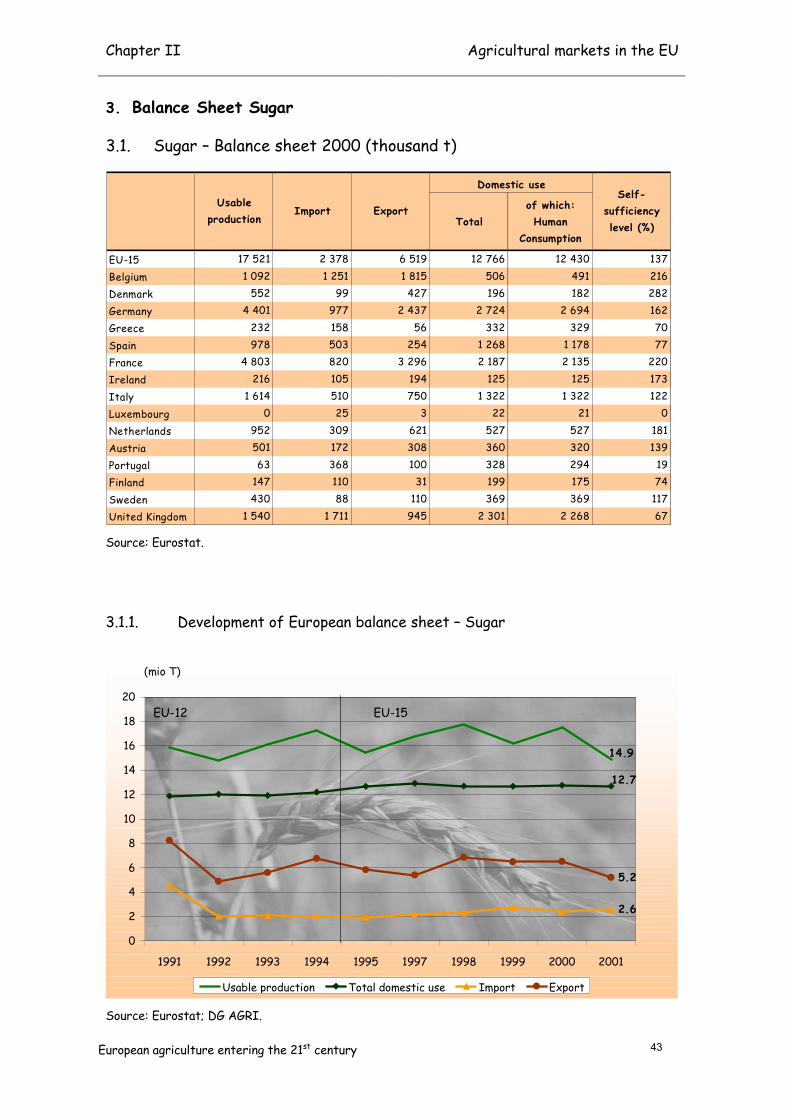
3. Balance Sheet Sugar
3.1. Sugar – Balance sheet 2000 (thousand t)
Totalof which: Human
Consumption
EU-15 17 521 2 378 6 519 12 766 12 430 137Belgium 1 092 1 251 1 815 506 491 216Denmark 552 99 427 196 182 282Germany 4 401 977 2 437 2 724 2 694 162Greece 232 158 56 332 329 70Spain 978 503 254 1 268 1 178 77France 4 803 820 3 296 2 187 2 135 220Ireland 216 105 194 125 125 173Italy 1 614 510 750 1 322 1 322 122Luxembourg 0 25 3 22 21 0Netherlands 952 309 621 527 527 181Austria 501 172 308 360 320 139Portugal 63 368 100 328 294 19Finland 147 110 31 199 175 74Sweden 430 88 110 369 369 117United Kingdom 1 540 1 711 945 2 301 2 268 67
Usable production
Import ExportSelf-
sufficiency level (%)
Domestic use
Source: Eurostat.
3.1.1. Development of European balance sheet – Sugar
14.9
12.7
2.6
5.2
0
2
4
6
8
10
12
14
16
18
20
1991 1992 1993 1994 1995 1997 1998 1999 2000 2001
(mio T)
Usable production Total domestic use Import Export
Source: Eurostat; DG AGRI.
EU-12 EU-15

Chapter II Agricultural markets in the EU
European agriculture entering the 21st century 44
4. Oilseeds production (Oilseeds for food and non-food purposes)
4.1. Oilseeds area and production 2001: sunflower, rape seed, soya(thousand ha/t)
Area of production (1000 ha)
Harvested production
Area of production (1000 ha)
Harvested production
Area of production (1000 ha)
Harvested production
Area of production (1000 ha)
Harvested production
EU-15 5 254 13 147 2 993 8 872 1 878 3 024 382 1 250BLEU 8 26 8 26 0 0 0 0Denmark 81 220 81 220 0 0 0 0Germany 1 163 4 215 1 138 4 160 25 54 0 1Greece 19 24 0 0 17 19 2 5Spain 885 911 25 36 858 870 2 5France 1 910 4 765 1 083 2 873 706 1 581 121 311Ireland 2 7 2 7 0 0 0 0Italy 480 1 354 31 34 209 425 240 895Netherlands 1 2 1 2 0 0 0 0Austria 93 231 56 147 20 51 16 34Portugal 43 24 0 0 43 24 0 0Finland 74 102 74 102 0 0 0 0Sweden 45 106 45 106 0 0 0 0United Kingdom 451 1 159 451 1 159 0 0 0 0
Total Soya beanTotal
Total Rape seed Total Sunflower seedof which:
Source: DG AGRI.
4.1.1. Development of European area and production for soya, sunflower andrape seed (food and non-food purposes)
1.2
3.1
8.9
0
2
4
6
8
10
12
1991 1992 1993 1994 1995 1996 1997 1998 1999 2000 2001
(mio T)
0
1 000
2 000
3 000
4 000
5 000
6 000
7 000
8 000(1000 Ha)
Total Area Soya bean Sunflower seed Rape seed
Source: Eurostat, DG AGRI.
EU-12 EU-15

Chapter II Agricultural markets in the EU
European agriculture entering the 21st century 45
5. Protein crops production
5.1. Protein crops - Production 2001/2002 (thousand t)
E U -15 1 2 0 1 3 8 9 7B L E U 2 9D e n m a rk 3 3 12 0G e r m a n y 18 5 6 4 1G r e e c e 1 3 3 1S p a in 6 3 6 1F r a n c e 4 7 2 1 8 5 2I r e la n d 2 10I t a ly 6 4 13 9N e th e r la n d s 4 16A u s t r ia 4 1 12 0P o r tu g a l 1 2 6F in la n d 5 12S w e d e n 3 0 8 6U n it e d K in g d o m 2 7 5 7 9 5
A re a (1 0 0 0 h a )
U s a b le p ro d u c t io n
Source: estimation DG AGRI.
5.1.1. Development of area and production – Protein crops
3 897 tonnes
1 201 Ha
2 000
3 000
4 000
5 000
6 000
1995 1996 1997 1998 1999 2000 2001
0
200
400
600
800
1 000
1 200
1 400
1 600
production area
thousand T '000 Ha
Source: estimation DG AGRI.
Protein crops include peas, field beans, sweet lupins.

Chapter II Agricultural markets in the EU
European agriculture entering the 21st century 46
6. Tomato and apple production
6.1. Tomato – Production 2001 (thousand t)
Area (ha) Production Export
EU -15 : 14 768 282BLEU 652 223 180Denmark 53 21 4Germany 330 50 21Greece 37 500 1 850 4Spain 61 500 3 730 1 010France 7 090 845 93Ireland : 7 :Italy 123 234 6 334 130Netherlands 1 180 550 596Austria 156 27 4Portugal 13 847 971 2Finland 121 34 :Sweden 45 18 :United Kingdom 254 108 5
Source: Eurostat (Comext2); DG AGRI.
6.1.1. Development of European production – Tomato (thousand t)
0
4 000
8 000
12 000
16 000
20 000
1993 1994 1995 1996 1997 1998 1999 2000 2001
Production/Consumption
0
50
100
150
200
250
300
350
Import/Export
Production Consumption Export Import
Source: Eurostat (Comext2); DG AGRI.
EU-12 EU-15

Chapter II Agricultural markets in the EU
European agriculture entering the 21st century 47
6.2. Apple – Production 2001 (thousand t)
Area (Ha) Production Export*
EU-15 292 467 8 730 495Belgium 8 843 386 333Denmark 1 679 20 2Germany 36 124 922 123Greece 14 900 223 2Spain 42 407 962 87France 56 885 2 364 784Ireland 12 135 13 2Italy 67 027 2 305 533Luxembourg 0 4 0Netherlands 11 718 390 288Austria 6 057 409 44Portugal 21 276 306 14Finland 531 3 0Sweden 1 418 20 2United Kingdom 11 467 403 34
Source: Eurostat (Comext); DG AGRI.(the Area is provisional for certain countries)
6.2.1. Development of European production – Apple (thousand t)
495
723
8 730
0
2 000
4 000
6 000
8 000
10 000
12 000
1991 1992 1993 1994 1995 1996 1997 1998 1999 2000 2001
1000 tons
Export Import Production
Source: Eurostat; DG AGRI.
EU-12 EU-15
* Only for EU = Export for third countries.

Chapter II Agricultural markets in the EU
European agriculture entering the 21st century 48
7. Tobacco production
7.1. Raw Tobacco Production 2000
Area of production
(ha)
Harvest Production
(t)EU-15 126 256 338 658Belgium 400 1 166Germany 4 546 11 156Greece 56 920 121 700Spain 14 078 43 000France 9 391 25 579Italy 38 788 129 936Portugal 2 133 6 121
Source: Eurostat, DG AGRI.
7.1.1. Development of European raw tobacco area
126
0
50
100
150
200
250
1991 1992 1993 1994 1995 1996 1997 1998 1999 2000 2001
1000 ha
Area
Source: Eurostat, DG AGRI.

Chapter II Agricultural markets in the EU
European agriculture entering the 21st century 49
8. Cotton production
8.1. Cotton - Production 2000/2001 (thousand t)
EU-15 493 935 1 527 761 232Greece 405 000 1 235 1 203Spain 88 935 292 34 15
AreaExtra EU Export
Usable production
Extra EU Import
Source: DG AGRI.
8.1.1. Development of European production – Cotton (thousand t)
1476
761
232
0
500
1 000
1 500
2 000
1992 1993 1994 1995 1996 1997 1998 1999 2000 2001
production extra EU import extra EU export
Source: DG AGRI.

Chapter II Agricultural markets in the EU
European agriculture entering the 21st century 50
9. Balance Sheet olive oil and table wine
9.1. Olive oil - Balance sheet 2001/2002 (thousand t)
Total extra EU Total extra EU
EU-15 2 420 751 60 998 309 1 872Greece 360 0 0 100 15 270Spain 1 412 10 2 595 105 598France 3 94 0 4 1 94Italy 610 484 58 273 170 735Portugal 34 44 0 21 17 62Other UE 0 119 0 6 1 113
ConsumptionProduction EU import EU export
Source: DG AGRI.(year 2001 is provisional)
9.1.1. Development of European balance sheet – Olive oil (thousand t)
658
2 336
1 020
1 858
0
500
1 000
1 500
2 000
2 500
1992 1993 1994 1995 1996 1997 1998 1999 2000 2001
Production total Import total Export Consumption
Source: DG AGRI.(year 2001 is provisional)

Chapter II Agricultural markets in the EU
European agriculture entering the 21st century 51
9.2. Table Wine - Balance sheet 2000/2001 (1 000 hl)
EU-15 100 474 58 602 66 044 86 981 63 230 16 870 23 160Belgium 2 129 136 430 421 560 125Denmark 0 114 116 354 354 471 115Germany 785 4 524 4 376 5 365 4 924 5 128 696Greece 3 266 1 194 1 040 2 837 2 537 47 630Spain 26 779 9 190 12 618 18 551 7 024 256 5 056France 24 739 15 551 17 586 18 486 15 864 4 174 7 592Ireland 0 22 23 0 0 0 0Italy 41 205 22 549 24 381 28 256 20 153 430 11 547Luxembourg 0 37 60 40 40 78 15Netherlands 0 88 84 1 104 1 092 1 184 84Austria 246 603 553 282 250 157 169Portugal 3 440 4 039 4 776 3 737 3 032 1 587 553Finland 0 14 16 61 61 64 1Sweden 0 140 78 511 511 454 5United Kingdom 12 408 201 2 368 2 368 2 280 131
Human consumption
Total Import
Total Export
Usable production
Beginning stocks
Ending stocks
Internal use
Source: DG AGRI.(year 2001 is provisional)
9.2.1. Development of European balance sheet – Table wine (1 000 hl)
100 474
63 230
0
20 000
40 000
60 000
80 000
100 000
120 000
1991 1992 1993 1994 1995 1996 1997 1998 1999 2000 2001
Intra EU export Extra EU export Production Human consumption
Source: DG AGRI.(year 2001 is provisional)
The marketing year 2000/01 covers the period between 01/08/2000 and31/07/2001.

Chapter II Agricultural markets in the EU
European agriculture entering the 21st century 52
10. Balance Sheets Meat
10.1. Total meat – Balance sheet 1999 (thousand t)
Usable production Imports* Exports*Human
Consumption Self-sufficiency
level (%)
EU-15 35 565 1 044 3 408 33 335 107Belgium/Luxembourg 1 639 312 1 036 921 178Denmark 2 003 164 1 617 590 339Germany 6 269 2 137 1 285 7 256 86Greece 486 405 10 881 55Spain 4 810 321 624 4 538 106France 6 290 1 183 1 938 5 627 112Ireland 1 107 74 825 367 302Italy 3 829 1 214 364 4 693 82Netherlands 2 994 569 2 242 1 291 232Austria 834 143 215 771 108Portugal 784 189 14 953 82Finland 339 33 30 342 99Sweden 570 107 59 618 92United Kingdom 3 611 1 340 558 4 487 80
Source: Eurostat; DG AGRI.
10.1.1. Development of European balance sheet - Total meat (EU-12 until 1994)
35.4
33.4
1.4
2.6
0
5
10
15
20
25
30
35
40
1991 1992 1993 1994 1995 1996 1997 1998 1999 2000 2001
(mio T)
Usable production Human consumption Imports Exports
Source: Eurostat; DG AGRI.
EU-12 EU-15
* Only for EU = Imports and Exports fromthird countries.
Total meat includes beef and veal, pigs, poultry,sheep and goats.

Chapter II Agricultural markets in the EU
European agriculture entering the 21st century 53
10.2. Beef and Veal – Balance sheet 1999 (thousand t)
Usable production Imports* Exports* Human Consumption
Self-sufficiency level (%)
EU-15 7 679 383 875 7 517 102Belgium/Luxembourg 273 43 110 205 133Denmark 157 82 115 138 114Germany 1 374 286 543 1 248 110Greece 67 138 3 202 33Spain 678 92 155 642 106France 1 609 339 378 1 631 99Ireland 641 9 601 64 1 002Italy 1 156 429 132 1 467 79Netherlands 508 192 405 296 172Austria 203 19 74 156 130Portugal 98 73 0 168 58Finland 91 12 5 98 93Sweden 146 46 7 184 79United Kingdom 678 268 10 1 018 67
Source: Eurostat.
10.2.1. Development of European balance sheet - Beef and Veal(EU–12 until 1994)
7.7
6.7
0.40.5
0
1
2
3
4
5
6
7
8
9
10
1991 1992 1993 1994 1995 1996 1997 1998 1999 2000 2001
(mio T)
Usable production Human consumption Imports Exports
Source: Eurostat; DG AGRI.
Self-sufficiency level is the ratio betweenusable production and human consumption.
* Only for EU = Imports and Exports fromthird countries.
EU-15EU-12

Chapter II Agricultural markets in the EU
European agriculture entering the 21st century 54
10.3. Pig – Balance sheet 1999 (thousand t)
Usable production Imports* Exports* Human Consumption
Self-sufficiency level (%)
EU-15 18 002 67 1 522 16 345 110Belgium/Luxembourg 993 97 624 475 209Denmark 1 642 55 1 374 349 470Germany 4 103 1 139 574 4 672 88Greece 140 202 2 339 41Spain 2 892 100 394 2 602 111France 2 353 503 637 2 222 106Ireland 251 34 128 155 162Italy 1 468 736 123 2 081 71Netherlands 1 711 125 1 142 654 262Austria 520 82 135 467 111Portugal 373 91 13 444 84Finland 182 17 23 178 103Sweden 327 48 49 326 100United Kingdom 1 047 580 248 1 381 76
Source: Eurostat.
10.3.1. Development of European balance sheet - Pig (EU–12 until 1994)
17.6
16.5
0.1
1.1
0
2
4
6
8
10
12
14
16
18
20
1991 1992 1993 1994 1995 1996 1997 1998 1999 2000 2001
(mio T)
Usable production Human consumption Imports Exports
Source: Eurostat; DG AGRI.
EU-12 EU-15
* Only for EU = Imports and Exports from third countries.

Chapter II Agricultural markets in the EU
European agriculture entering the 21st century 55
10.4. Poultry – Balance sheet 1999 (thousand t)
Usable production Imports* Exports* Human Consumption
Self-sufficiency level (%)
EU-15 8 755 342 1 008 8 090 108Belgium/Luxembourg 368 140 285 223 165Denmark 202 21 127 96 210Germany 748 655 160 1 243 60Greece 154 46 5 195 79Spain 1 002 116 56 1 062 94France 2 190 170 911 1 475 149Ireland 125 29 37 115 109Italy 1 132 26 106 1 052 108Netherlands 758 244 692 319 238Austria 105 40 6 139 75Portugal 288 14 1 305 94Finland 66 3 2 64 102Sweden 92 9 3 99 93United Kingdom 1 525 360 190 1 703 90
Source: Eurostat.
10.4.1. Development of European balance sheet - Poultry (EU–12 until 1994)
9.1
8.9
0.8
1.0
0
1
2
3
4
5
6
7
8
9
10
1991 1992 1993 1994 1995 1996 1997 1998 1999 2000 2001
(mioT)
Usable production Human consumption Imports Exports
Source: Eurostat; DG AGRI.
EU-12 EU-15
* Only for EU = Imports and Exports from third countries.

Chapter II Agricultural markets in the EU
European agriculture entering the 21st century 56
10.5. Sheep and goat - Balance sheet 1999 (thousand t)
Usable production Imports* Exports* Human Consumption
Self-sufficiency level (%)
EU-15 1 134 252 4 1 384 82Belgium/Luxembourg 4 31 17 18 22Denmark 2 6 1 7 29Germany 44 56 8 93 47Greece 126 20 0 145 87Spain 239 13 18 233 103France 139 172 11 299 47Ireland 90 2 59 33 273Italy 73 23 3 93 78Netherlands 17 8 3 22 77Austria 7 2 0 9 81Portugal 25 11 0 36 69Finland 1 1 0 2 50Sweden 5 4 0 9 55United Kingdom 362 133 110 385 94
Source: Eurostat.
10.5.1. Development of European balance sheet - Sheep and goat(EU–12 until 1994)
1.0
1.3
0.3
0.0
0.2
0.4
0.6
0.8
1.0
1.2
1.4
1.6
1991 1992 1993 1994 1995 1996 1997 1998 1999 2000 2001
(mioT)
Usable production Human consumption Imports
Source: Eurostat; DG AGRI.
EU-12 EU-15
* Only for EU = Imports and Exports from third countries.

Chapter II Agricultural markets in the EU
European agriculture entering the 21st century 57
11. Balance Sheet dairy products
11.1. Butter - Balance sheet 1999 (thousand t)
EU-15 1 886 26 117 1 875 101Belgium 117 107 117 101 116Denmark 93 20 39 76 122Germany 428 170 52 548 78Greece 2 6 0 8 28Spain 36 5 2 28 131France 451 133 77 507 89Ireland 146 5 127 16 913Italy 148 50 13 185 80Luxembourg 0 0 0 0 0Netherlands 163 29 83 107 153Austria 35 5 2 40 88Portugal 25 2 7 20 125Finland 52 0 9 43 121Sweden 48 0 7 43 112United Kingdom 141 44 21 153 92
Usable production
Self-sufficiency level (%)
Imports* Exports*Total domestic
use
Source: Eurostat.
11.1.1. Development of European balance sheet – Butter (thousand t)
1829
1765
1 000
1 400
1 800
2 200
2 600
1991 1992 1993 1994 1995 1996 1997 1998 1999 2000 2001
Production Consumption
Source: Eurostat; DG AGRI.
EU-12 EU-15
* Only for EU = Imports and Exports from third countries.

Chapter II Agricultural markets in the EU
European agriculture entering the 21st century 58
11.2. Cheese - Balance sheet 1999 (thousand t)
Total domestic use
Self sufficiency level (%)
EU-15 6 710 123 293 6 513 103Belgium 62 185 63 183 34Denmark 275 33 233 76 362Germany 1 594 475 424 1 658 96Greece 222 65 30 256 87Spain 283 106 31 358 79France 1 693 172 407 1 463 116Ireland 102 18 77 23 443Italy 1 069 282 155 1 200 89Luxembourg 0 0 0 0 0Netherlands 659 102 464 295 224Austria 116 57 32 141 82Portugal 80 17 3 93 86Finland 95 17 19 92 104Sweden 128 36 16 147 87United Kingdom 334 243 48 529 63
Usable production
Import* Export*
Source: Eurostat.
11.2.1. Development of European balance sheet – Cheese (thousand t)
7434
7142
0
1 000
2 000
3 000
4 000
5 000
6 000
7 000
8 000
1991 1992 1993 1994 1995 1996 1997 1998 1999 2000 2001
Production Consumption
Source: DG AGRI.
EU-12 EU-15
* Only for EU = Imports and Exportsfrom third countries.
Consumption includes cheese componentsof processed cheese.

Chapter II Agricultural markets in the EU
European agriculture entering the 21st century 59
11.3. Skimmed Milk Powder - Balance sheet 1999 (thousand t)
Totalof which: Human
Consumption
EU-15 1 116 79 709 1 065 531 105Belgium 93 43 95 38 22 247Denmark 39 6 22 23 0 170Germany 342 133 346 145 49 237Greece 0 0 0 0 0 0Spain 13 3 1 13 11 100France 261 64 84 253 47 103Ireland 84 7 83 13 1 646Italy 0 123 0 123 123 0Luxembourg 0 0 0 0 0 0Netherlands 85 230 68 248 91 34Austria 13 0 3 11 4 120Portugal 12 4 5 11 6 109Finland 28 0 0 28 23 100Sweden 35 0 0 34 32 104United Kingdom 110 4 0 125 120 88
Usable production
Self-sufficiency level (%)
Imports* Exports*
Domestic use
Source: Eurostat.
11.3.1. Development of European balance sheet – Skimmed Milk Powder(thousand t)
978
808
0
200
400
600
800
1 000
1 200
1 400
1 600
1991 1992 1993 1994 1995 1996 1997 1998 1999 2000 2001
Production Consumption
Source: Eurostat; DG AGRI.
* Only for EU = Imports and Exports from third countries.
EU-12 EU-15

Chapter II Agricultural markets in the EU
European agriculture entering the 21st century 60
11.4. Whole Milk Powder - Balance sheet 1999 (thousand t)
Total domestic use
Self sufficiency level (%)
EU-15 905 5 732 455 199Belgium 60 51 95 16 370Denmark 97 2 84 15 647Germany 200 54 128 126 158Greece 0 17 0 17 0Spain 8 8 15 0 0France 260 16 215 65 400Ireland 45 1 46 0 0Italy 0 30 0 30 0Luxembourg 0 0 0 0 0Netherlands 110 45 113 69 159Austria 4 2 2 4 106Portugal 9 7 7 7 129Finland 3 1 2 4 84Sweden 7 0 0 7 102United Kingdom 102 17 25 95 108
Usable production
Import Export
Source: Eurostat.
11.4.1. Development of European balance sheet – Whole Milk Powder(thousand t)
905
455
0
200
400
600
800
1 000
1 200
1991 1992 1993 1994 1995 1996 1997 1998 1999
Production Total domestic use
Source: Eurostat.
EU-12 EU-15
* Only for EU = Imports and Exports from third countries.

Chapter III Expenditure and support
European agriculture entering the 21st century 61
EXPENDITURE AND SUPPORT
FOR THE AGRICULTURAL SECTOR
IN THE EU

Chapter III Expenditure and support
European agriculture entering the 21st century 62
Chapter III Expenditure and support for the agricultural sector in the EU
1. Budget breakdown: EAGGF Guarantee Section* 1993-2001 in the EU(million EUR)
0
5 000
10 000
15 000
20 000
25 000
30 000
35 000
40 000
1993 1994 1995 1996 1997 1998 1999 2000 2001
Refunds Direct payments Other
Source: DG AGRI.* Excludes Rural Development
2. Trend in EAGGF Guarantee Section expenditure by Member State(million EUR)
0
1 000
2 000
3 000
4 000
5 000
6 000
7 000
8 000
9 000
10 000
B DK D EL E F IRL I L NL A P FIN S UK
1991 2001
Source: DG AGRI; 1991 including expenditure on carryovers; 1995 and 2000 - Austria, Finland,Sweden; 1999 including set-aside, income aid and fisheries expenditure charged to the GuaranteeSection from 1993.

Chapter III Expenditure and support
European agriculture entering the 21st century 63
3. Evolution in EAGGF Guarantee Section expenditure by product (million EUR)
0
3 000
6 000
9 000
12 000
15 000
18 000
arable crops sugar olive oil driedfodder
fruit andvegetables
wine tobacco milkyproducts
beef meat sheep/goatmeat
1991 2001
Source: DG AGRI.
4. Trend in EAGGF Guidance Section expenditure by Member State(million EUR)
0
200
400
600
800
1 000
1 200
1 400
B DK D EL E F IRL I L NL A P FIN S UK
1991 1999
Source: DG AGRI.

Chapter III Expenditure and support
European agriculture entering the 21st century 64
5. Direct payments to the producers, by size class, paid by the EAGGFin the Financial Year 2000 for Arable Crops and Livestock premia
s i z e c l a s s e s
t h o u s a n d E u r o
EU-15 642 850 2 921 716 2 833 229 9 397 755 4 107 517 831 069 20 734 136Belgium 6 054 64 732 53 369 115 358 7 082 0 246 596Denmark 5 306 66 413 89 832 384 383 85 557 1 516 633 006Germany 53 262 402 908 437 640 1 314 941 758 028 648 713 3 615 491Greece 72 638 267 944 185 051 188 700 8 196 0 722 529Spain 100 837 429 954 429 294 1 094 911 394 860 36 359 2 486 214France 44 408 354 703 584 799 3 594 939 1 213 338 6 067 5 798 254Ireland 16 246 165 864 197 876 316 892 30 460 640 727 977Italy 201 506 610 433 376 823 696 979 183 853 17 473 2 087 068Luxembourg 168 2 503 4 339 8 211 248 0 15 468Netherlands 16 515 88 730 25 001 33 718 2 995 505 167 463Austria 35 877 137 869 108 895 128 451 12 719 3 182 426 994Portugal 52 925 63 114 26 312 92 521 82 239 3 818 320 930Finland 13 821 96 976 75 264 74 558 981 0 261 600Sweden 9 144 65 648 79 425 235 818 65 834 2 035 457 904United Kingdom 14 145 103 925 159 309 1 117 375 1 261 128 110 760 2 766 642
> 5 000 < 10 000 EUR
> 10 000 < 50 000 EUR
> 50 000 < 300 000 EUR
> 300 000 EUR
Total< 1 250 EUR
> 1 250 < 5 000 EUR
Source: DG AGRI.
6. Number of beneficiaries of direct payments, by size class, paid by theEAGGF in the Financial Year 2000 for Arable Crops and Livestock premia
s i z e c l a s s e s
t h o u s a n d
EU-15 1 164.98 1 053.94 394.93 471.03 48.24 1.65 3 134.77Belgium 9.29 21.04 7.51 6.56 0.11 0.00 44.51Denmark 7.96 21.66 12.07 19.41 1.14 0.00 62.24Germany 88.13 135.51 60.13 70.67 6.72 1.26 362.42Greece 129.91 101.76 26.91 11.78 0.11 0.00 270.47Spain 188.17 158.40 60.14 60.07 4.53 0.08 471.39France 67.06 117.38 78.99 165.60 17.06 0.02 446.11Ireland 24.21 57.77 27.98 18.70 0.41 0.00 129.07Italy 362.87 234.40 53.58 38.55 2.22 0.04 691.66Luxembourg 0.29 0.76 0.60 0.48 0.00 0.00 2.13Netherlands 26.50 31.35 3.53 2.03 0.05 0.00 63.46Austria 61.55 52.12 15.56 8.39 0.14 0.00 137.76Portugal 138.68 26.33 3.77 4.29 0.95 0.01 174.03Finland 20.28 35.52 10.75 4.96 0.02 0.00 71.53Sweden 14.32 23.21 11.18 12.14 0.85 0.00 61.70United Kingdom 25.78 36.76 22.23 47.40 13.96 0.24 146.37
Total> 50 000 < 300 000 EUR
> 300 000 EUR
> 5 000 < 10 000 EUR
> 10 000 < 50 000 EUR
< 1 250 EUR
> 1 250 < 5 000 EUR
Source: DG AGRI.(In order to protect the anonymity of the beneficiaries, numbers less than 10 have been made invisible in this table)

Chapter III Expenditure and support
European agriculture entering the 21st century 65
7. Development in the PSE of the agricultural sector as a whole in the EU (in% of the value of total gross farm receipts)
0
10
20
30
40
50
60
1991 1992 1993 1994 1995 1996 1997 1998 1999 2000
%
PSE of EU agricultural sector
Source: OECD.
8. Development in the PSE of specific agricultural products in the EU (in % ofthe value of total gross farm receipts)
0
10
20
30
40
50
60
70
80
Wheat Maize Oilseeds Refinedsugar
Milk Beef andveal
Pigmeat
%
1991 2000
Source: OECD.
PSE: Producer Support Estimate