European Commission, DG ECFIN Key indicators for the euro...
12
KEY INDICATORS FOR THE EURO AREA 1 European Commission, DG ECFIN this update: 1 June 2006 next update: 6 July 2006 1 Output 2002 2003 2004 Dec-05 Jan-06 Feb-06 Mar-06 Apr-06 May-06 Industrial confidence 1.1 Balance -12 -11 -5 -5 -4 -2 -1 1 2 Industrial production 1.2 mom % ch. -0.7 0.5 2.0 0.2 0.2 0.0 0.4 2002 2003 2004 04Q4 05Q1 05Q2 05Q3 05Q4 06Q1 Gross domestic product 1.3 qoq % ch. 0.2 0.3 0.4 0.7 0.3 0.6 2 Private consumption 2002 2003 2004 Dec-05 Jan-06 Feb-06 Mar-06 Apr-06 May-06 Consumer confidence 2.1 Balance -11 -18 -14 -11 -11 -10 -11 -10 -9 Retail sales 2.2 mom % ch. 1.1 0.1 0.2 -0.1 0.5 -0.1 -0.8 2002 2003 2004 04Q4 05Q1 05Q2 05Q3 05Q4 06Q1 Private consumption 2.3 qoq %ch. 0.6 1.1 1.6 0.8 0.1 0.3 0.5 0.1 0.7 3 Investment 2002 2003 2004 04Q4 05Q1 05Q2 05Q3 05Q4 06Q1 Capacity utilization 3.1 % 81.2 80.7 81.6 82.1 81.9 81.1 80.9 81.1 82.0 Gross fixed capital formation 3.2 qoq % ch. -2.0 0.9 2.3 0.6 0.2 1.4 1.0 0.3 0.3 Change in stocks 3.3 % of GDP -0.1 0.0 -0.1 0.4 0.3 0.3 0.1 0.6 0.5 4 Labour market 2002 2003 2004 Dec-05 Jan-06 Feb-06 Mar-06 Apr-06 May-06 Unemployment 4.1 % 8.2 8.4 8.9 8.3 8.2 8.1 8.0 8.0 2002 2003 2004 04Q4 05Q1 05Q2 05Q3 05Q4 06Q1 Employment 4.2 yoy % ch. 0.7 0.3 0.7 0.8 0.6 0.6 0.6 0.8 Shortage of labour 4.3 % 3.8 2.5 2.4 2.1 2.2 2.0 2.1 2.8 2.4 Wages 4.4 yoy % ch. 2.9 2.5 2.2 1.9 2.7 2.2 2.2 2.1 5 International transactions 2002 2003 2004 Dec-05 Jan-06 Feb-06 Mar-06 Apr-06 May-06 Export order books 5.1 Balance -22 -24 -13 -11 -11 -9 -6 -2 -2 World trade 5.2 Index 125 132 Exports of goods 5.3 Bn. EUR 776.9 1038.6 1142.1 109.8 110.0 110.0 111.4 Imports of goods 5.4 Bn. EUR 781.6 970.4 1069.1 112.5 110.5 112.8 111.1 Trade balance 5.5 Bn. EUR -4.7 68.2 73.0 -2.6 -0.5 -2.8 0.3 2002 2003 2004 04Q4 05Q1 05Q2 05Q3 05Q4 06Q1 Exports of goods and services 5.6 qoq % ch. 2.1 0.6 5.9 0.4 -0.2 1.5 2.8 0.7 3.1 Imports of goods and services 5.7 qoq % ch. 0.5 2.6 6.1 1.4 -1.2 2.0 2.9 1.3 2.5 2002 2003 2004 Dec-05 Jan-06 Feb-06 Mar-06 Apr-06 May-06 Current account balance 5.8 Bn. EUR 44.9 18.1 42.4 -3.4 -0.7 -4.0 -3.2 Direct investment (net) 5.9 Bn. EUR -11.0 -18.4 -39.7 -5.3 4.9 -25.4 7.5 Portfolio investment (net) 5.10 Bn. EUR 64.4 -9.4 39.0 -13.8 -37.1 20.5 19.2 6 Prices 2002 2003 2004 Dec-05 Jan-06 Feb-06 Mar-06 Apr-06 May-06 HICP 6.1 yoy % ch. 2.3 2.1 2.2 2.2 2.4 2.3 2.2 2.4 2.5 Core HICP 6.2 yoy % ch. 2.5 2.0 2.1 1.4 1.3 1.3 1.4 1.6 Producer prices 6.3 yoy % ch. 1.7 1.6 2.3 4.7 5.2 5.4 5.1 Import prices 6.4 Index 97.9 102.5 97.2 110.1 111.6 111.9 7 Monetary and financial indicators 2002 2003 2004 Dec-05 Jan-06 Feb-06 Mar-06 Apr-06 May-06 Interest rate (3 months) 7.1 % p.a. 3.3 2.3 2.1 2.5 2.5 2.6 2.7 2.8 2.9 Bond yield (10 years) 7.2 % p.a. 4.8 4.1 4.1 3.4 3.3 3.5 3.7 3.9 4.0 ECB repo rate 7.3 % p.a. 3.25 2.75 2.25 2.25 2.50 2.50 2.50 2.50 Stock markets 7.4 Index 3053 2420 2805 3548 3627 3744 3815 3841 3731 M3 7.5 yoy % ch. 5.6 7.8 5.9 7.5 7.6 8.1 8.4 Credit to private sector (loans) 7.6 yoy % ch. 7.7 5.0 6.0 9.1 9.6 10.4 10.8 11.3 Exchange rate USD/EUR 7.7 Value 0.95 1.13 1.24 1.19 1.21 1.19 1.20 1.23 1.28 Nominal effective exchange rate 7.8 Index 95.1 106.4 109.8 107.8 108.7 108.2 109.0 110.3 111.7 Key indicators for the euro area European Communities, 2006. http://europa.eu.int/comm/economy_finance/indicators/key_euro_area/keyeuroarea_en.htm. ECFIN/A4/REP/53457
Transcript of European Commission, DG ECFIN Key indicators for the euro...

KEY INDICATORS FOR THE EURO AREA
1
European Commission, DG ECFIN
this update: 1 June 2006next update: 6 July 2006
1 Output 2002 2003 2004 Dec-05 Jan-06 Feb-06 Mar-06 Apr-06 May-06Industrial confidence 1.1 Balance -12 -11 -5 -5 -4 -2 -1 1 2Industrial production 1.2 mom % ch. -0.7 0.5 2.0 0.2 0.2 0.0 0.4
2002 2003 2004 04Q4 05Q1 05Q2 05Q3 05Q4 06Q1Gross domestic product 1.3 qoq % ch. 0.2 0.3 0.4 0.7 0.3 0.6
2 Private consumption 2002 2003 2004 Dec-05 Jan-06 Feb-06 Mar-06 Apr-06 May-06Consumer confidence 2.1 Balance -11 -18 -14 -11 -11 -10 -11 -10 -9Retail sales 2.2 mom % ch. 1.1 0.1 0.2 -0.1 0.5 -0.1 -0.8
2002 2003 2004 04Q4 05Q1 05Q2 05Q3 05Q4 06Q1Private consumption 2.3 qoq %ch. 0.6 1.1 1.6 0.8 0.1 0.3 0.5 0.1 0.7
3 Investment 2002 2003 2004 04Q4 05Q1 05Q2 05Q3 05Q4 06Q1Capacity utilization 3.1 % 81.2 80.7 81.6 82.1 81.9 81.1 80.9 81.1 82.0Gross fixed capital formation 3.2 qoq % ch. -2.0 0.9 2.3 0.6 0.2 1.4 1.0 0.3 0.3Change in stocks 3.3 % of GDP -0.1 0.0 -0.1 0.4 0.3 0.3 0.1 0.6 0.5
4 Labour market 2002 2003 2004 Dec-05 Jan-06 Feb-06 Mar-06 Apr-06 May-06Unemployment 4.1 % 8.2 8.4 8.9 8.3 8.2 8.1 8.0 8.0
2002 2003 2004 04Q4 05Q1 05Q2 05Q3 05Q4 06Q1Employment 4.2 yoy % ch. 0.7 0.3 0.7 0.8 0.6 0.6 0.6 0.8 Shortage of labour 4.3 % 3.8 2.5 2.4 2.1 2.2 2.0 2.1 2.8 2.4Wages 4.4 yoy % ch. 2.9 2.5 2.2 1.9 2.7 2.2 2.2 2.1
5 International transactions 2002 2003 2004 Dec-05 Jan-06 Feb-06 Mar-06 Apr-06 May-06Export order books 5.1 Balance -22 -24 -13 -11 -11 -9 -6 -2 -2World trade 5.2 Index 125 132 Exports of goods 5.3 Bn. EUR 776.9 1038.6 1142.1 109.8 110.0 110.0 111.4 Imports of goods 5.4 Bn. EUR 781.6 970.4 1069.1 112.5 110.5 112.8 111.1 Trade balance 5.5 Bn. EUR -4.7 68.2 73.0 -2.6 -0.5 -2.8 0.3
2002 2003 2004 04Q4 05Q1 05Q2 05Q3 05Q4 06Q1Exports of goods and services 5.6 qoq % ch. 2.1 0.6 5.9 0.4 -0.2 1.5 2.8 0.7 3.1Imports of goods and services 5.7 qoq % ch. 0.5 2.6 6.1 1.4 -1.2 2.0 2.9 1.3 2.5
2002 2003 2004 Dec-05 Jan-06 Feb-06 Mar-06 Apr-06 May-06Current account balance 5.8 Bn. EUR 44.9 18.1 42.4 -3.4 -0.7 -4.0 -3.2 Direct investment (net) 5.9 Bn. EUR -11.0 -18.4 -39.7 -5.3 4.9 -25.4 7.5 Portfolio investment (net) 5.10 Bn. EUR 64.4 -9.4 39.0 -13.8 -37.1 20.5 19.2
6 Prices 2002 2003 2004 Dec-05 Jan-06 Feb-06 Mar-06 Apr-06 May-06HICP 6.1 yoy % ch. 2.3 2.1 2.2 2.2 2.4 2.3 2.2 2.4 2.5Core HICP 6.2 yoy % ch. 2.5 2.0 2.1 1.4 1.3 1.3 1.4 1.6 Producer prices 6.3 yoy % ch. 1.7 1.6 2.3 4.7 5.2 5.4 5.1 Import prices 6.4 Index 97.9 102.5 97.2 110.1 111.6 111.9
7 Monetary and financial indicators 2002 2003 2004 Dec-05 Jan-06 Feb-06 Mar-06 Apr-06 May-06Interest rate (3 months) 7.1 % p.a. 3.3 2.3 2.1 2.5 2.5 2.6 2.7 2.8 2.9Bond yield (10 years) 7.2 % p.a. 4.8 4.1 4.1 3.4 3.3 3.5 3.7 3.9 4.0ECB repo rate 7.3 % p.a. 3.25 2.75 2.25 2.25 2.50 2.50 2.50 2.50Stock markets 7.4 Index 3053 2420 2805 3548 3627 3744 3815 3841 3731M3 7.5 yoy % ch. 5.6 7.8 5.9 7.5 7.6 8.1 8.4 Credit to private sector (loans) 7.6 yoy % ch. 7.7 5.0 6.0 9.1 9.6 10.4 10.8 11.3 Exchange rate USD/EUR 7.7 Value 0.95 1.13 1.24 1.19 1.21 1.19 1.20 1.23 1.28Nominal effective exchange rate 7.8 Index 95.1 106.4 109.8 107.8 108.7 108.2 109.0 110.3 111.7
Key indicators for the euro area
European Communities, 2006. http://europa.eu.int/comm/economy_finance/indicators/key_euro_area/keyeuroarea_en.htm. ECFIN/A4/REP/53457

KEY INDICATORS FOR THE EURO AREA
2
Comments
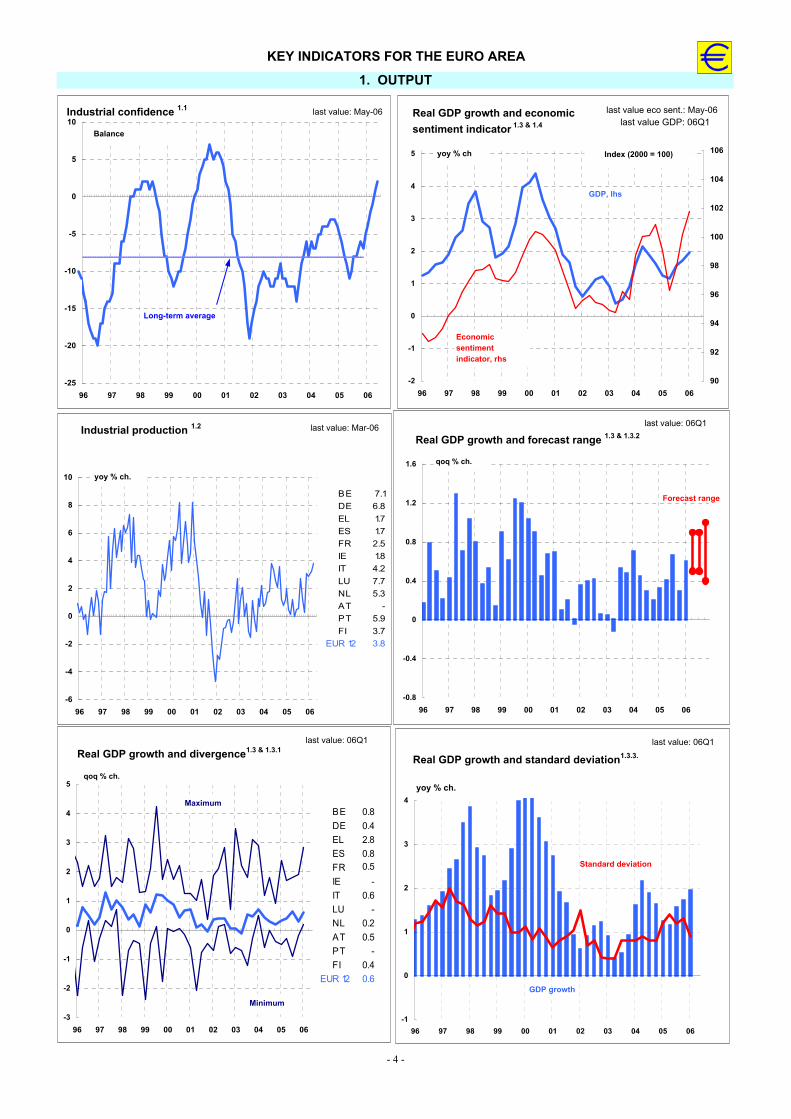
1. Output The Commission’s industrial confidence indicator increased by 1 point in May. For the sixth consecutive month, the indicator registered a further improvement in confidence, and it is now only 4 points below its historic maximum, which was reached in May 2000. The increase in the confidence indicator was due to a more positive assessment of the stocks of finished products and improved productions expectations. With regard to the other components, managers held slightly more negative views on the order books and unchanged views on the stock of finished products.
Industrial production in the euro area rose by 0.4% in March 2006 compared to the previous month. On an annual basis, industrial production increased by 3.8% vis-à-vis the same period in 2005. Month-on-month production of intermediate and capital goods increased, while production of durable and non-durable consumer goods, as well as production in the energy sector declined.
Eurostat’s first estimate of gross domestic product for the first quarter of 2006 shows an increase of 0.6% over the previous quarter. In comparison with the same quarter of the previous year, GDP grew by 2.0%.
The Commission’s dynamic factor model for quarterly euro-area GDP growth projects GDP growth in the range of 0.5% to 0.9% for the second and third quarters of 2006, slightly higher compared to the previous release. The projected range for GDP growth in the fourth quarter is 0.4% to 1.0%.
2. Private consumption The Consumer confidence indicator improved by 1 point in May. Except for a small setback in the first half of 2005, the indicator has been on an upward trend since the first quarter of 2003. The rise in confidence was mainly due to more positive expectations with regard to the unemployment situation. Expectations concerning consumers' own financial situation and their savings did not change much compared to last month, while they held slightly more negative views on the future development of the general economic situation.
In March 2006, the volume of retail sales dropped by 0.8%, compared to the previous month. Vis-à-vis the same period in 2005, retail sales fell by 0.2%.
Private consumption increased by 0.7% in the first quarter of 2006 (q-o-q), after remaining flat in the previous quarter. On an annual basis, household final consumption expenditure rose by 1.8%.
3. Investment
Gross fixed capital formation rose by 0.3% in the first quarter of 2006 (q-o-q), unchanged from the previous quarter. On an annual basis, investment increased by 2.9%. The change in stocks as a percentage of GDP amounted to 0.5% in the first quarter of 2006. According to the quarterly manufacturing survey, capacity utilisation in the manufacturing sector increased to 82.4% in the second quarter of 2006. This is slightly above its long-term average.
4. Labour market In April 2006, the unemployment rate stood at 8.0%, unchanged compared to March. It was 8.7% one year ago. Total employment in the euro area rose by 0.8% (y-o-y) in the fourth quarter of 2005, it had increased by 0.6% in the previous quarter. The growth rate registered one year ago was also 0.8%. Employment expectations in February where unchanged from the previous month.
The level of recorded labour shortages increased by 0.1 pp in the third quarter of 2005: 2.1% of firms reported that unfilled job openings were constraining production.
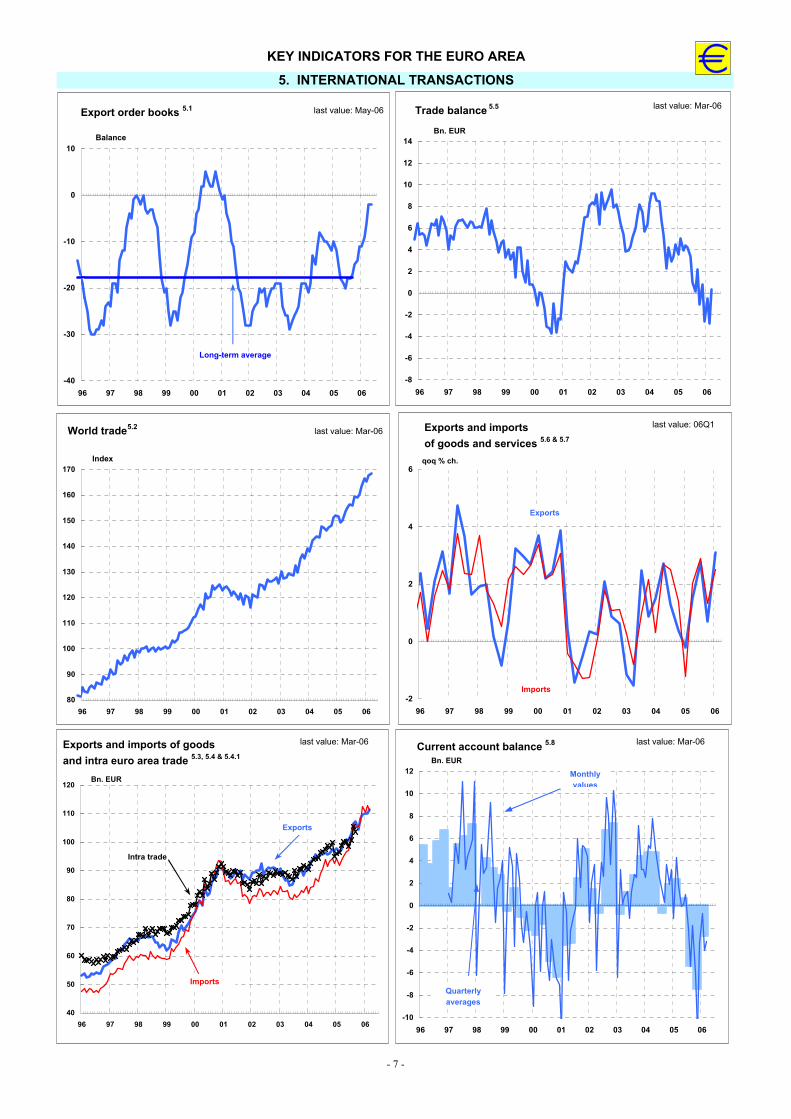
5. International transactions The assessment of export order books in manufacturing remained unchanged in May. The estimate of the trade balance for the euro area revealed a 0.3 bn euro surplus in March 2006, compared to a revised deficit of 2.8 bn euro in the previous month. The improvement in the trade balance was the result of an increase in exports of goods (+1.4 bn euro) and a decrease in imports of goods (-1.7 bn euro). In the first quarter of 2006, exports of goods and services (in volume terms) were up by 3.1% and imports by 2.5% (q-o-q). Compared to one year earlier, exports and imports rose by 8.3% and 9.1%, respectively.
The seasonally-adjusted current account of the euro area showed a deficit of 3.2 bn euro in March 2006 (corresponding to a deficit of 1.3 bn euro in

KEY INDICATORS FOR THE EURO AREA
3
non seasonally-adjusted terms). This reflected deficits in both current transfers (4.7 bn euro) and income (2.7 bn euro), which were only partly offset by the surpluses in goods (2.4 bn euro) and services (1.9 bn euro). In the financial account, combined direct and portfolio investment recorded net inflows of 57 bn euro in March 2006, reflecting net inflows in both direct investment (8 bn euro) and portfolio investment (49 bn euro).
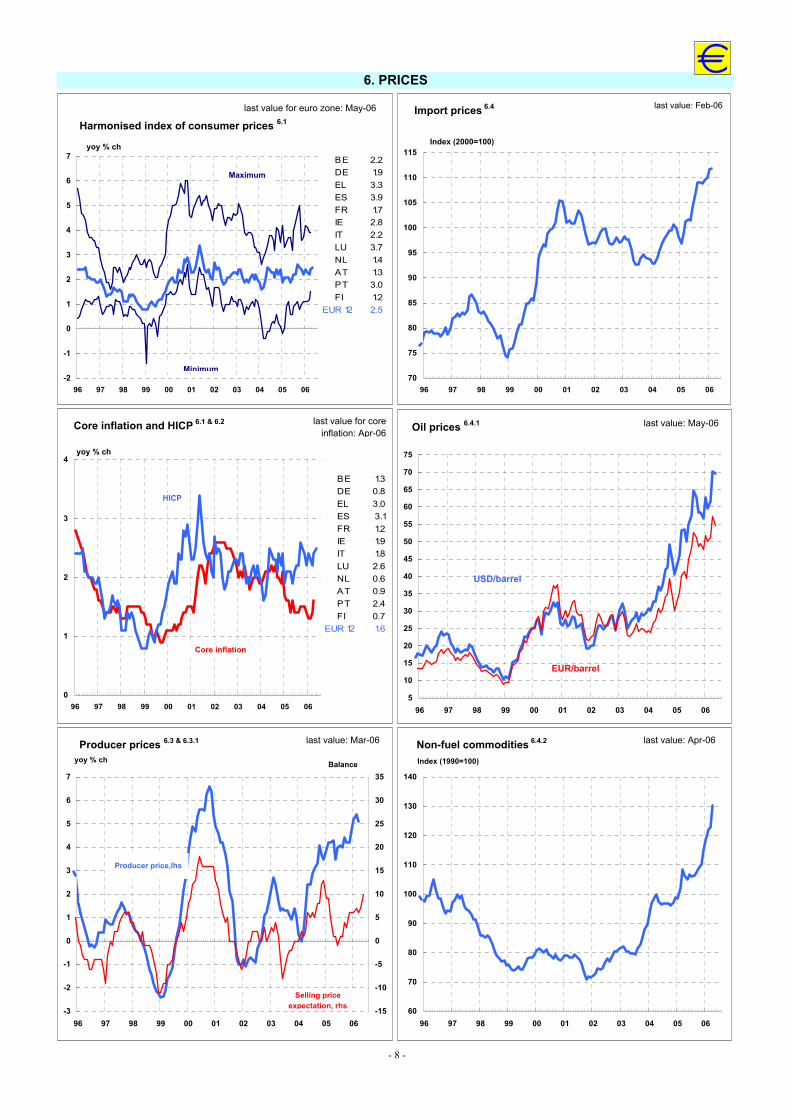
6. Prices According to Eurostat’s flash estimate, euro area annual HICP inflation increased to 2.5% in May, up from 2.4% in April. In April 2006, the impact of higher energy prices (oil, petrol) remained a key determinant of price increases. The highest annual inflation rates were recorded for housing (5.3%), transport (4.6%), alcohol and tobacco (2.7%) and hotels and restaurants (2.7%), whereas a decline was observed for communication (-3.7%). The largest absolute contributions to the HICP inflation rate were again energy-price related. They stemmed from fuels for transport (annual increase of 10.6%), gas (15.9%), heating oil (18.6%) and district heating (19.0%) that accounted for 0.35, 0.19, 0.14 and 0.08 percentage points of HICP inflation, respectively. The core inflation rate increased from 1.4% in March to 1.6% in April 2006.
In late May 2006, oil prices stood at around 70 US dollar per barrel (Brent) and thereby clearly higher than at the end of 2005 (59 US dollar per barrel).
In March 2006, producer price inflation decreased to 5.1%, down from 5.4% in February 2006. Among the main components, the highest annual inflation rate was again recorded for energy (17.4%). The inflation rate of intermediate goods increased for the fifth consecutive time and stands now at 2.5%. Producer prices excluding energy and construction increased at an annual rate of 1.8%.
7. Monetary and financial indicators In December 2005 and March 2006, the ECB Governing Council decided to raise policy interest rates by 25 basis points each. The minimum bid rate on the main refinancing operations of the Eurosystem currently stands at 2.50%. In 2006, euro area money markets have been strongly affected by market expectations of future changes in ECB policy interest rates. In late May 2006, the three-month money market rate stood close to 2.92% pointing to strong market expectations of
another increase in policy interest rates at the meeting of the Governing Council on 8 June 2006. Government bond yields declined somewhat in the second half of May and stood slightly below four percent in late May. The euro area yield curve (as measured by the difference between long-term yields and three-month interest rates) flattened slightly in recent weeks.
M3 growth accelerated further in April 2006. The annual growth rate increased to 8.8%, from a revised 8.5% in March. The three-month moving average of M3 growth increased to 8.4% in the period February to April 2006. The most liquid components slowed slightly but continued to grow faster than the aggregate. The annual growth rate of M1 decreased from a revised 10.1% in March to 9.8% in April. The still very low level of interest rates remained a key determinant of monetary developments. The annual rate of credit growth (loans) to the private sector accelerated from 10.8% in March to 11.3% in April, which is the highest rate since the ECB took over responsibility in 1999. Lending for house purchase grew even stronger in response to low mortgage interest rates and house price dynamics (+12.1% in April, unchanged from March). All in all, the increases in the annual growth rates in monetary and credit aggregates point to a limited impact of past increases in policy interest rates and support the view of ample liquidity conditions in the euro area.
The euro exchange rate increased in May 2006 and temporarily hit the level of 1.30 US dollar per euro. On 30 May it stood at around 1.28 US dollar per euro. Changes in interest rate expectations in the US and in the euro area as well as concerns about external imbalances were again among the main determinants of exchange market developments.
In May 2006, there was a substantial sell-off in equity markets. In the first three weeks of May the EuroSTOXX50 lost about six percent and on 22 May it declined to its lowest level in 2006 before some reversal was seen in subsequent days. Almost in parallel, global equity markets recorded sharp declines with the most pronounced losses in emerging economies. Concerns about a further monetary tightening in the US and a global withdrawal of liquidity as well as the outlook for slower-than-expected economic growth had affected investors' risk preferences and were named as reasons for equity market developments.
- 4 -
KEY INDICATORS FOR THE EURO AREA
1. OUTPUT
Real GDP growth and divergence1.3 & 1.3.1
-3
-2
-1
0
1
2
3
4
5
96 97 98 99 00 01 02 03 04 05 06
qoq % ch.
Minimum
Maximum
last value: 06Q1
BE 0.8DE 0.4EL 2.8ES 0.8FR 0.5IE -IT 0.6LU -NL 0.2AT 0.5PT -FI 0.4
EUR 12 0.6
Real GDP growth and economic sentiment indicator 1.3 & 1.4
-2
-1
0
1
2
3
4
5
96 97 98 99 00 01 02 03 04 05 0690
92
94
96
98
100
102
104
106
GDP, lhs
Economic sentiment indicator, rhs
yoy % ch
last value eco sent.: May-06
Index (2000 = 100)
last value GDP: 06Q1
Industrial production 1.2
-6
-4
-2
0
2
4
6
8
10
96 97 98 99 00 01 02 03 04 05 06
yoy % ch.
last value: Mar-06
BE 7.1DE 6.8EL 1.7ES 1.7FR 2.5IE 1.8IT 4.2LU 7.7NL 5.3AT -PT 5.9FI 3.7
EUR 12 3.8
update graph table
Industrial confidence 1.1
-25
-20
-15
-10
-5
0
5
10
96 97 98 99 00 01 02 03 04 05 06
Balance
last value: May-06
Long-term average
Real GDP growth and forecast range 1.3 & 1.3.2
-0.8
-0.4
0
0.4
0.8
1.2
1.6
96 97 98 99 00 01 02 03 04 05 06
qoq % ch.
last value: 06Q1
Forecast range
Real GDP growth and standard deviation1.3.3.
-1
0
1
2
3
4
96 97 98 99 00 01 02 03 04 05 06
yoy % ch.
last value: 06Q1
GDP growth
Standard deviation

KEY INDICATORS FOR THE EURO AREA
- 5 -
2. PRIVATE CONSUMPTION 3. INVESTMENT
Consumer confidence 2.1
-25
-20
-15
-10
-5
0
5
96 97 98 99 00 01 02 03 04 05 06
Balance
last value: May-06
Long-term average
Retail sales 2.2
-4
-2
0
2
4
6
97 98 99 00 01 02 03 04 05 06
yoy % ch
last value: Mar-06
BE -2.7DE -2.2EL -ES 1.2FR 1.6IE -IT -LU 7.6NL -AT -1.2PT -2.4FI 5.9
EUR 12 -0.2
Private consumption 2.3
-0.5
0.0
0.5
1.0
1.5
96 97 98 99 00 01 02 03 04 05 06
qoq % ch
last value: 06Q1
Capacity utilisation in manufacturing industry 3.1
76
78
80
82
84
86
96 97 98 99 00 01 02 03 04 05 06
%
last value: 06Q2
Long-term average
Gross fixed capital formation 3.2
-4
-2
0
2
4
96 97 98 99 00 01 02 03 04 05 06
qoq % ch
last value: 06Q1
Change in stocks 3.3
-0.8
-0.6
-0.4
-0.2
0.0
0.2
0.4
0.6
0.8
96 97 98 99 00 01 02 03 04 05 06
% of GDP
last value: 06Q1

KEY INDICATORS FOR THE EURO AREA
- 6 -
4. LABOUR MARKET
Unemployment 4.1
7
8
9
10
11
12
96 97 98 99 00 01 02 03 04 05 06
%
last value: Apr-06
BE 8.4DE 8.2EL -ES 8.3FR 8.9IE 4.3IT -LU 4.8NL 3.8AT 4.9PT 7.6FI 7.5
EUR 12 8.0
Employment in total economy 4.2
-4
-2
0
2
4
6
96 97 98 99 00 01 02 03 04 05 06
yoy % ch
Minimum
Maximum
last value: 05Q4
BE 0.8DE -0.3EL -ES 3.8FR 0.3IEIT -LU -NL -AT 0.9PT -FI 2.0
EUR 12 0.8
Wages 4.4
1.0
1.5
2.0
2.5
3.0
3.5
4.0
4.5
5.0
97 98 99 00 01 02 03 04 05 06
yoy % ch
last value: 05Q4
Hourly labour costs in industryand services 4.4.2
0
1
2
3
4
5
6
97 98 99 00 01 02 03 04 05 06
yoy % ch
last value: 05Q4
BE -DE 0.4EL -ES 3.6FR 3.7IE -IT -LU 7.7NL -AT 3.8PT 0.7FI 3.4
EUR 12 2.4
Labour productivity 4.4.1
-1
0
1
2
3
96 97 98 99 00 01 02 03 04 05 06
yoy % ch
last value: 05Q4
BE -DE 1.7EL -ES -0.3FR 1.2IE -IT -LU -NL -AT 1.4PT -FI 0.9
EUR 12 1.2
0
2
4
6
8
10
12
7 8 9 10 11 12
Beveridge curve4.3.1
Labour shortage(% of reporting firms)
Unemployment rate
2002
2005Q4(8.3, 2.8)
2001
2000 1998
1993
1996
last value: 05Q4
7
KEY INDICATORS FOR THE EURO AREA
5. INTERNATIONAL TRANSACTIONS
- 7 -
Export order books 5.1
-40
-30
-20
-10
0
10
96 97 98 99 00 01 02 03 04 05 06
Balance
last value: May-06
Long-term average
Exports and imports of goodsand intra euro area trade 5.3, 5.4 & 5.4.1
40
50
60
70
80
90
100
110
120
96 97 98 99 00 01 02 03 04 05 06
Exports
Imports
last value: Mar-06
Bn. EUR
Intra trade
Trade balance 5.5
-8
-6
-4
-2
0
2
4
6
8
10
12
14
96 97 98 99 00 01 02 03 04 05 06
last value: Mar-06
Bn. EUR
Current account balance 5.8
-10
-8
-6
-4
-2
0
2
4
6
8
10
12
96 97 98 99 00 01 02 03 04 05 06
Bn. EUR
last value: Mar-06
Monthly values
Quarterly averages
Exports and imports of goods and services 5.6 & 5.7
-2
0
2
4
6
96 97 98 99 00 01 02 03 04 05 06
Imports
Exports
last value: 06Q1
qoq % ch.
80
90
100
110
120
130
140
150
160
170
96 97 98 99 00 01 02 03 04 05 06
Index
last value: Mar-06World trade5.2
6. PRICES
- 8 -
Harmonised index of consumer prices 6.1
-2
-1
0
1
2
3
4
5
6
7
96 97 98 99 00 01 02 03 04 05 06
yoy % ch
Maximum
Minimum
last value for euro zone: May-06
BE 2.2DE 1.9EL 3.3ES 3.9FR 1.7IE 2.8IT 2.2LU 3.7NL 1.4AT 1.3PT 3.0FI 1.2
EUR 12 2.5
Import prices 6.4
70
75
80
85
90
95
100
105
110
115
96 97 98 99 00 01 02 03 04 05 06
Index (2000=100)
last value: Feb-06
Core inflation and HICP 6.1 & 6.2
0
1
2
3
4
96 97 98 99 00 01 02 03 04 05 06
yoy % ch
last value for coreinflation: Apr-06
Core inflation
HICP
BE 1.3DE 0.8EL 3.0ES 3.1FR 1.2IE 1.9IT 1.8LU 2.6NL 0.6AT 0.9PT 2.4FI 0.7
EUR 12 1.6
Non-fuel commodities 6.4.2
60
70
80
90
100
110
120
130
140
96 97 98 99 00 01 02 03 04 05 06
Index (1990=100)
last value: Apr-06Producer prices 6.3 & 6.3.1
-3
-2
-1
0
1
2
3
4
5
6
7
96 97 98 99 00 01 02 03 04 05 06-15
-10
-5
0
5
10
15
20
25
30
35
yoy % ch
last value: Mar-06
Producer price,lhs
Selling price expectation, rhs
Balance
Oil prices 6.4.1
5
10
15
20
25
30
35
40
45
50
55
60
65
70
75
96 97 98 99 00 01 02 03 04 05 06
last value: May-06
EUR/barrel
USD/barrel

- 9 -
KEY INDICATORS FOR THE EURO AREA
7. MONETARY AND FINANCIAL INDICATORS
Short-term interest rate, official repo rate and bond yield7.1 & 7.2 & 7.3
0
2
4
6
8
10
96 97 98 99 00 01 02 03 04 05 06
% p.a
Short-term
Long-term
last value: May-06
Repo rate
Real interest rates 7.1.2 & 7.3.1
-2
0
2
4
6
96 97 98 99 00 01 02 03 04 05 06
% p.a
Long-term
last value: May-06
Short-term
Money supply M3 and credit to private sector 7.5 & 7.6
2
4
6
8
10
12
96 97 98 99 00 01 02 03 04 05 06
yoy % ch
Ref. value: 4.5%
Credit to private sector
M3
last value: Apr-06
Euro vis-à-vis USD and YEN 7.7 & 7.7.1
80
100
120
140
160
180
200
96 97 98 99 00 01 02 03 04 05 060.8
0.9
1
1.1
1.2
1.3
1.4Value
USD/EUR (rhs)
JPY/EUR (lhs)
last value: May-06
Stock markets 7.4
500
1500
2500
3500
4500
5500
96 97 98 99 00 01 02 03 04 05 06
last value: May-06
Index
Nominal effective exchange rate 7.7
50
75
100
125
150
96 97 98 99 00 01 02 03 04 05 06
Index
USA
last value: May-06
Japan
Euro area
8. PUBLIC FINANCE*
KEY INDICATORS FOR THE EURO AREA
* Figures are from the Commission's spring 2006 forecas
- 10 -
General government balance 8 .1
-6
-5
-4
-3
-2
-1
0
1
96 97 98 99 00 01 02 03 04 05
% of GDP
BE -0.3DE -3.1EL -3.0ES 0.9FR -3.0IE 0.1IT -4.1LU -1.8NL -1.2AT -1.9PT -5.0FI 2.8
EUR 12 -2.4
2006
General government expenditures and receipts 8.4
40
42
44
46
48
50
52
54
96 97 98 99 00 01 02 03 04 05
% of GDP
Expenditures
Receipts
Tax burden
BE 45.2DE 38.7EL 35.3ES 36.0FR 44.2IE 30.5IT 40.7LU 38.4NL 39.2AT 40.6PT 37.5FI 44.7
EUR 12 40.4
tax burden
2006
Primary balance 8.2
0
1
2
3
4
5
96 97 98 99 00 01 02 03 04 05
% of GDP
BE 3.8DE -0.3EL 1.9ES 2.6FR -0.4IE 1.3IT 0.5LU -1.7NL 1.2AT 0.8PT -2.1FI 4.2
EUR 12 0.6
2006
Cyclically adjusted primary balance 8.3
0
1
2
3
4
96 97 98 99 00 01 02 03 04 05
% of GDP
BE 4.3DE -0.2EL 1.1ES 3.0FR 0.1IE 2.3IT 1.1LU -1.1NL 2.1AT 1.0PT -1.1FI 4.4
EUR 12 1.0
2006
General government debt 8.6
60
64
68
72
76
96 97 98 99 00 01 02 03 04 05
% of GDP
BE 89.8DE 68.9EL 105.0ES 40.0FR 66.9IE 27.2IT 107.4LU 7.9NL 51.2AT 62.4PT 68.4FI 39.7
EUR 12 70.5
2006
-5
-4
-3
-2
-1
0
1
96 97 98 99 00 01 02 03 04 05
% of GDP
BE 0.1DE -3.0EL -3.8ES 1.3FR -2.5IE 1.1IT -3.4LU -1.3NL -0.3AT -1.7PT -4.0FI 3.0
EUR 12 -2.0
2006
Cyclically adjusted balance8.5
The euro area includes 12 countries (BE, DE, EL, ES, FR, IE, IT, LU, NL, AT, PT, FI)mom % ch., qoq % ch., yoy % ch.: monthly, quarterly and annual percentage change respectively.No. Indicator Note Source1 Output1.1 Industrial confidence
indicator Industry survey, average of balances to replies on production expectations, order books, and stocks (the latter with inverted sign)
ECFIN
1.2 Industrial production Volume, excluding construction, working day adjusted Eurostat
1.3 Gross domestic product Volume (1995), seasonally adjusted Eurostat1.3.1 Gross domestic product &
divergenceFrom 1992 until 1996 the minimum and maximum is based on BE, DE, ES, FR, IT, NL, PT and FI; from 1996 it includes also AT
Eurostat
1.3.2 Gross domestic product and forecast range
Volume (1995), seasonally adjusted; the forecast is based on confidence indicators, real and financial variables (see also ECFIN Economic Papers No 154, June 2001)
ECFIN/ Eurostat
1.3.3 Gross domestic product and standard deviation
From 1992 until 1996 the standard deviation is based on BE, DE, ES, FR, IT, NL, PT and FI; from 1996 it includes also AT
ECFIN/ Consensus Forecasts
1.4 Economic sentiment indicator
Composite of indicators for industry, construction, retail trade and consumers (1995 = 100)
ECFIN
2 Private consumption2.1 Consumer confidence
indicator Consumer survey, average of balances to replies to four questions (financial and economic situation, unemployment, savings over next 12 months)
ECFIN
2.2 Retail sales Volume, excluding motor vehicles, working day adjusted Eurostat2.3 Private consumption Volume (1995 prices), seasonally adjusted Eurostat
3 Investment3.1 Capacity utilization In percent of full capacity, manufacturing, seasonally adjusted, survey data (collected each
January, April, July and October). Last value available for 06Q2: 82.4ECFIN
3.2 Gross fixed capital formation
Volume (1995 prices), seasonally adjusted Eurostat
3.3 Change in stocks In percent of GDP, volume (1995 prices), seasonally adjusted Eurostat
4 Labour market4.1 Unemployment In percent of total workforce, ILO definition, seasonally adjusted Eurostat4.2 Employment Total employment, domestic concept, seasonally and working day adjusted Eurostat4.3 Shortage of labour Percent of firms in the manufacturing sector reporting a shortage of labour (unfilled job
openings) as a constraint to production, seasonally adjusted ECFIN
4.3.1 Beveridge curve Relationship between the unemployment rate and shortage of labour as defined in 4.3 ECFIN/ Eurostat
4.4 Wages Wages and salaries. Labour cost index, industry and services (excluding public administration), nominal, working day adjusted
Eurostat
4.4.1 Labour productivity Difference between GDP growth and employment growth ECFIN4.4.2 Hourly labour costs in
industry and servicesLabour cost index, industry and services (excluding public administration), hourly, not seasonally adjusted
Eurostat
5 International transactions5.1 Export order books Industry survey; balance of positive and negative replies, seasonally adjusted ECFIN5.2 World trade Volume, 1998=100, seasonally adjusted CPB5.3 Exports of goods Bn. EUR, excluding intra euro area trade, fob, seasonally and working day adjusted Eurostat5.4 Imports of goods Bn. EUR, excluding intra euro area trade, cif, seasonally and working day adjusted Eurostat5.4.1 Intra trade Bn. EUR, intra euro area trade, seasonally and working day adjusted Eurostat5.5 Trade balance Bn. EUR, excluding intra euro area trade, fob-cif, seasonally and working day adjusted
Eurostat5.6 Exports of goods and
services Volume (1995 prices), including intra euro area trade, seasonally adjusted Eurostat
5.7 Imports of goods and services
Volume (1995 prices), including intra euro area trade, seasonally adjusted Eurostat
5.8 Current account balance Bn. EUR, excluding intra euro area transactions; before 1997 partly estimated ECB
5.9 Direct investment (net) Bn. EUR, excluding intra euro area transactions ECB5.10 Portfolio investment (net) Bn. EUR, excluding intra euro area transactions ECB
Key indicators for the euro area - Explanatory notes
- 11 -
No. Indicator Note Source6 Prices6.1 HICP Harmonised index of consumer prices, national CPI until 1996 Eurostat6.2 Core HICP Harmonised index of consumer prices, excluding energy and unprocessed food Eurostat6.3 Producer prices Without construction Eurostat6.3.1 Selling price expectation Industry survey; balance of positive and negative replies, seasonally adjusted ECFIN6.4 Import prices Import unit values index for goods, 2000=100 Eurostat6.4.1 Oil prices Brent light; USD/barrel and EUR/barrel Ecowin6.4.2 Non-fuel commodities
pricesIndex of market prices for non-fuel commodities, 1995=100, in USD terms IMF
7 Monetary and financial indicators7.1 Interest rate Percent p.a., 3-month interbank money market rate, period averages Ecowin7.1.2 Real short-term interest
rates3-month interbank money market rate (period averages) minus annual percentage change of HICP (CPI before 1996)
Ecowin/ Eurostat
7.2 ECB repo rate Percent p.a., minimum bid rate of the ECB, end of period Ecowin
7.3 Bond yield Percent p.a., 10-year government bond yields (before 1995 long-term bond yield available) lowest level prevailing in the euro area, period averages
Ecowin
7.3.1 Real long-term interest rates
10-year government bond yields (lowest level prevailing in the euro area, period averages) minus annual percentage change of HICP (CPI before 1996)
Ecowin/ Eurostat
7.4 Stock markets DJ Euro STOXX50 index, period averages Ecowin7.5 M3 Seasonally adjusted, three-month moving average (attributed to middle month): from 1997
onwards corrected for holdings by non-residents ECB
7.6 Credit to private sector (loans)
MFI loans to euro area residents excluding MFIs and general government, monthly values: month end values, annual values: annual averages
ECB
7.7 Exchange rate USD/EUR Period averages, until December 1998: USD/ECU rates ECB7.7.1 Exchange rate JPY/EUR Period averages, until December 1998: JPY/ECU rates ECB7.8 Nominal effective exchange
rateAgainst 13 other industrialized countries, double export weighted, 1995 = 100, increase (decrease): appreciation (depreciation)
ECFIN
8 Public finance8.1 General government
balanceIn percent of GDP, net lending (+) or net borrowing (-) general government, ESA 79 up to 1994, ESA 95 as of 1995, 2005 estimates are based on ECFIN spring 2006 forecasts
ECFIN
8.2 Primary balance In percent of GDP; net lending/borrowing minus interest payment; ESA 79 up to 1994, ESA 95 as of 1995; incl. 2000 and 2001 one-off proceeds relative to UMTS licences, 2005 results are based on ECFIN spring 2006 forecasts
ECFIN
8.3 Cyclically adjusted primary balance
In percent of GDP; primary balance corrected for the influence of the cycle; ESA 79 up to 1994, ESA 95 as of 1995, proceeds from UMTS licences excluded, 2005 results are based on ECFIN spring 2006 forecasts
ECFIN
8.4 General government expenditure and receipts
In percent of GDP, ESA 79 up to 1994, ESA 95 as of 1995; proceeds from UMTS licences booked as expenditure with negative sign; tax burden: taxes on production and imports (incl. taxed paid to EU) + current taxes on income and wealth + actual social contributions + capital taxes; 2005 results are based on ECFIN spring 2006 forecasts
ECFIN
8.5 Cyclically adjusted balance In percent of GDP, general government balance corrected for the influence of the cycle; ESA 79 up to 1994, ESA 95 as of 1995, proceeds from UMTS licences excluded, 2005 results are based on ECFIN spring 2006 forecasts
ECFIN
8.6 General government debt In percent of GDP, ESA 79 up to 1994, ESA 95 from 1995 ownwards, 2005 results are based on ECFIN spring 2006 forecasts
ECFIN
- 12 -