Europe and Central Asia ASSESSMENT OF THE ROLE OF...
115
I Report No: ACS12128 Europe and Central Asia ASSESSMENT OF THE ROLE OF GLACIERS IN STREAM FLOW FROM THE PAMIR AND TIEN SHAN MOUNTAINS May 4, 2015 GWADR EUROPE AND CENTRAL ASIA Public Disclosure Authorized Public Disclosure Authorized Public Disclosure Authorized Public Disclosure Authorized
Transcript of Europe and Central Asia ASSESSMENT OF THE ROLE OF...

I
Report No: ACS12128
Europe and Central Asia
ASSESSMENT OF THE ROLE OF GLACIERS IN STREAM
FLOW FROM THE PAMIR AND TIEN SHAN MOUNTAINS
May 4, 2015
GWADR
EUROPE AND CENTRAL ASIA
Pub
lic D
iscl
osur
e A
utho
rized
Pub
lic D
iscl
osur
e A
utho
rized
Pub
lic D
iscl
osur
e A
utho
rized
Pub
lic D
iscl
osur
e A
utho
rized

II
Standard Disclaimer:
This volume is a product of the staff of the International Bank for Reconstruction and Development/ The World Bank. The findings,
interpretations, and conclusions expressed in this paper do not necessarily reflect the views of the Executive Directors of The World Bank or the
governments they represent. The World Bank does not guarantee the accuracy of the data included in this work. The boundaries, colors,
denominations, and other information shown on any map in this work do not imply any judgment on the part of The World Bank concerning the
legal status of any territory or the endorsement or acceptance of such boundaries.
Copyright Statement:
The material in this publication is copyrighted. Copying and/or transmitting portions or all of this work without permission may be a violation of
applicable law. The International Bank for Reconstruction and Development/ The World Bank encourages dissemination of its work and will
normally grant permission to reproduce portions of the work promptly.
For permission to photocopy or reprint any part of this work, please send a request with complete information to the Copyright Clearance
Center, Inc., 222 Rosewood Drive, Danvers, MA 01923, USA, telephone 978-750-8400, fax 978-750-4470, http://www.copyright.com/.
All other queries on rights and licenses, including subsidiary rights, should be addressed to the Office of the Publisher, The World Bank, 1818 H
Street NW, Washington, DC 20433, USA, fax 202-522-2422, e-mail [email protected].

I
THE ROLE OF GLACIERS IN THE HYDROLOGIC REGIME
OF THE AMU DARYA AND SYR DARYA BASINS
Glaciers of the Bartang Basin in the Amu Darya Headwaters
DONALD ALFORD
ULRICH KAMP
CALEB PAN
The World Bank
May 2015
II
The Role of Glaciers in the Hydrologic Regime
of the Amu Darya and Syr Darya Basins
Donald Alford
Consultant – Mountain Hydrologic Systems &
Research Affiliate Department of Geography
University of Montana
Ulrich Kamp Associate Professor
Department of Geography University of Montana
Caleb Pan Research Affiliate
Department of Geography University of Montana
Final Report submitted to
The World Bank
Washington, D.C. May 2015
III
Contents
1. EXECUTIVE SUMMARY 2. INTRODUCTION
2.1. Background 2.2. The Problem 2.3. Scale and Location in Mountain Hydrology 2.4. The ‘Pamir-Karakoram Anomaly’
3. PREVIOUS STUDIES AND UNCERTAINTY 3.1 Previous Studies 3.2 Uncertainty 3.2.1. Mapping Uncertainty 3.2.2. Scenario Uncertainty 3.2.3. Conclusion
4. METHODOLOGY AND DATA 4.1. Basin and Glacier Hypsometries 4.2. Stream Flow 4.3. Water Budget 4.4. Glacier Ablation and Runoff 4.5. Glacier Zones 4.6. Steady-State Equilibrium Altitude 4.7. Ablation Gradient
5. AMU DARYA MOUNTAIN BASINS 5.1. Basins 5.2. Glaciers 5.3. Climate 5.4. Hydrology 5.4.1. Seasonality of Stream Flow 5.4.2. Glacier and Snow Runoff
6. SYR DARYA MOUNTAIN BASINS 6.1. Basins 6.2. Glaciers 6.3. Climate 6.4. Hydrology 5.4.1. Variability of Stream Flow 5.4.2. Glacier, Snow, and Rainfall Runoff
7. STREAM FLOW AND CLIMATE CHANGE 7.1. Amu Darya Mountain Basins 7.2. Syr Darya Mountain Basins
8. DISCUSSION 9. BIBLIOGRAPHY
APPENDIX Mapping Basin and Glacier Area

1
1. EXECUTIVE SUMMARY
Background
The headwaters of the Amu Darya and Syr Darya in the western Tien Shan, Pamir and Hindu Kush
mountains are a major source of stream flow into the Aral Sea Basin (Figure ES-1). The water security—affecting
energy and food security—of this region and the consequent regional dynamics and politics are connected to
these headwaters. The Aral Sea Basin comprises of 7 countries (Kyrgyz Republic Tajikistan, Turkmenistan,
Uzbekistan, Southern Kazakhstan, and small parts of Afghanistan, Iraq) with a total population of more than 60
million over an area of 4 million km2. In the basin, there are large differences in water availability, from Tajikistan
with an average of about 5,000 m3 available per person annually to Turkmenistan with less than 300 m3 per
person annually. The upstream countries, Tajikistan and the Kyrgyz Republic, rich in water resources but poor in
oil, gas and coal, energy supply rely heavily on hydropower. Hydropower accounts for 99% in Tajikistan and 93% in
the Kyrgyz Republic (WDI data, 2011). Due to winter energy shortages, these countries would like to expand
hydropower production. In contrast, the downstream countries, Kazakhstan, Turkmenistan and Uzbekistan, are
largely dependent on inflow from the two upstream countries to secure summer irrigation supplies. Agriculture is
a key component of the basin’s economy and accounts for 90% of total water withdrawal in the basin. Out of 7.4
million hectares of land being irrigated in the basin, 4.3 million hectares are in Uzbekistan and 1.6 million hectares
in Turkmenistan (ICWC data, 2011). Tensions amongst the riparian countries have risen in recent years due to
conflicting seasonal demands on these water resources. Climate change may have a significant impact on the
overall water resource availability in the basin.
Recent concerns related to climate change, glacier retreat and stream flow from these mountains have
served to illustrate the very limited understanding that exists concerning the hydrologic regimes of the mountain
headwaters of these major river systems as well as of the glaciers, that are a component of those regimes.
Traditional studies of the mountain water resources, based on gross aggregate means relating climate and runoff
derived from macro-scale satellite imagery and global circulation models or historical records, may produce useful
values information on total runoff, but cannot distinguish amongst rainfall, snow and glacier melt as components
of that runoff. This decomposition has important implications for future water resource planning and
management. A better understanding of these hydrologic processes is critical for assessing the amount and
timing of water supply and hydropower available (both current and future) for the various countries in the
Central Asia region that have headwaters originating in these mountains. Such an understanding is also critical
in making estimates of runoff changes under a climate change future. This is the main objective of this study.

2
Figure ES-1. The mountain headwaters of the Aral River Basin in Central Asia.
This study expands the knowledge on the role of glaciers (both present and in the future) on the Amu and
Syr Darya rivers by adopting a methodology developed recently for the nearby Ganges and Indus systems (e.g.,
World Bank., 2010; World Bank, 2011; Immerzeel, et. al., 2010). Based on historical records and analyses of GIS
hypsometry and satellite imagery, this study presents the general baseline hydrology of the mountain basins at
the headwaters of these two river systems and evaluates the role of glaciers and snow melt as components of the
flow of these rivers. This melt model and data provide the fundamental organized information bases needed to
assess potential impact of various climate change scenarios of the Amu and Syr Darya River basins. This will help
to prioritize areas of most concern from the water resource management and planning perspectives and potential
solutions. To the governments of Central Asian countries, this study will be an important contribution to the
overall discussion of climate change impacts on water in Central Asia.
Methodology
This assessment is based on available period-of-record stream flow data, a digital elevation model derived
area-altitude distribution of the glaciers of each basin, satellite imagery-derived basin and glacier extents, and an
ablation gradient model. Regional values from studies in the high mountains of Asia are used to estimate values

3
for the ablation gradient, equilibrium line altitude, and glacier net balance. The non-glacier components of runoff
were approximated based on the seasonality of precipitation.
For this study, elementary water and energy budget principles are combined with these area-altitude
digital elevation models to reflect the dominant influence of altitude and surface area in determining variations in
mass and energy exchange in the mountains of the region. The meso-scale models developed as a result of this
study are designed to reflect a fundamental characteristic of mountain ranges or regions – virtually all properties
and processes vary with altitude, and area is the most useful factor in assessing total runoff volumes.
Model Results
The Amu Darya: The Amu Darya is formed by the confluence of the Panj and Vakhsh rivers in southwestern
Tajikistan. The two principal sources of runoff on the basin are: (i) winter precipitation as snow that melts during
the succeeding summer-season, and (ii) glacier melt during a summer-season. These two sources respond very
differently to variations in temperature and precipitation. Timing and volume of runoff from the seasonal
snowpack will be determined by the snow depth—in water-equivalent terms—of the winter precipitation. All
snow below the regional snowline, which in the Pamirs is at an altitude of c. 5,000 m a.s.l., will become runoff
during the spring and early summer months as the 0°C isotherm migrates upward to a maximum altitude between
5,000-6,000 m a.s.l., and then migrates to lower altitudes with the onset of fall and winter. Precipitation above the
regional snowline will become incorporated in the glaciers or perennial snowfields to serve as a secondary storage
exploited during years of drier and warmer conditions than the average.
Timing and volume of runoff from glaciers represent a combination of melt of the seasonal storage of water,
as snow, and the melt of the total ice reserves of the glaciers of a basin. Since there is no realistic upper limit to
the amount of water than can be produced by melting during the summer season each year at the surface of a
glacier that may be hundreds of meters thick, the limit on runoff from this process is determined largely by the
mean air temperature of the summer-season. The primary limiting factor in a mountain range such as the Pamirs
is the upper altitude reached each summer by the mean 0oC isotherm during the melt season. Glacier melt water
is produced from below this altitude, in the ablation zone. A major complication in viewing the glaciers of a
mountain basin as simply large, isothermal snowdrifts, as is sometimes done, is that the snow deposited on the
accumulation zone is converted to glacier ice, and transferred by plastic flow down-glacier into the ablation zone.
It is the two processes of storage of the seasonal snow above the regional snowline each year, and the slow
transfer of this snow, by plastic flow, to the altitudes of the glacier ablation zones that complicates both estimates
of snowmelt and glacier runoff in the high mountains of Asia. In the Pamirs, as much as 25% of the total basin
surface area will be above the mean 0°C isotherm in the summer season, and therefore experience no melt.
Modeling procedures developed without consideration of this fact can be expected to be in error by
approximately this amount. Results of the modeling show that:
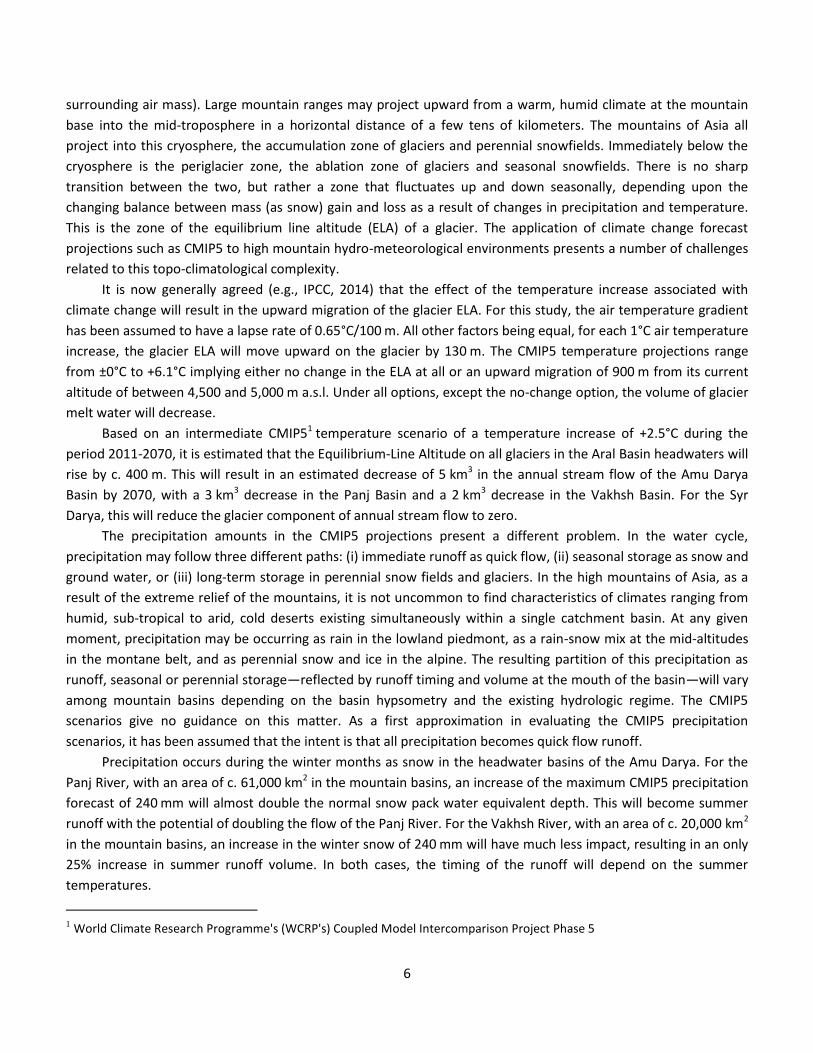
The total annual runoff in the Upper Amu Darya Basin is 39 km3. Of this, 22 km3 come from the Upper
Panj Basin and 17 km3 from the Upper Vakhsh Basin.
The glacier component of the total annual runoff in the Upper Amu Darya Basin is estimated to be 9 km3
(24% of total runoff). Of this, 4 km3 originate in the Panj Basin and 5 km3 in the Vakhsh Basin.

4
The snowmelt component of the total annual runoff in the Upper Amu Darya Basin is estimated to be
29 km2 (76% of total runoff). Of this, 18 km3 come from the Panj Basin and 11 km3 from the Vakhsh
Basin. Snowmelt is the main component of runoff from the mountain basins.
The Syr Darya: The Syr Darya is formed by the confluence of the Naryn and Kara rivers in the Fergana Valley, and
flows westward through Kirghizstan, Tajikistan and Uzbekistan to the Aral Sea. The Syr Darya receives additional
input from basins along the north slopes of the Alai Mountains as it flows through the Fergana Valley, and from
the Chirchik River near Tashkent, Uzbekistan. The mountain headwaters of the Syr Darya are primarily in the
western Tien Shan and Alai mountains. While glacier ablation contributes to the runoff in the Syr Darya Basin, it is
apparent that a combination of snow melt and summer precipitation is the major component in the runoff from
glacierized basins in the western Tien Shan Mountains. A potential complete disappearance of the glaciers will
have a minimal impact on the water resources of the Upper Syr Darya Basin. The role of precipitation is far more
important here. The results of the modeling show that:
The total annual runoff in the Upper Syr Darya mountain basins as measured in the Fergana Valley is
18 km3: 12 km3 in the Naryn Basin, 5 km3 in the Kara Basin, and 1 km3 in the small basins on the north
slope of the Alai Range. An additional 7 km3 of the runoff in the Upper Syr Darya is contributed by the
Chirchik River flowing into the Syr Darya from a glacierized basin north of the city of Tashkent.
The glacier component of the total annual runoff in the Fergana Valley is estimated to be 1.4 km3 (6% of
total runoff), from small cirque glaciers primarily located in the Naryn and Kara basins. Available data
indicate there is considerable summer rain at the altitude of the glacier ablation zones. This will tend to
mask the role of glacier melt water in the Upper Syr Darya tributaries.
It is assumed that the decrease in runoff from 18 km3 to 7 km3 within the Fergana Valley reflects
consumptive use. This suggests that the importance of glacier runoff in the Syr Darya system will be
restricted to the Fergana Valley.
Table ES-1 summarizes total runoff and glacier and snow melt components in Amu and Syr Darya Basins.
Table ES-1. Summary of total annual runoff and melt water components from glaciers, snow and ‘others’ (snow/rain) in the Upper
Amu Darya and Upper Syr Darya basins.
Basin Total Runoff Glacier Melt Water Snow Melt Water
(km3) (km
3) (%) (km
3) (%)
Amu Darya ≈79 --- --- --- --- Upper Amu Darya 38.7 9.3 24 29.4 76
Upper Panj 21.7 3.7 17 18.0 83 Upper Vakhsh 17.0 5.6 33 11.4 67
Basin Total Runoff Glacier Melt Water ‘Others’
(km3) (km
3) (%) (km
3) (%)
Syr Darya ≈37 --- --- --- --- Upper Syr Darya 25.4 1.5 6 23.9 94
Chirchik 6.9 0.1 2 6.8 98 Upper Fergana Valley 18.5 1.4 8 17.1 92 Alai Range 1.0 0.1 10 0.9 90 Kara 5.2 0.3 6 4.9 94 Naryn 12.3 1.0 8 11.3 92

5
Figure ES-2. Components of runoff in the mountain basins of the upper Amu Darya Basin representing the diversity of hydro-
meteorological environments. While aggregated mean data provide useful forecasts of total runoff into the rivers of the adjacent
lowlands, they provide little insight into the role of individual water budget components, such as glaciers, in stream flow formation.
(BQ: total basin runoff; GQ: glacier melt runoff; SQ: snowmelt runoff; MCM: million cubic meters). (The Panj is here the Upper Panj =
Shidz).
Figure ES-3. Components of runoff in the mountain basins of the Upper Syr Darya Basin representing the diversity of hydro-
meteorological environments. While aggregated mean data provide useful forecasts of total runoff into the rivers of the adjacent
lowlands, they provide little insight into the role of individual water budget components, such as glaciers, in stream flow formation.
(Q: runoff; ‘Other’: undifferentiated runoff from snowmelt and rain; MCM: million cubic meters).
The Impact of Climate Change
Most problems dealing with the climate and hydrology of high mountain glacier basins can be reduced to
the interaction of topography (altitude, aspect, slope) and meteorology (the properties and processes of the
Murgab Gund Bartang Gudara Shidz Vanch Yazgulem Kysyzlu Muksu Obighigou
BQ, mcm 1449 3276 1630 1544 9771 2491 1693 3150 6615 7403
GQ, mcm 915 507 980 403 3470 480 372 1130 2685 1269
SQ, mcm 534 2769 650 1141 6301 2011 1321 2020 4930 6139
0
2000
4000
6000
8000
10000
12000
Ru
no
ff (
MC
M)
Components of Runoff in the Amu Darya Mountain Basins
Naryn Kara Darya Chirchik Alai
Total Q 12249 5161 6867 1040
Glacier Q 1008 311 74 118
Other 11241 4850 6793 922
0
2,000
4,000
6,000
8,000
10,000
12,000
14,000
Stre
am F
Low
(M
CM
)
Stream Flow Components in the Syr Darya Basin
6
surrounding air mass). Large mountain ranges may project upward from a warm, humid climate at the mountain
base into the mid-troposphere in a horizontal distance of a few tens of kilometers. The mountains of Asia all
project into this cryosphere, the accumulation zone of glaciers and perennial snowfields. Immediately below the
cryosphere is the periglacier zone, the ablation zone of glaciers and seasonal snowfields. There is no sharp
transition between the two, but rather a zone that fluctuates up and down seasonally, depending upon the
changing balance between mass (as snow) gain and loss as a result of changes in precipitation and temperature.
This is the zone of the equilibrium line altitude (ELA) of a glacier. The application of climate change forecast
projections such as CMIP5 to high mountain hydro-meteorological environments presents a number of challenges
related to this topo-climatological complexity.
It is now generally agreed (e.g., IPCC, 2014) that the effect of the temperature increase associated with
climate change will result in the upward migration of the glacier ELA. For this study, the air temperature gradient
has been assumed to have a lapse rate of 0.65°C/100 m. All other factors being equal, for each 1°C air temperature
increase, the glacier ELA will move upward on the glacier by 130 m. The CMIP5 temperature projections range
from ±0°C to +6.1°C implying either no change in the ELA at all or an upward migration of 900 m from its current
altitude of between 4,500 and 5,000 m a.s.l. Under all options, except the no-change option, the volume of glacier
melt water will decrease.
Based on an intermediate CMIP51 temperature scenario of a temperature increase of +2.5°C during the
period 2011-2070, it is estimated that the Equilibrium-Line Altitude on all glaciers in the Aral Basin headwaters will
rise by c. 400 m. This will result in an estimated decrease of 5 km3 in the annual stream flow of the Amu Darya
Basin by 2070, with a 3 km3 decrease in the Panj Basin and a 2 km3 decrease in the Vakhsh Basin. For the Syr
Darya, this will reduce the glacier component of annual stream flow to zero.
The precipitation amounts in the CMIP5 projections present a different problem. In the water cycle,
precipitation may follow three different paths: (i) immediate runoff as quick flow, (ii) seasonal storage as snow and
ground water, or (iii) long-term storage in perennial snow fields and glaciers. In the high mountains of Asia, as a
result of the extreme relief of the mountains, it is not uncommon to find characteristics of climates ranging from
humid, sub-tropical to arid, cold deserts existing simultaneously within a single catchment basin. At any given
moment, precipitation may be occurring as rain in the lowland piedmont, as a rain-snow mix at the mid-altitudes
in the montane belt, and as perennial snow and ice in the alpine. The resulting partition of this precipitation as
runoff, seasonal or perennial storage—reflected by runoff timing and volume at the mouth of the basin—will vary
among mountain basins depending on the basin hypsometry and the existing hydrologic regime. The CMIP5
scenarios give no guidance on this matter. As a first approximation in evaluating the CMIP5 precipitation
scenarios, it has been assumed that the intent is that all precipitation becomes quick flow runoff.
Precipitation occurs during the winter months as snow in the headwater basins of the Amu Darya. For the
Panj River, with an area of c. 61,000 km2 in the mountain basins, an increase of the maximum CMIP5 precipitation
forecast of 240 mm will almost double the normal snow pack water equivalent depth. This will become summer
runoff with the potential of doubling the flow of the Panj River. For the Vakhsh River, with an area of c. 20,000 km2
in the mountain basins, an increase in the winter snow of 240 mm will have much less impact, resulting in an only
25% increase in summer runoff volume. In both cases, the timing of the runoff will depend on the summer
temperatures.
1 World Climate Research Programme's (WCRP's) Coupled Model Intercomparison Project Phase 5

7
For the Syr Darya, the available precipitation data indicates that 50-60% of the annual precipitation in the
mountain basins falls as rain during the months of June to September. It is assumed that this will become quick
flow. The remainder will be winter snow that will be melting at the same time, resulting in roughly a doubling of
runoff volumes largely independent of any temperature changes.
From the standpoint of hydrological analyses, a problem presented by the CMIP5 forecast projects is the
large number of combination and permutations of temperature and precipitation involved. The maximum
decreases in precipitation projected by CMIP5 will result in a major decrease in stream flow volumes in the
headwaters of both the Amu Darya and Syr Darya basins. The maximum increases in values will result in serious
flooding. At least two CMIP5 combinations—of maximum precipitation with average or minimum temperature
changes—may result in rapid glacier growth and advance throughout the Pamir-Karakoram-Himalaya mountains
similar to that of the Little Ice Age as a result of increase snow fall in the accumulation zones of the glaciers. The
hydrological consequences of such an advance are beyond the scope of this study.
Discussion
To meet the immediate needs of water resources planning and management for the mountain rivers of
Asia, the primary need at the present time is the development of short-term, seasonal, runoff forecast procedures
for the mountain basins to permit some quantification of the ongoing debates concerning questions of water
supply and use. This will require the establishment of monitoring program involving satellite imagery analysis and
field measurements of the crucial variables defining the hydrometeorology of these complex high mountain
systems. The monitoring program will need to consider the interactions of climate, glaciers, and stream flow in the
Amu and Syr Darya headwater catchment basins as a factor in monitoring network design. From the standpoint of
the findings of this study, the most important, and perhaps the simplest to implement, is a network of sites for the
measurement of snow water-equivalent depth in the headwater basins of both the Amu Darya and Syr Darya.
Some key design elements for building a hydrometeorological monitoring program in these headwaters
and to enhance availability of data for climate impact predictions include the following (from World Bank, 2014):
Monitoring Site and Instrument Selection
A representative site location (the primary altitudinal zone of specific and total volume runoff, ice cover area and glacier ablation is generally 3,000-6,000 m);
Refurbishment or upgrading of existing sites to a working condition to allow continuity of earlier data collection programs;
Simpler setups and devices, which are more reliable than the advanced setups and devices that are scattered—and often broken or unmaintained—across the region;
Locations in the glacierized headwaters of streams that have importance for water management (for hydropower, irrigation and water supply);
Sites that are accessible for as long as possible throughout the year, with the exception of satellite stations;
En route support from villages and establishment of telecommunication links.
Personnel / Training and Safety
Local, well-trained technical personnel for observations, maintenance and station surveillance to reduce travel and mission costs and time lags (this is technically feasible through adequate capacity-building programs that

8
enable local personnel to perform essential technical functions based on well-defined, station-specific standard operating procedures);
Respect for mountain communities as able stakeholders and disaster management professionals;
Teaming of community elders with disaster preparedness specialists to further create a holistic and trusting venue for conveying data and information;
Planning and training for the specific kinds of safety issues that arise with crevasses, avalanches, icefalls and accumulation zones where there is deep snow, with the help of qualified and experienced mountaineers.
Data Collection and Management
An agreed data policy covering the different data streams the program will monitor; data lose value if not managed in a transparent and replicable manner (general guiding principles are outlined here);
Emphasis on acquisition and analysis of existing climate data over further development of the monitoring network;
Equal, nonhierarchical access to all program data for all partners and the establishment of a web-based metadata catalog and archiving system;
Designation of data providers as the owners and custodians of the data they generate, even if the data are pooled or aggregated in program-related databases and data management systems;
Publication of selected data for the general public in a fashion agreed to by program partners;
Design and implementation of a rigid data quality control procedure that all data must undergo.
Implementation
A program consortium group of partners that meets for the program commencement and periodically thereafter, when major program milestones have been achieved and consensus is needed;
A dedicated group to provide governance of the program (identified national focal points; international organizations; donors and representatives of the hosting regional organization; and invited experts on an ad hoc basis), meeting twice per year;
Implementation and day-to-day monitoring management facilitated through a regional institution or other dedicated center of excellence in one of the participating countries;
A management unit housed within the principal regional organization to ensure day-to-day execution of the program, comprising a scientific officer, technical officer, asset management officer, financial controller and administrative support.

9
2. INTRODUCTION
This report describes the role of glaciers in the stream flow of the rivers of the Aral Basin. The study area
contains the mountain basins at the headwaters of the Amu Darya and Syr Darya, located primarily in the Pamir,
Hindu Kush, Karakoram and western Tien Shan mountains (Figure 1). The Amu Darya study area includes the
mountain basins of the Vakhsh and Panj rivers; the Syr Darya study area includes the mountain basins of the
Naryn, Kara, and Chirchik rivers, and a number of small basins on the north-facing slopes of the Alai Range.
Figure 1. The mountain headwaters of the Aral River Basin in Central Asia.
The high mountains of Asia are the source of c. 50% of the annual stream flow of the major rivers of the
region. The association of high mountains, rivers, and glaciers has led many to assume, a priori, that the glaciers
are a major source of the mountain runoff, and that the current general global retreat of glaciers will adversely
impact the volume and timing of the major rivers of Asia (e.g., IPCC, 2007). Major problems have been
encountered in testing this assumption. There are presently no credible conceptual models describing the hydro-
meteorological environments of the high mountains of Asia that quantify the glacier melt component.
Furthermore, there is a general lack of sufficient data to test hypotheses that relate glaciers and rivers, either as a
result of a lack of a current monitoring program, or as a result of a reluctance to share these data on the part of
some governments.

10
For mountain headwater regions such as the Pamir or Tien Shan mountains, the two most common
approaches in assessing the role of glaciers in stream flow are:
(i) The application of macro-scale climate modeling procedures using global circulation models (GCMs).
These GCMs have a resolution of 100-200 km that is much too coarse to evaluate the mountain topo-
climates. Furthermore, imagery at a pixel size of 500-1000 m does not distinguish between snowfields
and glaciers, or map glacier boundaries with any precision (e.g., Immerzeel et al., 2012).
(ii) The application of the results from a single glacierized basin for which some data are available, to the
entire headwater region, on the assumption of regional uniformity in the mountain hydro-
meteorological environment (e.g., Hagg et al., 2013).
The primary impetus for the development of the methodology used in our study was a perceived need to
develop an approach to the assessment of the hydrology of Himalayan glaciers, based on the available data,
satellite imagery, and hypsometries derived from SRTM data that was at the scale of the individual glacierized
basin, rather than at the scale of an entire mountain range, and that reflected the role of the extreme three-
dimensional topography of these mountains. These mountains extend upwards into the middle troposphere, with
the glaciers commonly above the 600 mb-altitude, while most climate data are from altitudes below the 700 mb-
altitude. We here assumed that both processes of water and energy exchange vary with altitude in catchment
basins within the Asian mountains. The total volume of water passing through a catchment basin as a result of
glacier ablation and runoff will be determined largely by a relationship between the intensity of those processes
and the surface area over which they act. Hence, our methodology includes an area-altitude distributed process
(Alford et al., 2009; Racoviteanu et al., 2013) that computes volume of melt water produced annually by glacier
ablation and runoff as the product of the altitudinal distribution of glacier surface area in the ablation zone and
the gradient of ablation from a maximum value at the glacier terminus to zero at the altitude of the equilibrium
line altitude (ELA). Stream flow for each glacierized mountain basin is taken from the best available period-of-
record hydrometric data (Tajik Hydrometeorological Department, 2013; Global Runoff Data Centre, 2013) and
glacier areas derived from Landsat 5 satellite imagery analysis. The two are connected by a digital elevation model
(DEM) based on SRTM data and generally accepted glacier theory (Haefli, 1962; Benn and Lehmkuhl, 2000). The
results must be viewed as first-order hypotheses.
The purpose of this study was to assess the role of the glaciers in the Pamir, Hindu Kush, Karakoram, Alai
and Tien Shan mountains in the volume and timing of stream flow of the Amu Darya and Syr Darya, and, in terms
of these finding, to discuss the implications of the general retreat of glaciers for the water resources.
Methodologically, it is a continuation of similar studies in the tributaries of the Ganges River from the Nepal
Himalaya (Alford et al., 2009), and the western Himalaya, Karakoram and Hindu Kush mountains of the upper
Indus Basin (Alford, 2011; Yu et al., 2013). Results are presented primarily in graphical and tabular form, and only
the most salient conclusions are drawn.
2.1. Background

11
Traditionally, the study of mountain environments and resources has been undertaken from a lowland
perspective. Mountains are viewed as a resource base, providing necessities such as water, timber, and minerals,
and creating major barriers to surface travel. From this perspective, the most common definition of a mountain is
an elevated landform, and the most definitive measure of a mountain is altitude above sea level (e.g., UNEP,
2002). Analyses of mountain resources, such as water, have traditionally been based on statistical ‘black box’
models in which stream flow, as measured at the mouth of a mountain basin, may be indexed to climate data as
measured at a nearby, lowland station. This type of model produces useful results, but is dependent for historical
databases describing both stream flow and climate. Additionally, as the term ‘black box’ implies, the model output
provides stream flow timing and volume, with no indication of the contribution of individual components of the
water budget. While the results produced by this approach have proven useful for the purposes of water
resources planning and management that are generally concerned only with variations in timing or volume of
lowland water resources, attempts to apply variations of these statistical models to the problems of glaciers and
stream flow have been generally unsatisfactory, unless it is assumed that all stream flow from a basin is glacier
melt.
It is apparent that mountains are defined by a complex, three-dimensional diversity of biophysical
environments, produced by interactions among terrain, geology and meteorology. The homogeneity seen from
the distant lowlands reflects a complex mosaic of environments. Altitude determines the properties of an
atmospheric column extending upwards from a point within the mountains. These atmospheric properties
determine the potential water and energy budgets at a point, or within a basin, in the mountains. Relief defines
local topography, i.e., slope aspect and angle. These terrain properties, in turn, create the three-dimensional
spatial mosaic of water and energy budgets that characterize mountain catchment basins—the mountain topo-
climatology (Thornthwaite, 1953; Geiger, 1966).
Much of the literature describing the hydrology and glaciology of the high mountains of Asia are from single
or discontinuous visits to particular locations, or is based on the extrapolation of lowland, gross aggregate data
bases. There are few continuous records other than low altitude stream flow and climatological data for the
hydro-meteorological or glaciological environments of these mountains, and fewer models that would permit the
synthesis and analysis of these data. But even these existing data are not readily available. Of necessity, much of
the literature is speculative, and based upon relationships developed from other mountain regions in Asia, Europe
and North America. This problem is reflected in a section of the ‘Bishkek Platform’, produced at the Bishkek Global
Mountain Summit, at the conclusion of the United Nations International Year of the Mountains 2002 (IYM, 2002):
“Mountain-specific data: We recognize that the lack of spatially disaggregated
socio-economic and environmental data hampers the recognition and specific
analysis of mountain livelihood issues. We encourage governments to produce,
publish and use mountain-specific data to improve policies for sustainable
mountain development, especially in relation to dominant lowland economies.”
This report presents an analysis of the meso-scale hydro-meteorological environments of the Pamir, Hindu
Kush and western Tien Shan mountains. The topographic variables of basin and glacier area and their
hypsometries have been determined with Landsat 5 and SRTM measurements. The scale of this study is that of the
gauged mountain sub-basins of the Amu Darya and Syr Darya. The findings describing the role of glaciers in the
stream flow of these rivers are at the scale of these sub-basins, an intermediate, or meso-scale, between that of

12
the macro-scale Aral Basin and of the micro-scale of the climate, and hydrometric stations that provided data for
the study. The primary locations are those of the hydrometric stations and of the glaciers that are generally
separated horizontally by tens of kilometers and vertically by thousands of meters. We recognize that a change in
scale and location could alter the findings presented here. A stream gauge located immediately downstream from
a glacier terminus will show a much different relationship between glacier runoff and stream flow than one
located in the foothills of the mountains.
This report deals only in passing with questions related to the physical interactions involved in glacier
response to climate change and global warming. Similarly, the complexities of mass and energy exchange in a
glacier environment and ice dynamics as they relate to the flow of ice from an area of accumulation to an area of
melt are recognized, but not described in detail. Values used to describe the equilibrium line altitude (ELA) and
ablation gradient are considered generally representative of the mountains of Asia, but may vary with location in
these mountains. It is the purpose of this report to assess the role of glaciers in stream flow formation primarily
from the perspective of the relationship between glacier changes and potential changes in the volume and timing
of water resources availability. This has involved:
(i) A review of the literature to determine current status of understanding of the glaciers and hydrology
of the mountains of South and Central Asia and the role played by glaciers in determining the volume
and timing of stream flow from these mountains.
(ii) The development of methodologies to provide realistic estimates of the historical contribution of ice
melt to the flow of the rivers originating in the Nepal Himalaya, as well as evaluate the potential
changes in the timing and volume of stream flow in these rivers with both increases and decreases in
the contribution of snow- and ice-melt.
(iii) The assessment of potential variations in stream timing and volume resulting from projected CMIP5
climate change scenarios.
An emphasis is placed on those concepts and methodologies that may be of most use in the continuing
assessments of water resources planning and development in the complex Himalayan environments. For this
study, the hydrological and glaciological environments of the mountain basins are considered linked by simple
gradients describing the variation of water and energy exchange with altitude in mountain catchment basins. The
meso-scale models developed as a result of this study are designed to reflect a fundamental characteristic of
mountain ranges or regions—virtually all properties and processes vary with altitude. At the same time, the bulk
of the data available for these mountains or regions are commonly gross aggregate means, obtained from lowland
stations or, more recently, from ‘down-scaling’ of GCMs. The methodologies discussed here are designed to
disaggregate available data sets, and to reflect the altitudinal gradients that define the mountain hydrologic
regime. They are designed to provide estimates of the hydrology and glaciology of mountain regions with data
that are, for the most part, readily available from the general literature. The critical variables in the methodologies
developed from this study are:
The surface area of both basins and glaciers.
The area-altitude distribution (= hypsometry) of glaciers, or glacierized portions of basins.

13
The equilibrium line altitude (ELA) of glaciers.
The slope of the ablation gradient for the glaciers.
The mean summer altitude of the 0°C isotherm, and the altitudinal range through which it moves
annually.
2.2. The Problem
The glaciers of the mountains of Asia have been the subject of sporadic study since at least the mid-1800s,
primarily by expatriate scientists. Most Asian glaciers have been retreating during this period, and it has been
generally assumed that without a major shift in the global climate, the existing glaciers will be largely gone within
a century, or so. Recent concerns that this retreat will cause the rivers of Asia to become intermittent (IPCC, 2007),
or will result in a period of unprecedented flooding, followed by severe drought (Rees and Collins, 2004; World
Bank, 2005) has led to an increase in studies designed to assess the potential impact of this retreat on the rivers of
the region.
Several approaches have been used in these studies to estimate the potential impacts of climate change on
glaciers, and of the resulting impacts of glacier retreat on mountain runoff. All have been based on the use of
satellite imagery, data from various sources, and differing conceptual approaches. The scale of these approaches
has varied from downscaled climate data derived from GCMs combined with MODIS or GRACE satellite imagery to
intermediate-scale Landsat and ASTER imagery combined with available climate and hydrologic data from ground-
based monitoring. Conceptual approaches have generally been those of traditional climate and engineering
hydrology, combined with glacier models developed for the European Alps, and involving a reliance on statistical
analyses. Regardless of scale or conceptual approach, most recent studies have provided estimates of the
potential impact of glacier retreat on stream flow volume and timing resulting from climate change, but have
provided no procedure for separating the resulting runoff into the water budget components of glacier melt, rain
or snow melt in the basins studied.
Hydrology, glaciology and climatology are primarily field sciences, dependent upon empirical data for their
analyses. Relating glacier runoff to glacier dynamics requires measurement of both the glacier mass balance and
resulting stream flow at a glacier terminus in order to quantify the interrelationships. No studies of this problem
within the Asian mountains have been found in the literature. At least for the near term, the extreme
inaccessibility of a majority of the glaciers of Asian mountains makes the availability of such definitive studies of
this relationship highly unlikely. To compensate for this lack, a range of scales, procedures, data sources and
assumptions have been used in the recent studies of the climate-glacier-runoff interrelationships in the mountains
of Asia. These studies have resulted in a range of findings, but a general consensus is today that the disappearance
of the glaciers, if it happens, will not be as catastrophic as projected by the earlier studies.
The primary problem remains the development of solutions to the water planning and management needs
of the countries of Asia dependent upon the mountain water. Traditional engineering approaches to the
estimation of water supply in the lowlands adjacent to the mountain basins should be sufficient. The extreme
topography and climate of the mountains basins pose a problem for the development of water resources within
the mountain basins, such as hydroelectric reservoirs, and will require more detailed study and monitoring. This is
the challenge for both the countries of the region and the development assistance community that provide much
of the support for these activities.

14
2.3. Scale and Location in Mountain Hydrology
In considering scale as a factor in hydrological studies, it has been held by Klemes (1983) that
“(…) levels of scale at which a meaningful conceptualization of physical
processes is possible are not arbitrary and their range is not continuous.
Formulations appropriate at a given level usually are not applicable at the
immediately adjoining levels. This is seen as one of the important reasons for the
slow progress of hydrological science on basin scale.”
The scale of this study is that of the gauged sub-basins of the high mountains of Asia, and of the glaciers that
are located within them. For the purposes of this assessment, the glaciers of each basin are treated as a single
geographic component of the hydrology of these basins, rather than as individual glaciers as is the more common
approach for glacier mass balance studies. It is to be expected that the glaciers of a catchment basin will vary in
terms of topographic factors other than altitude, such as aspect. This may produce local variations in factors such
as the ELA, or the ablation gradient among the glaciers in the basin. Values in this study are considered to be an
average for any variability that is present within basins. Here, the emphasis is on the hydrologic output of the
glacier, and only secondarily with the mass balance measurements that would be required for a standard
glaciological assessment of the glacier’s ‘health’.
General models and GCMs with a resolution of 100-200 km, a common tool of climate change evaluations,
are clearly at a scale several orders of magnitude larger than that necessary to define the temperature or
precipitation field over a typical mountain glacier. Even ‘downscaled’ data from a GCM will still have a resolution
of c. 50 km. For mountain hydrology or glaciology, most problems are at an intermediate, meso-scale, of the
gauged catchment basin, with a scale of meters, rather than kilometers. The regional, macro-scale, approach
substitutes a satellite image of the area of the snow cover of a mountain range, for the water equivalent depth of
this snow cover. In this case, the analyst is left with a single mean value to describe the complex, three-
dimensional mountain catchment environment as either a one dimensional point, or a two-dimensional plain. This
approach is typical of the statistical, ‘black box’ hydrologic models in general use today. While they generally
produce useful values for planning and management purposes, they cannot quantify the various components of
stream flow such as glacier melt water. After Klemes (1990), to do this requires combined hydrologic-glaciologic
models:
“(…) mountain hydrology modeling makes painfully obvious (…) the importance
of areal mapping of hydrological and other geophysical variables and the
inadequacy of the traditional point measurements which are the legacy of the
century old technology (…).”
The primary locations of this study are those of the hydrometric stations and of the glaciers that are
separated horizontally by tens of kilometers and vertically by thousands of meters. At the terminus of the glacier,
a maximum percentage of stream flow is a result of glacier melt. As this distance increases, the glacier

15
contribution is diluted by other sources of input, such as snow melt or rain fall. Seen in this context, it is easier to
understand why recent statements that some fixed percentage of the volume of flow of a given river is the result
of glacier melt may contain substantial error.
2.4. The ‘Pamir-Karakoram Anomaly’
Virtually all recent assessments of glaciers and stream flow in the mountains of Asia have been based on an
assumption of retreating glaciers throughout the region. Hewitt (2005), however, has pointed out that the glaciers
of the Karakoram Mountains, immediately south of the Pamirs, may be advancing. Hewitt (2005) referred to this
as the ‘Karakoram anomaly’ that, he suggested, is produced by the extremely high altitudes of the glaciers and
perennial snowfields of the Karakoram Mountains, or what he called the ‘elevation effect’. A similar situation has
been described for the Pamir glaciers (Gardelle et al., 2013), who suggested that it be renamed the ‘Pamir-
Karakoram anomaly’. Very recently, a study in the Nepal Himalaya by Bajracharya et al. (2014) showed a decrease
in glacier surface area during recent decades, while a comparable study in the adjacent Indian Himalaya by
Bahguna et al. (2014) showed no significant retreat during the past twenty years, with a small number advancing.
While a majority of the earth’s glaciers are indeed retreating, the anomalous glacier activity in the
Karakoram and Pamirs and the lack of a consensus on the glacier activity in the Himalaya present an additional
complication to the already complex problem of predicting the future of these glaciers, or of the impact of the
glaciers on future stream flow in the rivers of the region. In these circumstances, it is reasonable to suggest that a
primary goal could be a continuation of the development of methodologies to evaluate the glacier hydrology of
Asian mountains, and expanded monitoring programs to provide the information necessary to drive these
methodologies.

16
3. PREVIOUS STUDIES AND UNCERTAINTY
3.1. Previous Studies
Glaciological studies in the Pamir and Tien Shan mountains begun during the second half of the 19th century
and were initially undertaken by geographers, geologists, and botanists like A.P. and B.A. Fedchenko, I.V.
Mushketov, V.F. Oshanin, G.E. Grum-Grzhimailo, and V.I. Lipskiy. The first systematic data on the glaciers were
obtained by N.L. Korzhenevskii, who began studying them in 1903 and published the first inventory of Central
Asian glaciers in 1930. Field studies conducted during the Soviet-German expedition of 1928 and later during the
Tajik-Pamirian expedition of the USSR Academy of Sciences from 1929-1932 resulted in the compilation of a
topographic map of the alpine area of the Central Pamirs, a region previously unknown. The expeditions also
resulted in the discovery of the highest peak in the USSR, Communism Peak (7,495 m a.s.l.; Pik Kommunizma, now
named Pik Imeni Ismail Samani), and the describing of numerous glaciers on many Pamirian ranges. During the
Second International Polar Year (1932-1933), the primary glaciological studies were concentrated around the area
of Fedchenko Glacier (Lednik Fedchenko). Here, at an elevation of 4,200 m a.s.l., an observatory was constructed
and repeated phototheodolite surveys of the Tanymas group of glaciers and Fedchenko Glacier were carried out
(Committee of the Second International Polar Year, 1936a).
During the post-World War II years, complete aerial photography of the area was acquired, and the
compilation of a large-scale topographic map was completed. Using these data, Zabirov (1955) compiled an
inventory of glaciers of the Pamirs that lists 1,085 glaciers longer than 1.5 km, covering a total area of about
8,041 km2. Since 1962, the Institute of Geography at the USSR Academy of Sciences (now the Russian Academy of
Sciences) has been responsible for investigations of Pamirian glaciers. From 1968 to 1978, it carried out a series of
comprehensive field studies connected to the inventorying of glaciers. The new glacier inventory of the Pamirs and
the Alai Range (Alayskiy Khrebet) was compiled on the basis of interpretation of aerial photographs
complemented by analysis of space images (e.g., Dreyer et al., 1982; Kotlyakov, 1978). General reviews of the
glacier problems and literature reviews have been produced (e.g., Kotlyakov, 1978; Konovalov, 2011; Savoskul and
Smakhtin, 2013; Kayamov, undated). While the Russians stream gauging network was abandoned with the
collapse of the Soviet Union at c. 1990, there are historical records available for the period c. 1965-1990 for an
estimated ten hydrometric stations in glacierized basins of the Pamirs (GRDC, 2013), with data comparable in
duration to that used in recent studies of the Nepal Himalaya and Karakoram (World Bank, 2010; World Bank,
2011; DHM, 1988; WAPDA, unpublished).
Studies of glaciers as a component of stream flow from the high mountains of Asia were relatively rare until
the IPCC stated in 2007 that the disappearance of the glaciers of the Himalaya by 2035 would lead to the Indus
and Ganges rivers becoming intermittent. Following this assertion, that has since been withdrawn, a number of
studies of the hydrology of the Hindu Kush-Himalaya Mountains were undertaken to define the relationships
existing among climate, glaciers, snowmelt and stream flow in the headwater catchment basins, and to evaluate
the role of glaciers in the stream flow of Asian rivers (e.g., Rees and Collins, 2006; Alford, 2010; Immerzeel et al.,
2010; Kaser et al., 2010; Alford et al., 2011; Racoviteanu et al., 2013). Much of this work has been based on the
use of digital elevation models (DEMs) and satellite imagery, and the extrapolation of concepts from North
America and the European Alps (e.g., Haefli, 1964; Ohmura, 2001). It is now generally accepted that the role of
snow and glacier melt in determining stream flow volume from the mountain basins along the southern margin of

17
the Tibetan Plateau is generally less important than previously had been suggested by the IPCC (2007), and that
this role increases from east to west as the influence of the southeast summer monsoon in the Nepal and Indian
Himalaya is replaced by winter westerly lows in the Karakoram (e.g., NRC, 2012).
Studies of postulated climate change and stream flow have recently begun in the headwaters of the Amu
and Syr Darya in the Pamir and Tien Shan mountains (e.g., Savoskul et al., 2003; Wagner and Hoelzle, 2010; Hagg
et al., 2011; Chevalier et al., 2012; Immerzeel et al., 2012; Klemm and Hagg, 2012; Hagg et al. 2013). For the most
part, these studies are similar to early studies of the relation between climate and glaciers of the Nepal Himalaya,
primarily a review of the literature, with statistical analyses of mean temperatures and terminus retreat used as a
proxy for stream flow and the impact of climate change. Most have followed the procedure represented by the
‘U.B.C. Watershed Model’ (Quick and Pipes, 1977), treating the glacierized basins as ‘black box’ problems,
represented by gross aggregate mean of precipitation, temperature, and runoff. A few glacier studies in the Pamir
and Tien Shan mountains (Aizen and Aizen, 1992; Aizen et al., 1996, 1997) have involved studies of glaciers,
climate, and stream flow from a basis of the area-altitude distribution of each. General reviews of the glacier
problems and literature reviews have also been produced (e.g., Kotlyakov, 1978; Konovalov, 2011; Savoskul and
Smakhtin, 2013; Kayamov, undated).
The approach described by Immerzeel et al. (2012) will ultimately produce forecasts of stream flow volumes
from the mountain basins similar to those produced by the UBC model, but will not distinguish between snow and
glacier runoff, an essential factor in any assessment of the potential impact of climate change on the respective
roles of snow and glaciers in stream flow formation, or for the development of engineering models for project
design and management at the sub-basin scale. Studies of the hydrology of the Nepal Himalaya and upper Indus
Basin (Alford, 1992, 2009, 2010) suggested that the relative contribution of snow and glacier melt could be
separated using hydrograph analysis, and varied measurably among basins considered studied. Racoviteanu et al.
(2013) evaluated the methodology used in the Nepal Himalaya study and found that, while the results from the
earlier studies were modified slightly by the use of more precise data inputs, they were generally correct.
3.2. Uncertainty
Much has been made of ‘uncertainty’ in assessing the nature of the Himalayan environment (e.g., Thompson
and Warburton, 1985; Bolch et al., 2012). With respect to the high mountains of Asia, the term, and concept,
originated with Thompson and Warburton as ‘Himalayan Uncertainty’, and referred primarily to results of
socioeconomic studies conducted in the Nepal Himalaya by individuals defined as ‘bean counters’ (without
elaboration). Bolch et al. (2012) used the term to refer specifically to the proliferation of conflicting estimates of
glacier surface areas for the Himalaya.
Describing uncertainty in a study is not an easy task, and communication issues exist across disciplines.
Rauser and Geppert (in review) define as follows:
“In a very simplistic and basic understanding, uncertainty characterizes the
degree to which we trust a scientific statement.”
According to these authors,

18
“(…) explicit uncertainty arises from sources of imperfections in our
understanding and our description of Earth system components that we are
actually aware of […while…] implicit uncertainty’ arise from processes and
properties of the Earth system that we do not (yet) know. [It is] the difference to
the infinite amount of potential processes in reality that we cannot cover with
our modeling.”
As the authors further explain, explicit uncertainty might origin in errors from, for examples, instrument
calibration, data conversion, or limited measurement resolution; it can be described quantitatively or qualitatively
as it describes the known unknowns. On the other hand, implicit uncertainty cannot be quantified as it describes
the unknown unknowns. Rauser and Geppert (in review) conclude that
“All authors of climate change papers should make very clear and explicit as to
what they think the type and characteristics of their uncertainty is, to make sure
that our growing body of knowledge of the Earth system is not blemished by
misconceptions of what we know—and what we do not know.”
In our study, uncertainty is assumed to result from
The need to introduce approximations as proxies for the very complex physical processes involved in
water and energy balance processes of hydrology and glaciology.
A lack of empirical measurements of the hydrological and glaciological variables used to drive the
analyses.
Differences in surface area measurements resulting from satellite imagery and mapping methodology
employed.
The temporal and spatial variability of the glacier and hydrological environments being studied.
Some explicit uncertainties in our study are:
The internal vertical error of the SRTM digital elevation model data has been put at up to 16 m (Jarvis et
al. (2008).
The error in delineating glaciers for estimating the glacierized area using band ratios from Landsat
satellite imagery has been put at ±2% (e.g., Paul et al. 2003; Bolch and Kamp 2006; Bolch et al. 2010).
In our accuracy assessment, we tested the impact of an error in the measurement of the glacierized area
on the glacier melt runoff: a 10% error in estimating the glacier ablation surface area would result in a
10% change in glacier melt water at the glacier terminus, which itself would then result in a change in
runoff of 2-3% at the confluence of the Panj and Vakhsh rivers and of 1% in the Lower Aral River. While
this is not an unreasonable estimate, it assumes that the location of the ELA is known with considerable
precision. But every cryosphere scientist knows about the various methods and their uncertainties in

19
calculating the ELA. (It is important to mention that in our study, we calculated the total runoff as a sum
of all runoffs from individual glaciers).
Some other uncertainties in our study are:
The error in the estimates of the accumulation zone area. While this does not enter into runoff
estimates, it is a factor in estimates of the steady-state equilibrium as an element of the climate change
estimates. However, the ablation gradient was not intended to provide annual values of mass gain or
loss.
The error in defining the ablation gradient value. There is no field data available from the mountains in
Asia on which to base an error estimate. We used a gradient of 10 mm/m. Also for the Pamirs, Hagg et
al. (2011) used 9 mm/m and Gardelle et al. (2013) used 10 mm/m.
The error in estimates of precipitation. Precipitation data are needed in estimating snowmelt runoff, but
the availability of climate data is poor for the Pamirs.
The error in estimates of runoff. In the study area, stream flow measurements ceased in 1989 with the
collapse of the Soviet Union; prior to that, we had observed in the field that all gauging stations were
cableways over uncontrolled cross sections.
There has always been an unstated sense among many undertaking biophysical studies in the Asian
mountains that the existing data bases of climate and stream flow may contain errors, and there are many other
errors than the ones listed above in any study of mountain hydrology. Many are a result of limited studies, and
some result from the fact that the mountain water and energy budgets are not quite the same as those of the
lowlands. However, analyses of these available data sets have shown that in general they present a clear and
consistent picture of the elements of the physical environments they describe (e.g., Bruijneel and Bremmer, 1989;
Alford, 1992; Archer and Fowler, 2004; Alford et al., 2009). In our study, some errors are the result of the fact that
we are involved with research that is looking for a substitute for the traditional ‘black box’ or canned-
software models that cannot differentiate among the various stream flow-generating components within the
mountain basin.
3.2.1. Mapping Uncertainties
To illustrate the ‘uncertainty’ in stream flow modeling studies, we here describe exiting issues in carrying out
the first two steps: calculating the catchment basin area and the glacierized area.
Both Wagner and Hoelzle (2010) and Klemm and Hagg (2012) use identical areas for the Amu Darya, Panj
and Vakhsh basins, however, without mentioning their source (Table 2). We mapped the areas of all basins and
sub-basins ourselves from Landsat 5 satellite imagery and the SRTM DEM and received higher numbers. The
problem is that using differing basin areas in the first place might produce differing glacierized areas that then are
used as input data for the stream flow modeling. It is also worth mentioning that mapping catchment basins is not
as easy task: when we analyzed watersheds from the SRTM DEM, the result was a flow of streams in the Upper
Gudara Basin westward into the Lower Gudara Basin. However, from our field experience and the literature we

20
know that these streams actually drain eastwards into Kara Lake. Therefore, we manually had to correct the
watershed delineation and excluded the Upper Gudara Basin from our analysis. The error in watershed delineation
probably resulted from the internal vertical error in SRTM data of up 16 m (Jarvis et al. 2008).
Table 2. Areas of the Amu Darya Basin and selected sub-basins from selected references (see Figure 1 for location and naming of sub-basins).
Reference
Source Data Basin Area (km2)
Type Year Model Amu
Darya
Upper
Amu
Darya1
Panj Upper
Panj2
Vakhsh Upper
Vakhsh3
Wagner and Hoelzle (2010) ? ? ? 143,100 --- 114,000 --- 39,100 --- Klemm and Hagg (2012) ? ? ? 143,100 --- 114,000 --- 39,100 --- This Study Landsat 5 + SRTM DEM 2009-11 vector 158,211 81,794 118,330 61,484 39,880 20,310
1 The Upper Amu Darya basin excludes the Lower Panj and Lower Vakhsh basins, and the Upper Gudara basin that drains internally into Lake Kara. 2 The Upper Panj basin includes seven sub-basins but excludes the Lower Panj basin and the Upper Gudara basin that drains into Lake Kara. 3 The Upper Vakhsh basin includes three sub-basins but excludes the Lower Vakhsh basin.
Furthermore, no general agreement on the areal extent or surface area of Pamir glaciers exists: the total
surface area of glacier ice in the Pamirs has been estimated at between 7,116 and 16,000 km2 (Table 3). For
example, the latter is number has been presented by Immerzeel et al. (2012) who apparently did not distinguish
between glaciers and the perennial snowfields that border them.
Table 3. Glacierized area in the Pamir Mountains from different sources.
Reference Glacier Area (km2)
Immerzeel et al. (2012) 16,000 Dyurgerov and Meier (2005) 12,260 Von Wissman (1959) 11,738 USGS (2010) 10,200 Zabirov (1955)
1 8,041
Kayumov (undated) 8,000 Kotlaykov and Varnakovas / USGS (undated, recently) 7,500 UNESCO (1998) 7,116 1 Zabirov (1955) mapped only glaciers longer that 1.5 km.
Similar mapping issues surface after a review of databases and studies on glacier coverage in the Amu Darya
Basin (Table 4).
Table 4. Glacierized area within the Amu Darya Basin and selected sub-basins from studies discussed in the text.
Reference Source Data Glacierized Area (km
2)
Type Year Model Amu
Darya Upper Amu
Darya1
Panj Upper Panj
2
Vakhsh Upper
Vakhsh3
WGI4 aerial, maps 1940s-1960s Point/Circle 7,588 3,913 3,675

21
GLIMS5 various 1960-2004 Vector 3,008 2,905 1,055 1,003 1,953 1,914
RGI6 various ? Vector 9,914 8,568 5,513 4,730 4,401 3,838
Wagner & Hoelzle (2010)7 GLIMS; own mapping 2000-2003 Vector 6,991 3,592 3,399
Lutz et al. (2013) GLIMS; own mapping ? Vector 10,289 --- ---
This Study Landsat 5 TM 2009-2011 Vector 11,664 10,258 6,889 6,083 4,776 4,176
Raster 11,887 10,461 6,960 6,043 4,928 4,307
1 The Upper Amu Darya Basin excludes the Lower Panj and Lower Vakhsh basins, and the Upper Gudara Basin that drains internally into Lake Kara. 2 The Upper Panj Basin excludes the Lower Panj Basin and the Upper Gudara Basin that drains into Lake Kara. 3 The Upper Vakhsh Basin excludes the Lower Vakhsh Basin. 4 World Glacier Inventory; as presented in Wagner and Hoelzle (2010). It is not clear if the areas are representative for the entire Amu Darya Basin or only the Upper Amy Darya Basin.
5 Global Land Ice Measurements from Space.
6 Randolph Glacier Inventory. 7 It is not clear if the areas are representative for the entire Amu Darya Basin or only the Upper Amu Darya Basin.
The WGI puts the glacierized area at 7,588 km2; data are retrieved from maps and aerial photographs from
the 1940s to 1960s. The inventory contains only point and circle data, i.e. only the area for individual glaciers
rather than exact glacier shape polygons. The glacier data from the Global land Ice Measurement from Space
(GLIMS) initiative are still incomplete and total to only 3,008 km2 of glacierized area in the Amu Darya Basin and to
only 2,905 km2 in the Upper Amu Darya Basin. Some of the source material dates back to 1960. The Randolph
Glacier Inventory (RGI) contains 8,568 km2 of glacierized area in the Upper Amu Darya Basin. Since RGI is a
database that was merged from other existing inventories, information about the data type and source year is
lacking. Both GLIMS and RGI data sets include debris-covered glaciers. Wagner and Hoelzle (2010) used data from
the World Glacier Inventory (WGI) from the 1940s-1960s, and from GLIMS and additional manual mapping using
sources from 2000-2003; they put the glacierized area at 7,588 km2. Unfortunately, Wagner and Hoelzle (2010)
missed to deliver additional important information about the glacier mapping approach and the extent of their
own mapping. This is also true for Lutz et al. (2013), who used a RGI version 2.0 dataset that had been manually
updated by a GLIMS expert; they calculated a glacierized area of 10,289 km2.
Owing to the uncertainty issues with data from available glacier inventories, we mapped the entire
glacierized area in the Amu Darya Basin (excluding the upper Gudara) using Landsat 5 TM satellite imagery from
2009-2011, following a GLIMS-approved methodology with a mapping error of ±2% (e.g., Paul et al. 2003; Bolch
and Kamp 2006; Bolch et al. 2010). In the entire Amu Darya Basin, glaciers and ice cover 11,887 km2; in the Upper
Amu Darya, it is 10,461 km2. We used the latter number in our hydrologic analyses, since no stream-gauging
stations exist in the Lower Panj and Lower Vakhsh. A downside of the employed mapping approach is that it does
not allow for identifying debris-covered ice. However, based on personal communications and existing travel
reports, we assume here that the debris-covered glacier area is relatively small. Consequently, all glacier areas and
hypsometries, stream flows, and other data produced by our study represent only minimums leading, without
doubt, to some uncertainty. However, by utilizing GLIMS mapping approaches both Lutz et al. (2013) and we
calculated almost identical glacierized areas (it is assumed that also Lutz et al. 2013 mapped only clean-ice).
The following comparison is a good example for demonstrating the differences in glacier inventories and
mapping approaches. The GLIMS database lacks coverage in the Muksu Basin due to a missing flight pass and in
the southern range that separates the Shidz Basin from Afghanistan (Figure 2a). While the RGI shows higher
glacier coverage in the Muksu Basin than GLIMS does, also RGI shows no glacier coverage in the range that
separates the Shidz Basin from Afghanistan (Figure 2b). Our study presents a larger total glacierized area than

22
both GLIMS and RGI, because we calculated larger areas for many individual glaciers and identified additional
glacierized mountain ranges—for example, the Wakhan Corridor that separates the Shidz Basin from Afghanistan
(Figure 2c). Glaciers in the Wakhan Corridor can be identified already during a first visual inspection (Figure 2d).
Figure 2. Comparison of glacierized area in the Amu Darya Basin derived from three different sources: (A) Global Land
Ice Measurements from Space (GLIMS) inventory including data from 1960-2004; (B) Randolph Glacier Inventory (RGI)
including data from an unknown time period; (C) this study that utilized (D) Landsat 5 TM satellite imagery from 2009-
2011. The red boxes show two examples for differing mapping results. Upper box: the GLIMS inventory (A) and the RGI
(B) present very different glacier coverage. Lower box: only the band ratio approach used in this study (C) mapped the
glaciers in the Wakhan Corridor that separates the Shidz Basin from Afghanistan.
3.2.2. Scenario Uncertainties
Recent studies of the potential impact of climate change on the glaciers and stream flow of the Amu Darya
mountain basins have generally involved analyses of (i) macro-scale hydro-meteorological data, based on the use
of macro-scale GCM projections and MODIS satellite imagery to measure glacier extent (Immerzeel et al., 2012), or
(ii) GCM models and stream flow measurements to project future stream flow volumes, based on World Climate
Research Programme's (WCRP's) Coupled Model Intercomparison Project phase 3 (CMIP3) to assess climate
changes in the Tien Shan Mountains, with some limited extrapolation to the Pamirs (Siegfried et al., 2013). Both

23
the approaches of Immerzeel et al. (2013) and Siegfried et al. (2013) are plausible empirical engineering ‘black
box’ stream flow forecast models, driven by aggregate means of the pertinent climate variables, and can be
expected to produce results reflecting the reliability of the data and climate scenarios used.
Other approaches to the problem of climate change and stream flow specifically focused on the Amu Darya
basins are those by Chevalier et al. (2012) and Hagg et al. (2012). Both focus on basin-scale analyses of the
relationships of snow cover, glaciers and stream flow, and both project a shift to an earlier onset of the spring
runoff and a decrease in the late summer runoff, resulting from decreased stream flow from retreating glaciers
that supply all of the late summer runoff. Their primary drawback is that both are focused on a limited sample of
basins in the upper Amu Darya headwaters, and are therefore difficult to extrapolate to the entire upper basin.
The study by Chevalier et al. (2012) used data from basins with headwaters in the northern Pamirs, the most
humid portion of the entire Amu Darya Basin. The study by Hagg et al. (2012) is based on a single basin (Gudara
Basin) that is typical of the extreme aridity of basins in the southern Pamirs, with a portion of the catchment area
east of the main Pamirs.
As a result of the employment of very differing (assumed) input data sets and scenario modeling
approaches, resulting numbers for glacier changes and runoff vary widely making comparisons impossible (Tables
5-8). For the Panj and Vakhsh basins, Wagner and Hoelzle (2010) assumed a temperature increase of 2°C from
2003 to 2050 reducing the glacier volume by between 75.5% and 53%, respectively, which then leads to an
increase in total runoff owing to higher volumes from the melting glaciers. In contrast, for the larger Amu Darya
and Syr Darya basins, Immerzeel et al. (2012) calculated a decrease in total runoff of between 22% and 35% from
2010 to 2050.
Table 5. Results for basin area, glacierized area, runoff and projected changes from
2003 to 2005 in the Amu Darya Basin after Wagner and Hoelzle (2010).
Panj Vakhsh
(km2) (%) (km
2) (%)
Basin Area 114,000 --- 39,100 --- Glacierized Area 2003 3,592 3.2 3,399 8.7
Change from 2003 to 2050*
Glacier Volume --- −75.5 --- −53.0 Total Runoff --- increase --- increase
* Assumed temperature change: +2.0°C.
Table 6. Results for basin area, glacierized area, runoff and projected changes from 2010 to 2050 in the Amu Darya and Syr Darya
basins after Immerzeel et al. (2012).
Amu Darya & Syr Darya Amu Darya Syr Darya
(km2) (%) (km
2) (%) (km
2) (%)
Basin Area 2,000,000 (?) --- 800,000 (?) --- 1,200,000 (?) --- Glacierized Area c. 17,800 0.9 c. 16,000 2 c. 1,800 0.15 Glacier Melt Runoff --- --- --- 38 --- 11 Snowmelt Runoff --- --- --- 27 --- 35 Rain Runoff --- --- --- 35 --- 54
Change from 2010 to 2050
Glacierized Area --- −53 --- --- --- ---

24
Total Runoff --- --- --- −26 to −35 --- −22 to −28
Table 7. Results for basin area, glacierized area, runoff and projected changes from 2003 to 2050 in two smaller
sub-basins within the Amu Darya Basin after Klemm and Hagg (2012).
Abramov (in the Panj) Kudara (in the Vakhsh)
(km2) (%) (km
2) (%)
Basin Area 55.5 --- 1,575 --- Glacierized Area 28.3* 51 520** 33
Change from 2003 to 2050***
Glacierized Area --- −49 to −99 --- −18 to −45 Total Runoff --- +20 to +33 --- +0.5 to +15 * In 1986.
** Source year unknown.
*** Assumed temperature change: +1.8°C (first number) and +2.8°C (second number).
Table 8. Results for basin area, glacierized area, runoff and
projected changes from 1985-89 to 2050 in the Rukhk sub-
basins within the Amu Darya Basin after Hagg et al. (2013).
Rukhk (in the Panj)
(km2) (%)
Basin Area 4,306 --- Glacierized Area 431 10 Glacier Melt Runoff --- 32
Change from 1985-1989 to 2050*
Glacierized Area --- −36 to −45 Total Runoff --- −5 Glacier Melt Runoff --- −11 to −8
3.2.3. Conclusion
Clearly, there is no consensus on the amount of glacier ice at the headwaters of the Amu Darya, a very
fundamental factor in any attempt to assess the potential impact of their retreat on the water resources from the
rivers. Some of the reasons for these discrepancies are: differing definitions of the ‘Pamirs’; incomplete
inventories; inventories containing merged data of different quality; differing definitions of ‘glacier’ and what is
mapped in the first place; and differing glacier mapping methodologies. Without doubt, an erroneous glacierized
area would negatively impact all following steps in modeling past, present, and future stream flows. We,
therefore, conclude that (i) caution is necessary when simply downloading and using data from existing glacier
inventories or when merging data without communicating what exactly has been done; and (ii) if experts carry out
the glacier mapping, very similar results can be re-produced.
Furthermore, it is reasonable that the glacierized area is only a single example of the lack of an organized,
generally available data set describing the baseline conditions of climate, stream flow, and glacier mass balance
characteristics. Without such a data set, operational forecast modeling is probably not possible. Solutions to this
problem are, for example, the allocation of stream-gauging data for the Lower Panj and Lower Vakhsh basins,

25
which would prevent their exclusion from the analysis, or the application of the morphometric glacier mapping
(MGM) approach after Bolch and Kamp (2007) that—while being more time-consuming—allows for identifying
debris-covered ice.

26
4. METHODOLOGIES AND DATA
This assessment of the role of glaciers in the stream flow of the Amu Darya and Syr Darya was based on
three primary databases:
(i) Basin and glacier surface areas and hypsometries (area-altitude distribution) derived from Landsat 5
TM satellite imagery and SRTM DEM data.
(ii) Stream flow records for the mountain catchment basins from the Tajik Department of Hydrology and
Meteorology and from the Global Runoff Data Centre, Koblenz, Germany.
(iii) Glacier data describing the equilibrium line altitude (ELA) and the ablation gradient taken from the
literature.
4.1. Basin and Glacier Area and Hypsometry
Mapping glacier extent has always been a challenge. To begin with, there is often not even an agreement on
the area extent of the river basins under investigation, and as a result variations exist in available data for glacier
coverage. This is partly due to the fact that there is no single definition of the Pamir Mountains and their
boundaries. Specifically with regard to the mountains of the Amu Darya Basin, the problem of glacier surface area
has had an impact on the results of most recent studies, as well as the unresolved question of whether or not
General Circulation Models (GCMs) are useful for glacier-related studies.
The individual catchment basins (entire Amu Darya and Syr Darya basins and sub-basins) were determined
using the 90-m SRTM DEM; their boundaries were delineated using the ‘Watershed’ tool in the ‘Hydrology’ toolset
of Spatial Analyst Tools in ArcMap 10.01. The derived watersheds were then converted to vector polygon shape-
files, and basin surface areas were calculated. This process of converting raster into vector data comes with a
change of area (km2), because the software draws the catchment polygon by ‘cutting through’ each individual
square raster pixel, i.e. the sub-pixel area outside of the polygon line is excluded from further analysis when using
vector data. As a result, the raster-derived area is always larger than the vector-derived area. Glacier inventories
such as that of GLIMS contain glacier outlines as polygons that represent vector data. When such glacier polygons
are draped over raster data, for example, satellite imagery or SRTM DEM, and area–altitude distributions are
calculated, the vector data are converted back to raster data.
This study utilized imagery (L1T product) from Landsat 5 from 2009-2011 (one scene is from 2000). Landsat
5 was launched in 1984 and was recently decommissioned on June 5, 2013. The L1T product provides radiometric
and geometric corrections based from ground control points or a SRTM DEM (Bolch et al., 2010). Landsat imagery
has been extensively and successfully used in glacier mapping and monitoring studies, particularly for band ratio
analysis and land cover classification. Landsat 5 carries the Thematic Mapper (TM) and Multi-Spectral Scanner
(MSS); however, the MSS was powered down in 1995. A Landsat 5 TM image covers an area of 170 x 185 km2 and
comes at 30 m spatial resolution for bands 1-5 and 7, while the thermal band 6 has a spatial resolution of 120 m.
For this study, Landsat 5 TM imagery was selected based on the following criteria: date availability; end of melt

27
season (all scenes are from either August or September except one from early October); percent of cloud cover (in
all scenes <5%); and atmospheric noise. Scenes were downloaded free-of-charge from the USGS imagery archive
(USGS Earth Explorer website: http://earthexplorer.usgs.gov/).
In our study, the glacier surface area and glacier hypsometries were determined for the compound glaciers
of the gauged catchment basins rather than for individual glaciers, as is more commonly the case. This was done in
order to facilitate the comparison of calculated glacier melt volumes with measured stream flow volumes. At a
very fundamental level, this has involved development of a definition of what constitutes a glacier in the Pamirs. In
the upper portion of the accumulation zone, the large glaciers of these mountains merge with the perennial
snowfields to form a continuous snow-covered high altitude surface. The debris cover of the lower portions of the
ablation zone of many glaciers merges with terminal, lateral, and medial moraines, making the identification of
glacier ice difficult in most imagery. At the lowest altitudes, periodic snow depositions make the precise location
of the terminus problematical.
Most of the glaciers in the Pamirs and western Tien Shan are debris-free, clean ice glaciers. Clean glacial ice
has a distinct spectral signature, with uniqueness in the visible and near-infrared part of the electromagnetic
spectrum, which makes it relatively easy to map debris-free glaciers. Snow and ice are characterized by high
reflectivity (albedo) in the visible wavelengths (0.4-0.7 μm); medium reflectivity in the near infrared (0.8-2.5 μm);
low reflectivity and high emissivity in the thermal infrared (2.5-14 μm); and low absorption and high scattering in
the microwave. While in clear weather the high albedo of snow and ice make them easily distinguished from
surrounding terrain using visible infrared (VIR), optically thick clouds are also highly reflective in VIR, hence they
confound the classification. However, they are reflective in the near infrared (NIR), thus, discriminated from snow
and ice.
For more detailed information on the methodology used here in mapping catchment basins and the
glacierized areas see the Appendix.
4.2. Stream Flow
For the Amu Darya, mean monthly stream flow records for thirteen hydrometric stations in the headwater
basins of the Panj and Vakhsh tributaries to the Amu Darya were obtained from the Tajik Department of
Hydrology and Meteorology. These records are from stations established during the 1930s and 1940s, and
abandoned at the time of the end of the Soviet era, between 1985 and 1990. They are primarily cableways, with
uncontrolled cross sections. No discussion of the gauge accuracy for these stations was found in the literature.
For the Syr Darya, mean annual stream flow values for eighteen hydrometric stations in the headwater
tributaries of the Naryn Basin, Kara Basin, Alai Range and the Chirchik Basin were obtained from the Global Runoff
Data Centre, Germany. Records for mean monthly stream flow data for stations at the headwaters of the Naryn
Basin were obtained from a database maintained by the University Corporation for Atmospheric Research (UCAR),
Boulder, Colorado. These data were also from stations established during the Soviet era and were discontinued at
the end of that era. Again, no error estimate is available.

28
4.3. Water Budget
Assessments of the role of glaciers in stream flow formation in the high mountains of Asia must involve both
the hydrology of the basins, as well as that of the glaciers within those basins. This study is concerned with the
glacier melt component of the annual stream flow, so the hydrologic continuity equation describing the
relationship between the glaciers and stream flow volumes is:
Qt = R + Ms + Mi - Et ± ∆s (1)
where:
Qt : Total runoff
R: Input as rain
Ms: Snowmelt runoff
Mi: Glacier melt runoff (ablation)
Et: Evaporation
∆s: Change in storage, as snow, glacier ice, or groundwater.
In practice, there are reported instances of rainfall on the ablation zones of glaciers in the western Tien Shan
Mountains, at the headwaters of the Syr Darya. In the altitudes of the glacier ablation zones evaporation may be
assumed to be minimal, and the change in groundwater storage for the hydrologic year is assumed to be zero
(e.g., Rasmussen and Tangborn, 1976). As a first approximation, Eq. 1 reduces to a determination of the relative
importance of snow melt and glacier ablation in the regime of most Asian rivers:
Qt = Ms + Mi (2)
4.4. Glacier Ablation and Runoff
Measurements of runoff from immediately downstream from a glacier terminus in Asian mountains were
neither found in the literature nor expected. It is unlikely that such measurements have yet been made. Glacier
ablation estimates were based on net balance measurements reported for glaciers in the Himalaya and Karakoram
mountains (e.g., Fujita, 1998; Mayer, et al., 2006; Wagnon, 2007). These values ranged from 1-3 m.
4.5. Glacier Zones
Glaciers are divided into two zones, a lower ‘ablation zone’, and an upper ‘accumulation zone’. Melt water
resulting in runoff is produced primarily in the ablation zone. While there may be some melt above the ELA, the
resulting melt water will generally percolate downward in the firn and be refrozen at depth (Figure 3).

29
Figure 3. Glacier zonation (from Hewitt, 2014).
In assessing the role of glacier melt in the rivers of Asia, it is useful to remember that there is an altitude, at
c. 6,000 m a.s.l., above which snow is deposited and never melts. While many analyses of glacier melt and stream
flow in the high mountains of Asia have considered glaciers to be essentially large snow drifts, with spatially
uniform patterns of melt to the highest altitudes, they are not. These glaciers exist through a range of altitudes
from the lowest, where melt may occur continuously throughout the year, to the highest, where it never occurs.
Assessments of the role of glaciers in the stream flow of the rivers of south Asia that do not recognize this fact are
not credible.
4.6. Steady-State Equilibrium Line Altitude
Application of the ablation gradient concept for calculating measurable runoff resulting from ice melting
requires a knowledge, or estimate, of the altitude above which this runoff ceases. In virtually every large mountain
range a high amount of the annual precipitation falls during the winter months, as snow. At the lower altitudes,
this snow is transient, and is removed during each summer season, forming a major portion of the stream flow
from mountain catchment basins. At higher altitudes in most major mountain ranges, perennial snowfields and
glaciers often result. The annual altitude separating the accumulation zone from the ablation zone at the end of
the ablation period is called the firn line, while the mean of all firn line altitude is called the equilibrium line
altitude (ELA), which is considered to be a feature of the general climate. Since the firn line fluctuates annually on
the glacier, and over time, it produces a characteristic area-altitude distribution over the glacier, with the median
altitude of a glacier defining a steady-state ELA separating accumulation and ablation into zones of equal volume
(Figure 4).

30
Figure 4. Glacier steady-state equilibrium, in which annual accumulation and ablation volumes are
equal and are just balanced by a volume transfer from the accumulation zone.
It is possible to estimate the altitude of the steady-state ELA from
(i) estimates of the mean altitude of the summer-season 0°C isotherm,
(ii) from the glacier area-altitude balance ratio method as outlined by Benn and Gemmell (1997) and
Osmaston (2005), or
(iii) from median glacier altitude as determined by hypsometry.
Braithwaite and Raper (2009) stated that
”(…) the balanced-budget ELA is approximately equal to median glacier altitude,
although generally somewhat lower. Data for median glacier altitude are compiled
as part of the WGI, and ELA can therefore be estimated for those regions covered
by the inventory. If data are not available for median glacier altitude, the mid-
range altitude can be used as a less accurate proxy for ELA.”
For this study, the median altitude method was used, in conjunction with the altitude of the summer-season
0°C isotherm.
4.7. Ablation Gradient
Factors contributing to the ablation gradient vary complexly over a mountain region such as the Pamir
Mountains. Energy exchange over the surface of a mountain glacier involves a mix of short-wave and long-wave
energy sources, and the turbulent transfer of sensible heat. Short-wave solar energy is generally the dominant
source of input to the melt process, but its impact is limited to daylight hours and un-shaded surfaces. The energy
available from solar radiation is dependent upon the degree of cloudiness, and the surface albedo of the glacier—

31
the reflectivity of the ice. Clean ice reflects most of the short-wave energy it receives. Short-wave radiation
intensity varies primarily with altitude and slope aspect. As the albedo decreases with a build-up of dust or other
contaminants, the absorption of solar radiation increases. Long-wave radiation is emitted primarily by the water
vapor in the atmosphere immediately above the glacier surface at any time when the air temperature is above
0oC. Glacier ice acts as a ‘black-body’ to long-wave radiation. The long-wave energy exchange process is driven by
the relative temperatures of the ice surface and by the atmospheric water vapor content. Long-wave radiation is
largely independent of aspect, but decreases as atmospheric water vapor decreases with increasing altitude. In
practice, few of these exchange processes is measured on the Asian glaciers. A degree-day index serves as a proxy
for all sources of energy, and has proven to be useful for long-term estimates of melt, but less so for daily or
weekly values. Ohmura (2001.
In this study, the primary challenge remaining was development of a methodology that would make possible
the extrapolation of the degree-day concept to the entire melting surface of a glacier. Hock (2003) stated that
“While temporal variability of degree-day factors has received considerable
attention, it is surprising how little research has focused on the development of
spatially distributed temperature-index models specifically accounting for the
large spatial variability in degree-day factors in mountain regions, in particular in
steeply sided terrain. A reason might be that degree-day melt modeling has
traditionally been driven by the need for operational runoff modeling with primary
interest in basin runoff response and not in snow line retreat or spatially
distributed melt estimates. However, in recent years an increasing need for
spatially distributed estimates of melt rates has been identified. To cater to this
demand, while retaining simple data input requirements, distributed temperature-
index models need to be developed”.
It was in recognition of this need that lead to the development of the area-altitude distribution process
model for estimating the ablation of the glaciers of the Nepal Himalaya (World Bank, 2010). A primary attribute of
this procedure is the ablation gradient concept.
The ablation gradient—the variation of glacier melt on a glacier with altitude above the terminus—was
proposed by the Swiss glaciologist Richard Haefeli (1962) specifically to describe the response of a glacier terminus
to variations of the annual firn limit, or ELA, that marks the altitude at which the summer melt is just sufficient to
remove all of the winter snow deposit (Figure 5). Haefeli (1962) postulated that changes in the location of the
glacier terminus were primarily the result of basal sliding and an ablation gradient through the altitudinal interval
between the terminus and the ELA. He described the ablation gradient between the terminus and the firn limit as
being analogous to the air temperature lapse rate, with similar implications. According to Haefeli (1962)
“The ablation gradient is analogous to the well-known gradient of the average
annual temperature of the air. The analogous phenomenon in the ablation would
mean that the ablation gradient for a given glacier within a given climatic period
remains approximately independent of the yearly fluctuations of the firn line.”

32
Figure 5. The ablation gradient (from Haefli, 1962).
The ablation gradient concept has been described by a number of workers, however, using differing
terminology, for examples, ‘energy of glacierization’ (Shumskiiy, 1947), ‘activity index’ (Meier and Post, 1961;
Meier and Tangborn, 1965), ‘ablation gradient’ (Haefeli, 1963), ‘vertical budget gradient (VBG)’ (Kaser, 2001; Kaser
and Osmanston, 2002), or ‘mass balance gradient’ (Konz et. al, 2006). The concept has been either applied (e.g.,
Pelto, 1987, 1988) or elaborated (e.g., Tangborn, 1980; Kotlyakov and Krenke, 1982; Braithwaite, 1984). While
each of these workers places slightly different conditions on the nature of this gradient and its universality, there
is a general agreement that the slope of this gradient—defined by the net budget of a series of points spanning
the firn limit or ELA—is determined by the gradient of energy exchange processes, as they vary with altitude over
the surface of a glacier, and the duration of the annual melt period that decreases upward from the terminus to
the ELA. For any glacier it is assumed that the slope of this gradient—defined as melt/meter (mm/m)—is a
constant determined by the response of a glacier to climate variations. All workers agree that the slope of the
gradient remains constant from year to year, while the ELA moves vertically on the glacier in response to annual or
long-term variations in climate.
A primary challenge lies in assigning a value to the gradient for any given mountain region. Haefeli (1962)
proposed gradient values ranging from 0 mm/m at the Poles to 14 mm/m near the equator. Kaser and Osmanston
(2006) presented a model based on a vertical budget gradient of 20 mm/m for tropical glaciers. The value of
14 mm/m was used when applying the glacier ablation model to glacierized basins in the Nepal Himalaya (World
Bank, 2010) based largely on studies of the Yala Glacier (Fujita, 1998). Alford (2012) used 10 mm/m for the
Karakoram Himalaya based on four years of data from the Chhote Shigri Glacier in the western Himalaya provided

33
by Wagnon et al. (2007) and from the Baltoro Glacier in the Karakoram provided by Mayer et al. (2006). Long-term
ablation losses for glaciers in the Himalaya, Karakoram and Pamir mountains based on analysis of satellite imagery
yielded values ranging from 5-10 mm/m. For the Pamirs, Gardelle et al. (2013) used 10 mm/m, and for their study
of the Tanimas glaciers in the Pamirs, Hagg et al. (2012) used 9 mm/m. Racoviteanu et al. (2013) found that
variation of the ablation gradient exists in a region like the eastern Himalaya, but that a regional average of
8 mm/m based on all measured values produced results comparable to those from earlier studies based on
Haefeli’s (1962) estimated gradient at the latitude of the Nepal Himalaya (NRC, 2012). It is clear that errors related
to the estimation of runoff in the immediate vicinity of a glacier based on assumed ablation gradients are possible,
but sensitivity analyses indicate that these become minor when viewed as a component of the regional stream
flow.
Parameterization of the AGM relies on the following four key glacier variables: ice area, hypsometry, the
basin-wide ELA, and an ice ablation gradient. General steps in the AGM involved:
(i) delineating the glacier boundaries,
(ii) calculating the basin-wide ELA and ice ablation gradient,
(iii) computing the ice hypsometry for 100-m altitudinal bands below the ELA using the glacierized area
and the DEM,
(iv) multiplying the area of each altitudinal band by the ablation gradient values to obtain the ice melt
volume per elevation band, and
(v) summing up the ice melt volumes to obtain the basin-wide runoff volume as follows:
Bs = bs1A1 + bs2A2 + bs3A3,…+ bsnAn (3)
where
Bs : Glacier ice melt (MCM)
bs1,2,…n : Specific ice melt (m) for each altitudinal belt
A1,2,…n : Area of altitude belt (km2) in the ablation zone
These values, summed for all the altitudinal belts on the ablating portion of the glaciers, were assumed to
represent the annual glacier ice melt (Bs) for the combined glaciers of each catchment basin. Similarly, the annual
snow accumulation (Bw) was calculated as follows:
Bw = bw1A1 + bw2A2 + bw3A3, …+ bwnAn (4)
where:
Bw : Glacier snow accumulation (MCM)
bw1,2…n : Specific snow accumulation (m) for each altitudinal belt
A1,2…n : Area of altitude belts (km2) in the accumulation zone

34
A state of quasi-stable equilibrium for a glacier, used to estimate the location of the ELA, is defined here as:
Bs + Bw = 0
The application of this model requires certain assumptions:
(i) It was assumed that the properties of the cryogenic zone in the mountains circling the Tibetan Plateau
varied primarily with altitude in any single mountain range, and with latitude between the southern
and northern extremes of these mountains (Cogley, http://www.iop.org/mt4/mt-tb.cgi/3820).
(ii) The summer-season freezing level, used to approximate the ELA, is assumed to drop c. 1,000 m from
c. 5,000 m to 4,000 m a.s.l. between the Nepal Himalaya and the Tien Shan mountains.
(iii) A mean slope of c. 10 mm/m for the ablation gradient is a reasonable estimate in glacier studies in the
circum-Tibetan Mountains (e.g., Fujita et al., 1998; Wagnon et al., 2007; Hagg et al., 2012; Racoviteanu
et al., 2013; Gardelle et al., 2013).
(iv) Glacier melt and runoff volumes were estimated using representative mass balance data from the
Himalaya and Karakoram mountains (e.g., Kulkarni, 1992; Mayer et al., 2006; Wagnon et al., 2007).
(v) The ELAs have been estimated from the altitude of the summer-season 0°C isotherm, from the
summer-season freezing level, median glacier altitude, and from analyses of the quasi-stable
equilibrium altitude (Hoinkes, 1970), as well from extrapolations of the altitudes reported from glacier
studies in the Nepal and Indian Himalaya and the Karakoram mountains.
The hydro-meteorological input data for this study represent historical period-of-record values from the
literature, from the Global Runoff Data Centre, Germany, the Asian Data Base at the University of Idaho, or from
the Tajik Department of Hydrometeorology:
(i) Data for twenty-seven gauged catchment basins in the upper Syr Darya Basin were available from the
Global Runoff Data Centre files (GRDC, 2013). Historical period-of-record stream flow data for twelve
glacierized basins in the headwaters of the Amu Darya in the Pamir and Hindu Kush mountains were
provided by the Tajik Department of Hydrometeorology.
(ii) Surface areas and area-altitude distributions of basins and glaciers were determined from Shuttle
Radar Topography Mission (SRTM) data at 90 m spatial resolution and Landsat satellite imagery at
30 m spatial resolution. The SRTM was flown in February 2000, and its data represent the currently
most readily available source of remote sensing-derived elevation data. Various versions of the SRTM
data are available at no cost over the Internet.
(iii) Temperature and precipitation estimates for the Syr Darya Basin were based on data from the Central
Asia Data Base (CADB) at the University of Idaho.

35
All these parameters are considered averages of the range of values characterizing individual mass balance
studies on discrete mountain glaciers, and are used here to define the conditions existing on the compound glacier
systems found in each glacierized mountain basin analyzed.
This procedure is not intended as a substitute for traditional glacier mass balance studies. It is intended to
be a reconnaissance tool, developed to permit an assessment of the relative importance of glacier melt in the
rivers of Asia in the almost complete absence of glacier mass balance data, and the potential impact of receding
glaciers on regional water supplies. It is emphasized that both glacier and snowmelt runoff are empirical, driven by
field measurements. Where these measurements are not available, as is the case in much of central Asia, any
value of snow or glacier melt as runoff components must be considered an estimate. For this study, the volume of
the snowmelt (SQ) component is derived as a residual, the difference of the respective volumes of measured basin
runoff (BQ) at a stream flow gauging site and the calculated glacier melt volume (GQ).

36
5. AMU DARYA MOUNTAIN BASINS
The mountain headwaters of the Amu Darya are located primarily in the Pamir and Hindu Kush mountains in
eastern Tajikistan and northern Pakistan. The Pamirs are among the world’s highest mountains, and since
Victorian times, they have been known as the ‘Roof of the World’, presumably a translation from Persian.
Although the precise extent of the Pamirs is debatable, it is agreed that they lie mostly in the Gorno-
Badakhshan Province of Tajikistan and the Badakshan Province of Afghanistan. To the north they join the Tien
Shan Mountains along the Alai Valley of Kyrgyzstan. To the south they join the Hindu Kush Mountains along
the Wakhan Corridor in Afghanistan and the Gilgit-Baltistan Province in Pakistan. To the east they may end on the
Chinese border or extend to the range that includes Kongur Tagh that is sometimes included in the Kunlun
Mountains.
The Amu Darya is formed by the confluence of the Panj and Vakhsh rivers in southwestern Tajikistan and
then flows through Uzbekistan and Turkmenistan, before discharging into the remnants of the Aral Sea (Figure 6).
While the estimated flow of the Amu Darya is 79 km3, this value must be viewed with some skepticism, since all
indications are that the river contains little, or no water at its mouth at the Aral Sea. To this total flow of the Amu
Darya, the Vakhsh River contributes 20 km3 and the Panj River 34 km3 at the confluence (e.g., Chevalier et al.,
2012). The water resources situation in the Aral Basin, to which the Amu Darya is one of two major contributors,
has been studied extensively and is well documented in the literature (e.g., McKinney, 2003; Lutz et al., 2012).

37
Figure 6. The Amu Darya, in the Aral Basin, stretches from its headwaters in the Pamirs to
its mouth in the Aral Sea.
5.1. Basins
The study area consists of ten glacierized sub-basins within the Pamir and Hindu Kush mountains for which
stream flow data were available: seven at the headwaters of the Panj River, and three at the headwaters of the
Vakhsh River (Figure 7). These basins represent a majority of the mountain surface area contributing runoff to the
Vakhsh and Panj rivers. While the drainage basin of the entire Amu Darya totals 534,739 km2, this study focused
only on the part of the basin that lies within the mountains and foothills of the Pamir and Hindu Kush Mountains
and includes 158,201 km2. Owing to the lack of gauge data for the Lower Panj and Lower Vakhsh basins, our
glacier area and stream flow calculations focus exclusively on the Upper Amu Darya Basin with an area of
81,794 km2; it consists of the Upper Panj Basin with an area of 61,484 km2 (75%) and the Upper Vakhsh Basin with
an area of 20,310 km2 (25%) (Figure 8).
Figure 7. Locations of glaciers and stream gauging stations in the mountain basins of the Upper Amu
Darya.
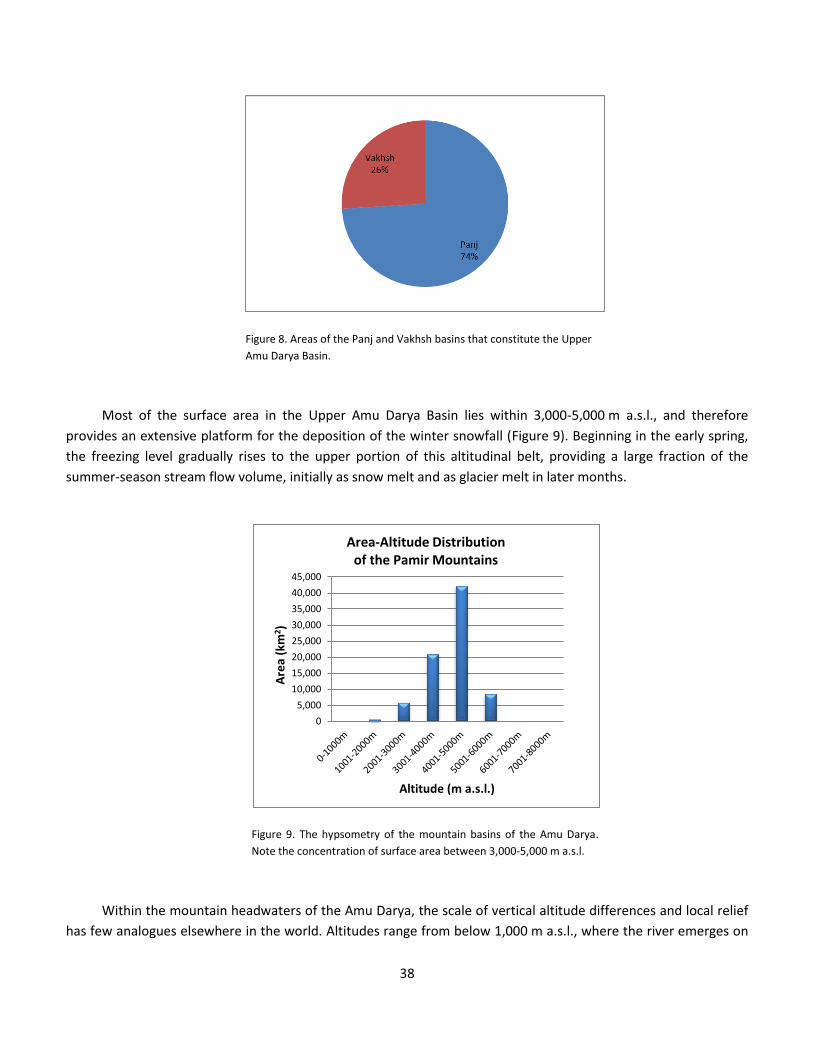
38
Figure 8. Areas of the Panj and Vakhsh basins that constitute the Upper
Amu Darya Basin.
Most of the surface area in the Upper Amu Darya Basin lies within 3,000-5,000 m a.s.l., and therefore
provides an extensive platform for the deposition of the winter snowfall (Figure 9). Beginning in the early spring,
the freezing level gradually rises to the upper portion of this altitudinal belt, providing a large fraction of the
summer-season stream flow volume, initially as snow melt and as glacier melt in later months.
Figure 9. The hypsometry of the mountain basins of the Amu Darya.
Note the concentration of surface area between 3,000-5,000 m a.s.l.
Within the mountain headwaters of the Amu Darya, the scale of vertical altitude differences and local relief
has few analogues elsewhere in the world. Altitudes range from below 1,000 m a.s.l., where the river emerges on
0
5,000
10,000
15,000
20,000
25,000
30,000
35,000
40,000
45,000
Are
a (k
m2)
Altitude (m a.s.l.)
Area-Altitude Distribution of the Pamir Mountains

39
the plains, to several mountain peaks above 7,000 m a.s.l. The median altitude of the catchment above Shidz, a
gauging station on the upper Panj River, is more than 5,000 m a.s.l. (Figure 10). This means that the greater part of
the catchment surface is thrust up into the middle troposphere (ground level atmospheric pressures approaching
500 mb). In lowland areas, the behavior of climate variables such as diurnal variations in air temperature, specific
and relative humidity, wind strength and direction, and cloud formation are significantly different at these
pressure levels than near to the ground surface. Most climate change scenarios, either explicitly or implicitly,
reflect changes that are expected below the 700 mb level.
Figure 10. Area-altitude distribution (hypsometry) of the Shidz Basin at the
headwaters of the Amu Darya. The altitude of the 700 mb, 600 mb, and 500 mb
levels (vertical green lines, left to right, respectively) demonstrate the extreme
altitude reached by these mountains, extending into the middle troposphere. Most
climate change scenarios, either explicitly or implicitly, reflect changes that are
expected below the 700 mb level.
The variation of hypsometries between the Upper Vakhsh and Upper Panj basins document that not only is
the Upper Vakhsh Basin considerably smaller than the Upper Panj Basin, but the relative distribution of surface
area with altitude varies as well (Figure 11). In the Panj Basin the area between 3,000 and 5,000 m a.s.l. is
extensive because of the inclusion of the ‘pamirs’—high altitude plains—for which the Pamir Mountains are
named. These ‘pamirs’ are major features of the Murgab, Gund and upper Panj basins, but are not a significant
feature of the Vakhsh headwater basins.
0%
10%
20%
30%
40%
50%
60%
70%
80%
90%
100%
0%
1%
2%
3%
4%
5%
6%
7%
8%
9%
10%
200 1,200 2,200 3,200 4,200 5,200 6,200 7,200
Cu
mu
lati
ve p
erc
en
t A
rea
Pe
rce
nt
of
Co
ntr
ibu
tin
g A
rea
Altitude (m a.s.l.)
Area-altitude Distribution in the Shidz Basin
Percent Area Cumulative Percent

40
Figure 11. Comparative area-altitude distribution (hypsometry) for the mountain
basins of the Panj and Vakhsh rivers.
5.2. Glaciers
In the Upper Amu Darya basin, glaciers cover 10,461 km2 (12%) of its area, of which 59% is to be found in
the Upper Panj Basin and 41% in the Upper Vakhsh Basin (Table 9, Figure 12). Glaciers cover 19% of the Upper
Vakhsh Basin and 10% of the Upper Panj Basin.
Table 9. Basin area and glacier area in the headwaters of the Amu Darya Basin.
Basin Basin Area
(km2)
Glacier Area
(km2)
Glacier Area
(%)
Amu Darya (this study) 158,210 11,887 7 Panj (entire) 118,330 6,848 6 Vakhsh (entire) 39,880 4,928 12
Upper Amu Darya 81,794 10,461 12 Upper Panj 61,484 6,043 10 Bartang 4,345 702 16 Gudara 4,067 648 16 Gund 13,853 800 6 Murgab 16,700 1,020 5 Shidz 18,519 2,263 12 Vanch 2,060 332 16 Yazgulem 1,940 278 14
Upper Vakhsh 20,310 4,307 19 Kysyzlu 8,370 758 9 Muksu 6,550 2,551 36 Obighigou 5,390 997 15
0-1 K 1-2 K 2-3 K 3-4 K 4-5 K 5-6 K 6-7 K 7-8 K
Panj 10878 12058 14268 26019 46450 8559 97 1
Vakhsh 6422 4592 7567 11719 7283 2173 123 2
0
5,000
10,000
15,000
20,000
25,000
30,000
35,000
40,000
45,000
50,000
Bas
in A
rea
(km
2)
Comparative Hypsometry for the Mountain Basins of the Panj and Vakhsh Rivers

41
A B
C D
Figure 12. Glacierized area in the (a) Upper Amu Darya Basin; (c) Panj Basin; and (d) Vakhsk Basin; and (b) share of
glacierized area in the Panj and Vakhsh basin in the total glacierized area.
The hypsometry of the Pamir glaciers shows an altitudinal range of 3,000 m from 3,500-6,500 m a.s.l., with a
maximum surface area at c. 5,000 m a.s.l. (Figure 13).

42
Figure 13. The hypsometry of glaciers in the gauged mountain basins at the headwaters of the Amu
Darya. The median altitude is indicated by a red line. In this study, the median altitude approximates
the equilibrium line altitude (ELA) and represents the approximate altitude, at which the ablation
gradient is assumed to be zero, for the purpose of ablation gradient calculations.
Median glacier altitudes are used here to define the steady-state ELA, assumed to be the altitude of zero
annual ablation for the ablation gradient calculations, and the altitude dividing the glaciers into zones of
accumulation and ablation of equal volume for estimating glacier volume adjustments to climate change
scenarios. For example, for the Muksu Basin the median glacier altitude of 5,064 m a.s.l. is used as the ELA in this
study (Table 10; Figure 14). For the glaciers of the Amu Darya headwaters, these median altitudes range over
500 m from 4,491 to 5,111 m a.s.l. This range of altitudes is not random: the glaciers of those basins on the
windward slopes of the northern Pamir Mountains—the Obighigou, Yazgulem, Kysyzlu and Vanch—all have
median altitudes near 4,500 m a.s.l., while the remainder, located primarily on the lee side of the main Pamir
Range and sub-basins in the south, have values near 5,000 m a.s.l.
Table 10. Comparison of the median glacier
altitude (MGA) in the basins considered in this
study, and the ELA as estimated from the
assumption of glacier quasi-stable equilibrium.
Basin MGA
(m a.s.l.)
ELA
(m a.sl.)
Amu Darya 4,847 4,795 Bartang 4,868 4,750 Gudara 5,089 5,050 Gund 4,933 4,850 Kysyzlu 4,574 4,550
0
200
400
600
800
1,000
1,200
25
00-2
60
0
27
00-2
80
0
29
00-3
00
0
31
00-3
20
0
33
00-3
40
0
35
00-3
60
0
37
00-3
80
0
39
00-4
00
0
41
00-4
20
0
43
00-4
40
0
45
00-4
60
0
47
00-4
80
0
49
00-5
00
0
51
00-5
20
0
53
00-5
40
0
55
00-5
60
0
57
00-5
80
0
59
00-6
00
0
61
00-6
20
0
63
00-6
40
0
65
00-6
60
0
67
00-6
80
0
69
00-7
00
0
71
00-7
20
0
73
00-7
40
0
Gla
cie
r A
rea
(km
2 )
Altitude (m a.s.l)
Hypsometry of the Glaciers in the Pamirs

43
Muksu 5,064 4,950 Murgab 5,106 5,100 Obighigou 4,491 4,450 Shidz 5,111 5,100 Vanch 4,579 4,500 Yazgulem 4,680 4,650
Figure 14. Accumulation zone, ablation zone, and ELA—as defined by the median glacier
altitude—in the Muksu Basin.
It is a primary assumption associated with ablation gradient analysis that the hypsometry of glacier ice is a
major determinant of the way in which the basin glaciers are in balance with a regional climate, and how they will
respond to changes in that climate. When comparing the glacier hyspometries for the Panj and Vakhsh basins, the
primary difference is the extensive glacierized area at lower altitudes in the Vakhsh Basin in the north, which may
reflect more active and advancing glaciers here– the ‘Pamir anomaly’ (Figure 15).

44
Figure 15. Comparison of the glacier hypsometries in the northern (Vakhsh) and southern (Panj) portions of the Pamirs.
The primary difference is the extensive glacierized area at lower altitudes in the north, which may reflect more active
and advancing glaciers here– the ‘Pamir anomaly’?
5.3. Climate
There are few climate data available for the headwaters of the Amu Darya. Those used for this study are
from the city of Khorog (2,077 m a.s.l.), the administrative center of Gorno-Badakhshan Autonomous Province in
the Pamirs of Tajikistan. The temperature data are from the website ‘climatebase.ru’, and are monthly mean
values for Khorog.
The primary need for applying the ‘Ablation Gradient Model’ (AGM) is a determination of the approximate
freezing level during the summer season (May to September). These mean monthly temperatures were used to
define an approximation of the altitude of the mean monthly freezing temperature by assuming an air
temperature lapse rate of 6.5°C/1,000 m. Archer (2004) explained that
“(…) from a hydrological point of view the upper zone of the freezing level is one of
continuous frost, where precipitation falls as snow and where there is virtually no
contribution to river runoff. However, it provides nourishment to lower zones
through snow avalanching and glacier flow. The middle zone is one with frequent
freeze–thaw cycles, where precipitation may fall as rain or snow, melt of lying
snow occurs during daylight hours and refreezing occurs at night. In the lower
0
50
100
150
200
250
300
350
400
450
500
30
00-3
10
0
32
00-3
30
0
34
00-3
50
0
36
00-3
70
0
38
00-3
90
0
40
00-4
10
0
42
00-4
30
0
44
00-4
50
0
46
00-4
70
0
48
00-4
90
0
50
00-5
10
0
52
00-5
30
0
54
00-5
50
0
56
00-5
70
0
58
00-5
90
0
60
00-6
10
0
62
00-6
30
0
64
00-6
50
0
66
00-6
70
0
68
00-6
90
0
70
00-7
10
0
72
00-7
30
0
74
00-7
50
0
76
00-7
70
0
78
00-7
90
0
Gla
cie
r A
rea
(km
2)
Altitude (m a.s.l.)
Hypsometries of the Glaciers in the Panj and Vakhsh Basins
Panj
Vakhsh

45
zone with continuous above-freezing temperatures, precipitation is expected to fall
as rain and melt is continuous, though enhanced during daylight hours.”
The monthly freezing levels, based on extrapolation of the Karakoram temperature values (Archer, 2004),
are: 4,500 m a.s.l. in May, 5,100 m a.s.l. in June, 5,600 m a.s.l. in July, 5,600 m a.s.l. in August, and 4,970 m a.s.l. in
September, with a mean or summer-season altitude of 5,170 m a.s.l. (Figure 16).
Figure 16. Elevation of the freezing level for monthly maximum and minimum
temperatures, Karakoram Himalaya (after Archer, 2004).
Based on these data, it is assumed that the average summer-season altitude of the 0oC isotherm, at which
sufficient snow and ice melt is possible to produce measureable runoff from a basin in the Pamirs, is c. 5,000 m
a.s.l. A few valley glaciers in the Pamirs have terminal altitudes below 3,000 m a.s.l. At this altitude, ice melt is
assumed to be occurring during most months of each year. This represents a very small fraction of the glacier
cover, however, and produces only an insignificant amount of runoff. The primary altitude of runoff volume
produced by ice melt is immediately below the annual freezing level, where the surface area of the ablation zone
is greatest.
Precipitation data for the Pamir region is quite limited. Data were available for only two sites: Dushanbe and
Khorog. Both data sets indicate that precipitation occurs primarily during winter months (Figure 17). These two
stations are representative of the seasonal pattern of precipitation in eastern Tajikistan, with snow during the
winter months and very dry summers, but there are insufficient data to permit development of orographic trend
estimates. Snow pit measurements on the upper Fedchenko Glacier indicate precipitation may exceed 2,000 mm
at 4,000-5,000 m a.s.l., at least in the Muksu Basin. At c. 4,000 m a.s.l. on the Murgab Plateau, annual precipitation
is less than 100 mm. Specific runoff estimates, based on available stream flow measurements (Tajik DHM, 2013)
serve as a useful proxy of basin precipitation. The specific runoff depths are in general agreement with the limited
high altitude data from snow pits and the station at Murgab.

46
Figure 17. Mean annual precipitation in Dushanbe (blue) and Khorog (green), Tajikistan.
As a first approximation, it is assumed that the general glacier environment of the Pamirs is similar to that of
the adjacent Karakoram Range as described by Archer (2004), Archer and Fowler (2004, 2006), and Hewitt (2006).
Snow pit data from the accumulation basins of the Fedchenko, Tanimas and Medvedev glaciers at c. 5,000 m a.s.l.
(e.g., Bashev et al., 1975; Savoskul and Smakhtin, 2013) are in general agreement with snow depths at similar
altitudes in the Karakoram as reported by Archer and Fowler (2004) and Wake (1987). Snow pit measurements
from the upper Fedchenko Glacier, indicating an annual glacier accumulation depth of 2,000 mm, are the only
data found related to precipitation at the altitude of the Pamir glaciers. This climatological difference was
apparent with other climate indicators. The median altitude of the glaciers of the Upper Amu Darya Basin, often
suggested as an approximation of the ELA, where annual depths of accumulation and melt are equal, varied by an
average of 500 m between the Vakhsh glaciers at 4,581 m a.s.l., and the Panj glaciers at 5,021 m a.s.l. Based on the
steady-state net budget calculations using the ‘Ablation Gradient Model’ (AGM) , and the Balance Ratio approach
for determination of the steady-state ELA, the ELA difference between the Vakhsh and Panj basins was reduced to
300 m, and the best fit for the winter balance (Bw) was a specific accumulation of 2,000 mm for the Vakhsh
glaciers, and 1,000 mm for the Panj glaciers.
5.4. Hydrology
The hydrology of the Upper Amu Darya Basin has the following characteristics:
(i) The mean annual runoff of the Amu Darya is estimated to be 79 km3; the Upper Amu Darya at the
confluence of the Panj and Vakhsh Rivers is estimated to be c. 39 km3, with c. 22 km3 (56%) from the
Panj River, and c. 17 km3 (44%) from the Vakhsh River (Tables 11 and 12).
0
20
40
60
80
100
120
j f m a m j j a s o n d
Pre
cip
itat
ion
(m
m)
Month
Mean Monthly Precipitation in Duschanbe and Khorog, Tajikistan

47
(ii) The two principal sources of runoff are: (a) winter precipitation as snow that melts during the
succeeding summer season; and (b) glacier melt during a summer-season. From a climate perspective,
the volume of runoff from the seasonal snow pack is determined primarily by winter precipitation,
while the volume of glacier melt is some function of the temperature during the summer season.
Table 11. Stream flow and runoff data from 2013 for basins of the Panj River,
received from the Tajik Department of Hydrometeorology. (BQ: total basin
runoff; Bq: specific basin runoff; MCM = million cubic meters).
Basin Area
(km2)
Stream Flow
(m3/s)
BQ
(MCM)
Bq
(mm)
Murgab (Barchidev) 16,700 47 1,449 90 Gund (Khorog) 13,853 104 3,276 240 Bartang (Shojand) 4,345 140 1,349 310 Gudara 4,067 50 1,544 380 Shidz 18,519 479 9,771 530 Vanch 2,060 79 2,491 1,210 Yazgulem 1,940 54 1,693 870
Total 61,484 --- 21,573 300
Table 12. Stream flow and runoff data from 2013 for the basins of the Vakhsh
River, received from the Tajik Department of Hydrometeorology. (BQ: total
basin runoff; Bq: specific basin runoff; MCM = million cubic meters).
Basin Area
(km2)
Stream Flow
(m3/s)
BQ
(MCM)
Bq
(mm)
Kysyzlu (Dombrachi) 8,370 100 3,150 380 Muksu 6,550 210 6,615 1,010 Obighigou (Tavildara) 5,390 235 7,403 1,370
Total 20,310 --- 17,168 850
The impact of climate change on the source, timing and volume of runoff from the headwater basins of the
Amu Darya will be greatly influenced by location within the basin. Stream flow is an integration of all climatic
factors in a mountain basin, and is an index of comparable mountain topo-climates. A primary indicator of the
regional range of topo-climates in the mountain basins considered in this study was the annual discharge depth of
stream flow—the specific runoff in millimeters—measured at the gauging stations in each basin. This varied from
less than 100 mm in the Murgab Basin, with most of its area east of the mountains, to more than 1,300 mm in the
Obighigou Basin in the northern Pamir. This order-of-magnitude difference in specific runoff illustrates the
extreme variation in at least one of the climate variables affecting these mountain basins. In general, the southern
basins, primarily the source of the Panj River, are much more arid, as indicated by specific runoff, than the
northern basins of the Vakhsh River. The Panj River headwaters have an average specific discharge of 300 mm,
while it is 850 mm in the Vakhsh River headwaters—almost three times higher. Specific runoff exceeds 1 m in the

48
Obighigou and Muksu basins within the Vakhsh Basin of the northern Pamirs, and in the Vanch Basin within the
Panj Basin in the southern Pamirs (Figure 18).
Figure 18. Specific runoff (q) in the glacier basins of the Upper Amu Darya. The specific runoff from the northern portion of the
upper Amu Darya Basin is significantly higher than from the southern portion. The northern basins are also the site of higher
glacier cover than those in the south, as well as a lower area-altitude distribution of glacier ice. (“Panj” is here the upper Panj =
Shidz).
Some idea of the climate variability can be developed from the year-to-year fluctuation in mean flow of the
rivers in the basins. The recent past has been characterized by decade-long swings of flow volume of 20-40% of
the period-of-record mean in the both the Panj and Vakhsh rivers, which is a greater swing in any ten-year period
in the recent past than will be experienced by a complete disappearance of the glaciers at the headwaters of these
rivers. The interannual variability of the Panj River, based on the flow at Shidz from 1967-1986, ranges between
140% and 75% of the period-of-record mean of 479 m3/s (Figure 19), and shows no apparent trend for either
decreasing of increasing flow at this gauge station during this period of observations. Flow volume appears to be
determined by cycles, most probably involving the depth of the winter snow deposits. This is similar to the annual
variability of the upper Indus River, immediately to the south of the Amu Darya Basin. The interannual variation of
the Vakhsh River at Garm is between 122% and 76% of the long-term mean of 327 km3/s (Figure 20). As for the
Panj River, also for the Vakhsh River there is no trend of either decreasing or increasing flow at this gauge station
during this period of observations.
Kysyzlu Obighigou Muksu Vanch Yazgulem Gudara Bartang Gund Murgab Shidz
Sq q, mm 380 1370 1010 1210 870 380 310 240 90 530
0
200
400
600
800
1000
1200
1400
1600
Spe
cifi
c R
un
off
(q
, mm
)
Specific Runoff in the Glacier Basins of the upper Amu Darya River

49
Figure 19. Stream flow of the Panj River at Shidz from 1967-1986.
Figure 20. Stream flow of the Vakhsh River at Garm from 1941-1985.
5.4.1. Seasonality of Stream Flow
0
100
200
300
400
500
600
700
1965 1970 1975 1980 1985 1990
Stre
am F
low
(m
3 /s)
Year
Stream Flow of the Panj River at Shidz from 1967-1986
0
50
100
150
200
250
300
350
400
450
1935 1940 1945 1950 1955 1960 1965 1970 1975 1980 1985 1990
Stre
am F
low
(m
3 /s)
Year
Stream Flow of the Vakhsh River at Garm from 1941-1985

50
Runoff in the upper Amu Darya Basin results primarily from glacier and snowmelt. In water budget analyses,
both are treated as storages that produce runoff at temperatures above the freezing point. The runoff from the
seasonal snow is determined from the water equivalent depth of the winter snow. Since the mountain snows are
generally deposited at all altitudes in a mountain basin, measureable snowmelt runoff begins as soon as air
temperatures reach 0°C or above in the spring at the altitude of the gauging station, and continues until the
snowpack is completely removed, up to the altitude of the regional snowline. At this time, the seasonal snowmelt
flood occurs, and, without additional input, the stream flow hydrograph begins the recession phase. In the Upper
Amu Darya Basin, the snowmelt peak flow commonly occurs in July, and hence snowmelt runoff is interpreted as
the primary component of the rising limb of the annual hydrograph (Figure 21).
Figure 21. Annual hydrographs of the Panj and Vakhsh rivers at gauging points downstream from the mountain basins. For
both rivers, annual peak flow occurs in July, with a general decrease—‘recession’—to seasonal low flows during winter
months.
Since glaciers are located at higher altitudes in the mountain basin, glacier melt does not begin until the
freezing level has migrated up to those altitudes, but will then continue until the freezing level migrates downward
with the onset of fall. The glacier annual peak flow occurs in August. In the Upper Amu Darya Basin virtually all
glacier runoff occurs during the peak melt season of July to September, while snowmelt is more evenly distributed
over the period April to July. Glacier melt is a major component of the falling limb of the annual hydrograph.
In mountain catchment basins, as generalities, water retention in the basin as groundwater storage is
generally minimal (Todd, 1980), as a result of high rates of erosion of the products of mechanical weathering, and
low rates of chemical weathering, evapotranspiration losses are low (Barry and Chorley, 1970), stream gradients
are high, promoting rapid runoff, storage is mainly as winter snow or glaciers, so runoff timing is linked to
summer season temperatures, while volumes are related to winter snow deposition or glacier ablation surface
area. The precise form of the annual hydrograph will be strongly influenced by location, as well as the time period
jan feb mar apr may jun jul aug sep oct nov dec
Panj (Hirmanjo) 239 226 246 469 915 1760 2180 1840 903 451 331 272
Vahksh (Garm) 114 109 131 175 320 582 840 769 426 205 154 130
0
500
1000
1500
2000
2500
Stre
am F
low
(m
3 /s)
Annual Hydrographs for the Panj and Vakhsh Rivers
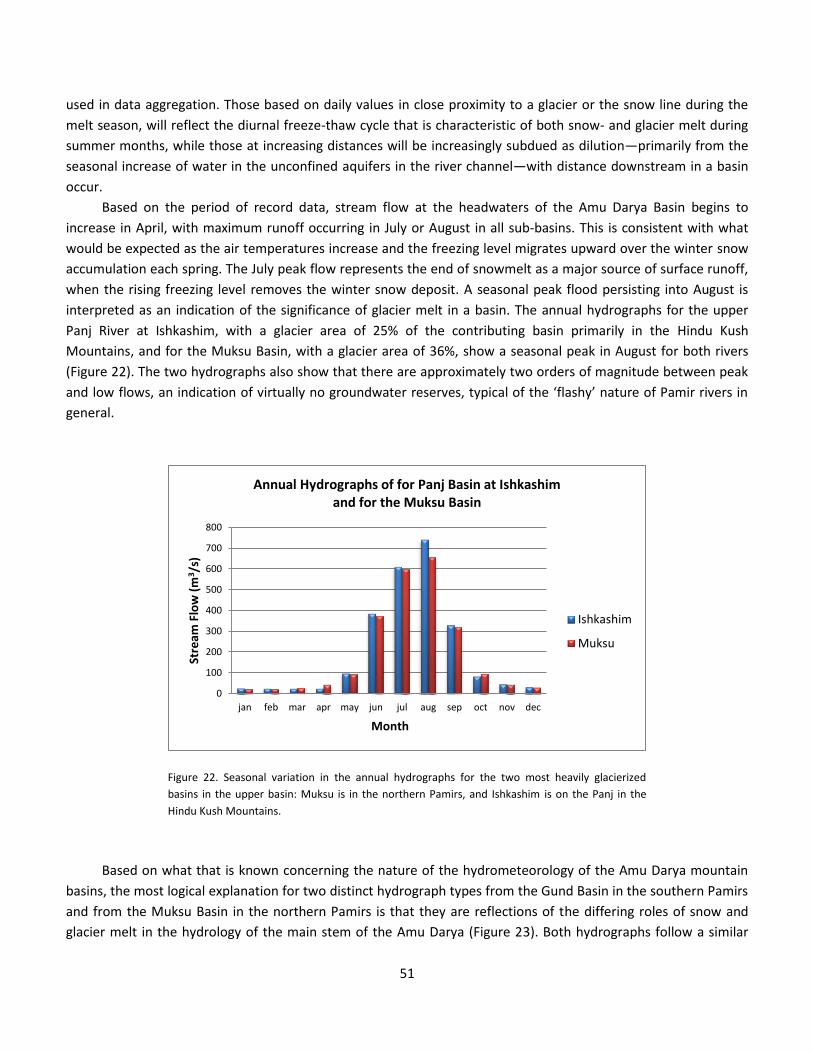
51
used in data aggregation. Those based on daily values in close proximity to a glacier or the snow line during the
melt season, will reflect the diurnal freeze-thaw cycle that is characteristic of both snow- and glacier melt during
summer months, while those at increasing distances will be increasingly subdued as dilution—primarily from the
seasonal increase of water in the unconfined aquifers in the river channel—with distance downstream in a basin
occur.
Based on the period of record data, stream flow at the headwaters of the Amu Darya Basin begins to
increase in April, with maximum runoff occurring in July or August in all sub-basins. This is consistent with what
would be expected as the air temperatures increase and the freezing level migrates upward over the winter snow
accumulation each spring. The July peak flow represents the end of snowmelt as a major source of surface runoff,
when the rising freezing level removes the winter snow deposit. A seasonal peak flood persisting into August is
interpreted as an indication of the significance of glacier melt in a basin. The annual hydrographs for the upper
Panj River at Ishkashim, with a glacier area of 25% of the contributing basin primarily in the Hindu Kush
Mountains, and for the Muksu Basin, with a glacier area of 36%, show a seasonal peak in August for both rivers
(Figure 22). The two hydrographs also show that there are approximately two orders of magnitude between peak
and low flows, an indication of virtually no groundwater reserves, typical of the ‘flashy’ nature of Pamir rivers in
general.
Figure 22. Seasonal variation in the annual hydrographs for the two most heavily glacierized
basins in the upper basin: Muksu is in the northern Pamirs, and Ishkashim is on the Panj in the
Hindu Kush Mountains.
Based on what that is known concerning the nature of the hydrometeorology of the Amu Darya mountain
basins, the most logical explanation for two distinct hydrograph types from the Gund Basin in the southern Pamirs
and from the Muksu Basin in the northern Pamirs is that they are reflections of the differing roles of snow and
glacier melt in the hydrology of the main stem of the Amu Darya (Figure 23). Both hydrographs follow a similar
0
100
200
300
400
500
600
700
800
jan feb mar apr may jun jul aug sep oct nov dec
Stre
am F
low
(m
3 /s)
Month
Annual Hydrographs of for Panj Basin at Ishkashim and for the Muksu Basin
Ishkashim
Muksu

52
trend during the period of base flow from November to March and—as indicated by the rising limb—the spring
snowmelt from April to July. The primary difference, other than volume, is the peak of summer flow in July for the
Gund Basin, with only 6% of glacier area, compared with a peak flow in August from the Muksu, with a 36% glacier
area. In conclusion, snowmelt ends in July with the onset of recession for minimally glacierized basins, while
glacier melt produces a seasonal peak flow in August, as the summer melt season comes to an end.
Figure 23. Comparison of the annual hydrographs from the Gund Basin in the southern Pamirs and
from the Muksu Basin in the northern Pamirs.
The recession segments of the gauged sub-basins in the Amu Darya Basin show two distinct recession types
that appear to be related to percent glacier area in each sub-basin (Figure 24). The Gund and Bartang basins, with
a glacier cover of 10% or less, have a single peak in July, followed by a normal recession curve. In contrast, while
the Panj/Shidz, Muksu and Obighigou basins with glacier areas ranging from 20-50% also have the main summer
peak flow in July, their peak flows continue into August at a slightly lower level before they begin the recession.
0
100
200
300
400
500
600
700
jan feb mar apr may jun jul aug sep oct nov dec
Stre
amfl
ow
(m
3 /s)
Annual Hydrographs for the Gund and Muksu Basins
Gund
Muksu

53
Figure 24. Monthly variation between June and December in the recession flow of the annual hydrograph for selected basins in
the Pamirs. The recession curves of basins at the headwaters of the Amu Darya provide a tool for separating basins with a large
glacier runoff component (Panj/Shidz, Obighigou, and Muksu) from those that are primarily snow melt (Murgab, Gudara,and
Kysyzlu).
Recent concerns about potential increases or decreases in the runoff of the rivers of Asia have focused on
the mountain glaciers of the headwater basins. However, the examples of the Obighigou and Muksu basins
illustrate the importance of the snowmelt component (Table 13). Total runoff is approximately equal from both
basins. Both basins contain glaciers, and glacier melt is a component of the total runoff volume. Based on identical
assumptions and procedures, the ablation gradient analysis of both basins yielded estimates of glacier runoff that
differ by a factor of three: 35% for the Muksu Basin, and 17% for the Obighigou Basin. Since there is no indication
of a rain component of runoff during the summer melt season, it is assumed that the remainder of runoff from
each basin is a result of melting winter snow, which varies by a factor of two: 65% in the Muksu Basin, and 83% in
the Obighigou Basin. An understanding of the build-up of the winter snow pack is as essential as glacier mass
balance studies when anticipating possible future stream flow fluctuations of the Amu Darya.
Table 13. Runoff characteristics of the Muksu and Obighigou basins. Total basin runoff
(BQ) is composed of a glacier component (GQ) and a snowmelt component (SQ).
While in the Muksu Basin GQ and SQ are almost evenly balanced, the runoff in the
Obighigou Basin is almost completely snowmelt. Both basins contribute to the flow of
the Vakhsh River, but neither can be used, alone, as a credible index of the relative
role of snow and ice as components of the flow of the Vakhsh River. At the same
time, an average value for the two basins, as would be used in a traditional stream
flow forecast model, will mask the role of each. (MCM: million cubic meters).
Basin BQ
(MCM)
GQ
(MCM)
GQ
(%)
SQ
(MCM)
SQ
(%)
Muksu 7,615 2,685 35 4,930 65
0
100
200
300
400
500
600
700
800
Jun Jul Aug Sep Oct Nov Dec
Stre
am F
low
(m
3 /s)
Recession Flow Curves of Basins in the Pamirs
Panj (Ishkashim)
Obighigou
Murgab (Barchidev)
Gudara (Rukhk)
Kysyzlu (Dombrachi)
Muksu

54
Obighigou 7,403 1,264 17 6,139 83
While the volume of runoff from glacier melt is related to summer season temperatures, the volume of
runoff from snowmelt is dependent upon the previous winter’s snow water equivalent snow fall depth. No useful
snow water equivalent depth data were found for this study outside a few pit studies on the glaciers. Snowmelt
runoff was treated as a residual in the water budget calculations, expressed as the difference between total
runoff, as measured at the Tajik hydrometric stations, and the estimated glacier runoff. There is no indication of
rainfall in the basins of the Pamirs in the summer months.
In the most general terms, the seasonality of runoff can be expected to vary among basins, depending on
hypsometry and glacier extent. Any increase in temperature will produce an earlier beginning of spring runoff with
no other change in the snowmelt component of runoff. Glacier retreat will result in a decrease of the stream flow
peak in August/September, with a general decrease in total annual volume. It has been found in the hydrograph
analyses of runoff from the Karakoram (Alford, 2011) and those of the Pamirs that glaciers with a glacier cover
exceeding 10% generally do not begin recession flow until August, while in the only snow-fed basins they begin
their recession early in July.
5.4.2 Glacier and Snow Runoff
The runoff from the mountain basins of the Amu Darya is mainly a result of the melting of glaciers and
winter snow. While runoff from glaciers and the seasonal snowpack, where both are present in a mountain basin,
are often treated as a single problem involving surface area and air temperature, the two respond very differently
to variations in temperature and precipitation. Timing and volume of runoff from the seasonal snowpack will be
determined by the snow depth—in water-equivalent terms—of the winter precipitation. All snow below the
regional snowline, which in the Pamirs is at an altitude of c. 5,000 m a.s.l., will become runoff during the spring
and early summer months as the 0°C isotherm migrates upward to a maximum altitude between 5,000-6,000 m
a.s.l., and then migrates to lower altitudes with the onset of fall and winter. Precipitation above the regional
snowline will become incorporated in the glaciers or perennial snowfields to serve as a secondary storage
exploited during years of drier and warmer conditions than the average.
Timing and volume of runoff from glaciers represent a combination of melt of the seasonal storage of water,
as snow, and the melt of the total ice reserves of the glaciers of a basin. Since there is no realistic upper limit to
the amount of water than can be produced by melting during the summer season each year at the surface of a
glacier that may be hundreds of meters thick, the limit on runoff from this process is determined largely by the
mean air temperature of the summer-season. The primary limiting factor in a mountain range such as the Pamirs
is the upper altitude reached each summer by the mean 0oC isotherm during the melt season. Glacier melt water
is produced from below this altitude, in the ablation zone. A major complication in viewing the glaciers of a
mountain basin as simply large, isothermal snowdrifts, as is sometimes done, is that the snow deposited on the
accumulation zone is converted to glacier ice, and transferred by plastic flow down-glacier into the ablation zone.
It is the two processes of storage of the seasonal snow above the regional snowline each year, and the slow
transfer of this snow, by plastic flow, to the altitudes of the glacier ablation zones that complicates both estimates

55
of snowmelt and glacier runoff in the high mountains of Asia. In the Pamirs, as much as 25% of the total basin
surface area will be above the mean 0°C isotherm in the summer season, and therefore experience no melt.
Modeling procedures developed without consideration of this fact can be expected to be in error by
approximately this amount.
Based upon this procedure, the runoff components for the Upper Amu Darya Basin and its sub- basins were
estimated (Tables 14 and 15; Figures 25 and 26). Of the total runoff of c. 39 km3 in the Upper Amu Darya Basin,
76% are from snowmelt and 24% from glacier melt. In the Upper Panj Basin, snow contributes 83% to the total
runoff, while glaciers contribute 17%. In the Upper Vakhsh Basin, 67% of the total runoff comes from snow and
33% from glaciers. Of all glacier melt, 40% comes from the Panj Basin and 60% from the Vakhsh Basin. Of all
snowmelt, 61% comes from the Panj Basin and 39% from the Vakhsh Basin.
Table 14. Components of runoff in the mountain basins of the Upper Amu Darya Basin (UADB).
Upper Amu Darya Upper Panj Upper Vakhsh
(km3) (%)* (km
3) (%)* (km
3) (%)*
Total Runoff (BQ) 38.7 --- 21.7 --- 17.0 --- Contribution to UADB --- --- --- 56 --- 44
Glacier Melt Runoff (GQ) 9.3 24 3.7 17 5.6 33 Contribution to UADB GQ --- --- --- 40 --- 60 Contribution to UADB BQ --- --- --- 10 --- 14
Snowmelt Runoff (SQ) 29.4 76 18.0 83 11.4 67 Contribution to UADB SQ --- --- --- 61 --- 39 Contribution to UADB BQ --- --- --- 46 --- 29
* Rounded numbers might lead to erroneous sums.
A B
C D

56
E F
Figure 25. Components of runoff in the mountain basins of the Upper Amu Darya Basin. (A) Share of BQ in Panj and Vakhsh
basins in ADB BQ. (B) Share of GQ and SQ in ADB BQ. (C) Share of GQ in Panj and Vakhsh basins in ADB GQ. (D) Share of SQ in the
Panj and Vakhsh basins in ADB SQ. (ADB: Upper Amu Darya Basin; BQ: total basin runoff; GQ: glacier melt runoff; SQ: snowmelt
runoff).
Table 15. Summary of the hydrological components of runoff and stream flow in the sub-basins of the Vakhsh and Panj rivers showing
the relative contribution of snow and glacier melt among the mountain basins at the present time. (BQ: total basin runoff, GQ: glacier
melt runoff, SQ: snowmelt runoff, Bq: specific basin runoff, Sq: specific snowmelt runoff; MCM: million cubic meters).
Basin Area
(km2)
BQ
(m3/s)
BQ
(MCM)
Bq
(mm)
Glacier Area
(km2)
GQ
(MCM)
SQ
(MCM)
Sq
(mm)
Panj Murgab 16,700 47 1,449 90 1,020 915 534 30 Gund 13,853 104 3,276 240 800 507 2,769 200 Bartang 4,345 135 1,630 380 702 980 650 150 Gudara 4,067 50 1,544 380 648 403 1,141 280 Shidz 18,519 479 9,771 530 2,263 3,470 6,301 340 Vanch 2,060 79 2,491 1,210 332 480 2,011 980 Yazgulem 1,940 54 1,693 870 278 372 1,321 680
Total 61,484 --- 21,854 300 6,043 5,185 15,669 210 Vakhsh Kysylsu 8,370 100 3,150 380 758 1,130 2,020 240 Muksu 6,550 210 6,615 1,010 2,551 2,685 4,930 740 Obighigou 5,390 235 7,403 1,370 997 1,269 6,139 1,140
Total 20,310 --- 17,168 850 4,306 5,685 11,383 540

57
Figure 26. Components of runoff in the mountain basins of the upper Amu Darya Basin representing the diversity of hydro-meteorological
environments. While aggregated mean data provide useful forecasts of total runoff into the rivers of the adjacent lowlands, they provide
little insight into the role of individual water budget components, such as glaciers, in stream flow formation. (BQ: total basin runoff; GQ:
glacier melt runoff; SQ: snowmelt runoff; MCM: million cubic meters).
Murgab Gund Bartang Gudara Shidz Vanch Yazgulem Kysyzlu Muksu Obighigou
BQ, mcm 1449 3276 1630 1544 9771 2491 1693 3150 6615 7403
GQ, mcm 915 507 980 403 3470 480 372 1130 2685 1269
SQ, mcm 534 2769 650 1141 6301 2011 1321 2020 4930 6139
0
2000
4000
6000
8000
10000
12000
Ru
no
ff (
MC
M)
Components of Runoff in the Amu Darya Mountain Basins

58
6. SYR DARYA MOUNTAIN BASINS
The Syr Darya is formed by the confluence of the Naryn and Kara rivers in the Upper Fergana Valley of
Uzbekistan. Its headwaters are in the western Tien Shan Mountains, the Fergana Range and the Alai Mountains of
Kyrgyzstan (Figure 27). The river flows through both the Uzbek and Tajik portions of the Fergana Valley before
exiting into Uzbekistan and flowing into the Aral Sea. There are major differences between the topography and
glaciers of the Amu Darya and Syr Darya basins. While terrain elevations reach 7,000 m a.s.l. in the northern
Pamirs, maximum elevations are only slightly above 5,000 m a.s.l. in the western Tien Shan. These altitudinal
differences have a profound effect on the nature of the glaciers in the western Tien Shan, when compared to the
Pamirs, and on the hydrologic regime at the headwaters of the Syr Darya.
Figure 27. The headwaters of the Syr Darya are in the mountains of Kyrgyzstan, from where the river
flows westward through Tajikistan and Uzbekistan in the Fergana Valley and subsequently through
Kazakhstan to the Aral Sea.
The glacierized headwaters of the Syr Darya are located in the western Tien Shan Mountains, the Fergana
and Alai ranges, and the Chirchik River Basin. The Naryn, Kara, and Alai Mountains basins encircle the Upper
Fergana Valley and drain into it (Figures 28 and 29). The Chirchik River flows through the city of Tashkent, and is
considered here as being outside the Upper Fergana Valley.

59
Figure 28. The Fergana Valley is enclosed by three mountain ranges: the western Tien Shan Mountains in the north, the
Fergana Range in the east, and the Alai Mountains in the south.
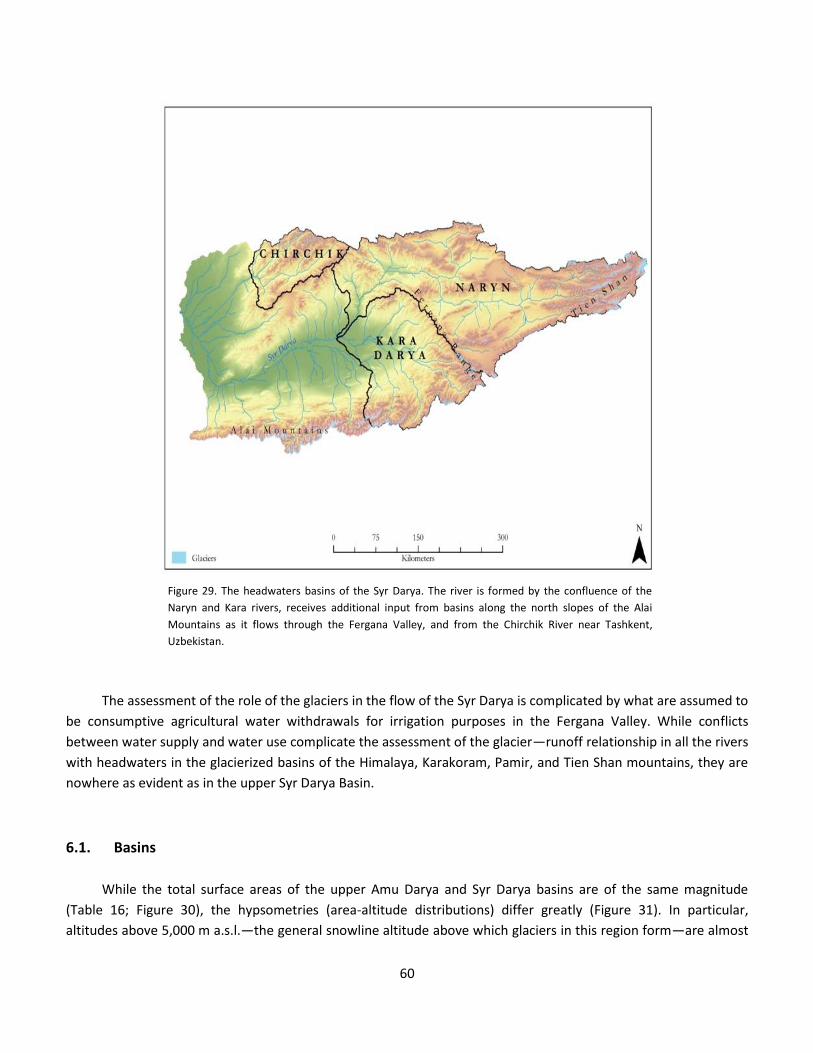
60
Figure 29. The headwaters basins of the Syr Darya. The river is formed by the confluence of the
Naryn and Kara rivers, receives additional input from basins along the north slopes of the Alai
Mountains as it flows through the Fergana Valley, and from the Chirchik River near Tashkent,
Uzbekistan.
The assessment of the role of the glaciers in the flow of the Syr Darya is complicated by what are assumed to
be consumptive agricultural water withdrawals for irrigation purposes in the Fergana Valley. While conflicts
between water supply and water use complicate the assessment of the glacier—runoff relationship in all the rivers
with headwaters in the glacierized basins of the Himalaya, Karakoram, Pamir, and Tien Shan mountains, they are
nowhere as evident as in the upper Syr Darya Basin.
6.1. Basins
While the total surface areas of the upper Amu Darya and Syr Darya basins are of the same magnitude
(Table 16; Figure 30), the hypsometries (area-altitude distributions) differ greatly (Figure 31). In particular,
altitudes above 5,000 m a.s.l.—the general snowline altitude above which glaciers in this region form—are almost

61
completely absent in the Upper Syr Darya Basin, while the larger area at these higher altitudes allows for the
existence of more extensive glaciers and snowfields in the Upper Amu Darya Basin.
Table 16. Areas of sub-basins and glacier areas in the Upper Syr Darya Basin. (Q: stream flow or
discharge; BQ: total basin runoff; Bq: specific basin runoff).
Basin Area
(km2)
Glacier Area
(km2)
Q
(m3/s)
BQ
(MCM)
Bq
(mm)
Chirchik 11,714 181 218 6,867 570 Fergana Valley 90,543 2,115 --- 18,450 ---
Alai Range 11,106 489 --- 1,040 190 Kara 15,589 416 --- 5,161 330 Naryn 63,848 1,226 75 12,249 190
Total 102,257 2,296 --- 25,317 260
A B
Figure 30. (A) Surface area of sub-basins within the Upper Syr Darya Basin. (B) Surface area of the Fergana Valley catchment
that combines the Naryn and Kara basins, and the Alai Mountains.

62
Figure 31. The hypsometry of the Upper Syr Darya Basin is strongly influenced by the low altitudes of the
Fergana Valley west of the Fergana Mountains, similar to the hypsometry of the Nepal Himalaya. In both
cases, with a limited amount of the total surface area at high altitudes, there is insufficient area on which
glaciers may form, regardless of the high altitude climate. The Upper Amu Darya Basin has a larger area at
higher altitudes, which allows for the existence of more extensive glaciers and snowfields.
The hypsometry of the Upper Naryn Basin, which has a surface area of c. 2,000 km2 above an altitude of
4,000 m a.s.l. and a glacier surface area of 1,226 km2, provides a better indication of the high altitude hypsometry
of the glacierized portions of the Syr Darya mountain basins (Figure 32). In the case of the Syr Darya glaciers, the
location of glaciers appear to be primarily determined by the presence of cirques basins that provide traps to
concentrate local accumulation of wind-blown snow. These cirques are erosional features left behind by previous
cycles of glacier growth and retreat.
0
10,000
20,000
30,000
40,000
50,000
60,000
Are
a (k
m2 )
Altitude (m a.s.l)
Hypsometries Amu Darya and Syr Darya Basins
Syr Darya
Amu Darya

63
Figure 32. The Upper Naryn Basin shows the typical hypsometry of an individual mountain basin within
the Upper Syr Darya Basin.
6.2. Glaciers
The headwaters of the Syr Darya in the western Tien Shan and Alai mountains have only a few peaks above
5,000 m a.s.l., and the glaciers are primarily small cirque glaciers. The total surface area of the glaciers at the
headwaters of the Syr Darya is 2,296 km2, slightly greater than the 1,658 km2 estimated by Kotlyakov (1996) (Table
16). The glaciers are not uniformly distributed among the glacierized basins. The mountains surrounding Fergana
Valley contain 93% of all glaciers: 54% of them can to be found in the Naryn Basin, 21% in the Alai Mountains, and
18% in the Kara Basin (Figure 33). Only 7% of the glaciers are in the Chirchik Basin. Representative hypsometries
are shown in Figure 34. There are c. 300 km2 of glacier area that has been catalogued as ‘ungauged’ and, hence,
has not been included in the analysis.
A B
0
500
1,000
1,500
2,000
2,500
3,000
3,500
4,000
4,500
5,000A
are
a (k
m2 )
Altitude (m a.s.l.)
Hypsometry of the Upper Naryn Basin

64
Figure 33. (A) Share of glacierized area in sub-basins of the total glacierized area in the Upper Syr Darya Basin. (B) Combined
share of the Naryn and Kara basins and Alai Mountains (Fergana Valley catchment) and of the Chirchik Basin in the total
glacierized area in the Upper Syr Darya Basin.
Figure 34. Representative hypsometries for the Naryn and Kara basins, and Alai Range within the Upper Syr Darya
Basin. Maximum area-altitude values vary slightly among these glaciers, but are generally between 4,100 and 4,300 m
a.s.l.
The following two figures are examples for the glacierized portions of the Naryn Basin (Figure 35) and the
Alai Mountains (Figure 36).
0
20
40
60
80
100
120
140
160
180
Are
a (k
m2 )
Altitude (m a.s.l.)
Area-Altitude Distribution for Glaciers in the Syr Darya Basin
Naryn
Kara Darya
Alai
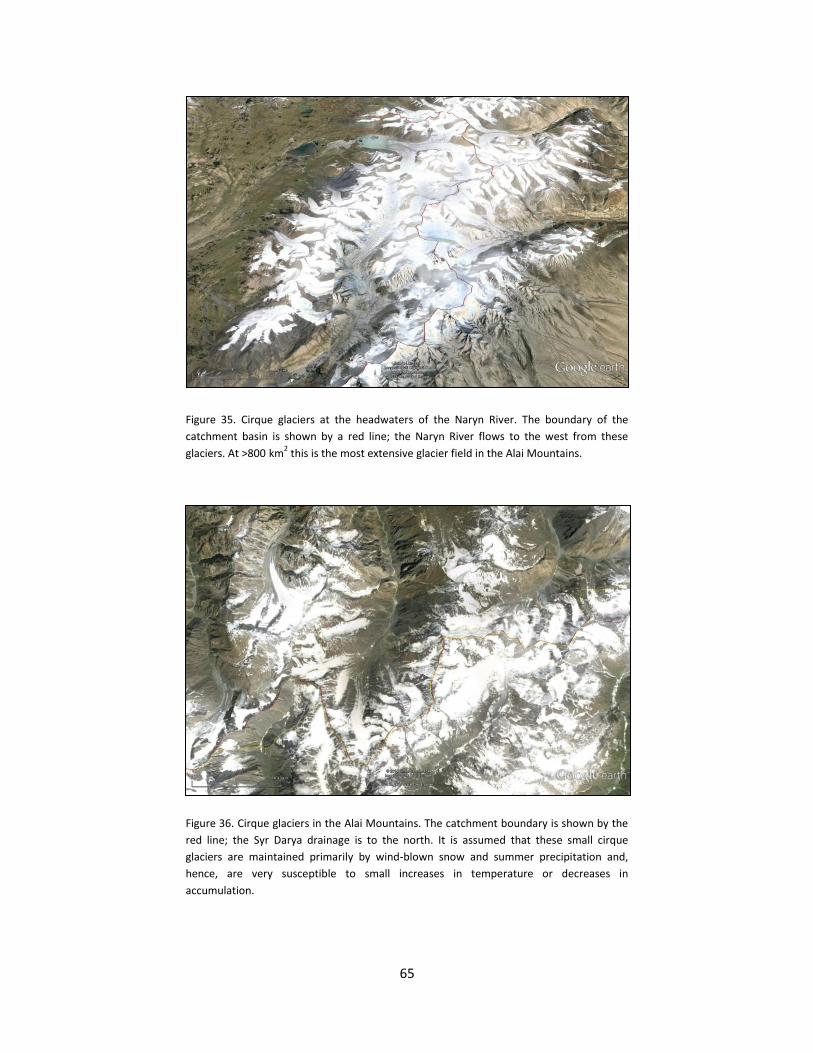
65
Figure 35. Cirque glaciers at the headwaters of the Naryn River. The boundary of the
catchment basin is shown by a red line; the Naryn River flows to the west from these
glaciers. At >800 km2 this is the most extensive glacier field in the Alai Mountains.
Figure 36. Cirque glaciers in the Alai Mountains. The catchment boundary is shown by the
red line; the Syr Darya drainage is to the north. It is assumed that these small cirque
glaciers are maintained primarily by wind-blown snow and summer precipitation and,
hence, are very susceptible to small increases in temperature or decreases in
accumulation.

66
Perhaps the most striking difference between the glaciers of the Upper Syr Darya Basin and those of the
Upper Amu Darya Basin is in their area-altitude distributions (Figure 37). While in the Upper Syr Darya Basin
glaciers exist between c. 3,200 and 5,000 m a.s.l. with a median altitude of c. 4,100 m a.s.l., they exist in the Upper
Amu Darya Basin between 3,400 and 7,000 m a.s.l. with a median altitude of c. 5,000 m a.s.l. As outlined in the
section above, these differences in glacier properties are ascribed as much to differences in topography as to
differences in the main climate controls.
Figure 37. Glacier hypsometries in the Upper Syr Darya Basin (blue) and the Upper Amu Darya Basin
(red). The difference between the glacier hypsometries in both basins is expected to produce a
difference in the response of the glaciers to any climate change.
While the shrinkage of glaciers may be related to climatic factors, the growth of glaciers is largely
determined by the surface area available at altitudes at which a favorable climate—precipitation and
temperature—exists. In the Pamir Mountains, the surface area above 4,000 m a.s.l. is c. 60,000 km2, with a glacier
surface area of over 10,000 km2. In the western Tien Shan Mountains, the surface area above 4,000 m a.s.l. is c.
6,000 km2, with a glacier surface area of c. 1,700 km2.
6.3. Climate
The climate data for the Syr Darya Basin consist of an extensive database containing period-of-record
measurements of both temperature and precipitation for the river’s headwater basins available in the ‘Central
0
200
400
600
800
1,000
1,200
20
00-2
10
0
22
00-2
30
0
24
00-2
50
0
26
00-2
70
0
28
00-2
90
0
30
00-3
10
0
32
00-3
30
0
34
00-3
50
0
36
00-3
70
0
38
00-3
90
0
40
00-4
10
0
42
00-4
30
0
44
00-4
50
0
46
00-4
70
0
48
00-4
90
0
50
00-5
10
0
52
00-5
30
0
54
00-5
50
0
57
00-5
80
0
59
00-6
00
0
61
00-6
20
0
63
00-6
40
0
65
00-6
60
0
67
00-6
80
0
69
00-7
00
0
71
00-7
20
0
73
00-7
40
0
75
00-7
60
0
77
00-7
80
0
Gla
cie
r A
rea
(km
2 )
Altitude (m a.s.l.)
SDB
ADB

67
Asia Data Base’ (CADB) at the University of Idaho compiled by Vladimir Aizen. A more-detailed analysis of these
data is beyond the scope of this study, but would undoubtedly provide useful insights into the climates of the
western Tien Shan Mountains.
Based on a regression of the CADB temperature data, the mean summer season 0oC isotherm is estimated
to be slightly above 4,000 m a.s.l., a first approximation of the altitude that separates the zones of ablation and
accumulation on the mountain glaciers and is assumed to define the regional snow line in the western Tien Shan
Mountains (Figure 38). Any precipitation falling above this altitude is assumed to fall as snow, and enter into either
seasonal storage as snow, or become perennial snowfields and glaciers. It is a useful baseline against which
estimates of climate change may be tested. As the climate warms, the altitude of the 0°C isotherm is assumed to
move upwards on the glaciers, causing melt affecting both the periglacier snowfields, as well as he glaciers (Alford
et al., 2009; IPCC, 2014).
Figure 38. Air temperature lapse rate during the summer season (June to September)
in the Syr Darya Basin. Visual extrapolation indicates that the altitude of the summer-
season 0°C isotherm is slightly above 4,000 m a.s.l.
Seasonal temperatures at the altitude of the projected summer-season 0°C isotherm reflect the
temperature environment at an altitude only a few hundred meters below this line (Figure 39). These
data, from the CADB station ‘Tien Shan’ at an altitude of c. 3,600 m a.s.l. have been separated into a
‘winter season’ from October to March and a ‘summer season’ from April to September. Even at this
altitude, several hundred meters below the Syr Darya glaciers, average summer temperatures are only
slightly above the freezing level.
y = -0.0066x + 27.5 R² = 0.883
0
5
10
15
20
25
500 1,000 1,500 2,000 2,500 3,000 3,500 4,000
Tem
pe
ratu
re (
C◦ )
Altitude (m a.s.l.)

68
Figure 39. Long-year record of mean winter and summer temperatures for the climate station
‘Tien Shan’ at 3,600 m a.s.l. in the western Tien Shan.
An assessment of the role of glaciers in the stream flow of the Syr Darya is complicated by the fact that,
similar to the seasonal monsoon and the glaciers of the Nepal Himalaya, the season of maximum precipitation in
its headwaters occurs during the summer months, coincident with the ablation season. In general, annual
precipitation is at a maximum at low altitudes in the basin from April to May, and gradually increasing upward to
maximum values in June and July at the highest altitudes for which data are available (Figures 40 and 41). As much
as 50-60% of the total annual precipitation during the summer season occurs during the period of maximum
stream flow, when it is assumed glacier melt and runoff is at a peak.
-25
-20
-15
-10
-5
0
5
10
1930 1940 1950 1960 1970 1980 1990 2000
Tem
pe
ratu
re (
ᵒC)
Year
Temperature Record for the Climate Station 'Tien Shan'
Average Winter Temperature Average Summer Temperature

69
Figure 40. Monthly precipitation at different locations in the Syr Darya Basin. The seasonal maximum
values of precipitation are between 3-4 months earlier at low altitudes than in the mountain basins. The
seasonal precipitation maximum at the higher altitude stations during the ablation period in the
summer season suggests that a portion of annual glacier melt water runoff is produced by summer
precipitation by both rain and snow melt.
Figure 41. Variation of the fraction of summer season (June to August)
precipitation of the total annual precipitation in the upper Syr Darya Basin.
Precipitation during the summer season, which is assumed to be the period of
maximum glacier melting, is also the season of maximum precipitation at the
general altitude of the glaciers above 3,000 m a.s.l.
0
10
20
30
40
50
60
70
80
90
100
Jan Feb Mar Apr May Jun Jul Aug Sep Oct Nov Dec
Monthly Precipitation in the Upper Syr Darya Basin
Tien Shan, 3614 m Bishkek, 759 m Isfana, 1925 m
Dolon, 3040 m Naryn, 2039 m Andijian, 497 m
0
500
1,000
1,500
2,000
2,500
3,000
3,500
4,000
0.00 0.10 0.20 0.30 0.40 0.50 0.60
Alt
itu
de
(m
a.s
.l.)
Percent
Fraction of the Summer Season Precipitation in the Upper Syr Darya Basin

70
This orographic gradient of precipitation complicates the application of basic glacier mass balance concepts
to an analysis of the annual runoff resulting from melting below the glacier ELA. It appears that there is rain during
the ablation season either on, or very near, the glacier ablation zone. This means that the runoff immediately
downstream from the glacier terminus, as well as at the mouth of the glacierized basin, is a result of both glacier
melt and rain, with no obvious procedure available to separate the two.
6.4. Hydrology
Mean annual stream flow data were available from the global Runoff Data Centre (GRDC, 2014). Twenty-
two of these stations were within or immediately adjacent to the upper Syr Darya Basin. Data from these twenty-
two monitoring stations are used as the basic hydrological database of this study. Data describing the mean
monthly values for two stations in the Naryn Basin—Naryn and Uch Kurgan (UCAR, 2014)—were found a limited
consideration of the annual hydrograph of a glacierized basin.
The hydrology of the upper Syr Darya has the following characteristics:
(i) The mean annual flow volume of the Syr Darya is estimated to be 37 km2; in the Upper Syr Darya Basin
it is estimated to be 25 km3.
(ii) The mean annual flow of the Naryn River at Uch Kurgan below the Fergana Cascade is 12 km3.
(iii) The mean annual flow of the Kara at the confluence with the Naryn River forming the Syr Darya is
5 km3.
(iv) The mean annual flow from the small basins on the north side of the Alai Mountains is 1 km3.
(v) Specific runoff (runoff depth per unit area) varies from less than 50 mm at Bekabad, where the Syr
Darya leaves the Fergana Valley, to 700 mm on the south flank of the Fergana Range. Most mountain
stations have values near 200 mm.
(vi) The total volume of water entering the Upper Syr Darya in the Fergana Valley from all sources (Naryn,
Kara, and Alai Mountains) is 18 km3, while outflow from the Fergana River at Bekabad at the western
end of the Fergana Valley is 7 km3, which is a decrease in volume of 11 km3.
A useful comparison of the importance of precipitation in the hydrology of a basin is specific runoff (Bq), the
mean depth of runoff from a basin, in millimeters. Specific runoff is determined by dividing the runoff volume by
the surface area of the basin. Specific runoff provides an indicator of the potential impact of projected increases
or decreases of precipitation on the stream flow of a basin. In general, the runoff efficiency (Q/P) is high for
mountain catchment basins, i.e. specific runoff serves as a useful index of precipitation as well as of any changes

71
in that precipitation. The specific runoff in the headwater basins of the Syr Darya ranges from slightly over
100 mm to over 700 mm (Figure 42).
Figure 42. Specific runoff (mm) for the gauged basins at the headwaters of the Syr Darya.
Runoff volume in the Upper Syr Darya is primarily from the Naryn Basin. At the confluence with the Kara,
both rivers contribute a combined c. 17 km3 to the Syr Darya (Table 17). An additional c. 1 km3 flow volume is
added from the small basins on the north slopes of the Alai Mountains, for a total flow volume of c. 18 km3 within
the Fergana Valley.
Table 17. Mean values for the period-of-record for stream flow and glacierized area for nineteen basins
within the Tien Shan, Alai, and Fergana mountains, together with glacier area. Data have been
downloaded from the Global Runoff Data Center (GRDC) in Koblenz, Germany, and are sufficient for
calibrating early tests of the Ablation Gradient Model. (Q: stream flow or discharge; BQ: total basin
runoff; Bq: specific basin runoff; MCM: million cubic meters).
Basin Area
(km2)
Mean
Altitude
(m a.s.l.)
Glacier
Area
(km2)
Q
(m3/s)
BQ
(MCM)
Bq
(mm)
Naryn River Naryn 11,009 3,553 822 86 2,715 260 Ust Kekerim 17,671 3,054 100 118 4,202 190 Ust Kairagash 6,121 3,035 144 9 279 590 Ust Djumbol 8,896 2,818 104 79 2,475 470 Toktugul
Reservoir
12,101 2,847 50 --- --- --- Uch Kurgan 5,863 1,777 0 75 2,263 390 Aflatun 2,179 2,042 5 10 315 150
Total 63,848 --- 1,226 --- 12,249 ---
0
100
200
300
400
500
600
700
800
TASH
-KU
RG
AN
GA
YA
SAR
YKA
ND
A
DA
ZGO
N
AN
DA
RH
AN
PA
ULG
AN
UC
H-K
OR
GO
N
MIK
HA
ILO
VSK
OE
AK
TASH
SALA
MA
LIK
GU
LCH
A
AFL
ATU
N
UST
. DJU
MG
OL
CH
ALM
A
CH
AR
VA
K
CH
AN
GET
TULE
KEN
UST
. KA
RA
KO
L
UST
. KA
IRA
GA
CH
UC
H-K
UR
GA
N
UST
. KEK
IRIM
DO
NG
UZT
AY
NA
RYN
Spe
cifi
c R
un
off
(m
m)
Specific Runoff in Basins of the Upper Syr Darya

72
Kara River Ust Karakol 1,724 2,579 52 9 284 170 Tuleken 2,557 3,026 128 20 630 260 Gulcha 2,122 3,012 30 16 504 180 Chalma 4,174 3,115 156 47 1,481 430 Aktash 942 3,118 39 21 655 720 Salamalik 2,709 2,081 5 22 693 590 Charvak 1,301 2,219 6 29 914 700
Total 15,589 --- 416 --- 5,161 --- Chirchik River
Chirchik 11,714 2,577 181 218 6,867 570
Total 11,714 --- 181 --- 6,867 --- Syr Darya (Alai)
Paulgan 1,493 2,733 39 10 315 240 Tash-Kurgan 3,439 2,266 111 14 441 290 Andrahan 2,220 2,222 28 6 189 110 Dazgon 755 2,808 9 3 95 130 Ungauged* 3,199 3,205 302 --- --- ---
Total 11,106 --- 489 --- 1,040 --- *This ungauged sub-basin was excluded from the hydrologic modeling.
6.4.1. Variability of Stream Flow
The Naryn gauging station at 2,039 m a.s.l. provides the only data source available for this study for
assessing the relationship between stream flow and glacier melt in the Syr Darya Basin. The station is located
immediately downstream from the main concentrations of glacier ice in the Naryn Basin, and can therefore be
expected to respond most directly to glacier melt water.
The interannual variability of stream flow at this station is c. 25-35% of the long-term mean flow (Figure 43).
There is no indication that any increase or decrease in the mean or extreme flows have occurred during the
period-of-record, 1940-1985.
0
20
40
60
80
100
120
1935 1940 1945 1950 1955 1960 1965 1970 1975 1980 1985 1990
Stre
am F
low
(m
3 /s)
Year
Interannual Variability of Stream Flow of Nary River at Naryn

73
Figure 43. The interannual variability of stream flow at the Naryn gauging station near the headwaters of the Naryn River
between 1940 and 1985.
The primary problem in analyzing the annual hydrograph from Naryn involves the summer-season
precipitation peak at high altitudes in the basin discussed above. Since both precipitation maximum and summer-
season glacier melt occur during the summer months, separation of the two as components of the annual runoff is
a more difficult matter than in the nearby Pamirs. The hydrograph has a seasonal peak flow in July, with a
secondary, lower, peak in August, before the recession phase begins (Figure 44). A comparison of the monthly
precipitation in the Upper Naryn Basin with the monthly specific runoff at the Naryn gauging station provides
some indication of the relationship between the two (Figure 45). Monthly precipitation reaches maximum values
during May and June, while runoff peaks in June to August. It is assumed that all runoff prior to the beginning of
glacier melt is a result of precipitation input. The July peak is assumed to represent both precipitation and glacier
melt, while the secondary peak in august is largely glacier melt.
Figure 44. Mean period-of-record monthly stream flow volume at the Naryn gauging
station. The two summer peaks reflect the joint contribution of summer-season
precipitation in the basin, together with glacier melt.
jan feb mar apr may jun jul aug sep oct nov dec
Naryn 26 25 26 47 115 200 238 206 86 45 33 28
0
50
100
150
200
250
Stre
am F
low
(m
3/s
)
Annual Hydrograph for the Naryn River at Naryn

74
Figure 45. The annual trend of precipitation and specific runoff. The excess of runoff over
precipitation during the months of August and September is assumed to be largely glacier melt
runoff.
Based on hydrograph analysis, it is estimated that the total volume of stream flow during the months of July
to September at Naryn is 1.4 km3. Based on the ablation gradient analysis it is estimated that the summer-season
glacier runoff is 0.8 km3. The approximate recession volume for the period June to September from a peak flow in
June is on the order of 0.7 km3. Both numbers give a total volume of 1.5 km3, which provides a rough estimate of
the relatively equal contribution of precipitation and glacier melt of the summer stream flow at this station. With
increasing distance downstream from the glaciers, as a result of dilution by precipitation, the glacier fraction of
total stream flow decreases to c. 10% of the total flow volume where the Naryn River reaches the Fergana Valley.
6.4.2. Glacier, Snow, and Rainfall Runoff
The glaciers at the headwaters of the Syr Darya—in the Naryn and Kara basins and the small basins on the
north slopes of the Alai Mountains—contribute 1.4 km3 to the mean annual stream flow volume of 18 km3 in the
Fergana Valley (Tables 18 and 19; Figure 46). The primary source of the glacier runoff is the Naryn Basin
contributing almost 1 km3. The contribution attributed to ‘Other’ is intended to include both rainfall and snow
melt. Figure 47 illustrates graphically the relative glacier contribution of each of the tributaries to the upper Syr
Darya.
Table 18. Components of runoff in the mountain basins of the upper Syr Darya Basin (SDB).
Syr Darya Chirchik1
Naryn Kara Alai Mountains ‘Fergana’2
jan feb mar apr may jun jul aug sep oct nov dec
Q, mm 7 7 7 23 43 55 65 56 24 13 9 8
Naryn P, mm 10 12 21 32 56 56 38 22 14 16 14 11
0
10
20
30
40
50
60
70
Pre
cip
itat
ion
an
d R
un
off
(m
m)
Precipitation and Specific Runoff in Naryn

75
(km3) (%) (km
3) (%)* (km
3) (%)* (km3) (%)* (km
3) (%)* (km
3) (%)*
Total Runoff (BQ) 25.4 --- 6.9 --- 12.3 --- 5.2 --- 1.0 --- 18.5 --- Contribution to SDB --- --- --- 27 --- 48 --- 21 --- 4 --- 73
Glacier Melt Runoff (GQ) 1.5 5.9 0.1 2 1.0 8.1 0.3 5.8 0.1 10.0 1.4 8 Contribution to SDB GQ --- --- --- 7 --- 67 --- 20.0 --- 6.7 --- 93 Contribution to SDB BQ --- --- --- >0 --- 4 --- 1.2 --- 0.4 --- 6
“Other”3 Runoff (SRQ) 23.9 94.1 6.8 98 11.3 92 4.9 94 0.9 90 17.1 92
Contribution to SDB SRQ --- --- --- 28 --- 47 --- 21 --- 4 --- 72 Contribution to SDB BQ --- --- --- 27 --- 45 --- 19 --- 4 --- 67
1 The Chirchik Basin is downstream from the confluence of the Naryn and Kara rivers. 2 The Naryn, Kara, and Alai Mountain basins in the Fergana Valley catchment are upstream from the confluence of the Naryn and Kara rivers. 3 “Others” combines runoff from snowmelt and rain.
* Rounded numbers might lead to erroneous sums.
A B
C D
E F

76
Figure 46. Components of runoff in the mountain basins of the Upper Syr Darya Basin. (SDB: Upper Syr Darya Basin; BQ:
total basin runoff; GQ: glacier melt runoff; SRQ: snowmelt AND rain runoff = “Other”).
Table 19. Annual volumes of total basin runoff (BQ),
glacier melt runoff (GQ), and runoff from both snow
melt and rain (‘Other’) in basins in the Syr Darya
headwaters. (MCM: million cubic meters).
Basin BQ
(MCM)
GQ
(MCM)
‘Other’
(MCM)
Naryn 2,715 822 1,893 Ust. Kairagach 279 144 135 Chalma 1,486 156 1,330 Gulcha 502 30 472 Tuleken 645 128 517 Uch-Korgon 669 82 587 Paulgan 305 39 266 Tash-Kurgan 435 111 324 Dazgon 98 9 89 Ust-Djumgol 2,475 104 2,371 Charvak 903 6 897 Afluntun 326 5 321 Ust Karakol 284 52 232 Andrahan 297 28 269 Charvak 903 6 897
Figure 47. Components of runoff in the mountain basins of the Upper Syr
Darya Basin representing the diversity of hydro-meteorological
environments. While aggregated mean data provide useful forecasts of
total runoff into the rivers of the adjacent lowlands, they provide little
insight into the role of individual water budget components, such as
Naryn Kara Darya Chirchik Alai
Total Q 12249 5161 6867 1040
Glacier Q 1008 311 74 118
Other 11241 4850 6793 922
0
2,000
4,000
6,000
8,000
10,000
12,000
14,000
Stre
am F
Low
(M
CM
)
Stream Flow Components in the Syr Darya Basin

77
glaciers, in stream flow formation. (Q: runoff; ‘Other’: undifferentiated
runoff from snowmelt and rain; MCM: million cubic meters).
While glacier ablation contributes to the runoff in the Syr Darya Basin, it is apparent that a combination of
snow melt and summer precipitation is the major component in the runoff from glacierized basins in the western
Tien Shan Mountains. A potential complete disappearance of the glaciers will have a minimal impact on the water
resources of the Upper Syr Darya Basin. The role of precipitation is far more important here.

78
7. STREAM FLOW AND CLIMATE CHANGE
Most problems dealing with the climate and hydrology of high mountain glacier basins can be reduced to
the interaction of topography (altitude, aspect, slope) and meteorology (the properties and processes of the
surrounding air mass). Large mountain ranges may project upward from a warm, humid climate at the mountain
base into the mid-troposphere in a horizontal distance of a few tens of kilometers. The mountains of Asia all
project into this cryosphere, the accumulation zone of glaciers and perennial snowfields. Immediately below the
cryosphere is the periglacier zone, the ablation zone of glaciers and seasonal snowfields. There is no sharp
transition between the two, but rather a zone that fluctuates up and down seasonally, depending upon the
changing balance between mass (as snow) gain and loss as a result of changes in precipitation and temperature.
This is the zone of the equilibrium line altitude (ELA) of a glacier. The application of climate change forecast
projections such as CMIP5 to high mountain hydro-meteorological environments presents a number of challenges
related to this topo-climatological complexity.
It is now generally agreed (e.g., IPCC, 2014) that the effect of the temperature increase associated with
climate change will result in the upward migration of the glacier ELA. For this study, the air temperature gradient
has been assumed to have a lapse rate of 0.65°C/100 m. All other factors being equal, for each 1°C air temperature
increase, the glacier ELA will move upward on the glacier by 130 m. The CMIP5 temperature projections range
from ±0°C to +6.1°C implying either no change in the ELA at all or an upward migration of 900 m from its current
altitude of between 4,500 and 5,000 m a.s.l. Under all options, except the no-change option, the volume of glacier
melt water will decrease.
The precipitation amounts in the CMIP5 projections (Tables 20 and 21) present a different problem. In the
water cycle, precipitation may follow three different paths:
(i) immediate runoff as quick flow,
(ii) seasonal storage as snow and ground water, or
(iii) long-term storage in perennial snow fields and glaciers.
Table 20. Projections covering all GCMs (included in CMIP5) and 4 scenarios for radiative forcing (‘emissions’) scenarios for 2011-2040
(against 1976-2005 baseline).
P (mm) JAN FEB MAR APR MAY JUN JUL AUG SEP OCT NOV DEC YEAR MEAN Max 8.2 9.7 13.4 20.1 34.2 19 12.6 12 11.7 16.6 12.5 12 182 --- Min -5.5 -8.5 -11 -10.8 -13.8 -13.1 -12.5 -13.3 -11.7 -11.4 -11.4 -11.8 -135 --- Mean 2.1 1.5 3.2 4.6 3.2 1.6 0.7 0.2 -0.4 0.9 1.7 2.6 21.9 ---
T (°C) JAN FEB MAR APR MAY JUN JUL AUG SEP OCT NOV DEC YEAR MEAN Max 2.7 2.6 3.6 2.5 2.6 2.3 2.8 3.4 2.9 3.5 2.4 3.2 34.5 2.9 Min -0.2 -1.5 0.1 0.1 0 0.1 0.3 0.2 0.2 -0.2 0.2 0.3 -0.4 0 Mean 1.2 1.3 1.3 1.1 1.2 1.2 1.3 1.4 1.5 1.4 1.3 1.4 15.6 1.3

79
Table 21. Projections covering all GCMs (included in CMIP5) and 4 scenarios for radiative forcing (‘emissions’) scenarios for 2041-2070
(against 1976-2005 baseline).
P (mm) JAN FEB MAR APR MAY JUN JUL AUG SEP OCT NOV DEC YEAR MEAN Max 17 14.2 18.8 32.3 44.4 20.6 14.7 14.7 9.7 22.6 16 15.7 240.7 --- Min -8.2 -19.2 -18.4 -16.4 -18 -22.3 -21.8 -19.5 -15 -11.1 -15.3 -11.6 -197 --- Mean 3.4 3.1 4.5 7.6 4.6 1.4 -1.6 -1.4 -1.6 0.9 3.1 3.9 27.9 ---
T (°C) JAN FEB MAR APR MAY JUN JUL AUG SEP OCT NOV DEC YEAR MEAN Max 5.1 4.9 6.4 5.9 5.4 5.5 6.7 8.1 7.3 6.2 5 6.4 72.9 6.1 Min 0.4 0.1 0 0.3 0.1 0.2 0.6 0.4 -0.1 0.4 0.4 0.4 3.2 0.3 Mean 2.4 2.4 2.4 2.2 2.3 2.3 2.6 2.8 2.7 2.6 2.5 2.7 29.9 2.5
In the high mountains of Asia, as a result of the extreme relief of the mountains, it is not uncommon to find
characteristics of climates ranging from humid, sub-tropical to arid, cold deserts existing simultaneously within a
single catchment basin. At any given moment, precipitation may be occurring as rain in the lowland piedmont, as a
rain-snow mix at the mid-altitudes in the montane belt, and as perennial snow and ice in the alpine. The resulting
partition of this precipitation as runoff, seasonal or perennial storage—reflected by runoff timing and volume at
the mouth of the basin—will vary among mountain basins depending on the basin hypsometry and the existing
hydrologic regime. The CMIP5 scenarios give no guidance on this matter. As a first approximation in evaluating the
CMIP5 precipitation scenarios, it has been assumed that the intent is that all precipitation becomes quick flow
runoff, with the following caveats.
Precipitation occurs during the winter months as snow in the headwater basins of the Amu Darya. For the
Panj River, with an area of c. 61,000 km2 in the mountain basins, an increase of the maximum CMIP5 precipitation
forecast of 240 mm will almost double the normal snow pack water equivalent depth. This will become summer
runoff with the potential of doubling the flow of the Panj River. For the Vakhsh River, with an area of c. 20,000 km2
in the mountain basins, an increase in the winter snow of 240 mm will have much less impact, resulting in an only
25% increase in summer runoff volume. In both cases, the timing of the runoff will depend on the summer
temperatures.
For the Syr Darya, the available precipitation data indicates that 50-60% of the annual precipitation in the
mountain basins falls as rain during the months of June to September. It is assumed that this will become quick
flow. The remainder will be winter snow that will be melting at the same time, resulting in roughly a doubling of
runoff volumes largely independent of any temperature changes.
From the standpoint of hydrological analyses, a problem presented by the CMIP5 forecast projects is the
large number of combination and permutations of temperature and precipitation involved. The maximum
decreases in precipitation projected by CMIP5 will result in a major decrease in stream flow volumes in the
headwaters of both the Amu Darya and Syr Darya basins. The maximum increases in values will result in serious
flooding. At least two CMIP5 combinations—of maximum precipitation with average or minimum temperature
changes—may result in rapid glacier growth and advance throughout the Pamir-Karakoram-Himalaya mountains
similar to that of the Little Ice Age as a result of increase snow fall in the accumulation zones of the glaciers. The
hydrological consequences of such an advance are beyond the scope of this study.

80
7.1. Amu Darya Mountain Basins
Current conditions of stream flow volume, together with glacier melt and snowmelt volumes are shown in
Tables 22 and 23 on the line marked ‘base line’. Below that line are the average values of temperature increase, or
precipitation increase/decrease derived from the GCM scenarios in Tables 20 and 21. It is assumed that the
change in temperature or precipitation will not be instantaneous at the beginning of the period, but will occur
gradually, reaching the value given in the GCM scenario at the end of the period. Furthermore, it is assumed that
precipitation increases in climate change scenarios will involve snow that contributes to runoff without losses as
snowmelt during the summer season. The stream flow volumes resulting from the combinations and permutations
of air temperature and precipitation scenarios from GCM scenarios are illustrative and not inclusive. The total
range of values for glacier runoff and snowmelt runoff are included, making it possible to evaluate any change
combination of interest.
Table 22. Forecasts of changes in basin stream flow volume, glacier
component of stream flow, and snow melt component of stream flow for
the Panj River based on the scenarios taken from Tables 20 and 21. (BQ:
total basin runoff; GQ: glacier melt runoff; SQ: snowmelt runoff; MCM:
million cubic meters).
2011-2040 Scenarios
Parameter Change BQ
(MCM)
GQ
(MCM)
SQ
(MCM) ‘Baseline’ --- 23,251 4,871 18,380 T (°C) +1.3 21,594 3,214 18,380 T (°C) ±0 23,251 4,871 18,380 T (°C) +2.9 20,446 2,066 18,380
P (mm) +182 36,230 4,871 31,359 P (mm) -135 13,623 4,871 8,752 P (mm) +21.9 23,653 4,871 18,782
2041-2070 Scenarios Parameter Change BQ
(MCM)
GQ
(MCM)
SQ
(MCM) ‘Baseline’ --- 23,251 4,871 18,380 T (°C) +0.3 23,351 4,971 18,380 T (°C) +2.5 20,441 2,061 18,380 T (°C) +6.1 18,562 182 18,380
P (mm) +240.7 40,343 4,871 35,472 P (mm) -197 9,206 4,871 4,335 P (mm) +27.9 24,819 4,871 19,948
Table 23. Forecasts of changes in basin stream flow volume, glacier
component of stream flow, and snow melt component of stream flow for
the Vakhsh River based on the scenarios taken from Tables 20 and 21. (BQ:
total basin runoff; GQ: glacier melt runoff; SQ: snowmelt runoff; MCM:
million cubic meters).
2011-2040 Scenarios
Parameter Change BQ
(MCM)
GQ
(MCM)
SQ
(MCM) ‘Baseline’ --- 17,168 5,620 11,548

81
T (°C) +1.3 15,642 4,094 11,548 T (°C) ±0 17,168 5,620 11,548 T (°C) +2.9 14,881 3,333 11,548
P (mm) +182 20,864 5,620 15,244 P (mm) -135 14,426 5,620 8,806 P (mm) +21.9 17,613 5,620 11,993
2041-2070 Scenarios Parameter Change BQ
(MCM)
GQ
(MCM)
SQ
(MCM) ‘Baseline’ --- 17,168 5,620 11,548 T (°C) +0.3 17,168 5,320 11,548 T (°C) 2.5 14,920 3,372 11,548 T (°C) 6.1 11,966 418 11,548
P (mm) +240.7 22,057 5,620 16,310 P (mm) -197 14,893 5,620 9,273 P (mm) +27.9 17,500 5,620 11,880
7.2. Syr Darya Mountain Basins
The glaciers in the Upper Syr Darya Basin cover 2,296 km2 and consist of several hundred small cirque
glaciers, located in basins adjacent to the local ridge crest in the Alai and Fergana mountains and in the Naryn
Basin. Results from the ‘Ablation Gradient Model’ (AGM) analysis indicate that these glaciers produce 1.5 km3 of
runoff annual under the current climate. For this analysis, the ELA, an indicator of the current glacier climate, was
at 4,100 m a.s.l. A primary indicator of increasing temperatures as a result of climate change in the mountains is
the upward migration of the ELA with increasing temperature. This is the primary indictor of the impact of the
CMIP5 climate change scenarios used in the analyses with the AGM (Table 24). A problem with this approach
involves the scale of the AGM at 100 m altitudinal bands. This restricts the temperature increases in the climate
change scenarios to multiples of the air temperature lapse rate of -0.65°C/100 m. While any of the temperatures
considered in CMIP5 can be rounded off to a corresponding altitudinal increase in the ELA, this may result in an
altitudinal increase of, for example, 150 m, which then must be rounded off to the nearest 100 m increment to be
used in the calculations. This procedure can result in an error in the estimated loss of area. The magnitude of this
‘area error’ will be determined by the hypsometry of the glaciers at the altitude of the ELA. In the case of the
glaciers in the Syr Darya Basin, it will vary initially from c. 100 km2, for the glaciers in the Naryn Basin to c. 10 km2
for the glaciers in the Chirchik Basin. As the ELA moves upward, the error will diminish with the decrease in the
areas of the altitudinal bands.
Table 24. Forecasts of changes in basin stream flow volume, glacier component of
stream flow, and snow melt component of stream flow for the Syr Darya Basin
based on the scenarios taken from Tables 18 and 19. (BQ: total basin runoff; GQ:
glacier melt runoff; ‘Other’ Q: snowmelt and rain runoff; MCM: million cubic
meters).
2011-2040 Scenarios Parameter Change BQ
(MCM)
GQ
(MCM)
‘Other’ Q
(MCM) ‘Baseline’ --- 17,410 1,738 16,100 T (°C) +1.3 17,035 935 16,100 T (°C) ±0 17,410 1,738 16,100

82
T (°C) +2.9 16,100 0 16,100 P (mm) +182 34,196 1,738 32,458 P (mm) -135 5,758 1,738 4,020 P (mm) 21.9 18,192 1,738 17,967
2041-2070 Scenarios Parameter Change BQ
(MCM)
GQ
(MCM)
‘Other’ Q
(MCM) ‘Baseline’ --- 17,410 1,738 16,100 T (°C) +0.3 17,410 1,738 16,100 T (°C) +2.5 16,245 145 16,100 T (°C) +6.1 16,100 0 16,100
P (mm) +241 39,392 1,738 37,654 P (mm) -197 1,728 1,738 0 P (mm) +27.9 17,388 1,738 15,650
An interesting characteristic of the glaciers in the Syr Darya Basin is that a significant amount of the
measured annual precipitation at altitudes near the glacier ablation zones occurs during the summer months. For
traditional mass balance calculations, the summer months are assumed to being dominated by melt, and that the
major component of summer season runoff is glacier melt. In the Syr Darya mountain basins, this does not appear
to be the case. It is assumed that the cirque glaciers of the western Tien Shan Mountains exist as the result of wind
redistribution of the winter snow into the cirque basins, while runoff from these basins is primarily from summer
rain. All estimates of the climate change scenarios in CMIP5 for the Syr Darya must be considered in terms of these
caveats. The implications of the climate change scenarios in CMIP5 are that projected temperature increases will
have a relatively small impact on annual stream flow, while projected precipitation variations

83
8. DISCUSSION
The interest that has been expressed in the potential impact of the glaciers on stream flow in the high
mountains of Asia may be interpreted as a tacit recognition of the important role of mountains in determining the
water availability for much of Asia. At the same time, recent concerns related to climate change, retreating
Himalayan glaciers, and potential impacts on stream flow have served to illustrate the very limited understanding
that exists in the scientific and water management communities of the hydrologic regimes in the headwaters of
many major river systems, and the supply-use problems faced by the countries of the region. Recent studies of the
Asian glaciers have emphasized a number of basic problems involving the reliability of the procedures being used
in analyses.
The hydro-meteorological monitoring program in the Pamir and Tien Shan mountains headwater basins that
involved the collection of data describing the climate, stream flow and glacier environments, came to an end with
the breakup of the Soviet Union in 1989. This appears to have resulted in no or only very limited data collection
for c. 25 years. Those data that do exist have not been digitized, and may be available only by meeting with the
appropriate government agency in each river basin. At the same time, those that are available, such as historical
stream flow records from Nepal, Pakistan and Tajikistan, are commonly being ignored.
Because of an apparent lack of immediately useable ‘ground-truth’ information, a number of investigators
have begun using data from accessible global databases, GCMs, and satellite imagery of a comparable scale, such
as MODIS or GRACE. This shift has meant the introduction of procedures for generating regional components of
climates—at the macro-scale with a grid spacing of 50 km or a pixel resolution of 500 m—that can then be tested
statistically against monthly or annual values of runoff volume. These procedures generally produce stream flow
estimates that are consistent with measured values, but cannot differentiate among the various components of
the basin water budget—glaciers, snow melt and rainfall—that may be present.
Glacier area, and the division of that area into zones of accumulation and ablation, is basic to any
assessment of glacier runoff. At the present time, there is no generally accepted value for these parameters in any
of the high mountains of Asia, or of individual river basins in any of those mountain ranges. For the moment, at
least, each study must choose from among a range of conflicting values, and scales. At a minimum, criteria could
be developed, defining such factors as source, scale, date, of the imagery and procedures used in estimation of
glacier area that would permit users without a background in GIS to evaluate the data.
It has been an accepted practice in many of the evaluations of the relationship between climate change and
glacier retreat to consider the glacier retreat to be solely a response to an increase in air temperature. Basic
glacier dynamics require that any change in a glacier terminus must be interpreted as the interaction among
accumulation, ablation and ice dynamics. Of the three, only ablation can be related directly to changes in air
temperature. Even then, this relationship is actually a proxy of a complex energy budget involving both radiation,
and sensible heat exchange. Some success in quantifying all three factors has been achieved in studies of the
glacier-climate relationship in the European Alps. The challenge is to develop estimation techniques for
accumulation and glacier dynamics for the high mountains of Asia that would serve the same purpose as the
ablation gradient model. This will necessitate the development of procedures that will permit the scaling up of the
critical parameters defining accumulation and flow processes from the mid-altitude range of Alpine glaciers to the
extreme altitudes of those in Asia.

84
To meet the immediate needs of water resources planning and management for the mountain rivers of Asia,
the primary need at the present time is the development of short-term, seasonal, runoff forecast procedures for
the mountain basins to permit some quantification of the ongoing debates concerning questions of water supply
and use. This will require the establishment of monitoring program involving satellite imagery analysis and field
measurements of the crucial variables defining the hydrometeorology of these complex high mountain systems.
The monitoring program will need to consider the interactions of climate, glaciers, and stream flow in the Amu
and Syr Darya headwater catchment basins as a factor in monitoring network design. From the standpoint of the
findings of this study, the most important, and perhaps the simplest to implement, is a network of sites for the
measurement of snow water-equivalent depth in the headwater basins of both the Amu Darya and Syr Darya.
Some key design elements for building a monitoring program in these headwaters and to enhance
availability of data for climate impact predictions include the following (from World Bank, 2014):
Monitoring Site and Instrument Selection
A representative site location (the primary altitudinal zone of specific and total volume runoff, ice cover area and glacier ablation is generally 3,000-6,000 m);
Refurbishment or upgrading of existing sites to a working condition to allow continuity of earlier data collection programs;
Simpler setups and devices, which are more reliable than the advanced setups and devices that are scattered—and often broken or unmaintained—across the region;
Locations in the glacierized headwaters of streams that have importance for water management (for hydropower, irrigation and water supply);
Sites that are accessible for as long as possible throughout the year, with the exception of satellite stations;
En route support from villages and establishment of telecommunication links.
Personnel / Training and Safety
Local, well-trained technical personnel for observations, maintenance and station surveillance to reduce travel and mission costs and time lags (this is technically feasible through adequate capacity-building programs that enable local personnel to perform essential technical functions based on well-defined, station-specific standard operating procedures);
Respect for mountain communities as able stakeholders and disaster management professionals;
Teaming of community elders with disaster preparedness specialists to further create a holistic and trusting venue for conveying data and information;
Planning and training for the specific kinds of safety issues that arise with crevasses, avalanches, icefalls and accumulation zones where there is deep snow, with the help of qualified and experienced mountaineers.
Data Collection and Management
An agreed data policy covering the different data streams the program will monitor; data lose value if not managed in a transparent and replicable manner (general guiding principles are outlined here);
Emphasis on acquisition and analysis of existing climate data over further development of the monitoring network;
Equal, nonhierarchical access to all program data for all partners and the establishment of a web-based metadata catalog and archiving system;

85
Designation of data providers as the owners and custodians of the data they generate, even if the data are pooled or aggregated in program-related databases and data management systems;
Publication of selected data for the general public in a fashion agreed to by program partners;
Design and implementation of a rigid data quality control procedure that all data must undergo.
Implementation
A program consortium group of partners that meets for the program commencement and periodically thereafter, when major program milestones have been achieved and consensus is needed;
A dedicated group to provide governance of the program (identified national focal points; international organizations; donors and representatives of the hosting regional organization; and invited experts on an ad hoc basis), meeting twice per year;
Implementation and day-to-day monitoring management facilitated through a regional institution or other dedicated center of excellence in one of the participating countries;
A management unit housed within the principal regional organization to ensure day-to-day execution of the program, comprising a scientific officer, technical officer, asset management officer, financial controller and administrative support.

86
9. BIBLIOGRAPHY
Aizen, V, and Aizen, M. 1993. Glacier Runoff Estimation and Simulation of Stream flow in the Peripheral Territory
of Central Asia. Proceedings of the Snow and Glacier Hydrology Symposium, Kathmandu, Nepal, November
1992, IAHS Publication, 218, 1993.
Aizen, V., Aizen, M., and Melack, J. 1995. Precipitation, melt and runoff in the northern Tien Shan. Journal of
Hydrology, 186, 229-251.
Aizen, V., Aizen, M., and Dozier, J. 1997. Climatic and hydrologic changes in the Tien Shan, Central Asia. Journal of
Climate, 10.
Aizen, V., 2014, Central Asia Data Base, CADB, Dep’t of Geography, University of Idaho, Moscow.
Alford, D. 1985. Mountain hydrologic systems. Journal of Mountain Research and Development, 5, 349-363.
Alford, D. 1992. Hydrological Aspects of the Himalayan Region. International Centre for Integrated Mountain
Development (ICIMOD), Occasional Paper, 18, Kathmandu, 68 pp.
Alford, D. 2011. Hydrology and Glaciers in the Upper Indus Basin. The World Bank, Technical Report, Washington,
D.C.
Alford, D. 2012. Hydrology and glaciers in the Upper Indus Basin. In: Yu, W. (Ed.), Climate Risks on Water and Food
Security in the Indus Basin of Pakistan, Directions for Development. The World Bank, Washington, D.C.
Alford, D., and Armstrong, R. 2010. The role of glaciers in stream flow from the Nepal Himalaya. The Cryosphere,
4, 469-494.
Alford, D., and Kamp, U. 2013. The Role of Glaciers in the Hydrologic Regime of Asian Mountains: Developing
Baseline Estimates. Presentation at The Impact of Glacier Melting on National and Trans-boundary Water
Systems in Central Asia, United Nations Regional Centre for Preventive Diplomacy for Central Asia Seminar,
Almaty, Kazahkstan, 11-12 April, 2013.
Alford, D., Archer, D., Bookhagen, B., Grabs, W., Halvorson, S., Hewiit, K., Immerzeel, W., Kamp, U., and
Krumwiede, B. 2014. Monitoring of Glaciers, Climate, and Runoff in the Hindu Kush–Himalaya Mountains. The
World Bank, Technical Report, Washington, D.C.
Alford, D., Armstrong, R., and Racoviteanu, A. 2010. Glacier Retreat in the Nepal Himalaya: The Role of Glaciers in
Stream Flow From the Nepal Himalaya. The World Bank, Technical Report, Washington, D.C.
Archer, D., and Fowler, H. 2004. Spatial and temporal variations in precipitation in the Upper Indus Basin, global
teleconnections and hydrological implications. Hydrology and Earth System Sciences, 8, 47-61.
Badenkov, Y. 1990. Sustainable development of the mountainous regions of the USSR. The realities, the role of
science, and research orientations. Mountain Research and Development, 10, 129-139.
Bagla, P. 2009. No sign yet of Himalayan meltdown, Indian report finds. Science, 326(5955), 924-925.
Bahuguna, M., Rathore, B., Brahmbhatt, R., Sharma, M., Dhar, S., Randhawa, S., Kumar, K., Romshoo, S., Shah, R.,
and Ganjoo, R. 2014. Are the Himalayan glaciers retreating? Current Science, 106, 10.
Bajracharya, S., Mehra, S.,Shrestra, F., Bajeracharya, O., Baidya, S. 2014. Glacier Studies in Nepal and decadal
Change from 1908 to 2010 Based on Landsat Data. International Centre for Integrated Mountain Development
(ICIMOD), Research Report 2014/2, Kathmandu.
Batura Glacier Investigation Group. 1979. The Batura glacier in the Karakoram Mountains and its variations.
Scientia Sinica, 22, 958-974.

87
Benn, D., and Gemmell, A. 1997. Calculating equilibrium-line altitudes of former glaciers by the balance ratio
method: a new computer spreadsheet. Glacial Geology and Geomorphology. (http://ggg.qub.ac.uk/papers/
full/1997/tn011997/tn01.html).
Benn, D., and Lehmkuhl, F. 2000. Mass balance and equilibrium-line altitudes of glaciers in high-mountain
environments. Quaternary International, 65/66, 15-29.
Bennett, T., Adams, J., and Lettenmaier, D. 2005. Potential impacts of a warming climate on water availability in
snow-dominated regions. Nature, 438, 17.
Benson, C. 1963. Reconnaissance Snow Studies on Mt. Wrangell, Alaska. Geophysical Institute, University of
Alaska, Final Report prepared for CRREL under Contract No. DA ll-190-ENG-131, 38 pp.
Bolch, T., Menounos, B., and Wheate, R. 2010a. Landsat-based glacier inventory of western Canada, 1985-2005.
Remote Sensing of Environment, 114, 127-137.
Bolch, T., Yao, T., Kang, S., Buchroithner, M., Scherer, D., Maussion, F., Huintjes, E., and Schneider, C. 2010b. A
glacier inventory for the western Nyainqentanglha Range and Nam Co Basin, Tibet, and glacier changes 1976-
2009. The Cryosphere, 4, 419-433.
Bolch, T., Kulkarni, A., Kääb, A., Huggel, P., Cogley, J., Frey, S., Kargel, J., Fujita, K., Scheel, M., Bajracharya, M., and
Stoffel, T. 2012. The State and Fate of Himalayan Glaciers. Science, 335(6079), 310-314.
Braithwaite, R., and Raper, S. 2002. Glaciers and their contribution to sea level change. Physics and Chemistry of
the Earth, 27, 1445–1454.
Braithwaite, R. 2008. Temperature and precipitation climate at the equilibrium-line altitude of glaciers expressed
by the degree-day factor for melting snow. Journal of Glaciology, 54, 437-444.
Bruijnzeel, L., and Bremer, C. 1989. Highland-Lowland Interactions in the Ganges Brahmaputra River Basin: A
Review of Published Literature. International Centre for Integrated Mountain Development (ICIMOD),
Occasional Paper, 11, Kathmandu, 135 pp.
Central Asia Data Base (CADB). 2014. Aizen, V., University of Idah, Moscow, Idaho, U.S.A.
Chevalier, B., Pouyard, B., Mojaisky, M., Bolgov, M., Olsson, O., Bauer, M., and Froebrich, J. 2012. Trends for snow
cover and river flows in the Pamirs (Central Asia). Hydrology and Earth Sciences Discussions, 9, 29-64.
Cogley, J.G. 2005. Extended Format for the World Glacier Inventory. Trent Technical Note 2005-1, Department of
Geography, Trent University, Peterborough, Canada.
Cogley, J.G. 2010. A more complete version of the World Glacier Inventory. Annals of Glaciology, 50, 32-38.
Department of Hydrology and Meteorology (DHM). 1988. Hydrological Records of Nepal, Stream flow Summary,
Updated Version, His Majesty’s Government of Nepal, Ministry of Water Resources, Kathmandu.
Dreyer, N., Nikoklayeva, G., and Tsigelnaya, I. 1982. Maps of stream flow resources in some high-mountain areas
in Asia and North America. In: Glen, J. (Ed.), Hydrological Aspects of Alpine and High-Mountain Area,
International Association of Hydrological Sciences, 138, 11-20.
Dyurgerov, M., and Meier, M. 2004. Glaciers and the Changing Earth System: A 2004 Snapshot. INSTAAR,
University of Colorado at Boulder, Boulder, U.S.A.
Focus Humanitarian Assistance. Unpubished. Village-scale Risk Management in the Pamir Mountains, Tajikistan:
The Lake Sarez Management Project Component II – The Social Component. Focus Humanitarian Assistance,
The Aga Khan Development Network, Dushanbe, Tajikistan.
Frey, H., Paul, F., and Strozz, T. 2012. Compilation of a glacier inventory for the western Himalayas from satellite
data: methods, challenges, and results. Remote Sensing of Environment, 124, 832–884.

88
Fujita, K., Takeuchi, N., and Seko, K. 1998. Glaciological observations of Yala Glacier in the Langtang Valley, Nepal
Himalayas, 1994 and 1996. Bulletin of Glacier Research, 16, 75-81.
Furbish, D.J., and Andrews, J.T. 1984. The use of hypsometry to indicate long-term stability and response of valley
glaciers to changes in mass transfer. Journal of Glaciology, 30, 199-211.
Gardelle, J., Berthier, E., Arnaud, Y., and Kääb, A. 2013. Region-wide glacier mass balances over the Pamir-
Karakoram-Himalaya during 1999–2011. The Cryosphere, 7, 975-1028.
Geiger, R. 1966. The Climate Near the Ground. Harvard University Press, Cambridge, 611 pp.
Giece, E., Sebring, J., and Tronchine, A. 2004. Wassernutzungs-Konflikte in Zentralasien. Zentrum fuer
International Entwicklungs- und Umweltforschung (ZEU), Discussion Paper, 18, Giessen, Germany.
Global Runoff Data Center (GRDC). 2013. WMO, Koblenz, Germany.
Gross, G., Kerschner, H., Patzelt, G. 1976. Methodische Untersuchungen ueber die Schneegrenze in alpinen
Gletschergebieten. Zeitschrift fuer Gletscherkunde und Glazialgeologie, 12, 223-251. (In German).
Haeberli, W., and Hoelzle, M. 1995. Application of inventory data for estimating characteristics of regional climate-
change effects on mountain glaciers: a pilot study with the European Alps. Annals of Glaciology, 21, 206-212.
Haeberli, W., Bösch, H., Scherler, K., Østrem, G., and Wallén, C.C. (Eds.). 1989. Status 1988. World Glacier
Monitoring Service (WGMS), IAHS (ICSI)/UNEP/UNESCO, Zurich, 458 pp.
Haefli, R. 1962. The ablation gradient and the retreat of a glacier tongue. International Association of Hydrological
Sciences, 58, 49-59.
Hagg, W., Hoezle, M., Wagner, S., and Klose, Z. 2011. Estimation of future glaciation and runoff in the Tanimas
Basin, Eastern Pamirs. Hydrology and Earth System Sciences Discussions, 8, 1507-1540.
Hagg, W., Hoelzle, M., Wagner, S., Mayra, E., and Klose, Z. 2013. Glacier and runoff changes in the Rukhk
catchment, upper Amu-Darya basin until 2050. Global and Planetary Change, 110, 62-73.
Hewitt, K. 2005. The Karakoram Anomaly? Glacier expansion and the “elevation effect”, Karakoram Himalaya.
Mountain Research and Development, 25, 332-340.
Hewitt, K. 2007. Tributary glacier surges: an exceptional concentration at Panmah Glacier, Karakoram Himalaya.
Journal of Glaciology, 53, 181-188.
Hewitt, K., Wake, C., Young, G. J., and David, C. 1989. Hydrological investigations at Biafo Glacier, Karakoram
Himalaya, Pakistan: an important source of water for the Indus River. Annals of Glaciology, 13, 103-108.
Hoelzle, M., Chinn, T., Stumm, D., Paul, F., Zemp, M., Haeberli, W. 2007. The application of glacier inventory data
for estimating past climate change effects on mountain glaciers: a comparison between the European Alps and
the Southern Alps of New Zealand. Global and Planetary Change, 56, 69-82.
Hock, R. 2003. Temperature index melt modelling in mountain areas. Journal of Hydrology, 282, 104–115.
Hoinkes, H. (1970) Methoden und Moeglichkeiten von Massenhaushaltsstudien auf Gletschern. Zeitschrift fuer
Gletscherkunde und Glazialgeologie, 6(1-2), 37-89.
Hopkins, P. 1990. The Great Game: The Struggle for Empire in Central Asia. John Murray Publishers, London.
Immerzeel, W., Lutz, A, and Droogers, P. 2012. Climate Change Impacts on the Upstream Water Resources of the
Amu and Syr Darya. Technical Report for the Asian Development Bank.
Immerzeel, W., van Beek, L.P.H., and Bierkens, M.F.P. 2010. Climate change will affect the Asian Water Towers.
Science, 328, 1382-1385.
Intergovernmental Panel on Climate Change (IPCC). 2007. Chapter 10.6 (Case studies) of the IPCC report of the
Working Group II.

89
Intergovernmental Panel on Climate Change (IPCC). 2013. Fifth Assessment Report, Climate Change, 2013, The
Physical Science Basis, Fig FAQ 1, p. 346.
Jenson, I., and Marker, K. 2010. River Basin Modeling of the Amu Darya Basin, Central Asia. Bachelor Project,
Technical University of Denmark, Copenhagen.
Kaser, G., and Osmaston, H. 2002. Tropical Glaciers. Cambridge University Press, Cambridge, 207 pp.
Kayumov, A. Undated. Glaciers Resources of Tajikistan: Conditions of the Climate Change. State Agency for
Hydrometeorology, Dushanbe, Tajikistan.
Klemes, V. 1983. Conceptualization and scale in hydrology. Journal of Hydrology, 65, 1-23.
Klemes, V. 1990. The modeling of mountain hydrology: the ultimate challenge. In: Hydrology of Mountainous
Areas, IAHS Publication 190.
Klemm, W., and Hagg, W. 2012. Climate Impact on Stream Flow in the Amu Daria Basin. Technical Report for the
FAO Investment Centre, Food and Agricultural Organization (FAO) of the United Nations, Rome.
Kotlyakov, Y., and Krenke, A. 1982. Investigations of the hydrological conditions of alpine area by glaciological
methods. In: Roots, F., and Glen, J. (Eds.), Hydrological Aspects of Alpine and High-Mountain Area,
International Association of Hydrological Sciences, 138.
Kotlyakov, V. 1996. Variations of Snow and Ice in the Past and at Present on a Global and Regional Scale.
International Hydrological Programme, IHP-IV, Project H-41, UNESCO, Paris, 78 pp.
Kotlyakov, V., and Varnakova, G. Undated. Glaciers of Asia: Glaciers of the Former Soviet Union. In: Williams, R.,
and Ferrigno, J. (Eds.), Satellite Image Atlas of Glaciers of the World, U.S. Geological Survey, Professional
Paper, 1386-F-1, Washington, D.C.
Konovalov, V. 1982. On methods of regional computation of glacier melting intensity in Central Asia. In: Roots, F.,
and Glen, J. (Eds.), Hydrological Aspects of Alpine and High-Mountain Area, International Association of
Hydrological Sciences, 138.
Kotlyakov, V. 1978. Problems and results of studies of mountain glaciers in the Soviet Union. World Glacier
Inventory, IAHS-AISH Publication, 126.
Kulkarni, A. V. 1992. Mass balance of Himalayan glaciers Using AAR and ELA methods. Journal of Glaciology, 38,
101-104.
Lutz, A., Droogers, P., Immerzeel, W. 2012. Climate change impact and adaptation on the water resources in the
Amu Darya and Syr Darya River Basins. Technical Report for the Asian Development Bank.
Mayer, C., Lambrecht, A., Belo, M., Smirglia, S., and Diolauti, G. 2006. Glaciological characteristics of the ablation
zone of Baltoro glacier, Karakoram, Pakistan. Annals of Glaciology, 43, 123-131.
McKinney, D. 2004. Cooperative management of transboundary water resources in Central Asia. In: Burghart, D.,
and Sabonis-Helf, T. (Eds.), In the Tracks of Tamerlane, Central Asia’s Path into the 21st Century, National
Defense University Press, Washington DC, 187-220.
Meier, M.F., and Post, A.S. 1962. Recent variations in mass net budgets of glaciers in western North America.
International Association of Hydrological Sciences, 58, 63-77.
Middleton, R., and Thomas, H. 2011. Tajikistan and the High Pamirs. Odyssey Illustrated Guides, 704 pages.
National Center for Atmospheric Research and University Cooperation for Atmospheric Research (NCAR/UCAR)
2013. Randolph Glacier Inventory Data Base of Global Glacier Outlines. https://climatedataguide.ucar.edu/
climate-data/randolph-glacier-inventory-data-base-global-glacier-outlines (accessed November 2013).
NRC. 2012. Himalayan Glaciers: Climate Change, Water Resources, and Water Security. The National Academy
Press, Washington, D.C.

90
Ohmura, A. 2001. Physical basis for the temperature-based melt-index method. Journal of Applied Meteorology,
40, 753-761.
Paul, F., Maisch, M., Rothenbühler, C., Hoelzle, M., Haeberli, W. 2007. Calculation and visualization of future
glacier extent in the Swiss Alps by means of hypsographic modeling. Global and Planetary Change, 55, 343-
357.
Porter, S.C. 1975. Equilibrium line altitudes of late Quaternary glaciers in the Southern Alps, New Zealand.
Quaternary Research, 5, 27-47.
Quick, M., and Pipes, A. 1977. U.B.C. Watershed Model. Hydrological Sciences Bulletin, 22, 1-3.
Rabus, B., Eineder, M., Roth, A., and Bamler, R. 2003. The shuttle radar topography mission: a new class of digital
elevation models acquired by spaceborne radar. Journal of Photogrammetry and Remote Sensing, 57, 241-
262.
Racoviteanu, A., Arnaud, Y., Williams, M., and Ordonez, J. 2008. Decadal changes in glacier parameters in the
Cordillera Blanca, Peru, derived from remote sensing. Journal of Glaciology, 54, 499-510.
Racoviteanu, A., Armstrong, R., and Williams, M. 2013. Evaluation of an ice ablation model to estimate the
contribution of melting glacier ice to annual discharge in the Nepal Himalaya. Water Resources Research, 49,
1-17.
Raina, V. 2009. Himalayan Glaciers: A State-of-Art Review of Glacial Studies, Glacial Retreat and Climate Change.
Ministry of Environment and Forests, Government of India, Discussion Paper, Kosi-Katarmal, Almora.
Rasmussen, A., and Tangborn, W. 1976. Hydrology of the North Cascades region, Washington: 1. runoff,
precipitation and storage characteristics. Water Resources Research, 12, 203-216.
Rauser, F., and Geppert, G. (in press). Understanding uncertainty as a key interdisciplinary problem in Earth system
science. In: Webley, P., Riley, K., and Thompson, M. (Eds.), Characterizing Uncertainties in Natural Hazard
Modeling, American Geophysical Union (AGU) Books in Earth and Space Sciences.
Rees, G., and Collins, D. 2004, SAGARMATHA: Snow and Glacier Aspects of Water Resources Management in the
Himalayas. DFID Project No. R7980, An assessment of the potential impacts of deglaciation on the water
resources of the Himalaya, Centre for Ecology and Hydrology, Crowmarsh Gifford, Wallingford, U.K.
Savoskul, O., Chevnina, E., Perziger, F., Vasilina, L., Baburing, B., Danshin, A., Matyakubov, B., and Murakayev, R.
2003. Water, Climate, Food and Environment in the Syr Darya Basin. Contribution to the Project ADAPT, Dutch
Ministry of Foreign Affairs and International Water Management Institute, (IWMI).
Sharma, C. 1977. River Systems of Nepal. Navana Printing Works, Kathmandu, 214 pp.
Sharma, C. 1983. Water and Energy Resources of the Himalayan Block. Navana Printing Works, Kathmandu, 477
pp.
Siegfried, T., Yakolev, A., and Stoll, S. 2013. Climate Change and Impacts in Central Asia: An Overview. Technical
Report to the World Bank.
Tangborn, W., and Rasmussen, L. 1976. Hydrology of the North Cascades region, Washington: 2. a proposed
hydrometeorological stream flow prediction model. Water Resources Research, 12, 187-202.
Tangborn, W., and Rasmussen, L. 1977. Application of a hydrometeorological model to the south-central Sierra
Nevada of California. Journal of Research, U.S. Geological Survey, 5, 33-48.
Thayyen, R., and Gergan, J. 2009. Role of glaciers in watershed hydrology: “Himalayan catchment” perspective.
The Cryosphere, 3, 443-476.
Thompson, M, and Warburton, M, 1985, Uncertainty on a Himalayan Scale, Mountain Research and Development,
5, pp. 115-135.

91
Thornthwaite, C. 1953. Topoclimatology. Symposium on Microclimatology and Micrometeorology, Toronto
Meteorological Conference, Toronto, Canada, September 15, 1953.
Torsnes, I., Rye, N., and Nesje, A. 1993. Modern and Little Ice Age equilibrium-line altitudes on outlet valley
glaciers from Jostedalsbreen, western Norway: an evaluation of different approaches to their calculation.
Arctic and Alpine Research, 25, 106-116.
Unger-Shayesteh, K., Vorogushyn, S., Farinotti, D., Gafurov, A., Duethmann, D., Mandychev, A., and Merz, B. 2013.
What do we know about past changes in the water cycle of Central Asian headwaters? A review. Global and
Planetary Change
UNEP, 2002, United Nations Environmental Programme, Mountain Watch: Environmental Change and Sustainable
Development in Mountains, UNEP World Conservation Monitoring Centre, Cambridge, U.K.
University Corporation for Atmospheric Research (UCAR). 2013. Naryn River Stream Flow Records.
Wagnon, P., Linda, A., Arnaud, Y., Kumar, R., Sharma, P., Vincent, C., Pottakkal, J., Berthier, E., Pamanathan, A.,
and Hasnain, S. 2007. Four years of mass balance on Chhota Shigri Glacier, Himachal Pradesh, India, a new
benchmark glacier in the western Himalaya. Journal of Glaciology, 53.
Wagner, S., and Hoelzle, M. 2010. Glacier Volume Changes in the Panj and Vakhsh Basins: Application of Simple
Parameterizations to Estimate Past and Future Glacier Change in the Panj and Vakhsh River Basins. Technical
Report, ITos, Ebnat‐Kappel, Switzerland.
Wake, C. 1987. Spatial and temporal variation of snow accumulation in the central Karakoram, northern Pakistan.
Theses and Dissertations (Comprehensive), Paper 304, Wilfrid Laurier University, Waterloo.
Ward. R. 1975. Principles of Hydrology. McGraw-Hill, London.
Water and Power Development Authority (WAPDA), Islamabad, Pakistan.
Williams, R., Hall, D., and Benson, C. 1991. Analysis of glacier facies using satellite techniques. Journal of
Glaciology, 37, 120-127.
World Bank, 2005, Pakistan: Country Water Resources Assistance Strategy, Water Economy: Running Dry, Report
No. 34081-PK, Agriculture and Rural Development Sector, South Asia Region.
World Bank, 2014, Monitoring of Glaciers, Climate and Runoff in the Hindu Kush-Himalaya Mountains, South Asia
Sustainable Development (SASDN), Environment and Water Resources Unit. Report prepared by Donald
Alford, David Archer, Bodo Bookhagen, Wolfgang Grabs, Sarah Halvorson, Kenneth Hewitt, Walter Immerzeel,
Ulrich Kamp, and Brandon Krumwiede
Young, G. 1982. Hydrological relationships in a glacierized mountain basin. In: Roots , F., and Glen, J. (Eds.),
Hydrological Aspects of Alpine and High-Mountain Area, International Association of Hydrological Sciences,
138, 1.

92
APPENDIX
Mapping Basin and Glacier Areas
1. Data Sources
1.1. Satellite Imagery
In studies of the cryosphere, satellite imagery analysis has been popular since the early 1970s with the
introduction of medium-resolution (10-90 m) optical sensors such as Landsat Multispectral Scanner (MSS), Landsat
Thematic Mapper (TM), System Pour l’Observatoire de la Terre (SPOT), Indian Remote Sensing (IRS) including
Cartosat and Resourcesat, Landsat 7 Enhanced Thematic Mapper Plus (ETM+), Advanced Spaceborne Thermal
Emission and Reflection Radiometer (ASTER), and Advanced Land Observing Satellite (ALOS). Today, large-scale
(<10 m) imagery suitable for detailed glacier studies at basin scale is available, for example, from IKONOS,
Quickbird, and GeoEye-1. Despite this great variety of available satellite imagery—and this also at large-scale
resolution—in their review of the use of optical remote sensing in glacier characterization, Racoviteanu et al.
(2008) concluded that medium-scale (10-90 m) resolution optical sensors in multispectral mode, with relatively
large swath widths and short revisit cycles, are useful for regular glacier mapping over extensive areas. However,
sensors operating in the visible and near-IR (VNIR) ranges, such as Landsat, ASTER and ALOS, are limited to
daylight and cloud-free conditions, which are difficult to obtain in some regions (Racoviteanu et al., 2008).
Our study utilized satellite images (L1T product) from Landsat 5 from 2009-2011 (one scene is from 2000)
that were downloaded free-of-charge from the USGS imagery archive (USGS Earth Explorer website:
http://earthexplorer.usgs.gov/) (Table 1). Landsat 5 was launched in 1984 and was recently decommissioned on
June 5, 2013. The L1T product provides radiometric and geometric corrections based from ground control points
or a SRTM DEM (Bolch et al., 2010). Landsat imagery has been extensively and successfully used in glacier mapping
and monitoring studies, particularly for band ratio analysis and land cover classification. Landsat 5 carries the
Thematic Mapper (TM) and Multi-Spectral Scanner (MSS); however, the MSS was powered down in 1995. A
Landsat 5 TM image covers an area of 170 x 185 km2 and comes at 30 m spatial resolution for bands 1-5 and 7,
while the thermal band 6 has a spatial resolution of 120 m. For this study, Landsat 5 TM imagery was selected
based on the following criteria: date availability; end of melt season (all scenes are from either August or
September except one from early October); percent of cloud cover (in all scenes <5%); and atmospheric noise.
Table 1. Landsat 5 TM Data (L1T product) acquired from the USGS
used in this study.
Image ID Path/Row Date
LT51520332011234KHC00 152/033 08/22/2011
LT51540332011248KHC00 154/033 09/05/2011
LT51520322011250KHC00 152/032 09/07/2011
LT51520332011250KHC00 152/033 09/07/2011

93
LT51520342011250KHC00 152/034 09/07/2011
LT51510332009253KHC00 151/033 09/10/2009
LT51540322011248KHC00 154/032 09/05/2011
LT51530332000259XXX02 153/033 09/15/2000
LT51480352009216KHC00 148/035 08/04/2009
LT51530352009219KHC00 153/035 08/07/2009
LT51510352010240KHC02 151/035 08/28/2010
LT51480352010235KHC00 148/035 08/23/2010
LT51500342011236KHC00 150/034 08/24/2011
LT51520322010247KHC00 152/032 09/04/2010
LT51500352011236KHC00 150/035 08/24/2011
LT51540362009258KHC00 154/036 09/15/2009
LT51530342011273KHC00 153/034 09/30/2011
LT51510342009237KHC00 151/034 08/25/2009
LT51520352011234KHC00 152/035 08/22/2011
LT51510332011275KHC00 151/033 10/02/2011
LT51500332009262KHC00 150/033 09/19/2009
1.2. Digital Elevation Model
Digital elevation models (DEMs) are digital representations of the Earth’s surface. In glacier monitoring they
are required, for example, for glacier ice-volume loss/mass balance estimates, glacier area-altitude distributions
(or hypsometries), and equilibrium line altitude estimation. DEMs are generated from digitized topographic maps,
satellite stereo-imagery (e.g., ASTER, IRS, SPOT), and data derived from radar interferometry (e.g., SRTM,
TerraSAR-X) and laser altimetry (e.g., LiDAR).
SRTM provides near-global elevation data at 90 m spatial resolution. Jarvis et al. (2008) found the vertical
error of SRTM DEM’s to be less than 16 m, and, for the Swiss Alps, Frey and Paul (2012) described the vertical and
horizontal error of SRTM data to be approximately 10 m based on ground control points. While SRTM DEMs are
widely used in glacier mapping, they also have some disadvantages. The slope-induced errors characteristic of
InSAR data make SRTM unsuitable for glacier change detection at small timescales and over small glaciers
(Racoviteanu et al., 2008). Furthermore, for the mid-latitudes and the outer tropics SRTM’s acquisition month
overlapped with the accumulation season resulting in possible over-estimations of SRTM-derived elevations over
glaciers (Racoviteanu et al., 2008). Bishop et al. (2008) noticed that SRTM data were greatly affected by shadows
caused by high topographic relief. Quincey et al. (2012) summarized systematic errors in SRTM data reported by a
number of authors who found a nearly linear elevation bias for parts of the Alps, Patagonia, the Himalaya, and
British Colombia, and reported regional patterns of the bias. Despite these disadvantages, SRTM data are often
used simply because of their coverage and easy handling. Furthermore, the relatively low resolution of 90 m has
another advantage: when describing and classifying glaciers using geomorphometric parameters, the quality
depends on the accuracy of the input DEM, and studies have shown that for many applications increased DEM
resolution only introduces disruptive noise (Quincey et al., 2012).
ASTER imagery has the capability to generate DEMs from satellite stereo-pairs at a higher spatial resolution
of 30 m. The ASTER Global Digital Elevation Model (GDEM) project website (http://gdem.ersdac.jspacesystems
.or.jp/) provides data free of charge for most areas of the world. Kääb (2002) found the vertical accuracy of ASTER

94
GDEM to be as high as 60 m in rugged terrain. Yet, for topographically less complex regions Toutin (2008)
presented a vertical accuracy of 15-30 m.
Comparative studies of DEMs from different sources demonstrated that still some uncertainty exists about
reliability of extracted elevations. For the Tien Shan at the border between Kazakhstan and Kyrgyzstan, Bolch et al.
(2005) compared elevations from (i) the SRTM DEM and a DEM derived from contour lines (‘reference DEM’) and
(ii) the SRTM DEM with an ASTER DEM, concluding that for the former the average difference between elevations
was only about 6 m on average, while for the latter the difference was up to 100 m, particularly at SE- and N/NW
exposed steeper slopes. For Cerro Sillajhuay in the Andes at the border between Bolivia and Chile, Kamp et al.
(2005) compared an ASTER DEM with a DEM from contour lines (‘reference DEM’) and found that the ASTER DEM
showed increasingly lower elevations with increasing elevation. For the Bernina Group in the Swiss Alps, Bolch and
Kamp (2006) compared an ASTER DEM and a SRTM DEM with a DEM derived from contour lines (‘reference DEM’)
and found that ASTER elevations were generally too high (8.3 m on average), and SRTM elevations were generally
too low (9.8 m on average). Fujita et al. (2008) compared SRTM DEM elevations and ASTER DEM elevations with
ground survey data in the Bhutan Himalaya and reported a mean elevation difference of 11.3 m for the SRTM
DEMs and 11 m for the ASTER DEMs. Berthier et al. (2007) compared SRTM DEM elevations with SPOT 5 DEM
elevations for non-glaciated terrain in the Khumbu Himalaya and found a mean difference of 0.43±16.7 m. Frey
and Paul (2012) found that glacier parameters derived from SRTM yielded more accurate results than parameters
derived from the ASTER GDEM.
Although they have also their disadvantages, at this point, ASTER GDEM and SRTM data provide the best (or
only) available and least expensive sources for a region/country-wide glacier mapping. We here utilized SRTM data
that were acquired free-of-charge from Consultative Group for International Agriculture Research (CGIAR-CSI;
http://www.cgiar-csi.org/). Ground control point (GCP) data were not available for quality assessment of the
SRTM data.
2. The Catchment Basins
2.1. Delineation
The first step in watershed analyses is the definition and delineation of the catchment area. In our study,
‘catchment basin’ was defined as the drainage area upstream from the primary hydrometric gauging station.
The individual catchment basins (entire Upper Amy Darya and Upper Syr Darya basins and their sub-basins)
were determined using the 90-m SRTM DEM; boundaries were delineated using the ‘Watershed’ tool in the
‘Hydrology’ toolset of Spatial Analyst Tools in ArcMap 10.01. The derived watersheds were then converted to
vector polygon shape-files, and basin surface areas were calculated. This process of converting raster into vector
data comes with a change of area (km2), because the software draws the catchment polygon by ‘cutting through’
each individual square raster pixel, i.e. the sub-pixel area outside of the polygon line is excluded from further
analysis when using vector data. As a result, the raster-derived area is always larger than the vector-derived area.
Glacier inventories such as GLIMS contain glacier outlines as polygons that represent vector data. When such
glacier polygons are draped over raster data, for example, satellite imagery or SRTM DEM, and area–altitude
distributions are calculated, the vector data are converted back to raster data.

95
In this study, the organization of the headwaters of the Amu Darya Basin and the surface areas of basins and
sub-basins are as follows:
(i) The headwaters of the Amu Darya Basin include 12 sub-basins and contain an area of 158,211 km2
(Figures 1 and 2).
(ii) The Panj Basin contains 118,330 km2 or 75% of the Amu Darya Basin and is divided into Lower Panj
and Upper Panj basins.
(iii) The area upstream from the Lower Panj and Lower Vakhsh basins is referred to as Upper Amu Darya
Basin that includes the Upper Panj and Upper Vakhsh that together contain ten sub-basins covering an
area of 81,794 km2 or 52% of the entire Amu Darya Basin.
(iv) The Upper Panj Basin includes the Shidz, Vanch, and Yazgulem basins. The Shidz Basin includes the
Bartang and Gund basins. The Bartang Basin includes the Gudara and Murgab basins. In total, the
Upper Panj Basin includes seven sub-basins (Shidz, Vanch, and Yazgulem; Bartang and Gund; Gudara
and Murgab) and contains 61,484 km2 or 39% of the entire Amu Darya Basin.
(v) The Vakhsh Basin contains 39,880 km2 or 25% of the Amu Darya Basin and is divided into Lower
Vakhsh and Upper Vakhsh basins. The Upper Vakhsh Basin includes the Kyzyslu, Muksu, and Obighigou
basins. In total, the Upper Vakhsh Basin includes three sub-basins (Kyzyslu, Muksu, and Obighigou)
and contains 20,310 km2 or 13% of the entire Amu Darya Basin.

96
Figure 1. The Amu Darya Basin and its twelve sub-basins. In this study, a basin contains the area upstream from a
stream-gauging station. Since no data was available from stream-gauging stations in the Lower Panj and the
Lower Vakhsh basins, these two basins were excluded from the analysis. The ten (sub-)basins upstream from the
Lower Panj and Lower Vakhsh basins are referred to as the Upper Amu Darya Basin.

97
Figure 2. Organization of (sub-)basins within the headwaters of the Amu Darya Basin.
1 Since no data was available from stream-gauging stations in the Lower Panj and the Lower Vakhsh basins, these two basins
were excluded from the analysis. 2
In the Upper Gudara Basin streams drain internally into Lake Kara; hence, it is not even considered a part of the Amu Darya
Basin. The ten (sub-) basin—including the Lower Gudara Basin—upstream from the Lower Panj and Lower Vakhsh basins are
referred to as the Upper Amu Darya Basin.
Since for the Lower Panj and Lower Vakhsh basins no stream-gauging station data for calibration of
hydrological modeling results were available, they were excluded from the analysis. In other words: the here
presented hydrologic modeling results are representative only for the combined Upper Panj and Upper Vakhsh
basins (= Upper Amu Darya Basin) rather than for the entire headwaters of the Amu Darya Basin.
Two facts complicate the basin organization. First, the Shidz basin is actually the upper portion of the main
Panj river; however, it includes its own stream-gauging station and, hence, following the applied definition of
‘basin’ in this study, it qualified as an individual basin. Second, in the Upper Gudara basin (not part of Figure 1)
streams drain internally into Lake Kara (Kara Kul) in the basin’s center; hence, the Upper Gudara basin is not even
considered a part of the Amu Darya Basin. The latter is a good example for the facts that computer-based mapping
results must be seen with caution and that in cases of doubtful results the user has to carry out a manual
correction: when analyzing the flow direction from the SRTM DEM using the standard ArcHydro toolset in ArcMap
10, the results revealed a flow direction from Lake Kara into Gudara River. However, based on the literature and
own field observations, the flow direction is in the opposite direction, i.e. into Lake Kara. As a result, in our map
the Gudara River abruptly terminates at the border to the Upper Gudara Basin (Figure 1).

98
The hydrological organization of the headwaters of the Syr Darya is much easier: it includes the three sub-
basins Chirchik, Kara and Naryn, and the headwaters in the Alai Mountains in the south (Figure 3).
Figure 3. The headwaters of the Syr Darya Basin contain three sub-basins (Chirchik, Kara, and Naryn) and the
headwaters of the Altai Mountains.
In conclusion, when comparing studies of one specific river basin, it is important to note that there is a
chance that not one single definition exists of what exactly constitutes its boundary. Since available data sets
present differing catchment areas for the Amu Darya and Syr Darya basins and their sub-basins, we here carried
out our own mapping of catchment areas.
2.2. Hypsometric Analysis
The altitude–area distribution (or hypsometry) offers information about the topography of a catchment
basin. The hypsometric curve is the empirical cumulative distribution function of elevations in a catchment; it
allows hydrologists and geomorphologists for assessing the similarity of watersheds. In our study, hypsometry
plots, and hypsometric curves at 1000-m belt intervals have been produced for the entire headwaters of the Amu
Darya and Syr Darya basins and all their sub-basins (Figures 4 and 5).
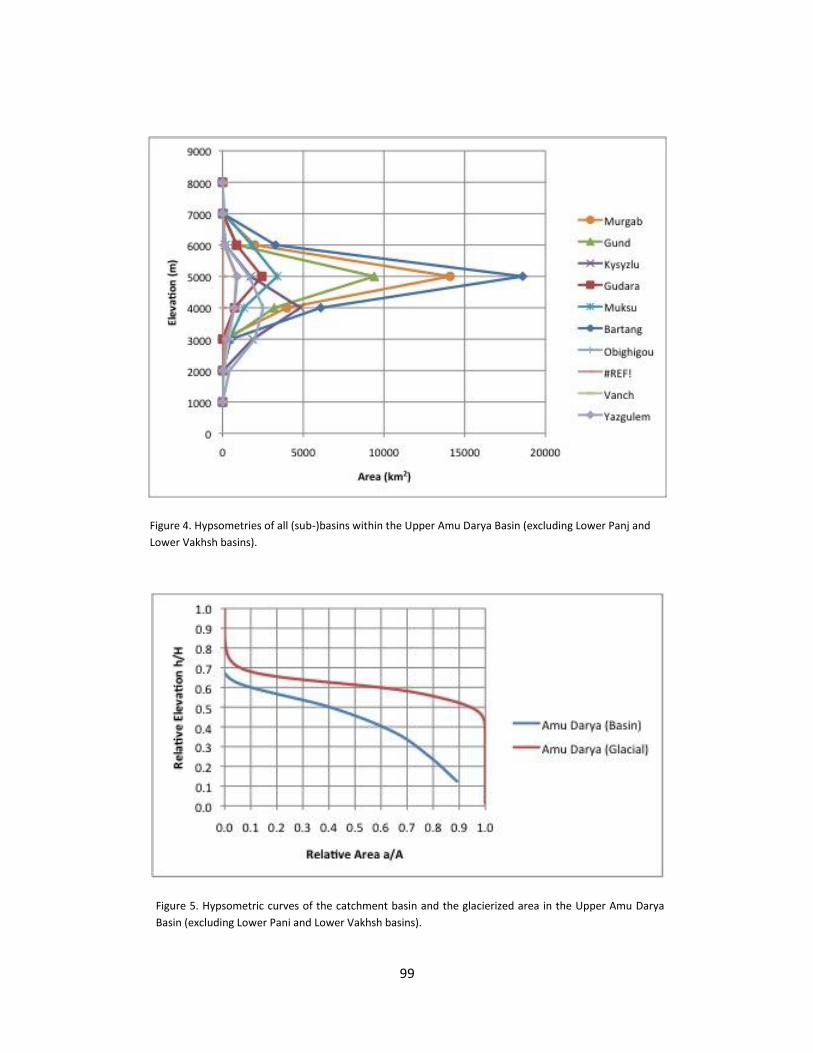
99
Figure 4. Hypsometries of all (sub-)basins within the Upper Amu Darya Basin (excluding Lower Panj and
Lower Vakhsh basins).
Figure 5. Hypsometric curves of the catchment basin and the glacierized area in the Upper Amu Darya
Basin (excluding Lower Pani and Lower Vakhsh basins).

100
3. The Glaciers
3.1. World Glacier Inventory (WGI)
The World Glacier Inventory (WGI) was conceived half a century ago as an activity to be completed during
the International Geophysical Year, 1957-1958. Today, WGI is housed at the National Snow and Ice Data Center
(NSIDC) in Boulder, Colorado; it is based on the original WGI from the World Glacier Monitoring Service (WGMS)
(Haeberli et al., 1989). WGI consists today of nearly 70,000 glacier records and can be viewed as a snapshot of the
glacier distribution in the second half of the 20th century. The database is based primarily on aerial photographs
and maps with most glaciers having one data entry only. Glaciers are represented by point data that have to be
converted to polygons based on the glacier area attribute, which is a significant generalization in glacier modeling.
In 2005, a more complete version, called WGI-XF (XF for Extended Format) was introduced (Cogley, 2005).
By 2010, it contained information for over 130,400 glaciers and nearly half of the global extent of ice (Cogley,
2010). The additional glaciers came mainly from the assimilation of existing regional inventories but also from
rescuing inventories that have been lost and from some new inventories. Inventory parameters include geographic
location, area, length, orientation, elevation, and classification. Cogley (2010) conceded that the incomplete
information about the dates of imagery and maps is a hindrance to analysis and, hence, WGI-XF is not assuredly
reliable as a source for detailed studies of single glaciers. However, Cogley (2010) also stated that there are several
other subjects in which less detail would be a price worth paying for more complete coverage.
3.2. Global Land Ice Measurements from Space (GLIMS)
The international project Global Land Ice Measurements from Space (GLIMS), established in the late 1990s,
was designed to monitor the World’s glaciers using data from optical satellite instruments, such as ASTER.
Compared to other glacier inventories, GLIMS is the first attempt to building a globally complete, high-resolution
map of glacier extents. So-called regional centers and affiliated stewards are responsible for a specific region; for
the Pamir Mountains it is the Russian Academy of Sciences. Currently, the GLIMS database contains >122,000
snapshots of glaciers worldwide.
GLIMS analysis results include digital glacier outlines and related metadata, and they can also include snow
lines, center flow lines, hypsometry data, surface velocity fields, and literature references. The program also
develops tools to aid in glacier mapping and for transfer of analysis results for archiving to the National Snow and
Ice Data Center (NSIDC). These include GLIMSView, documented procedures for GLIMS analysis, and web-based
tools for data formatting and quality control.
3.3. Randolph Glacier Inventory (RGI)
The Randolph Glacier Inventory (RGI) is a global inventory of glacier outlines and intended for estimates of
ice volume and glacier mass at global and large-regional scales. RGI is supplemental to the GLIMS and first data

101
were released in 2012. Its production had been motivated by the Fifth Assessment Report of the
Intergovernmental Panel on Climate Change (IPCC AR5).
RGI is a combination of both new and existing published glacier outlines. New outlines were provided by
the glaciological community in response to requests for data on the GLIMS and Cryolist e-mail listservers. RGI
visualizes the data in a GIS by overlaying outlines on modern satellite imagery, and assessed their quality relative
to other available products. Data are organized into 19 large regions, with a shape-file provided for each region.
In several regions the outlines already in GLIMS were used for RGI. Data from the World Glacier Inventory (WGI,
1989) and the related WGI-XF (Cogley, 2010) were used for some glaciers in northern Asia, with outlines
approximated by circles of area equaling those reported in the source. Where no other data were available, the
RGI relies on data from the Digital Chart of the World (DCW) that is based on the United States Defense Mapping
Agency’s Operational Navigational Charts (Danko, 1992). Currently, RGI contains >682,500 km2 of glacierized area
(NCAR/UCAR, 2013). The glacier outlines can be combined with DEMs to give areas, area distributions, and
hypsometries.
While one of the RGI’s advantages is that it also includes debris-covered parts of glaciers, it has its
limitations. For example, it lacks glacier IDs and other metadata found in other inventories. Furthermore, at this
point, RGI data are not to be used for reporting that focuses on the properties of the inventory itself, such as
global size distribution, or glacier hypsometry (Arendt et al., 2013; GLIMS, 2013).
3.4. Defining ‘Glacier’
In the upper portion of the accumulation zone, the large glaciers of these mountains merge with the
perennial snowfields, to form a continuous snow-covered high altitude surface. The debris cover of the lower
portions of the ablation zone of many glaciers merges with terminal, lateral and medial moraines, making the
identification of glacier ice difficult in most imagery. These problems are not insoluble, but require more time than
was available for this reconnaissance assessment.
Before glaciers can be mapped using satellite imagery, it is important to define what constitutes a glacier in
the Pamir Mountains. Unclear glacier definitions in the literature are one of the reasons, why comparisons of
mapping results are difficult. GLIMS defined a glacier in terms of remote sensing, thus, this definition does require
the motion of ice; a glacier is “a body of ice and snow that is observed at the end of the melt season” (Raup et al.,
2007). Paul et al. (2009) set the lower limit of what constitutes a glacier at 0.01 km2, because a glacier any smaller
would be too difficult to accurately identify through a platform with a spatial resolution of 15-30 m. When
inventorying glaciers in the western Nyainqentanglha Range and Nam Co basin, Tibet, Bolch et al. (2010b) mapped
glaciers >0.01 km2, but then only compared glacier parameters for glaciers >0.1 km2. When generating the glacier
inventory for western Canada, Bolch et al. (2010a) mapped only glaciers >0.05 km2. Frey et al. (2012) defined a
glacier as being >0.2 km2. Krumwiede et al. (2014) mapped only glacier >0.1 km2 in the Mongolian Altai, believing
anything smaller represents only transient snow patches. However, for water resource management it is
important to map even transient snow patches because they contribute to the local hydrology. Further, it is
assumed that when mapping glaciers through a remote sensing platform, the implemented image is obtained at
the absolute end of the melt season. Therefore, any snow patches in the image will remain until the first season’s
snow. In the study at hand, all glaciers ≥0.01 km2 were mapped.

102
3.5. Glacier Mapping Methodology
For the purposes of this study, glacier surface area and glacier hypsometries were determined for the
glacierized portions of the gauged catchment basins rather than for individual glaciers, as is more commonly the
case. This was done in order to facilitate the comparison of calculated glacier melt volumes with measured stream
flow volumes.
Most of the glaciers in the Pamirs are debris-free, clean ice glaciers. Clean glacial ice has a distinct spectral
signature, with uniqueness in the visible and near-infrared part of the electromagnetic spectrum, which makes it
relatively easy to map debris-free glaciers. Snow and ice are characterized by high reflectivity (albedo) in the
visible wavelengths (0.4-0.7 μm); medium reflectivity in the near infrared (0.8-2.5 μm); low reflectivity and high
emissivity in the thermal infrared (2.5-14 μm); and low absorption and high scattering in the microwave. While in
clear weather the high albedo of snow and ice make them easily distinguished from surrounding terrain using
visible infrared (VIR), optically thick clouds are also highly reflective in VIR, hence they confound the classification.
However, they are reflective in the near infrared (NIR), thus, discriminated from snow and ice.
Raup et al. (2007) identified the five most commonly used methods in glacier identification from satellite
imagery: manual digitization, spectral band ratio (VIS/NIR) and threshold, Normalized Difference Snow Index (NDSI
= TM2 – TM5 / TM2 + TM5), geomorphometric-based, and thermal band methods. Single band ratios and NDSI are
commonly used to separate the bright snow and ice from darker landscape features. NDSI is an unsupervised
classification method that utilizes the brightness of snow and ice in Landsat’s visible band 2 and is contrasted
against the low reflectivity in the SWIR band 5 (Hall et al., 1995; Bishop et al., 2008). When mapping glaciers in the
Cordillera Blanca, Peru, Racoviteanu et al. (2008) found that NDSI was superior to other band ratios based on
visual inspection. However, the NDSI method is still susceptible to erroneously mapping in shadowed regions
(Bishop et al., 2008). When inventorying the glaciers in the Southern Alps of New Zealand, Gjermundsen et al.
(2011) tested a supervised classification method and described the results as not promising: bright rocks and small
disconnected snow patches classified as glacier area resulted in high error percentage. In order to classify debris-
covered glaciers, Raup et al. (2007) suggested geomorphometric-based methods. Such automated delineation
methods have been implemented by many author groups (e.g., Bolch and Kamp, 2006; Bolch et al., 2007; Bhambri
et al., 2011; Kamp et al., 2011); however, these studies discussed errors of >5%, which required a manual editing
during post-processing. Geomorphometric methods also require a DEM of sufficient accuracy. Both Paul et al.
(2011) for the European Alps and Racoviteanu et al. (2008) for the Cordillera Blanca of Peru manually edited
glacier outlines to include debris-covered glaciers using contrast-enhanced false-color composite satellite images.
However, Paul et al. (2010) discussed that human, as opposed to automated, delineation of glacier outlines
tended to digitize only parts of glaciers.
Identifying the correct threshold when using automated mapping methods is important: if a too small
threshold was chosen, more manual editing might be necessary; if a too large threshold was chosen, glaciers will
be underrepresented. Identifying the threshold when applying the band ratio method is most sensitive in regions
with ice in shadows, and a threshold of 2 has been suggested (Bishop et al., 2008; Bolch et al., 2010; Gjurmendsen
et al., 2011). When using NDSI a threshold of 0.4 was found to best differentiate snow from non-snow, and
thresholds of 0.5-0.6 proved successful in delineating glacier ice in the Andes of Peru (Racoviteanu et al., 2008).
Both band ratios and NDSI methods produced satisfactory mapping results for shaded glacier parts, and have the
advantage of being fast and robust, thus relatively easy to automate over extensive areas (Bolch and Kamp, 2006;

103
Paul et al., 2007; Bishop et al., 2008; Racoviteanu et al., 2008). However, using band ratios has some problems in
mapping glaciers due to the presence of fresh snow on the glacier surface, supra-glacial debris, and pro-glacial and
supra-glacial lakes (Racoviteanu et al., 2008). Paul et al. (2013) recommended using the smallest threshold
available when applying an automated method such as a band ratio or NDSI, because a small threshold will include
most of the slightly dirty glacier ice surrounding the glacier margins.
Determining which spectral band to use in the band ratio technique is important in order to understand the
relationship between the glacier and its associated spectral signature. Rees (2006) described that the concept of a
spectral signature is the association between specific land cover and the variation of pixel values representative
across different bands of an image. Clean glacier ice is highly reflective in the visible and NIR wavelengths (0.45-
0.90 μm). On the contrary, high absorption occurs in SWIR between the ranges of 0.6-0.7 μm and 2.08-2.35 μm in
the electromagnetic spectrum. Identifying bands with high and low reflectance is the key to select the bands for
the band ratio analysis: the greater the difference in pixel values, the higher the contrast between glacier ice and
other land covers (Dozier, 1989; Lillesand et al., 2007; Paul et al., 2011).
Most of the studies on glacier mapping use Landsat TM imagery and apply the band ratios TM3/TM5 and
TM4/TM5 (e.g., Paul et al., 2002; Bolch et al., 2006; Bhambri et al., 2011; Gjermundsen et al., 2011). Bolch et al.
(2010a, b) used TM3/TM5 when creating an inventory for western Canada and the western Nyainqentanglha
Range and the Nam Co Basin. Paul et al. (2002) compared TM3/TM5 and TM4/TM5 and found that TM4/TM5 was
the only combination that did not have problems in shadow regions. Yet, Paul et al. (2011) used TM3/TM5 to map
glaciers in the Alps, and the authors then applied an additional threshold in TM1 to improve the classification in
shadow regions. Bishop et al. (2008) and Frey et al. (2012) found that at low sun angles TM3/TM5 produced better
results for glacier areas in shadow, yet more turbid lakes were incorrectly identified as glacier ice. TM4/TM5 has
been proven to be effective in mapping thin debris-covered glaciers (Paul et al., 2002; Bolch et al. 2010b). On the
other side, also TM4/TM5 often incorrectly identifies turbid lakes and vegetation as glacier ice. Bolch (2006)
suggested using the Normalized-Difference Water Index (NDWI) to correct band ratio mapping errors. Despite
such still existing difficulties, the methodology of using Landsat imagery band ratios comes with a relatively low
mapping error of ±2% (e.g., Paul et al. 2003; Bolch and Kamp 2006; Bolch et al. 2010).
Kamp et al. (2013) and Krumwiede et al. (2014) argued for a simple threshold ratio mapping approach,
allowing for faster processing time by using an unsupervised classification scheme. This scheme uses bands 4 and
7 from the Landsat 5 TM and Landsat 7 ETM+ sensors and performs simple raster math calculations. This approach
can be incorporated directly into satellite imagery processing methods and can generate output datasets including
raster overlays and glacier outline shape files with area calculations. These output datasets can then be
incorporated with DEMs to determine glacier hypsometric areas and glacier area with respect to aspect. Using this
simple method makes it is easier to analyze several images in a shorter amount of time and allow for multi-
temporal change detection and analysis.
These findings from Kamp et al. (2013) and Krumwiede et al. (2014) are supported by Kamp and Pan (in
press), who describe that band ratio TM4/TM7 produced the most accurate results when compared to results
from visual interpretation and from other frequently used band ratios (TM3/TM5, TM5/TM3, TM5/TM4) and NDSI,
because it is the only approach that did not erroneously map shadowed terrain and pro-glacial lakes (Figure 6). In
the Kamp and Pan (in press) study in the Ikh Turgen Range in the northeastern Mongolian Altai at the Russian
border, using band ratio TM4/TM7 identified 52 glaciers, while it was 59 glaciers using band ratio TM5/TM3, 61
glaciers using NDSI, and 62 glaciers using band ratio TM5/TM4. The ‘over-prediction’ of glacier numbers for the
latter three approaches occurred in particular in the glacier class of < 0.05 km2 and was due to erroneous
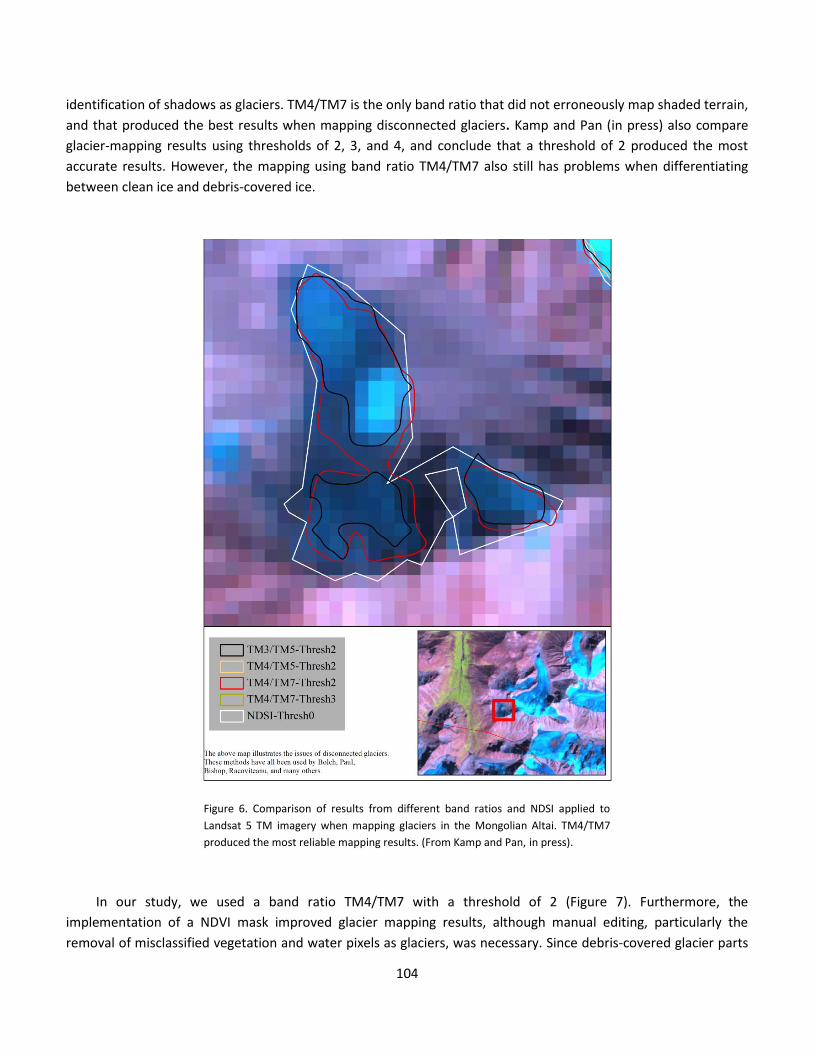
104
identification of shadows as glaciers. TM4/TM7 is the only band ratio that did not erroneously map shaded terrain,
and that produced the best results when mapping disconnected glaciers. Kamp and Pan (in press) also compare
glacier-mapping results using thresholds of 2, 3, and 4, and conclude that a threshold of 2 produced the most
accurate results. However, the mapping using band ratio TM4/TM7 also still has problems when differentiating
between clean ice and debris-covered ice.
Figure 6. Comparison of results from different band ratios and NDSI applied to
Landsat 5 TM imagery when mapping glaciers in the Mongolian Altai. TM4/TM7
produced the most reliable mapping results. (From Kamp and Pan, in press).
In our study, we used a band ratio TM4/TM7 with a threshold of 2 (Figure 7). Furthermore, the
implementation of a NDVI mask improved glacier mapping results, although manual editing, particularly the
removal of misclassified vegetation and water pixels as glaciers, was necessary. Since debris-covered glacier parts

105
cannot be mapped with the TM4/TM7 method, the presented glacierized areas in the Amu Darya Basin and all its
sub-basins represent only minimum extents. While it is assumed that debris-covered glacier parts do exist, it has
been reported that most of the ice in the study area is debris-free.
Figure 7. Model approach to delineate glacier outlines used in this study.
3.6. Hypsometric Analysis
Elevation is one of the most important factors responsible for variations in glacier characteristics, and the
most fundamental altitude is the equilibrium-line altitude (ELA) that separates ablation and accumulation areas of
the glacier. In glacier monitoring it is usually assumed that the ELA is equal to the snowline position at the end of
the melting season (Quincey et al., 2012). ELA calculations are fundamental for estimating the mass balance of a
glacier and, thus, serve as indicators for climate variations.
This study used the Toe-to-Summit Altitude Method (TSAM) that—although a relatively simple method to
extract the ELA using DEM elevation values—can be performed efficiently, especially at well-defined valley glaciers
(Lehmkuhl, 1998; Benn and Lehmkuhl, 2000). TSAM goes back to Louis (1955) who proposed that the ELA can be
estimated from the arithmetical average of the elevation of the highest peak in the catchment and the terminal
moraine. After examining the minimum and maximum elevation of a glacier, the mean and median elevations are
calculated; both such elevations can be used to represent the ELA. ELAs were calculated for the Upper Amu Darya
and Upper Syr Darya basins and all their sub-basins.
The glacier hypsometry describes the distribution of glacierized area per elevation belt. Changes in the
glacier hypsometry over time are used to document climate changes and their impacts on glaciers. In the study at

106
hand, glacier hypsometry plots and hypsometric curves at 100-m belt intervals were produced for the Upper Amu
Darya and Upper Syr Darya basins and all their sub-basins.
4. References
Arendt, A., Bolch, T., Cogley, J.G., Gardner, A., Hagen, J.-O., Hock, R., Kaser, G., Pfeffer, W.T., Moholdt, G., Paul, F.,
Radić, V., Andreassen, L., Bajracharya, S., Beedle, M., Berthier, E., Bhambri, R., Bliss, A., Brown, I., Burgess,
E., Burgess, D., Cawkwell, F., Chinn, T., Copland, L., Davies, B., de Angelis, H., Dolgova, E., Filbert, K., Forester,
R., Fountain, A., Frey, H., Giffen, B., Glasser, N., Gurney, S., Hagg, W., Hall, D., Haritashya, U.K., Hartmann, G.,
Helm, C., Herreid, S., Howat, I, Kapustin, G., Khromova, T., Kienholz, C., Koenig, M., Kohler, J., Kriegel, D.,
Kutuzov, S., Lavrentiev, I., LeBris, R., Lund, J., Manley, W., Mayer, C., Miles, E., Li, X., Menounos, B., Mercer,
A., Moelg, N., Mool, P., Nosenko, G., Negrete, A., Nuth, C., Pettersson, R., Racoviteanu, A., Ranzi, R., Rastner,
P., Rau, F., Rich, J., Rott, H., Schneider, C., Seliverstov, Y., Sharp, M., Sigurðsson, O., Stokes, C., Wheate, R.,
Winsvold, S., Wolken, G., Wyatt, F., and Zheltyhina, N. 2012. Randolph Glacier Inventory [v2.0]: A Dataset of
Global Glacier Outlines. Global Land Ice Measurements from Space, Boulder Colorado, USA. Digital Media.
Benn, D.I., and Lehmkuhl, F. 2000. Mass balance and equilibrium line altitudes of glaciers in high mountain
environments. Quaternary International, 65/66, 15-29.
Berthier, E., Arnaud, Y., Rajesh, K., Sarfaraz, A., Wagnon, P., and Chevallier, P. 2007. Remote sensing estimates of
glacier mass balances in the Himachal Pradesh (Western Himalaya, India). Remote Sensing of Environment
108, 327-338.
Bhambri, R., Bolch, T., Chaujar, R.K. and Kulshreshtha, S.C. 2011. Glacier changes in the Garhwal Himalaya, India,
from 1968 to 2006 based on remote sensing. Journal of Glaciology, 57, 543–556.
Bishop, M.P., Olsenholler, J.A., Shroder, J.F., Barry, R.G., Raup, B.H., Bush, A.B.G., Copland, L., Dwyer, J.L.,
Fountain, A.G., Haeberli, W., Kääb, A., Paul, F., Hall, D.K., Kargel, J.F., Molnia, B.F., Trabant, D.C. and Wessels,
R. 2008. Global land ice measurements from space (GLIMS): remote sensing and GIS investigations of the
Earth's cryosphere. Geocarto International, 19, 57–84.
Bolch, T., and Kamp, U. 2003. Evaluation of digital elevation models from ASTER data for high mountain regions
(Cerro Sillajhuay, Chile/Bolivia). Kartographische Nachrichten, 53, 224-230. (In German).
Bolch, T., and Kamp, U. 2006. Glacier mapping in high mountains using DEMs, ASTER and Landsat data.
Proceedings of the 8th International Symposium on High Mountain Remote Sensing Cartography, March 20–
27, 2005, La Paz, Bolivia. Grazer Schriften der Geographie und Raumforschung, 41, 13-24.
Bolch, T., Kamp, U., and Olsenholler, J. 2005. Using ASTER and SRTM DEMs for studying geomorphology and
glaciation in high mountain areas. In: Oluic, M. (Ed.), New Strategies for European Remote Sensing,
Proceedings of the 24th Meeting of the European Association of Remote Sensing Laboratories (EARSeL), 25–
27 May 2004, Dubrovnik, Croatia, Millpress, Rotterdam, 119-127.
Bolch, T., Buchroithner, M., Kunert, A., and Kamp, U. 2007. Automated delineation of debris-covered glaciers
based on ASTER data. In: Gomarasca, M.A. (Ed.): GeoInformation in Europe, Proceedings 27th Annual

107
Symposium European Association of Remote Sensing Laboratories (EARSeL), June 4-7, 2007, Bozen, Italy,
Millpress, Rotterdam, 403-410.
Bolch, T., Menounos, B., and Wheate, R. 2010a. Landsat-based glacier inventory of western Canada, 1985-2005.
Remote Sensing of Environment, 114, 127-137.
Bolch, T., Yao, T., Kang, S., Buchroithner, M., Scherer, D., Maussion, F., Huintjes, E., and Schneider, C. 2010b. A
glacier inventory for the western Nyainqentanglha Range and Nam Co Basin, Tibet, and glacier changes
1976–2009. The Cryosphere, 4, 419-433.
Cogley, J.G. 2005. Extended Format for the World Glacier Inventory. Trent Technical Note 2005-1, Department of
Geography, Trent University, Peterborough, Ontario, Canada.
Cogley, J.G. 2010. A more complete version of the World Glacier Inventory. Annals of Glaciology, 50, 32-38.
Danko, D.M., 1992. The digital chart of the world. GeoInfo Systems, 2, 29-36.
Dozier, J. 1989. Spectral signature of alpine snow cover from the landsat thematic mapper. Remote Sensing of
Environment, 28, 9-22.
Dyurgerov, M., and Meier, M.F. 2005. Glaciers and the Changing Earth System: A 2004 Snapshot. Institute of Arctic
and Alpine Research, Occasional Paper, 58, 117 p.
Frey, H., and Paul, F. 2012. On the suitability of the SRTM DEM and ASTER GDEM for the compilation of
topographic parameters in glacier inventories. International Journal of Applied Earth Observation and
Geoinformation, 18, 480-490.
Frey, H., Paul, F., and Strozzi, T. 2012. Compilation of a glacier inventory for the western Himalayas from satellite data:
methods, challenges, and results. Remote Sensing of Environment, 124, 832-843.
Fujita, K., Suzuki, R., Nuimura, T., and Sakai, A. 2008. Performance of ASTER and SRTM DEMs, and their potential
for assessing glacial lakes in the Lunana Region, Bhutan Himalaya. Journal of Glaciology, 54, 220-228.
Gjermundsen, E.F., Mathieu, R., Kääb, A., Chinn, T., Fitzharris, B. and Hagen, J.O. 2011. Assessment of multispectral
glacier mapping methods and derivation of glacier area changes, 1978–2002, in the central Southern Alps,
New Zealand, from ASTER satellite data, field survey and existing inventory data. Journal of Glaciology, 57,
667–683.
Global Land Ice Measurements from Space (GLIMS) Program. 2013. http://www.glims.org.
Haeberli, W., Bösch, H., Scherler, K., Østrem, G., and Wallén, C.C. (Eds.). 1989. World Glacier Inventory: Status
1988. World Glacier Monitoring Service, Zurich, 458 pp.
Hall, D.K., Riggs, G.A., and Salomonson, V.V. 1995. Development of methods for mapping global snow cover using
moderate resolution imaging spectrometer data. Remote Sensing of Environment, 54, 127-140.
Immerzeel, W., Lutz, A, and Droogers, P. 2012. Climate Change Impacts on the Upstream Water Resources of the
Amu and Syr Darya. Technical Report for the Asian Development Bank, 103 p.
Jarvis, A., Reuter, H.I., Nelson, A., and Guevara, E. 2008. Hole-filled SRTM for the Globe Version 4.
http://srtm.csi.cgiar.org.

108
Kääb, A. 2002. Monitoring high-mountain terrain deformation from repeated air- and spaceborne optical data:
examples using digital aerial imagery and ASTER data.ISPRS Journal of Photogrammetry and Remote
Sensing, 57, 39-52.
Kamp, U., and Pan, C.G. (in press): Inventory of clean-ice glaciers in Mongolia, derived from Landsat imagery from
1989 to 2011. Geografiska Annaler A – Physical Geography.
Kamp, U., Bolch, T., and Olsenholler, J. 2005. Geomorphometry of Cerro Sillajhuay (Andes, Chile/Bolivia):
comparison of digital elevation models (DEMs) from ASTER remote sensing data and contour maps.
Geocarto International, 20, 23-34.
Kamp, U., Byrne, M. and Bolch, T. 2011. Glacier fluctuations between 1975 and 2008 in the Greater Himalaya
Range of Zanskar, southern Ladakh. Journal of Mountain Science, 8, 374-389.
Kamp, U., Krumwiede, B.S., McManigal, K.G., Pan, C.G., Walther, M. and Dashtseren, A. 2013b. The Glaciers of
Mongolia. Institute of Arctic and Alpine Research (INSTAAR) Occasional Papers, 61, Boulder.
Krumwiede, B.S., Kamp, U., Leonard, G.J., Kargel, J.S., Dashtseren, A. and Walther, M. 2014. Recent glacier changes
in the Mongolian Altai Mountains: case studies from Munkh and Khairkhan Tavan Bogd. In: Kargel, J.S.,
Leonard, G.L., Bishop, M.P., Kääb, A. and Raup, B. (Eds.), Global Land Ice Measurements from Space: Satellite
Multispectral Imaging of Glaciers, Praxis-Springer, Berlin, 481-508.
Lehmkuhl, F. 1998. Quaternary glaciations in central and western Mongolia. Quaternary Proceedings, 6, 153-167.
Lillesand, T.M., Kiefer, R.W., and Chipman, J.W. 2007. Remote Sensing and Image Interpretation. John Wiley and
Sons, Hoboken.
NCAR/UCAR (National Center for Atmospheric Research and University Cooperation for Atmospheric Research).
2013. Randolph Glacier Inventory Data Base of Global Glacier Outlines. https://climatedataguide.ucar.edu/
climate-data/randolph-glacier-inventory-data-base-global-glacier-outlines.
Paul, F., Kääb, A., Maisch, M., Kellenberger, T., and Haeberli, W. 2002. The new remote-sensing-derived Swiss
glacier inventory: I. Methods. Annals of Glaciology, 34, 355-361.
Paul, F., Barry, R., Cogley, G., Frey, H., Haeberli, W., Ohmura, A., Ommanney, S., Raup, B., Rivera, A., and Zemp, M.
2009. Recommendations for the compilation of glacier inventory data from digital sources. Annals of
Glaciology, 50, 119-126.
Paul, F., Barry, R.G., Cogley, J.G., Frey, H., Haeberli, W., Ohmura, A., Ommanney, C.S.L., Raup, B., Rivera, A., and
Zemp, M. 2010. Guidelines for the compilation of glacier inventory data from digital sources. Technical
Report, World Glacier Monitoring Service, Zurich, 23 pp.
Paul, F., Frey, H., and Le Bris, R. 2011. A new glacier inventory for the European Alps from Landsat TM scenes of
2003: challenges and results. Annals of Glaciology, 52, 144-152.
Paul, F., Barrand, N.E., Baumann, S., Berthier, E., Bolch, T., Casey, K., Frey, H., Joshi, S.P., Konovalov, V., Le Bris, R.,
Molg, N., Nosenko, G., Nuth, C., Pope, A., Racoviteanu, A., Rastner, P., Raup, B., Scharrer, K., Steffen, S., and
Winsvold, S. 2013. On the accuracy of glacier outlines derived from remote-sensing data. Annals of
Glaciology, 54, 171-182.

109
Quincey, D., Bishop, M.P., Kääb, A., Berthier, E., Flach, B., Bolch, T., Buchroithner, M., Kamp, U., Khalsa, S.J.S.,
Toutin, T., Haritashya, U., Racoviteanu, A.E., Shroder, J.F., and Raup, B. 2013. Digital terrain modeling and
glacier topographic characterization. In: Kargel, J.S., Leonard, G.J., Bishop, M.P., Kääb, A., and Raup, B. (Eds.),
Global Land Ice Measurements from Space: Satellite Multispectral Imaging of Glaciers, Praxis-Springer,
Berlin, 113-143.
Racoviteanu, A., Arnaud, Y., Williams, M., and Ordonez, J. 2008. Decadal changes in glacier parameters in the
Cordillera Blanca, Peru, derived from remote sensing. Journal of Glaciology, 54, 499-510.
Raup, B., Kääb, A., Kargel, J.S., Bishop, M.P., Hamilton, G., Lee, E., Paul, F., Rau, F., Soltesz, D., Khalsa, S.J.S., Beedle, M. and
Helm, C. 2007a. Remote sensing and GIS technology in the global land ice measurements from space (GLIMS)
project. Computers and Geosciences, 33, 104-125.
Rees, W.G. 2006. Remote Sensing of Snow and Ice. Taylor and Francis/CRC Press, Boca Raton.
Toutin, T. 2008. ASTER DEMs for geomatic and geoscientific applications: a review.” International Journal of
Remote Sensing, 29, 1855-1875.
Wissmann, H. von, 1959. Recent glaciation and snowline in High Asia, with indications for glaciation during the last
ice age. Akademie der Wissenschaften und der Literatur in Mainz, 14, 1103-1431. (In German).

110