Ethnic segregation in England’s...
31
i Ethnic segregation in England’s schools Simon Burgess Deborah Wilson Contents 1. Introduction ............................................................................................................... 1 2. Previous Literature .................................................................................................... 2 3. Data ........................................................................................................................... 4 4. Measuring segregation ............................................................................................... 6 5. Results ....................................................................................................................... 8 Ethnic Composition of Schools .................................................................................. 8 Indices of Segregation.............................................................................................. 10 Ethnic Segregation and Income segregation ............................................................. 22 6. Conclusion............................................................................................................... 25 References........................................................................................................................... 27 CASEpaper 79 Centre for Analysis of Social Exclusion February 2004 London School of Economics Houghton Street London WC2A 2AE CASE enquiries – tel: 020 7955 6679
Transcript of Ethnic segregation in England’s...
i
Ethnic segregation in England’s schools
Simon Burgess Deborah Wilson
Contents 1. Introduction ............................................................................................................... 1 2. Previous Literature .................................................................................................... 2 3. Data........................................................................................................................... 4 4. Measuring segregation............................................................................................... 6 5. Results....................................................................................................................... 8
Ethnic Composition of Schools .................................................................................. 8 Indices of Segregation.............................................................................................. 10 Ethnic Segregation and Income segregation ............................................................. 22
6. Conclusion............................................................................................................... 25 References........................................................................................................................... 27 CASEpaper 79 Centre for Analysis of Social Exclusion February 2004 London School of Economics Houghton Street London WC2A 2AE CASE enquiries – tel: 020 7955 6679
ii
Centre for Analysis of Social Exclusion The ESRC Research Centre for Analysis of Social Exclusion (CASE) was established in October 1997 with funding from the Economic and Social Research Council. It is located within the Suntory and Toyota International Centres for Economics and Related Disciplines (STICERD) at the London School of Economics and Political Science, and benefits from support from STICERD. It is directed by Howard Glennerster, John Hills, Kathleen Kiernan, Julian Le Grand, Anne Power and Carol Propper. Our Discussion Paper series is available free of charge. We also produce summaries of our research in CASEbriefs, and reports from various conferences and activities in CASEreports. To subscribe to the CASEpaper series, or for further information on the work of the Centre and our seminar series, please contact the Centre Administrator, Jane Dickson, on:
Telephone: UK+20 7955 6679 Fax: UK+20 7955 6951 Email: [email protected] Web site: http://sticerd.lse.ac.uk/case
Simon Burgess Deborah Wilson All rights reserved. Short sections of text, not to exceed two paragraphs, may be quoted without explicit permission provided that full credit, including notice, is given to the source.
iii
Editorial Note
Simon Burgess is Professor of Economics in the Department of Economics and the Leverhulme Centre for Market and Public Organisation (CMPO), University of Bristol; and a Research Associate at the ESRC Research Centre for Analysis of Social Exclusion, London School of Economics. Deborah Wilson is a Senior Research Officer at the CMPO, University of Bristol. Acknowledgements
Thanks to the Leverhulme Trust for funding this work through the Leverhulme Centre for Market and Public Organisation, and to the Department for Education and Skills for supplying the data. Thanks also to Paul Gregg, Ron Johnston, Nabil Khattab, Ruth Lupton, Tariq Modood, Anne Power and Bill Wilson for comments on an earlier draft and to Adele Atkinson and Brendon McConnell for compiling the dataset. The views expressed in this paper are our own. Abstract
We document ethnic segregation in secondary schools in England in 2001 in order to contribute to the debate on the degree of ethnic group social integration. We use indices of dissimilarity and isolation to compare the patterns of segregation across nine ethnic groups. We find that levels of ethnic segregation in England’s schools are high, with considerable variation both across LEAs and across different minority ethnic groups. By combining the two indices we are able to identify areas of particular concern as scoring highly on both. Finally, we show that ethnic segregation is only weakly related to income segregation. JEL subject codes: J78, J15, J24 Keywords: England; ethnic segregation; segregation indices; schools, minority group differences, spatial income clustering Correspondence: CMPO, Department of Economics, University of Bristol, 12 Priory Road, Bristol BS8 1TN Simon Burgess: email: [email protected]; tel: +44(0)117 954 8436 Deborah Wilson: email: [email protected]; tel: +44(0)117 928 7795
1
1. Introduction
The degree of ethnic group social integration is a major issue in Britain, and indeed more widely. For example, The Economist highlights a “wide-ranging question with no easy answers: can Europe integrate its mainly new, and growing, minorities?”1 This is clearly a many-faceted issue, and this paper concentrates on just one, ethnic segregation in schools. This complements the substantial literature on residential segregation. The topic of ethnic segregation in schools is one of very long standing, particularly in the US (see Reardon et al (2000) and references therein). It has also been highlighted as a contributory factor in a recent UK Government report on the rioting in northern towns in the summer of 2001 (Cantle 2001). This paper aims to establish some facts concerning ethnic segregation in English schools in 2001. We measure segregation using indices of dissimilarity and isolation, the two most widely used measures. We compare the patterns of segregation across nine ethnic groups. We also look at the contribution of spatial income clustering to ethnic segregation. Our main findings are as follows. Levels of ethnic segregation in England’s schools are high. In many local areas, over half the minority pupils would have to switch schools to produce an even spread of ethnic groups. Second, there is considerable variation across groups – segregation is higher for pupils of Indian, Pakistani or Bangladeshi origin than for pupils with black Caribbean or black African heritage. Furthermore, in the former groups, segregation appears to be higher where they are (relatively) numerous, while for black pupils segregation is lower in areas where they are more numerous. Third, combining the dissimilarity and isolation indices, we identify areas of particular concern as scoring highly on both. For pupils of Asian ethnic origin, we find that these areas coincide almost exactly with the locations of the severe disorders in the summer of 2001. This is suggestive that either school segregation plays a direct role in the underlying causes of discontent (as suggested by the Cantle Report on the riots), or is related through a correlation with housing segregation. Our data do not allow us to definitively address these points. Finally, we show that ethnic segregation in schools is only very weakly related to income segregation. That is, there are areas with the same spatial spread of income, but very different levels of ethnic segregation.
1 The Economist, 10th May 2003, p.23.
2
The rest of the paper is organised as follows. Section 2 briefly describes some related literature. Section 3 details our dataset, and section 4 the methods we use to measure segregation. Section 5 then presents our results and the final section concludes.
2. Previous Literature
The focus of this study is ethnic segregation in English secondary schools. Three related strands of a wide literature on segregation are therefore relevant. First, the issue of what is meant by ‘segregation’ and how best to measure it; second, the evidence on ethnic residential segregation; finally, evidence on both ethnic and income segregation across schools. We briefly review the literature relating to each of these three aspects in turn. There is a large literature on how to measure segregation, which primarily focuses on residential segregation across urban areal units. Massey and Denton (1988) distinguish five dimensions of residential segregation: evenness, exposure, concentration, centralization and clustering. Each is conceptually distinct, picking up different aspects of the phenomenon. Concentration, centralization and clustering are all explicitly spatial in nature and as such we cannot address them using our data. Here, therefore, we focus on evenness and exposure. Evenness refers to the differential distribution of two social groups in a city (Massey and Denton 1988). An uneven distribution of a minority group across areal units results in segregation of that group. Following Duncan and Duncan (1955), the most widely used measure of evenness is the index of dissimilarity, D. Exposure refers to the degree of potential contact between members of different social groups within areal units. The most widely used measure of exposure is the isolation index, I (see Massey and Denton (1988) for a discussion of the relative merits of alternative measures of evenness and exposure). So we pick up on two dimensions of segregation by using both D and I. While evenness and exposure are conceptually distinct, Massey and Denton find that they are closely correlated empirically. Our results confirm this in the context of school segregation. The issue of ethnic residential segregation has long been a concern, particularly in the United States. Cutler, Glaeser and Vigdor (1999) provide consistent, long term measures of ethnic segregation in American cities from 1890 to 1990. They conclude that, first, segregation rose until 1970 and then “modestly” declined; second, that segregation across cities is extremely persistent and positively related to city size. Borjas (1997) distinguishes two issues the
3
literature tries to address: the measurement of the degree of segregation in specific geographical areas (Bean and Tienda 1987; Massey and Denton 1989; McKinney and Schnare 1989) and the implications of this “ghettoization” (Case and Katz 1991; Crane 1991; Cutler and Glaeser 1997). The general conclusion from the latter is that neighbourhood effects do have a significant impact on outcomes. Here we focus on the former issue in the context of school segregation; we aim to address the impact of such segregation in later work. In the UK context, Peach (1996) uses 1991 census data to measure the degree of segregation in British cities and compare this to the levels found in the US. He finds that the proportions individual ethnic minorities form of local area (ward and enumeration district) populations are “nowhere near as high as that formed regularly by the African American population in the US” (page 221). He does find differences between ethnic minorities in Britain, however: Caribbean average levels of residential segregation are much lower than those for Bangladeshis or Pakistanis and generally below those for Indians. We find a similar picture when we consider average levels of school segregation. As Rivkin (1994) states, any analysis of student segregation using school level data incorporates the influences of both the geographic locations of pupils (or their families) and the attendance policies employed by school districts. He attempts to separately identify these two influences and investigate changes in the levels of both using US data from 1968 to 1988. He concludes that US schools are highly segregated, but that this is primarily due to continued high levels of residential segregation and that integrative action by school districts will at best have a marginal impact. Reardon et al (2000) concur with this conclusion. They discuss previous studies (Clotfelter 1998; Orfield et al 1997) which have used pairwise measures of segregation (majority/minority). In general, such studies show gradual increases of both white/black and white/Hispanic school segregation in the 1990s. In their paper, Reardon et al decompose the entropy index of segregation (a measure of evenness) into several components in order to estimate different minority/minority trends as well as majority/minority. They find that, between 1989 and 1995 in US metropolitan areas, segregation between white students and their black, Hispanic and Asian peers rose, while groups other than white became less segregated from one another. The authors further decomposed the index into geographical components and found that two thirds of metropolitan public-school segregation is between school districts, resulting largely from residential patterns. They conclude that residential segregation remains a significant barrier to school desegregation.
4
The school segregation literature in the UK has focussed primarily on income segregation, using eligibility for free school meals as an indicator of low income. Gorard and Fitz (1998a, b) use a variant of the isolation index on both Welsh and English data and conclude that income segregation has decreased since the Education Reform Act of 1988 which introduced a quasi-market into the UK education system. Noden (2000) employs both an isolation index and an index of dissimilarity and finds that there has been a consistent rise in the average level of income segregation across English secondary schools across both the exposure and the evenness dimensions of segregation. Goldstein and Noden (2003) extend the analysis by employing multilevel modelling techniques to estimate social segregation trends. They too find evidence of an increase in such segregation in England between 1994 and 1999. These last two results concur more with other studies, which suggest that the quasi-market reforms gradually introduced ways of disadvantaging minorities (Tomlinson 2001). For this analysis we employ similar indices to investigate segregation by ethnicity.
3. Data
We use data from the Annual Schools Census (ASC), or ‘Form 7’ as it was previously known, which covers all schools. Returning this data is a mandatory requirement for schools. We focus on state maintained secondary schools in England in 2001 (the pupils are aged from 11 to 16 or 18). We use data on the ethnic composition of schools, along with a number of other school level characteristics. We match on to this some area (ward-based) data. Data on ethnic identity for each individual pupil is now becoming available in PLASC (Pupil Level Annual Schools Census) and is the subject of ongoing research. One important question in this field is the definitions of ethnicity available. Often, these are rather aggregated, while other evidence and casual empiricism suggests that there is a diversity of experience within such broad ethnic groups.2 This data is a little better, but still not very disaggregate. The data available to us give the number of pupils in each school classified as being of:
black Caribbean heritage black African heritage black other heritage
2 For example, incidence of low income is very different: in 2000/01, 60% of Pakistanis
and Bangladeshis lived in low-income households, compared to 25% of Indians, 19% of black Caribbeans and 17% of whites. (Source: http://www.statistics.gov.uk/cci/nugget.asp?id=269 using HBAI and Family Resources Survey). See also Dorsett (1998).
5
Indian ethnic origin Pakistani ethnic origin Bangladeshi ethnic origin Chinese ethnic origin any other minority ethnic origin white ethnic origin
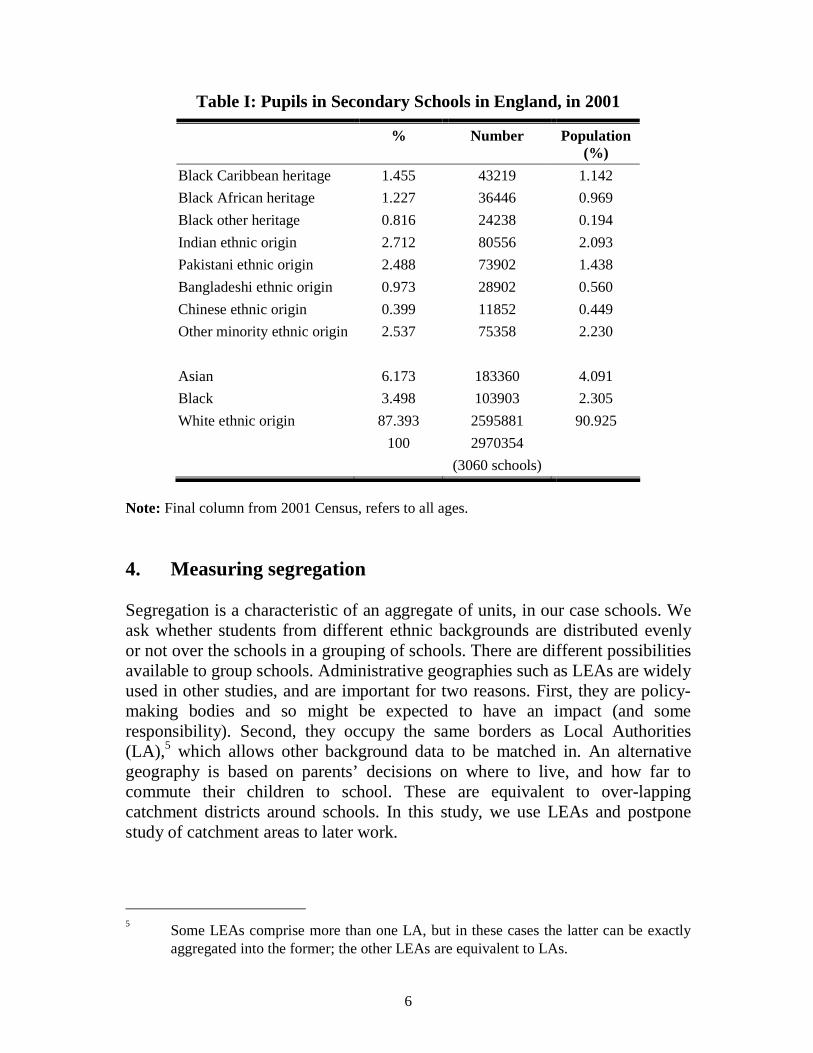
For comparison with more aggregated groups in other work, we also report results for the created groups ‘Black’ combining the three black groups, and ‘Asian’ combining Indian, Pakistani and Bangladeshi.3 We compare ethnic segregation to income-related measures of segregation. We use pupils’ eligibility for Free School Meals (FSM), which is related to the parental income, and is available at school level in the ASC. The figure used is the percentage of pupils in the school known to be eligible for free school meals (but not necessarily claiming). We also match in spatial data on deprivation. We use the Index of Multiple Deprivation (IMD), available at ward level.4 The components of this index are subindices relating to income; employment; health; education; housing; and geographical access to services. We compute the standard deviation of the ward-level indices across each Local Education Authority (LEA) as a measure of spatial income segregation in the LEA. We make a small number of sample selection decisions. We omit independent schools, special schools and other academic centres such as hospital schools and detention centres. We also drop schools that could not be matched using school number. We omit the nine schools with missing ethnicity data, and we drop all schools from LEAs with very few schools: the Isles of Scilly (1 school), the Isle of Wight (5), Rutland (3), Kensington and Chelsea (4), and Hartlepool (5). Table I describes the ethnicity of the pupils in our dataset adding up over all of England. Clearly, the majority overall are white, with about 1.5% of black Caribbean heritage, 2.0% other black heritage, 2.7% Indian ethnicity and 2.5% Pakistani heritage. Table I also provides the same breakdown from the 2001 Census for England. This column shows the difference between school age children and the whole population. The comparison shows that ethnic minorities form a slightly higher proportion of children than of the population as a whole.
3 This corresponds to Peach’s (1996) ‘South Asian’ category.
4 See http://www.neighbourhood.statistics.gov.uk/metadata.asp?dsno=18 for the data
and http://www.urban.odpm.gov.uk/research/summaries/03100/pdf/rrs03100.pdf for details of construction of the indices. Note that both FSM and IMD are measures of the income distribution across the whole population and are not specific to any minority ethnic group(s).
6
Table I: Pupils in Secondary Schools in England, in 2001
% Number Population (%)
Black Caribbean heritage 1.455 43219 1.142
Black African heritage 1.227 36446 0.969
Black other heritage 0.816 24238 0.194
Indian ethnic origin 2.712 80556 2.093
Pakistani ethnic origin 2.488 73902 1.438
Bangladeshi ethnic origin 0.973 28902 0.560
Chinese ethnic origin 0.399 11852 0.449
Other minority ethnic origin 2.537 75358 2.230
Asian 6.173 183360 4.091
Black 3.498 103903 2.305
White ethnic origin 87.393 2595881 90.925
100 2970354
(3060 schools)
Note: Final column from 2001 Census, refers to all ages.
4. Measuring segregation
Segregation is a characteristic of an aggregate of units, in our case schools. We ask whether students from different ethnic backgrounds are distributed evenly or not over the schools in a grouping of schools. There are different possibilities available to group schools. Administrative geographies such as LEAs are widely used in other studies, and are important for two reasons. First, they are policy-making bodies and so might be expected to have an impact (and some responsibility). Second, they occupy the same borders as Local Authorities (LA),5 which allows other background data to be matched in. An alternative geography is based on parents’ decisions on where to live, and how far to commute their children to school. These are equivalent to over-lapping catchment districts around schools. In this study, we use LEAs and postpone study of catchment areas to later work.
5 Some LEAs comprise more than one LA, but in these cases the latter can be exactly
aggregated into the former; the other LEAs are equivalent to LAs.
7
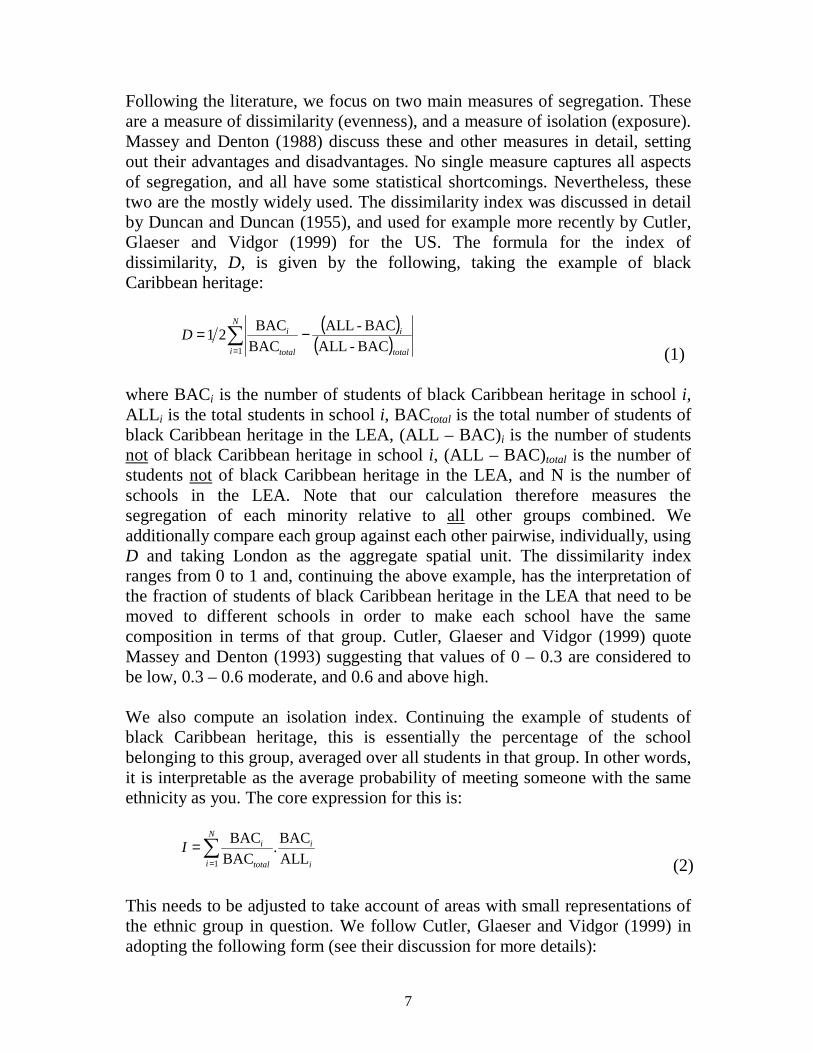
Following the literature, we focus on two main measures of segregation. These are a measure of dissimilarity (evenness), and a measure of isolation (exposure). Massey and Denton (1988) discuss these and other measures in detail, setting out their advantages and disadvantages. No single measure captures all aspects of segregation, and all have some statistical shortcomings. Nevertheless, these two are the mostly widely used. The dissimilarity index was discussed in detail by Duncan and Duncan (1955), and used for example more recently by Cutler, Glaeser and Vidgor (1999) for the US. The formula for the index of dissimilarity, D, is given by the following, taking the example of black Caribbean heritage:
( )( )∑
=
−=N
i total
i
total
iD1 BAC-ALL
BAC-ALLBACBAC
21 (1)
where BACi is the number of students of black Caribbean heritage in school i, ALLi is the total students in school i, BACtotal is the total number of students of black Caribbean heritage in the LEA, (ALL – BAC)i is the number of students not of black Caribbean heritage in school i, (ALL – BAC)total is the number of students not of black Caribbean heritage in the LEA, and N is the number of schools in the LEA. Note that our calculation therefore measures the segregation of each minority relative to all other groups combined. We additionally compare each group against each other pairwise, individually, using D and taking London as the aggregate spatial unit. The dissimilarity index ranges from 0 to 1 and, continuing the above example, has the interpretation of the fraction of students of black Caribbean heritage in the LEA that need to be moved to different schools in order to make each school have the same composition in terms of that group. Cutler, Glaeser and Vidgor (1999) quote Massey and Denton (1993) suggesting that values of 0 – 0.3 are considered to be low, 0.3 – 0.6 moderate, and 0.6 and above high. We also compute an isolation index. Continuing the example of students of black Caribbean heritage, this is essentially the percentage of the school belonging to this group, averaged over all students in that group. In other words, it is interpretable as the average probability of meeting someone with the same ethnicity as you. The core expression for this is:
∑
=
=N
i i
i
total
iI1 ALL
BAC.
BACBAC
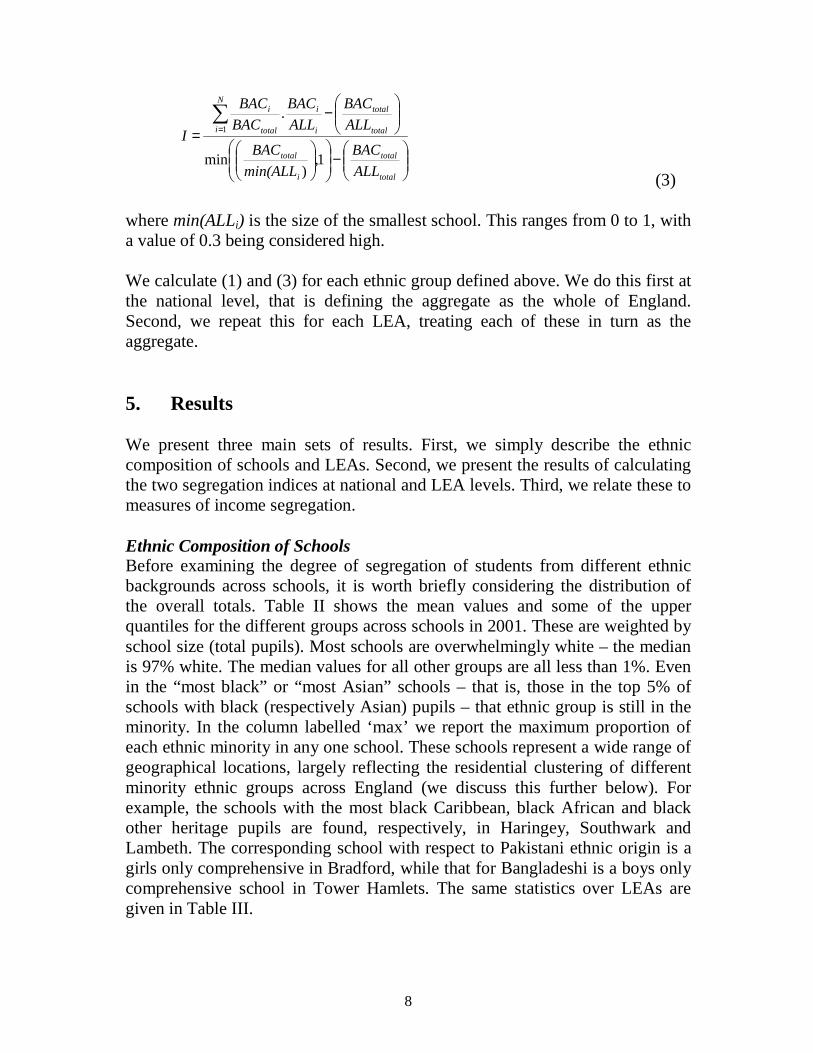
(2) This needs to be adjusted to take account of areas with small representations of the ethnic group in question. We follow Cutler, Glaeser and Vidgor (1999) in adopting the following form (see their discussion for more details):
8
−
−
=∑
=
total
total
i
total
total
totalN
i i
i
total
i
ALL
BAC
min(ALL
BAC
ALL
BAC
ALL
BAC
BAC
BAC
I
1,)
min
.1
(3) where min(ALLi) is the size of the smallest school. This ranges from 0 to 1, with a value of 0.3 being considered high. We calculate (1) and (3) for each ethnic group defined above. We do this first at the national level, that is defining the aggregate as the whole of England. Second, we repeat this for each LEA, treating each of these in turn as the aggregate.
5. Results
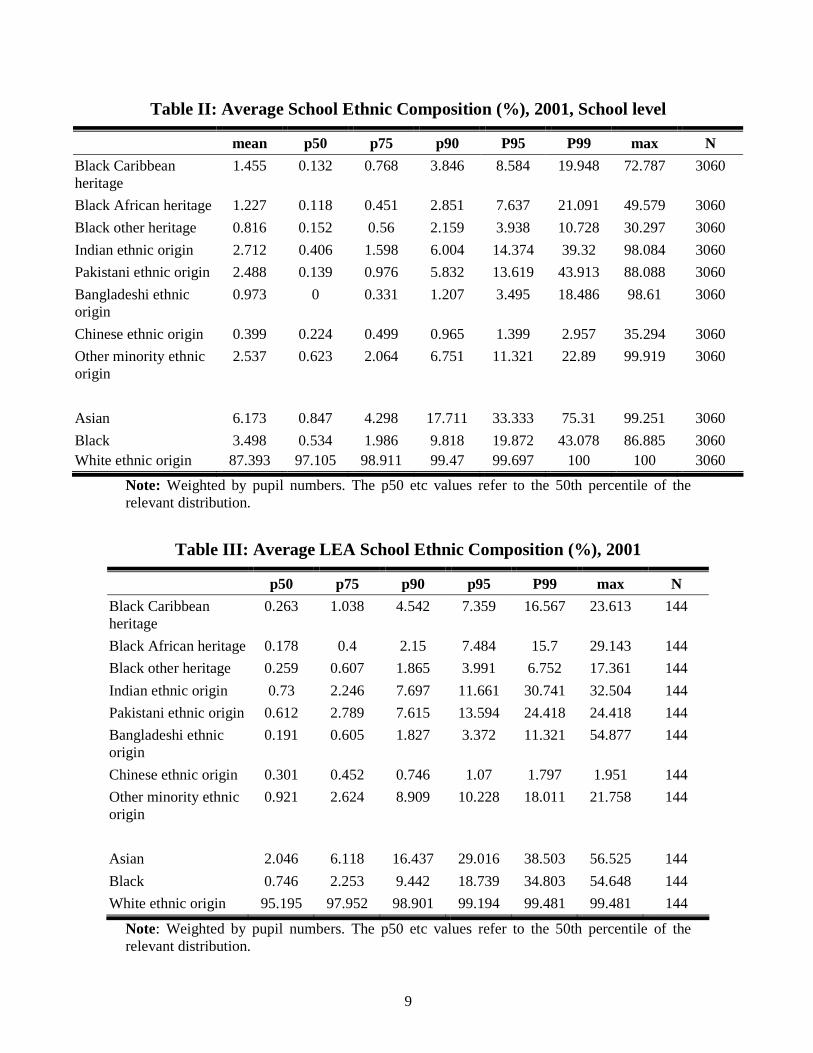
We present three main sets of results. First, we simply describe the ethnic composition of schools and LEAs. Second, we present the results of calculating the two segregation indices at national and LEA levels. Third, we relate these to measures of income segregation. Ethnic Composition of Schools Before examining the degree of segregation of students from different ethnic backgrounds across schools, it is worth briefly considering the distribution of the overall totals. Table II shows the mean values and some of the upper quantiles for the different groups across schools in 2001. These are weighted by school size (total pupils). Most schools are overwhelmingly white – the median is 97% white. The median values for all other groups are all less than 1%. Even in the “most black” or “most Asian” schools – that is, those in the top 5% of schools with black (respectively Asian) pupils – that ethnic group is still in the minority. In the column labelled ‘max’ we report the maximum proportion of each ethnic minority in any one school. These schools represent a wide range of geographical locations, largely reflecting the residential clustering of different minority ethnic groups across England (we discuss this further below). For example, the schools with the most black Caribbean, black African and black other heritage pupils are found, respectively, in Haringey, Southwark and Lambeth. The corresponding school with respect to Pakistani ethnic origin is a girls only comprehensive in Bradford, while that for Bangladeshi is a boys only comprehensive school in Tower Hamlets. The same statistics over LEAs are given in Table III.
9
Table II: Average School Ethnic Composition (%), 2001, School level
mean p50 p75 p90 P95 P99 max N
Black Caribbean heritage
1.455 0.132 0.768 3.846 8.584 19.948 72.787 3060
Black African heritage 1.227 0.118 0.451 2.851 7.637 21.091 49.579 3060
Black other heritage 0.816 0.152 0.56 2.159 3.938 10.728 30.297 3060
Indian ethnic origin 2.712 0.406 1.598 6.004 14.374 39.32 98.084 3060
Pakistani ethnic origin 2.488 0.139 0.976 5.832 13.619 43.913 88.088 3060
Bangladeshi ethnic origin
0.973 0 0.331 1.207 3.495 18.486 98.61 3060
Chinese ethnic origin 0.399 0.224 0.499 0.965 1.399 2.957 35.294 3060
Other minority ethnic origin
2.537 0.623 2.064 6.751 11.321 22.89 99.919 3060
Asian 6.173 0.847 4.298 17.711 33.333 75.31 99.251 3060
Black 3.498 0.534 1.986 9.818 19.872 43.078 86.885 3060 White ethnic origin 87.393 97.105 98.911 99.47 99.697 100 100 3060
Note: Weighted by pupil numbers. The p50 etc values refer to the 50th percentile of the relevant distribution.
Table III: Average LEA School Ethnic Composition (%), 2001
p50 p75 p90 p95 P99 max N
Black Caribbean heritage
0.263 1.038 4.542 7.359 16.567 23.613 144
Black African heritage 0.178 0.4 2.15 7.484 15.7 29.143 144
Black other heritage 0.259 0.607 1.865 3.991 6.752 17.361 144
Indian ethnic origin 0.73 2.246 7.697 11.661 30.741 32.504 144
Pakistani ethnic origin 0.612 2.789 7.615 13.594 24.418 24.418 144
Bangladeshi ethnic origin
0.191 0.605 1.827 3.372 11.321 54.877 144
Chinese ethnic origin 0.301 0.452 0.746 1.07 1.797 1.951 144
Other minority ethnic origin
0.921 2.624 8.909 10.228 18.011 21.758 144
Asian 2.046 6.118 16.437 29.016 38.503 56.525 144
Black 0.746 2.253 9.442 18.739 34.803 54.648 144
White ethnic origin 95.195 97.952 98.901 99.194 99.481 99.481 144
Note: Weighted by pupil numbers. The p50 etc values refer to the 50th percentile of the relevant distribution.
10
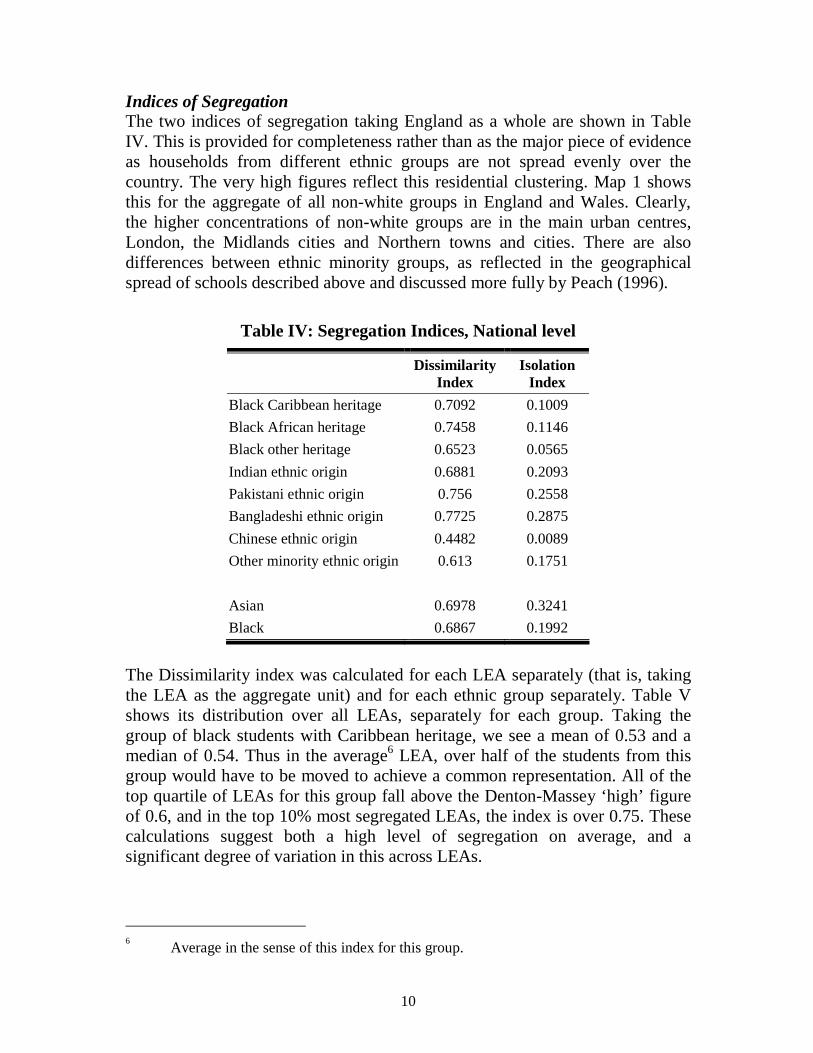
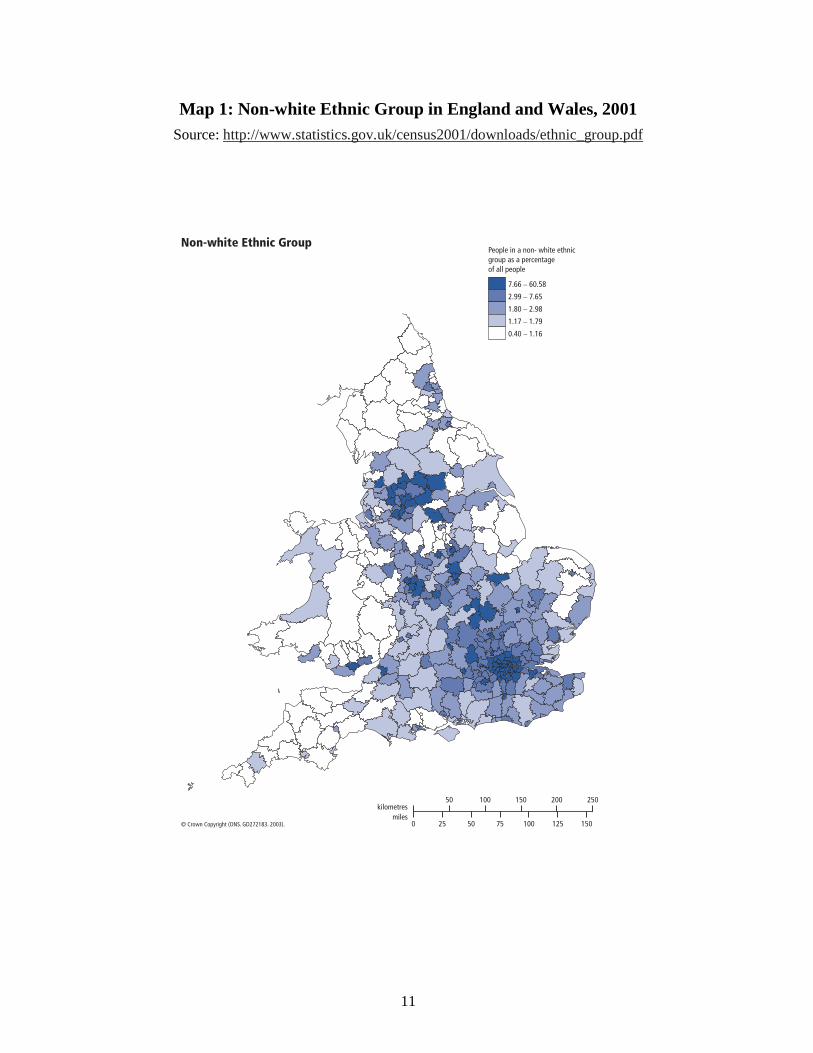
Indices of Segregation The two indices of segregation taking England as a whole are shown in Table IV. This is provided for completeness rather than as the major piece of evidence as households from different ethnic groups are not spread evenly over the country. The very high figures reflect this residential clustering. Map 1 shows this for the aggregate of all non-white groups in England and Wales. Clearly, the higher concentrations of non-white groups are in the main urban centres, London, the Midlands cities and Northern towns and cities. There are also differences between ethnic minority groups, as reflected in the geographical spread of schools described above and discussed more fully by Peach (1996).
Table IV: Segregation Indices, National level
Dissimilarity Index
Isolation Index
Black Caribbean heritage 0.7092 0.1009
Black African heritage 0.7458 0.1146
Black other heritage 0.6523 0.0565
Indian ethnic origin 0.6881 0.2093
Pakistani ethnic origin 0.756 0.2558
Bangladeshi ethnic origin 0.7725 0.2875
Chinese ethnic origin 0.4482 0.0089
Other minority ethnic origin 0.613 0.1751
Asian 0.6978 0.3241
Black 0.6867 0.1992
The Dissimilarity index was calculated for each LEA separately (that is, taking the LEA as the aggregate unit) and for each ethnic group separately. Table V shows its distribution over all LEAs, separately for each group. Taking the group of black students with Caribbean heritage, we see a mean of 0.53 and a median of 0.54. Thus in the average6 LEA, over half of the students from this group would have to be moved to achieve a common representation. All of the top quartile of LEAs for this group fall above the Denton-Massey ‘high’ figure of 0.6, and in the top 10% most segregated LEAs, the index is over 0.75. These calculations suggest both a high level of segregation on average, and a significant degree of variation in this across LEAs.
6 Average in the sense of this index for this group.
11
Map 1: Non-white Ethnic Group in England and Wales, 2001 Source: http://www.statistics.gov.uk/census2001/downloads/ethnic_group.pdf
© Crown Copyright (ONS. GD272183. 2003). 0 25 50
50
75 100
100
125 150
150 200 250
mileskilometres
0.40 _ 1.16
1.17 _ 1.79
1.80 _ 2.98
2.99 _ 7.65
7.66 _ 60.58
People in a non- white ethnicgroup as a percentageof all people
Non-white Ethnic Group
12
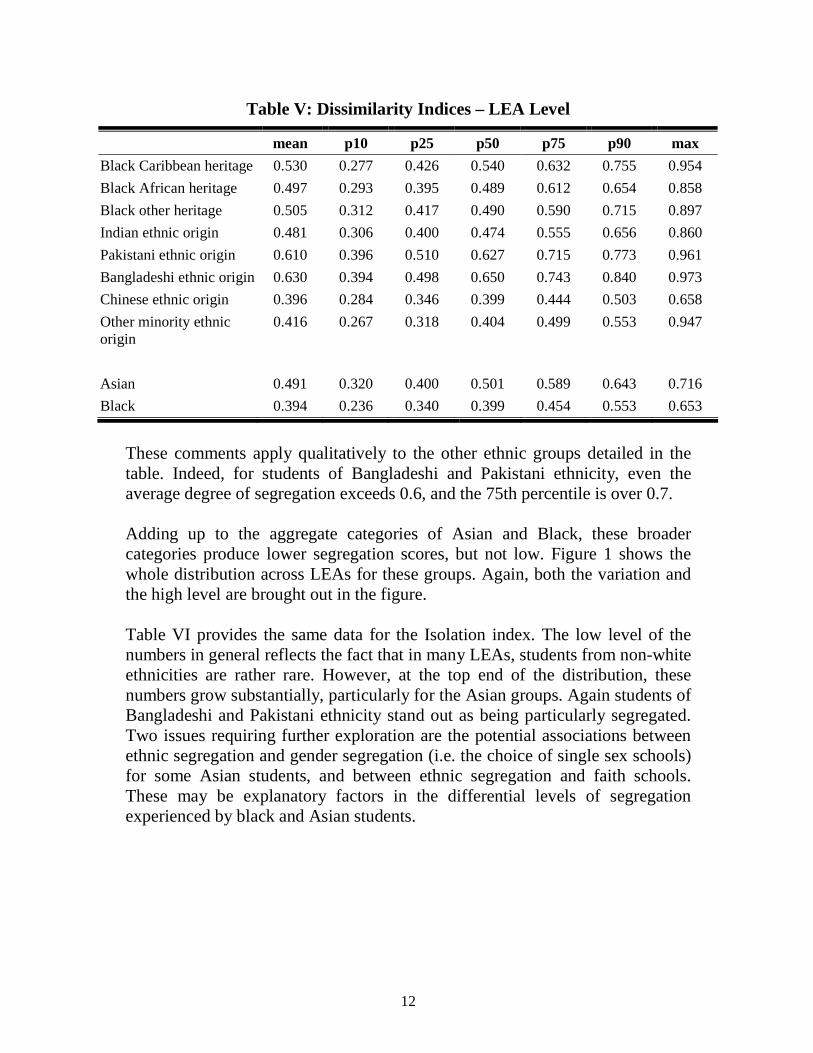
Table V: Dissimilarity Indices – LEA Level
mean p10 p25 p50 p75 p90 max
Black Caribbean heritage 0.530 0.277 0.426 0.540 0.632 0.755 0.954
Black African heritage 0.497 0.293 0.395 0.489 0.612 0.654 0.858
Black other heritage 0.505 0.312 0.417 0.490 0.590 0.715 0.897
Indian ethnic origin 0.481 0.306 0.400 0.474 0.555 0.656 0.860
Pakistani ethnic origin 0.610 0.396 0.510 0.627 0.715 0.773 0.961
Bangladeshi ethnic origin 0.630 0.394 0.498 0.650 0.743 0.840 0.973
Chinese ethnic origin 0.396 0.284 0.346 0.399 0.444 0.503 0.658
Other minority ethnic origin
0.416 0.267 0.318 0.404 0.499 0.553 0.947
Asian 0.491 0.320 0.400 0.501 0.589 0.643 0.716
Black 0.394 0.236 0.340 0.399 0.454 0.553 0.653
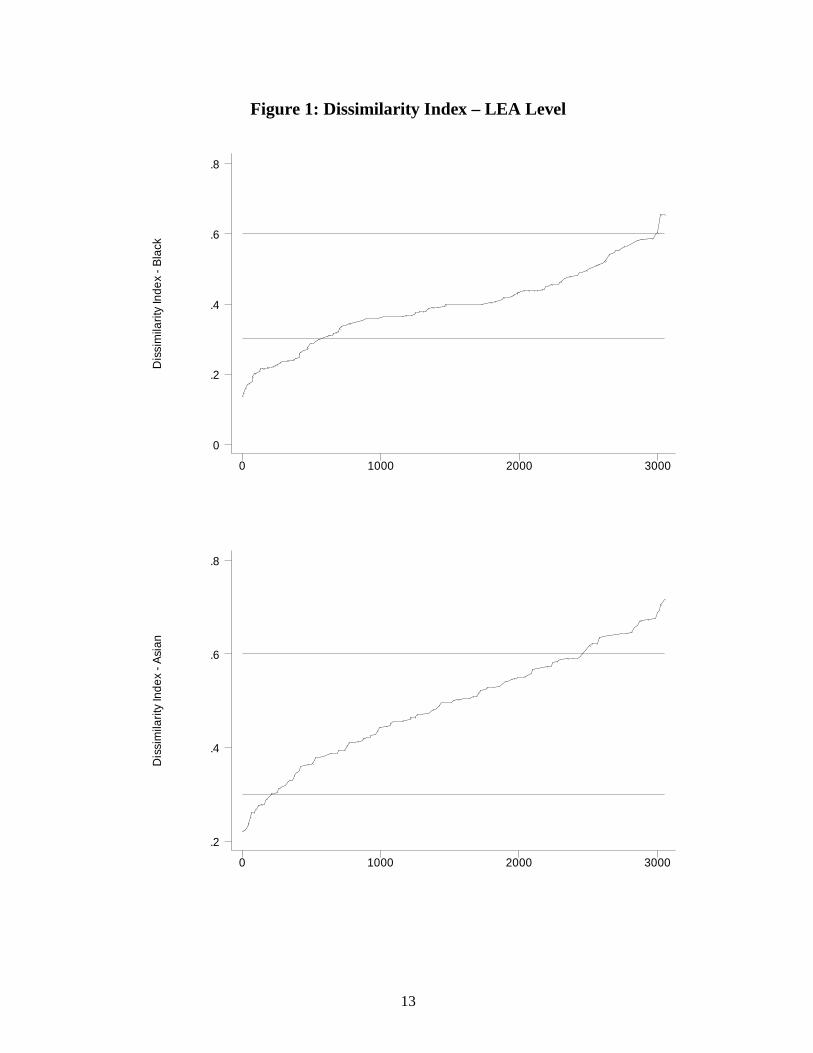
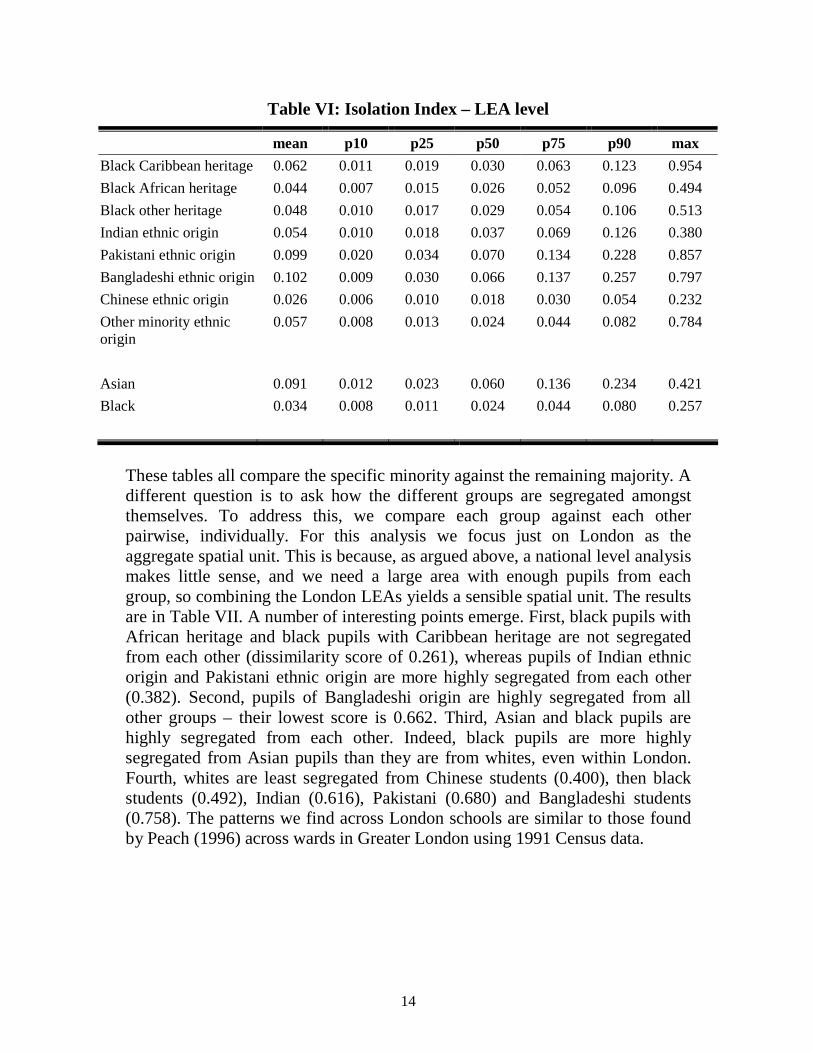
These comments apply qualitatively to the other ethnic groups detailed in the table. Indeed, for students of Bangladeshi and Pakistani ethnicity, even the average degree of segregation exceeds 0.6, and the 75th percentile is over 0.7. Adding up to the aggregate categories of Asian and Black, these broader categories produce lower segregation scores, but not low. Figure 1 shows the whole distribution across LEAs for these groups. Again, both the variation and the high level are brought out in the figure. Table VI provides the same data for the Isolation index. The low level of the numbers in general reflects the fact that in many LEAs, students from non-white ethnicities are rather rare. However, at the top end of the distribution, these numbers grow substantially, particularly for the Asian groups. Again students of Bangladeshi and Pakistani ethnicity stand out as being particularly segregated. Two issues requiring further exploration are the potential associations between ethnic segregation and gender segregation (i.e. the choice of single sex schools) for some Asian students, and between ethnic segregation and faith schools. These may be explanatory factors in the differential levels of segregation experienced by black and Asian students.
13
Figure 1: Dissimilarity Index – LEA Level
Dis
sim
ilarit
y In
dex
- Bla
ck
0 1000 2000 3000
0
.2
.4
.6
.8D
issi
mila
rity
Inde
x - A
sian
0 1000 2000 3000
.2
.4
.6
.8
14
Table VI: Isolation Index – LEA level
mean p10 p25 p50 p75 p90 max
Black Caribbean heritage 0.062 0.011 0.019 0.030 0.063 0.123 0.954
Black African heritage 0.044 0.007 0.015 0.026 0.052 0.096 0.494
Black other heritage 0.048 0.010 0.017 0.029 0.054 0.106 0.513
Indian ethnic origin 0.054 0.010 0.018 0.037 0.069 0.126 0.380
Pakistani ethnic origin 0.099 0.020 0.034 0.070 0.134 0.228 0.857
Bangladeshi ethnic origin 0.102 0.009 0.030 0.066 0.137 0.257 0.797
Chinese ethnic origin 0.026 0.006 0.010 0.018 0.030 0.054 0.232
Other minority ethnic origin
0.057 0.008 0.013 0.024 0.044 0.082 0.784
Asian 0.091 0.012 0.023 0.060 0.136 0.234 0.421
Black 0.034 0.008 0.011 0.024 0.044 0.080 0.257
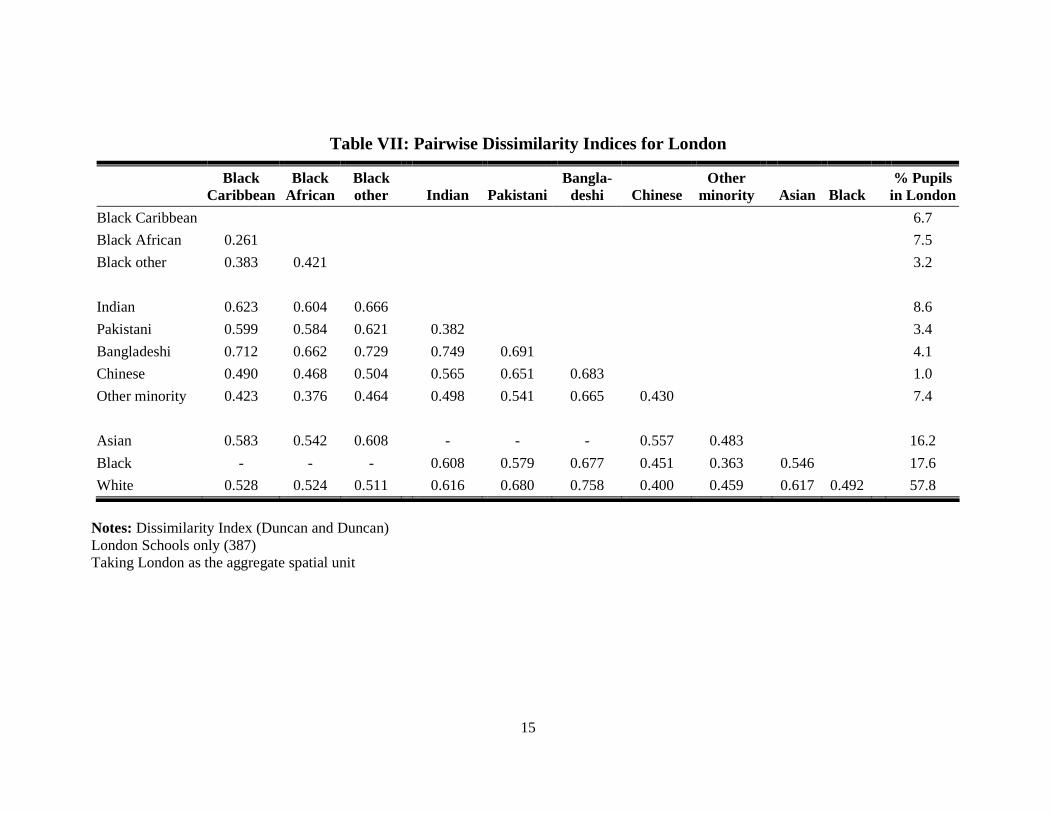
These tables all compare the specific minority against the remaining majority. A different question is to ask how the different groups are segregated amongst themselves. To address this, we compare each group against each other pairwise, individually. For this analysis we focus just on London as the aggregate spatial unit. This is because, as argued above, a national level analysis makes little sense, and we need a large area with enough pupils from each group, so combining the London LEAs yields a sensible spatial unit. The results are in Table VII. A number of interesting points emerge. First, black pupils with African heritage and black pupils with Caribbean heritage are not segregated from each other (dissimilarity score of 0.261), whereas pupils of Indian ethnic origin and Pakistani ethnic origin are more highly segregated from each other (0.382). Second, pupils of Bangladeshi origin are highly segregated from all other groups – their lowest score is 0.662. Third, Asian and black pupils are highly segregated from each other. Indeed, black pupils are more highly segregated from Asian pupils than they are from whites, even within London. Fourth, whites are least segregated from Chinese students (0.400), then black students (0.492), Indian (0.616), Pakistani (0.680) and Bangladeshi students (0.758). The patterns we find across London schools are similar to those found by Peach (1996) across wards in Greater London using 1991 Census data.
15
Table VII: Pairwise Dissimilarity Indices for London
Black
Caribbean Black
African Black other Indian Pakistani
Bangla-deshi Chinese
Other minority Asian Black
% Pupils in London
Black Caribbean 6.7
Black African 0.261 7.5
Black other 0.383 0.421 3.2
Indian 0.623 0.604 0.666 8.6
Pakistani 0.599 0.584 0.621 0.382 3.4
Bangladeshi 0.712 0.662 0.729 0.749 0.691 4.1
Chinese 0.490 0.468 0.504 0.565 0.651 0.683 1.0
Other minority 0.423 0.376 0.464 0.498 0.541 0.665 0.430 7.4
Asian 0.583 0.542 0.608 - - - 0.557 0.483 16.2
Black - - - 0.608 0.579 0.677 0.451 0.363 0.546 17.6
White 0.528 0.524 0.511 0.616 0.680 0.758 0.400 0.459 0.617 0.492 57.8
Notes: Dissimilarity Index (Duncan and Duncan) London Schools only (387) Taking London as the aggregate spatial unit
16
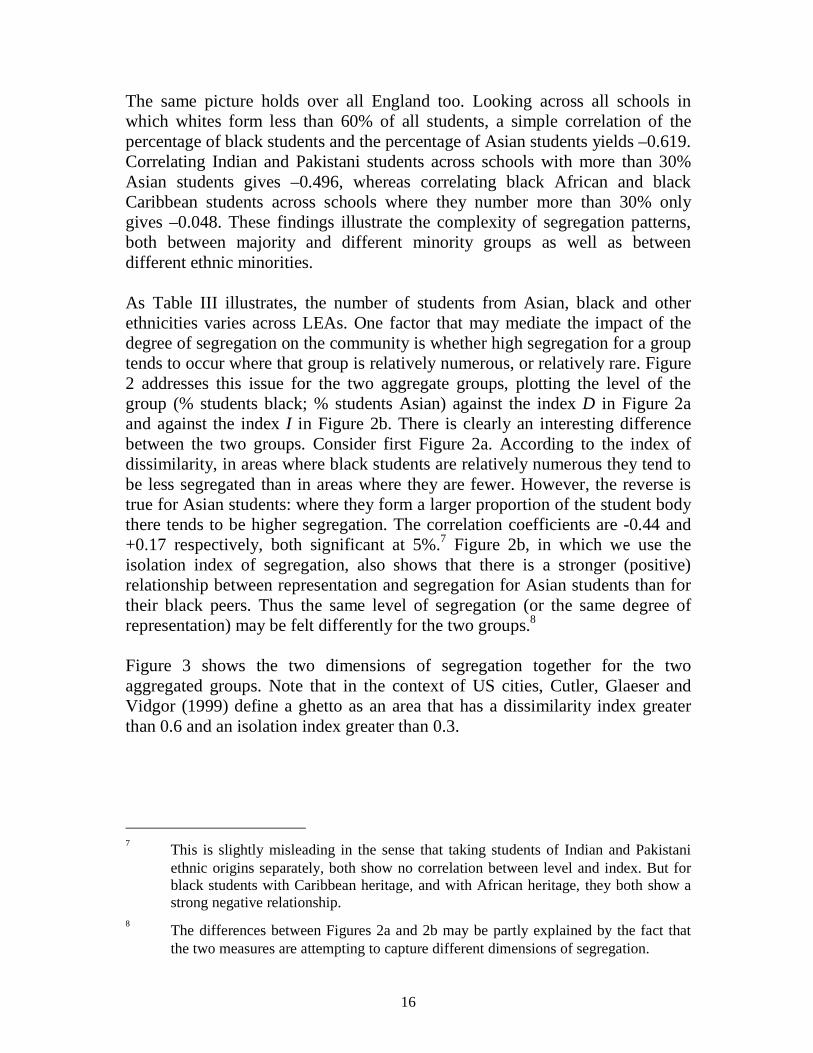
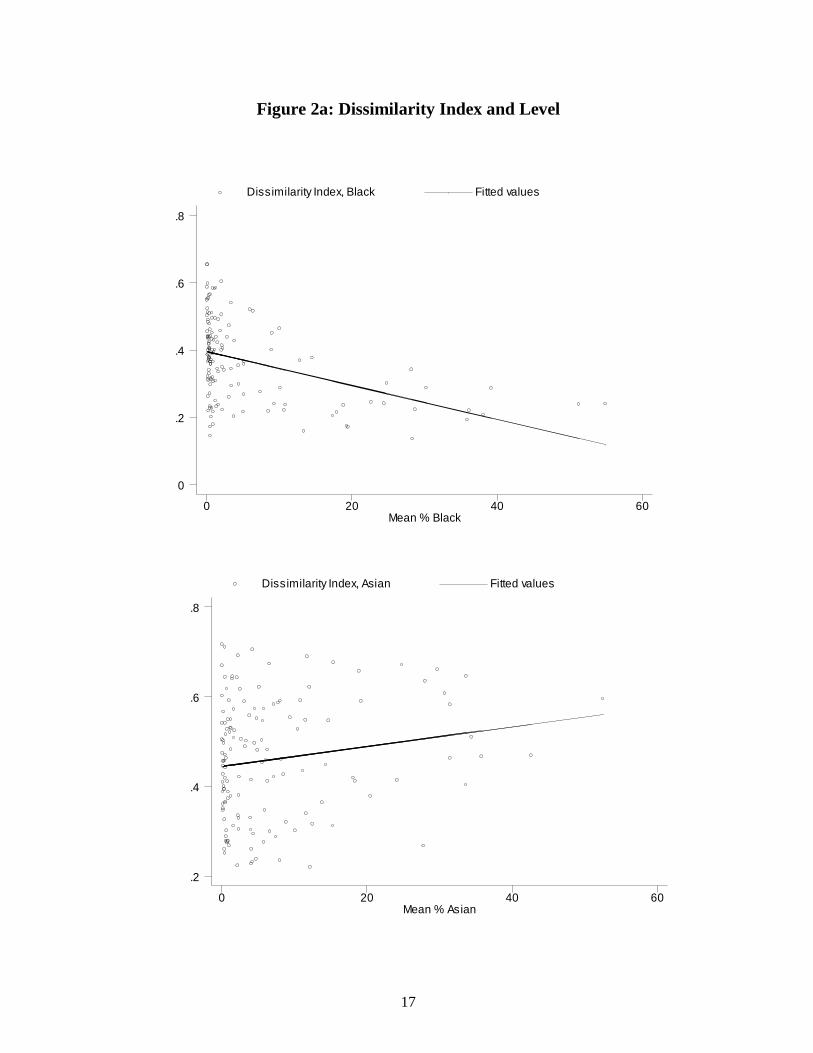
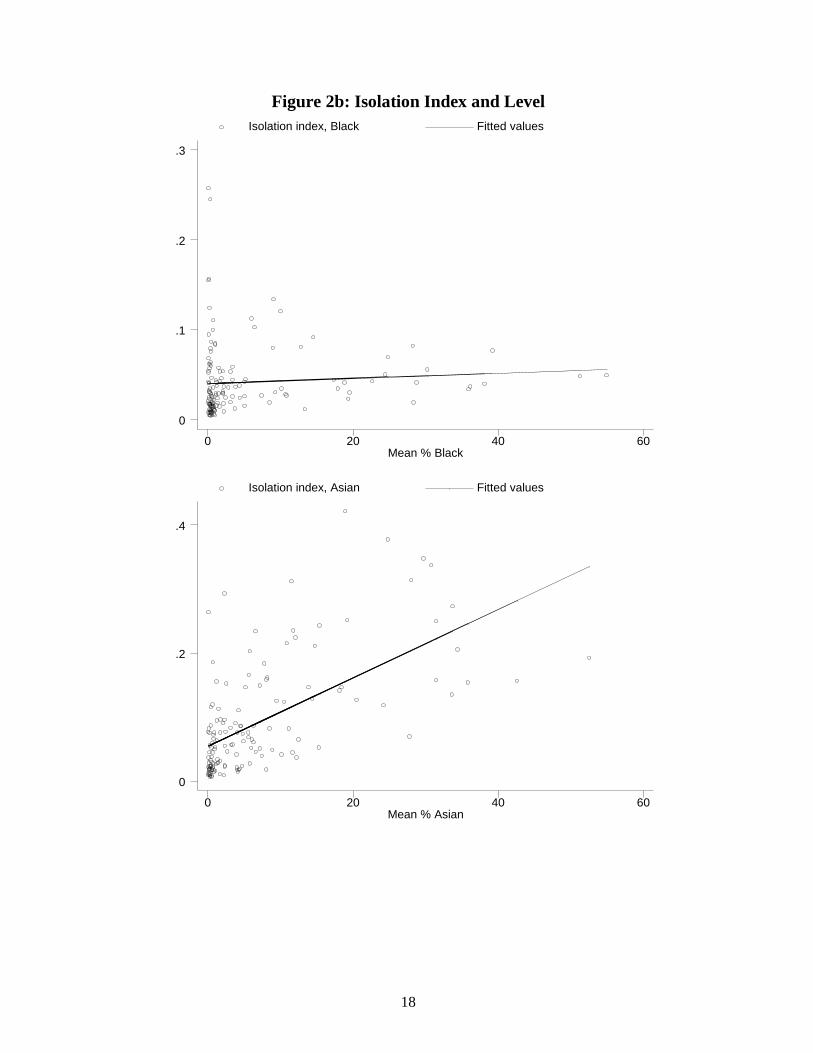
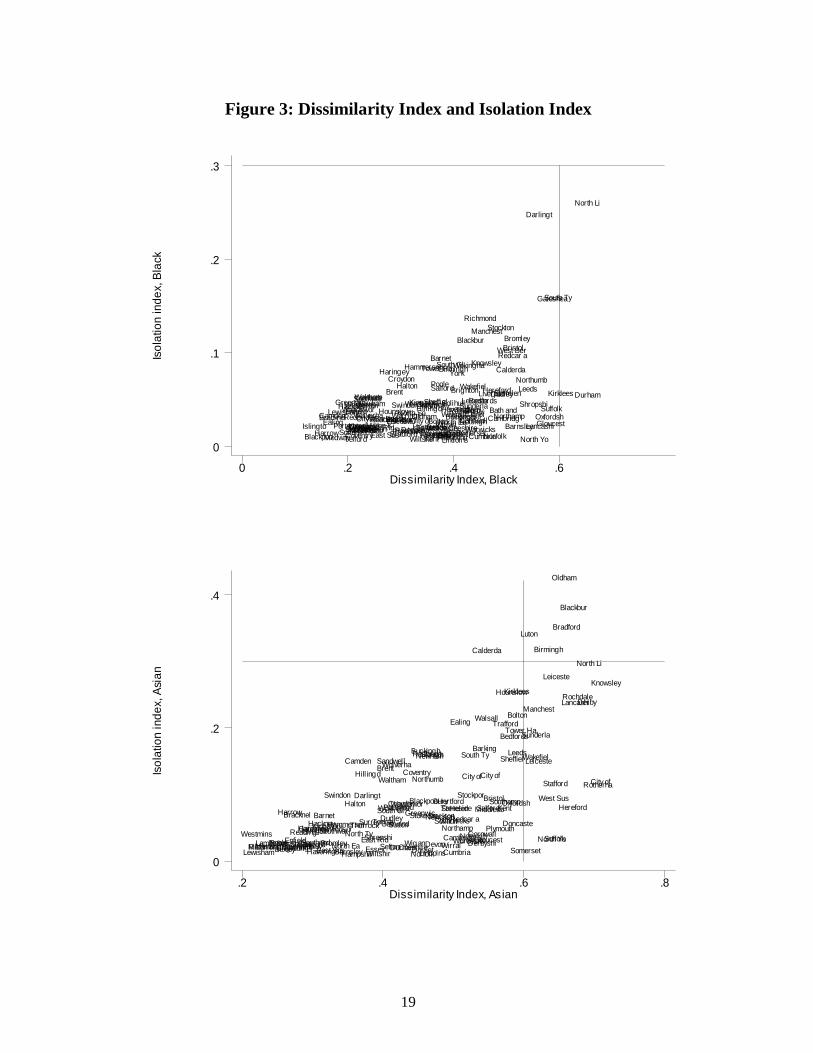
The same picture holds over all England too. Looking across all schools in which whites form less than 60% of all students, a simple correlation of the percentage of black students and the percentage of Asian students yields –0.619. Correlating Indian and Pakistani students across schools with more than 30% Asian students gives –0.496, whereas correlating black African and black Caribbean students across schools where they number more than 30% only gives –0.048. These findings illustrate the complexity of segregation patterns, both between majority and different minority groups as well as between different ethnic minorities. As Table III illustrates, the number of students from Asian, black and other ethnicities varies across LEAs. One factor that may mediate the impact of the degree of segregation on the community is whether high segregation for a group tends to occur where that group is relatively numerous, or relatively rare. Figure 2 addresses this issue for the two aggregate groups, plotting the level of the group (% students black; % students Asian) against the index D in Figure 2a and against the index I in Figure 2b. There is clearly an interesting difference between the two groups. Consider first Figure 2a. According to the index of dissimilarity, in areas where black students are relatively numerous they tend to be less segregated than in areas where they are fewer. However, the reverse is true for Asian students: where they form a larger proportion of the student body there tends to be higher segregation. The correlation coefficients are -0.44 and +0.17 respectively, both significant at 5%.7 Figure 2b, in which we use the isolation index of segregation, also shows that there is a stronger (positive) relationship between representation and segregation for Asian students than for their black peers. Thus the same level of segregation (or the same degree of representation) may be felt differently for the two groups.8 Figure 3 shows the two dimensions of segregation together for the two aggregated groups. Note that in the context of US cities, Cutler, Glaeser and Vidgor (1999) define a ghetto as an area that has a dissimilarity index greater than 0.6 and an isolation index greater than 0.3.
7 This is slightly misleading in the sense that taking students of Indian and Pakistani
ethnic origins separately, both show no correlation between level and index. But for black students with Caribbean heritage, and with African heritage, they both show a strong negative relationship.
8 The differences between Figures 2a and 2b may be partly explained by the fact that
the two measures are attempting to capture different dimensions of segregation.
17
Figure 2a: Dissimilarity Index and Level
Mean % Black
Dissimilarity Index, Black Fitted values
0 20 40 60
0
.2
.4
.6
.8
Mean % Asian
Dissimilarity Index, Asian Fitted values
0 20 40 60
.2
.4
.6
.8
18
Figure 2b: Isolation Index and Level
Mean % Black
Isolation index, Black Fitted values
0 20 40 60
0
.1
.2
.3
Mean % Asian
Isolation index, Asian Fitted values
0 20 40 60
0
.2
.4
19
Figure 3: Dissimilarity Index and Isolation Index
Is
olat
ion
inde
x, B
lack
Dissimilarity Index, Black0 .2 .4 .6
0
.1
.2
.3
Camden
GreenwicHackney
Hammersm
Islingto
Lambeth
Lewisham
Southwar
Tower Ha
WandsworWestmins
Barking
Barnet
Bexley
Brent
Bromley
Croydon
EalingEnfield
Haringey
Harrow
HaveringHillingdHounslowKingstonMertonNewham
Redbridg
Richmond
Sutton
Waltham
Birmingh
Coventry
DudleySandwellSolihull
WalsallWolverha
Knowsley
LiverpooSt Helen
SeftonWirral
BoltonBury
Manchest
Oldham
Rochdale
Salford
StockporTameside
Trafford
Wigan BarnsleyDoncaste
RotherhaSheffiel
Bradford
Calderda
KirkleesLeedsWakefiel
Gateshea
NewcastlNorth Ty
South Ty
Sunderla Bath and
Bristol,
North So
South Gl
Middlesb
Redcar a
Stockton
City of
East RidNorth Ea
North Li
North Yo
York
Bedfords
LutonBuckingh
Milton KDerbyshi
Derby
Dorset
Poole
Bournemo
Durham
Darlingt
East Sus
Brighton
Hampshir
PortsmouSouthamp
Leiceste
Leiceste
StaffordStoke-onWiltshir
Swindon
Bracknel
Windsor
West Ber
ReadingSlough
Wokingha
CambridgCity of Cheshire
Halton
Warringt
DevonPlymouthTorbay Essex
SouthendThurrock
Hereford
WorcesteKentMedway
Lancashi
Blackbur
Blackpoo
NottinghCity of
Shropshi
Telford
Cornwall
Cumbria
GloucestHertford
Lincolns Norfolk
Northamp
Northumb
Oxfordsh
Somerset
Suffolk
SurreyWarwicks
West Sus
Isol
atio
n in
dex,
Asi
an
Dissimilarity Index, Asian.2 .4 .6 .8
0
.2
.4
Camden
GreenwicHackneyHammersm
Islingto
LambethLewisham
Southwar
Tower Ha
Wandswor
Westmins
Barking
Barnet
Bexley
Brent
Bromley
Croydon
Ealing
Enfield
Haringey
Harrow
Havering
Hillingd
Hounslow
Kingston
Merton
NewhamRedbridg
Richmond
Sutton
Waltham
Birmingh
Coventry
Dudley
Sandwell
Solihull
Walsall
Wolverha
Knowsley
Liverpoo
St Helen
Sefton Wirral
Bolton
Bury
Manchest
Oldham
Rochdale
Salford
Stockpor
Tameside
Trafford
WiganBarnsley
Doncaste
Rotherha
Sheffiel
Bradford
Calderda
Kirklees
LeedsWakefiel
Gateshea
Newcastl
North Ty
South Ty
Sunderla
Bath and
Bristol,
North So
South Gl MiddlesbRedcar aStockton
City of
East RidNorth Ea
North Li
North YoYork
Bedfords
Luton
Buckingh
Milton K Derbyshi
Derby
DorsetPooleBournemo Durham
Darlingt
East SusBrightonHampshir
PortsmouSouthamp
Leiceste
Leiceste
Stafford
Stoke-on
Wiltshir
Swindon
Bracknel
Windsor
West Ber
Reading
Slough
Wokingha
Cambridg
City of
Cheshire
Halton
Warringt Devon
PlymouthTorbay
EssexSouthend
Thurrock
Hereford
Worceste
Kent
Medway
Lancashi
Blackbur
Blackpoo
Nottingh
City of
ShropshiTelford
Cornwall
Cumbria
Gloucest
Hertford
LincolnsNorfolk
Northamp
Northumb
Oxfordsh
Somerset
Suffolk
Surrey Warwicks
West Sus
20
Figure 3: Dissimilarity Index and Isolation Index, continued
Isol
atio
n in
dex,
Indi
an
Dissimilarity Index, Indian.2 .4 .6 .8 1
0
.1
.2
.3
.4
Camden
GreenwicHackney
HammersmIslingto
Lambeth
LewishamSouthwarTower Ha
WandsworWestmins
Barking
Barnet
Bexley
Brent
Bromley
Croydon
Ealing
Enfield
Haringey
Harrow
Havering
Hillingd
Hounslow
Kingston
Merton
Newham
Redbridg
Richmond
Sutton
Waltham
Birmingh
Coventry
Dudley
Sandwell
SolihullWalsall
Wolverha
Knowsley
Liverpoo
St Helen
SeftonWirral
Bolton
Bury
Manchest
Oldham
Rochdale
Salford
StockporTameside
Trafford
Wigan
Barnsley
Doncaste
RotherhaSheffielBradford
Calderda
Kirklees
Leeds
Wakefiel
GatesheaNewcastlNorth Ty South Ty
Sunderla
Bath and
Bristol,North So
South Gl
Middlesb
Redcar a
Stockton
City of
East Rid
North Ea
North Li
North Yo
York
Bedfords
Luton
Buckingh
Milton KDerbyshi
Derby
Dorset
Poole Bournemo
DurhamDarlingt
East SusBrightonHampshir
Portsmou
Southamp
Leiceste
Leiceste
Stafford
Stoke-on
WiltshirSwindon
BracknelWindsor
West Ber
Reading
Slough
Wokingha
CambridgCity of Cheshire
Halton
Warringt
DevonPlymouth
Torbay
Essex
SouthendThurrock
Hereford
Worceste
Kent
Medway
Lancashi
Blackbur
Blackpoo
Nottingh
City of
Shropshi
Telford
Cornwall
CumbriaGloucest
Hertford
LincolnsNorfolk
Northamp
Northumb
OxfordshSomerset
Suffolk
Surrey
Warwicks West Sus
Isol
atio
n in
dex,
Pak
ista
ni
Dissimilarity Index, Pakistani.2 .4 .6 .8 1
0
.5
1
Camden
GreenwicHackney
Hammersm
Islingto
Lambeth
LewishamSouthwar
Tower HaWandswor
Westmins
Barking
BarnetBexleyBrent Bromley CroydonEalingEnfield HaringeyHarrow HaveringHillingd
HounslowKingstonMerton
NewhamRedbridgRichmondSutton
Waltham
Birmingh
CoventryDudleySandwell
Solihull
Walsall
Wolverha
Knowsley
LiverpooSt Helen Sefton
WirralBoltonBury
Manchest
Oldham
Rochdale
SalfordStockpor
TamesideTrafford
WiganBarnsleyDoncaste
Rotherha
Sheffiel
BradfordCalderda
Kirklees
Leeds
Wakefiel
Gateshea
Newcastl
North Ty
South Ty
Sunderla
Bath and
Bristol,
North SoSouth Gl
Middlesb
Redcar a
StocktonCity of East Rid
North Ea
North Li
North Yo
York
Bedfords
Luton
Buckingh
Milton KDerbyshi
Derby
DorsetPoole
Bournemo DurhamDarlingtEast Sus
BrightonHampshir
Portsmou
SouthampLeiceste
Leiceste
Stafford
Stoke-onWiltshir
Swindon
BracknelWindsor
West Ber
Reading
Slough
Wokingha
Cambridg
City of
Cheshire
Halton
Warringt Devon
Plymouth
Torbay
EssexSouthend
Thurrock
Hereford
WorcesteKentMedway
Lancashi
Blackbur
Blackpoo
Nottingh
City of Shropshi
Telford
Cornwall
CumbriaGloucest
Hertford
Lincolns NorfolkNorthamp
Northumb
Oxfordsh
Somerset
Suffolk
Surrey
Warwicks
West Sus
21
Looking first at the graph for black students, there are no areas that have extreme segregation indices in both dimensions. Of the two LEAs that come closest, North Lincolnshire and Darlington, both have less than 1% of black students. The situation is rather different for students of Asian ethnic origin. Here there are five LEAs with extreme segregation indices in both dimensions: Oldham, Blackburn, Bradford, Birmingham and Luton. Furthermore, these are all areas with significant representations of these students:
LEA % Asian students
Bradford 29.0
Luton 27.9
Birmingham 26.8
Blackburn with Darwen 23.8
Oldham 15.5
It is interesting to note that some of these areas suffered severe rioting by Asian and white youths in the summer of 2001: Bradford, Oldham and Burnley.9 The Community Cohesion Review Team, chaired by Ted Cantle (Cantle 2001) which published a report on these disturbances for the Home Office identified segregation in education as one contributory factor to the lack of community cohesion which in turn led to disorder:
“…The extent to which these physical divisions were compounded by so many other aspects of our daily lives, was very evident. Separate educational arrangements, community and voluntary bodies, employment, places of worship, language, social and cultural networks, means that many communities operate on the basis of a series of parallel lives” (paragraph 2.1, emphasis added).
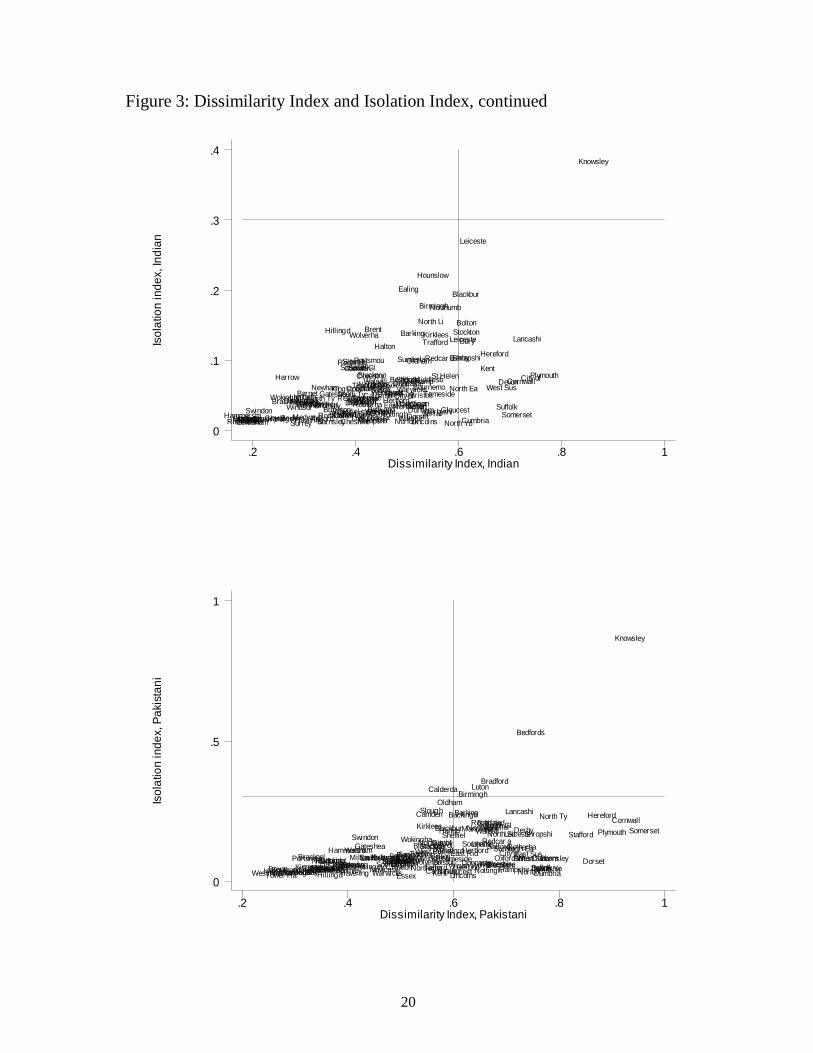
This evidence is suggestive, no more, of an association between educational segregation and social unrest. It is not clear from these data alone whether school segregation is picking up housing segregation and it is this that engenders severe discontent, or whether school segregation itself may play a role. Panels c and d of Figure 3 repeat the exercise for Indian and Pakistani students separately. There are more areas of extreme segregation for the latter group, and
9 The last of these towns is actually in the Lancashire LEA, but is geographically
sandwiched between Blackburn and Rochdale; both Lancashire and Rochdale are close to the top right quadrant of Figure 3b.
22
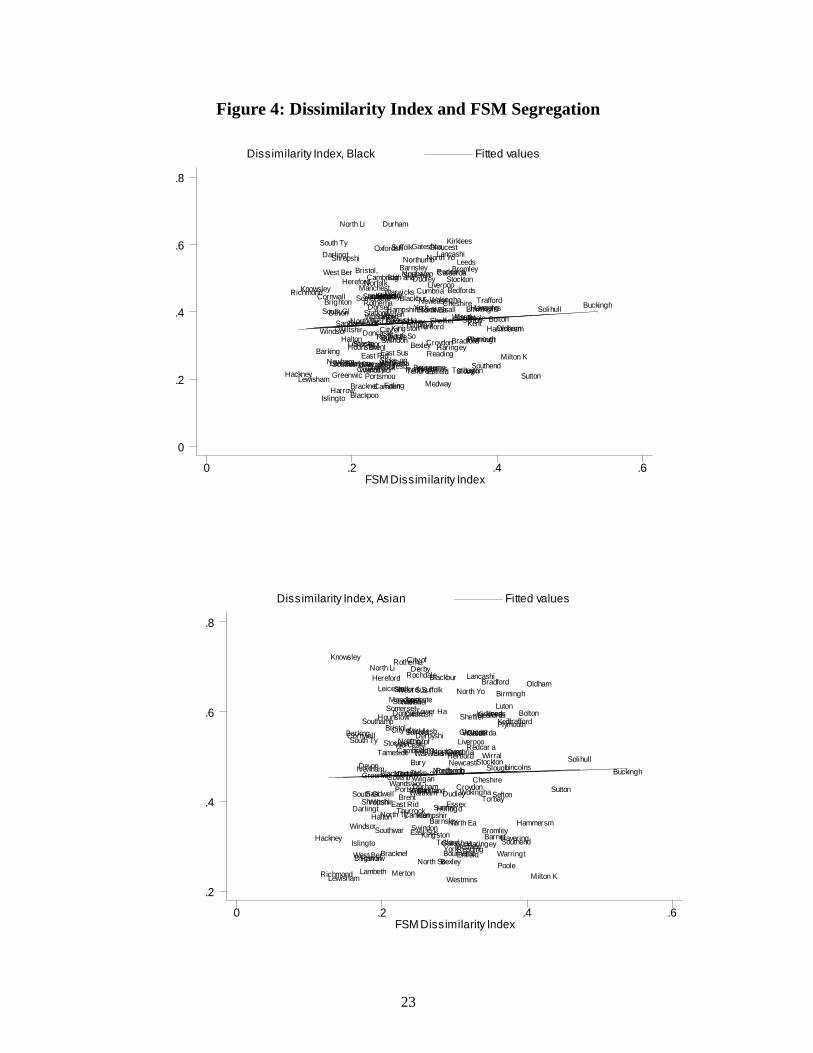
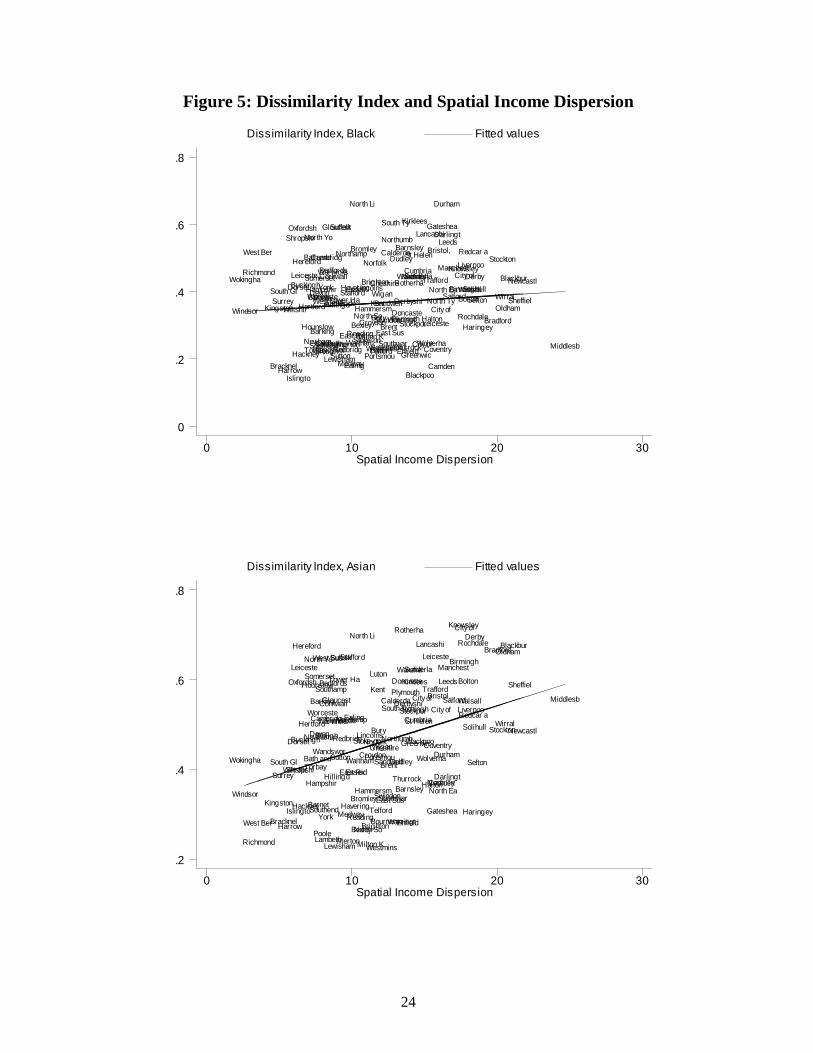
the areas of Bradford, Luton, Birmingham and Oldham are again prominent. Bedfordshire and Knowsley are also in the top quadrant, but have negligible numbers of Pakistani students (1% and 0.01%). In the graph for students of Indian ethnic origin, Leicester with 32% of such students also has very high segregation. Ethnic Segregation and Income segregation Given the correlation between ethnicity and poverty,10 it is important to see whether ethnic segregation simply reflects income segregation across space. We have two measures of the latter. First, we use a school average level measure of deprivation, and compute the D index measure using that as above for each LEA. This is based on whether a child is eligible for free school meals (FSM), a means-tested benefit widely used to investigate income segregation in schools (see Noden 2000). Figure 4 graphs the D index for FSM against the D index for ethnicity for the two aggregated groups. It is clear that there is essentially no relationship between the two indices for either ethnic group. In other words: there is both high and low ethnic segregation in both high and low FSM segregation areas. The second measure of spatial income distribution is based on the LEA variability of the ward-level index of multiple deprivation. This is plotted against the D index for ethnicity for the two ethnic groups in Figure 5. There is again little relationship between the two for black students. However, for the Asian group we do find a significant positive relationship. Ethnic segregation of Asian students is higher in LEAs with greater spatial income dispersion. The generally weak relationship between ethnic and income segregation mirrors the results of Peach (1996), who estimates the importance of economic factors in residential segregation in Greater London and concludes that all ethnic groups would manifest much lower segregation levels if it were solely economic factors that controlled their residential distribution. He estimates, for example, that only 8% of the observed level of black Caribbean segregation is ‘explained’ by socio-economic factors. Dorsett (1998) further highlights the differences between minority ethnic groups in relation to their individual and household socio-economic characteristics and the resulting differences in their patterns of settlement across differentially deprived neighbourhoods.
10
For some groups, but not all – recall footnote 2 shows that Pakistanis, Bangladeshis and Black Africans suffer higher rates of poverty, but black Caribbeans, Indians and Chinese do not.
23
Figure 4: Dissimilarity Index and FSM Segregation
FSM Dissimilarity Index
Dissimilarity Index, Black Fitted values
0 .2 .4 .6
0
.2
.4
.6
.8
Camden
GreenwicHackney
Hammersm
Islingto
Lambeth
Lewisham
Southwar
Tower Ha
Wandswor Westmins
Barking
Barnet
BexleyBrent
Bromley
Croydon
Ealing
Enfield
Haringey
Harrow
Havering
Hillingd
Hounslow
Kingston
MertonNewhamRedbridg
Richmond
Sutton
Waltham
Birmingh
Coventry
Dudley
Sandwell
SolihullWalsall
Wolverha
Knowsley LiverpooSt Helen
SeftonWirral Bolton
Bury
Manchest
OldhamRochdale
Salford
Stockpor
Tameside
Trafford
Wigan
Barnsley
Doncaste
Rotherha
Sheffiel
Bradford
Calderda
Kirklees
Leeds
Wakefiel
Gateshea
Newcastl
North Ty
South Ty
Sunderla
Bath andBristol,
North So
South Gl
Middlesb
Redcar aStockton
City of
East Rid
North Ea
North Li
North Yo
York
Bedfords
Luton
Buckingh
Milton K
Derbyshi
DerbyDorset
Poole
Bournemo
Durham
Darlingt
East Sus
BrightonHampshir
Portsmou
Southamp
Leiceste
Leiceste
Stafford
Stoke-on
WiltshirSwindon
Bracknel
Windsor
West Ber
Reading
Slough
Wokingha
Cambridg
City of
Cheshire
Halton Warringt
Devon
Plymouth
Torbay
Essex
SouthendThurrock
Hereford
WorcesteKent
Medway
Lancashi
Blackbur
Blackpoo
Nottingh
City of
Shropshi
Telford
CornwallCumbria
Gloucest
Hertford
Lincolns
NorfolkNorthamp
Northumb
Oxfordsh
Somerset
Suffolk
Surrey
Warwicks
West Sus
FSM Dissimilarity Index
Dissimilarity Index, Asian Fitted values
0 .2 .4 .6
.2
.4
.6
.8
Camden
Greenwic
Hackney
Hammersm
Islingto
LambethLewisham
Southwar
Tower Ha
Wandswor
Westmins
Barking
Barnet
Bexley
Brent
Bromley
Croydon
Ealing
EnfieldHaringey
Harrow
Havering
Hillingd
Hounslow
Kingston
Merton
Newham Redbridg
Richmond
SuttonWaltham
Birmingh
Coventry
DudleySandwell
Solihull
Walsall
Wolverha
Knowsley
Liverpoo
St Helen
Sefton
Wirral
Bolton
Bury
Manchest
OldhamRochdale
SalfordStockpor
Tameside
Trafford
Wigan
Barnsley
Doncaste
Rotherha
Sheffiel
Bradford
Calderda
KirkleesLeeds
Wakefiel
Gateshea
Newcastl
North Ty
South Ty
Sunderla
Bath and
Bristol,
North So
South Gl
Middlesb
Redcar a
Stockton
City of
East Rid
North Ea
North Li
North Yo
York
BedfordsLuton
Buckingh
Milton K
Derbyshi
Derby
Dorset
Poole
Bournemo
Durham
Darlingt
East Sus
Brighton
Hampshir
Portsmou
Southamp
LeicesteLeicesteStafford
Stoke-on
Wiltshir
Swindon
Bracknel
Windsor
West BerReading
Slough
Wokingha
CambridgCity of
Cheshire
Halton
Warringt
Devon
Plymouth
TorbayEssex
Southend
Thurrock
Hereford
Worceste
Kent
Medway
LancashiBlackbur
Blackpoo
NottinghCity of
Shropshi
Telford
Cornwall
Cumbria
Gloucest
Hertford
LincolnsNorfolk
Northamp
Northumb
OxfordshSomerset
Suffolk
Surrey
Warwicks
West Sus
24
Figure 5: Dissimilarity Index and Spatial Income Dispersion
Spatial Income Dispersion
Dissimilarity Index, Black Fitted values
0 10 20 30
0
.2
.4
.6
.8
Camden
GreenwicHackney
Hammersm
Islingto
Lambeth
Lewisham
Southwar
Tower Ha
Wandswor Westmins
Barking
Barnet
Bexley Brent
Bromley
Croydon
Ealing
Enfield
Haringey
Harrow
Havering
Hillingd
Hounslow
Kingston
MertonNewhamRedbridg
Richmond
Sutton
Waltham
Birmingh
Coventry
Dudley
Sandwell
SolihullWalsall
Wolverha
KnowsleyLiverpooSt Helen
Sefton WirralBolton
Bury
Manchest
OldhamRochdale
Salford
Stockpor
Tameside
Trafford
Wigan
Barnsley
Doncaste
Rotherha
Sheffiel
Bradford
Calderda
Kirklees
Leeds
Wakefiel
Gateshea
Newcastl
North Ty
South Ty
Sunderla
Bath andBristol,
North So
South Gl
Middlesb
Redcar aStockton
City of
East Rid
North Ea
North Li
North Yo
York
Bedfords
Luton
Buckingh
Milton K
Derbyshi
DerbyDorset
Poole
Bournemo
Durham
Darlingt
East Sus
BrightonHampshir
Portsmou
Southamp
Leiceste
Leiceste
Stafford
Stoke-on
WiltshirSwindon
Bracknel
Windsor
West Ber
Reading
Slough
Wokingha
Cambridg
City of
Cheshire
HaltonWarringt
Devon
Plymouth
Torbay
Essex
Southend Thurrock
Hereford
WorcesteKent
Medway
Lancashi
Blackbur
Blackpoo
Nottingh
City of
Shropshi
Telford
CornwallCumbria
Gloucest
Hertford
Lincolns
NorfolkNorthamp
Northumb
Oxfordsh
Somerset
Suffolk
Surrey
Warwicks
West Sus
Spatial Income Dispersion
Dissimilarity Index, Asian Fitted values
0 10 20 30
.2
.4
.6
.8
Camden
Greenwic
Hackney
Hammersm
Islingto
LambethLewisham
Southwar
Tower Ha
Wandswor
Westmins
Barking
Barnet
Bexley
Brent
Bromley
Croydon
Ealing
EnfieldHaringey
Harrow
Havering
Hillingd
Hounslow
Kingston
Merton
NewhamRedbridg
Richmond
SuttonWaltham
Birmingh
Coventry
DudleySandwell
Solihull
Walsall
Wolverha
Knowsley
Liverpoo
St Helen
Sefton
Wirral
Bolton
Bury
Manchest
OldhamRochdale
SalfordStockpor
Tameside
Trafford
Wigan
Barnsley
Doncaste
Rotherha
Sheffiel
Bradford
Calderda
Kirklees Leeds
Wakefiel
Gateshea
Newcastl
North Ty
South Ty
Sunderla
Bath and
Bristol,
North So
South Gl
Middlesb
Redcar a
Stockton
City of
East Rid
North Ea
North Li
North Yo
York
BedfordsLuton
Buckingh
Milton K
Derbyshi
Derby
Dorset
Poole
Bournemo
Durham
Darlingt
East Sus
Brighton
Hampshir
Portsmou
Southamp
LeicesteLeicesteStafford
Stoke-on
Wiltshir
Swindon
Bracknel
Windsor
West BerReading
Slough
Wokingha
CambridgCity of
Cheshire
Halton
Warringt
Devon
Plymouth
TorbayEssex
Southend
Thurrock
Hereford
Worceste
Kent
Medway
Lancashi Blackbur
Blackpoo
NottinghCity of
Shropshi
Telford
Cornwall
Cumbria
Gloucest
Hertford
LincolnsNorfolk
Northamp
Northumb
OxfordshSomerset
Suffolk
Surrey
Warwicks
West Sus
25
6. Conclusion
In this paper we focus on one dimension of the debate regarding social integration between ethnic groups and document the extent of ethnic segregation in English secondary schools in 2001. We employ the two most widely used indices of segregation – the index of dissimilarity and the isolation index – and compare patterns of school segregation across nine ethnic groups. Our main findings are that levels of ethnic segregation in England’s schools are high. There is, however, a significant degree of variation both across LEAs and across ethnic groups: segregation is higher for pupils of Indian, Pakistani or Bangladeshi origin than for pupils with black Caribbean or African heritage. Segregation for the former groups is positively related to their proportion in the local population, while the same is not true for the Black aggregate group. When we combine the two indices we identify areas of particularly high segregation, especially for pupils of Asian origin. These areas coincide almost exactly with the locations of urban unrest in the summer of 2001. Finally, we show that ethnic segregation is only weakly related to income segregation. Residential segregation is undoubtedly a multi-faceted issue (Blalock 1967). As Massey and Denton (1998) state: ethnic segregation arises from a “complex interplay of many different social and economic processes”; it does not simply follow income or class contours. Both choices and constraints may be important in determining residential location (Dorsett 1998). School segregation can be viewed as adding a further layer onto an already complex picture. The relevant factors determining the level of school segregation include geographical location, social class and the history of particular schools. In the UK we can add to this list the impact the education quasi-market and the emphasis on parental choice has had on the degree of ethnic segregation (Tomlinson 2001). This suggests several avenues for further research in this field, and there are in particular three questions we intend to follow up. First, do schools act to intensify or ameliorate residential segregation, and if this varies, with what factors? We will exploit the recently released Census 2001 alongside our current data to compare residential and educational segregation across England. Second, what is the role of markets and competition between schools in this process? Since the Education Reform Act of 1988, which introduced overlapping catchment areas, school league tables and devolved budgets, the education system has been more responsive to parents’ choices. The degree to which competition is feasible varies over the country, and we intend to use this to get at the role of markets in segregation. Third, what is the impact of different levels of segregation on the educational attainment of

26
minority ethnic pupils? We can now address this question using the recently released Pupil Level Annual Schools Census (PLASC), which matches information on ethnicity with exam results for every pupil at each Key Stage of compulsory education. Exploring these links further and investigating their impact is a worthy subject of ongoing research.
27
References
Bean, F D and Tienda, M (1987), The Hispanic population of the United States. New York: Russell Sage Foundation
Blalock, H M (1967), Toward a theory of minority-group relations. London: John Wiley & Sons
Borjas, G J (1997), To ghetto or not to ghetto: Ethnicity and residential segregation, NBER Working Paper 6176. Cambridge MA: NBER
Cantle, T (2001), Community cohesion: A report of the independent review team, (http://www.homeoffice.gov.uk/docs/community_cohesion.pdf) (accessed 20 June 2003). London: Home Office
Case, A C and Katz, L F (1991), The company you keep: The effects of family and neighbourhood on disadvantaged youths, NBER Working Paper 3705, Cambridge MA: NBER
Clotfelter, C T (1998), Public school segregation in metropolitan areas, NBER Working Paper 6779, Cambridge MA: NBER
Crane, J (1991), ‘The epidemic theory of ghettos and neighbourhood effects on dropping out and teenage childbearing’, American Journal of Sociology 96: 1226-1259
Cutler, D M and Glaeser, E L (1997), ‘Are ghettos good or bad?’, Quarterly Journal of Economics 112: 827-872
Cutler, D M, Glaeser, E L and Vidgor, J L (1999), ‘The rise and decline of the American ghetto’, Journal of Political Economy 107(3): 455-506
Dorsett, R (1998), Ethnic minorities in the inner city. Bristol: Policy Press
Duncan, O D and Duncan, B (1955), ‘A methodological analysis of segregation indexes’, American Sociological Review 20: 210-217
Goldstein, H and Noden, P (2003), ‘Modelling social segregation’, Oxford Review of Education 29(2): 225-237
Gorard, S and Fitz, J (1998a), ‘The more things change … the missing impact of marketisation?’, British Journal of Sociology of Education 19: 365-376
Gorard, S and Fitz, J (1998b), ‘Under starters orders: the established market, the Cardiff study and the Smithfield project’, International Studies in Sociology of Education 8: 299-314
Massey, D S and Denton, N A (1988), ‘The dimensions of residential segregation’, Social Forces 67: 281-315
28
Massey, D S and Denton, N A (1989), ‘Hypersegregation in United States metropolitan areas – Black and Hispanic segregation across five dimensions’, Demography 26: 373-391
Massey, D S and Denton, N A (1993), American Apartheid: Segregation and the making of the Underclass. Cambridge MA: Harvard University Press
McKinney, S and Schnare, A B (1989), ‘Trends in residential segregation by race: 1960-1980’, Journal of Urban Economics 26: 269-280
Noden, P (2000), ‘Rediscovering the impact of marketisation: dimensions of social segregation in England’s secondary schools, 1994-99’, British Journal of Sociology of Education 21(3): 371-390
Orfield, C, Bachmeier, M, James, D and Eitle, T (1997), Deepening segregation in American public schools, Harvard Project on School Segregation, Cambridge MA
Peach, C (1996), ‘Does Britain have ghettos?’, Transactions of the Institute of British Geographers, New Series 21(1): 216-235
Reardon, S F, Yun, J T and McNulty Eitle, T (2000), ‘The changing structure of school segregation: measurement and evidence of multiracial metropolitan-area school segregation, 1989-1995’, Demography 37(3): 351-364
Rivkin, S (1994), ‘Residential segregation and school integration’, Sociology of Education 67: 279-292
Tomlinson, S (2001), ‘Some success, could do better: education and race 1976-2000’ in Phillips R and Furlong J (eds), Education, reform and the state: twenty-five years of politics, policy and practice. London: Routledge