School choice and school ethnic segregation: a case …ggrjj/current-papers/...School choice and...
27
School choice and school ethnic segregation: a case study of Birmingham NOT TO BE CITED WITHOUT THE AUTHOR’S PERMISSION Ethnic segregation in England’s urban neighbourhoods and schools is a topic of considerable contemporary public interest. 1 Members of the country’s main ethnic minority groups, especially those with Indian, Pakistani and Bangladeshi backgrounds, are significantly clustered into residential enclaves which they dominate – although though not to the same extent as is the situation for some ethnic groups, especially blacks, in the United States (Johnston et al, 2002a, 2002b). They are also concentrated into certain schools (Burgess and Wilson, 2005; Burgess et al, 2005; Johnston et al, 2004, 2005), and this ethnic clustering in schools is greater than the residential clustering in the same area (Johnston et al, 2007). The reasons for greater ethnic segregation in schools than in neighbourhoods have not been explored in detail, although there has been considerable speculation in the media and by a range of commentators. Drawing on the American experience post Brown v Board of Education, when court-mandated desegregation involved bussing in many school districts, much of that speculation has focused on what is known as ‘white flight’. White families avoided the desegregation policies in the US by adopting one of three available ‘re-segregation’ strategies: moving to school districts where desegregation is not required, usually because of their predominantly white ethnic composition; sending their children to ‘faith schools’ outside the state education system (because of the constitutional separation of church and state); and sending their children to other types of private school. As a consequence, although desegregation has been found to be effective in terms of improved educational performance by blacks its impact has been relatively slight because of these re- segregation processes constraining their chances of going to mixed-race schools (see Thermstrom, 2002; Frankenberg et al, 2003: Lee, 2004; Orfield and Lee, 2004). The first of these strategies is also available in England. Families can move to Local Education Authorities (LEAs) with relatively small numbers of non-white students, for example, so that their children need not attend mixed-race schools. They can also opt to send their children to independent (public) schools, almost all of which have very few students from non-white ethnic backgrounds. As for the second option, the English state system allows parents to exercise choice between schools by selecting which schools they would prefer their children to be allocated to, although the final decision rests with the LEA. By exercising such choice, many parents may be able to select schools with an ‘acceptable’ ethnic balance – and in so doing may send their children to schools othe r than those closest to their homes. One element of such a strategy involves applying for children to attend schools with religious affiliations that 1 See, for example, an article in the Observer for 27.4.2007 on ‘UK schools dividing on race lines’: http://education.guardian.co.uk/raceinschools/story/0,,2090209,00.html .
Transcript of School choice and school ethnic segregation: a case …ggrjj/current-papers/...School choice and...

School choice and school ethnic segregation: a case study of Birmingham
NOT TO BE CITED WITHOUT THE AUTHOR’S PERMISSION
Ethnic segregation in England’s urban neighbourhoods and schools is a topic of considerable contemporary public interest.1 Members of the country’s main ethnic minority groups, especially those with Indian, Pakistani and Bangladeshi backgrounds, are significantly clustered into residential enclaves which they dominate – although though not to the same extent as is the situation for some ethnic groups, especially blacks, in the United States (Johnston et al, 2002a, 2002b). They are also concentrated into certain schools (Burgess and Wilson, 2005; Burgess et al, 2005; Johnston et al, 2004, 2005), and this ethnic clustering in schools is greater than the residential clustering in the same area (Johnston et al, 2007). The reasons for greater ethnic segregation in schools than in neighbourhoods have not been explored in detail, although there has been considerable speculation in the media and by a range of commentators. Drawing on the American experience post Brown v Board of Education, when court-mandated desegregation involved bussing in many school districts, much of that speculation has focused on what is known as ‘white flight’. White families avoided the desegregation policies in the US by adopting one of three available ‘re-segregation’ strategies: moving to school districts where desegregation is not required, usually because of their predominantly white ethnic composition; sending their children to ‘faith schools’ outside the state education system (because of the constitutional separation of church and state); and sending their children to other types of private school. As a consequence, although desegregation has been found to be effective in terms of improved educational performance by blacks its impact has been relatively slight because of these re-segregation processes constraining their chances of going to mixed-race schools (see Thermstrom, 2002; Frankenberg et al, 2003: Lee, 2004; Orfield and Lee, 2004). The first of these strategies is also available in England. Families can move to Local Education Authorities (LEAs) with relatively small numbers of non-white students, for example, so that their children need not attend mixed-race schools. They can also opt to send their children to independent (public) schools, almost all of which have very few students from non-white ethnic backgrounds. As for the second option, the English state system allows parents to exercise choice between schools by selecting which schools they would prefer their children to be allocated to, although the final decision rests with the LEA. By exercising such choice, many parents may be able to select schools with an ‘acceptable’ ethnic balance – and in so doing may send their children to schools other than those closest to their homes. One element of such a strategy involves applying for children to attend schools with religious affiliations that 1 See, for example, an article in the Observer for 27.4.2007 on ‘UK schools dividing on race lines’: http://education.guardian.co.uk/raceinschools/story/0,,2090209,00.html .
2
operate within the state system and offer ‘faith-based’ contexts within which the national curriculum is taught, By opting for such schools, parents may be able to influence the ethnic composition of the schools their children attend because of ethnic variations in religious affiliations. Such parental decision-making is not restricted to members of the majority white population, of course. Members of other ethnic groups may adopt any of the strategies outlined here. Within the state system, for example, they may avoid certain types of ‘faith school’ and prefer others, and/or they may nominate schools for their children to attend based on their ethnic composition. Ethnic segregation in schools may reflect sorting processes involving the active decision-making of members of all groups. Little of the substantial literature on school choice in England deals with the issue of the ethnic composition of the student body. For example, recent studies using the data set employed in this paper have shown that most English students have considerable choice of secondary schools within a relatively short distance from their home. On average, for example, all secondary school students have 6.7 schools within ten minutes drive of their home – although this figure ranges from 17.2 in London, through 6.7 in other urban areas to only 1.4 in rural areas (Burgess et al, 2004). Perhaps not surprisingly, therefore, most secondary students in urban areas do not attend their nearest school: only 24 per cent in London, and 43 per cent in other urban areas; the figure for rural areas is 57 per cent. The overall average is 45 per cent, although it is only 30 per cent for the small number of Local Education Authorities (LEAs) which retain selective secondary schools. To what extent is this choice of schools other than nearest to the student’s home a function of choice processes within which the school’s ethnic composition is a major factor? On average, according to these studies, secondary students in England travel 2.8 kilometres to school (Burgess et al, 2006), although mean distances travelled are lower in urban areas (1.7 km in London; 1.5 km in other urban areas) than rural (2.4 km).2 Students also travel further if they attend schools with religious affiliations (1.5 km for those attending schools without denominational affiliations, compared to 2.6 km and 2.7 km for those attending Church of England and Roman Catholic schools respectively). And there are differences among the various ethnic groups: the average distance travelled by whites was 1.7 km, for Black Africans and Black Caribbeans it was 2.1 and 2.0 respectively, whereas for Ind ians, Pakistanis and Bangladeshis it was 1.5, 1.5 and 1.0. These differences are negatively correlated with the number of available opportunities. Nationally, for example, whereas 32 per cent of whites have 3 secondary schools available within 2 km of their homes, the percentages for the three south Asian groups are 62, 67 and 80 respectively. Such differences reflect the much greater concentration of non-whites in urban areas; students living there are significantly less likely than others to attend their nearest school and, holding this difference constant, only Bangladeshis are more likely to attend their nearest secondary school than are whites. Although there has long been an element of parental choice in the allocation of students to schools, until relatively recently most English LEAs used systems in 2 Inn Birmingham, the city studied here, the average distance travelled to primary school is 0.88km and for secondary school it is 2.28km (2.02km for those attending comprehensive schools and 5.21km for those attending selective – grammar – schools). The average distance to the nearest primary school is 0.34km and for the nearest non-selective secondary school 0.77km.
3
which allocating students to the nearest schools to their homes dominated. The 1988 Education Reform Act gave much greater power to parents in the selection of schools for their students, however, and the rhetoric of choice has since become increasingly loud in government policies for education (West et al, 1998). As a consequence of these changes, the processes and consequences of parental choice – sometimes termed ‘marketisation’ – have become major research subjects (as indicated in Dale’s, 1997, major review article). Much of the research set in the context of this expansion of markets within the English educational system has focused on class issues (e.g. Ball, 1993; Reay and Ball, 1997), in particular with regard to the choice of secondary school. In addition, most of these – in the absence of large data sets allowing otherwise – have involved qualitative case studies only, providing important insights into how both parents and children make their choices – especially in the transfer from primary to secondary school – but unable to complement these with wider (quantitative) studies of the extent of choice and its impact on the composition of individual schools. (For examples of such studies see, for example, Ball and Vincent, 1998, and Reay and Ball, 1998, on the sources of information used in parental choice, and a series of papers by Reay and Lucey – 200a, 200b, 2003 – on students’ roles in decision-making on the transition from primary to secondary schools.) One group of large-scale quantitative studies has argued that the introduction of greater parental choice resulted in an initial fall in inter-school segregation according to family poverty – indexed by the number of students qualifying for free school meals – although these findings have been questioned on technical grounds (Taylor, 2001; Taylor, Gorard and Fitz, 2001; Forard, Taylor and Fitz, 2001; Goldstein and Noden, 2003). Although some studies make reference to ethnic issues involved in school choice (e.g. Reay and Lucey, 2000a; Lucey and Reay, 2002), very few give them prominence even though, as Bagley (1996, 570) expresses it, ‘’increased rights to express a preference and obtain the school of their choice could – if informed by ‘race’ – have significant implications for the ethnic composition of schools’. Bagley’s study of three schools found that the ethnic composition of the only one which had a multi-ethnic student population was an influence on whether white parents chose to send their children there, although the percentage of parents citing it as an issue was only 13 (compared to 2 and 3.5 per cent respectively for the other two schools studied, which were predominantly white: of those parents who rejected a school, one-third referred to ethnic composition with regard to the multi-ethnic school, compared to zero for either of the other two – Bagley et al, 2001). However, interviews with a small number of parents found that race was a much more important factor, suggesting that ‘white parental beliefs, attitudes and choice [are] informed by ‘race’’ and that ‘white flight – if it is to occur – is more likely to be flight away from schools with ethnic minority pupils than flight to predominantly white schools’ (p. 579). As already noted, almost all studies of school choice undertaken in England have considered only a small number of schools, with little complementary quantitative data to indicate the extent to which parental choice produces school attendance patterns involving many cross-cutting journeys as a result of students being allocated to other than their nearest schools (on which see Harland and Stillwell, 2007b). One exception to this is a paper which showed considerable numbers of students attending comprehensive secondary schools other than the nearest to their home (Parsons et al,
4
2000). Because the case study city had only a small ethnic minority population, however, this issue was outwith their remit. The other major exception is Allen’s national study of secondary schools, which found that 48 per cent of students were attending their ‘proximity allocation’ school, and 12 per cent were at a non-proximity voluntary aided school.3 For some 22 per cent (the figure was higher in London – 34 per cent – and other urban areas), however, no clear reason for not attending their proximity allocation school was identifiable: a number of reasons was suggested, but these did not include the school’s ethnic composition. School choice in Birmingham To address the issue of the role of school choice in sustaining and possibly exacerbating ethnic segregation, in this paper we look at the situation in Birmingham, England’s second largest city with some 102,000 students attending state primary schools there and 65,000 the state secondary schools. Birmingham also has a multi-ethnic population. Of the country’s five main ethnic minority groups only one – Chinese – has few students living there. Of the 102,300 students attending its state primary schools in 2002, the percentages of Black Africans, Black Caribbeans, Indians, Pakistanis and Bangladeshis were 1.1, 5.5, 5.5, 19.0 and 4.1 respectively: the comparable figures for secondary schools were 0.9, 6.7, 7.3, 16.7 and 3.6. Birmingham Local Education Authority (LEA) offers parents a choice of three separate primary schools: where schools are over-subscribed, each individual school’s admissions criteria are used to determine which applicants are offered places.4 Four general criteria apply to all schools, in order of priority: children who are in public care; children with a sibling already at the school and who will still be attending it when the current applicant enrols; those who have made applications on denominational grounds for voluntary-controlled Church of England schools;5 and children who live nearest the school.6 Most schools simply apply these, but individual schools can set their own additional criteria. Most of these are voluntary-aided Roman Catholic (RC) schools which give preference to, for example: baptised Roman Catholic children living within the relevant parish with siblings already at the school; other baptised RCs resident in the parish; other baptised RCs resident outwith the parish but who have siblings there; other baptised RCs resident outwith the parish; children from non-RC faiths who have siblings already at the school; and children from other non-RC faiths. A Muslim school operates similar criteria, as do a Jewish primary school and several of the Church of England voluntary-aided – as against voluntary-controlled – schools.
3 They were termed proximity allocation schools because school size was used to constrain the allocation of students to their nearest school. This has not been taken into account here. 4 The material on school choice in Birmingham’s schools is taken from relevant documents available on the LEA’s website atehttp://www.bgfl.org/services/admissions/finding.htm. On admissions policies more generally, see White et al (2001). 5 Voluntary-controlled schools operate in buildings and on land owned by a voluntary body (in most cases, a church) and are overseen by a governing body; they are funded by the relevant LEA, which employs the staff and determines the admissions criteria. Voluntary-aided schools differ in that part of their funding comes from the voluntary organisation which also employs the staff; its admissions policy is determined by the governing body in consultation with the LEA. Both categories of school have to teach the national curriculum. 6 For three named schools, children living in the defined catchment areas have priority over all other applicants save those in public care.

5
For entry to Birmingham’s secondary schools, up to six preferences can be expressed. For community (i.e. non-selective or comprehensive) schools, each sets its own admissions criteria, which in most cases are, in order of priority: children in public care; children with one or more siblings already, and remaining, at the school; and children who live nearest the school (using straight- line distances).7 In addition, the voluntary-aided and voluntary-controlled, denominational schools set further criteria relevant to their respective faiths: thus, for example, the Muslim school stresses that it ‘will admit children of families practising the Islamic faith in preference to other pupils’. Most Roman Catholic schools give preference to members of their faiths, especially those living in the parish(es) associated with the school, with siblings already there and/or attending designated ‘feeder’ primary schools ;8 Church of England schools offer criteria such as ‘children whose parents are long-standing and regular members of the congregation of any Church of England parish (letter from priest required)’. There are also eight selective (grammar) schools enrty to which is based on performance at three tests in verbal and non-verbal reasoning and mathematics. A recent report by Birmingham City Council (2007) indicates that for students enrolling in September 2005, 98 per cent of primary school students were allocated to one of their parents’ three choices and 95 per cent of secondary school students were similarly allocated to one of the six parental choices. A survey of parents found that 90 per cent of primary school students’ parents were either ‘very satisfied’ or ‘satisfied’ with the school place that they had been offered as were 82 per cent of parents of secondary school students. To a large extent, therefore, a study of which schools students attend is investigating those which their parents selected – albeit not necessarily their first choice – and with which they are satisfied, presumably on the criteria they deployed when making their selections. The data The ethnic composition of English primary and secondary schools in recent years can be analysed using the Pupil Level Annual School Census (PLASC) data set, a key administrative dataset which forms part of the National Pupil Database: it covers all state primary and secondary schools. It records the ethnicity of every student at each school, using the 16-fold classification deployed by the Office of National Statistics for the 2001 Census, but in the data for the years analysed here (entry in 2002 and 2003) we use information on the following categories: White Black Caribbean Black African Black Other Indian Pakistani Bangladeshi Other Asian Chinese Other Each student’s ethnicity is recorded by the school in January of each year, but is open to inspection and alteration by parents. Because there are only small numbers of
7 Some indicate how near one has to live to the school to get accepted: one, for example, informed potential 2006 entrants that there were 1339 applications for some 400 places in 2005: all those with a sibling at the school were admitted, and all of those accepted on the third criterion lived within 2164 meters of the school premises. 8 The LEA’s introductory booklet on secondary school admissions stresses that ‘Catholic schools have been built for Catholic children, who will be given priority over others’.
6
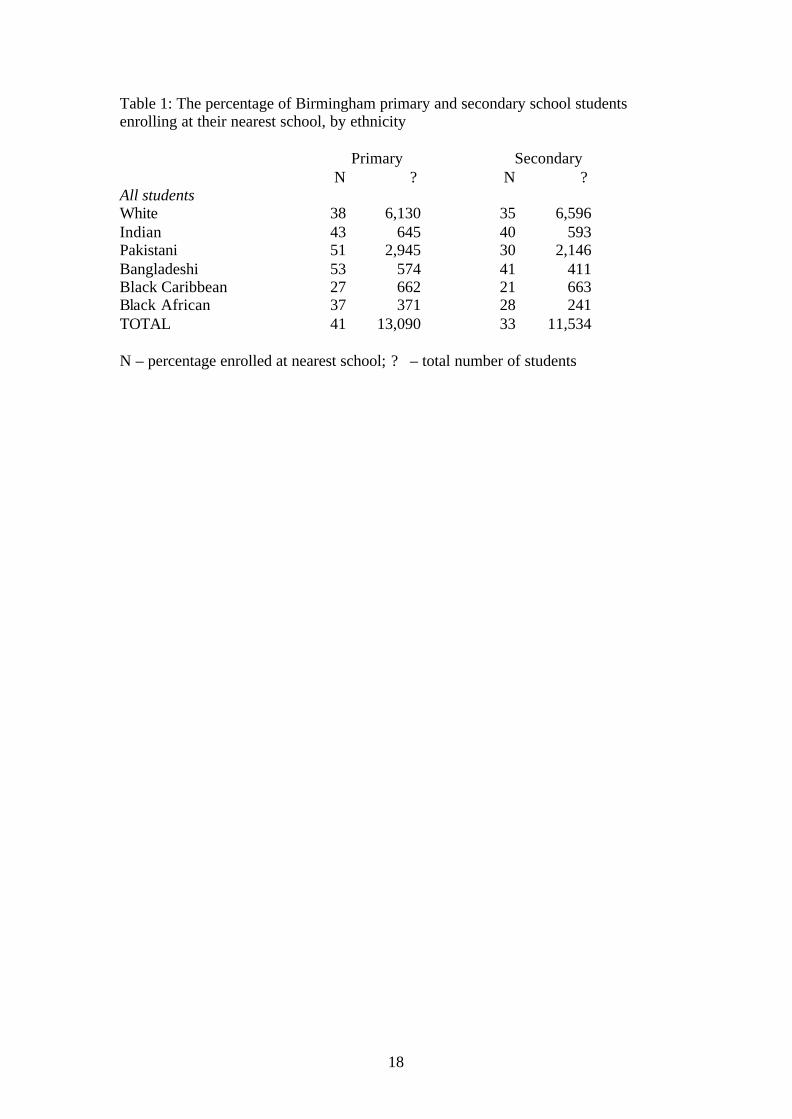
students in Birmingham in the Black Other and Chinese categories (125 and 274 respectively in the primary schools), these are not separately studied here. This data set contains information about each student covering not only her/his ethnicity but also age and sex, plus whether he/she is registered as having special educational needs, qualifies for free school meals, and uses English as the first language. For each school, information is available on its funding, whether it has a denominational link,9 whether it is single-sex or mixed, and whether it is selective or comprehensive. In addition, the data set indicates the school’s location and the student’s postcode. Using the locational information, it is possible – within a Geographical Information System – to identify the nearest school to each student’s home, and thus whether he/she attends that school: a similar task has been undertaken, for England as a whole, but for secondary schools only, in Allen (2007).10 Because some secondary schools are single-sex only (no primary schools are in Birmingham), this has been taken into account so that for each student the nearest school is one for which he/she qualifies. We have excluded from this analysis students who attend the Jewish and Muslim schools,11 a small number of special schools, and also those who attend the selective secondary schools that have been retained in some parts of the city. (These selective schools have also been omitted from the calculation of each student’s nearest school.) Information on whether each student attends the nearest school to her/his home is the basic variable used in this study. In addition, however, by knowing all students’ nearest school we can estimate each school’s characteristics if all students were to attend their nearest establishment. In the case of the several primary schools but only one secondary school, the geographical configuration means that the number living closer to them than any other is very small; these have been omitted from some of the analyses below. Also excluded from some of the analyses are infants’ schools, which take students from ages 5-7 only. The basic question addressed in this paper is whether students attend the school nearest to their home and the extent to which any variation in this is linked to a school’s ethnic composition and denominational affiliation. For this, we have characterised schools according to their ethnic composition in the school year 2001-2002. Our analyses then focus on the cohort entering those schools in the following year (2002-2003), arguing that decisions whether to apply to a particular school will be based on its ethnic composition at the time of application – which in most cases will undoubtedly be based on subjective opinions for which the objective data deployed here act as a proxy. The data cover some 13,000 students entering primary schools and 12,000 entering secondary schools in the selected cohort. There were some differences among the main ethnic groups in the percentages enrolling at their nearest school (Table 1). In general, students of South Asian ethnicity, especially Bangladeshis and Pakistanis, were most likely to enrol at their nearest school, as was
9 Most of the schools with religious affiliations are funded other than through the straight LEA grant scheme: very few without such links have separate funding arrangements. 10 Use of the PLASC data in this context has been evaluated in detail for Leeds in Harland and Stillwell (2007a, 2007b). 11 This is in part for confidentiality reasons.

7
also the case with Bangladeshi secondary school students. Of major interest here, however, is the characteristics of the schools that this entry cohort enrolled at. School denomination, ethnicity and school enrolled at One probable influence on whether a student enrolled at her/his nearest school is its religious affiliation. This can involve one of two separate sorting processes. Firstly, because some parents decide to send their children to a school associated with a particular denomination they don’t patronise their nearest institution because it is not linked to that denomination. Secondly, others may reject their nearest school because of its denominational links – preferring to send them to a more distant establishment which has no such affiliation. Of Birmingham’s 289 primary schools analysed here (excluding the Jewish and Muslim schools plus special schools), Table 2 shows that 211 had no religious affiliation and were attended by 10,213 (78 per cent) of the city’s 13,018 primary school students in the 2002-2003 cohort. There were also 54 Roman Catholic schools, attended by 14 per cent of the students; 6 per cent attended one of the 24 Church of England and other (non-RC) Christian schools. Of the 12,752 secondary school students who enrolled for the first time in 2002, 84 per cent were at the 74 non-denominational establishments; the majority of the remainder went to either one of the 9 Roman Catholic schools (11 per cent) or one of the six other Christian establishments (4 per cent). Table 3 examines the percentage of students enrolling at their nearest school, according to its denomination, in two ways. The first two columns focus on the schools’ denomination. For primary schools, those who attended a school without a denominational link were more likely to go to their nearest establishment (45 per cent) than those attending either a Church of England or, especially, a Roman Catholic school. There were similar differences for secondary schools. Denominational schools enrolled fewer students from their immediate catchment (the area they were closer to than any other school). The second two columns in Table 3 look at the percentage of students enrolling at their nearest school according to its denominational affiliation. Students whose nearest school (either primary or secondary) was non-denominational were more likely to attend that school than were those whose nearest school had a denominational link. Given this apparent importance of denominational links as an influence on school choice, are there still difference across the city’s main ethnic groups when such affiliations are taken into account? Table 4 reports binary logistic regressions addressing that question. For primary schools, the dependent variable was whether students attended the nearest school to her/his home; the ‘other Christian’ schools have been combined with the Church of England establishments. The two highly significant negative regression coefficients for denomination of nearest school indicates that students were much less likely to be enrolled at their nearest school if it had a denominational link,, and especially it if were a Roman Catholic school, than if it did not. Similarly, the highly significant negative coefficient for attending a Roman Catholic rather than a non-denominational school indicates that the former were much more likely to enrol non-local students than were the latter.

8
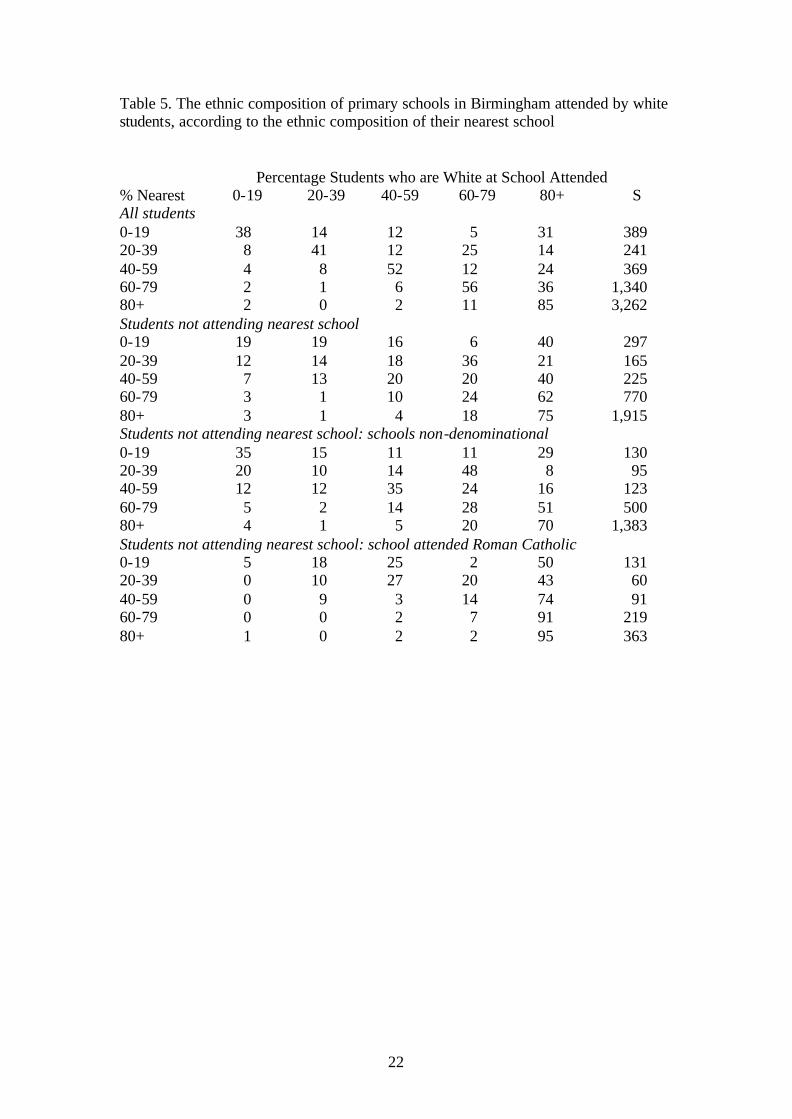
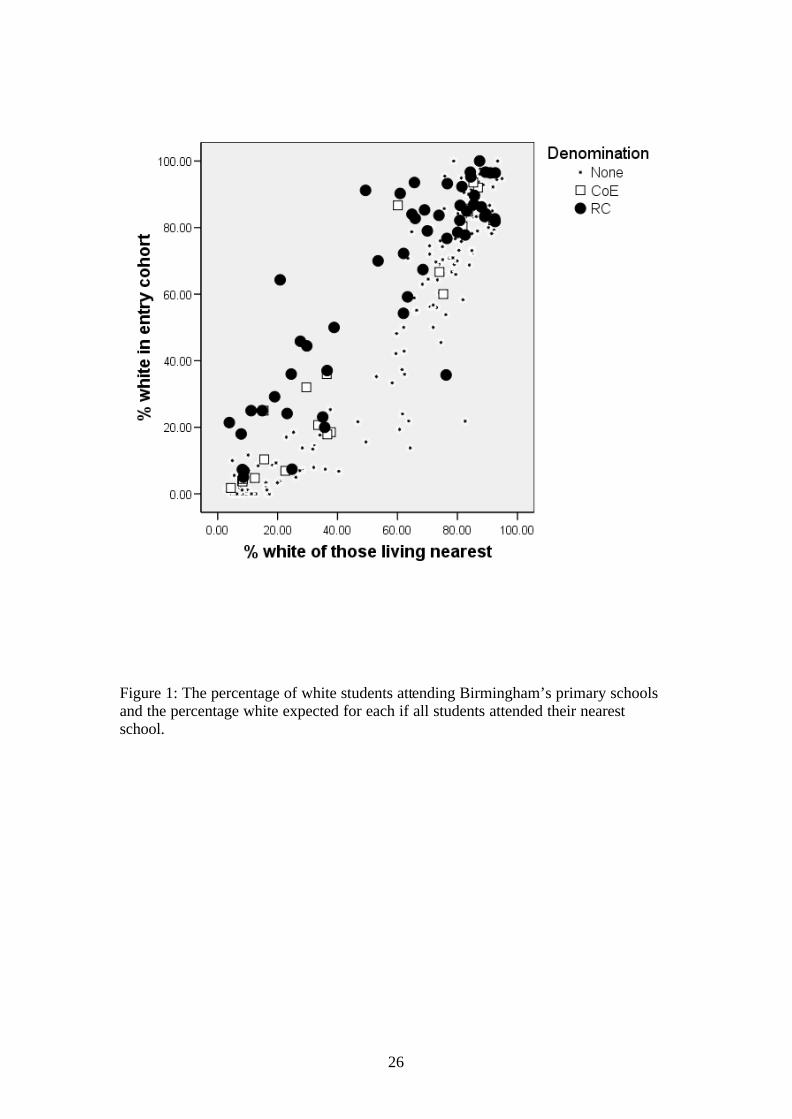
Parental choice creates greater by-passing of the nearest primary school if either it has a religious link or such a school is attended. In addition, there are significant differences between five of the non-white ethnic groups and whites in the probability that their children attended the nearest school to their homes: students from two of the three south Asian ethnic groups (Pakistani and Bangladeshi) were less likely to attend local schools than white students. Turning to secondary schools, the other regression in Table 4 shows the same patterns with regard to religious affiliation as primary schools. Students were significantly less likely to enrol at the nearest school to their home if it had a denominational link, and were also less likely to attend at their nearest school if they were at a denominational establishment than if they were not. Unlike the case with primary schools, however, some students from ethnic minority groups (including the relatively large Pakistanis as well as Black Caribbeans) were less likely than whites to enrol at the nearest school to their homes. ‘White flight’ to denominational schools? If the pattern of white student enrolment at primary schools other than that closest to their homes is, at least in part, the result of parental choice on the basis of a school’s ethnic composition (i.e. ‘white flight’), then substantial numbers of white students should be attending schools whose percentage white exceeds that of their nearest school To evaluate whether this was so, all schools were placed into five categories according to the percentage of their students recorded as white: 0-19, 20-39; 40-59; 60-79; 80-100. For each student in the subsequent entry cohort it was then possible to compare the percentage white at her/his nearest school with that in the school he/she attended. The first block of data in Table 5 covers all white primary school students and shows that the great majority attended a school whose ethnic composition had at least as large a white percentage as that of the nearest to their home. Thus, for example, the first row shows that among those whose nearest school was less than 20 per cent white in the year prior to their enrolment, only 38 per cent when to a school with that small a white component, and almost one-third went to a school whose ethnic composition was at least 80 per cent white. Of those whose nearest school was 20-39 per cent white, nearly eight times as many (51 per cent) enrolled at a school where more than 40 per cent of the students were white as enrolled at one where the white percentage was less than 20. Many more students attended a school with a larger white component than that of their nearest establishment than attended one with fewer whites. The data give a clear impression of ‘drift’, away from local schools with small white percentages towards those where whites are relatively more numerous. Figure 1 shows this graphically. For each school we have calculated both the percentage of its 2002 enrolment cohort students who are white and the percentage of its students who would be white if all attended the nearest establishment to their home. Most of those expected to have high white percentages – i.e. whose local areas are predominantly white (in the top right of the diagram) – indeed are predominantly white according to the ethnicity of those attending the school. Many of those expected to have only small white percentages – i.e. schools in predominantly non-white neighbourhoods (in the lower left-hand corner of the diagram) – have even smaller percentages. There is a third group of schools whose enrolment percentage white is much larger than expected (i.e. the positive residuals; the schools where the

9
percentage white among the attendees is much larger than the percentage according to who lives nearest to the school). Most of these are affiliated with the Roman Catholic church and the clear implication is that Roman Catholic schools, especially those with a relatively small white component to the ethnic composition of their immediate neighbourhoods, are enrolling a larger number of white students than would be the case if they drew exclusively from those catchments.12 The second block of data in Table 5 concentrates on white students who did not enrol at their nearest school. This provides an even clearer picture that parents who exercised choice to send students to a school other than their nearest selected one with a larger white percentage than that of the establishment closest to their home. Indeed, even where the nearest school had 60-79 per cent whites on its roll, over one-third of the newly-enrolled students living in those neighbourhoods attended a school which was more than 80 per cent white. The final blocks in Table 5 subdivide students not attending their nearest school according to whether the school attended was either non-denominational or Roman Catholic. This shows a very clear difference between the two groups. Among those whose nearest school was only 0-19 per cent white, for example, whereas over one-third of those enrolling at a non-denominational school went to one with the same white percentage and just under one-third went to a school that was 80 per cent or more white, the comparable figures for those attending Roman Catholic schools were 5 and 50 per cent. Indeed (other than for the 80 per cent plus category) almost all those moving outside their local neighbourhood to a Roman Catholic primary school went to one with a substantially larger white population than their local neighbourhood school. There was a similar drift away from local schools towards those with larger white percentages in their ethnic composition among secondary students. The first block of Table 6, for example, shows that if the nearest school was less than 40 percent white the majority enrolled at a school with a larger white percentage. Looking only at those who did not attend their nearest school – the second block of data – the percentages attending schools with relatively small white populations were particularly low, with the great majority enrolling at schools which were more than 60 per cent white in the previous year. This pattern is also illustrated in Figure 2; many schools whose expected ethnic composition – if students attended their nearest schools – was less than 60 per cent white enrolled even fewer white students, and Roman Catholic schools, especially those with small expected white populations, enrolled many more whites than would have been the case if all students attended their nearest school. This final conclusion is sustained by the data in the last two blocks of Table 6. School choice by non-whites The discussion so far has implied that differences between the ethnic composition of schools and what would have been the composition if all students attended their nearest establishment is a function of choice by the parents of white students. The data in Tables 5-6 clearly suggest that a substantial proportion of parents of white
12 The few exceptions (the large negative residuals) were either schools with small intakes or those with a substantial proportion of their enrolees ethnically categorised as ‘other’.
10
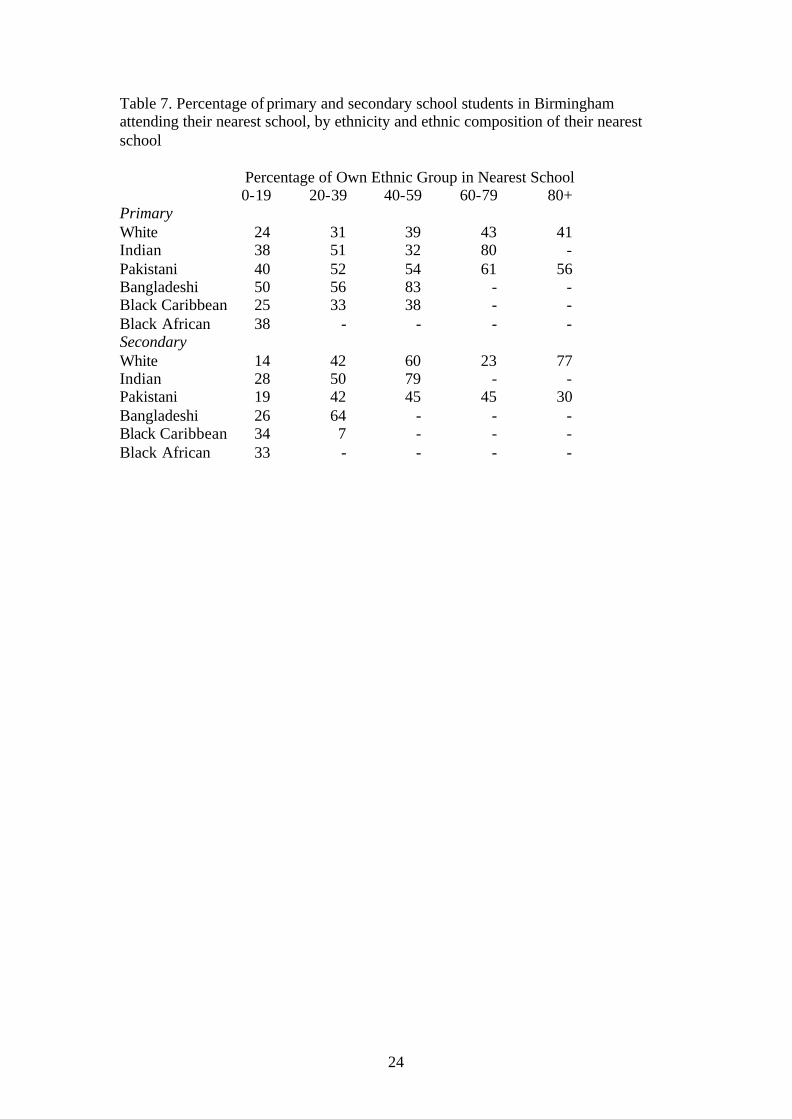
children send them to schools where the percentage of students who are white is greater than at their neighbourhood establishment. But Tables 1 and 4 also indicate that many non-white students attend schools other than tha t closest to their home. This raises the question whether in their case, too, some parents are sending them to schools with a larger percentage of their co-ethnics than is the case with their nearest school. Table 7 provides clear circumstantial evidence which is consistent with that argument. For most groups, the larger it is as a percentage of the nearest school’s ethnic composition, the larger the percentage who enrol at their nearest school. With Bangladeshis, for example, whereas 50 per cent enrolled at their nearest school if they comprised 0-19 per cent Bangladeshis in the previous year, 56 per cent did so where they formed 20-39 per cent of the school population, and the figure was 83 per cent where Bangladeshis formed 40-59 per cent of the school population. The same general pattern is observed for Bangladeshis in secondary schools – although none comprised more than 39 per cent of the total student complement – and for both Indians and Pakistanis in both types of school (although with Indians there is an interesting deviation from the general trend with both primary and secondary that were 4-50 per cent Indian). There is, however, less evidence of similar patterns for Black Caribbeans and, especially, the small population of Black Africans. Just as some parents of white students apparently select schools for their children to attend based on their ethnic composition either directly or, by choosing ‘faith schools’ (especially Roman Catholic schools), indirectly, so it seems that some parents of non-white students, especially South Asians, are making similar choices for their children. The implication is that, to a greater or lesser extent, all ethnic groups are involved in sorting processes resulting in greater segregation of the city’s schools than would be the case if all students attended the nearest school to their home. School segregation is greater than neighbourhood segregation at least in part because of parental choice within the city’s system of allocating students to schools. Modelling school choice by ethnic group The descriptive data outlined in the previous sections provide strong circumstantial evidence supporting the argument that patterns of ethnic segregation in Birmingham’s schools reflect not only residential sorting by ethnic group – indicated by the expected percentage ethnic composition of each school if all students attended the nearest to their home – but also parental choice across most ethnic groups. To establish this conclusion more securely, this section models those patterns. At the core of this model are two hypotheses. The first of these argues that students will be enrolled at their nearest school if her/his ethnic group forms a substantial component of the school’s population; the second argues that because students tend to be enrolled at schools where their ethnic group forms a large component of the total, this will mean that where that happens they are less likely to go to their nearest school:
H1 – the larger an ethnic group as a percentage of students at the nearest school, the greater the probability that a member of that ethnic group enrols at her/his nearest school; and

11
H2 – the larger an ethnic group as a percentage of the population of the school attended, the smaller the probability that a member of that ethnic group enrols at her/his nearest school.
In addition, it is expected – following the findings discussed above – that whether a student attends the nearest school to her/his home will be influenced both by the religious affiliation of that school and the religious affiliation of the school attended. Thus:
H3 – the probability of a student being enrolled at her/his nearest school is lower if that school has a denominational link than if it does not; and H4 – the probability of a student being enrolled at her/his nearest school is lower if the school attended has a denominational link than if it does not.
Further, because much of the literature on school choice in non-selective systems argues that some parents will seek to enrol their children at schools with high academic reputations, according to performance in the Standardised Attainment Tests (SATs) at ages 7 (KS10, 11 (KS2), 14 (KS3) and 16 (the GCSE examinations), measures of school performance are also included: for primary schools this is the average KS2 score in the previous year and for secondary schools it is the average GCSE score. Similarly, it is sometimes argued that families from poor backgrounds are less likely to be concerned about school choice than others. The usual measure of relative poverty is eligibility for free school meals, and this is included here for all students – with the hypothesis that eligible students are more likely to attend the school nearest to their home.
H5 – students qualifying for free school meals are more likely to be enrolled at the nearest school to their home than are those who do not. H6 – the higher the average SAT performance at a student’s nearest school, the greater the probability that he/she will be enrolled there; H7 – the higher the average SAT performance at the school the student is enrolled at, the lower the probability the he/she will attend her/his nearest school;
The full model is: Pijk = a + b1 PCjk – b2 PCjm +/- b3 CE k +/- b4 RCk +/- b5 CEm +/- b6RCm +/- b7FSMij +/- b8 SATk +/- b9SATm [1] where Pijk is the probability that student i, in ethnic group j, enrols at the nearest school to her/his home, k; PCjk is the percentage of the students in school k (the nearest to student’s i’s home) who are of ethnic group j; PCjm is the percentage of the students in school m (the one attended by student i) who are of ethnic group j; CE k and RCk are dummy variables, coded 1 if school k has a Church of England or Roman Catholic affiliation, respectively; CE m and RCm are dummy variables, coded 1 if school m has a Church of England or Roman Catholic, respectively; FSMij is a dummy variable, coded 1 if student i in ethnic group j is eligible for free school meals; SATk is the mean SAT score (KS2 for primary schools; GCSE for secondary schools) at school k; and

12
SATm is the mean SAT score (KS2 for primary schools; GCSE for secondary schools) at school m. The model is fitted separately for each ethnic group, for primary and secondary schools, giving twelve tests in all. The results in Table 8 indicate considerable success for the model. The percentage of individuals correctly classified (i.e. whether or not they attended their nearest school) is generally large – never falling below 60 per cent and averaging 75 per cent over the twelve models – and the majority of the regression coefficients are statistically significant, many at the 0.001 level or better (34 of the 54 coefficients are significant for the primary school models as are 31 of 54 for the secondary schools.) At the primary school level, regarding the first two hypotheses which relate to the school’s ethnic composition, all of b1 regression coefficients have the expected sign and all but one is significant at the 0.01 level or better. For each of the six ethnic groups, therefore, the larger that group as a percentage of the population of a student’s nearest school, the greater the probability that the student attends that school: the weakest relationship is for Indian students. Only four of the b2 regression coefficients are statistically significant, however. The larger the percentage of Pakistani, Bangladeshi, Black Caribbean or Black African students at a school, respectively, the smaller the probability that a student from the relevant ethnic group attending that school was enrolled at the nearest school to their home in 2002. This is not the case with Whites and Indians, however. Turning to school denomination, the b3 and, especially, b4 coefficients show that for each of the six ethnic groups students are much less likely to be enrolled at their nearest school if it has a religious denomination than if it does not. Denominational schools recruit fewer students from their immediate catchment areas than non-denominational schools. There is a less clear cut pattern regarding the denominational affiliation of the school attended, however. The highly significant positive b5 coefficients for Pakistanis and Bangladeshis indicate that if students drawn from those ethnic groups attend a Church of England or Roman Catholic school it is quite likely to be the nearest to their home – suggesting that attending such a school may be a default option if either the parents cannot gain access to another school or are prepared to accept the nearest establishment whatever its affiliation. Regarding the other three variables, there is virtually no evidence that family background is related to the decision whether to enrol at the nearest school, with only one, marginally, significant b7 coefficient. Finally, the b8 and b9 coefficients indicate that among Whites, Indians and Pakistanis, but not Bangladeshis, Black Caribbeans and Black Africans, the higher the average KS2 score of the nearest school the greater the probability that a student is enrolled there and also the higher the score for the school attended the lower the probability that a student is enrolled at her/his nearest school. Good local schools enrol White, Indian and Pakistani students from both within their immediate catchments and from further afield. Turning to secondary schools, ethnic composition is not significantly related to whether Whites or Indians attend their nearest school, though it is for members of the other four groups. The most consistent pattern – as with primary schools – is for the
13
denomination of the nearest school. Roman Catholic schools are much less likely than non-denominational and Church of England schools to enrol students for whom they are the nearest available non-selective establishment. School performance is also crucial: the higher the nearest school to a student’s home’s average GCSE performance, the more likely he/she is to enrol at that school. Conclusions Ethnic segregation in England’s primary and secondary schools has become a substantial issue in contemporary public and political debate because of the implications that such separation in key socialisation locales have for the stability of a multi-cultural society. Given earlier findings that schools in England’s urban areas are more segregated than the neighbourhoods in which they are located, the implication is that the processes by which students are allocated to schools – in which parental choice is an important criterion – are exacerbating the separation of ethnic groups within society. This deployment of choice is usually portrayed as involving ‘white flight’, with the parents of white children seeking to distance them from members of other ethnic groups in the schools they attend, by selecting state schools according to their ethnic composition, although it may well be the case that members of other ethnic groups operate similar criteria in the selection of schools for their children. This paper has evaluated the extent to which such behaviour may have resulted in ethnic segregation in Birmingham, England’s second largest LEA with a substantial multi-ethnic population. The majority of students there do not attend their nearest school – either primary or secondary – and analysis of data for a single-year entry cohort has shown that there is a greater probability of members of all groups attending their nearest school the larger their group as a proportion of that school’s student population in the preceding year. Furthermore, students who do not attend their nearest school are very likely to be enrolled instead at one with a higher percentage of its students drawn from their ethnic group than is the case at their nearest establishment. There is ethnic sorting in Birmingham’s schools apparently reflecting parents’ opinions regarding the desirability of enrolling their children at the nearest school. In part that reflects – as much debate has suggested – the average academic performance at the nearest school (parents prefer to send their children to ‘high achieving’ schools); in part too, as shown here, it reflects on the school’s ethnic composition. Key to that sorting process – particularly for white families, it seems – is a school’s denominational affiliation. Parents are much less likely to send their children to the nearest school if it is associated with either the Church of England or the Roman Catholic Church, and those who do enrol their children at such schools are much more likely than others to send them to a school other than that closest to their home. Because proximity to a school is a major criterion applied by the LEA when schools are over-subscribed, much debate about school choice has linked it to the housing market: parents, it is argued, who want their children to attend a particular school (usually, according to the debates, because of its academic performance but also, as the evidence here suggests, because of its ethnic composition) will seek homes close to that school – and be prepared to pay premium prices accordingly. However, if parents choose to send their children to denominational schools and meet their criteria, then proximity to the selected school may not be quite as important an issue
14
for them. This appears to be the case in Birmingham, where a substantial number of parents appear to be using the denominational schools (especially those associated with the Roman Catholic church) to gain access to establishments which meet their desiderata for their children on criteria such as ethnic composition and academic performance. They may then avoid the need to pay a premium property price to gain access to desired schools, but as a consequence their children have to travel beyond the nearest school to their home. The rhetoric of choice with regard to public services in the United Kingdom stresses its importance in promoting higher standards and better outcomes for all. But in schools, academic performance is not the only criterion that some parents at least identify as important when selecting which establishments they wish their children to attend. Among the other criteria that they might apply are a school’s ethnic composition – as for some at least a school which is not mixed (has either very few students drawn from certain groups or, perhaps more importantly, a large number drawn from the parents’ own ethnic group) is so desirable that they are prepared for their children to travel more than the minimum distance required to access the nearest school. The analyses reported here have clearly shown this to be the case for Birmingham, where there is considerable ethnic sorting in both primary and secondary schools greater than would be expected given the residential sorting in the city’s neighbourhoods (that would be reflected if all students attended the nearest school to their home). Many by-pass their nearest school in order, it seems, to be enrolled in one with a different ethnic composition – for white parents, with a greater percentage of white students than is the case at their nearest school; and many do this by sending their children to the denominational schools which operate their own, ‘faith-based’, admissions criteria within the state system. References Allen, R. 2007: Allocating pupils to their nearest secondary school: the consequences
for social and ability stratification. Urban Studies 44: 751-770. Bagley, C. 1996: Black and white unite or flight? The racialised dimension of
schooling and parental choice. British Educational Research Journal 22: 569-580.
Bagley, C., Woods, P. A. and Glatter, R. 2001: Rejecting schools: towards a fuller
understanding of the process of parental choice. School Leadership and Management 21: 309-325.
Ball, S. J. 1993: Education markets, choice and social class: the market as a class
strategy in the UK and the USA. British Journal of the Sociology of Education 14: 3-19.
Ball, S. J. and Vincent, C. 1998: ‘I heard it on the grapevine’: ‘hot’ knowledge and
school choice. British Journal of Sociology of Education 19: 377-400. Birmingham City Council (2007) School Admissions: a report from Overview and
Scrutiny. Available at http://www.birmingham.gov.uk/Media/School

15
%20Admissions%20060207.pdf?MEDIA_ID=187262&FILENAME=School%20Admissions%20060207.pdf
Burgess, S., Briggs, A., McConnell, B. and Slater, H. 2006: School choice in
England: basic facts. Bristol: Centre for Market and Public Organisation, Department of economics, University of Bristol, Working Paper 06/159.
Burgess, S., McConnell, B., Propper, C. and Wilson, D. 2004: Sorting and choice in
English secondary schools. Bristol: Centre for Market and Public Organisation, Department of economics, University of Bristol, Working Paper 04/111.
Burgess, S. and Wilson, D. 2005: Ethnic segregation in England’s schools.
Transactions of the Institute of British Geographers NS30: 20-36. Burgess, S., Wilson, D. and Lupton, R. 2005: Parallel lives? Ethnic segregation in
schools and neighbourhoods. Urban Studies 42: 1027-1056. Dale. R. 1997: Educational markets and school choice. British Journal of Sociology of
Education, 18: 451-468. Frankenberg, E. Lee, C. and Orfield, G. 2003: A Multiracial Society with Segregated
Schools: Are We Losing the Dream? Cambridge MA: Harvard University, The Civil Rights Project. (available from www.civilrightsproject.harvard.edu).
Goldstein, H. and Noden, P. 2003: Modelling social segregation. Oxford Review of
Education 29: 225-237. Gorard, S., Taylor, C. and Fitz, J. 2001: Social exclusion and public policy: the
relationship between local school admission arrangements and segregation by poverty. International Journal of Sociology and Social Policy 26: 10-36.
Harland, K. and Stillwell, J. 2007a: Commuting to school in Leeds: how useful is the
PLASC? Leeds: University of Leeds, School of Geography, Working Paper 07/02.
Harland, K. and Stillwell, J. 2007b: Using PLASC data to identify patterns of
commuting to school, residential migration and movement between schools in Leeds. Leeds: University of Leeds, School of Geography, Working Paper 07/03.
Johnston, R. J., Poulsen, M. F. and Forrest, J. 2002a: Are there ethnic
enclaves/ghettos in English cities? Urban Studies 39: 591-618. Johnston, R. J., Forrest, J. and Poulsen, M. F. 2002b: The ethnic geography of
EthniCities: The American model’ and residential concentration in London. Ethnicities: 209-235.
Johnston, R. J., Burgess, S., Wilson, D. and Harris, R. 2007: School and residential
segregation: an analysis of variations across England’s Local Education Authorities. Regional Studies,

16
Johnston, R. J., Wilson, D. and Burgess, S. 2004: School segregation in multi-ethnic
England. Ethnicities 4, 259-291 Johnston, R. J., Wilson, D. and Burgess, S. 2005: England’s multi-ethnic educational
system? A classification of secondary schools. Environment and Planning A 37: 45-62.
Lee, C. 2004: Residential Segregation and Educational Outcomes in Metropolitan
Boston. Cambridge MA: Harvard University, The Civil Rights Project (available from www.civilrightsproject.harvard.edu).
Lucey, H. and Reay, D.2002: A market in waste: psychic and structural dimensions of
school-choice policy in the UK and children’s narratives on ‘demonized’ schools. Discourse: Studies in the Cultural Politics of Education 23: 253-266.
Orfield, G. and Lee, C. 2004: Brown at 50: King’s Dream or Plessy’s Nightmare?
Cambridge MA: Harvard University, The Civil Rights Project. (available from www.civilrightsproject.harvard.edu).
Parsons, E., Chalkley, B. and Jones, A. 2000: School catchments and pupil
movements: a case study in parental choice. Educational Studies 26: 33-48. Reay, D. and Ball, S. J. 1997: ‘Spoilt for choice’: the working classes and educational
markets. Oxford Review of Education 23: 89-101. Reay, D. and Ball, S. J. 1998: ‘Making their minds up’: family dynamics of school
choice. British Educational Research Journal 24: 431-448. Reay, D. and Lucey, H. 2000a: ‘I don’t really like it here but I don’t want to be
anywhere else’: children and inner city council estates. Antipode 32: 410-428. Reay, D. and Lucey, H. 2000b: Children, school choice and social differences.
Educational Studies 26: 83-100. Reay, D. and Lucey, H. 2003: The limits of ‘choice’: children and inner city
schooling. Sociology 37: 121-142. Taylor, C. 2001: The geography of choice and diversity in the ‘new’ secondary
education market of England. Area 33: 368-381. Taylor, C. and Gorard, S. 2001: The role of residence in school segregation: placing
the impact of parental choice in perspective. Environment and Planning A 33: 1829-1852.
Thernstrom, A. 2002: The racial gap in academic achievement. In A. Thernstrom and
S. Thernstrom, editors, Beyond the Color Line: New Perspectives on Race and Ethnicity in America. Stanford CA: Hoover Institution Press, 259-276.

17
West, A., Pennell, H. and Noden, P. 1998: School admissions: increasing equity, accountability and transparency. British Journal of Educational Studies 46: 188-200.
White, P., Gorard, S., Fitz, J. and Taylor, C. 2001: Regional and local differences in
admission arrangements for schools. Oxford Review of Education 27:317-337.
18
Table 1: The percentage of Birmingham primary and secondary school students enrolling at their nearest school, by ethnicity Primary Secondary N ? N ? All students White 38 6,130 35 6,596 Indian 43 645 40 593 Pakistani 51 2,945 30 2,146 Bangladeshi 53 574 41 411 Black Caribbean 27 662 21 663 Black African 37 371 28 241 TOTAL 41 13,090 33 11,534 N – percentage enrolled at nearest school; ? – total number of students

19
Table 2: The distribution of primary and secondary school students in Birmingham, by school denomination Primary Secondary Denomination N S N S None 211 10,213 74 10,724 Church of England 24 940 1 85 Roman Catholic 54 1,865 9 1,454 Other Christian - - 5 452

20
Table 3: The percentages of primary and secondary students in Birmingham attending their nearest school, by the characteristics of the school attended and their nearest school School Attended Nearest School P S P S Denomination None 45 35 47 34 Church of England 36 17 34 13 Roman Catholic 22 18 22 18 Other Christian 60 4 40 0 P – Primary; S – Secondary

21
Table 4: Binary logistic regressions of the likelihood of a student attending their nearest school in Birmingham, by school denomination and ethnicity Primary Secondary Constant -0.837*** -1.764*** Denomination of nearest school (comparator: none) Church of England -0.439*** -1.014*** Roman Catholic -1.025*** -0.804*** Denomination of school attended (comparator: none) Church of England -0.052 -0.802*** Roman Catholic -0.830*** -0.883*** Ethnic (comparator: white) Indian 0.127 0.100 Pakistani 0.395*** -0.305*** Bangladeshi 0.476*** 0.090 Black Caribbean -0.475 -0.763*** Black African -0.140 -0.318* Other -0.166*** -0.418*** %correct 63.2 66.4 N 12,144 11,790 * – statistically significant at the 0.05 level or better; ** – statistically significant at the 0.01 level or better; *** – statistically significant at the 0.001 level or better;
22
Table 5. The ethnic composition of primary schools in Birmingham attended by white students, according to the ethnic composition of their nearest school Percentage Students who are White at School Attended % Nearest 0-19 20-39 40-59 60-79 80+ S All students 0-19 38 14 12 5 31 389 20-39 8 41 12 25 14 241 40-59 4 8 52 12 24 369 60-79 2 1 6 56 36 1,340 80+ 2 0 2 11 85 3,262 Students not attending nearest school 0-19 19 19 16 6 40 297 20-39 12 14 18 36 21 165 40-59 7 13 20 20 40 225 60-79 3 1 10 24 62 770 80+ 3 1 4 18 75 1,915 Students not attending nearest school: schools non-denominational 0-19 35 15 11 11 29 130 20-39 20 10 14 48 8 95 40-59 12 12 35 24 16 123 60-79 5 2 14 28 51 500 80+ 4 1 5 20 70 1,383 Students not attending nearest school: school attended Roman Catholic 0-19 5 18 25 2 50 131 20-39 0 10 27 20 43 60 40-59 0 9 3 14 74 91 60-79 0 0 2 7 91 219 80+ 1 0 2 2 95 363

23
Table 6. The ethnic composition of secondary schools in Birmingham attended by white students, according to the ethnic composition of their nearest school Percentage Students who are White at School Attended % Nearest 0-19 20-39 40-59 60-79 80+ S All students 0-19 21 7 14 35 23 547 20-39 4 38 14 27 16 367 40-59 3 6 52 28 11 219 60-79 3 4 6 50 37 2,706 80+ 1 1 2 13 85 2,732 White students not attending nearest school 0-19 13 8 15 39 25 494 20-39 6 8 21 41 24 246 40-59 7 12 1 57 23 107 60-79 4 5 7 39 46 2,164 80+ 1 2 3 28 66 1,233 White students not attending nearest school: school attended non-denominational 0-19 16 11 14 51 9 314 20-39 9 10 24 42 15 162 40-59 11 21 2 53 13 62 60-79 4 6 8 41 41 1,812 80+ 1 2 4 32 62 974 White students not attending nearest school: school attended Roman Catholic 0-19 9 0 18 18 56 176 20-39 0 0 15 40 45 80 40-59 0 0 0 62 38 45 60-79 2 0 1 27 70 346 80+ 0 0 1 14 85 258
24
Table 7. Percentage of primary and secondary school students in Birmingham attending their nearest school, by ethnicity and ethnic composition of their nearest school Percentage of Own Ethnic Group in Nearest School 0-19 20-39 40-59 60-79 80+ Primary White 24 31 39 43 41 Indian 38 51 32 80 - Pakistani 40 52 54 61 56 Bangladeshi 50 56 83 - - Black Caribbean 25 33 38 - - Black African 38 - - - - Secondary White 14 42 60 23 77 Indian 28 50 79 - - Pakistani 19 42 45 45 30 Bangladeshi 26 64 - - - Black Caribbean 34 7 - - - Black African 33 - - - -

25
Table 8: Binary logistic regressions of school choice W I P B BC BA Primary a -1.514*** -0.603 -1.054*** 0.586 -2.110*** -1.818** b1 0.008*** 0.020* 0.015*** 0.108*** 0.059*** 0.058** b2 0.001 -0.003 -0.019*** -0.099*** -0.037*** -0.052** b3 -0.237*** -1.390*** -2.953*** -2.837*** -0.586 -1.818** b4 -1.049*** -1.703*** -3.246*** -2.061*** -1.333*** -3.400*** b5 -0.396** 0.224 2.017*** 3.200*** -0.091 0.939 b6 -0.784*** 0.639 0.432 1.489 -1.041*** -1.026* b7 -0.061 0.299 -0.184* 0.338 0.312 -0.065 b8 0.225*** 0.337*** 0.225*** 0.013 0.188** -0.028 b9 -0.199*** -0.358*** -0.185*** -0.010 -0.065 0.042 %correct 67.8 66.9 76.6 83.3 73.2 79.5 N 5,601 612 2,742 550 628 349 Secondary a -4.655*** -25.781 -6.292 -24.825 -25.297 4.755 b1 0.029 0.022* 0.012*** 0.077*** 0.045** 0.945** b2 -0.002 0.001* 0.005* 0.040*** -0.045** -0.354* b3 1.196* -19.180 -19.836 -19.801 -19.486** 39.502 b4 -1.917*** -2.330*** -3.200*** -3.798*** -1.117*** -2.724*** b5 -0.307 -18.794 -19.452 -17.976 -19.440*** 20.187 b6 -0.386*** -1.727*** 1.012* 3.046* -0.392 -1.649 b7 0.076 -0.016 0.134 0.213 0.134 0.554 b8 0.157*** 0.133*** 0.157*** 0.243*** 0.149*** 0.044 b9 -0.091*** 0.003 -0.081*** -0.079* -0.008 0.022 %correct 76.8 79.3 64.1 77.3 77.1 76.7 N 6,571 593 1,988 400 658 232 W – white; I – Indian; P – Pakistani; B – Bangladeshi; BC – Black Caribbean; BA – Black African. b1 – regression coefficient for percentage of own ethnic group at nearest school; b2 – regression coefficient for percentage of own ethnic group at school attended; b3 – regression coefficient – dummy variable=1 if nearest school Church of England; b4 – regression coefficient – dummy variable=1 if nearest school Roman Catholic; b5 – regression coefficient – dummy variable=1 if school attended Church of England/Christian; b6 – regression coefficient – dummy variable=1 if school attended Roman Catholic; b7 – regression coefficient – dummy variable=1 if qualifies for free school meals; b8 – regression coefficient for average KS2/GCSE score of nearest school; b9 – regression coefficient for average KS2/GCSE score of school attended. * – statistically significant at the 0.05 level or better; ** – statistically significant at the 0.01 level or better; *** – statistically significant at the 0.001 level or better;
26
Figure 1: The percentage of white students attending Birmingham’s primary schools and the percentage white expected for each if all students attended their nearest school.

27
Figure 2: The percentage of white students attending Birmingham’s secondary schools and the percentage white expected for each if all students attended their nearest school.