Ethnic Segregation and Educational Outcomes in Swedish ...
48
The Stockholm University Linnaeus Center for Integration Studies (SULCIS) Ethnic Segregation and Educational Outcomes in Swedish Comprehensive Schools Ryszard Szulkin and Jan O. Jonsson Working Paper 2007:2 ISSN 1654-1189
Transcript of Ethnic Segregation and Educational Outcomes in Swedish ...

The Stockholm University Linnaeus Center for Integration Studies (SULCIS)
Ethnic Segregation and Educational Outcomes in Swedish Comprehensive
Schools
Ryszard Szulkin and Jan O. Jonsson
Working Paper 2007:2
ISSN 1654-1189
The Stockholm University Linnaeus Center for Integration Studies (SULCIS)
SULCIS is a multi-disciplinary research center focusing on migration and integration funded by a Linnaeus Grant from the Swedish Research Council (VR). SULCIS consists of affiliated researchers at the Department of Criminology, the Department of Economics, the Department of Human Geography, the Department of Sociology and the Swedish Institute for Social Research (SOFI). For more information, see our website: www.su.se/sulcis SULCIS Working Paper Series 2007:1 Arai, M & Skogman Thoursie, P., “Giving Up Foreign
Names: An empirical Examination of Surname Change and Earnings”
2007:2 Szulkin, R. & Jonsson, J.O., “Ethnic Segregation and Educational Outcomes in Swedish Comprehensive Schools”

Ethnic segregation and educational outcomes in Swedish comprehensive schools
Abstract
We ask whether ethnic density in Swedish comprehensive schools affect teacher-assigned
school grades in ninth grade (age 16). The data, based on two entire cohorts who graduated in
1998 and 1999 (188,000 pupils and 1,043 schools), link school information with Census data
on social origin, and enable us to distinguish first- from second generation immigrants. Using
multilevel analysis we find the proportion of first, but not the second, generation immigrant
pupils in a school to depress grades in general, but particularly for (first generation)
immigrant pupils. Passing a threshold of more than 40 percent immigrants reduces grades
with around a fifth of a standard deviation, affecting fourteen percent of immigrant children.
Our main results are robust to model specifications which address omitted variable bias both
at individual- and school-level. One policy implication of our results is that desegregation
policies which concentrated on the two per cent most segregated schools would probably
improve school results and reduce ethnic inequality.
Keywords:
Ethnic inequality, Immigrant schooling, Educational attainment, Contextual effects,
Hierarchical models
Word count:
11,349 (including endnotes and references)

Ethnic Segregation and Educational Outcomes in Swedish
Comprehensive Schools
Ryszard Szulkin & Jan O. Jonsson
INTRODUCTION
Many countries have recently experienced a rapid increase in immigration, and concomitant
changes in their ethnic mix. This is true for the U.S.A. during the last two-three decades (e.g.,
Lee and Bean 2004), and likewise for parts of Europe: Countries such as Sweden, Belgium,
France, the Netherlands, and Austria now have, like the U.S.A, an immigrant population
around 12-15 %, with a growing number of native-born children of immigrants (OECD 2003).
Many Western countries share not only in the experience of large-scale immigration, but also
in the ethnic spatial concentration to and segregation within large city areas that typically
follows (e.g., Musterd 2005; Charles 2003). As a result, many have expressed concern for the
conditions and opportunities of children in urban residential areas with a high concentration of
ethnic minorities, often characterized also by socioeconomic disadvantages.1 In particular, this
concern has focused on their school results and educational attainment as a basis for their
chances in the labor market and for their integration at large.
1 We follow the convention and use the term “ethnic” in some instances (as in “ethnic
segregation/density/concentration”, which we use interchangeably) to denote the distribution or
clustering of people of different immigrant statuses according to their own and/or their parents’
country of birth (which is the information we have access to). We are aware, however, that the proper
use of the term “ethnic” should require information about religion, language, cultural belonging etc.
(immigrants from Turkey to Sweden, for example, consist of at least three ethnic groups: Turks,
Kurds, and Syrians).
Sociological theories of role models, collective socialization, and peer processes
indeed suggest that the concentration of disadvantaged families in neighborhoods and schools
will have negative consequences for children’s school achievement. There is also a number of
empirical studies showing the importance of the socioeconomic composition of schools for
educational outcomes (Hanushek, Kain and Rivkin 2002, Robertson and Symons 2003,
Willms 1986; Erikson 1994), suggesting that socioeconomic segregation depresses
educational achievement for those who live in disadvantaged areas, where children of
immigrants are over-represented. There is a related body of studies of neighborhood effects
(see Garner and Raudenbush 1991; Borjas 1995; Brooks-Gunn, Duncan and Aber 1997, and
reviews by Dietz 2002; Sampson, Morenoff and Gannon-Rowley 2002; Durlauf 2004),
showing that “middle-class” residential areas are overall associated with better achievements
of pupils, even when controlling for characteristics of their own family of origin (though the
causal nature of these associations is contested).
Studies of racial segregation in the U.S.A. conclude that also such segregation tends to
depress school achievement (Boozer, Krueger, and Wolkon 1992; Grogger 1996; Cutler and
Glaeser 1997; Hoxby 2000; Hanushek et al. 2002), though there are mixed findings in
previous research, probably due to differences in methodology and in data (Hanushek et al.
2002; Durlauf 2004). However, as pointed out by several researchers (e.g., Ellen et al. 2002),
we know rather little about the effects of ethnic concentration due to recent immigration, in
the U.S.A. or elsewhere. Though there are some common sociological mechanisms,
immigration has somewhat different dynamics in relation to segregation than race. The spatial
segregation of immigrants is partly a phenomenon of ‘population shock’ when (sometimes
large numbers of) newcomers tend to cluster in separate, often underprivileged, residential
areas (e.g., Jensen 2001). Such ethnic concentration produces communities where
disadvantage may be maintained across generations due to lack of language proficiency,

limiting networks, and distance to the majority culture (e.g., Borjas 1995; Portes and
Rumbaud 2001). However, such disadvantage tends to be erased in the third generation (Alba
and Knee 2003) and some immigrant groups are relatively resourceful, especially with regard
to human capital and skills, and exhibit high educational aspirations (e.g., Similä 1994;
Goyette and Xie 1999). A systematic ethnic segregation – where immigrants in general are
isolated from the majority population – may thus, at least in theory, create residential areas
that are more beneficial for children than those produced purely by a concentration of
socioeconomic disadvantage (cf. Cutler and Glaeser 1997).
The academic interest as well as the social policy relevance of the question whether
ethnic segregation reduces children’s educational opportunity are obvious. What is far from
obvious, however, is how to estimate such segregation effect empirically. There are few data-
sets that are large enough to assess contextual effects with precision, and a major obstacle is
the problem of estimating causal effects from observational data. Thus, many previous studies
suffer from inefficient and/or biased estimates of segregation effects (cf. the critical reviews
by Dietz 2002 and Durlauf 2004). The problem is mainly due to two social phenomena that
generate bias. First, families may sort themselves into neighborhoods and schools on the basis
of unmeasured characteristics that are likely to be correlated with the studied outcome, as
when parents with high aspirations for their children move to majority population areas.
Second, schools in ethnic minority areas may have less resources and therefore greater
difficulties to attract qualified teachers than schools in other districts. What we register as
negative effects of ethnic segregation may in these cases be a function of other, unobserved
characteristics of pupils and schools, resulting in omitted variable bias.
This study addresses the question to what extent ethnic segregation in Swedish
comprehensive schools, following recent immigration waves, has consequences for pupils’
school achievements; and whether such consequences are evident for native children to a
lesser or same extent as immigrant children. The answers to these questions have bearing both
on issues of societal efficiency and inequality. We draw on a unique data set, comprising two
entire cohorts of public school pupils in the last grade of comprehensive school (aged 16). For
these 188,000 respondents, information on teacher-assigned grades has been matched with
individual-level registry data on socioeconomic and demographic characteristics of their
family of origin. On the basis of these data, we have been able to create precise and reliable
measures of the socioeconomic and ethnic composition of schools (n=1,043). We can
distinguish first- from second-generation immigrants, giving us an opportunity of addressing
specific hypotheses about contextual mechanisms.
We use multilevel analyses, with pupils nested within schools, to estimate ethnic
segregation effects, controlling for a set of relevant, observed variables both at
individual/family and school level. To reduce the problem of omitted variable bias we
perform two tests. First, using longitudinal information on previous residential mobility of
respondents we are able to check to what extent population sorting influences the segregation
effect. Second, a model fitting within-school slopes (equal to a fixed effects model in
econometrics) addresses the problem of omitted variables at school level. Because the
problem of bias is both crucial for our understanding of social phenomena and very rarely
addressed in sociology, we devote a full section to this issue.
What makes the case of Sweden particularly interesting is that it combines a recent
history of high immigration rates and subsequent ethnic segregation (comparable with other
nations) with relatively equal living conditions and a low degree of stratification between
schools. Our finding that ethnic segregation depresses children’s school achievement is likely
to contain an important generic component and thus be possible to generalize to other
countries with similar experience of immigration and ethnic concentration. This is because the
micro-sociological processes behind are of a general nature: Potential problems with language

proficiency and instruction in schools with many immigrants as well as the transmission of
aspirations and skills between peers, and between adults and children within local
communities, are part and parcel of social life, no matter the longitude and latitude. At the
same time, the effects of ethnic segregation are likely to be of varying strength depending on
macro-sociological circumstances, such as general social inequality, stratification between
schools, the composition of ethnic minorities, and the reception of immigrants. As we
describe below, welfare state intervention in Sweden guarantees a base-line living standard
for ethnic minorities; and schools in ethnic minority areas get compensatory resources.
Because such social policy is likely to mitigate negative consequences of ethnic segregation
on school results, we believe that the case of Sweden represents a strategic conservative test
of segregation effects and our results thus may provide a lower-bound estimate of such
effects.
We proceed with a discussion of theories of ethnic segregation effects and a review of
findings from previous studies, after which we give a more elaborate description of the case
of Sweden. Our empirical analyses, including a discussion of the robustness of our findings,
follow. We conclude with a discussion of the results, how these may inform social policy, and
their generalizability to other countries.
THEORY AND HYPOTHESES
In understanding differences in school grades, parental resources and behavior are essential.
Theories focus on early (pre-school) socialization as well as parental support during the
school years in the forms of continuous socialization, transmission of educational aspirations,
economic resources, good advice on how to navigate the school system, and engagement in
and practical help with the school work (e.g., Schneider and Coleman 1993; Erikson and
Jonsson 1996).
Over and above pupils’ own “family context” (such as their social background),
typically measured at the individual level, the composition of families in neighborhoods and
schools may also have an impact on performance in school, as may various macro-
characteristics of this context. There are three basic processes behind (cf. Jencks and Mayer
1990). First, adults that a student meets or relates to (such as friends’ parents) may function as
role models, transfer skills, disseminate social norms, and exercise social control (e.g.,
Coleman and Hoffer 1987; Sampson et al. 2002; Crowder and South 2003). Secondly, peers
influence each other: because pupils do homework together, for example, each one’s skills
and aspirations (and indirectly their parents’ human capital), exert an influence on the other
(e.g., Winston and Zimmerman 2004). To be sure, school mates also make a difference in the
class-room situation, either by helping each other or in some other way contribute to a
productive learning environment, or by various negative influences (as in contagion theories;
see also Lazear 2001). Thirdly, institutional resources are likely to impact on students’
achievements. These may stem from local libraries, churches or youth organizations; but for
adolescents, characteristics of schools are of utmost importance. Previous research has
emphasized school climate, efficacy in instruction, economic resources (and the correlated
dimensions teacher quality and class sizes), and norms and educational aspirations (e.g., Lee
and Bryk 1989; Scheerens and Bosker 1997; Gustafsson 2003; Roscigno, Tomaskovic-Devey,
and Crowley 2006).
As the two first processes – collective socialization and peer influence – highlight
social interaction effects they are of particular sociological relevance.2 Spatial segregation,
2 The third, institutional effect is also of great social policy relevance. For a comprehensive study of
school effects, see Mortimer at al (1988); Sheerens and Bosker (1997) provide a useful review.
Particularly within economics, there are many studies of whether and to what extent school resources
according to such theories, means that a clustering of children from less resourceful families
in a school makes pupils face less opportunities of learning, lower educational aspirations, a
lack of role models that value education and schoolwork; and that pupils receive less relevant
and adequate information about the educational system and the labor market. This is akin to
problems assigned to minority children due to the “social isolation” from the majority society
in segregated inner-city areas (Wilson 1987), and due to the absence of what is sometimes
termed positive “spill-over effects” or human-capital externalities (Borjas 1995).
These general theoretical ideas apply to segregation in all forms, where families with
more resources are residing in different areas and their children attending different schools,
than those less resourceful. As immigrant families on average belong to the latter category,
we expect children in these families to face a “gross” disadvantage in school (though this will
vary with immigration circumstances and characteristics of the ethnic group). Controlling for
socioeconomic resources we also expect lasting segregation effects stemming from ethnic
concentration. Why is that? Obviously, immigrant parents typically have little experience
from and information on the educational system and labor market, and have often not
developed out-group social networks that may help in getting ahead in a new country. Their
human capital – most obviously language proficiency and educational credentials – are often
not compatible with demands in the labor market, making the transmission of relevant skills
to children (and, indirectly, to friends to their children) less efficient.3 One can even
hypothesize that their small return to higher education leads children who observe this to
have a causal effect on output, i.e., student achievement; see Hanushek (2002) and Krueger (2002) and
references therein.
3 They can function as positive role models nonetheless, of course, and their general abilities and
aspirations can be transmitted to children: but here, a limiting mechanism may be that ethnic networks
may be narrow, not allowing for so much positive spill-over effects between ethnic minority groups.

underestimate their expected benefits from educational attainment and therefore exert less
effort in school (cf. Breen and Peñalosa 2002).4 A concentration of immigrants, in some
neighborhoods and schools, who have experienced war, persecution, and involuntary
emigration, may amplify disadvantages such as social and psychological problems in both
parents and children. In general, we (also) expect neighborhoods with a large proportion of
relatively newly arrived immigrants of different ethnic origins to show less social cohesion
and collective efficacy, because norm-setting as well as social control are facilitated by
homogeneity and residential stability (Sampson et al. 2002).
In school, a concentration of pupils who do not master the language of instruction may
create problems with efficient teaching; this is of course readily derived from basic didactic
theory, and is also predicted from a model in which disruptions during class determine student
outcomes (Lazear 2001).
Finally, in ethnically segregated social spaces opportunities for cross-group
interactions is lower and ethnic closure in interpersonal networks become more pronounced
(Sanders 2002).5 Those from ethnically disadvantaged backgrounds are therefore more
exposed to environments that cannot aid in or do not promote school achievement, and a lack
of contact with native peers has negative effects on immigrant children’s integration into the
host society – consequently, we expect ethnic segregation to depress school performance
4 While mainstream culture of individual success may be wide-spread in segregated neighbourhoods,
opportunities for individual progress may nonetheless be perceived as strongly limited (e.g.,
Ainsworth 2002).
5 This may to some degree be counterbalanced by the fact that the propensity of cross-group
interaction is higher in more heterogeneous school environments than in strongly segregated ones,
probably because in-group interaction becomes more plausible as the minority group increases in size
(Moody 2001).

particularly for children from minority backgrounds (cf. Borjas 1995). Another consequence
of the processes discussed above is that we assume negative contextual effects to be more
pervasive for first-generation than for second-generation immigrants: the former have overall
less resources (in particular language skills), their parents have not been economically
integrated to the same extent as those who arrived earlier, and they are less likely to profit
from majority population networks.
While it is rather straightforward to hypothesize that there are negative ethnic
segregation effects on pupil outcomes, it is difficult to envisage at what level of segregation
they become apparent. Most studies use linear models, implicitly assuming that the effect of
ethnic concentration is the same across the distribution. A corollary of great policy relevance
is that a redistribution of immigrant groups – through housing programs, for example – would
have no overall effect (cf. Jencks and Mayer 1990). In difference to this, epidemic models,
often used when studying deviant behavior, assume accelerating effects and therefore a
possibility of increasing overall educational standards by desegregation policies. Such a
model has been applied to school achievement by Crane (1991) who found a tipping point
where children living in the four percentages least advantaged neighborhoods were
disproportionally more likely to drop out of high school. We believe that it is reasonable to
expect threshold effects of ethnic concentration, but we see no theoretical reason that these
should occur at a particular degree of segregation.
What we set out to test empirically are the hypotheses that:
1. ethnic segregation is correlated with school outcomes, so that the larger the
fraction of first- and second-generation immigrants in a school, the lower the
school achievements;

2. this correlation is partly dependent on differences in socioeconomic resources,
but even controlling for such resources ethnic segregation will have a general
negative impact on school achievement;
3. this negative effect is weakest for pupils born in Sweden by Swedish-born
parents;
4. resource convergence and assimilation across generations make the negative
impact of ethnic concentration less for second-generation than for first-
generation immigrants.
5. ethnic segregation effects accelerate as ethnic concentration in schools gets to a
certain point.
THE SWEDISH SETTING
Sweden used to be ethnically relatively homogeneous with net emigration up to the 1940s, but
has experienced increasing ethnic diversity following several immigration waves: first, in
relation to World War II, by immigrants from Germany and the Baltic states; secondly, in the
1950s and 1960s, by labor market immigrants (predominantly from other Nordic countries
and from Southern Europe) and political refugees (from former East Bloc countries and Latin
America); thirdly, as a result of recent immigration waves in the 1980s and 1990s, particularly
from former Yugoslavia and from western Asia. As is shown in Appendix Table A1, this
means that around half of the immigrant children in our study come from outside Europe
(primarily from Iran, Turkey, Chile, and Iraq) and 30 per cent from South- and Eastern
Europe. At present, Sweden has an internationally high percentage of foreign-born of around
12 per cent (OECD 2003; Statistics Sweden 2004). In our sample, consisting of children born
1982-83, 7.8 per cent are first generation immigrants and 4.6 per cent are second generation
immigrants (Table 1a). Though a government program in the period 1984-94 sought to
distribute immigrants across municipalities most end up in metropolitan areas, and residential
segregation is relatively high (Andersson 1998). Overall segregation indices (contrasting
foreign-born with Swedish-born) are between 0.3 and 0.4, though for recent non-European
immigrant groups they are as high as 0.5 to 0.8 (Andersson 2000).6
Thus, Sweden nowadays displays both a large proportion of foreign-born and
relatively strong ethnic segregation, like many comparable countries in the Western world.
What makes Sweden a special case is predominantly the way social policy reduces poverty
rates and ensures relatively equal standards of living between the native and the foreign-born
groups. This is partly a result of an all-encompassing and generous social security system,
partly because benefits in kind equalize opportunities. For our purposes, it is most important
to note that immigrants enjoy full coverage of health services and other forms of social
security; that the local municipalities provide high quality and heavily subsidized child care
for virtually all children between 1-6 years of age; and that comprehensive schools are
ensured resources according to need, following governmental norms. The latter means that,
for example, a greater share of immigrant pupils adds resources in order to compensate for
difficulties in instruction, stemming from language problems in particular (more resources are
also given to schools for pupils with other special needs). In our data, this is reflected in the
6 As the measures normally reported on segregation, primarily the index of dissimilarity, are not
margin-insensitive, there is unfortunately no straightforward way of comparing segregation between
countries (this point has been made several times over the last decades: succinct formulations are
found in, e.g., Falk, Cortese and Cohen 1978; Grusky and Charles 1998). It is generally believed,
however, that European figures in general do not match the strong spatial segregation of the black
population in large American city areas (see the review by Alba and Nee 2003, pp. 248-60; Musterd
2005).

fact that only five per cent of the individual-level variation in school grades were due to
differences between schools in 1998/99.7
To be sure, there are sharp socioeconomic differences between immigrants and
Swedish-born, reflected in employment rates (Ekberg 1999), unemployment risks (Arai and
Vilhelmsson 2004), and in the receipt of social welfare support (Franzén 2003). Nonetheless,
disadvantaged immigrant children in Sweden face more equal opportunities than they do in
most other countries due to lower inequality overall. This is reflected, for the population as a
whole, in extremely low child poverty rates (Bradbury and Jäntti 2001), relatively low
intergenerational inequality in terms of educational and occupational inheritance (Breen and
Jonsson 2005), and relatively high income mobility across generations (Solon 2002;
Björklund et al 2002).
Arguably, then, Sweden is an interesting case to study because it combines
comparatively high immigration rates and ethnic segregation with relatively equal
opportunities for children. Therefore, we would expect that our estimates of ethnic
segregation effects on educational outcomes are lower bound.
7 Though comparisons between countries should be done with some caution, it appears that the figures
for Sweden are somewhat lower than in England and the Netherlands, while between-school variation
seems to be larger in the U.S.A. (Scheerens and Bosker 1997, Ch. 3). For example, Roscigno (1998)
reports that 18%-22% of the variance in reading achievement among tenth-graders in U.S. public
schools was between schools in 1990. It may appear futile to study between-school variation when it is
as low as in Sweden, but even modest between-school variation may conceal relatively strong school-
level effects (cf. Duncan and Raudenbush 1999).
DATA AND VARIABLES
The data-set on which the empirical analyses in this paper are based include information on
all pupils (about 193,000 individuals) who attended the ninth grade in all Swedish
comprehensive schools in 1998 and 1999 (1,249 schools). The information on individual
pupils come from an official school registry of nine-graders (Åk9-registret), including
information on which school they attended. This data-set was matched (using unique personal
identification numbers) with registry data on parents, mainly from the 1980 and 1990
Censuses.8 Thus, data on pupils’ achievements are combined with information about basic
characteristics of their families.
The allocation of pupils to Swedish comprehensive schools is based on which
residential area the pupil lives in. There are some exceptions to that, such as some private
schools, but only around two per cent of pupils in our cohorts actually go to such schools.9
We excluded private schools and very small schools in which the total number of ninth grade
students in the years studied was less than 20. The reason is partly that the vast majority of
8 Such matching procedures are standard in Sweden, carried out by Statistics Sweden, and are entirely
accurate. It should be noted that for immigrants arriving in Sweden after 1990, the matching relies on
information from the annual registry of the population (RTB) and the Flergenerationsregister, to
which individual-level information of parental characteristics have been added. We have no
information on parents’ occupation for this sub-group.
9 There is also a voucher system making it possible for pupils to switch schools from their
“residential” one. In our cohorts, this was not so commonly used, and studies in Stockholm conclude
that it does not lead to ethnic segregation – most of those who use the system in fact move to a school
that is more conveniently located (often, it is closer, which must be seen in relation to the rather high
density of schools in the inner city of Stockholm), and not one that differs in the composition of pupils
or general standard (Kjellman 2001).

students attend ‘normal’ public schools, partly that the choice of other types of school is
dictated by some unmeasured characteristic of families that may also be correlated with grade
point averages. Among private and smaller schools, there are relatively more schools for
children with special needs, and religious/ethnic schools with restricted intake and special
curricula meaning that these schools have a pupil composition that sharply differs from
ordinary public schools. The exclusion of private and small schools reduces the number of
students to about 188,000 and the number of schools to 1,043.
Outcome variables
Our outcome variable is pupil’s school marks (grades) in the 9th and final grade of
comprehensive school, defined as the standardized (mean=0, SD=1) sum of the school grades
in the 16 best subjects for each individual pupil (meritvärde). Almost all Swedish children
pass through the public comprehensive school between 7-16 years of age. There is little
streaming or tracking and grades are only required in the 9th grade (age 16), which are the
ones we have information on. In each of 16 subjects, one out of four grade levels are assigned
by teachers: not pass, pass, pass with distinction, and pass with great distinction (these are
then given 0, 10, 15, and 20 points, respectively). These grades shall, according to the national
regulation, measure pupils’ knowledge as evaluated against pre-determined goals in a national
curriculum. Grades no doubt mostly reflect results in recurrent, informal examinations (which
are subject-based rather than general ability tests). As teachers are encouraged to “use all
kinds of information” to assess pupils’ knowledge, also class-room performance and the
results of assignments are considered. In addition, as each school must carry out common
national tests in core subjects (mainly Swedish, Maths and English) teachers use such test
results for evaluating individual pupils. The National Board of Education, in inspecting
schools, can also control that school grade averages do not get out of line with the results at
these national tests.
The sum of the teacher-assigned grades is consequential for pupils’ array of available
school choices at (upper) secondary school (age 17-19); in particular, only pupils who pass a
grade limit, defined as having a “pass” in Swedish, English, and Maths, are eligible for
making the transition to the academic study programs. We have also made analyses on
eligibility, so defined, but as the results are similar to the ones we find on the basis of our
analysis on grades, they are not reported here but available from the authors upon request.
Level 1: The pupils and their parents
We have information on a number of relevant pupil and parental, or household, characteristics
(see Table 1a). Sibship size is defined as the number of siblings (whether biological or not)
living in the respondents’ household. Four family types are distinguished: intact families (i.e.,
children living with two biological or adoptive parents), reconstituted families (one
biological/adoptive parent and one step-parent), single parent-families, and children living
without a parent (in special homes or with other adults). Two out of three pupils live in
nuclear families and about one out of four lives with a single parent (mostly with the mother).
Furthermore, we have data on the biological (or adoptive) parents’ level of education, country
of birth, unemployment experience, and experience of receiving social welfare during the year
when the pupil left compulsory school, i.e., 1998 or 1999. The parents’ level of education is
based on the highest out of seven levels of education achieved, according to a Swedish
standard classification (Statistics Sweden 1988). Social welfare is a dummy variable coded as
1 if at least one of the parents obtained social welfare during the relevant year, which was the
case for eleven per cent of the pupils in our data. As this benefit is given on a household basis,
the variable indicates household poverty. The parents’ experience of unemployment is a

dummy variable coded as 1 if at least one of the parents obtained unemployment benefits
during the relevant year, which is the case for around 23 per cent of the pupils.10
Table 1a here
Pupils’ immigrant status is measured by two binary variables. The first variable is
given the value 1 if the pupil and both his/her parents were born abroad, and zero otherwise; it
thus distinguishes (first generation) immigrants.11 The second variable is given the value 1 if
the pupil was born in Sweden but both his/her parents were born abroad (second generation
immigrants).12 If either equals 1, we identify the group as ‘pupils of immigrant background’.
In the empirical analyses sex, unemployment, social welfare, and sibship size are
centered around their grand means. For parents’ education we use the most frequent category,
short secondary education, as reference category. For immigrant status, Swedish-born
students with Swedish-born parents are the reference group.
10 This is a high figure compared to the average unemployment rate which was around ten per cent at
that time (it is currently, in 2005, around five per cent). The reasons are partly that most children have
two parents and thus an elevated probability that at least one of them has experienced unemployment,
and probably partly that it was common with shorter spells of unemployment.
11 We define adopted children who were born abroad as born in Sweden. They normally arrive in
Sweden at a very young age.
12 Previous research has shown that having one Swedish-born parent and one foreign-born has the
same impact on school results as having two Swedish-born parents: the real divide is between those
who do not have any Swedish-born parent (and thus not Swedish as the mother tongue) and the rest
(Similä 1994).

Level 2: Schools in 1998 and 1999
Descriptive statistics on our school-level variables are shown in Table 1b. Our crucial
independent variable is the proportion immigrant pupils in a school in 1998 and 1999, what
we will term ethnic density or ethnic concentration. This measure has the advantage of being
simple both to compute and understand, and is also policy relevant. In a discussion of
different measures of segregation, Reardon and Firebough (2002) recommend such a simple
measure when studying schools, as it is reasonable to assume that all pupils within a school
occupy the same location in the social geography of schools. The possible exception that they
mention is that it is less likely that pupils of very different ages influence each other: to
circumvent this, we base our measure only on the immigrant status of ninth-graders.13
We compute three different compositional variables to measure ethnic density: the
proportion of first generation immigrants in a school; the proportion of second generation
immigrants; the sum of these proportions (‘immigrant background’) (Table 1b). There is a
great deal of variation between schools in pupils’ results as well as in their social background.
The maximum share of first generation immigrants in a school is 87 per cent and 62 per cent
of second generation immigrants. In 74 (out of 1,043) schools, there are no pupils with
immigrant background. In one school, all pupils have such background. The distribution of
native and immigrant pupils across schools are depicted in Figures 1 and 2, where it can be
seen that few native students (around 15 per cent) go to schools with more than 20 per cent
immigrants, while a majority of immigrant children are found in such schools. The Index of
13 More elaborated measures, such as the ‘generalized heterogeneity measure’ used by Moody (2001),
could be calculated from the proportion immigrants of different origins, but as we do not set out to test
hypotheses about immigrant heterogeneity in the school population, we prefer our more interpretable
measure of ethnic density.

Dissimilarity shows that 44 per cent of first generation immigrants would need to change
schools to achieve an even distribution of cases across schools.
Figures 1 and 2 here
We use two measures of the socioeconomic composition of schools: the proportion of
students with at least one parent with university degree and the proportion of students with at
least one parent receiving social welfare during the relevant year.14 Table 1b shows that there
are some schools in which seven out of ten pupils have at least one parent with university
degree. There is also one school in which only one out of hundred pupils has such educational
background. Also the proportion of pupils whose household has experienced social welfare
varies strongly between schools. The lowest average grades in a school are 121 points and the
highest is 253 points. In sum, these descriptive statistics clearly show that ethnic and
socioeconomic segregation in Swedish schools is a reality. The zero-order correlations
between the level-two variables are given in Table A2 in Appendix. There is a strong negative
correlation between the proportion of children with no Swedish-born parent and the average
results in the school, which is more marked for the first- than for the second-generation
immigrants. The ethnic density variables are also strongly and positively correlated with the
proportion of pupils living in a household who received social welfare the current year.
Table 1b here
14 We also checked with proportion unemployed, which did not change any conclusion.
MODELS AND ANALYTICAL STRATEGY
The data set includes information both on individual pupils and on the composition of the
schools they attended. An appropriate statistical method for dealing with information of this
kind, with individuals nested within schools, is hierarchical or multilevel modeling (Bryk and
Raudenbush 1992). Multilevel models estimate within-school and between-school equations,
accounting for potential dependence between observations within schools. A particular
advantage in our case is that it allows us to estimate both random intercepts (which addresses
our question whether ethnic density in schools affects grades) and random slopes (whether the
‘individual-level effect of being immigrant’ varies with ethnic density of schools). One way
of looking at this hierarchical linear model (HLM, we use version 5), is to conceive of each
school as having its “own” level-one regression equation with an intercept and a slope (or
slopes) that in turn constitute the outcome(s) in the level-two models (Raudenbush et al.
2000). However, the estimation is done in one stage and uses both within- and between-group
variance to estimate effects. While the standard HLM model makes the strong assumption that
slopes are uncorrelated with residuals at the school level, we will profit from a model
specification that can handle such omitted variable bias.
Level-one, within-school equation:
Gradeij = B0j + B1j*FIRSTij + B2j*SECONDij + Bk*� BACKGROUNDij + Rij (1)
The level-one, or within-school, equation estimates the grades for each pupil i within
each school j. B0j is the intercept (or average grade) for school j. B1j represents the gap in
grades between first generation immigrants and children with Swedish-born parents for school
j and B2j does the same for second generation immigrants. Thus, both the intercept and the
estimate of the grade gap between the groups are allowed to vary between schools. We also
include in the level-one model a vector of the individual pupils’ background characteristics.
Bk are fixed parameters for these background characteristics. Rij is the level-one random

variance, or each individual’s unique contribution to the outcome. The random variance is
assumed to be normally distributed.
Level-two, between-school equations:
B0j = G00 + G01*%FIRST + G02*%SECOND + G03*%WELFARE + G04*%DEGREE + U0j (2)
The first level-two, or between-school equation, estimates the variation in average
school grade levels (B0j). G00 is the intercept; G01 is the regression coefficient for the
proportion of first generation immigrant children in the school on average grades in school;
G02 is the corresponding regression coefficient for the proportion of second-generation
immigrants; G03 is the coefficient for the proportion of children with parents receiving social
welfare; G04 is the coefficient for the proportion of children with academic background. U0j is
the random variation in school results between schools.
Equation 2 (sometimes called a random intercept model) addresses the question to
what extent a school’s average grades are a function of characteristics of its pupils, but
implicitly assumes that slopes do not vary across schools. However, we also want to address
the question whether pupils of immigrant origin are most affected by ethnic density in their
schools – i.e, we want to fit a cross-level interaction. In Equation 3 (a random slope model),
the gap in grades between first-generation immigrants and the reference group of pupils with
at least one Swedish-born parent (B1j) is the outcome. G10 is the fictitious average gap in
grades between the reference group and first generation Swedish pupils in schools with no
such pupils, G11 is the regression coefficient for the effect of the proportion of first generation
pupils on the gap in grades, and U1j is the random variation between schools in grade gaps.
Equation 4 shows the same for the gap between second-generation immigrants and the
reference group (B2j).
B1j = G10 + G11* %FIRST + U1j (3)
B2j = G20 + G21* %SECOND + U2j (4)

Identifying effects of ethnic segregation
The problem of endogeneity, or population sorting, plagues studies of the influence of social
environment (neighborhoods, schools) on individual outcomes (see Manski 2000 for a general
discussion; Hanushek et al. 2003 applied to school effects; Dietz 2002 to neighborhood
effects). Normally, it is assumed that endogeneity causes an upward bias in estimates of
environmental effects, because unobserved (omitted) variables on the basis of which families
sort themselves to residential areas – such as economic resources or parental aspirations – are
related to children’s school success. In addition, identifying ethnic segregation effects at
school level is difficult because other school characteristics that are related to ethnic
segregation – such as the schools’ economic resources – are correlated with school
achievement.
We deal with omitted variable bias in various ways. First, as described above, we
control for a set of empirically crucial and well measured variables indicating individual
pupils’ background as well as the socioeconomic composition of schools. Second, we believe
that the problem of bias in the interaction between the proportion of immigrants in the school
and the dummy variable indicating the individual student’s immigrant status (Model 3 and 4)
in a model that includes the main effects of schools is relatively small.15 Third, we use pupils’
residential mobility history to control for population sorting. This addresses the argument of
15 Hanushek et al (2002) argue precisely that, in their case, the fact that the negative effect of racial
composition vary across minority groups suggests that differences in school quality are not responsible
for their results. This is a plausible interpretation, though certainly not water-proof: it is, for example,
quite possible that poor school quality affects those with less human capital and other resources in
their family of origin most.

population sorting head on, and provides an important – and almost unique – opportunity of
dealing with omitted variable bias using observables.16
Finally, we address the problem of unobserved school heterogeneity by applying what
is generally (particularly within econometrics) known as a school-fixed effects model. This is
done within the HLM framework by group-mean centering individual-level variables, i.e.,
expressing them as deviations from the school means. As all between-school variation is thus
removed, this model cannot estimate the main effect of immigrant density or any other school
attribute that is invariant between pupils within a school. But this model represents a powerful
test of hypotheses 3 and 4 because the interaction effects between ethnic density and
individual immigrant status are not biased due to omitted school level characteristics.17
16 Besides controlling for observables, there are three ways that researchers have tried to come to grip
with problems of population grouping. One is using instrumental variables (e.g., Evans, Oates and
Schwab 1992), re-estimating school-level variables via a measured variable that is strongly related to
these but unrelated to the error term. The problem of finding such an instrument is however
formidable and a common critique of this strategy (e.g., Duncan and Raudenbush 1999; Rivkin 2001).
Secondly, researchers have used a combination of individual and school-fixed effect models
(Hanushek et al 2002; 2003), which however put a lot of demand on data quite aside from
interpretative problems. A third strategy is to use experiments and quasi-experiments (e.g. the
Tennessee-experiment, residential relocation experiments, such as MTO [see Durlauf 2004 for a
critical review], and local quasi-experiments such as Winston and Zimmerman 2004). These studies
are important but likely to be exceptions. Experiments also have limitations: for ethical reasons it is
not possible to change a situation ‘for the worse’, so the consequences of the most common change –
increasing ethnic concentration – could hardly be studied that way.
17 As this model does not use between-group variation, there is no particular advantage in estimating it
in HLM. We estimated a fixed-effect model in Stata using dummy variables for schools and received
very similar results.
It should be noted that the attempt to reduce upward omitted variable bias by using
control variables or fixed effect models may under some circumstances introduce a downward
bias in estimates. This is because the control variables are endogenous to the extent that ethnic
segregation impact on our indicators of parents’ and households’ resources (cf. Duncan,
Connell and Klebanov 1997; Sampson et al. 2002). For example, if residential segregation
means that immigrants have less opportunities of getting a job and avoiding poverty (by
mechanisms outlined by Wilson 1987, for example), then controlling for (parental and school-
level) social welfare and unemployment will lead to an underestimation of the influence of
ethnic segregation. It is also likely that our school-fixed-effect model partials out differences
between schools that are consequences of ethnic segregation (e.g., if the most qualified
teachers avoid certain schools where there is a high concentration of immigrant pupils).
Estimates of segregation effects from models where these controls are applied will thus be
conservative and counterbalance the assumed upward bias introduced by population sorting.
RESULTS
Average grades
Table 2 gives results from four hierarchical linear models, estimating the effects of ethnic
concentration in school on average grades. Model 1 shows that the ethnic gap in grades is
twice as wide for first-generation immigrant pupils than for the second generation (0.39 of a
standard deviation as compared to 0.19).18 Model 2, in which ethnic concentration is
introduced as a predictor, reveals that grades are 0.54 standardized points lower in schools in
18 We also fitted models with a more detailed classification of immigrant origin (into Nordic, European
and Western, and non-European/Western regions). This showed, as expected, that the latter group fare
worse in terms of grades. However, using the detailed classification did not change the estimates of the
school-level variables, which is why we choose to present the simpler models.

which all pupils are immigrants than in schools with none. The corresponding figure for the
proportion of second-generation immigrants is -0.37.19
Table 2 about here
In model 3, we analyze whether the effects of ethnic density on average school grades
are due to the selection of pupils from poor social conditions to those schools that pupils with
immigrant background attend. We do that by adding individuals’ social background (level-
one) and schools’ social composition (level-two). The effects of these variables are in line
with results from previous research. Having parents with low qualifications, who are
unemployed, or on social welfare, are characteristics that all are associated with lower grades;
men and those with many siblings have lower grades too. Also when these variables are
accounted for, grades are higher in schools where more pupils have well-educated parents.
This indicates that school results are not only influenced by the pupil’s socioeconomic origin,
but also by that of his/her schoolmates. The result that this ‘positive’ context appears to be
more important than the ‘negative’ one, indicated by social benefits, is in line with previous
studies and supports the general idea of peer effects and positive externalities of parental
educational resources (cf. Brooks-Gunn et al. 1997). 20
19 It should be noted that we calculate out of the range of the data. There is no school in which all
pupils in the ninth grade are first- or second-generation immigrants.
20 We addressed the possibility that our results in Model 3 are biased due to the multicollinearity of the
school-level variables proportion social welfare and proportion immigrants, by running separate
models excluding one of these variables at a time. The only important change in the results was that
the proportion social welfare turned out to have a strongly negative effect on grades (-0.41) when the

What is of crucial interest is that when comparing Model 2 with Model 3, it turns out
that variables included in the latter model account for the whole individual-level gap in grades
between second-generation immigrants and pupils with Swedish-born parents (a result
consistent with Dryler 2001). They also account for the entire effect of the density of second-
generation immigrant pupils on average grades in schools. For those who immigrated
themselves the results are different. First, the ethnic gap in grades, though strongly reduced, is
still significant after controls. Second, the main effect on grades of the proportion of
immigrant pupils, while somewhat reduced, is still relatively strong under this model
specification (-0.41 standardized points).21
Next, we ask whether the grade disadvantage associated with high ethnic density in
schools is particularly marked for immigrant students. This is tested in Model 4 where we add
interaction terms between ethnic gaps in grades and ethnic density in schools. For pupils born
outside Sweden the interaction term is negative and significant, indicating that the ethnic gap
in school results increases with the density of immigrant pupils in school. While pupils in
general show lower grades in schools with many immigrants, this is then all the more
pronounced for immigrant pupils themselves. For second-generation immigrants the
corresponding interaction term is positive but not significant at conventional levels. Grades
proportion immigrants (first and second generation) was removed from the analysis. The effects of
proportion immigrants remained more or less the same when proportion social welfare was removed.
21 In an additional analysis we fitted Model 3 for only those students who live in nuclear families
(results not shown). The reason for this is that the influence of both parents’ resources on children’s
school progress may be less important when one of the parents does not live together with the child.
Moreover, we fitted Model 3 separately for ninth graders in 1998 and 1999 because the social
composition of ninth graders in the previous year may be less important for the results pertaining to
those studying one year later. The results of these additional analyses confirm our conclusions.

for these pupils are rather similar to those of pupils with Swedish-born parents (given
individuals’ social background and the composition of the schools they attend), irrespective of
the proportion of second-generation immigrant pupils in schools.
The results in Table 2 suggests that there is an effect of ethnic density on school
results. However, we have so far assumed linear effects and as explained it is plausible that
there is some threshold value where it emerges. We address this question by replacing the
metric measure of proportion of pupils born outside Sweden (using Model 3 of Table 2 as our
point of departure) with dummy variables. The result, displayed in Table 3, does indeed
suggest that there is a threshold: The effect of ethnic density on grades is weak in schools with
less than 40 per cent children born outside Sweden but beyond that point there is a fairly
strong negative marginal effect. This rather extreme form of segregation applies to 24 schools
or two per cent of all schools in our data, and very few pupils with Swedish-born parents go to
such schools (cf. Figure 2). However, it is not such an uncommon experience for immigrant
pupils: around fourteen per cent of all pupils born outside Sweden attend such segregated
schools.
Table 3 about here
Testing for robustness of the results
We address the issue of omitted variable bias by performing two additional analyses. First, a
common problem with model specifications such as ours is that parents who have high
educational aspirations for their children and who are able and willing to support them, move
out from disadvantaged areas (and vice versa). One straightforward way of addressing this
problem of population sorting is to control for the moves themselves. We managed to match

onto our data information on individuals’ residential moves between local areas22 and we then
constructed a variable measuring the difference in ethnic density between the residential area
before and after the relocation.23 We used the proportion of first generation immigrants,
because our previous results show these to be most important, and because we believe that
this is a characteristic of residential areas that is also sensed by families when they make
choices where to live. If a respondent has experienced several moves, we took the difference
between the first, origin, location and the current parish of destination (as selection of
residential areas often is made in steps, as in a housing-career model). The difference, which
is negative if someone moved to an area with less immigrant concentration and positive
22 The information is coded according to parishes, which are relatively small and often homogeneous
residential areas though more heterogeneous than schools and larger than the typical neighborhood
(the average number of people in a parish is 3,300 which is smaller than the average U.S. census tract,
for example). The data contain information on when the move occurred, the origin parish, and the
destination parish. No move is registered before the birth of the respondent (understandably but
regrettably), so we cannot take into account population sorting that occurred before that month for
native-born. For immigrants, the first information is on the parish of their first residential location in
Sweden. Moves then comprise the historical period 1982/83 to 1998/99 for native born (age 0 to 16)
and for immigrant pupils the (variable) year of immigration and 1998/99 (immigration age to 16).
23 The proportion of immigrants in a parish was calculated using the 1990 Census. It would have been
even more attractive to have this figure for the year when the move took place, as parishes may change
their relative proportion of immigrants, but this was not possible. Taking 1990 as the source year is
however a good compromise as the respondents were born 1982/83 and their grades stem from
1998/99.

otherwise, is entered as an individual-level covariate in our model.24 In addition, we include
the proportion of immigrants in the parish of origin (i.e., the parish of birth or, for immigrants,
the one upon arrival); and we also use a variable measuring how many moves a pupil has
made during childhood (within Sweden), as relocation has been shown to have a negative
effect on children’s educational attainment (Astone and McLanahan 1994). Descriptive
statistics on these three residential mobility variables are shown at the bottom of Table 1a.
Table 4 shows the results of adding them to two models of grades. For ease of presentation,
we leave out the individual-level control variables in the table, reporting only the effects of
ethnic concentration and sorting. Model 1 shows the estimates before controlling for sorting
(i.e., they replicate the effects from Table 2, Model 3).
Table 4 here
Table 4 reveals only relatively minor changes in the parameters of interest. As expected, the
proportion of immigrants in the residential area of origin has a negative impact on grades, as
has the number of times a child has moved. The sorting variable has an unexpected positive
sign but is not significant at the 5%-level. One reason that this variable is not more important
is that most residential moves are within the same parish or between parishes of rather similar
ethnic concentration (cf. Table 1a). The average positive effect turns out to be a function of a
more complex underlying pattern where the assumptions of population sorting is borne out for
24 This follows from our expectation that the variables proxy for different resources and aspirations
among families, though particularly the proportion immigrants at the parish of birth may also have an
influence via social interaction.

immigrants, but not for those with Swedish-born parents.25 We tried different model
specifications to account for these types of interaction effects, but none changed the
parameters of greatest interest to us, namely those representing the effect of ethnic density in
schools on grades. Our conclusion is that our results are robust to population sorting that takes
place via domestic residential moves during childhood.
Next, we address the potential problem that the ethnic segregation effect is partly an
effect of differences in school quality between areas with more and less immigrants. We
replicate the analysis of school grades without school-level variables and with individual-level
variables school-mean centered. By doing this, we control for all characteristics of the school
and of the pupils that do not vary across pupils within the school (such as unmeasured school
resources, teacher quality etc.). Naturally, this means that we cannot estimate the main effect
of immigrant density or any other school-level variable. However, we are able to estimate the
interaction effects between ethnic density and individual immigrant status. This (school-fixed-
effects) model, presented in Table 5, gives further support to our previous results, as reported
in Table 2, Model 4. The interaction effects are somewhat weaker in the fixed-effects model (-
0.21 as compared to -0.24), but the conclusions are the same. The grades of second-generation
immigrants (relative to pupils of Swedish descent) do not seem to be influenced by their
concentration to certain schools, while first generation immigrants lose more than those of
native origin by attending schools with a high concentration of immigrant pupils. The latter
25 It is possible that population sorting that occurred before the birth of those with Swedish-born
parents can explain the difference between movers and stayers. We would ourselves put more weight
on the results for immigrants because we capture population sorting more accurately for them. This is
the case particularly as immigrants did not choose their initial residential area during most of the years
we cover (1984-1994); instead, they were allocated to one by the immigration authorities, a process
that approaches random assignment (Edin, Fredriksson, and Åslund 2003).

effect, it should be noted, is fairly weak: going from a school with few immigrants to one of
the most segregated schools would, according to our model, make immigrant pupils lag a
tenth of a standard deviation more behind their fellow pupils of Swedish origin.
Table 5 here
All in all, our analyses in this section support the main results we attained above. We
cannot, on the basis of these tests, rule out that our estimates of the effect of ethnic
concentration on school results are biased because of omitted variables, but it would seem
rather unlikely. At any rate, until further data become available to researchers, our results
provide, to our knowledge, the best estimates for the effects of ethnic concentration in schools
on educational achievement.
CONCLUSIONS
In Sweden, like in many Western countries, recent large-scale immigration in combination
with substantial ethnic spatial segregation have raised concerns about the opportunities of
children in minority areas. We ask whether the proportion immigrants in a school affects
pupils’ grades, using a unique data-set, comprising 188,000 16-year old pupils from 1,043
comprehensive schools graduating from the ninth grade in 1998 and 1999.
Multilevel analyses suggest that ethnic density in schools has a negative effect on
grades which is not confined to, but most preponderant for immigrant pupils. We find a
threshold effect indicating that ethnic densities up to 40 per cent have little impact on grades,
while attending a school with higher concentration of immigrant pupils is connected with
around a fifth of a standard deviation’s reduction in grades. This is a moderately strong effect
which concerns rather few schools but nevertheless affects fourteen per cent of immigrant
children.
Our data offer unusually good opportunities of testing how robust our results are. To
account for population sorting, we use longitudinal information on pupils’ residential moves
from their birth, and to account for unobserved school heterogeneity we apply a school-fixed-
effects model. These tests do not change the estimates much, suggesting that omitted variables
do not bias our estimates (and there is a risk that we underestimate the segregation effect by
controlling for some potentially endogenous variables). Thus, we concur with the few other
studies that have addressed the issue of bias in estimates of ethnic/race composition of schools
(especially Cutler and Glaeser 1997; Hanushek et al 2002; Hoxby 2000), that such context
does matter for pupil outcomes.
What are the policy implications of our findings? Our interpretation of the results is
that there is both a general cost of ethnic segregation in terms of lower average achievement
as well as a specific cost for immigrant children. Especially interesting from a policy point of
view is that ethnic concentration appears to have noteworthy negative effects only at
relatively high levels of segregation. This suggests that desegregation policies would lead
both to more efficient schools and to less educational inequality; and that counter-acting the
most extreme forms of segregation would probably be enough to see positive results.
Although segregation is of importance, a large proportion of the variation in school
achievement remains between individuals within schools, not between schools: If we want to
raise overall standards and reduce inequality between children of immigrant and native origin
in school grades, policies for increasing immigrant parents’ human capital and improving
their economic and labor market situation may have more potential than combating
segregation.
Can our results on ethnic segregation in Sweden be comfortably exported to the
U.S.A. and other nations? The generality of the presumed processes behind ethnic segregation
effects – such as ethnic disadvantage and immigrant language problems in combination with
collective socialization and peer influence – suggests that this is the case. Also, the size of the
immigrant population, the trends in immigration, as well as the substantial ethnic segregation
in Sweden appear to be comparable to the U.S.A. and several other Western countries.
However, Swedish welfare state policies counteract minority group poverty, and much
governmental and municipality funds are invested in minority areas to keep them in good
shape and their schools and social institutions on par with those in other areas. Thus, we
would expect that ethnic segregation estimates from Swedish data provide something of a
lower boundary. We can then speculate that ethnic segregation effects on school results may
be of quite substantial magnitude without financial and other support to ethnic minorities and
neighborhoods where they are concentrated, and that residential segregation is likely to harm
human capital development in many Western countries.
REFERENCES
Ainsworth, James W. 2002. “Why Does It Take a Village? The Mediation of Neighborhood
Effects on Educational Achievement.” Social Forces 81:117-52.
Alba, Richard, and Victor Knee. 2003. Remaking the American Mainstream. Assimilation and
Contemporary Immigration. Cambridge, Mass.: Harvard University Press.
Andersson, Roger. 1998. ”Socio-spatial Dynamics: Ethnic Divisions of Mobility and Housing
in post-Palme Sweden.” Urban Studies 35:397-428.
Andersson, Roger. 2000. “Etnisk och socioekonomisk segregering i Sverige 1990-1998.” Pp.
223-66 in Välfärdens förutsättningar (SOU 2000:37), edited by Johan Fritzell.
Stockholm: Fritzes.
Arai, Mahmood, and Roger Vilhelmsson. 2004. “Unemployment-Risk Differentials Between
Immigrant and Native Workers in Sweden.” Industrial Relations 43:690-98.
Astone, N. M., and S. S. McLanahan. 1994. “Family Structure, Residential Mobility, and
School Dropout: A Research Note.” Demography 31:5-584.
Björklund Anders, Eriksson Tor, Jäntti Markus, Raaum O, Österbacka E. 2002. “Brother
Correlations in Earnings in Denmark, Finland, Norway and Sweden Compared to the
United States.” Journal of Population Economics 15:757-72.
Boozer, Michael A., Alan B. Krueger, Shari Wolkon. 1992. “Race and school quality since
Brown v. Board of Education.” Brooking Papers on Economic Activity: Microeconomics:
1992:269-326.
Borjas, George J. 1995. “Ethnicity, Neighborhoods, and Human-Capital Externalities.”
American Economic Review 85:365-90.
Bradbury, Bruce and Markus Jäntti (2001). “Child poverty across the industrialized world:
evidence from the Luxembourg Income Study.” Pp. 11-32 in Koen Vleminckx och
Timothy M. Smeeding (eds.), Child Well-Being, Child Poverty and Child Policy in
Modern Nations. Bristol: The Policy Press.
Breen, Richard and Jan O. Jonsson. 2005. “Inequality of Opportunity in Comparative
Perspective: Recent Research on Educational Attainment and Social Mobility.” Annual
Review of Sociology 31:223-44.
Breen, Richard, and Cecilia Garcia-Peñalosa. 2002. “Bayesian Learning and Gender
Segregation.” Journal of Labor Economics 20:899-922.
Brooks-Gunn, Jeanne, Greg J. Duncan, and J. Lawrence Aber, eds. 1997. Neighborhood
Poverty. Volume 1. Context and consequences for children. New York: Russell Sage.
Bryk, Anthony S., and Stephen W. Raudenbush. 1992. Hierarchical Linear Models:
Applications and Data Analysis Methods. Newbury Park, CA: Sage.
Charles, Camille Zubrinsky. 2003. “The Dynamics of Racial Residential Segregation.”
Annual Review of Sociology 29:167-207.
Coleman, James S., and Thomas Hoffer. 1987. Public and Private High Schools. The Effect of
Communities. New York: Basic Books.
Crane, Jonathan. 1991. “The Epidemic Theory of Ghettos and Neighborhood Effects of
Dropping Out and Teenage Childbearing.” American Journal of Sociology 96:1226-59.
Crowder, Kyle, and Scott J. South. 2003. “Neighborhood distress and school dropout: the
variable significance of community context.” Social Science Research 32:659-98.
Cutler, David M. and Edward L. Glaeser. 1997. “Are Ghettos Good or Bad?” Quarterly
Journal of Economics 112: 827-72.
Dietz, Robert D. 2002. “The estimation of neighborhood effects in the social sciences: An
interdisciplinary approach.” Social Science Research 31:539-75.

Dryler, Helen. 2001. “Etnisk segregation i skolan.” Pp. 319-55 in SOU 2001:57. Stockholm:
Fritzes.
Duncan, Greg J., and Stephen W. Raudenbush. 1999. “Assessing the Effects of Context in
Studies of Child and Youth Development.” Educational Psychologist 34:29-41.
Duncan, Greg J., James P. Connell, and Pamela K. Klebanov. 1997. ”Conceptual and
Methodological Issues in Estimating Causal Effects of Neighborhoods and Family
Conditions on Individual Development.” Pp. 219-50 in Neighborhood Poverty. Volume
1. Context and Consequences for Children, edited by Jeanne Brooks-Gunn, Greg J.
Duncan, and J. Lawrence Aber. New York: Russell Sage.
Durlauf, Steven N. 2004. “Neighborhood Effects.” in Handbook of Regional and Urban
Economics, vol. 4, edited by Vernon Henderson and Jacques-François Thisse.
Amsterdam: North Holland
Edin, Per-Anders, Peter Fredriksson, and Olof Åslund. 2003. ”Ethnic enclaves and the
economic success of immigrants – evidence from a natural experiment.” Quarterly
Journal of Economics 118:329-57.
Ekberg, Jan. 1999. “Immigration and the public sector: Income effects for the native
population in Sweden.” Journal of Population Economics 12:411-30.
Ellen, Ingrid Gould, Katherine O´Regan, Amy Ellen Schwartz, and Leanna Stiefel. 2002.
”Immigrant Children and New York City Schools: Segregation and Its Consequences.”
Brooking-Wharton Papers on Urban Affairs, pp. 183-214.
Erikson, Robert. 1994. ”Spelar valet av skola någon roll?” Pp. 132-71 in Sorteringen i skolan
edited by Robert Erikson and Jan O. Jonsson. Stockholm: Carlssons.
Erikson, Robert, and Jan O. Jonsson, eds. 1996. Can Education be Equalized? Boulder, Co:
Westview Press.
Evans, William N., Wallace E. Oates, and Robert M. Schwab. 1992. “Measuring Peer Group
Effects: A Study of Teenage Behavior.” The Journal of Political Economy 100:966-91.
Falk, R. Frank, Charles F. Cortese, and Jack Cohen. 1978. “Utilizing Standardized Indices of
Residential Segregation: Comment on Winship.” Social Forces 57:713-16.
Franzén, Eva. 2003. I välfärdsstatens väntrum: studier av invandrares socialbidragstagande.
Göteborgs universitet: Institutionen för socialt arbete.
Garner, Catherine L., and Stephen W. Raudenbush. 1991. “Neighborhood Effects on
Educational Attainment: A Multilevel Analysis.” Sociology of Education 64:251-62.

Goyette, Kimberly, and Yu Xie. 1999. “Educational Expectations of Asian American Youths:
Determinants and Ethnic Differences.” Sociology of Education 72:22-36.
Grogger, Jeff T. 1996. “Does school quality explain the recent black/white trend?” Journal of
Labor Economics 14:231-53.
Grusky, David B., and Maria Charles. 1998. “The Past, Present, and Future of Sex
Segregation Methodology.” Demography 35:497-504.
Gustafsson, Jan-Eric. 2003. “What do we know about effects of school resources on
educational results?” Swedish Economic Policy Review 10:79-110.
Hanushek, Eric A. 2002. “Evidence, policy, and the class size debate.” Pp. 37-65 in The Class
Size Debate, edited by Lawrence Mishel and Richard Rothstein. Washington D.C.:
Economic Policy Institute.
Hanushek, Eric A., John F. Kain, and Steven G. Rivkin. 2002. “New Evidence about Brown
vs. Board of Education: The Complex Effects of School Racial Composition on
Achievement.” Working Paper 8741, National Bureau of Economic Research.
Hanushek, Eric A., John F. Kain, Jacob M. Markman, and Steven G. Rivkin. 2003. “Does
Peer Ability Affect Student Achievement?” Journal of Applied Econometrics 18:527-
544.
Hoxby, Caroline M. 2000. “Peer effects in the classroom: Learning from gender and race
variation.” Working Paper 7867, National Bureau of Economic Research.
Jencks, Christopher and Susan E. Mayer. 1990. “The Social Consequences of Growing up in a
Poor Neighborhood.” Pp. 111-86 in Inner-City Poverty in the United States, edited by L.
Lynn and M. McGreary. Washington, DC: National Academic Press.
Jensen, Leif. 2001. “The Demographic Diversity of Immigrants and Their Children.” Pp. 21-
56 in Rubén G. Rumbaut and Alejandro Portes (eds.), Ethnicities. Children of
Immigrants in America. Berkeley. Cal.: University of California Press.
Kjellman, Ann-Christin. 2001. Hurra för valfriheten – men vad ska vi välja? Studies in
Educational Sciences 34. Stockholm: HLS Förlag.
Krueger, Alan B. 2002. “Understanding the magnitude and effect of class size on student
achievement.” Pp. 7-35 in The Class Size Debate, edited by Lawrence Mishel and
Richard Rothstein. Washington D.C.: Economic Policy Institute.
Lazear, E. P. 2001. “Educational production.” Quarterly Journal of Economics 116:777-803.
Lee, Jennifer and Frank D. Bean. 2004. “America’s Changing Color Lines: Immigration,
Race/Ethnicity, and Multiracial Identification.” Annual Review of Sociology 30:221-42.

Lee, Valerie E., and Anthony S. Bryk. 1989. “A Multilevel Model of the Social Distribution
of High School Achievement.” Sociology of Education 62:172-92.
Manski, Charles F. 2000. “Economic analysis of social interactions.” Journal of Economic
Perspectives 14:115-36.
Moody, James. 2001. “Race, School Integration, and Friendship Segregation in America.”
American Journal of Sociology 107:679-716.
Mortimer, Peter, Pamela Sammons, Louise Stoll, David Lewis, and Russel J. Ecob. 1988.
School Matters: The Junior Years. Wells: Open Books.
Musterd, Sako. 2005. “Social and Ethnic Segregation in Europe: Levels, Causes, and Effects.”
Journal of Urban Affairs 27:331-48.
OECD. 2003. Trends in International Migration. SOPEMI 2002. Paris: OECD.
Portes, Alejandro and Rubén G. Rumbaud. 2001. Legacies: The Story of the Immigrant
Second Generation. Berkeley: University of California Press.
Raudenbush, Stephen W., Anthony S. Bryk, Yuk Fai Cheong, and Richard T. Congdon. 2000.
HLM5: Hierarchical Linear and Nonlinear Modeling. Chicago: Scientific Software
International.
Reardon, Sean F. and Glenn Firebough. 2002. “Response: Segregation and Social Distance: A
Generalized Approach to Segregation Measurement.” Sociological Methodology 32:85-
101.
Rivkin, Steven G. 2001. “Tiebout Sorting, Aggregation, and the Estimation of Peer Group
Effects.” Economics of Education Review 20:201-209.
Robertson, Donald, and James Symons. 2003. “Self-selection in the state school system.”
Education Economics 11:259-73.
Roscigno, Vincent J. 1998. “Race and the Reproduction of Educational Disadvantage.” Social
Forces 76:1033-60.
Roscigno, Vincent J., Donald Tomaskovic-Devey, and Martha Crowley. 2006. “Education
and the Inequalities of Place.” Social Forces 84:2121-45.
Sampson, Robert J., Jeffery D. Morenoff, and Thomas Gannon-Rowley. 2002. “Assessing
‘Neighborhood Effects’: Social Processes and New Directions in Research.” Annual
Review of Sociology 28:443-78.
Sanders, Jimy M. 2002. ”Ethnic Boundaries and Identity in Plural Societies.” Annual Review
of Sociology 28:327-57.
Scheerens, Jaap and Roel Bosker. 1997. The Foundations of Educational Effectiveness.
Oxford: Elsevier.
Schneider, Barbara and James S. Coleman. 1993. Parents, their Children, and Schools.
Boulder, Col.: Westview.
Similä, Matti. 1994. “Andra generationens invandrare i den svenska skolan.” Pp. 226-63 in
Sorteringen i skolan, edited by Robert Erikson and Jan O. Jonsson. Stockholm: Carlsson.
Solon, Gary. 2002. “Cross-Country Differences in Intergenerational Earnings Mobility.”
Journal of Economic Perspectives 16:59-66.
Statistics Sweden. 1988. Svensk utbildningsnomenklatur (SUN). Del 1. Systematisk version.
Meddelande i samordningsfrågor 1988:4. Stockholm: Statistics Sweden.
Statistics Sweden. 2004. Statistisk Årsbok 2004 (Statistic Yearbook 2004). Stockholm: SCB.
Willms, Douglas J. 1986. “Social Class Segregation and its Relationship to Pupils’
Examination Results in Scotland.” American Sociological Review 51:224-41.
Wilson, William J. 1987. The Truly Disadvantaged: The Inner City, the Underclass, and
Public Policy. Chicago: University of Chicago Press.
Winston, Gordon C., and David J. Zimmerman. 2004. “Peer Effects in Higher Education.” Pp.
395-421 in College Choices: The Economics of Where to Go, When to Go and How to
Pay for It, edited by Caroline Hoxby. Chicago: University of Chicago Press for the
NBER-C.

Figure 1. The proportion of immigrant pupils (having no Swedish-born parent) found in schools with different immigrant densities. Figure 2. The proportion of “native” pupils (Swedish-born with Swedish-born parents) found in schools with different immigrant densities.

TABLE 1a: Descriptive Statistics for Individual-level Variables.
Mean Std. dev. Min. Max. N
Individual-level variables:
Grades 199.369 60.17 0 320 188,724
Standardized grades 0.0 1.0 -3.3 2.0
Immigrant background 0.125 0.33 0 1 188,617
First generation 0.078 0.27 0 1 188,617
Second generation 0.046 0.21 0 1 188,617
Women 0.486 0.50 0 1 188,724
Sibship size 2.087 1.44 0 17 188,724
Experience of unemployment 0.230 0.42 0 1 188,283
Experience of social welfare 0.110 0.31 0 1 188,278
Parents’ Short compulsory 0.030 0.17 0 1 187,743
Education Compulsory 0.084 0.28 0 1
Short secondary 0.333 0.47 0 1
Secondary 0.137 0.34 0 1
Lower tertiary 0.193 0.39 0 1
University degree 0.208 0.41 0 1
Postgraduate 0.016 0.13 0 1
Family Intact family 0.661 0.47 0 1 188,724
Type Reconstituted family 0.072 0.26 0 1
Single parent 0.251 0.43 0 1
Alone, institution or other adults
0.016 0.12 0 1
Proportion immigrants at place of birth or arrival in Sweden
0.028 0.034 0 0.224 189,510
Difference current-origin residence -0.003 0.030 -0.224 0.224 188,743
Number of residential moves 1.991 2.266 0 33 188,743

TABLE 1b: Descriptive Statistics for School-level Variables.
Mean Std. dev. Min. Max. N
School-level variables:
Proportion First generation immigrants 0.075 0.10 0 0.87 1,043
Second generation immigrants 0.045 0.07 0 0.62 1,043
Immigrant background (1st+2nd) 0.120 0.15 0 1 1,043
Parents university degree 0.209 0.12 0.01 0.79 1,043
Parents on social welfare 0.110 0.08 0.00 0.79 1,043
Average Grade of the school 198.88 15.03 121.26 253.41 1,043
Standardized grade -0.01 0.25 -1.30 0.90 1,043
Proportion qualified 0.907 0.07 0.48 1 1,043
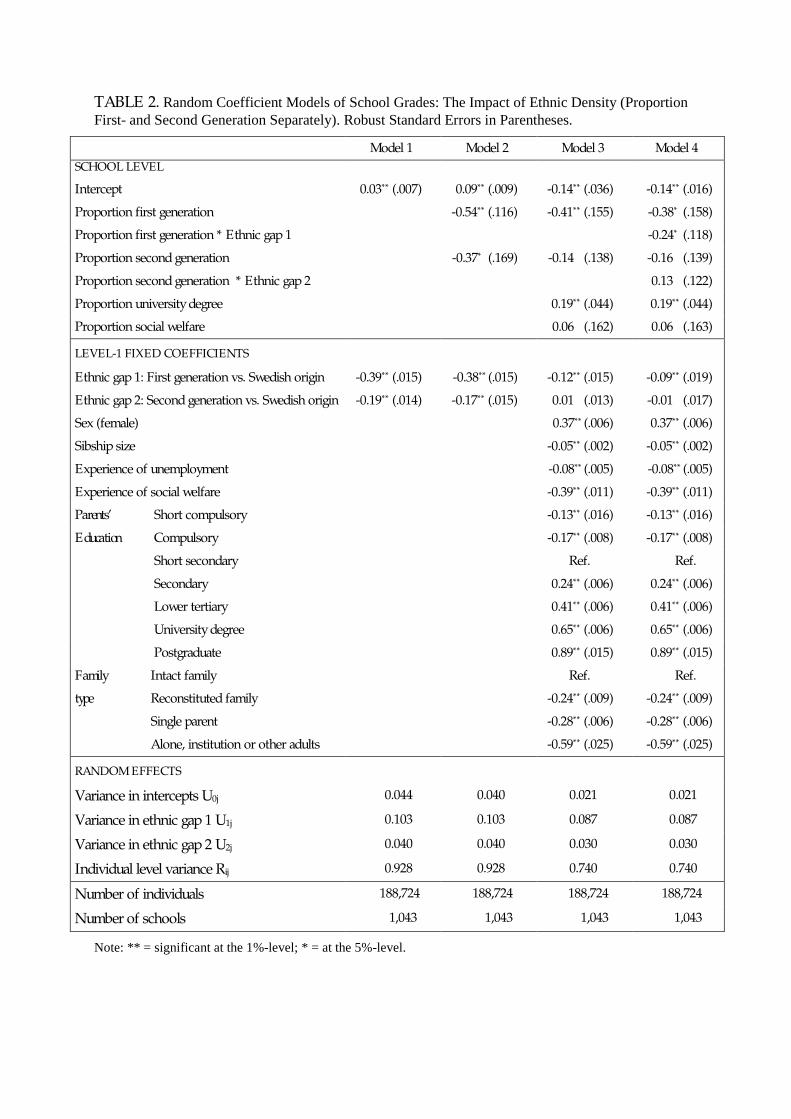
TABLE 2. Random Coefficient Models of School Grades: The Impact of Ethnic Density (Proportion First- and Second Generation Separately). Robust Standard Errors in Parentheses.
Model 1 Model 2 Model 3 Model 4
SCHOOL LEVEL
Intercept 0.03** (.007) 0.09** (.009) -0.14** (.036) -0.14** (.016)
Proportion first generation -0.54** (.116) -0.41** (.155) -0.38* (.158)
Proportion first generation * Ethnic gap 1 -0.24* (.118)
Proportion second generation -0.37* (.169) -0.14 (.138) -0.16 (.139)
Proportion second generation * Ethnic gap 2 0.13 (.122)
Proportion university degree 0.19** (.044) 0.19** (.044)
Proportion social welfare 0.06 (.162) 0.06 (.163)
LEVEL-1 FIXED COEFFICIENTS
Ethnic gap 1: First generation vs. Swedish origin -0.39** (.015) -0.38** (.015) -0.12** (.015) -0.09** (.019)
Ethnic gap 2: Second generation vs. Swedish origin -0.19** (.014) -0.17** (.015) 0.01 (.013) -0.01 (.017)
Sex (female) 0.37** (.006) 0.37** (.006)
Sibship size -0.05** (.002) -0.05** (.002)
Experience of unemployment -0.08** (.005) -0.08** (.005)
Experience of social welfare -0.39** (.011) -0.39** (.011)
Parents’ Short compulsory -0.13** (.016) -0.13** (.016)
Education Compulsory -0.17** (.008) -0.17** (.008)
Short secondary Ref. Ref.
Secondary 0.24** (.006) 0.24** (.006)
Lower tertiary 0.41** (.006) 0.41** (.006)
University degree 0.65** (.006) 0.65** (.006)
Postgraduate 0.89** (.015) 0.89** (.015)
Family Intact family Ref. Ref.
type Reconstituted family -0.24** (.009) -0.24** (.009)
Single parent -0.28** (.006) -0.28** (.006)
Alone, institution or other adults -0.59** (.025) -0.59** (.025)
RANDOM EFFECTS
Variance in intercepts U0j 0.044 0.040 0.021 0.021
Variance in ethnic gap 1 U1j 0.103 0.103 0.087 0.087
Variance in ethnic gap 2 U2j 0.040 0.040 0.030 0.030
Individual level variance Rij 0.928 0.928 0.740 0.740
Number of individuals 188,724 188,724 188,724 188,724
Number of schools 1,043 1,043 1,043 1,043
Note: ** = significant at the 1%-level; * = at the 5%-level.

TABLE 3. Random Coefficient Models of School Grades: The Impact of Ethnic Density (Density Variable for First Generation Immigrants Transformed to a Series of Dummy Variables). Robust Standard Errors in Parentheses.
SCHOOL LEVEL b-coefficient Standard error
Intercept -0.149** (0.017)
Proportion first 0%-10% Ref.
Generation 11%-20% -0.078** (0.017)
Immigrants 21%-30% -0.067 (0.036)
31%-40% -0.057 (0.062)
41%-50% -0.231* (0.118)
51% or higher -0.241* (0.117)
Proportion university degree 0.183** (0.043)
Proportion social welfare -0.014 (0.145)
LEVEL-1 FIXED COEFFICIENTS Same as in Table 2a, Model 3
Ethnic gap 1: First generation vs. Swedish origin
-0.123** (0.014)
Ethnic gap 2: Second generation vs. Swedish origin
0.007 0.013
RANDOM EFFECTS
Variance in intercepts U0j 0.021
Variance in ethnic gap 1 U1j 0.087
Variance in ethnic gap 2 U2j 0.029
Individual level variance Rij 0.740
Number of individuals 188,724
Number of schools 1,043
Note: ** = significant at the 1%-level; * = at the 5%-level.

TABLE 4. Random Coefficient Models of School Grades, Controlling for Ethnic Density at the Place of Residence (Parish) at Birth, or Arrival in Sweden, and for Residential Mobility. Robust Standard Errors in Parentheses.
School grades
Model 1 Model 2 SCHOOL LEVEL
Intercept -0.14** (.036) -0.01** (.017)
Proportion first generation -0.41** (.155) -0.40** (.153)
Proportion second generation -0.14 (.138) -0.06 (.144)
Proportion university degree 0.19** (.044) 0.24** (.044)
Proportion social welfare 0.06 (.162) 0.09 (.160)
LEVEL-1 FIXED COEFFICIENTS
Controls same as in Table 2a, Model 3
Proportion immigrants in the parish of origin -0.53** (.169)
Difference: % immigrants in parish of origin minus % immigrants in parish of destination
0.26 (.151)
Number of moves -0.04** (.001)
RANDOM EFFECTS
Variance in intercepts U0j 0.021 0.020
Variance in ethnic gap 1 U1j 0.087 0.091
Variance in ethnic gap 2 U2j 0.030 0.031
Individual level variance Rij 0.740 0.737
Number of individuals 188,724 188,724
Number of schools 1,043 1,043
Note: ** = significant at the 1%-level; * = at the 5%-level.

TABLE 5. School Fixed Effects Model of School Grades. The Impact of Ethnic Density (Proportion First- and Second Generation Immigrants Separately) on Ethnic Gap in Grades. Robust Standard Errors in Parentheses.
b-coefficient Standard error
Intercept -0.01 (0.008)
Ethnic gap 1: First generation vs. Swedish origin -0.13** (0.019)
Proportion first generation * Ethnic gap 1 -0.21 (0.118)
Ethnic gap 2: Second generation vs. Swedish origin -0.03 (0.018)
Proportion second generation * Ethnic gap 2 0.05 (0.136)
Other individual-level coefficients same as in Table 2
Number of individuals 188,724
Number of schools 1,043
Note: ** = significant at the 1%-level; * = at the 5%-level.

APPENDIX TABLE A1. Geographical origin of first generation immigrant pupils who left Swedish public comprehensive schools in 1998-99. Region of origin and the ten largest sending countries.
Region of origin % Largest sending countries %
North and West Europe 21 Finland
15
East and South Europe 30 Bosnia-Herzegovina Poland Yugoslavia (former)
7 5 12
Outside Europe 49 Chile Iran Iraq Lebanon Syria Turkey
5 10 5 4 3 8
Other nationalities 26
Sum 100 Sum 100
Note: Immigrants from USA, Canada, Australia and New Zeeland are classified as ‘North and West Europe’. TABLE A2. Bivariate correlations (Pearson’s r) between ethnic density (proportion of first-generation immigrants, second generation immigrants, and these together) and average grades, proportion parents with university degree, and on social welfare, respectively.
Correlation with
Average grades % university degree
% on social welfare
% first generation immigrants -0.466 -0.055 0.852
% second generation immigrants -0.372 -0.117 0.517
% first- plus second gen. imm. -0.477 -0.090 0.798
N 1,043 1,043 1,043