Ethnic Concentration and Bank Use in Immigrant...
22
Ethnic Concentration and Bank Use in Immigrant Communities Sarah Bohn* and Sarah Pearlman{ Despite the many benefits of bank use, large portions of the U.S. population remain unbanked. One of the largest is immigrants, where the incidence of being unbanked is over 13% higher than among natives in 2001. We document growth in the nativity gap in bank use over time. We also test the importance of immigrant enclaves, defined as areas with high concentrations of immigrants from the same region, in explaining the increasing differential in bank use. Combining data from the Survey of Income and Program Participation, Census, and FDIC we find that immigrants living in enclaves are significantly less likely to have a bank account. We take steps to isolate one particular channel through which this might operate: the use of informal financial services provided by co-ethnics in enclaves. The results suggest that demand-side preferences may have power in explaining the persistence of the nativity gap in bank use in the United States. JEL Classification: G21, J10 1. Introduction Despite the prevalence and expansion of bank use in the United States, large portions of the U.S. population remain unbanked (Rhine, Greene, and Toussaint-Comeau 2006). One of the largest is immigrants, where the incidence of being unbanked is over 13% higher than among natives. 1 Financial institutions confer many benefits to their users, including providing safe and low-cost savings instruments, and the means to increase investment in a home or business. Without formal banking relationships it is more difficult for households to acquire financial assets, and researchers and policymakers are concerned that this may inhibit the wealth accumulation of unbanked households. For immigrant households, this may have long- term impacts if nonparticipation in the formal financial sector inhibits their economic success and slows their incorporation into the American economy (Bernanke 2004). Given concerns over economic assimilation and bank use, several recent articles have explored the determinants of unbanked status among immigrants. Among other factors, education, income, wealth, family size, and institutional quality in the source region are all found to be correlated with bank use (Osili and Paulson 2006; Rhine and Greene 2006; Paulson and Rhine 2008). One factor that has been mentioned but not specifically explored, however, is the * Public Policy Institute of California, 500 Washington Street, Suite 600, San Francisco, CA 94111, USA; E-mail [email protected]. { Vassar College, 124 Raymond Avenue, Box 497, Poughkeepsie, NY 12603, USA; E-mail sapearlman@vassar. edu; corresponding author. The authors are grateful to participants at the Southern Economic Association and the Association for Public Policy Analysis and Management annual meetings, two anonymous referees, and seminar participants at Wesleyan University, Vassar College, and Amherst College for comments. Received September 2010; accepted May 2012. 1 Author’s calculations from the 2001 Survey of Income and Program Participation (SIPP). Southern Economic Journal 2013, 79(4), 864–885 DOI: 10.4284/0038-4038-2010.245 864 E Southern Economic Association, 2013
Transcript of Ethnic Concentration and Bank Use in Immigrant...
Ethnic Concentration and Bank Use inImmigrant Communities
Sarah Bohn* and Sarah Pearlman{
Despite the many benefits of bank use, large portions of the U.S. population remain unbanked.One of the largest is immigrants, where the incidence of being unbanked is over 13% higher thanamong natives in 2001. We document growth in the nativity gap in bank use over time. We alsotest the importance of immigrant enclaves, defined as areas with high concentrations ofimmigrants from the same region, in explaining the increasing differential in bank use. Combiningdata from the Survey of Income and Program Participation, Census, and FDIC we find thatimmigrants living in enclaves are significantly less likely to have a bank account. We take steps toisolate one particular channel through which this might operate: the use of informal financialservices provided by co-ethnics in enclaves. The results suggest that demand-side preferences mayhave power in explaining the persistence of the nativity gap in bank use in the United States.
JEL Classification: G21, J10
1. Introduction
Despite the prevalence and expansion of bank use in the United States, large portions of
the U.S. population remain unbanked (Rhine, Greene, and Toussaint-Comeau 2006). One of
the largest is immigrants, where the incidence of being unbanked is over 13% higher than
among natives.1 Financial institutions confer many benefits to their users, including providing
safe and low-cost savings instruments, and the means to increase investment in a home or
business. Without formal banking relationships it is more difficult for households to acquire
financial assets, and researchers and policymakers are concerned that this may inhibit the
wealth accumulation of unbanked households. For immigrant households, this may have long-
term impacts if nonparticipation in the formal financial sector inhibits their economic success
and slows their incorporation into the American economy (Bernanke 2004).
Given concerns over economic assimilation and bank use, several recent articles have
explored the determinants of unbanked status among immigrants. Among other factors,
education, income, wealth, family size, and institutional quality in the source region are all
found to be correlated with bank use (Osili and Paulson 2006; Rhine and Greene 2006; Paulson
and Rhine 2008). One factor that has been mentioned but not specifically explored, however, is the
* Public Policy Institute of California, 500 Washington Street, Suite 600, San Francisco, CA 94111, USA; E-mail
{ Vassar College, 124 Raymond Avenue, Box 497, Poughkeepsie, NY 12603, USA; E-mail sapearlman@vassar.
edu; corresponding author.
The authors are grateful to participants at the Southern Economic Association and the Association for Public
Policy Analysis and Management annual meetings, two anonymous referees, and seminar participants at Wesleyan
University, Vassar College, and Amherst College for comments.
Received September 2010; accepted May 2012.1 Author’s calculations from the 2001 Survey of Income and Program Participation (SIPP).
Southern Economic Journal 2013, 79(4), 864–885DOI: 10.4284/0038-4038-2010.245
864 E Southern Economic Association, 2013

concentration of immigrants from the same source region, or residency in an immigrant enclave.
Theoretically enclaves can impact bank use through multiple, competing channels. On the one
hand, enclaves provide a network of co-ethnics through which immigrants may access informal
financial services, thereby decreasing demand for a bank. Indeed, there are numerous case studies
documenting the use of informal financial instruments in U.S. immigrant communities (Light and
Deng 1995; Bond and Townsend 1996). On the other hand, enclaves may provide residents with
access to information networks through which they may learn about banking services or job
opportunities, thereby increasing their income and, potentially, their acquisition of language skills
or legal status. These factors, in turn, would increase demand for banks. These compensating
factors yield an ambiguous prediction on the direction of the enclave effect on being banked. Thus
the overall impact of enclaves on immigrant bank use remains an open empirical question.
To identify a relationship between enclaves and bank use we exploit detailed household
financial behavior information from the Survey of Income and Program Participation (SIPP),
the only large-scale data set that has information on immigrant status, location, and bank use.
We use the 1990, 1996, and 2001 waves of the SIPP and find that the nativity gap in bank use—
between native-born and foreign-born households—has actually grown over time, from 8% in
1990 to 13.8% in 2001. Furthermore, a cursory look at the data, shown in Figure 1, suggests
there is a negative correlation between immigrant bank use and the concentration of
immigrants in a metropolitan statistical area (MSA). In this figure each circle represents
an MSA, charted based on the immigrant concentration (from Census data) and average
household bank use (based on SIPP). The correlation between immigrant concentration
and immigrant bank use is consistently negative. No similar correlation exists for native
households, except in 1990. These correlations, while unconditional, suggest that immigrant
concentrations may differentially impact immigrant bank use relative to that of natives.
Figure 1. Average Bank Use by MSA and Immigrant Concentration
Caption Slope coefficients & standard errors: Natives: 1990 2.23 (.10)**, 1996 .04 (.11), 2001 .08 (.11);
Immigrants: 1990 2.74 (.34)*, 1996 2.97 (.22)***, 2001 2.67 (.29)** Note: Authors’ calculations from SIPP
1990, 1996, and 2001 (household-weighted calculations); U.S. Census bureau (population-weighted calculations).
Each point represents an MSA, plotted based on bank use by native or immigrant households within the MSA
and the MSA concentration of foreign-born residents.
Ethnic Concentration and Immigrant Bank Use 865

To identify whether the size of, and increase in, the nativity gap can be explained by immigrant
enclaves, we rely on variation in origin-specific immigrant concentration within MSAs over time and
the differential effect this variation has on natives and immigrants. Specifically we assume that after
controlling for other factors in the demand and supply of bank services, any additional impact of the
source region–MSA concentration of immigrants on immigrant bank use constitutes an enclave effect.
After combining information on co-ethnic residence patterns from the U.S. Census with
rich individual data and MSA-level characteristics, we find evidence that immigrant co-ethnic
enclaves have a statistically significant negative impact on the likelihood that immigrant
households have a formal banking relationship. The magnitude of our estimates is large,
suggesting that for a 10% increase in concentration, the probability an immigrant household
has a bank account falls between 2.4% and 3.0%. We argue this constitutes a negative enclave
effect for several reasons. First, we exploit the rich individual-level data in the SIPP to control
for numerous observable household characteristics. Second, we find no similar effects of
immigrant concentration for native households, even those from similar ethnic backgrounds to
immigrants. Third, we find no effects of overall immigrant concentration on the bank use for
immigrant households. What matters is the concentration of immigrants from the same source
region. This suggests that our estimates capture enclave effects rather than unobserved MSA
characteristics that might be related to large immigrant populations.
Further, we also probe the robustness of our results to various model and data specifications.
Overall our results are robust to additional controls for unobservable factors at the MSA or
individual level, which may jointly determine immigrant location and bank use, including the
location of quasi-banks, changes in preferences, and self-selection bias. To the degree that we
effectively mitigate these concerns, our results provide evidence that immigrant enclaves drive
down the use of formal banking services by immigrant households. Given the increases in
immigrant concentrations over time, we argue that this can partially explain the rising nativity gap.
2. Conceptual Framework
We provide a basic model of banking participation in order to outline the channels
through which enclaves affect financial behavior. A household will open and maintain a bank
account if the benefits of doing so outweigh the costs:
Yi~1 if BSzBTwCMzCTzCP:
The benefits of bank account ownership are twofold (Washington 2006). First, there is a
savings benefit of bank account ownership (BS), conferring a safe vehicle for savings and access
to interest-bearing financial assets. Second, there is a transaction benefit of bank account
ownership (BT ), which provides a low-cost means of transferring income into payments.2 These
2 Payments here can include remittances overseas, a common practice among immigrants. International remittances can
be made in cash, by wire transfers through nonbank entities, and by transfers through formal banking institutions
(even via automated teller machines). Suro et al. (2002) find that some of the key factors determining which type of
service an immigrant uses to transfer money overseas are convenience, word of mouth, and security. While this may
lead to increased use of formal bank services, the survey also finds that many immigrants are wary of banks. In a study
of remittance behavior by Mexican immigrants, Ameudo-Dorantes and Bansak (2006) find that increases in access to
formal banking services does not significantly alter remittance flows. We argue that immigrant preferences for
remitting money overseas are incorporated into their general preferences for utilizing formal and informal financial
services. Thus our modeling of the decision to use formal banking services incorporates the decision on how to remit.
866 Sarah Bohn and Sarah Pearlman
benefits depend on the frequency and size of income and purchases, how income is received,
household wealth, and the availability of alternatives, such as informal financial services like
ROSCAs or quasi-banking services like check cashing and payday lending outlets.
The costs of owning a bank account are threefold. First, there are monetary costs, such as
fees (CM), which depend on wealth and the volume of transactions. Second, there are time costs
(CT ), which are a function of the location of banks and the availability of alternatives. Third,
there are other nonmonetary costs, collectively called psychic costs (CP), which include
cognitive costs associated with understanding the features of a bank account, language barriers,
legal barriers, and a general distrust of or discomfort with banks. Psychic costs are difficult to
quantify but likely are a function of education, prior experience with banking, legal status,
language ability, and the use of banks within a household’s social network.
Enclaves may affect the benefits and costs of bank account ownership in numerous
directions, making the a priori prediction about the direction of causality between enclaves and
bank use ambiguous. On the one hand, enclaves may increase bank use in a few ways. First,
enclaves may confer information about formal banks, as the chance that a member of a
households’ social network uses formal banking services will increase as the size of the network
grows. Similarly, networks in enclaves may confer job information and thus lead to improved
labor market outcomes for immigrant residents, thereby increasing demand for banking services.3
Last, on the supply side, banks may offer more immigrant-specific services as enclave size grows.
On the other hand, enclaves my inhibit bank use through at least three channels. First,
enclaves likely will increase the availability of informal financial alternatives to banks, as
described earlier. Second, enclaves may yield relatively worse labor market outcomes for
immigrants by inhibiting language acquisition or participation in the formal labor market,
thereby decreasing the demand for banking services.4 Third, if quasi-banks are more likely to
locate in areas with high immigrant populations, they provide an alternative to formal banking
services. The specific channel we aim to test is the availability of informal financial alternatives
conferred by immigrant enclaves. There is no direct measure of informal financial behavior, so
we can only narrow in on this mechanism indirectly by eliminating competing explanations. In
the empirical strategy outlined below we describe the approach to controlling for the other
potential channels through which enclaves may impact demand for banking services.
3. Data
To discern the relationship between enclaves and immigrant bank use and to narrow in
on the specific channels through which they operate we turn to the data. In the absence of
an experiment randomly distributing immigrants across identical cities and observing their
banking decisions, we exploit the rich data in the Survey of Income and Program Participation
(SIPP). Key to our identification strategy is the variation in immigrant enclave size and
3 The strength of these network-driven explanations depends on the quality of the network. In particular, positive
network externalities may require that skilled immigrants choose to stay in the enclave, something that perhaps is
unlikely (Borjas 1998).4 This negative network externality is perhaps more likely than the positive human capital externality listed prior, given
evidence in Cutler and Glaeser (1997). However, that study examined the effects of residential segregation among
native-born African Americans.
Ethnic Concentration and Immigrant Bank Use 867
character due to the growth and dispersion of immigrants in the United States over the past few
decades.
The principal source of data for our study is the SIPP. The SIPP is a nationally
representative data set containing detailed information on immigrant status, region of origin,
and financial market participation. We use the 1990, 1996, and 2001 panels of the SIPP.
Although these data are longitudinal, because immigrant status, bank use, and household
location vary little (or not at all) over time, the longitudinal structure of the SIPP is not useful
for our analysis.5 Our unit of analysis is the household; for this reason household weights are
applied throughout, a few exceptions noted. We choose households over individuals because
many of the banking decisions are likely correlated across members of the same household,
particularly for spouses who have joint bank accounts. We define a household as immigrant or
native based on the status of the head of household6 and restrict attention to those age 18 to 65
who live in metropolitan areas. The result is a repeated cross section that contains 35,134
households, 85.2% of whom are native and 14.8% of whom are immigrant in the raw,
unweighted sample.7
We define immigrant enclaves by region of origin rather than country. This is necessitated
given the small number of immigrants from most countries in the SIPP but is also warranted by
evidence that informal networks among immigrants exist at broad ethnic levels (see, for
example, among Hispanic and Asian immigrants in Bond and Townsend 1996). Five different
regions of origin are defined: Latin America, which includes Mexico, Central and South
America, the Caribbean, Asia, Europe, and Other, which includes Africa, Other North
America, and Oceania. Table 1 provides information on the composition of the immigrants in
the sample and in the general population. Immigrants from Latin America make up the largest
component, forming about 40% of all immigrants in the sample, while immigrants from Asia
make up the second largest group, forming 27% of immigrants in the sample.
We measure enclaves as the concentration of immigrants from these similar source regions
in a metropolitan area. This measure, derived from U.S. Census data, follows much of the
immigration literature and assumes that the propensity for immigrants to rely on enclave
networks is intensified the higher the concentration of similar immigrants in a metropolitan
area (Borjas 1986, 1995; Bertrand, Luttmer, and Mullainathan 2000; Chiswick and Miller 2005;
Andersson, Burgess, and Lane 2009). Although enclaves may be alternatively measured at the
sub-MSA level, research suggests that among immigrants, networks are determined by ethnicity
rather than neighborhood (Borjas 1995) and operate more broadly than within a narrowly
defined neighborhood (Hellerstein, McInerney, and Neumark 2009). Utilizing a larger
geographic area should bias us against finding a result. The Census gives reliable population
estimates at the MSA level, for native-born and immigrants and, more specifically, by region of
birth. This allows us to measure ethnic enclaves for immigrants from the same region for the 75
5 Within each panel we use the wave that most closely coincides with the relevant Census year. In the 1990 SIPP we use
the fourth wave, which runs from January to April of 1991. In the 1996 SIPP we use the third wave, which runs from
November 1996 to February 1997. In the 2001 SIPP we use the third wave, which runs from September to December of
2001. While each round of the SIPP is a panel containing multiple waves, we restrict attention to one wave.6 Defined as the reference person in the SIPP. Other studies define households more restrictively, considering couple
immigrant households to be those in which both partners are foreign born (Cobb-Clark and Hildebrand 2006). We
consider this definition in section 5.7 Immigrant is defined as foreign born, regardless of subsequent citizenship status. Two exceptions are individuals born
to U.S. citizens abroad and Puerto Ricans, who are counted as natives. Also, we remove 61 households that have
extreme bank to total wealth values.
868 Sarah Bohn and Sarah Pearlman

Ta
ble
1.
Imm
igra
nts
inS
am
ple
Reg
ion
of
Ori
gin
1990
1996
2001
Na
%Im
mig
ran
ts
inP
op
ula
tio
nb
Aver
age
MS
A
Co
nce
ntr
ati
on
cN
a%
Imm
igra
nts
in
Po
pu
lati
on
bA
ver
age
MS
A
Co
nce
ntr
ati
on
cN
a%
Imm
igra
nts
in
Po
pu
lati
on
bA
ver
age
MS
A
Co
nce
ntr
ati
on
c
Lati
nA
mer
ica
500
33.0
%4
.6%
79
63
9.5
%6
.7%
78
33
9.8
%8
.4%
Ca
rib
bea
n1
46
9.2
%1
.5%
23
21
1.7
%1
.8%
17
58
.5%
2.1
%E
uro
pe
22
71
9.2
%2
.4%
30
41
6.4
%2
.5%
28
11
4.9
%2
.6%
Asi
a2
99
24
.9%
3.7
%5
22
27
.6%
4.7
%5
40
29
.1%
5.6
%O
ther
d1
65
13
.7%
0.7
%9
14
.8%
0.9
%1
45
7.8
%1
.1%
To
tal
13
37
10
0.0
%1
2.9
%1
94
51
00
.0%
16
.6%
19
24
10
0.0
%1
9.8
%a
SIP
Psa
mp
le.
bB
ase
do
nth
eS
IPP
sam
ple
s,u
sin
gin
div
idu
al
wei
gh
ts.
cM
SA
con
cen
trati
on
fro
mth
e1990
an
d2000
Cen
sus.
1996
valu
esare
inte
rpo
late
d(s
eete
xt)
.d
Oth
erin
clu
des
Afr
ica,
Oce
an
ia,
an
do
ther
No
rth
Am
eric
a.
Ethnic Concentration and Immigrant Bank Use 869

MSAs in our sample.8 There is significant variation in this enclave measure even at the MSA
level, as illustrated by Figure 2. The concentration of the two largest immigrant groups—
Asian and Latin American—reveal significant dispersion across MSAs and large changes
across time.
We classify a household as ‘‘banked’’ if any adult age 18–65 has a bank account, which
includes checking accounts, savings accounts, certificates of deposit, and money market deposit
accounts.9 Given the importance of banks for asset accumulation, we also focus on interest-
bearing bank accounts separately.10 Summary statistics on the unconditional means for bank
8 We include only MSAs that appear in the 1990, 1996, and 2001 samples. This leads to an exclusion of 26 MSAs which
do not appear in all of the panels. The 1990 SIPP wave is matched to the 1990 Decennial Census; the 2001 wave is
matched to the 2000 Decennial Census. The 1996 wave is matched to data interpolated between the 1990 and 2000
censuses using a cubic spline derived from four decennial censuses: 1970, 1980, 1990, and 2000. We also test the
sensitivity of our results to a linear spline interpolation. These results are available upon request and are similar in all
cases.9 The SIPP uses various strategies to impute data that are missing for individuals because they were not present for a
particular survey wave or because they did not answer particular questions. There are concerns that imputation rates
for bank ownership status might be higher for immigrant households than native ones, and that these differences may
skew our results. We therefore reestimate all of our results on the subsample that excludes households with imputed
bank status. This removes very few observations as imputation rates are low for an entire household on a characteristic
(bank ownership) with numerous questions. The results on the nonimputed status subsample are similar to our
original estimates. They are available upon request.10 These include everything except non-interest-bearing checking accounts. We consider the division by interest-bearing
and non-interest-bearing accounts because the 1990 SIPP does not separately account for checking accounts.
Approximately 86% of households with a bank account have at least one interest-bearing account.
Figure 2. Distribution of Immigrant Concentration across MSAs (MSAs included in 1990 and 2001 SIPP only)
Note: Authors’ calculations from 1990, 2000 Decennial Census (population-weighted).
870 Sarah Bohn and Sarah Pearlman
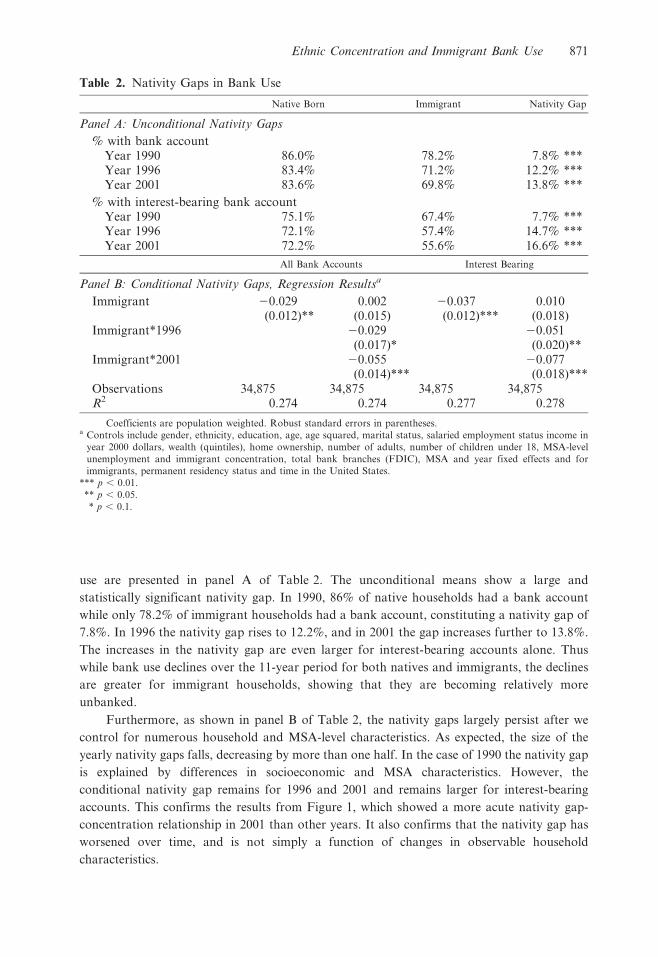
use are presented in panel A of Table 2. The unconditional means show a large and
statistically significant nativity gap. In 1990, 86% of native households had a bank account
while only 78.2% of immigrant households had a bank account, constituting a nativity gap of
7.8%. In 1996 the nativity gap rises to 12.2%, and in 2001 the gap increases further to 13.8%.
The increases in the nativity gap are even larger for interest-bearing accounts alone. Thus
while bank use declines over the 11-year period for both natives and immigrants, the declines
are greater for immigrant households, showing that they are becoming relatively more
unbanked.
Furthermore, as shown in panel B of Table 2, the nativity gaps largely persist after we
control for numerous household and MSA-level characteristics. As expected, the size of the
yearly nativity gaps falls, decreasing by more than one half. In the case of 1990 the nativity gap
is explained by differences in socioeconomic and MSA characteristics. However, the
conditional nativity gap remains for 1996 and 2001 and remains larger for interest-bearing
accounts. This confirms the results from Figure 1, which showed a more acute nativity gap-
concentration relationship in 2001 than other years. It also confirms that the nativity gap has
worsened over time, and is not simply a function of changes in observable household
characteristics.
Table 2. Nativity Gaps in Bank Use
Native Born Immigrant Nativity Gap
Panel A: Unconditional Nativity Gaps
% with bank accountYear 1990 86.0% 78.2% 7.8% ***Year 1996 83.4% 71.2% 12.2% ***Year 2001 83.6% 69.8% 13.8% ***
% with interest-bearing bank accountYear 1990 75.1% 67.4% 7.7% ***Year 1996 72.1% 57.4% 14.7% ***Year 2001 72.2% 55.6% 16.6% ***
All Bank Accounts Interest Bearing
Panel B: Conditional Nativity Gaps, Regression Resultsa
Immigrant 20.029(0.012)**
0.002(0.015)
20.037(0.012)***
0.010(0.018)
Immigrant*1996 20.029(0.017)*
20.051(0.020)**
Immigrant*2001 20.055(0.014)***
20.077(0.018)***
Observations 34,875 34,875 34,875 34,875R2 0.274 0.274 0.277 0.278
Coefficients are population weighted. Robust standard errors in parentheses.a Controls include gender, ethnicity, education, age, age squared, marital status, salaried employment status income in
year 2000 dollars, wealth (quintiles), home ownership, number of adults, number of children under 18, MSA-level
unemployment and immigrant concentration, total bank branches (FDIC), MSA and year fixed effects and for
immigrants, permanent residency status and time in the United States.
*** p , 0.01.
** p , 0.05.
* p , 0.1.
Ethnic Concentration and Immigrant Bank Use 871

4. Empirical Findings
Model Specification
We estimate the propensity to have a bank account using the following linear probability
model:
Bist~azb1Xitzb2Zstzb3lsjtzb4lsjt � djzdjzdtzdszeijst ð1Þ
where Bist is the measure of bank use for a household headed by individual i in MSA s at time t.11
We estimate separate models of bank use of all types and bank use for savings, by interest-bearing
accounts in particular. This helps isolate the nontransaction motives for holding an account of
different type; we expect, if there is a relationship between enclaves and immigrant bank use, that
it will be relatively larger for interest-bearing accounts. Both native and immigrant households
are included in all specifications, with dummy variable dj indicating the household is headed by
an immigrant from region j. The key relationship we want to identify is that between Bist and the
immigrant region-specific enclave measure, lsjt. Because the enclave measure is common to all
MSA residents, we take a number of approaches to isolate the immigrant source region-specific
effect on bank use.
First, we use MSA fixed effects ds to control for time-varying factors common to
households in a given MSA. Second, we include native-born households in the model to
account for other MSA-specific factors specifically correlated with immigrant enclave size.
Thus our key coefficient of interest, b4, identifies the differential impact of enclaves on bank use
of immigrants relative to native born within an MSA. The MSA fixed effects and inclusion of
natives in the model help control for characteristics that systematically shift demand for
banking services, such as the availability of quasi-banking alternatives, which we cannot
control for directly. Other MSA-level channels that we control for directly are represented by
Zst. This includes the availability of banking services, measured by Federal Deposit Insurance
Corporation bank location data.12 We also control for MSA unemployment rates, as they are
related to economic activity that attracts labor, potentially increasing the concentration of
immigrants, as well as capital, potentially increasing the supply of banks.
Household characteristics that drive the costs and benefits of banking services are included
in Xist. These include controls related to the demand for banking services due to the volume
of transactions: wealth (quintiles), total household income, the number of children, and the
number of adults in the household. Total income also controls somewhat for labor market
outcomes. We also include controls for education, ethnicity, gender, age, marital status, and
time in the United States (for immigrants), as well as dummies for salaried work and, in some
estimations, dummies for business ownership. To control for prior banking experience, we
proxy with home ownership, as this is likely to be highly correlated with previous financial
11 We choose the linear probability due to the ease of interpreting interaction effects (Ai and Norton 2003). For
robustness we also estimate logit models. Results are available upon request.12 The FDIC provides information on all branches of FDIC insured institutions in the country as of June 30 of each
year. We use data from 1994, the earliest year available, 1996, and 2001, which gives us the total number of bank
branches in every MSA for all years in our sample. Although we would like to control for the number of fringe bank
outlets such as check cashers or payday lenders, comprehensive historical data are not currently available. We rely on
MSA fixed effects as well as MSA-time varying characteristics, such as immigrant concentration, to pick up most of
the variation in location of these establishments.
872 Sarah Bohn and Sarah Pearlman

market participation. For immigrant households, we use proxy variables to control for
language ability and legal status, factors that are likely related to demand for banking services.
Neither are directly available in the SIPP during the time period we consider, but the
combination of age, time in the United States, gender, and education are highly correlated with
both (Orrenius and Zavodny 2005; Passel and Cohn 2008). In addition, we include a dummy
variable for permanent residency status, differentiating between households who are definitely
legal (naturalized or permanent resident) and those who are more likely to be undocumented
(reporting neither).13
A challenge to the identification of b4 is the potentially endogenous location choice of
immigrants. The selection into immigrant enclaves may be systematically related to the use of
formal banking services. If industrious immigrants, for example, are more likely to live outside
immigrant enclaves and simultaneously more likely to have a bank account, then our coefficient
of interest may pick up immigrant ability rather than informal networks. If, however, lower
ability immigrants are deflected from cities with high concentrations of immigrants in the face
of stiff labor market competition (Light 2006), then our estimates may be biased downward.
Ideally one would exploit a natural experiment that randomly assigns individuals to cities
and observe their banking choices14 or make use of an instrumental variable for concentration.
Since neither are an option here, we instead rely on two approaches. First, we include the rich
set of individual characteristics described above, which control for much of the potential source
of skill difference across households. Beyond this, we exploit a common hypothesis in
immigrant location choice literature, namely that immigrants are more responsive to the level of
location-specific characteristics rather than predicted changes in these characteristics (LaLonde
and Topel 1991) and estimate a model with fixed effects by year. This assumes that the
propensity for immigrants to locate in particular areas is largely a function of previous
settlement patterns, rather than current economic characteristics. We recognize, however, that
this will not completely control for self-selection bias if immigrants with particular
unobservable characteristics are changing their settlement patterns over time. Thus in the
robustness check section we take a number of approaches to address potential unobserved
individual heterogeneity.
If we have effectively controlled for the other factors that impact a household’s decision to
hold a bank account, b4 will capture the role that social networks within enclaves play in
determining immigrant bank use. If the main channel through which these networks operate is
the provision of informal financial services, we expect the sign to be negative. If, however, the
main channel is through exposure to banking services, we expect the sign to be positive.
13 It is impossible to precisely measure legal status as neither the SIPP nor any comprehensive representative data set
includes indicators of legal versus illegal status. It would be difficult to obtain accurate responses on legal status in a
large-scale survey, even if the question were asked. However, researchers estimate that nationally representative
surveys similar to the SIPP (Census and CPS) have been able to capture the large majority of the illegal population. In
the 1990 SIPP individuals are not asked separately about their naturalization status and permanent residency status.
We categorize non-naturalized individuals as non-permanent residents for this wave.14 Other authors have used similar quasi-experiments to examine enclave effects on various labor market outcomes in
Scandinavia (Edin, Fredriksson, and Aslund 2003; Damm 2009). In the U.S. context however, similar natural
experiments are not large enough to exploit.
Ethnic Concentration and Immigrant Bank Use 873

Estimation Results
We estimate Equation 1 using a linear probability model. The results are presented in
Table 3. Column 1 contains results for all bank accounts while column 2 contains results for
interest-bearing accounts only. We report population weighted coefficients with robust
standard errors, clustered by MSA.15
Overall we find that immigrants living in enclaves are significantly less likely to own bank
accounts, as shown by the negative coefficient on the immigrant interaction term in each
column. Our estimates for all bank accounts (column 1) suggest that if the concentration of
immigrants from a household’s source region increases by 10%, the probability that the average
immigrant household has a bank account relative to similar natives and immigrants from
different regions of origin falls by 2.4%.16 As expected, the magnitude of the coefficient on
interest-bearing bank accounts (column 2) is even larger, at 3.05%. The results have
implications for changes in immigrant concentrations over time. They suggest that, even after
controlling for changes in observable characteristics, as the percentage of immigrants from
Table 3. Bank Use
All Accounts (1) Interest Bearing (2)
Head of household an immigrant from region j:
Latin America 20.011 (0.028) 20.001 (0.016)Caribbean 0.043 (0.026) 0.030 (0.023)Asia 0.003 (0.019) 20.034 (0.023)Europe 20.004 (0.015) 20.003 (0.016)Other 0.070 (0.019)*** 0.050 (0.021)**
Concentration immigrants from region j in household’s MSA
Latin America 20.095 (0.276) 20.208 (0.282)Caribbean 0.001 (0.913) 20.741 (1.482)Asia 1.166 (1.088) 1.129 (0.847)Europe 22.619 (2.415) 20.800 (2.649)Other 3.137 (2.617) 4.253 (4.052)
ConcentrationImmigrantsRegion j 20.241 20.305*ImmigrantRegion j (0.119)** (0.089)***Observations 34,875 34,875R2 0.275 0.279
Other variables include gender, ethnicity, education, age, age squared, marital status, salaried employment status,
income in year 2000 dollars, wealth (quintiles), number of adults, number of children under 18, MSA-level
unemployment and immigrant concentration, bank branches (FDIC), MSA and year fixed effects, permanent residency
status and time in the United States. Full estimation results in Appendix. Coefficients are population weighted. Robust
standard errors in parentheses.
*** p , 0.01.
** p , 0.05.
* p , 0.1.
15 The results for the full set of controls are shown in the Appendix. The signs and precision of the covariates are similar
to those found in other studies (Cobb-Clark and Hildebrand 2006; Osili and Paulson 2006).16 The effects are identified by changes within MSA, across time. However, models that utilize only the time variation or
variation across MSAs yield similar results. In fact, when either set of fixed effects (rather than both) are employed,
the point estimates are larger and strongly statistically significant. Overall, we find that the MSA-level variation
carries more weight as compared with time variation. For the reasons discussed we find the model identifying from
variation within MSA over time to be preferable.
874 Sarah Bohn and Sarah Pearlman

certain source regions increases in a city the probability that immigrants from that region have
bank accounts falls. The direct concentration variable estimates suggest that there is no
consistent, significant relationship between immigrant enclaves and MSA native-born co-
residents. The models identify a differential impact of immigrant concentration on banking
behavior of immigrants. Since we control for other MSA and household characteristics that
could yield this negative relationship, our conceptual framework suggests that the increased
availability of informal financial services within enclaves are a key explanation of our results.
While we attribute these enclave effects to informal networks in immigrant communities, we
recognize concerns that the effects may be attributable to unobservable individual or MSA-
level factors that are distinct from informal networks. In the following section we address
concerns regarding the endogeneity of the immigrant concentration variable.
5. Robustness Checks
In this section we examine the robustness of our main findings. The main concerns
surrounding our results are that unobservable factors at the MSA or household level may drive
the relationship between immigrant concentration and immigrant bank use, leading to a
spurious correlation between the two. This would threaten our argument that the channel
through which immigrant concentration impacts bank use is the availability of social networks.
We address each concern in turn.
MSA-Level Heterogeneity
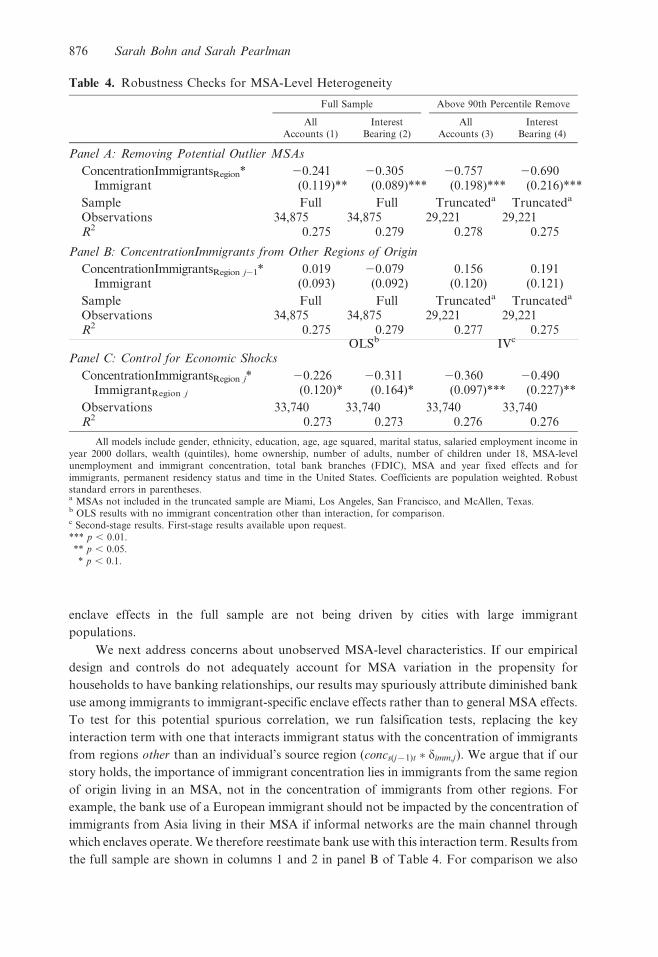
We start with concerns that our results are being driven by certain outlier cities with high
immigrant concentrations. We examine the distribution of immigrant concentrations and
truncate the sample at the 90th percentile, removing MSAs for which immigrants comprise
more than one third of the total population, a natural break in the data.17 Only four MSAs lie
above this threshold: Miami, Los Angeles, San Francisco, and McAllen, Texas. Results from
the sample that excludes these four MSAs are shown in columns 3 and 4 in panel A of Table 4.
It is important to note that this removes over one third of the immigrants from our sample. For
comparison we also present the results from the full sample in columns 1 and 2.
The results show that the relationship between immigrant concentration and bank use
among immigrants is not being driven by cities with large immigrant concentrations. In fact,
the opposite seems to be the case, as the coefficients on the interaction term are twice as large
in the truncated sample as the full one. One possibility for these results is that the channels
through which enclaves increase bank use operate more strongly in cities with potentially larger
enclaves. These channels include the provision of job information that leads to improved labor
market outcomes and language acquisition and the tailoring of banking services to particular
communities, which may enhance information about and comfort with formal banks. We have
no way of knowing with certainty if this is the case. However, the results suggest that any
17 Given that the vast majority of immigrants in our sample live in MSAs with high concentrations of immigrants,
truncating the sample at the 90th percentile is preferable to the 75th percentile or the median. For example, 80% of the
immigrants in our sample live in MSAs with immigrant concentrations above the median.
Ethnic Concentration and Immigrant Bank Use 875
enclave effects in the full sample are not being driven by cities with large immigrant
populations.
We next address concerns about unobserved MSA-level characteristics. If our empirical
design and controls do not adequately account for MSA variation in the propensity for
households to have banking relationships, our results may spuriously attribute diminished bank
use among immigrants to immigrant-specific enclave effects rather than to general MSA effects.
To test for this potential spurious correlation, we run falsification tests, replacing the key
interaction term with one that interacts immigrant status with the concentration of immigrants
from regions other than an individual’s source region (concs(j{1)t � dimm,j). We argue that if our
story holds, the importance of immigrant concentration lies in immigrants from the same region
of origin living in an MSA, not in the concentration of immigrants from other regions. For
example, the bank use of a European immigrant should not be impacted by the concentration of
immigrants from Asia living in their MSA if informal networks are the main channel through
which enclaves operate. We therefore reestimate bank use with this interaction term. Results from
the full sample are shown in columns 1 and 2 in panel B of Table 4. For comparison we also
Table 4. Robustness Checks for MSA-Level Heterogeneity
Full Sample Above 90th Percentile Remove
All
Accounts (1)
Interest
Bearing (2)
All
Accounts (3)
Interest
Bearing (4)
Panel A: Removing Potential Outlier MSAs
ConcentrationImmigrantsRegion* 20.241 20.305 20.757 20.690Immigrant (0.119)** (0.089)*** (0.198)*** (0.216)***
Sample Full Full Truncateda Truncateda
Observations 34,875 34,875 29,221 29,221R2 0.275 0.279 0.278 0.275
Panel B: ConcentrationImmigrants from Other Regions of Origin
ConcentrationImmigrantsRegion j21* 0.019 20.079 0.156 0.191Immigrant (0.093) (0.092) (0.120) (0.121)
Sample Full Full Truncateda Truncateda
Observations 34,875 34,875 29,221 29,221R2 0.275 0.279 0.277 0.275
OLSb IVc
Panel C: Control for Economic Shocks
ConcentrationImmigrantsRegion j* 20.226 20.311 20.360 20.490ImmigrantRegion j (0.120)* (0.164)* (0.097)*** (0.227)**
Observations 33,740 33,740 33,740 33,740R2 0.273 0.273 0.276 0.276
All models include gender, ethnicity, education, age, age squared, marital status, salaried employment income in
year 2000 dollars, wealth (quintiles), home ownership, number of adults, number of children under 18, MSA-level
unemployment and immigrant concentration, total bank branches (FDIC), MSA and year fixed effects and for
immigrants, permanent residency status and time in the United States. Coefficients are population weighted. Robust
standard errors in parentheses.a MSAs not included in the truncated sample are Miami, Los Angeles, San Francisco, and McAllen, Texas.b OLS results with no immigrant concentration other than interaction, for comparison.c Second-stage results. First-stage results available upon request.
*** p , 0.01.
** p , 0.05.
* p , 0.1.
876 Sarah Bohn and Sarah Pearlman
consider the truncated sample that excludes the four MSAs with immigrant concentrations above
the 90th percentile. These results are shown in columns 3 and 4. Overall we find limited evidence
to support the hypothesis that the concentration of immigrants from other source regions impacts
the bank use of immigrant households. Three out of four of the coefficients are positive and none
are significant. These results further support our argument that the main channel through which
immigrant concentration impacts bank use is the availability of informal networks.
Third, we utilize a common instrumental variables approach to account for unobservable
economic shocks to MSAs that may not be fully captured in our MSA-level controls. These
shocks could jointly determine immigrant bank use and immigrant concentration and thus bias
our findings. We instrument for immigrant concentration for the year in question using
immigrant concentration in 1970, exploiting the chain-based migration patterns of immigrants
to the United States.18
The results from the second stage are reported in columns 3 and 4 in panel C of Table 4. The
number of observations in the instrumental variable (IV) estimation falls due to the absence of
information on 1970 immigrant concentration for several MSAs in the sample. Since we omit the
control variable concsjt to simplify the IV calculation and we also present baseline ordinary least
squares results omitting concentration measures other than the interaction term and MSAs that
have no 1970 Census data for comparison. These are in columns 1 and 2 in panel C of Table 4. We
find that instrumenting does not change the magnitude of our baseline results much. The standard
errors on the all bank account regression increase, but statistical significance is maintained. These
results lend confidence to the conclusion that our results are not driven purely by economic shocks.
Individual-Level Heterogeneity
We next address concerns that changes in the unobserved, individual-level characteristics of
immigrants within MSAs over time drive our results. For example, if enclaves are increasingly made
up of immigrants with greater preference for not using banks, we will obtain a negative relationship
between concentration and bank use for reasons that have nothing to do with social networks.
To the extent that unobserved preferences for bank use are correlated within ethnic
groups, we can use native households as a test for whether or not the estimated effects are
unique to immigrants. If the immigrant enclave size in fact measures immigrant informal
networks rather than changing ethnic preferences, we anticipate that immigrant enclave size
should have no power in explaining differences in bank use between native-born whites and
native-born Latinos. We test this by estimating bank use only on the sample of native
households and interacting concentration with Mexican American natives, all Latin American
natives, and Asian American natives. These interaction terms tell us, for example, if Mexican
American households living in MSAs with a higher concentration of Mexican immigrants are
more or less likely to have a bank account than comparable non-Mexican American natives.
18 Historical patterns of settlement of immigrants are a strong predictor of current settlement within source country
groups (Cortes 2008). However, we expect the 1970 distribution of immigrants across MSA to be unrelated to current
economic shocks. To construct the IV, we essentially reallocate immigrants in year t according to their distribution in
1970 as follows:P
j
Ijs1970
Ij1970|Ijt where I is the number of immigrants and s represents MSA. We calculated 1970 statistics
from the Decennial Census. Native-born are reallocated in the same fashion. The ratio of immigrant to native plus
immigrant within MSA instruments for our key variable of interest. We estimate bank use using two-stage least
squares. First-stage results are available upon request.
Ethnic Concentration and Immigrant Bank Use 877
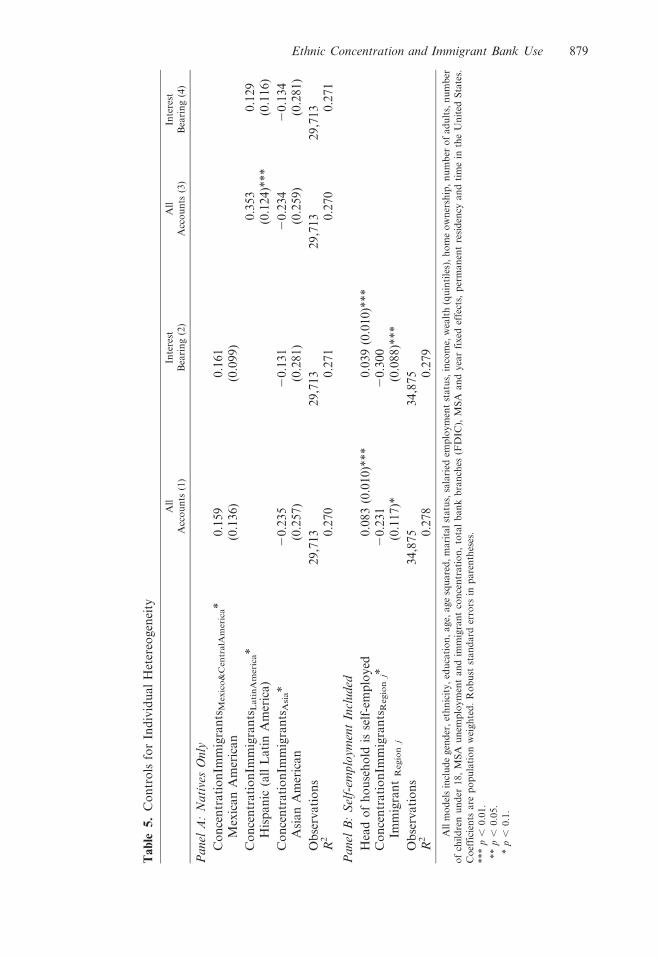
The results, presented in panel A of Table 5, show no evidence that immigrant concentration has a
similar effect on natives of similar ethnic backgrounds. The coefficients on the interaction terms are
either insignificant or positive and significant, showing that the negative enclave effect is specific to
immigrants.19 To the extent that immigrant preferences regarding banks are similar to those of co-
ethnic natives, these results suggest that changes in preferences do not drive the enclave effects we
find. Furthermore, this test is evidence that the enclave effects are unique to immigrants.20
Next, we are concerned with potential sorting into MSAs based on individual ability or
industriousness. As we mentioned earlier, it is impossible to completely control for unobserved
ability given the lack of an instrument for immigrant concentration. We consider, however, a
proxy variable in the form of self-employment.21 Highly industrious individuals may be more
likely to open their own business and therefore to be self-employed than less industrious individuals.
Self-employment also serves as an additional check on the labor market channel for immigrant
enclaves. We therefore reestimate bank use including a measure of self-employment in addition to all
of the controls in the initial estimation. The results are in panel B of Table 5. We see no significant
changes in the results, as the coefficients on the interaction terms remain negative and significant.22
The next piece of evidence that selection does not drive the findings utilizes evidence from the
literature that unobserved skill varies across immigrant arrival cohort. We thus hold arrival cohort
constant and reestimate the relationship between bank use and immigrant concentration. We
consider two years of arrival cohorts—1970–1980 or 1980–1990—and track the bank use of these
synthetic cohorts over time.23 Borjas (1985) suggests that unobserved immigrant quality declined
over these cohorts. In the analysis we also restrict the age range of the natives in the sample to
match those of the restricted immigrant cohort group. The results are shown in panel A of Table 6.
Overall we find no evidence that unobserved cohort ability biases our results. As shown in columns
3 and 4, the estimated enclave effects are larger for the newer arrival cohort of immigrants who
arrived between 1980 and 1990. The coefficients, however, remain negative in all cases.
19 We define households based on the immigrant status of the head of household. This, however, may lead to inappropriate
classifications for mixed households defined as households comprised of native-immigrant couples. For robustness, we
check if the results are robust to removing these mixed households from the sample. This removes approximately 1300
households from the analysis. We find no significant change in the results, which are available upon request.20 We also estimate the full model on subsamples of Hispanic and Asian households in case the importance of immigrant
concentration varies by ethnicity, something not captured by the ethnicity dummy variables. First, we find that the
nativity gap is larger and increasing more severely in the subsamples of Hispanic and Asian households. We also find
that the coefficients on the interaction term remain negative and even increase in size in the Hispanic subsample. They
also remain highly significant in the Hispanic and Asian subsamples (20.51 and 20.27, respectively) but do not retain
significance in the Asian subsample, likely due to small sample size (approximately 1400 observations). Results are
available upon request.21 In the SIPP self-employment is best measured by ownership of businesses. We regard self-employment broadly,
defined as anyone who reports owning at least one business.22 We also examined individual heterogeneity by splitting the sample by gender and education. These results are available
upon request. Note that splitting the sample based on these individual characteristics does not test whether the
immigrant enclave is more or less skilled since the independent variables of interest are the same across models. These
results instead indicate whether more or less skilled immigrants in enclaves of various sizes are more likely to use formal
banking services. For gender we find that for interest-bearing accounts the coefficient on the interaction term is similar
across men and women. For education we find that the coefficients on the interaction term are larger than the baseline
for households with less education (high school or less). For households whose head has a college education the
coefficients are still negative but smaller and no longer significant. This may be driven by the relatively small number of
highly educated immigrants in our sample, thus we hesitate to make any strong conclusions from this cut of the data.23 Due to sample size constraints estimating effects on the newest cohort of immigrants that arrived after 1990 is
unreliable.
878 Sarah Bohn and Sarah Pearlman
Ta
ble
5.
Co
ntr
ols
for
Ind
ivid
ua
lH
eter
eog
enei
ty
All
Acc
ou
nts
(1)
Inte
rest
Bea
rin
g(2
)
All
Acc
ou
nts
(3)
Inte
rest
Bea
rin
g(4
)
Panel
A:
Nati
ves
Only
Co
nce
ntr
ati
on
Imm
igra
nts
Mex
ico
&C
en
tra
lAm
eri
ca*
0.1
59
0.1
61
Mex
ica
nA
mer
ica
n(0
.13
6)
(0.0
99
)
Co
nce
ntr
ati
on
Imm
igra
nts
La
tin
Am
eri
ca*
0.3
53
0.1
29
His
pa
nic
(all
La
tin
Am
eric
a)
(0.1
24
)**
*(0
.11
6)
Co
nce
ntr
ati
on
Imm
igra
nts
Asi
a*
20
.23
52
0.1
31
20
.23
42
0.1
34
Asi
an
Am
eric
an
(0.2
57
)(0
.28
1)
(0.2
59
)(0
.28
1)
Ob
serv
ati
on
s2
9,7
13
29
,71
32
9,7
13
29
,71
3R
20
.27
00
.27
10
.27
00
.27
1
Pa
nel
B:
Sel
f-em
plo
ym
ent
Incl
ud
ed
Hea
do
fh
ou
seh
old
isse
lf-e
mp
loy
ed0
.08
3(0
.01
0)*
**
0.0
39
(0.0
10
)**
*C
on
cen
tra
tio
nIm
mig
ran
tsR
eg
ion
j*2
0.2
31
20
.30
0Im
mig
ran
tR
eg
ion
j(0
.11
7)*
(0.0
88
)**
*
Ob
serv
ati
on
s3
4,8
75
34
,87
5R
20
.27
80
.27
9
All
mo
del
sin
clu
de
gen
der
,et
hn
icit
y,
edu
cati
on
,age,
age
squ
are
d,
mari
tal
statu
s,sa
lari
edem
plo
ym
ent
statu
s,in
com
e,w
ealt
h(q
uin
tile
s),
ho
me
ow
ner
ship
,n
um
ber
of
ad
ult
s,n
um
ber
of
chil
dre
nu
nd
er18,
MS
Au
nem
plo
ym
ent
an
dim
mig
ran
tco
nce
ntr
ati
on
,to
tal
ban
kb
ran
ches
(FD
IC),
MS
Aan
dyea
rfi
xed
effe
cts,
per
man
ent
resi
den
cyan
dti
me
inth
eU
nit
edS
tate
s.
Co
effi
cien
tsare
po
pu
lati
on
wei
gh
ted
.R
ob
ust
stan
dard
erro
rsin
pare
nth
eses
.
***
p,
0.0
1.
**
p,
0.0
5.
*p
,0.1
.
Ethnic Concentration and Immigrant Bank Use 879

Ta
ble
6.
Su
b-s
am
ple
so
fIm
mig
ran
tH
ou
seh
old
sb
yC
oh
ort
,T
ime
inU
.S.,
an
dP
oss
ible
Leg
al
Sta
tus
Pan
elA
:C
oh
ort
:Y
ear
of
Arr
ival
1970–1980
1980–1990
All
Acc
ou
nts
(1)
Inte
rest
Bea
rin
g(2
)A
llA
cco
un
ts(3
)In
tere
stB
eari
ng
(4)
Co
nce
ntr
ati
on
Imm
igra
nts
Reg
ion
j*2
0.0
53
20
.24
92
0.4
10
20
.34
3Im
mig
ran
t Reg
ion
j(0
.13
5)
(0.1
34
)*(0
.16
2)*
*(0
.14
7)*
*O
bse
rva
tio
ns
26
,58
42
6,5
84
31
,44
03
1,4
40
R2
0.2
71
0.2
74
0.2
76
0.2
77
Pan
elB
:T
ime
inU
.S.
0–5
yea
rs6–11
yea
rs11
+yea
rs
All
Acc
ou
nts
(1)
Inte
rest
Bea
rin
g(2
)A
llA
cco
un
ts(3
)In
tere
stB
eari
ng
(4)
All
Acc
ou
nts
(5)
Inte
rest
Bea
rin
g(6
)
Co
nce
ntr
ati
on
Imm
igra
nts
Reg
ion
j*2
0.0
61
20
.57
82
0.4
06
20
.05
02
0.2
77
20
.34
1Im
mig
ran
t Reg
ion
j(0
.35
9)
(0.2
43
)**
(0.2
20
)*(0
.22
8)
(0.1
26
)**
(0.0
97
)**
*O
bse
rva
tio
ns
30
,53
93
0,5
39
30
,63
93
0,6
39
32
,69
03
2,6
90
R2
0.2
75
0.2
77
0.2
74
0.2
74
0.2
69
0.2
73
Pan
elC
:P
oss
ible
Leg
al
Sta
tus
Natu
rali
zed
Cit
izen
sP
erm
an
ent
Res
iden
tsa
Lik
ely
Un
do
cum
ente
d
All
Acc
ou
nts
(1)
Inte
rest
Bea
rin
g(2
)A
llA
cco
un
ts(3
)In
tere
stB
eari
ng
(4)
All
Acc
ou
nts
(5)
Inte
rest
Bea
rin
g(6
)
Co
nce
ntr
ati
on
Imm
igra
nts
Reg
ion
j*2
0.1
41
20
.19
72
0.1
38
20
.26
52
0.7
38
20
.80
8Im
mig
ran
t Reg
ion
j(0
.11
0)
(0.1
40
)(0
.12
2)
(0.1
09
)**
(0.3
58
)**
(0.3
73
)**
Ob
serv
ati
on
s3
1,8
93
31
,893
33
,59
23
3,5
92
3,7
49
3,7
49
R2
0.2
63
0.2
67
0.2
68
0.2
73
0.3
48
0.3
02
All
mo
del
sin
clu
de
gen
der
,et
hn
icit
y,
edu
cati
on
,age,
age
squ
are
d,
mari
tal
statu
s,sa
lari
edem
plo
ym
ent
statu
s,in
com
e,w
ealt
h(q
uin
tile
s),
ho
me
ow
ner
ship
,n
um
ber
of
ad
ult
s,n
um
ber
of
chil
dre
nu
nd
er18,
MS
A-l
evel
un
emp
loym
ent
an
dim
mig
ran
tco
nce
ntr
ati
on
,b
an
kb
ran
ches
(FD
IC),
MS
Aan
dyea
rfi
xed
effe
cts,
an
dfo
rim
mig
ran
ts,
per
man
ent
resi
den
cyst
atu
san
d
tim
ein
the
Un
ited
Sta
tes.
Co
effi
cien
tsp
op
ula
tio
nw
eigh
ted
.R
ob
ust
stan
dard
erro
rsin
pare
nth
eses
.a
Incl
ud
esn
atu
rali
zed
citi
zen
s.
***
p,
0.0
1.
**
p,
0.0
5.
*p
,0.1
.
880 Sarah Bohn and Sarah Pearlman
Alternately, we hold fixed the years since arrival of the immigrants in the sample, to
abstract from the unobservable effects of assimilation over time (whereas the previous controls
for cohort effects). To capture the potential for a differential impact of enclaves by tenure in the
United States we separately estimate bank use on subsamples that include immigrants who
have been in the United States fewer than 5 years, between 6 and 10 years, and more than
10 years. Results are shown in panel B of Table 6. The coefficient on interest-bearing accounts
is largest for immigrants with fewer than five years in the United States (column 2), perhaps
indicating less assimilated immigrants are more subject to enclave effects. However, the
coefficient on all bank accounts is largest for immigrants with 6–11 years in the United States
(column 3), The pattern of standard errors is not too surprising given the small number of
immigrants in the 0–5 and 6–11 year groups (833 and 935, respectively). But the pattern of
significant results does not present a clear picture on the role of time in the United States on our
model. Nevertheless, we find a negative and significant effect for immigrants with the longest
tenure, 11 years or more. This indicates that the effects are not dominated by unobserved
heterogeneity of immigrants on this characteristic.24
Finally, we address concerns regarding immigrant legal status. We verify that our results
are not identifying only the differential propensity to use a bank account due to
documentation status. Our model includes some proxies for legal status, such as the dummy
for permanent resident status and demographic characteristics highly correlated with legal
status (time in the United States, age, education, and ethnicity, following Orrenius and
Zavodny 2005).25 Here we go one step further to estimate the model separately for immigrant
households of different legal status: naturalized immigrants, permanent residents, and a
narrowly defined group of likely undocumented based on being nonpermanent resident and
not graduated from high school. For the latter, we include only less educated native-born
households as the MSA-level comparison. Results are shown in panel C of Table 6. Overall,
they are in line with our expectations; however, due to small samples precision falls greatly.
For naturalized immigrants (columns 1 and 2) the enclave effect is smaller and insignificant.
For naturalized and permanent residents combined (columns 3 and 4), the coefficient is more
negative and significant for interest-bearing accounts. Finally, for the group of most likely
undocumented immigrants (columns 5 and 6), the coefficients are significantly larger than for
the entire immigrant sample. Note that this latter point estimate is not directly comparable to
the others or to the baseline model results, as it includes only less-educated native and
immigrant households. As the coefficients remain negative among each subsample, we are
confident that our results are not being driven by one legal status group of immigrants.
Overall our results are robust to a variety of controls for heterogeneity at the MSA and
individual level. We recognize that we are limited in our ability to control for the problem
24 We also split the sample by age of entry. Given that year of arrival is categorical in the SIPP and the small sample size
of immigrants, we construct only three categories: immigrants who arrived before age 15; immigrants who arrived
between the ages of 16 and 30; and immigrants who arrived over age 30. Though large, these breaks address the
concern that immigrants who arrive as children differ substantially from those who arrive in prime working age. We
find negative interaction terms for all three groups. The coefficients, however, are only significant for the 0–15 and the
30+ groups. Furthermore the size of the coefficient is larger for these two groups than the 15–30 group. This suggests
that any potential enclave effects are not limited to immigrants who arrived at a later age and may have slower rates of
assimilation. These results are available upon request.25 Mexican birth along with education and young age are the strongest predictors of undocumented status. However,
restricting our sample along all three dimensions makes the SIPP sample so small that we cannot reliably estimate the
model. Thus, we use education and reported citizenship status as a reasonable proxy.
Ethnic Concentration and Immigrant Bank Use 881
of self-selection, given the absence of a good instrument for immigrant concentration.
Nevertheless, the robustness of our results leads us to be confident that the concentration
effects are not purely a story of self-selection. We are therefore confident to conclude that there
is a negative impact on banking participation for immigrants residing in MSAs with higher
concentrations of similar immigrants.
6. Conclusion
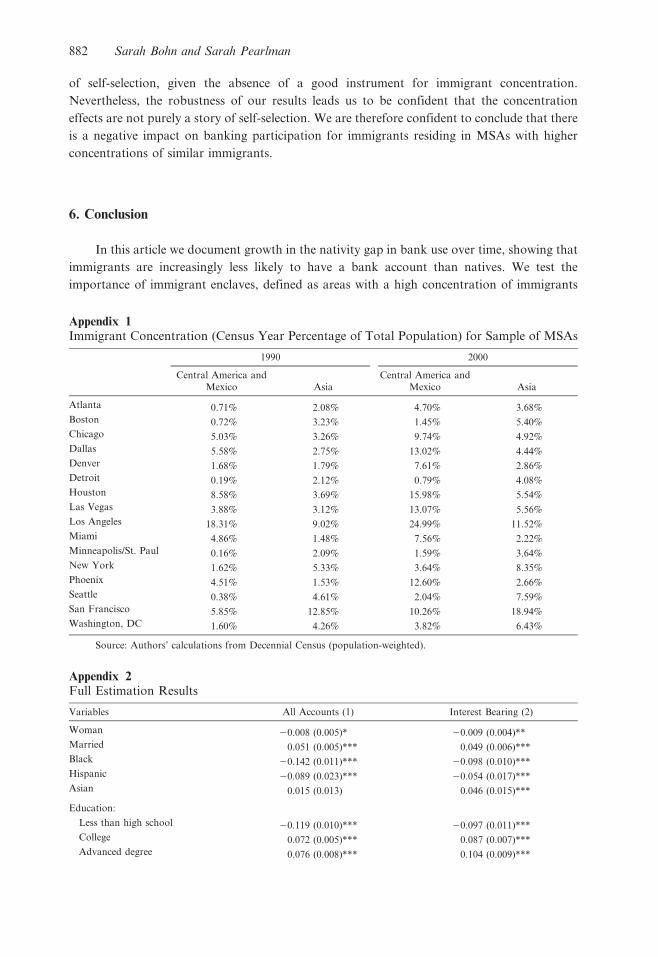
In this article we document growth in the nativity gap in bank use over time, showing that
immigrants are increasingly less likely to have a bank account than natives. We test the
importance of immigrant enclaves, defined as areas with a high concentration of immigrants
Appendix 1Immigrant Concentration (Census Year Percentage of Total Population) for Sample of MSAs
1990 2000
Central America and
Mexico Asia
Central America and
Mexico Asia
Atlanta 0.71% 2.08% 4.70% 3.68%
Boston 0.72% 3.23% 1.45% 5.40%
Chicago 5.03% 3.26% 9.74% 4.92%
Dallas 5.58% 2.75% 13.02% 4.44%
Denver 1.68% 1.79% 7.61% 2.86%
Detroit 0.19% 2.12% 0.79% 4.08%
Houston 8.58% 3.69% 15.98% 5.54%
Las Vegas 3.88% 3.12% 13.07% 5.56%
Los Angeles 18.31% 9.02% 24.99% 11.52%
Miami 4.86% 1.48% 7.56% 2.22%
Minneapolis/St. Paul 0.16% 2.09% 1.59% 3.64%
New York 1.62% 5.33% 3.64% 8.35%
Phoenix 4.51% 1.53% 12.60% 2.66%
Seattle 0.38% 4.61% 2.04% 7.59%
San Francisco 5.85% 12.85% 10.26% 18.94%
Washington, DC 1.60% 4.26% 3.82% 6.43%
Source: Authors’ calculations from Decennial Census (population-weighted).
Appendix 2Full Estimation Results
Variables All Accounts (1) Interest Bearing (2)
Woman 20.008 (0.005)* 20.009 (0.004)**
Married 0.051 (0.005)*** 0.049 (0.006)***
Black 20.142 (0.011)*** 20.098 (0.010)***
Hispanic 20.089 (0.023)*** 20.054 (0.017)***
Asian 0.015 (0.013) 0.046 (0.015)***
Education:
Less than high school 20.119 (0.010)*** 20.097 (0.011)***
College 0.072 (0.005)*** 0.087 (0.007)***
Advanced degree 0.076 (0.008)*** 0.104 (0.009)***
882 Sarah Bohn and Sarah Pearlman
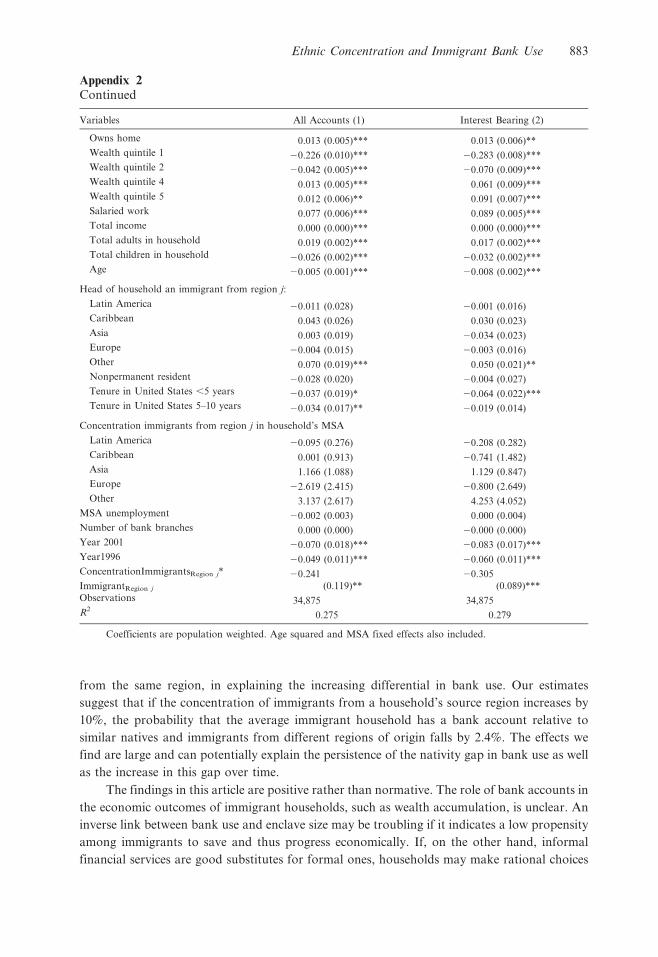
from the same region, in explaining the increasing differential in bank use. Our estimates
suggest that if the concentration of immigrants from a household’s source region increases by
10%, the probability that the average immigrant household has a bank account relative to
similar natives and immigrants from different regions of origin falls by 2.4%. The effects we
find are large and can potentially explain the persistence of the nativity gap in bank use as well
as the increase in this gap over time.
The findings in this article are positive rather than normative. The role of bank accounts in
the economic outcomes of immigrant households, such as wealth accumulation, is unclear. An
inverse link between bank use and enclave size may be troubling if it indicates a low propensity
among immigrants to save and thus progress economically. If, on the other hand, informal
financial services are good substitutes for formal ones, households may make rational choices
Variables All Accounts (1) Interest Bearing (2)
Owns home 0.013 (0.005)*** 0.013 (0.006)**
Wealth quintile 1 20.226 (0.010)*** 20.283 (0.008)***
Wealth quintile 2 20.042 (0.005)*** 20.070 (0.009)***
Wealth quintile 4 0.013 (0.005)*** 0.061 (0.009)***
Wealth quintile 5 0.012 (0.006)** 0.091 (0.007)***
Salaried work 0.077 (0.006)*** 0.089 (0.005)***
Total income 0.000 (0.000)*** 0.000 (0.000)***
Total adults in household 0.019 (0.002)*** 0.017 (0.002)***
Total children in household 20.026 (0.002)*** 20.032 (0.002)***
Age 20.005 (0.001)*** 20.008 (0.002)***
Head of household an immigrant from region j:
Latin America 20.011 (0.028) 20.001 (0.016)
Caribbean 0.043 (0.026) 0.030 (0.023)
Asia 0.003 (0.019) 20.034 (0.023)
Europe 20.004 (0.015) 20.003 (0.016)
Other 0.070 (0.019)*** 0.050 (0.021)**
Nonpermanent resident 20.028 (0.020) 20.004 (0.027)
Tenure in United States ,5 years 20.037 (0.019)* 20.064 (0.022)***
Tenure in United States 5–10 years 20.034 (0.017)** 20.019 (0.014)
Concentration immigrants from region j in household’s MSA
Latin America 20.095 (0.276) 20.208 (0.282)
Caribbean 0.001 (0.913) 20.741 (1.482)
Asia 1.166 (1.088) 1.129 (0.847)
Europe 22.619 (2.415) 20.800 (2.649)
Other 3.137 (2.617) 4.253 (4.052)
MSA unemployment 20.002 (0.003) 0.000 (0.004)
Number of bank branches 0.000 (0.000) 20.000 (0.000)
Year 2001 20.070 (0.018)*** 20.083 (0.017)***
Year1996 20.049 (0.011)*** 20.060 (0.011)***
ConcentrationImmigrantsRegion j* 20.241 20.305
ImmigrantRegion j (0.119)** (0.089)***
Observations 34,875 34,875
R20.275 0.279
Coefficients are population weighted. Age squared and MSA fixed effects also included.
Appendix 2Continued
Ethnic Concentration and Immigrant Bank Use 883
to remain unbanked. In this case, nativity gaps in bank use may not be linked with different
economic outcomes.
Our results have important implications for policymakers and financial institutions aiming
to increase bank use among immigrant households. Limited demand may play a major role in
deterring some immigrants from opening and maintaining back accounts, and understanding
the sources of muted demand is necessary for determining how to modify banking services
to reach underserved communities. Reliance on informal networks may help explain the
persistence of underserved communities and shed light on the limits of banking sector outreach
to them.
References
Ai, Chunrong, and Edward C. Norton. 2003. Interaction terms in logit and probit models. Economics Letters 80:123–9.
Amuedo-Dorantes, Catalina, and Cynthia Bansak. 2006. Money transfers among banked and unbanked Mexican
immigrants. Southern Economic Journal 73:374–401.
Andersson, Fredrik, Simon Burgess, and Julia Lane. 2009. Do as the neighbors do: The impact of social networks on
immigrant employment. IZA Discussion Paper No. 4423.
Bernanke, Ben. 2004. Opening remarks given at ‘‘Financial Access for Immigrants: Learning from Diverse Perspectives’’
Conference, Federal Reserve Bank of Chicago, April 16.
Bertrand, Marianne, Erzo Luttmer, and Sendhil Mullainathan. 2000. Network effects and welfare cultures. Quarterly
Journal of Economics 115:1019–55.
Bond, Philip, and Robert Townsend. 1996. Formal and informal financing in a Chicago ethnic neighborhood. Federal
Reserve Bank of Chicago, Economic Perspectives, July, 3–27.
Borjas, George. 1986. The self-employment experience of immigrants. Journal of Human Resources 21:485–506.
Borjas, George. 1995. Ethnicity, neighborhoods, and human-capital externalities. American Economic Review 85:365–90.
Borjas, George. 1998. To ghetto or not to ghetto: Ethnicity and residential segregation. Journal of Urban Economics
44:228–53.
Chiswick, Barry, and Paul Miller. 2005. Do enclaves matter in immigrant adjustment? City & Community 4:5–35.
Cobb-Clark, Deborah A., and Vincent A. Hildebrand. 2006. The wealth and asset holding of U.S.-born and foreign-
born households: Evidence from SIPP data. Review of Income and Wealth 52:17–42.
Cortes, Patricia. 2008. The effect of low-skilled immigration on US prices: Evidence from CPI data. Journal of Political
Economy 116:381–422.
Cutler, David, and Edward Glaeser. 1997. Are ghettos good or bad? Quarterly Journal of Economics 112:827–72.
Damm, Anna Piil. 2009. Ethnic enclaves and immigrant labor market outcomes: Quasi-experimental evidence. Journal of
Labor Economics 27:281314.
Edin, Per-Anders, Peter Fredriksson, and Olof Aslund. 2003. Ethnic enclaves and the economic success of immigrants—
Evidence from a natural experiment. Quarterly Journal of Economics 118:329–57.
Hellerstein, Judith, Melissa McInerney, and David Neumark. 2009. Spatial mismatch, immigrant networks, and
Hispanic employment in the United States. NBER Working Paper No. 15398.
LaLonde, Robert, and Robert Topel. 1991. Labor market adjustments to increase immigration. In Immigration, Trade
and the Labor Market, edited by John Abowd and Richard Freeman. Chicago: University of Chicago Press,
pp. 167–200.
Light, Ivan. 2006. Deflecting migration: Networks, markets and regulation in Los Angeles. New York: Russell Sage
Foundation.
Light, Ivan, and Zhong Deng. 1995. Gender differences in ROSCA participation within Korean business households in
Los Angeles. In Money-Go-Rounds: The Importance of Rotating Savings and Credit Associations for Women, edited
by Shirley Ardener and Sandra Burman. Oxford, UK: Berg, pp. 217–40.
Orrenius, Pia, and Madeline Zavodny. 2005. Self-selection among undocumented immigrants from Mexico. Journal of
Development Economics 78:215–40.
Osili, Una Okonkwo, and Anna Paulson. 2006. Immigrant-native differences in financial market participation. Federal
Reserve Bank of Chicago Working Paper 2004-18.
Passel, Jeffrey, and D’Vera Cohn. 2008. Trends in unauthorized immigration: Undocumented inflow now trails legal
inflow. Washington, DC: Pew Hispanic Center.
884 Sarah Bohn and Sarah Pearlman

Paulson, Anna, and Sherrie L. W. Rhine. 2008. Financial assimilation of an immigrant group: Evidence on the use of
checking and savings accounts. Journal of Family and Economic Issues 29:264–78..
Rhine, Sherrie L. W., and William H. Greene. 2006. The determinants of being unbanked for U.S. immigrants. Journal
of Consumer Affairs 40:21–40.
Rhine, Sherrie L. W., William H. Greene, and Maude Toussaint-Comeau. 2006. The importance of check-cashing
businesses to the unbanked: Racial/ethnic differences. Review of Economics and Statistics 88:146–57.
Suro, Robert, Sergio Bendixen, B. Lindsay Lowell, and Dulce Benavides. 2002. Billions in motion: Latino immigrants,
remittances and banking. Washington, DC: Pew Hispanic Center and Mulitlateral Investment Fund.
Washington, Ebonya. 2006. The impact of banking and fringe banking regulation on the number of unbanked
Americans. Journal of Human Resources 41:106–13.
Ethnic Concentration and Immigrant Bank Use 885