
Estimation of Ground Water Recharge in Shankergarh … · Allahabad (India) using Remote ... The...
15
Global Journal of Science, Engineering and Technology Issue 1, 2012, 34-48 . © GJSET Publishing, 2012. http://www.gjset.org 34 Estimation of Ground Water Recharge in Shankergarh block of Allahabad (India) using Remote Sensing and Statistical Approach KISHAN SINGH RAWAT 1 *, ANIL KUMAR MISHRA 1 , GEORGE PAUL 2 AND RAKESH KUMAR 3 1 Water Technology Centre, 3 Division of Agricultural physics, Indian Agricultural Research Institute, New Delhi-12, INDIA 2 Division of Civil, Indian Institute of Technology, New Delhi-12, INDIA [email protected] Abstract: - The present research work was undertaken to estimate the ground water recharge in Shankergarh block, Allahabad (India) during the year 2008. The data set used consisted of satellite derived rainfall and actual evapotranspiration and SCS-CN model estimated runoff values. The monthly values of the different components of water balance equation were estimated and subsequently the ground water recharge was estimated for the study area. The annual ground water recharge was found to be approximately 0.39 meter, which is nearly equal to estimated value of GWR (0.36 meter) from empirical model (Amritsar formula). The recharge was most prominent during the months of May, June, July, August, September and October because study area start rainfall occurring from April till October according to remote sensing data and record of last four years (2007-2010) rainfall data from Hydromet Division, India Meteorological Department, Allahabad district. The study gave a clear picture of the water accounting of the study area. A major portion of the precipitation was loss as runoff but a good part of rainfall going as ground water recharge and this can be attributed to the fact that the study region is predominantly an agricultural region. The precipitation is distributed evenly through the monsoon season and the runoff generated was very high (Annual runoff=880.35 mm) as compare to the ground water recharge (Annual GWR=393.69 mm). Key-words: - Ground water; MODIS, MOD16, NOAA, rainfall, remote sensing and GIS, Water Balance. 1 Introduction The growing world population has put a lot of strain on natural resources. Water as one of these resources is of absolute importance in regard to the health and economy of all countries. The United Nations Commission on Sustainable Development regards [1] water as one of the main issues facing the world [2]. The scarce water resources in arid and semi-arid regions are very obviously under increasing stress from the growing human population and are the focus of many challenges [3]. In the present times groundwater forms the primary drinking water source in arid and semi-arid regions, since river flows are unreliable and large fresh lakes are ephemeral or no longer exist [4]. Despite the increasing water stress in these areas, there is great diversity of physical environments and patterns of human occupation. Agriculture continues to play a central role in the livelihoods especially in under developing countries. Reliable water supplies, particularly those from groundwater are the lead input for increasing yields, reducing agricultural risk and stabilizing farm incomes. Over the past few decades the rules of use and exploitation have changed dramatically by the introduction of advanced drilling technology for groundwater, as well as the introduction of mechanized pumps [4]. In practice, falling water levels testify to probable over development and inadequate scientific understanding of the resources [4]. The effects of this include; degradation of groundwater quality, either as salinity increase or an increase in other undesirable constituents in the water, land surface changes in the form of general or local subsidence, disruption of the natural hydrological cycle due to reduced infiltration and
-
Upload
truongmien -
Category
Documents
-
view
214 -
download
0
Transcript of Estimation of Ground Water Recharge in Shankergarh … · Allahabad (India) using Remote ... The...

Global Journal of Science, Engineering and Technology Issue 1, 2012, 34-48 . © GJSET Publishing, 2012. http://www.gjset.org
34
Estimation of Ground Water Recharge in Shankergarh block of Allahabad (India) using Remote Sensing and Statistical Approach
KISHAN SINGH RAWAT1*, ANIL KUMAR MISHRA1, GEORGE PAUL2 AND RAKESH KUMAR3
1Water Technology Centre, 3Division of Agricultural physics, Indian Agricultural Research Institute, New
Delhi-12, INDIA 2Division of Civil, Indian Institute of Technology, New Delhi-12, INDIA
[email protected] Abstract: - The present research work was undertaken to estimate the ground water recharge in Shankergarh block, Allahabad (India) during the year 2008. The data set used consisted of satellite derived rainfall and actual evapotranspiration and SCS-CN model estimated runoff values. The monthly values of the different components of water balance equation were estimated and subsequently the ground water recharge was estimated for the study area. The annual ground water recharge was found to be approximately 0.39 meter, which is nearly equal to estimated value of GWR (0.36 meter) from empirical model (Amritsar formula). The recharge was most prominent during the months of May, June, July, August, September and October because study area start rainfall occurring from April till October according to remote sensing data and record of last four years (2007-2010) rainfall data from Hydromet Division, India Meteorological Department, Allahabad district. The study gave a clear picture of the water accounting of the study area. A major portion of the precipitation was loss as runoff but a good part of rainfall going as ground water recharge and this can be attributed to the fact that the study region is predominantly an agricultural region. The precipitation is distributed evenly through the monsoon season and the runoff generated was very high (Annual runoff=880.35 mm) as compare to the ground water recharge (Annual GWR=393.69 mm). Key-words: - Ground water; MODIS, MOD16, NOAA, rainfall, remote sensing and GIS, Water Balance.
1 Introduction The growing world population has put a lot of strain on natural resources. Water as one of these resources is of absolute importance in regard to the health and economy of all countries. The United Nations Commission on Sustainable Development regards [1] water as one of the main issues facing the world [2]. The scarce water resources in arid and semi-arid regions are very obviously under increasing stress from the growing human population and are the focus of many challenges [3]. In the present times groundwater forms the primary drinking water source in arid and semi-arid regions, since river flows are unreliable and large fresh lakes are ephemeral or no longer exist [4]. Despite the increasing water stress in these areas, there is great diversity of physical environments and patterns of human occupation. Agriculture continues to play a central role in the
livelihoods especially in under developing countries. Reliable water supplies, particularly those from groundwater are the lead input for increasing yields, reducing agricultural risk and stabilizing farm incomes. Over the past few decades the rules of use and exploitation have changed dramatically by the introduction of advanced drilling technology for groundwater, as well as the introduction of mechanized pumps [4]. In practice, falling water levels testify to probable over development and inadequate scientific understanding of the resources [4]. The effects of this include; degradation of groundwater quality, either as salinity increase or an increase in other undesirable constituents in the water, land surface changes in the form of general or local subsidence, disruption of the natural hydrological cycle due to reduced infiltration and
35
groundwater recharge [5, 6, 7]. Hence this ushers in the question of sustainability. Recharge is vital for the replenishment of groundwater. Ruston [8] defined recharge as water which can move vertically downwards from the base of the soil zone. Not only does the rate of groundwater recharge affect the sustainable volume of water that can be pumped from the aquifer, it also places a limit on the movement of contaminants oozing from landfills and radioactive waste disposal sites [9]. Estimating groundwater recharge is a key component in determining the sustainable yield of groundwater resources in arid and semi-arid regions [10, 11]. Groundwater resources management requires estimating groundwater recharge on large spatial and temporal scales; while detailed information on groundwater recharge is required for sitespecific studies and short time frames for assessing groundwater contamination [12, 13]. Good groundwater resources management practices require developing a water budget approach on a regional or large scale for an entire aquifer or geographic region [14]. There are many methods available for estimating saturated groundwater recharge. However, the amount of information that is needed depends on the complexity of the method [15, 16, 17, 18]. In arid and semi-arid areas, groundwater is often the only water resource, which is available around the year. Groundwater basins are not a resource in itself but long term storage reservoirs [19]. For their sustainable management the recharge is the most crucial factor required. Groundwater basins can be viewed as nested systems of recharge and discharge areas, with discharge appearing in the form of springs, streams or evapotranspiration [20]. The understanding of such systems is the prerequisite for their management. In arid and semi-arid areas like India, ground recharge is highly variable in space and time and its estimation is quite difficult. First, the recharge estimate depends on the water balance in which actual evapotranspiration is almost equal to effective precipitation [21]. Another factor which complicates recharge evaluation through desert vadose zones is the large spatial and temporal variability of water fluxes [22, 23, 24, 25]. This is due to low rainfall, high temperatures, low humidity and high rates of potential evaporation which results in a wide range of minimum and maximum amounts of recharge [26, 27, 28]. The knowledge of groundwater recharge is of great importance in many arid and semi-arid
environments [6]. Groundwater resources may be under threat of depletion due to over exploitation as irrigation demands increases [29]. Therefore, it is important and practical to have knowledge of recharge in any groundwater management scheme so that the rate of abstraction could be compromised to maintain the desirable groundwater levels [30]. The prevailing situation in the area under review is a Laissez-Faire kind of approach where each individual farmer or land owner abstracts the groundwater resource from their own sources at will, this might, if not controlled, pose danger to the groundwater storage in the aquifer [9, 24]. However, it is difficult to determine the properties of large aquifers, such as transmissivities, storage coefficients and similar parameters, in sufficient resolution. Modelling large aquifers is difficult and strenuous task [31]. But the essential information for water availability is the information on fluxes in and out of the storage [32]. For the evaluation of water balance of an underground reservoir many types of remote sensing data are available nowadays that can be employed [5, 11, 33, 34, 35, 36, 37]. The water balance of an underground storage reservoir is determined by precipitation, surface runoff and evapotranspiration and of course anthropogenic abstractions [38, 39].Directly or indirectly related remote sensing products are available in relatively high spatial resolution [40] for all these hydrological components. Protection, enhancement and restoration of groundwater, ensure a balance between abstraction and recharge of groundwater [41, 42]. With the aim of achieving good groundwater status the ground water commission is focusing on quantifying the groundwater occurrence and abstraction. To meet this directive it is cardinal that the recharge flux be known and quantified in order to formulate the proper groundwater management system in any environment. With the view to estimate the ground water recharge of the study area, this research work was formulated using the water balance concept. 1.1 About ground water recharge Part of the rain water, which falls on the ground, is infiltrated into the soil. This infiltrated water is utilized partly in filling the soil moisture deficiency and part of it is percolated down reaching the water table. This water reaching the water table is known as the recharge from rainfall to the aquifer. Recharge due to rainfall depends on various

36
hydrometeorological and topographic factors, soil characteristics and depth to water table. 1.2 Impotency of remote sensing and GIS in estimation of Ground water recharge The most important aspect of remote sensing systems is that they provide spatially complete and temporal information about the state of the Earth’s surface which helps hydrogeologists improve their understanding of the hydrogeological system, especially in remote and unexplored areas [43]. However, considering that the RS data have limitations with regard to depth penetration, the key for success in ground water investigations lies in understanding/establishing the linkage between surface manifestations (observed on remote sensing data) and the subsurface (ground water) phenomena [44]. This makes the hydrogeological interpretation/analysis as one of the most difficult tasks of all the hydrological applications of remote sensing [45, 46]. 1.3 Objective of the presented study The aim of this research is to use remote sensing data sets to help improve the estimation of regional groundwater recharge across the Shankergarh block, Allahabad (India). Such inputs include evapotranspiration (ET), precipitation (P), land cover, Elevation Model (DEM) and Runoff (by using CN methods). 1. To estimate evapotranspiration and understand its spatial and temporal over the Shankergarh block, Allahabad (India). 2. Estimate the regional precipitation over the twelve months of 2006 using satellite NOVAA data sets. 3. Estimate the regional Runoff over the twelve months of 2008 by using Soil Conservation Services (SCS-CN) Model. 4. Use GIS to apply water balance modeling to estimate groundwater recharge.
2 Study area The study was conducted to estimate the monthly values of the different components of water balance equation and subsequently determine the ground water recharge in Shankergarh block, Allahabad (India). The study was conducted for only one year (January to December 2008). The Shankergarh block is, situated in Allahabad district of Uttar Pradesh State, India; and is
bounded by latitudes 25° 02' 40.4" N to 25° 21' 41.0" N and longititudes 81° 42' 33.20" E to 82° 00' 12.55" E (Fig.1) falling in Survey of India (SOI) topographical maps 63G/11 and 63G/12, respectly. Geologically the area comprises of Upper Vindhayan formations consisting of mainly sandstone and shale. The area lies 45 km southwest of the Allahabad district on the Allahabad-Banda road and is situated on the right bank of river Yamuna. The area shows a nearly flat to a gently undulated topography with small hillocks with rolling topography. The minimum and maximum elevations of this area are 90 m (msl) and 180 (msl) respectively. It is drained by various order of drainage. 2.1 Phsiographic settings Phsiographically, the Trans-Yamuna region can be divided into two broad categories, viz, the northern plains of the Ganga and Yamuna and the southern rocky terrain of Vindhyan ranges, which are bounded by the valleys of the Yamuna and the Ganga in the north and Rewa high lands in the south, respectively. The northern plain of the Ganga and the yamuna comprises the northern portions of Karchhana, Meja and a part of Bara tehsils (Shankargarh Block) of Allahabad (U.P.). To the north of tehsil Karchhana, lies a ridge, formed by the high banks of the Yamuna and the Ganga, which ranges from about a kilometer and a half to 5 km in width, and is crowned with light sandy soil full of Kanker. It is scoured by numerous nalas, which carry off the water of the interior to the Ganga and the Yamuna. To the north of this ridge, there is a narrow strip of Kachhar region (low land of newer alluvia) which is more prominent near the confluence of the Ganga and Tons, near Sirsa, in the north-eastern part of tehsil Meja. To its south, lies the uplands (a strip of old alluvia), which comprises the central part of tehsil Karchhana and the tracts of Chaurasi and Manda in tehsil Meja. 2.2 Soils of the study area Basically the Vindhyan soils are formed by disintegration and weathering. Different types of soils in the area are loamy, sandy and alluvial. The physical content of the soil are influenced by the climatic conditions, vegetation cover and other factors. Alluvial soils are formed due to erosion mainly by water and landslips. In process, weathered material is transported and deposited at places other

37
than the origin. In such cases the underlying rock has a little role to play in influencing the vegetation on the alluvial soils. Such soils are found deposited in the basins of river and along the banks of river.
These uplands are covered with loam, except in the south-western part of tehsil Karchhana, where the soil is a mixture of clay and marsh. The southern uplands of Vidhyan series, which are bounded by the Rewa scarps in the south, and 100 meter contour in the north, can be sub-divided into three sections viz; (i) the Vidyachal-denuded lower upland, sloping to the north and the south, (ii) the central plateau and; (iii) the Panna range or the Rewa high lands. The Panna range or the Rewa high lands of the south, comprising the highest point of the Trans-Yamuna region of the Allahabad district, U.P., (India) is a highly dissected region. Steep slopes, having free-face, rectilinear and basal concave elements of slopes, and dissected valleys, are the main terrain characteristics the regions. 2.3 Climatic conditions The climatic condition in the region is semi- arid to semi-tropical in which the summers are very hot and the winters are very cool. The south western winds directly affect the climatic condition of the region. In the most of the season the climate is pleasant, the sky looks clean and blue, the winters are rainless. 2.3.1 Temperature There is continuous increase in temperature from March to May, May is also the hottest month with the mean daily maximum temperature at about 41 °C and the mean minimum at about 27 °C (Table 1). The weather is appreciably hot in summer and in individual days during May and the early part of June, the day temperature rises up to 46 °C or more. With the onset of the monsoon in the region by about the middle of June, there is an appreciable drop in the day temperature. After the withdrawal of the monsoon at the nights become progressively cooler. February is generally the coldest month with a mean daily maximum temperature of about 24 °C (Table 1). 2.3.2 Rainfall and Humidity About 91 per cent of the annual rainfall in the study area is received during the southwest monsoon in the months from June to September. The variation in the
annual rainfall from year to year is appreciable. The relative humidity is high during the Southwest monsoon. During the rest of the year the air is dry (Table 1).
3 Materials and method The methodology undertaken to determine the ground water recharge and the processing of different data products used for the present study is discussed in this section. The different components of the water balance equation for the tons river catchment area have been estimated to synthesize the ground water recharge as the residual field [14, 38, 47]. The study was conducted in Shankergarh block of Allahabad (India) district to estimate the monthly ground water recharge for the year 2008 because of the availability of satellite data products. The different components of the water balance were assimilated into monthly values [27, 36, 48]. 3.1 Water balance equation The water balance of a small drainage basin underlain by impervious rock at depth can be expressed as follows:
GWGWRSMOFETIP a (1)
where, P = Precipitatin, mm I = Interception, mm ETa = Actual evapotranspiration, mm OF = Overland flow, mm ΔSM = Change in soil moisture, mm GWR = Change in ground water storage or ground water recharge, mm GW = Ground water runoff or base flow, mm. 3.1.1 Precipitation The term precipitation denotes all forms of water derived from atmospheric vapour and deposited on the earth's surface. The daily rainfall values for the study region during the year 2008 were acquired as satellite data product from NOAA data centre ftp://ftpprd.ncep.noaa.gov/pub/cpc/fews/S.Asia/. The data processing to get the rainfall values in desired form was carried out and is explained in the next section.
Meteorological rainfall data of 2008 (Table 2) for study area is also use for validation of result from

38
remote sensing data. Rainfall data found from web side of Hydromet Division, India Meteorological Department. 3.1.2 Actual evapotranspiration The actual evapotranspiration was acquired as a product of MODIS sensor onboard TERA & AQUA satellites. The product is named as MOD16 and gives the 8 daily actual evapotranspiration at a spatial resolution of 1 km. The product is processed to get the monthly actual evapotranspiration required for the present water balance study. The processing steps are discussed in detail in the next section. 3.1.3 Runoff or overland flow
Estimation of direct runoff from the study area produced by the given precipitation is done through Soil Conservation Services (SCS-CN) Model (The SCS method of estimating runoff from storm rainfall was developed by USDA scientist). The SCS approach involves the use of simple empirical formula and various available tables and curves (Fig. 2). The empirical equation requires the rainfall and a watershed coefficient as inputs. The watershed coefficient is called the curve number (CN), which is an index that represents the combination of hydrologic soil group and land use and land treatment classes. This model involves relationship between land cover, hydrologic soil group and curve number. As satellite data can be use for estimating the land cover distribution, hence these provide useful input support for SCS model. Basic data requirement for this model are as follows:
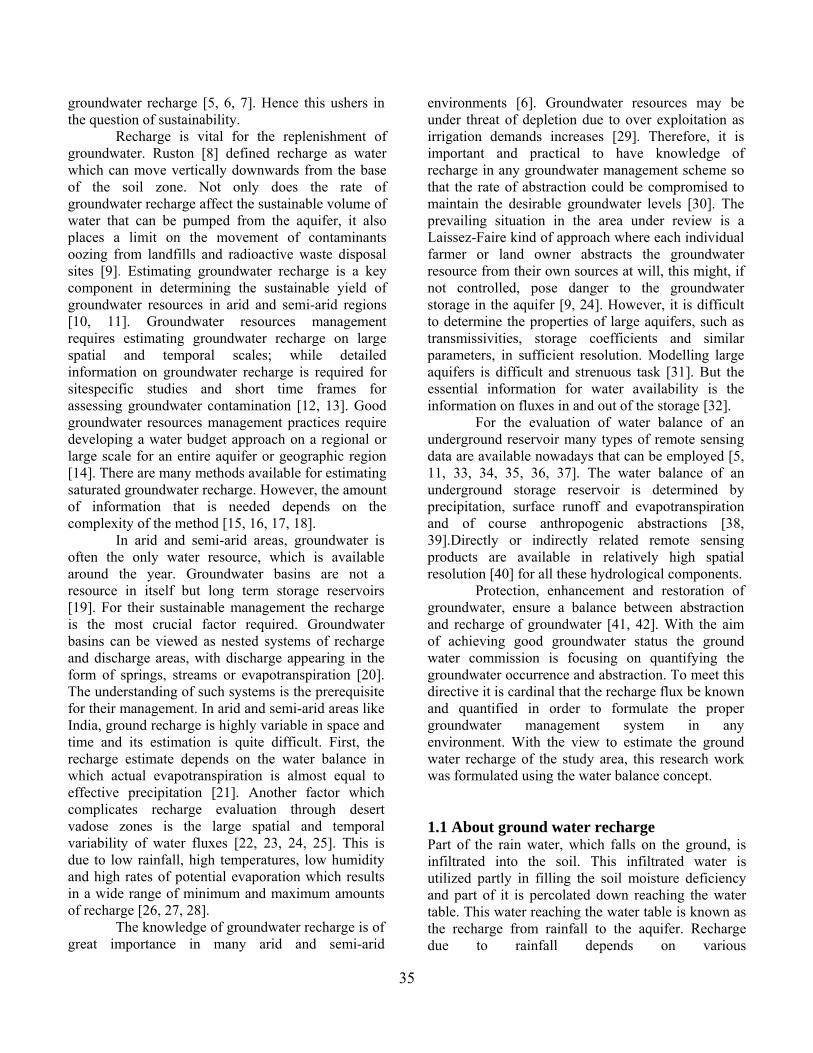
1. Types of land use/cover such as bare soil, vegetation, impervious surface agriculture land etc. and hydrology conditions (AMC) of each land use (Table 3).
2. The antecedent moisture condition which is the index of the soil condition with respect of runoff potential before the storm; it has three categories.
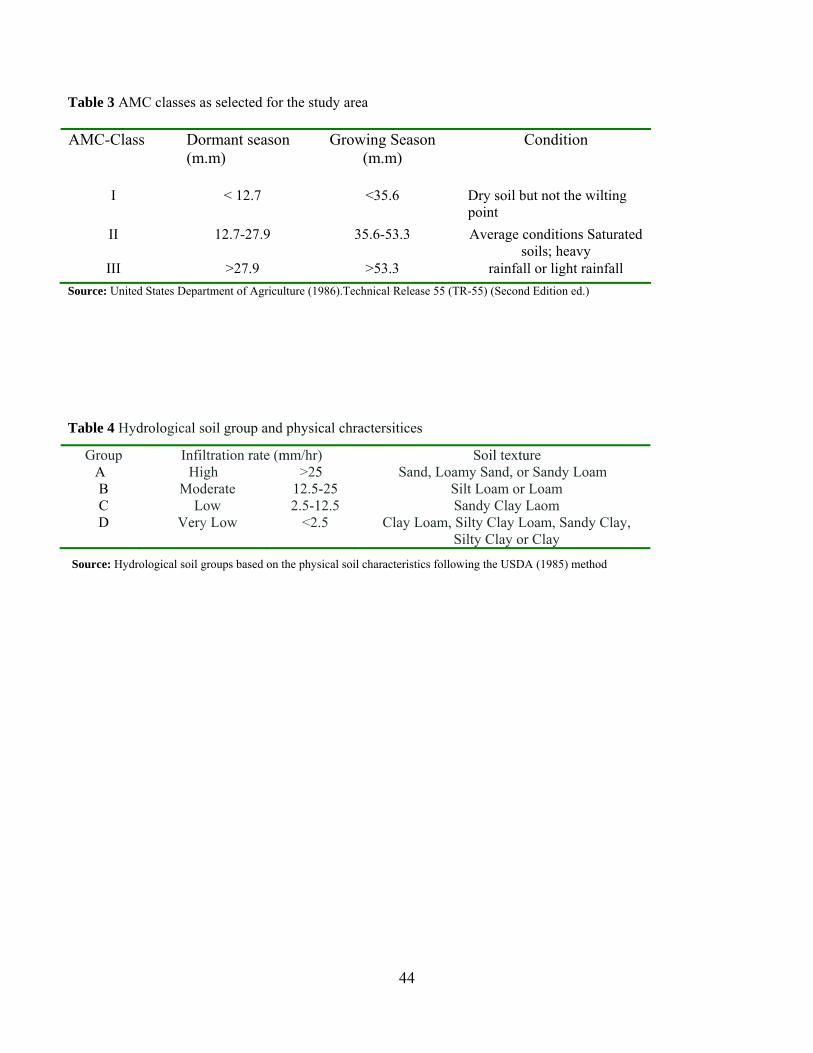
3. Hydrological Soil Group (HSG) provides four groups based on the basis of intake of water on bare soil when thoroughly wetted. The hydrological soil group classification based on texture of distributed soil is given in Table 4. The expression used in SCS-CN method for estimating runoff as applied in the analysis under the
study is given below.
SIP
IPQ
a
a
2
(2)
where, Q = Accumulated storm runoff, mm; P = accumulated storm rainfall, mm; and S = potential maximum retention of water by the soil. The Central Soil & Water Conservation Research & Training Institute (lCAR) Dehradun (India) gave empirical relation between S and Ia for Indian conditions which are as follows and were used in the present study; (a) Black soil region (AMC―II&III). Ia= 0.l S (b) Black soils region (AMC I). Ia = 0.3S (c) All other regions. Ia = 0.3S S value is derived from curve number (CN) using following formulae
CNS
25425400 (3)
where CN is function of watershed hydrologic land use/landcover units, hydrologic soil groups and antecedent moisture condition. The CN values can be obtained for different land uses and hydrologic condition from Table 5. The CN values (AMC-II) for the different hydrologic soil cover has also given in Table 4. Consequently the CN values for AMC-I & II is obtained using the following empirical equations;
CNII
CNIICNI
058.010
2.4 (4)
CNII
CNIICNIII
13.010
23 (5)
3.1.4 Ground water recharge The ground water recharge was calculated as a residual function of the water balance equation. The monthly values of all other components were been estimated and the ground water recharge on monthly basis determined. The process to calculate then ground water recharge is shown in the Figure 3. Here we assume that this calculated amount have the capacity to recharge the ground water i.e this is potential amount of water for recharge under prevailing condition. But ground water recharge are regulated by several factors such as climate (amount and intensity of rainfall and evaporation), Soil and

39
aquifer hydraulic properties, Type and amount of vegetation cover and types of land use, topography, nature and geometry of aquifers etc., and only fractional amount of this calculated recharge is take part in actual ground water recharge. 3.1.5 Empirical Method for Ground Water recharge (GWR) by Rainfall Several empirical formulae have been worked out for various regions in India on the basis of detailed studies. One of the simplest methods used for estimating recharge R is by empirical expressions of the given equation 6 type. R = 21 KPK (6)
where, P is Rainfall, and 1K & 2K are constants for recharge area
Amritsar formula of the commonly used formula is use here for estimation of ground water recharge through rainfall and tries validating to estimation of ground water recharge through Remote sensing and GIS techniques Amritsar formula :- Sehgal [49] developed a formula commonly called the Amritsar formula using regression analysis, Sehgal developed this formula in 1973 for Irrigation and Power Research Institute, Punjab.
5.0165.2 PR (7) where, R is GWR and P is Annual Rainfall, both are measured in inches. 3.2 Data products and its processing The different data products used in the study includes topographical maps, study area map and satellite data products (rainfall and actual ET), each of these products and their processing is discussed in detail in this section. 3.2.1 Rainfall data The remote sensing rainfall data product RFE2.0 from Climate Prediction Centre (CPC), NOAA was used in the study for each day of the 2006. The daily rainfall images are provided for the Southern Asia (70°-110°
E, 5°-35° N) beginning from May 01, 2001. The product is updated three times daily at around 9 am, 1 pm, and 9 pm Eastern Local Time and covers a 24-hour period of accumulated precipitation. Resolution
of rainfall estimates is 0.1 by 0.1 degree. The daily rainfall data product is generated by merging four kinds of individual input data sources (Figure 4). The infrared cloud top temperature fields derived from Meteosat, polar orbiting satellite precipitation estimate data from Special Sensor Microwave/ Imager (SSM/I) on board the Defense Meteorological Satellite Program, Advanced Microwave Sounding Unit (AMSU-B) on board the NOAA-15, 16 and 17 and Global Telecommunication System (GTS) station data (Figure 4). The merged analysis presents similar spatial distribution patterns with those of satellite estimates while its magnitude is close to the gauge-based analysis over areas with gauge data.The rainfall images were georeferenced using coordinates for first pixel and pixel size. The daily rainfall images were converted into monthly rainfall by adding up the 30 or 31 days rainfall starting from 1st of January 2008. 3.2.2 Actual evapotranspiration (ETa) The actual evapotranspiration data has been acquired from NASA EROS Data Center. The evapotranspiration data is a product derived from the MODIS sensor and is named as MOD16. MOD16 is a level 4 product and has a temporal resolution of eight days at a spatial resolution of 1 km over the land surface only [50]. The data was provided for the study period and region by the EROS Data Center. The data was in GMAO Meteorological format which was converted into float format using code written in C program. The Float format was directly imported into ILWIS 3.3 where further analysis was carried out.
4 Results and discussion The various components of the water balance equation, computed for the study area for the study year 2008 is presented in this paper. The ground water recharge calculated as the residual component is discussed on monthly basis for the study period. 4.1 Estimation of Precipitation The satellite derived daily precipitation was computed for the study region by taking the weighted average. The daily weighted average value was converted into monthly basis to study the monthly water balance scenario for the study area. The lowest rainfall recorded in the year 2008 was during the month of

40
March (0.29 mm) whereas the highest was during the month of September (393.52 mm). The total annual rainfall for the study area was computed as 1811.91 mm. The spatially distributed rainfall derived from satellite data, over the study region for the different months is shown in figure 5. The spatial rainfall maps show the highly distributive nature of the rainfall over the study area. For the study area of 53675.5 hectares the satellite rainfall gives 6 to 8 different values. The precipitation value is the most important component of the water balance equation and influences all other parameters of the equation. The daily precipitation values were used to determine the runoff and losses from the study area. The actual evapotranspiration values for the study region during the year 2008 was acquired as MODIS satellite product and processed to convert into monthly values. The weighted average values were computed from the spatial maps. The lowest evapotranspiration recorded in the year 2008 for the study area was during the month of May (11.80 mm) whereas the highest was for the month of September (32.37 mm). The spatially distributed actual evapotranspiration, derived from MODIS satellite data product, over the study region for the different months is shown in figure 6. 4.2 Estimation of overland runoff (OF) The overland runoff for the study region was computed using SCS curve number method. The study area was presumed to be primary agricultural land with soil type clay loamy. The curve number (CN) for this specific land use and soil group was taken as 75. Runoff discharge was available for only 6 months with highest discharge of 212.90 mm in the month of September. Annual runoff from the study region was estimated to be 880.35 cm which was merely 45 per cent of the total precipitation. Table 6 shows the monthly runoff value for the study area during the year 2008. 4.3 Estimation of ground water recharge (GWR) The ground water recharge was estimated from the water balance equation as a residual factor. The equation is as follows:
factorunknowfromlossesOFETPGWR a %20 (8)
The monthly values of the water balance components are shown in table 6.The computed
monthly ground water recharge value show high for month’s June (92.15 mm), July (38.29 mm), August (75.61 mm), September (69.55 mm) and October (72.69 mm) of rainfall going into recharge. The highest recharge was seen in the month of June (92.15 mm) and the lowest was in the month of December (0.55 mm). The first four months showed no recharge owing to negligible precipitation. A comparative plot showing the variation of water balance component was plotted and is shown in figure 7. The ground water recharge is seen as a major component in the water balance. 4.2.1 Ground water recharge (GWR) by empirical method By using Amritsar formula (eq 6) which is base on regression analysis and shows annual ground water recharge nearly equal (0.36 m) to result of ground water recharge estimation through remote sensing and GIS (0.39 m) only 0.03 meter differences from two different ways (table 7). Result empirical model for ground water recharge, which is support to result from remote sensing and GIS. Differences of 0.03 meter may be improved if some other factor use in equation 8.
5 Conclusions The study gave a clear picture of the water accounting of the study area. A major portion of the precipitation was going as ground water recharge and this can be attributed to the fact that the study region is predominantly an agricultural region. The precipitation is distributed evenly through the monsoon season and the sufficient runoff was generated. The data set used consisted of satellite derived rainfall data; satellite derived actual evapotranspiration data and SCS-CN model runoff values were used to estimate ground water recharge. The annual potential ground water recharge was found to 0.39 meter. The recharge was most prominent during the six months May (27.89 mm), June (92.15 mm), July (38.29 mm), August (75.61 mm), September (69.55 mm) and October (72.69 mm).

41
References [1] United Nations Commission on Sustainable Development (UNCSD) Report on the Fifth Session (7-25 April 1997). Economic and Social Council Official Records, 1997 Supplement No. 9 [2] United Nations World Water Development (UNWWD) report, 2003. http://www.hmtreasury.gov.uk/independent_reviews/stern_review_economics_climate_change/stern eview_index.cfm. (DOC: 2/10/2007) [3] M. Leblanc, G. Favreau, S. Tweed, C. Leduc, M. Razack, L. Mofor, Remote sensing for groundwater modelling in large semiarid areas: Lake Chad Basin, Africa, Hydrogeology Journal, Vol. 15, 2007, pp. 97-100. [4] Edmunds, W. M.; Fellman, E; Goni, I.B.; Prudhomme, C. Spatial and temporal distribution of groundwater recharge in northern Nigeria. Hydrogeol. J. Vol. 10, No. 1, 2002, pp. 205-215. [5] T. S. Anuraga, L. Ruiz, M. S. Mohan Kumar, M. Sekhar, Leijnse, A. Estimating groundwater recharge using land use and soil data: A case study in South India. Agricultural Water Management, Vol. 84, 2006, pp. 65-76. [6] V. M. Chowdary, N. H. Raob, P. B. S. Sarma, GIS-based decision support system for groundwater assessment in large irrigation project areas, Agricultural Water Management, Vol. 62, 2003, pp. 229-252. [7] M. Civita, Data needs and presentation. In: Guidebook on Mapping Groundwater Vulnerability, ed. J. Vrba & A. Zaporozec, International Association of Hydrogeologists, Vol. 16, 1995, pp. 57-73. [8] B. R. Scanlon, R.W. Healy, P.G. Cook, Choosing appropriate techniques for quantifying ground water recharge, Hydrogeology Journal, Vol. 10, 2002, pp.18-39. [9] A. Chomba, Recharge estimate in Moura-Ficalho aquifer: using EARTH model. 2004. M.Sc. Thesis, lTC, Enschede, The Netherlands. [10] G. Bekesi, J. McConchie, Groundwater recharge modelling using the Monte Carlo technique, Manawatu region, New Zealand, Journal of Hydrology, Vol. 224, 1999, pp. 137-148. [11] E. Kendy, Y. Zhang, C. Liu, J. Wang, T. Steenhuis, Groundwater recharge from irrigated cropland in the North China Plain: case study of Luancheng County, Hydrological Processes,Vol. 18, 2004, pp. 2289-2302. [12] J. Rueedi, M. S. Brennwald, R. Purtschert, U. Beyerle, M. M. Hofer, R. Kipfer, Estimating amount and spatial distribution of groundwater recharge in the lullemmeden basin (Niger) based on 3H, 3He and CFC-
ll measurements, Hydrological Processes, Vol. 19, 2005, pp. 3285-3298. [13] J. Vrba, M. Civita, Assessment of groundwater vulnerability. In: Guidebook on Mapping Groundwater Vulnerability, ed. J. Vrba & A. Zaporozec, Vol. 6, 1995, pp. 31-38. [14] Cherkauer, D. S. Quantifying ground water recharge at multiple scales using PRMS and GIS. Ground Water 42, Vol. 1, 2004, pp. 97–110. [15] C. P. Kumar, P. V. Seethapathi, Assessment of Natural Groundwater Recharge in Upper Ganga Canal Command Area, Journal of Applied Hydrology, Vol. XV, No. 4, October 2002, pp. 13-20. [16] Y. F. Lin, J. Wang, A. J. Valocchi, Making groundwater recharge and discharge estimate maps in one day: An Arc GIS 9.2 application for water resources research, Arc User 11. 2008b, 1, pp. 32-35. [17] M. W. Stoertz, A new method for mapping ground water recharge areas and for zoning recharge for an inverse model. 1989, Ph.D. thesis, University of Wisconsin–Madison. [18] K. Zaninovi, M. Gaji, Capka, Changes in components of the water balance in the Croatian Lowlands, Theoretical and Applied Climatology, Vol. 65, 2000, pp. 111-117. [19] A. Jeyaram, S. A. Faruqui, R. J. Karale, A. K. Sinha, Groundwater investigations using 1RS, LISS-II data in Nagpur district. In: Natural Resources Management - a new perspective, ed. R. J. Karale, 1992, pp. 459-464. [20] J. Boonstra, M. N. Bhutta, Groundwater recharge in irrigated agriculture: the theory and practice of inverse modelling, Journal of Hydrology, Vol. 174, 1996, pp. 357-374. [21] W. P. Kustas, E. M. Perry, P. C. Doraiswamy, M. S. Moran, Using satellite remote sensing to extrapolate evapotranspiration estimates in time and space over a semiarid rangeland basin, Remote Sensing of Environment, Vol. 49, 1994, pp. 275-286. [22] W. R. Dripps, K. R. Bradbury, A simple daily soil water balance model for estimating the spatial and temporal distribution of groundwater recharge in temperate humid areas, Hydrogeology Journal, Vol. 15, No.3, 2007, pp. 433-444. [23] Limbrick, K. J. Estimating daily recharge to the Chalk aquifer of southern England -a simple methodology, Hydrology and Earth System Sciences, Vol. 6, No. 3, 2002, pp. 485-495. [24] K. R. Ruston, Groundwater Hydrology, Conceptual and Computational Models, John Wiley. 2003, pp. 165–167.

42
[25] W. Boughton, Catchment water balance modeling III Australia 1960-2004, Agricultural Water Management, Vol. 71, 2005, pp. 91-116. [26] J. W. Finch, Estimating direct groundwater recharge using a simple water balance model- sensitivity to land surface parameters, Journal of Hydrology, Vol. 211, 1998, pp. 112-125. [27] Z. H. Ghulam N. B. Muhammad, A water balance model to estimate groundwater recharge in Rechna doab, Pakistan, Irrigation and Drainage Systems, Vol. 10, 1996, pp. 297-317. [28] D. El Hadanai, N. Limam, R. El Meslouhi, Remote sensing applications to groundwater resources, In: Proc. Int. Symp. Operationalization of Remote Sensing, Vol. 9, 1993, pp. 93-103. [29] J. W. Finch, The contribution made by remotely sensed data to a study of groundwater recharge in a semi-arid environment, In: Int. Symp. Remote Sensing & Water Resources. 1990, pp. 573-577. [30] Y. F. Lin, J. Wang, A. J. Valocchi, A new GIS approach for estimating shallow groundwater recharge and discharge, Transaction in GIS 12, Vol. 4, 2008a, pp. 459–474. [31] F. H. Jaber, S. Shukla, S. Srivastava, Recharge, upflux and water table response for shallow water table conditions in southwest Florida, Hydrological Processes,Vol. 20, 2006, pp. 1895-1907. [32] A. G. Bobba, R. P. Bukata, J. H. Jerome, Digitally processed satellite data as a tool in detecting potential groundwater flow systems, Journal of Hydrology, Vol. 131, 1992, pp. 25-62. [33] A. M. J. Meijerink, Application of remote sensing and geographic information systems, In: IAH Proc. Netherlands Hydrogeology Research in Int. Coop, 1994, pp. 27-38. [34] A. M. J. Meijerink, H. A. M. de Brouwer, C. R. Valenzuela, C. M. Mannaerts, Introduction to the use of geographic information systems for practical hydrology, UNESCO, IHP and ITC Publ. 1994, 23. [35] D. Wencai, Y. Deliao, Methods for recognizing and extracting groundwater information from remote sensing data, In: Proc. Int. Symp. Operationalization of Remote Sensing, Vol. 9, 1993, pp. 105-111. [36] P. Waters, P. Greenbaum, L. Smart, H. Osmaston, Applications of remote sensing to groundwater hydrology, Remote Sensing Reviews. Vol. 4, No. 2, 1990, pp. 223-264. [37] R. Tateishi, C. H. AIm, Mapping
evapotranspiration and water balance for global land surfaces, ISPRS Journal of Photogrammetry & Remote Sensing, Vol. 51, 1996, pp. 209-215. [38] C. Y. XU, D. Chen, Comparison of seven models for estimation of evapotranspiration and groundwater recharge using lysimeter measurement data in Germany, Hydrological Processes, Vol. 19, 2005, pp. 3717-3734. [39] P. Brunner, H. J. Hendricks Franssen, L. Kgotlhang, P. Bauer-Gottwein, W. Kinzelbach, How can remote sensing contribute in groundwater modeling?, Hydrogeology Journal, Vol. 15, No. 1, 2007, pp. 5-18. [40] R. B. Bradford, R. Ragab, S. M. Crooks, F. Bouraoui, E. Peters, Simplicity versus complexity in modelling groundwater recharge in Chalk catchments, Hydrology and Earth System Sciences, Vol. 6, No. 5, 2002, pp. 927-937. [41] R. Chatterjee, R. R. Purohit, Estimation of replenishable groundwater resources of India and their status of utilization, Current Science, Vol. 96, 2009, pp. 12-25 [42] J. Hoffmann, P. Sander, Remote sensing and GIS in hydrogeology, Hydrogeology Journal, Vol. 15, No. 1, 2007, pp. 1-3. [43] T.J. Jackson, Remote sensing of soil moisture: implications for groundwater recharge, Hydrogeology Journal,Vol. 10: 2002. pp. 40-51. [44] M.W. Becker, Potential for satellite remote sensing of groundwater, Ground Water, Vol. 44, No. 2, 2006. pp. 306-318. [45] A.M.J. Meijerink, D. Bannert, O. Batelaan, M.W. Lubczynski, T. Pointet, Remote sensing applications to groundwater, 2007, IHP-VI Series on Groundwater, No. 16, UNESCO, Paris, France. [46] F. H. S. Chiew, T. A. McMahon, Estimating groundwater recharge using a surface watershed modelling approach, Journal of Hydrology. Vol. 114, 1990, pp. 285-304. [47] A. Rango, Application of remote sensing methods to hydrology and water resources, Hydrological Sciences Journal,Vol. 39, 1994, pp. 309-319. [48] S. P. Sehgal, Groundwater resources of Punjab state. III Annual Research Session of CBIP, 1973, New Delhi [49] B. J. Choudhury, Synergism of multipsectral satellite observations for estimating regional land surface evaporation, Remote Sensing of Environment, Vol. 49, 1994, pp. 264-274.

43
Table 1 Ten years average (1994-2006) maximum and minimum temperature and rainfall
Month/ Year Maximum average temp.(°C)
Minimum average temp.(°C)
average rainfall (mm)
January 22.03 7.75 15.8 February 26.54 11.17 19.0 March 33.09 15.79 3.8 April 38.88 22.9 5.4 May 41.41 26.72 9.4 June 39.40 27.84 103.8 July 34.55 26.27 281.0 August 33.18 25.78 266.0 September 32.66 24.49 216.3 October 33.23 20.37 39.1 November 30.02 14.05 10.1 December 24.78 8.61 11.0
Source: Air Force Station, Bamrauli, Allahabad
Table 2 Ther rainfall data of Allahabad district for last four year
Source: Hydromet Division, India Meteorological Department, Allhabad, (U.P.)
Months 2007 Rainfall (mm)
2008 Rainfall (mm)
2009 Rainfall (mm)
2010 Rainfall (mm)
January 0.1 0.6 0 3.6 February 75.8 10 0.5 19.5 March 25.1 0 14.4 0 April 1.2 3.1 3.2 0.5 May 21.9 38.5 26.8 7.5 June 77 322.4 3.1 8.5 July 295.4 446.9 172.7 201.7 August 295.4 326.1 64.8 160.6 September 209.2 67.5 177.8 126.4 October 2.8 20.3 33.6 45.5 November 0 1.7 15.9 5.3 December 5.4 0 6 0 Annual (mm) 1009.3 1237.1 518.8 579.1 Annual (inch) -- 48.7 -- -- Annual (m) -- 1.24 -- --
44
Table 3 AMC classes as selected for the study area
AMC-Class Dormant season
(m.m) Growing Season
(m.m) Condition
I < 12.7 <35.6 Dry soil but not the wilting point
II 12.7-27.9 35.6-53.3 Average conditions Saturated soils; heavy
III >27.9 >53.3 rainfall or light rainfall
Source: United States Department of Agriculture (1986).Technical Release 55 (TR-55) (Second Edition ed.)
Table 4 Hydrological soil group and physical chractersitices
Group Infiltration rate (mm/hr) Soil texture A High >25 Sand, Loamy Sand, or Sandy Loam B Moderate 12.5-25 Silt Loam or Loam C Low 2.5-12.5 Sandy Clay Laom D Very Low <2.5 Clay Loam, Silty Clay Loam, Sandy Clay,
Silty Clay or Clay
Source: Hydrological soil groups based on the physical soil characteristics following the USDA (1985) method

45
Table 5 Runoff curve numbers for hydrological soil cover complexes as selected for the Tons river catchment
Source: United States Department of Agriculture (1986).Technical Release 55 (TR-55) (Second Edition ed.)
Land use description on input screen
Description and curve numbers from TR-55
Cover description Curve number for hydrologic soil group
Cover type and hydrologic condition % Imper- vious areas
A B C D
Agricultural Row crops-staight rows + crop residue cover-good condition
64 75 82 85
Commercial Urban districts: commercial and business 85 89 92 94 95
Forest Woods-good condition 30 55 70 77
Grass/Pasture Pasture, grassland, or range-good condition 39 61 74 80
High Density Rsidential
Residential districts by average lot size:1/8 acre or less
65 77 85 90 92
Industrial Urban district: industrial 72 81 88 91 93
Low Density Residential
Residential districts by average lot size:1/2 acre lot 25 54 70 80 85
Open Spaces Open space (lawns,parks,golf courses,50%to70%) 49 69 79 84
Parking and Paved Spaces
Impervious areas: paved parking lots, roofs,drivesways,etc.(excluding right-of-way)
100 98 98 98 98
Residentil 1/8 acre Residential districts by average lot size:1/8 acre 65 77 85 90 92
Residential 1/4 acre
Residential districts by average lot size:1/4 acre 38 61 75 83 87
Residential 1/3 acre
Residential districts by average lot size:1/8 acre 30 57 72 81 86
Residential 1/2 acre
Residential districts by average lot size:1/2 acre 25 54 70 80 85
Residential 1acre Residential districts by average lot size:1 acre 20 51 68 79 84
Residential 2acre Residential districts by average lot size:2 acre 12 46 65 77 82
Water/Wetlands 0 0 0 0 0

46
Table 6 The monthly values of the water balance components in Shankergarh block, Allahabad (India)
Months Rainfall (mm)
ETa (mm)
Runoff (mm)
20 % loss of Rainfall (mm)
Ground water Recharge
(mm) January 0.97 16.06 0 0.194 0 February 1.17 16.87 0 0.234 0 March 0.29 19.14 0 0.058 0 April 21.48 19.14 0.20 4.30 0 May 144.18 11.80 75.65 28.84 27.89 June 289.51 13.81 125.65 57.90 92.15 July 235.39 19.86 130.16 47.08 38.29 August 319.10 22.15 157.52 63.82 75.61 September 393.52 32.37 212.90 78.70 69.55 October 268.71 29.62 112.66 53.74 72.69 November 102.93 22.62 47.81 20.59 11.91 December 37.09 16.12 13.00 7.42 0.55 Annual (mm) 1811.91 175.49 880.35 362.38 393.69 Annual (inch) 71.34 6.91 34.66 14.27 15.50 Annual (m) 1.81 0.18 0.88 0.36 0.39
(1 metter = 39.37007874 Inch) Table 7 Comparegion of Ground water recharge in Study area by two different ways
Ground water recharge using Remote sensing and GIS Techniques 0.39 meter Ground water recharge using Empirical Mode (Amritsar formula) 0.36 meter Diffrances in Ground water recharge by both Techniques 0.03 meter


Figure 13. Monthly water balance
components in Shankergarh block, Allahabad (India) during the year 2008.