Estimation of Age-Specific Migration in an Age...
60
Resiliency of Gadid Stocks to Fishing and Climate Change 161 Alaska Sea Grant College Program • AK-SG-08-01, 2008 Estimation of Age-Specific Migration in an Age-Structured Model Sara E. Miller and Terrance J. Quinn II University of Alaska Fairbanks, Juneau Center, School of Fisheries and Ocean Sciences, Juneau, Alaska James N. Ianelli NOAA National Marine Fisheries Service, Alaska Fisheries Science Center, Resource Ecology and Fisheries Management Division, Seattle, Washington Abstract The standard Eastern Bering Sea (EBS) walleye pollock ( Theragra chalco- gramma) age-structured stock assessment model has no spatial dimen- sion. To better understand its dynamics on finer spatial and temporal scales, an age-specific movement (ASM) model was developed. The ASM model stratifies the assessment data into two regions (northwest [NW] and southeast [SE] EBS), includes movement, and allows population parameters to be region-specific. The ASM model was used to evaluate hypotheses on age-specific movement between the NW and SE and cov- ered years 1977 to 2005 and ages-3 to 10+. Estimates of biomass and population parameters from the ASM model were similar to those of the standard stock assessment model. The ASM model fitted the yearly observed catch numbers and yield, and catch-age composition data well, but some population parameters were highly uncertain or highly cor- related. More in-depth information on finer spatial and temporal scales is needed from spatially explicit studies of EBS walleye pollock. Having additional information from a mark-recapture study would help to sta- bilize the ASM model and allow some assumptions to be relaxed.
Transcript of Estimation of Age-Specific Migration in an Age...
Resiliency of Gadid Stocks to Fishing and Climate Change 161Alaska Sea Grant College Program • AK-SG-08-01, 2008
Estimation of Age-Specific Migration in an Age-Structured Model Sara E. Miller and Terrance J. Quinn IIUniversity of Alaska Fairbanks, Juneau Center, School of Fisheries and Ocean Sciences, Juneau, Alaska
James N. IanelliNOAA National Marine Fisheries Service, Alaska Fisheries Science Center, Resource Ecology and Fisheries Management Division, Seattle, Washington
AbstractThe standard Eastern Bering Sea (EBS) walleye pollock (Theragra chalco-gramma) age-structured stock assessment model has no spatial dimen-sion. To better understand its dynamics on finer spatial and temporal scales, an age-specific movement (ASM) model was developed. The ASM model stratifies the assessment data into two regions (northwest [NW] and southeast [SE] EBS), includes movement, and allows population parameters to be region-specific. The ASM model was used to evaluate hypotheses on age-specific movement between the NW and SE and cov-ered years 1977 to 2005 and ages-3 to 10+. Estimates of biomass and population parameters from the ASM model were similar to those of the standard stock assessment model. The ASM model fitted the yearly observed catch numbers and yield, and catch-age composition data well, but some population parameters were highly uncertain or highly cor-related. More in-depth information on finer spatial and temporal scales is needed from spatially explicit studies of EBS walleye pollock. Having additional information from a mark-recapture study would help to sta-bilize the ASM model and allow some assumptions to be relaxed.

162 Miller et al.—Age-Specific Migration
IntroductionFish are mobile creatures so it seems natural to include movement and spatial structure in a model that estimates abundance and affects fisheries management policies. Yet, movement and spatial structure of fish populations are infrequently incorporated into stock assessment (Quinn and Deriso 1999, Chapter 10). Ignoring spatial structure can lead to misinterpretations of basic population-dynamic processes (Härkönen and Harding 2001), and ignoring movement can lead to errors in detect-ing potential stock declines (Nielsen 2004, Chapter 1).
Walleye pollock (Theragra chalcogramma) is the dominant species in the commercial groundfish catch off Alaska. In 2003, the eastern Bering Sea (EBS)–Aleutian Islands walleye pollock fishery accounted for 76% of the groundfish catch (1.49 million metric tons [t]) and 63% of the total ex-vessel value ($302 million dollars) (Hiatt et al. 2004). Of this catch, 0.36 million t were caught in the northwest (NW) EBS, and 1.13 million t were caught in the southeast (SE) EBS (Ianelli et al. 2004) (Fig. 1).
The modern fishery (since the early 1990s) has had two seasonal components: a winter roe fishery on spawning aggregations (“A-season”) with an opening on January 20, and a summer/fall “B-season” opening in mid-late June (prior to 2000 the opening was later). Beginning in 2002, the A-season was allocated 40% of the catch and the B-season, 60%. Both seasons’ lengths depend on the catch rates (Ianelli et al. 2005). Juvenile
Figure 1. Fishery management areas and the hydroacoustic (EIT) survey are divided between the NW and SE Eastern Bering Sea by 170ºW. Area 518 is the Bogoslof district and areas 541-543 encompass the Aleutian Islands region.

163Resiliency of Gadid Stocks to Fishing and Climate Change
walleye pollock reach sexual maturity and recruit to the fishery at about age-4 at lengths of 40 to 45 cm (Wespestad 1993).
The stock structure of walleye pollock in the EBS is poorly under-stood (Ianelli 2005). Walleye pollock exhibit movements throughout their life history and during the year. During the spring and summer EBS walleye pollock migrate to feeding areas, and during the winter they migrate to spawning areas. Most walleye pollock populations spawn during the late winter and early spring (Mulligan et al. 1989, Bailey et al. 1999).
Interannual variations in walleye pollock recruitment are important because they drive the annual population size that affects higher and lower trophic levels and the harvest levels of the fishery. Walleye pol-lock recruitment is determined by both biological (egg production, can-nibalism, predators, food sources, spawning biomass, larval mortality, year-class strength), and environmental-oceanographic (temperature, storms, ice cover and retreat, currents, cold-pool) factors (Wespestad et al. 2000, Mueter et al. 2006).
Studies have shown that there are differences in the biological and behavioral aspects of walleye pollock in the NW and SE EBS (Fig. 1). Walleye pollock in the NW EBS are slightly smaller and have lower average growth rates than walleye pollock in the SE EBS (Lynde et al. 1986, Ianelli et al. 2004). Differences in cannibalism rates, spawn tim-ing, feeding rate, and reproductive output may also occur between the SE and NW EBS. Some of these observations can be explained by the hypothesis that as walleye pollock get older (ages 3+), there is a gen-eral ontogenetic movement from the NW to SE EBS (Bailey et al. 1999, Buckley et al. 2001).
The standard EBS walleye pollock stock assessment model is an age-structured population dynamics model (Quinn and Deriso 1999, Chapter 8; Ianelli et al. 2004). The main structure of the model is repre-sented by “true” but unobservable population numbers-at-age that are based on an array of parameters for fishing and natural mortality, and recruitment, some of which are estimated within the model. Fishing mortality is parameterized to be semi-separable with both year and age (selectivity) components. Parameters such as mean weights-at-age and -year, maturity-at-age, and natural mortality are estimated inde-pendently of the model.
Currently there are no estimates of EBS walleye pollock movement rates. We determined if age-specific movement could be estimated from the current disaggregated assessment survey and fishery data. We tested the two following hypotheses: (1) The age-specific movement (ASM) model can estimate migration without movement (tagging) data, but with a great deal of uncertainty; and (2) The ASM model performs better than a non-movement version of the spatial, two-season ASM model.
164 Miller et al.—Age-Specific Migration
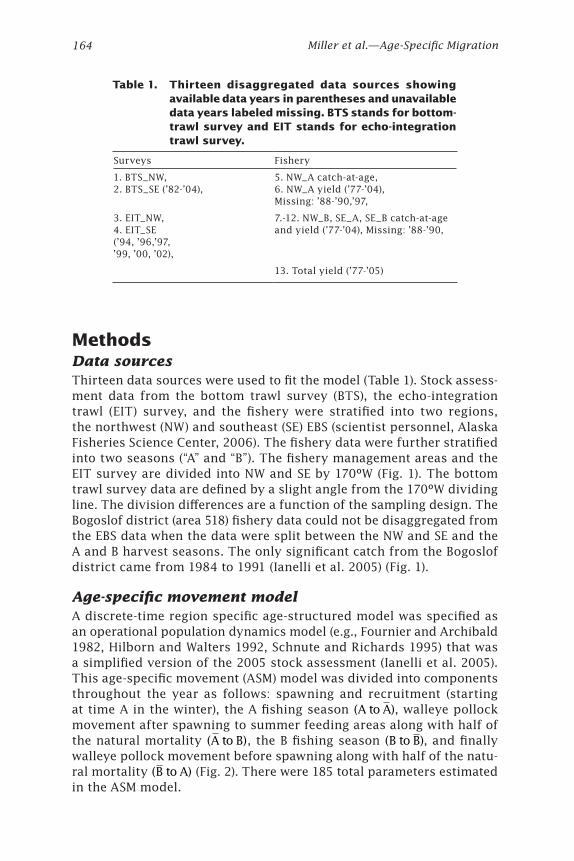
MethodsData sourcesThirteen data sources were used to fit the model (Table 1). Stock assess-ment data from the bottom trawl survey (BTS), the echo-integration trawl (EIT) survey, and the fishery were stratified into two regions, the northwest (NW) and southeast (SE) EBS (scientist personnel, Alaska Fisheries Science Center, 2006). The fishery data were further stratified into two seasons (“A” and “B”). The fishery management areas and the EIT survey are divided into NW and SE by 170ºW (Fig. 1). The bottom trawl survey data are defined by a slight angle from the 170ºW dividing line. The division differences are a function of the sampling design. The Bogoslof district (area 518) fishery data could not be disaggregated from the EBS data when the data were split between the NW and SE and the A and B harvest seasons. The only significant catch from the Bogoslof district came from 1984 to 1991 (Ianelli et al. 2005) (Fig. 1).
Age-specific movement modelA discrete-time region specific age-structured model was specified as an operational population dynamics model (e.g., Fournier and Archibald 1982, Hilborn and Walters 1992, Schnute and Richards 1995) that was a simplified version of the 2005 stock assessment (Ianelli et al. 2005). This age-specific movement (ASM) model was divided into components throughout the year as follows: spawning and recruitment (starting at time A in the winter), the A fishing season (A to A), walleye pollock movement after spawning to summer feeding areas along with half of the natural mortality (A to B), the B fishing season (B to B), and finally walleye pollock movement before spawning along with half of the natu-ral mortality (B to A) (Fig. 2). There were 185 total parameters estimated in the ASM model.
Table 1. Thirteen disaggregated data sources showing available data years in parentheses and unavailable data years labeled missing. BTS stands for bottom-trawl survey and EIT stands for echo-integration trawl survey.
Surveys Fishery
1. BTS_NW,2. BTS_SE (’82-’04),
5. NW_A catch-at-age, 6. NW_A yield (’77-’04), Missing: ’88-’90,’97,
3. EIT_NW, 4. EIT_SE(’94, ’96,’97, ’99, ’00, ’02),
7.-12. NW_B, SE_A, SE_B catch-at-age and yield (’77-’04), Missing: ’88-’90,
13. Total yield (’77-’05)

165Resiliency of Gadid Stocks to Fishing and Climate Change
Subscripts on parameters were as follows: a age y year k season (A, A, B, Bor )Superscripts on parameters were as follows: r region (NW or SE) l identifier; (stochastic component [ε]: R = recruitment, I
= initial numbers at age), (selectivity [ν, β, δ]: F = fishery, BTS = bottom trawl survey, EIT = echo-integration trawl survey), (variance [σ]), (survey abundance [n]: EIT or BTS), (survey catchability coefficient [q]: BTS or EIT).
Recruitment by region was specified as a function of an estimated mean recruitment value R (abundance at age-3 for the entire EBS), an estimated scalar allocating the fraction of recruitment to the SE region (hence 1−φ is the fraction of recruitment in the NW), and estimated sto-chastic components ε for a total of 74 estimated recruitment parameters. Equations are only given for the NW. Analogous equations for the SE can be obtained by replacing the region-specific population parameters for the NW with those for the SE.
One Year(Ages 3 to 10+)
Movement to winter distribution
(spawning) + half of natural mortality
July-Dec fishery removals
(B-season)
Movement to summer distribution (feeding) + half of natural mortality
Jan.-June fishery removals
(A-season)
Fishery catch-at-age and
survey data
Area-specific recruitment
(age-3)
Fishery catch-at-age
data
A
–
–
A
A
B
B
Figure 2. Depiction of the spatial model. Seasons (A, A, B, B) are denoted on the outer circle.

166 Miller et al.—Age-Specific Migration
Recruitment to the NW region for age-3 was modeled as
NWA
NW R
1977N Reyy
3 1 2005, ,
( )( ) , .= − ≤ ≤φ ε y
The initial numbers at age for 1977 were modeled as
NWA
NW I
N Re aaa
, ,( )( ) , .1977 1 4 10= − ≤ ≤ +φ ε
Next, abundance and fishing mortality were modeled as
NWA
NWA
NWAN N e
a y a y
Fa y
, , , ,, ,= −
where
NWA
F NWAF Fa y a y, , , ,= ν
in which νaF is the estimated age-specific fishery selectivity and NW
AFy , is
the estimated fishing mortality for fully available ages in the NW region during the A season in year y. Removals by the EIT and the bottom trawl survey, which occur in the middle of the year, were considered insignifi-cant and not subtracted out as mortality. There were 99 total estimated fishing mortality rate parameters for fully available ages because some fishing mortalities were set equal to a close year from an analogous season and region (i.e., 1987 = 1988 = 1989, 1990 = 1991, 1997 = 1998, and 2004 = 2005) (Table 1).
Selectivity was modeled as a logistic function with two parameters β l and δ l,
νβ
δ
al
a
el
l
=
+− −
1
12 94
(. ( )
).
The superscript l on the selectivity parameters identifies the param-eter’s use for either the fishery selectivity or the survey selectivity. The parameter β l is the age at which 50% of the fish are vulnerable to the fishery (or survey), whereas the parameter δ l is the width (in years) between the age at 50% selection and the 5% and 95% selection values. For example, if β l = 5 and δ l =2, then age-3 selectivity is 5% and age-7 selectivity is 95%. This parameterization allows for interpretable scaling and can be useful for Bayesian analyses (where priors might be devel-oped). A total of six selectivity parameters were estimated, two each for the fishery, the BTS, and the EIT survey.
MovementAfter the A season, movement from region r to region r’ ( ), '
,r r
a kP was assumed to occur, along with a half year of natural mortality, or
NWB
NW,NWA
NWA
SE,NWA
SEN P N e P Na y a a y
M
a, , , , , ,= +− 2
aa y
Me
, ,.
A
− 2
Natural mortality was assumed constant and set at 0.3, the same value used in the standard stock assessment model. It was assumed that
(1)
(2)
(3)
(4)
(5)
(6)
167Resiliency of Gadid Stocks to Fishing and Climate Change
natural and fishing mortality do not differ between males and females at any life stage. This is based on studies of relative age compositions between sexes that did not differ significantly in the EBS (Pereyra et al. 1976). Next, the B season fishery occurred, resulting in abundance
NWB
NWB
NWB.N N ea y a y
Fa y
, , , ,, ,= −
Following the B season, the remaining half-year of natural mortality and the end-of-year movement before spawning were assumed to occur, resulting in abundance at the start of the next year and next age as
NWA
NW,NWB
NWB
SE,NWN P N e Pa y a a y
M
a+ +−= +1 1
2, , , , , ,BB
SEB
N ea y
M
, ,,
− 2
where 3 ≤ a ≤ 9 and 1977 ≤ y ≤ 2004. In this equation, the number in the NW region at the end of the previous season (B) that stayed in the NW region is added to the number that moved to the NW region from the SE region at the end of the previous season (B). The plus group, which combines abundances for adult fish ages-10+, was modeled as
NWA
NW,NWB
NWB
SE,NWN P N e Py y
M
10 1 9 92
9+ +−= +, , , , , ,BB
SEB
NW,NWB
NWB
S
N e
P N e
y
M
y
M
92
10 102
, ,
, , ,
−
+ +
−
+
+ EE,NWB
SEB
P N ey
M
10 102
+ +
−
, , ,
where 1977 ≤ y ≤ 2004.The movement probabilities for the ASM model were based on the
hypothesis that as walleye pollock get older (ages-3+), there is a general ontogenetic movement from NW to SE EBS (Bailey et al. 1999, Buckley et al. 2001). Movement probabilities for the first age (age-3 fish) that stayed in the same region were logit-transformed as
NW,NWNWP
ek
k3
1
1, ( )
=+− ω
SE,SESEP
ek
k3
1
1, ( )
=+− ω
for estimation stability, where rkω varied by region and season for a
total of four estimated movement parameters (NWA
SEA
NWB
SEB
ω ω ω ω, , , ). The initial model configuration was conditioned such that the move-ment probabilities were relative to the next youngest age group for the probabilities NW→NW,
NW,NW NW,NWP P aa k k a k, , , ,= ≤ ≤ +−γ 1 4 10
because the region- and age-specific movement rates were expected to be difficult to estimate.
(7)
(8)
(9)
(10a)
(10b)
(11)
and

168 Miller et al.—Age-Specific Migration
Based on available knowledge, the scalar γ was set at 0.8 for the first set of movements (season A) and at 0.9 for the second set (season B). For the movement probabilities for the SE, we assumed that once fish were in the SE region, they would follow an adult movement pattern. So each subsequent age after age-3 was assumed equal to the value at age-3 for both seasons, or
SE,SE SE,SEP P ak a k3 4 10, , , .= ≤ ≤ +
In a two region model, the probability of moving is 1 minus the prob-ability of staying.
EstimationA penalized joint negative log likelihood function (PL) (Maunder and Deriso 2003) or “errors in variables” (EV) method (Ludwig and Walters 1981, Collie and Sissenwine 1983, Ludwig et al. 1988) was developed to allow estimation of model parameters. This consisted of producing model estimates of catch in numbers, yield, and survey abundances to compare with data. The PL or EV was used as the objective function consisting of the addition of fourteen components (thirteen data sources and one penalty function) that each followed lognormal distributions. All the data sources were independent except for the catch in numbers, yield, and total yield. The total yield was included along with the yield by region and season, because the individual yields were estimated with more error, a few years of yield data were missing (Table 1), and it was important that the estimated total yield be close to the observed total yield for the entire EBS. The variance terms σ2(l) were either taken from the 2004 stock assessment report (Ianelli et al. 2004) or were given a value consistent with available knowledge.
The log likelihood component for the region- and season-specific catch-at-age data (NW_A, σ = 0.3; NW_B, SE_A, and SE_B, σ = 0.2 [J.N. Ianelli, unpubl. data, 2006]) was
L
cc
ra y k
ra y k
rkkya
l1
2
22=
∑∑∑ln
ˆ
( )
, ,
, ,
( )σrr∑
where c and c were the observed and predicted catch numbers, respec-tively. All subsequent likelihood components were of this form. The predicted catch was from the Baranov catch equation
CFZ
N e Z= − −( ),1
where no natural mortality occurs during the catch period (M = 0). Therefore, the predicted catch-at-age was
(12)
(13)
(14)

169Resiliency of Gadid Stocks to Fishing and Climate Change
ra y k
ra y k
Fc N er
a y kˆ ( )., , , ,, ,= − −1
The predicted survey numbers (NW_BTS, SE_BTS, NW_EIT, and SE_EIT, σ = 0.2 [Ianelli et al. 2004]) were
ra yl r
a y al ln N qˆ
, , ,= B ν
where ql was the catchability coefficient by survey, for a total of two estimated catchability coefficient parameters. The superscript l desig-nated the survey as the bottom trawl (BTS) or hydroacoustic (EIT). The age-specific selectivity for the bottom trawl and EIT survey was mod-eled as in eq. (5).
Predicted yield (NW_A, NW_B, SE_A, and SE_B, σ = 0.05 [Ianelli et al. 2004]) was
ry k
ra y k
a
ra y ky w cˆ ( ˆ ),, , , , ,=
=
+
∑3
10
The sum of the product of the mean body weight (kg) of the catch (w) and the predicted catch in numbers across ages. Predicted total yield (σ = 0.1, J.N. Ianelli, unpubl. data, 2006) was then
ˆ ( ˆ ).,Y yyr
ry k
k
= ∑ ∑The penalty function, consisting of three components, was modeled as
LN
Ny
y
y
53
3
2
=
+∑lnˆ
ˆ, ,
, ,
NWA
SEA
(( ) ( )
( ) ( )
NW R SE R
NW I SE I
ε ε
ε ε
y y
a a
2 2
2 2
+ +
+
∑∑
∑∑∑ .
Because the recruitment numbers of EBS walleye pollock are highly variable and difficult to predict (Ianelli et al. 2004), the first part of the penalty function keeps the NW and SE age-3 abundances similar. The second and third parts of the penalty function conditioned the stochas-tic components to sum to zero.
The ASM model was implemented in AD model builder language (Fournier 1996, Otter Research Ltd.).
AnalysesTo evaluate confounding of parameters, the correlation matrix, derived from the Hessian, was examined. Model outputs of the ASM model and the 2005 stock assessment were compared and any patterns in the residuals were identified.
(15)
(16)
(17)
(18)
(19)
170 Miller et al.—Age-Specific Migration
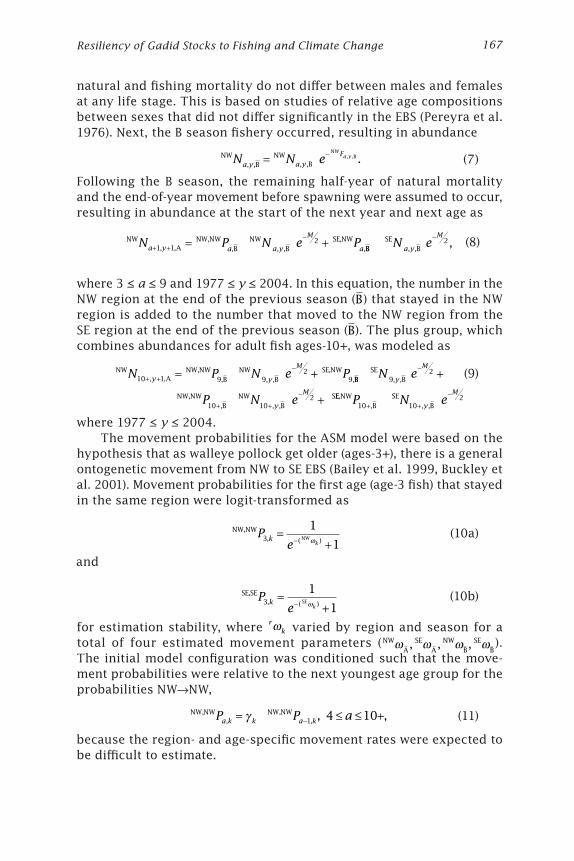
ResultsThe ASM’s total and penalty likelihoods and fit to the thirteen data sources are listed in Table 2. The data sources with the greatest influ-ence (largest component of the total likelihood) were the SE bottom trawl survey, the NW EIT survey, the NW catch-at-age data for the A season, and the SE catch-at-age data for the B season.
The estimated percentage of fish that stayed in the NW during the Aseason decreased from 99% (age-3) to 21% (ages-10+), while the percent-age of fish that stayed in the NW during the B season decreased from 75% (age-3) to 36% (ages-10+). Thirty percent of the fish stayed in the SE during the A season (ages-3 to 10+) and 70% stayed in the SE during the B season (Fig. 3).
From the analysis of the ASM’s Hessian correlation matrix, only a few important correlations were found. The only correlations between fishery and/or survey selectivity and migration were negative correla-tions between the NW
Bω movement parameter and the fishery selectivity
parameters βF and δ F of –0.51 and –0.51, respectively. There was a posi-tive correlation between the survey catchability coefficients for the EIT qEIT and bottom trawl qBTS surveys (0.45).
There were a few limitations associated with the ASM model. First, there were high variances for the stochastic components rε2005
R (NW and SE), and the NW
Aω movement parameter. Second, some parameter
estimates did not vary much from their starting value, i.e., the fishery
Table 2. Fit of the ASM model in terms of its negative log likelihood components. Components for the SE region are shown in parentheses.
Data sources Likelihoods
NW (SE) BTS 883 (1,402)
NW (SE) EIT 4,061 (446)
NW (SE) A season fishery 1,308 (810)
NW (SE) B season fishery 982 (1,046)
NW (SE) A yield 28 (34)
NW (SE) B yield 54 (38)
Total fishery yield 10
Penalty Components (eq. 19):
1. Recruitment (NW, SE similar) 65
2. Recruitment deviations 312
3. Initial abundance (age-3) deviations 11
Total likelihood 11,489

171Resiliency of Gadid Stocks to Fishing and Climate Change
selectivity parameter, βF (starting value = 4 and estimate = 3.98), and the scalar allocating the fraction of recruitment between regions, φ (starting value = 0.50 and estimate = 0.50).
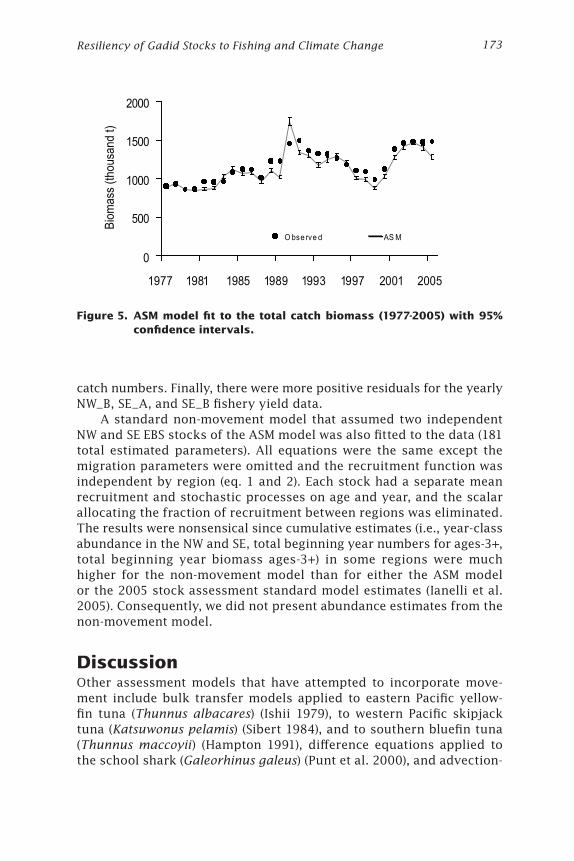
Recruitment and beginning year biomass estimates from the 2005 standard stock assessment (Ianelli et al. 2005) were usually somewhat lower than the ASM model’s estimates, though of the same order of magnitude (Fig. 4A and 4B). While the ASM model’s estimates of age-3 abundance fluctuated between 533 million and 22 billion fish, the 2005 stock assessment’s estimates fluctuated between 1.2 and 16 billion fish. The ASM model fitted the observed total yield well in most years, except it underestimated the yield in years 1988, 1989, 1991, and 2005 and overestimated the yield in 1990 (Fig. 5).
The ASM model fitted well the yearly observed yield data by region and season, the yearly observed catch data in numbers by region and season, and the catch-age composition data (results not shown). Except for years 1977 and 1981 to 1984, the ASM model closely fitted the yearly observed catch in numbers in the NW_A fishery. The ASM model fitted the yearly observed catch in numbers in the NW_B fishery well except for underestimates in years 1977, 1986, 1997, and 2004. The ASM model frequently underestimated the observed SE_B fishery catch numbers (1977 to 1979, 1981, 1982, 1993, and 1999). Although the ASM model
0%
50%
100%
3 4 5 6 7 8 9 10
Age
Prop
ortio
n th
at st
ayNW _A bar NW _B barSE_A bar SE_B bar
Figure 3. Estimated migration with 95% confidence intervals for the ASM model. The lines represent the proportion of fish that stay in each region and season for a particular age.

172 Miller et al.—Age-Specific Migration
only somewhat fitted the yearly observed bottom trawl survey and EIT survey numbers in the NW and SE, the ASM model fitted the survey age composition data well. The poorer fits may be a function of the limita-tions of the survey (Barbeaux and Dorn 2003) or due to the weighting factors (variances) on the data sets.
There were a few notable patterns in the residuals for the ASM model (results not shown). First, all the residuals were positive for the yearly EIT_NW data. Second, there were all negative residuals after 1990 for age-3 and after 1977 for age-4 NW_A fishery catch numbers, and after 1992, for ages-10+ NW_B fishery catch numbers. Third, after 1990, there were more negative residuals for ages-3 and 4 SE_A fishery
0
8,000
16,000
24,000
1977 1982 1987 1992 1997 2002
Biom
ass
(thou
sand
t)
ASM
stock assess.2005
0
10,000
20,000
30,000
1974 1979 1984 1989 1994 1999
X 1,
000,
000
ASM
stock assess.2005
Total Beginning Year Biomass(Ages 3-10+)
Figure B
Year-Class AbundanceSE and NW (Ages-3)
Figure A
Figure 4. Year-class abundance (Fig. A) and total beginning year biomass (Fig. B) for the ASM model (with 95% confidence intervals) compared to the 2005 stock assessment standard model results (Ianelli et al. 2005).
173Resiliency of Gadid Stocks to Fishing and Climate Change
catch numbers. Finally, there were more positive residuals for the yearly NW_B, SE_A, and SE_B fishery yield data.
A standard non-movement model that assumed two independent NW and SE EBS stocks of the ASM model was also fitted to the data (181 total estimated parameters). All equations were the same except the migration parameters were omitted and the recruitment function was independent by region (eq. 1 and 2). Each stock had a separate mean recruitment and stochastic processes on age and year, and the scalar allocating the fraction of recruitment between regions was eliminated. The results were nonsensical since cumulative estimates (i.e., year-class abundance in the NW and SE, total beginning year numbers for ages-3+, total beginning year biomass ages-3+) in some regions were much higher for the non-movement model than for either the ASM model or the 2005 stock assessment standard model estimates (Ianelli et al. 2005). Consequently, we did not present abundance estimates from the non-movement model.
DiscussionOther assessment models that have attempted to incorporate move-ment include bulk transfer models applied to eastern Pacific yellow-fin tuna (Thunnus albacares) (Ishii 1979), to western Pacific skipjack tuna (Katsuwonus pelamis) (Sibert 1984), and to southern bluefin tuna (Thunnus maccoyii) (Hampton 1991), difference equations applied to the school shark (Galeorhinus galeus) (Punt et al. 2000), and advection-
0
500
1000
1500
2000
1977 1981 1985 1989 1993 1997 2001 2005
Biom
ass
(thou
sand
t)
O bse rve d AS M
Figure 5. ASM model fit to the total catch biomass (1977-2005) with 95% confidence intervals.

174 Miller et al.—Age-Specific Migration
diffusion models applied to various tuna species (Deriso et al. 1991, Kleiber and Hampton 1994, Sibert et al. 1999). These studies differed from ours in that they had direct movement rates through extensive tagging data.
We developed the ASM model in an attempt to estimate walleye pollock migration between the NW and SE EBS. The first hypothesis that we tested was that the age-specific movement (ASM) model can estimate migration without movement (tagging) data, but with a great deal of uncertainty. This hypothesis was not rejected; under moder-ate assumptions, this study showed that reasonable estimates of most population and movement parameters could be obtained from existing disaggregated assessment survey and fishery data. While some popula-tion parameters remain uncertain and high correlation exists between some parameters, most movement parameters could be estimated with confidence for the ASM model with only four estimated migration parameters. More realistic migration estimation would vary by year (1977-2005) and age (ages-3 to 10+). Having additional information from tagging studies or other movement studies would probably be neces-sary to stabilize such a complex model.
The second hypothesis we tested was that the ASM model per-forms better than a non-movement version of the spatial, two-season ASM model. The results of the non-movement model were nonsensical showing that movement must be included in any spatial model of EBS pollock.
The next step for evaluating the ASM model is to examine a third hypothesis: the ASM model would not be as robust as the region-wide, standard stock assessment model until additional information from tagging studies or other movement studies becomes available. Further analysis of the ASM model through robustness tests and management strategy evaluations (MSEs) need to be done through simulation experi-ments with known population and migration parameters (e.g., Fu and Quinn 2000) before the ASM model is used for assessment purposes.
A similar attempt using an age-structured stock assessment model that incorporated migration based on parasitological analyses was developed to test the migration effects on the assessment and man-agement of the western and central Baltic herring (Clupea harengus membras) stocks (Horbowy 2005). Compared to the spatial model, the migration model produced higher (lower) spawning stock biomass estimates for the western (central) stock. Herring migration effects on catch and biomass ranged from low (less than 5% change) to moderate (up to 20% change). In comparison, the ASM model generally produced higher abundances (ages 3-10+) in the NW as compared to the SE (66% of the time) (Fig. 6).
Currently, there is one yearly total allowable catch (TAC) for the whole EBS that is divided by sectors and seasons by a fixed percentage. The TAC is allocated temporally by the A (40%) and B (60%) fishery sea-

175Resiliency of Gadid Stocks to Fishing and Climate Change
sons. Unlike the standard model used for the current stock assessment that is only able to estimate walleye pollock abundances for the entire EBS, the ASM model was able to estimate abundances by season for the NW and SE separately (Fig. 6). This provides more in-depth information for fishery management and allocation of quota both spatially and tem-porally. Instead of fixed percentages, managers would be able to allocate quota by both region and availability. For simplicity, the ASM model only included ages 3+, one type of movement (age-specific changes), two regions (NW and SE EBS), and fishery selectivity related to gear-only effects rather than both availability and gear effects. Future elaborations should include: a larger range of ages (1+), age- and/or year-specific movements, fishery selectivity by year, region, and/or season, finer spatial and temporal scales in the EBS, and a sensitivity analysis of the weighting factors used (Deriso et al. 2007).
The key finding of our study is that more in-depth information on finer spatial and temporal scales is likely from spatially explicit studies of EBS walleye pollock. Not only will we likely gain information on their biology and changes in migration with age and environmental influ-ences, more complex information of their intra-annual distribution will likely further management and conservation of the species.
x 1,
000,
000
ASM SE
ASM NW
2005 assess.
ASM total
1977 1981 1985 1989 1993 1997 2001 2005
40,000
30,000
20,000
10,000
0
Abundance
(Ages-3-10+)
Figure 6. Estimated total abundance and abundance by area (with 95% confidence intervals) for the ASM model for the A-season compared to the 2005 stock assessment results (Ianelli et al. 2005).
176 Miller et al.—Age-Specific Migration
AcknowledgmentsWe thank the Alaska Fisheries Science Center Population Dynamics Fellowship and the North Pacific Research Board (Project 505) for fund-ing. We thank Dan Nichol at the Alaska Fisheries Science Center (AFSC) for the disaggregated bottom trawl survey data and Taina Honkalehto, also at AFSC, for the disaggregated EIT survey data. We also thank Dr. Brenda Norcross and Dr. Gordon Haas for their helpful comments in the review process.
ReferencesBailey, K.M., T.J. Quinn II, P. Bentzen, and W.S. Grant. 1999. Population struc-
ture and dynamics of walleye pollock, Theragra chalcogramma. Adv. Mar. Biol. 37:179-255.
Barbeaux, S.J., and M.W. Dorn. 2003. Spatial and temporal analysis of east-ern Bering Sea echo integration-trawl survey and catch data of walleye pollock, Theragra chalcogramma, for 2001 and 2002. NOAA Tech. Memo. NMFS-AFSC-136.
Buckley, T.W., A. Greig, J. Ianelli, P. Livingston, and G. Walters. 2001. Spatial distribution and ontogenetic movement of walleye pollock in the eastern Bering Sea. Presented at the North Pacific Marine Science Organization (PICES), Victoria, B.C., Canada, October 5-13, 2001. Alaska Fisheries Science Center, Seattle, Washington. Available: http://www.afsc.noaa.gov/refm/reem/doc/Pices2001Poster.pdf (Aug. 2007).
Collie, J.S., and M.P. Sissenwine. 1983. Estimating population size from rela-tive abundance data measured with error. Can. J. Fish Aquat. Sci. 40:1871-1879.
Deriso, R., M. Maunder, and J. Skalski. 2007. Variance estimation in integrated assessment models and its importance for hypothesis testing. Can. J. Fish Aquat. Sci. 64:187-197.
Deriso, R.B., R.G. Punsly, and W. Bayliff. 1991. A Markov movement model of yellowfin tuna in the eastern Pacific Ocean and some analyses for interna-tional management. Fish. Res. 11:375-395.
Fournier, D. 1996. An introduction to AD model builder for use in nonlinear modeling and statistics. Otter Research Ltd., Nanaimo, B.C.
Fournier, D., and C.P. Archibald. 1982. A general theory for analyzing catch at age data. Can. J. Fish Aquat. Sci. 39:1195-1207.
Fu, C., and T.J. Quinn II. 2000. Estimability of natural mortality and other population parameters in a length-based model: Pandalus borealis in Kachemak Bay, Alaska. Can. J. Fish Aquat. Sci. 57:2420-2432.
Hampton, J. 1991. Estimation of southern bluefin tuna Thunnus maccoyii mortality and movement rates from tagging experiments. Fish. Bull. U.S. 89:591-610.
Härkönen, T., and K.C. Harding. 2001. Spatial structure of harbour seal popula-tions and the implications thereof. Can. J. Zool. 79:2115-2127.
177Resiliency of Gadid Stocks to Fishing and Climate Change
Hiatt, T., R. Felthoven, C. Seung, and J. Terry. 2004. Stock assessment and fish-ery evaluation report for the groundfish fisheries of the Gulf of Alaska and Bering Sea/Aleutian Island area: Economic status of the groundfish fisher-ies off Alaska, 2003. NOAA NMFS Alaska Fisheries Science Center, Resource Ecology and Fisheries Management Division, Economic and Social Sciences Research Program, Seattle, Washington.
Hilborn, R., and C.J. Walters. 1992. Quantitative fisheries stock assessment: Choice, dynamics, and uncertainty. Chapman and Hall, New York.
Horbowy, J. 2005. Assessing Baltic herring stocks with a model that incorpo-rates migration. Fish. Res. 76:266-276.
Ianelli, J. 2005. Assessment and fisheries management of eastern Bering Sea walleye pollock: Is sustainability luck? Bull. Mar. Sci. 76(2):321-335.
Ianelli, J.N., S. Barbeaux, G. Walters, T. Honkalehto, and N. Williamson. 2004. Eastern Bering Sea walleye pollock stock assessment for 2005. In: Stock assessment and fishery evaluation report for the groundfish resources of the Bering Sea/Aleutian Islands Regions. North Pacific Fishery Management Council, Anchorage, Alaska, pp. 37-125.
Ianelli, J.N., S. Barbeaux, T. Honkalehto, B. Lauth, and N. Williamson. 2005. Eastern Bering Sea walleye pollock stock assessment for 2006. In: Stock assessment and fishery evaluation report for the groundfish resources of the Bering Sea/Aleutian Islands Regions. North Pacific Fishery Management Council, Anchorage, Alaska, pp. 31-124.
Ishii, T. 1979. Attempt to estimate migration of fish population with survival parameters from tagging experiment data by the simulation method. Investig. Pesq. 43:301-317.
Kleiber, P., and J. Hampton. 1994. Modeling effects of FADs and islands on movement of skipjack tuna (Katsuwonus pelamis) estimating parameters from tagging data. Can. J. Fish. Aquat. Sci. 51:2642-2653.
Ludwig, D., and C.J. Walters. 1981. Measurement errors and uncertainty in parameter estimates for stock and recruitment. Can. J. Fish. Aquat. Sci. 38:711-720.
Ludwig, D., C.J. Walters, and J. Cooke. 1988. Comparison of two models and two estimation methods for catch and effort data. Nat. Resour. Model. 2:457-498.
Lynde, C.M., M.V.H. Lynde, and R.C. Francis. 1986. Regional and temporal dif-ferences in growth of walleye pollock (Theragra chalcogramma) in the eastern Bering Sea and Aleutian Basin with implications for management. NMFS Northwest and Alaska Fisheries Center, Seattle, Washington. NWAFC Processed Report 86-10.
Maunder, M.N., and R.B. Deriso. 2003. Estimation of recruitment in catch-at-age models. Can. J. Fish Aquat. Sci. 60, 1204-1216.
Mueter, F.J., C. Ladd, M.C. Palmer, and B.L. Norcross. 2006. Bottom-up and top-down controls of walleye pollock (Theragra chalcogramma) on the Eastern Bering Sea shelf. Prog. Oceanogr. 68:152-183.

178 Miller et al.—Age-Specific Migration
Mulligan, T.J., K. Bailey, and S. Hinckley. 1989. The occurrence of larval and juvenile walleye pollock, Theragra chalcogramma, in the eastern Bering Sea with implications for stock structure. In: Proceedings of the International Symposium on the Biology and Management of Walleye Pollock. Alaska Sea Grant, University of Alaska Fairbanks, pp. 471-489.
Nielsen, A. 2004. Estimating fish movement. Ph.D. dissertation, Royal Veterinary and Agricultural University, Frederiksberg, Denmark.
Pereyra, W.T., J.E. Reeves, and R.G. Bakkala. 1976. Demersal fish and shell-fish resources of the eastern Bering Sea in the baseline year 1975. U.S. Department of Commerce, Northwest Fisheries Center Processed Report.
Punt, A.E., F. Pribac, T.I. Walker, B.L. Taylor, and J.D. Prince. 2000. Stock assess-ment of school shark, Galeorhinus galeus, based on a spatially explicit population dynamics model. Mar. Freshw. Res. 51:205-220.
Quinn II, T.J., and R.B. Deriso. 1999. Quantitative fish dynamics. Oxford University Press, New York.
Schnute, J.T., and L.J. Richards. 1995. The influence of error on population estimates from catch-age models. Can. J. Fish Aquat. Sci. 52:2063-2077.
Sibert, J.R. 1984. A two-fishery tag attrition model for the analysis of mor-tality, recruitment, and fishery interaction. Tuna and Billfish Assessment Programme, South Pacific Commission, Noumea, New Caledonia. Tech. Rep. No. 13.
Sibert, J.R., J. Hampton, D.A. Fournier, and P.J. Bills. 1999. An advection-diffu-sion-reaction model for the estimation of fish movement parameters from tagging data, with application to skipjack tuna (Katsuwonus pelamis). Can. J. Fish Aquat. Sci. 56:925-938.
Wespestad, V.G. 1993. The status of Bering Sea pollock and the effect of the “donut hole” fishery. Fisheries 18(3):18-24.
Wespestad, V.G., L.W. Fritz, W.J. Ingraham, and B.A. Megrey. 2000. On rela-tionships between cannibalism, climate variability, physical transport, and recruitment success of Bering Sea walleye pollock (Theragra chalco-gramma). ICES J. Mar. Sci. 57:272-278.

Resiliency of Gadid Stocks to Fishing and Climate Change 179Alaska Sea Grant College Program • AK-SG-08-01, 2008
Changes in Fecundity in a Stressed Population: Northern Cod (Gadus morhua) off NewfoundlandSusan B. Fudge and George A. RoseMemorial University of Newfoundland, Fisheries and Marine Institute, Fisheries Conservation Group, St. John’s, Newfoundland, Canada
AbstractRecently determined relationships in stock fecundity off Newfoundland are compared with historical data from Newfoundland, Iceland, Norway, Baltic, and the North Sea and are used to establish baseline relationships between fecundity and size at age in Atlantic cod (Gadus morhua). A total of 200 prespawning female cod were sampled in 1999 and 2003 in three Northwest Atlantic management areas. For southern Newfoundland stocks that have fared relatively well in the 1990s and early 2000s, fecundity-size relationships did not differ from historical norms, although age at maturity was lower. In the highly stressed north-ern stock off Labrador, however, age at maturity was much lower than historical norms or in southern stocks, and fecundity much higher in small and young fish. Mortality rates were higher in the northern fish. We discuss these changes in the context of changed life histories and rebuilding in stressed gadoid stocks.
IntroductionFecundity is a fundamental property of reproductive potential. Despite this importance, and the long history of Atlantic cod (Gadus morhua) fisheries in the North Atlantic, there have been relatively few fecundity studies on this species. The first studies were done by Earll (1880) and Fulton (1890), and later in the twentieth century by Powles (1958). In the northwest Atlantic, May (1967), Postolakii (1967), and Pinhorn (1984) provided estimates of fecundity for several stocks. More recently, many stocks off Newfoundland and Labrador have experienced exceptional

180 Fudge and Rose—Changes in Cod Fecundity
declines in biomass and remain at all time low levels (e.g., Lilly et al. 2000). Despite evidence of change in life history characteristics such as depressed age at maturity (Olsen et al 2004), growth (Dutil et al. 1999), and lower condition (Rose and O’Driscoll 2002) there has been no reas-sessment of historical fecundity information for these stocks.
In general, fecundity is the reproductive output of an individual, or number of offspring produced (Thain and Hickman 1994). There are three main types of fish fecundity described in Murua et al. (2003) and Kraus et al. (2000): Relative fecundity is the number of oocytes per unit body weight; realized fecundity is the total number of eggs spawned per season; and potential fecundity is the number of developing oocytes per female fish prior to spawning.
Our objective was to quantify the potential fecundity of Atlantic cod and its relationship with growth parameters in three major management areas. We then compare our results with historical data from the same stocks and from other cod stock areas across the North Atlantic.
Materials and methodsStudy areasCod fecundity was investigated within three populations in NAFO (Northwest Atlantic Fisheries Organization), subdivisions 2J, 3KL and 3Ps (Fig. 1). Hawke Channel in subdivision 2J is located between Hamilton and Belle Isle Banks, and was the northernmost sampling site. Acoustic trawl surveys and fisheries research have been conducted in this area since 1994 (e.g., Anderson and Rose 2001). Samples from 3KL were taken from two areas; the offshore site, Bonavista Corridor, straddles the southeast limit of 3K and the northeast boundary of 3L. The Bonavista Corridor is the most southern migration route of north-ern cod and held the last large spawning aggregations in the early 1990s (Rose 1993). The inshore site, Smith Sound, Trinity Bay (Fig. 1A) is a fjord within subdivision 3L and currently holds the largest known concentra-tion of overwintering northern cod, estimated at 26,000 tons in 2001. The cod that migrate along the Bonavista Corridor cross the 3K and 3L subdivision boundary lines, hence these areas were combined into 3KL for analysis. The third and final sampling area was Placentia Bay (Fig. 1B), which forms part of the inshore component of the subdivision 3Ps stock. Of all the cod stocks in the Northwest Atlantic, 3Ps rebounded the quickest after rapid decline in the late 1980s. This stock has had a small commercial fishery (average TAC of 15,000 t per year) since 1997. Placentia Bay cod have been under intensive study since 1996 (e.g., Lawson and Rose 2000, Mello and Rose 2005, Rose et al. 2008).

181Resiliency of Gadid Stocks to Fishing and Climate Change
Figure 1. Sampling sites () and NAFO subdivisions for 1999 and 2003. Inserts represent coastal sampling sites Placentia Bay (A) and Smith Sound (B).

182 Fudge and Rose—Changes in Cod Fecundity
Collections and preparationBefore spawning, a female cod gonad contains three sizes of eggs: large translucent eggs approximately 1.5 mm in diameter that are ready for release; middle-sized yolked eggs that will be released within weeks; and small whitish eggs (May 1967). The large and middle-sized eggs are first generation eggs and will be released in the current spawning season. The small whitish eggs are second-generation eggs, which will not be released until the following spawning year. Release of the large translucent eggs begins soon after oocytes become hydrated; therefore in order to measure fecundity gonads must be sampled before any hydrated eggs are visible (Raitt 1932). Female cod were sampled prior to and during the spawning seasons of 1999 and 2003. In 2J and 3KL, fish were sampled with a research otter trawl (Campelen 1800), whereas samples were caught using handlines in 3Ps.
Standard lengths, and whole, gutted, liver and gonad weights were recorded, with otoliths taken for aging. Fish sizes varied between areas (Table 1). In all analyses, gutted weight was used as opposed to whole weight to reduce bias resulting from seasonal changes and variations due to feeding. Extracted ovaries were cut down the middle and placed in a labeled jar, and Gilson’s fluid (Simpson 1951) was then added to cover the ovary, to aid in the breakdown of connective tissues and the separation of eggs from each other and the ovarian wall. Samples were topped up with fluid and agitated once a week to help speed the break-down process, and then were left for an average of three months before processing. When separation was complete, each sample was passed through a series of interlocking sieves of differing mesh sizes (1.4 m, 1.0 m, 500 m, 300 m, 180 m, 125 m). Remnant ovarian wall tissue and
Table 1. Summary of female cod sampled during 1999 and 2003 within three NAFO subdivisions 2J, 3KL, and 3Ps. Information includes number of fish sampled, size (lengths and gutted weights), ranges, and standard deviations.
Area Year Sample size
Standard length (cm) Gutted weight (kg)
Range Average ± SD Range Average ± SD
2J
1999 31 40-60 48.6 ± 4.7 0.465-1.81 0.918 ± 0.270
2003 12 42-61 49.3 ± 7.0 0.540-1.63 0.927 ± 0.396
3KL
1999 27 35-82 62.0 ± 10.5 0.355-3.95 2.02 ± 0.962
2003 60 40-94 56.5 ± 12.0 0.472-6.60 1.53 ± 1.27
3Ps
1999 18 56-84 68.3 ± 9.3 1.21-4.61 2.57 ± 1.12
2003 52 45-72 59.0 ± 5.2 0.653-2.61 1.61 ± 0.850
Total – 200 – – – –

183Resiliency of Gadid Stocks to Fishing and Climate Change
second-generation eggs were discarded, and eggs were stored in jars with 90% ethanol until processed.
Subsampling and countingMost methods used to measure fecundity involve taking a subsample of the total volume of eggs in an ovary. The Motoda splitter (Motoda 1959) is primarily used for plankton subsampling, but has been used in fecundity studies (Allain 1999) and was used in the present study. The splitter produces subsamples by successive fractionations. Counts were done manually using a stereomicroscope and handheld counter; two subsamples from each gonad were counted three times. All samples met the required <5% variation. The combined total 6 counts were aver-aged and used in the estimation for the total number of eggs in that sampled ovary. The potential fecundity per fish was determined by the following equation:
N Neggs eggsinsubsample= × Subsample split fracttion
For comparison, six egg samples of random sizes were subsampled a second time using the whirling vessel. Average difference of potential fecundity estimates between the Motoda splitter and the whirling vessel was 10%. Using a paired t-test, no significant difference was found in the determined fecundities between the two methods (p > 0.05, α = 0.05).
Fecundity analysesInitially all data were pooled and a series of regressions were performed to determine the presence or absence of general relationships between fecundity and specific measured growth variables. Fecundity was inves-tigated in relation to fish length, age, gutted weight, and liver and gonad indices. Liver index (LI) and gonad index (GI) are defined as:
LI = Liver weight/Total weight (2)GI = Gonad weight/Total weight (3)
Fecundity was also investigated in relation to condition (Fulton’s K). Fulton’s condition examines the relation between length and weight and is used to quantify the state of well-being of a fish (Wooton 1990a), and is measured as:
K = Total weight (kg)/length3 (cm) (4)
Significant relations were further explored through a series of 3-factor ANCOVAs, after which the data were categorized by study area. Results include samples from 1999 and 2003 except for the offshore area of Bonavista Corridor within 3KL (Fig. 1). Data were transformed into base

184 Fudge and Rose—Changes in Cod Fecundity
10 logarithms to standardize variance and facilitate historical compari-sons (e.g., Pinhorn 1984).
A comparison of linear regressions of fecundity-weight relations of cod from different geographic regions of the North Atlantic was also performed. Available data and original equations were gathered from 11 published studies, representing Labrador, North Sea, Norway, Baltic, and Iceland (Table 2).
ResultsThe overall range of lengths, weights, and ages of cod sampled was 40-94 cm, 0.355-4.61 kg, and 4-14 years, respectively (Table 1, Fig. 2). On average, mature female cod sampled from 2J were of lesser length, weight, and age than those at the other sites in both sampled years (Table 1); mature 2J cod were all less than 7 years of age (Fig. 3).
Regression analyses indicated the strongest predictors of fecundity were weight, length, and age respectively (Table 3). The regressions of fecundity on these variables were significant in all regions, with the amount of explained variation ranging from 31 to 72%. Fecundity was also associated with Fulton’s K in all regions (p < 0.05). No overall association was evident between fecundity and liver (LI) or gonad index (GI); however, fecundity was significantly correlated with liver index in 2J, and to gonad index in 3Ps. Month was factored into a GLM model to
Population/ area Original function
Weight units n Source
NAFO 2J F = 2.09W + 6.04a kg 43 This study
2J-3K F = 0.48W + 0.01a kg 8 May 1967
Labrador F = 0.2118W + 0.041b g 65 Postolakii 1967
North sea
F = 569W – 80,7000 g 92 Oosthuizen and Daan 1974
F = 526W – 548,000 g 47 Schopka 1971
Norway
F = 790W – 41,600 g 49 Botros 1962
F = 0.334W1.126 kg 240 Kjesbu et al. 1998 (weighted average)
Baltic
F = 633W + 88,791 g 807 Kraus et al. 2000 (weighted average)
F = 860W – 297,000 g 71 Botros 1962
F = 746W + 95,000 g 84 Schopka 1971
Iceland
F = 519W g 42 Joakimsson 1969
F = 584W – 832,000 g 49 Schopka 1971
aLog-log regression.bFecundity in thousands of eggs.
Table 2. Comparison of original fecundity-weight relations in cod of different geographic regions of the North Atlantic.

185Resiliency of Gadid Stocks to Fishing and Climate Change
control for seasonality. It was found that the relation of fecundity to gonad index did not change across months sampled in 2J, 3KL, or 3Ps.
Fecundities differed significantly between the two years of sampling (1999 and 2003) by a factor of 2-4. In a 3-way ANOVA using year, region and gutted weight as factors, year and region were significant effects but did not interact (p = 0.08). Hence for all subsequent analyses data were pooled by year.
Analysis of covariance indicated that the slopes of the regression lines of fecundity on length, age, and weight differed significantly between 2J, 3KL, and 3Ps (p’s < 0.01). Among the years the relationships were strongest in 3Ps cod (Table 3). Cod in 2J had much higher fecundi-ties at small sizes and younger ages than did cod from other regions. In 2J and adjacent 3KL, fecundities differed greatly from those reported by May (1967) and Postolakii (1968). At age 5 cod had fecundities similar to those at age 12 historically (Fig. 5), and with cod six times their size (Fig. 6).
Figure 2. Scatter diagram of fecundity against length for the three NAFO areas sampled; 2J, 3KL, and 3Ps.
20 40 60 80 100Length (cm)
0
2
4
6
8
10
Mill
ions
of e
ggs
2J 3KL 3Ps

186 Fudge and Rose—Changes in Cod Fecundity
Additional fecundity and weight data for six North Atlantic cod pop-ulations were examined (Labrador area, NAFO subdivisions 2J-3K, Baltic (east and west), North Sea, Iceland, and Norway (Barents Sea) (Table 2, Fig 7). Where more than a single fecundity relationship was available for an area (except Norway), weighted averages were used to produce a representative regression. Due to large variance between the samples from Norway, these data sets are separated, but both indicate some of the highest weights and fecundities overall. Historical data from 863 female cod from 2J-3K (Postolakii 1967 and May 1967) have the lowest fecundities (and smallest weights) of all the stocks examined, but in the present study cod from this area had much higher fecundities at the same weights.
Discussion and conclusionsResults of the present study indicate that potential fecundity of Atlantic cod is strongly correlated with weight, length, and age and less so with somatic and liver condition. A relationship between gamete production
0 4 8 12 16Age (yrs)
0
2
4
6
8
10
Mill
ions
of e
ggs
2J 3KL 3Ps
Figure 3. Scatter diagram of fecundity against age for the three NAFO areas sampled; 2J, 3KL, and 3Ps.
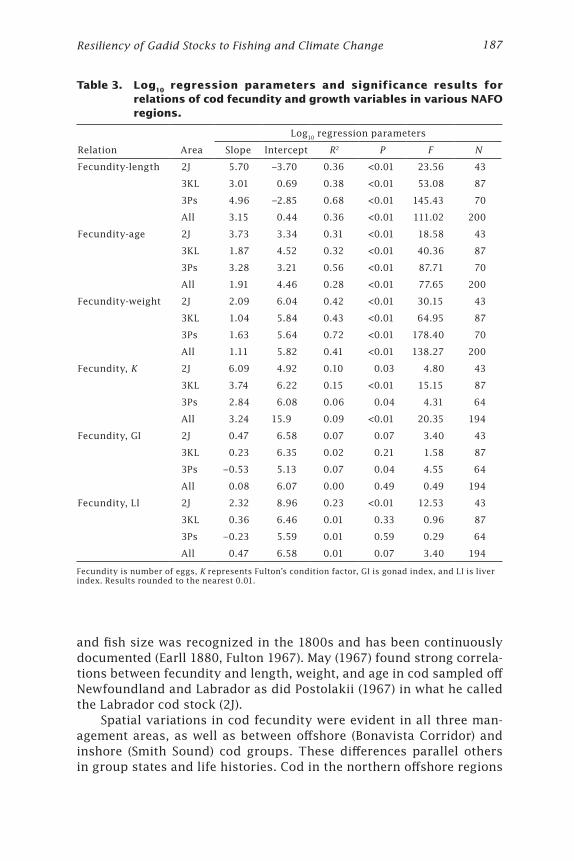
187Resiliency of Gadid Stocks to Fishing and Climate Change
and fish size was recognized in the 1800s and has been continuously documented (Earll 1880, Fulton 1967). May (1967) found strong correla-tions between fecundity and length, weight, and age in cod sampled off Newfoundland and Labrador as did Postolakii (1967) in what he called the Labrador cod stock (2J).
Spatial variations in cod fecundity were evident in all three man-agement areas, as well as between offshore (Bonavista Corridor) and inshore (Smith Sound) cod groups. These differences parallel others in group states and life histories. Cod in the northern offshore regions
Relation Area
Log10 regression parameters
Slope Intercept R2 P F N
Fecundity-length 2J 5.70 –3.70 0.36 <0.01 23.56 43
3KL 3.01 0.69 0.38 <0.01 53.08 87
3Ps 4.96 –2.85 0.68 <0.01 145.43 70
All 3.15 0.44 0.36 <0.01 111.02 200
Fecundity-age 2J 3.73 3.34 0.31 <0.01 18.58 43
3KL 1.87 4.52 0.32 <0.01 40.36 87
3Ps 3.28 3.21 0.56 <0.01 87.71 70
All 1.91 4.46 0.28 <0.01 77.65 200
Fecundity-weight 2J 2.09 6.04 0.42 <0.01 30.15 43
3KL 1.04 5.84 0.43 <0.01 64.95 87
3Ps 1.63 5.64 0.72 <0.01 178.40 70
All 1.11 5.82 0.41 <0.01 138.27 200
Fecundity, K 2J 6.09 4.92 0.10 0.03 4.80 43
3KL 3.74 6.22 0.15 <0.01 15.15 87
3Ps 2.84 6.08 0.06 0.04 4.31 64
All 3.24 15.9 0.09 <0.01 20.35 194
Fecundity, GI 2J 0.47 6.58 0.07 0.07 3.40 43
3KL 0.23 6.35 0.02 0.21 1.58 87
3Ps –0.53 5.13 0.07 0.04 4.55 64
All 0.08 6.07 0.00 0.49 0.49 194
Fecundity, LI 2J 2.32 8.96 0.23 <0.01 12.53 43
3KL 0.36 6.46 0.01 0.33 0.96 87
3Ps –0.23 5.59 0.01 0.59 0.29 64
All 0.47 6.58 0.01 0.07 3.40 194
Fecundity is number of eggs, K represents Fulton’s condition factor, GI is gonad index, and LI is liver index. Results rounded to the nearest 0.01.
Table 3. Log10 regression parameters and significance results for relations of cod fecundity and growth variables in various NAFO regions.

188 Fudge and Rose—Changes in Cod Fecundity
are not seen beyond age 7 and occur at relatively low densities, while inshore cod that overwinter in Smith Sound from the same stock (3KL) consist of a wide size range (35-120 cm) and ages reaching 15-20 years and occur at very high densities (DFO 2004a, Rose 2000). North Atlantic studies by Postolakii (1967), McIntyre and Hutchings (2003), as well as studies for Newfoundland cod stocks by May (1967) and Pinhorn (1984), have all demonstrated differences in fecundity-growth correlations between areas. Temporal variation in fecundities between 1999 and 2003 in Smith Sound cod may be related to reproduction suppression or atresia (Rideout et al. 2000). Rideout and Rose (2006) found that for cod sampled from Smith Sound during 1999-2004, the 1999 sample had the highest rate of skipped spawning. This event was positively correlated with population age structure and diet.
The strongest fecundity to size, age, and condition relationships were evident in cod from Placentia Bay, where stock rebuilding follow-ing a fishing moratorium in 1993 enabled reopening of a modest com-mercial fishery in 1997 (average harvest about 15,000 t per year). In
0 2 4 6 8Weight (kg)
0
2
4
6
8
10
Mill
ions
of e
ggs
2J 3KL 3Ps
Figure 4. Scatter diagram of fecundity against weight for the three NAFO areas sampled; 2J, 3KL, and 3Ps.

189Resiliency of Gadid Stocks to Fishing and Climate Change
most respects the 3Ps cod stock, is the northwest Atlantic stock in the best condition. (Lawson and Rose 2000, DFO 2004b). This stock has the biomass, migrations, growth rates, reproductive potential, and condi-tion closer to historical norms than in the formerly larger cod stocks on the Grand Bank and to the north (Sherwood and Rose 2005). In terms of fecundity, our results differ little from those of Pinhorn (1984) for this area.
In comparison, cod life histories in the northern offshore areas (Hawke Channel and Bonavista Corridor) bear little resemblance to his-torical norms. Cod here historically matured at earlier ages and smaller sizes than cod inhabiting southern waters (Fleming 1960, May 1967, Lilly et al. 2005). However, lengths-at-age and weights-at-age declined in the
0 4 8 12 16 20 24
0
2
4
6
8
Mill
ions
o fe g
gs
0 4 8 12 16 20 24Age (yrs)
0
2
4
6
8
a)
b)
Figure 5. Fecundity at age for this study (+) and historical data from May 1967 () and Postolakii 1968 ( ). Data from NAFO subdivisions 3L (a) and 2J-3K (b).

190 Fudge and Rose—Changes in Cod Fecundity
1980s and early 1990s, with the greatest declines occurring in the north-ernmost extents of the stock. The age composition of this population has become extremely truncated and since the early 1990s very few cod older than 6 years have been found (Lilly et al. 2005). Furthermore, an increasing proportion of these fish are maturing at even younger ages. In the early 1960s, 15% of females were mature at 6 years of age; this increased to 50% in the 1970s to 80s and to 80% in the 1990s (Fleming 1960, Lilly et al. 2005). Currently, the average age at maturity for cod in 2J is 4-5 years whereas historically it was 6-7 years (this paper; Lilly et
a)
b)
0 2 4 6 8 10Weight (kg)
0
2
4
6
0 2 4 6 8 10
0
2
4
6
Mill
ions
of e
ggs
Figure 6. Fecundity at weight for this study (+) and historical data from May 1967 () and Postolakii 1968 ( ). Data from NAFO subdivisions 3L (a) and 2J-3K (b). Weight is gutted except for Postolakii 1968 data, for which only whole weights were available.

191Resiliency of Gadid Stocks to Fishing and Climate Change
al. 2000). Cod sampled by May in the mid-1960s from offshore 2J-3K in similar areas to the present study were of greater age and size ranges (5-15 yrs; 3-9 kg, respectively) than were cod found in this study (4-6 years of age and 0.5-2 kg in weight).
This study also looked at a comparison of the fecundity-weight relation across North Atlantic cod stocks. May (1967) noted that the relatively high fecundity from the western Baltic and Norway might result from the low age and small size at maturation, and was not nec-essarily representative of the northeast Atlantic as a whole. Oosthuizen and Daan (1974) confirmed that Baltic and Norwegian cod fecundities are among the highest of all stocks, and that Newfoundland-Labrador cod fecundities were significantly lower. This has changed; our data
0 4000 8000 12000 16000Weight (g)
0
2000000
4000000
6000000
8000000
10000000
Fecu
n dity
2J - This study2J-3K Labrador BalticNorth Sea Iceland Norway 1Norway 2
Figure 7. Comparison of linear regressions of fecundity-weight relations in cod of different geographic regions of the North Atlantic. Data were combined by weighted averages for Baltic, North Sea, and Iceland (Table 2). Norway 1 represents data from Botros 1962; Norway 2 data are weighted averaged data from Kjesbu et al. 1998. Weights are whole weights except for cod sampled from Labrador for which only gutted weights were available. Bold lines include data from the Newfoundland and Labrador region.
192 Fudge and Rose—Changes in Cod Fecundity
show that not only are cod from 2J maturing at earlier ages but they are producing a higher number of eggs at equivalent sizes and ages than in any other reported study for any cod stock.
There are several hypotheses for these changes in life history, and although the present work does not allow us to resolve these, a few com-ments are appropriate. Drinkwater (2002) provides evidence that severe climate conditions (cold temperatures) played a role in the slower growth rates and reduced size at age evident in the 1990s. Pörtner et al. (2001) showed a significant relationship between temperature fluctuations and recruitment, and found that a cold-induced shift in energy budget occurs which is unfavorable for growth performance and fecundity. In addition, capelin (Mallotus villosus) all but disappeared in the northern areas surrounding Newfoundland and Labrador after 1990 and shifted their range southward, followed by a southward shift in cod (Narayanan et al. 1995, Carscadden et al. 1997, Rose et al. 2000b). Historically cape-lin has been the most important food of northern cod (Carscadden et al. 2001, Lilly 1994), and a primary energy source for the development of eggs (Henderson et al. 1984); but in the 1990s few offshore cod could locate them (Rose and O’Driscoll 2002). A poor diet may be contributing to the lack of survivorship past age 6, and the related early maturation and high fecundity in the offshore areas (2J-3K). Growth and repro-duction at some level compete for the limited resources of available energy. If food availability is sufficient and maintenance energy costs are taken care of, the surplus energy will bolster energy reserves and production of eggs (Wooton 1990b). Our results suggest that northern cod are investing a large amount of relatively scarce energy reserves into reproduction and in doing so may be subject to an increased risk of mortality (Lambert and Dutil 2000). Changed life history parameters could also be a survival tactic in response to the present low state of the population, the lowest recorded in history (Waiwood 1982, deYoung and Rose 1993, Sinclair and Murawski 1997). Another hypothesis is that life history changes are genetic and induced by fishing. Olsen et al. (2004) suggested that the pressures of size-selective exploitation could change the life history of cod, and that early maturation may be a genetic response to increased mortality. However, there is still no quantitative evidence linking fecundity and genetic change.
This study provides contemporary data on cod fecundity in the northwest Atlantic. Southern cod groups have fecundity schedules similar to historical norms, but the formerly dominant northern fish are maturing at earlier ages and smaller sizes, and dying young.
Early maturation, early mortality, and high fecundity are likely to be linked life history responses to environmental, population, or genetic changes. Further investigation of these changes is needed for fisheries management.
193Resiliency of Gadid Stocks to Fishing and Climate Change
AcknowledgmentsThis research was funded by the NSERC Industrial Chair in Fisheries Conservation. We thank W. Hiscock, J. Rideout, M. Windle, and the crews of the C.C.G.S. Teleost and C.C.G.S. Shamook for various forms of assistance.
References Allain, V. 1999. Fecundity of the deep-sea fish in the north-east Atlantic
Alepocephalus bairdii (Pisces: Alepocephalidae). J. Mar. Biol. Assoc. UK 79:765-767.
Anderson, J.T., and G.A. Rose. 2001. Offshore spawning and year-class strength of northern cod (2J3KL) during the fishing moratorium, 1994-1996. Can. J. Fish. Aquat. Sci. 58:1386-1394.
Botros, G.A. 1962. Die Fruchtbarkeit des Dorsches (Gadus morhua L.) in der west-Lichen Ostee und den westnorwegiachen Gewässern. Kiel. Meeresforsch. 18:67-80.
Carscadden, J., B.S. Nakashima, and K.T. Frank. 1997. Effects of fish length and temperature on the timing of peak spawning in capelin (Mallotus villosus). Can. J. Fish. Aquat. Sci. 54:781-787.
deYoung, B., and G.A. Rose. 1993. On recruitment and distribution of Atlantic cod (Gadus) off Newfoundland. Can. J. Fish. Aquat. Sci. 50:2729-2741.
DFO. 2004a. Northern (2J+3KL) cod. Canadian Scientific Advisory Secretariat Stock Status Report 2004/011.
DFO. 2004b. Subdivision 3Ps cod. Canadian Scientific Advisory Secretariat Stock Status Report 2004/039.
Drinkwater, K.F. 2002. A review of the role of climate variability in the decline of northern cod. Am. Fish. Soc. Symp. 32:113-130.
Dutil, J-D., M. Castonguay, D. Gilbert, and D. Gascon. 1999. Growth, condition, and environmental relationships in Atlantic cod (Gadus morhua) in the northern Gulf of St. Lawrence and implications for management strategies in the Northwest Atlantic. Can. J. Fish. Aquat. Sci. 56:1818-1831.
Earll, R.E. 1880.A report on the history and present condition of the shore cod fisheries of Cape Ann, Mass., together with notes on the natural history and artificial propagation of the species. Report of the Commission for 1878. United States Commission of Fish and Fisheries, Washington, D.C.
Fleming, A.M. 1960. Age, growth and sexual maturity of cod (Gadus morhua L.) in the Newfoundland area, 1947-1950. J. Fish. Res. Board Can. 17(6):775-809.
Fulton, T.W. 1890. The comparative fecundity of sea-fishes. Ninth Ann. Rept. Fish Bd. Scotland Pt. 6:685-740.
Henderson, R.J., J.R. Sargent, and C.C.E. Hopkins. 1984. Changes in the content and fatty acid composition of lipid in an isolated population of the cape-lin, Mallotus villosus, during sexual maturation and spawning. Mar. Biol. 78:255-263.

194 Fudge and Rose—Changes in Cod Fecundity
Joakimsson, G. 1969. Fruchtbarkeitsbestimmungen an Kabeljau, Schellfisch und Hering in isländischen Gewässern. Kiel. Meeresforsch. 25:172-189.
Kjesbu, O.S., P.R. Witthames, P. Solemdal, and C.E. Wilson. 1998. Temporal variations in the fecundity of arcto-Norwegian cod (Gadus morhua) in response to natural changes in food and temperature. J. Sea Res. 40:303-321.
Kraus G., A. Muller, K. Trella, and F.W. Koster. 2000. Fecundity of Baltic cod: Temporal and spatial variation. J. Fish Biol. 56:1327-1341.
Lambert, Y., and J.D. Dutil. 2000. Energetic consequences of reproduction in Atlantic cod (Gadus morhua) in relation to spawning level of somatic energy reserves. Can. J. Fish. Aquat. Sci. 57:815-825.
Lawson, G.L., and G.A. Rose. 2000. Seasonal distribution and movements of coastal cod (Gadus morhua L.) in Placentia Bay, Newfoundland. Fish. Res. 49:61-75.
Lilly, G.R. 1994. Predation by Atlantic cod on capelin on the southern Labrador and Northeast Newfoundland shelves during a period of changing spatial distributions. ICES Mar. Sci. Symp. 198:600-611.
Lilly, G.R., J. Brattey, N.G. Cadigan, B.P. Healey, and E.F. Murphy. 2005. An assessment of the cod (Gadus morhua) stock in NAFO divisions 2J3KL in March 2005. Canadian Scientific Advisory Secretariat Research Document 2005/018.
Lilly, G.R., P.A. Shelton, J. Brattey, N.G. Cadigan, E.F. Murphy, and D.E. Stansbury. 2000. An assessment of the cod stock in NAFO Divisions 2J+3KL. Canadian Scientific Advisory Secretariat Res. Doc. 2000/063.
May, A.W. 1967. Fecundity of Atlantic cod. J. Fish. Res. Board Can. 24:1531-1551.
McIntyre, T.M., and J.A. Hutchings. 2003. Small-scale temporal and spatial variation in Atlantic cod (Gadus morhua) life history. Can. J. Fish. Aquat. Sci. 60:1111-1121.
Mello, L.G.S., and G.A. Rose. 2005. Seasonal growth of Atlantic cod: Effects of temperature, feeding and reproduction. J. Fish. Biol. 67:149-170.
Motoda, S. 1959. Devices of simple plankton apparatus. Mem. Fac. Fish. Hokkaido Univ. 7:73-94.
Murua, H., G. Kraus, F. Saborido-Rey, P.R. Witthames, A. Thorsen, and J. Junquera. 2003. Procedure to estimate fecundity of a marine fish spe-cies in relation to their reproductive strategy. J. Northwest Atl. Fish. Sci. 33:33-53.
Narayanan, S., J. Carscadden, J.B. Dempson, M.F. O’Connell, S. Prinsenberg, D.G. Reddin, and N. Shackell. 1995. Marine climate off Newfoundland and its influence on salmon (Salmo salar) and capelin (Mallotus villosus). In: R.J. Beamish (ed.), Climate change and northern fish populations. Can. Spec. Publ. Fish. Aquat. Sci. 121 pp.
Olsen, E.M., M. Heino, G.R. Lilly, M.J. Morgan, J. Brattey, B. Ernande, and U. Dieckmann. 2004. Maturation trends indicative of rapid evolution pre-ceded the collapse of northern cod. Nature 428:932-935.
195Resiliency of Gadid Stocks to Fishing and Climate Change
Oosthuizen, E., and N. Daan. 1974. Egg fecundity and maturity of North Sea cod, Gadus morhua. Neth. J. Sea Res. 8:378-397.
Pinhorn, A.T. 1984. Temporal and spatial variation in fecundity of Atlantic cod (Gadus morhua) in Newfoundland waters. J. North-west Fish. Sci. 5:161-170.
Postolakii, A.I. 1967. Fecundity of cod of the Labrador stock. Transactions of N.M. Knipovich’s Arctic Research and Planning Institute of Sea Fish Economy and Oceanography.
Pörtner, H.O., B. Berdal, R. Blust, O. Brix, A. Colosimo, B. De Wachter, A. Giuliani, T. Johansen, T. Fischer, R. Knust, G. Lannig, G. Naevdal, A. Nedenes, G. Nyhammer, F.J. Sartoris, I. Serendero, P. Sirabella, S. Thorkildsen, and M. Zakhartsev. 2001. Climate-induced effects on growth performance, fecun-dity and recruitment in marine fish: Developing a hypothesis for cause and effect relationships in Atlantic cod (Gadus morhua) and common eelpout (Zoarces viviparous). Cont. Shelf Res. 21:1975-1997.
Powles, P.M. 1958. Studies of reproduction and feeding of Atlantic cod (Gadus callarias L.) in the southwestern Gulf of St. Lawrence. J. Fish. Res. Board Can 15:1383-1402.
Raitt, D.S. 1932. The fecundity of haddock. Fisheries, Scotland Sci. Invest. 1:1-42.
Rideout, R.M., and G.A. Rose. 2006. Suppression of reproduction in Atlantic cod Gadus morhua. Mar. Ecol. Prog. Ser. 320:267-277.
Rideout, R.M., M.P.M Burton, and G.A. Rose. 2000. Observations on mass atre-sia and skipped spawning in northern Atlantic cod, from Smith Sound, Newfoundland. J. Fish Biol. 57:1429-1440.
Rose, G.A. 1993. Cod spawning on a migration highway in the north-west Atlantic. Nature 366:458-461.
Rose, G.A., and R.L. O’Driscoll. 2002. Capelin are good for cod: Can the north-ern stock rebuild without them? ICES J. Mar. Sci. 59:1018-1026.
Rose, G.A., S. Gauthier, and G.L. Lawson. 2000a. Acoustic surveys in the full monte: Simulating uncertainty. Aquat. Living Resour. 13:367-372.
Rose, G.A., B. deYoung, D.W. Kulka, S.V. Goddard, and G.L. Fletcher. 2000b. Distribution shifts and overfishing the northern cod (Gadus morhua): A view from the ocean. Can. J. Fish. Aquat. Sci. 57:644-663.
Rose, G.A., I.R. Bradbury, B. deYoung, S.B. Fudge, G.L. Lawson, L.G.S. Mello, R. Rideout, D.R. Robichaud, G. Sherwood, P.V.R. Snelgrove, and M.J.S. Windle. 2008. Rebuilding Atlantic cod: Lessons from a spawning ground in coastal Newfoundland. In: G.H. Kruse, K. Drinkwater, J.N. Ianelli, J.S. Link, D.L. Stram, V. Wespestad, and D. Woodby (eds.). Resiliency of gadid stocks to fishing and climate change. Alaska Sea Grant, University of Alaska Fairbanks. (This volume.)
Schopka, S.A. 1971. Fortpflanzungsrate bei Herings- und Kabeljaupopulationen. Ber. dt. Wiss. Kommn Meeresforsch. 22:31-79.

196 Fudge and Rose—Changes in Cod Fecundity
Sherwood, G.D., and G.A. Rose. 2005. Stable isotope analysis of some repre-sentative fish and invertebrates of the Newfoundland and Labrador conti-nental shelf food web. Estuar. Coast. Shelf Sci. 63(4):537-549.
Simpson, A.C. 1951. The fecundity of the plaice. Fishery Investigations 5, -30. London: His majesty’s Stationery Office, Ministry of Agriculture and Fisheries. Ser. 2, Vol. 17.
Sinclair, A.F., and S.A. Murawski. 1997. Why have groundfish stocks declined? In: J. Boreman, B.S. Nakashima, J.A. Wilson, and R.L. Kendall (eds.), Northwest Atlantic groundfish: Perspectives on a fishery collapse. American Fisheries Society, Bethesda. Maryland.
Thain, M., and M. Hickman. 1994. The Penguin dictionary of biology, 9th edn. Penguin Books, London.
Waiwood, K.G. 1982. Growth history and reproduction in Atlantic cod (Gadus morhua). In: C.J.J. Richter and H.J.T Goos (eds.), Proceedings of the International Symposium on Reproductive Physiology of Fish. Pudoc, Wageningen, Netherlands.
Wooton, R.J. 1990a. Growth. In: Ecology of teleost fishes. Chapman and Hall, London.
Wooton, R.J. 1990b. Reproduction. In: Ecology of teleost fishes. Chapman and Hall, London.
Resiliency of Gadid Stocks to Fishing and Climate Change 197Alaska Sea Grant College Program • AK-SG-08-01, 2008
Rebuilding Atlantic Cod: Lessons from a Spawning Ground in Coastal Newfoundland
G.A. Rose, I.R. Bradbury1, B. deYoung2, S.B. Fudge, G.L. Lawson3, L.G.S. Mello, D. Robichaud4, G. Sherwood5, P.V.R. Snelgrove6, and M.J.S. WindleMemorial University, Fisheries and Marine Institute, Fisheries Conservation Group, St. John’s, Newfoundland and Labrador, Canada
AbstractAtlantic cod (Gadus morhua) was studied at the Bar Haven, Placentia Bay, Newfoundland (NAFO 3Ps stock unit) spawning ground from 1996 to 2003. Lessons applicable to management of rebuilding stocks derived from these studies are reviewed: (1) cod spawn in the same area each year, but numbers and timing vary (spawning biomass varied from 2,000 to 25,000 t, with timing protracted over at least 100 days); (2) courtship and spawning behavior is complex, and includes lekking, sound production, and vertical rituals; (3) large fish in good condition are necessary to large egg potential because fecundity increases expo-nentially with fish size—total egg potential varied considerably from year to year with spawning abundance, age changes, and mean liver condition in spawning females; (4) retention of early life stages did not explain local recruitment and rankings of annual densities of eggs, larvae and juveniles did not match with local recruitment during three years of study; (5) dispersal of early life stages, juveniles, and adults was density-dependent; (6) individual adults homed to the same spawn-
Authorship assigned alphabetically after senior author. Present affiliations: 1. Dalhousie University Department of Biology, Halifax, NS, Canada. 2. Department of Physics and Physical Oceanography, Memorial University, St. John’s, NL, Canada. 3. Woods Hole Oceanographic Institution, Woods Hole, Massachusetts, USA. 4. LGL Ltd., Sidney, BC, Canada. 5. Gulf of Maine Research Institute, Portland, Maine, USA. 6. Ocean Sciences Centre, Memorial University, St. John’s, NL, Canada.
198 Rose et al.—Rebuilding Atlantic Cod
ing ground in sequential years, but others strayed; (7) egg potential was correlated with the return of adults to the spawning ground 4-5 years later (r2 = 0.33, d.f. 3), and with recruitment to the full stock area (NAFO subdivision 3Ps) (r2 = 0.96, d.f. 5), with only weak compensation in survival at low stock size; (8) fishing on spawning aggregations may harm reproductive potential; and (9) seasonal fisheries influence fish-ing mortality, commercial yield, and value. Management implications are discussed.
IntroductionFish population dynamics at low stock sizes may differ fundamentally from those at higher stock levels and are not well understood (deYoung and Rose 1993). As a consequence, assumptions and models based on extrapolations from higher population states have proven to be unre-alistic in predicting rebuilding rates, such as those for Newfoundland and Labrador cod (e.g., Roughgarden and Smith 1996, Myers et al. 1999, Hutchings 1999). Recent evaluations of stock-recruitment relationships have emphasized the need to better understand the “low end” of the stock-recruitment relationship in stocks that have entered this domain (Walters and Martell 2004), in particular because of the possibility of depensation, which describes a population state in which growth rates do not increase and may even decline at low stock sizes (Liermann and Hilborn 2001). Although Myers et al. (1995) concluded that there was little evidence for depensation across a broad sweep of fish stocks, there is considerable evidence that at least some of the cod stocks in Newfoundland and Labrador waters entered just such a state in the 1990s (Frank and Brickman 2000, Anderson and Rose 2001, Rose 2004, Shelton et al. 2006 ). Nevertheless, it is not at all clear at what life stage depensatory mortality occurs, or if all stocks in this region are in this state.
The place to start in attempting to understand the dynamics of rebuilding in fish stocks is on the spawning grounds. Very few stud-ies have focused on multiyear studies of spawning grounds in marine fishes, with attempts to track the dynamics of a population from spawn-ing fish through the egg and juvenile stages and back to spawning recruits. No study of which we are aware has attempted to do this with a stock at a depressed population level. In the present work, we review the results of a study based at a key spawning ground for Atlantic cod (Gadus morhua) on the south coast of Newfoundland (NAFO subdivision 3Ps management unit), located on the Bar Haven shoals in Placentia Bay (Fig. 1). At the beginning of this work in the mid-1990s, the stock was recovering from a depressed state. Over the past decade it has rebuilt somewhat, although not to historic levels, and now supports the largest fishery in the northwest Atlantic (Brattey et al. 2004). It was during this

199Resiliency of Gadid Stocks to Fishing and Climate Change
period of moderate growth from a low stock size that we attempted to capture the dynamics of the life history of these fish from spawning to returning next generation adults.
The first objective of this work was to learn about the dynamics of cod populations, especially at low population sizes. Several “lessons,” used in the sense of “something learned by study or experience,” (Allen 2000) may be gleaned from this work. These form the basis of this review, which represents a synthesis of published research as well as new and more comprehensive interpretations of the data that have been collected. We add new syntheses from egg production and population models that enable comparisons of egg, larval, and juvenile concentra-tions with recruitment to the local spawning group and to the full man-agement unit stock. We also examine the persistence of the Bar Haven spawning ground. A chronological approach is taken, from spawning adults, their distribution, density, and behavior, through the early life stages, and ending at next-generation recruitment back to the spawning ground and to the full stock.
It was also an objective to use this work to provide information that could advise management. Such advice often assumes compensa-tory population dynamics (Cook 1998, Frank and Brickman 2000) such that as abundance declines, individual and population growth rates are assumed to increase. These controversial assumptions point to the importance of this study in providing a better understanding of popula-tion processes at low stock sizes.
Figure 1. Map of Placentia Bay showing the Bar Haven spawning shoals and dominant currents.
200 Rose et al.—Rebuilding Atlantic Cod
MethodsAcoustic surveys and stationsThe timing and distribution of spawning at the Bar Haven ground in Placentia Bay was monitored over eight years (1996-2003) using acous-tic survey methods employing calibrated Simrad EK500 split-beam or BioSonics single beam DT4000 echosounders (38 and 120 kHz, 6-7º half-power beam widths) (Lawson and Rose 2000a, Mello and Rose 2005a). Surveys were conducted in June 1996, from April to September in 1997-1999, and in April-early May and June from 2000 to 2003. In addi-tion to the surveys, the CCGV Shamook was moored over the spawning aggregation at the Bar Haven grounds for periods of 24-36 hours in April 2002 while acoustic data were collected continuously with a calibrated EK500 split-beam echosounder with a 38 kHz transducer deployed in a fixed position adjacent to the vessel. A video camera for species and behavioral identification and passive acoustic listening hydrophone to monitor sounds made by spawning fish were also deployed at the mooring site.
TaggingCod were tagged at the Bar Haven grounds with Floy T-tags in 1997 and with transmitting sonar tags in experimental releases in 1998, 2000, and 2002. In all cases, cod were caught with feather hooks on lines fished from the CCGS Shamook in depths ranging from 10 to 70 m. In April and May 1997, 1,813 cod were tagged with Floy Ts at the Bar Haven grounds, and several thousand fish were tagged at other locations in Placentia Bay (Lawson and Rose 2000b). Recaptures were made by the commercial and scientific fisheries. The acoustic tag was the Lotek CAFT 16-3, designed to transmit a high volume (–59 dB) coded pulse every 5 seconds for up to 3 years. These tags were surgically implanted in adult cod (Robichaud and Rose 2001) at the Bar Haven grounds (Table 1). Tagged fish were released at the capture location on the grounds and translocated from the site in the various experiments. All telemetry surveys were made with Lotek SRX-400 receivers from small vessels (4 m Zodiak and 6 m RV Gecho) equipped with hydrophones.
Egg potentialDuring all acoustic surveys, the proportions of females, the condition of their gonads (immature, ripening, spawning, or spent), and their size were routinely assessed (n = 144, 441, 504, 678, 336, 907, 347, and 365 females sampled from 1996 to 2003, respectively, ranging in length from 45 to 120 cm). Fecundity was determined from females sampled in 1999 and 2003 at Bar Haven (Fudge and Rose 2008). Spawning intensity was defined as the number of ripe females on the ground during the consecutive surveys. Spawning (egg) potential was estimated through

201Resiliency of Gadid Stocks to Fishing and Climate Change
two calculations. First, the average acoustic backscattering coefficient for females on the grounds was calculated for each year from April to June encompassing the main spawning period in all years:
S S fa n a(females) n–1= ∑ ( )
where f = the proportion of females from catch data, and n is the num-ber of surveys. Next, the numbers of females of each 10 cm length group was determined by decomposing the mean Sa (females) by the length composition determined from the catch and the mean acoustic target strength for each length class according to TS (dB) = 10 × log10
(length [cm]) –67.5 (Rose unpubl.). Egg potential was estimated from the total number of females of 10 cm length groups, the percent maturity of those groups, and their mean fecundity:
Egg potential = × ×( )∑ L LS M F10 10
where SL10 was the number of spawning females of each 10 cm length group, M was the percent maturity of the group, and F their mean fecundity.
Table 1. Homing summary from acoustic telemetry experiments conducted with adult spawning cod at Bar Haven from 1998 to 2003. All fish were tagged with Lotek CAFT-16 long term coded pinger tags. Most mortality in these fish has resulted from fishing (30-40% returns from the fishery), with a maximum time at liberty of over 4 years. “No.” is the number of fish at liberty during the homing year from each experiment.
ExperimentRelease
year No. RelocationHoming
yearHoming
% Reference
1 1998 48 No na 1
1 1998 26 No 1999 39 1
1 1998 15 No 2000 53 1
2 2000 4 No 2000 na 2
2 2000 11 Upcurrent 2000 64 2
2 2000 8 Downcurrent 2000 25 2
3 2002 16 No 2002 na 3
3 2002 17 On route 2002 51 3
3 2002 15 Off route 2002 13 3
3 2002 11 na 2003 49 3
3 2002 9 na 2003 79 3
3 2002 9 na 2003 20 3
1 Robichaud and Rose 2001. 2 Robichaud and Rose 2002. 3 Windle and Rose 2005.
(1)
(2)

202 Rose et al.—Rebuilding Atlantic Cod
Finally, estimates of total spawning numbers over each year were made by integrating over 100 days (based on the detailed chronologi-cal data from 1997 to 1999 and assuming a 20 day residence for each female cod, Robichaud and Rose 2002).
Egg and larval surveysEgg, larval, and demersal juvenile density and distribution were moni-tored from 1997 to 1999. Eggs and larvae were sampled over a grid of 45 stations throughout the spawning and post-spawning periods from April to August in 1997 and 1999, and from April to September in 1998, using a 4 m2 Tucker trawl and double oblique tows to 40 m depth. Cod eggs were staged I-IV and all stage I eggs were assumed to be cod (had-dock and witch flounder with similar eggs are uncommon in Placentia Bay, Bradbury et al. 2000). Predictions of egg development time were based on mixed layer temperature (Pepin et al. 1997).
Juvenile surveysDemersal juveniles were surveyed with a 25 m bottom seine once a month from September to December 1997-1999 at 18 sites around the shoreline of the bay that contained eelgrass habitat (Robichaud and Rose 2006). Numbers and standard length of cod caught were recorded. Hatch dates were calculated from an age-length relationship developed using standard lapillus daily-otolith-ring counts (D. Robichaud unpubl. data).
RecruitmentRecruitment was assessed from acoustic surveys at the Bar Haven spawning grounds at ages 4-5, and over the full management unit (NAFO 3Ps) using results from sequential population model Adapt run E, a middle estimate among several that varied (see Brattey et al. 2004). It is important to note that the sequential population analysis (SPA) was tuned primarily with two bottom trawl survey indices that do not cover the Bar Haven area. Hence the surveys do not overlap in space, but the main trawl survey was conducted at the same time in April as the acoustic survey at Bar Haven. The indices of recruitment differ in interpretation: the Bar Haven index reflects subadult and adult presence on this spawning ground (ages 4-5), whereas the stock index reflects survival of juveniles to age 3 over a greater proportion of, but not the full, stock range. Beverton-Holt stock-recruitment models were used to compare egg potential and recruitment, using a nonlinear fitting proce-dure assuming lognormal errors (Hilborn and Walters 1992).

203Resiliency of Gadid Stocks to Fishing and Climate Change
Results and discussionThe Bar Haven spawning groundsThe Bar Haven area in northwest Placentia Bay is dominated by a series of islands and underwater shoals that rise to within 50 m of the surface (Fig. 1). A deep channel (to 200 m) penetrates the main area between Bar Haven and Woody Islands, but the main spawning area is in the shallower waters (30-80 m) at the margins of this channel (Windle and Rose 2006). The dominant flow in Placentia Bay is the inshore branch of the Labrador Current that hooks around the Avalon Peninsula and flows counter-clockwise around the bay. The complex bathymetry and variable winds result in many eddies and local variations to these dominant flows. Tidal elevations are variable spatially but reach peak heights of 3-4 m in the Swift Current area near the Bar Haven grounds. Temperatures are generally cool as a result of the Labrador Current waters, but surface waters warm seasonally to 10-15ºC. During the spawning season, surface waters are warming but at depths of over 40-50 m retain near zero or even subzero temperatures.
The spawning biomass at Bar Haven, as estimated from acoustic surveying, ranged from a few thousand tons in 2000 to over 25,000 t in 1998 (Fig. 2). Total stock spawning biomass estimated from sequential population models ranged from about 60,000 t in 1996 to about 85,000 t in 1998 and 1999 (Brattey et al. 2004). Bar Haven represented between about 2 and 30% of the spawning biomass of the stock. The two series were weakly correlated when fit with a log model with zero intercept (r = 0.48; p = 0.07) (Fig. 3).
Lesson 1: Cod spawn in same area each year, but numbers and timing vary.Cod spawned at the Bar Haven grounds in all years from 1996 to 2003 (Figs. 2, 3). The strongest year classes on the grounds were those born in 1990, 1992, and 1997 (Fig. 4). From 1997 to 1999, and particularly in 1998, there were numbers of fish older than 7 years. From 2000 to 2003 there were very few such older fish, likely a result of a concentration of fishing effort and catch in the Bar Haven area from 1998 to 2000 (Brattey et al. 2004). From 1997 to 1999, when spawning activity was monitored near year-round, spawning was highly protracted, but peaked from April to June with a secondary peak in June or early July (Fig. 5). Early spawning coincided with export of eggs and larvae from Placentia Bay, whereas later spawning was associated with higher retention of early life stages.
The protracted spawning observed made single or short-term mea-sures of spawning density potentially misleading in terms of spawning potential. Our measures spanned the spawning from 1997 to 1999 and the major peak from April to June in the later years (1996 was a start-

204 Rose et al.—Rebuilding Atlantic Cod
up year with only a single measure in June). April-June measures are thought to capture the year-to-year variations (ranking the same if the full season had been used in those years, 98 > 97 > 99).
The location of the spawning grounds relative to current and tidal flows results in eggs and larvae being transported seaward and out of the bay if spawning occurs early in cold waters, or more likely being retained within the bay if spawning is later under warmer conditions. Surface drifters released at the Bar Haven grounds were retained within the land-sea complex of the inner bay, many at locations similar to the distribution of eggs and juveniles (Bradbury et al. 2000, Robichaud and Rose 2006).
Lesson 2: Spawning behavior is complex, involving lekking and sound production by males and extended courtship.In cod, courtship behavior and spawning may extend over a period of weeks or months and follows structured rituals. Males generally arrived first on the grounds (Robichaud and Rose 2002) and undertook a form of lekking behavior, in which they competed with other males in attempts to attract females (Hutchings et al. 1999, Nordeide and Folstad
Figure 2. Spawning biomass from acoustic surveys at Bar Haven (dashed) and in the 3Ps stock.

205Resiliency of Gadid Stocks to Fishing and Climate Change
2000, Windle and Rose 2007). Males made grunting noises periodically by contracting muscles around their swim bladder (S.B. Fudge unpubl.). These grunts were recorded primarily at night. Females moved on and off the lekking arenas as their eggs ripened, with larger females batch spawning several times over a period of a few weeks (Robichaud and Rose 2003). Courtship and spawning involved vertical movements in the water column (the height depending on the depth of water), most notably in the evening, and can be observed as rises and falls in small groups of fish that have the appearance of columns (Rose 1993, Lawson and Rose 2000a). From a fixed station, the rises and falls of fish in a spawning group appear as a wave (Fig. 6).
Lesson 3: Large fish in good condition enhance egg potential.There were large inter-annual differences in the spawning potential, with a major peak in 1997 and 1998 (1998 highest) (Fig. 7). This peak reflected for the most part a large total number of fish on the ground but also an older age structure (Fig. 4). For example, a large total number of fish was observed in 2003, but spawning potential was less than in 1997 and 1998 because of a younger age and smaller size structure. The
Figure 3. Spawning biomass at Bar Haven from acoustic surveys vs. the 3Ps stock spawning biomass, where x and y are the spawning biomass of Bar Haven and the 3Ps stock, respectively.

206 Rose et al.—Rebuilding Atlantic Cod
Figure 4. Age structure of cod at the Bar Haven spawning area, 1996-2003.

207Resiliency of Gadid Stocks to Fishing and Climate Change
Figure 5. Spawning intensity (ripe female numbers), egg, larval, and juvenile concentrations from 1997 to 1999 in Placentia Bay.

208 Rose et al.—Rebuilding Atlantic Cod
percentage of cod aged 8 years and older reached about 14% in 1998 and 1999, but declined quickly to 9% in 2000 and 5% by 2002. Estimated annual egg production rapidly declined by 2000, but increased some-what in 2002 and 2003.
Liver condition in mature female cod of all size classes varied among years (ANOVA, p < 0.05). Larger fish varied less in liver condition than smaller fish. Years of highest condition were 1997, 1998, and 2003. Mean annual liver condition in spawning females was correlated with annual egg potential (Fig. 8). In turn, cod with superior liver condition had isotope signatures characteristic of pelagic feeding (Sherwood et al. 2007), primarily a function of the availability of capelin in Placentia Bay (Mello and Rose 2005a). Liver condition in cod is known to be strongly related to reproductive success (Marshall et al. 2000).
Lesson 4: Retention of early life stages does not explain local recruitment.In the three years of study of all life stages, retention did not appear to be key to resultant survival to spawning recruitment. The 1997 year class, the strongest to return to the Bar Haven grounds from 1996 to 2003, was poorly retained within the bay, with concentrations of eggs, larvae, and juveniles the lowest measured from 1997 to 1999 (Fig. 5).
Temporal trends in the progression of life stages differed substan-tially among years (Fig. 5). In 1997, the highest adult spawner and early
Figure 6. Echogram from stationary transducer (38 kHz) over spawning aggregation at Bar Haven in 2003. The x-axis represents time (approximately 15 minutes) and the y-axis depth (as indicated). The rises and falls of the individual fish, which form columns (Rose 1993) when observed from a moving platform, can be clearly seen.

209Resiliency of Gadid Stocks to Fishing and Climate Change
Figure 7. Annual egg production by length group at Bar Haven, 1996-2003.

210 Rose et al.—Rebuilding Atlantic Cod
stage egg concentrations were found in April (mean surface temperature 0.0ºC), but only low concentrations of larvae and demersal juveniles were subsequently observed in the bay. These findings suggest that early spawning at inevitably cold temperatures led to extended develop-ment times that resulted in few larvae or juveniles being retained within the bay. In 1998, peak spawning was delayed until June when surface temperatures were 11ºC, and late stage eggs, larvae, and juveniles were more abundant within the bay (juveniles were 5 times more abundant in 1998 than in 1997). In keeping with these results, juveniles within the bay were virtually all spawned during the later peak in spawning in all years studied. Back calculations of spawning dates using otolith ages and expected egg stage durations indicated that locally retained juveniles resulted from spawning that occurred from June onward in all years. Larvae and demersal juveniles that were spawned before June were rarely observed despite an abundance of pre-June spawning in all years (Robichaud and Rose 2006).
Figure 8. Annual egg potential and the mean liver index of female cod, April-June 1997-2003. Each datum is an annual average of the females measured (1996 is excluded because of singular sampling) (r = 0.64; p < 0.05). Fecundity based on Fudge and Rose 2008.
211Resiliency of Gadid Stocks to Fishing and Climate Change
Annual rankings of the concentrations of the three life history stages, eggs, larvae, and juveniles, did not match with local recruitment to the Bar Haven grounds (97 > 98 >> 99). The ranking of juvenile (and to a lesser extent larval) density matched that of full stock recruitment, as well as annual egg potential at Bar Haven (98 > 97 >> 99).
Potential annual fecundity at Bar Haven predicted the independently modeled juvenile recruitment to the larger stock area more precisely than local spawning recruitment, which also suggests that retention was not the key factor in local recruitment. We note that these conclusions are based on three years of data only (it was not feasible to extend this part of the study), and these results must be interpreted in that light. Nonetheless, these findings, in tandem with our findings on homing behavior, are consistent with recent studies indicating that homing in cod sustains population structures (Svedang et al. 2007), although at some larger scale retention is likely to be important.
Lesson 5: Dispersal of both early life stages and adults is density-dependent.Juvenile dispersal was highly density-dependent (Robichaud and Rose 2006). When densities of juveniles were higher, they were more dis-persed. This result differs substantially with past studies conducted at lower resolution on the northeast coast of Newfoundland, in which den-sity-dependence of juveniles was not detected (Schneider et al. 1997).
Adults disperse from the Bar Haven grounds after spawning, in some years venturing around the Avalon Peninsula as far north as Trinity Bay (Lawson and Rose 2000a,b). Fish of larger size travel far-ther, with the exception of very large fish that become more sedentary (Lawson and Rose 2000a,b). In years of higher abundance, more fish will migrate farther. Tagging results reported in Lawson and Rose (2000b) and Brattey et al. (1999), suggest that the extent of the post-spawning migration to the north from fish tagged in Placentia Bay may have been greater in 1997 and 1998 than in the following years when the numbers of fish spawning at Bar Haven were lower.
Lesson 6: Adults home in sequential years to the same spawning ground.Telemetry experiments conducted at the Bar Haven grounds from 1998 to 2003 showed that adult cod are capable of precise homing both in subsequent years and in the same year after being transplanted back along the spawning migration route (Table 1). The only experiments in which cod did not home at a high rate were those in which cod were displaced to what was likely to be unfamiliar territory not on the migra-tion path (Robichaud and Rose 2002, Windle and Rose 2005; Table 1). Overall, discounting those transplant experiments, homing averaged about 60%. It is important to recognize that this work does not address

212 Rose et al.—Rebuilding Atlantic Cod
natal homing. The present data are not adequate to address that issue. Nevertheless, the demonstrated homing that takes place to the Bar Haven grounds is likely the mechanism that sustains this spawning group (Robichaud and Rose 2001, Windle and Rose 2005). It is equally important to note that on average 40% of cod did not home, but strayed, presumably to other spawning grounds. As many of these fish were subsequently caught in the fisheries, there is no evidence of elevated morality as a cause of non-returning fish.
Lesson 7: At low stock sizes, egg potential predicts recruitment.Overall annual spawning potential (eggs) at the Bar Haven ground from 1996 to 2000 was correlated with recruitment to the Bar Haven ground four and five years later (r2 = 0.41) and to the full fisheries management unit (NAFO subdivision 3Ps) (r2 = 0.95) in Beverton-Holt models (Figs. 9, 10). Surprisingly, the full stock relationship was the stronger of the two, based on six years of independent data (only four years of data were available from Bar Haven). The correlation between egg potential and local recruitment may be explained by homing, but why the strong relationship exists with the full stock recruitment series is uncertain. One possibility is that Bar Haven spawning could be driving recruit-ment in the full stock, but it seems more likely that egg production is widely correlated. We cannot distinguish between these two notions. Nevertheless, the predictive power of the stock-recruitment relation-
Figure 9. Egg potential at Bar Haven (closed circles), and recruits at age 3 to 3Ps stock (open circles) and to the Bar Haven grounds at age 4-5 years (open diamonds).

213Resiliency of Gadid Stocks to Fishing and Climate Change
ship offers the possibility that recruitment might be predicted several years in advance by a relatively simple monitoring of one key spawning ground. It is also important to note that although potential fecundity appears to be a much more reliable index of actual stock size for stock-recruitment analyses than is biomass or numbers (Marshall et al. 1998), and this was true in our study, most of the variability in egg production was explained by the more easily measured spawning stock biomass.
A lower slope of the stock (egg production)-recruitment relationship at Bar Haven relative to the full stock suggests that at lower stock sizes there will be a greater tendency for local recruitment, and that at larger stock sizes more dispersion of recruits to a greater area will take place. This relationship has important implications for rebuilding of Atlantic cod stocks, and perhaps those of other species, where some sub-stock
Figure 10. Paulik or life history diagram (Nash and Dickey-Collas 2005) of cod showing relationships between spawning stock biomass (SSB), egg potential, juvenile density, and recruits both to the Bar Haven grounds and to the full 3Ps stock. SSB in 104 t; Potential eggs × 1012; Juveniles indexed; and recruits × 106. Juveniles have no units (index only).

214 Rose et al.—Rebuilding Atlantic Cod
components have fared better than others, and where expansion of the more productive components may be key to rebuilding.
It is important to note that there was little evidence in our data of strong compensation in survival rates from egg to adult (Fig. 11). Nor was there evidence of strong depensation, which has been postulated for the more depressed stocks of northern and Grand Bank cod (e.g., Frank and Brickman 2000, Anderson and Rose 2001, Rose 2004). At Bar Haven, recruitment was more or less directly related to egg potential, with similar rates of survival evident at all but the lowest production. The relationship with the full stock is also shown in Fig. 11, although we make no claims of cause and effect.
Figure 11. Survivorship from egg potential spawned at Bar Haven to subsequent spawning recruits back to Bar Haven (open diamonds) and to the full stock (closed circles).
215Resiliency of Gadid Stocks to Fishing and Climate Change
Lesson 8: Differential fishing mortality may harm spawning components.The NAFO division 3Ps cod stock includes several spawning grounds that may comprise reproductive populations (Lawson and Rose 2000a,b; Bradbury et al. 2000). The fishery opened in 1997 tended to concentrate effort in Placentia Bay, and in particular in the Bar Haven area. From 1998 to 2000 the fishing intensity was extreme during the spring and late fall, when cod tend to aggregate at Bar Haven. As much as 35-40% of the total catch from 3Ps came from Placentia Bay during these years (FRCC 2002), and as much as 33% from the resident population (Mello and Rose 2005a). A steep decline in the numbers of fish spawning at Bar Haven is evident after 1998, preceding the decline in the full stock (Fig. 2). In addition, the rate of increase in spawning biomass in the full stock suggested by the population model has been much more modest at the Bar Haven grounds. The year-to-year decline in returns of spawning cohorts of ages 5-10 years averaged 0.85 from 1997 to 2003 (equivalent to instantaneous mortality Z with the assumption of sequential homing or similar proportion of the stock returning to Bar Haven each year). This assumption was almost certainly violated in year 2000 when fish did not return to the grounds. (The reasons are not known but large concentrations of fish were located in the deep channel of the bay in spawning condition, but they did not come to the Bar Haven grounds that year.) Hence, the data show a systematic decline in all age classes in 2000 and an untenable increase in 2001, but in all other years the assumption of homing is reasonable. In contrast, estimates of fishing mortality from the SPA population model, pooled over the same ages, ranged from less than 0.2 to about 0.4 during the same period (add 0.2 for M) (Brattey et al. 2004). These data suggest that the mortality rate of the Bar Haven spawning fish was considerably higher than in the general population, and a decline in egg production and then recruit-ment were immediate and delayed results, respectively. Additional tagging experiments conducted at Bar Haven support this conclusion (see Brattey et al. 2004).
Lesson 9: Seasonal fisheries may influence fishing mortality and commercial yield and value.Cod exhibited strong seasonality in weight and condition, reaching high-est levels in late fall and lowest in spring during spawning (Mello and Rose 2005b). Simulations based on data collected during this research indicated that fishing during spawning required mortality to be 8-17% higher to catch the same quota by weight as a fall fishery. Moreover, spring and summer fisheries resulted in lower yield (6%) and quality (5-26%) of fish products (Mello and Rose 2005b).

216 Rose et al.—Rebuilding Atlantic Cod
ConclusionsDetailed study of a part of the range of a fish stock, in particular key spawning grounds, with subsequent linkages through the life history and the next generation of recruits, can yield insights into the popula-tion dynamics of a fish stock that might be lost with the broader but less detailed measures typical of most stock assessments (e.g., Brattey et al. 2004). We believe that our observations are of particular importance to cod and other stocks that are at low population levels, where former sub-stock structures have either been reduced or even eradicated by overfishing or failing production. We draw the following conclusions with reference to the ecology and management of rebuilding cod (and other) stocks:
1. Monitoring of the abundance and age structure of spawning groups and their egg potential offers a simple and effective means of track-ing the present state and future potential of a fish stock;
2. Fishing on spawning grounds without restricting catch quotas to that local group risks differential reduction and overfishing of criti-cal spawning components in fish stocks having multiple spawning grounds (such as the one studied here);
3. Fishing on spawning grounds risks differential removal of the largest spawners and hence reducing disproportionately egg potential and recruitment. Spawning behavior is complex hence intrusive fishing could reduce reproductive success;
4. During the spawning season, cod are in their poorest somatic condi-tion, and commercial quality and yield will be poorer than during the fall period;
5. A reasonable number of large cod in a spawning population (ca. 15%), here 8 years and older, will enhance potential fecundity, and provide an indication that fishing mortality is not too high. Large numbers of younger, smaller spawners are less likely to produce strong recruit-ment; and
6. Compensatory rates of survival of early life stages may not occur at low stock sizes. The formerly dominant offshore spawning groups of cod in Newfoundland waters were reduced to perhaps 1-2% of their historic levels in the last half of the twentieth century, and are very likely to be in a depensatory state (Rose 2004). The Placentia Bay cod, although reduced, at their lowest point were likely not less than 10-20% of historical levels, and appear to exhibit neither strong compensation nor depensation.

217Resiliency of Gadid Stocks to Fishing and Climate Change
Finally, evaluation of alternative management strategies and tests of the population effects of the biological hypotheses advanced here could be based on simulations (e.g., Kell et al. 2007). For example, the close relationship between egg potential and stock recruitment from 1996 to 2000 predicts that recruitment will decline in the early 2000s in the NAFO 3Ps cod stock, with some recovery in the 2002-2003 year classes (this prediction will be tested in the coming years). Our results also highlight the importance of conserving local cod spawning groups (Wroblewski et al. 2005), indeed allowing their abundances to increase (Shelton et al. 2006), as a step toward rebuilding the formerly larger components of stocks.
Acknowledgments We thank crews of the RV Mares, RV Innovation, CCGS Shamook, and CCGS Teleost, S. Fraser, B. Oake, D. Methven, and numerous students for contributions to this work. We also thank two anonymous review-ers for several insightful comments on an earlier paper, including the suggestion of using a Paulik diagram to show some of our results. This research was funded by the NSERC Industrial Chair in Fisheries Conservation at the Marine Institute, Memorial University.
ReferencesAllen, R. 2000. The new Penguin English dictionary. Penguin, London. 1642
pp.
Anderson, J.T., and G.A. Rose. 2001. Offshore spawning and year-class strength of northern cod (2J3KL) during the fishing moratorium, 1994-1996. Can. J. Fish. Aquat. Sci. 58:1386-1394.
Bradbury, I.R., P.V.R. Snelgrove, and S. Fraser. 2000. Transport and develop-ment of eggs and larvae of Atlantic cod, Gadus morhua, in relation to spawning time and location in coastal Newfoundland. Can. J. Fish. Aquat. Sci. 57:1761-1772.
Brattey, J., G.L. Lawson, and G.A. Rose. 1999. Seasonal migration patterns of Atlantic cod (Gadus morhua) in subdivision 3Ps based on tagging experi-ments during 1997-1998. Canadian Stock Assessment Secretariat Research Document No. 99/37.
Brattey, J., N. Cadigan, B.P. Healey, G.R. Lilly, E.F. Murphy, P.A. Shelton, and J.-C. Mahé. 2004. Assessment of the cod (Gadus morhua) stock in NAFO subdivision 3Ps in October 2004. Canadian Science Advisory Secretariat No. 2004/083.
Cook, R.M. 1998. A sustainability criterion for the exploitation of the North Sea cod. ICES J. Mar. Sci. 55:1061-1070.
deYoung, B., and G.A. Rose. 1993. On recruitment and distribution of Atlantic cod (Gadus morhua) off Newfoundland. Can. J. Fish. Aquat. Sci. 50:2729-2741.
218 Rose et al.—Rebuilding Atlantic Cod
Frank, K.T., and D. Brickman. 2000. Allee effects and compensatory population dynamics within a stock complex. Can. J. Fish. Aquat. Sci. 57:513-517.
FRCC. 2002. Report on NAFO subdivision 3Ps cod. Fisheries Resources Conservation Council, Ottawa.
Fudge, S.B., and G.A. Rose. 2008. Changes in fecundity in a stressed popula-tion: Northern cod (Gadus morhua) off Newfoundland. In: G.H. Kruse, K. Drinkwater, J.N. Ianelli, J.S. Link, D.L. Stram, V. Wespestad, and D. Woodby (eds.). Resiliency of gadid stocks to fishing and climate change. Alaska Sea Grant, University of Alaska Fairbanks.
Hilborn, R., and C.J. Walters. 1992. Quantitative fisheries stock assessment. Chapman and Hall, New York. 570 pp.
Hutchings, J.A. 1999. Influence of growth and survival cost of reproduction on Atlantic cod (Gadus morhua). Can. J. Fish. Aquat. Sci. 56:1612-1623.
Hutchings, J.A., T.D. Bishop, and C.R. McGregor-Shaw. 1999. Spawning behav-iour of Atlantic cod, Gadus morhua: Evidence of mate competition and mate choice in a broadcast spawner. Can. J. Fish. Aquat. Sci. 56:97-104.
Kell, L.T., I. Mosqeira, P. Grosjean, J.-M. Fromentin, D. Garcia, R. Hillary, E. Jardim, S. Mardle, M. Pastoors, J.J. Poos, F. Scott, and R.D. Scott. 2007. FLR: An open-source framework for the evaluation and development of man-agement strategies. ICES J. Mar. Sci. 64:640-646.
Lawson, G.L., and G.A. Rose. 2000a. Small-scale spatial and temporal patterns in spawning of Atlantic cod (Gadus morhua) in coastal Newfoundland waters. Can. J. Fish. Aquat. Sci. 57:1011-1024.
Lawson, G.L., and G.A. Rose. 2000b. Seasonal distribution and movements of coastal cod (Gadus morhua L.) in Placentia Bay, Newfoundland. Fish. Res. 49:61-75.
Liermann, M., and R. Hilborn. 2001. Depensation: Evidence, models and impli-cations. Fish Fish. 2:33-58.
Marshall, C.T., N.A. Yaragina, B. Adlandsvik, and V. Dolgov. 2000. Reconstructing the stock-recruitment relationship for northeast arctic cod using a bioenergetic index of reproduction. Can. J. Fish. Aquat. Sci. 57:2433-2442.
Marshall, C.T., O.S. Kjesbu, N.A. Yaragina, P. Solemdal, and O. Ulltang. 1998. Is spawner biomass a sensitive measure of the reproductive and recruitment potential of northeast arctic cod? Can. J. Fish. Aquat. Sci. 55:1766-1783.
Mello, L.G.S., and G.A. Rose. 2005a. Seasonal variation in abundance and stock composition of Atlantic cod (Gadus morhua L.) in Placentia Bay, Newfoundland, in relation to fisheries. Fish. Res. 74:142-156.
Mello, LG.S., and G.A Rose. 2005b. Seasonal cycles in weight and condition in Atlantic cod (Gadus morhua L.) in relation to fisheries. ICES J. Mar. Sci. 62:1006-1015.
Myers, R.A., K.G. Bowen, and N.J. Barrowman. 1999. Maximum reproductive rate of fish at low population sizes. Can. J. Fish. Aquat. Sci. 56:2404-2419.
Myers, R.A., N.J. Barrowman, J.A. Hutchings, and A.A. Rosenberg. 1995. Population dynamics of exploited fish stocks at low population levels. Science 269:1106-1108.
219Resiliency of Gadid Stocks to Fishing and Climate Change
Nash, R.D.M., and M. Dickey-Collas. 2005. The influence of life history dynam-ics and environment on the determination of year class strength in North Sea herring (Clupea harengus L.). Fish. Oceanogr. 14:279-291.
Nordeide, J.T., and I. Folstad. 2000. Is cod lekking or a promiscuous group spawner? Fish Fish. 1:90-93.
Pepin, P., D.C. Orr, and J.T. Anderson. 1997. Time to hatch and larval size in relation to temperature and egg size in Atlantic cod. Can. J. Fish. Aquat. Sci. 54(Suppl. 1):2-10.
Robichaud, D., and G.A. Rose. 2001. Multiyear homing of Atlantic cod to a spawning ground. Can. J. Fish. Aquat. Sci. 58:2325-2329.
Robichaud, D., and G.A. Rose. 2002. The return of cod transplanted from a spawning ground in southern Newfoundland. ICES J. Mar. Sci. 1285-1295.
Robichaud, D., and G.A. Rose. 2003. Sex differences in cod residency on a spawning ground. Fish. Res. 60:33-43.
Robichaud, D., and G.A. Rose. 2006. Density-dependent distribution of demer-sal juvenile Atlantic cod (Gadus morhua) in Placentia Bay, Newfoundland. ICES J. Mar. Sci. 63:766-774.
Rose, G.A. 1993. Cod spawning on a migration highway in the north-west Atlantic. Nature 366:458-461.
Rose, G.A. 2004. Reconciling overfishing and climate change with stock dynam-ics of Atlantic cod (Gadus morhua) over 500 years. Can. J. Fish. Aquat. Sci. 61:1553-1557.
Roughgarden, J., and F. Smith. 1996. Why fisheries collapse and what to do about it. Proc. Natl. Acad. Sci. 93:5078-5083.
Schneider, D.C., D.A. Methven, and E.J. Dalley. 1997. Geographic contraction in juvenile fish: A test with northern cod (Gadus morhua) at low abundances. Can. J. Fish. Aquat. Sci. 54(Suppl. 1):187-199.
Shelton, P.A., A.F. Sinclair, G.A. Chouinard, and R. Mohn. 2006. Fishing under low productivity conditions is further delaying recovery of Northwest Atlantic cod (Gadus morhua). Can. J. Fish. Aquat. Sci. 63:235-238.
Sherwood, G.D., R.M. Rideout, S.B. Fudge, and G.A. Rose. 2007. Influence of diet on growth, condition and reproductive capacity in Newfoundland and Labrador cod (Gadus morhua): Insights from stable carbon isotopes (δ13C). Deep-Sea Res. II 54:2794-2809.
Svedang, H., D. Righton, and P. Jonsson. 2007. Migratory behaviour of Atlantic cod Gadus morhua: Natal homing is the prime stock-separating mecha-nism. Mar. Ecol. Prog. Ser. 345:1-12.
Walters, C.J., and S.J.D. Martell. 2004. Fisheries ecology and management. Princeton University Press. 399 pp.
Windle, M.J.S., and G.A. Rose. 2005. Migration route familiarity and homing of transplanted Atlantic cod (Gadus morhua). Fish. Res. 75:193-199.
Windle, M.J.S., and G.A. Rose. 2007. Do cod form spawning leks? Evidence from a Newfoundland spawning ground. Mar. Biol. 150:671-680.
Wroblewski, J.S., B. Neis, and K. Gosse. 2005. Inshore stocks of Atlantic cod are important for rebuilding the East Coast fishery. Coastal Management 33:411-432.


![[a] Age Estimation: Why? 1. Age : 7 Years2. Age:12](https://static.fdocuments.us/doc/165x107/54692249b4af9f8e0f8b4891/a-age-estimation-why-1-age-7-years2-age12.jpg)