World Migration in the Age of Globalization: Policy ...migration.uwo.ca/presentations/Li, P.-...
39
International Migration in the Age of Globalization: Implications and Challenges Presented for the Western Centre for Research on Migration and Ethnic Relations, UWO January 20, 2011 Peter S. Li, Ph.D., F.R.S.C. Department of Sociology University of Saskatchewan Canada
Transcript of World Migration in the Age of Globalization: Policy ...migration.uwo.ca/presentations/Li, P.-...
International Migration in the Age of Globalization: Implications and Challenges
Presented for the Western Centre for Research on Migration and Ethnic Relations, UWOJanuary 20, 2011
Peter S. Li, Ph.D., F.R.S.C.Department of Sociology
University of SaskatchewanCanada

Globalization and World Migration
• Globalization has increased the interconnectedness of nations, speeding up the flow of people, ideas, goods
• International migration happened before age of globalization, but the scope & speed are unprecedented
• World migrant population
-1980 – 100 million (2% world population)
-2005 – 190 million (2.9%)
-2010 – 214 million (3.1%)
-1980-2010, on average the annual increase was 3.8 m, or 2.6%
• How does globalization change world migration? What are the policy implications for immigrant-receiving countries?
2
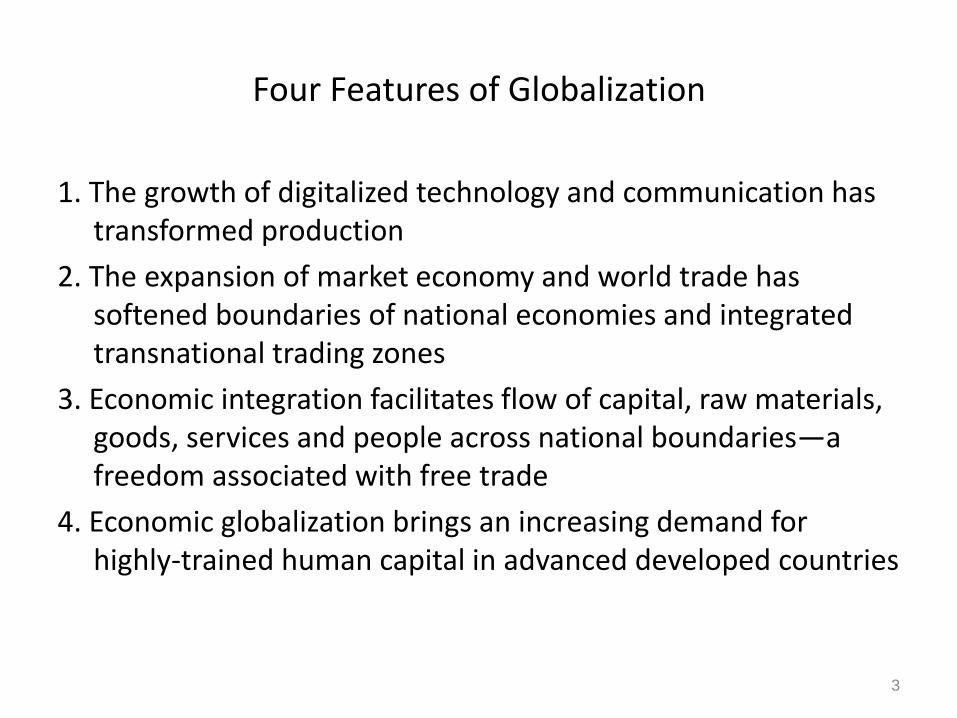
Four Features of Globalization
1. The growth of digitalized technology and communication has transformed production
2. The expansion of market economy and world trade has softened boundaries of national economies and integrated transnational trading zones
3. Economic integration facilitates flow of capital, raw materials, goods, services and people across national boundaries—a freedom associated with free trade
4. Economic globalization brings an increasing demand for highly-trained human capital in advanced developed countries
3

1. Growth of Digitalized Technology
• High-speed communication and digitalized technology have revolutionized the nature, efficiency and organization of corporate production and distribution
• Have enabled corporations to localize and economize production/distribution activities in different countries
• Concomitantly, to integrate localized economic activities in corporate headquarters in global cities
• Economic globalization thrives on advanced digitalized technology that facilitates corporation to expand their global operations and to integrate their localized activities in headquarters
4

2. Transnational Trading Zones
• National economies dismantle trade barriers by joining transnational trading zones as a means to carve out a larger share of world market.
• EU, NAFTA, ASEAN were formed in part to promote freer trade in the integrated regions
• WTO formed 1995 by 128 countries, is dedicated to free trade under a universal framework of trade
• Economic globalization expands world trade, but does so under a universal framework that aims at incorporating peripheral regions to a singular global economic system unhampered by national boundaries
5

3. Transnational Mobility
• Economic globalization internationalizes national economies, encourages free movement of people/goods
• Increased mobility not only from less to more developed regions but all among countries within integrated zone
• EU maintains the principle of free movement first for migrant workers and then for all EU citizens
• NAFTA, signed 1994, has visa provision to allow professionals cross-border employment, e.g. TN in US that covers 64 professional categories
• Economic globalization removes mobility barriers and allows high-trained human capital to move freely
6

4. Demand for Highly-Trained Human Capital
• Since economic globalization is premised on information technology, countries race to invest in the new economy in order to sustain future national growth and to capture a larger share of expanding world market
• Hence, highly-trained professionals responsible for the growth of the new economy --- those in information technology, finance, commerce, and advanced sciences ---are in great demand
• Thus, economic globalization creates the demand and the competition for highly-trained professionals and skilled workers in the world labour pool
7

Five Features of World Migration
1. World migration from less to more developed regions of the world
2. New demands for immigrants in highly developed countries due to demographic transitions
3. Globalization creates contradictory labour demands and displacements, creating mobility opportunities for some and uprooting others
4. Economic globalization creates contradictory tendencies in international migration
5. World migration has added racial and cultural diversity to historically homogeneous populations
8

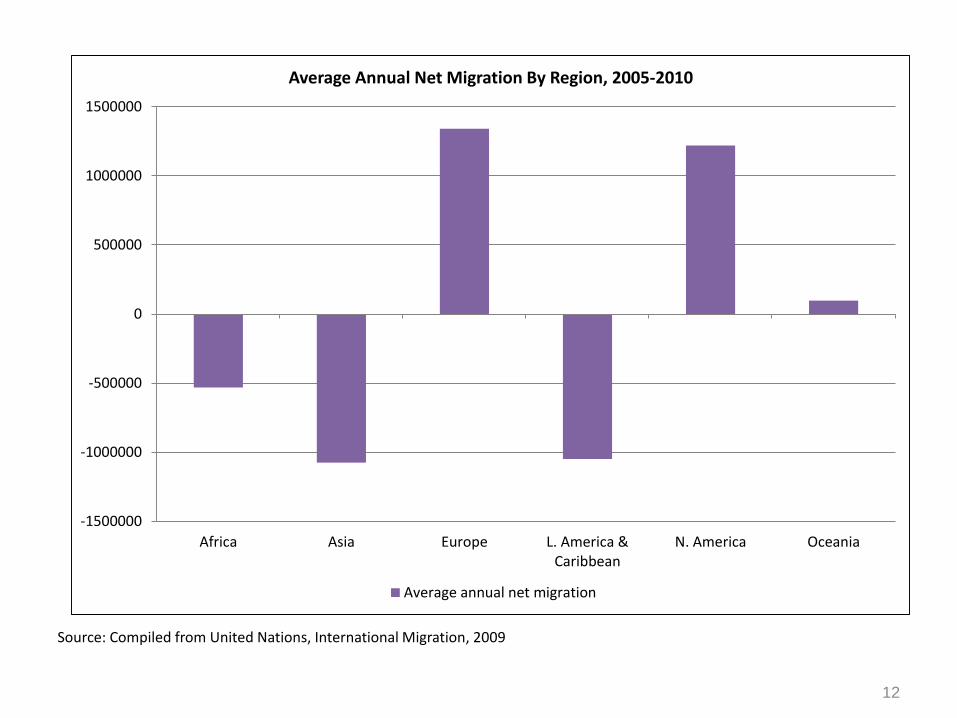
1. Uneven World Migration
• Throughout 19th and early part of 20th century Europe was a source of emigration
• Since latter half of 20th century, emigration from Europe has declined
• Shortages of skilled immigrants in the US and Canada prompted them to amend immigration laws
• Latin America, Asia, Africa have net migration loss, N America, Europe and Oceania net gain
9

Source: Compiled from United Nations, International Migration, 2009
0.0
5.0
10.0
15.0
20.0
25.0
30.0
35.0
40.0
Africa Asia Europe L. America &Caribbean
N. America Oceania
%
Distibution of Migrants By World Region, 2010
Non-refugee migrants Total migrants

11
Source: Compiled from United Nations, International Migration, 2009
0
2
4
6
8
10
12
14
16
18
Africa Asia Europe L. America &Caribbean
N. America Oceania World
%
Migrants as % of Local Population, 2010
Migrants as % of local population
12
Source: Compiled from United Nations, International Migration, 2009
-1500000
-1000000
-500000
0
500000
1000000
1500000
Africa Asia Europe L. America &Caribbean
N. America Oceania
Average Annual Net Migration By Region, 2005-2010
Average annual net migration

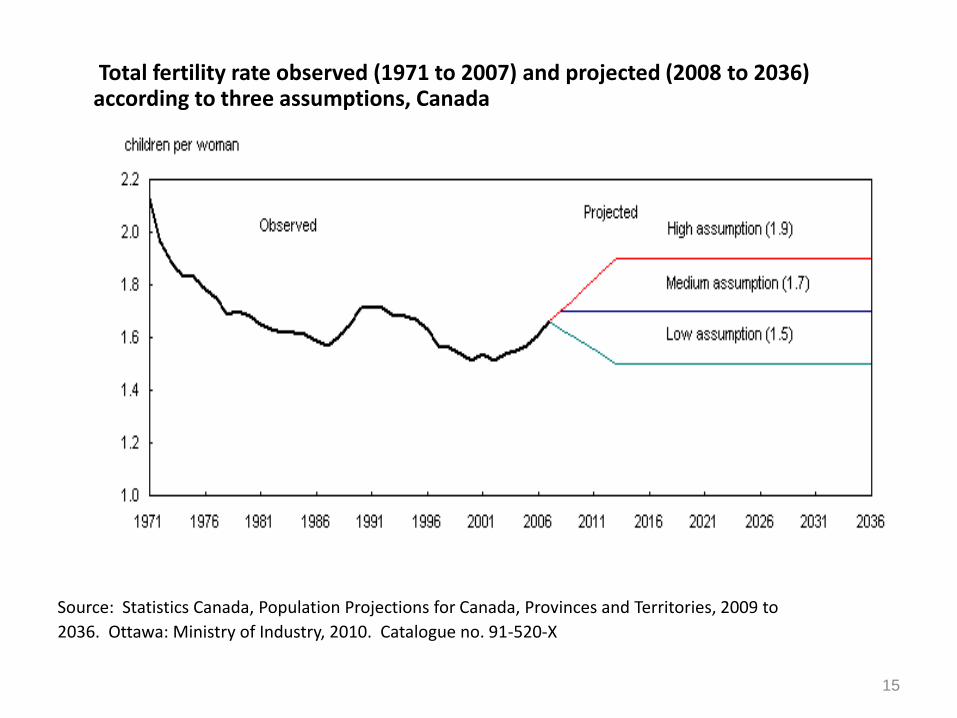
2. Demographics and Demands for Immigrants
• Declining fertility and population aging compel many highly developed countries to rely on immigrants as a source of labour market and population growth
• Among OECD, the only countries that have a fertility near 2.1 are US, New Zealand and Ireland
• Japan, Italy, Spain, Germany (1.3), Canada (1.5)
• Succeeding cohorts smaller, population aging, potential shrinking proportion in labour force & higher tax burden
• Case of Canada
13

14
Total Fertility Rate of OECD Countries, 1970-2006
Source: OECD Social Indicators, 2009
1.0
1.2
1.4
1.6
1.8
2.0
2.2
2.4
2.6
2.8
3.0
1970 1975 1980 1985 1990 1995 2000 2006
United Kingdom Czech Republic Belgium OECD-30 Sweden Spain
Replacement level of 2.1
15
Total fertility rate observed (1971 to 2007) and projected (2008 to 2036) according to three assumptions, Canada
Source: Statistics Canada, Population Projections for Canada, Provinces and Territories, 2009 to
2036. Ottawa: Ministry of Industry, 2010. Catalogue no. 91-520-X

16
Proportion of population by age group, observed (1981 to 2009) and projected (2010 to 2061), according to three scenarios, Canada
Source: Statistics Canada, Population Projections for Canada, Provinces and Territories, 2009 to2036. Ottawa: Ministry of Industry, 2010. Catalogue no. 91-520-X
17
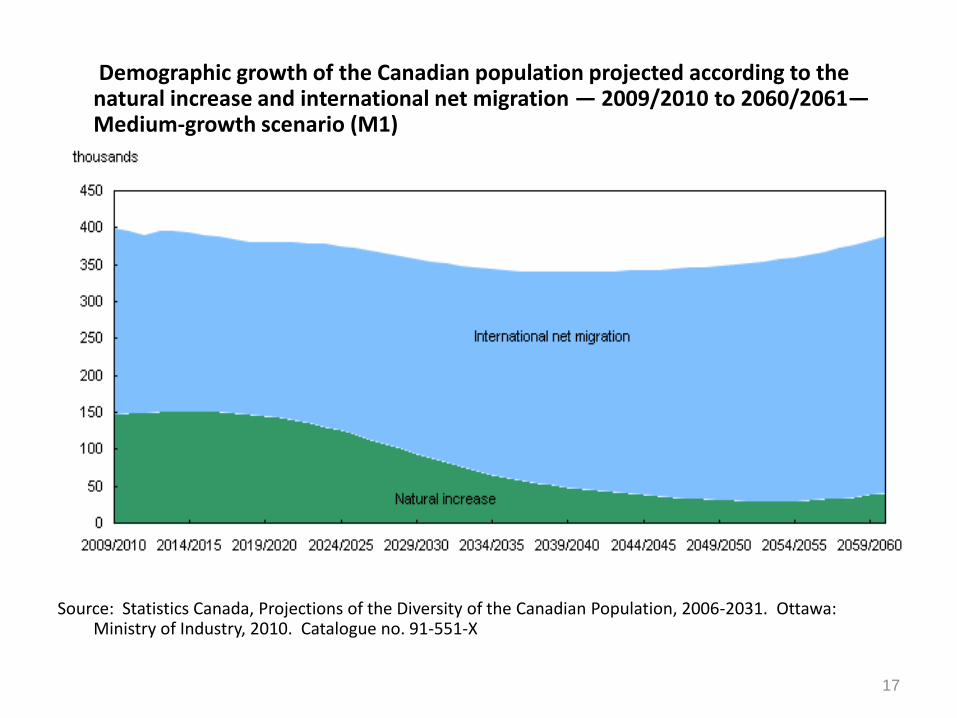
Demographic growth of the Canadian population projected according to the natural increase and international net migration — 2009/2010 to 2060/2061—Medium-growth scenario (M1)
Source: Statistics Canada, Projections of the Diversity of the Canadian Population, 2006-2031. Ottawa: Ministry of Industry, 2010. Catalogue no. 91-551-X
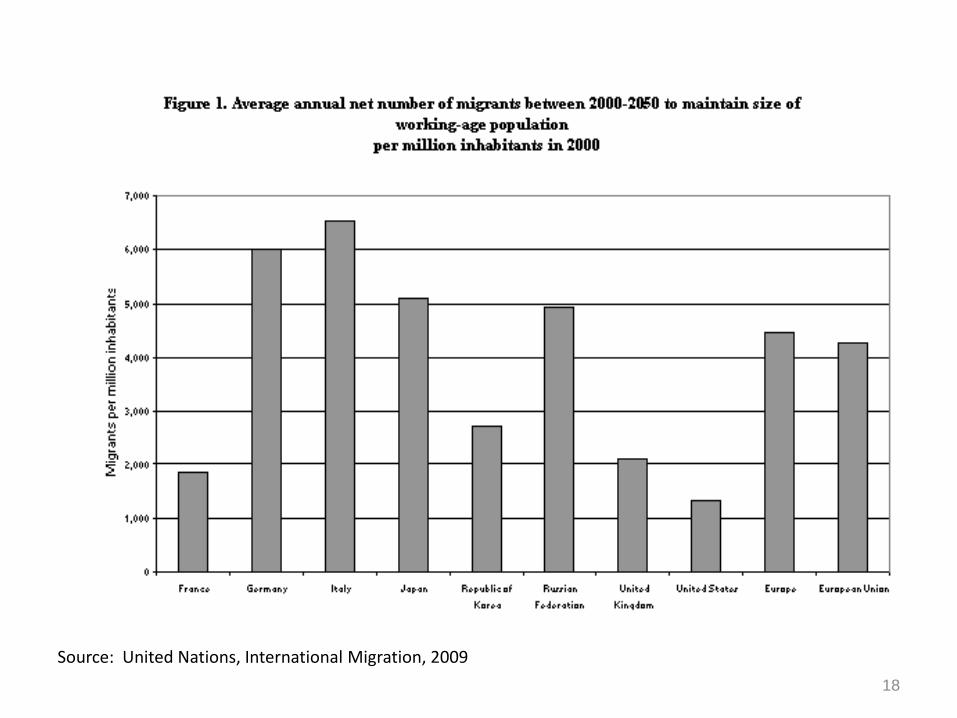
18
Source: United Nations, International Migration, 2009

3. Contradictory Labour Demands and Displacements
• In developed countries, demand for highly skilled needed for the new economy, but in peripheral or developing regions, demand for low-cost industrial labour
• Migrant workers in China grow from 144 m in 2000 to 230 m in 2009, or 17% of total population
• Also contradictions in global cities—high remuneration for professionals in specialized service firms, low pay for those tied to informalized economy
• Historically, rising demand for skilled workers met by rise in women participation and university graduates
• Changing demographics add pressures to developed countries to look to skilled immigrants as a solution
19

20
Source: Compiled from National Bureau of Statistics of China, 2009 Report of Monitoring and Surveying Migrant Workers, and Liang and Ma (2004)
0
50
100
150
200
250
Total migrants Intercounty migrants Intracounty migrants
M
i
l
l
i
o
n
s
No. of Migrant Workers in China, 2000, 2009
2000 2009

21
Source: Compiled from National Bureau of Statistics of China, 2009 Report of Monitoring and Surveying Migrant Workers, and Liang and Ma (2004)
0.0
10.0
20.0
30.0
40.0
50.0
60.0
70.0
Migrants as % total population Intercounty migrants as % of total migrants
Percent Migrant and Percent Intercounty Migrants, 2000, 2009
2000 2009

4. Contradictory Tendencies in Migration
• Freedom of movement associated with free trade
• High degree of mobility for those associated with the prosperity of the new economy
• Highly developed countries offer high remuneration and return to specialized human capital, hence movement from less to more developed regions
• Developed countries also attract unskilled workers displaced by globalization, who sought entry as illegal migrants & asylum seekers
• 2009- 15.2 million refugees, 86% in less developed regions; 14% in developed regions
• Intense competition for skilled immigrants; tightened security to bar the entry of unwanted immigrants
22

23
Source: Compiled from United Nations, International Migration, 2009
0.0
10.0
20.0
30.0
40.0
50.0
60.0
70.0
80.0
Africa Asia Europe L. America &Caribbean
N. America Oceania
%
Distribution of Refugees by World Region, 2010
Refugees as % of total world refugees

24
Source: Compiled from United Nations, International Migration, 2009
0.0
2.0
4.0
6.0
8.0
10.0
12.0
14.0
16.0
18.0
Africa Asia Europe L. America &Caribbean
N. America Oceania World
%
Refugees as % of Migrants, 2010
Refugees as % of migrants

5. Increased Diversity due to Immigration
• Changing immigrant source has added diversity to N America, Europe, Australia & New Zealand
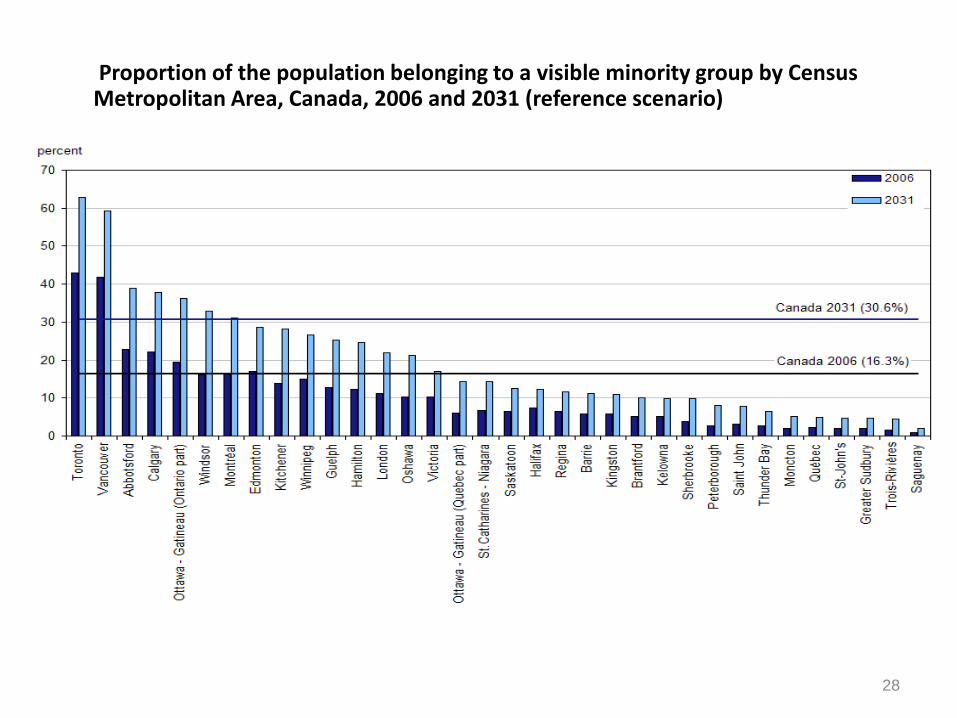
• Canada, visible minorities increased from 6.3% in 1986 to 13.4% in 2001, and 16.3% in 2006
• US, Hispanics grew to 43 million (14.3%) in 2006, outnumbered the 36 million Blacks, but Hispanics now accounts for about half of population growth
• Immigrants change the racial mix and receiving countries reacts in different degrees of nativism and intensity towards increased heterogeneity
25
26
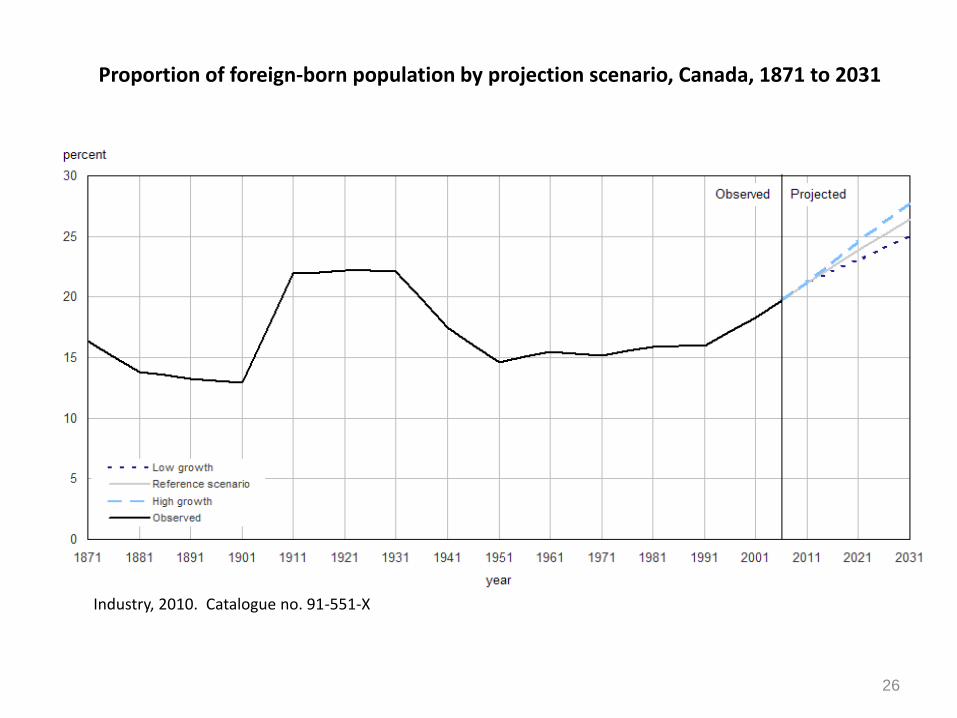
Proportion of foreign-born population by projection scenario, Canada, 1871 to 2031
Source: Statistics Canada, Projections of the Diversity of the Canadian Population, 2006-2031. Ottawa: Ministry of Industry, 2010. Catalogue no. 91-551-X

27
Proportion of the population belonging to a visible minority group by generation status, Canada, 2006 and 2031 (reference scenario)
Source: Statistics Canada, Projections of the Diversity of the Canadian Population, 2006-2031. Ottawa: Ministry of Industry, 2010. Catalogue no. 91-551-X
28
Proportion of the population belonging to a visible minority group by Census Metropolitan Area, Canada, 2006 and 2031 (reference scenario)
Source: Statistics Canada, Projections of the Diversity of the Canadian Population, 2006-2031. Ottawa: Ministry of Industry, 2010. Catalogue no. 91-551-X

Policy Implication 1: Long-term Interest and Short-Term Concerns
• Most developed countries see the need to rely on immigrants for long-term growth
• Immigration may trigger backlash from resident population in the short-term
• Policy challenge in balancing the two
• Some countries set up immigration program that maintains a stable level of immigration, but create flexibility in admission and issue work permits
• 2003-08, US admitted about 1 million immigrants annually and 264K international students, 400K temporary workers yearly; In 2009, Canada admitted 250,000 immigrants and 382K temporary residents, including 178K workers
29

30
Annual Permanent Residents (Immigrants) Admitted to Canada, 1860-2009
Source: Citizenship and Immigration Canada, Facts and Figures 2009 – Immigration overview: Permanent and temporary residents.
31
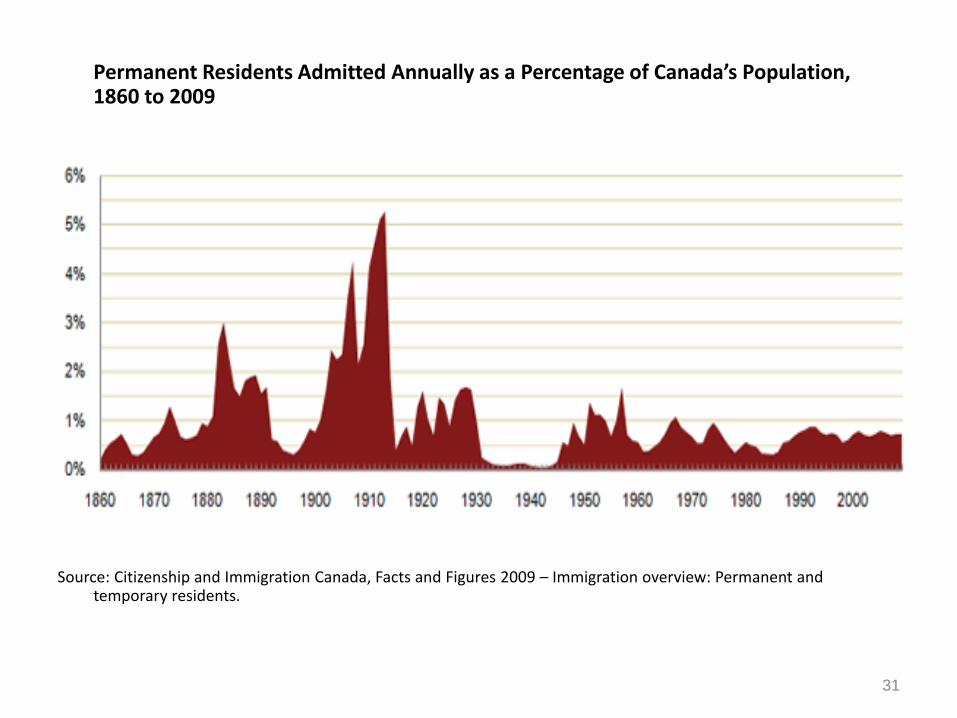
Permanent Residents Admitted Annually as a Percentage of Canada’s Population, 1860 to 2009
Source: Citizenship and Immigration Canada, Facts and Figures 2009 – Immigration overview: Permanent and temporary residents.

32
Temporary residents present in Canada on December 1st By Yearly Status, 1985 to 2009
Orange- Other temporary; Red- Humanitarian population; Beige – Foreign Students, Blue- Foreign Workers
Source: Citizenship and Immigration Canada, Facts and Figures 2009 – Immigration overview: Permanent and temporary residents.

Policy Implication 2: Issues of Pluralism, Integration and Discrimination
• Increased migration from less to more developed regions change the racial and cultural mix of receiving countries
• Rise in immigrant population from different backgrounds creates a new political constituency that can exert political demands
• Challenge of immigration policy is not just admission policy but also integration policy
• Countries vary in their response to increased diversity
• Challenge is to find policy option that bridge cultural heritage and multicultural future
33

Policy Implication 3: Border Control--Open for Skilled Immigrants, Shut for Unwanted Immigrants
• Most immigrant-receiving countries define immigrants’ value in terms of human capital
• Competition for skilled immigrants leads to softening entry requirements
• Shunning unskilled immigrants leads to tightening border to bar the unwanted immigrants
• Globalization brings a contradictory response of border control: flexible and accommodating for high-skilled workers and draconian towards unskilled workers and asylum seekers
34
Policy Implication 4: Managing Chain Migration
• As skilled migrants increase, they sponsor family members and relatives, creating chain migration
• Immigrant-receiving countries often do not attach much value to family-class immigrants but accept them as humane measures under democracy
• Policy challenge is to maintain a balance between upholding democratic principle and economic needs
• Such a balance is difficult because of upward spiral between increased skilled immigrants and increased family immigration, hence immigration backlogs
35
36
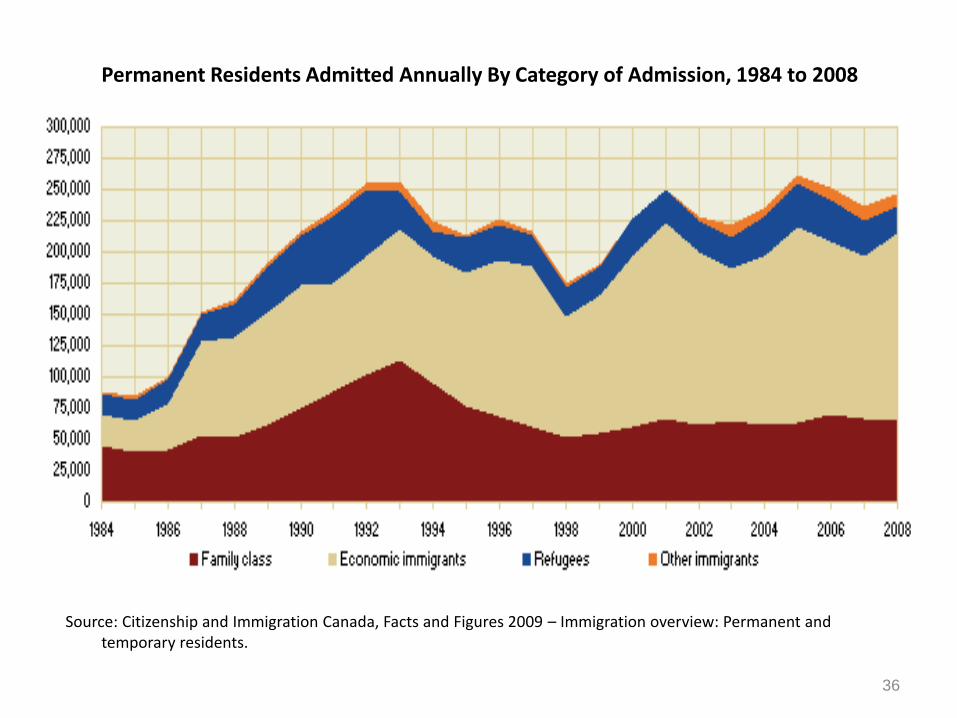
Permanent Residents Admitted Annually By Category of Admission, 1984 to 2008
Source: Citizenship and Immigration Canada, Facts and Figures 2009 – Immigration overview: Permanent and temporary residents.

37
% Immigrants Admitted Annually with University Degree, 1995 to 2009
Source: Citizenship and Immigration Canada, Facts and Figures, various years.
0.0
5.0
10.0
15.0
20.0
25.0
30.0
35.0
40.0
45.0
50.0
% Immigants Admitted with University Degree

Policy Implication 5: Return Migration from Brain Drain
• The migration of highly-trained immigrants from less developed to more developed regions is a brain drain
• But such a drain is unsustainable as the economic disparities between regions shrink.
• Case of Hong Kong immigrants to Canada
• China is now an exporter of highly-trained immigrants, but as the economic growth continues, there is likely to be return migrants
• Policy challenge for immigrant-receiving countries is to attract and to retain highly skilled immigrants
38

Future of International Migration
• Competition for skilled immigrants in the world market is like to intensify as developing countries increase output and as demographic pressures continue
• Countries which can maintain a competitive remuneration level and an enlightened policy of multiculturalism and integration will be better able to attract and retain immigrants
• Future brain drain may not be unidirectional but multi-directional, resulting in brain circulation
• There is a need for international community to develop a universal framework to regulate international migration
39