Estimating Variability of Injuries in Underbody Blast Live ... · Estimating Variability of...
17
UNCLASSIFIED UNCLASSIFIED The Nation’s Premier Laboratory for Land Forces UNCLASSIFIED The Nation’s Premier Laboratory for Land Forces UNCLASSIFIED Estimating Variability of Injuries in Underbody Blast Live-fire Testing for Evaluating Modeling and Simulation Brian Benesch DISTRIBUTION STATEMENT A. Approved for public release; distribution is unlimited
Transcript of Estimating Variability of Injuries in Underbody Blast Live ... · Estimating Variability of...
UNCLASSIFIED
UNCLASSIFIED The Nation’s Premier Laboratory for Land ForcesUNCLASSIFIED The Nation’s Premier Laboratory for Land Forces
UNCLASSIFIED
Estimating Variability of Injuries in
Underbody Blast Live-fire Testing for
Evaluating Modeling and Simulation
Brian Benesch
DISTRIBUTION STATEMENT A. Approved for public release; distribution is unlimited
UNCLASSIFIED
UNCLASSIFIED The Nation’s Premier Laboratory for Land Forces
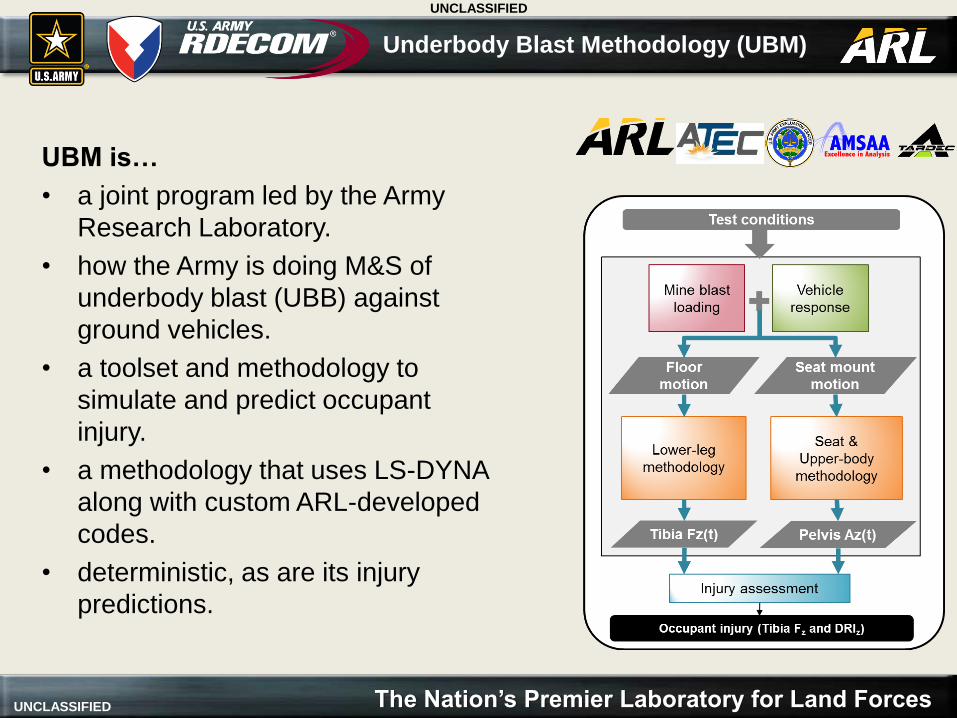
UBM is…
• a joint program led by the Army
Research Laboratory.
• how the Army is doing M&S of
underbody blast (UBB) against
ground vehicles.
• a toolset and methodology to
simulate and predict occupant
injury.
• a methodology that uses LS-DYNA
along with custom ARL-developed
codes.
• deterministic, as are its injury
predictions.
Underbody Blast Methodology (UBM)
UNCLASSIFIED
UNCLASSIFIED The Nation’s Premier Laboratory for Land Forces
• UBM is undergoing VV&A to support Army evaluations of
ground vehicles.
• UBM will be evaluated by comparing its deterministic
injury predictions to live-fire (LF) test results which contain
stochastic variability inherent in UBB testing.
• The variability of LF test results is not well defined.
Issue
UNCLASSIFIED
UNCLASSIFIED The Nation’s Premier Laboratory for Land Forces
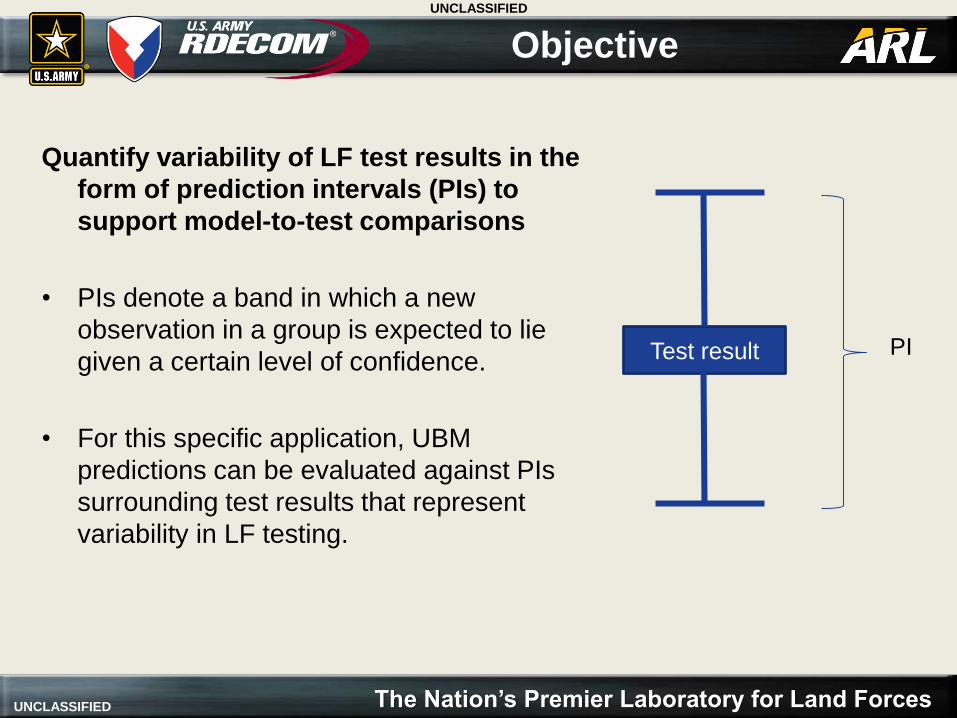
Quantify variability of LF test results in the
form of prediction intervals (PIs) to
support model-to-test comparisons
• PIs denote a band in which a new
observation in a group is expected to lie
given a certain level of confidence.
• For this specific application, UBM
predictions can be evaluated against PIs
surrounding test results that represent
variability in LF testing.
Objective
Test result PI
UNCLASSIFIED
UNCLASSIFIED The Nation’s Premier Laboratory for Land Forces
Estimate the injury variability inherent in LF UBB testing by
combining variabilities from two independent sources:
1. Repeat testing
2. Expert opinion
Pros and cons of each data source:
• Repeat testing is few in number but objective
• Expert opinion is subjective but informed by years of experience
Why aggregate estimates from both sources?
• They supplement each other.
• They are independent sources and so provide a double blind test to
corroborate the other’s estimate.
Approach
UNCLASSIFIED
UNCLASSIFIED The Nation’s Premier Laboratory for Land Forces
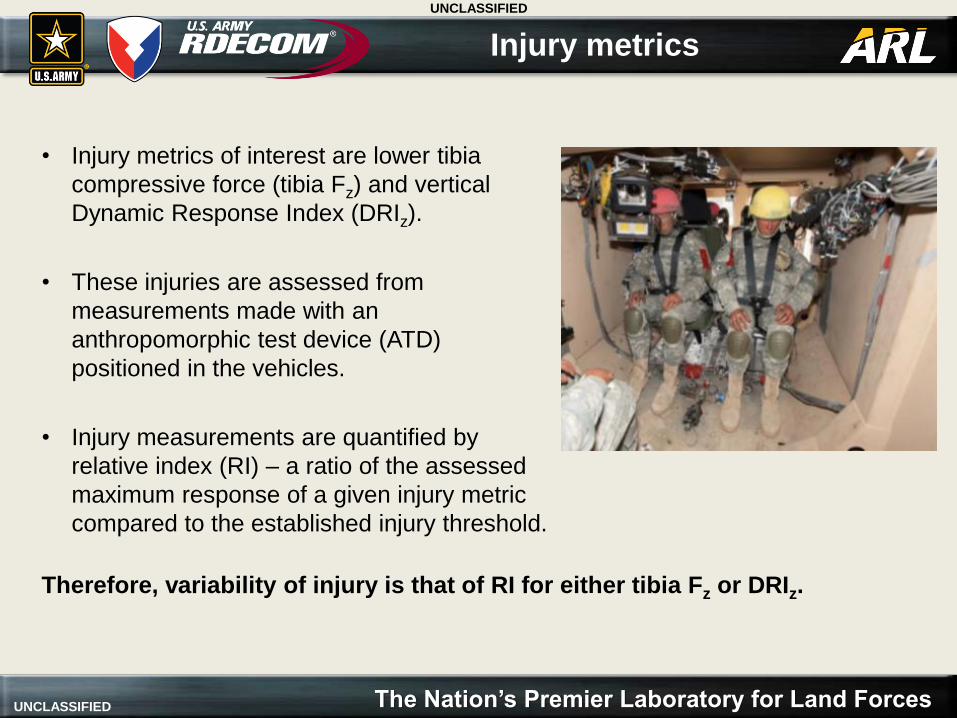
• Injury metrics of interest are lower tibia
compressive force (tibia Fz) and vertical
Dynamic Response Index (DRIz).
• These injuries are assessed from
measurements made with an
anthropomorphic test device (ATD)
positioned in the vehicles.
• Injury measurements are quantified by
relative index (RI) – a ratio of the assessed
maximum response of a given injury metric
compared to the established injury threshold.
Injury metrics
Therefore, variability of injury is that of RI for either tibia Fz or DRIz.
UNCLASSIFIED
UNCLASSIFIED The Nation’s Premier Laboratory for Land Forces
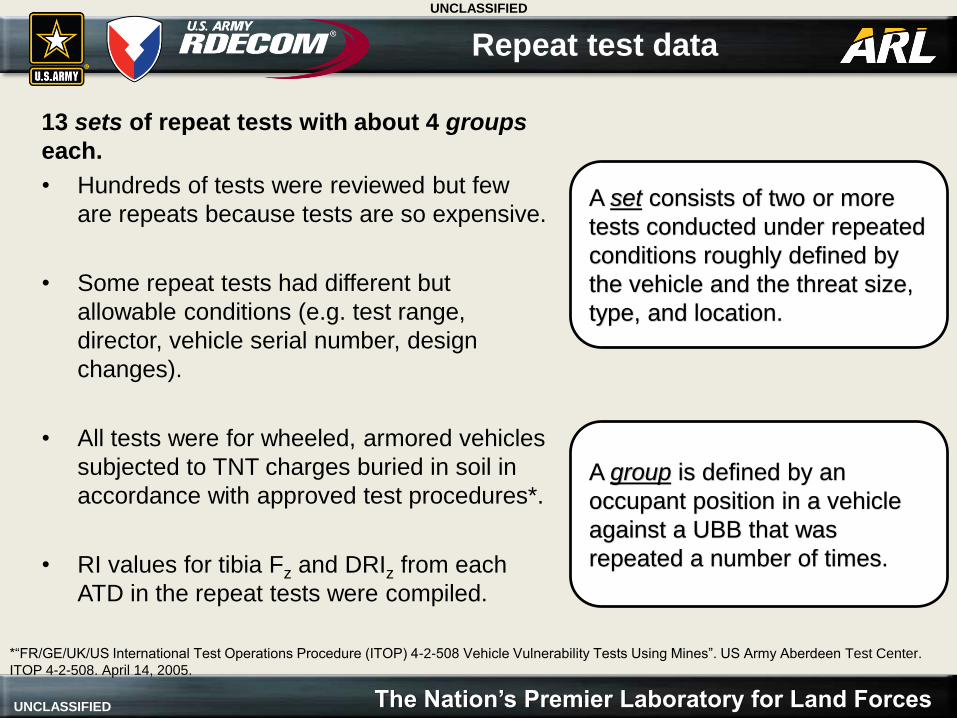
13 sets of repeat tests with about 4 groups
each.
• Hundreds of tests were reviewed but few
are repeats because tests are so expensive.
• Some repeat tests had different but
allowable conditions (e.g. test range,
director, vehicle serial number, design
changes).
• All tests were for wheeled, armored vehicles
subjected to TNT charges buried in soil in
accordance with approved test procedures*.
• RI values for tibia Fz and DRIz from each
ATD in the repeat tests were compiled.
Repeat test data
A set consists of two or more
tests conducted under repeated
conditions roughly defined by
the vehicle and the threat size,
type, and location.
A group is defined by an
occupant position in a vehicle
against a UBB that was
repeated a number of times.
*“FR/GE/UK/US International Test Operations Procedure (ITOP) 4-2-508 Vehicle Vulnerability Tests Using Mines”. US Army Aberdeen Test Center.
ITOP 4-2-508. April 14, 2005.
UNCLASSIFIED
UNCLASSIFIED The Nation’s Premier Laboratory for Land Forces
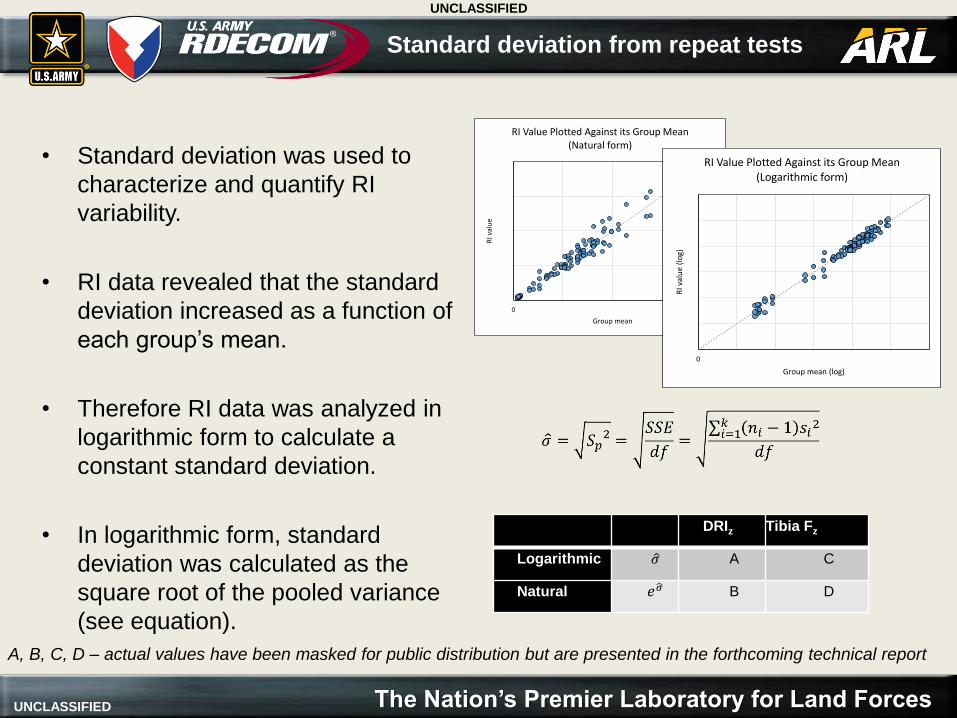
• Standard deviation was used to
characterize and quantify RI
variability.
• RI data revealed that the standard
deviation increased as a function of
each group’s mean.
• Therefore RI data was analyzed in
logarithmic form to calculate a
constant standard deviation.
• In logarithmic form, standard
deviation was calculated as the
square root of the pooled variance
(see equation).
Standard deviation from repeat tests
DRIz Tibia Fz
Logarithmic ො𝜎 A C
Natural 𝑒ෝ𝜎 B D
0
50
100
150
200
0 50 100 150 200
RI v
alu
e
Group mean
RI Value Plotted Against its Group Mean (Natural form)
0
1
2
3
4
5
6
0 1 2 3 4 5 6
RI v
alu
e (l
og)
Group mean (log)
RI Value Plotted Against its Group Mean (Logarithmic form)
0
50
100
150
200
0 50 100 150 200
RI v
alu
e
Group mean
RI Value Plotted Against its Group Mean (Natural form)
0
1
2
3
4
5
6
0 1 2 3 4 5 6
RI v
alu
e (l
og)
Group mean (log)
RI Value Plotted Against its Group Mean (Logarithmic form)
A, B, C, D – actual values have been masked for public distribution but are presented in the forthcoming technical report
UNCLASSIFIED
UNCLASSIFIED The Nation’s Premier Laboratory for Land Forces
“Expert elicitation refers to a systematic approach to synthesize subjective
judgments of experts on a subject where there is uncertainty due to
insufficient data, when such data is unattainable because of physical
constraints or lack of resources.”*
Relative to this study, there is uncertainty in the variability of injuries from
LF UBB testing due to insufficient data.
A workshop was held to extract expert intuition.
• 15 experts in attendance offering a collective 158 years of experience with
UBB testing and about 1,700 UBB tests observed, analyzed, or evaluated (28
experts were invited and all reviewed the output).
• Organizations represented: ARL-SLAD, ARL-WMRD, ATC, WIAMan, IDA,
TARDEC, DOT&E, ATEC, MCOTEA, MSCS, and JPO MRAP.
• However, experts were asked to not represent any particular organization but
instead to represent their own personal experiences and perspectives.
Expert opinion
*Slottje, P; Sluijs, J.P.; Knowl, A. B. “Expert Elicitation: Methodological suggestions for its use in
environmental health impact assessments.” National Institute for Public Health and the Environment. 2008
UNCLASSIFIED
UNCLASSIFIED The Nation’s Premier Laboratory for Land Forces
• Experts were asked to estimate these bounds for three nominal cases:
a low, medium, and high average RI value (each assigned a certain
value) focused first on tibia Fz and then on DRIz.
• Estimating a 95% bounds helped to calculate a constant standard
deviation in logarithmic units.
Question posed to experts
“Consider a large set of hypothetical repeated LF UBB tests (say, 100
tests) for a specific vehicle. For the same occupant position, assume that
an average RI of a particular injury metric value was calculated. Given that
average RI value, what are the bounds above and below it for which you
expect 95% of the injury values from the large set of hypothetical repeated
tests?”
UNCLASSIFIED
UNCLASSIFIED The Nation’s Premier Laboratory for Land Forces
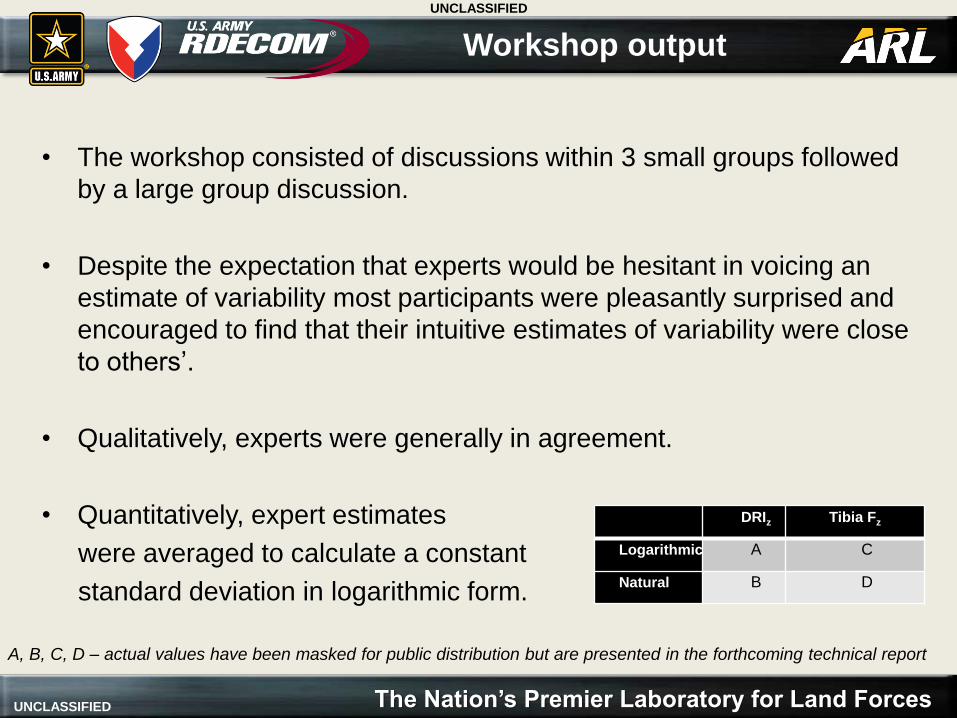
• The workshop consisted of discussions within 3 small groups followed
by a large group discussion.
• Despite the expectation that experts would be hesitant in voicing an
estimate of variability most participants were pleasantly surprised and
encouraged to find that their intuitive estimates of variability were close
to others’.
• Qualitatively, experts were generally in agreement.
• Quantitatively, expert estimates
were averaged to calculate a constant
standard deviation in logarithmic form.
Workshop output
DRIz Tibia Fz
Logarithmic A C
Natural B D
A, B, C, D – actual values have been masked for public distribution but are presented in the forthcoming technical report
UNCLASSIFIED
UNCLASSIFIED The Nation’s Premier Laboratory for Land Forces
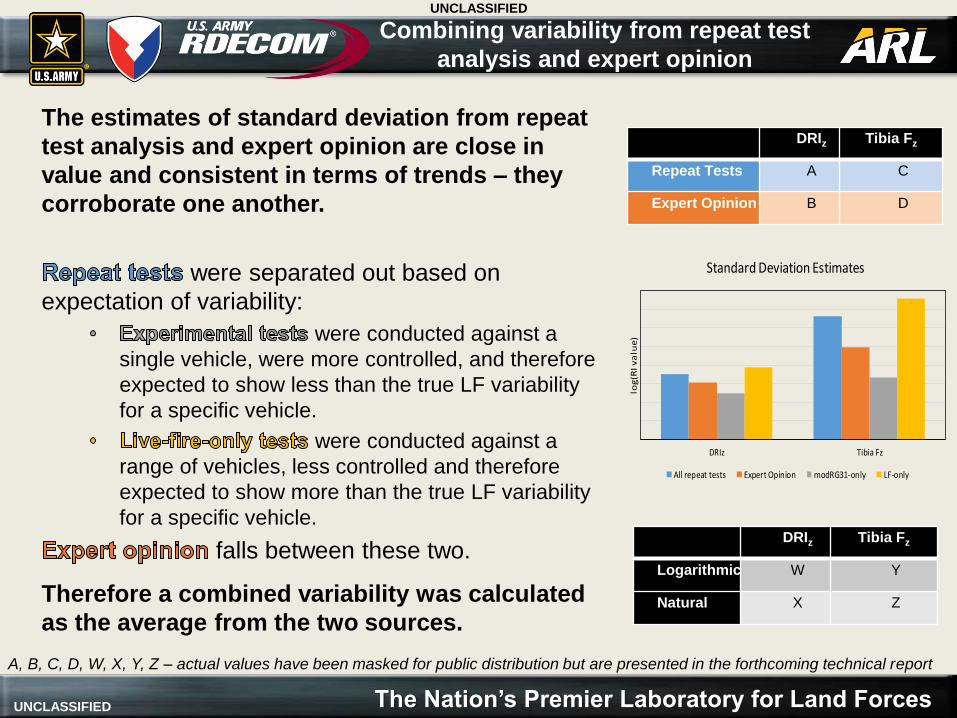
The estimates of standard deviation from repeat
test analysis and expert opinion are close in
value and consistent in terms of trends – they
corroborate one another.
were separated out based on
expectation of variability:
were conducted against a
single vehicle, were more controlled, and therefore
expected to show less than the true LF variability
for a specific vehicle.
were conducted against a
range of vehicles, less controlled and therefore
expected to show more than the true LF variability
for a specific vehicle.
falls between these two.
Combining variability from repeat test
analysis and expert opinion
DRIz Tibia Fz
Repeat Tests A C
Expert Opinion B D
DRIz Tibia Fz
Logarithmic W Y
Natural X ZTherefore a combined variability was calculated
as the average from the two sources.
A, B, C, D, W, X, Y, Z – actual values have been masked for public distribution but are presented in the forthcoming technical report
DRIz Tibia Fz
log
(RI
va
lue
)
Standard Deviation Estimates
All repeat tests Expert Opinion modRG31-only LF-only
UNCLASSIFIED
UNCLASSIFIED The Nation’s Premier Laboratory for Land Forces
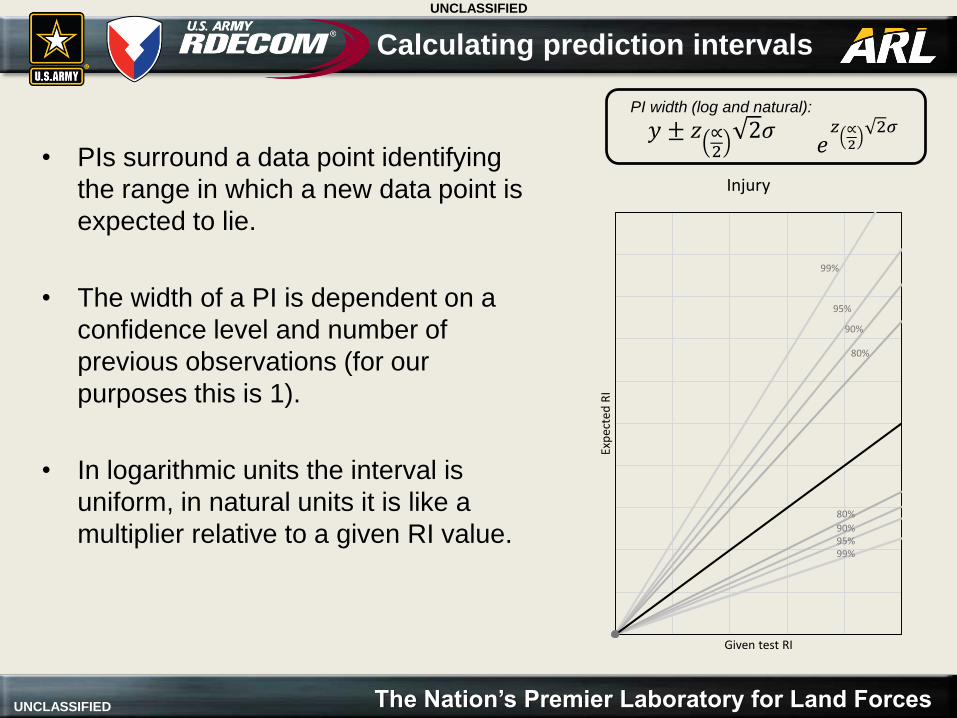
• PIs surround a data point identifying
the range in which a new data point is
expected to lie.
• The width of a PI is dependent on a
confidence level and number of
previous observations (for our
purposes this is 1).
• In logarithmic units the interval is
uniform, in natural units it is like a
multiplier relative to a given RI value.
Calculating prediction intervals
𝑦 ± 𝑧 ∝2
2𝜎𝑒𝑧 ∝
22𝜎
Exp
ecte
d R
I
Given test RI
Injury
99%
95%
90%
80%
99%95%90%
80%
PI width (log and natural):
UNCLASSIFIED
UNCLASSIFIED The Nation’s Premier Laboratory for Land Forces
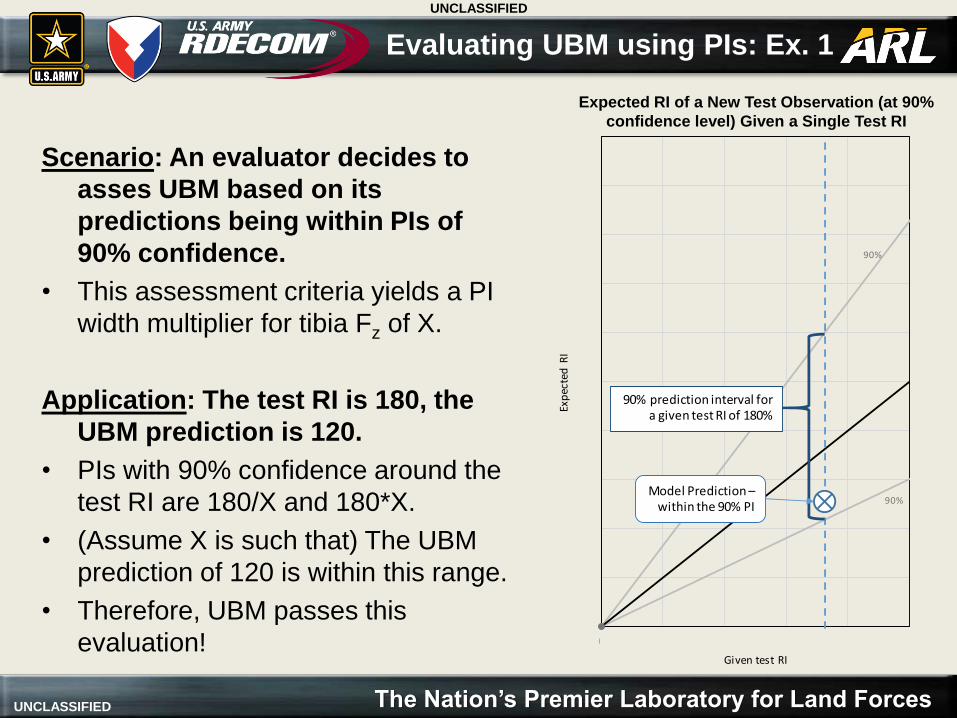
Scenario: An evaluator decides to
asses UBM based on its
predictions being within PIs of
90% confidence.
• This assessment criteria yields a PI
width multiplier for tibia Fz of X.
Application: The test RI is 180, the
UBM prediction is 120.
• PIs with 90% confidence around the
test RI are 180/X and 180*X.
• (Assume X is such that) The UBM
prediction of 120 is within this range.
• Therefore, UBM passes this
evaluation!
Evaluating UBM using PIs: Ex. 1
Expected RI of a New Test Observation (at 90%
confidence level) Given a Single Test RI
0
50
100
150
200
250
300
350
400
450
500
0 50 100 150 200 250
Exp
ecte
d R
I
Given test RI
Tibia Fz (in ERB)
90%
90%
90% prediction interval for a given test RI of 180%
Model Prediction –within the 90% PI
UNCLASSIFIED
UNCLASSIFIED The Nation’s Premier Laboratory for Land Forces
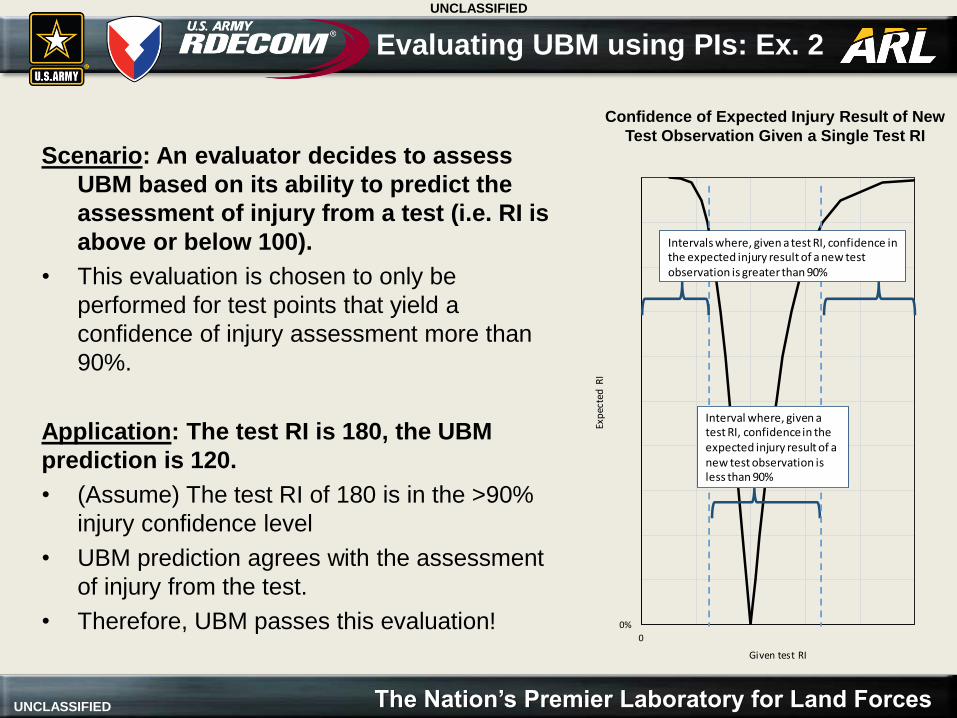
Scenario: An evaluator decides to assess
UBM based on its ability to predict the
assessment of injury from a test (i.e. RI is
above or below 100).
• This evaluation is chosen to only be
performed for test points that yield a
confidence of injury assessment more than
90%.
Application: The test RI is 180, the UBM
prediction is 120.
• (Assume) The test RI of 180 is in the >90%
injury confidence level
• UBM prediction agrees with the assessment
of injury from the test.
• Therefore, UBM passes this evaluation!
Evaluating UBM using PIs: Ex. 2
Confidence of Expected Injury Result of New
Test Observation Given a Single Test RI
0%
10%
20%
30%
40%
50%
60%
70%
80%
90%
100%
0 50 100 150 200 250
Exp
ecte
d R
I
Given test RI
Tibia Fz (in ERB)
Intervals where, given a test RI, confidence in the expected injury result of a new test observation is greater than 90%
Interval where, given a test RI, confidence in the expected injury result of a new test observation is less than 90%
UNCLASSIFIED
UNCLASSIFIED The Nation’s Premier Laboratory for Land Forces
• Variability of tibia Fz and DRIz for LF testing was quantified in the form of
standard deviation estimates.
• Standard deviations were produced using two independent sources:
repeat tests and expert opinion.
• These two sources yielded similar values for a given injury metric and
consistent trends across the two injury metrics.
• One set of aggregated estimates were produced from the two sources.
• The standard deviation estimates were used to generate PIs which can be
used to support the comparison of UBM predictions to LF test results for
evaluation of UBM.
Additional comments:
• Standard deviation estimates were generated for LF tests against a specific vehicle – they should be
modified for a different vehicle.
• Additionally, estimates were made for tests conducted in different soil types.
Conclusion/summary
UNCLASSIFIED
UNCLASSIFIED The Nation’s Premier Laboratory for Land Forces
ARL-SLAD: Army Research Laboratory’s Survivability/Lethality Analysis
Directorate
ARL-WMRD: Army Research Laboratory’s Weapons & Materials Research
Directorate
ATC: Aberdeen Test Center
WIAMan: Warrior Injury Assessment Manikin
IDA: Institute for Defense Analysis
TARDEC: Tank Automotive Research, Development, and Engineering Center
DOT&E: Director, Operational Test and Evaluation
ATEC: Army Test and Evaluation Command
MCOTEA: Marine Corps Operational Test & Evaluation Activity
MSCS: Marine Corps System Command
JPO MRAP: Joint Program Office, Mine Resistant Ambush Protected Vehicles
Organization Acronyms