Estimating Postmortem Intervals of Human Remains …
110
University of Tennessee, Knoxville University of Tennessee, Knoxville TRACE: Tennessee Research and Creative TRACE: Tennessee Research and Creative Exchange Exchange Masters Theses Graduate School 8-2017 Estimating Postmortem Intervals of Human Remains Recovered Estimating Postmortem Intervals of Human Remains Recovered in Mid-Western Waterways: A Test of Terrestrial and Aquatic Body in Mid-Western Waterways: A Test of Terrestrial and Aquatic Body Scoring Methods Scoring Methods Amanda Rose Fink University of Tennessee, Knoxville, afi[email protected] Follow this and additional works at: https://trace.tennessee.edu/utk_gradthes Part of the Biological and Physical Anthropology Commons Recommended Citation Recommended Citation Fink, Amanda Rose, "Estimating Postmortem Intervals of Human Remains Recovered in Mid-Western Waterways: A Test of Terrestrial and Aquatic Body Scoring Methods. " Master's Thesis, University of Tennessee, 2017. https://trace.tennessee.edu/utk_gradthes/4871 This Thesis is brought to you for free and open access by the Graduate School at TRACE: Tennessee Research and Creative Exchange. It has been accepted for inclusion in Masters Theses by an authorized administrator of TRACE: Tennessee Research and Creative Exchange. For more information, please contact [email protected].
Transcript of Estimating Postmortem Intervals of Human Remains …
University of Tennessee, Knoxville University of Tennessee, Knoxville
TRACE: Tennessee Research and Creative TRACE: Tennessee Research and Creative
Exchange Exchange
Masters Theses Graduate School
8-2017
Estimating Postmortem Intervals of Human Remains Recovered Estimating Postmortem Intervals of Human Remains Recovered
in Mid-Western Waterways: A Test of Terrestrial and Aquatic Body in Mid-Western Waterways: A Test of Terrestrial and Aquatic Body
Scoring Methods Scoring Methods
Amanda Rose Fink University of Tennessee, Knoxville, [email protected]
Follow this and additional works at: https://trace.tennessee.edu/utk_gradthes
Part of the Biological and Physical Anthropology Commons
Recommended Citation Recommended Citation Fink, Amanda Rose, "Estimating Postmortem Intervals of Human Remains Recovered in Mid-Western Waterways: A Test of Terrestrial and Aquatic Body Scoring Methods. " Master's Thesis, University of Tennessee, 2017. https://trace.tennessee.edu/utk_gradthes/4871
This Thesis is brought to you for free and open access by the Graduate School at TRACE: Tennessee Research and Creative Exchange. It has been accepted for inclusion in Masters Theses by an authorized administrator of TRACE: Tennessee Research and Creative Exchange. For more information, please contact [email protected].
To the Graduate Council:
I am submitting herewith a thesis written by Amanda Rose Fink entitled "Estimating
Postmortem Intervals of Human Remains Recovered in Mid-Western Waterways: A Test of
Terrestrial and Aquatic Body Scoring Methods." I have examined the final electronic copy of this
thesis for form and content and recommend that it be accepted in partial fulfillment of the
requirements for the degree of Master of Arts, with a major in Anthropology.
Lee Meadows Jantz, Major Professor
We have read this thesis and recommend its acceptance:
Giovanna Vidoli, Joanne Devlin
Accepted for the Council:
Dixie L. Thompson
Vice Provost and Dean of the Graduate School
(Original signatures are on file with official student records.)

Estimating Postmortem Intervals of Human Remains Recovered in Mid-Western Waterways: A
Test of Terrestrial and Aquatic Body Scoring Methods
A Thesis Presented for the Master of Arts
Degree The University of Tennessee, Knoxville
Amanda Rose Fink August 2017

ii
ACKNOWLEDGEMENTS
I would first like to thank Dr. Lee Meadows Jantz, my advisor, for her patience
and encouragement during my time at the University of Tennessee. The
university is lucky to have such an amazing researcher. Dr. Joanne Devlin, thank
you for the many red pen marks and the opportunity to assist with 110. I am a
better teacher and writer because of you. Dr. Giovanna Vidoli, thank you for your
edits and also for including me in short courses at the FAC. I will remember those
opportunities forever.
Many people in law enforcement and the medicolegal field contributed to
this research. I would like to thank La Crosse County chief medical examiner,
Tim Candahl, and Chief Deputy, Bob Cooper for teaching me everything I know
about death investigations, and introducing me to the idea of researching water
deaths. Thank you Curtis Green, Manitowoc County Chief Coroner, for allowing
me into your office and granting me access to your case reports and photos.
Thank you to Dr. Andrew Baker, and Joan Jung at the Hennepin County Medical
Examiner’s office. Without your help I would have never reached my goal number
of cases for this study!
Dr. Timothy McAndrews and Dr. David Anderson; Thank you for your
encouragement and support during my undergraduate career. Without your help I
would have never applied to graduate school.
Thank you to Rob Waschubsch with the US Geological Survey, Michael A.
Welvaert of the National Weather Service Forecast Office, and Todd Rieck with

iii
NWS la Crosse, for helping with water temperature data. Before your help there
were many days that made me think this data was untouchable!
Thank you, Claire Jantz, for making an amazing map of my research area!
The world was lacking a map of the Midwest and its’ glorious waterways.
Thank you, Brian Miller, for offering me a place to stay during my data
collection phase. You made five days of data collection a little more enjoyable.
Thank you to my sister, Alyssa Borski. You showed me graduate school
was a reality. You have always set a great example for me, and I am proud to
follow in your steps. Now, let’s go on vacation!
Mom and dad; thank you for your encouragement and support in all
aspects of my life. Alyssa and I are so lucky to have parents who support us in
all that we do. Tennessee was cool, but I am ready to come back north. Love
you.
iv
ABSTRACT
In attempt to determine postmortem intervals (PMI), forensic investigators often
rely on observed amounts of postmortem taphonomic alterations of the human
body. Research has been conducted in an attempt to understand and predict the
sequence and rate of human decomposition using total body scoring methods as
well as accumulated degree days (ADD) (Megyesi et al. 2005). While most
research focuses on methods of decomposition scoring in terrestrial
environments, Heaton et al. (2010) devised a method to aid in the prediction of
PMI and postmortem submersion intervals (PMSI) in an aqueous environment.
Using 73 forensic cases collected from the Hennepin County, MN, Medical
Examiner’s Office, La Crosse, WI, Medical Examiner’s Office, and the Manitowoc
County, WI, Medical Examiner’s Office, this study demonstrates that aquatic
taphonomic alterations do not always occur in a sequential pattern due to a
plethora of variables, such as water temperature. The data were split into three
categories according to known ADD. Using both the Megyesi et al. (2005) and
the Heaton et al. (2010) decomposition scoring methods, cold water submersion
of a human body can produce varied results and the inability to accurately predict
PMI and PMSI. Those forensic cases with the shortest PMSI also show a low
accuracy rate of predicting PMSI. Both the Megyesi et al. (2005) and the Heaton
et al. (2010) total scoring methods resulted in more accurate PMSI prediction for
those cases with ADDs between 26°C and 99°C. This study demonstrates the
demand for more accurate decompositional scoring methods and the need for

v
further exploration into the study of the effects of cold-water temperatures on the
taphonomic process of the human body.

vi
TABLE OF CONTENTS Chapter 1 Introduction ............................................................................................. 1
Hypotheses ................................................................................................... 4 Chapter 2 Literature Review .................................................................................... 5
Postmortem Changes and Human Decomposition ....................................... 7 Factors Affecting the Rate of Human Decomposition in Water ..................... 19 Effects of Water Submersion on a Human Body and Methods Used to Estimate PMSI .............................................................................................. 21 Concerns Forensic Investigators Face When Determining PMSIs ............... 27
Chapter 3 Methods .................................................................................................. 31 Accumulated Degree Days ........................................................................... 40 Measuring Decomposition ............................................................................ 40
Chapter 4 Results .................................................................................................... 45 General Observations ................................................................................... 45 Statistical Analysis ........................................................................................ 45
Chapter 5 Discussion ............................................................................................... 69 Trends In Aqueous Decomposition ............................................................... 69
Chapter 6 Conclusions and Recommendations ...................................................... 79 Bibliography ............................................................................................................. 82 Appendix .................................................................................................................. 88 Appendix I. Megyesi et al. (2005) Decomposition Scoring Tables .......................... 89 Appendix II. Heaton et al. (20010) Decomposition Scoring Tables ......................... 92 Appendix III. Data .................................................................................................... 94 Vita ........................................................................................................................... 99

vii
LIST OF TABLES
Table 2.1. Stages of decay and associated gross morphologic changes from Marks et al. (2009) ........................................................................................ 17
Table 3.1. Demographic Data of Sampled Forensic Cases ..................................... 34 Table 3.2. Biological Profile ..................................................................................... 36 Table 3.3. Site and Scene Descriptions as Reported by Coroner/Medical Examiner .................................................................................................................. 37 Table 3.4. Expressions of Decomposition ............................................................... 38 Table 4.1. Repeated-Measures ANOVA comparing differences in means
between the Megyesi et al. (2005) predicted ADD Celsius, the Heaton et al. (2010) predicted ADD Celsius, and the calculated ADD from water temperatures Celsius .................................................................................... 53
viii
LIST OF FIGURES
Figure 2.1. Livor Mortis. Blood pooling due to the lack of circulation. La Crosse County Medical Examiner’s office, Chief Medical Examiner: Timothy Candahl ...... 11 Figure 2.2. Skin slippage on the trunk and arms due to water submersion. Marbling due to deoxyhemoglobin in superficial blood vessels of the arm. La Crosse County Medical Examiner’s Office, Chief Medical Examiner: Tim Candahl. .................................................................................................................. 13 Figure 2.3. Facial bloat as a result of 92.22°C ADD water submergence. La Crosse County Medical Examiner’s Office, Chief Medical Examiner: Tim Candahl. ................................................................................................................. 15 Figure 2.4. Wrinkled appearance of hand due to water submersion. La Crosse County Medical Examiner’s Office, Chief Medical Examiner: Tim Candahl ............ 23 Figure 2.5. Appearance of color change, red, green and brown, due to water submergence. La Crosse County Medical Examiner’s Office, Chief Medical Examiner: Tim Candahl ........................................................................................... 25 Figure 3.1. Hennepin, La Crosse and Manitowoc Counties .................................... 32 Figure 4.1. Total body score against log10 calculated actual accumulated degree-days (r2=0.3486, F1,71=37.99, p<0.0001). Gray areas indicated confidence intervals.................................................................................................................... 47 Figure 4.2. Regression of total Aquatic Decomposition Score against log10 calculated actual accumulated degree-days (r2=0.3413, F1,71=36.78, p<.0001). Gray areas indicated confidence intervals ............................................................... 48 Figure 4.3. Pearson’s product moment correlation between log10 actual calculated ADD and log10 Megyesi et al. (2005) predicted ADD (r=0.5756781) ...... 50 Figure 4.4. Pearson’s product moment correlation between log10 actual calculated ADD and log10 Heaton et al. (2010) predicted ADD (r=0.5922739)……………………………………………………...….............……… .... 51 Figure 4.5. Pearson’s product moment correlation between log10 Heaton et al. (2010) predicted ADD and log10 Megyesi et al. (2005) predicted ADD (r=0.8860195).................................................................................................... ...... 52

ix
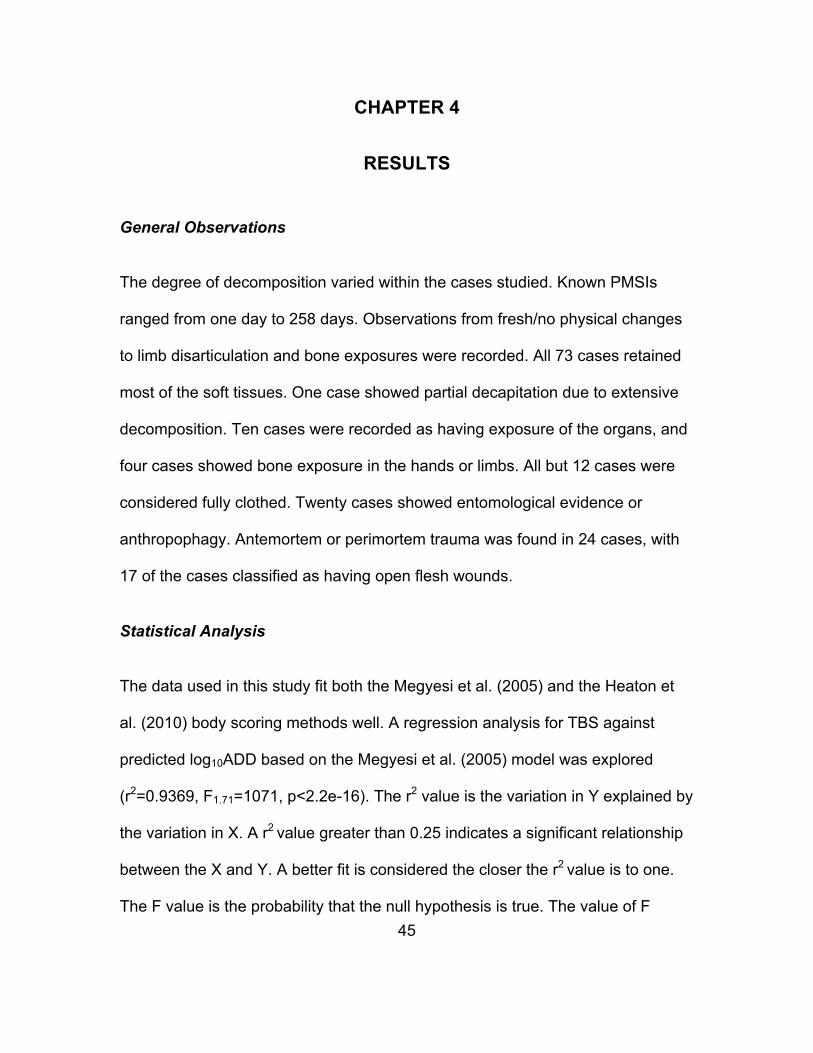
Figure 4.6. Regression of total body score against log10 calculated actual accumulated degree-days (r2=0.03442, F1,27=0.9625, p: 0.3353). Gray areas indicated confidence intervals .................................................................................. 55 Figure 4.7. Regression of total aquatic decomposition score against log10 calculated actual accumulated degree-days (r2=0.06273, F1,27=1.807, p: 0.19) Gray areas indicated confidence intervals ............................................................... 56 Figure 4.8. Pearson’s product moment correlation between log10 Megyesi et al. (2005) predicted ADD and log10 calculated actual ADD (r=-0.1559689) ................. 57 Figure 4.9. Pearson’s product moment correlation between log10Heaton et al. (2010) predicted ADD and log10 calculated actual ADD (r=-0.219079) ................... 58 Figure 4.10. Regression of total body score against log10 calculated actual accumulated degree-days (r2=0.3769, F1,20=12.1, p<0.005). Gray areas indicated confidence intervals ................................................................................................. 60 Figure 4.11. Regression of total aquatic decomposition score against log10 calculated actual accumulated degree-days (r2=0.5845, F1,20=28.13, p<0.0001) Gray areas indicated confidence intervals ............................................................... 61 Figure 4.12. Pearson’s product moment correlation between log10 Megyesi et al. (2005) predicted ADD and log10 calculated actual ADD (r=0.55) ............................. 62 Figure 4.13. Pearson’s product moment correlation between log10Heaton et al. (2010) predicted ADD and log10 calculated actual ADD (r=0.765) ........................... 63 Figure 4.14. Regression of total body score against log10 calculated actual accumulated degree-days (r2=0.5472, F1,20=24.17, p<0.0001). Gray areas indicated confidence intervals .................................................................................. 65 Figure 4.15. Regression of total aquatic decomposition score against log10 calculated actual accumulated degree-days (r2=0.5743, F1,20=26.99, p<0.0001). Gray areas indicated confidence intervals ............................................................... 66 Figure 4.16. Pearson’s product moment correlation between log10 Megyesi et al. (2005) predicted ADD and log10 calculated actual ADD (r=0.801) ........................... 67 Figure 4.17. Pearson’s product moment correlation between log10Heaton et al. (2010) predicted ADD and log10 calculated actual ADD (r=0.758) ........................... .68

1
CHAPTER 1
INTRODUCTION Worldwide an estimated 372,000 deaths occur annually as a consequence of
drowning (World Health Organization 2016). Frequently deceased individuals
are found floating in bodies of water, or searched for within bodies of water when
reported missing. Autopsies are conducted on drowning victims in an attempt to
understand the cause and manner of death of waterlogged bodies, while forensic
scientists utilize an array of qualitative factors to help determine postmortem
intervals (PMI) and postmortem submersion intervals (PMSI) ( Mateus and Vieira
2014; Papadodima et al. 2010). Predicting time since death is important in all
circumstances of death, including drowning. With an accurate estimation of PMI
investigators can narrow the missing persons list, exclude suspects in homicide
cases, and identify the decedent. Anthropological studies have significantly
advanced this field in recent years utilizing outdoor research facilities at the
University of Tennessee, Knoxville, Texas State, Sam Houston State, Southern
Illinois University, Colorado Mesa University, and Western Carolina University to
better understand postmortem changes of the human body.
The use of human donors has allowed advances in research in the field of
anthropology and human decomposition. This research has helped to create
predicted rates and sequences of human decomposition in specific environments
(Megyesi et al. 2005 and Heaton et al. 2010). Most of this research has focused

2
on different types of terrestrial environments. The University of Tennessee
Knoxville’s Anthropology Research Facility, founded by William M. Bass,
spearheaded research of postmortem decomposition changes using donors
beginning in the 1980’s (Rodriguez and Bass 1983). Since that time, five other
facilities across the nation have conducted research, significantly adding to the
literature of PMI and decomposition studies (Klein 2015).
One type of environment that is not thoroughly understood in the
anthropological literature analyzing human decomposition is the aqueous
environment. The effects that a water environment has on human decomposition
have generated a gap in the literature due to several reasons. Creating
experimental bodies of water to mimic lakes, rivers, or streams is prohibitive on
many levels. Locating and securing a location to construct a mock waterway can
become an overwhelming task. Further simulating fluctuating water
temperatures, current, depth, and PH level is virtually unmanageable. The cost
of creating a mock waterway incorporating the plethora of variables, including
current, fluctuating temperatures, aquatic animals, insects, etc. are
insurmountable. In addition, ethical restrictions prohibit the use of human tissue
in authentic waterways, forcing many researchers to utilize Sus scrofa as human
analogues (Anderson 2010; Forbes et al. 2010; Humphreys at al. 2013; Michaud
and Moreau 2011). Due to the high cost and unmanageable task of mimicking
waterways, researchers often rely on actual waterways to conduct studies
(Anderson 2010; De Donno et al. 2014; Forbes et al. 2010; Haglund 1993;

3
Heaton et al. 2010; Mateus and Vieira 2014The purpose of this study is to
attempt to fill this gap in the literature by using forensic case studies and medical
examiner records to generate information on how water affects the
decomposition process, allowing or inhibiting forensic scientists to predict
accurate PMIs and PMSIs.
This study focuses on submerged cases from the Midwestern United
States involving a variety of different water temperatures. Known PMIs from
medical examiner’s and police reports are used to understand the effects of
water on the decomposition process. In addition, factors relating to the
decomposition process, such as discoloration and skin slippage, as well as
environmental factors, such as water temperature, were collected from autopsy
reports and medical examiner/coroner reports. The generally accepted model
incorporates only temperatures as a variable following a simple principle that
colder water temperatures drastically slow the decomposition process, while
warmer water temperatures allow for a regular and predicted rate of human
decomposition (Heaton et al. 2010). Efforts have been conducted to formulate
and verify a quantitative approach to demonstrate descriptive stages of
decomposition (De Donno et al. 2014; Heaton et al. 2010; Megyesi et al. 2005;
Michaud and Moreau 2011). However, a need has been expressed for validation
studies of the estimation of PMSI estimates in aqueous environments utilizing
accumulated degree days, otherwise known as the amount of thermal heat
required to create decomposition changes (De Donno et al. 2014; Heaton et al.

4
2010). It is important to understand the effects water has on the decomposition
process in order to aid law enforcement and medico-legal death investigators in
their prediction of PMIs and PMSIs. Accurate estimations of time since death
and time since body submersion can expedite the process of decedent
identification, as well as suspect identification in homicide cases.
Hypotheses This study specifically looks to determine whether it is possible to assign
accurate PMIs due to the effects water has on the decomposition process of
waterlogged bodies through the following questions:
1.) How does water submersion affect the expression of decomposition
and the rate of decomposition?
1A.) Is there a pattern of the decomposition process in an aqueous
environment?
2.) How does water submersion impact PMSI estimates in waterlogged
bodies?
2A.) Can Total Aquatic Decomposition Score (Heaton et al. 2010) be
used to predict accumulated degree days (ADD) and PMSI in cold
water cases and cases with short PMSIs?
2B.) Can Total Body Score (Megyesi et al. 2005) be used predict ADD
and PMSI in waterlogged bodies?

5
CHAPTER 2
LITERATURE REVIEW In more recent years research on aquatic human decomposition has begun to
focus on approaches of estimating postmortem submersion intervals by utilizing
methods involving accumulated degree days ( De Donno et al. 2014; Heaton et
al. 2010; Humphreys et al. 2013; Mateus and Vieira 2014). Perhaps one of the
most well known methods to estimate postmortem intervals based on qualitative
visual assessments of decomposition is by Megyesi et al. (2005). Megyesi et al.
(2005) included a total of 68 human remains cases in the United States in
various outdoor and indoor settings to score decomposition. Using a point based
scoring system, body areas were individually assessed and assigned a score
according to the stage of decomposition to which the area has progressed. While
this particular system is specialized to predict PMIs in specific terrestrial
environments, Heaton et al. (2010) have provided a revised method that fits an
aquatic environment. The Heaton et al. (2010) study included a total of 187
forensic drowning case files from rivers in Scotland and northwest England.
Heaton et al. (2010) excluded cases with an ADD<10 due to the classification of
the remains as fresh decomposition. According to Heaton et al. (2010), bodies in
a fresh state can be assessed to determine PMIs using conventional methods.
Both point based scoring systems for decomposition by Megyesi et al.
(2005) and Heaton et al. (2010) utilize ADD. ADD is the amount of heat energy

6
that is necessary to continue the decomposition process (Megyesi et al. 2005).
Daily temperature averages are summed for each day of the PMI resulting in a
final ADD. Using ADD in combination with a point based scoring systems allows
the use of temperatures to estimate unknown PMIs or PMSIs in the case of an
aqueous environment. For example, using the Heaton et al. (2010) point-based
scoring system (TADS), a body with a total aquatic decomposition score of 9
would estimate the individual had been submerged for a total of 43.01°C ADD
according to the equation TADS=-3.706+7.778*LOG ADD. Utilizing water
temperature records, it could be determined that the decedent had been
submerged for four days at an average water temperature of 10.75°C. Because
decomposition is temperature dependent these models utilize expressions of
decomposition to predict time since death or submersion. Bodies in terrestrial
environments and aqueous environments are subjected to similar scoring
methods utilizing ADD. Total body score (TBS) and total aquatic decomposition
score (TADS) are summed from decomposition scores of the head, trunk, and
limbs, and an outcome of estimated ADD is created. Since the time of discovery
of human remains is always known, one can use the calculated ADD and actual
ambient temperature data for each day to calculate an estimated PMI or PMSI.
Methods of decomposition scoring to predict PMIs continue to be
scrutinized due to small sample sizes, the utilization of pigs as human analogs,
and the plethora of environmental factors that can affect the rate of
decomposition (Bass 1997; De Donno et al. 2014; Humphreys et al. 2013;

7
Suckling et al. 2016). This chapter will discuss the process of human
decomposition, effects of water submersion on a human body and factors
affecting the rate of human decomposition in water, methods used to estimate
PMSIs, and the concerns forensic investigators face when determining PMSIs.
Postmortem Changes and Human Decomposition
Forensic anthropologists are becoming more involved in the process of death
investigation (Marks et al. 2009). While forensic anthropologists are highly
specialized in skeletal examination, the progression from a fresh corpse to
skeletal material continues to be a critical process in death evaluations and an
interest to anthropologists. Working in tandem with forensic scientists, such as
pathologists and entomologists, the study of forensic anthropology can not only
assist in determining the manner of death, but also can provide an estimated
time interval since a victim’s death. An anthropologist can attempt to estimate
PMIs through studies of the human taphonomic process, which can be broken
down into several methodical and well-documented steps (Marks et al. 2009).
Megyesi et al. (2005) approached decomposition scoring by splitting the
stages of decomposition into fresh, early decomposition, advanced
decomposition, and skeletonization. The fresh stage is described as no change
or discoloration to the body (Megyesi et al. 2005). Early stages of decomposition
include: discoloration of the skin progressing to a gray/green color, skin slippage,
purge, and bloating. However, forensic scientists and death investigators look for

8
several other early physiological changes indicating an estimation of time since
death such as pallor, rigor mortis, algor mortis, and livor mortis.
Decomposition includes internal and external processes. Internal
decomposition is comprised of cell death, which can often be detected and
scored externally through the presence of bloating, marbling, and color changes
to the skin. The processes of internal and external decomposition which result in
the reduction of human remains and can commence as quickly as 15 minutes
after death occurs (Clark et al. 1997; Marks et al. 2009). The earliest
postmortem change, pallor, is defined as an alteration or lightening of skin color
(Clark et al. 1997). This loss of skin color is caused by a lack of oxygenated
blood circulating throughout the body. Pallor is more easily detected in lighter
skinned individuals, and can often be indiscernible in individuals with darker skin
tones. Also occurring within the first two hours postmortem is skeletal muscle
relaxation, including sphincter relaxation. Relaxation of the muscles and
sphincters can lead to fecal soiling and purging of the gastric contents (Clark et
al. 1997).
Other postmortem changes can be detected between two and four hours
postmortem. Marks et al. (2009) explain that autolysis, the internal biochemical
process of cell death, is the earliest development of decomposition. This process
of cell death ultimately leads to external evidence of decomposition such as
tissue necrosis, putrefaction, algor mortis, rigor mortis, and livor mortis (Amendt
et al. 2010). While these postmortem processes act independently of one

9
another, often they occur concurrently (Clark et al. 1997; Marks et al. 2009;
Prahlow 2010).
Algor mortis, defined as the cooling of the body to reach an ambient
temperature, begins immediately postmortem. The deceased’s body temperature
will decrease, or in some cases increase, at an approximate average rate of
1.5°F each hour postmortem until the ambient temperature is reached (Amendt
et al. 2010; Clark et al. 1997). However, several factors, such as body mass and
ambient temperature, can affect the rate of algor mortis (Amendt et al. 2010).
Rigor mortis is defined as muscle stiffening due to autolysis of muscle
cells, causing the muscle fibers to biochemically bind together (Amendt et al.
2010; Marks et al. 2009). This chemical process of muscle stiffening is often
used to aid as a predictor of PMIs. Many death investigators understand the
onset of rigor mortis to commence two hours after a victim’s death, become fully
set around 12 hours after death, and dissipate over the next 12 hour span (Clark
et al. 1997). However the rate of onset and dissipation of rigor mortis is
dependent on several factors (Amendt et al. 2010; Prahlow 2010). Antemortem
body temperature of the victim, as well as warm ambient temperatures, can
increase the rate, onset, and dissipation of rigor mortis. Conversely, cooler
ambient temperatures will decrease the rate of rigor mortis (Amendt et al. 2010;
Clark et al. 1997). Often seen in drowning deaths, an increase of physical activity
immediately prior to death can give rise to an immediate or increased onset of
rigor mortis (Amendt et al. 2010). Adenosine triphosphate (ATP) is already
10
lacking in the cells due to increased of perimortem physical activity, causing an
instantaneous restriction in the actin and myosin muscle fibers, resulting in a
sudden or increased rate of appearance of rigor mortis (Prahlow 2010).
Livor mortis is also occurring simultaneously with algor mortis and rigor
mortis. Livor mortis is defined as blood pooling due to lack of circulation
throughout the deceased’s body (Amendt et al. 2010; Clark et al. 1997: Marks et
al. 2009) (Figure 2.1). A lack of hemoglobin in the red blood cells causes the
blood to darken starting 15 minutes postmortem. After two hours postmortem
livor mortis is easily detectable on the lowest part of the body and will become
fixed as body temperature continues to decrease (Amendt et al. 2010; Clark et al.
1997). Research by Henssge and Madea (2007) aims to create a more accurate
model of predicting PMIs from body temperatures and observance of these early
postmortem changes while considering the variable factors, such as ambient
temperature.

11
Figure 2.1. Livor Mortis. Blood pooling due to the lack of circulation. La Crosse County Medical Examiner’s office, Chief Medical Examiner: Timothy Candahl.
12
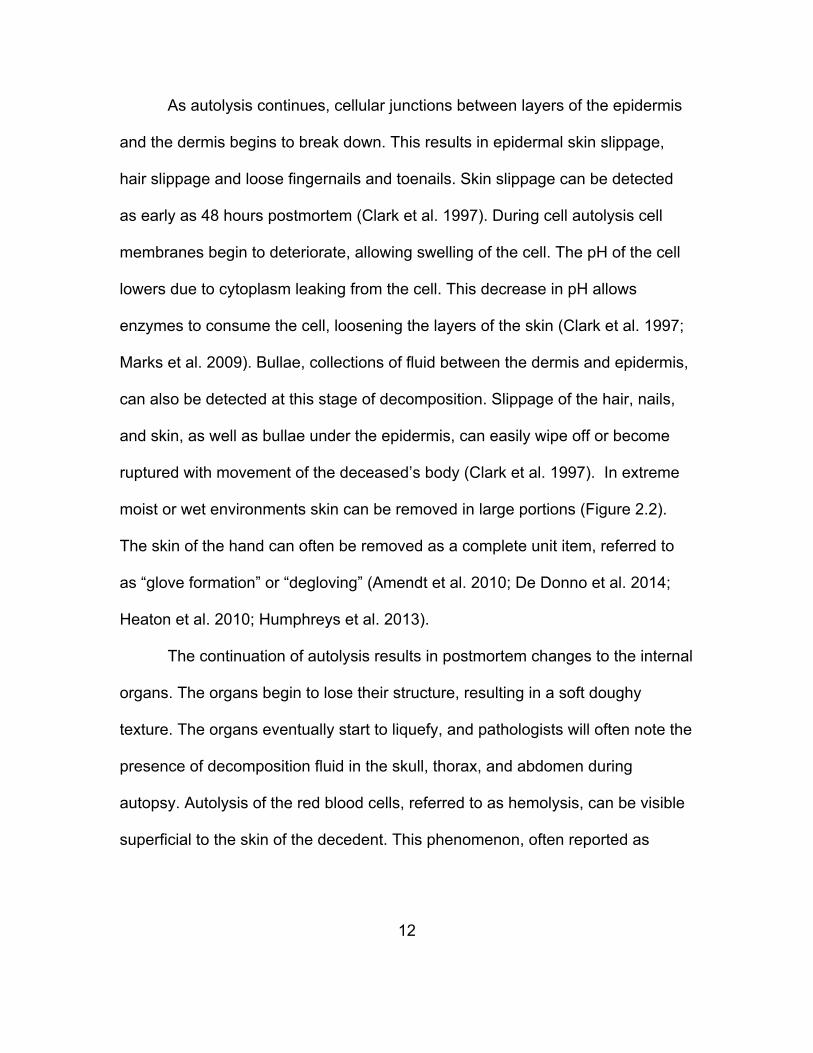
As autolysis continues, cellular junctions between layers of the epidermis
and the dermis begins to break down. This results in epidermal skin slippage,
hair slippage and loose fingernails and toenails. Skin slippage can be detected
as early as 48 hours postmortem (Clark et al. 1997). During cell autolysis cell
membranes begin to deteriorate, allowing swelling of the cell. The pH of the cell
lowers due to cytoplasm leaking from the cell. This decrease in pH allows
enzymes to consume the cell, loosening the layers of the skin (Clark et al. 1997;
Marks et al. 2009). Bullae, collections of fluid between the dermis and epidermis,
can also be detected at this stage of decomposition. Slippage of the hair, nails,
and skin, as well as bullae under the epidermis, can easily wipe off or become
ruptured with movement of the deceased’s body (Clark et al. 1997). In extreme
moist or wet environments skin can be removed in large portions (Figure 2.2).
The skin of the hand can often be removed as a complete unit item, referred to
as “glove formation” or “degloving” (Amendt et al. 2010; De Donno et al. 2014;
Heaton et al. 2010; Humphreys et al. 2013).
The continuation of autolysis results in postmortem changes to the internal
organs. The organs begin to lose their structure, resulting in a soft doughy
texture. The organs eventually start to liquefy, and pathologists will often note the
presence of decomposition fluid in the skull, thorax, and abdomen during
autopsy. Autolysis of the red blood cells, referred to as hemolysis, can be visible
superficial to the skin of the decedent. This phenomenon, often reported as

13
Figure 2.2. Skin slippage on the trunk and arms due to water submersion. Marbling due to deoxyhemoglobin in superficial blood vessels of the arm. La Crosse County Medical Examiner’s Office, Chief Medical Examiner: Tim Candahl.

14
marbling is a result of the blue hue of deoxyhemoglobin in superficial blood
vessels also shown in the arm in figure 2.2 (Clark et al. 1997; Prahlow 2010).
During one’s life microorganisms, such as bacteria and fungi, within the
body are usually kept in check by the body’s normal immune defense systems.
After death, these defense systems no longer function, allowing microorganisms
to grow and consume soft tissues (Prahlow 2010). This process, referred to as
putrefaction, produces gas as well as decomposition fluid.
Occurring simultaneously with autolysis, putrefaction begins its process in
areas of sufficient amounts of blood. Red blood cells provide a food source for
microorganisms. Therefore the products of autolysis and putrefaction,
gas/bloating and decomposition fluid are not consistent throughout the
deceased’s body. Bloating and fluids are often first noticed in areas of liver mortis
and other highly vascularized areas. The first areas to bloat due to these
processes of decomposition are the lips, face, and in males, the scrotum (Clark
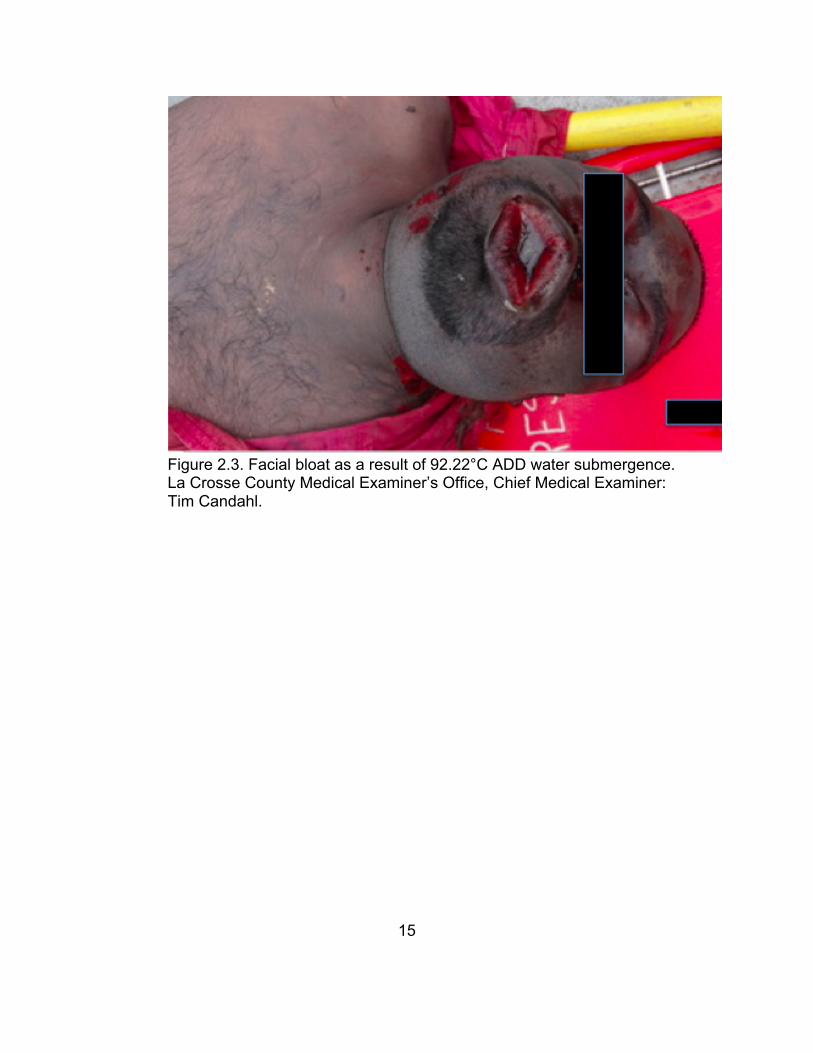
et al. 1997; Marks et al. 2009; Prahlow 2010). Facial bloat can be recognized in
Figure 2.3.
The abdomen will begin to bloat simultaneously with or shortly after the
face and lips begin to bloat between two and seven days postmortem (Galloway
et al. 1989; Marks et al. 2009; Megyesi et al. 2005). Gases remain trapped within
the abdomen, which can cause bloating, often engorging the abdomen to several
times its original size (Amendt et al. 2010). The cecum, a structure in the left
lower quadrant of the gastrointestinal tract, is a site containing many bacteria
15
Figure 2.3. Facial bloat as a result of 92.22°C ADD water submergence. La Crosse County Medical Examiner’s Office, Chief Medical Examiner: Tim Candahl.
16
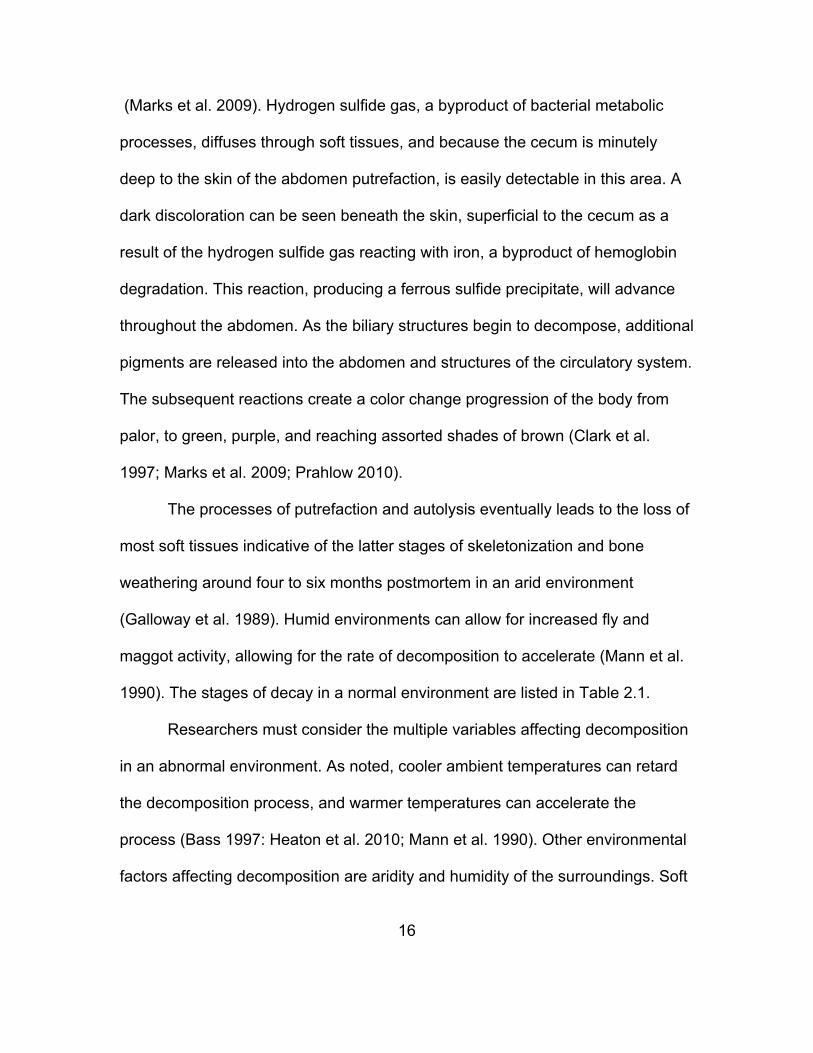
(Marks et al. 2009). Hydrogen sulfide gas, a byproduct of bacterial metabolic
processes, diffuses through soft tissues, and because the cecum is minutely
deep to the skin of the abdomen putrefaction, is easily detectable in this area. A
dark discoloration can be seen beneath the skin, superficial to the cecum as a
result of the hydrogen sulfide gas reacting with iron, a byproduct of hemoglobin
degradation. This reaction, producing a ferrous sulfide precipitate, will advance
throughout the abdomen. As the biliary structures begin to decompose, additional
pigments are released into the abdomen and structures of the circulatory system.
The subsequent reactions create a color change progression of the body from
palor, to green, purple, and reaching assorted shades of brown (Clark et al.
1997; Marks et al. 2009; Prahlow 2010).
The processes of putrefaction and autolysis eventually leads to the loss of
most soft tissues indicative of the latter stages of skeletonization and bone
weathering around four to six months postmortem in an arid environment
(Galloway et al. 1989). Humid environments can allow for increased fly and
maggot activity, allowing for the rate of decomposition to accelerate (Mann et al.
1990). The stages of decay in a normal environment are listed in Table 2.1.
Researchers must consider the multiple variables affecting decomposition
in an abnormal environment. As noted, cooler ambient temperatures can retard
the decomposition process, and warmer temperatures can accelerate the
process (Bass 1997: Heaton et al. 2010; Mann et al. 1990). Other environmental
factors affecting decomposition are aridity and humidity of the surroundings. Soft
17
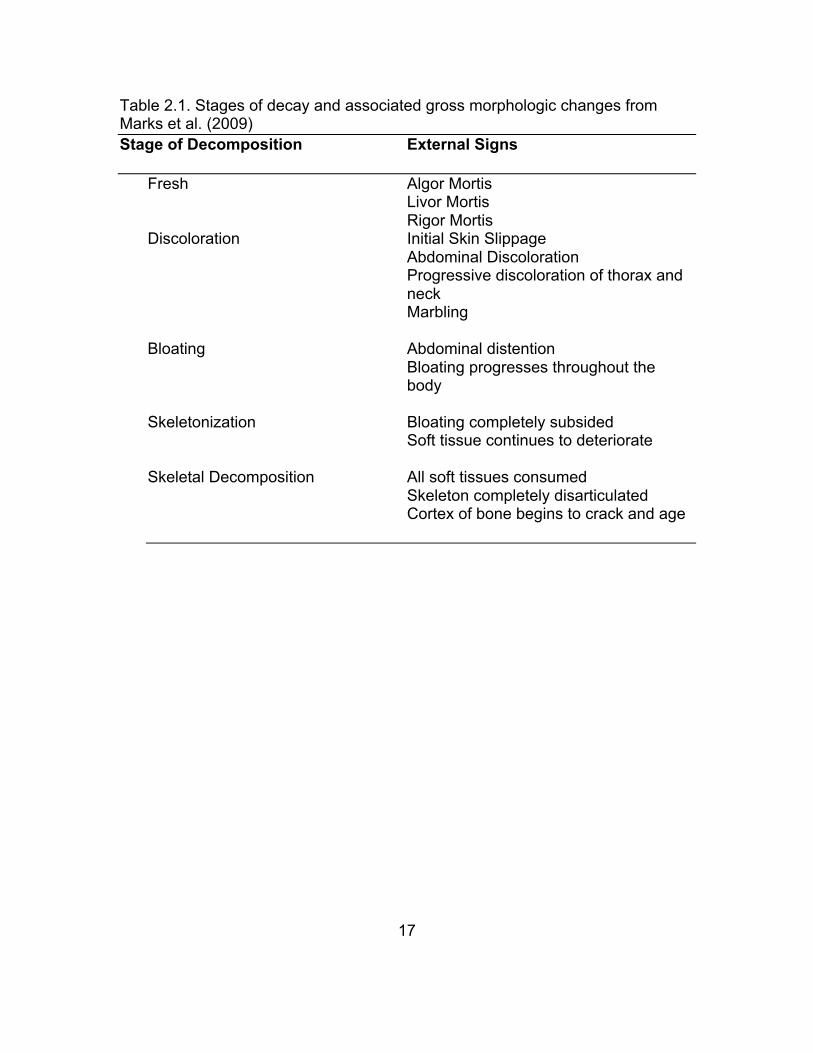
Table 2.1. Stages of decay and associated gross morphologic changes from Marks et al. (2009) Stage of Decomposition External Signs
Fresh Algor Mortis Livor Mortis Rigor Mortis Discoloration Initial Skin Slippage Abdominal Discoloration Progressive discoloration of thorax and neck Marbling Bloating Abdominal distention Bloating progresses throughout the
body Skeletonization Bloating completely subsided Soft tissue continues to deteriorate Skeletal Decomposition All soft tissues consumed Skeleton completely disarticulated Cortex of bone begins to crack and age

18
tissues often dry out in arid and also hot environments resulting in mummification
of the corpse (Bass 1997; Clark et al. 1997; Galloway et al. 1989). The presence
of insects and animals scavenging (anthropophagy) can also accelerate the
Table 2.1. Stages of decay and associated gross morphologic changes from
decomposition process (Amendt et al. 2010; Bass 1997). Other factors, such as
amount of clothing as well as tautness of the garments, can also slow the rate of
decomposition (Bass 1997; Prahlow 2010).
By understanding postmortem changes as a series of taphonomic
modifications, anthropologists and death investigators are able to estimate a PMI
range of the deceased. It is important to consider the various environmental and
non-environmental variables that can alter the known sequence and rate of
decomposition when making these estimations. Researchers, such as Megyesi
et al. (2005) and Heaton et al. (2010), have created point based scoring systems
in attempt to estimate PMIs according to sequenced postmortem taphonomic
modifications. These methods are unable to take into account all of the various
factors affecting decomposition. However, due to lack of a more appropriate and
all-encompassing approach of scoring methods to predict PMIs, Megyesi et al.
(2005) and modified versions of a total body scoring methods continue to be
applied in death investigations and research.

19
Factors Affecting the Rate of Human Decomposition in Water As in terrestrial decomposition, aquatic decomposition is expected to occur in a
sequential progressive pattern across many types of waterways (Heaton et al.
2010). Though aquatic decomposition can be predicted in a sequential manner
several factors can affect the rate of decomposition of human remains
submerged in water (Haglund 1993; Prahlow 2010). Environmental and body
factors can both accelerate and inhibit rates of decomposition. Environmental
factors, including water temperature, depth, current, aquatic life, and obstructions
or debris, can severely affect decomposition (Haglund 1993; Petrik et al. 2004).
Haglund (1993) recognizes additional factors such as the presence of clothing,
body size, floating or submerged position, and trauma as having decompositional
influences.
It is understood that bodies submerged in water decay at a much slower
rate than those in terrestrial environments. It is often estimated that
decomposition occurs twice as slow in an aqueous environment in comparison to
a terrestrial environment (Petrik et al. 2004; Rodriquez 1997). This is due to
several different environmental factors; temperature being the most influential
(Mann et al. 1990; Payne-James et al. 2011; Petrik et al. 2004; Prahlow 2010;
Rodriquez 1997). Cooler temperatures can severely decelerate the rate of
decomposition, partially due to a decreased amount of microbes and other
aquatic life feeding on the submerged body (Cockle and Bell 2015; Petrik et al.
2004; Rodriquez 1997; Sorg et al. 1997).

20
Most dependent on temperature is the rate of cell autolysis, which occurs
at a much slower rate in cooler temperatures, ultimately slowing the entire
decomposition process (Rodriquez 1997). A slower or halted rate of cell death
leads to a longer pre-bloat interval, in which the body will remain fully submerged
until a sufficient amount of putrefactive gases in the gastrointestinal tract and
lungs develop from cell autolysis, which may cause the body to resurface.
Temperatures are generally cooler at the bottom of bodies of water,
consequently prolonging the pre-bloat stage of decomposition (Rodriquez 1997).
Payne and King (1972) found that each of the 11 pig specimens used in their
study sank to the bottom of a water filled tank when initially placed in the water.
In the summer it took two days for the specimens to bloat and float to the water’s
surface, while it took between two and three weeks to do so in the winter. Mateus
and Vieira (2014) estimated decomposing human remains to reach the bloating
stage and float to the water’s surface after 100-140°C accumulated degree-days
(ADD), and a hypothetical estimate of 130°C for a body to generally begin to
float. As water temperatures decrease the number of days until a body will begin
to bloat and resurface will increase (Tomita 1975). With water reaching nearly
freezing temperatures a submerged human body may take several months to
resurface (Rodriquez 1997). Figure 2.3 exhibits facial bloat as a result of water
submergence for 92.22°C ADD. This individual was recovered in 23.05°C water
after being submerged for four days.

21
Also dependent on temperature is the formation of adipocere. Adipocere,
also known as grave wax, is a fatty acid compound that is often found to occur
from tissues submerged in water for periods of time (Clark et al. 1997; O’Brien
1997; O’Brien and Kuehner 2007). The conversion of fats into fatty acids requires
a water source either from the environment or the deceased’s body. Studies by
O’Brien (1994, 1997), O’Brien and Kuehner (2007) and Forbes et al. (2011) have
found that adipocere formation usually occurs in bodies submerged in warmer
water temperatures. However, formation of adipocere has been reported to form
in cooler water temperatures as well (Forbes et al. 2011). While adipocere
formation requires water to form, if the body remains fully submerged, adipocere
may not have a chance to solidify. Most commonly, adipocere is detected on
bodies that have resurfaced or washed upon a shore, allowing desiccation and
hardening of the adipose tissue (O’Brien 1994; O’Brien and Kuehner 2007).
Effects of Water Submersion on a Human Body and Methods Used to Estimate PMSI After human remains have been recovered from a body of water several
postmortem changes are assessed to aid in an estimate of PMI or PMSI. As
stated above, decomposition of a body submerged in water is temperature
dependent and occurs in a sequential manner. Before the formulation of point-
based decomposition scoring systems to predict PMIs, decomposition was
visually assessed and divided into sequential stages.

22
An early study conducted by Payne and King (1972) used pigs as human
analogues to assess the decomposition of soft tissue in aqueous environments.
They used a six stage sequential system based on stages of submerged fresh,
early floating, floating decay, bloated deterioration, floating remains, and sunken
remains. In 1993 Haglund used a four point scoring system. He assessed
decomposition across 11 areas on bodies from aqueous environments. The
main focus of these particular evaluations of anatomical areas was adipocere
formation and amount of tissue loss exposing bone. However, Haglund (1993)
explained that there are various factors that can affect the decomposition rate of
human remains in aqueous environments. Utilizing case reports, autopsy reports,
and scene photos from rivers in the United Kingdom, Heaton et al. (2010) revised
the Megyesi et al. (2005) point-based terrestrial decomposition scoring system
employing ADD to estimate postmortem submersion intervals (PMSI).
A physical trait found in many bodies recovered from water is the
presence of “washerwoman skin” (Prahlow 2010). Now an outdated term,
washerwoman skin describes the wrinkled physical appearance usually on the
hands and feet of bodies submerged in water (Figure 2.4). Heaton et al. (2010)
described this physical change as an earlier stage of aquatic submersion.
However, succeeding this physical wrinkled appearance the skin will begin to
become soggy and eventually slough off in more advanced stages of submerged
decomposition (Heaton et al. 2010). Heaton et al. (2010) explained that skin can

23
Figure 2.4. Wrinkled appearance of hand due to water submersion. La Crosse County Medical Examiner’s Office, Chief Medical Examiner: Tim Candahl.

24
slough off on all areas of the body, but frequently occurs on the hands and the
feet and is referred to as “degloving”.
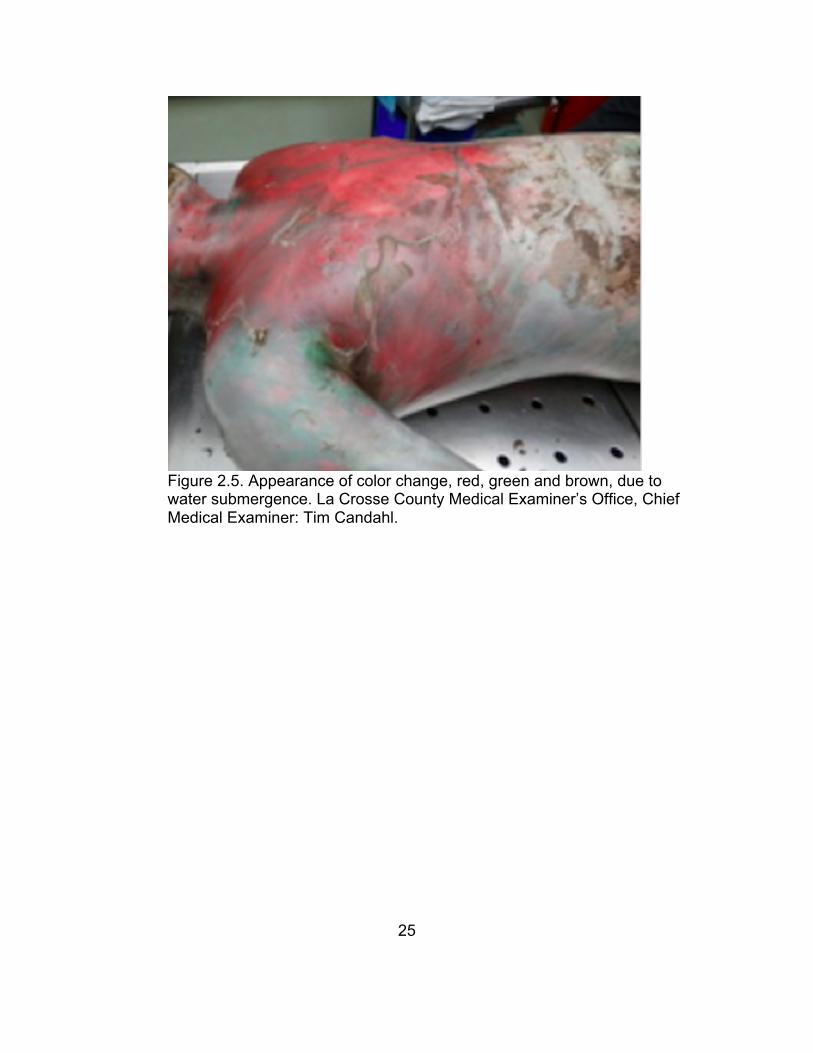
Megyesi et al. (2005) shows a progression of color change from pink/white
coloration becoming gray/green over time, eventually resulting in flesh of a
brown/black color. However, Heaton et al. (2010) revised this color changing
sequence to fit an aquatic environment. While soft tissue modifications of
decomposition are similar in terrestrial and aquatic decomposition, these traits
often occur at different rates and have different visual markers (Heaton et al.
2010). Instead of skin drying out and possibly reaching the mummified advanced
state of decomposition, submerged skin retains water and often displays different
colors than those observed in terrestrial decomposition. Heaton et al. (2010)
displayed in their aquatic decomposition point-based scoring system a
progression from pink, red, green, to black discoloration of the face before
eventually sloughing off, and pink, yellow, green, dark green, purple, to black
discoloration of the trunk (Figure 2.5). During this progression of color change the
bloating of the trunk is increasing and relenting, until the internal organs are soft
or liquefied (Heaton et al. 2010).
Following a dark color change of the skin and possible mummification in
terrestrial environments Megyesi et al. (2005) listed the last category of
decomposition as skeletonization. During this stage the bones become
predominantly exposed and dry. Heaton et al. (2010) revised these stages as
skeletonization in situ with bone disarticulation and adipose formation. Due to
25
Figure 2.5. Appearance of color change, red, green and brown, due to water submergence. La Crosse County Medical Examiner’s Office, Chief Medical Examiner: Tim Candahl.

26
several factors of an aqueous environment, after skin sloughing has occurred the
bones that are exposed tend to disarticulate (Haglund 1993). In an aqueous
environment bodies are often suspended in water allowing movement of the body
in three dimensions. This continuous movement, influenced by the water
current,aids in soft tissue connection decomposition especially in the joints
(Haglund 1993). Heaton et al. (2010) designated the final stages of
decomposition to include a progression of skin loss, bone exposure, and
disarticulation of the bones.
Megyesi et al. (2005) explained that decomposition occurs differently in
three main areas of the body: the head and neck, the trunk, and the limbs. The
Heaton et al. (2010) specialized aquatic decomposition scoring method also
divided the body into the same three anatomical areas. Therefore, a total body
decomposition assessment must be comprised of the individual scores summed
together from each of the three anatomical areas. Each of the three anatomical
regions has scores ranging from fresh to dry, or in the case of submersion
decomposition, fresh to complete disarticulation and skeletonization. A minimum
total body score (TBS) of three and a maximum TBS of 35 can be assigned using
Megyesi et al. (2005). A minimum total aquatic decomposition score (TADS) of
three could be assigned, and a maximum TADS of 25 can be assigned to an
individual case. Appendix I provides the descriptive stages of scoring
decomposition for each of the three anatomical regions derived from Megyesi et
27
al. (2005), and Appendix II outlines the descriptive stages of scoring total aquatic
decomposition derived from Heaton et al. (2010).
Utilizing ADD and point based scoring systems for decomposition
unknown PMIs and PMSIs can be predicted. TADS and TBS create an
estimation of ADD allowing for a time since death interval to be approximated
with known daily temperatures.
Concerns Forensic Investigators Face When Determining PMSIs While scoring decomposition to predict PMIs and PMSIs can provide an
estimate, an exact time since death can never be calculated. As mentioned
above, several environmental and body factors can accelerate or impede the rate
of decomposition. De Donno et al. (2014) utilized 68 submerged forensic cases
to estimate PMSIs in sequestered versus non-sequestered aquatic
environments. Utilizing the Heaton et al. (2010) point based decomposition
scoring system and ADD they found each forensic case is too unique to predict a
PMI (De Donno et al. 2014). While these scoring methods do provide an estimate
of PMI and PMSI, a developed method to include all variables affecting
decomposition does not exist. An algorithm including all factors of human
decomposition in water would have to include clothing, water depth, water
obstacles, water temperature, current, water pH levels, marine life activity, state
of submersion of floatation, body weight, body mass index, and many more
factors (De Donno et al. 2014; Haglund 1993; Payne-James et al. 2011).

28
Since it is nearly impossible to recreate all of the environmental and body
conditions in a controlled setting, forensic cases have been used to study aquatic
decomposition (De Donno et al. 2014; Forbes et al. 2011; Heaton et al. 2010;
Humphreys et al. 2013; Mateus and Vieira 2014; Megyesi et al. 2005). When
utilizing forensic cases many of the mentioned variables are unknown or
undocumented. Haglund (1993) expresses that often the point of entry of a
submerged body is not known. Bodies can become stuck or snagged below the
surface or above the surface in a stationary position. Both of these variables
hinder the ability to estimate the water current’s effect on decomposition.
Similarly, levels of water pH are not measured, but are found to affect
decomposition (Alley 2007; Ayers 2010).
It should also be understood that point based decomposition scoring
methods are not suited well for very short PMIs. Both Megyesi et al. (2005) and
Heaton et al. (2010) do not take into account physical expressions of algor
mortis, livor mortis, or rigor mortis. They also do not consider the hindering affect
clothing has on decomposition, or the accelerated affect and pattern of
decomposition antemortem or perimortem trauma possibly has on the body
(Mann et al. 1990; Smith 2009).
Another very significant problem when using point based decomposition
scoring systems to predict ADD and PMI is the lack and accuracy of temperature
recordings. Temperatures are rarely recorded in medical examiner/coroner or
autopsy reports. Temperatures of many waterways are not recorded daily, if at

29
all. Water temperatures that are recorded are often recorded at the surface and
not at the bottom of the body of water where the temperature is often cooler
(Rodriquez 1997). It should also be noted that in colder regions temperature
sensors often freeze and are not able to provide an accurate temperature
reading (Maddock, Pers. Comm.). Heaton et al. (2010) collected temperature
data from environmental agencies, however temperatures of the studied bodies
of water were only collected one to three times each month. Using monthly
temperature data instead of daily temperature measurements may ensure
general instead of accurate estimates of daily temperatures and ADD. However,
it may be more beneficial for longer PMSIs to be recorded using daily
temperatures, and for temperatures to be recorded by the researcher instead of
relying on outside research parties (Heaton et al. 2010).
It should be noted that PMSIs do not always equate to PMIs. Particularly
in homicide cases, it is possible that the victim may have been deceased prior to
being submerged in water. When using the Heaton et al. (2010) point based
decomposition scoring method for aqueous environments ADD are not
necessarily predicting time since death, rather time since water submersion.
Utilizing both Megyesi et al. (2005) and Heaton et al. (2010) this research
attempts to highlight how water affects the many different expressions of human
decomposition. Due to the plethora of environmental and body factors affecting
decomposition this study also aims to explore how water submersion impacts
PMSI estimates in waterlogged bodies. Additional research of PMSI estimates is

30
crucial to the study and application of death investigation. More accurate
methods of PMSIs and the factors that can affect those estimates are deemed
useful to forensic scientists and law enforcement when solving homicide,
accidental, and suicide deaths and can aid in the process of human identification
(Papadodima et al. 2010; Prahlow 2010).

31
CHAPTER 3
METHODS This study is comprised of accidental and suicidal drowning cases obtained from
medical examiner and coroner’s offices in Wisconsin and Minnesota. Cases were
required to have a known or precisely estimated PMSI and available daily water
temperatures. A total of 73 cases from three primary counties, Hennepin County
in Minnesota, La Crosse County in Wisconsin, and Manitowoc County in
Wisconsin, containing major rivers or lakes were examined (see Figure 3.1).
These three counties were chosen for this study because of the frequent amount
of water deaths as well as the variability of water temperatures throughout the
seasons.
The Mississippi River and Lake Michigan were the main bodies of water
examined in this study. The Mississippi headwaters, near Hennepin and La
Crosse counties, can often drop to below freezing temperatures in the winter
months (US Army Corps of Engineers 2017). An average current flowing south at
1.3 miles per hour keeps the water from freezing. Lake Michigan, bordering
Manitowoc County, is the third largest Great Lake at approximately 22,300
square miles. While the entire lake does not entirely freeze over in the winter
months, ice typically covers over half of the lake. The lake is 925 feet at its
deepest point allowing reservoirs of heat within the lake. According to the Great
Lakes Environmental Research Lab, strong winds and contrasting wave actions

32
Figure 3.1. Hennepin, La Crosse and Manitowoc Counties.
33
inhibit the lake from entirely freezing over. During the summer months, water
temperatures are recorded between 60 and 70 degrees Fahrenheit (NOAA
2015). These waterways were chosen for this study due to the compatibility in
water temperature fluctuation throughout the seasons as well as the inability for
the body of water to entirely freeze during the winter months.
Permission to access autopsy reports, medical examiner reports, police
reports, and photographs was granted by Dr. Andrew Baker, Hennepin County
Chief Medical Examiner. Hennepin County in Minnesota is bisected by the
Mississippi River. A total of 42 of 102 drowning cases between 2004 and 2014 fit
this study. Permission to access these same materials at the La Crosse County
Medical Examiner’s office in Wisconsin was granted by Timothy Candahl, Chief
Medical Examiner. This county is also bordered by the Mississippi River,
resulting in a total of 20 cases between 1997 and 2017 that fit this study. Chief
Coroner, Curtis Green, of the Manitowoc County Coroner’s Office in Wisconsin
also granted access to reports, resulting in a total of 11 cases from the
Manitowoc River, leading into Lake Michigian, and Lake Michigan from 1998 to
2015 that fit this study. Table 3.1 includes the demographic data of the cases
from each county that fit this study.
While reviewing the case files, three data sets (observations of
decomposition as well as biological profile information, and site/scene
descriptions) were collected for each case utilizing scene reports, autopsy
reports, and photographs. Biological profile observations are defined in

34
Table 3.1. Demographic data of sampled forensic cases. Males
(N) Females
(N) Totals
(N) Age
Range (years)
White Black Other White Black Other
Hennepin County
14-67 19 10 4 7 1 1 42
La Crosse County
6-72 13 1 4 1 0 1 20
Manitowoc County
1-71 7 0 1 2 0 1 11
Totals 39 11 9 10 1 3 73

35
Table 3.2. Site/scene descriptions as reported in the death investigation reports
are listed in Table 3.3. Observations of the expression of decomposition that
were recorded are listed in Table 3.4.
Accumulated Degree Days
Until recent years, medical examiner and coroner reports were often not as
detailed as a researcher or investigator would anticipate. Cases that were poorly
documented dating from the 1990’s and early 2000’s, were excluded from this
study due to lack of photographs, detailed descriptions, and water temperature
information. Very few cases had documented water and ambient temperatures
recorded. The US Army Corps of Engineers website was utilized to obtain water
temperature data for those cases that were undocumented by death
investigators. The US Army Corps of Engineers controls each lock and dam on
the Mississippi River, and they record a mean daily water temperature. Access to
information to the nearest lock and dam system for each individual case was
granted to obtain daily water temperatures. Water temperature data from Lock
and Dam #1 on the Mississippi River was utilized for all cases in Hennepin
County. Lock and Dam #1 PMSI ADD ranged from 0.01°C to 1826.5°C. Water
temperature data from Lock and Dam #7 on the Mississippi River was utilized for
all cases in La Crosse County. Lock and Dam #7 PMSI ADD ranged from 0.01°C
to 917.78°C. Only cases from Manitowoc County with documented daily water
temperatures in the site/scene, police, or medical examiner’s report were used in

36
Table 3.2. Biological Profile. Variable Description Sex The decedent’s sex as reported by a pathologist, medical
examiner, or coroner. Sex was determined using soft tissue characteristics or anthropological techniques when skeletal remains are present.
Age Biological age of the individual was determined by the medical examiner or coroner using medical records after the decedent had been positively identified.
Ancestry Ancestry of the victim was collected by the death investigator or law enforcement officer who made the positive identification of the victim or by the pathologist at autopsy to describe human variation among populations (Livingstone 1962).
Weight The decedent’s weight was recorded from an identification card. Weight is an estimate since these documents contain self-reported weight. Pathologists also document weight of the remains at the time of an autopsy. However since decomposition has taken place and the body has retained water these weights would not reflect the decedent’s antemortem weight.
Stature Length of the decedent is an estimate due to the self-reported nature of height obtained from positive identification documents often used, such as a driver’s license (Willey and Falsetti 1991).
Clothing Clothing was recorded as absent, lightly clothed if the decedent had a shirt and pants or shorts, and fully clothed if the decedent was dressed in anything more than a shirt and shorts or pants.

37
Table 3.3. Site and Scene Descriptions as Reported by Coroner/Medical Examiner. Variable Description PMSI The known postmortem submersion interval was defined in this
study as the reported time of death made by witnesses at the scene or suicide notes until the time the body was recovered. When exact time of death was unknown the date the decedent was last known to be alive is reported as the time of death. Victims submerged for less than 12 hours were excluded from this study. Victims submerged for 12 hours or more were documented by number of days submerged.
Water Temperature
Water temperature was recorded as average daily temperature of the water in which the decedent was found. It was collected by outside parties such as the US Army Corps of Engineers and the National Oceanic Atmospheric Administration.
Ambient Temperature
Ambient temperature was recorded as average daily temperature at the location in which the decedent was found as reported by the National Weather Service.
Water Depth The death investigator or law enforcement officer at the scene recorded the depth of the water in which the decedent was found. It was categorized into groups including: no depth if the remains had washed to the shore, shallow if the remains were in less than five feet of water, and deep if the remains were recovered in more than five feet of water (limited visibility).
Site Description
This is the description of the scene the victim was recovered, often in a river or lake.

38
Table 3.4. Expressions of decomposition. Variable Description Submerged or Floating remains
If the remains were fully submerged at the scene the decedent was considered sunk, and if the remains were exposed to the water’s surface or washed to a shoreline the body was considered to have been floating.
Stage of Decomposition
This was reported by pathologists in autopsy reports as no signs of decomposition, early signs of decomposition, moderate decomposition, or advanced decomposition.
Adipocere This is the wax like result from anaerobic hydrolysis of fats into fatty acids (Clark et al. 1997; O’Brien 1994).
Rigor Mortis This is defined as muscle stiffening due to autolysis of muscle cells, causing the muscle fibers to biochemically bind together (Marks et al. 2009).
Livor Mortis This is defined as blood pooling due to lack of circulation throughout the deceased’s body (Clark et al. 1997: Marks et al. 2009).
Algor Mortis This is defined as the cooling or warming of the body to reach an ambient temperature (Clark et al. 1997).
Autolytic Changes to Organs
This was reported by the pathologist performing the autopsy as either absent, beginning; if the organs were soft and decomposition fluid was present, liquefied; if the organs were present but mainly liquid, and reported as complete; if the organ structures were unidentifiable.
Entomology This was recorded as presence or absence of either insects or insect bites on the remains as reported by the pathologist at autopsy.
Anthropophagy This is the presence of vertebrate animal activity, scavenging, on the body.
Washerwoman Skin
This is described as the wrinkled physical appearance usually on the hands and feet of bodies submerged in water (Heaton et al. 2010).
Discoloration This is the change of color appearance of the body, usually progressing from a green color to a dark brown color as a result of autolytic cell activity (Clark et al. 1997).
Marbling This is the result of autolysis of the red blood cells, creating a blue hue of deoxyhemoglobin in the superficial blood vessels (Clark et al. 1997; Prahlow 2010).

39
Table 3.4. Continued Variable Description Hair Slippage This is the same process as skin slippage, but occurring where
there is a presence of copious amounts of hair, such as the head (Clark et al. 1997).
Skin Slippage This is defined as the break down of the cellular junctions between the epidermis and dermis, resulting in the epidermis separating from the dermis (Clark et al. 1997).
Bullae This is the collection of fluid filled pockets between the dermis and epidermis resulting from autolytic changes of the cellular junctions between the layers of the epidermis and dermis (Clark et al. 1997).
Bloating This is the result of autolytic and putrefactive decomposition changes, creating a build up of gas in the soft tissues (Clark et al. 1997)
Purge This is the result of the relaxation of the muscles and gas buildup in the gastrointestinal tract leading to expulsion of the gastric contents through the mouth and/or nose (Clark et al. 1997).
Trauma Presence of any antemortem, perimortem, or postmortem lesions, bruises, breaks, or bone fractures as reported by the pathologist, medical examiner, or coroner.

40
this study due to the lack of reliable temperature gauges in the Manitowoc River
and the shores of Lake Michigan (K. Schrader, Pers. Comm 2016). These PMSI
ADD ranged from 0.01°C to 191.67°C. Water temperatures of 32° F or below
were assigned as 0.01°C to avoid negative ADD. The total range of ADD for all
decedents in this study is from 0.01°C to 1826.5°C with a mean ADD of
140.63°C.
Measuring Decomposition Each case was evaluated and scored utilizing scene reports, autopsy reports and
photographs. Detailed notes were taken, and the data were scored at a later
date. Decomposition scores can be found in Appendix III. Not all cases had
similar available sources to collect data from. Some cases did not have available
photographs, while others did not include autopsy reports. Therefore, scoring at a
later date utilizing detailed notes eliminated some biases.
In order to assess decomposition, this study utilized methods from the
Megyesi et al. (2005) point-based scoring system as well as the Heaton et al.
(2010) point-based scoring system. The Heaton et al. (2010) scoring system is a
revised version of Megyesi et al. (2005) created specifically to score
aquatic/submersion decomposition. By using point-based scoring systems in
conjunction with accumulated degree-days (ADD), an estimated PMSI can be
determined and compared to the known PMSI. Heaton et al. (2010) explained
that similar types of soft tissue modifications occur in similar sequences and

41
therefore are not dependent on the type of aquatic site. It is suggested that the
sequence of decomposition is comparable between all types of waterways,
allowing the same methods of visual assessment of postmortem modification to
be utilized for each case in this study.
In order to assess how the land based decomposition scoring method
(Megyesi et al. 2005) and the water based scoring method (Heaton et al. 2010)
compared to one another and to determine which method was more accurate this
study had three components. First, after scoring bodies from photographs and
assigning a TBS/TADs score, ADD were calculated and compared for each
method to understand if both scoring methods predict equivalent or
interchangeable estimates. Second, PMSIs were calculated from TBS and TADS
scores, and then were compared to one another to determine which method is
more accurate and which method was more appropriate for waterlogged bodies.
The third component of this study compared how these methods work for cases
in three different temperature categories.
To calculate ADD estimation using methods derived from Megyesi et al.
(2005) the following formula is required:
(ADD= 10^(.002*TBS*TBS+1.81) ±388.16).
A standard regression error is included as ±388.16. To calculate ADD estimation
using TADS Heaton et al. (2010) utilized the equation:
(TADS=-3.706+7.778*LOG ADD)
or
42
(ADD=10((TADS+3.706)/7.778))
With an assigned TBS or TADS, an estimation of PMSI can be made using
known ADD from the time of body discovery to the time of known submersion.
Microsoft Excel (Katz 2010) was utilized to calculate all TBS and TADS scores.
To test for an intraobserver error, I re-scored 25% or 19 of the cases for TBS
and TADS. The estimated ADD was then compared to the initial score’s
estimated ADD using a paired t-test for both decomposition-scoring methods
using the statistical program, R studio 1.0.136 (2013).
After estimated ADD were calculated using both TBS and TADS, each
method was compared to the actual ADD retrieved from autopsy, coroner,
medical examiner, or police reports. A regression analysis was utilized to test
TBS against the actual and the predicted log10 ADD, as well as TADS against the
actual and predicted log10 ADD to understand the relationship between the
variables. A p-value <.05 was considered significant. Regression analyses
predict the type of relationship between independent (TBS or TADS) and
dependent (calculated/predicted ADD) variables. Simmons et al. (2010) and De
Donno et al. (2014) explain that decompositional scoring systems matched
against log10 ADD allows for the expression of a simple linear equation to
represent decomposition’s exponential progression. ADD temperatures were
subjected to the log10 function to normally distribute the data and for the
temperatures to appear more logically when charted. A Pearson’s product
moment correlation was used to compare the estimated and actual calculated
43
ADD based on water temperatures. Using a Pearson’s product moment
correlation allowed for the strength of a linear association between two variables
to be measured. An absolute value of the r-value 0.1 to .3 was considered as a
low correlation, from 0.3 to 0.5 as a medium correlation, and 0.5 to 1.0 as a high
correlation. Actual ADD and estimated ADD from each scoring method were then
compared, as well as the predictive methods with each other, using a repeated-
measures ANOVA test using SPSS to examine if the sample means were
significantly different (IBM Corp., 2016).
The estimated PMSI was then compared to the actual PMSI using a
paired t-test for both decomposition-scoring methods using the statistical
program, R studio 1.0.136 (2013). Thirteen cases were excluded from this
assessment due to the large number of days that were documented as 0°C. The
estimated PMSI for the Megyesi et al. (2005) and the Heaton et al. (2010) were
then compared to one another using a paired t-test. Comparing estimated PMSIs
to actual PMSIs from two different scoring methods, Megyesi et al. (2005) and
Heaton et al. (2010), will attempt to answer how water submersion impacts PMSI
estimates in waterlogged bodies. Specifically, the results from each scoring
method will attempt to answer the first research question regarding how water
submersion affects the decomposition process and rate of decomposition.
Cases were also categorized and statistically analyzed in R (2013) using
the same regression analysis and Pearson’s product moment correlation analysis
methods as above according to temperature categories. Using actual ADD

44
calculated from water temperatures and a chosen temperature threshold, cases
were split between three groups according to ADD: ADD 25°C and under, ADD
between 26°C and 100°C, and ADD over 100°C. A two-tailed t-test was also
utilized to determine if each predicted decomposition scoring method was
significantly different from the actual calculated water temperatures. A p-value of
less than 0.05 was considered significantly different. These analyses determine
which decomposition scoring method best predicts PMSI for different water
temperatures.
45
CHAPTER 4
RESULTS General Observations The degree of decomposition varied within the cases studied. Known PMSIs
ranged from one day to 258 days. Observations from fresh/no physical changes
to limb disarticulation and bone exposures were recorded. All 73 cases retained
most of the soft tissues. One case showed partial decapitation due to extensive
decomposition. Ten cases were recorded as having exposure of the organs, and
four cases showed bone exposure in the hands or limbs. All but 12 cases were
considered fully clothed. Twenty cases showed entomological evidence or
anthropophagy. Antemortem or perimortem trauma was found in 24 cases, with
17 of the cases classified as having open flesh wounds.
Statistical Analysis The data used in this study fit both the Megyesi et al. (2005) and the Heaton et
al. (2010) body scoring methods well. A regression analysis for TBS against
predicted log10ADD based on the Megyesi et al. (2005) model was explored
(r2=0.9369, F1.71=1071, p<2.2e-16). The r2 value is the variation in Y explained by
the variation in X. A r2 value greater than 0.25 indicates a significant relationship
between the X and Y. A better fit is considered the closer the r2 value is to one.
The F value is the probability that the null hypothesis is true. The value of F

46
ranges between zero and an arbitrarily large number. The p-value indicates
whether or not the null hypothesis can be rejected. A low p-value of <0.05 will
reject the null hypothesis, while an insignificant p-value of >0.05 will indicate that
the changes in the predictor are not associated with the changes in the response.
Data were then subjected to a regression analysis between TBS and ADD
calculated from the water temperatures to estimate the relationship between the
two variables. The regression model for TBS against log10ADD based on water
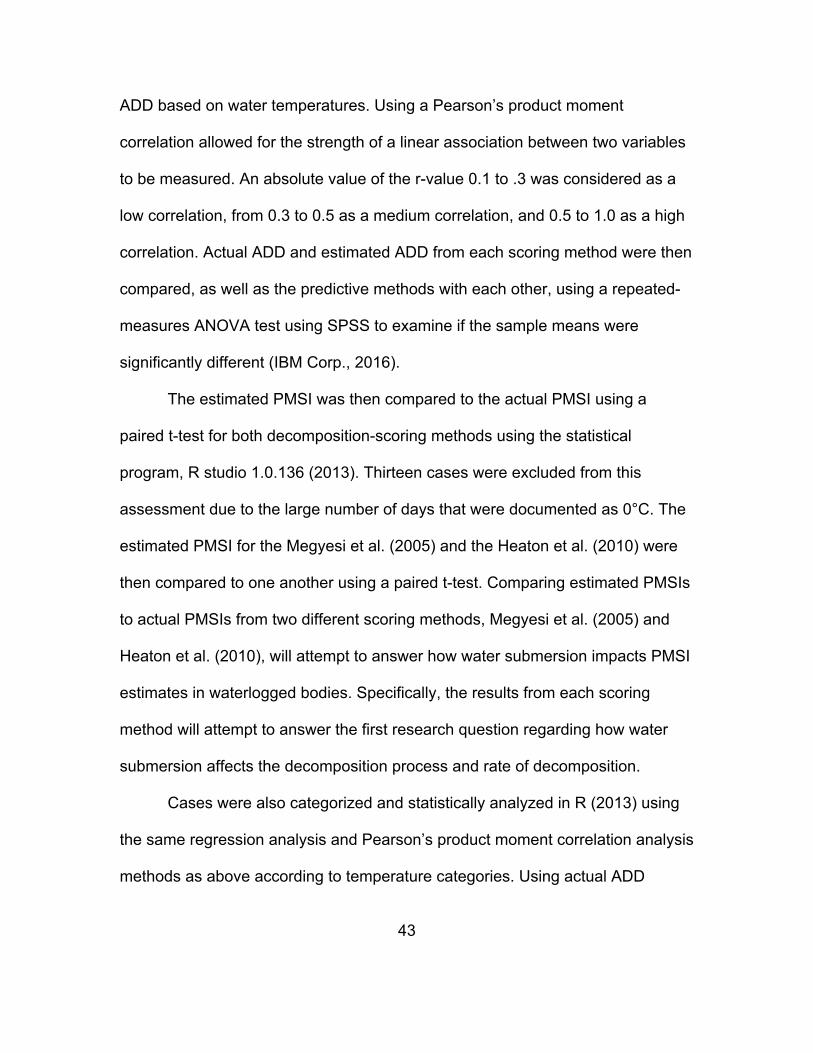
temperatures (Fig. 4.1) fits the data well and is considered significant (r2=0.3486,
F1,71=37.99, p<0.0001). The data were tested for an intraobserver error for each
decomposition scoring method using a t-test, and no significant differences were
found (Megyesi et al. (2005):t=1.4377, df=21, p=0.1677; Heaton et al. (2010):
t=1.7143, df=18, p=0.1036). The t-value indicates difference size between the
two sets of data. The t-value can be positive or negative, and the further the
value is from zero indicates there is not a significant difference between the two
data sets. The df-value is the degrees of freedom, and the p-value less than 0.05
rejects the null hypothesis, while a p-value of greater than 0.05 accepts the null
hypothesis.
A regression analysis for TADS against log10ADD based on the Heaton et
al. (2010) regression model was explored (r2=0.9994, F1,71=1.289e5, p<0.0001).
The regression model for TADS against log10ADD based on actual water
temperatures (Fig. 4.2) also fits the data well, and the relationship between the
two variables is considered significant (r2=0.3413, F1,71=36.78, p<.0001).
47
Figure 4.1. Total body score against log10 calculated actual accumulated degree-days (r2=0.3486, F1,71=37.99, p<0.0001). Gray areas indicated confidence intervals.

48
Figure 4.2. Regression of total Aquatic Decomposition Score against log10 calculated actual accumulated degree-days (r2=0.3413, F1,71=36.78, p<.0001). Gray areas indicated confidence intervals.

49
Actual ADD calculated from water temperatures was then compared to the
predicted ADD for both Megyesi et al. (2005) and Heaton et al. (2010) methods
using Pearson’s product moment correlations to understand the linear
relationship between the two sets of temperatures. Figure 4.3 indicates a positive
linear correlation between the Megyesi et al. (2005) predicted ADD and the
actual ADD (r=0.5756781). A r-value can range from -1 to 1 depending on the
type of association (negative or positive) between the two variables. The closer
the r-value is to zero indicates a weaker association and vice-versa. As an r-
value approaches zero, the plot will appear more scattered and further from the
line of best fit. A positive linear correlation was also found between the Heaton et
al. (2010) predicted ADD and the actual calculated ADD (r=0.5922739) (Fig. 4.4).
A strong correlation (r=0.8860195) was found between both Megyesi et al. (2005)
and Heaton et al. (2010) predicted ADD methods (Fig. 4.5).
A repeated-measures ANOVA was used to compare the means of each
ADD predictive method and the actual calculated ADD from water temperatures.
The results show there is no significant difference between the three data sets
(Table 4.1). An F statistic is the ratio of the variation within the subject to the error
variation and measures how far the data are from the mean. Larger F scores
indicate greater dispersion from the mean. A p-value greater than 0.05 indicates
that the means are not significantly different. While there was no significant
difference between the Megyesi et al. (2005) predicted ADD and the actual ADD
calculated from water temperatures, the Megyesi et al. (2005) method over

50
Figure 4.3. Pearson’s product moment correlation between log10 actual calculated ADD and log10 Megyesi et al. (2005) predicted ADD (r=0.5756781).

51
Figure 4.4. Pearson’s product moment correlation between log10 actual calculated ADD and log10 Heaton et al. (2010) predicted ADD (r=0.5922739).

52
Figure 4.5. Pearson’s product moment correlation between log10 Heaton et al. (2010) predicted ADD and log10 Megyesi et al. (2005) predicted ADD (r=0.8860195).

53
Table 4.1. Repeated-Measures ANOVA comparing differences in means between the Megyesi et al. (2005) predicted ADD Celsius, the Heaton et al. (2010) predicted ADD Celsius, and the calculated ADD from water temperatures Celsius.
(I) factor1 (J) factor1
Mean Difference
[I-J] (F) Std. Error Sig.a (p)
95% Confidence Interval for
Differencea
Lower Bound Upper Bound
1.(Megyesi
ADD)
2 10.397 25.386 .683 -40.210 61.003
3 23.286 23.498 .325 -23.557 70.129
2. (Heaton
ADD)
1 -10.397 25.386 .683 -61.003 40.210
3 12.889 11.138 .251 -9.314 35.092
3. (ADD) 1 -23.286 23.498 .325 -70.129 23.557
2 -12.889 11.138 .251 -35.092 9.314
Based on estimated marginal means
a. Adjustment for multiple comparisons: Least Significant Difference (equivalent to no adjustments).

54
predicted ADD (F=23.286, p=0.325). The Heaton et al. (2010) method also
tended to over predict ADD (F=12.889, p=0.251). Of the two predictive ADD
methods the Megyesi et al. (2005) method over predicted ADD twice as much in
comparison to the Heaton et al. (2010) method (F=10.397, p=.683).
A paired t-test was used to compare the estimated PMSI to the actual
PMSI for both decomposition-scoring methods for 60 cases. The results indicate
no significant difference between the actual PMSI and the estimated PMSI using
the Megyesi et al. (2005) method (t=-15784, df=59, p=0.1198). No significant
difference was found between the actual PMSI and the estimated PMSI using the
Heaton et al. (2010) method (t=0.010479, df=59, p-value=0.9917). The estimated
PMSI for the Megyesi et al. (2005) and the Heaton et al. (2010) were then
compared to one another using a paired t-test. The results indicate no significant
difference between the two estimated PMSIs (t=1.9166, df=59, p-
value=0.06014).
Data were then split into three subgroups according to actual calculated
water temperatures. Group A consisted of 29 cases with ADD of 25.8°C or
below. The data were subjected to a regression analysis, which indicated a non-
significant relationship between the two variables when using the Megyesi et al.
(2005) model (r2=0.03442, F1,27=0.9625, p: 0.3353) (Fig. 4.6) as well as the
Heaton et al. (2010) model (r2=0.06273, F1,27=1.807, p: 0.19) (Fig. 4.7). Group A
was then analyzed using Pearson’s product moment correlation (Fig. 4.8 and Fig.
4.9) for each body scoring method. The results show a low negative correlation

55
Figure 4.6. Regression of total body score against log10 calculated actual accumulated degree-days (r2=0.03442, F1,27=0.9625, p: 0.3353). Gray areas indicated confidence intervals.

56
Figure 4.7. Regression of total aquatic decomposition score against log10 calculated actual accumulated degree-days (r2=0.06273, F1,27=1.807, p: 0.19). Gray areas indicated confidence intervals.

57
Figure 4.8. Pearson’s product moment correlation between log10 Megyesi et al. (2005) predicted ADD and log10 calculated actual ADD (r=-0.1559689).

58
Figure 4.9. Pearson’s product moment correlation between log10Heaton et al. (2010) predicted ADD and log10 calculated actual ADD (r=-0.219079).

59
as found between TBS and actual calculated water temperatures for the Megyesi
et al. (2005) scoring method (r=-0.1559689) as well as the Heaton et al. (2010)
scoring method (r=-0.219079). The actual calculated ADD was then subjected to
a two-tailed t-test compared to the Megyesi et al. (2005) scoring method
(p<0.0001) and another comparing to the Heaton et al. (2010) method (p<0.001).
Each method was found to have significantly different predicted mean ADD in
comparison to calculated ADD from water temperatures.
Group B consisted of 22 cases with ADD between 26°C and 99°C. This
data set was also subjected to a regression analysis, which indicated a
significant relationship between the two variables when using the Megyesi et al.
(2005) model (r2=0.3769, F1,20=12.1, p<0.005) (Fig. 4.10) as well as the Heaton
et al. (2010) model (r2=0.5845, F1,20=28.13, p<0.0001) (Fig. 4.11). Group B was
then analyzed using Pearson’s product moment correlation (Fig. 4.12 and Fig.
4.13) for each body scoring method. The results show a high positive correlation
found between TBS and actual calculated water temperatures for the Megyesi et
al. (2005) scoring method (r=0.55) as well as the Heaton et al. (2010) scoring
method (r=0.765). The actual calculated ADD was then subjected to a two-tailed
t-test compared to the Megyesi et al. (2005) scoring method and the Heaton et
al. (2010) method. The Megyesi et al. (2005) scoring method mean ADD was
significantly different than the actual water temperature mean (p<0.0001), while
the Heaton et al. (2010) scoring ADD mean was not significantly different form
the actual water temperature mean (p>0.05).

60
Figure 4.10. Regression of total body score against log10 calculated actual accumulated degree-days (r2=0.3769, F1,20=12.1, p<0.005). Gray areas indicated confidence intervals.

61
Figure 4.11. Regression of total aquatic decomposition score against log10 calculated actual accumulated degree-days (r2=0.5845, F1,20=28.13, p<0.0001). Gray areas indicated confidence intervals.

62
Figure 4.12. Pearson’s product moment correlation between log10 Megyesi et al. (2005) predicted ADD and log10 calculated actual ADD (r=0.55).

63
Figure 4.13. Pearson’s product moment correlation between log10Heaton et al. (2010) predicted ADD and log10 calculated actual ADD (r=0.765).

64
Group C consisted of 22 cases with ADD of 100°C and over. The data
were subjected to a regression analysis, which indicated a significant relationship
between the two variables when using the Megyesi et al. (2005) model
(r2=0.5472, F1,20=24.17, p<0.0001) (Fig. 4.14) as well as the Heaton et al. (2010)
model (r2=0.5743, F1,20=26.99, p<0.0001) (Fig. 4.15). Group C was then
analyzed using Pearson’s product moment correlation (Fig. 4.16 and Fig. 4.17)
for each body scoring method. The results show a high positive correlation as
found between TBS and actual calculated water temperatures for the Megyesi et
al. (2005) scoring method (r=0.801) as well as the Heaton et al. (2010) scoring
method (r=0.758). The actual calculated ADD was then subjected to a two-tailed
t-test compared to the Megyesi et al. (2005) scoring method and the Heaton et
al. (2010) method. The Megyesi et al. (2005) scoring method mean ADD was
significantly different than the actual water temperature mean (p<0.05), while the
Heaton et al. (2010) scoring ADD mean was not significantly different from the
actual water temperature mean (p>0.05).

65
Figure 4.14. Regression of total body score against log10 calculated actual accumulated degree-days (r2=0.5472, F1,20=24.17, p<0.0001). Gray areas indicated confidence intervals.

66
Figure 4.15. Regression of total aquatic decomposition score against log10 calculated actual accumulated degree-days (r2=0.5743, F1,20=26.99, p<0.0001). Gray areas indicated confidence intervals.

67
Figure 4.16. Pearson’s product moment correlation between log10 Megyesi et al. (2005) predicted ADD and log10 calculated actual ADD (r=0.801).
68
Figure 4.17. Pearson’s product moment correlation between log10Heaton et al. (2010) predicted ADD and log10 calculated actual ADD (r=0.758).

69
CHAPTER 5
DISCUSSION Trends in Aqueous Decomposition
The focus of this study was to assess aquatic human decomposition in various
water temperatures and to understand how aquatic environments and various
temperatures affect our ability to use body scoring methods by Megyesi et al.
(2005) and Heaton et al. (2010) to predict PMSI in an aqueous environment. The
data fit both the Megyesi et al. (2005) and the Heaton et al. (2010) body scoring
methods well. However, when the data were split into three separate water
temperature categories the results showed that colder water temperatures as
well as short known PMSis inhibit the ability to accurately predict PMSI using
body scoring methods.
I noticed trends of decomposition and factors that inhibited trends in an
aquatic environment. The decedents that had the shortest PMSIs had a distinct
pallor similar to what is seen in terrestrial environments shortly after death. This
is often cited as the first sign of decomposition (Clark et al.1997). The proceeding
indicators of decomposition seen in stationary or terrestrial environments such as
rigor mortis, livor mortis, and algor mortis, all fluctuated according to several
different variables. Rigor mortis was seen in decedents who had been
submerged from 12 hours to 39 days. While many death investigators
understand rigor mortis often can relent after 24 hours it is important to take into

70
account ambient temperature, in this case water temperature, and prior physical
activity to death (Amendt et al. 2010; Prahlow 2010). Physical activity prior to
death increases the onset of rigor mortis, while lower temperatures can
dramatically slow the process of rigor mortis as seen in 12 decedents in this
study. Variations in onset of algor mortis and livor mortis were also seen in this
study due to variations in water temperatures, water current, and fluctuating body
position within the moving water.
Discoloration was seen in all decedents who had PMSI of more than one
day in warmer water temperatures. Those submerged in cold or freezing water
temperatures and also recovered in cold or freezing water temperatures
exhibited red discoloration especially in the face and green discoloration in the
abdomen. Marbling was usually only detected in those submerged in warmer
temperatures in earlier stages of decomposition. Purple and black discoloration
was only seen in those individuals who were recovered from warm water
temperatures. Those individuals who were recovered in cold temperatures and
had extended PMSIs did not reach the extent of decomposition that produced a
purple/black discoloration.
Decedents were recorded whether they were floating or submerged in the
water. Heaton et al. (2010) specifies whether the remains are pre-bloat, bloating
or post-bloat. Often the remains that are not in a state of bloat will remain
submerged in the water until they become bloated enough to cause them to float
to the surface (Haglund 1993). It is estimated that decomposing human remains

71
reach the bloating stage and float to the surface of the water after 100-140°C
ADD (Mateus and Vieira 2014). However, 28 cases in this study had not reached
100 ADD and were detected floating at the water’s surface. Decedents recovered
in freezing water temperatures with extended PMSIs were often found in floating
positions without any evidence of bloat and few signs of decomposition. It is
possible that these decedents had died with air in their lungs, causing them to
float to the surface, or that the bloat stage had been prolonged due to the cold
water temperatures making evidence of bloating very subtle. One other
explanation could be that those individuals who were both submerged and
recovered from freezing water had frozen appendages or were completely frozen
causing buoyancy. Four cases in this study were documented as completely
frozen.
While skin wrinkling (washerwoman skin) occurred in almost all
submerged individuals, the occurrence and usual sequence of skin slippage, hair
slippage, and degloving was not always detected. According to Clark et al.
(1997) skin slippage can occur as early as 48 hours postmortem. Megyesi et al.
(2005) consider skin slip to be an early stage of decomposition, while Heaton et
al. (2010) classify it to occur later in the decomposition process in an aqueous
environment. The Heaton et al. (2010) scoring method expects skin slippage to
occur at the same time on the face and the abdomen. Shortly after, skin slippage
on the hands (degloving) and hair slippage should occur. Skin slippage was
detected in this study as early as three days post-submersion in warm water

72
temperatures, while hair slippage was seen four days post-submersion in warm
water temperatures. Both hair and skin slippage was not detected until seven
days post-submersion in cold aqueous environments. Fifteen cases with PMSI of
more than four days exhibited skin slippage without any signs of hair slippage.
One case with a PMSI of 126 days showed signs of skin slippage on the limbs,
but none was detected on the abdomen or face, nor were there signs of hair
slippage. A single case was recorded as exhibiting hair slippage without signs of
skin slippage on the body. Both of these anomalies occurred in water with very
low calculated ADD. An explanation for these anomalies is most likely the
amount of clothing the decedent was wearing. Clothing protects the remains from
various factors, including anthropophagy and debris in the water. Without direct
contact to the water the clothing may act as a barrier allowing the integrity of the
skin to remain intact for longer periods of submersion. In each of the cases of
extended PMSIs all of the decedents were considered to be fully clothed,
including the presence of shoes.
Only one case in the study had extensive decomposition that led to
skeletonization of the cranium as well as bone exposure in the limbs. This case
had a PMSI of 35 days in the summer, and was not wearing any clothing when
the body was recovered. The body was recovered in an open river. Three other
cases had bone exposure occurring in the limbs or hands. A combination of lack
of clothing in these areas, increased ADD, and open river currents constantly

73
altering the position of the body allowed for an accelerated rate of decomposition
to occur in the water.
As the regression model indicates in Figure 4.2 a significant correlation
between TBS and calculated water temperature ADD was found using the
Megyesi et al. (2005) method. However, it can be noticed that the smallest and
largest ADDs have increasing distances between the confidence intervals. This is
also true using the Heaton et al. (2010) aquatic body scoring method in Figure
4.4. De Donno et al. (2014) explained that a higher ADD results in a less
accurate estimation of ADD. However, because most body scoring methods do
not take into account early signs of decomposition, such as rigor mortis and livor
mortis, the estimation of short PMSIs will also be less accurate.
Low ADD measures can be due to short PMSIs. However, several cases
in this study have been subjected to cooler water temperatures for extended
periods of time. This study explored how ADD can affect our estimation of PMSI.
When the cases were split into categories according to ADD temperatures it was
concluded that those bodies recovered in the coolest temperatures as well as
those that were in the water for the shortest amount of time had the least
accurate PMSI estimations. Inaccurate estimations can arise from a variety of
factors. As previously mentioned, body scoring methods do not take into account
early signs of decomposition. Methods assign a score of “1” when no physical
changes are found, and a score of “2” when observations such as marbling and
skin slippage are seen. However, in aquatic decomposition many postmortem

74
changes, such as rigor mortis, livor mortis, and shades of discoloration that can
be attributed to various water temperatures, occur between the stages assigning
scores of 1 and 2 points. Those decedents that were recovered from cooler water
temperatures show signs of discoloration as a consequence of freezing instead
of decomposition, resulting in the assignment of a higher TBS and TADS score
leading to increased ADD estimations.
Two cases with extended PMSIs (64 and 119 days) from group A, 25.8°C
or below, had extreme overestimations of ADD as results of both decomposition
scoring methods. As in the 64 day PMSI case, the body was submerged in below
freezing temperature water. The body was observed to have undergone the
process of bloat. However the presence of bloat was a consequence of water
retention instead of anaerobic decomposition. This submersion in a water system
comprising a strong current caused the body to almost entirely freeze. Constant
exposure of the decedent to water still allowed for decomposition observations
such as skin slippage, hair slippage and slight discoloration due to the body
freezing. Evidence of bloat due to water retention, skin slippage, and hair
slippage caused the decomposition observations to fit into advanced stages of
decomposition according to scoring methods used, even though the body did not
show evidence that it had undergone any earlier stages of decomposition. With
increased TBS and TADS scores due to submersion, increased predicted ADDs
resulted even though the water was below freezing. Upon internal examination,

75
no evidence of autolytic decomposition had occurred from a halted anaerobic
decomposition as a result of the below freezing water temperatures.
The decedent submerged for 119 days was recovered in above freezing
temperatures, but was submerged in below freezing temperatures for almost the
entirety of the PMSI. The six days before recovery of the decedent the water
temperatures rose, allowing for an accelerated rate of decomposition. Micozzi
(1986) explained that the process of freezing causes a halt in anaerobic
decomposition, but increases aerobic decomposition when thawed. This increase
in aerobic decay, as opposed to putrefaction caused by anaerobic
decomposition, allowed for advanced stages of decomposition to be observed.
Water retention also caused an appearance of bloat. Consequently larger ADD
estimations were assigned, resulting in an overestimation of PMSI.
All of the cold-water submersions in this study resulted in an
overestimation of PMSI due to the factors listed above, such as observations of
bloat due to water retention instead of decomposition. Increased intervals of
submersion leading to water retention of the body played a large role in
deterioration of the skin, resulting in decomposition changes such as skin
slippage, hair slippage, and degloving. While the Megyesi et al. (2005) and the
Heaton et al. (2010) methods consider these to be consequences of anaerobic
decomposition (putrefaction) water retention, even in below freezing
temperatures, can cause observations of advanced stages of decomposition,
resulting in overestimations of ADD.

76
While prediction of ADD led to inaccurate PMSI estimates of those
decedents with short PMSI intervals and those in cold water temperatures, the
cases in group B, 26°C to 99°C ADD, were much more predictable. A high
positive correlation was found between both scoring methods and ADD
calculated from water temperatures. Overall, both scoring methods tended to
over predict ADD, however the Heaton et al. (2010) method did not have a
significantly different ADD mean when compared to calculated water temperature
ADD. The Megyesi et al. (2005) method did produce a significantly different ADD
mean when compared to the calculated water temperature ADD. This is most
likely due to the inability to score submerged remains in any of the scoring stages
that include desiccated or mummified descriptions due to the nature of an
aqueous environment.
The results for group C, 100°C ADD and over, were similar to that of
group B. The Megyesi et al. (2005) method tended to over predict ADD
estimations for this study as a whole, however it under predicted 7 of the 22
cases in this group by 50°C or more. The mean ADD predicted using the
Megyesi et al. (2005) method was significantly different than the calculated water
temperature ADD for this group due to these under predictions and a few over
predictions of ADD. Under prediction of ADD using the Megyesi et al. (2005)
method can, again, be explained by the inability to surpass scoring categories
involving descriptions of desiccated or mummified remains due to an aqueous
environment in place of a terrestrial environment. The Heaton et al. (2010)

77
scoring method fit this data group well due to the detailed descriptions and
scoring stages of advanced decomposition usually observed in cases with larger
ADD estimates. The results and observations of decomposition from this study
show that the beginning stages of aquatic decomposition do not always occur in
a sequential predicted manner. However, stages of decomposition post skin
slippage are described as sequential stages of skeletonization and loss of soft
tissue integrity. The loss of soft tissue and process of skeletonization can be
halted or prolonged due to cooler water temperatures, but these processes
cannot be reversed or observed in a nonsequential fashion.
The results indicate that both the Megyesi et al. (2005) and the Heaton et
al. (2010) decomposition scoring methods fit the data well. Overall, each method
was able to predict PMSIs for the data in this study. However, when the data
were split into categories of ADD the results varied. Both decomposition scoring
methods proved unfit to predict short PMSIs and cases that were submerged in
cold water conditions with low ADD of 25°C and under. Both methods of
decomposition scoring showed high positive correlations for PMSI predictions for
cases with ADD between 26°C and 99°C. While the Megyesi et al. (2005)
method tended to over predict PMSIs in an aqueous environment compared to
the Heaton et al. (2010) model, the predicted ADD mean was not significantly
different than the actual calculated ADD for group B cases. Group C cases
consisting of ADD of 100°C and over had similar results to that of group B,
except that the predicted ADD mean was significantly different than the actual
78
calculated ADD using the Megyesi et al (2005) model. The results indicate the
Heaton et al. (2010) model is best fit to estimate PMSIs. However, the Heaton et
al. (2010) model does not possess the ability to predict short PMSIs and PMSIs
with low ADD as a result of cold or freezing water temperatures.
The incorporation of the Megyesi et al. (2005) method into this study
allowed for an understanding of the sequence of human decomposition, and to
determine which variables create an alteration in this pattern when attempting to
understand and score aquatic decomposition. By utilizing both the Megyesi et al.
(2005) scoring method as well as the Heaton et al. (2010) scoring method it was
able to be determined that the Heaton et al. (2010) scoring method does not
address all the necessary alterations to the Megyesi et al. (2005) method in order
to provide an all-encompassing aquatic scoring method. While research
conducted by Heaton et al. (2010) to formulate an aquatic scoring method was
never compared to or scored using the Megyesi et al. (2005) method, results
from this study confirm that aquatic decomposition may not always follow a
specific sequence. The Heaton et al. (2010) method is best fit for the specific
study sample it was created for. Results indicate that additional alterations to the
aquatic scoring method should be considered when attempting to score cases
with extremely low or high ADD.

79
CHAPTER 6
CONCLUSIONS AND RECOMMENDATIONS The purpose of this study was to assess aquatic human decomposition in various
water temperatures and to understand how aquatic environments and various
water temperatures affect our ability to use body scoring methods by Megyesi et
al. (2005) and Heaton et al. (2010) to predict PMSI in an aqueous environment.
Results highlight broad findings of an abnormal pattern of aqueous human
decomposition in cold-water environments as well as the inability to use
decomposition scoring methods to predict short PMSIs and PMSIs with low ADD
calculations due to low water temperatures.
The results indicate that cold water submersion allows for certain
decomposition processes to occur as a result from retaining fluid, instead of
anaerobic decomposition. Bloating was noticed in cold-water cases as a result of
water retention and not from actual gaseous buildup. Constant exposure to cold
water allowed for features of decomposition such as skin slippage, hair slippage,
skin wrinkling, and degloving of the hands and/or feet to progress, while other
features of decomposition were halted or delayed. An overall trend in aquatic
decomposition can therefore not be predicted due to these issues as a result of
cooler water temperatures.
Overall, both decomposition scoring methods by Megyesi et al. (2005) and
Heaton et al. (2010) were able to predict ADD that were not significantly different

80
from the actual ADD calculated from water temperatures. While these methods
proved to be inaccurate for estimating short PMSIs and PMSIs with low ADD due
to cold water temperatures, they were more able to accurately predict PMSIs with
cumulative ADDs between 26°C and 99°C.
This study contributes valuable information to the field of anthropology as
well as medicolegal death investigation by providing additional research of PMSI
estimates to understand the accuracy of each method, as well as the
circumstantial nature of their applicability. More accurate methods of PMSIs and
the factors that can affect those estimates are deemed useful to forensic
scientists and law enforcement when solving homicide, accidental, and suicide
deaths and can aid in the process of human identification.
Most importantly, this study demonstrates the need for more accurate
decompositional scoring methods. The purpose of the research conducted by
Heaton et al. (2010) was to improve on the Megyesi et al. (2005) method and
alter the method to fit an aquatic environment. Results indicate that the Heaton et
al. (2010) method more accurately predicted PMSIs. However, this study
indicates the need for a more accurate method that understands the effects that
cold or freezing water submersion has on the decomposition process. The results
also indicate a need for more accurate decomposition scoring methods to predict
extended PMSIs or PMSIs with ADD over 100°C.
Future directions should continue to explore the effects water temperature
has on human the decomposition process. The Heaton et al. (2010) model

81
serves best to predict PMSIs of individuals submerged in warmer water
temperatures. This model could possibly be altered to consider body color
alterations due to cold or freezing temperatures and the other non-sequential
consequences listed above, such as skin slippage, hair slippage, and bloating
due to water retention instead of anaerobic decomposition.

82
BIBLIOGRAPHY

83
Alley, Olivia 2007 Aquatic Decomposition in Chlorinated and Freshwater Environments(May).
Amendt, J., M. Lee Goff, Carlo P. Campobasso, and Martin Grassberger
2010 Current Concepts in Forensic Entomology. Current Concepts in Forensic Entomology. http://www.springerlink.com/index/10.1007/978-1-4020-9684-6.
Anderson, Gail S.
2010 Decomposition and Invertebrate Colonization of Cadavers in Coastal Marine Environments. In Current Concepts in Forensic Entomology Pp. 223–272.
Ayers, Laura E 2010 Differential Decomposition in Terrestrial, Freshwater, and Saltwater Environments: A Pilot Study. http://ecommons.txstate.edu/anthroptad/24.
Bass, William M. II
1997 Outdoor Decomposition Rates in Tennessee. In Forensic Taphonomy: the Postmortem FAte of human Remains, edited by W.D. Haglund and M.H. Sorg, pp. 181-186. CRC Press, Boca Raton, FL.
Clark, Michael A, Michael B Worrell, and John E Pless
1997 Postmortem Changes in Soft Tissues. In Forensic Taphonomy: The Postmortem Fate of Human Remains, edited b W.D. Haglund and M.H. Sorg, pp. 151–170. CRC Press, Boca Raton, FL.
Cockle, Diane L, and Lynne S Bell
2015 Human Decomposition and the Reliability of a “Universal” Model for Post Mortem Interval Estimations. Forensic Science International.
De Donno, A., C. P. Campobasso, V. Santoro, et al.
2014 Bodies in Sequestered and Non-Sequestered Aquatic Environments: A Comparative Taphonomic Study Using Decompositional Scoring System. Science and Justice 54(6). Forensic Science Society: 439–446. http://dx.doi.org/10.1016/j.scijus.2014.10.003.
Forbes, Shari L., Matthew E A Wilson, and Barbara H. Stuart
2010 Examination of Adipocere Formation in a Cold Water Environment. International Journal of Legal Medicine 125(5): 643–650.
84
Galloway, a, W H Birkby, a M Jones, T E Henry, and B O Parks 1989 Decay Rates of Human Remains in an Arid Environment. Journal of Forensic Sciences 34: 607–616.
Haglund, William D
1993 Disappearance of Soft Tissue and the Disarticulation of Human Remains from Aqueous Environments. Human Remains from Aqueous Environments Journal of Forensic Sciences, JFSCA 3856(4): 806–81550. www.astm.org.
Heaton, Vivienne, Abigail Lagden, Colin Moffatt, and Tal Simmons
2010 Predicting the Postmortem Submersion Interval for Human Remains Recovered from U.K. Waterways. Journal of Forensic Sciences 55(2): 302–307.
Henssge, Claus, and Burkhard Madea
2007 Estimation of the Time since Death. Forensic Science International 165(2–3): 182–184.
Humphreys, Michael K., Edward Panacek, William Green, and Elizabeth Albers
2013 Comparison of Protocols for Measuring and Calculating Postmortem Submersion Intervals for Human Analogs in Fresh Water. Journal of Forensic Sciences 58(2): 513–517.
IBM CORP.
2016 SPSS Statistics for Macintosh, Version 22.0 Katz, Abbott
2010 Microsoft Excel 2010. Style (DeKalb, IL): 21–39. Klein, N.
2015 A comparative study of human decomposition research facilities in the United States: the role of “body farms” in forensic application. In American Academy of Forensic Sciences: 67th annual Scientifc Meeting, Orlando, FL.
Livingstone FB.
1962 On the non-existence of human races. Current Anthropology 3(3): 279.
Maddock, Shawn 2016 Personal Communication, July 11, 2016, Email. Oceanographer, User Services, Center for Operational Oceanographic Products and Services. Web: tidesandcurrents.noaa.gov
85
Mann, R W, W M Bass, and L Meadows 1990 Time since Death and Decomposition of the Human Body: Variables and Observations in Case and Experimental Field Studies. Journal of Forensic Sciences 35(1): 103–111.
Marks, M. K., Love, J. C., & Dadour, I. R.
2009 Taphonomy and time: estimating the postmortem interval. Hard Evidence: Case Studies in Forensic Anthropology, 165-178.
Mateus, M., and V. Vieira
2014 Study on the Postmortem Submersion Interval and Accumulated Degree Days for a Multiple Drowning Accident. Forensic Science International 238. Elsevier Ireland Ltd: e15–e19. http://dx.doi.org/10.1016/j.forsciint.2014.02.026.
Megyesi, Mary S, Stephen P Nawrocki, and Neal H Haskell
2005 Using Accumulated Degree-Days to Estimate the Postmortem Interval from Decomposed Human Remains. Journal of Forensic Sciences 50(3): 618–626.
Michaud, J.P., and Moreau, G.
2011 A statistical approach based on accumulated degree-days to predict decomposition-related processes in forensic studies. Journal of Forensic Sciences 56(1): 229-232.
Micozzi, Marc S. 1986 Experimental Study of Postmortem Change Under Field Conditions: Effects of Freezing, Thawing, and Mechanical Injury. Journal of Forensic Sciences 31(3):953-961.
NOAA’s National Weather Service
2015 National Data - NOAA’s National Weather Service. NOAA’s National Weather Service Website. http://www.nws.noaa.gov/view/national.php?thumbs=on.
O’Brien, Tyler G.
1994 Human Soft-Tissue Decomposition in an Aquatic Environment and its Transformation Into Adipocere. Unpublished, Master’s Thesis, University of Tennessee, Knoxville.
1997 Movement of Bodies in Lake Ontario. In Forensic Taphonomy: the Postmortem Fate of Human Remains, edited by W. D. Haglund and M. H. Sorg, pp. 559-565.CRC Press, Boca Raton, FL.

86
O’Brien, Tyler G., and Amy C. Kuehner 2007 Waxing Grave about Adipocere: Soft Tissue Change in an Aquatic Context. In Journal of Forensic Sciences Pp. 294–301.
Papadodima, S. A., S. A. Athanaselis, E. Skliros, and C. A. Spiliopoulou
2010 Forensic Investigation of Submersion Deaths. International Journal of Clinical Practice 64(1): 75–83.
Payne-James, J. Jason, Richard Jones, Steven B. Karch, and John Manlove
2011 Simpson’s Forensic Medicine. Hodder & Stoughton Ltd 13: 264. Payne, Jerry A, and Edwin W King
1972 Insect Succession and Decomposition of Pig Carcasses in Water. J. Georgia Entomol Soc 7(3): 153–162.
Petrik, M.S., Hobischak, N. R., and Anderson, G.
2004 Examination of Factors Surrounding Human Decomposition in Freshwater: A Review of Body Body Recoveries and Coroner Cases in British Columbia. Canadian Society of Forensic Science 37(1): 9–17.
Prahlow, Joseph
2010 Forensic Pathology for Police, Death Investigators, Attorneys, and Forensic Scientists. Forensic Pathology for Police, Death Investigators, Attorneys, and Forensic Scientists.
R Core Team
2013 R: a language and environment for statistical computing. R Foundation for Statistical Computing. Vienna, Austria. URL http://www.R-project.org/.
Rodriquez, W C
1997 Decomposition of Buried and Submerged Bodies. In Forensic Taphonomy Pp. 459–467.
Rodriguez, WC and WM Bass 1983 Insect Activity and its Relationship to Decay Rates of Human Cadavers in East Tennessee. Journal of Forensic Sciences 28(2): 423-432.
Schrader, Kristen
2016 Great Lakes Observing System. Personal Communication, July 7, 2016, Email.

87
Simmons, T., Adlam, R. E., & Moffatt, C. 2010 Debugging decomposition data—comparative taphonomic studies and the influence of insects and carcass size on decomposition rate. Journal of forensic sciences, 55(1), 8-13.
Smith, Ashley C.
2009 The Effect of Sharp-Force Thoracic Trauma on the Rate and Pattern or Decomposition. Journal of Forensic Sciences 59(2): 319-326.
Sorg, Marcella., John Dearborn, Elizabeth Monahan, Henry Ryan, Kristin Sweeny, and Edward David
1997 Forensic Taphonomy in Marine Contexts. In Forensic Taphonomy: the Postmortem Fate of Human Remains, edited by W. D. Haglund and M. H. Sorg, pp. 567-604.CRC Press, Boca Raton, FL.
Suckling, Joanna K., M. Katherine Spradley, and Kanya Godde
2016 A Longitudinal Study on Human Outdoor Decomposition in Central Texas. Journal of Forensic Sciences 61(1): 19–25.
Tomita, K.
1975 On Putrefactions and Flotations of Dead Bodies under Water. Hiroshima Journal of Medical Sciences.
U.S. Army Corps of Engineers
2017 Water Management. Electronic Document, http://www.mvp-wc.usace.army.mil/index.html, Accessed July 10, 2016-April 28, 2017.
Willey, P., & Falsetti, T.
1991 Inaccuracy of height information on driver's licenses. Journal of Forensic Science, 36(3), 813-819.
World Health Organization (WHO)
2016 Media Centre: Drowning. Electronic Document, http://www.who.int/mediacentre/factsheets/fs347/en/, Accessed October 18, 2016.

88
APPENDIX
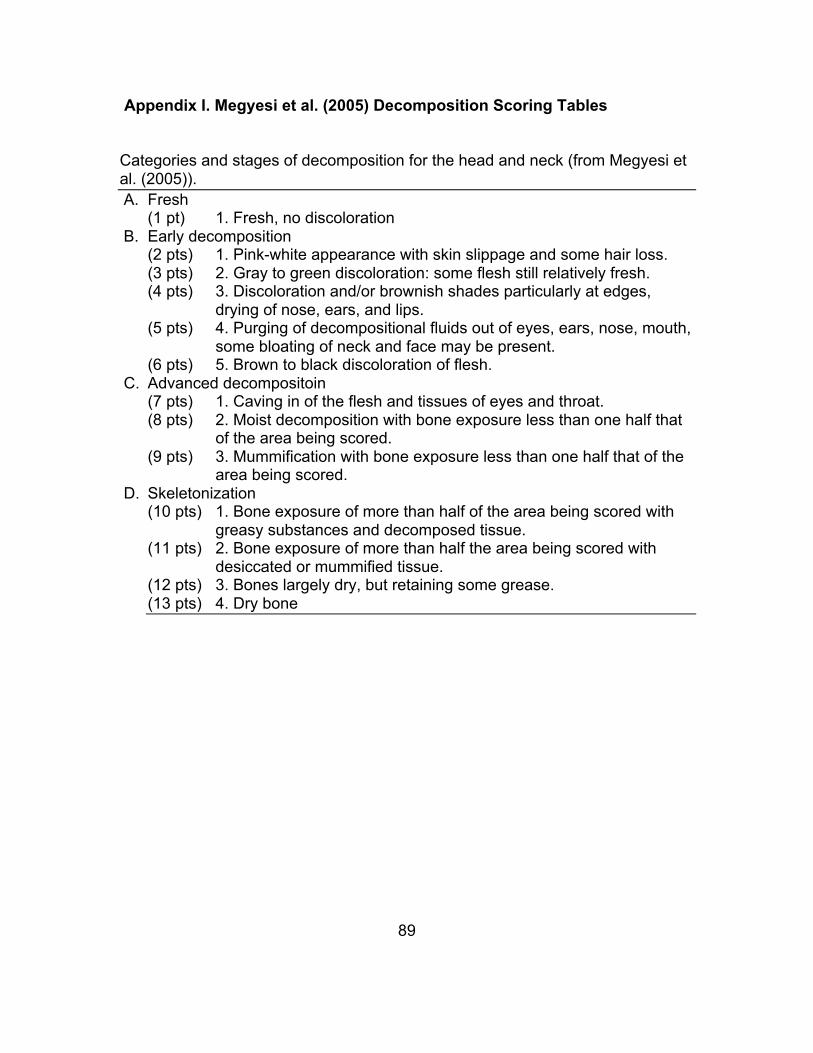
89
Appendix I. Megyesi et al. (2005) Decomposition Scoring Tables Categories and stages of decomposition for the head and neck (from Megyesi et al. (2005)). A. Fresh
(1 pt) 1. Fresh, no discoloration B. Early decomposition
(2 pts) 1. Pink-white appearance with skin slippage and some hair loss. (3 pts) 2. Gray to green discoloration: some flesh still relatively fresh. (4 pts) 3. Discoloration and/or brownish shades particularly at edges,
drying of nose, ears, and lips. (5 pts) 4. Purging of decompositional fluids out of eyes, ears, nose, mouth,
some bloating of neck and face may be present. (6 pts) 5. Brown to black discoloration of flesh.
C. Advanced decompositoin (7 pts) 1. Caving in of the flesh and tissues of eyes and throat. (8 pts) 2. Moist decomposition with bone exposure less than one half that
of the area being scored. (9 pts) 3. Mummification with bone exposure less than one half that of the
area being scored. D. Skeletonization
(10 pts) 1. Bone exposure of more than half of the area being scored with greasy substances and decomposed tissue.
(11 pts) 2. Bone exposure of more than half the area being scored with desiccated or mummified tissue.
(12 pts) 3. Bones largely dry, but retaining some grease. (13 pts) 4. Dry bone

90
Categories and stages of decomposition for the trunk (from Megyesi et al. (2005)). A. Fresh
(1 pt) 1. Fresh, no discoloration B. Early decomposition
(2 pts) 1. Pink-white appearance with skin slippage and marbling present. (3 pts) 2. Gray to green discoloration: some flesh still relatively fresh. (4 pts) 3. Bloating with green discoloration and purging of decompositional
fluids. (5 pts) 4. Postbloating following release of the abdominal gases, with
discoloration changing from green to black C. Advanced decompositoin
(6 pts) 1. Decomposition of tissue producing sagging of flesh; caving in of the abdominal cavity.
(7 pts) 2. Moist decomposition with bone exposure less than one half that of the area being scored.
(8 pts) 3. Mummification with bone exposure less than one half that of the area being scored.
D. Skeletonization (9 pts) 1. Bone with decomposed tissue, sometimes with body fluids and
grease still present. (10 pts) 2. Bones with desiccated or mummified tissue covering less than
one half of the area being scored. (11 pts) 3. Bones largely dry, but retaining some grease. (12 pts) 4. Dry bone.

91
Categories and stages of decomposition for the limbs (from Megyesi et al. (2005)). A. Fresh
(1 pt) 1. Fresh, no discoloration B. Early decomposition
(2 pts) 1. Pink-white appearance with skin slippage of hands and/or feet. (3 pts) 2. Gray to green discoloration: marbling: some flesh still relatively
fresh. (4 pts) 3. Discoloration and/or brownish shades particularly at edges,
drying of fingers, toes, and other projecting extremities. (5 pts) 4. Brown to black discoloration, skin having a leathery appearance.
C. Advanced decompositoin (6 pts) 1. Moist decomposition with bone exposure less than one half that
of the area being scored. (7 pts) 2. Mummification with bone exposure less than one half that of the
area being scored. D. Skeletonization
(8 pts) 1. Bone exposure over one half the area being scored, some decomposed tissue and body fluids remaining.
(9 pts) 2. Bones largely dry, but retaining some grease. (10 pts) 3. Dry bone.

92
Appendix II. Heaton et al. (2010) Decomposition Scoring Tables Descriptive stages for decomposition observed in the face and the assigned facial aquatic decompositional score (FADS) (from Heaton et al. (2010)).
(1 pt) No visible changes. (2 pts) Slight pink discoloration, darkened lips, goose pimpling. (3 pts) Reddening of face and neck, marbling visible on face, Possible
early signs of animal activity/predation-concentrated on the ears, nose, and lips.
(4 pts) Bloating of the face, green discoloraiton, skin beginning to slough off.
(5 pts) Head hair beginning to slough off-mostly at the front. Brain softening and becoming liquefied. Tissue becoming exposed on face and neck. Green/black discoloration.
(6 pts) Bone becoming exposed-concentrated over the orbital , frontal, and parietal regions. Some on the madible and maxilla. Early adipocere formation.
(7 pts) More extensive skeletization on the cranium. Disarticulation of mandible.
(8 pts) Complete disarticulation of the skull from torso. Extensive adipocere formation.
Descriptive stages for decomposition observed on the torso and the assigned body aquatic decompositional score (BADS) (from Heaton et al. (2010)).
(1 pt) No visible changes. (2 pts) Slight pink discoloration, goose pimpling. (3 pts) Yellow/green discoloration of the abdomen and upper chest.
Marbling. Internal organs beginning to decopose/autolysis. (4 pts) Dark green discoloration of abdomen, mild bloating of abdomen,
initial skin slippage. (5 pts) Green/purple discoloration, extensive abdominal bloating-tense to
touch, swollen scrotum in males, exposure of underlying fat and tissues.
(6 pts) Black discoloration, bloating becoming softer, initial exposure of internal orgnas and bones.
(7 pts) Further loss of tissues and organs, more bone exposed, initial adipocere formation.
(8 pts) Complete skeletonization and disarticulation.

93
Descriptive stages for decomposition observed in the limbs and the assigned limb aquatic decompositional score (LADS) (from Heaton et al. (2010)).
(1 pt) No visible changes. (2 pts) Mild wrinkling of skin on hands and/or feet. Possible goose
pimpling. (3 pts) Skin on palms of hands and/or soles of feet becoming white,
wrinkled, and thickened. Slight pink discoloration of arms and legs. (4 pts) Skin on palms of hands and/or soles of feet becoming soggy and
loose. Marbling of the limbs-predominantly on upper arms and legs. (5 pts) Skin on hands/feeting starting to slough off. Yellow/green to
green/black discoloraiton on arms and/or legs. Initial skin slippage on arms and/or legs.
(6 pts) Degloving of hands and/or feet-exposing large areas of underlying muscles and tendons. Patchy sloughing of skin on arms and/or legs.
(7 pts) Exposure of bones of hands and/or feet. Muscles, tendons, and small areas of bone exposed in lower arms and/or legs.
(8 pts) Bones of hands and/or feet beginning to disarticulate. Bones of upper arms and/or legs becoming exposed.
(9 pts) Complete skeltonization and disarticulation of limbs.

94
Appendix III. DATA
DE
CE
DE
NT
AC
TUA
L PM
SI
(DA
YS
)
AD
D
(C°)
SE
X
AG
E
ME
GY
ES
I
SC
OR
ES
TBS
HE
ATO
N
SC
OR
ES
TAD
S
ME
GY
ES
I A
DD
HE
ATO
N A
DD
ME
GY
ES
I P
MS
I (DA
YS
)
HE
ATO
N
PM
SI (D
AY
S)
HEN-1 68 63.5 F 47 6,5,5 16 5,6,4 15 209.8
9 254.09 110 106
HEN-2 26 274.33 F 23 6,4,4 14 4,5,4 13 159.2
2 140.56 9 7.0
HEN-3 1 18.55 M 41 1,1,1 3 1,1,1 3 67.3 7.28 3.6 0.4
HEN-4 7 122.94 M 47 5,5,5 15 5,4,5 14 181.9
7 188.98 7.1 8.0
HEN-5 3 74.39 M 20 1,2,1 4 3,3,3 9 69.5 43.01 2.9 1.8
HEN-6 74 121.11 M 21 3,3,3 9 5,3,4 12 93.76 104.54 43.5 41.2
HEN-7 4 98.17 F 20 3,4,3 10 4,4,4 16 102.3
3 341.63 4.4 4.4
HEN-8 1 24.72 M 26 1,1,1 3 2,1,1 4 67.3 9.79 2.7 0.4
HEN-9 57 96.61 M 52 3,4,3 10 5,4,5 14 102.3
3 181.98 76.5 101
HEN-10 13 51.56 M 22 2,2,2 6 5,2,3 10 76.21 57.83 N/A N/A
HEN-11 9 248.39 M 47 6,5,5 16 5,6,7 18 209.8
9 617.58 7.7 9.2
HEN-12 12 329.89 M 20 8,5,5 18 5,6,8 19 287.0
8 830.35 21 17.5
HEN-13 15 411.67 F 50 8,5,5 18 6,7,8 21 287.0
8 1501.0
5 17.5 22.3
HEN-14 1 25.28 M 50 1,1,1 3 1,1,1 3 67.3 7.28 2.7 0.3

95
HEN-15 2 27 M 55 1,1,1 3 2,2,2 6 67.3 17.70 4.9 1.3
HEN-16 1 18.83 M 14 1,1,1 3 1,1,2 4 67.3 9.79 3.6 0.5
HEN-17 5 102.61 M 46 5,4,4 13 4,4,5 13 140.6 140.56 5.2 7.0
HEN-18 3 73.28 M 23 5,4,3 12 5,4,5 14 125.3
1 188.98 3.5 3.6
HEN-19 4 97.67 M 41 5,4,3 12 5,4,5 14 125.3
1 188.98 4.8 4.5
HEN-20 6 154.83 M 45 5,4,4 13 5,5,5 15 140.6 254.09 6.2 7.2
HEN-21 1 0.39 F 39 1,1,1 3 2,2,2 6 67.3 17.70 172.6 18.7
HEN-22 258 1826.5 M 45 8,5,6 19 6,7,6 19 340.4
1 830.35 N/A N/A
HEN-23 7 105.06 M 24 5,4,3 12 4,6,5 15 125.3
1 254.09 6.3 3.8
HEN-24 26 394.22 M 21 10,7,6 23 6,6,6, 18 737.9 617.58 17.6 21.5
HEN-25 9 176.11 F 45 6,5,5 16 5,6,6 17 209.9 459.33 9.5 8.6
HEN-26 1 20.83 F 74 1,1,1 3 2,1,2 5 67.3 13.16 3.2 0.6
HEN-27 1 25.78 M 26 1,1,1 3 2,1,2 5 67.3 13.16 2.6 0.5
HEN-28 1 11.39 F 52 1,1,1 3 2,1,2 5 67.3 13.16 5.9 1.2
HEN-29 7 192.78 M 50 5,4,4 13 4,5,4 13 140.6 140.56 5.2 5.2
HEN-30 5 145 M 44 1,1,1 3 2,2,2 6 67.3 17.70 2.4 0.7
HEN-31 4 27.22 M 64 1,1,1 3 2,2,2 6 67.3 17.70 N/A N/A

96
HEN-32 13 182.67 M 19 6,5,5 16 5,5,6 16 209.9 341.63 15.2 8.9
HEN-33 1 18.89 M 53 1,1,1 3 2,2,2 6 67.3 17.70 3.6 0.9
HEN-34 2 43.89 M 67 1,2,2 4 3,2,4 9 69.5 43.01 3.3 2.0
HEN-35 2 46.11 M 20 1,1,1 3 2,2,3 7 67.3 23.79 2.9 1.0
HEN-36 1 2.39 M 54 1,1,1 3 2,2,1 5 67.3 13.61 28.2 3.0
HEN-37 16 424.28 F 16 6,4,4 14 5,5,4 14 159.2
2 188.98 11.6 17.0
HEN-38 35 475.89 M 19 10,7,6 24 7,6,7 20 181.9
7 1116.4 N/A N/A
HEN-39 8 177.56 M 35 6,4,4 14 4,5,4 13 159.2
2 140.56 9.4 8.4
HEN-40 4 103.11 M 42 6,4,5 15 5,5,5 15 181.9
7 254.09 6.3 5.5
HEN-41 3 0.1 M 37 1,1,1 3 3,2,2 7 67.3 273.79 N/A N/A
HEN-42 107 1729.9 M 39 6,5,5 16 5,6,5 16 209.8
9 341.63 14.4 19.4
LAX-1 3 82.78 M 6 5,4,3 12 4,4,5 13 125.3
1 140.56 4.1 3.8
LAX-2 1 20.56 M 72 1,1,1 3 1,1,1 3 67.3 7.28 3.3 0.4
LAX-3 1 21.67 F 72 1,1,1 3 2,2,3 7 67.3 23.79 3.1 1.1
LAX-4 126 35 M 27 5,4,4 13 4,3,4 11 140.6 77.75 N/A N/A
LAX-5 1 5.83 M 55 1,1,1 3 2,2,2 6 67.3 17.70 11.5 1.3
LAX-6 180 917.78 M 37 6,5,5 16 5,5,5 15 209.8
9 254.09 N/A N/A

97
LAX-7 6 47.78 M 21 1,1,1 3 2,2,2 6 67.3 17.70 8.3 2.8
LAX-8 4 92.22 M 23 5,4,3 12 4,4,5 13 125.3
1 140.56 5.5 4.5
LAX-9 2 0.1 F 21 1,1,1 3 1,1,1 3 67.3 7.28 N/A N/A
LAX-10 1 30.56 M 20 1,1,1 3 1,1,1 3 67.3 7.28 2.2 0.4
LAX-11 1 30.56 M 35 1,1,1 3 1,1,2 4 67.3 9.79 2.2 0.3
LAX-12 1 6011 M 45 1,1,1 3 1,1,2 4 67.3 9.79 11 0.2
LAX-13 1 26.11 M 15 1,1,1 3 1,1,2 4 67.3 9.79 2.6 0.4
LAX-14 3 42.22 M 21 3,3,3 9 4,4,4 12 93.76 104.54 2.7 0.3
LAX-15 119 21.67 M 22 6,4,3 13 5,5,5 15 140.6 254.09 145 147.5
LAX-16 82 87.78 M 24 3,4,3 10 5,4,4 13 102.3
3 140.56 N/A N/A
LAX-17 1 17.22 M 24 1,1,1 3 1,1,2 4 67.3 9.79 3.9 2.5
LAX-18 3 38.89 M 21 1,1,1 3 3,2,2 7 67.3 23.79 5.1 1.8
LAX-19 1 22.22 M 19 1,1,1 3 1,1,2 4 67.3 9.79 3.0 3.2
LAX-20 6 0.1 M 22 1,1,1 3 2,2,2 6 67.3 17.70 N/A N/A
MAN-1 1 20 F 1 1,1,1 3 1,1,1 3 67.3 7.28 3.4 2.2
MAN-2 1 21.67 M 24 1,1,1 3 1,1,1 3 67.3 7.28 3.1 2.3
MAN-3 1 11.11 M 18 1,1,1 3 1,1,2 4 67.3 9.79 6.1 1.6

98
MAN-4 1 20.56 F 71 1,1,1 3 1,1,2 4 67.3 9.49 3.3 3.0
MAN-5 1 18.89 M 39 1,1,1 3 1,1,2 4 67.3 9.79 3.6 2.8
MAN-6 38 32.5 M 19 6,4,5 15 5,4,5 14 181.9
7 188.98 N/A N/A
MAN-7 3 3.89 M 46 1,1,1 3 2,2,2 6 67.3 17.70 134 5.3
MAN-8 1 12.22 F 36 1,1,1 3 1,1,1 3 67.3 7.28 5.5 0.6
MAN-9 1 3.33 M 24 1,1,1 3 1,1,2 4 67.3 9.78 20.2 2.9
MAN-10 8 191.67 M 51 3,4,3 10 3,4,4 11 102.3
3 77.75 N/A N/A
MAN-11 64 0.1 M 21 5,4,3 12 5,4,4 13 125.3
1 140.56
+ N/A N/A
99
VITA
Amanda Rose Fink was born in Fond du Lac, Wisconsin, where she lived
until she graduated high school. She attended the University of Wisconsin- La
Crosse and obtained a Bachelor of Arts degree in organizational and
Professional Communication Studies, with a minor in Anthropology in 2012. She
also obtained a Bachelor of Science degree in Archaeology in 2014. In 2014 she
enrolled at the University of Tennessee Anthropology graduate school pursuing a
degree in biological anthropology while focusing on forensic anthropology.