Estimating growth in EPS: Deutsche Bank in January …adamodar/podcasts/cfspr16/Session25.pdf238...
21
238 Estimating growth in EPS: Deutsche Bank in January 2008 Aswath Damodaran 238 ¨ In 2007, Deutsche Bank reported net income of 6.51 billion Euros on a book value of equity of 33.475 billion Euros at the start of the year (end of 2006), and paid out 2.146 billion Euros as dividends. Return on Equity = Retention Ratio = ¨ If Deutsche Bank maintains the return on equity (ROE) and retention ratio that it delivered in 2007 for the long run: Expected Growth Rate Existing Fundamentals = 0.6703 * 0.1945 = 13.04% ¨ If we replace the net income in 2007 with average net income of $3,954 million, from 2003 to 2007: Normalized Return on Equity = Normalized Retention Ratio = Expected Growth Rate Normalized Fundamentals = 0.4572 * 0.1181 = 5.40% Net Income 2007 Book Value of Equity 2006 = 6,510 33,475 = 19.45% 1 − Dividends Net Income = 1 − 2,146 6,510 = 67.03% Average Net Income 2003-07 Book Value of Equity 2006 = 3,954 33,475 = 11.81% 1 − Dividends Net Income = 1 − 2,146 3,954 = 45.72%
Transcript of Estimating growth in EPS: Deutsche Bank in January …adamodar/podcasts/cfspr16/Session25.pdf238...

238
EstimatinggrowthinEPS:DeutscheBankinJanuary2008
Aswath Damodaran
238
¨ In2007,Deutsche Bankreportednetincome of6.51billionEurosonabookvalueofequityof33.475billionEurosatthestartoftheyear(endof2006),andpaidout2.146billion Eurosasdividends.
ReturnonEquity=
Retention Ratio=
¨ IfDeutsche Bankmaintains thereturnonequity(ROE)andretention ratiothat itdelivered in2007forthelongrun:
ExpectedGrowthRateExistingFundamentals=0.6703*0.1945=13.04%¨ Ifwereplacethenet incomein2007withaveragenet incomeof$3,954million,
from2003to2007:NormalizedReturnonEquity=NormalizedRetention Ratio=ExpectedGrowthRateNormalizedFundamentals=0.4572*0.1181=5.40%
€
Net Income2007
Book Value of Equity2006
=6,51033,475
=19.45%
€
1 −Dividends
Net Income=1 −
2,1466,510
= 67.03%
€
Average Net Income2003-07
Book Value of Equity2006
=3,95433,475
=11.81%
€
1 −Dividends
Net Income=1 −
2,1463,954
= 45.72%

239
EstimatinggrowthinNetIncome:TataMotors
Aswath Damodaran
239
Year Net IncomeCap Ex Depreciation Change in
WCChange in
DebtEquity
Reinvestment
Equity Reinvestment
Rate2008-09 -25,053₹ 99,708₹ 25,072₹ 13,441₹ 25,789₹ 62,288₹ -248.63%2009-10 29,151₹ 84,754₹ 39,602₹ -26,009₹ 5,605₹ 13,538₹ 46.44%2010-11 92,736₹ 81,240₹ 46,510₹ 50,484₹ 24,951₹ 60,263₹ 64.98%2011-12 135,165₹ 138,756₹ 56,209₹ 22,801₹ 30,846₹ 74,502₹ 55.12%2012-13 98,926₹ 187,570₹ 75,648₹ 680₹ 32,970₹ 79,632₹ 80.50%Aggregate 330,925₹ 592,028₹ 243,041₹ 61,397₹ 120,160₹ 290,224₹ 87.70%
Year NetIncomeBVofEquityatstartoftheyear ROE
2008-09 -25,053₹ 91,658₹ -27.33%2009-10 29,151₹ 63,437₹ 45.95%2010-11 92,736₹ 84,200₹ 110.14%2011-12 135,165₹ 194,181₹ 69.61%2012-13 98,926₹ 330,056₹ 29.97%Aggregate 330,925₹ 763,532₹ 43.34%
2013value
Averagevalues:2008-2013
Reinvestmentrate 80.50% 87.70%ROE 29.97% 43.34%Expectedgrowth 24.13% 38.01%

240
ROEandLeverage
Aswath Damodaran
240
¨ AhighROE,otherthingsremainingequal,shouldyieldahigherexpectedgrowthrateinequityearnings.
¨ TheROEforafirmisafunctionofboththequalityofitsinvestmentsandhowmuchdebtitusesinfundingtheseinvestments.Inparticular
ROE=ROC+D/E(ROC- i (1-t))where,
ROC=(EBIT(1- taxrate))/(BookValueofCapital)BVofCapital=BVofDebt+BVofEquity- CashD/E=Debt/Equityratioi =Interestrateondebtt=Taxrateonordinaryincome.

241
DecomposingROE
Aswath Damodaran
241
¨ Assumethatyouareanalyzingacompanywitha15%returnoncapital,anafter-taxcostofdebtof5%andabookdebttoequityratioof100%.EstimatetheROEforthiscompany.
¨ NowassumethatanothercompanyinthesamesectorhasthesameROEasthecompanythatyouhavejustanalyzedbutnodebt.Willthesetwofirmshavethesamegrowthratesinearningspershareiftheyhavethesamedividendpayoutratio?
¨ Willtheyhavethesameequityvalue?

242
EstimatingGrowthinEBIT:Disney
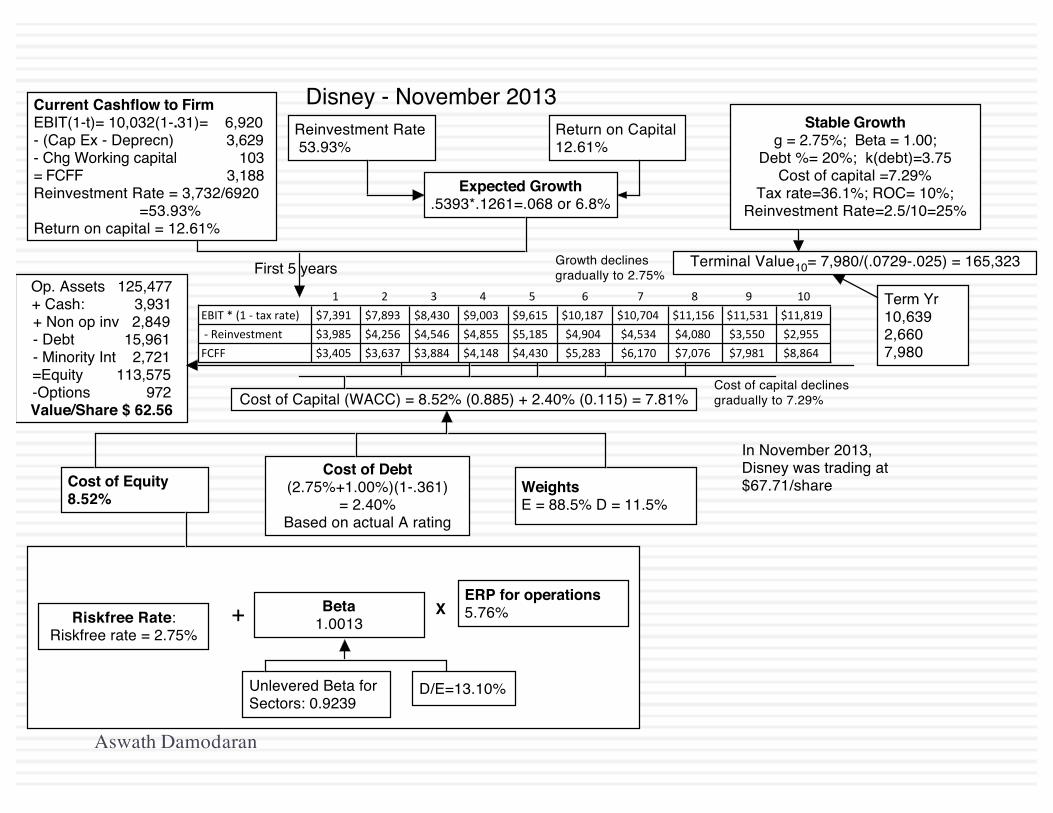
¨ Westartedwiththereinvestment ratethatwecomputedfromthe2013financialstatements:Reinvestment rate=Wecomputedthereinvestmentrateinprioryearstoensurethatthe2013valueswerenotunusualoroutliers.
¨ Wecompute thereturnoncapital,usingoperatingincome in2013andcapitalinvestedatthestartoftheyear:
ReturnonCapital2013 =
Disney’sreturnoncapitalhasimprovedgraduallyoverthelastdecadeandhaslevelledoffinthelasttwoyears.
¨ IfDisneymaintains its2013reinvestment rateandreturnoncapitalforthenextfiveyears, itsgrowthratewillbe6.80percent.ExpectedGrowthRatefromExistingFundamentals=53.93%*12.61%=6.8%
(3,629 + 103)10,032 (1-.3102)
= 53.93%
EBIT (1-t)(BV of Equity+ BV of Debt - Cash)
=10, 032 (1-.361)
(41,958+ 16,328 - 3,387)=12.61%
Aswath Damodaran

243
Wheneverythingisinflux:Changinggrowthandmargins
¨ Theelegantconnectionbetweenreinvestmentandgrowthinoperatingincomebreaksdown,whenyouhaveacompanyintransition,wheremarginsarechangingovertime.
¨ Ifthatisthecase,youhavetoestimatecashflowsinthreesteps:¤ Forecastrevenuegrowthandrevenues infutureyears,takingintoaccountmarketpotentialandcompetition.
¤ Forecasta“target”margininthefutureandapathwayfromcurrentmargins tothetarget.
¤ Estimatereinvestment fromrevenues, usingasales tocapitalratio(measuring thedollarsofrevenues yougetfromeachdollarofinvestment).
Aswath Damodaran
243
244
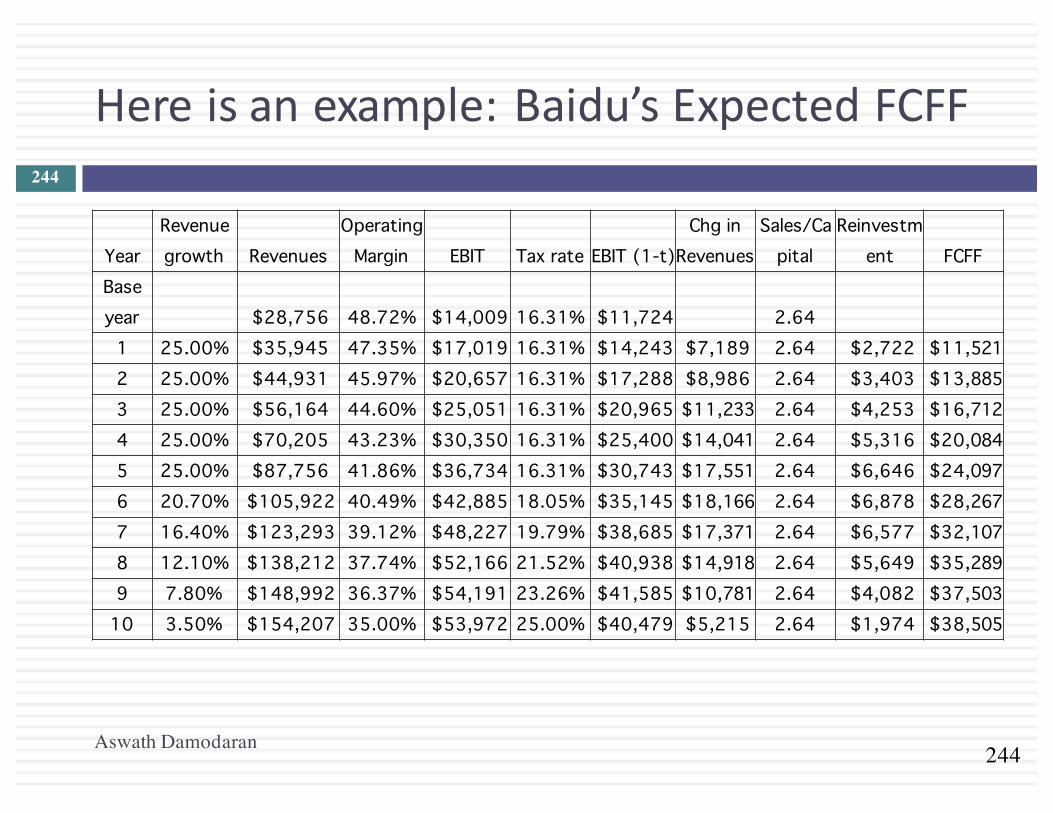
Hereisanexample:Baidu’sExpectedFCFF
Aswath Damodaran
244
YearRevenue growth Revenues
Operating Margin EBIT Tax rate EBIT (1-t)
Chg in Revenues
Sales/Capital
Reinvestment FCFF
Base year $28,756 48.72% $14,009 16.31% $11,724 2.64
1 25.00% $35,945 47.35% $17,019 16.31% $14,243 $7,189 2.64 $2,722 $11,521 2 25.00% $44,931 45.97% $20,657 16.31% $17,288 $8,986 2.64 $3,403 $13,885 3 25.00% $56,164 44.60% $25,051 16.31% $20,965 $11,233 2.64 $4,253 $16,712 4 25.00% $70,205 43.23% $30,350 16.31% $25,400 $14,041 2.64 $5,316 $20,084 5 25.00% $87,756 41.86% $36,734 16.31% $30,743 $17,551 2.64 $6,646 $24,097 6 20.70% $105,922 40.49% $42,885 18.05% $35,145 $18,166 2.64 $6,878 $28,267 7 16.40% $123,293 39.12% $48,227 19.79% $38,685 $17,371 2.64 $6,577 $32,107 8 12.10% $138,212 37.74% $52,166 21.52% $40,938 $14,918 2.64 $5,649 $35,289 9 7.80% $148,992 36.37% $54,191 23.26% $41,585 $10,781 2.64 $4,082 $37,503
10 3.50% $154,207 35.00% $53,972 25.00% $40,479 $5,215 2.64 $1,974 $38,505

245
IV.GettingClosureinValuation
Aswath Damodaran
245
¨ Sincewecannotestimatecashflowsforever, weestimatecashflowsfora“growthperiod” andthenestimateaterminalvalue, tocapturethevalueattheendoftheperiod:
¨ Whenafirm’scashflowsgrowata“constant” rateforever, thepresentvalueofthosecashflowscanbewrittenas:Value=ExpectedCashFlowNextPeriod/(r- g)where,
r=Discountrate(CostofEquityorCostofCapital)g=Expectedgrowth rateforever.
¨ This“constant” growthrateiscalledastablegrowthrateandcannotbehigherthanthegrowthrateoftheeconomyinwhichthefirmoperates.
Value = CFt
(1+r)t+
Terminal Value(1+r)N
t=1
t=N∑

246
Gettingtostablegrowth…
Aswath Damodaran
246
¨ Akeyassumption inalldiscounted cashflowmodels istheperiodofhighgrowth,andthepatternofgrowthduringthatperiod. Ingeneral,wecanmakeoneofthreeassumptions:¤ thereisnohighgrowth,inwhichcasethefirmisalreadyinstablegrowth¤ therewillbehighgrowthforaperiod,attheendofwhichthegrowthrate
willdroptothestablegrowthrate(2-stage)¤ therewillbehighgrowthforaperiod,attheendofwhichthegrowthrate
willdeclinegraduallytoastablegrowthrate(3-stage)¨ Theassumptionofhowlonghighgrowthwillcontinuewilldepend
uponseveralfactorsincluding:¤ thesizeofthefirm(largerfirm->shorterhighgrowthperiods)¤ currentgrowthrate(ifhigh->longerhighgrowthperiod)¤ barrierstoentryanddifferentialadvantages(ifhigh->longergrowth
period)

247
ChoosingaGrowthPeriod:Examples
Aswath Damodaran
247
Disney Vale Tata Motors Baidu Firm size/market size
Firm is one of the largest players in the entertainment and theme park business, but the businesses are being redefined and are expanding.
The company is one of the largest mining companies in the world, and the overall market is constrained by limits on resource availability.
Firm has a large market share of Indian (domestic) market, but it is small by global standards. Growth is coming from Jaguar division in emerging markets.
Company is in a growing sector (online search) in a growing market (China).
Current excess returns
Firm is earning more than its cost of capital.
Returns on capital are largely a function of commodity prices. Have generally exceeded the cost of capital.
Firm has a return on capital that is higher than the cost of capital.
Firm earns significant excess returns.
Competitive advantages
Has some of the most recognized brand names in the world. Its movie business now houses Marvel superheros, Pixar animated characters & Star Wars.
Cost advantages because of access to low-cost iron ore reserves in Brazil.
Has wide distribution/service network in India but competitive advantages are fading there.Competitive advantages in India are fading but Landrover/Jaguar has strong brand name value, giving Tata pricing power and growth potential.
Early entry into & knowledge of the Chinese market, coupled with government-imposed barriers to entry on outsiders.
Length of high-growth period
Ten years, entirely because of its strong competitive advantages/
None, though with normalized earnings and moderate excess returns.
Five years, with much of the growth coming from outside India.
Ten years, with strong excess returns.

Aswath Damodaran248
Valuing Vale in November 2013 (in US dollars)Let's start with some history & estimate what a normalized year will look like
Assume that the company is in stable growth, growing 2% a year in perpetuity
Estimate the costs of equity & capital for Vale
Business Sample,size
Unlevered,beta,of,business Revenues
Peer,Group,EV/Sales
Value,of,Business
Proportion,of,Vale
Metals'&'Mining 48 0.86 $9,013 1.97 $17,739 16.65%Iron'Ore 78 0.83 $32,717 2.48 $81,188 76.20%Fertilizers 693 0.99 $3,777 1.52 $5,741 5.39%Logistics 223 0.75 $1,644 1.14 $1,874 1.76%Vale,Operations 0.8440 $47,151 $106,543 100.00%
Market D/E = 54.99%Marginal tax rate = 34.00% (Brazil)Levered Beta = 0.844 (1+(1-.34)(.5499)) = 1.15Cost of equity = 2.75% + 1.15 (7.38%) = 10.87%
Year Operating+Income+($) Effective+tax+rate+ BV+of+Debt BV+of+Equity Cash Invested+capital Return+on+capital
2009 $6,057 27.79% $18,168 $42,556 $12,639 $48,085 9.10%
2010 $23,033 18.67% $23,613 $59,766 $11,040 $72,339 25.90%
2011 $30,206 18.54% $27,668 $70,076 $9,913 $87,831 28.01%
2012 $13,346 18.96% $23,116 $78,721 $3,538 $98,299 11.00%
2013+(TTM) $15,487 20.65% $30,196 $75,974 $5,818 $100,352 12.25%
Normalized $17,626 20.92% 17.25%
%"of"revenues ERPUS & Canada 4.90% 5.50%Brazil 16.90% 8.50%Rest of Latin America 1.70% 10.09%China 37.00% 6.94%Japan 10.30% 6.70%Rest of Asia 8.50% 8.61%Europe 17.20% 6.72%Rest of World 3.50% 10.06%Vale ERP 100.00% 7.38%Vale's rating: A-Default spread based on rating = 1.30%Cost of debt (pre-tax) = 2.75% + 1.30% = 4.05%
Cost of capital = 11.23% (.6452) + 4.05% (1-.34) (.3548) = 8.20%
!"#$%"&'("$'!!"#$ = ! !!"# = !
2%17.25% = 11.59%!
!"#$%!!"!!"#$%&'()!!""#$" = !17,626! 1− .2092 1− !. 1159. 082− .02 = $202,832!
Value of operating assets = $202,832+ Cash & Marketable Securities = $ 7,133- Debt = $ 42,879Value of equity = $167,086Value per share =$ 32.44Stock price (11/2013) = $ 13.57

249
EstimatingStablePeriodInputsafterahighgrowthperiod:Disney¨ Respect thecap:Thegrowthrateforeverisassumed tobe2.5.This isset lower
thantheriskfreerate(2.75%).¨ Stableperiodexcess returns:Thereturnoncapital forDisneywilldropfromits
highgrowthperiodlevelof12.61%toastablegrowthreturnof10%.This isstillhigherthanthecostofcapitalof7.29%butthecompetitive advantagesthatDisneyhasareunlikelytodissipate completely bytheendofthe10thyear.
¨ Reinvesttogrow:Basedontheexpected growthrateinperpetuity(2.5%)andexpected returnoncapital foreverafteryear10of10%,wecomputesastableperiodreinvestment rateof25%:¨ Reinvestment Rate=GrowthRate/ReturnonCapital =2.5%/10%=25%
¨ Adjustriskandcostofcapital: Thebetaforthestockwilldroptoone,reflectingDisney’sstatusasamaturecompany.
¤ CostofEquity=RiskfreeRate+Beta*RiskPremium=2.75%+5.76%=8.51%¤ ThedebtratioforDisneywillriseto20%.Sinceweassumethatthecostofdebtremains
unchangedat3.75%,thiswillresultinacostofcapitalof7.29%¤ Costofcapital=8.51%(.80)+3.75%(1-.361)(.20)=7.29%
Aswath Damodaran

250
V.Fromfirmvaluetoequityvaluepershare
Aswath Damodaran
250
Approach used To get to equity value per shareDiscount dividends per share at the cost of equity
Present value is value of equity per share
Discount aggregate FCFE at the cost of equity
Present value is value of aggregate equity. Subtract the value of equity options given to managers and divide by number of shares.
Discount aggregate FCFF at the cost of capital
PV = Value of operating assets+ Cash & Near Cash investments+ Value of minority cross holdings-Debt outstanding= Value of equity-Value of equity options =Value of equity in common stock/ Number of shares

251
ValuingDeutscheBankinearly2008
Aswath Damodaran
251
¨ TovalueDeutscheBank,westartedwiththenormalized incomeover theprevious fiveyears(3,954millionEuros)andthedividends in2008(2,146millionEuros).WeassumedthatthepayoutratioandROE,basedonthesenumberswillcontinueforthenext5years:¤ Payoutratio=2,146/3954=54.28%¤ Expectedgrowthrate=(1-.5428)*.1181=0.054or5.4%¤ Costofequity=9.23%

252
DeutscheBankinstablegrowth
Aswath Damodaran
252
¨ Attheendofyear5,thefirmisinstablegrowth.Weassumethatthecostofequitydropsto8.5%(as thebetamoves to1)andthatthereturnonequityalsodropsto8.5(toequalthecostofequity).StablePeriodPayoutRatio=1– g/ROE=1– 0.03/0.085=0.6471or64.71%ExpectedDividends inYear6=ExpectedNetIncome5 *(1+gStable)*StablePayoutRatio
=€5,143 (1.03)*0.6471=€3,427millionTerminalValue=
PVofTerminalValue=
¨ Valueofequity=€9,653+€40,079=€49,732millionEuros¨ Valueofequityper share=
Stockwastradingat89Eurospershareatthetimeoftheanalysis.
Expected Dividends6
(Cost of Equity-g)=
3,247(.085-.03)
= 62,318 million Euros
Terminal Valuen
(1+Cost of EquityHigh growth )n=
62,318(1.0923)5 = 40, 079 mil Euros
Value of Equity# Shares
=49,732474.2
=104.88 Euros/share

253
ValuingDeutscheBankin2013
Aswath Damodaran
253
Current 1 2 3 4 5 Steady stateRisk Adjusted Assets (grows 3% a year for next 5 years) 439,851 € 453,047 € 466,638 € 480,637 € 495,056 € 509,908 € 517,556 €Tier 1 Capital ratio (increases from 15.13% to 18.00% over next 5 years 15.13% 15.71% 16.28% 16.85% 17.43% 18.00% 18.00%Tier 1 Capital (Risk Adjusted Assets * Tier 1 Capital Ratio) 66,561 € 71,156 € 75,967 € 81,002 € 86,271 € 91,783 € 93,160 €
Change in regulatory capital (Tier 1) 4,595 € 4,811 € 5,035 € 5,269 € 5,512 € 1,377 €Book Equity 76,829 € 81,424 € 86,235 € 91,270 € 96,539 € 102,051 € 103,605 €
ROE (expected to improve from -1.08% to 8.00% in year 5) -1.08% 0.74% 2.55% 4.37% 6.18% 8.00% 8.00%Net Income (Book Equity * ROE) -716 € 602 € 2,203 € 3,988 € 5,971 € 8,164 € 8,287 €- Investment in Regulatory Capital 4,595 € 4,811 € 5,035 € 5,269 € 5,512 € 1,554 €FCFE -3,993 € -2,608 € -1,047 € 702 € 2,652 € 6,733 €Terminal value of equity 103,582.19 €Present value -3,669.80 € -2,202.88 € -812.94 € 500.72 € 69,671.28 €Cost of equity 8.80% 8.80% 8.80% 8.80% 8.80% 8.80% 8.00%Value of equity today = 63,486.39 €Number of shares outstanding = 1019.50Value per share = 62.27 €Stock price in November 2013 = 35.46 €

254
ValuingTataMotorswithaFCFEmodelinNovember2013:Thehighgrowthperiod
Aswath Damodaran
254
¨ Weusetheexpectedgrowthrateof24.13%,estimatedbaseduponthe2013valuesforROE(29.97%)andequityreinvestmentrate(80.5%):¨ Expectedgrowthrate=29.97%*80.5%=24.13%
¨ ThecostofequityforTataMotorsis13.50%:Costofequity==6.57%+0.964(7.19%)=13.50%
¨ TheexpectedFCFEforthehighgrowthperiod
Current 1 2 3 4 5Expectedgrowthrate 24.13% 24.13% 24.13% 24.13% 24.13%NetIncome 98,926₹ 122,794₹ 152,420₹ 189,194₹ 234,841₹ 291,500₹EquityReinvestmentRate 80.50% 80.50% 80.50% 80.50% 80.50% 80.50%EquityReinvestment 79,632₹ 98,845₹ 122,693₹ 152,295₹ 189,039₹ 234,648₹
FCFE 19,294₹ 23,949₹ 29,727₹ 36,899₹ 45,802₹ 56,852₹[email protected]% 21,100₹ 23,075₹ 25,235₹ 27,597₹ 30,180₹
Sum of PV of FCFE = 127,187₹

255
Stablegrowthandvalue….
Aswath Damodaran
255
¨ Afteryearfive,wewillassumethatthebetawillincrease to1andthattheequityriskpremiumwilldecline to6.98%percent (asthecompanybecomesmoreglobal).Theresultingcostofequityis13.55percent.CostofEquityinStableGrowth=6.57%+1(6.98%)=13.55%
¨ Wewillassumethatthegrowthinnetincomewilldropto6%andthatthereturnonequitywilldropto13.55%(whichisalsothecostofequity).EquityReinvestmentRateStableGrowth=6%/13.55%=44.28%FCFEinYear6=₹291,500(1.06)(1 – 0.4428)=₹ 136,822millionTerminalValueofEquity=₹136,822/(0.1355 – 0.06)=₹ 2,280,372million
¨ TovalueequityinthefirmtodayValueofequity=PVofFCFEduringhighgrowth+PVofterminalvalue
=₹127,187+2,280,372/1.13555 =₹742,008 million¤Dividingby2694.08million sharesyieldsavalueofequitypershareof₹275.42,about40%lowerthanthestockpriceof₹427.85 pershare.

Aswath Damodaran256
Term yrEBIT (1-t) 41,896- Reinv 9.776FCFF 32,120
Terminal Value10= 32,120/(.10-035) = ¥494,159
Cost of capital = 12.91% (.9477) + 3.45% (.0523) = 12.42%
Unlevered Beta for Businesses: 1.30
ERP6.94%
Operating assets ¥291,618+ Cash 43,300- Debt 20,895Value of equity 314,023/ No of shares 2088.87 Value/share ¥150.33
Cost of Debt(3.5%+0.8%+0.3%)(1-.25) = 3.45%
Cost of Equity12.91%
Stable Growthg = 3.5%
Cost of capital = 10% ROC= 15%;
Reinvestment Rate=3.5%/15% = 23.33%
WeightsE = 94.77% D = 5.23%
Riskfree Rate:Riskfree rate = 3.5% +
Beta 1.356 X
In November 2013, the stock was trading at ¥160.06 per share.
Cost of capital decreases to 10% from years 6-10
D/E=5.52%
Baidu: My valuation (November 2013)Revenue
growth of 25% a year for 5 years, tapering down to 3.5% in year
10
Pre-tax operating
margin decreases to
35% over time
Sales to capital ratio
maintained at 2.64 (current
level)
1 3 3 4 5 6 7 8 9 10Revenue growth 25.00% 25.00% 25.00% 25.00% 25.00% 20.70% 16.40% 12.10% 7.80% 3.50%Revenues ¥35,945 ¥44,931 ¥56,164 ¥70,205 ¥87,756 ¥105,922 ¥123,293 ¥138,212 ¥148,992 ¥154,207Operating Margin 47.35% 45.97% 44.60% 43.23% 41.86% 40.49% 39.12% 37.74% 36.37% 35.00%EBIT ¥17,019 ¥20,657 ¥25,051 ¥30,350 ¥36,734 ¥42,885 ¥48,227 ¥52,166 ¥54,191 ¥53,972Tax rate 16.31% 16.31% 16.31% 16.31% 16.31% 18.05% 19.79% 21.52% 23.26% 25.00%EBIT (1-t) ¥14,243 ¥17,288 ¥20,965 ¥25,400 ¥30,743 ¥35,145 ¥38,685 ¥40,938 ¥41,585 ¥40,479 - Reinvestment ¥2,722 ¥3,403 ¥4,253 ¥5,316 ¥6,646 ¥6,878 ¥6,577 ¥5,649 ¥4,082 ¥1,974FCFF ¥11,521 ¥13,885 ¥16,712 ¥20,084 ¥24,097 ¥28,267 ¥32,107 ¥35,289 ¥37,503 ¥38,505
Last%12%months Last%yearRevenues ¥28,756 ¥22,306Operating income or EBIT ¥14,009 ¥11,051Operating Margin 48.72% 49.54%Revenue Growth 28.92%Sales/Capital Ratio 2.64

257
Disney:InputstoValuation
High Growth Phase Transition Phase Stable Growth Phase
Length of Period 5 years 5 years Forever after 10 years
Tax Rate 31.02% (Effective)
36.1% (Marginal)
31.02% (Effective)
36.1% (Marginal)
31.02% (Effective)
36.1% (Marginal)
Return on Capital 12.61% Declines linearly to 10% Stable ROC of 10%
Reinvestment Rate
53.93% (based on normalized
acquisition costs)
Declines gradually to 25%
as ROC and growth rates
drop:
25% of after-tax operating
income.
Reinvestment rate = g/ ROC
= 2.5/10=25%
Expected Growth
Rate in EBIT
ROC * Reinvestment Rate =
0.1261*.5393 = .068 or 6.8%
Linear decline to Stable
Growth Rate of 2.5%
2.5%
Debt/Capital Ratio 11.5% Rises linearly to 20.0% 20%
Risk Parameters Beta = 1.0013, ke = 8.52%%
Pre-tax Cost of Debt = 3.75%
Cost of capital = 7.81%
Beta changes to 1.00;
Cost of debt stays at 3.75%
Cost of capital declines
gradually to 7.29%
Beta = 1.00; ke = 8.51%
Cost of debt stays at 3.75%
Cost of capital = 7.29%
Aswath Damodaran
Aswath Damodaran
Term Yr10,6392,6607,980
Terminal Value10= 7,980/(.0729-.025) = 165,323
Cost of Capital (WACC) = 8.52% (0.885) + 2.40% (0.115) = 7.81%
Return on Capital12.61%
Reinvestment Rate 53.93%
Unlevered Beta for Sectors: 0.9239
ERP for operations5.76%Beta
1.0013Riskfree Rate:Riskfree rate = 2.75%
Op. Assets 125,477+ Cash: 3,931+ Non op inv 2,849- Debt 15,961- Minority Int 2,721=Equity 113,575-Options 972Value/Share $ 62.56
WeightsE = 88.5% D = 11.5%
Cost of Debt(2.75%+1.00%)(1-.361)
= 2.40%Based on actual A rating
Cost of Equity8.52%
Stable Growthg = 2.75%; Beta = 1.00;
Debt %= 20%; k(debt)=3.75Cost of capital =7.29%
Tax rate=36.1%; ROC= 10%; Reinvestment Rate=2.5/10=25%
Expected Growth .5393*.1261=.068 or 6.8%
Current Cashflow to FirmEBIT(1-t)= 10,032(1-.31)= 6,920- (Cap Ex - Deprecn) 3,629 - Chg Working capital 103= FCFF 3,188Reinvestment Rate = 3,732/6920
=53.93%Return on capital = 12.61%
+ X
Disney - November 2013
In November 2013, Disney was trading at $67.71/share
First 5 years
D/E=13.10%
1 2 3 4 5 6 7 8 9 10EBIT/*/(1/2/tax/rate) $7,391 $7,893 $8,430 $9,003 $9,615 $10,187 $10,704 $11,156 $11,531 $11,819/2/Reinvestment $3,985 $4,256 $4,546 $4,855 $5,185 $4,904 $4,534 $4,080 $3,550 $2,955FCFF $3,405 $3,637 $3,884 $4,148 $4,430 $5,283 $6,170 $7,076 $7,981 $8,864
Growth declines gradually to 2.75%
Cost of capital declines gradually to 7.29%