Establishment of reference intervals of clinical chemistry ...
13
Clin Chem Lab Med 2016; 54(5): 843–855 *Corresponding author: Anwar Borai, PhD, King Abdullah International Medical Research Center, King Saud Bin Abdulaziz University for Health Sciences, Pathology, King Abdulaziz Medical City, P. O. Box 9515, Jeddah 21423, Saudi Arabia, E-mail: [email protected] Kiyoshi Ichihara: Faculty of Health Sciences, Department of Clinical Laboratory Sciences, Yamaguchi University Graduate School of Medicine Minamikogushi 1-1-1, Ube 755 8505, Japan Abdulaziz Al Masaud: King Abdullah International Medical Research Center, King Saud bin Abdulaziz University for Health Sciences, Pathology, King Abdulaziz Medical City, Hassa, Saudi Arabia Waleed Tamimi and Nawaf Otaibi: King Abdullah International Medical Research Center, King Saud bin Abdulaziz University for Health Sciences, Pathology, King Abdulaziz Medical City, Riyadh, Saudi Arabia Suhad Bahijri: Faculty of Medicine, Department of Clinical Biochemistry, King Abdulaziz University, Jeddah, Saudi Arabia David Armbuster: Global Scientific Affairs, Abbott Diagnostics, Chicago, IL, USA Ali Bawazeer, Mustafa Nawajha, Haitham Khalil, Ibrahim Kaddam and Mohamed Abdelaal: King Abdullah International Medical Research Center, King Saud bin Abdulaziz University for Health Sciences, Pathology, King Abdulaziz Medical City, Jeddah, Saudi Arabia Reo Kawano: Faculty of Health Sciences, Yamaguchi University Graduate School of Medicine, Ube, Japan Anwar Borai*, Kiyoshi Ichihara, Abdulaziz Al Masaud, Waleed Tamimi, Suhad Bahijri, David Armbuster, Ali Bawazeer, Mustafa Nawajha, Nawaf Otaibi, Haitham Khalil, Reo Kawano, Ibrahim Kaddam and Mohamed Abdelaal, on behalf of the Committee on Reference Intervals and Decision Limits, International Federation for Clinical Chemistry and Laboratory Medicine Establishment of reference intervals of clinical chemistry analytes for the adult population in Saudi Arabia: a study conducted as a part of the IFCC global study on reference values DOI 10.1515/cclm-2015-0490 Received May 23, 2015; accepted August 26, 2015; previously published online October 30, 2015 Abstract Background: This study is a part of the IFCC-global study to derive reference intervals (RIs) for 28 chemistry ana- lytes in Saudis. Method: Healthy individuals (n =826) aged ≥18 years were recruited using the global study protocol. All specimens were measured using an Architect analyzer. RIs were derived by both parametric and non-parametric methods for comparative purpose. The need for secondary exclu- sion of reference values based on latent abnormal values exclusion (LAVE) method was examined. The magnitude of variation attributable to gender, ages and regions was cal- culated by the standard deviation ratio (SDR). Sources of variations: age, BMI, physical exercise and smoking levels were investigated by using the multiple regression analysis. Results: SDRs for gender, age and regional differences were significant for 14, 8 and 2 analytes, respectively. BMI-related changes in test results were noted conspicu- ously for CRP. For some metabolic related parameters the ranges of RIs by non-parametric method were wider than by the parametric method and RIs derived using the LAVE method were significantly different than those without it. RIs were derived with and without gender partition (BMI, drugs and supplements were considered). Conclusions: RIs applicable to Saudis were established for the majority of chemistry analytes, whereas gender, regional and age RI partitioning was required for some analytes. The elevated upper limits of metabolic analytes reflects the existence of high prevalence of metabolic syn- drome in Saudi population. Keywords: Architect; C-RIDL; IFCC; multicenter study; ref- erence interval; Saudi population. List of abbreviations: 3N-ANOVA, three-level-nested ANOVA; Alb, albumin; ALP, alkaline phosphatase; ALT, alanine aminotransferase; Amy, amylase; AST, aspartate aminotransferase; BMI, body mass index; Ca, calcium; CDL, clinical decision limit; CK, creatine kinase; CI, confidence interval; Cl, chloride; CLSI, Clinical and Labo- ratory Standards Institute; CRE, creatinine; C-RIDL, Com- mittee on Reference Intervals and Decision Limits; CRP, C-reactive protein; CV(b), CV of the regression slope b; Fe, iron; GGT, gamma-glutamyltransferase; Glu, glucose; HDL-C, HDL-cholesterol; IP, inorganic phosphate; K, potassium; LAVE, latent abnormal values exclusion; LDH, lactate dehydrogenase; LDL-C, LDL-cholesterol; LL, lower
Transcript of Establishment of reference intervals of clinical chemistry ...
Clin Chem Lab Med 2016; 54(5): 843–855
*Corresponding author: Anwar Borai, PhD, King Abdullah International Medical Research Center, King Saud Bin Abdulaziz University for Health Sciences, Pathology, King Abdulaziz Medical City, P. O. Box 9515, Jeddah 21423, Saudi Arabia, E-mail: [email protected] Ichihara: Faculty of Health Sciences, Department of Clinical Laboratory Sciences, Yamaguchi University Graduate School of Medicine Minamikogushi 1-1-1, Ube 755 8505, JapanAbdulaziz Al Masaud: King Abdullah International Medical Research Center, King Saud bin Abdulaziz University for Health Sciences, Pathology, King Abdulaziz Medical City, Hassa, Saudi ArabiaWaleed Tamimi and Nawaf Otaibi: King Abdullah International Medical Research Center, King Saud bin Abdulaziz University for Health Sciences, Pathology, King Abdulaziz Medical City, Riyadh, Saudi ArabiaSuhad Bahijri: Faculty of Medicine, Department of Clinical Biochemistry, King Abdulaziz University, Jeddah, Saudi ArabiaDavid Armbuster: Global Scientific Affairs, Abbott Diagnostics, Chicago, IL, USAAli Bawazeer, Mustafa Nawajha, Haitham Khalil, Ibrahim Kaddam and Mohamed Abdelaal: King Abdullah International Medical Research Center, King Saud bin Abdulaziz University for Health Sciences, Pathology, King Abdulaziz Medical City, Jeddah, Saudi ArabiaReo Kawano: Faculty of Health Sciences, Yamaguchi University Graduate School of Medicine, Ube, Japan
Anwar Borai*, Kiyoshi Ichihara, Abdulaziz Al Masaud, Waleed Tamimi, Suhad Bahijri, David Armbuster, Ali Bawazeer, Mustafa Nawajha, Nawaf Otaibi, Haitham Khalil, Reo Kawano, Ibrahim Kaddam and Mohamed Abdelaal, on behalf of the Committee on Reference Intervals and Decision Limits, International Federation for Clinical Chemistry and Laboratory Medicine
Establishment of reference intervals of clinical chemistry analytes for the adult population in Saudi Arabia: a study conducted as a part of the IFCC global study on reference values
DOI 10.1515/cclm-2015-0490Received May 23, 2015; accepted August 26, 2015; previously published online October 30, 2015
Abstract
Background: This study is a part of the IFCC-global study to derive reference intervals (RIs) for 28 chemistry ana-lytes in Saudis.Method: Healthy individuals (n = 826) aged ≥ 18 years were recruited using the global study protocol. All specimens were measured using an Architect analyzer. RIs were derived by both parametric and non-parametric methods for comparative purpose. The need for secondary exclu-sion of reference values based on latent abnormal values exclusion (LAVE) method was examined. The magnitude of
variation attributable to gender, ages and regions was cal-culated by the standard deviation ratio (SDR). Sources of variations: age, BMI, physical exercise and smoking levels were investigated by using the multiple regression analysis.Results: SDRs for gender, age and regional differences were significant for 14, 8 and 2 analytes, respectively. BMI-related changes in test results were noted conspicu-ously for CRP. For some metabolic related parameters the ranges of RIs by non-parametric method were wider than by the parametric method and RIs derived using the LAVE method were significantly different than those without it. RIs were derived with and without gender partition (BMI, drugs and supplements were considered).Conclusions: RIs applicable to Saudis were established for the majority of chemistry analytes, whereas gender, regional and age RI partitioning was required for some analytes. The elevated upper limits of metabolic analytes reflects the existence of high prevalence of metabolic syn-drome in Saudi population.
Keywords: Architect; C-RIDL; IFCC; multicenter study; ref-erence interval; Saudi population.
List of abbreviations: 3N-ANOVA, three-level-nested ANOVA; Alb, albumin; ALP, alkaline phosphatase; ALT, alanine aminotransferase; Amy, amylase; AST, aspartate aminotransferase; BMI, body mass index; Ca, calcium; CDL, clinical decision limit; CK, creatine kinase; CI, confidence interval; Cl, chloride; CLSI, Clinical and Labo-ratory Standards Institute; CRE, creatinine; C-RIDL, Com-mittee on Reference Intervals and Decision Limits; CRP, C-reactive protein; CV(b), CV of the regression slope b; Fe, iron; GGT, gamma-glutamyltransferase; Glu, glucose; HDL-C, HDL-cholesterol; IP, inorganic phosphate; K, potassium; LAVE, latent abnormal values exclusion; LDH, lactate dehydrogenase; LDL-C, LDL-cholesterol; LL, lower

844 Borai et al.: Reference interval study in Saudi Arabia
limit; MRA, multiple regression analysis; Me, median; Mg, magnesium; Na, sodium; NP, non- parametric; P, par-ametric; RI, reference interval; RMP, reference measure-ment procedure; rp, partial correlation coefficient; SDR, standard deviation ratio; SV, sources of variation; TBil, total bilirubin; TC, total cholesterol; TG, triglycerides; TP, total protein; TRF, transferrin; UA, uric acid; UIBC, unsat-urated iron binding capacity; UL, upper limit
IntroductionThe reference interval (RI) is used to interpret laboratory test results and defines the common range of values from healthy individuals. Reference intervals are of great rel-evance as a guide in clinical management of patients [1] especially when specific clinical decision limits (CDLs) or medical decision levels (MDLs), are not available. There-fore, appropriate RIs, ideally derived from the expected patient population to be served by the laboratory, must be provided to the clinicians. Each laboratory is required to verify the RIs regularly. Differences may be seen in the RIs depending on populations living under different environ-mental and dietary conditions [2]. However, to date there has been no study exploring possible regional differences in reference values for the Saudi population. The guideline for deriving reference intervals (C28-A3) was published by the Clinical and Laboratory Standards Institute (CLSI) in 2008 [3]. The International Federation of Clinical Chemis-try and Laboratory Medicine (IFCC) recommends follow-ing established guidelines, specifically CLSI C28, a joint CLSI and IFCC document, for defining RIs by each labora-tory using realistic routine conditions [4]. The derivation of reference intervals by each laboratory is not feasible. Therefore, most laboratories utilize reference intervals supplied by in vitro diagnostic manufacturers, but these intervals may be dated, method specific, or not suitable for a given patient population. Deriving RIs by conduct-ing a multicenter study that follows a common protocol established by an international organization is desirable.
The effect of ethnicity on RIs and whether separate RIs should be derived for each ethnic group when specific analytical procedures are applied must be considered. If appropriately detailed data is collected, separate refer-ence intervals may be required based on the ethnicity [5].
The RIs for many different common analytes in healthy Saudi individuals were investigated previously [6–9]. The most comprehensive study investigated RIs for general chemistry analytes was published by EL Hazmi in 1982 [10]. Twenty-five biochemical tests were investigated
in young adults (20–29 years). In the same study compari-son of the results obtained for Saudis with those reported for Western populations was shown to be different for the majority of the tests. Although the study was conducted without well-defined criteria for recruitment, it was one of the first attempts to derive RIs for chemistry analytes in the Saudi population.
This study is important because it is part of the inter-national multi-center project led by the Committee on Reference Intervals and Decision Limits (C-RIDL) of the IFCC and its standard protocol. Other collaborating coun-tries include the USA, Turkey, Japan, the UK, China, India, South Africa, Argentina, Russia, the Philippines, Nepal, Pakistan, Kenya, Nigeria, and Bangladesh, listed in the order in which these countries joined the C-RIDL initia-tive. The study also includes a large number of common tests (28 analytes reported here; and an additional 20 immunoassay analytes to be reported later). In addi-tion to this, up-to-date analytical methods and the latest automated instruments have been utilized for measure-ment. The population involved in this study represents the only Arabs and the only population with no alcohol intake. Thus the results provide an unique opportunity to compare Saudi RIs with those from countries of with widely different demographic profiles in terms of typical partitioning factors, e.g. BMI, alcohol intake and smoking. The study also provides an opportunity to investigate the controversies over the need for secondary exclusion of individuals by use of the latent abnormal values exclusion (LAVE) method [11, 12] and the use of parametric and non-parametric methods for derivation of RIs.
The main goal of this study is to derive country spe-cific RIs for the adult Saudi population utilizing the common protocol proposed by the C-RIDL [13]. The study contributes to the IFCC C-RIDL global project and to the Saudi population in particular.
Materials and methodsStudy population
Suitable subjects were selected according to the criteria described below were recruited from the healthy Saudi population. All subjects were Saudis regardless of their ethnic origins but original inhabitants of the Arabian Peninsula were preferred in recruitment. Subjects were asked to complete the questionnaire described below and asked to return it before participation. The study is a multi-center study involving three different regions of the Kingdom: the western region; represented by the two largest cities; Jeddah and Makkah, the central region; represented by the capital city; Riyadh and the eastern region; represented by Hassa and Dammam. The regions

Borai et al.: Reference interval study in Saudi Arabia 845
were selected for their highest density of Saudi residents compared to other regions (~65%). The questionnaire items were adapted from the one used in the previous Asian project [14], but modified accord-ing to Saudi local needs. In each region the healthy subjects were recruited from different professions. The centralized measurement scheme was adopted to eliminate variations attributable to differ-ences in analytical methods. Therefore, the Jeddah laboratory acted as the central laboratory for receiving and processing samples, and carrying out the assays collectively. Body mass index (BMI) was cal-culated by dividing the weight in kilograms by the height in meters squared (kg/m2). The study was approved by King Abdullah Inter-national Medical Research Center, Research Ethics Committee, King Abdulaziz Medical City, Jeddah, Saudi Arabia (Study number RCJ0212-209).
Inclusion and exclusion criteria
The same inclusion and exclusion criteria described in the C-RIDL protocol [13] were applied with some modification to cope with the Saudi population. The participants were subjectively feeling well, between the ages of 18 and 65 and ideally they were not taking any medication or supplements but if they were under any of medication names, doses and frequency were recorded. The participants were excluded if any of the following was applied: if he or she was dia-betic and on oral therapy or insulin, history of chronic liver or kidney disease, had results from their blood samples that clearly point to a severe disease, had been a hospital in-patient or been subjectively seriously ill during the previous 4 weeks of participation, donated blood in the previous 3 months, he or she was known carrier state of HBV, HCV, or HIV, if she was pregnant or within one year after childbirth and if he or she had participated in another research study involving an investigational product in the past 12 weeks.
For analysis of sources of variation (SV) for each analyte, a health status survey was conducted via the questionnaire according to the common protocol to obtain information on BMI, ABO blood type, eat-ing patterns, exercise, recent episodes of infection or allergy, menstrual status, and other factors. Written informed consent was obtained from each volunteer. The collected specimens, the test results, and ques-tionnaires were processed anonymously by assigning sequential num-bers on arrival to each individual. After completion of measurement for major analytes, the test results together with newly derived gender-specific RIs were reported confidentially to each participant.
Sample size
As recommended by the C-RIDL protocol, the target sample size was set at 500 or more to derive country-specific RIs in a reproducible manner and to obtain at least 120 samples for analysis to identify regional differences [3]. The original number of recruited participants in this study was 826 but 22 subjects were excluded by identifica-tion of non-eligible features after recruitment and testing (see “Data validation” below). Two subjects having sickle cell trait anemia with abnormal Hb variant and one a new case having leukemia were excluded from the study. Other subjects were diabetics (newly diag-nosed). Therefore, 804 subjects were included from across the King-dom of Saudi Arabia: Western 409 (51%); Central 152 (19%); Eastern 243 (30%). The ages of subjects were evenly distributed between 18
and 65 years. The purpose of this multicenter scheme was to explore possible regional differences as well as to facilitate recruiting enough subjects for the study.
Blood collection and handling
Preparing volunteers for sampling and sample processing were con-ducted using the IFCC/C-RIDL protocol [13]. Briefly, the healthy sub-jects were strictly requested to avoid excessive physical exhaustion/exercise for 3 days before the sampling. Participants were asked to avoid excessive eating/drinking the night before. They were asked to be fasting at least for 10 h before sample collection. The amount of blood to be drawn was between 15–20 mL. The time of sampling was set at 7 to 10 AM. The blood was drawn after the participant had sat quietly for approximately 30 min to avoid variations due to postural influence and physical stress. The time period was used for checking the questionnaire. For blood collection four plain tubes containing clot activator were used. In addition to this, two EDTA blood tubes were collected for complete blood count (CBC) and hemoglobin A1c (HbA1c) analysis but for further studies. The plain tubes were left at room temperature before centrifugation, which were performed within one hour. After separation of the serum at 1200 g for 10 min at room temperature, the specimens then promptly divided into 5–10 aliquots of 1 mL each using well-sealed freezing containers (CryoTubes, Thermo Fisher Scientific, Inc., Waltham, MA, USA) and were immediately stored at −80 °C. All the aliquots were shipped in a box filled with sufficient amount of dry ice to the central lab in the western region (Jeddah) for collective measurement.
Quality control
Cross-check: For standardized and non-standardized analytes, RIs determined from values measured centrally in Jeddah laboratory were converted to those of each participating laboratory (Riyadh and Hassa) based on the cross-check test results. Therefore, as rec-ommended by the C-RIDL common protocol and before sending samples to the central lab in Jeddah, 25 specimens were measured in Riyadh, but, due to insufficient sample volumes, 17 samples were measured in Hassa for the purpose of comparison instead of 25. The linear structural relationship (the major axis regression) was used to convert RIs established by the centralized assay to the values of each participating laboratory (results not shown). All participating labora-tories in Jeddah, Riyadh and Hassa used the same analyser, Architect and assay reagents (Abbott Diagonostics, Chicago, IL, USA).
Mini-panel: For the purpose of this study dedicated QC monitoring was undertaken by use of multiple commutable specimens prepared in a central laboratory (Jeddah) as suggested by the C-RIDL common protocol and standard operating procedure 2 (SOP 2) [13]. Accord-ingly, a mini-panel of sera from five healthy individuals (2 males and 3 females) were prepared and measured over the period of col-lective measurements in order to assess between-day variations of test results [12]. Between-day variations were monitored by use of an index, a cumulative sum of difference of each specimen’s value (Xi) from its average (X0) (cumD = ∑(Xi−X0) [i = 1~n] ). The merit of this method is that when, an unexpected bias occurs on a certain testing day, the regression line can be used for recalibrating the assay of the day based on all the past assays.

846 Borai et al.: Reference interval study in Saudi Arabia
Panel of sera: For standardized analytes, RIs were made traceable to the reference measurement procedure (RMP) based on test results for the panel of sera which have values assigned indirectly by comparison with test results for standard reference Material (TP, urea, CRE, UA, TBil, Glu, TC, TG, LDL-C, HDL-C, Na, K, Cl, Ca, IP, CRP, and TRF) and value assigned sera for enzymes (AST, GGT, ALT, CK and LDH) [12] .
Methods, instruments and reagents
Twenty-eight general chemistry analytes including CRP and TRF were measured in each serum sample. The names of test items and their assay methods are listed in Table 1. Assay reagents were sup-plied by Abbott Diagnostics (Medi-Serve). Assay precisions are listed in the same table. Between and within-day CVs were calculated using Bio-Rad QC materials. Within-day CVs were calculated based on test-ing controls 20 times within the same day while between-day CVs were estimated based on assaying controls 30 times over consecu-tive days. The auto-analyzer used for the measurement was Architect
16000c, Abbott Diagnostics, USA. The assays were performed at King Abdulaziz Medical City Laboratory located in Jeddah, Saudi Arabia, using the manufacturer’s reagents, calibrators, and controls.
Data collection
The anthropometric measurements were entered manually using the Microsoft excel sheet. Original data were registered in data collec-tion sheet hard copies. For the clinical laboratory results they were retrieved and verified using stored data in the 16000c Abbott auto-analyzer software (Excel sheet format).
Statistical analysis
The tests results were evaluated by using the same statistical meth-ods described in the previous studies [12–15] but are described briefly below.
Table 1: List of biochemical tests with their principles of measurement and the calculated coefficient of variation (within- and between-day imprecision).
Abbreviation Analyte Method Within-day CV
Between-day CV
TP Total protein Biuret method 0.8 0.9Alb Albumin Bromcresol green 0.5 1.3Urea Urea Urease 1.2 1.7UA Uric acid Uricase 0.4 1.0CRE Creatinine Kinetic alkaline picrate 1.2 1.7TBil Total bilirubin Diazonium salt 1.6 2.6Glu Glucose Hexokinase/G-6-PDH 0.7 1.7TC Total cholesterol Cholesterol oxidase (enzymatic)a 0.2 0.9TG Triglycerides Glycerol phosphate oxidase 0.8 1.1HDL-C High density lipoprotein-cholesterol Accelerator selective detergentb 1.2 1.8LDL-C Low density lipoprotein-cholesterol Measured, liquid selective detergent 0.9 0.9Na Sodium Ion-selective electrode diluted (indirect) 0.4 1.0K Potassium Ion-selective electrode diluted (indirect) 1.2 1.7Cl Chloride Ion-selective electrode diluted (indirect) 0.5 1.3Ca Calcium Arsenazo-III dye 0.3 2.0IP Inorganic phosphorous Phosphomolybdate 0.5 3.1Mg Magnesium Enzymatic (NADP to NADPH) 0.8 2.2Fe Iron FERENE without a protein removal step 0.9 2.3UIBC Unsaturated iron binding capacity FERENE method 2.7 9.0AST Aspartate aminotransferase NADH (without P-5′-P) 3.8 2.0ALT Alanin aminotransferase NADH (without P-5′-P) 1.3 4.4LDH Lactate dehydrogenase Lactate to pyruvatec 1.9 3.1ALP Alkaline phosphatase p-nitrophenyl phosphate (p-NPP) hydrolysisd 0.8 2.5GGT Gamma glutamyl transferase L-Gamma-glutamyl-3-carboxy-4-nitroanilide substrate 2.1 1.2CK Creatine kinase NAC (N-acetyl-L-cysteine) 3.3 1.6AMY Amylase CNPG3 substrate 0.4 1.1CRPe C-reactive protein Immunoturbiditmetry 1.2 2.1TRF Transferrin Immunoturbiditmetry 0.5 1.7
aCholesterol reagent is certified to be traceable to the National Reference System for Cholesterol, against the Abell-Kendall reference method in a CDC-Certified Cholesterol Reference Method Laboratory Network (CRMLN). bUltra HDL regent is certified as traceable to the HDL cholesterol covering the NCEP decision points, by the CDC-Certified Reference Method Laboratory Network (CRMLN). cThis method uses the IFCC recommended forward reaction – lactate to pyruvate. dThis method optimized to include amino propanol buffer (AMP) which consid-ered as a chelated metal-ion buffer of zinc, magnesium, and HEDTA. eStandard CRP test (not hs-CRP).

Borai et al.: Reference interval study in Saudi Arabia 847
Data validation
Data validation started by excluding those subjects with overtly abnormal results (e.g. pointing to diabetes mellitus, chronic hepatic or renal disease, active viral infections, hemoglobinopathies, etc.). CBC and HbA1c measurements were part of the study but data was not included in this manuscript.
Partitioning criteria and data regression
The magnitude of variation of test results attributable to a specific factor was expressed as standard deviation (SD). In brief, the mag-nitude of between-region SD (SD-reg), between-gender SD (SD-sex) between-age SD (SD-age), and net-between individual SD (SD-indiv) were computed by the 3-level nested ANOVA (3N-ANOVA) as standard deviation ratio (SDR-reg, SDR-sex and SDR-age) [12, 13]. In the analy-sis, geographical areas were categorized into three regions (western, central and eastern). Age was stratified into the following groups for males and females (18–29, 30–39, 40–49, and 50–65 years). Ratios of SD-reg, SD-sex and SD-age over SD-indiv ≥ 0.3 was regarded as pres-ence of significant difference between-gender, between-region, or between-age [11, 16], which may require consideration of partitioning the RI.
Multiple regression analysis (MRA) was performed to iden-tify factors possibly influencing the test results, including gen-der, age and BMI. In addition to the level of cigarette smoking and regular physical exercise with respective levels categorized as fol-lows: none, ≤ 20, and > 20 cigarettes/day; none, 1–7 days/week, respectively. A given explanatory variable was considered to be of practical importance when its standardized partial regression coef-ficient, which corresponds to the partial correlation coefficient (rp), was > 0.15 in its absolute value. p-values for rp = 0.15 and 0.20, assum-ing data size of 400 with inclusion of four explanatory parameters, are approximately 0.003 and 0.0001, respectively.
Derivation of reference interval
An exclusion of inappropriate subjects after blood collection and tests measurements was applied to cope with abnormal results attributable to highly prevalent diseases like metabolic syndrome and diabetes. In addition to excluding those individuals with BMI > 32 kg/m2, as a method of secondary exclusion, the multivariate iterative method called latent abnormal value exclusion (LAVE) [11, 12, 17] was applied for simultaneous derivation of RIs for multiple test items. In its first iteration, the RI is derived test item by item independently disregarding latent abnormal results. From the sec-ond iteration on, the RI for each item is computed from data after excluding those from individuals with two or more results outside the RIs which were derived in the previous iteration for a list of pre-defined reference test items. This results in adjustment of the RIs when abnormal test results are associated with each other. Usually the RIs of all test items stabilize after 6–8th iteration. In this study, the LAVE method was employed in reference to the values of Alb, UA, Glu, TC, TG, HDL-C, LDL-C, AST, ALT, GGT, CK, and CRP with iteration = 8 and allowance of up to one result outside the RI and up to one missing result in the reference test items. For the analysis of reference values for lipids, UA, Fe and Ca, those who were taking
drugs or supplements for dyslipidemia and hyperuricemia, and for raising serum iron and calcium, respectively, were not included. Parametric (P) method was used for computing RIs after transform-ing the distribution of reference values into Gaussian form by use of the modified Box-Cox transformation [11]. RIs by the non-parametric (NP) method were also derived for comparative purpose. In order to improve the precision of the RI, the bootstrap method through 100-time resampling of the final dataset chosen by the LAVE method was applied to obtain smoothed lower and upper limits (LL, UL), and median (Me) of the RI both for the P and NP methods. This resam-pling procedure also served for predicting 90% confidence intervals (CI) for the limits of the RI.
Results
Profile of the subjects
The demographic profile of the participants from each region is summarized in Supplemental Table 1. As a whole, male female ratio was almost equal (51.2% vs. 48.8%). Between-region differences of age and BMI expressed in terms of SDR-reg were 0.213 (male: 0.14; female: 0.27) and 0.07 (male: 0.20; female: 0.02), respectively. About 15% of participants were smokers. The proportions of males and females indi-viduals under medications were 5% and 3%, respectively. Overall 22% and 12% of males and females, respectively were practicing routine exercise in various grades.
Quality control
The results for the mini-panel of sera from the five healthy individuals were measured over 18 days. Between-day var-iations index was consistent for all analytes but bias was detected for Alb, Cl, Ca and LDH. The F values obtained from the two-way ANOVA (degree of freedom: 17.4) were 11.5, 20.14, 12.57 and 13.67, respectively. After adjustment of results for biased days, the F values for the same order of analytes were 5.80, 6.67, 6.17 and 4.36.
Traceability
Traceability of test results for the standardized analytes was evaluated by the central laboratory. The assigned values were obtained from the panel of sera which was measured for the global study. Excellent linearity between the test results for sera in the common panel and their assigned values [12] was confirmed with small CV of the regression line slope, CV(b), well below the critical

848 Borai et al.: Reference interval study in Saudi Arabia
value of 11% [18] for all the analytes except Na, Cl, Ca, and Alb with narrow coverage of the test ranges by the serum panel. The major axis linear regression was used to assess the need for recalibration of test results [18]. When difference in the lower or upper limit of the RI before and after recalibration was more than 1/4 of SD of the original RI, recalibration of test results was performed by using regression coefficients (intercepts and slopes). This cri-terion corresponds to Frasers’ allowable limit of bias. By this criteria, the recalibration based on the assigned values was performed for TP, UA, TC, HDL-C and LDL-C. Although our ALT and AST assays are not traceable to the IFCC reference methods because they do not include the co-factor pyridoxal-5-phosphate (P-5-P), previous method comparison studies during the 2009 Asian Study [14] using the JSCC non-activated and the IFCC activated
formula-tions demonstrated very close agreement as shown in Supplemental Figure 1. However, it is possible that subjects with a significant P-5-P deficiency may have ALT and/or AST values that fall outside the RIs. We did not have such a case in this study.
Sources of variations and regionality of results
The results of the 3N-ANOVA to evaluate SVs for all ana-lytes are summarized in Table 2. The three SVs analyzed were gender, region, and age. The level of standard deviation ratio (SDR) for gender (SDR-sex) was signifi-cantly high ( ≥ 0.30) for 14 analytes: Alb, ALT, AST, CK, CRE, Fe, GGT, HDL-C, TBil, TG, TRF, UIBC, Urea, UA and
Table 2: Gender-, region-, and age-related changes evaluated by 3-level nested ANOVA.
Analytes Unites Trans Male (M) Female (F) Nested ANOVAa
n Mean SD n Mean SD SDR-sex SDR-reg (M,F) SDR-age (M,F)
TP g/L 1 392 75 4 403 74 5 0.06 0.16 (0.21, 0.15) 0.19 (0.24, 0.00)Alb g/L 1 391 43 2.4 403 42 2.6 0.33 0.17 (0.37, 0.26) 0.23 (0.28, 0.13)Urea mmol/L 1 393 4.9 1.2 405 3.8 1.3 0.56 0.00 (0.17, 0.00) 0.43 (0.11, 0.58)UA μmol/L 1 393 371 80 405 265 71 1.07 0.00 (0.22, 0.13) 0.30 (0.00, 0.49)CRE μmol/L 0 393 79.6 11.6 405 61.4 7.6 1.44 0.00 (0.00, 0.16) 0.28 (0.14, 0.45)TBil μmol/L 0 393 9.9 5 399 6.9 4.5 0.53 0.00 (0.30, 0.24) 0.10 (0.00, 0.24)Glu mmol/L 0 392 5.4 1.2 405 5.2 1 0.00 0.16 (0.26, 0.21) 0.51 (0.35, 0.53)TC mmol/L 1 393 5 0.9 405 5 1 0.00 0.00 (0.08, 0.00) 0.41 (0.29, 0.47)TG mmol/L 0 393 1.5 0.95 405 1.1 0.59 0.38 0.00 (0.04, 0.12) 0.52 (0.25, 0.51)HDL-C mmol/L 1 393 1.11 0.22 405 1.38 0.26 0.78 0.00 (0.00, 0.00) 0.20 (0.13, 0.20)LDL-C mmol/L 1 389 3.13 0.82 407 2.98 0.88 0.00 0.14 (0.05, 0.29) 0.43 (0.27, 0.42)Na mmol/L 1 393 140 3 405 139 3 0.18 0.36 (0.35, 0.34) 0.21 (0.15, 0.18)K mmol/L 1 393 4.3 0.33 405 4.2 0.31 0.14 0.09 (0.24, 0.10) 0.22 (0.04, 0.24)Cl mmol/L 1 393 106 2.5 404 107 2.6 0.22 0.29 (0.43, 0.30) 0.20 (0.00, 0.11)Ca mmol/L 1 392 2.4 0.1 404 2.3 0.12 0.24 0.27 (0.38, 0.21) 0.28 (0.23, 0.20)IP mmol/L 1 393 1.13 0.18 405 1.15 0.15 0.00 0.00 (0.16, 0.00) 0.29 (0.32, 0.24)Mg mmol/L 1 393 0.84 0.06 405 0.82 0.06 0.19 0.00 (0.09, 0.11) 0.20 (0.16, 0.00)Fe μmol/L 1 389 17 5.6 403 12 5.8 0.58 0.00 (0.12, 0.00) 0.06 (0.00, 0.09)UIBC μmol/L 1 393 38 10 401 49 13 0.68 0.00 (0.00, 0.00) 0.18 (0.09, 0.22)AST U/L 0 390 21 6 405 16 5 0.63 0.00 (0.20, 0.16) 0.19 (0.12, 0.17)ALT U/L 0 389 22 14 352 13 8 0.81 0.00 (0.40, 0.15) 0.27 (0.19, 0.17)LDH U/L 1 392 165 38 405 158 36 0.00 0.33 (0.39, 0.25) 0.27 (0.00, 0.28)ALP U/L 1 391 75 19 404 67 20 0.29 0.00 (0.22, 0.09) 0.19 (0.06, 0.26)GGT U/L 0 388 33 19 404 19 13 0.81 0.00 (0.00, 0.00) 0.38 (0.27, 0.40)CK U/L 0 393 134 101 405 70 38 0.79 0.00 (0.18, 0.19) 0.06 (0.00, 0.00)AMY U/L 1 389 63 22 404 60 21 0.09 0.11 (0.05, 0.23) 0.15 (0.14, 0.19)CRP mg/L 0 390 3.7 5.89 402 5.16 6.82 0.00 0.00 (0.14, 0.10) 0.32 (0.00, 0.29)TRF g/L 0 393 2.6 0.4 405 2.9 0.5 0.50 0.00 (0.06, 0.00) 0.25 (0.14, 0.28)
Trans, Log transformation (0 = Log-transformation, 1 = no-transformation). SDR, standard deviation ratio; SDR-sex, between-sex; SDR-reg, between-region; SDR-age, between-age. aThree-level nested ANOVA was applied in two stages, first for between-sex, -region, and -age dif-ferences, and second for between-region and between-age after partitioning for each sex. SDR ≥ 0.3 was regarded as a significant between-sex, region, or age difference. The SDRs in parentheses represent those computed after partitioning data to males (M) and females (F) by use of 2-level nested ANOVA, the light to dark gray backgrounds indicate 0.25 < SDR ≤ 3, 0.3 < SDR ≤ 0.5 and 0.5 < SDR, respectively.
Borai et al.: Reference interval study in Saudi Arabia 849
moderately elevated SDR in ALP analyte only. The SDRs for region (SDR-reg) were significant in two analytes: LDH, Na and moderately in two other analytes: Ca and Cl. SDRs for age (SDR-age) were significant in eight analytes: CRP, GGT, Glu, LDL-C, TC, TG, urea, and UA, and moderately in ALT, Ca, CRE, LDH, IP, and TRF (Table 2). As the mag-nitude of between-region and -age differences may differ between two genders, we also performed 3N-ANOVA after separating the dataset by gender (Table 2). The two values shown within the parenthesis in the last two columns correspond to SDR-reg and SDR-age values for males and females, respectively. We observed unmatched SDR-reg and SDR-age between two genders in two analytes (ALT and LDH) and eleven analytes (Alb, ALP, CRE, GGT, Glu, LD, LDL-C, TC, TG, urea and UA), respectively. We con-firmed the differential effect of sex on age-related changes observed for the 11 analytes by multiple regression anal-ysis, in which BMI was included as a control variable to
prevent its possible confounding effect on the analysis of age-related change.
Gender effect on the sources of test variation
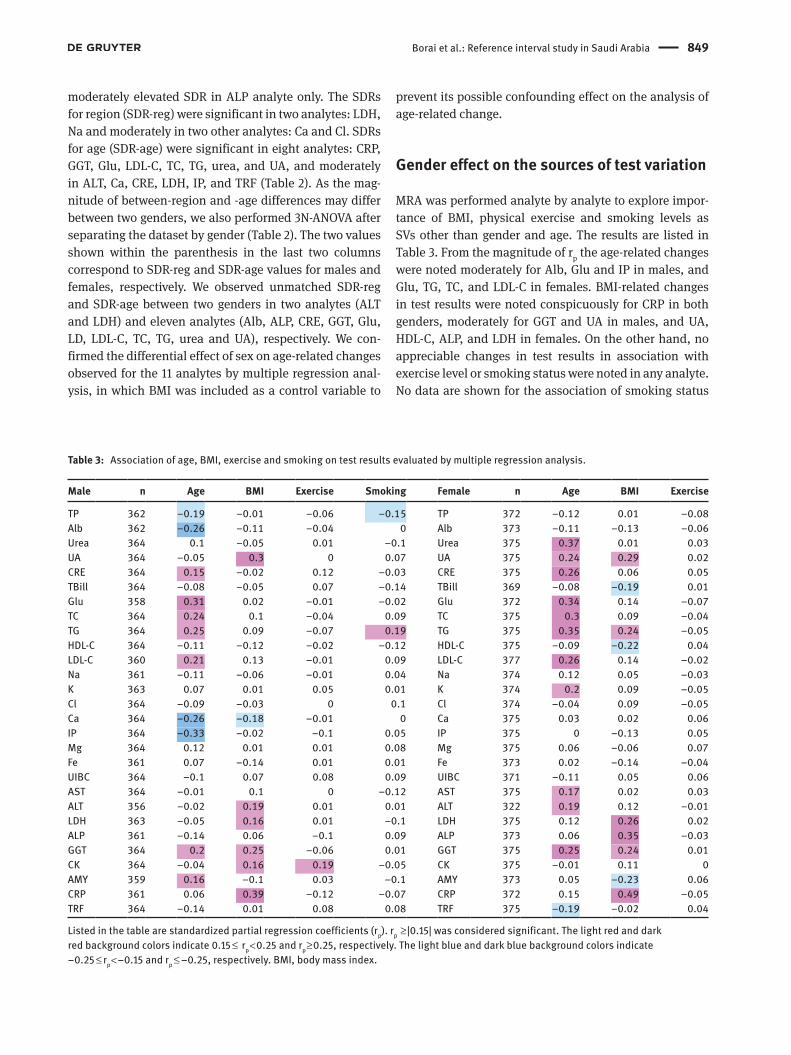
MRA was performed analyte by analyte to explore impor-tance of BMI, physical exercise and smoking levels as SVs other than gender and age. The results are listed in Table 3. From the magnitude of rp the age-related changes were noted moderately for Alb, Glu and IP in males, and Glu, TG, TC, and LDL-C in females. BMI-related changes in test results were noted conspicuously for CRP in both genders, moderately for GGT and UA in males, and UA, HDL-C, ALP, and LDH in females. On the other hand, no appreciable changes in test results in association with exercise level or smoking status were noted in any analyte. No data are shown for the association of smoking status
Table 3: Association of age, BMI, exercise and smoking on test results evaluated by multiple regression analysis.
Male n Age BMI Exercise Smoking Female n Age BMI Exercise
TP 362 −0.19 −0.01 −0.06 −0.15 TP 372 −0.12 0.01 −0.08Alb 362 −0.26 −0.11 −0.04 0 Alb 373 −0.11 −0.13 −0.06Urea 364 0.1 −0.05 0.01 −0.1 Urea 375 0.37 0.01 0.03UA 364 −0.05 0.3 0 0.07 UA 375 0.24 0.29 0.02CRE 364 0.15 −0.02 0.12 −0.03 CRE 375 0.26 0.06 0.05TBill 364 −0.08 −0.05 0.07 −0.14 TBill 369 −0.08 −0.19 0.01Glu 358 0.31 0.02 −0.01 −0.02 Glu 372 0.34 0.14 −0.07TC 364 0.24 0.1 −0.04 0.09 TC 375 0.3 0.09 −0.04TG 364 0.25 0.09 −0.07 0.19 TG 375 0.35 0.24 −0.05HDL-C 364 −0.11 −0.12 −0.02 −0.12 HDL-C 375 −0.09 −0.22 0.04LDL-C 360 0.21 0.13 −0.01 0.09 LDL-C 377 0.26 0.14 −0.02Na 361 −0.11 −0.06 −0.01 0.04 Na 374 0.12 0.05 −0.03K 363 0.07 0.01 0.05 0.01 K 374 0.2 0.09 −0.05Cl 364 −0.09 −0.03 0 0.1 Cl 374 −0.04 0.09 −0.05Ca 364 −0.26 −0.18 −0.01 0 Ca 375 0.03 0.02 0.06IP 364 −0.33 −0.02 −0.1 0.05 IP 375 0 −0.13 0.05Mg 364 0.12 0.01 0.01 0.08 Mg 375 0.06 −0.06 0.07Fe 361 0.07 −0.14 0.01 0.01 Fe 373 0.02 −0.14 −0.04UIBC 364 −0.1 0.07 0.08 0.09 UIBC 371 −0.11 0.05 0.06AST 364 −0.01 0.1 0 −0.12 AST 375 0.17 0.02 0.03ALT 356 −0.02 0.19 0.01 0.01 ALT 322 0.19 0.12 −0.01LDH 363 −0.05 0.16 0.01 −0.1 LDH 375 0.12 0.26 0.02ALP 361 −0.14 0.06 −0.1 0.09 ALP 373 0.06 0.35 −0.03GGT 364 0.2 0.25 −0.06 0.01 GGT 375 0.25 0.24 0.01CK 364 −0.04 0.16 0.19 −0.05 CK 375 −0.01 0.11 0AMY 359 0.16 −0.1 0.03 −0.1 AMY 373 0.05 −0.23 0.06CRP 361 0.06 0.39 −0.12 −0.07 CRP 372 0.15 0.49 −0.05TRF 364 −0.14 0.01 0.08 0.08 TRF 375 −0.19 −0.02 0.04
Listed in the table are standardized partial regression coefficients (rp). rp ≥ |0.15| was considered significant. The light red and dark red background colors indicate 0.15 ≤ rp < 0.25 and rp ≥ 0.25, respectively. The light blue and dark blue background colors indicate −0.25 ≤ rp < −0.15 and rp ≤ −0.25, respectively. BMI, body mass index.

850 Borai et al.: Reference interval study in Saudi Arabia
in females due to very small proportion of female smokers ( < 3% in this study).
Reference intervals
Table 4 represents a simplified list of the RIs derived by setting 0.30 as a critical SDR-sex by consensus for par-titioning reference values by gender. The RIs are shown based on 90% CI for the upper and lower limits (UL, LL). They are basically derived by use of P method without application of LAVE method and any restriction regard-ing BMI (Method 1). However, the LAVE method (allow-ing up to one abnormal result) with restriction to BMI ≤ 32 and ≤ 26 kg/m2 (Method 2 and 3, respectively) were applied for the following analytes, which are known to be influenced by inappropriate nutritional statuses and muscular exertion prior to the sampling: (Method 2) UA, HDL-C, and LDL-C, (Method 3) Alb, Glu, TC, TG, AST, ALT, GGT, CK, and CRP. The RIs for iron, UIBC and TRF were cal-culated separately after excluding subjects with exogenous iron supplements and anemia (males with Hb < 130 g/L or females with Hb < 110 g/L) before deriving the RIs. The LAVE method was applied using the seven sets of analytes related to Fe metabolism and inflammation as the refer-ence test items: (Method 4) Fe, UIBC, TRF, Alb, CRP, Fer-ritin and TP. For the age-related RIs, although there were analytes with SDRage ≥ 0.35, it was not possible to derive reproducible RIs from the current size of data.
RIs were derived for both males and females, males only and females only by use of the P and NP methods. On the basis of the above results we just show RIs for all Saudis rather than those after partitioning by region as listed in Supplemental Table 2. After limiting to BMI ≤ 32 kg/m2 and applying the LAVE method, approximately 77% of the original data (804→617 individuals) remained. The effect of the exclusion procedures was apparent only for analytes known to be related to nutritional status: Alb, UA, Glu, TC, TG, HDL-C, LDL-C, AST, ALT, GGT, CRP, and muscle damage due to excessive exertion: CK and AST. In the same Table, RIs with no exclusion by LAVE method are included also. The 3rd column in the same Table shows RIs from Abbott Architect kit inserts.
The last three blocks of columns in Supplemental Table 2 illustrate the magnitude of differences in the UL of the RI by use or nonuse of LAVE method, and between P and NP methods. The difference is expressed as its ratio to SD of the RI, (UL–LL) /3.92, derived by P method. ULs for UA, urea, Glu, Alb, TG, AST, ALT, LDH, GGT, CK and CRP have been changed significantly when LAVE method was applied. Comparison between P and NP RIs shows that ULs
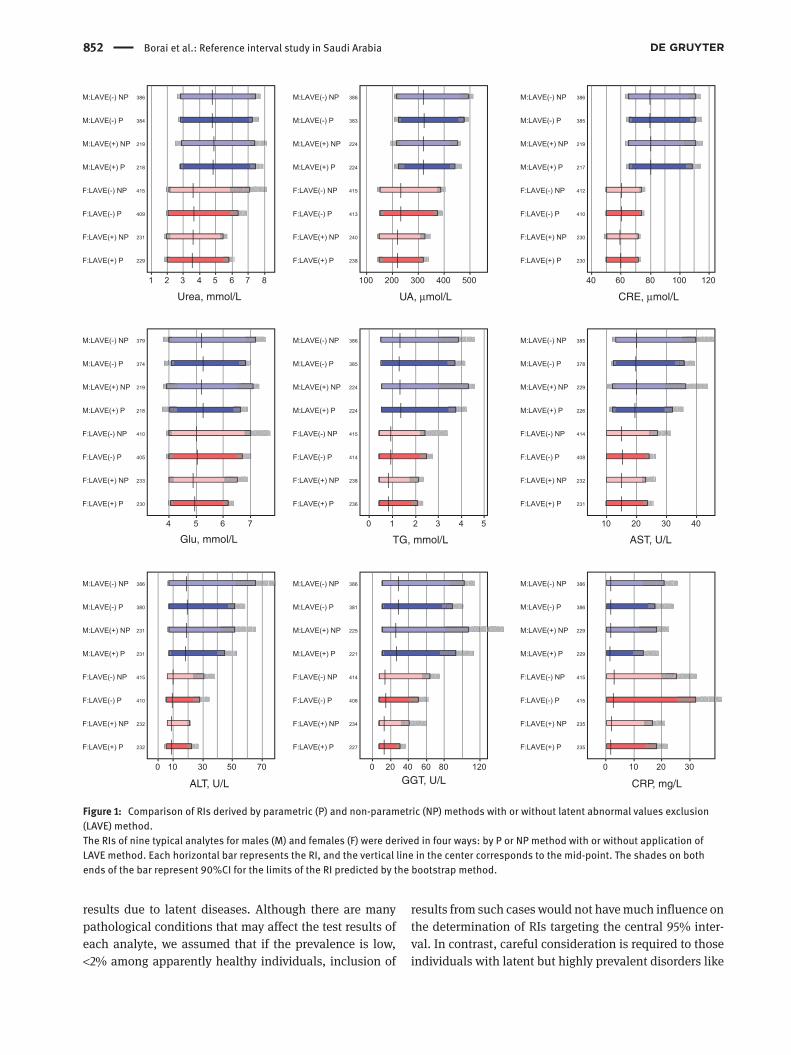
by the NP method are higher than those by the P method for Glu, AST, ALT, GGT, CK and CRP. Typical examples of these differences in RIs by use or nonuse of the LAVE method, and between P and NP methods are also shown for nine representative analytes (Figure 1). The same results for the comparison are shown for the rest of the analytes in Sup-plemental Figure 2. It is notable that the gap between P and NP methods decreased after applying the LAVE method in UA, AST, ALT, CRP, implying dependence of the gap on the prevalence of latent abnormal values and higher suscepti-bility of the NP method to the extreme values than the P method.
Serial changes in RIs during the iterative process of the LAVE method are illustrated in the left half of each graph in Supplemental Figure 3 shown for all the analytes. It is clearly shown that no change in the RI occurred by LAVE method in analytes which rarely get abnormal in healthy individuals: TP, Alb, Urea, CRE, Na, K, Cl, etc. Whereas, prominent stepwise changes in the RI were observed for analytes whose abnormal values are common in healthy individuals: TG, AST, ALT, GGT, and CRP. The probability paper plot in the right half of the same Figure demon-strates that the cumulative frequency curves before and after applying the LAVE methods (light blue and blue, respectively) are identical in analytes unaffected by the LAVE method such as TP, Urea (male), CRE (male), Na, K for which it is rare for healthy individuals do have abnor-mal results. Whereas, the two curves differ greatly in those analytes affected by the LAVE method such as Glu, AST, ALT, GGT, and CRP. It is of note that the upper tailing of the curve (shifting away from the central line) representing the gap between NP and P is more pronounced without the LAVE method.
Due to the high association between BMI and many of biochemical test results (as shown in Table 3) and due to the high prevalence of increased BMI in Saudi individuals, the RIs after setting cutoff values of 26, 28, and 30 kg/m2 for BMI in addition to applying the LAVE method were also derived as shown in Supplemental Table 3. By low-ering the cutoff value for BMI, the number of individuals available for derivation of RIs was decreased progressively and ULs were lowered for analytes affected by metabolic syndrome such as UA, Glu, TC, TG, LDL-C, ALT, GGT and CRP, while the UL for HDL-C increased.
DiscussionIn defining reference individuals, it was important to adopt a strict policy to exclude those with abnormal

Borai et al.: Reference interval study in Saudi Arabia 851
Tabl
e 4:
Sim
plifi
ed li
st o
f RIs
with
90%
CI o
f the
lim
its in
cons
ider
atio
n of
gen
der,
BMI a
nd th
e ne
ed fo
r LAV
E m
etho
d.
Item
Un
it
Met
hod
Mal
e+Fe
mal
eM
ale
Fem
ale
n LL
90%
CI
RI
UL 9
0% C
In
LL 9
0% C
I RI
UL
90%
CI
n LL
90%
CI
RI
UL 9
0% C
I
LL
ULLL
UL
LL
ULLL
UL
LL
ULLL
UL
LL
ULLL
UL
LL
UL
TP
g/L
1
795
66
67
66
83
83
84
Al
b
g/L
3
229
38
40
39
50
49
51
Ur
ea
mm
ol/L
1
38
4 2.
7 2.
9 2.
8 7.
3 7.
0 7.
6 40
9 2.
0 2.
2 2.
1 6.
4 5.
9 6.
9UA
μm
ol/L
2
22
4 20
7 24
5 22
3 44
4 42
6 47
1 23
8 14
1 16
0 14
8 32
1 30
9 34
4CR
E
μmol
/L
1
385
64
67
66
111
107
116
410
49
51
50
74
73
75TB
il
μmol
/L
1
384
3.3
4.2
3.6
22.4
20
.9
25
411
1.9
2.4
2.2
15.5
13
.3
17.4
Glu
m
mol
/L
3 22
6 3.
80
4.1
4.0
5.9
5.8
6.0
TC
m
mol
/L
3 23
3 3.
32
3.69
3.
5 6.
36
6.16
6.
59
TG
m
mol
/L
3
102
0.45
0.
59
0.50
3.
58
3.02
4.
42
127
0.38
0.
45
0.39
1.
60
1.36
1.
93HD
L-C
mm
ol/L
2
22
5 0.
67
0.79
0.
74
1.76
1.
65
1.90
23
9 0.
93
1.04
0.
98
2.19
2.
09
2.30
LDL-
C
mm
ol/L
2
458
1.59
1.
90
1.80
4.
34
4.17
4.
51
Na
m
mol
/L
1 79
2 13
4 13
5 13
5 14
4 14
4 14
5
K
mm
ol/L
1
798
3.7
3.8
3.7
4.9
4.9
5.0
Cl
m
mol
/L
1 79
9 10
1 10
1 10
1 11
1 11
1 11
2
Ca
mm
ol/L
1
797
2.09
2.
13
2.11
2.
56
2.55
2.
57
IP
m
mol
/L
1 80
1 0.
79
0.83
0.
81
1.44
1.
42
1.46
Mg
m
mol
/L
1 79
5 0.
71
0.72
0.
71
0.96
0.
95
0.97
Fe
μmol
/L
4
350
7.2
8.4
7.9
29.6
27
.8
31.3
35
4 3.
1 4.
3 3.
7 26
.0
24.5
27
.3UI
BC
μmol
/L
4
354
20
23
21
53
52
55
353
26
32
29
77
74
80AS
T
U/L
3
10
2 10
13
11
28
26
30
12
6 10
11
10
24
22
25
ALT
U/
L
3
103
6 8
7 39
33
46
12
6 4
6 5
18
16
22LD
H
U/L
1
790
92
104
10
238
230
245
AL
P
U/L
1
797
38
42
39
114
111
119
GG
T
U/L
3
10
2 11
12
11
65
50
86
12
7 6
8 7
21
18
26CK
U/
L
3
102
38
61
54
266
225
331
128
23
30
27
138
123
165
AMY
U/
L
1 79
2 29
33
31
11
7 11
0 12
3
CRP
m
g/L
3
231
0.1
0.2
0.2
11.8
9
16.8
TRF
g/
L
4
356
1.9
2.0
2.0
3.2
3.1
3.3
354
2.0
2.1
2.1
3.9
3.8
4.0
All r
efer
ence
inte
rval
s (R
I) w
ere
deriv
ed b
y th
e pa
ram
etric
met
hod
base
d on
mod
ified
Box
-Cox
pow
er tr
ansf
orm
atio
n. S
DR-s
ex fo
r par
titio
ning
is 0
.30.
90%
CI o
f the
lim
its o
f RIs
wer
e de
rived
by
boot
stra
p m
etho
d of
100-
times
iter
atio
n. M
etho
d 1:
No
excl
usio
n pr
oced
ure
was
app
lied;
Met
hod
2: S
ubje
cts
with
dru
gs (h
yper
tens
ion,
dys
lipid
emia
, hyp
erur
ecim
ia) o
r BM
I > 32
wer
e ex
clud
ed,
then
LAV
E m
etho
d w
as a
pplie
d by
set
ting
Grou
p-1 t
ests
as
refe
renc
e ite
ms;
Met
hod
3: Th
e sa
me
as M
etho
d 2
exce
pt th
at s
ubje
cts
with
BM
I > 26
wer
e ex
clud
ed; M
etho
d 4:
Sub
ject
s w
ith ir
on
supp
lem
ents
and
ane
mia
(mal
e: H
b < 1
30 g
/L o
r fem
ale:
< 11
0 g/
L) w
ere
excl
uded
, the
n LA
VE m
etho
d w
as a
pplie
d by
set
ting
Grou
p-2
test
s as
the
refe
renc
e ite
ms
for s
econ
dary
exc
lusi
on.
Grou
p-1 t
ests
: Alb
, UA,
Glu
, TC,
TG, H
DL, L
DL, A
ST, A
LT, G
GT, C
K, a
nd C
RP. G
roup
-2 te
sts:
Fe, U
IBC,
TRF
, Fer
ritin
, TP,
Alb
, and
CRP
. LL,
low
er li
mits
; UL,
upp
er li
mits
. Val
ues
in g
ray
back
grou
nd co
r-re
spon
d to
90%
CI o
f the
lim
its (L
L, U
L) o
f the
RIs
.
852 Borai et al.: Reference interval study in Saudi Arabia
Urea, mmol/L UA, µmol/L
TG, mmol/LGlu, mmol/L
ALT, U/L GGT, U/L CRP, mg/L
AST, U/L
CRE, µmol/L
Figure 1: Comparison of RIs derived by parametric (P) and non-parametric (NP) methods with or without latent abnormal values exclusion (LAVE) method.The RIs of nine typical analytes for males (M) and females (F) were derived in four ways: by P or NP method with or without application of LAVE method. Each horizontal bar represents the RI, and the vertical line in the center corresponds to the mid-point. The shades on both ends of the bar represent 90%CI for the limits of the RI predicted by the bootstrap method.
results due to latent diseases. Although there are many pathological conditions that may affect the test results of each analyte, we assumed that if the prevalence is low, <2% among apparently healthy individuals, inclusion of
results from such cases would not have much influence on the determination of RIs targeting the central 95% inter-val. In contrast, careful consideration is required to those individuals with latent but highly prevalent disorders like

Borai et al.: Reference interval study in Saudi Arabia 853
metabolic syndrome and diabetes mellitus which are very common in Saudi Arabia [19]. Therefore, LAVE method was applied in our study to exclude individuals with abnormal results in other related analytes, apparently attributable to those conditions.
The performance of the LAVE method have been well characterized in previous reports [14, 15] and this study confirmed the need for its use in seven out of nine test items shown in Figure 1. This study also confirmed that RIs by the NP method were easily influenced by latent abnormal results for those test items compared with the RIs derived by the P method. Regarding the regional vari-ability in test results for any of the 28 analytes examined within the three different regions of Saudi Arabia by using the nested ANOVA, we found apparent regional dif-ferences in Na, LDH and moderate differences for Ca and Cl. We were unable to identify the reason for higher levels of Na in Riyadh males and females and LDH in Jeddah males compared to other regions. Samples from different regions were run concurrently. Hence, the between-city difference is not attributable to between-day analytical bias but may be attributable to differences in lifestyles, dietary habits or other environmental factors. The exact factor cannot be determined in this study but further study is required.
In this study the test results for the standardized ana-lytes, such as UA, CRE, AST, GGT, ALT, CK and LDH were made traceable to the RMP based on the values assigned to the serum panel [12], and thus, the RIs for them are applicable to Saudi laboratories nationwide as long as the assays are standardized.
The main findings of MRA which reveals how well the SVs (i.e. age, BMI, exercise, smoking status) predict the level of target test results were described in the results. However, when compared to other populations involved in the multi-center Asian study conducted in 2009 with careful standardization of test results based on certified reference materials [15], the most peculiar finding is that no age-related changes in ALP and LDH were observed in females. In addition to this, minimal BMI-related changes for TG, HDL-C, ALT both in males and females were noticed [12]. However, BMI-related changes in test results were noted conspicuously for CRP in both genders. Our observation of strong association between BMI and CRP in Saudis was consistent with the findings in a previous study correlation coefficient (r = 0.3, p = 0.001) [20]. CRP is a specific maker of inflammation which can be associ-ated with increased risk of diabetes and cardiovascular disease in different populations. This association is com-monly seen among those with any overweight individuals particularly in females [21, 22]. This is consistent with our
outcomes as the association between elevated CRP levels and BMI was stronger in females than males (r = 0.49 and r = 0.39, respectively). This could be partially explained by the higher body fat in women than men.
Compared to the manufacturers’ RIs (kit inserts) several analytes have higher ULs. For example males and females had higher ULs for GGT, LDH and UIBC. In males the higher UL for CK was apparent and consistent with the kit insert value, due to the greater muscle mass of men.
In the adult Saudi population the RIs for general bio-chemical analytes related to metabolic syndrome of Glu, TC, LDL-C, TG, UA and CRP read higher than the recom-mended ULs reported by known international organiza-tions, e.g. WHO, NCEP ATP III for CDLs [23–25] even after applying more strict criteria as shown in Table 4. The only explanation for this could be the well-known high preva-lence of metabolic syndrome (e.g. diabetes and cardio-vascular disease) in Saudi population [26–28] even after utilizing the LAVE method to adjust the influence of those conditions. However, the ULs derived for these parameters in serum with adoption of very strict exclusion criteria based on BMI and LAVE method are of great relevance in interpreting the laboratory test results, but they cannot be used in making clinical decision for therapeutic interven-tion as more appropriate protocols are required to deter-mine the CDLs.
As expected, the values are more significant with metabolically affected analytes such as UA, Glu, TC, TG, LDL-C, AST, ALT, GGT, CK, and CRP. For these analytes, individuals with BMI > 32 kg/m2 were excluded. Before deriving RIs for analytes which were presumed to be affected by specific conditions such as hypertension, dyslipidemia and hyperuricemia or supplements such as vitamin D, calcium and iron such individuals were excluded. Therefore, the number of reference individuals for those analytes, where the LAVE method is more appro-priate, was smaller than without the exclusion method. In addition to this, the RIs of NP method were wider than the P method for UA, GLU, TG, AST, ALT, LDH, GGT, CK and CRP. This finding is consistent with the recently published Ichihara report [12]. That means RIs showed a tendency toward lowering of the ULs when stricter crite-ria for LAVE method were applied. This is not applicable to other tests, for example, urea and CRE in Figure 1 do not show changes in RIs implying with lack of abnormal values in healthy individuals.
In this study which were associated with those of other tests, the observation of elevated ULs of metabolic analytes in Saudi population became clearer when reference values are compared with those obtained from other countries

854 Borai et al.: Reference interval study in Saudi Arabia
participating in the global study using the same C-RIDL protocol [12]. Due to sharing common culture, religion, lan-guage, life style, foods (e.g. no alcohol consumption) and the prevalence of metabolic diseases [29, 30], the outcomes of this study can be useful and applicable to other neigh-boring countries in the Middle East including Arabian Gulf countries. The main limitation of the study was the rela-tive small number of subjects involved after partitioning. Therefore, it was not possible to carry out data analysis to obtain dedicated RIs for each region or age category.
In conclusion, as a part of global multi-center collabo-rative project for derivation of RIs, this study is considered to be the largest and first study for the Saudi population to establish RIs for the majority of general biochemistry ana-lytes under a standardized protocol. Partitioning of RIs by gender and age was necessary for many analytes. Regard-ing the controversies over the optimal statistical methods for derivation of the RI, this study confirmed the superior-ity of the P over NP method and the need for application of LAVE method for analytes which are easily influenced by the presence of highly prevalent metabolic disorders among apparently healthy individuals.
Acknowledgments: This study was planned by the C-RIDL of the IFCC and supported financially by the Japan Society for the Promotion of Science (JSPS) [Fund No. 24256003: 2012–2014]. All reagents required for test-ing were generously offered by Abbott (Medi-Serve). The sampling equipment and all required facilities and sup-port were provided by Ministry of Saudi National Guard. We are grateful to King Abdullah International Medical Research Center (KAIMRC-WR) (Grant/Award Number: ‘RCJ0212-209’) and for the collaborating laboratory staff at King Abdulaziz Medical Cities in Jeddah, Riyadh, Hassa and Dammam for their contributions to the success of the study. We are very grateful to Mr. Shogo Kimura of Yama-guchi University Graduate School of Medicine for his dedicated contribution to data analyses and preparation of figures. Finally, we are grateful for the collaboration and the kind support from the Saudi Society for Clinical Chemistry (SSCC).Author contributions: All the authors have accepted responsibility for the entire content of this submitted manuscript and approved submission.Research funding: None declared.Employment or leadership: None declared.Honorarium: None declared.Competing interests: The funding organization(s) played no role in the study design; in the collection, analysis, and interpretation of data; in the writing of the report; or in the decision to submit the report for publication.
References1. Horn PS, Pesce AJ. Reference intervals: an update. Clin Chim
Acta 2003;334:5–23.2. Johnson AM, Hyltoft Petersen P, Whicher JT, Carlstrom A,
MacLennan S. Reference intervals for serum proteins: similarities and differences between adult Caucasian and Asian Indian males in Yorkshire, UK. Clin Chem Lab Med 2004; 42:792–9.
3. IFCC and CLSI. C28-A3 document. Defining, establishing and verifying reference intervals in the clinical laboratory: approved guideline, 3rd ed., vol. 28 No. 30; 2008.
4. Solberg HE, Stamm D. International Federation of Clinical Chemistry (IFCC) IFCC recommendation. The Theory of Reference Values. Part 4. Control of analytical variation in the produc-tion, transfer and application of reference values. Ann Biol Clin (Paris) 1991;49:487–90.
5. Horn PS, Pesce AJ. Effect of ethnicity on reference intervals. Clin Chem 2002;48:1802–4.
6. El-Hazmi MA, Warsy AS. Evaluation of serum cholesterol and triglyceride levels in 1-6-year-old Saudi children. J Trop Pediatr 2001;47:181–5.
7. Ardawi MS, Maimani AA, Bahksh TA, Rouzi AA, Qari MH, Raddadi RM. Reference intervals of biochemical bone turnover markers for Saudi Arabian women: a cross-sectional study. Bone 2010;47:804–14.
8. Scott TG. A pilot study of the reference values for the commoner haematological and biochemical parameters in Saudi nationals. J Clin Pathol 1982;35:69–73.
9. Tamimi W, Albanyan E, Altwaijri Y, Tamim H, Alhussein F. Age- and gender-specific reference intervals for fasting blood glucose and lipid levels in school children measured with abbott architect c8000 chemistry analyzer. Indian J Clin Biochem 2012;27:141–6.
10. El-Hazmi MA, Al-Faleh FZ, Al-Mofleh IA, Warsy AS, Al-Askah AK. Establishment of normal “reference” ranges for biochemi-cal parameters for healthy Saudi Arabs. Trop Geogr Med 1982;34:323–32.
11. Ichihara K, Boyd JC, IFCC Committee on Reference Intervals and Decision Limits (C-RIDL). An appraisal of statistical procedures used in derivation of reference intervals. Clin Chem Lab Med 2010;48:1537–51.
12. Ichihara K. Statistical considerations for harmonization of the global multicenter study on reference values. Clin Chim Acta 2014;432:108–18.
13. Ozarda Y, Ichihara K, Barth JH, Klee G; Committee on Reference Intervals and Decision Limits (C-RIDL), International Federation for Clinical Chemistry and Laboratory Medicine. Protocol and standard operating procedures for common use in a worldwide multicenter study on reference values. Clin Chem Lab Med 2013;51:1027–40.
14. Ichihara K, Ceriotti F, Tam TH, Sueyoshi S, Poon PM, Thong ML, et al. The Asian project for collaborative derivation of refer-ence intervals: (1) strategy and major results of standardized analytes. Clin Chem Lab Med 2013;51:1429–42.
15. Ichihara K, Ceriotti F, Kazuo M, Huang YY, Shimizu Y, Suzuki H, et al. The Asian project for collaborative derivation of reference intervals: (2) results of non-standardized analytes and transfer-ence of reference intervals to the participating laboratories on the basis of cross-comparison of test results. Clin Chem Lab Med 2013;51:1443–57.

Borai et al.: Reference interval study in Saudi Arabia 855
16. Ichihara K, Itoh Y, Lam CW, Poon PM, Kim JH, Kyono H, et al. Sources of variation of commonly measured serum analytes in 6 Asian cities and consideration of common reference intervals. Clin Chem 2008;54:356–65.
17. Ichihara K, Kawai T. Determination of reference intervals for 13 plasma proteins based on IFCC international reference prepara-tion (CRM470) and NCCLS proposed guideline (C28-P,1992): trial to select reference individuals by results of screening tests and application of maximal likelihood method. J Clin Lab Anal 1996;10:110–17.
18. Ichihara K, Ozarda Y, Klee G, Straseski J, Baumann N, Ishikura K, et al. Utility of a panel of sera for the alignment of test results in the worldwide multicenter study on reference values. Clin Chem Lab Med 2013;51:1007–25.
19. Alqurashi KA, Aljabri KS, Bokhari SA. Prevalence of diabetes mellitus in a Saudi community. Ann Saudi Med 2011;31: 19–23.
20. Allam AR, Taha IM, Al-Nozha OM, Sultan IE. Nutritional and health status of medical students at a university in Northwest-ern Saudi Arabia. Saudi Med J 2012;33:1296–03.
21. Lin J, Zhang M, Song F, Qin J, Wang R, Yao P, et al. Association between C-reactive protein and pre-diabetic status in a Chinese Han clinical population. Diabetes Metab Res Rev 2009; 25:219–23.
22. Sabanayagam C, Shankar A, Lim SC, Lee J, Tai ES, Wong TY. Serum C-reactive protein level and prediabetes in two Asian populations. Diabetologia 2011;54:767–75.
23. Alberti KG, Zimmet PZ. Definition, diagnosis and classification of diabetes mellitus and its complications. Part 1: diagnosis and classification of diabetes mellitus provisional report of a WHO consultation. Diabet Med 1998;15:539–53.
24. Expert Panel on Detection E, Treatment of High Blood Cholesterol in A. Executive Summary of The Third Report of The National Cholesterol Education Program (NCEP) Expert Panel on Detection, Evaluation, And Treatment of High Blood Cholesterol In Adults (Adult Treatment Panel III). J Am Med Assoc 2001;285:2486–97.
25. Kogiso T, Moriyoshi Y, Shimizu S, Nagahara H, Shiratori K. High-sensitivity C-reactive protein as a serum predictor of nonalcoholic fatty liver disease based on the Akaike Information Criterion scoring system in the general Japanese population. J Gastroenterol 2009;44:313–21.
26. Rahman Al-Nuaim A. High prevalence of metabolic risk factors for cardiovascular diseases among Saudi population, aged 30-64 years. Int J Cardiol 1997;62:227–35.
27. Al-Nozha M, Al-Khadra A, Arafah MR, Al-Maatouq MA, Khalil MZ, Khan NB, et al. Metabolic syndrome in Saudi Arabia. Saudi Med J 2005;26:1918–25.
28. Afifi MM. Metabolic syndrome in Saudi Arabia. Saudi Med J 2006;27:1087; author reply 1088.
29. Alarouj M, Bennakhi A, Alnesef Y, Sharifi M, Elkum N. Diabe-tes and associated cardiovascular risk factors in the State of Kuwait: the first national survey. Int J Clin Pract 2013;67:89–96.
30. Alharbi NS, Almutari R, Jones S, Al-Daghri N, Khunti K, de Lusignan S. Trends in the prevalence of type 2 diabetes mellitus and obesity in the Arabian Gulf States: systematic review and meta-analysis. Diabetes Res Clin Pract 2014;106:e30–33.
Supplemental Material: The online version of this article (DOI: 10.1515/cclm-2015-0490) offers supplementary material, available to authorized users.