Essential Performance Indicators for North Dakota the state’s actual performance score to the...
80
Midwestern Higher Education Compact 2012-2013 Advancing Postsecondary Opportunity, Completion, and Productivity Essential Performance Indicators for North Dakota and Selected Peer States
Transcript of Essential Performance Indicators for North Dakota the state’s actual performance score to the...

12012-13 State Performance Indicators
Midwestern Higher Education Compact
2012-2013
Advancing Postsecondary Opportunity, Completion,and Productivity
Essential Performance Indicators for
North Dakotaand Selected Peer States

22012-13 State Performance Indicators

32012-13 State Performance Indicators
Table of Contents1 Introduction6 Summary of State Performance Indicators
9 TARGET OUTCOMES
10 Postsecondary Enrollment 11 College enrollment directly after high school12 Postsecondary enrollment among older adults13 Undergraduate enrollment by race/ethnicity15 Postsecondary enrollment among low-income
students
16 Postsecondary Degree Completion 17 Graduation rates at two-year and four-year
institutions 21 Graduation rates by ethnicity at public four-
year institutions
22 System Effi ciency 23 Credentials awarded per expenditure
26 LEVERAGE POINTS
27 Academic Preparation 28 Children ages 3 to 4 enrolled in preschool 29 Academic profi ciency of 8th grade students 31 Rate of high school graduation 32 Proportion of college-bound students
who demonstrate college-ready academic achievement
34 Affordability 35 Percentage of family income needed to pay for
college 39 Monthly savings needed to pay for four years
of college 40 Average student loan debt
41 Effectiveness and Effi ciency of Postsecondary Institutions
42 Diffusion of high-impact educational experiences: study abroad
43 Promotion of timely degree completion 44 Education and related expenditures for total
degree production
45 POLICY INSTRUMENTS
46 Investments 47 Pre-K education expenditures per student 49 K-12 education expenditures per student 51 Overall public funding for higher education 53 State appropriations for postsecondary
institutions 56 Need-based grant aid allocations 58 Policies for Improving Educational Quality59 Pre-K policy rating 60 K-12 policy rating 61 Postsecondary policy rating 62 State data system rating
63 APPENDICES
64 Enrollment in International Perspective 65 Educational Attainment in International
Perspective66 Weights Used for Performance Scores70 Endnotes

22012-13 State Performance Indicators

12012-13 State Performance Indicators
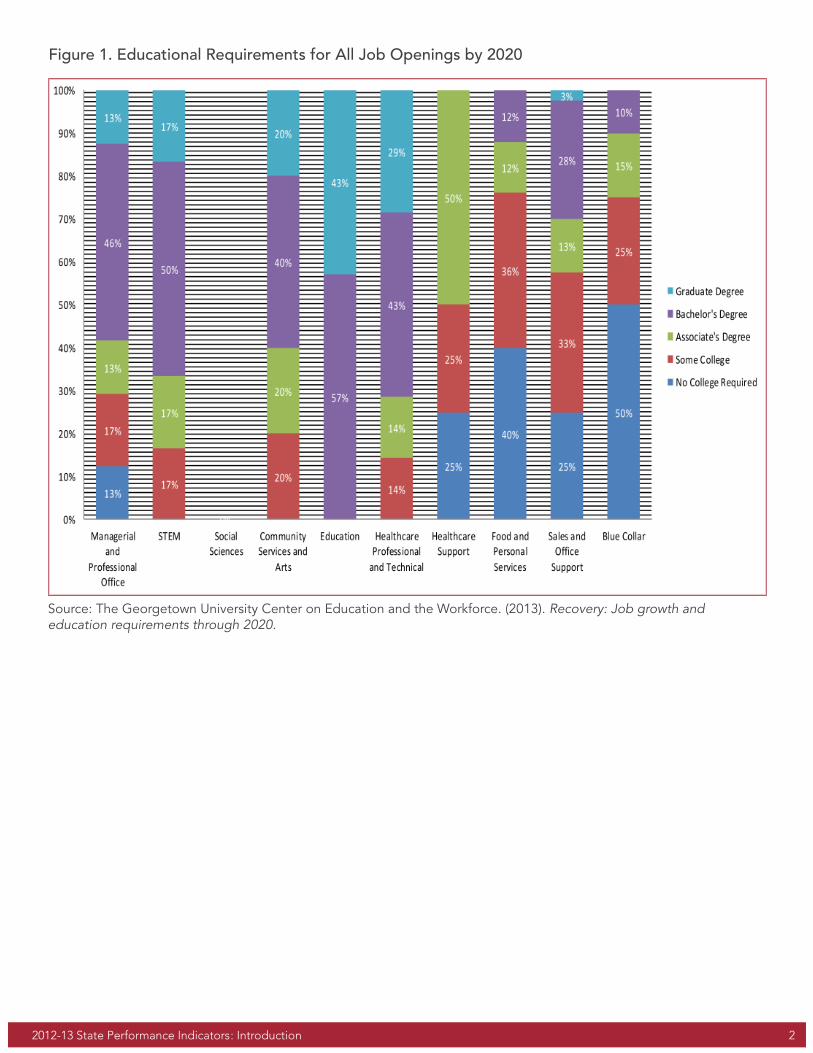
Technological advancement, global competition, and the emerging knowledge-innovation economy are driving an increasing demand for postsecondary education and training. In the United States, approximately 65 percent of all jobs in 2020 will require some level of postsecondary education, and the demand will reach 72 percent in North Dakota.1 The demand for postsecondary education in North Dakota will be heavily concentrated in managerial, STEM, community service, education, and healthcare industries (see Figure 1).2 Demand will be lowest in “blue collar” industries, including farming, fi shing, forestry, construction and extraction, installation, maintenance, production, and transportation.
These same projections for 2020 suggest that the demand for adults who possess an associate’s degree or higher could reach 60 percent by 2025. This scenario has helped to guide Lumina Foundation’s state-by-state assessment of degree production trends.3 If the historical rate of educational attainment in North Dakota were to remain constant through 2025, approximately 54 percent of adults would possess an associate’s degree or higher. Accordingly, a degree gap of 6 percentage points is projected in North Dakota by 2025 if current trends continue.
As indicated in Figures 2a-b, the ability of policymakers to close the degree gap carries signifi cant implications for state revenue. If the current rate of degree production remains constant, state revenue in 2025 will be $15 million less than it is today. Conversely, if the degree gap is closed, over $27 million in additional revenue will be generated through income tax, sales tax, property tax, Medicaid savings, and corrections savings. Moreover, policies that effectively raise levels of educational attainment will yield important civic and health benefi ts.4 Indeed, Table 1 indicates that rates of voting, volunteerism, and healthful prenatal care are higher among individuals with at least a bachelor’s degree than those with only a high school diploma or GED.5 Health risk factors such as smoking are less prevalent among individuals who have a bachelor’s degree or higher. Residents of North Dakota also benefi t from higher education in terms of higher earnings and lower unemployment.
This report portrays various performance indicators that are intended to facilitate an assessment of the postsecondary education system in your state. Descriptive statistics are presented for your state and fi ve other comparison states as well as the nation. Comparison states were selected according to the degree of similarity of population characteristics, capital advantages, and market conditions.6 Indicators in the fi rst section, Target Outcomes, assess progress towards the key goal of increasing the number of people who enroll in college and complete a high-quality degree as effi ciently as possible. The second section, Leverage Points, provides indicators relevant to intermediate outcomes associated with postsecondary degree production, including academic preparation, affordability, and institutional effectiveness. The fi nal section, Policy Instruments, focuses on some of the system resources and policies needed to infl uence leverage points and target outcomes.
Increasing Educational Attainment in North Dakota: An Imperative for Future Prosperity
: Introduction
22012-13 State Performance Indicators
Figure 1. Educational Requirements for All Job Openings by 2020
Source: The Georgetown University Center on Education and the Workforce. (2013). Recovery: Job growth and education requirements through 2020.
: Introduction

32012-13 State Performance Indicators
Figure 2a. State Revenues Generated from the Current Rate of Degree Production
Source: National Center for Higher Education Management Systems and CLASP. (2012). Calculating the economic value of increasing college credentials by 2025.
: Introduction

42012-13 State Performance Indicators
Figure 2b. State Revenues Generated from Closing the Degree Gap
Source: National Center for Higher Education Management Systems and CLASP. (2012). Calculating the economic value of increasing college credentials by 2025.
: Introduction

52012-13 State Performance Indicators
Table 1. Civic, Health, and Economic Benefi ts of Higher Education
Benefi t TypeNorth
Dakota
Top Comparison
StateNational Average
CivicVoting rate in the 2008 presidential election among individuals with a high school diploma vs. bachelor’s degree7 – – 55%/77%
Volunteerism rate among individuals with a high school diploma vs. bachelor’s degree or higher8 – – 17.9%/42.3%
HealthPercentage of mothers 20 years of age and older with low birth-weight live births (less than 5.5 pounds): High school diploma vs. bachelor’s degree or higher9
– – 8.3%/6.8%
Breastfeeding among mothers 15-44 years of age: High school diploma vs. bachelor’s degree10
– – 43.2%/74.6%
Age-adjusted prevalence of smoking among persons 25 years of age and older: High school diploma vs. bachelor’s degree11
– – 28.7%/9.0%
Economic
Average difference in earnings between associate’s degree/some college and high school diploma in 2010 (25 years and older)12
$4,477 $6,229(Minnesota)
$5,579
Average difference in earnings between bachelor’s degree and high school diploma in 2010 (25 years and older)13 $13,856
$21,276(Minnesota)
$21,073
Average unemployment rate in 2010: High school diploma vs. bachelor’s degree14 4.5%/1.3%
6.8%/1.7% (South
Dakota)10.3%/5.4%
Difference in median state income tax revenue: High school diploma vs. bachelor’s degree15 $898
$1,500 (Minnesota)
–
: Introduction

62012-13 State Performance Indicators
Indicator Category Current Score TrendAspirational
Score
•• Postsecondary Enrollment: General
Rate of college enrollment directly after high school 69% Decreasing 72%
Rate of postsecondary enrollment among older adults 7% Increasing 8%
•• Postsecondary Enrollment: Achievement Gap
Undergraduate enrollment rate of disadvantaged minority students at public four-year institutions
7% Stable 11%
Postsecondary enrollment rate among low-income students 39% Increasing 49%
•• Degree Completion: General
Graduation rate at public two-year colleges 48% Increasing 32%
Graduation rate at public four-year colleges 48% Decreasing 67%
•• Degree Completion: Achievement Gap
Graduation rate by ethnicity at public four-year institutions: average gap between disadvantaged minority students and White students
23 percentage points
Increasing (gap) 0.5
•• System Effi ciency
Credentials awarded per expenditure: Public two-year colleges 3.5 — 4.2
Credentials awarded per expenditure: Public master’s universities 2.3 — 2.6
Credentials awarded per expenditure: Public research universities 1.4 — 1.9
•• Degree Quality
A common limitation of presenting a large compendium of indicators is the diffi culty of distilling a few reasonable judgments about system performance. This report provides one method of summarizing state performance indicators associated with target outcomes, leverage points, and policy instruments. As indicated in Tables 2-4, over 35 performance indicators used in this report are enumerated within 14 categories. The state’s performance score for each indicator is evaluated in relation to an aspirational score, such as the average of the top 10 states, and then assigned a weight that refl ects the priority of improvement relative to the aims of effectiveness and effi ciency (see Appendix B). Category scores are computed as the sum of weighted indicator scores. One of three colors - red, yellow, or green - is then used to refl ect the proximity of the state’s actual performance score to the aspirational score. In most cases, the thresholds were set accordingly: red (the weighted score is less than 70 percent of the aspirational score); yellow (the weighted score is 70 to 89 percent of the aspirational score); and green (the weighted score is 90 to 100 percent of the aspirational score). Each color thus represents the overall performance and need for improvement: red (high need for improvement), yellow (moderate need for improvement), and green (state approximates or exceeds aspirational score). However, state performance was not rated in three categories – Degree Quality, Effi ciency of Postsecondary Institutions, and Investments – due to the current lack of indicators or diffi culty in establishing appropriate benchmarks. Finally, the recent trend in state performance is described as decreasing, stable, or increasing. Trends are defi ned from multi-year indicators by comparing performance from the present year and the most recent year depicted in the corresponding fi gure (e.g., 2013 compared to 2006). Trends for indicators that only portray present performance are either omitted or estimated in relation to performance levels documented in a previous year’s state report.
Summary of State Performance Indicators
Table 2. Performance Summaries for Target Outcomes
•• Approximates or exceeds aspirational score •• Moderate need for improvement •• High need for improvement •• Performance not rated
: Summary

72012-13 State Performance Indicators
Indicator Category Current Score TrendAspirational
Score
•• Academic Preparation: General
Percentage of children ages 3 to 4 enrolled in preschool 34% Increasing 93%
Percentage of 8th grade students scoring at or above profi ciency in math
41% Increasing 55%
Percentage of 8th grade students scoring at or above profi ciency in reading
34% Stable 47%
Percentage of 8th grade students scoring at or above profi ciency in science
45% — 48%
Rate of high school graduation 88% Increasing 91%
Percentage of college-bound students who demonstrate college-ready academic achievement: English
61% — 78%
Percentage of college-bound students who demonstrate college-ready academic achievement: Reading
41% — 57%
Percentage of college-bound students who demonstrate college-ready academic achievement: Math
43% — 62%
Percentage of college-bound students who demonstrate college-ready academic achievement: Science
35% — 52%
•• Academic Preparation: Achievement Gap
Percentage of 8th grade students scoring at or above profi ciency in math: Lower vs. Higher income students
26 percentage points
Increasing (gap) 0
Percentage of 8th grade students scoring at or above profi ciency in reading: Lower vs. Higher income students
22 percentage points
Increasing (gap) 0
Percentage of 8th grade students scoring at or above profi ciency in science: Lower vs. Higher income students
20 percentage points
— 0
•• Affordability: Middle Class
Percentage of family income needed to pay for college 18% Stable 19%
Monthly savings over 18 years needed to pay for four year of college
$314 Increasing $195
Average student loan debt $27,802 — $19,982
•• Affordability Gap
Percentage of family income needed to pay for college: Lower vs. Median income families, two-year colleges
14 percentage points
Stable (gap) 0
Percentage of family income needed to pay for college: Lower vs. Median income families, four-year colleges
22 percentage points
Stable (gap) 0
•• Effectiveness of Postsecondary Institutions: Four-Year Colleges
Public four-year effectiveness in promoting degree completion -2.47 — 1.00
•• Effi ciency of Postsecondary Institutions: Four-Year Colleges
Educational expenditures index 0.15 (expenditures approximate expected level)
— —
Table 3. Performance Summaries for Leverage Points
•• Approximates or exceeds aspirational score •• Moderate need for improvement •• High need for improvement •• Performance not rated
: Summary

82012-13 State Performance Indicators
Indicator Category Current Score TrendAspirational
Score
•• Investments (prior to FY 2013)16
Pre-K Expenditures per Student: Percentage actual of ideal 0% Stable 100%
K-12 Expenditures per Student $10,671 Decreasing —
State fi scal support for higher education per $1,000 of personal income
$9.65 Decreasing —
State fi scal support for higher education as a percentage of total state revenue
8.9% Decreasing —
State appropriations for postsecondary institutions as a proportion of average education and related expenditures
52-74% — —
Average award of State Need-based Grant Aid $1,351 Increasing —
State Need-Based Grant Aid: Total State Aid as a percentage of Federal Pell Grant Aid
19% Increasing —
•• Policies for Improving Educational Quality: PK-12
Pre-K policy rating: Percent of standards met 0% Stable 100%
K-12 policy rating: Percent of standards met 64% — 100%
•• Policies for Improving Educational Quality: Postsecondary
Postsecondary policy: Student learning outcomes state reporting
0% Stable 100%
Table 4. Performance Summaries for Policy Instrument Indicators
•• Approximates or exceeds aspirational score •• Moderate need for improvement •• High need for improvement •• Performance not rated
: Summary

92012-13 State Performance Indicators
TARGET OUTCOMES
: Target Outcomes

102012-13 State Performance Indicators
Postsecondary enrollment has steadily grown over the past few decades as the perceived value of postsecondary credentials has risen. Total undergraduate enrollment in the nation’s degree-granting institutions increased by 34 percent between 2000 and 2009, from 13.2 million to 17.6 million.17 Nonetheless, enrollment gaps remain among some demographic segments, such as those defi ned by race/ethnicity, socioeconomic status, and age. The identifi cation of these gaps can inform strategies for reducing access barriers and expanding postsecondary enrollment and educational opportunity.
Indicators in this section include:
» College Enrollment Directly after High School » Postsecondary Enrollment among Older Adults » Undergraduate Enrollment by Race/Ethnicity » Postsecondary Enrollment among Low-Income Students
Postsecondary Enrollment
: Target Outcomes

112012-13 State Performance Indicators
High school seniors bound for college make a crucial decision of whether to enroll in college immediately after graduating from high school or to delay enrollment for a semester or longer. The decision is consequential since postponed enrollment is associated with future obstacles to degree completion, such as the decay of academic skills and knowledge, the loss of relevant social capital (e.g., college-oriented friends, counselors), and the adoption of competing roles and obligations (e.g., work, marriage, family). Recent research has indicated that the odds of obtaining a bachelor’s degree decrease by 5 percent for every month that a student delays postsecondary enrollment after graduating from high school.18 The rate of direct enrollment is thus a valid concern for policymakers. As indicated in Figures 3a-b, approximately 18 percent of high school graduates in North Dakota directly enroll in an associate’s or certifi cate-granting college, and 51 percent of high school graduates directly enroll in a four-year institution.
College Enrollment Directly after High School
Figure 3a. Percentage of High School Graduates Going Directly to an Associate’s or Certifi cate-Granting College
Source: IPEDS. (2013). Enrollment. Common Core of Data. (2013). State diploma recipients/completers. Private School Universe Survey. (2013). High school graduates.
: Target Outcomes
Figure 3b. Percentage of High School Graduates Going Directly to a Four-Year Institution

122012-13 State Performance Indicators
The expansion of postsecondary opportunities for older adults is particularly crucial for meeting future workforce demands. Figure 4 depicts the proportion of older adults enrolled in postsecondary education. In North Dakota, the proportion of older residents enrolled in college increased between 1991 and 2009. North Dakota’s rate of enrollment among residents aged 25-49 without a bachelor’s degree in 2009 (7 percent) approximates the national average.
Postsecondary Enrollment Among Older Adults
Figure 4. Percentage of Population Enrolled in College: Persons Aged 25-49 without a Bachelor’s Degree
Source: National Center for Higher Education Management Systems. (2011). Enrollment of 25-49 year olds as a percent of 25-49 year olds with no bachelor’s degree or higher.
: Target Outcomes

132012-13 State Performance Indicators
The postsecondary enrollment of traditionally under-represented students has been a priority in states committed to promoting equal opportunity and economic growth, particularly as state populations become more racially and ethnically diverse. Figures 5a and 5b provide a comparison of the demographic composition of state populations aged 18-24 to current postsecondary enrollment in public two- and four-year institutions, respectively. The fi gures demonstrate that students of under-represented ethnic and racial backgrounds tend to enroll at relatively higher rates at two-year institutions than do White students. The converse holds true at public four-year institutions. For example, Figure 5b indicates that while American Indian residents aged 18-24 comprise 6 percent of the population in North Dakota, only 2 percent of full-time undergraduate students (any age) at public four-year institutions are American Indian.19 In contrast, they constitute six percent of students at two-year institutions.
Undergraduate Enrollment by Race/Ethnicity
Figure 5a. North Dakota State Racial Composition for Persons Aged 18-24 and First-Time, Full-Time, Degree-Seeking Student Enrollment in North Dakota Public Two-Year Institutions
Source: U.S. Census Bureau. (2012). 2010 U.S. Census Summary Files. Integrated Postsecondary Education Data System. (2012). Student enrollment: 2011.
: Target Outcomes

142012-13 State Performance Indicators
Figure 5b. North Dakota State Racial Composition for Persons Aged 18-24 and First-Time, Full-Time, Degree-Seeking Student Enrollment in North Dakota Public Four-Year Institutions
Source: U.S. Census Bureau. (2012). 2010 U.S. Census Summary Files. Integrated Postsecondary Education Data System. (2012). Student enrollment: 2011.
: Target Outcomes

152012-13 State Performance Indicators
Students from low-income families have traditionally faced academic, social, and fi nancial barriers to college enrollment. States continue to address such barriers through PK-12 improvement initiatives, postsecondary encouragement programs, and student grant aid. The rate of enrollment among low-income students has increased in North Dakota over the past few years (see Figure 6).20 The current rate of 39 percent equals the national average but falls below the rates observed in several peer states.
Postsecondary Enrollment among Low-Income Students
Figure 6. Undergraduate Enrollment Rate of Low-Income Students over Time
Source: Postsecondary Education Opportunity. (2012). College participation rates for students from low income families by state.
: Target Outcomes

162012-13 State Performance Indicators
While many states have made signifi cant gains in the rate of postsecondary enrollment, rates of degree completion across the nation have largely remained steady and below the level expected by policymakers. Nationally, only 29 percent of students who enroll in a two-year college graduate within 3 years, and 56 percent of students who enroll in a four-year institution graduate with a bachelor’s degree within 6 years.21 The failure to complete a degree program has negative consequences for both students and states. Since employers are more likely to demand an educational credential than a specifi c number of postsecondary credits, a premature departure from college can severely curb one’s prospects for future employment and earnings. This is partly evident in the 2010 annual average unemployment rate of individuals with some college but no degree, which was 3.8 percentage points higher than the unemployment rate of individuals with a bachelor’s degree.22 Moreover, individuals who have attained a bachelor’s degree earn 26 percent more than those who have completed 16 years of schooling without graduating from college.23 Low completion rates can thus translate into liabilities and an impoverished tax base for states and local communities.
Indicators in this section include:
» Graduation Rates at Two-Year and Four-Year Institutions24
» Graduation Rates by Ethnicity at Public Four-Year Institutions
Postsecondary Degree Completion
: Target Outcomes

172012-13 State Performance Indicators
A commonly used metric for degree completion is graduation from a two-year institution within three years and graduation from a four-year institution within six years. Figure 7a shows that the public two-year graduation rate in North Dakota is above the national average and the rates in most peer states. The public four-year graduation rate in North Dakota was 48 percent, which was lower than the national average and the rates in most comparison states (see Figure 7b). Figure 7c demonstrates that North Dakota’s private nonprofi t colleges and universities have lower graduation rates than private nonprofi t institutions in all peer states. Data were missing for North Dakota’s private for-profi t college (see Figure 7d).
Graduation Rates at Two-Year and Four-Year Institutions
Figure 7a. Graduation Rates at Public Two-Year Institutions
Source: Integrated Postsecondary Education Data System (2013). Graduation.
: Target Outcomes

182012-13 State Performance Indicators
Figure 7b. Graduation Rates at Public Four-Year Institutions
Source: Integrated Postsecondary Education Data System (2013). Graduation.
: Target Outcomes

192012-13 State Performance Indicators
Figure 7c. Graduation Rates at Private Non-Profi t Four-Year Institutions
Source: Integrated Postsecondary Education Data System (2013). Graduation.
: Target Outcomes

202012-13 State Performance Indicators
Figure 7d. Graduation Rates at Four-Year Private For-Profi t Institutions
Source: Integrated Postsecondary Education Data System (2013). Graduation. Note. Data were missing for some years.
: Target Outcomes

212012-13 State Performance Indicators
Figure 8 depicts the six-year graduation rates for students of various ethnic backgrounds. Graduation rates were highest among White and Asian students. Graduation rates were lowest among African Americans (31 percent), American Indians (30 percent), and Hispanics (25 percent). Moreover, the graduation rates of African American, Hispanic, and American Indian students have decreased over the past few years.
Graduation Rates by Ethnicity at Public Four-Year Institutions
Figure 8. 6-Year Graduation Rates by Ethnicity at North Dakota Public Four-Year Institutions
Source: Integrated Postsecondary Education Data System (2013). Graduation.
: Target Outcomes

222012-13 State Performance Indicators
Under conditions of fi nancial exigency, states and institutions are pressed to produce graduates with high-quality degrees or certifi cates at the lowest possible cost. The measurement of effi ciency, though, is particularly diffi cult due to the labor-intensive process of educating students, the challenges of scalability in academic environments, and changing workforce demands. Policymakers should thus interpret indicators of effi ciency with caution, while recognizing that producing a skilled labor force requires signifi cant investments in time and fi nancial resources.
Indicators in this section include:
» Credentials Awarded per Expenditure
System Effi ciency
: Target Outcomes

232012-13 State Performance Indicators
Revenue-based indicators of effi ciency are helpful for comparing states on the use of educational resources. Figures 9a-c depict state performance according to the number of credentials awarded per $100,000 of education and related expenditures.25 Performance on this measure among North Dakota’s institutions approximates or exceeds the national average and the effi ciency levels in several peers states.26
Credentials Awarded per Expenditure
Figure 9a. Credentials Awarded Per $100,000 of Education and Related Expenditures: Public Two-Year Colleges
Source: Integrated Postsecondary Education Data System (2013). Completions, Finance.
: Target Outcomes

242012-13 State Performance Indicators
Figure 9b. Credentials Awarded Per $100,000 of Education and Related Expenditures: Public Master’s Universities
Source: Integrated Postsecondary Education Data System (2013). Completions, Finance.
: Target Outcomes
,

252012-13 State Performance Indicators
Figure 9c. Credentials Awarded Per $100,000 of Education and Related Expenditures: Public Research Universities
Source: Integrated Postsecondary Education Data System (2013). Completions, Finance.
: Target Outcomes

262012-13 State Performance Indicators
LEVERAGE POINTS
: Leverage Points

272012-13 State Performance Indicators
The extent to which students are academically prepared for college predicts degree completion beyond the effects of race/ethnicity, socioeconomic status, institutional selectivity, attendance patterns, and academic performance during college.27 Academic preparation thus constitutes a key leverage point for improving postsecondary outcomes. However, the cumulative nature of both academic competencies and defi cits necessitates an assessment of academic preparedness that spans pre-K education, middle school, and high school.
Indicators in this section include:
» Children Ages 3 to 4 Enrolled in Preschool » Academic Profi ciency of 8th Grade Students » Rate of High School Graduation » Proportion of College-bound Students who Demonstrate College-ready Academic Achievement
Academic Preparation
: Leverage Points

282012-13 State Performance Indicators
Early childhood education provides a critical foundation for successfully managing subsequent academic challenges. Relative to children in control groups, participants in high-quality, educationally-focused programs have exhibited greater long-term gains in IQ, lower rates of grade retention and special education placements, and higher rates of high school graduation and college attendance.28 Moreover, the benefi t-cost ratios of such programs have varied from 2.5 to 16.2. Figure 10 demonstrates that the rate of enrollment in preschool among children ages 3 to 4 is lower in North Dakota than in all peer states. The current rate of preschool enrollment in North Dakota can also be contrasted with the national average rate of school enrollment among children ages 5 to 6 (93 percent).29
Children Ages 3 to 4 Enrolled in Preschool
Figure 10. Children ages 3 to 4 enrolled in preschool
Source: The Annie E. Casey Foundation Kids Count Data Center. (2013). Early childhood indicators.
: Leverage Points

292012-13 State Performance Indicators
The successful completion of rigorous coursework in high school is signifi cantly determined by whether students enter high school with foundational skills and knowledge in such areas as math, reading, and science. In fact, 8th grade academic achievement has been found to be the most signifi cant predictor of college readiness among 12th grade students.30 As indicated in Figure 11a, less than half of students in North Dakota and comparison states score at or above the profi ciency level in math, reading, or science on the National Assessment of Educational Progress (NAEP). Moreover, Figure 11b reveals wide disparities in performance between students from low- and higher-income families.31
Academic Profi ciency of 8th Grade Students
Figure 11a. NAEP 8th Grade Math, Reading, and Science Scores: All Students At or Above Profi cient Level
Source: National Center for Education Statistics. (2013). National assessment of educational progress: 2013.
: Leverage Points

302012-13 State Performance Indicators
Figure 11b. NAEP 8th Grade Math, Reading, and Science Scores: Low- and Higher-Income Students At or Above Profi cient Level
Source: National Center for Education Statistics. (2013). National assessment of educational progress: 2011, 2013.
: Leverage Points

312012-13 State Performance Indicators
The completion of high school or its equivalent is required for college admission. In North Dakota, the percentage of 9th grade students who graduate from high school four years later has risen since 2005 (see Figure 12). The graduation rate in North Dakota is well above the national average.32
Rate of High School Graduation
Figure 12. Public High School Graduation Rates Over Time
Source: NCES. (2013). Common core of data.
: Leverage Points

322012-13 State Performance Indicators
Students who enter college with a high level of academic preparedness are less likely to need remedial education and are more likely to complete their degrees on time. Academic preparedness can be assessed by the proportion of students taking the ACT who meet college readiness benchmarks. Benchmark scores in English, math, reading, and science delineate a 75 percent likelihood of attaining at least a “C” in fi rst-year college courses (e.g., biology).33 Figure 13a demonstrates that nearly all high school graduates in North Dakota take the ACT. Figure 13b indicates that a large proportion of ACT-tested high school graduates did not meet the benchmark in each subject area.
Proportion of College-bound Students who Demonstrate College-ready Academic Achievement
Figure 13a. Percentage of High School Graduates Taking ACT
Source: ACT. (2013). 2013 national and state scores.
: Leverage Points

332012-13 State Performance Indicators
Figure 13b. Percentage of ACT-Tested High School Graduates Who Met or Exceeded College Readiness Benchmark Scores
Source: ACT. (2013). College readinesss benchmark attainment by state: 2013.
: Leverage Points

342012-13 State Performance Indicators
The affordability of higher education has become a growing concern for students, parents, and policymakers. Over the past few decades, college tuition and fees have increased at more than four times the rate of consumer prices partly in response to reductions in state and local funding. For instance, tuition revenue per student at public research universities increased by $369 between 2008 and 2009, a time during which state and local appropriations per student decreased by $751.34 Such precipitous increases in tuition have occurred while the incomes of many low- and middle-class families have stagnated or declined. Accordingly, states play an increasingly critical role in determining the relative affordability of public colleges and universities.
Indicators in this section include:
» Percentage of Family Income Needed to Pay for College » Monthly Savings Needed to Pay for Four Years of College » Average Student Loan Debt
Affordability
: Leverage Points

352012-13 State Performance Indicators
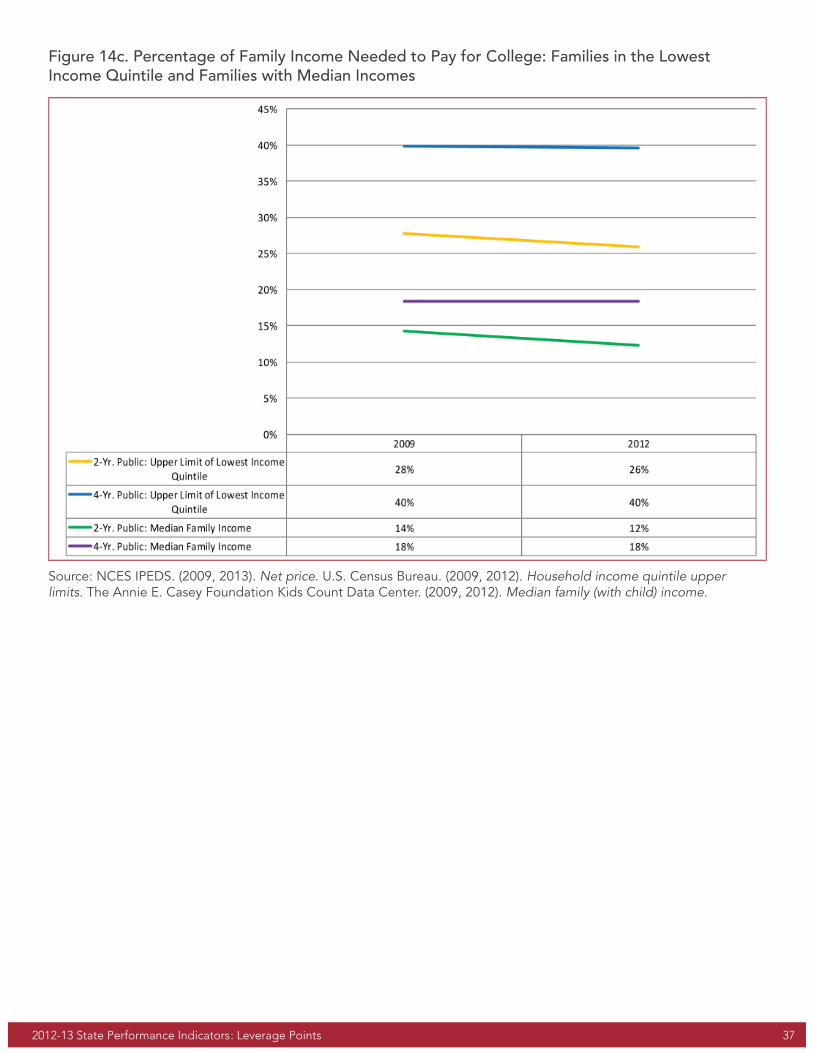
A key challenge in promoting fi nancial access is to ensure that students and families can manage the net price of college, that is, the cost of tuition, room, and board after subtracting grant aid. Figure 14a demonstrates that the average net cost of full-time enrollment at a public four-year institution has increased over the past few years in North Dakota, though it remains below the national average.35 Despite the higher net price, Figure 14b shows that the net cost of college as a percentage of family income has remained constant in North Dakota. Moreover, Figure 14c indicates that college affordability in North Dakota is highly contingent on family income. Families with median incomes in North Dakota would need to allocate between 12 and 18 percent of their incomes to pay for college. In contrast, college attendance for low-income students requires between 26 and 40 percent of family income.
Percentage of Family Income Needed to Pay for College
Figure 14a. Net Price of One Year of Full-Time Enrollment at a Public Four-Year Institution
Source: NCES IPEDS. (2009, 2013). Net price.
: Leverage Points

362012-13 State Performance Indicators
Figure 14b. Percentage of Family Income Needed to Pay for Full-Time Enrollment at a Public Four-Year College: Families with Median Incomes
Source: NCES IPEDS. (2009, 2013). Net price. The Annie E. Casey Foundation Kids Count Data Center. (2009, 2012). Median family (with child) income.
: Leverage Points
372012-13 State Performance Indicators
Figure 14c. Percentage of Family Income Needed to Pay for College: Families in the Lowest Income Quintile and Families with Median Incomes
Source: NCES IPEDS. (2009, 2013). Net price. U.S. Census Bureau. (2009, 2012). Household income quintile upper limits. The Annie E. Casey Foundation Kids Count Data Center. (2009, 2012). Median family (with child) income.
: Leverage Points

382012-13 State Performance Indicators
A key indicator of college affordability is whether families can save enough money over time to pay for four years of full-time enrollment at a public college. Figures 15a-b provide two investment scenarios (10-year vs. 18-year) for a 529 college savings plan that obtains a 5 percent rate of return. According to Figure 15a, a family with the median income in North Dakota would need to save $459 per month or 8 percent of income over ten years to pay the net cost of enrolling at a public four-year institution for four years.36 Under more ideal circumstances, Figure 15b shows that a family would need to save $314 per month or 5 percent of income over 18 years. Notably, these amounts of monthly savings are much higher than the current national average college savings rate, which is $195 per month for a child aged 13-17 in a middle-income family.37
Monthly Savings Needed to Pay for Four Years of College
Figure 15a. Monthly Savings Over 10 Years Needed for Families with Median Household Incomes to Pay the Net Cost of Four Years of Full-Time Enrollment at a Public Four-Year Institution
Source: Integrated Postsecondary Education Data System (2013). Tuition. TIAA-CREF. (2013). 529 college savings tool.
: Leverage Points

392012-13 State Performance Indicators
Figure 15b. Monthly Savings Over 18 Years Needed for Families with Median Household Incomes to Pay the Net Cost of Four Years of Full-Time Enrollment at a Public Four-Year Institution
Source: Integrated Postsecondary Education Data System (2013). Tuition. TIAA-CREF. (2013). 529 college savings tool.
: Leverage Points

402012-13 State Performance Indicators
Students are increasingly using loans to fi nance their college education. Nationally, individuals in the graduating class of 2011 had an average student loan debt of $26,600 (not counting credit card debt or borrowing from family members).38 Approximately 83 percent of graduates of public four-year institutions in North Dakota had some student loan debt (i.e., institutional, state, federal, or private loans), and the average debt of $27,802 was higher than the average debt of college graduates in most comparison states (see Figure 16). Assuming a beginning salary of $41,701, the average beginning salary for the graduating class of 2011,39 the typical graduate from a public four-year institution in North Dakota will need to allocate 9 percent of his or her income to loan repayments.40 This debt burden can be contrasted with what has been classifi ed as “unmanageable debt,” which requires repayment in excess of 8 percent of income.41
Average Student Loan Debt
Figure 16. Educational Loan Debt Among Graduates of Public Four-Year Institutions
Source: Institute for College Access and Success. (2012). College InSight database: 2010-11.
: Leverage Points

412012-13 State Performance Indicators
A fundamental objective in many state accountability frameworks is to determine whether the institutional conditions of colleges and universities are conducive to student success. The student outcomes most commonly examined in this regard include levels of student engagement, student learning, degree completion, and employment. However, the availability of relevant data for interstate comparison is quite limited. Institutional effectiveness and effi ciency are variously examined here as the diffusion of high-impact educational experiences, the degree to which institutions promote timely degree completion, and the relative level of educational expenditures.
Indicators in this section include:
» Diffusion of High-Impact Educational Experiences: Study Abroad » Promotion of Timely Degree Completion » Education and Related Expenditures for Total Degree Production
Effectiveness and Effi ciency of Postsecondary Institutions
: Leverage Points

422012-13 State Performance Indicators
A useful measure of the quality of undergraduate education is the extent to which students are exposed to so-called high-impact experiences, including fi rst-year seminars, learning communities, collaborative learning, undergraduate research, service-learning, internships, capstone projects, and study abroad. Such activities tend to exert a rather strong impact on a variety of student outcomes by demanding a high degree of student effort; promoting faculty and peer interactions; exposing students to diverse people and ideas; inciting feedback from others; and applying and integrating knowledge.42 This report begins to examine the diffusion of high-impact practices by focusing on undergraduate participation in study abroad, an experience that is arguably crucial in preparing students to be internationally competitive and globally engaged.43 As indicated in Table 5, approximately 1 student studied abroad in North Dakota for every 100 students enrolled full-time, which is below the national average.
Diffusion of High-Impact Educational Experiences: Study Abroad
Table 5. Undergraduate Study Abroad Participants per 100 Students Enrolled Full-Time at Four-Year Colleges and Universities
Source: Integrated Postsecondary Education Data System (2013). Enrollment: 2011. Open Doors Data (2013). Fact sheets by states: 2011-12 data.
MHEC StateNumber of study abroad participants per
100 full-time students enrolledIllinois 3
Indiana 4
Iowa 5
Kansas 3
Michigan 3
Minnesota 6
Missouri 3
Nebraska 3
North Dakota 1
Ohio 3
South Dakota 2
Wisconsin 4
U.S. 3
: Leverage Points

432012-13 State Performance Indicators
Graduation rates are frequently used to assess the degree to which institutions promote timely degree completion. However, numerous factors that frequently lie beyond institutional control strongly infl uence degree completion, such as the socioeconomic status and academic preparedness of students. The indicator presented here thus estimates institutional effectiveness as the difference between actual graduation rates and the rates that we would predict from several structural, demographic, and contextual factors.44 Values below -1 indicate limited institutional effectiveness, and values above 1 indicate a high or very high level of effectiveness. Figure 17 indicates that the institutional effectiveness of public two-year institutions in North Dakota is high, but public four-year institutions have a more limited impact on timely degree completion.
Promotion of Timely Degree Completion
Figure 17. Institutional Effectiveness Scores based on Graduation Rates
Source: Horn, A. S. (2014). Effectiveness and effi ciency in promoting timely degree completion: A performance rating system for the states. Minneapolis, MN: Midwestern Higher Education Compact.
: Leverage Points

442012-13 State Performance Indicators
Institutional effi ciency can be partly defi ned by the relationship between educational expenditures and degree production, particularly the minimization of expenditures for a specifi c level of degree production without sacrifi cing quality.45 Although a simple cost-per-degree indicator is frequently used to assess effi ciency, education and related expenditures can vary tremendously according to the types of degrees produced (e.g., certifi cates, bachelor’s degrees, doctoral degrees), the disciplines represented (e.g., English, engineering), and other factors such as the student-faculty ratio. The indicator in this report thus estimates whether educational expenditures are lower or higher than expected, given the institution’s degree production profi le as well as structural, demographic, and contextual attributes. Values below -.25 indicate that average educational expenditures are lower than expected, which may refl ect a high level of institutional effi ciency. Values above .25 indicate that educational expenditures are higher than expected, which may refl ect either ineffi ciency or unmeasured investments associated with educational quality. Figure 18 indicates that the educational expenditures of public two-year and four-year institutions approximate the expected level in North Dakota.
Education and Related Expenditures for Total Degree Production
Figure 18. Educational Expenditures Index Scores
Source: Horn, A. S. (2014). Effectiveness and effi ciency in promoting timely degree completion: A performance rating system for the states. Minneapolis, MN: Midwestern Higher Education Compact.
: Leverage Points

452012-13 State Performance Indicators
POLICY INSTRUMENTS
: Policy Instruments

462012-13 State Performance Indicators
Substantial fi nancial investments are required to create and sustain a PK-16 educational system that meets state needs for economic and social development. State funding of K-12 education constituted approximately 20 percent of state expenditures in 2010 and forms a major contribution to the total funding for instruction (61 percent), administration (11 percent), student and staff support (10 percent), operations and management (10 percent), transportation and food services (4 percent), among other functions.46 States allocated 10 percent of their budgets to higher education in 2010,47 including general institutional operating expenses (78 percent); research, agricultural extension, and medical education (12 percent); and student fi nancial aid (10 percent).48 Various factors infl uence funding for education within any particular state, including the tax base and structure, enrollment, and state expenditures for other public services. Moreover, states differ in the strategies used to ensure that postsecondary education remains affordable for the citizenry. For instance, some concentrate funds into direct institutional appropriations, while others may focus more on need-based student aid.
Indicators in this section include:
» Pre-K Education Expenditures per Student » K-12 Education Expenditures per Student » Overall Public Funding for Higher Education » State Appropriations for Postsecondary Institutions » Need-Based Grant Aid Allocations
Investments
: Policy Instruments

472012-13 State Performance Indicators
Nationally, pre-K expenditures per child declined from $5,020 in 2002 to $3,841 in 2012.49 However, North Dakota is one of 11 states in the nation that does not currently have a state pre-K program. In order to assess the adequacy of future investments in pre-K programs, actual expenditures should be compared with the ideal expenditures needed to meet quality standards for pre-K programs (see Figure 19b).50
Pre-K Education Expenditures per Student
Figure 19a. Pre-K Expenditures per Child Enrolled (adjusted for infl ation and regional cost differences)
Source: National Institute for Early Education Research. (2012). The state of preschool 2012.
: Policy Instruments

482012-13 State Performance Indicators
Figure 19b. Ideal vs. Actual Pre-K Expenditures per Child
Source: National Institute for Early Education Research. (2012). Cost estimates per child.
: Policy Instruments
492012-13 State Performance Indicators
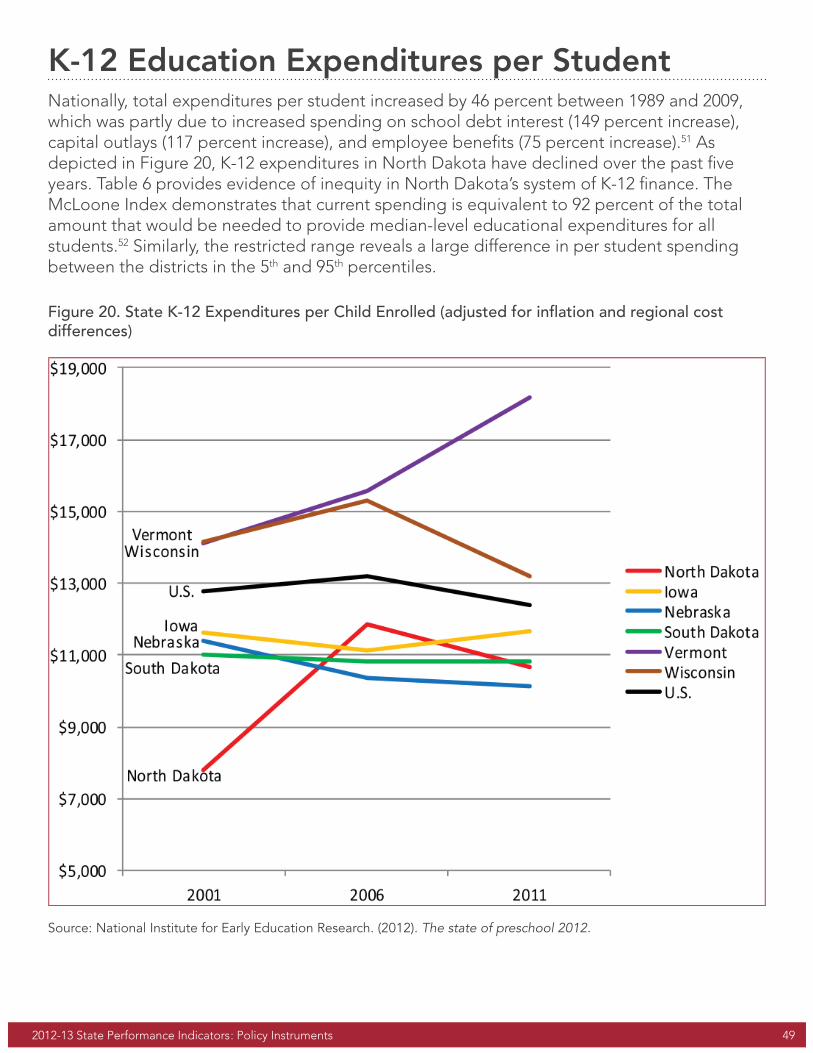
Nationally, total expenditures per student increased by 46 percent between 1989 and 2009, which was partly due to increased spending on school debt interest (149 percent increase), capital outlays (117 percent increase), and employee benefi ts (75 percent increase).51 As depicted in Figure 20, K-12 expenditures in North Dakota have declined over the past fi ve years. Table 6 provides evidence of inequity in North Dakota’s system of K-12 fi nance. The McLoone Index demonstrates that current spending is equivalent to 92 percent of the total amount that would be needed to provide median-level educational expenditures for all students.52 Similarly, the restricted range reveals a large difference in per student spending between the districts in the 5th and 95th percentiles.
K-12 Education Expenditures per Student
: Policy Instruments
Figure 20. State K-12 Expenditures per Child Enrolled (adjusted for infl ation and regional cost differences)
Source: National Institute for Early Education Research. (2012). The state of preschool 2012.

502012-13 State Performance Indicators
Table 6. Equity in K-12 Finance
Source: Education Counts Research Center (2013). Indicators. *State’s national rank appears in parentheses.
MHEC State
McLoone Index – Actual spending as percent of amount needed to bring all students to median level (2010)*
Restricted Range – Difference in per-pupil spending levels at the 95th and 5th percentiles (2010)*
Illinois 89% (39) $6,111 (45)
Indiana 90% (34) $3,973 (27)
Iowa 93% (8) $3,125 (13)
Kansas 89% (38) $3,784 (23)
Michigan 91% (22) $3,940 (26)
Minnesota 90% (29) $3,641 (20)
Missouri 91% (17) $4,231 (30)
Nebraska 94% (6) $4,737 (38)
North Dakota 92% (12) $4,061 (28)
Ohio 90% (30) $4,877 (40)
South Dakota 90% (13) $4,469 (35)
Wisconsin 92% (10) $2,883 (10)
: Policy Instruments

512012-13 State Performance Indicators
In the midst of competing budgetary demands, state policymakers are confronted with the challenging task of securing revenue to fund the postsecondary system. As indicated in Figure 21a, fi scal support per $1,000 of personal income in North Dakota has decreased over the past decade, though it remains above the national average. The percentage of total revenue allocated to higher education in North Dakota has also decreased since 2000 (see Figure 21b).
Overall Public Funding for Higher Education
Figure 21a. State Fiscal Support for Higher Education Per $1,000 of Personal Income
Source: SHEEO. (2013). State higher education fi nance: 2011. National Center for Higher Education Management Systems. (2013). State and local support for higher education operating expenses per $1,000 of personal income: 2001, 2006.
: Policy Instruments

522012-13 State Performance Indicators
Figure 21b. State Fiscal Support for Higher Education as a Percentage of Total State Revenue
Source: SHEEO. (2013). State higher education fi nance. National Center for Higher Education Management Systems. (2013). State higher education priority.
: Policy Instruments

532012-13 State Performance Indicators
The direct allocation of state funds to postsecondary institutions partly determines the student’s share of the cost of higher education. Figures 22a-c demonstrate the degree to which state appropriations approximate education and related expenditures (i.e., the total amount spent on instruction, student services, and academic support). The average amount of state appropriations constitutes more than half of the average education and related expenditures at public research universities (74 percent), master’s universities (52 percent), and two-year colleges (60 percent).53
State Appropriations for Postsecondary Institutions
Figure 22a. State Appropriations as a Proportion of Educational Expenditures Per FTE Student: Public Research Universities (Very High Research Activity)
Source: NCES IPEDS. (2013). Finance: 2011.
: Policy Instruments

542012-13 State Performance Indicators
Figure 22b. State Appropriations as a Proportion of Educational Expenditures Per FTE Student: Public Master’s Universities (Larger Programs)
Source: NCES IPEDS. (2013). Finance: 2011.
: Policy Instruments

552012-13 State Performance Indicators
Figure 22c. State Appropriations as a Proportion of Educational Expenditures Per FTE Student: Public Two-Year Colleges
Source: NCES IPEDS. (2013). Finance: 2011.
: Policy Instruments

562012-13 State Performance Indicators
State need-based student aid programs can play a signifi cant role in reducing the net cost of college for families of modest means. Figure 23a indicates that the average state need-based grant award in North Dakota has increased over time but remains lower than the average award in most peer states. State commitments to need-based aid programs can also be depicted as a proportion of federal need-based aid. According to Figure 23b, North Dakota’s commitment to need-based aid has risen over the past few years.
Need-Based Grant Aid Allocations
Figure 23a. Average Award of State Need-based Grant Aid (Adjusted for Infl ation and Cost of Living Differences)
Source: NASSGAP. (2013). Annual survey data. Note. Need-based aid was not awarded in South Dakota during the selected years.
: Policy Instruments

572012-13 State Performance Indicators
Figure 23b. State Need-Based Grant Aid: Total State Aid as a Percentage of Federal Pell Grant Aid
Source: Postsecondary Education Opportunity. (2013). Pell grant recipient data by state.
: Policy Instruments

582012-13 State Performance Indicators
States formulate and endorse a host of policies to improve high school readiness, high school graduation rates, and college readiness. For example, most MHEC states have adopted the Common Core State Standards, wherein grade-specifi c student outcomes are clearly delineated for English language arts and mathematics.54 Such state-led efforts could strongly infl uence opportunities for participation and success in higher education.
Indicators in this section include:
» Pre-K Policy Rating » K-12 Policy Rating » Postsecondary Policy Rating » State Data System Rating
Policies for Improving Educational Quality
: Policy Instruments

592012-13 State Performance Indicators
If states are to reap a high, positive return on pre-K investments, policymakers must ensure a high level of program quality. The National Institute for Early Education Research defi nes “high quality” programs according to 10 policy standards.55 In Table 7, the fi rst standard refers to whether the state has comprehensive early learning standards in the areas of physical well-being and motor development, social/emotional development, learning approaches, language development, and cognition. Four standards are related to teacher quality, including requirements that pre-K teachers possess a bachelor’s degree, a pre-K education specialization, and at least 15 hours of annual in-service training. Moreover, teacher assistants should possess at least a Child Development Associate (CDA) credential. Two standards indicate that class size should not exceed 20 students, and there should be at least 1 staff member for every 10 children. Another two standards pertain to student and parent services, including the provision of vision, hearing, and health screenings; parent support or involvement programs; and a meal program. States meet the last standard if site visits are required to evaluate program implementation. As indicated earlier, North Dakota currently does not have a state pre-K program.
Pre-K Policy Rating
Table 7. Pre-K Policies Associated with High Program Quality
Source: National Institute for Early Education Research. (2012). The state of preschool 2012.
MHEC State North DakotaNumber of States Meeting Standards
Comprehensive early learning standards 51
Teacher has B.A. 30
Specialized training in Pre-K 44
Assistant teacher has CDA or equivalent 15
At least 15 hours/year in-service 42
Maximum class size <20 44
Staff-child ratio 1:10 or better 45
Vision, hearing, health, and one support service 37
At least one meal 24
Site visits 32
Quality Standards Checklist Sum 2012 0 (4 states meet all standards)
: Policy Instruments

602012-13 State Performance Indicators
States can improve the quality of K-12 education through policies related to K-16 alignment, student-staff ratios, teacher effectiveness, and teacher retention. Policymakers can help orient school reforms by articulating the skills and knowledge needed to be successful in college, including learning strategies, academic knowledge, self-regulation skills, and “college knowledge.”56 K-16 alignment can also be promoted through the use of assessment instruments that inform high school students whether they require additional academic preparation to be successful in college, thereby reducing the need for subsequent remedial education.57 Student achievement can be improved through reductions in student-teacher ratios58 and student-counselor ratios.59 Teacher quality can be infl uenced through licensure requirements related to subject-specifi c coursework and pedagogical knowledge60 as well as fi nancial incentives for teachers to obtain certifi cation through the National Board for Professional Teaching Standards.61 Teacher retention can be improved by providing competitive salaries62 and promoting participation in mentoring and induction programs.63 According to Table 8, North Dakota meets 64 percent of the K-12 quality standards.64
K-12 Policy Rating
Source: Editorial Projects in Education Research Center. (2012). State Highlights 2012. *Data for this indicator were derived from the Common Core of Data.
North Dakota
States Meeting Standard
K-16 AlignmentCollege readiness – State defi nes college readiness Yes 38
Assessment alignment – High school assessment aligned with postsecondary system Yes 21
Student-Staff RatiosStudent-to-teacher ratio median in elementary schools is 15:1 or less (2009-10) Yes 28
Student-counselor ratio 250:1* No 3
Teacher EffectivenessSubstantial coursework in subject area(s) taught (e.g., academic major) required for teacher licensure
Yes (not for alternative-route candidates 28
Test of basic skills required for teacher licensureYes (not for alternative-
route candidates 39
Test of subject-specifi c knowledge required for teacher licensureYes (not for alternative-
route candidates 43
Financial incentives for teachers to earn national-board certifi cation (2011-12) Yes 24
Teacher RetentionTeacher-pay parity – Teacher salaries at least equal to comparable occupations (2010) No 13
State-funded induction program required for all new teachers No 14
State-funded mentoring program required for all new teachers No 16
Table 8. K-12 Policies Related to K-16 Alignment, Student-Staff Ratios, Teacher Quality, and Teacher Retention
: Policy Instruments

612012-13 State Performance Indicators
While various policies can be adopted to enhance the quality of postsecondary education, this report focuses on the critical need to promote the assessment of institutional practices and student outcomes. Specifi cally, states are evaluated according to whether all public four-year institutions are using the National Survey of Student Engagement (NSSE), whether public two-year institutions are using the Community College Survey of Student Engagement (CCSSE), and whether states require institutions to report student learning outcomes. The utilization of NSSE and CCSSE allows institutions to determine whether they are providing an effective context for learning and persistence, including the provision of a high level of academic challenge, active and collaborative learning, student-faculty interaction, a supportive campus environment, and enriching educational experiences.65 Policymakers can further convey the expectation of strong institutional performance by mandating the collection and reporting of student outcomes data. Many institutions are currently using such measures as the Collegiate Learning Assessment, the ETS Profi ciency Profi le, and the ACT Collegiate Assessment of Academic Profi ciency. Table 9 indicates that many of North Dakota’s public four-year institutions utilize the NSSE survey, and all two-year colleges use the CCSSE survey. North Dakota does not report student learning outcomes for two- and four-year institutions.
Postsecondary Policy Rating
Source: National Survey of Student Engagement. (2013). Participating Institution Search. Center for Community College Student Engagement. (2013). Member Colleges.
MHEC State
Percentage of public
4-year institutions
participating in NSSE 2007-13
Percentage of public
2-year institutions
participating in CCSSE 2010-13
State reports student learning
outcomes: 4-year
institutions
State reports student learning
outcomes: 2-year
institutionsIllinois 83% 69% no no
Indiana 93% 100% no no
Iowa 100% 88% no no
Kansas 88% 48% no no
Michigan 100% 65% no no
Minnesota 92% 100% yes yes
Missouri 93% 33% yes yes
Nebraska 86% 75% no no
North Dakota 67% 100% no no
Ohio 47% 83% no no
South Dakota 86% 0% yes yes
Wisconsin 93% 53% no no
Table 9. Postsecondary Student Assessment Practices and Policies in MHEC States
: Policy Instruments

622012-13 State Performance Indicators
The improvement of performance in any system necessitates that individuals receive and utilize feedback on the effi cacy of past, present, and future actions. Historically, though, states have lacked appropriate data systems that provide timely and relevant feedback for students, parents, teachers, administrators, and policymakers. Accordingly, the Data Quality Campaign, a national advocacy organization, has identifi ed 10 state actions to promote the effective use of data and 10 essential elements of longitudinal data systems. While most states have already adopted all of the essential elements for a robust longitudinal data system, important state actions remain to be taken. State actions refer to strategies for linking data across educational sectors and into the workforce, providing data access for relevant stakeholders, and promoting the effective use of data for system improvement. North Dakota has completed 3 of 10 recommended state actions (see Table 10).
State Data System Rating
Source: Data Quality Campaign. (2012). Data for action 2012: Focus on people to change data culture.
Action IL IN IA KS MI MN MO NE ND OH SD WI
1. Link data systems no yes no no no no yes no no no no no
2. Create stable, sustained support yes no yes yes yes no no yes yes yes no yes
3. Develop governance structures yes yes yes yes yes yes yes yes yes yes yes yes
4. Build state data repositories yes yes yes yes yes yes yes yes no yes no yes
5. Implement systems to provide timely access to information no yes no no no no no no no no no no
6. Create progress reports using individual student data to improve student performance no yes yes yes yes yes yes no yes yes no yes
7. Create reports using longitudinal statistics to guide systemwide improvement yes yes no yes yes yes yes no no yes no yes
8. Developa a P-20/workforce research agenda yes yes no yes yes yes yes no no yes no yes
9. Promote educator professional development and credentialing no no no no no no no no no yes no no
10. Promote strategies to raise awareness of available data no yes no yes yes no no no no yes no yes
Table 10. State Actions and System Elements Related to Data Quality
: Policy Instruments

632012-13 State Performance Indicators
APPENDICES
: Appendices

642012-13 State Performance Indicators
As the forces of globalization diminish barriers between countries, states will increasingly compete for knowledge-based industries and jobs on an international stage. Access to postsecondary education is essential for developing a stock of human capital that enables states to retain a strong competitive advantage. Figure A-1 shows that the United States continues to be a global leader in postsecondary enrollment, which is due in part to the size, diversity, and accessibility of its system. North Dakota’s rate of enrollment among 18-24 year olds (47 percent) exceeds the rates of all OECD countries except Korea (58 percent).66
Enrollment in International Perspective
Source: OECD. (2013). StatExtracts: 2011. U.S. Census Bureau. (2013). American Community Survey: 2011.
Figure A-1. Percentage of Young Adults Aged 18 to 24 Enrolled in Postsecondary Education
United States OECD Country58% Korea
Rhode Island 55%
Massachusetts 54%
Vermont 53%
Iowa, Nebraska, New Jersey, New York 48%
Connecticut, Michigan, North Dakota, Pennsylvania 47%
Delaware, Maryland, New Hampshire, South Dakota 46%
California, Kansas, Minnesota, Wisconsin 45%
Illinois, Ohio, Virginia 44%
Florida, Indiana, Mississippi, Utah 43% United States
Missouri, North Carolina 42% Greece
Alabama, Idaho, Kentucky, Maine 41% Belgium, Poland
Colorado, Montana, West Virginia 40% Ireland
Georgia, Louisiana, New Mexico, Tennessee 39%
Arizona, Arkansas, South Carolina, Texas 38%
Washington, Wyoming 37%
Hawaii, Oklahoma, Oregon 36% New Zealand
Nevada 35% Australia, Hungary, Netherlands
34% Spain
32% Czech Republic, France
30% Austria, Canada, Portugal, Turkey
29% Finland, Germany
Alaska 28%
27% Italy, Norway, Slovak Republic
25% Denmark, United Kingdom
24% Sweden
22% Iceland
21% Switzerland
17% Mexico
: Appendices-International Perspectives

652012-13 State Performance Indicators
While the United States has comparatively high enrollment rates, several countries outperform the United States in degree attainment. Figure A-2 indicates that the United States ranks 11th in the percentage of adults aged 25-34 who have an associate’s degree or higher. However, only three OECD countries exceed North Dakota’s rate of postsecondary educational attainment: Korea, Japan, and Canada. While each of these countries has its own cultural characteristics, political climate, and economic conditions, specifi c policy mechanisms may partially explain differences in degree attainment. For example, Canada has invested heavily in “sub-bachelor’s” attainment, which has widened the pipeline and increased both participation and graduation.67
Educational Attainment in International Perspective
United States OECD Country64% Korea
59% Japan
57% Canada
Massachusetts 55%
Minnesota 51%
New York, North Dakota 50%
Iowa 48%
New Jersey, Vermont, Virginia 47% Ireland, Norway, United Kingdom
Connecticut, Colorado, Illinois, Maryland, South Dakota 46% Luxembourg, New Zealand
New Hampshire 45% Australia, Israel
Nebraska, Pennsylvania 44%
Kansas, Rhode Island, Wisconsin 43% France, Sweden, United States
Washington 42% Belgium
41% Chile
Hawaii, Maine, Missouri, Montana, Utah 40% Netherlands, Switzerland, Denmark, Estonia, Finland, Iceland
Ohio, North Carolina 39% OECD Average, Spain
California, Michigan, Oregon 38%
Delaware, Florida, Indiana 37%
Georgia, Wyoming 36%
Arizona, Idaho, South Carolina 35%
Kentucky, Texas 34% Slovenia
Alabama, Oklahoma, Tennessee 33% Greece
Alaska, Mississippi 32%
Louisiana, West Virginia 31%
Arkansas, New Mexico 30%
Nevada 28% Germany
27% Hungary, Portugal
26% Slovak Republic
25% Czech Republic
23% Mexico
21% Austria, Italy
19% Turkey
Figure A-2. Percentage of Adults Aged 25 to 34 Holding an Associate’s Degree or Higher
Source: National Center for Higher Education Management Systems. (2013). ACS educational attainment by degree level: 2011. OECD. (2013). Education at a glance: Population who has attained tertiary education: 2011.
: Appendices-International Perspectives

662012-13 State Performance Indicators
Weights Used for Performance Scores
Indicators
Type of Aspirational
Score
Raw Performance
Score WeightRationale for
Differential Weights68
Postsecondary Enrollment: General
College enrollment directly after high school
Median Score of Top 10 States
Current Score/Aspirational Score 0.80
The augmentation of direct rather than postponed
enrollment is assumed to be a more effi cient and
effective method of raising educational attainment.
Postsecondary enrollment among older adults
Median Score of Top 10 States
Current Score/Aspirational Score 0.20
Postsecondary Enrollment: Achievement Gap
Undergraduate enrollment rate of disadvantaged minority students at public four-year institutions
Corresponding state population estimate
Current Score/Aspirational Score 0.50
Postsecondary enrollment among low-income students
Median Score of Top 10 States
Current Score/Aspirational Score 0.50
Degree Completion: General
Graduation rates at public two-year colleges
Median Score of Top 10 States
Current Score/Aspirational Score 0.50
Graduation rates at public four-year colleges
Median Score of Top 10 States
Current Score/Aspirational Score 0.50
Degree Completion: Achievement Gap
Graduation rate by ethnicity at public four-year institutions: average gap between disadvantaged minority students and White students
Ideal of educational equity (e.g.,
achievement is not linked with race/ethnicity or SES)
0-.5=100; .6-2= 90; 2.1-5=75;
5.1 plus=601.00
System Effi ciency
Credentials awarded per expenditure: Public two-year colleges
80th percentile score Current Score/Aspirational Score 0.33
Credentials awarded per expenditure: Public masters universities
80th percentile score Current Score/Aspirational Score 0.33
Credentials awarded per expenditure: Public research universities
80th percentile score Current Score/Aspirational Score 0.33
Academic Preparation: General
: Appendices-Weights Used for Performance Scores

672012-13 State Performance Indicators
Indicators
Type of Aspirational
Score
Raw Performance
Score WeightRationale for
Differential Weights68
Children ages 3 to 4 enrolled in preschool
National average school enrollment of
children ages 5-6
Current Score/Aspirational Score 0.20
The weights of academic preparation idicators
progressively decrease to refl ect the importance of
PK-8 education in fostering college readiness.
Academic profi ciency of 8th grade students: All students math
Median Percentage of Students Scoring
at Levels 4-6 Profi ciency on the PISA Exam Among Top Five Countries
Current Score/Aspirational Score 0.17
Academic profi ciency of 8th grade students: All students reading
Median Percentage of Students Scoring
at Levels 4-6 Profi ciency on the PISA Exam Among Top Five Countries
Current Score/Aspirational Score 0.17
Academic profi ciency of 8th grade students: All students science
Median Percentage of Students Scoring
at Levels 4-6 Profi ciency on the PISA Exam Among Top Five Countries
Current Score/Aspirational Score 0.17
Rate of high school graduation Top state Current Score/Aspirational Score 0.09
Proportion of college-bound students who demonstrate college-ready academic achievement: English
Top state among states with
comparable percent of high school
graduates taking ACT (within 10
percentage points)
Current Score/Aspirational Score 0.05
Proportion of college-bound students who demonstrate college-ready academic achievement: Reading
Top state among states with
comparable percent of high school
graduates taking ACT (within 10
percentage points)
Current Score/Aspirational Score 0.05
Proportion of college-bound students who demonstrate college-ready academic achievement: Math
Top state among states with
comparable percent of high school
graduates taking ACT (within 10
percentage points)
Current Score/Aspirational Score 0.05
Weights Used for Performance Scores
: Appendices-Weights Used for Performance Scores

682012-13 State Performance Indicators
Indicators
Type of Aspirational
Score
Raw Performance
Score WeightRationale for
Differential Weights68
Proportion of college-bound students who demonstrate college-ready academic achievement: Science
Top state among states with
comparable percent of high school
graduates taking ACT (within 10
percentage points)
Current Score/Aspirational Score 0.05
Academic Preparation: Achievement Gap
Academic profi ciency of 8th grade students: Lower vs. Higher income students, Math
Ideal of educational equity (e.g.,
achievement is not linked with race/ethnicity or SES)
0-.5=100; .6-2=90; 2.1-5=75;
5.1 plus=600.33
Academic profi ciency of 8th grade students: Lower vs. Higher income students, Reading
Ideal of educational equity (e.g.,
achievement is not linked with race/ethnicity or SES)
0-.5=100; .6-2=90; 2.1-5=75;
5.1 plus=600.33
Academic profi ciency of 8th grade students: Lower vs. Higher income students, Science
Ideal of educational equity (e.g.,
achievement is not linked with race/ethnicity or SES)
0-.5=100; .6-2=90; 2.1-5=75;
5.1 plus=600.33
Affordability: Middle Class
Percentage of Family Income Needed to Pay for College
Median score of top 10 states
Aspirational Score/Current Score 0.30
Asset indicators receive greater weight since
student debt can adversely affect persistence.
Monthly savings over 18 years needed to pay for four year of college
National average college savings rate
Aspirational Score/Current Score 0.60
Average Student Loan Debt Median score of top 10 states
Aspirational Score/Current Score 0.10
Affordability Gap
Percentage of Family Income Needed to Pay for College: Lower vs. Median income families, two-year colleges
Ideal of equal fi nancial access
0-.5=100; .6-2=90; 2.1-5=75;
5.1 plus=600.40
The affordability gap for enrollment at four-
year colleges is assigned a greater weight due to the greater under-
representation of disadvantaged students at four-year colleges and
the potentially larger impact of four-year college
degree completion on socioeconomic mobility.
Weights Used for Performance Scores
: Appendices-Weights Used for Performance Scores

692012-13 State Performance Indicators
Indicators
Type of Aspirational
Score
Raw Performance
Score WeightRationale for
Differential Weights68
Percentage of Family Income Needed to Pay for College: Lower vs. Median income families, four-year colleges
Ideal of equal fi nancial access
0-.5=100; .6-2=90; 2.1-5=75;
5.1 plus=600.60
Effectiveness of Postsecondary Institutions: Four-year colleges
Public four-year effectiveness in promoting degree completion
Cut-off for “High Effectiveness”
“moderate” effectiveness -.99 thru +.99: Yellow
1.00
Policies for Improving Educational Quality: PK-12
Pre-K policy rating Top state Current Score/Aspirational Score 0.50
K-12 policy rating Ideal Current Score/Aspirational Score 0.50
Policies for Improving Educational Quality: Postsecondary
Postsecondary policy: Student learning outcomes state reporting
Top state Current Score/Aspirational Score 1.00
Weights Used for Performance Scores
Note: Final category scores represent the sum of corresponding indicator scores. Unless otherwise indicated, fi nal scores were converted into the color scheme accordingly: red: less than 70; yellow: 70-89; and green: 90-100. The median 2012 PISA profi ciency scores among 15 year-old students are identifi ed after retaining only the highest scoring Chinese administrative region.
: Appendices-Weights Used for Performance Scores

702012-13 State Performance Indicators
1 The Georgetown University Center on Education and the Workforce. (2013). Recovery: Job growth and education requirements through 2020.
2 Job categories were defi ned by the Georgetown University Center on Education and the Workforce: Managerial and Professional (e.g., management, business operations, fi nance, and legal); STEM (e.g., computer and mathematical science, architects and technicians, engineers and technicians, life and physical scientists); Social Sciences (psychologists, market research analysts, urban planners, survey researchers, economists, anthropologists, archeologists, sociologists, political scientists, historians, geographers); Community Service and Arts (e.g., social services, arts, design, sports, entertainment, media); Education; Healthcare (professionals and support); Food and Personal Services (e.g., protective services, food preparation and serving, personal care); Sales and Offi ce Support; and Blue Collar (e.g., farming, fi shing and forestry, construction and extraction, installation, maintenance and equipment repair, production, transportation and material moving).
3 Lumina Foundation. (2012). A stronger nation through higher education. Retrieved from http://www.luminafoundation.org/publications/A_Stronger_Nation-2012.pdf
4 College Board. (2010). Education pays 2010. Retrieved from http://trends.collegeboard.org/downloads/Education_Pays_2010.pdf
5 State-by-state data currently exist only for a few indicators related to the economic benefi ts of higher education.
6 Horn, A. S. (2012). The selection of peer states for performance benchmarking in higher education. Retrieved from http://www.mhec.org/sites/mhec.org/fi les/20130429peer_state_selection_working_paper.pdf
7 U.S. Census Bureau. (2010). Voting and registration in the election of November 2008. Retrieved October 19, 2011, from http://www.census.gov/prod/2010pubs/p20-562.pdf
8 Bureau of Labor Statistics. (2011). Volunteering in the United States: 2010. Retrieved October 19, 2011, from http://www.bls.gov/news.release/pdf/volun.pdf
9 U.S. Department of Health and Human Services. (2011). Health, United States, 2010. Retrieved October 19, 2011, from http://www.cdc.gov/nchs/data/hus/hus10.pdf#010
10 Ibid.
11 Ibid.
12 U.S. Census Bureau. (2010). American Community Survey 1 Year Estimates. Retrieved October 19, 2011, from http://factfi nder2.census.gov
13 U.S. Census Bureau. (2010). American Community Survey 1 Year Estimates. Retrieved October 19, 2011, from http://factfi nder2.census.gov
14 Bureau of Labor Statistics. (2011). Education pays. Retrieved October 19, 2011, from http://www.bls.gov/emp/ep_chart_001.htm
15 Median incomes are defi ned as median earnings in the past 12 months in 2010 infl ation-adjusted dollars by educational attainment for the population 25 years and over with earnings. U.S. Census Bureau. (2010). 2010 American Community Survey 1-year estimates. The Tax Foundation. State individual income tax rates, 2000-2011. Retrieved October 19, 2011, from http://www.taxfoundation.org/fi les/state_individualincome_rates-2000-2011-20110503.xls
Endnotes
: Appendices-Endnotes

712012-13 State Performance Indicators
Endnotes16 General investment levels are not currently rated due to the diffi culty in establishing ideal funding levels.
17 National Center for Education Statistics. (2010). Number and percentage of actual and projected undergraduate enrollment in degree-granting postsecondary institutions, by sex, attendance status, and control of institution: Selected years, fall 1970-2020. Retrieved October 19, 2011, from http://nces.ed.gov/programs/coe/tables/table-hep-1.asp
18 Bozick, R., & DeLuca, S. (2005). Better late than never? Delayed enrollment in the high school to college transition. Social Forces, 84(1), 527-550.
19 Enrollment estimates do not include international students and students of unknown race/ethnicity. Enrollment estimates include students of all ages.
20 Postsecondary Education Opportunity. (2012). College participation rates for students from low income families by state. Retrieved from http://www.postsecondary.org. The low-income student enrollment rate is defi ned as the number of dependent Pell grant recipients divided by the number of children enrolled in 4th to 9th grades who qualify for free/reduced price lunch. Enrollment rates among college-ready, low-income students were unavailable.
21 National Center for Higher Education Management Systems. (2009). Graduation rates. Retrieved from http://www.higheredinfo.org
22 Bureau of Labor Statistics. Education pays. Retrieved from http://www.bls.gov/emp/ep_chart_001.htm
23 Jaeger, D. A., & Page, M. E. (1996). Degrees matter: New evidence on sheepskin effects in the returns to education. The Review of Economics and Statistics, 78(4), 733-740.
24 Note that the indicators in this section refl ect the extent to which the PK-16 system and relevant state conditions enable students to obtain a postsecondary degree. For indicators that focus specifi cally on the performance of colleges and universities, see the section on Institutional Effectiveness and Effi ciency.
25 Education and related expenditures include spending on direct costs of educational activities: instruction, student services, and educational spending related to academic support, institutional support, and operations.
26 It is worth noting that some credentials cost signifi cantly more than others, and states that appear to be maximizing their revenues might be generating lower quality degrees or credentials that have lower market returns. 27 Adelman, C. (2006). The toolbox revisited: Paths to degree completion from high school through college. Retrieved October 19, 2011, from http://www2.ed.gov/rschstat/research/pubs/toolboxrevisit/toolbox.pdf
28 Pianta, R. C., Barnett, W. S., Burchinal, M., & Thornburg, K. R. (2009). The effects of preschool education: What we know, how public policy is or is not aligned with the evidence base, and what we need to know. Psychological Science in the Public Interest, 10(2), 49-88.
29 NCES. (2013). Percentage of the population 3 to 34 years old enrolled in school, by age group: Selected years, 1940 through 2012. Retrieved from http://nces.ed.gov/programs/digest/d13/tables/dt13_103.20.asp 30 American College Testing. (2008). The forgotten middle. Retrieved October 19, 2011, from http://www.act.org/research/policymakers/pdf/ForgottenMiddle.pdf
31 Higher income is defi ned as any level of income that did not qualify the student for free or reduced price lunch.
: Appendices-Endnotes

722012-13 State Performance Indicators
Endnotes32 This rate does not include GED attainment. Graduation rates are only calculated for public schools: the number of 9th graders/number of high school graduates four years later. These rates have not been adjusted for student migration.
33 American College Testing. (2010). What are ACT’s college readiness benchmarks? Retrieved October 19, 2011, from http://www.act.org/research/policymakers/pdf/benchmarks.pdf
34 Desrochers, D. M., & Wellman, J. V. Trends in college spending 1999-2009. Retrieved October 19, 2011, from http://www.deltacostproject.org/resources/pdf/Trends2011_Final_090711.pdf
35 Estimates have been adjusted for infl ation and regional cost differences.
36 Adjustments have been made for regional cost differences. This calculation assumes the following: average net cost at a public four-year institution for the state’s median family income; 5 percent college cost infl ation; no current savings; 5 percent rate of return. See https://www.tiaa-cref.org/public/products-services/education-savings/529
37 SallieMae. (2013). How America saves for college 2013. Retrieved from https://www.salliemae.com/assets/Core/how-America-saves/HowAmericaSaves_Report2013.pdf
38 The Project on Student Debt. (2012). Student debt and the class of 2011. Retrieved from http://projectonstudentdebt.org/fi les/pub/classof2011.pdf. The debt estimates refl ect the average per-undergraduate borrower cumulative principal from institutional, state, federal, and private loans. The debt estimates do not take into account credit card debt and family loans, thereby underestimating the overall debt burden incurred through postsecondary education.
39 NACE. (2012). Salary survey: Starting salaries for new college graduates. Retrieved from http://www.naceweb.org/uploadedFiles/NACEWeb/Research/Salary_Survey/Reports/SS_January_exsummary_4web.pdf
40 This calculation assumes a 10-year repayment plan with a fi xed interest rate of 6.8 percent.
41 King, T., & Bannon, E. (2002). The burden of borrowing: A report on the rising rates of student loan debt. Retrieved October 19, 2011, from http://www.pirg.org/highered/BurdenofBorrowing.pdf.
42 Kuh, G. D. (2008). High-impact educational practices: What they are, who has access to them, and why they matter. Retrieved from http://www.neasc.org/downloads/aacu_high_impact_2008_fi nal.pdf
43 See Commission on the Abraham Lincoln Study Abroad Fellowship Program. (2005). Global competence and national needs. Retrieved from http://www.nafsa.org/uploadedFiles/NAFSA_Home/Resource_Library_Assets/CCB/lincoln_commission_report%281%29.pdf?n=6097
44 Horn, A. S. (2014). Effectiveness and effi ciency in promoting timely degree completion: A performance rating system for the states.
45 Education and related expenditures are defi ned here as (instructional expenditures + student services + (educational share * (academic support + institutional support + operational maintenance).
46 National Center for Education Statistics. (2012). Public school expenditures. Retrieved from http://nces.ed.gov/programs/coe/indicator_tot.asp#info
47 NASBO. (2011). 2010 state expenditure report. Retrieved from http://www.nasbo.org/sites/default/fi les/2010%20State%20Expenditure%20Report.pdf
: Appendices-Endnotes

732012-13 State Performance Indicators
Endnotes48 State Higher Education Executive Offi cers. (2012). State higher education fi nance. Retrieved from http://www.sheeo.org/fi nance/shef/SHEF_FY11.pdf. Expenditure fi gures do not include capital or debt service. Twelve states also allocate funds to private institutions (0.2 percent of total appropriations).
49 National Institute for Early Education Research. (2012). The state of preschool 2012. Retrieved from http://nieer.org/publications/state-preschool-2012. NIEER defi nes state preschool programs according to whether the initiative is (a) controlled and funded by the state; (b) primarily focused on early childhood education for 3- and/or 4-year old children at least two days per week; (c) differentiated from child care subsidies; and (d) intended to serve all students, not just those with disabilities. NIEER qualifi es state supplements to Head Start if the program is under state administration and student enrollment is signifi cantly expanded. The fi gures reported here have been adjusted for infl ation and regional cost differences. PreK expenditures refl ect state and TANF expenditures.
50 Gault, B., Mitchell, A. W., Williams, E., Dey, J., & Sorokina, O. (2008). Meaningful investments in pre-k: Estimating the per-child costs of quality programs. Retrieved from http://www.pewstates.org/uploadedFiles/PCS_Assets/2008/PEW_PkN_meaningfulinvestmentsbrief_may2008.pdf
51 National Center for Education Statistics. (2012). Public school expenditures. Retrieved from http://nces.ed.gov/programs/coe/indicator_tot.asp#info
52 The index represents the following ratio: (Total expenditures on students who are funded below the statewide median level)/(Median expenditures x number of students funded below median level). Accordingly, the index represents actual funding as a percent of ideal funding, wherein the ideal of equity is defi ned as all students being funded at the median level. In the case of Minnesota, the index of 90 percent means that current funding for the bottom half of students is equivalent to 90 percent of ideal funding (again, wherein all such students receive median-level funding). Minnesota would need to increase spending by 10 percent of the ideal total to achieve the goal of median-level spending for all students in the bottom half.
53 Education and related expenditures include instruction, student services, and academic support. Educational expenditures exclude research, service, institutional support, and other expenses. State appropriations data do not refl ect how appropriations are actually being used. Other sources of revenue were excluded: local appropriations, government grants and contracts, and other revenue. Revenue and expenditures are calculated on a FTE student basis.
54 Minnesota and Nebraska have not adopted the Common Core Standards.
55 National Institute for Early Education Research. (2012). The state of preschool 2012. Retrieved from http://nieer.org/sites/nieer/fi les/2011yearbook.pdf
56 Conley, D. T. (2007). Redefi ning college readiness. Retrieved from http://inside.redwoods.edu/basicskills/documents/1.Redefi ningCR_Vol3_Copy.pdf
57 See Rutschow, E. Z., & Schneider, E. (2011). Unlocking the gate: What we know about improving developmental education. Retrieved from http://www.mdrc.org/sites/default/fi les/full_595.pdf
58 Steve Aos, Marna Miller, & Jim Mayfi eld. (2007). Benefi ts and Costs of K–12 Educational Policies: Evidence-Based Effects of Class Size Reductions and Full-Day Kindergarten. Olympia: Washington State Institute for Public Policy, Document No. 07-03-2201.
59 Carrell, S. E., & Hoekstra, M. (2011). Are school counselors a cost-effective education input? Retrieved from http://econweb.tamu.edu/mhoekstra/counselors.pdf
: Appendices-Endnotes

742012-13 State Performance Indicators
Endnotes60 Goe, L., & Stickler, L. M. (2008). Teacher quality and student achievement. Retrieved from http://www.gtlcenter.org/sites/default/fi les/docs/March2008Brief.pdf
61 Helding, K. A., & Fraser, B. J. (2013). Effectiveness of National Board Certifi ed teachers in terms of classroom environment, attitudes and achievement among secondary science students. Learning Environment Research, 16, 1-21.
62 Borman, G. D., & Dowling, N. M. (2008). Teacher attrition and retention. A meta-analytic and narrative review of the research. Review of Educational Research, 78(3). 367-409. 63 Ingersoll, R. M., & Strgon, M. (2012). What the research tells us about the impact of induction and mentoring programs for beginning teachers. NSSE Yearbook, 111(2), 466-490. 64 Standards are assigned 0/1 refl ecting “no”/”yes.” Scores are then summed.
65 National Survey of Student Engagement. (2012). Fostering student engagement campuswide. Retrieved from http://nsse.iub.edu/NSSE_2011_Results/pdf/NSSE_2011_AnnualResults.pdf. For CCSSE, see http://www.ccsse.org/aboutsurvey/aboutsurvey.cfm
66 International comparisons should be utilized with caution due to several factors. First, interstate migration is seamless in the United States and these data refl ect patterns related to tuition pricing and labor market demands as well as academic or institutional quality. Second, there are national and cultural differences impacting both participation and completion rates. Israel, for example, requires military service for most citizens between the ages of 18-21, reducing the percentage of eligible students between those ages. Finally, OECD data is useful for establishing benchmarks with the world’s wealthiest, most developed economies, but provides less reliable data regarding emerging economic nations such as Brazil, China, South Africa, Russia, and India.
67 Hauptman, A. M., & Kim, Y. (2009). Cost, containment, and attainment in higher education: An international comparison. Retrieved October 19, 2011, from http://www.policyarchive.org/handle/10207/bitstreams/18138.pdf.
68 See indicator descriptions for supporting references.
: Appendices-Endnotes

22012-13 State Performance Indicators
752012-13 State Performance Indicators
Midwestern Higher Education Compact105 Fifth Avenue South, Suite 450Minneapolis, MN 55401Phone: 612-677-2777 Fax: 612-767-3353E-mail: [email protected]
For cost savings purchases of computing hardware, software, and other technology products and services, go directly to www.mhectech.org.
For an interactive, searchable database of all institutions participating in the Midwest Student Exchange Program,please visit the MSEP Access Navigator at http://msep.mhec.org.
Visit MHEC’s website at: www.mhec.org.


![[S]pan Performance Score - Performance Score](https://static.fdocuments.us/doc/165x107/58e9fdd61a28ab88748b5093/span-performance-score-performance-score.jpg)