
Essays in Organizational Behavior - DASH Home
202
Essays in Organizational Behavior The Harvard community has made this article openly available. Please share how this access benefits you. Your story matters Citation Lee, Jooa. 2015. Essays in Organizational Behavior. Doctoral dissertation, Harvard University, Graduate School of Arts & Sciences. Citable link http://nrs.harvard.edu/urn-3:HUL.InstRepos:14226103 Terms of Use This article was downloaded from Harvard University’s DASH repository, and is made available under the terms and conditions applicable to Other Posted Material, as set forth at http:// nrs.harvard.edu/urn-3:HUL.InstRepos:dash.current.terms-of- use#LAA
Transcript of Essays in Organizational Behavior - DASH Home
Essays in Organizational BehaviorThe Harvard community has made this
article openly available. Please share howthis access benefits you. Your story matters
Citation Lee, Jooa. 2015. Essays in Organizational Behavior. Doctoraldissertation, Harvard University, Graduate School of Arts &Sciences.
Citable link http://nrs.harvard.edu/urn-3:HUL.InstRepos:14226103
Terms of Use This article was downloaded from Harvard University’s DASHrepository, and is made available under the terms and conditionsapplicable to Other Posted Material, as set forth at http://nrs.harvard.edu/urn-3:HUL.InstRepos:dash.current.terms-of-use#LAA

Essays on Organizational Behavior
A dissertation presentedby
Joo A Lee
to
The Department of Public Policy
in partial fulfillment of the requirementsfor the degree of
Doctor of Philosophyin the subject of Public Policy
Harvard UniversityCambridge, Massachusetts
November 2014

c� 2014 Joo A Lee
All rights reserved.
Dissertation Advisor: Professor Francesca Gino Joo A Lee
Essays on Organizational Behavior:
Abstract
How do organizations create an environment to motivate their employees to be healthy, pro-
ductive, and competent decision makers? My dissertation identifies the underlying factors
that could prevent organizations from achieving their goals, and takes on three research
projects to address such barriers to successful organizational functioning. To provide a
theoretical foundation for my research, I bring together conceptual and methodological
streams from various disciplines including organizational behavior, behavioral decision re-
search, and cognitive and a↵ective psychology. I then employ multiple methods, including
laboratory experiments involving psychophysiology as well as field research.
Three essays compose this dissertation. My first essay examines the role of emotion-
regulation processes in moral decision making. That is, emotion-regulation strategies (con-
cealing and rethinking emotions) influence the decision maker’s preference for utilitarian
choice. Using a process-dissociation approach, I also show emotion regulation selectively
reduces deontological inclinations, leading to greater preference for utilitarian decisions.
My second essay utilizes data from a large-scale field data as well as data from laboratory
and online labor market. This research shows how seemingly irrelevant, uncontrollable fac-
tors—such as rain—may influence employee productivity by eliminating potential cogni-
tive distractions. My third essay focuses on an intervention designed to invoke individuals’
psychosocial resources. Using a method called the Reflected Best-Self Exercise, I empiri-
cally test a set of hypotheses at the individual and team level. This research demonstrates
that this intervention not only has positive health and stress-bu↵ering e↵ects, but also has
implications for individual-level creativity, team-level functioning and performance.
iii

Across three essays, I argue that organizational performance should be understood in
terms of the functioning of individual employees and teams. Thus, my work lays ground-
work for organizational leaders to counteract the three barriers to organizational function-
ing.
iv

Contents
List of Tables viii
List of Figures ix
1 Microfoundations of Organizational Functioning 11.1 Barriers to Managerial Decision Making . . . . . . . . . . . . . . . . . . . 21.2 Barriers to Employee Engagement . . . . . . . . . . . . . . . . . . . . . . 31.3 Barriers to Employee Health and Motivation . . . . . . . . . . . . . . . . . 41.4 Concluding Remarks . . . . . . . . . . . . . . . . . . . . . . . . . . . . . 5
2 Poker-faced Morality: Concealing Emotions Lead to Utilitarian Decision Mak-ing 62.1 Introduction . . . . . . . . . . . . . . . . . . . . . . . . . . . . . . . . . . 7
2.1.1 Utilitarian vs. Deontological Decision making in Moral Psychology 82.1.2 Role of Emotion-Regulatory E↵orts in Moral Decision Making . . 102.1.3 Deontological Inclinations as an Underlying Mechanism for the
Relationship between Emotion Regulation and Utilitarian Decisions 122.1.4 Overview of the Present Research . . . . . . . . . . . . . . . . . . 15
2.2 Study 1 . . . . . . . . . . . . . . . . . . . . . . . . . . . . . . . . . . . . 162.2.1 Method . . . . . . . . . . . . . . . . . . . . . . . . . . . . . . . . 172.2.2 Results . . . . . . . . . . . . . . . . . . . . . . . . . . . . . . . . 182.2.3 Discussion . . . . . . . . . . . . . . . . . . . . . . . . . . . . . . 22
2.3 Study 2 . . . . . . . . . . . . . . . . . . . . . . . . . . . . . . . . . . . . 232.3.1 Study 2a Method . . . . . . . . . . . . . . . . . . . . . . . . . . . 242.3.2 Study 2a Results . . . . . . . . . . . . . . . . . . . . . . . . . . . 252.3.3 Study 2b Method . . . . . . . . . . . . . . . . . . . . . . . . . . . 252.3.4 Study 2b Results . . . . . . . . . . . . . . . . . . . . . . . . . . . 272.3.5 Discussion . . . . . . . . . . . . . . . . . . . . . . . . . . . . . . 31
2.4 Study 3 . . . . . . . . . . . . . . . . . . . . . . . . . . . . . . . . . . . . 332.4.1 Method . . . . . . . . . . . . . . . . . . . . . . . . . . . . . . . . 33
v

2.4.2 Results . . . . . . . . . . . . . . . . . . . . . . . . . . . . . . . . 352.4.3 Discussion . . . . . . . . . . . . . . . . . . . . . . . . . . . . . . 40
2.5 Study 4 . . . . . . . . . . . . . . . . . . . . . . . . . . . . . . . . . . . . 412.5.1 Method . . . . . . . . . . . . . . . . . . . . . . . . . . . . . . . . 422.5.2 Results . . . . . . . . . . . . . . . . . . . . . . . . . . . . . . . . 432.5.3 Discussion . . . . . . . . . . . . . . . . . . . . . . . . . . . . . . 44
2.6 General Discussion . . . . . . . . . . . . . . . . . . . . . . . . . . . . . . 452.6.1 Theoretical Contributions . . . . . . . . . . . . . . . . . . . . . . 462.6.2 Limitations and Venues for Future Research . . . . . . . . . . . . . 472.6.3 Conclusion . . . . . . . . . . . . . . . . . . . . . . . . . . . . . . 50
3 Rainmakers: Why Bad Weather Means Good Productivity 513.1 Introduction . . . . . . . . . . . . . . . . . . . . . . . . . . . . . . . . . . 52
3.1.1 Psychological Mechanisms of the "Weather E↵ect" on Productivity 533.2 Study 1: Field Evidence from a Japanese Bank . . . . . . . . . . . . . . . 55
3.2.1 Method . . . . . . . . . . . . . . . . . . . . . . . . . . . . . . . . 553.2.2 Results and Discussion . . . . . . . . . . . . . . . . . . . . . . . . 57
3.3 Study 2: Online Study of Weather and Productivity . . . . . . . . . . . . . 593.3.1 Method . . . . . . . . . . . . . . . . . . . . . . . . . . . . . . . . 593.3.2 Results and Discussion . . . . . . . . . . . . . . . . . . . . . . . . 61
3.4 Study 3: Online Study of Weather and Salience of Outdoor Options . . . . 613.4.1 Method . . . . . . . . . . . . . . . . . . . . . . . . . . . . . . . . 643.4.2 Results and Discussion . . . . . . . . . . . . . . . . . . . . . . . . 64
3.5 Study 4: Laboratory Study of Outdoor Options and Productivity . . . . . . 653.5.1 Method . . . . . . . . . . . . . . . . . . . . . . . . . . . . . . . . 653.5.2 Results and Discussion . . . . . . . . . . . . . . . . . . . . . . . . 67
3.6 General Discussion and Conclusion . . . . . . . . . . . . . . . . . . . . . 703.6.1 Theoretical and Practical Implications . . . . . . . . . . . . . . . . 75
4 The Power of Social A�rmation: E↵ects of Positive Interpersonal Jolts onHealth and Performance 774.1 Introduction . . . . . . . . . . . . . . . . . . . . . . . . . . . . . . . . . . 78
4.1.1 Self-A�rmation and Problem-Solving Performance . . . . . . . . . 814.1.2 Social-A�rmation as an Alternative Self-A�rmation Intervention . 834.1.3 Positive Interpersonal Jolts and Problem-Solving Performance . . . 864.1.4 Overview of the Present Research . . . . . . . . . . . . . . . . . . 93
4.2 Study 1 . . . . . . . . . . . . . . . . . . . . . . . . . . . . . . . . . . . . 944.2.1 Method . . . . . . . . . . . . . . . . . . . . . . . . . . . . . . . . 944.2.2 Results and Discussion . . . . . . . . . . . . . . . . . . . . . . . . 99
4.3 Study 2 . . . . . . . . . . . . . . . . . . . . . . . . . . . . . . . . . . . . 106
vi
4.3.1 Method . . . . . . . . . . . . . . . . . . . . . . . . . . . . . . . . 1084.3.2 Results and Discussion . . . . . . . . . . . . . . . . . . . . . . . . 113
4.4 General Discussion . . . . . . . . . . . . . . . . . . . . . . . . . . . . . . 1184.4.1 Theoretical and Practical Contributions . . . . . . . . . . . . . . . 1204.4.2 Limitations and Venues for Future Research . . . . . . . . . . . . . 1234.4.3 Conclusion . . . . . . . . . . . . . . . . . . . . . . . . . . . . . . 125
A 127A.1 Moral Dilemma Scenario (Study 1) . . . . . . . . . . . . . . . . . . . . . . 127A.2 High-conflict, Personal Moral Dilemmas (Study 2a) . . . . . . . . . . . . . 128A.3 High-conflict, Personal Moral Dilemmas (Study 3) . . . . . . . . . . . . . 130A.4 Congruent vs. Incongruent Moral Dilemmas (Study 4) . . . . . . . . . . . 131
B 138B.1 Instructions and Materials for the Online Task (Study 2) . . . . . . . . . . . 138B.2 Instructions for the Data Entry Task (Study 4) . . . . . . . . . . . . . . . . 140
C 141C.1 Treatment Booklet . . . . . . . . . . . . . . . . . . . . . . . . . . . . . . 142C.2 Control Booklet . . . . . . . . . . . . . . . . . . . . . . . . . . . . . . . . 150C.3 Sample Email from the Senior Executive Fellows Program . . . . . . . . . 154C.4 Sample Best-Self Report . . . . . . . . . . . . . . . . . . . . . . . . . . . 155C.5 Treatment Worksheet . . . . . . . . . . . . . . . . . . . . . . . . . . . . . 161C.6 Control Worksheet . . . . . . . . . . . . . . . . . . . . . . . . . . . . . . 164C.7 MERS Assignment . . . . . . . . . . . . . . . . . . . . . . . . . . . . . . 168C.8 Sample Evaluation Sheet for Expert Panel . . . . . . . . . . . . . . . . . . 170
Bibliography 171
vii

List of Tables
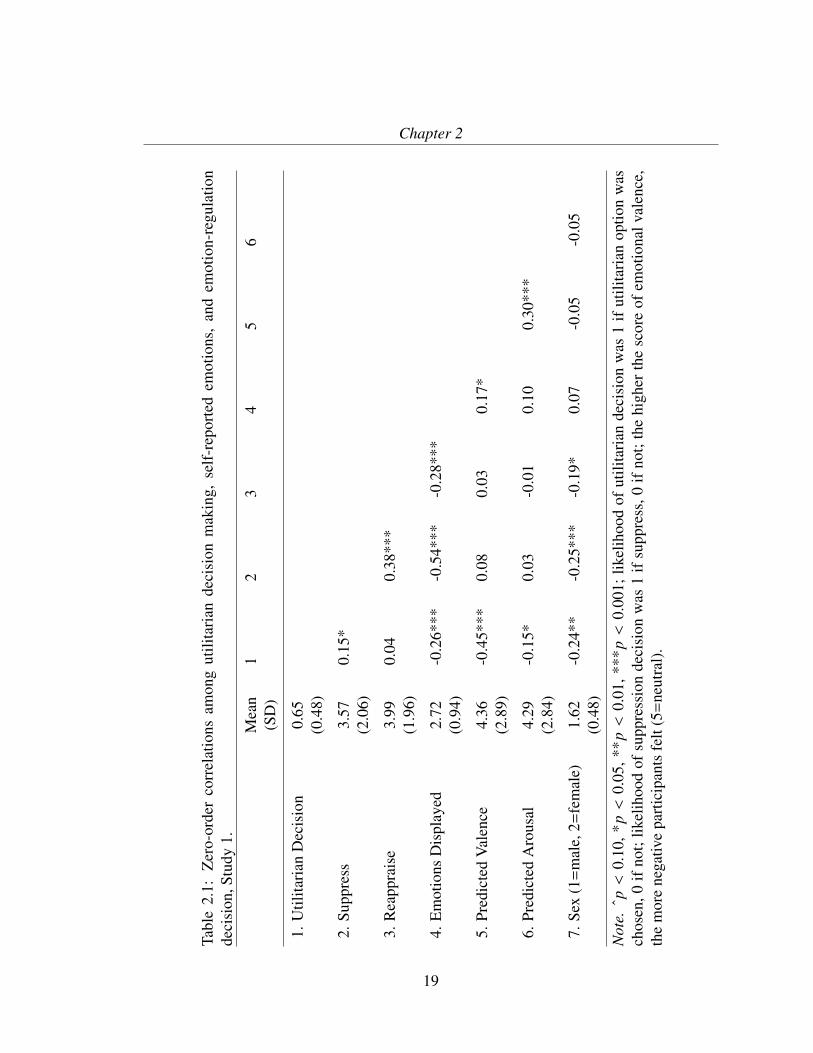
2.1 Zero-order correlations among utilitarian decision making, self-reportedemotions, and emotion-regulation decision, Study 1. . . . . . . . . . . . . . 19
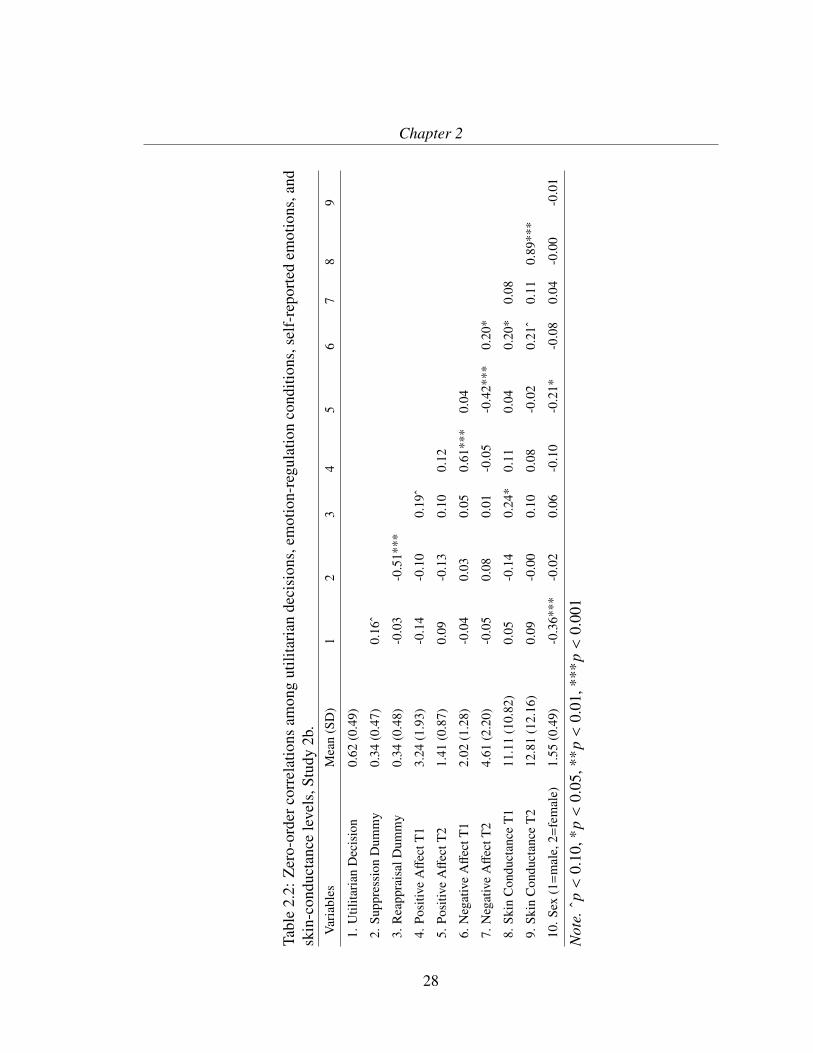
2.2 Zero-order correlations among utilitarian decisions, emotion-regulation con-ditions, self-reported emotions, and skin-conductance levels, Study 2b. . . . 28
2.3 Means and standard deviations by condition, Study 2b. . . . . . . . . . . . 292.4 Zero-order correlations among utilitarian decisions, emotion-regulation con-
ditions, self-reported emotions, and skin-conductance levels, Study 3. . . . 372.5 Means and standard deviations by condition, Study 3. . . . . . . . . . . . . 38
3.1 Summary regression results on completion time (n = 598, 393) for Study 1. 583.2 Summary statistics for Study 2. . . . . . . . . . . . . . . . . . . . . . . . . 623.3 Summary regression results in Study 2. . . . . . . . . . . . . . . . . . . . 633.4 Summary statistics for Study 4. . . . . . . . . . . . . . . . . . . . . . . . . 683.5 Summary regression results in Study 4 (Speed as a dependent variable). . . 713.6 Summary regression results in Study 4 (Accuracy as a dependent variable). 72
4.1 Means, standard deviations, and zero-order correlations for key variables,Study 1. . . . . . . . . . . . . . . . . . . . . . . . . . . . . . . . . . . . . 100
4.2 Multiple regressions results for fluency, flexibility, and novelty, controllingfor the level of education, Study 1. . . . . . . . . . . . . . . . . . . . . . . 107
4.3 Hierarchical multiple regression analyses for member-reported team func-tioning, Study 2. . . . . . . . . . . . . . . . . . . . . . . . . . . . . . . . . 115
4.4 Hierarchical multiple regression analyses for member-reported team func-tioning by categories, Study 2. . . . . . . . . . . . . . . . . . . . . . . . . 116
4.5 Hierarchical multiple regression analyses for overall team performance,Study 2. . . . . . . . . . . . . . . . . . . . . . . . . . . . . . . . . . . . . 118
4.6 Multiple regression analyses for member-rated and expert-rated team per-formance, Study 2. . . . . . . . . . . . . . . . . . . . . . . . . . . . . . . 119
viii

List of Figures
2.1 Results for the willingness to engage in emotion-regulation strategies as afunction of the moral choice made. Error bars represent standard errors(Study 1). . . . . . . . . . . . . . . . . . . . . . . . . . . . . . . . . . . . 21
2.2 Results for the traditional utilitarian judgment as a function of the emotion-regulation strategies. Error bars represent standard errors (Study 4). . . . . 44
2.3 Results for the process dissociation deontology and utilitarian scores as afunction of the emotion-regulation strategies. Error bars represent standarderrors (Study 4). . . . . . . . . . . . . . . . . . . . . . . . . . . . . . . . . 45
3.1 Exposure to outdoor options moderates the relationship between weatherconditions and productivity. . . . . . . . . . . . . . . . . . . . . . . . . . . 70
4.1 Experimental procedure for Study 1. . . . . . . . . . . . . . . . . . . . . . 964.2 Mean positive and transcendence emotions as a function of time and treat-
ment in Study 1. Error bars represent standard errors. . . . . . . . . . . . . 1014.3 Mean RSA as a function of time and treatment in Study 1. Error bars
represent standard errors. . . . . . . . . . . . . . . . . . . . . . . . . . . . 1024.4 Mean sIgA as a function of time and treatment in Study 1. Error bars
represent standard errors. . . . . . . . . . . . . . . . . . . . . . . . . . . . 1034.5 Mean skin conductance as a function of time and treatment in Study 1.
Error bars represent standard errors. . . . . . . . . . . . . . . . . . . . . . 1044.6 Mean problem-solving performance as a function of treatment in Study 1.
Error bars represent standard errors. . . . . . . . . . . . . . . . . . . . . . 1064.7 Team satisfaction and functioning mediates the relationship between the
experience of jolt and team performance. c denotes beta coe�cient for totale↵ect, and c0 beta coe�cient for direct e↵ect. ***p < 0.001, **p < 0.01,*p < 0.05, ˆp < 0.10. . . . . . . . . . . . . . . . . . . . . . . . . . . . . . 120
ix

Acknowledgments
I am greatly indebted to my wonderful advisors and mentors, Francesca Gino, Max Bazer-
man, and Richard Zeckhauser.
Francesca Gino taught me how exciting research can be. I always felt safe when raising
(sometimes through late-night email exchanges) new ideas that seemed too silly to discuss
with anyone else. The times we spent together discussing new theories and next steps were
the highlights of my graduate career. She is an eternally optimistic person and helped me
move forward even when I encountered inevitable moments of frustration.
Max Bazerman is the reason why I am in this field. His 2009 class introduced me to the
world of behavioral decision science and the wonder of experimental research. Through
his “nonlab” group, I not only received invaluable feedback on my own work, but met the
incredible doctoral students who are now my dear friends. Most importantly, Max taught
me not only to be a good scholar who asks important questions, but also to be a good human
being.
Richard Zeckhauser has been my mentor since I was a master’s degree student at the
Kennedy School. Richard and his famous class, titled “Analytic Frameworks for Policy”,
taught me to think critically and creatively as a scholar. I admire his brilliance, but more
importantly I admire the level of generosity and kindness that he has continued to share
with me all these years. He has given me the courage to be the kind of researcher who is
willing at times to take on the unorthodox yet worthwhile questions.
I am grateful to all of you for your unlimited support and trust. You have made this
intellectual journey extremely rewarding and exciting. It is such a privilege to have learned
from all of you, and I look forward to continuing to learn from each of you.
I’d also like to thank my collaborators, who have given me the support and mentorship
x

so critical to these endeavors. Bradley Staats, Dan Cable, Alison Brooks, and Bobby Par-
mar – all of whom Francesca introduced to me – are inspiring scholars. I have thoroughly
enjoyed our discussions of theoretical wrinkles and nagging empirical inconsistencies. I
hope that our collaborative work will continue for many years to come. I would also like to
thank four political scientists – James Fowler, Yunkyu Sohn, Dustin Tingley, and Jonathan
Renshon. All of you make interdisciplinary collaboration the intellectually enriching expe-
rience it should be.
I am fortunate to have been part of, and learned from, two critical lab groups: the
Behavioral Insights Group (formerly known as the “nonlab”) and the GiNorton Lab. I
thank Michael Norton, Todd Rogers, Ryan Buell, Leslie John, Christine Looser, and Mindi
Rock for all their valuable input. I am also grateful for the generous support provided by
Nicole Tateosian from the doctoral programs o�ce. I am also fortunate to have grown
together with such a great group of student cohorts at both the Harvard Kennedy School
and Harvard Business School.
As a Harvard University Sackler Scholar in Psychobiology 2013-2014, I wish to ac-
knowledge the generosity of the Mortimer and Theresa Sackler Foundation. My research
was also supported by Harvard Business School, the University of North Carolina at Chapel
Hill, and London Business School. I would like to express deep gratitude for the assistance
provided by Pete Zimmerman, the Chair of the Senior Executive Fellows (SEF) Program,
as well as Kathleen Carroll, Matt Cohen, Juliet Jacobs, Horace Ling, Michael McNulty,
Anna Shanley, Alison Thompson, and Donna Levy Wray.
I am grateful for the support provided by Mark Edington, Gabe Mansur, Nina Cohodes,
and the Harvard Decision Science Laboratory facilities, as well as the Harvard Business
School Computer Laboratory for Experimental Research (CLER). I have also had the priv-
xi
ilege of working with such talented research assistants through the Lab and the Behavioral
Insights Group. I thank Kanyinsola Aibana, Grace Aranow, Will Boning, Ari Brenner, Sean
Cha, Marina Chen, Christopher Deitrick, Phil Esterman, Judith Ezike, Christopher Fergus,
Annie Giebelhaus, Elena Helgiu, Alex Hu, Jong Hyun Jang, Carolyn Killea, Soohyun Lee,
Matthew Letke, Nicole Ludmir, Ethan Ludwin-Peery, Kate Mentzinger, Hae Young Min,
Nga Nguy, Jeanie Nguyen, Ceylan Oymak, Ryan Romain, Reed Snyder, Claire Tan, Stella
Tu, Alexis Wilkinson, Yian Xu, and Amee Yang. I greatly appreciate the statistical and
technical assistance provided by Karol Kazol, Olivia Lau, Andrew Marder, and Bill Simp-
son.
Most importantly, I would like to dedicate my dissertation to my family for their end-
less support and encouragement. I thank my parents, my little brother, my grandparents,
and the rest of my family for believing in me and supporting me in a way that cannot be
described in words. Last but not least, I am forever indebted to Edward Cunningham for
all his love and patience.
Cambridge, MassachusettsNovember, 2014
xii

For my loving family
xiii

Chapter 1
Microfoundations of Organizational
Functioning
How do organizations create an environment to motivate their employees to be healthy,
productive, and competent decision makers? The basic premise of my research is that orga-
nizational performance should not only be understood in terms of pure productivity mea-
sured by tangible input and output, but should also capture (i) managerial decision making,
(ii) employee engagement, and (iii) employee health and motivation. Our understanding of
performance should account for critical underlying psychological factors that often cripple
organizations.
My dissertation identifies the underlying factors that could prevent organizations from
achieving their goals, and takes on three research projects to address such barriers to suc-
cessful organizational functioning. To provide a theoretical foundation for my research, I
bring together conceptual and methodological streams from various disciplines including
organizational behavior, behavioral decision research, and cognitive and a↵ective psychol-
ogy. I then employ multiple methods, including laboratory experiments involving psy-
1

Chapter 1
chophysiology and neuroendocrinology as well as field research.
1.1 Barriers to Managerial Decision Making
An organization may su↵er the long-term consequences of biased decision making if a de-
cision maker is unaware of the potential influence of emotions on the decision task at hand.
Organizational leaders often encounter moral dilemmas in which making a choice based
on principles of right and wrong (i.e., a deontological approach) conflicts with making a
choice based on creating the greatest good (i.e., a utilitarian approach). Emotions that arise
from moral dilemmas, in particular, can cloud the decision maker’s judgment and may lead
to suboptimal outcomes for the organization. Consider a manager who must fire employees
to save the company, or a regulator who approves new drugs that may have dangerous side
e↵ects. Often, decision makers facing moral dilemmas are not aware of the role that their
own emotions and their e↵orts to regulate such emotions play in their decision making.
In my second chapter, I focused on the emotion-regulation processes that precede moral
decision making to understand the mechanism by which suppressing emotional expressions
leads to more utilitarian decision making. Using both correlational and causal designs in
five studies, I examine how di↵erent emotion-regulation strategies (i.e., concealing and re-
thinking emotions) influence the decision maker’s preference for utilitarian choice. I use
a process-dissociation approach to understand why regulation of emotions increases utili-
tarian decision making, and show that it is because emotion regulation selectively reduces
deontological inclinations, leading to greater preference for utilitarian decisions. This re-
search not only contributes to the theory of emotions and moral decision making, but also
provides insights for organizational leaders into how emotion regulation can facilitate con-
flict resolution between our intuitive impulses and utilitarian goals.
2

Chapter 1
1.2 Barriers to Employee Engagement
When organizations estimate their future revenue stream, they tend to consider only the
factors that are directly under their control or the risk-related factors that influence the
macroeconomic environment. However, I argue that organizational performance can be
influenced by costly incidental factors such as workplace distractions that are rarely ac-
counted for in the organizational leaders’ minds.
My third chapter identified a limited attention span as an obstacle to sustaining em-
ployee productivity in the online labor market, in the laboratory, and in the field. Exoge-
nous weather was studied as one of the many factors that may lead employees to engage in
distracting thoughts. Using a large-scale field data that included individual productivity of
Japanese bankers, my colleagues (Brad Staats and Francesca Gino) and I found that, contra-
dictory to conventional wisdom, an increase in precipitation is associated with an increase
in worker productivity. Good weather was associated with a 1.3% decrease in worker pro-
ductivity, which could be translated as a significant loss in revenue for the bank, estimated
at approximately a million dollars a year. Further, we showed in the laboratory that when
the weather is bad, individuals tend to focus more on their work than on alternate outdoor
activities. This research reveals how seemingly irrelevant, uncontrollable factors–such as
rain–may influence employee productivity by eliminating potential cognitive distractions.
Thus, our work suggests that organizations should factor such incidental factors into their
sta�ng model and allow flexible working hours to minimize productivity loss.
3

Chapter 1
1.3 Barriers to Employee Health and Motivation
An organization may su↵er low productivity, high rates of absenteeism, and rising health
care costs if it fails to ensure that its employees cope with job-related stressors, and if it fails
to motivate them to excel. Yet, organizations often fail to predict how their employees will
respond to processes that were created to maximize productivity. Performance evaluation
that is focused on identifying the employee’s weaknesses, for example, may fail to motivate
employees, or might even backfire.
My fourth chapter addresses this problem of organizations impeding the human poten-
tial, by invoking individuals’ psychosocial resources. I adopt a method called the Reflected
Best-Self Exercise, in which employees identify their own narrative providers, then receive
and reflect on stories of when they were at their best, and finally revise their own strength
narratives. I theorize how this experience, which I term a positive interpersonal jolt, can
trigger a change in self-knowledge structures, and I empirically test a set of hypotheses at
the individual and team level. First, experiencing jolts in the laboratory setting increased
positive a↵ect and vagal tone–a physiological marker for positive emotions and social en-
gagement. Second, beyond the immediate a↵ective and physiological responses, it also
strengthened one’s immune system (measured by an increase of secretory immunoglobulin
A) and reduced aversive physiological arousal associated with stress. Third, individuals
who experienced jolts outperformed controls in creative problem-solving tasks.
The first study in this chapter provides empirical evidence for the role of social a�r-
mation in promoting resilience, physiological function, and productivity. Building on this
research, the second study was conducted with the Senior Executive Fellows program at the
Harvard Kennedy School as an in-class experiment. Using this unique opportunity to work
with real-world leaders, I show that the same intervention can enhance team functioning
4

Chapter 1
(team satisfaction, learning, voice behavior, and perspective-taking) and team performance
even though team functioning and performance were measured 10 days after the initial in-
tervention. This research thus identified a low-cost intervention that enables organizations
to trigger high-impact changes in employees’ psychological resilience, physical health,
productivity, and organizational functioning.
1.4 Concluding Remarks
My work to date is intended to promote the use of scientific evidence to diagnose and
address critical problems in social and behavioral science. Through a series of empirical
studies, I intend to deepen our understanding of psychological antecedents and behavioral
consequences of individual and organizational functioning. This dissertation demonstrates
that organizational performance should be understood, at least in part, in terms of the func-
tioning of individual employees and teams. This work provides managerial insights for
organizational leaders and managers, by informing them of a↵ective, cognitive, and moti-
vational influences that they may not have predicted to a↵ect the behavioral outcomes of
themselves and their employees. Thus, my work lays groundwork for organizational lead-
ers to counteract the three barriers to organizational functioning, by creating systems that
promote employee behaviors that are emotionally competent, engaged, and motivated.
5

Chapter 2
Poker-faced Morality: Concealing
Emotions Lead to Utilitarian Decision
Making
Abstract
This paper examines how making deliberate e↵orts to regulate aversive a↵ective responses
influences people’s decisions in moral dilemmas. I hypothesize that emotion regulation
– mainly suppression and reappraisal – will encourage utilitarian choices in emotionally
charged contexts and that this e↵ect will be mediated by the decision maker’s decreased de-
ontological inclinations. Study 1 finds that individuals who endorsed the utilitarian option
(vs. the deontological option) were more likely to suppress their emotional expressions.
In Studies 2a, 2b, and 3, participants are instructed to either regulate their emotions, using
one of two di↵erent strategies (reappraisal vs. suppression), or not to regulate, and data is
6

Chapter 2
collected through the concurrent monitoring of psycho-physiological measures. It is found
that participants are more likely to make utilitarian decisions when asked to suppress their
emotions rather than when they do not regulate their a↵ect. Study 4 shows that one’s re-
duced deontological inclinations mediate the relationship between emotion regulation and
utilitarian decision making.
2.1 Introduction
In the 2009 film Up in the Air (2009), the character Natalie Keener, played by Anna
Kendrick, takes a job with Career Transition Corporation, a company that institutes layo↵s
on behalf of other companies. Kendrick proposes a plan to cut costs by conducting layo↵s
via videoconferencing. Piloting the virtual-firing program online, with no trace of emotion
on her face, Natalie matter-of-factly informs Mr. Samuels, a 57-year-old employee, that he
has been let go. Even as Mr. Samuels becomes upset and starts to cry, Natalie continues to
suppress her emotional expressions, mechanically telling him to pack his belongings.
In both our professional and personal lives, we often face moral dilemmas in which
making a choice based on our principles of right and wrong (i.e., a deontological approach)
conflicts with making a choice based on creating the greatest good (i.e., a utilitarian ap-
proach). More specifically, decision makers in various professional settings regularly en-
gage in harmful actions toward others in pursuit of greater overall goals. Managers some-
times must fire employees to save their company, judges sometimes hand down capital
punishment to uphold legal principles, and regulators often approve new drugs that can
have dangerous side e↵ects.
Like Natalie, people often appeal to utilitarian logic to justify their decisions to harm
others. Molinsky and Margolis (2005) coined the term "necessary evils" to refer to tasks
7

Chapter 2
in which a person must knowingly and intentionally cause harm to another human being in
the service of achieving some perceived greater good or purpose. Interviews conducted to
determine how professionals who carry out necessary evils experience such incidents (e.g.,
surgeons operating on infants) found that 46% reported staying psychologically disengaged
(Molinsky and Margolis 2005). As a result, they denied experiencing prosocial emotions
toward those (if only temporarily) harmed and reported trying to dissociate from the harmed
target’s experience. This research highlights that once a utilitarian decision has been made
and is about to harm someone, people often try to detach themselves emotionally from the
event and show behavior lacking in interpersonal sensitivity.
Whereas this line of research treats emotional expressions as a consequence of justify-
ing utilitarian decision-making, this research asks if regulating emotional expression can
lead to more utilitarian decision making when people face moral dilemmas. Given the per-
vasiveness of such choices in our daily lives, in this paper I aim to investigate the emotion-
regulation processes that precede moral decision making and to understand the mechanism
by which suppressing emotional expressions may lead to more utilitarian decision making.
2.1.1 Utilitarian vs. Deontological Decision making in Moral Psychol-
ogy
Given the importance of moral decision making in dilemmas, moral psychology research
has begun to identify the psychological processes by which people evaluate moral dilem-
mas. Cognitive and emotional processes are often in conflict when a moral decision needs
to be made (Bartels 2008; Greene 2001; Greene et al. 2008). One early manifestation
was found in neuroimaging studies conducted to distinguish how individuals respond to
personal, impersonal, and non-moral dilemmas (Greene 2001). Personal dilemmas, in par-
8

Chapter 2
ticular, trigger processing in brain regions closely associated with emotions, and this a↵ec-
tive processing interferes with the utilitarian choice to avoid doing harm to others. Such
emotions have also been identified in the form of a host of discrete intrapersonal emotions
(such as victim distress and empathy; Blair 1995), as well as visceral, physiological re-
actions associated with engaging in harmful actions (Cushman et al. 2012). When such
strong aversive emotions are tied to a moral dilemma, people no longer prefer the utilitar-
ian option ("Doing harm is morally acceptable in circumstances that improve well-being")
and instead tend to choose the more morally intuitive, deontological one ("Doing harm
is morally unacceptable"). As this research from the dual-process model of moral judg-
ment suggests, when people face di�cult, personal moral dilemmas, both cognitive and
emotional considerations can influence their decisions.
Researchers have since proposed several ways in which one can elect the more utilitar-
ian choice even in the presence of strong emotions. For example, when people engage in
deliberative thinking (Greene 2001; Greene et al. 2004) or have a higher working memory
capacity (Bartels 2008; Feltz and Cokely 2008; Moore et al. 2008), they tend to make more
utilitarian judgments. Whereas this research has recognized the important role of cognitive
styles and executive functions in driving moral judgments and decisions, recent evidence
suggests that there is an alternate, a↵ective route to influence our utilitarian vs. deontolog-
ical decisions. For example, individuals who su↵er damage to brain areas associated with
emotions make more utilitarian decisions (Ciaramelli et al. 2007; Koenigs et al. 2007), and
visualizing or imagining a harm vividly (Amit and Greene 2012; Bartels 2008; Petrinovich
et al. 1993) also increases the tendency to make deontological judgments.
9

Chapter 2
2.1.2 Role of Emotion-Regulatory E↵orts in Moral Decision Making
Less scholarly attention has been paid to the ways in which people regulate the emotions
that arise from moral dilemmas themselves. If emotions are indeed critical in deterring
people from making utilitarian decisions, then one’s decision to regulate one’s emotional
reactions in the face of a moral dilemma is likely to be crucial in determining whether one
chooses options that are more or less utilitarian. This research considers distinct psycho-
logical routes to more utilitarian decisions by focusing on the role of regulating a↵ective
responses that arise from moral dilemmas.
Research has identified two types of emotion-regulation strategies, expressive suppres-
sion and cognitive reappraisal, and examined their di↵erential consequences on behavior
(Ochsner and Gross 2005, 2008). Suppression involves concealing our emotions after the
initial emotional response has occurred. It is unlikely to help one feel less negative, and
it impairs the e�ciency of cognitive processing, such as memory and problem solving
(Richards 2004; Richards and Gross 2000). In contrast, cognitive reappraisal alters one’s
thoughts about a target event to control the initial emotional response. Individuals who
chronically engage in reappraisal have been shown to have a more adaptive profile of phys-
iological responses (Gross and Levenson 1997) and are psychologically healthier in the
long term than those who do not (Gross 2002; Gross and John 2003). As compared to
controls, individuals who were instructed to use reappraisal felt less negative after expe-
riencing a negative event and had less sympathetic nervous system arousal (Gross 1998,
2002). Taken together, the empirical evidence to date suggests that the use of reappraisal
reduces one’s subjective and physiological experience of emotions.
Although such adaptive profile of reappraisal and maladaptive profile of suppression
are well-documented, few studies to date have examined the role of emotion-regulation
10

Chapter 2
strategies in moral decision making. Feinberg and colleagues (2012) demonstrated the
relevance and e�cacy of the reappraisal strategy in reducing moral intuitions (e.g., disgust
that arises from reading a scenario describing a family eating a deceased pet dog). In
their research, individuals who employed the reappraisal strategy, as compared to those
who did not, judged the family’s action to be less morally wrong. Although most people
experienced disgust initially, the use of reappraisal helped them to reconstrue the situation
such that they felt less negative (e.g., "The dog has already been killed in an accident,
so no real harm was done to the dog, and therefore I cannot judge this family’s action
to be morally wrong"). Importantly, Feinberg and colleagues (2012) found that habitual
suppression is not significantly associated with reducing moral intuitions, which led them
to focus on reappraisal only. This research pioneered the study of emotion regulation and
moral decision-making using scenarios that induce moral emotions such as disgust and
contempt. However, it has a limitation: the types of scenarios used do not capture the wide
variety of moral dilemmas present in the world.
There are several key di↵erences between the moral scenarios used in Feinberg et al.
(2012) and the moral dilemmas I discuss and use here. First, my research focuses on moral
dilemmas that involve a conflict between two moral principles: utilitarian and deontolog-
ical. The moral dilemma scenarios used in this study highlight a tension between two
conflicting goals that can be justified using two distinct moral principles. When people
feel torn between the options, they experience strong aversive emotions (Luce et al. 1997;
Tetlock et al. 2000). Second, these moral dilemmas involve inevitable harm. No matter
what decision the agent makes, some level of individual sacrifice in the form of physical
harm or su↵ering is unavoidable (Moore et al. 2008). Third, instead of reacting to what has
already been done from a third-person perspective, participants are asked to make moral
11

Chapter 2
judgment about the agent’s potential utilitarian actions or to make an active decision from
a first-person perspective.
2.1.3 Deontological Inclinations as an Underlying Mechanism for the
Relationship between Emotion Regulation and Utilitarian Deci-
sions
Due to such di↵erences, I argue that the moral dilemmas used in this research are more
conflicting and emotionally charged by nature than those used in Feinberg et al. (2012).
As such, predictions regarding the relationship between emotion regulation and moral de-
cision making should be made with caution. A primary criticism of the previous research
on moral decision making is that utilitarianism and deontology are measured on one scale,
on the assumption that these two moral principles are perfectly inversely related (i.e., a
stronger preference for utilitarian judgment means a weaker preference for deontological
judgment). However, given that these moral principles stem from two independent psy-
chological systems (Greene 2007), Conway and Gawronski (2013) used Jacoby’s (1991)
process-dissociation approach to quantify the relative strength of deontological and utili-
tarian inclinations within individuals. This technique allowed them to determine whether
an increase in utilitarian choice or judgment is driven by a heightened utilitarian inclination
or by a decreased deontological inclination. I thus adopted this methodology to understand
the mechanisms by which specific emotion-regulation strategies influence moral decision-
making.
Given the previous research on how suppression leads to more negative physiologi-
cal arousal associated with emotional stimuli (Gross 1998), suppressing negative a↵ect
arising from moral dilemmas may not help individuals feel less negative. Similar to the
12

Chapter 2
finding that habitual suppression is not significantly correlated with moral judgment (Fein-
berg et al. 2012), one could hypothesize that suppression will not be e↵ective in increasing
one’s preference for a utilitarian choice or may even decrease one’s utilitarian inclinations
if aversive arousal is heightened and consciously felt as a moral "gut feeling." However,
reappraisal would be more e↵ective in leading individuals to make a utilitarian choice, as it
reduces physiological arousal (Gross 1998). These predictions are based on the assumption
that such physiological arousal can influence our conscious decision-making by modulat-
ing the experience of empathic concerns for potential victims. If this is true, suppression
would increase deontological inclinations, and reappraisal would decrease deontological
inclinations.
However, a di↵erent prediction could be made if suppression actually helps reduce
one’s tendency to make a more emotionally driven decision. It is possible that the suppres-
sion of emotion-related facial expressions may function as feedback, providing information
that in turn influences one’s moral judgment. Drawing from the Facial Feedback Hypothe-
sis (Tomkins 1963), past research has found that facial feedback influences social-cognitive
processes, such as emotional experience (Davis et al. 2010) and empathic accuracy (Neal
and Chartrand 2011). As a result of facial feedback, individuals who express emotions may
become more sensitive toward a victim’s su↵ering associated with the utilitarian choice. If
suppression of facial feedback (either by instruction to suppress muscle movement or by
the injection of botulinum toxin to paralyze the facial muscles) were to reduce people’s
experience and appraisal of emotions, it might reduce one’s empathic distress associated
with the victims harmed and sacrificed as a result of the moral decision. If a decision
maker expects to experience negative feelings and knows it would be di�cult to avoid such
an aversive psychological state, suppression may successfully tamper with emotional in-
13

Chapter 2
fluence, thereby helping to generate a disconnect between one’s emotional reactions and
the decision at hand. Conway and Gawronski (2013) have demonstrated that showing a
photograph of the victim enhanced empathic concerns and emotional distress, thus selec-
tively increasing one’s deontological inclinations. Thus, I theorize that suppressing facial
expressions of aversive emotions will reduce one’s deontological inclinations and therefore
facilitate a utilitarian choice.
Hypothesis 1a: The use of suppression strategy will be associated with more utilitarian
decision-making.
Hypothesis 1b: The relationship between suppressing emotional reactions and making
utilitarian decisions will be explained by reduced deontological inclinations.
Based on prior research on the e�cacy of reappraisal in down-regulating negative a↵ect,
I expect to replicate the finding from Feinberg et al. (2012) but further probe the mecha-
nisms by which reappraisal leads to a more utilitarian choice. Cameron and Payne (2011)
proposed a motivational account of emotion regulation to explain the "collapse of compas-
sion," or the tendency for people to reduce their compassion as the number of people in
need of help increases. Individuals who had been instructed to down-regulate (reappraise)
emotions as they learn about one or eight victims expecting help were more likely to ex-
perience the "collapse of compassion" as compared to those who were told to experience
their emotions. Cameron and Payne (2011) demonstrated that people tend to predict that
the needs of large groups will be more overwhelming to them than the needs of one per-
son; therefore, people are motivated to engage in emotion regulation to prevent themselves
from experiencing such an aversive psychological state. This explains why people tend
to be insensitive to mass su↵ering. Along the same lines, I expect that reappraisal would
14

Chapter 2
reduce empathic concerns for the possible victims of the utilitarian choice. Taken together,
I predict that reappraising aversive emotions will reduce one’s deontological inclinations,
thereby facilitating a utilitarian choice.
Hypothesis 2a: The use of reappraisal strategy will be associated with more utilitarian
decision-making.
Hypothesis 2b: The relationship between reappraising emotional experience and making
utilitarian decisions will be explained by reduced deontological inclinations.
2.1.4 Overview of the Present Research
The main goal of this research is to contribute to the intersection between emotion regu-
lation and utilitarian decision-making, and to clarify the underlying mechanisms by which
emotion regulation a↵ects morality. Using both correlational and causal designs, I exam-
ine how di↵erent emotion-regulation strategies influence moral decisions when people are
faced with a di�cult moral dilemma. My goals are (1) to first show that concealing and
rethinking emotions increases one’s preference for utilitarian choice and (2) to test my hy-
pothesis regarding why regulation emotions has this specific e↵ect on utilitarian decision
making using a process-dissociation approach.
Across five studies, I test the main predictions and find that regulating emotions in-
creases people’s likelihood of making utilitarian decisions. I use a variety of emotionally
charged moral dilemmas and vary the dependent measures to include either making a moral
judgment (i.e., Is it morally appropriate?) or making a moral decision (i.e., Which decision
will you make if you were the agent?).
In Study 1, I examine whether individuals who choose a utilitarian option are more
likely to suppress emotions than those who make a deontological choice. Given the cor-
15

Chapter 2
relational nature of Study 1, in Study 2-4, I manipulate participants’ emotion-regulation
strategies and examine the e↵ects of such strategies on their moral decisions in a dilemma
situation. Here I test Hypothesis 1a and 2a, which suggests that individuals who are in-
structed to regulate their emotions are more likely to make utilitarian decisions as com-
pared to those who are not instructed to do so. Importantly, to closely track the e↵ect of
each emotion-regulation strategy on participants’ physiological arousal, I use data from
concurrent monitoring of psycho-physiological indices of emotion in Study 2b and 3. I test
the alternative hypothesis that suppression decreases preference for utilitarianism through
heightened physiological arousal, while reappraisal increases preference for utilitarianism
through reduced physiological arousal. Finally, in Study 4, I test Hypothesis 1b and 2b on
the mechanisms using the process-dissociation approach, which suggests that both strate-
gies selectively reduce deontological inclinations, thus leading to greater preference for
utilitarian decisions.
2.2 Study 1
In Study 1, I use a hypothetical scenario to test whether individuals who make utilitar-
ian decisions predict that they will experience more negative, high-arousal emotions, and
will thus be willing to use more emotion-regulation strategies, as compared to those who
make deontological decisions. To ensure that participants are given at least two emotion-
regulation strategies, I asked them to first make a moral decision and then indicate their
willingness to use suppression and reappraisal strategies.
16

Chapter 2
2.2.1 Method
Participants
I recruited 186 workers (Mage = 37.21, S D = 12.98; 38% male) from an online labor
market (Amazon Mechanical Turk) to participate in a 10-minute survey for $0.40.
Procedure
The study’s instructions informed participants that they would read a hypothetical scenario
(adapted from Uhlmann et al. 2013). In this scenario, an agent is about to decide whether to
approve the use of $2 million to save one child’s life (deontological choice) or to use it for
other hospital needs that could save 200 future patients’ lives (utilitarian choice) (Tetlock
et al. 2000, See Appendix A.1 for the scenario). After reading the scenario, participants
were presented with two choices: a deontological or a utilitarian choice.
In addition, participants answered two questions assessing how they felt as they made
the decision and some demographic questions. To better understand the emotions people
expect to experience as they considered making moral choices, two questions predicting
their emotional valence and arousal were asked. The first measured valence by asking
participants to indicate how positively or negatively they felt (with 0 = extremely un-
happy/unpleasant, 5 = neutral, and 10 = extremely happy/pleasant). The second measured
arousal by asking participants to indicate how aroused they would feel (with 0 = low level
of arousal, 5 = a moderate (everyday) level of arousal, and 10 = a high level of arousal).
Participants were then asked to decide how they would display their emotions. Then
I presented two ways to display emotions and asked how willing they would be to use
such strategies (1 = not at all, 7 = extremely willing): suppression ("I will try not to show
any emotional expressions on my face."), reappraisal ("I will try to change the way I think
17

Chapter 2
about the situation so I feel less negative."). Participants were also asked to rate how much
emotion they would actually express as they informed the transplant department of their
decision (1 = none, 5 = all) and to write a few sentences to describe what facial expression
they would have. Participants’ responses to this open-ended question were coded by two
research assistants who were blind to the study’s hypotheses. The two coders scored the
responses based on the extent to which the participants suppressed their emotional reactions
(1 = no attempt to suppress emotion, 7 = complete suppression of emotion).
Finally, participants completed a demographics questionnaire. Although testing the
gender e↵ects is outside the scope of this research, I included gender in all analyses, as par-
ticipants’ gender may influence both one’s tendency to make a utilitarian vs. deontological
choice and one’s emotion-regulation strategy.1
2.2.2 Results
Table 2.1 reports the descriptive statistics of the main variables and their zero-order cor-
relations. Of the participants, 65.6% chose to make a utilitarian decision by denying the
transplant request, and 34.4% made a deontological decision by approving the transplant
request. There was a significant gender di↵erence: males (53 out of 66) were more likely
to make a utilitarian choice than were females (62 out of 110), �2(1,N = 176) = 10.44,
p = 0.001, V = 0.02.
Individuals who made the utilitarian decision (M = 3.41, S D = 2.67) predicted feeling1Gender was included in my analyses for two main reasons. First, the gender e↵ect on moral decision
making is still debated by many scholars; it has been theorized that females are more likely to be driven byemotion, empathy, and care for others than males (Gilligan 1982). While some researchers found a smalle↵ect or no e↵ect of gender (Brabeck and Shore 2003; Ja↵ee and Hyde 2000), others found that femalesare more likely to have deontological inclinations (Aldrich and Kage 2003; Indick et al. 2000). Second, thegender e↵ect on the type of emotion-regulation strategy that individuals choose is well-documented; malesuse suppression strategy more frequently than females (Tamres et al. 2002).
18
Chapter 2
Tabl
e2.
1:Ze
ro-o
rder
corr
elat
ions
amon
gut
ilita
rian
deci
sion
mak
ing,
self-
repo
rted
emot
ions
,an
dem
otio
n-re
gula
tion
deci
sion
,Stu
dy1.
Mea
n(S
D)
12
34
56
1.U
tilita
rian
Dec
isio
n0.
65(0
.48)
2.Su
ppre
ss3.
57(2
.06)
0.15
*
3.R
eapp
rais
e3.
99(1
.96)
0.04
0.38
***
4.Em
otio
nsD
ispl
ayed
2.72
(0.9
4)-0
.26*
**-0
.54*
**-0
.28*
**
5.Pr
edic
ted
Vale
nce
4.36
(2.8
9)-0
.45*
**0.
080.
030.
17*
6.Pr
edic
ted
Aro
usal
4.29
(2.8
4)-0
.15*
0.03
-0.0
10.
100.
30**
*
7.Se
x(1=
mal
e,2=
fem
ale)
1.62
(0.4
8)-0
.24*
*-0
.25*
**-0
.19*
0.07
-0.0
5-0
.05
Not
e.ˆp<
0.10
,*p<
0.05
,**p<
0.01
,***
p<
0.00
1;lik
elih
ood
ofut
ilita
rian
deci
sion
was
1if
utili
taria
nop
tion
was
chos
en,0
ifno
t;lik
elih
ood
ofsu
ppre
ssio
nde
cisi
onw
as1
ifsu
ppre
ss,0
ifno
t;th
ehi
gher
the
scor
eof
emot
iona
lval
ence
,th
em
ore
nega
tive
parti
cipa
nts
felt
(5=
neut
ral).
19
Chapter 2
more negative emotions than those who made the deontological decision (M = 6.15, S D =
2.40), t(176) = 6.92, p < 0.001, d = 1.07. Similarly, utilitarian decision makers (M =
3.97, S D = 2.75) predicted experiencing more arousal than deontological decision makers
(M = 4.90, S D = 2.94), t(176) = 2.03, p = 0.04, d = 0.33.
I used a mixed ANOVA in which the participants’ willingness to use emotion-regulation
strategy served as a dependent variable, emotion-regulation type (suppression vs. reap-
praisal) served as a within-subject factor, and moral decision (utilitarian vs. deontological)
served as a between-subject factor. Participants reported that they were more likely to use
reappraisal (M = 3.99, S D = 1.96) than suppression (M = 3.57, S D = 2.06) when fac-
ing the moral dilemma, F(1, 175) = 7.83, p = 0.006, ⌘⇢2 = 0.04. More importantly, this
di↵erence was driven by the significant di↵erence in willingness to use suppression when
making a utilitarian choice (M = 3.80, S D = 2.15) as compared to when making a deon-
tological choice (M = 3.13, S D = 0.23), t(177) = 2.18, p = 0.03, d = 0.15. However, I
did not find a significant di↵erence on the willingness to reappraise emotions across utili-
tarian and deontological decision making, t(177) = �0.60, p = 0.55, d = 0.09. Figure 2.1
summarizes this relationship. Lastly, participants who made a utilitarian choice reported
that they were less likely to display emotional expressions when notifying others of their
decision (M = 2.55, S D = 0.91) as compared to those who made a deontological choice
(M = 3.06, S D = 0.91), t(175) = 3.56, p < 0.001.
A content analysis also confirms that participants who made the utilitarian choice were
more likely to engage in suppression. The intercoder reliability kappa was 0.74, p < 0.001,
so I created a composite score using an average. Utilitarian decision makers (M = 4.17,
S D = 2.22) suppressed emotional reactions more than deontological decision makers (M =
3.19, S D = 2.01), t(174) = 2.92, p = 0.004, d = 0.46. Examples of a suppression
20

Chapter 2
Figure 2.1: Results for the willingness to engage in emotion-regulation strategies as a func-tion of the moral choice made. Error bars represent standard errors (Study 1).
21
Chapter 2
response followed by a utilitarian decision include the following: "I would have to keep
my mouth shut very tight to keep my emotions from getting out of control," "I would try
to be as calm and stoic as possible," and "I would try to stonewall it." Examples of a no-
suppression response followed by a deontological decision included: "I would show the
pain and struggle of this decision in my expression" and "I would be sad and wouldn’t be
afraid of showing it. I don’t think there is much point in hiding the fact that my decision
causes someone to su↵er."
Controlling for gender did not change the direction or significance of the results, al-
though being female was positively associated with expressing emotions but negatively as-
sociated with suppressing and reappraising emotions. Similarly, controlling for predicted
emotions (both valence and arousal) did not change the direction or significance of the
results.
2.2.3 Discussion
In this study, participants’ emotional displays served as a primary measure of interest as
a function of the choice they made (whether utilitarian or deontological). These findings
demonstrated that utilitarian decision making, as compared to deontological decision mak-
ing, involved predicting the experience of more negative and high-arousal emotions. This
suggests that sacrificing one person to save 200 lives in the near future still generates more
aversive emotional reactions, despite the positive emotions that arise from saving 200 lives
in the distant future. Individuals who decided to make the utilitarian choice were also more
willing and likely to suppress emotional expressions, while those who made the deontolog-
ical choice were less likely to do so. However, participants’ willingness to use reappraisal
did not di↵er based on the moral decision made. It should be noted that this result is driven
22

Chapter 2
by lower levels of suppression when a deontological decision is made; people tended to
express emotions when making a deontological choice. Thus, this study demonstrated that
both suppression and reappraisal are relevant emotion-regulation strategies when dealing
with emotionally charged moral dilemmas.
2.3 Study 2
Study 1 showed that when individuals can rate each of the emotion-regulation strategies
that are likely to use, utilitarian decision makers are more willing to use suppression than
deontological decision makers.no significant di↵erence in the use of reappraisal was found.
Based on the promising correlations linking utilitarian decision making with emotion-
regulation strategies (suppression, in particular), in Study 2 I examined the causal rela-
tionship between regulatory strategies (by randomly assigning participants to one of the
three conditions – control, reappraisal, and suppression) and moral decisions. Specifically,
I investigated whether an emotion-regulation strategy employed at the moment of decision
a↵ects one’s moral decisions.
In Study 2a, I first instructed participants to use a specific emotion-regulation strategy
and then presented them with five moral dilemma scenarios. In each, participants judged
whether the agent’s utilitarian action is morally appropriate or not. In Study 2b, I asked
participants to watch a video clip depicting a moral dilemma and then asked them to make
a high-conflict moral decision by taking the perspective of the main character in the clip.
In Study 2b, I included skin conductance as a measure of emotional involvement in moral
dilemmas as well as a manipulation check of the emotion-regulation strategies. Skin con-
ductance levels, which reflect individuals’ tonic electrodermal activity, have been associ-
ated with indices of arousal, attention, fear, and anxiety (Mendes 2009). A key benefit
23

Chapter 2
of using skin conductance is that it cannot be voluntarily controlled or consciously pro-
cessed. Scholars have thus used skin conductance to reduce self-report biases and to detect
emotional engagement in judgment and decision making (Figner and Murphy 2011).
2.3.1 Study 2a Method
Participants and procedure
One hundred sixty-three individuals (Mage = 35.75 years, S D = 11.70; 38% male) from
Amazon Mechanical Turk participated in a 10-minute long study for $0.50. Participants
were randomly assigned to one of three conditions, in which they were asked to employ
di↵erent emotion-regulation strategies (adapted from Shiota and Levenson 2009): suppres-
sion, reappraisal, or no strategy at all (control). In the suppression condition, the instruc-
tions read:
As you listen to the audio clips, if you have any feelings, please try your
best not to let those feelings show. Please listen carefully, and try to behave so
that someone watching you would not know that you are feeling anything at
all.
In the reappraisal condition, the instructions read:
As you listen to the audio clips, please think about what you are seeing
objectively. Please listen carefully, and try to think about what you are seeing
in such a way that you feel less negative emotion.
Finally, in the control condition, participants were asked to "Please listen carefully."
Then participants listened to five moral dilemmas in the same order (See Appendix A.2
for the transcribed materials) and were asked to rate whether the utilitarian action of the
24

Chapter 2
agent is morally appropriate (1 = very inappropriate to 6 = very appropriate).
2.3.2 Study 2a Results
Using a multiple regression analysis, I tested the hypothesis that regulating one’s emo-
tions would be associated with an increased likelihood of making a utilitarian decision, as
compared to controls. I included gender as a covariate; being a male was associated with
rating the agent’s utilitarian action to be more morally appropriate, B = 0.46, S E = 0.17,
p = 0.006. The suppression dummy variable had significant regression weights, B = 0.51,
S E = 0.21, p = 0.01, as did the reappraisal dummy variable, B = 0.50, S E = 0.20,
p = 0.01.
2.3.3 Study 2b Method
Participants and procedure
One hundred ten individuals (Mage = 30.51 years, S D = 12.85; 46% male) from the
Boston/Cambridge area participated in the study for $15. They completed the study at
individual computer terminals. I used the same instructions for each of the conditions
(Shiota and Levenson 2009).
At the beginning of the experiment, I applied physiological sensors to participants to
measure their physiological responses from electrodermal activities throughout the entire
study. I first asked them to self-report their current emotions. After reading the emotion-
regulation instructions to suppress or reappraise their emotions (no specific instructions
were given to controls), participants watched a four-minute video clip from the movie Ver-
tical Limit (2000). The video clip presents a moral dilemma that triggers strong emotional
reactions. Specifically, it shows a rock-climbing accident that endangers a father, his daugh-
25

Chapter 2
ter, and his son. The father presents his son with a di�cult choice: 1) cut the rope, an action
that would save the son and daughter but kill the father; or 2) not cut the rope, which would
cause all three people to die. Thus, in this scenario, the utilitarian choice is to cut the rope
(i.e., save two people rather than none). After watching the video clip, participants indi-
cated the decision they would make if they faced the same choice as the son depicted in the
movie.
Next, they completed a questionnaire that measured their state emotions and were asked
demographic questions.
Measures
Autonomic responses. All physiological data were scored manually using Mindware
software modules (Mindware Technologies, Gahanna, OH) by research assistants who were
blind to both the study hypotheses and conditions. In addition, a subsample was rescored
to ensure reliability. Skin-conductance level was assessed by two Ag/AgCL electrodes at-
tached to the palm of the non-dominant hand. Skin conductance was recorded continuously
throughout the study, and the skin-conductance levels were retained for analysis.
State emotions. I assessed participants’ preexisting state emotions and their post-manipulation
state emotions (after watching the video and making their moral decision) using the 20-item
Positive and Negative A↵ect Scale (PANAS; Watson et al. 1988). I then created four com-
posite variables: pre-task positive a↵ect (↵ = 0.76), pre-task negative a↵ect (↵ = 0.82),
post-task positive a↵ect (↵ = 0.88), and post-task negative a↵ect (↵ = 0.93).
26

Chapter 2
2.3.4 Study 2b Results
Table 2.2 reports the descriptive statistics of the main variables I assessed in the study and
their zero-order correlations. Table 2.3 reports the mean and standard deviation of the main
variables by condition.
Manipulation checks. As a manipulation check, I tested whether di↵erent emotion-
regulation conditions led to di↵erent emotional and physiological consequences. The Ver-
tical Limit video clip begins with two minutes of relatively relaxing scenes and ends with
two minutes of anxiety-inducing scenes that depict the son’s moral dilemma. I asked par-
ticipants to report their subjective positive and negative emotions before they watched the
video and after they made the moral decisions. I also measured the participants’ physi-
ological responses by capturing skin-conductance levels at the baseline period and at the
post-decision period (during the moral decision making immediately after the movie). I
failed to collect skin conductance data for 18 participants due to measurement issues, and
they were thus treated as missing variables in the analysis on manipulation checks.
For subjective feelings, I conducted two mixed ANOVAs in which participants’ self-
reported positive and negative a↵ect served as dependent variables, time (baseline vs.
post-decision period) served as a within-subjects factor, and condition (emotion-regulation
strategies) as a between-subjects factor. The ANOVA using positive a↵ect as the dependent
variable revealed that positive a↵ect decreased significantly from the baseline to the post-
decision period, F(1, 107) = 91.21, p < 0.001, ⌘⇢2 = 0.46. The main e↵ect for condition
was not significant, F(2, 107) = 2.47, p = 0.09, nor was the Condition ⇥ Time interac-
tion, F(2, 107) = 1.11, p = 0.33. Mirroring these results, the ANOVA using negative
a↵ect as the dependent variable revealed that negative a↵ect increased significantly over
27
Chapter 2
Tabl
e2.
2:Ze
ro-o
rder
corr
elat
ions
amon
gut
ilita
rian
deci
sion
s,em
otio
n-re
gula
tion
cond
ition
s,se
lf-re
porte
dem
otio
ns,a
ndsk
in-c
ondu
ctan
cele
vels
,Stu
dy2b
.Va
riabl
esM
ean
(SD
)1
23
45
67
89
1.U
tilita
rian
Dec
isio
n0.
62(0
.49)
2.Su
ppre
ssio
nD
umm
y0.
34(0
.47)
0.16
ˆ
3.R
eapp
rais
alD
umm
y0.
34(0
.48)
-0.0
3-0
.51*
**
4.Po
sitiv
eA↵
ectT
13.
24(1
.93)
-0.1
4-0
.10
0.19
ˆ
5.Po
sitiv
eA↵
ectT
21.
41(0
.87)
0.09
-0.1
30.
100.
12
6.N
egat
ive
A↵
ectT
12.
02(1
.28)
-0.0
40.
030.
050.
61**
*0.
04
7.N
egat
ive
A↵
ectT
24.
61(2
.20)
-0.0
50.
080.
01-0
.05
-0.4
2***
0.20
*
8.Sk
inC
ondu
ctan
ceT1
11.1
1(1
0.82
)0.
05-0
.14
0.24
*0.
110.
040.
20*
0.08
9.Sk
inC
ondu
ctan
ceT2
12.8
1(1
2.16
)0.
09-0
.00
0.10
0.08
-0.0
20.
21ˆ
0.11
0.89
***
10.S
ex(1=
mal
e,2=
fem
ale)
1.55
(0.4
9)-0
.36*
**-0
.02
0.06
-0.1
0-0
.21*
-0.0
80.
04-0
.00
-0.0
1
Not
e.ˆp<
0.10
,*p<
0.05
,**p<
0.01
,***
p<
0.00
1
28

Chapter 2
Tabl
e2.
3:M
eans
and
stan
dard
devi
atio
nsby
cond
ition
,Stu
dy2b
.C
ondi
tions
Like
lihoo
dof
Util
itaria
nD
ecis
ion
Posi
tive
A↵
ecta
tT1
Posi
tive
A↵
ecta
tT2
Neg
ativ
eA↵
ecta
tT1
Neg
ativ
eA↵
ecta
tT2
SCL
atT1
SCL
atT2
Con
trol
0.53
(0.5
1)3.
00(0
.86)
1.44
(0.9
6)1.
88(0
.93)
4.33
(2.2
5)9.
56(5
.13)
10.9
5(4
.82)
Supp
ress
ion
0.73
(0.4
5)2.
97(0
.58)
1.25
(0.7
7)2.
07(1
.03)
4.85
(2.4
2)8.
89(8
.53)
12.7
7(1
0.32
)
Rea
ppra
isal
0.59
(0.5
0)3.
76(3
.13)
1.53
(0.8
6)2.
11(1
.74)
4.65
(1.9
4)14
.54
(15.
09)
14.4
3(1
7.14
)
Not
e.Li
kelih
ood
ofut
ilita
rian
deci
sion
was
1if
utili
taria
nop
tion
was
chos
en,0
ifno
t.
29

Chapter 2
time, F(1, 107) = 135.80, p < 0.001, ⌘⇢2 = 0.56. The main e↵ect of condition was again
not significant, F(2, 107) = 0.66, p = 0.52, nor was the Condition ⇥ Time interaction,
F(2, 107) = 0.19, p = 0.83. Together, these results indicate that the emotion-regulation
strategies that participants were asked to use while watching the video did not di↵eren-
tially influence participants’ emotional state based on participants’ self-reported emotions.
For physiological arousal, I conducted a mixed ANOVA in which participants’ physi-
ological arousal served as a dependent variable, time (baseline vs. arousal period) served
as a within-subjects factor, and condition (emotion-regulation strategies) as a between-
subjects factor. There was a significant increase in skin-conductance levels over time,
F(1, 90) = 8.95, p = 0.004, ⌘⇢2 = 0.09. There was no significant di↵erence across condi-
tions, F(2, 90) = 1.37, p = 0.26, but was there a significant interaction between the condi-
tions and change over time, F(2, 90) = 4.38, p = 0.01, ⌘⇢2 = 0.09. Increase in skin con-
ductance was more pronounced among individuals who suppressed (B = 3.88, S E = 0.98,
p < 0.001), as compared to those who reappraised (B = �0.11, S E = 0.94, p = 0.91) and
controls (B = 1.31, S D = 1.01, p = 0.20). It should be noted that the skin-conductance lev-
els were not similar across the three conditions at the baseline, F(2, 90) = 2.70, p = 0.07;
they were slightly higher for reappraisal than suppression, p = 0.11. In order to capture the
relative skin-conductance levels of the individual at di↵erent times, I thus created standard-
ized (ipsatized) scores for skin conductance for each individual and subtracted the scores
at the baseline from those at the arousal period. Replicating the same e↵ect, there was
a significant di↵erence across conditions, F(1, 91) = 6.04, p = 0.003, ⌘⇢2 = 0.12. In
the post-hoc analysis, the di↵erence score for suppression (M = 0.42, S D = 0.74) was
higher than that for reappraisal (M = �0.42, S D = 1.08), p = 0.004. However, the di↵er-
ence scores for suppression and reappraisal were not significantly di↵erent from controls
30

Chapter 2
(M = 0.30, S D = 0.98), ps > 0.18.
Emotion regulation and utilitarian decisions. Using a binary logistic regression anal-
ysis, I tested my hypothesis that regulating one’s emotions would be associated with an
increased likelihood of making a utilitarian decision as compared to the control condition,
controlling for gender. Being male was associated with the higher likelihood of making
utilitarian decision, B = 1.73, S E = 0.46, p < 0.001. The suppression dummy variable
had significant regression weights, B = 1.05, S E = 0.53, p = 0.05, whereas the reappraisal
dummy variable did not, B = 0.45, S E = 0.52, p = 0.39.
Mediation analysis. Additionally, I ran mediation analyses to test whether physiolog-
ical arousal mediates the relationship between emotion regulation and utilitarian decision
making. First, I entered the suppression indicator as an independent variable, utilitarian
decision making as a binary dependent variable, and changes in physiological arousal (dif-
ference between arousal period and baseline) as a mediating variable, while controlling for
the reappraisal indicator and gender as covariates. A bootstrap analysis confirmed that the
95% bias-corrected confidence interval for the size of the indirect e↵ect did not exclude
zero (-0.03, 0.13). Second, I repeated the same analysis but using the reappraisal indica-
tor as an independent variable, while controlling for the suppression indicator and gender.
A bootstrap analysis similarly confirmed that the confidence interval did not exclude zero
(-0.03, 0.11).
2.3.5 Discussion
Together, the results from Study 2a and Study 2b show that making an explicit e↵ort to
suppress one’s emotional expressions increases utilitarian decisions in personal, emotion-
31

Chapter 2
ally rich moral dilemmas. However, the e↵ect of reappraising emotions was not as robust
as that of suppression; reappraisal did not have the same e↵ect in Study 2a as in Study 2b,
but did have a similar e↵ect as suppression in Study 2a as in Study 2b.
Previous research (Gross 1998) found that reappraisal is e↵ective in making people feel
less negative, while suppression increases sympathetic activation. Although my findings
seem inconsistent with previous work on emotion regulation, the absence of a statistically
significant e↵ect of reappraisal on self-reported emotions might be attributed to the fact
that I asked participants to rate their emotions after they made the moral decision. It is
possible that making a di�cult decision may have led to negative emotions regardless of
the emotion-regulation strategy previously employed.
However, using di↵erent emotion-regulation strategies led to di↵erential changes in
physiological arousal over time. Consistent with what previous research has found (Gross
and Levenson 1993), suppressors experienced the most sympathetic activation over time,
while reappraisors and controls did not have similar sympathetic activation. Although
my results show that physiological arousal tracked one’s emotional state during the video
more closely than self-reported ratings of emotions, it is important to note that the skin-
conductance levels at baseline for those who reappraised were already higher than for those
who suppressed or for controls. It is possible that those who were instructed to reappraise
their emotions predict the emotion-inducing stimuli to be more di�cult to regulate, and
these expected emotions may have been su�cient to increase their skin-conductance lev-
els.
It should also be noted that sympathetic activation did not mediate the relationship
between the use of emotion-regulation strategies and utilitarian decision-making. This ex-
cludes the possibility that physiological arousal is consciously entered into the way people
32

Chapter 2
make moral decisions and increases their preference for deontological decision making.
2.4 Study 3
In Study 3 I conduct a conservative test of how regulating unrelated emotions influence
subsequent moral decision-making. This study also addresses the concern that people’s lay
belief that the utilitarian choice is less emotionally driven than the deontological choice
may play a role when they are told to regulate emotions while making a moral decision.
Using a separate-tasks paradigm (Keltner et al. 1993), I vary the emotion-regulation strat-
egy participants employ while viewing a series of aversive images as the first task, and then
present them with a decision task with moral dilemmas as the second task. Thus, partic-
ipants are not explicitly told to regulate their emotions while reading moral dilemmas. I
predict that this incidental regulation of aversive emotions will carry over to influence deci-
sions even in the unrelated moral domain. I use the same measure of sympathetic activation
as in Study 2b as a manipulation check and as a potential mediator.
2.4.1 Method
Participants and procedure
One hundred seventeen individuals (Mage = 28.36 years, S D = 8.65; 41% male) from a
city in the Northeastern United States participated in a half-hour study and received $10 for
their participation. The study instructions informed participants that they would complete
two unrelated surveys; they would first answer some questions about their emotions and
view some images, and then they would make choices in a moral decision-making task.
At the beginning of the experiment, I applied physiological sensors to participants to
33

Chapter 2
measure their physiological responses from electrodermal activities throughout the entire
study. After I applied sensors to measure skin-conductance levels, I first asked partici-
pants to indicate their current emotions. I then showed them 15 neutral images to measure
their physiological responses at baseline (T1). Next, I randomly assigned participants to
one of three conditions, in which they were asked to employ di↵erent emotion-regulation
strategies: suppression, reappraisal, or no strategy at all.
Across conditions, participants saw 12 aversive images after viewing the neutral im-
ages. Before viewing the images, they received instructions similar to those used in Study
2a and 2b. The images involved graphic scenes of burn, mutilation, and threats, and were
designed to induce negative, high-arousal emotions (T2). Both neutral and aversive images
have been used in studies of emotion regulation in the past ("picture reappraisal task"; Jack-
son et al. 2000; Ochsner et al. 2002), and were originally developed by the International
A↵ective Picture System (IAPS; Lang et al. 1999). All images appeared for 10 seconds,
followed by a three-second resting period. During the resting period, I presented a simple
prompt to remind participants to follow instructions. For all neutral images, participants
saw a cue screen "LOOK". Negative images were followed by either "REAPPRAISE," or
"SUPPRESS," or "LOOK," depending on the randomized condition in which participants
belonged. All images were presented in a fixed, randomized order.
In an ostensibly separate survey, I asked participants to read four high-conflict, per-
sonal moral dilemmas (Greene 2001; Koenigs et al. 2007). All of the dilemmas had a sim-
ilar structure, such that one person would have to personally harm another person to save
several others (see Appendix A.2 for details). I intentionally selected dilemmas that are
usually contested and for which people feel divided. In previous studies, on average, about
55% of people chose the utilitarian judgment over the non-utilitarian, emotional judgment
34

Chapter 2
(Greene et al. 2008). All scenarios were presented in the same order. I asked participants
two questions: 1) what decision they would make (utilitarian or non-utilitarian), and 2)
how they felt, in order to test whether the images influenced their self-reported negative
feelings, including fear and disgust. Then I asked a series of follow-up questions about
their emotion-regulation task, followed by demographic questions.
Measures
Autonomic responses. As in Study 2b, I collected skin-conductance levels to measure
participants’ negative arousal and anxiety induced by the images they viewed.
State emotions. I used the 20-item PANAS (Watson et al. 1988) before the participants’
viewing of the images and also after they had made the moral decision. To correctly mea-
sure how participants felt during the image-viewing task, I asked them to recall this par-
ticular task and to report their emotions. I then created four composite variables: pre-task
positive a↵ect (↵ = 0.86), pre-task negative a↵ect (↵ = 0.91), pre-task positive a↵ect
(↵ = 0.87), and post-task negative a↵ect (↵ = 0.93).
Post-task questionnaire. As a manipulation check, participants indicated the extent to
which they regulated their emotions while viewing the pictures (on a seven-point scale
anchored by 1 = not at all and 7 = very much).
2.4.2 Results
Among 117 participants, nine participants did not want to view images, so the experi-
menters allowed them to skip this portion of the experiment. Two participants did not
follow instructions. These participants were excluded from further analyses, as they did
35

Chapter 2
not receive the same stimuli as other participants. In addition, I failed to collect skin-
conductance data for nine participants due to measurement issues and treated them as miss-
ing in the analysis of the e↵ect of emotion regulation on sympathetic activation.
Table 2.4 reports the descriptive statistics of the main variables I measured and their
zero-order correlations. Table 2.5 reports the mean and standard deviation of these variables
by condition.
Manipulation checks. The extent to which participants regulated their emotions di↵ered
across emotion-regulation strategies, F(2, 103) = 3.35, p = 0.04, ⌘=0.06. A planned con-
trast revealed that participants in the control condition reported significantly less emotion
regulation (M = 4.08, S D = 1.40) than did those in the suppression condition (M = 5.06,
S D = 1.47; p = 0.04), whereas those in the reappraisal condition (M = 4.43, S D = 1.82)
did not di↵er significantly from either those in the control condition or those in the suppres-
sion condition, ps > 0.25. This suggests that suppressors, but not reappraisers, regulated
emotions to a larger extent than controls.
As an additional manipulation check, I asked participants to report their subjective feel-
ings before and after the negative stimuli being presented. I also captured the average skin-
conductance levels during the baseline period (during the viewing of 15 neutral images)
and during the arousal period (during the viewing of 12 aversive images).
First, I conducted mixed ANOVAs in which participants’ self-reported positive and neg-
ative a↵ect served as dependent variables, time (baseline vs. post-decision period) served as
a within-subjects factor, and condition (emotion-regulation strategies) served as a between-
subjects factor. Positive a↵ect significantly decreased over time, F(1, 103) = 84.08, p <
0.001, ⌘⇢2 = 0.45, but did not di↵er across conditions, F(2, 103) = 1.02, p = 0.36. I found
no significant interaction between time and condition, F(2, 103) = 2.43, p = 0.09. Neg-
36

Chapter 2
Tabl
e2.
4:Ze
ro-o
rder
corr
elat
ions
amon
gut
ilita
rian
deci
sion
s,em
otio
n-re
gula
tion
cond
ition
s,se
lf-re
porte
dem
otio
ns,a
ndsk
in-c
ondu
ctan
cele
vels
,Stu
dy3.
Varia
bles
Mea
n(S
D)
12
34
56
78
9
1.U
tilita
rian
Dec
isio
n1.
78(1
.19)
2.Su
ppre
ssio
nD
umm
y0.
32(0
.47)
0.14
3.R
eapp
rais
alD
umm
y0.
35(0
.48)
0.05
-0.5
0***
4.Po
sitiv
eA↵
ectT
14.
61(1
.08)
-0.1
9*0.
13-0
.10
5.Po
sitiv
eA↵
ectT
23.
88(1
.25)
-0.1
20.
120.
030.
75**
*
6.N
egat
ive
A↵
ectT
12.
03(1
.07)
-0.0
60.
17ˆ
-0.0
7-0
.24*
-0.0
5
7.N
egat
ive
A↵
ectT
22.
70(1
.35)
-0.1
00.
16-0
.14
0.08
-0.2
4*-0
.57*
**
8.Sk
inC
ondu
ctan
ceT1
8.31
(6.0
8)-0
.02
-0.0
50.
010.
160.
20*
-0.0
4-0
.18ˆ
9.Sk
inC
ondu
ctan
ceT2
9.19
(6.5
6)0.
01-0
.06
-0.0
10.
130.
17ˆ
-0.0
1-0
.13
0.96
***
10.S
ex(1=
mal
e,2=
fem
ale)
1.58
(0.4
9)-0
.15
00.
010.
01-0
.15
-0.1
20.
14-0
.24*
-0.2
4*
Not
e.ˆp<
0.10
,*p<
0.05
,**p<
0.01
,***
p<
0.00
1;nu
mbe
rofu
tilita
rian
choi
ces
was
betw
een
0an
d4.
37

Chapter 2
Tabl
e2.
5:M
eans
and
stan
dard
devi
atio
nsby
cond
ition
,Stu
dy3.
Con
ditio
nsFr
eque
ncy
ofU
tilita
rian
Dec
isio
n
Posi
tive
A↵
ecta
tT1
Posi
tive
A↵
ecta
tT2
Neg
ativ
eA↵
ecta
tT1
Neg
ativ
eA↵
ecta
tT2
SCL
atT1
SCL
atT2
Con
trol
1.46
(1.0
9)4.
57(1
.07)
3.61
(1.2
0)1.
89(0
.86)
2.67
(1.3
2)8.
67(5
.34)
9.79
(5.6
1)
Supp
ress
ion
2.03
(1.3
4)4.
82(1
.02)
4.10
(1.1
9)2.
29(1
.11)
3.01
(1.3
4)7.
88(6
.19)
8.66
(7.2
8)
Rea
ppra
isal
1.86
(1.0
8)4.
47(1
.15)
3.93
(1.3
4)1.
93(1
.18)
2.45
(1.3
6)8.
37(6
.82)
9.08
(6.8
9)
Not
e.N
umbe
rofu
tilita
rian
choi
ces
was
betw
een
0an
d4.
38

Chapter 2
ative a↵ect increased significantly over time, F(2, 102) = 35.69, p < 0.001, ⌘⇢2 = 0.26.
Again, the main e↵ect of condition was not significant, F(2, 102) = 1.84, p = 0.16, nor
was the condition ⇥ time interaction, F(2, 102) = 0.49, p = 0.62.
For physiological arousal, I conducted a mixed ANOVA in which participants’ physio-
logical arousal served as the dependent variable, time (baseline vs. arousal period) served as
a within-subjects factor, and condition (emotion-regulation strategies) served as a between-
subjects factor. This analysis revealed a significant increase of skin-conductance levels
over time, F(1, 95) = 23.42, p < 0.001, ⌘⇢2 = 0.20, but no significant di↵erence across
conditions, F(2, 95) = 0.19, p = 0.83, nor an interaction between time and condition,
F(2, 95) = 0.52, p = 0.60. This confirms that the aversive images successfully induced
both self-reported negative a↵ect and physiological arousal.
Emotion regulation and utilitarian decisions. I predicted that an individual’s attempt
to conceal emotional expressions carries over to unrelated moral decision-making and thus
increases the frequency of making utilitarian decisions. I used a Poisson regression to
model for count data. Incidental suppression increased the number of utilitarian choices,
B = 0.33, S E = 0.17, p = 0.04, whereas incidental reappraisal did not, B = 0.25, S E =
0.16, p = 0.11. The e↵ect of being female on the frequency of making utilitarian decisions
was negative but not statistically significant (B = �0.21, S E = 0.12, p = 0.09).2 This result
suggests that regulating emotional reactions unrelated to moral decision-making increases
the frequency with which participants make utilitarian choices.2The same analysis was repeated using the OLS regression, and the direction and significance of the
relationships did not change (B = 0.58, p = 0.04 for suppression, B = 0.42, p = 0.12 for reappraisal,B = �0.38, p = 0.09).
39
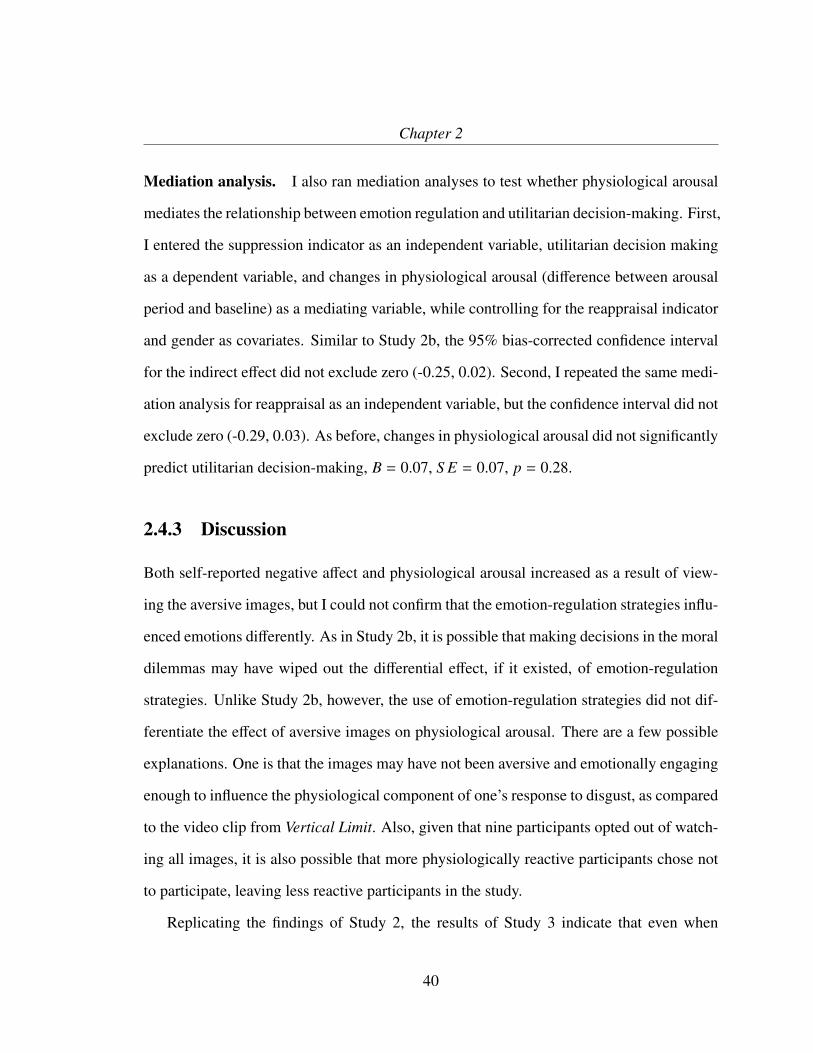
Chapter 2
Mediation analysis. I also ran mediation analyses to test whether physiological arousal
mediates the relationship between emotion regulation and utilitarian decision-making. First,
I entered the suppression indicator as an independent variable, utilitarian decision making
as a dependent variable, and changes in physiological arousal (di↵erence between arousal
period and baseline) as a mediating variable, while controlling for the reappraisal indicator
and gender as covariates. Similar to Study 2b, the 95% bias-corrected confidence interval
for the indirect e↵ect did not exclude zero (-0.25, 0.02). Second, I repeated the same medi-
ation analysis for reappraisal as an independent variable, but the confidence interval did not
exclude zero (-0.29, 0.03). As before, changes in physiological arousal did not significantly
predict utilitarian decision-making, B = 0.07, S E = 0.07, p = 0.28.
2.4.3 Discussion
Both self-reported negative a↵ect and physiological arousal increased as a result of view-
ing the aversive images, but I could not confirm that the emotion-regulation strategies influ-
enced emotions di↵erently. As in Study 2b, it is possible that making decisions in the moral
dilemmas may have wiped out the di↵erential e↵ect, if it existed, of emotion-regulation
strategies. Unlike Study 2b, however, the use of emotion-regulation strategies did not dif-
ferentiate the e↵ect of aversive images on physiological arousal. There are a few possible
explanations. One is that the images may have not been aversive and emotionally engaging
enough to influence the physiological component of one’s response to disgust, as compared
to the video clip from Vertical Limit. Also, given that nine participants opted out of watch-
ing all images, it is also possible that more physiologically reactive participants chose not
to participate, leaving less reactive participants in the study.
Replicating the findings of Study 2, the results of Study 3 indicate that even when
40

Chapter 2
the target of one’s suppression strategy consists of unrelated negative stimuli and not the
emotions that arise from the moral dilemma one is facing, the mere e↵ort to suppress emo-
tions carries over to the subsequent moral domain and increases the likelihood of utilitarian
choices. Similar to Study 2b, however, the e↵ect of reappraisal on utilitarian decision mak-
ing was not as robust as that of suppression.
2.5 Study 4
In Study 2 and 3, I found that regulation of emotional reactions in moral dilemmas leads
to more utilitarian decision-making. Because participants were asked to endorse either a
utilitarian decision or a deontological decision, their preference for the utilitarian decision
can be interpreted as either an increase in utilitarian inclinations or a decrease in deontolog-
ical inclinations. To reduce this uncertainty in interpreting the e↵ect of emotion-regulation
strategies on moral decision making, in Study 4, I used a process-dissociation approach
(Jacoby 1991) to independently quantify and delineate the contributions of utilitarian and
deontological inclinations to moral judgments (Conway and Gawronski 2013). I randomly
assigned participants to one of three conditions, in which I asked them first to employ dif-
ferent emotion-regulation strategies, similar to Studies 2 and 3 (Shiota and Levenson 2009):
suppression, reappraisal, or no strategy at all (control), and then to judge the appropriate-
ness of the utilitarian actions described in the moral dilemmas.
41

Chapter 2
2.5.1 Method
Participants and design
One hundred twenty-eight individuals recruited through Amazon Mechanical Turk (Mage =
34.18 years, S D = 11.97; 44% male) participated in an online study for $0.50. After
reading the emotion-regulation instructions, participants read six pairs of moral dilemma
scenarios that included both congruent and incongruent dilemmas (See Appendix A.4 for
all scenarios; Conway and Gawronski 2013), and judged whether the agent’s action would
be morally appropriate or not. Incongruent dilemmas pit deontological inclinations against
utilitarian inclinations; that is, benefits associated with the utilitarian action outweigh the
harms, but it violates deontological moral principles. For example, in the medical director
scenario I used in Study 1, it is acceptable to save 200 patients’ lives in the future over one
patient’s life according to the utilitarian principle, but it is not acceptable to let Ravi die
according to the deontological principle. However, pairs of congruent dilemmas describe
almost identical actions, except that the benefits from the utilitarian action do not outweigh
the harms, thus aligning utilitarian inclinations with deontological ones. For example, if
the medical director is facing a choice between spending funds to either save Ravi’s life
or to improve the hospital’s landscaping, then the decision not to save Ravi’s life violates
both deontological and utilitarian inclinations. I followed the same method (Conway and
Gawronski 2013) to calculate the process-dissociation scores (PD scores) of utilitarian and
deontological inclinations; I calculated the probability of rejecting harm in congruent and
incongruent dilemmas, and then derived the utilitarian (U) and deontological (D) parame-
ters.3
3U and D were calculated as follows.U = p(unacceptable|congruent) � p(unacceptable|incongruent)D = p(unacceptable|incongruent)/(1 � U)
42

Chapter 2
2.5.2 Results
Among incongruent dilemmas across three experimental conditions, harmful action was
judged as acceptable 66% of the time (S D = 30%). It was judged as acceptable 27% of
the time (S D = 24%) for the congruent dilemmas. Incongruent dilemmas (M = 4.41,
S D = 1.44) were deemed more acceptable than congruent dilemmas (M = 2.44, S D =
1.59), t(121) = 12.40, p < 0.001, d = 1.13, consistent with previous findings (Conway and
Gawronski 2013).
Moral decision-making analysis. I first calculated the proportion of appropriate re-
sponses on incongruent moral dilemmas. Controlling for the gender e↵ect (being female
was associated with finding the utilitarian action more inappropriate; B = 0.55, S E = 0.26,
p = 0.035), the suppression indicator predicted the greater likelihood of judging the util-
itarian action to be more acceptable as compared to the controls, B = 0.70, S E = 0.32,
p = 0.03. Similarly, the reappraisal indicator was associated with more utilitarian judg-
ment than controls, B = 0.76, S E = 0.31, p = 0.015 (See Figure 2.2).
Process-dissociation analysis. I first calculated the probability of rejecting harm in both
the congruent and incongruent dilemmas, and then calculated the process-dissociation (PD)
parameters based on the procedures in Conway and Gawronski (2013). PD utilitarianism
and deontology thus indicate the strength of inclinations for each principle within an in-
dividual, and were standardized. I ran a mixed-model ANOVA with PD parameters as
a within-subject factor and emotion-regulation strategy as a between-subjects factor (see
Figure 2.3). A marginally significant interaction between PD parameters and emotion-
Please see the technical description of this method in Conway and Gawronski (2013) for more detailedinformation.
43

Chapter 2
Figure 2.2: Results for the traditional utilitarian judgment as a function of the emotion-regulation strategies. Error bars represent standard errors (Study 4).
regulation strategy was found, F(2, 116) = 2.68, p = 0.07, ⌘⇢2 = 0.04. Post-hoc com-
parisons suggested that deontological inclinations were significantly higher in the control
condition (M = 0.45, S D = 1.08) than in the reappraisal (M = �0.13, S D = 0.96) and
suppression (M = �0.16, S D = 0.83) conditions, ps < 0.02. There was no di↵erence
between the suppression and reappraisal conditions, p = 0.99. On the other hand, utilitar-
ian inclinations did not di↵er significantly across di↵erent conditions, ps > 0.49. Lastly,
gender did not have a significant e↵ect in this model, p = 0.57.
2.5.3 Discussion
My findings suggest that both emotion-regulation strategies selectively decreased deonto-
logical inclinations while leaving utilitarian inclinations relatively una↵ected. This result is
consistent with Conway and Gawronski’s (2013) finding that increased empathy toward the
victims selectively increased deontological inclinations. While the data from Study 2b and
3 suggest that one’s emotional reactions to the moral dilemma, in terms of physiological
44

Chapter 2
Figure 2.3: Results for the process dissociation deontology and utilitarian scores as a func-tion of the emotion-regulation strategies. Error bars represent standard errors (Study 4).
arousal, did not mediate the relationship between employing emotion-regulation strategies
and utilitarian decision making, this study demonstrates that these strategies still reduce
one’s deontological inclinations related to causing harm.
2.6 General Discussion
In five studies, I examined the relationship between regulating emotions and utilitarian deci-
sions in moral dilemmas. I also investigated the psychological mechanism explaining why
the use of emotion-regulation strategies leads to greater utilitarian preferences and found
that decreased deontological inclinations explained this relationship. Across all studies,
I found support for both my hypotheses using multiple methods to manipulate emotion-
regulation strategies and test its e↵ects on moral decision making. Not only did integral
emotion regulation on emotions rooted in moral dilemmas have a carryover e↵ect on one’s
45

Chapter 2
utilitarian preference (Study 2 and Study 4), but incidental emotion regulation did as well
(Study 3). To ensure the generalizability of the findings, I used di↵erent types of moral
dilemmas in di↵erent studies. In addition to studying responses to written scenarios re-
sembling the well-known ethical dilemma known as the trolley problem, I used a video in
Study 2b that portrays a similar moral dilemma visually, a format that may have produced
stronger emotional reactions.
Thus, I argue that because emotion plays a critical role in determining whether or not
people make a moral choice, regulation of such emotion is predictive of choices when
facing moral dilemmas.
2.6.1 Theoretical Contributions
This paper contributes to the literature in several ways. First, by clearly delineating the
contributions of utilitarian versus deontological inclinations to moral decision-making, my
research provides empirical evidence that emotion-regulation strategies selectively reduce
the decision maker’s deontological inclinations, thus allowing them to choose a more util-
itarian option. This suggests that our deontological inclinations are not only rooted in our
judgments of right vs. wrong, but also are grounded in our emotional reactions related to
conducting harmful actions. The current study thus supports the previous work that has
demonstrated the role of "gut feelings" in thwarting utilitarian decisions (Greene 2001),
and shows that such aversive responses can be regulated by employing emotion-regulation
strategies.
Second, this work extends previous research (Feinberg et al. 2012; Margolis and Molin-
sky 2008; Molinsky and Margolis 2005) by focusing on moral dilemmas that have conflict-
ing moral principles. I theorized that the nature of our moral dilemmas would be more
46

Chapter 2
emotionally charged and conflicting due to the inevitability of harm, and therefore induce
more strong aversive emotional reactions than those used in the previous study (Feinberg
et al. 2012). My work is the first to empirically show how individuals make moral decisions
when facing strong aversive emotions from endorsing harmful actions; not only do individ-
uals who engage in the necessary evil of doing harm detach themselves emotionally from
the event (Molinsky and Margolis 2005; Margolis and Molinsky 2008), but those who reg-
ulate their emotions also tend to prefer harmful actions that maximizes overall well-being.
Third, while (Feinberg et al. 2012) demonstrate the relevance and e�cacy of the reap-
praisal strategy in reducing moral intuitions, this research brings back the relevance of
suppression in moral decision making. I showed in Study 1 that participants who made
the utilitarian decision predicted experiencing more negative emotions than did those who
made the deontological decision, and they also were more likely to suppress their facial ex-
pressions. Supporting the facial feedback hypothesis (Tomkins 1963), reducing emotional
expressions during the highly conflicting moral dilemma led to a preference for utilitarian
choice. This work also builds on the emotion-regulation choice literature (Sheppes et al.
2011, 2014), as Study 1 allowed the decision makers to report on their willingness to en-
gage in reappraisal and suppression strategies instead of imposing only one strategy to be
used.
2.6.2 Limitations and Venues for Future Research
I see several directions for future research that build on the limitations of the current work.
First, although the e↵ect of suppression on moral decision making was consistent across
all studies, the e↵ect of reappraisal was less evident, a result that seems inconsistent with
prior research findings (Feinberg et al. 2012). I conjecture that the lack of a statistically
47

Chapter 2
significant e↵ect of reappraisal might be explained by the intensity of emotions and the
extent to which the self is involved. Previous research suggested that high-intensity emo-
tional situations render the reappraisal strategy ine↵ective and costly (Sheppes and Meiran
2007, 2008; Sheppes et al. 2009). Our moral dilemmas involve inevitable harms, which
might have made it di�cult to reappraise the situation to feel less negative, while the idea
of suppressing such emotions might have been easier to implement. Also, reappraisal was
not as e↵ective as suppression (although the result was not statistically di↵erent) when
individuals were asked to make a hypothetical decision for themselves, as in Studies 2b
and 3, instead of judging an agent’s actions, as in Studies 2a and 4. These results provide
an alternative explanation that reappraisal is more e↵ective when one is judging another
agent’s fait accompli, but not as e↵ective when one is making a di�cult decision for one-
self. Building on previous work suggesting the dissociation between moral judgment and
choice of action (Tassy et al. 2013), future research could investigate whether individuals
choose di↵erent emotion-regulation strategies when they are told to make moral judgments
versus when they are told to make a choice of action for themselves.
Second, I examined a specific context in which the decision maker needs to closely
attend to the dilemma at hand and process aversive emotions attached to doing harm. Thus,
my theory was focused on reappraisal and suppression as key emotion-regulation strategies.
Future studies could investigate the role of di↵erent types of emotion-regulation strategies.
For example, previous research identified disengaging through distraction to be more ef-
fective than reappraisal (Sheppes et al. 2011, 2014).
Third, my findings support the view that the ways in which people make moral de-
cisions are not driven simply by one particular emotion (i.e., fear of doing harm). In the
medical director scenario I used in Study 1, for example, the utilitarian decision maker may
48

Chapter 2
experience sadness, sympathy, and compassion toward the patient who is being scarified
as a result of a utilitarian decision. Similarly, the deontological decision maker may expe-
rience the same negative feelings for the 200 patients who may be sacrificed to save one
patient, but to a lesser degree due to temporal distance. In addition, although the current
research is focused on a particular case of moral decision making that involves a conflict
between utilitarian and emotional options, both of which result in some form of losses, not
all moral decisions are made in the loss domain. That is, I have not studied di↵erent types
of moral dilemmas in which doing the right thing involves regulating positive emotions as-
sociated with rewards (e.g., engaging in unethical behavior for financial gain). Thus, future
work could identify the role of di↵erent emotions involved in a variety of moral dilemmas
(right vs. right and right vs. wrong) and examine how regulating more specific emotion has
similar consequences.
Fourth, this research found that physiological arousal did not explain the relation-
ship between emotion-regulation strategies and utilitarian decision making, although skin-
conductance levels accurately reflected the increase of aversive arousal associated with
emotional stimuli (i.e., the video depicting a moral dilemma as well as graphic images).
This suggests that the regulation of deontological inclinations associated with harmful ac-
tions may still be at the conscious level. Thus, future studies could use methods that could
capture moment-to-moment changes in emotion and emotion regulation, such as online
emotion ratings (Cameron and Payne 2011; Larsen and Fredrickson 1999).
Finally, I note that suppression is known to have negative cognitive, emotional, physi-
ological, and interpersonal consequences (Butler et al. 2003; Gross 2002; Gross and John
2003; Richards and Gross 1999; Srivastava et al. 2009). This raises the possibility that
making utilitarian choices when people suppress their emotions could be harmful to their
49
Chapter 2
psychological and physiological health in the long run. However, research has demon-
strated that when dealing with extremely adverse situations, such as conjugal bereavement,
suppressing the facial expressions of negative a↵ect (e.g., anger) has been found to be bene-
ficial for longer-term recovery of normal functioning (Bonanno and Keltner 1997). Further
research found that individuals’ ability to both enhance and suppress emotional expression
flexibly based on situational demands predicted successful long-term adaptation and adjust-
ment (e.g., less distress) in the aftermath of the September 11th terrorist attacks (Bonanno
et al. 2004). This line of research thus suggests that suppression can aid one’s coping with
aversive events in spite of its lingering emotional costs. It is not my goal to make norma-
tive judgments about whether one should always make reason-based utilitarian decisions
and avoid intuitive, emotion-based decisions in the moral domain. Rather, my results in-
dicate the plasticity of how we decide when faced with moral dilemmas, as suppression of
emotions predicted utilitarian decision-making.
2.6.3 Conclusion
Across five studies, I demonstrate that regulating emotions has moral consequences in sit-
uations in which one needs to intentionally cause harm to another person to achieve a
greater good. The moral dilemmas I employed in my studies mirror a common strug-
gle people experience in a wide range of contexts between their deliberative and intuitive
decision-making processes. This work shows that emotion regulation o↵ers some benefits
in our moral lives by helping us resolve the conflicts between our intuitive impulses and
utilitarian preferences.
50

Chapter 3
Rainmakers: Why Bad Weather Means
Good Productivity
Abstract
People believe that weather conditions influence their everyday work life, but to date, little
is known about how weather a↵ects individual productivity. Contrary to conventional wis-
dom, we predict and find that bad weather increases individual productivity and that it does
so by eliminating potential cognitive distractions resulting from good weather. When the
weather is bad, individuals appear to focus more on their work than on alternate outdoor
activities. We investigate the proposed relationship between worse weather and higher pro-
ductivity through four studies: (1) field data on employees’ productivity from a bank in
Japan; (2) two studies from an online labor market in the United States; (3) a laboratory ex-
periment. Our findings suggest that worker productivity is higher on bad rather than good
weather days and that cognitive distractions associated with good weather may explain the
relationship. We discuss the theoretical and practical implications of our research.
51

Chapter 3
3.1 Introduction
In this paper, we seek to understand the impact of weather on worker productivity. Al-
though researchers have investigated the e↵ect of weather on everyday phenomena, such
as stock market returns (Saunders 1993; Hirshleifer and Shumway 2003), tipping (Rind
1996), consumer spending (Murray et al. 2010), aggression in sports (Larrick et al. 2011),
and willingness to help (Cunningham 1979), few studies have directly investigated the
e↵ect of weather on work productivity. Moreover, to date, no studies have examined psy-
chological mechanisms through which weather a↵ects individual worker productivity, the
focus of our current investigation.
We theorize that thoughts related to salient outdoor options come to mind more easily
on good weather days than on bad weather days. Consistent with our theorizing, Simonsohn
(2010) found that cloud cover during visits to a college known for its academic rigor by
prospective students predicted whether they enrolled in the visited school. Prospective
students who visited on a cloudier day were more likely to enroll than were those who
visited on a sunnier day. Cloudy weather reduced the opportunity costs of outdoor activities
such as sports or hiking and thus increased the attractiveness of academic activities.
To gain insight into how people intuitively think about this relationship, we asked 198
adults (Mage = 38, S D = 14.19; 42% male) to predict the impact of weather on indi-
viduals’ work productivity. Among our respondents, about 82% stated that good weather
conditions would increase productivity, and about 83% responded that bad weather condi-
tions would decrease productivity. These survey results indicate that people indeed believe
that weather will impact their productivity and that bad weather conditions in particular
will be detrimental to it.
This conventional wisdom may be based on the view that bad weather induces a nega-
52

Chapter 3
tive mood and therefore impairs executive functions (Keller et al. 2005). In contrast to this
view, we propose that bad weather actually increases productivity through an alternative
psychological route. We theorize that the positive e↵ects of bad weather on worker produc-
tivity stem from the likelihood that people may be cognitively distracted by the attractive
outdoor options available to them on good weather days. Consequently, workers will be
less distracted and more focused on bad weather days, when such outdoor options do not
exist, and therefore will perform their tasks more e↵ectively.
3.1.1 Psychological Mechanisms of the "Weather E↵ect" on Produc-
tivity
When working on a given task, people generally tend to think, at least to some extent,
about personal priorities unrelated to that task (Giambra 1995; Killingsworth and Gilbert
2010). Task-unrelated thoughts are similar to other goal-related processes in that they can
be engaged in without explicit awareness, though they are not directed toward the given task
(Smallwood and Schooler 2006). Thus, when the mind wanders, attention shifts away from
the given task and may lead to failures in task performance (Robertson et al. 1997; Manly
et al. 1999). Prior work notes that general cognitive interference can have costly e↵ects
on worker productivity (for a review, see Jett and George 2003). Workers who experience
cognitive interference are distracted, showing an inability to focus on a task (Fisher 1998)
and a greater likelihood of committing errors while completing the task (Flynn et al. 1999).
Thinking about salient and attractive outdoor options is a form of task-unrelated think-
ing that serves as a cognitive distraction that shifts workers’ attention away from the task
at hand. Accordingly, we expect it will be harder for workers to maintain their task-related
thoughts on good weather days than on bad weather days. As a result, we also predict that
53

Chapter 3
workers will be less productive on good weather days than on bad weather days. More
specifically, we argue that on a bad weather day, individuals will have a higher ability to
focus on a given work task not because of the negative mood induced by the weather but be-
cause fewer distracting thoughts related to outdoor options will be readily available in their
minds. Consequently, they will be able to better concentrate on their tasks and work more
productively on bad weather days. In our research, we consider tasks where productivity
requires high levels of attention and focus, which allow workers to complete their work
faster. Thus, we expect fewer cognitive distractions to be associated with higher levels of
work productivity. Taken together, these arguments lead to the following hypotheses:
Hypothesis 1: Good weather conditions, such as lack of rain, will decrease worker produc-
tivity on tasks that require sustained attention and focus, as compared to bad weather
conditions.
Hypothesis 2: Good weather conditions will increase the salience and attractiveness of
outdoor options, as compared to bad weather conditions.
Hypothesis 3: The relationship between good weather conditions and worker productivity
will be mediated by greater cognitive distractions (i.e., salience of one’s outdoor
options).
To test our predictions, we used empirical data on worker productivity, measured by
individual performance on tasks conducted in a Japanese bank (Study 1), an online mar-
ketplace (i.e., Amazon Mechanical Turk, Studies 2 and 3), and the laboratory (Study 4).
We focused on precipitation as the key measure of bad weather given the previous finding
that precipitation is the most critical barrier to outdoor physical activities (Chen et al. 2006;
Togo et al. 2005).
54

Chapter 3
3.2 Study 1: Field Evidence from a Japanese Bank
3.2.1 Method
In Study 1, we examined the proposed link between weather conditions and productivity by
matching data on employee productivity from a mid-size bank in Japan with daily weather
data.1 In particular, we assessed worker productivity using archival data from a Japanese
bank’s home-loan mortgage-processing line. For the sake of brevity, we discuss the overall
structure of the operations here; more detailed information can be found in Staats and Gino
(2012). Our data includes information on the line from the rollout date, June 1, 2007
until December 30, 2009, a two-and-a-half year time period. We examined all transactions
completed by the permanent workforce, 111 workers who completed 598,393 transactions.
Workers at the bank conducted the 17 data-entry tasks required to move from a paper loan
application to a loan decision. The tasks included steps such as entering a customer’s
personal data (such as name, address, phone number, etc.) and entering information from
a real estate appraisal. Workers completed one task at a time (i.e., one of 17 steps for
one loan); when a task was completed, the system assigned the worker a new task. The
building in which the work took place had windows through which workers could observe
the weather. Workers were paid a flat fee for their work; there was no piece-rate incentive
to encourage faster completion of work.
In addition to the information on worker productivity, we also assembled data on weather
conditions in Tokyo, the city where the individuals worked. The National Climactic Data
Center of the U.S. Department of Commerce collects meteorological data from stations1The data reported in Study 1 have been collected as part of a larger data collection. Findings from the
data have been reported in separate manuscripts; Staats and Gino (2012), and Derler, R., Moore, C., & Staats,B. (2013). Enhancing ethical behavior through sequential task variety, Working Paper.
55

Chapter 3
around the world. Information for a location, such as Tokyo, was calculated as a daily
average and includes summaries for temperature, precipitation amount, and visibility.
Measures
Completion time. To calculate completion time, we took the natural log of the number
of minutes a worker spent to complete the task (µ = 0.39, � = 1.15). As we detail below,
we conducted our analyses using a log-linear learning curve model.
Weather conditions. Since our main variable of interest is precipitation, we included a
variable equal to the amount of precipitation each day in inches, down to the hundredth of
an inch (µ = 0.18, � = 0.53). To control for e↵ects from other weather-related factors, we
also included temperature (µ = 62.1, � = 14.6) and visibility (µ = 10.3, � = 5.1). With
respect to the former, it may be that productivity is higher with either low or high temper-
atures. Therefore, we entered both a linear and quadratic term for temperature (in degrees
Fahrenheit). Finally, because worse visibility could be related to lower productivity, we
included the average daily visibility in miles (to the tenth of a mile).
Control variables. We controlled for variables that have been shown to a↵ect worker
productivity. These included: same-day, cumulative volume (count of the prior number of
transactions handled by a worker on that day); all prior days’ cumulative volume (count of
transactions from prior days); load (percentage of individuals completing work during the
hour that the focal task occurred; see KC and Terwiesch 2009); overwork (a comparison
of current load to the average, see KC and Terwiesch 2009); defect; day-of-week, month,
year, stage (an indicator for each of the 17 di↵erent steps); and individual indicators.
56

Chapter 3
3.2.2 Results and Discussion
We used a log-linear learning curve model because individuals’ performance improves over
time with experience. Using this approach, we conducted our analyses at the transaction
level. Therefore, in our models, we controlled for the e↵ects of the worker, task, and time,
and then examined the e↵ect of weather on worker productivity. For our primary model,
we used a fixed e↵ects linear regression model with standard errors clustered by individual.
Column 1 in Table 3.1 shows our main model, which we used to test Hypothesis 1.
Examining rain, we found that the coe�cient is negative and significant (coe�cient = -
0.01363). In terms of the e↵ect size, we found that a one-inch increase in rain is related
to a 1.3% decrease in worker completion time for each transaction. Given that there are
approximately 100 workers in the operation, a 1.3% productivity loss is approximately
equivalent to losing one worker for the organization on a given day. Based on the aver-
age yearly salary of the associate-level employees at this bank and the average frequency
of precipitation, this loss could cost approximately $18,750 for this particular operation a
year. When accumulated over time for the entire bank of nearly 5,000 employees, a 1.3%
productivity loss could be interpreted as a significant loss in revenue for the bank: at least
$937,500 a year. Further, in a city the size of Tokyo (approximately 9 million people) our
identified e↵ect could translate into hundreds of millions of dollars in annual lost produc-
tivity.
Next, it is important to properly account for the standard errors in our model as we
have many observations nested within a small number of individual workers. Therefore, in
Column 2, we clustered the standard errors by day, not by worker. In Column 3, we used
Prais-Winsten regression with panel-corrected standard errors adjusted for heteroskedas-
ticity and panel-wide, first-order autocorrelation. Then, in Column 4, we used the fixed
57

Chapter 3Ta
ble
3.1:
Sum
mar
yre
gres
sion
resu
ltson
com
plet
ion
time
(n=
598,
393)
forS
tudy
1.(1
)(2
)(3
)(4
)(5
)(6
)M
odel
:M
ain
Mod
elC
lust
erby
Day
Prai
s-W
inst
enB
lock
Boo
tstra
pIn
dvl⇥
Mon
thFi
xed
E↵ec
tsIn
dvl⇥
Stag
eFi
xed
E↵ec
tsR
ain
(inch
es)
-0.0
1363
*-0
.013
63*
-0.0
1284
***
-0.0
1363
*-0
.011
67*
-0.0
1336
*(0
.006
068)
(0.0
0686
9)(0
.002
788)
(0.0
0568
6)(0
.004
827)
(0.0
0605
5)Te
mpe
ratu
re(d
egre
es)
0.00
6964
0.00
6964
*0.
0067
89**
*0.
0069
640.
0045
190.
0068
63
(0.0
0434
0)(0
.003
341)
(0.0
0177
3)(0
.004
364)
(0.0
0347
3)(0
.004
438)
Tem
pera
ture
-6.4
25e-
05-6
.425
e-05
*-6
.323
e-05
***
-6.4
25e-
05-4
.588
e-05
-6.4
49e-
05(3
.710
e-05
)(2
.680
e-05
)(1
.382
e-05
)(3
.819
e-05
)(2
.946
e-05
)(3
.756
e-05
)V
isib
ility
(mile
s)9.
799e
-04
9.79
9e-0
48.
483e
-04*
9.79
9e-0
48.
176e
-04
7.80
8e-0
4(7
.311
e-04
)(6
.991
e-04
)(3
.443
e-04
)(7
.040
e-04
)(5
.755
e-04
)(7
.102
e-04
)Sa
me-
day,
cum
ulat
ive
volu
me
-1.6
96e-
04*
-1.6
96e-
04**
*-1
.040
e-04
***
-1.6
96e-
04**
-1.2
74e-
04**
*-1
.661
e-04
**
(6.5
11e-
05)
(2.2
59e-
05)
(9.3
73e-
06)
(6.0
31e-
05)
(2.9
09e-
05)
(5.8
30e-
05)
All
prio
rday
s’cu
mul
ativ
evo
lum
e-4
.507
e-05
*-4
.507
e-05
***
-4.5
81e-
05**
*-4
.507
e-05
*-1
.809
e-05
-3.4
77e-
05*
(1.8
01e-
05)
(3.6
74e-
06)
(1.6
72e-
06)
(1.8
23e-
05)
(2.3
80e-
05)
(1.6
61e-
05)
All
prio
rday
s’cu
mul
ativ
evo
lum
e1.
524e
-09*
1.52
4e-0
9***
1.50
8e-0
9***
1.52
4e-0
9*1.
380e
-09
1.32
3e-0
9*
(6.1
32e-
10)
(1.4
61e-
10)
(6.1
98e-
11)
(7.3
60e-
10)
(1.2
05e-
09)
(5.9
05e-
10)
Load
-0.4
181*
**-0
.418
1***
-0.4
014*
**-0
.418
1***
-0.3
283*
**-0
.365
1***
(0.0
5738
)(0
.021
95)
(0.0
1030
)(0
.059
65)
(0.0
5141
)(0
.047
88)
Ove
rwor
k0.
2603
***
0.26
03**
*0.
2468
***
0.26
03**
*0.
1898
***
0.21
66**
*(0
.049
25)
(0.0
2583
)(0
.009
857)
(0.0
5339
)(0
.046
01)
(0.0
4108
)D
efec
t0.
2206
***
0.22
06**
*0.
3108
***
0.22
06**
*0.
2398
***
0.24
87**
*(0
.035
07)
(0.0
1661
)(0
.006
690)
(0.0
3900
)(0
.036
09)
(0.0
3500
)C
onst
ant
-0.3
350
-2.1
010*
**-2
.421
2***
-0.3
350
0.17
331.
0083
***
(0.2
192)
(0.1
693)
(0.0
8566
)(0
.239
4)(0
.216
0)(0
.215
4)In
divi
dual
xm
onth
fixed
e↵ec
t-
--
-Ye
s-
Indi
vidu
alx
stag
efix
ede↵
ect
--
--
-Ye
s
Obs
erva
tions
598,
393
598,
393
598,
393
598,
393
598,
393
598,
393
R-S
quar
ed0.
3563
0.45
910.
3374
0.35
630.
0880
60.
0490
8
Not
e.A
llm
odel
sin
clud
ein
dica
tors
fort
hein
divi
dual
,sta
ge,m
onth
,yea
r,an
dda
yof
wee
k.**
*p<
0.00
1,**
p<
0.01
,*p<
0.05
58

Chapter 3
e↵ects regression model from Columns 1-3, but used block-bootstrapped standard errors.
In each model, the coe�cient on rain is negative and statistically significant. Finally, in
Columns 5 and 6 we added additional controls with first individual fixed e↵ects interacted
with monthly fixed e↵ects and then individual fixed e↵ects interacted with stage fixed ef-
fects. In conclusion, using a within-subject design, this study showed that greater rain is
related to better worker productivity.
3.3 Study 2: Online Study of Weather and Productivity
Although Study 1 o↵ers valuable information on employees’ actual work productivity, only
the time taken to complete a task was used as an outcome variable, as error rates were low
(less than 3%) and showed little variation across employees. In Study 2, we sought a
conceptual replication of the e↵ect of weather on completion time while also using a task
that would permit us to measure error rates. We could thus investigate productivity not only
in terms of quantity (speed at which workers completed their given task) but also in terms
of quality (accuracy of detecting errors and correcting them). To account for the potential
influence of weather-driven moods, in addition to new productivity measures, we collected
data on whether workers felt positive or negative a↵ect while completing the task.
3.3.1 Method
Participants and Procedure
We recruited U.S. residents to participate in an online survey in early March, when weather
conditions vary significantly depending on where workers are located. Three hundred and
twenty-nine online workers (Mage = 36.52, S D = 12.79; 48% male) participated in a 30-
59

Chapter 3
minute study and received a flat fee of $1. We first gave all workers a three-paragraph essay
that included 26 spelling errors; we asked them to find as many errors as they could and
correct the errors they found.2
Once all the workers had completed the task, they completed a questionnaire that in-
cluded measures of state emotions to control for potential e↵ects of a↵ect. Finally, we asked
workers to complete a demographics questionnaire that also included questions about the
day’s weather and their zip code.
Measures
Productivity. We computed the time (in seconds) workers spent on the task of correcting
spelling errors (i.e., speed). Given that each worker spent a di↵erent amount of time on
the task, we calculated speed by dividing the number of typos detected by the total time
taken in seconds. We then log-transformed the variable to reduce skewness. In addition,
we computed how many spelling errors were correctly identified and fixed as a measure of
accuracy.
State emotions. We used the 20-item form of the Positive and Negative A↵ect Scale
(PANAS; Watson et al. 1988). Participants indicated how much they felt each emotion
"right now" using a seven-point scale. We calculated two summary variables for each
participant: positive (↵ = 0.90) and negative a↵ect (↵ = 0.91).
Weather questionnaire. Workers were asked to report their zip code, which enabled us
to find the daily weather data of the specific area on a specific day (www.wunderground.
com). To ensure that workers’ perceived weather matched actual weather conditions, we2More detailed instructions and materials are available online as supplemental materials (Appendix B.1).
60
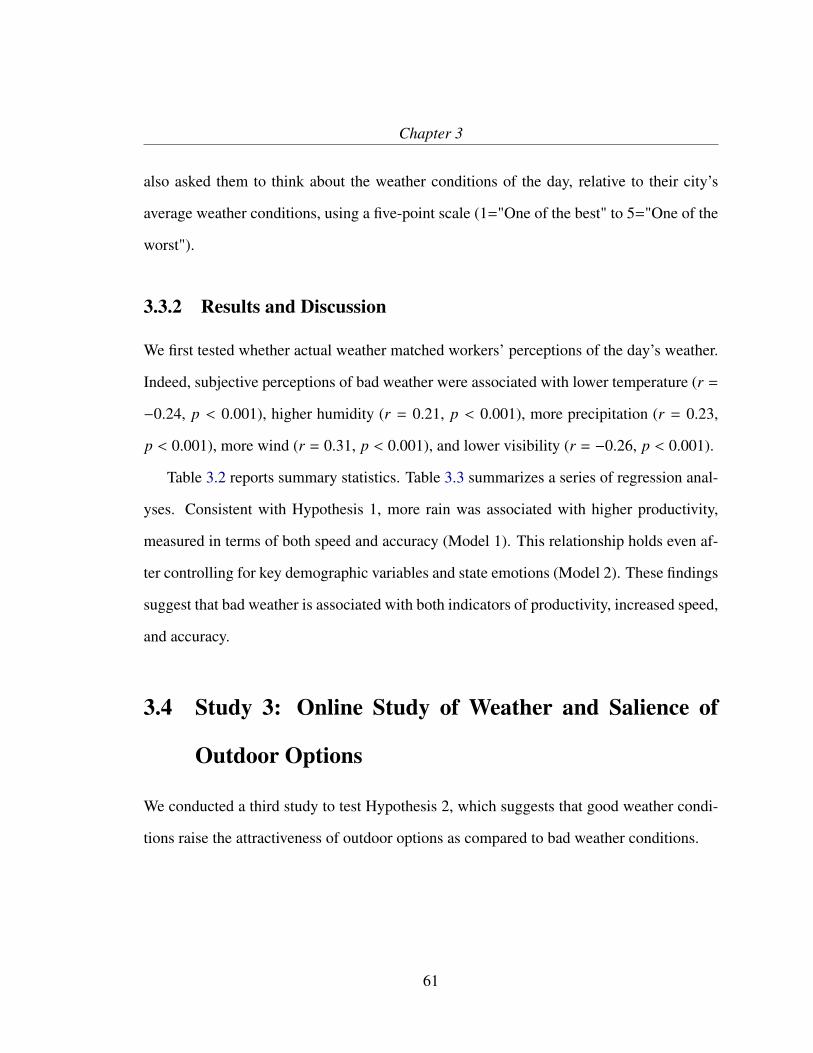
Chapter 3
also asked them to think about the weather conditions of the day, relative to their city’s
average weather conditions, using a five-point scale (1="One of the best" to 5="One of the
worst").
3.3.2 Results and Discussion
We first tested whether actual weather matched workers’ perceptions of the day’s weather.
Indeed, subjective perceptions of bad weather were associated with lower temperature (r =
�0.24, p < 0.001), higher humidity (r = 0.21, p < 0.001), more precipitation (r = 0.23,
p < 0.001), more wind (r = 0.31, p < 0.001), and lower visibility (r = �0.26, p < 0.001).
Table 3.2 reports summary statistics. Table 3.3 summarizes a series of regression anal-
yses. Consistent with Hypothesis 1, more rain was associated with higher productivity,
measured in terms of both speed and accuracy (Model 1). This relationship holds even af-
ter controlling for key demographic variables and state emotions (Model 2). These findings
suggest that bad weather is associated with both indicators of productivity, increased speed,
and accuracy.
3.4 Study 3: Online Study of Weather and Salience of
Outdoor Options
We conducted a third study to test Hypothesis 2, which suggests that good weather condi-
tions raise the attractiveness of outdoor options as compared to bad weather conditions.
61

Chapter 3
Tabl
e3.
2:Su
mm
ary
stat
istic
sfo
rStu
dy2.
Varia
ble
Mea
n�
12
34
56
78
9
1.Sp
eed
2.84
0.64
2.A
ccur
acy
17.8
74.
820.
823.
Prec
ipita
tion
0.28
0.93
0.12
0.11
4.Pe
rcei
ved
Bad
Wea
ther
3.01
0.82
0.01
0.01
0.24
5.Po
sitiv
eA↵
ect
4.00
1.14
-0.0
4-0
.04
0.02
-0.0
9
6.N
egat
ive
A↵
ect
1.53
0.83
-0.0
3-0
.05
-0.0
20.
01-0
.06
7.Fe
mal
e1.
520.
500.
020.
05-0
.10
0.06
0.08
-0.0
9
8.A
ge37
.23
12.8
8-0
.08
0.05
0.00
0.06
0.10
-0.1
50.
139.
Educ
atio
n4.
191.
490.
130.
180.
050.
020.
06-0
.05
0.05
0.11
10.I
ncom
e3.
842.
680.
130.
13-0
.01
-0.0
60.
010.
030.
04-0
.02
0.25
Not
e.B
old
deno
tes
sign
ifica
nce
ofle
ssth
an5%
.
62

Chapter 3
Table 3.3: Summary regression results in Study 2.
A. Speed
Model 1 Model 2
Precipitation 0.07** 0.07**
(0.02) (0.02)
Female 0.04
(0.07)
Age -0.00
(0.00)
Education 0.05*
(0.02)
Income 0.02
(0.01)
Positive A↵ect -0.02
(0.04)
Negative A↵ect -0.03
(0.04)
Constant 2.81*** 2.72***
(0.04) (0.24)
Observations 321 321
R-squared 0.01 0.05
Root MSE 0.62 0.62
B. Accuracy
Model 1 Model 2
Precipitation 0.54** 0.52**
(0.15) (0.15)
Female 0.30
(0.54)
Age 0.01
(0.02)
Education 0.47*
(0.01)
Income 0.18
(0.09)
Positive A↵ect -0.23
(0.28)
Negative A↵ect -0.39
(0.36)
Constant 17.62*** 15.45***
(0.28) (1.72)
Observations 321 321
R-squared 0.01 0.06
Root MSE 4.79 4.71***p < 0.001, **p < 0.01, *p < 0.05
63
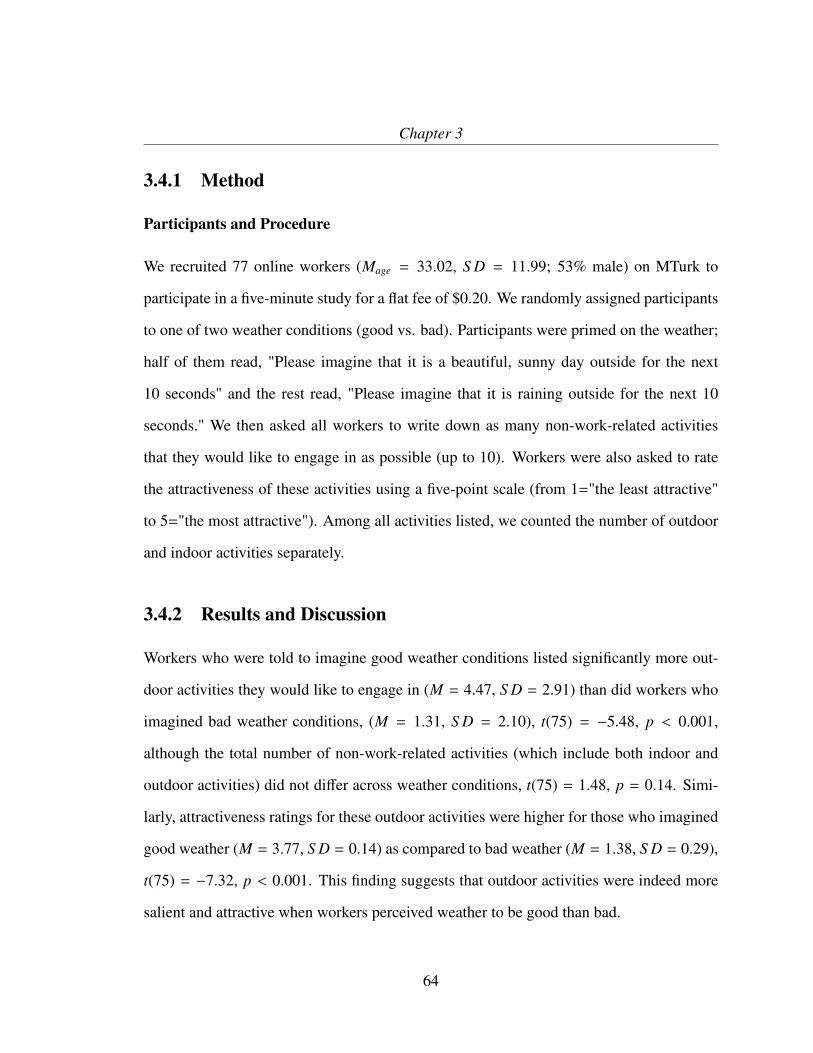
Chapter 3
3.4.1 Method
Participants and Procedure
We recruited 77 online workers (Mage = 33.02, S D = 11.99; 53% male) on MTurk to
participate in a five-minute study for a flat fee of $0.20. We randomly assigned participants
to one of two weather conditions (good vs. bad). Participants were primed on the weather;
half of them read, "Please imagine that it is a beautiful, sunny day outside for the next
10 seconds" and the rest read, "Please imagine that it is raining outside for the next 10
seconds." We then asked all workers to write down as many non-work-related activities
that they would like to engage in as possible (up to 10). Workers were also asked to rate
the attractiveness of these activities using a five-point scale (from 1="the least attractive"
to 5="the most attractive"). Among all activities listed, we counted the number of outdoor
and indoor activities separately.
3.4.2 Results and Discussion
Workers who were told to imagine good weather conditions listed significantly more out-
door activities they would like to engage in (M = 4.47, S D = 2.91) than did workers who
imagined bad weather conditions, (M = 1.31, S D = 2.10), t(75) = �5.48, p < 0.001,
although the total number of non-work-related activities (which include both indoor and
outdoor activities) did not di↵er across weather conditions, t(75) = 1.48, p = 0.14. Simi-
larly, attractiveness ratings for these outdoor activities were higher for those who imagined
good weather (M = 3.77, S D = 0.14) as compared to bad weather (M = 1.38, S D = 0.29),
t(75) = �7.32, p < 0.001. This finding suggests that outdoor activities were indeed more
salient and attractive when workers perceived weather to be good than bad.
64

Chapter 3
3.5 Study 4: Laboratory Study of Outdoor Options and
Productivity
In Study 4, we carefully chose the days on which we conducted our study sessions to
take advantage of natural variation, then we experimentally manipulated subjects’ expo-
sure to outdoor options. Through moderation, we seek to provide evidence in support of
our mediation hypothesis that the salience of attractive outdoor options is directly linked
to cognitive distractions. To test for the mediating role of outdoor options and cognitive
distractions through a moderation approach (Spencer et al. 2005), we chose weather con-
ditions and manipulated the mediating factor (in our case, exposure to outdoor options).3
Using a 2⇥2 design, we expect to find an interaction between weather conditions and ex-
posure to outdoor options in predicting work productivity (consistent with Hypothesis 3).
Further, we predict that productivity will be lower on good weather days as compared to
bad weather days, regardless of the outdoor-options manipulation, as these options are al-
ready salient and attractive without our prompt. Thus, we expect to see our predicted e↵ect
(better performance on bad weather days) in the condition in which we do not introduce
outdoor options as distractions.
3.5.1 Method
For our first manipulation, we varied whether the task was undertaken on days with poor
weather (rainy) or good weather (sunny). For our second manipulation, the participants3We selected this method of manipulating the availability of outdoor options instead of relying on self-
reports, which are less reliable and more likely to be biased (i.e., asking participants how distracted they feltor how frequently they thought about outdoor options). This approach is considered a stronger test of themediation hypothesis than measuring the mediating factor through the use of self-reported measures (Ruckeret al. 2011; Spencer et al. 2005).
65

Chapter 3
either were primed by exposure to a variety of outdoor options prior to the task or were
not primed by exposure to outdoor options. We used this second manipulation to vary the
level of cognitive distraction created by thinking about outdoor activities one may engage
in, a manipulation based on prior research (e.g., Simonsohn 2010). During the entire ex-
periment, the laboratory’s lighting and temperature levels were fixed at the same level, and
participants were able to see the outside weather through the lab’s window. There was no
significant di↵erence in show-up rates between bad versus good weather days.
Participants and Procedure
We recruited 136 students (Mage = 21.82, S D = 3.51; 48.89% male) through the study
pool at the Harvard Decision Science Laboratory. Students signed up online in advance to
participate in an hour-long study and were paid a $10 participation fee. They were also told
that, depending on the completion time of their data entry, they could receive an additional
$10 bonus.
Participants in the exposure-to-outdoor-options condition viewed photos of outdoor ac-
tivities taking place in good weather conditions and were asked to evaluate the attractive-
ness of each activity. Participants were then asked to pick their favorite depicted activity
or the activity in which they engaged most frequently and to discuss as vividly as possible
what they would do in the depicted scene. By contrast, participants in the control group
were asked to describe their typical daily routine.
Next, all participants completed the data-entry task, which involved entering five sets
of questionnaire responses written in Italian from printed copies into a spreadsheet.4 All
participants finished entering five surveys and received additional $10. After all participants4Further details of the instructions and materials used in this study are available online as supplemental
materials (Appendix B.2).
66

Chapter 3
completed their data-entry task, they answered a questionnaire that included state emotions,
subjective weather perceptions, and demographic questions.
Measures
Productivity. We assessed speed and accuracy as measures of productivity. For speed,
we first calculated the number of words entered, then divided this number by the amount of
time spent completing the task, given that each survey data consisted of a di↵erent number
of words. We assessed accuracy by counting the number of correct words entered for each
person.
State emotions. Similar to Study 2, we controlled for the potential influence of a↵ect by
measuring both positive (↵ = 0.93) and negative a↵ect (↵ = 0.89) using PANAS.
Subjective weather perceptions. As a manipulation check for our weather manipulation,
we asked participants whether they thought the weather on the day of their participation was
"good" or "bad."
3.5.2 Results and Discussion
We excluded 10 participants who failed to follow our instructions, as their completion time
was not recorded correctly. Table 3.4 reports the descriptive statistics and correlations
among the key variables used in our analyses.
Manipulation check. Almost 90% of the participants who participated on a good weather
day (60 out of 67) felt that the weather was good; almost 93% of participants who partici-
pated on a rainy day (64 out of 69) felt that the weather was bad, �2(1,N = 136) = 92.29,
67

Chapter 3
Tabl
e3.
4:Su
mm
ary
stat
istic
sfo
rStu
dy4.
Varia
ble
Mea
n�
12
34
56
78
9
Varia
ble
Mea
n�
12
34
56
78
9
1.Sp
eed
30.0
33.
55
2.A
ccur
acy
190.
4931
.81
0.90
3.G
ood
Wea
ther
Indi
cato
r0.
480.
50-0
.02
-0.0
1
4.O
utsi
deO
ptio
nIn
dica
tor
0.52
0.50
-0.1
4-0
.20
-0.0
4
5.A
ge21
.94
3.57
-0.2
0-0
.16
0.05
-0.0
6
6.Fe
mal
e1.
520.
500.
180.
100.
01-0
.07
-0.0
7
7.In
com
e4.
903.
400.
130.
090.
000.
06-0
.19
0.06
8.Ed
ucat
ion
3.42
1.03
-0.1
1-0
.04
0.09
0.00
0.71
-0.0
7-0
.26
9.Po
sitiv
eA↵
ect
35.9
312
.16
0.03
0.07
0.09
-0.0
70.
11-0
.09
0.06
-0.0
0
10.N
egat
ive
A↵
ect
19.5
99.
670.
00-0
.01
0.04
0.13
-0.1
50.
10-0
.05
0.01
-0.1
3N
ote.
Bol
dde
note
ssi
gnifi
canc
eof
less
than
5%.
68
Chapter 3
p < 0.001. These weather variables were not significantly correlated with our manipulation
of exposure to outdoor options, which we randomized.
Main analyses. Hypothesis 3 predicted that bad weather conditions increase productivity
by decreasing thoughts about outdoor options, which should reduce cognitive distractions.
Given the design of Study 4, this hypothesis would be supported by a significant interaction
between weather conditions and exposure to outdoor options in predicting productivity. To
test this hypothesis, we conducted a series of regression analyses (Table 5). As shown in
Model 1, exposure to outdoor options decreased data-entry speed and accuracy. We did not
find a statistically significant e↵ect of bad weather on productivity (for speed, � = 1.60,
p = 0.10; for accuracy, � = 13.33, p = 0.10). As predicted, the e↵ect of weather on speed
was qualified by a significant interaction between exposure to outdoor options and weather
conditions, while the interaction e↵ect on accuracy did not reach significance criteria. We
conducted similar analyses while controlling for demographics and state emotions (Model
2). After holding these variables constant, the interaction e↵ect on speed remained robust,
and the interaction e↵ect on accuracy became statistically significant.
A simple slope analysis supports Hypothesis 3 (see Figure 3.1). When no outdoor
options were made salient to participants, bad weather significantly increased data-entry
speed, � = 3.04, p = 0.04. When participants were exposed to outdoor options, however,
weather conditions no longer predicted speed significantly, � = 0.19, p = 0.76. Similarly,
when there were no outdoor options, bad weather significantly increased data-entry accu-
racy, � = 24.90, p = 0.05, a relationship that no longer held for those distracted by outdoor
options, � = 1.87, p = 0.74.
To summarize, we found that having attractive outdoor options decreased productivity
through increased cognitive distractions. In line with previous work (Bailey and Konstan
69

Chapter 3
Figure 3.1: Exposure to outdoor options moderates the relationship between weather con-ditions and productivity.
2006; Speier et al. 1999), we demonstrate that making outdoor options salient in people’s
minds alone could impair their ability to concentrate. Good weather conditions were harm-
ful for productivity, an e↵ect that seemed to disappear when outdoor options were made
salient. This interaction e↵ect between weather conditions and exposure to outdoor options
suggests that people can be relatively more productive at work on rainy days, unless they
are actively distracted. On sunny days, participants were likely to already be distracted, as
outdoor options were salient in their minds. Together, consistent with Hypothesis 3, these
findings show that cognitive distractions created by the salience of outdoor options may
serve as a mechanism through which bad weather conditions increase productivity.
3.6 General Discussion and Conclusion
Our main goal in this paper was to provide an alternative psychological route of limited
attention through which bad weather conditions influence productivity, even when we hold
a↵ective influences constant. Our evidence from both the field and the lab was consistent
70

Chapter 3
Table 3.5: Summary regression results in Study 4 (Speed as a dependent variable).
Model 1 Model 2
Exposure to Outdoor Options -2.20* -2.26*
(0.87) (0.87)
Good Weather Indicator -1.49 -1.58
(0.91) (0.92)
Interaction (Outdoor Options x Weather) 2.51* 2.60*
(1.27) (1.27)
Age -0.27
(0.13)
Female 1.14
(0.63)
Income 0.14
(0.63)
Education 0.46
(0.44)
Positive A↵ect 0.02
(0.03)
Negative A↵ect -0.01
(0.03)
Constant 31.28*** 32.70***
(0.64) (2.69)
Observations 123 122
R-squared 0.05 0.14
Adjusted R-squared 0.03 0.07
Root MSE 3.50 3.43***p < 0.001, **p < 0.01, *p < 0.05
71

Chapter 3
Table 3.6: Summary regression results in Study 4 (Accuracy as a dependent variable).Model 1 Model 2
Exposure to Outdoor Options -22.82** -23.90**
(7.68) (7.75)
Good Weather Indicator -12.02 -13.61
(8.09) (8.26)
Interaction (Outdoor Options x Weather) 20.61 21.88*
(11.16) (11.34)
Age -2.62*
(1.14)
Female 5.42
(5.65)
Income 1.10
(0.87)
Education 6.50
(3.97)
Positive A↵ect 0.26
(0.24)
Negative A↵ect -0.14
(0.03)
Constant 203.27*** 219.07
(5.67) (24.22)
Observations 125 124
R-squared 0.07 0.13
Adjusted R-squared 0.04 0.07
Root MSE 31.08 30.82***p < 0.001, **p < 0.01, *p < 0.05
72

Chapter 3
with the predictions of our theoretical model.
Although numerous previous studies used weather to induce either positive or nega-
tive moods (Cunningham 1979; Parrott and Sabini 1990; Schwarz and Clore 1983; Gold-
stein 1972; Keller et al. 2005) to study the e↵ect of moods, our result does not support
this weather-mood hypothesis. Using a meta-analysis, Shockley et al. (2012) found that
positive a↵ect is associated with enhanced overall job performance. In Studies 2 and 4,
however, weather conditions did not induce positive nor negative a↵ect, and a↵ect did not
predict productivity. Yet it is not our goal to suggest that the weather-mood hypothesis is
unwarranted or that a↵ect plays no role in cognition. Although these influences were not
realized in our study, they may still be in place, even if to a lesser extent than previous
research posited.
One potential moderator that could address these seemingly contradictory results is
workers’ exposure to outside weather, either by spending time and working outside or by
looking outside through windows. In fact, Keller et al. (2005) found that the amount of
time spent outdoors moderated the e↵ects of weather on mood and cognition. Both of our
studies were conducted in a climate-controlled environment where individuals were asked
to complete a series of tasks requiring attention and focus, such as a workplace (Study 1),
an online labor market (Study 2-3), and the laboratory (Study 4). Thus, this may explain
why outside weather conditions played a lesser role in influencing workers’ a↵ective state
but created a more significant variation in the level of cognitive distraction. In such con-
texts, weather may primarily act on people’s cognition rather than on their a↵ective states,
as weather influences their level of distraction when they think about attractive outdoor
options, as we have shown. Future research examining the role of weather across these dif-
ferent contexts (i.e., workers who typically work outside the o�ce, or workers who work
73

Chapter 3
in an o�ce without windows) would further our understanding of the relationship between
weather, a↵ect, and cognition.
It should also be noted that our measure of job performance was limited to the data entry
task, which requires attention, and thus more likely to be a↵ected by cognitive distractions,
rather than a↵ective influences. Positive a↵ect tends to encourage less constrained, less
e↵ortful, and more creative problem solving (Schwarz and Clore 1983). In fact, positive
moods induced by good weather conditions may broaden workers’ cognition, thus increas-
ing the flexibility of their thoughts (Keller et al. 2005). Consequently, future research
should include di↵erent types of tasks that could measure other aspects of job performance.
For example, weather-induced positive moods may improve workers’ productivity on tasks
that require creativity, as well as a↵ective interpersonal skills such as empathy and emo-
tional intelligence.
Research also shows that bad weather conditions may lead people to prefer spending
time at work because attractive outdoor options are not available to them (e.g., Connolly
2008; Zivin and Neidell 2010). Although our studies did not allow for testing this possi-
bility, future studies should investigate the potential role of di↵ering incentives. If workers
have incentives to finish their work early on sunny days, rather than having fixed work
hours per day, their motivation to leave early might o↵set productivity loss due to cognitive
distractions.
In addition, there might be individual di↵erences in people’s responses to weather con-
ditions (See Klimstra et al. 2011 for "weather reactivity") and their preference for outdoor
activities. Such dispositions may contribute to the variance in how outside weather con-
ditions are perceived and may also explain the lack of significant correlations between
weather and moods. Future studies should further examine the role of such individual
74

Chapter 3
di↵erences in modulating the role of outside weather in influencing worker productivity.
3.6.1 Theoretical and Practical Implications
Our research extends previous work on the influence of weather conditions on behavior.
Prior work has focused on the e↵ects of weather on behavior through people’s a↵ective
reactions to weather conditions (e.g., Larrick et al. 2011). Our work demonstrates that
weather conditions also influence individuals’ cognition. By reducing the potential for
cognitive distractions, bad weather was actually better than good weather at sustaining
individuals’ attention and focus, and, as a result, increasing their productivity.
Our results also deepen understanding of the factors that contribute to work productiv-
ity. Prior research has focused primarily on factors that are directly under one’s control or
the control of the organization (e.g., Staats and Gino 2012). We document the influence of
weather conditions, incidental factors that a↵ect work productivity. Distractions that arise
at work have been studied under the assumption that they can be avoided. In fact, engaging
in distractions, such as Internet surfing, may have positive e↵ects on productivity (due to
increased stimulation, Jett and George 2003). Similarly, perceived autonomy over lunch
breaks reduced fatigue at the end of the day (Trougakos et al. 2014). Thus, a concerted
e↵ort to take advantage of good weather for break purposes could o↵set potential negative
e↵ects on productivity. Future studies may explore the consequences of di↵erent types
of distractions at work, including how to structure break programs to restore the workers’
cognitive resources.
Weather is one of the many factors that may lead workers to engage in non-work-related
thoughts. Bad weather eliminates only one type of distracting thoughts; other factors may
influence worker productivity to a larger degree (i.e., explicit incentives and implicit goal-
75

Chapter 3
oriented motives). Despite our small e↵ect size in Study 1, our findings shed light on
how seemingly irrelevant, uncontrollable factors may influence workers’ productivity and
also learning over time. In fact, operational improvement e↵orts often focus on issues that
have e↵ect sizes less than 1%. Companies realize that even small e�ciency improvements
can translate to cost advantages. This finding calls for further investigation of the factors
that can increase task-unrelated thoughts that may adversely a↵ect productivity. Research
could also examine how expectations of certain conditions (e.g., rain when sunshine was
expected) might moderate the e↵ect of task-unrelated thoughts.
Our research also has practical implications. Although weather conditions are exoge-
nous and uncontrollable, to tap into the e↵ects of bad weather on productivity, organizations
could assign more clerical work of the type that requires sustained attention on rainy days
than sunny days. Since we found that cognitive distractions led to higher error rates, indi-
viduals may wish to avoid working on a task in which errors would be costly when they
have task-unrelated priorities. In addition, organizations may give productivity feedback to
each employee and allow flexible working hours that could maximize productivity. We also
note that if an organization wishes to maintain a consistent work output, then the weather
forecast might be a valuable input to a sta�ng model. Finally, as Cachon et al. (2011) note,
weather is an important variable for facility location. Our results suggest that, holding all
other factors constant, locating operations in places with worse weather may be preferable.
76
Chapter 4
The Power of Social A�rmation: E↵ects
of Positive Interpersonal Jolts on Health
and Performance
Abstract
In this paper I argue that the reflective process of positive reinforcement and redefinition of
one’s self-concept–what I term positive interpersonal jolts–can have a lasting influence on
performance and health. I draw on past research in narrative psychology and positive psy-
chology to test empirically how a positive interpersonal jolt intervention influences health
and performance at both the individual and group levels. First, experiencing jolts in the lab-
oratory setting increased positive a↵ect and vagal tone–a physiological marker for positive
emotions and social engagement. Second, beyond the immediate a↵ective and physio-
logical responses, it also strengthened one’s immune system (measured by an increase of
77

Chapter 4
secretory immunoglobulin A) and reduced aversive physiological arousal associated with
stress. Third, individuals who experienced jolts outperformed controls in creative problem-
solving tasks. The first study provides empirical evidence for the role of social a�rmation
in promoting resilience, physiological function, and productivity. Building on this research,
the second study was conducted with the Senior Executive Fellows program at the Harvard
Kennedy School as an in-class experiment. Using this unique opportunity to work with
real-world leaders, I show that the same intervention can enhance team functioning (team
satisfaction, learning, voice behavior, and perspective-taking) and team performance even
though these measures were taken 10 days after the initial intervention. My research sug-
gests that this intervention may lead to an upward spiral, in which the jolt increases teams’
relational coordination and performance. This low-cost intervention enables organizations
to institute high-impact changes that improve employees’ psychological resilience, physi-
cal health, productivity, and organizational performance.
4.1 Introduction
Can introducing positive psychology into organizational life deliver positive outcomes for
organizations and their employees, or does it simply engender complacency? Moreover,
if positive feedback may be less e↵ective than negative feedback at altering behavior, why
engage in it at all, given the potential downsides? Despite our limited understanding of
answers to these questions, a wave of positive psychology interventions has entered man-
agement practices in recent years. The clearest example of such change is the emergence
of the Chief Happiness O�cer–a new executive position first championed by Google’s
Chade-Meng Tan and Zappos’s Jenn Lim. One of the more prevalent management prac-
tices that has leveraged past work on positive psychology is the "strength-based" employee
78

Chapter 4
development program. In 2000, Standard Chartered Bank asked employees to identify
their core strengths and develop action plans to improve their e↵ectiveness (Dempsey,
2007). Similarly, Southwest Air and Zappos.com hire new employees based on their unique
strengths (Freiberg and Freiberg 1998; Hsieh 2010). By moving away from a traditional
competency-based model to a strengths-based model in developing employees, these pro-
grams improved employee engagement and organizational outcomes. The trend of adopting
positive psychology in management has naturally been met with both optimism and skepti-
cism. Some welcome company e↵orts to create a work environment that helps employees’
emotional well-being and productivity, while others express suspicion that this is yet an-
other intrusion into employees’ private emotional lives for the sake of maximizing profits
(Asghar 2014; Kovensky 2014).
Research confirmed that identifying and using one’s personal strengths–particularly
one’s "signature strengths"–increases life satisfaction and reduces depressive symptoms.
Similarly, visualizing one’s best possible self proved to help boost immediate positive af-
fect and to sustain the e↵ect in the long term (Sheldon and Lyubomirsky 2006). The benefits
of this approach extend beyond subjective well-being: Employee engagement (defined at
least in part as employees having the opportunity to do what they do best every day) was
associated with better business-unit outcomes, such as higher profit levels (Harter et al.
2002). Applying one’s own strengths was found to increase positive job-related experi-
ences (i.e., job satisfaction, engagement, pleasure, and meaning) and perceptions of one’s
job as a calling (Harzer and Ruch 2012, 2013). A similar self-a�rmation approach at the
time of employee orientation also increased customer satisfaction and decreased turnover
(Cable et al. 2013).
However, a strengths-based approach may backfire if it leads to complacency and lack
79

Chapter 4
of engagement and motivation in the workplace. Moreover, a large body of research shows
that negative information on self is generally stronger than positive information, as indi-
viduals are more motivated to avoid their bad self-concept than to pursue their good self-
concept (Baumeister et al. 2001). Such research suggests that negative feedback might be
more powerful in motivating people to move away from the status quo. Often, performance
evaluations with constructive criticism are believed to function as a "jolt" to employees–a
quick but e↵ective reshaping of the self-narrative such that employees accurately under-
stand their progress at work as measured against their own performance goals and then
exert more e↵ort in their work. In the absence of threats to self, employees may lower
their defenses, and may not feel stimulated enough to pursue their goals. Strengths-based
approaches may thus give employees a false sense of success, leading them to believe that
they no longer need to increase their e↵ort, and resulting in "complacent self-assurance"
(Vancouver and Thompson 2002).
Research also has shown that self-a�rmation, coupled with initial failure to meet a
goal, can lead to goal disengagement (Vohs et al. 2013). Because self-a�rmation helps in-
dividuals view a situation more realistically, facing setbacks may lead them to doubt their
goal-attainment abilities, thus reducing their sense of self-e�cacy. Indeed, experiencing
initial failure on a task was found to reduce subsequent motivation and performance on a
new but related task. As members of a work group, employees may experience compla-
cency and lack of engagement that leads them to stop searching for useful information from
other team members, which may in turn impede their learning and innovative thinking, and
negatively a↵ect the behavior of other group members.
This leads to two competing hypotheses on the role of self-a�rmation in the workplace.
On one hand, strengths-based management practices may promote and develop employee
80

Chapter 4
potential based on what employees are already quite confident doing. On the other hand,
the possibility of employees becoming complacent and lethargic is deeply concerning to
many organizations. This puzzle leads to key questions. What happens to our stress levels
and health when our self-concept is a�rmed? Would self-a�rmation lead to better or worse
problem-solving? Would self-a�rmed individuals make better team members?
The goal of this research is to build upon the narrative psychology literature by linking it
with the literature on self-a�rmation, and to broaden the conceptual range of the "positive
interpersonal jolt" beyond individual-level motivation and performance to include team
functioning and team performance. In this paper I first consider the benefits and challenges
of traditional self-a�rmation interventions and then identify an alternative method that
allows avoiding the potentially harmful e↵ect of self-a�rmation. I then develop the logic
of why this method may bring about an experience of the positive interpersonal jolt, and
why it might lead to better individual and group outcomes. Last, I empirically demonstrate
the e↵ect of jolts in laboratory and classroom settings with a sample of employees and
managers.
4.1.1 Self-A�rmation and Problem-Solving Performance
Our work lives can at times be threatening to our self-concept. Modern workplaces are
replete with performance evaluations, which invariably focus on identifying weaknesses
(Buckingham and Clifton 2001). People can receive negative performance evaluations
from their coworkers or clients (Ilgen and Davis 2000). Some events at work may even
become traumatic. People can be demoted or fired (Folger and Skarlicki 1998) or may fall
victim to workplace harassment, violence, or bullying (Berdahl 2007; Bond et al. 2010).
Such turns of events can leave us feeling that our value to the organization is nothing more
81

Chapter 4
than a tiny mechanical part–the proverbial cog in a wheel that can easily be diminished
or replaced by others. As a result, threats to self-concept can derail us from maintaining
a positive view of self (Taylor and Brown 1988) and can lead to spiraling drops in perfor-
mance, thus preventing us from performing at our best (Steele 1997). As conceptualized by
Petriglieri (2011), identity threat is an experience appraised as indicating potential harm to
the value, meanings, or enactment of an identity. Not only do employees whose identity is
threatened have less motivation to take on leadership positions and leave their jobs volun-
tarily (Davies et al. 2005; Trevor and Nyberg 2008), but they also act out in ways that can
thwart organizational goals (Elsbach 2003; Nag et al. 2007). Research on self-a�rmation
shows that people can restore their positive self-concept in such threatening situations by
a�rming personal attributes and values (Sherman and Cohen 2002, 2006; Steele 1988).
One of the main criticisms of self-a�rmation is that it is unclear whether it can lead
to clear behavioral changes evident in performance. For example, the e↵ects of self-
a�rmation on attitude and motivation were found to persist over a month-long period (Har-
ris and Napper 2005; Harris et al. 2007), and its e↵ects on health-related behavioral change
were found to be mixed (Harris and Epton 2010). In addition, given that changes in attitude
and motivation are rarely su�cient to make a long-term behavioral change (Ross and Nis-
bett 2011), it is unclear whether the stress-bu↵ering e↵ect of self-a�rmation can increase
problem-solving performance in individuals and teams. Finally, the positive relationship
between self-e�cacy and motivation can easily be disturbed when goals are perceived as
di�cult to achieve (Wright and Dismukes 1995).
A second criticism is that the personal attributes and values that self-a�rmation gen-
erates can be biased toward promoting a self-concept that is neither accurate nor realistic.
This becomes particularly problematic for individuals with low self-esteem, because self-
82

Chapter 4
verification motives (i.e., wanting to be viewed as they view themselves) can prevail. For
example, repeating a positive but ambiguous self-statement such as "I am a lovable person"
was found to backfire for those with low self-esteem (Wood et al. 2009).
In sum, in order for self-a�rmation to help trigger a critical and sustainable change
in self-concept to promote performance, it first needs to ensure that the changes in one’s
attitude and motivation lead to changes in performance. I argue that the intervention should
be su�ciently powerful that it aligns one’s self-concept with one’s behavior, by making
the self-concept more accessible to the individual. Second, timing is important in that an
experience of failure followed immediately by self-a�rmation can lead to negative self-
evaluations and a decrease in self-e�cacy and motivation. Third, it is important to ensure
that people’s self-verification motives to see themselves accurately does not conflict with
self-a�rmation motives by providing accurate and concrete descriptions of their behaviors
rather than ambiguous descriptions of their traits. The integration of benefits and potential
pitfalls of self-a�rmation thus calls for an alternative form of intervention.
4.1.2 Social-A�rmation as an Alternative Self-A�rmation Interven-
tion
To maximize the impact of self-a�rmation, I identified the Reflected Best Self Exercise
as a particularly useful method. This method was developed by Quinn et al. (2003), and
theorized by Roberts et al. (2005) to help individuals reach their full potential at work.
This exercise is "reflected" because it involves a process of integrating positive feedback
from close social relationships into the creation of a self-portrait. It taps into one’s best
self in that it relies on the individual’s cognitive representation of the qualities and char-
acteristics he or she displays when at his or her best (Roberts et al. 2005). I argue that
83

Chapter 4
this social-a�rmation method involves three strategies to strengthen the positive e↵ect of
self-a�rmation, which can be distinguished from the method that is most often used in
positive psychology and self-a�rmation literature (i.e., counting one’s blessings, recalling
one’s strengths, and writing down one’s core values).
First, this intervention gives individuals an opportunity to change the stories they tell
themselves. Rather than simply reflecting on their values and personal attributes, they
are given specific stories of themselves and asked to create a new one. Although self-
narratives are often generated from our own autobiographical memories, not all autobio-
graphical memories become one’s self-narrative. Instead, it has been theorized that it is the
self-defining memories that make an individual unique and di↵erent from others (Singer
and Salovey 2010). These self-defining memories are often a↵ectively charged and vivid,
often formed from repeated episodes in the past, and may reinforce an individual’s en-
during concerns and goals (2010). It is these memories that build one’s life stories as an
internalized and evolving narrative about the narrator (Bruner 1990; Ibarra and Barbulescu
2010; Josselson 2004; Lave and Wenger 1991; Linde 1993; McAdams 1988b; Pentland
1999). According to McAdam’s theory of life stories (1988a), the telling of stories is the
fundamental principle of a theory of identity and self-knowledge, as such self-narratives
ground one’s memories in a meaningful context of personal history. My research intends
to capitalize on the process of creating and revising a personal history with a core theme of
one’s unique strengths and contributions, by drawing from a collection of vivid, personal,
concrete narratives.
Second, this intervention facilitates the process of discovering one’s core strengths by
involving narratives from one’s social ties. People often choose to a�rm themselves in
the domain of social relationships (Creswell et al. 2007). A pioneering work on the topic
84

Chapter 4
of revising narratives was Singer’s (1997) study of men with substance abuse problems.
Singer investigated the role of self-defining memories in the life stories of such individu-
als, and found that their recovery involved redrafting a life story to include self-defining
memories that a�rmed their personal agency and interpersonal connections. Similarly, it
has been argued that subjective feelings of connectedness may provide protective e↵ects
of self-a�rmation (Cacioppo and Patrick 2009). This research thus capitalizes on the psy-
chosocial resources that significant others can provide to individuals. The narratives are
written by members of the focal individual’s own network, which often consists of people
who have a meaningful relationship with him or her, such as family, friends, and coworkers.
The focal individual is asked to actively identify narrative providers who can recall mem-
ories of the focal individual and construct stories of the focal individual at his or her best.
This process generates an opportunity to place oneself as a social being, as one realizes
how he or she is connected to these other individuals. Prior research found that individuals
change their self-concepts to align more closely with the appraisals of significant others
(Drigotas et al. 1999; Malloy et al. 1997). As such, the current research operationalizes
these externalized narratives as an alternative intervention that can help individuals revise
a life story around their unique strengths and contributions.
Third, this intervention equips individuals with specific strategies to reach their goals
and potential. Most past self-a�rmation interventions asked individuals to list a few values
that are important to them and to write about why they are important. The contents were
mainly self-generated and tailored to one’s particular valued identity (Sherman 2013), with
the exception of a few studies that treated positive feedback as a form of self-a�rmation
(Cohen et al. 2000). Less attention was paid to how one can achieve the goal of becoming
congruent with one’s valued identity. Based on Gollwitzer and Sheeran (2006), who sug-
85

Chapter 4
gested that achieving behavioral outcomes requires realistic and concrete plan-making, this
intervention instead asks individuals to make a deliberate e↵ort to synthesize a collection
of narratives, to articulate the newly developed self-narratives, and to write about how they
can apply their strengths to their work. Having a vivid picture of self is associated with
specific action tendencies that support the application of one’s strengths at work (Roberts
et al. 2005). This process of reflection and articulation can help individuals behave in ways
that are congruent with their newly revised personal history of strengths.
In sum, this research uses the Reflected Best Self Exercise as an e↵ective tool to a�rm
one’s personal agency and interpersonal connections.
4.1.3 Positive Interpersonal Jolts and Problem-Solving Performance
I propose that narratives that a�rm one’s personal agency and interpersonal connections
can enhance the problem-solving performance of individuals and work groups, when an
individual is told and reminded of their relationships with others.
I first consider why social-a�rmation intervention might lead to such positive out-
comes. In this intervention, the focal individual’s experience of receiving significant oth-
ers’ narratives can create a point of reflection. Roberts and colleagues (2005) termed this a
"jolt," a discrepant or surprising event that causes individuals to pause and reflect on their
experience (Louis 1980). Although it has been theorized that a jolt can occur with a new
piece of information that serves as a tipping point (Ibarra 2013), regardless of its intensity
or valence ("challenge vs. a�rmation") (Roberts et al. 2005), this research focuses on the
positive jolt created by significant others. That is, individuals learn about strengths they
may not have identified previously by themselves, and such moments are likely to produce
strong emotional responses that could also induce changes in "self-knowledge structures"
86

Chapter 4
(Poole et al. 1989; Roberts et al. 2005). Then individuals have an opportunity to reflect
on this experience of "jolt," synthesize the narratives, find a recurring theme of strengths,
and write a paragraph that articulates and abstracts what they have learned from this expe-
rience. It is this process of reflection that sparks the change in the stories that individuals
tell themselves.
E↵ects of Positive Interpersonal Jolts on Human Emotions and Physiology
I first hypothesize that a personal interpersonal jolt will have immediate benefits in terms of
increased positive a↵ect and improved physiology, enhanced immune system, and reduced
stress. Roberts and colleagues (2005) further theorized that three psychological resources
could enable jolt-driven responses, such as positive a↵ect, a sense of relational connec-
tion, and personal agency. One of the ways that one’s experience of self-a�rmation is
di↵erentiated from experiencing jolt is that the latter generates strong emotional responses
that can trigger changes in self-knowledge structures (Roberts et al. 2005). This is in line
with research showing that positive feedback can increase one’s positive a↵ect (Cooper and
Duncan 1971; Nummenmaa and Niemi 2004) whereas self-a�rmation typically does not
influence a↵ect (McQueen and Klein 2006; Schmeichel and Martens 2005). Thus, I predict
that the experience of jolt will have even more powerful e↵ects in terms of elevating one’s
emotional state than will self-a�rmation manipulations. Specifically, I hypothesize that the
jolt experience increases one’s feelings not only of subjective well-being (happiness) but
also of specific positive social emotions such as astonishment, awe, compassion, elevation,
and inspiration. These emotions represent feelings of self-transcendence. In addition, I
hypothesize that positive interpersonal jolts not only will increase positive state emotions
but also will manifest in physiological functioning, namely the tonic influence of the vagus
87

Chapter 4
nerve on heart rate, measured by respiratory sinus arrhythmia (RSA).1 Given that a jolt may
tap into both positive a↵ective and social-relational resources (Roberts et al. 2005), greater
increases in RSA are predicted to be observed in those who experience jolt than in those
who do not.
Hypothesis 1a: Individuals who experience positive interpersonal jolts have greater self-
reported positive a↵ect, and more heightened vagal tone, a biological measure of
positive emotionality and social engagement, than do controls.
E↵ects of Positive Interpersonal Jolts on Enhancing Immune System and Bu↵ering
Stress
Self-a�rmation is known to bu↵er stress and promote health (Creswell et al. 2005; Keough
and Markus 1998; Sherman et al. 2009). The two key features discussed above–positive
emotions and social engagement–are also useful psychosocial resources that could help in-
dividuals cope with potentially threatening situations. I identified secretory immunoglob-
ulin A (sIgA) as a salivary measure that may capture the positive emotional and social
aspects of positive interpersonal jolts. SIgA is a type of antibody that defends against in-
fections (i.e., common cold) by interfering with bacterial and viral adherence to mucosal
surfaces.2 Compared with lonely individuals, socially connected individuals were found
to have higher levels of Epstein-Barr virus (EBV) antibody titers (Glaser et al. 1985), less1The vagus nerve is responsible for regulating heart rate and maintaining homeostatic functions. The
change in vagal tone, most accurately indexed by respiratory sinus arrhythmia (RSA), is linked to self-regulatory e↵orts and mood (Beauchaine 2001; Butler et al. 2006; DiPietro et al. 1992; Porges 1995). Anincrease in RSA is associated with heart-rate deceleration and is often used as a proxy for positive, relaxingmood states and social engagement (Bazhenova et al. 2001; Beauchaine 2001; Ingjaldsson et al. 2003; Koket al. 2013; Wilhelm et al. 2001). For example, social touching by friends and strangers was found to increasevagal tone (Wilhelm et al. 2001).
2SIgA has been linked to positive a↵ect in many studies (Pressman and Cohen 2005 for reviews connect-ing a↵ect and immune system; Salovey et al. 2000) as well as to social support (Kiecolt-Glaser et al. 2002;Uchino et al. 1996 for a review of the relationship between social support and immune systems).
88

Chapter 4
natural-killer-cell activity (Kiecolt-Glaser et al. 1984), a better immune-system response to
an influenza vaccine (Pressman et al. 2005), and less stress-related inflammation (Jaremka
et al. 2013). Thus, the positive emotions and social engagement resulting from the jolt
experience are predicted to strengthen one’s immune system.
In addition to the direct emotional and health benefits associated with positive inter-
personal jolts, the e↵ect may carry over to a subsequent stress task. That is, jolts could
help individuals cope with stress more e↵ectively by bu↵ering its negative influence and
by reducing the aversive physiological arousal associated with stress at hand (Roberts et al.
2005).3 Based on the broaden-and-build theory of positive emotions (Fredrickson 2000),
I hypothesize that a jolt will increase one’s ability to cope with anaversive psychological
state after a cognitive and social stress task. Taken together, this intervention is predicted to
have an enduring e↵ect on subsequent stress tasks and to reduce the aversive physiological
arousal associated with negative emotions.
Hypothesis 1b: Individuals who experience positive interpersonal jolts develop a stronger
immune response (as measured by secretory immunoglobulin A) and experience re-
duced physiological arousal associated with stress, compared with controls.
E↵ects of Positive Interpersonal Jolts on Problem-Solving Performance
In addition to the a↵ective and physiological benefits, cognitive benefits such as problem-
solving performance may arise from three jolt-related psychosocial resources theorized by
Roberts and colleagues (2005), such as positive a↵ect and personal agency.3Positive a↵ect was shown to increase one’s tolerance for physical discomfort (Cogan et al. 1987) and
trait resilience in the aftermath of the September 11 terrorist attacks (Fredrickson et al. 2003). Importantly,positive a↵ect is known to have the e↵ect of "undoing" negative emotions, and therefore the cardiovascularresponses associated with negativity quickly return to baseline levels of arousal (Fredrickson et al. 2000).
89

Chapter 4
A large body of research has focused on the role of positive a↵ect in increasing intrin-
sic motivation (Isen and Reeve 2005) as well as in cognitive functioning, such as creative
problem-solving (Ashby et al. 1999; De Dreu et al. 2008; Estrada et al. 1994; Isen et al.
1987). In the workplace, positive emotions are also associated with greater innovation and
job-related performance (Amabile et al. 2005; Côté 1999; "Employee Positive Emotion
and Favorable Outcomes at the Workplace," Stalikas and Fitzpatrick 2008; Judge et al.
1998). Research in education settings has demonstrated that self-a�rmation can boost
test scores by reducing the negative e↵ect of stereotype threat (e.g., related to gender and
racial minorities) that could hinder performance on intelligence tests (Cohen et al. 2006,
2009; Martens et al. 2006; Miyake et al. 2010). Given that stress impairs cognitive func-
tioning (Liston et al. 2009), it is possible that a jolt may enhance problem-solving perfor-
mance by reducing the negative influence of stress. One study found that self-a�rmation
improved problem-solving performance among chronically stressed individuals (Creswell
et al. 2013).
Similarly, a jolt may increase creative performance through an increased sense of self-
e�cacy. Numerous studies on self-a�rmation found that it enhances scholarly perfor-
mance under evaluative threat (Cohen et al. 2006, 2009; Martens et al. 2006; Miyake et al.
2010). Here I draw on the biopsychological model of stress as threat versus challenge
(Blascovich and Tomaka 1996). The evaluative nature of the workplace can be seen as ei-
ther challenging or threatening. Challenge is a state in which individuals perceive that they
have su�cient resources to cope with a task’s demands, whereas threat is a state in which
they perceive that they lack su�cient resources. Individuals whose values are a�rmed
may not view the evaluative situation in the workplace as threatening. This heightened
sense of self-e�cacy can in turn motivate individuals to exert more e↵ort toward a given
90

Chapter 4
task (Vancouver et al. 2008), which may lead them to work more creatively and e↵ectively
as individuals and as group members. Similarly, positive self-evaluations and self-e�cacy
have been associated with greater job performance (Judge et al. 1998, 2004). I hypothesize
that, taken together, positive emotions and a greater sense of self-e�cacy from jolt will
provide su�cient resources to tackle problems at hand.
Hypothesis 2: Individuals who experience jolt outperform controls on tasks that involve
creative problem-solving and performance under stress, due to increased positive
a↵ect and sense of self-e�cacy.
E↵ects of Positive Interpersonal Jolts on Team Functioning and Performance
Although it is plausible that the e↵ects of a jolt would extend far beyond intrapsychic ben-
efits, little has been theorized on the role of jolts in team functioning and performance.
Individuals whose self-concept is triggered such that they view themselves as being appre-
ciated by others and connected to others may behave in ways that match their authentic
self-concept. I consider two potential channels that might explain why jolt can facilitate
interpersonal relationship among group members: self-transcendence and social sensitivity.
First, as proposed in Hypothesis 1a, jolt can enhance feelings of self-transcendence,
which reaches beyond caring about oneself. Self-a�rmation is known to reduce one’s de-
fensiveness in response to self-threatening information (Harris et al. 2007; Sherman and
Cohen 2002). Importantly, this e↵ect on defensiveness was found to be mediated by pos-
itive other-directed feelings such as love and connection (Crocker et al. 2008). This find-
ing suggests that self-a�rmation reduces one’s defensiveness via self-transcendence rather
than self-enhancement. Similarly, Roberts and colleagues (2005) theorized that as indi-
viduals learn about their strengths and gain clarity about their unique contribution to their
91

Chapter 4
social context through jolt, they may develop a strong sense of identification with others
(Stets and Burke 2003; Stryker 1980). Thus, I expect other-directed emotions generated
by jolt to facilitate e↵ective voice behavior, perspective-taking, and learning among group
members, which can lead to better team performance.
Second, a jolt may increase an individual’s sensitivity to others, thereby preventing po-
tential conflicts with his or her team members. Research on collective intelligence found
that members’ social sensitivity and the ways in which group members interact predict
group performance (Woolley et al. 2010). The literature on intergroup conflict has shown
that teams with a↵ective relationship-based conflict tend not to perform well (Jehn and
Mannix 2001; Jehn et al. 1999), because relationship conflicts decrease goodwill and mu-
tual understanding (Deutsch 1969). Reducing relationship conflicts would therefore be pos-
itively associated with better team functioning and performance. In fact, self-a�rmation
was found to reduce interpersonal resistance and intransigence in the context of negotia-
tion (Cohen et al. 2007). For example, self-a�rmation increased a negotiator’s openness to
compromise, thereby increasing concession-making. In addition, self-a�rmation reduced
the tendency to derogate a concession, which often is a psychological barrier to resolving
conflicts (Ward et al. 2011). This was because self-a�rmation reduced individuals’ feeling
that they were passive and uninfluential recipients of an inferior concession. Thus, I hy-
pothesize that a heightened sense of sensitivity to others will enable individuals to enhance
the quality of group interaction and reduce intergroup conflict, which can lead to better
team performance.
In sum, I predict that work groups that experienced jolts will have a better relationship,
evidenced by team functioning, and that this will mediate the relationship between the jolt
and team performance.
92

Chapter 4
Hypothesis 3a: Work groups that experience jolts will function better as a team than work
groups that do not experience jolts.
Hypothesis 3b: Work groups that experience jolts will outperform work groups that do
not experience jolts.
Hypothesis 3c: The relationship between experiencing jolts and team performance is ex-
plained by team functioning.
4.1.4 Overview of the Present Research
The current work focuses on the more specialized concept of the positive interpersonal jolt,
and provides a direct test of the e↵ects of positive interpersonal jolts on emotion, health,
stress, problem-solving performance, team functioning, and team performance. In Study 1,
in a laboratory experiment, individuals who were randomly assigned to the jolt condition
engaged in the Reflected Best Self Exercise, and those who were assigned to the control
group did not. Here I first demonstrate a↵ective and physiological manifestations of a
positive interpersonal jolt. Then I test the main hypotheses that a jolt reduces cognitive and
social stress, and enhances one’s problem-solving performance. In Study 2, using a unique
sample of senior leaders in the crisis simulation, I test the hypothesis that the jolt e↵ect
extends to enhance team performance, mediated by enhanced team functioning.
93

Chapter 4
4.2 Study 1
4.2.1 Method
Procedure and Participants A large sample of participants from the Boston/Cambridge
area were invited to fill out an online survey to determine their eligibility for this study.
This prescreening procedure included questions about their employment status, seniority
at work, health conditions (related to cardiovascular or neuroendocrinological disorders)
and demographics. Seventy-five individuals (Mage = 38.72, S D = 14.92; 45% male) who
were currently employed full-time with at least 3 years of work experience were invited
to participate in the 90-minute laboratory study. They were paid $30 at the end of the
laboratory study.
Before their participation in the laboratory study, participants were randomly assigned
to one of the two conditions. Individuals assigned to the treatment condition were asked to
send emails to their friends, family, and coworkers requesting three stories about when the
participant was at his or her personal best. This email included a link to an online survey, so
that all stories about each participant could be compiled by the researchers but not be avail-
able to the participants themselves. Individuals who were assigned to the control condition
were not asked to do anything prior to their participation. An average treated participant
had 1.78 narrative providers (S D = 2.43), and the average number of narratives was 4.05
(S D = 5.60). After receiving the stories from the treatment group, I scheduled laboratory
sessions for all participants between 2 PM and 6 PM to minimize diurnal variability, and
sent out a reminder a day before they were to appear in the laboratory.4
4Because of potential e↵ects on endocrine levels, we asked participants to refrain from engaging in strenu-ous exercise, drinking alcohol/ca↵eine, eating dairy products, smoking, or taking nonprescription medicationon the morning of the appointment, or brushing their teeth at least 1 hour before the experiment.
94

Chapter 4
After participants signed the consent forms, they were asked to rinse their mouth to
prepare for the saliva sample collection. Then they were escorted to the changing rooms,
where the research personnel attached electrodes and sensors to each participant’s body.
Participants were then escorted to the computer room and seated in their own cubicle,
where they remained for the duration of the study. Throughout the study, skin conductance
and heart rate were continuously measured. In addition, two saliva samples were collected
to measure secretory immunoglobulin A (sIgA) at the baseline and after engaging in the
Reflected Best Self Exercise.
Once participants were seated, they watched a 5-minute video showing a relaxing ocean
scene, after which they answered questions about their current emotions for measuring
baseline physiological measures during the resting period. Participants also completed a
series of questionnaires that measured their current emotions and attitudes toward work.
For the key manipulation, experimenters delivered an envelope to each participant. Par-
ticipants in the treatment group received a booklet along with the compiled stories about
themselves that had been provided by their narrative providers (see Appendix C.1). The
treatment booklet was designed to help participants engage in deeper personal reflection
about times when they believed they demonstrated their unique strengths. They were asked
to write three stories about themselves when they were at their best, and then to read the
stories submitted by the narrative providers. Finally, they incorporated these stories into
their final strengths narrative. The control booklet included a writing task that described
participants’ day-to-day organizational routines (see Appendix C.2). Participants spent 15
to 20 minutes on this task, then answered questions about their current emotions. Figure 4.1
illustrates the experimental design of this study.
For dependent measures, first, cognitive problem-solving tasks were introduced as a
95

Chapter 4
Figure 4.1: Experimental procedure for Study 1.
measure of individual creative performance. Second, a computer-based social-exclusion
task (Williams and Jarvis 2006), which has been shown to make individuals feel ostracized,
was used as a manipulation of social stress (Zadro et al. 2004). This task is expected to
increase a person’s perceived sense of threat, thus increasing physiological arousal. Last,
participants completed health and demographics questionnaire.
Measures
Self-reported emotions. The adapted version of the Positive and Negative A↵ect Scale
(PANAS; Watson et al. 1988) was used to measure the level of discrete emotions at base-
line and immediately after the writing task. Participants indicated how much they felt each
emotion "right now" using a 7-point scale (from 1 = "clearly does not describe my feel-
96

Chapter 4
ings" to 7 = "clearly describes my feelings"). In addition to seven items of the positive
emotions from the original PANAS (determined, happy, amused, strong, enthusiastic, ex-
cited, proud), five items were added to capture specific emotions that were hypothesized to
be related to an experience of a jolt, such as feeling awe, inspired, elevated, astonished, or
compassionate. For further analyses, two summary variables were calculated for each par-
ticipant for both pre- and post- positive a↵ect (↵ = 0.92; 0.96). In addition, two summary
variables consisting of only the new positive-emotion items (↵ = 0.88; 0.94) were created.
Autonomic nervous system (ANS) measures. Throughout the experiment, skin conduc-
tance responses and heart rate were measured using the Biopac system (Biopac, Inc., Santa
Barbara, CA). Skin conductance levels have been associated with indices of arousal, atten-
tion, fear, and anxiety (Mendes 2009). To measure skin conductance (activity of the sweat
glands), experimenters placed two disposable pre-gelled adhesive electrodes on the middle
volar surfaces of the first and second fingers of a participant’s nondominant hand. Through
the use of a BioNex amplifier system (Mindware Technologies, Gahanna, OH), raw skin
conductance measures were amplified with a gain of 25 micro-mho/V, a low-pass filter
set to 5Hz, and a sampling rate of 1000Hz. To measure heart rate and heart-rate variabil-
ity through electrocardiogram recordings, experimenters placed three disposable adhesive
electrodes on each participant’s torso. In particular, this measured vagal tone using RSA
(Porges 1995) to capture the vagal influences on the heart. RSA was calculated as heart-
rate variability in the high-frequency (respiratory) band of the R-wave to R-wave sequence
(0.14˘0.40 Hz). All the physiological data were ipsatized to control for physiological vari-
ability across participants (see Bush et al. 1993). Four participants were excluded because
they exhibited no variation in skin conductance over time.
97

Chapter 4
Immune-reactivity hormone. After watching the baseline video, participants were given
instructions for using the Salimetrics Oral Swab (SOS) kit. Each participant held an oral
swab under his or her tongue and, once the swab was fully saturated, placed the swab in an
individually labeled tube. Participants repeated the same procedure for the second swab,
which was requested 25 to 30 minutes after both treatment and control groups completed
their respective writing tasks. All samples were stored at ˘20 degrees Fahrenheit until ship-
ment on dry ice to Salimetrics for biochemical analysis of the concentration of salivary
sIgA. After these salivary responses were assayed, they were log-transformed to approxi-
mate normal distribution and ipsatized. Last, two participants’ data were excluded because
there was not enough saliva to be assayed.
Creative problem-solving. Two problem-solving tasks were presented in random or-
der. First, participants were presented with the Duncker candle problem (Duncker 1945;
Glucksberg and Weisberg 1966) with a time constraint of 3 minutes. It measured the ability
to see objects as performing atypical functions (Maddux and Galinsky 2009) and thus was
coded as a binary variable (1 = "solved," 0 = "did not solve"). Second, participants were
asked to generate as many uses of a newspaper as possible in 3 minutes (Guilford 1950).
The uses for a newspaper were coded according to their fluency, flexibility, and novelty
(Guilford 1950; Tadmor et al. 2012). First, the total number of distinct uses of newspapers
was generated as a measure of fluency. Second, the number of di↵erent categories gener-
ated was used as a measure of flexibility. Last, the mean score of the two coders’ subjective
ratings of the overall creativity of the items generated was used as a measure of novelty on
a scale from 1 ("not creative at all") to 7 ("very creative") (r = 0.86; ICC(2) = 0.92). After
confirming that all three methods yield similar outcomes, I created a composite variable.
98

Chapter 4
Social exclusion. Participants’ physiological responses to social exclusion using the "Cy-
berBall" game (Williams and Jarvis 2006) were measured. In this game, subjects play a
ball-throwing game on their computer screen with other players. All participants were as-
signed to an "ostracism" condition in which they were thrown the ball several times at the
beginning of the game and then not again for the duration of the game (35 throws total).
4.2.2 Results and Discussion
Table 4.1 reports means and standard deviations for the key variables in this study, as well as
their zero-order correlations. I compared the two groups’ self-reported emotions to ensure
that there was no significant di↵erence between the treatment and control groups. For
baseline a↵ect, there was no di↵erence across di↵erent groups: positive a↵ect, t(71) = 0.76,
p = 0.45, d = 0.19. This result suggests that the individuals who were assigned to the
treatment and the control groups did not di↵er significantly from each other at the baseline.
Consequences of a jolt on self-reported emotions and vagal tone. To test Hypothesis
1a, I used random-e↵ects regression models to control for the lack of independence of
two emotion measurements within the same participants. A summary variable for positive
emotions from PANAS was entered as a dependent variable. Time (baseline vs. after
manipulation) and condition (treatment vs. control) were entered as predictors. There was
a marginally significant main e↵ect of time, B = �0.16, S E = 0.09, p = 0.08, but no main
e↵ect of condition was found, B = 0.15, S E = 0.20, p = 0.45. Importantly, however,
a significant interaction between treatment and time was found, B = 1.07, S E = 0.13,
p < 0.001, which suggests that the changes in positive emotions over time depended on
the condition to which individuals were assigned. Although positive a↵ect for controls
actually decreased significantly from pretest (M = 2.83, S D = 0.89) to posttest (M = 2.59,
99

Chapter 4Ta
ble
4.1:
Mea
ns,s
tand
ard
devi
atio
ns,a
ndze
ro-o
rder
corr
elat
ions
fork
eyva
riabl
es,S
tudy
1.Va
riabl
esM
ean
(SD
)1
23
45
67
89
1011
1.Tr
eatm
ent(
vs.
Con
trol)
0.48
(0.5
0)
2.Po
sitiv
eEm
otio
nsat
T12.
69(0
.79)
0.10
3.Po
sitiv
eEm
otio
nsat
T23.
12(1
.02)
0.60
***
0.69
***
4.R
SAat
T16.
57(2
0.1)
0.23
0.05
0.01
5.R
SAat
T26.
78(2
.18)
0.35
**0.
030.
070.
58**
*
6.SI
gAat
T119
4.29
(157
.68)
-0.3
6**
-0.0
0-0
.18
-0.2
1-0
.18
7.SI
gAat
T227
1.54
(196
.97)
-0.2
60.
00-0
.17
-0.1
0-0
.07
0.65
***
8.Sk
inC
ondu
ctan
ceat
T17.
89(4
.84)
-0.0
20.
12-0
.01
0.09
0.07
0.11
-0.1
0
9.Sk
inC
ondu
ctan
ceat
T39.
82(4
.45)
-0.1
40.
15-0
.08
0.07
0.05
0.14
-0.0
90.
80**
*
10.S
kin
Con
duct
ance
atT4
9.43
(4.1
7)-0
.11
0.14
-0.0
60.
030.
030.
21-0
.03
0.81
***
0.93
***
11.P
erfo
rman
ce(C
andl
e)0.
35(0
.48)
0.34
**-0
.14
0.23
0.04
0.08
-0.1
4-0
.06
-0.0
8-0
.11
-0.0
7
12.P
erfo
rman
ce(N
ewsp
aper
)5.
27(1
.91)
0.29
*-0
.13
-0.0
40.
070.
10-0
.17
-0.1
0-0
.08
-0.0
0-0
.05
0.23
*
Not
e.**
*p<
0.00
1,**
p<
0.01
,*p<
0.05
,ˆp<
0.10
.All
phys
iolo
gica
lmea
sure
sar
era
wsc
ores
befo
retra
nsfo
rmat
ion
and
stan
dard
izat
ion.
T1re
fers
toba
selin
e,T2
refe
rsto
the
time
perio
dw
hen
parti
cipa
nts
wer
etre
ated
,T3
refe
rsto
the
cogn
itive
task
perio
d,an
dT4
refe
rsto
soci
alst
ress
task
perio
d.
100

Chapter 4
S D = 1.00), p = 0.02, d = 0.34, it increased significantly for the treatment group from
pretest (M = 3.03, S D = 0.72) to posttest (M = 3.78, S D = 0.73), p < 0.001, d = 1.40.
Figure 4.2: Mean positive and transcendence emotions as a function of time and treatmentin Study 1. Error bars represent standard errors.
The same analysis was conducted for the self-transcendence (other-directed) emotion
items (e.g., compassionate). A similar pattern was found; neither main e↵ect of time,
B = �0.21, S E = 0.13, p = 0.11, nor main e↵ect of treatment, B = 0.15, S E = 0.23,
p = 0.51, was found, but there was a significant interaction e↵ect, B = 1.37, S E = 0.17,
101
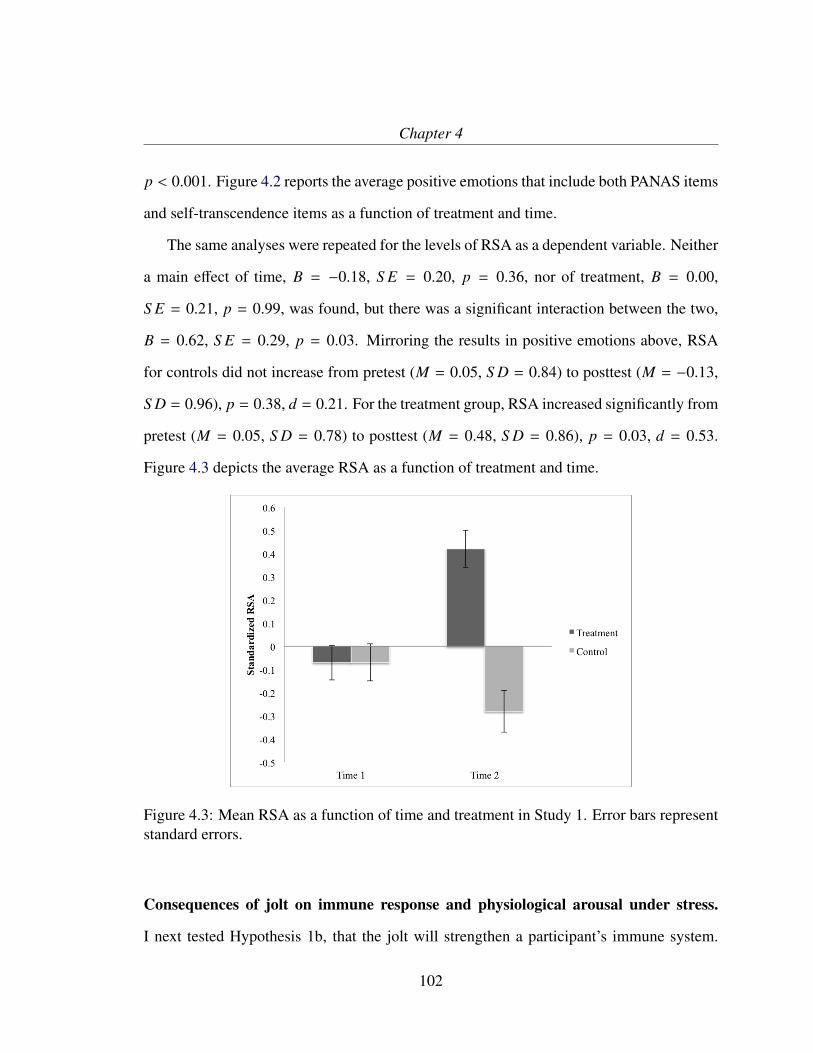
Chapter 4
p < 0.001. Figure 4.2 reports the average positive emotions that include both PANAS items
and self-transcendence items as a function of treatment and time.
The same analyses were repeated for the levels of RSA as a dependent variable. Neither
a main e↵ect of time, B = �0.18, S E = 0.20, p = 0.36, nor of treatment, B = 0.00,
S E = 0.21, p = 0.99, was found, but there was a significant interaction between the two,
B = 0.62, S E = 0.29, p = 0.03. Mirroring the results in positive emotions above, RSA
for controls did not increase from pretest (M = 0.05, S D = 0.84) to posttest (M = �0.13,
S D = 0.96), p = 0.38, d = 0.21. For the treatment group, RSA increased significantly from
pretest (M = 0.05, S D = 0.78) to posttest (M = 0.48, S D = 0.86), p = 0.03, d = 0.53.
Figure 4.3 depicts the average RSA as a function of treatment and time.
Figure 4.3: Mean RSA as a function of time and treatment in Study 1. Error bars representstandard errors.
Consequences of jolt on immune response and physiological arousal under stress.
I next tested Hypothesis 1b, that the jolt will strengthen a participant’s immune system.
102
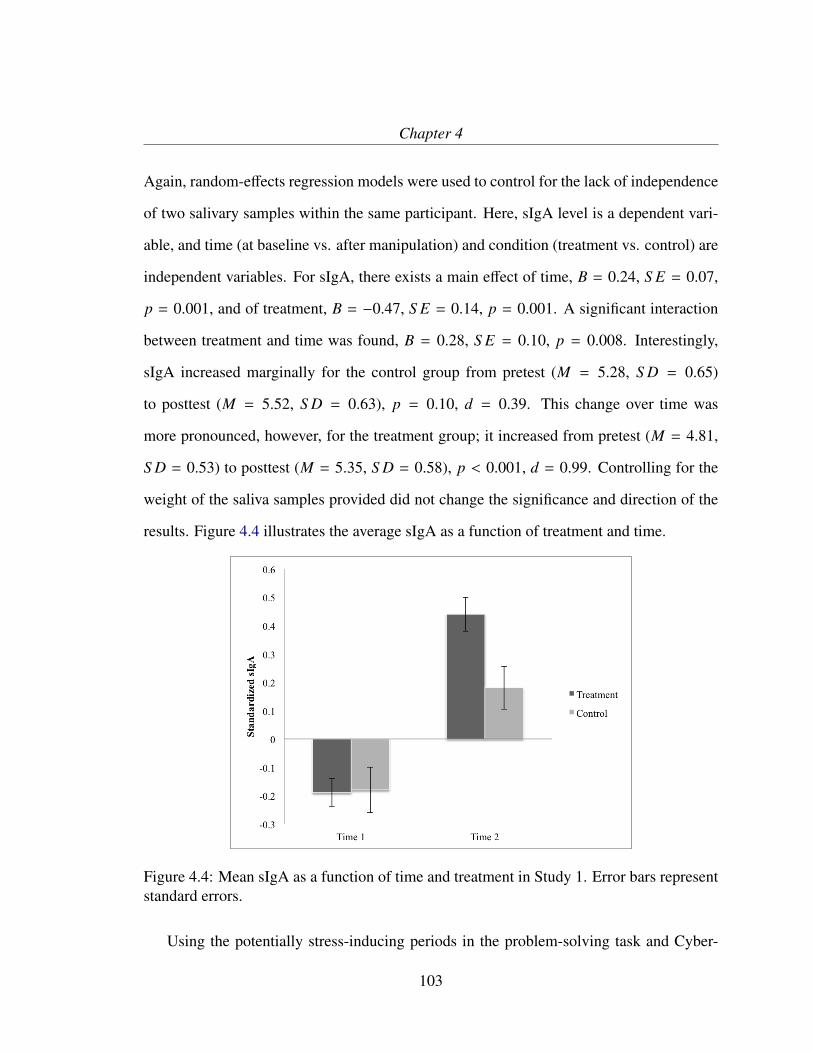
Chapter 4
Again, random-e↵ects regression models were used to control for the lack of independence
of two salivary samples within the same participant. Here, sIgA level is a dependent vari-
able, and time (at baseline vs. after manipulation) and condition (treatment vs. control) are
independent variables. For sIgA, there exists a main e↵ect of time, B = 0.24, S E = 0.07,
p = 0.001, and of treatment, B = �0.47, S E = 0.14, p = 0.001. A significant interaction
between treatment and time was found, B = 0.28, S E = 0.10, p = 0.008. Interestingly,
sIgA increased marginally for the control group from pretest (M = 5.28, S D = 0.65)
to posttest (M = 5.52, S D = 0.63), p = 0.10, d = 0.39. This change over time was
more pronounced, however, for the treatment group; it increased from pretest (M = 4.81,
S D = 0.53) to posttest (M = 5.35, S D = 0.58), p < 0.001, d = 0.99. Controlling for the
weight of the saliva samples provided did not change the significance and direction of the
results. Figure 4.4 illustrates the average sIgA as a function of treatment and time.
Figure 4.4: Mean sIgA as a function of time and treatment in Study 1. Error bars representstandard errors.
Using the potentially stress-inducing periods in the problem-solving task and Cyber-
103

Chapter 4
ball, I tested whether individuals in the treatment condition experienced less negative phys-
iological arousal than those in the control condition. A repeated-measures mixed model
was used to test the e↵ect of treatment across three time points (baseline, cognitive task,
and social stress task). There was no main e↵ect of treatment, B = 0.15, S E = 1.07,
p = 0.88, but there was a significant main e↵ect of time (for baseline vs. cognitive task,
B = 2.84, S E = 0.42, p < 0.001; for baseline vs. social stress task, B = 2.23, S E = 0.42,
p < 0.001). More important, there was a significant interaction between treatment and time
during the cognitive task, B = �1.59, S E = 0.60, p = 0.008, and a significant interaction
between treatment and time during the social stress task, B = �1.17, S E = 0.60, p = 0.049.
This finding indicates that individuals who experienced jolt felt less physiological arousal
during the cognitive and social stress tasks than those in the control condition. Figure 4.5
illustrates the levels of skin conductance as a function of treatment and time.
Figure 4.5: Mean skin conductance as a function of time and treatment in Study 1. Errorbars represent standard errors.
104

Chapter 4
Consequences of jolt for problem-solving performance. Last, I tested Hypothesis 2a,
that a jolt will enhance individual ability to solve problems creatively. For the candle task,
individuals in the treatment condition were more likely to solve it (51%, 18/35) than those
in the control condition (19%, 7/37), �2 = (1,N = 72) = 9.39, p = 0.004. Although
education level was not di↵erent across di↵erent conditions (Mtreatment = 3.83, S D = 1.25;
Mcontrol = 4.08, S D = 1.10, t(71) = 0.91, p = 0.36, d = 0.22), it was controlled for in
further analysis. A logit regression analysis found that this e↵ect is robust after controlling
for the level of education, B = 1.61, S E = 0.55, p = 0.004 (for education; B = 0.29,
S E = 1.12, p = 0.02). Similarly for the newspaper task, individuals in the treatment
condition (M = 5.79, S D = 0.31) did better at generating di↵erent uses of a newspaper
than did controls (M = 4.67, S D = 0.30), t(71) = �2.61, p = 0.01, d = �0.62. A
regression analysis found that controlling for education does not change the significance
and direction of the treatment e↵ect, B = 1.23, S E = 0.42, p = 0.004 (for education;
B = 0.45, S E = 0.18, p = 0.01). Figure 4.6 illustrates the summary performance outcomes
as a function of treatment and time. Table 4.2 summarizes separate analyses on fluency,
flexibility, and novelty for the newspaper task.
I examined the combined a↵ective, physiological, and cognitive e↵ects of engaging in
the social-a�rmation intervention in the laboratory setting. First, in support of Hypothesis
1a, a jolt increased positive a↵ect and vagal tone. Second, in support of Hypothesis 1b, a
jolt significantly strengthened the immune system of those in the treatment group compared
with those in the control group and bu↵ered negative physiological arousal associated with
stress-inducing tasks. Third, in support of Hypothesis 2a, a jolt increased problem-solving
performance. Thus, Study 1 provides evidence for the role of a jolt in building psychosocial
resources that have critical organizational implications such as for employee health and
105

Chapter 4
Figure 4.6: Mean problem-solving performance as a function of treatment in Study 1. Errorbars represent standard errors.
productivity.
4.3 Study 2
Although Study 1 provided causal evidence that jolt can bring a↵ective, physiological,
and cognitive benefits immediately, it is di�cult to conclude that a jolt can bring about a
change in behavior in the long term in the interpersonal setting. In Study 2, a group of
106

Chapter 4
Table 4.2: Multiple regressions results for fluency, flexibility, and novelty, controlling forthe level of education, Study 1.
Creative PerformancePredictor Variables Fluency Flexibility Novelty
� SE � SE � SE
Treatment (vs. Control) 0.50* 0.22 0.51* 0.22 0.64** 0.22
Level of Education 0.24* 0.09 0.23* 0.09 0.21* 0.09
N 73 73 73
Overall R-squared 0.13 0.13 0.15
Overall F 5.08** 5.22** 6.15**Note. ***p < 0.001, **p < 0.01, *p < 0.05, ˆp < 0.10.
senior leaders, after experiencing a jolt, participated in a crisis simulation related to public
health. At the end of the simulation, they were asked to give a presentation, which was
evaluated by expert panels. Here I intended to observe a change in interpersonal judgment
and behavior in a controlled setting that minimized demand characteristics. That is, the role
of the Reflected Best Self Exercise and its relationship with the crisis simulation were not
revealed to participants, and there was a 10-day gap between intervention and measurement
of outcomes.
In addition, Study 2 triangulates the e↵ect of positive interpersonal jolts by holding
all other factors constant. The treatment condition in Study 1 asked participants to iden-
tify narrative providers, reach out to them, and write an integrated narrative from both
self-identified and other-reflected stories. However, individuals who were assigned to the
control condition did not perform any such activities, which makes it di�cult to attribute
the di↵erence between the treatment and control condition to the e↵ect of positive inter-
personal jolt. In Study 2, however, all other factors (such as recalling one’s social network,
107

Chapter 4
soliciting stories from the narrative providers, and writing one’s own best-self stories) are
held constant. Instead, the only di↵erence between treatment and control groups is whether
the narrative providers’ stories are delivered to the individuals early on (10 days before the
performance task) or after the performance task. This design enables isolating the e↵ect of
experiencing positive interpersonal jolt.
4.3.1 Method
Participants
In this study, I worked with a unique sample of leaders from the Senior Executive Fellows
(SEF) program at Harvard Kennedy School. The SEF program is a 4-week leadership
development program o↵ered three times a year, in February, April, and October. A total
of 246 participants participated in this program (M = 48.47, S D = 7.13, 73% male).
Approximately 60 to 80 fellows are admitted to each program, and most are career civil
servants (a majority work for the U.S. government) or current or former military o�cers.
Many of the participants are candidates for promotion to senior executive or general o�cer
ranks. I collected data from four sessions: October–November 2013 (N = 31), February–
March 2014 (N = 70), April–May 2014 (N = 80), and October–November 2014 (N = 65).
Procedure
Pre-arrival assignment. Once the list of SEF program participants was confirmed, the
SEF program sta↵ emailed all participants, asking them to complete a pre-arrival assign-
ment (see Appendix C.3 for a sample email). First, all participants were asked to submit
their own self-assessment describing a past event when they were at their best. Second,
participants were asked to identify a minimum of five to 10 contacts who had witnessed
108

Chapter 4
them in situations in which they were at their best. They were encouraged to include a mix
of contacts who knew them well, including friends, mentors, family members, customers,
and colleagues. Third, after all contact information was provided, an invitation was sent
to these potential narrative providers to write up to three detailed stories describing their
interactions with the participant and to identify the occasions when the participant added
value and made important contributions. In particular, the narrative providers were asked
to describe the participant’s behaviors and specific characteristics in the situation. A third-
party website then compiled the stories received and created a report for each participant to
include all stories from self and others (see Appendix C.4 for a sample report).
Group assignment and experimental manipulation. The program director randomly
assigned participants to work groups consisting of five or six fellows. There were a few
rules that the program followed. First, each group had a similar gender and nationality
composition, and second, in cases where there were more than two fellows from the same
organization, or the same o�ce, they were assigned to di↵erent groups. After being as-
signed on the first day of the program, these work groups were told to meet each morning
to discuss the cases given to them, or to work together on group projects, including the
crisis-simulation exercise, throughout the program.
In each program, the program director randomly assigned the work groups to one of the
two conditions: treatment and control. A total of 24 groups were assigned to the treatment
condition, and 22 groups were assigned to the control condition. All participants were
asked to sit together as a group on Wednesday of Week 1, at which time they received
the individual packages. The work groups assigned to the treatment condition received a
package that included the narrative providers’ stories as well as worksheets to facilitate their
reflection on the strength narratives. On this worksheet, they were asked to first identify the
109
Chapter 4
commonalities across the stories and to write down the key themes, and then to integrate
the evidence to create a written portrait of themselves based on the strengths identified (see
Appendix C.5 for a treatment worksheet).
The work groups in the control condition did not receive the stories from the feedback
providers but instead received a worksheet to prepare for the group discussion that took
place later in one of the classes. In this assignment, the fellows were asked to reflect on
a previous experience in which they had observed a leader’s impressive communication
success or failure in detail, to identify common patterns of communication behavior, and
to write how these insights can be tied to the communication structure of their own organi-
zation (see Appendix C.6 for a control worksheet).
All groups were given an hour to complete their respective tasks. Although each group’s
members sat around the table together, participants were told not to discuss with others
what they’d received (either within the group or outside the group), in order to give the
treatment groups the opportunity to privately reflect on what they received, and to minimize
the suspicion of the work groups that were not treated.
Team-functioning survey. On Thursday and Friday of Week 2 (9 to 10 days after the
manipulation, depending on the class schedule), all participants were asked to complete
a 15-minute survey that measured their individual experience with their work group and
collected demographic information to be included as covariates.
The Middle East Respiratory Syndrome (MERS) crisis simulation. The SEF program
launched a crisis-simulation exercise on the third day of Week 1 (10 days after the manip-
ulation). In this exercise, all work groups played the role of the Emergency Watch Team
working in the Massachusetts state government to monitor developments following the re-
110

Chapter 4
port of a dangerous coronavirus, Middle East Respiratory Syndrome (MERS-CoV), being
detected in Massachusetts (see Appendix C.7 for more detailed assignment). All partici-
pants were also asked to follow a Twitter account (#GameSEFHKS) to receive the latest
information. In addition, more background information on MERS from state, local, and
international public health organizations, and fictional news articles confirming the spread
of the virus across Massachusetts, with increasing numbers of deaths, was provided (all
informational materials given to participants for 7 days leading up to the briefing day are
available upon request). Each work group was asked to prepare a brief presentation for the
Massachusetts governor’s top sta↵ the following Friday, in Week 2, which allowed about
10 days of preparation.
The briefing-day performance evaluation. Each work group presented to a group of
"top state o�cials and experts" consisting of faculty members at the Harvard Kennedy
School with various expertise, as well as external experts from the U.S. government, such
as the current Director of Massachusetts Emergency Management Agency / Undersecre-
tary for Homeland Security and Emergency Management in Executive O�ce of Public
Safety, a former Commissioner of U.S. Customs and Border Protection, and the Director of
the Bureau of Infectious Disease at the Massachusetts Department of Public Health. Each
group had 20 minutes to recommend a course of action for the governor. The expert panels,
which were blind to the experimental conditions, spent 5 minutes giving each group feed-
back on its performance and completed an evaluation form (see Appendix C.8 for a sample
evaluation sheet).
In order to ensure that all participants benefited from the intervention, after all data
collection was concluded I distributed the same materials to those in the treatment condition
that were distributed to those in the control condition. I then debriefed all participants on
111

Chapter 4
the experimental procedure in the class that followed.
Measures
Member-rated team functioning. A three-item scale measured the extent to which each
individual was satisfied working with the group (Van Der Vegt and Emans 2000). Partici-
pants indicated whether they agreed or disagreed with three statements ("I am satisfied with
the members of my group," "I am pleased with the way the members of my group and I
work together," and "I am very satisfied with working in my group") using a 7-point scale
(from 1 = "strongly disagree" to 7 = "strongly agree"; ↵ = 0.95). In addition, participants
rated the frequency with which they felt their opinions were heard by other group members
on a 5-point scale (from 1 = "never" to 5 = "always") and how much they learned from
other members of their group on a 4-point scale (from 1 = "none" to 4 = "a lot"). Last,
participants rated both the frequency with which they took the perspectives of other group
members and the frequency with which other members took their perspectives on a 5-point
scale (from 1 = "never" to 5 = "always").
All four measures loaded well onto a single factor (eigenvalue = 2.40, explaining 60%
of the variance), and a summary variable for team functioning was created (↵ = 0.77).
Member-rated and expert-rated team performance. All participants reported their
team’s performance in preparing the MERS exercise according to five dimensions, e�-
ciency, quality of innovation, adherence to schedule, ability to resolve conflict, and overall
excellence, on a 5-point scale (from 1 = "very poor" to 5 = "very good"; ↵ = 0.88). In addi-
tion, each team of three to four expert panels evaluated up to six work groups’ presentations
based on six criteria: e↵ectiveness (whether the group provided convincing support for the
recommendations), clarity (whether the recommendations were clear and concrete), fea-
112

Chapter 4
sibility (whether the policy recommendations were realistic and feasible), innovativeness
(whether the team showed creative and innovative thinking), team cohesiveness (whether
the team members showed an ability to relate to each other), and overall value of the con-
tents for the decision maker. Out of four programs, the first two used a 5-point scale (from
1 = "needs improvement" to 5 = "excellent"), and the last two used a 7-point scale (from
1 = "needs improvement" to 5 = "excellent"). Thus, we standardized the scales within
programs using z scores and combined them into one performance scale (↵ = 0.95).5
Because all 11 items loaded well onto a single factor (eigenvalue = 3.85, explaining
35% of the variance), I combined them to create a summary variable that captures both
member-rated and expert-rated team performance (↵ = 0.87).
4.3.2 Results and Discussion
Data Analysis Strategy
I first tested whether the average outcome for the treatment groups di↵ers from that for
the control group, by collapsing the data to the group level, and regressed the outcome
variable onto a dummy variable indicating assignment to the treatment group. Second, I
tested whether the average outcome for individuals in treatment groups di↵ered from that
for individuals in control groups, by conducting a multivariate regression analysis at the
individual level, clustering standard errors by group. Third, I also controlled for theoreti-
cally relevant covariates that may have influenced team functioning or team performance.
I controlled for other group-specific characteristics such as group size, mean age, and gen-5Because the limited number of available experts and limited class hours meant that di↵erent teams of
expert panels evaluated di↵erent groups, overall interrater reliability could not be obtained. However, therewere four judges, who rated 12 groups together. ICC(1) ranged from 0.13 to 0.51, ICC(2) ranged from 0.37to 0.81.
113

Chapter 4
der composition (ratio of females to males) based on the literature on team diversity and
collective intelligence (Polzer et al. 2002; Woolley et al. 2010). In addition, I controlled
for the cohort (by entering four di↵erent cohort indicators) in order to control for potential
factors that changed over time (such as course schedule and curriculum). For example, the
fellows in the October–November 2014 program had more experience working as a group
as the result of a curriculum change, and this may have increased their overall team perfor-
mance compared with previous programs. Next, I controlled for the group of expert panels
who evaluated each of the groups, as a total of nine groups of nonoverlapping expert pan-
els evaluated the groups and di↵erent groups of experts may have scored the work groups
di↵erently.
Consequences of a Jolt for Team Function 10 Days After the Intervention
The work groups assigned to the treatment condition (M = 0.13, S D = 0.35) rated their
average team functioning higher than did the groups assigned to the control condition (M =
�0.15, S D = 0.32), t(42) = 2.70, p = 0.01, d = 0.85. Similarly, the individuals assigned
to the treatment condition rated their team functioning to be higher than the individuals
assigned to the control condition, � = 0.38, S E = 0.13, p = 0.008 in the regression
analysis with group-clustered standard errors. Last, controlling for the e↵ect of group size,
mean age, gender composition, and cohort/expert panels did not change the direction or
significance of the treatment e↵ect, � = 0.39, S E = 0.13, p = 0.004 (see Table 4.3 for
the hierarchical regression results for the summary variable; individual measures are also
reported in Table 4.4).
114

Chapter 4
Table 4.3: Hierarchical multiple regression analyses for member-reported team function-ing, Study 2.
Team FunctioningPredictor Variables Step 1 Step 2
� SE � SE
Treatment (vs. Control) 0.38** 0.12 0.39** 0.13
Group Size 0.04 0.14
Mean Age 0.01 0.02
Gender Composition 0.6 0.91
Panel #2 -0.16 0.25
Panel #3 -0.36 0.25
Panel #4 -0.04 0.28
Panel #5 -0.14 0.28
Panel #6 0.15 0.29
Panel #7 -0.57* 0.29
Panel #8 0.28 0.27
Panel #9 0.60ˆ 0.31
N 246 246
Overall R-squared 0.04 0.12
Overall F 9.23** 2.51**
Change in R-squared 0.08
Change in F 1.88*Note. ***p < 0.001, **p < 0.01, *p < 0.05, ˆp < 0.10. � refers to a standardized
regression coe�cient, and panel refers to group of experts who evaluated work groups.
Consequences of a Jolt for Team Performance 10 Days After the Intervention
In support of Hypothesis 3a, the work groups that were assigned to the treatment condition
(M = 0.18, S D = 0.48) outperformed the groups in the control condition (M = �0.25,
115

Chapter 4
Tabl
e4.
4:H
iera
rchi
calm
ultip
lere
gres
sion
anal
yses
form
embe
r-re
porte
dte
amfu
nctio
ning
byca
tego
ries,
Stud
y2.
Satis
fact
ion
with
Gro
upW
ork
Freq
uenc
yof
Voic
eFr
eque
ncy
ofLe
arni
ngFr
eque
ncy
ofPe
rspe
ctiv
e-ta
king
Pred
icto
rVa
riab
les
Step
1St
ep2
Step
1St
ep2
Step
1St
ep2
Step
1St
ep2
�SE
�SE
�SE
�SE
�SE
�SE
�SE
�SE
Trea
tmen
t(vs
.Con
trol)
0.29
*0.
130.
24ˆ
0.13
0.28
*0.
130.
35*
0.14
0.34
**0.
120.
30*
0.14
0.19
0.13
0.25
ˆ0.
14
Gro
upSi
ze0.
090.
140.
090.
140.
010.
14-0
.06
0.14
Mea
nA
ge0.
020.
02-0
.03
0.02
0.03
ˆ0.
020.
020.
02
Gen
derC
ompo
sitio
n0.
350.
91.
61ˆ
0.93
-0.9
00.
920.
680.
91
Pane
l#2
0.09
0.25
-0.3
00.
250.
20.
25-0
.45ˆ
0.25
Pane
l#3
-0.1
70.
25-0
.40
0.25
-0.1
10.
25-0
.36
0.25
Pane
l#4
0.27
0.28
-0.4
30.
290.
020.
290.
010.
29
Pane
l#5
0.00
0.28
-0.4
00.
290.
330.
28-0
.34
0.28
Pane
l#6
0.13
0.29
-0.0
80.
30.
240.
290.
130.
29
Pane
l#7
-0.4
70.
28-0
.69*
0.29
0.11
0.29
-0.6
2*0.
29
Pane
l#8
0.62
*0.
27-0
.02
0.28
0.41
0.28
-0.1
80.
28
Pane
l#9
0.63
*0.
310.
220.
320.
380.
310.
510.
31
N24
624
624
624
624
624
624
624
6
Ove
rall
R-s
quar
ed0.
020.
110.
020.
090.
030.
080.
010.
1
Ove
rall
F5.
20*
2.34
**5.
08*
1.93
*7.
55**
1.52
2.15
1.96
*
Cha
nge
inR
-squ
ared
0.09
0.07
0.05
0.09
Cha
nge
inF
2.06
*1.
65ˆ
0.97
1.94
*
Not
e.**
*p<
0.00
1,**
p<
0.01
,*p<
0.05
,ˆp<
0.10
.�re
fers
toa
stan
dard
ized
regr
essi
onco
e�ci
ent,
and
pane
lref
ers
togr
oup
ofex
perts
who
eval
uate
dw
ork
grou
ps.
116
Chapter 4
S D = 0.44), t(42) = 3.04, p = 0.004, d = 0.96. Similarly, the individuals assigned to the
treatment condition outperformed those assigned to the control condition, � = 0.70, S E =
0.12, p < 0.001. Controlling for the e↵ect of group size, mean age, gender composition,
and cohort/expert panels did not change the direction or significance of the treatment e↵ect,
� = 0.77, S E = 0.12, p < 0.001 (see Table 4.5 for the hierarchical regression results for
the summary variable; member-rated vs. expert-rated performance ratings are reported in
Table 4.6).
Mediation Analysis
To test the mediation hypothesis that enhanced team functioning explains the relationship
between the experience of jolt and team performance (Hypothesis 3b), I first regressed team
performance on the treatment indicator, and entered team functioning as the proposed me-
diator at the group level. A bootstrap analysis of the indirect e↵ect using 1,000 repetitions
showed that the 95% confidence interval (CI) for the indirect e↵ect excluded 0, suggest-
ing that team functioning partially mediated the relationship between positive interpersonal
jolts and team performance (estimate = 0.12, base-corrected 95% CI = [0.02, 0.30]). This
result is reported in Figure 4.7.
I repeated the same analysis using the individual-level variables, controlling for group
size, mean age, gender composition, and cohort/expert groups. A bootstrap analysis of
the indirect e↵ect using 1,000 repetitions confirmed that the 95% CI of the indirect e↵ect
excluded zero, suggesting that team functioning partially mediated the relationship between
jolts and team performance (estimate = 0.14, base-corrected 95% CI = [0.04, 0.26]).
117
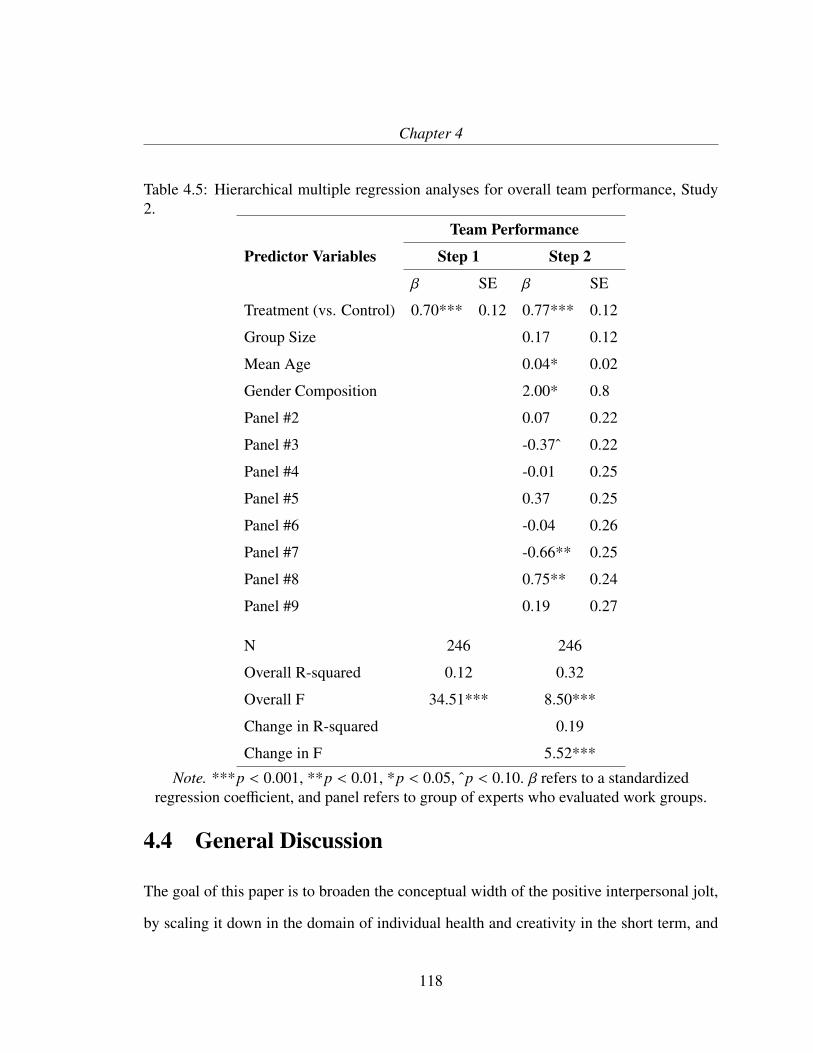
Chapter 4
Table 4.5: Hierarchical multiple regression analyses for overall team performance, Study2.
Team PerformancePredictor Variables Step 1 Step 2
� SE � SE
Treatment (vs. Control) 0.70*** 0.12 0.77*** 0.12
Group Size 0.17 0.12
Mean Age 0.04* 0.02
Gender Composition 2.00* 0.8
Panel #2 0.07 0.22
Panel #3 -0.37ˆ 0.22
Panel #4 -0.01 0.25
Panel #5 0.37 0.25
Panel #6 -0.04 0.26
Panel #7 -0.66** 0.25
Panel #8 0.75** 0.24
Panel #9 0.19 0.27
N 246 246
Overall R-squared 0.12 0.32
Overall F 34.51*** 8.50***
Change in R-squared 0.19
Change in F 5.52***Note. ***p < 0.001, **p < 0.01, *p < 0.05, ˆp < 0.10. � refers to a standardized
regression coe�cient, and panel refers to group of experts who evaluated work groups.
4.4 General Discussion
The goal of this paper is to broaden the conceptual width of the positive interpersonal jolt,
by scaling it down in the domain of individual health and creativity in the short term, and
118
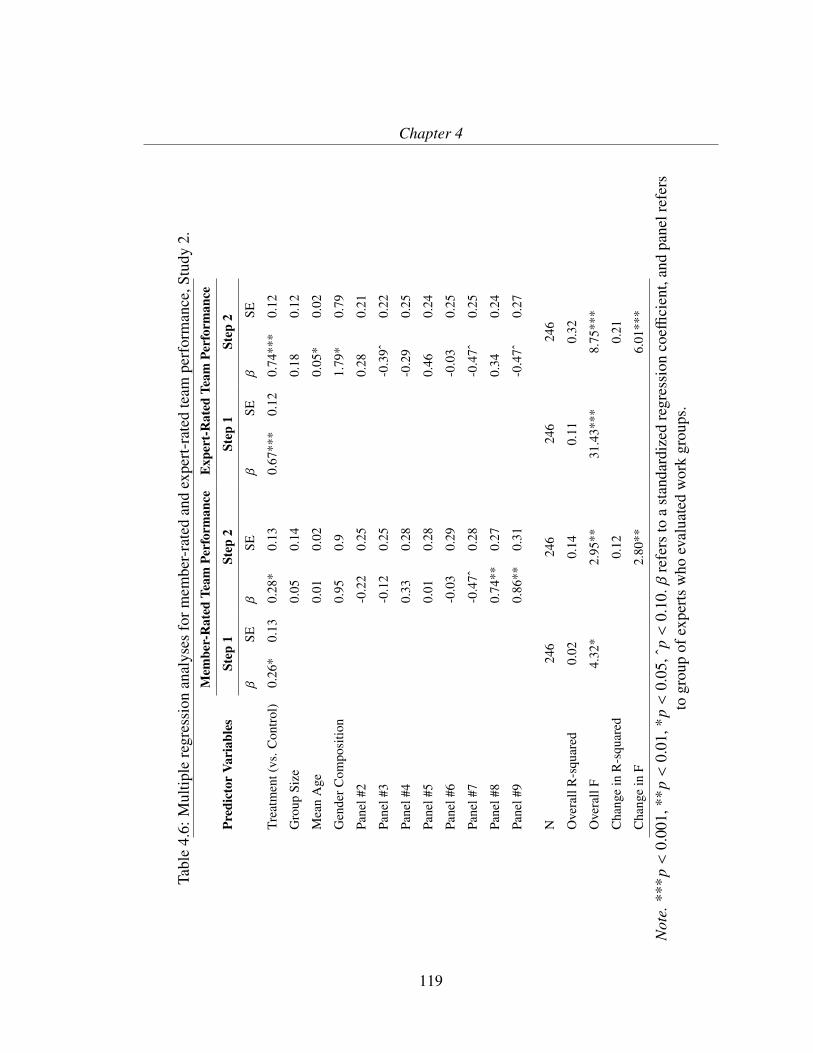
Chapter 4
Tabl
e4.
6:M
ultip
lere
gres
sion
anal
yses
form
embe
r-ra
ted
and
expe
rt-ra
ted
team
perf
orm
ance
,Stu
dy2.
Mem
ber-
Rat
edTe
amPe
rfor
man
ceEx
pert
-Rat
edTe
amPe
rfor
man
cePr
edic
tor
Vari
able
sSt
ep1
Step
2St
ep1
Step
2�
SE�
SE�
SE�
SE
Trea
tmen
t(vs
.Con
trol)
0.26
*0.
130.
28*
0.13
0.67
***
0.12
0.74
***
0.12
Gro
upSi
ze0.
050.
140.
180.
12
Mea
nA
ge0.
010.
020.
05*
0.02
Gen
derC
ompo
sitio
n0.
950.
91.
79*
0.79
Pane
l#2
-0.2
20.
250.
280.
21
Pane
l#3
-0.1
20.
25-0
.39ˆ
0.22
Pane
l#4
0.33
0.28
-0.2
90.
25
Pane
l#5
0.01
0.28
0.46
0.24
Pane
l#6
-0.0
30.
29-0
.03
0.25
Pane
l#7
-0.4
7ˆ0.
28-0
.47ˆ
0.25
Pane
l#8
0.74
**0.
270.
340.
24
Pane
l#9
0.86
**0.
31-0
.47ˆ
0.27
N24
624
624
624
6
Ove
rall
R-s
quar
ed0.
020.
140.
110.
32
Ove
rall
F4.
32*
2.95
**31
.43*
**8.
75**
*
Cha
nge
inR
-squ
ared
0.12
0.21
Cha
nge
inF
2.80
**6.
01**
*
Not
e.**
*p<
0.00
1,**
p<
0.01
,*p<
0.05
,ˆp<
0.10
.�re
fers
toa
stan
dard
ized
regr
essi
onco
e�ci
ent,
and
pane
lref
ers
togr
oup
ofex
perts
who
eval
uate
dw
ork
grou
ps.
119

Chapter 4
Figure 4.7: Team satisfaction and functioning mediates the relationship between the expe-rience of jolt and team performance. c denotes beta coe�cient for total e↵ect, and c0 betacoe�cient for direct e↵ect. ***p < 0.001, **p < 0.01, *p < 0.05, ˆp < 0.10.
by scaling it up in the domain of team functioning and team performance in the long run.
Study 1 demonstrated that jolt increased positive social emotions in both self-reports and
physiological responses, bu↵ered stress, and improved individual immune response in a
laboratory study. Study 2 demonstrated that jolt carried over to individual group members’
behavior over a period of 10 days, facilitating intragroup interactions. Importantly, both
studies showed that positive interpersonal jolts lead to better performance, in terms of cre-
ative problem-solving (in Study 1) and team performance in a crisis simulation (in Study 2).
The two studies demonstrate the presence of benefits in experiencing positive interpersonal
jolts for both employees from various organizations (Study 1) and work groups consisting
of senior leaders (Study 2).
4.4.1 Theoretical and Practical Contributions
This research advances positive organizational scholarship, narrative psychology, and self-
a�rmation literature in four ways.
120

Chapter 4
First, it adds to the body of research that connects positive social interactions to phys-
iological functioning (Dutton and Heaphy 2003; Heaphy and Dutton 2008). By tapping
into one’s close social relationships, positive interpersonal jolts may bring greater salience
and meaning to past interactions with the narrative providers. This indicates that past social
interactions can be capitalized to build necessary psychosocial resources to stay psycholog-
ically and physiologically resilient in threatening situations. One important methodological
extension of this research is to examine the physiological consequences of jolt, which are
less likely to be biased than self-reports. This research used new tools of investigation to
accurately measure the impact of positive interpersonal jolt, by including measurements
of physiological signals (skin conductance and vagal tone) and collection of saliva sam-
ples (immune-reactivity levels). Psychological stress is associated with susceptibility to
the common cold (Cohen et al. 1991), and job strain is associated with high rates of ab-
senteeism (Darr and Johns 2008). The findings of increased antibody and reduced physi-
ological arousal under stress suggest that psychological interventions can reduce physical
illness and absenteeism, which are costly for organizations.
Second, this research highlights the importance of stories that individuals tell them-
selves. The intervention I used consisted of a series of deliberate and reflective actions
taken to solicit self-knowledge from others who have vivid memories from the past in nar-
rative form, and the incorporation of such stories to redefine and articulate an individual’s
self-concept. Scholars of narrative psychology called the organization of human expe-
rience into self-narratives that consist of plots, characters, settings, and conflicts a "root
metaphor for psychology" (Sarbin 1986). Self-narratives create, develop, and maintain the
self-concept, which is a collection of self-representations (Ashforth 2000; Bruner 1990;
Ibarra and Barbulescu 2010; McAdams 1996, 1999; Singer and Salovey 2010). The study
121

Chapter 4
of self-narratives was proposed as an alternative to psychometric tests that often fail to
capture subtle and complex human experiences (Singer and Salovey 2010), but empirical
tests of the e�cacy of self-narrative construction have been rare. Instead of relegating
self-narratives to mere anecdotes, my work resuscitates this scholarship by actively using
them as an intervention in a randomized trial. Not only does this research provide direct
empirical evidence that constructing self-narratives with positive interpersonal jolts helps
individuals’ health and performance, but it also suggests that the very reflective process of
jolt that involves a revision of one’s self-narratives is critical.
Third, this research broadens the scope of self-a�rmation. Past research mainly fo-
cused on curbing aversive responses in the context of imminent identity threat; often the
e↵ect of self-a�rmation was present only when individuals felt threatened (Sherman and
Cohen 2006). Self-a�rmation seemed to have little impact on behavior in the absence
of a threat to self-concept. In one study that directly tested the e↵ect of self-a�rmation
on improving problem-solving performance, the e↵ect existed only in chronically stressed
individuals (Creswell et al. 2013). However, the present research shows that social af-
firmation can increase performance outcomes at individual and group levels, even under
situations where threat to self is not clearly imposed, although it is possible that the percep-
tions of threat prior to the problem-solving task and crisis-simulation briefings may have
moderated the relationship between jolt and performance.
Fourth, this research deepens our understanding of how creating a point of reflection
for employees can benefit their relationships with others in the workplace. Because the
narratives that describe the focal individual come from various sources, they allow him or
her to draw from narratives that are not necessarily restricted to work-related strengths and
contributions. Rather, these narratives broaden the range of self-defining moments such
122

Chapter 4
that the focal individual can construct multiple identities beyond the professional (e.g., "I
am not only an employee of the corporation; I am also a daughter, mother, and a friend"). In
line with the research on positive identity construction (Dutton et al. 2010), positive inter-
personal jolts can spark changes in self-concept, thus creating an opportunity to reconstruct
a work-related identity that is aligned with one’s personal strengths and purpose. Although
performance evaluations could function as a negative, threatening jolt that produces a nega-
tive self-concept, managers could consider di↵erent forms of performance review that help
employees reflect on their positive relationships and contributions. Thus, this research has
implications for how organizations communicate with their employees to foster motivation
and engagement and to give them an opportunity to learn and grow from these relationships.
4.4.2 Limitations and Venues for Future Research
First, although current employees who have at least 3 years of work experience were re-
cruited, it is possible that only those who had positive and meaningful social relationships
participated, since this study required participants to identify and reach out to potential
narrative providers. Individuals who did not want to participate in this exercise may have
di↵erent characteristics from those who did. Study 2 did not have the same problem be-
cause senior executives had already confirmed their participation with the executive educa-
tion program and then were asked to identify their narrative providers. However, holding
a leadership position in their respective organizations may also be associated with having
more contacts who may be willing to write best-self stories. Future studies can address this
problem by asking participants who opted out to participate in the study as an additional
control group (intent-to-treat).
Second, this research may not be generalizable to the di↵erent organizational settings,
123

Chapter 4
as the two studies were conducted either in the laboratory or in the classroom. In the or-
ganizational setting, specific organizational norms or contexts may play a significant role
in modulating the role of positive interpersonal jolts in enhancing employees’ health and
performance. Some work by design may not allow employees su�cient autonomy to use
their strengths even if these strengths have been identified. In addition, the work groups
in existing organizations may have fixed hierarchical structures and be assigned particular
roles, which may leave little room for each individual to contribute beyond his or her as-
signment. The ad hoc work groups in Study 2 were rather flat in terms of hierarchy, and
have much more flexibility in assigning roles. Thus, future research could be conducted in
the organizational setting to explore the far-reaching interpersonal and intergroup benefits
as well as the impact on organizational outcomes (e.g., employee absenteeism, attrition,
customer satisfaction, and business profits). Furthermore, future work could identify the
boundary conditions under which the e↵ect of positive interpersonal jolts is reduced, or
may even backfire.
Third, the two studies compared positive interpersonal jolts with a control condition. In
Study 1, individuals who were assigned to the treatment condition identified and contacted
their narrative providers prior to the laboratory study and engaged in the writing exercise
based on the stories they received. Control participants, however, did not interact with
their social network, nor did they have a chance to reflect on their strengths, but instead
wrote about their daily routines. Similarly, in Study 2, individuals who were assigned to
the control groups engaged in a writing exercise about leadership communications. It is
possible that these control conditions induced an aversive psychological state, which could
have biased the results. Future studies can delineate the e↵ect of positive interpersonal jolts
by comparing a condition in which participants identify their own strengths and write about
124

Chapter 4
them and a condition that simply focuses on positive autobiographical memories. This will
clearly delineate whether this jolt e↵ect can be driven by ordinary positive memories or by
self-defining memories that involve abstract and higher-level construal.
Fourth, future research should address the potential negative outcomes of social-a�rmation
interventions. For example, it is possible that this intervention may lead individuals to
engage in self-enhancing thoughts and positive illusions, leaving them vulnerable to self-
serving biases such as overconfidence (Taylor and Brown 1988). Future studies should
explore the potential danger of social a�rmation in decision-making tasks, in which self-
serving biases can lead to suboptimal outcomes. At the group level, a heightened sense of
group cohesion may also lead to an escalation of commitment to a losing course of action
(Thompson et al. 1998). Given that a�rming on decision-relevant traits (vs. traits that were
of low relevance) was shown to increase escalation of commitment to a losing course of
action (Sivanathan et al. 2008), future studies could examine the e↵ect of specific domains
of traits and values that are being a�rmed. Thus, future work could identify the boundary
conditions under which the e↵ect of positive interpersonal jolts is reduced, or may even
backfire.
4.4.3 Conclusion
Organizational scholars have become increasingly aware of the importance of human phys-
iological processes in the workplace. Much of this work has focused on how workplace
stressors (such as high job demands, burnout, and interpersonal/relational stresses) reduce
productivity through higher rates of absenteeism among employees and rising health-care
costs incurred by employers (Ganster 2005; Greenberg 2010; Halpern 2005; Zellars et al.
2009). There is, however, a relative dearth of research on how positive workplace in-
125

Chapter 4
terventions could lead to better physiological function and improved overall health and
productivity.
I argue that rigorous empirical tests of such interventions can significantly improve
the way organizations recruit, hire, and develop their employees. This research identi-
fied a low-cost intervention that enables organizations to institute high-impact changes that
improve employees’ psychological resilience, physical health, productivity, and organiza-
tional performance. This intervention would allow employers and employees to capitalize
on their psychosocial resources and align their strengths closely with the work they do.
This research suggests that positive interpersonal jolts may lead to an upward spiral, in
which the jolt increases teams’ relational coordination and performance. Such positive
team dynamics rea�rm the employee’s core strength.
126

Appendix A
A.1 Moral Dilemma Scenario (Study 1)
You are the Chief Medical Director at a charity hospital in Deeg, a poor slum community
in the Rajasthan region of India. You are confronted with an important decision regarding
how to allocate hospital funds. One of the patients at the hospital is a five year-old little boy
named Ravi, who needs a rare and extremely expensive ($2 million) transplant operation to
save his life. The only available funds are the $2 million that has already been set aside to
purchase better equipment over the next five years for the transplant department. In the long
run, these purchases will save the lives of 200 future patients from the Rajasthan region.
Presented with the choice, you have to decide whether to use $2 million to save Ravi’s
life, or to use it for other hospital needs. The transplant department is knocking your door
right now and you need to notify your decision whether or not to approve the transplant
request. What is your decision?
1) Approve the transplant request.
2) Deny the transplant request.
127

Appendix A
A.2 High-conflict, Personal Moral Dilemmas (Study 2a)
Euthanasia
You are the leader of a small group of soldiers. You are on your way back from a completed
mission deep in enemy territory when one of your men has stepped in a trap that has been
set by the enemy and he is badly injured. The trap is connected to a radio device that by
now has alerted the enemy to your presence. They will soon be on their way. If the enemy
finds your injured man they will torture him and kill him. He begs you not to leave him
behind, but if you try to take him with you your entire group will be captured. The only way
to prevent this injured soldier from being tortured is to shoot him yourself. Is it appropriate
for you to shoot this soldier in order to prevent him from being tortured by the enemy?
Vaccine Test
A viral epidemic has spread across the globe killing millions of people. You have developed
two substances in your home laboratory. You know that one of them is a vaccine, but you
don’t know which one. You also know that the other one is deadly. Once you figure out
which substance is the vaccine you can use it to save millions of lives. You have with you
two people who are under your care, and the only way to identify the vaccine is to inject
each of these people with one of the two substances. One person will live, the other will
die, and you will be able to start saving lives with your vaccine. Is it appropriate for you to
kill one of these people with a deadly injection in order to identify a vaccine that will save
millions of lives?
128

Appendix A
Vitamins
You are the leader of a mountaineering expedition that is stranded in the wilderness. Your
expedition includes a family of six that has a genetically caused vitamin deficiency. A few
people’s kidneys contain large amounts of this vitamin. There is one such person in your
party. The only way to save the lives of the six members of this family is to remove one of
this man’s kidneys so that the necessary vitamins may be extracted from it. The man will
not die if you do this, but his health will be compromised. The man is opposed to this plan,
but you have the power to do as you see fit. Is it appropriate for you to forcibly remove this
man’s kidney in order to save the lives of the six vitamin-deficient people?
Sacrifice
You, your husband, and your four children are crossing a mountain range on your return
journey to your homeland. You have inadvertently set up camp on a local clan’s sacred
burial ground. The leader of the clan says that according to the local laws, you and your
family must be put to death. However, he will let yourself, your husband, and your three
other children live if you yourself will kill your oldest son. Is it appropriate for you to kill
your oldest son in order to save your husband and your other three children?
Sophie’s Choice
You, your husband, and your four children are crossing a mountain range on your return
journey to your homeland. You have inadvertently set up camp on a local clan’s sacred
burial ground. The leader of the clan says that according to the local laws, you and your
family must be put to death. However, he will let yourself, your husband, and your three
129

Appendix A
other children live if you yourself will kill your oldest son. Is it appropriate for you to kill
your oldest son in order to save your husband and your other three children?
A.3 High-conflict, Personal Moral Dilemmas (Study 3)
Crying Baby
Enemy soldiers have taken over your village. They have orders to kill all remaining civil-
ians. You and some of your townspeople have sought refuge in the cellar of a large house.
Outside you hear the voices of soldiers who have come to search the house for valuables.
Your baby begins to cry loudly. You cover his mouth to block the sound. If you remove
your hand from his mouth his crying will summon the attention of the soldiers who will
kill you, your child, and the others hiding out in the cellar. To save yourself and the others
you must smother your child to death.
Which option would you choose?
1) I do not smother my child to death.
2) I smother my child to death.
Sophie’s Choice [same as in Study 2]
Which option would you choose?
1) I refuse to bring one of my children.
2) I bring one of my children to his laboratory.
130

Appendix A
Euthanasia [same as in Study 2]
Which option would you choose?
1) I do not shoot him myself.
2) I shoot him myself.
Vitamins [same as in Study 2]
Which option would you choose?
1) I do not remove this man’s kidney.
2) I remove the man’s kidney.
A.4 Congruent vs. Incongruent Moral Dilemmas (Study 4;
Conway & Gawronsky, 2013)
Car Acci-
dent
incon-
gruent
You are driving through a busy city street when all
of a sudden a young mother carrying a child trips
and falls into the path of your vehicle. You are
going too fast to break in time; your only hope is
to swerve out of the way. Unfortunately, the only
place you can swerve is currently occupied by a
little old lady. If you swerve to avoid the young
mother and baby, you will seriously injure or kill
the old lady.
Is it appropriate to
swerve and hit the
old lady in order
to avoid the young
mother and child?
131

Appendix A
Car Acci-
dent
con-
gruent
You are driving through a busy city street when all
of a sudden a young mother carrying a child trips
and falls into the path of your vehicle. You are
going too fast to break in time; your only hope
is to swerve out of the way. Unfortunately, the
only place you can swerve is currently occupied
by a group of children on their way to elementary
school. If you swerve to avoid the young mother
and baby, you will seriously injure or kill several
of them.
Is it appropriate to
swerve and hit the
schoolchildren in
order to avoid the
young mother and
child?
Crying
Baby
incon-
gruent
It is war time. Enemy soldiers have taken over
your village. They have orders to kill all remain-
ing civilians. You and some of your townspeople
have sought refuge in the cellar of a large house.
Outside you hear the voices of soldiers who have
come to search the house for valuables. A baby
with no parents begins to cry loudly. You cover
her mouth to block the sound. If you remove your
hand from the baby’s mouth her crying will sum-
mon the attention of the soldiers who will kill you
and the others hiding out in the cellar. To save
yourself and the others you must smother the child
to death.
Is it appropriate for
you to smother the
child in order to
save yourself and
the other towns-
people from being
killed?
132

Appendix A
Crying
Baby
con-
gruent
It is war time. Enemy soldiers have taken over
your village. They have orders to capture all re-
maining civilians to make them work quarrying
stone in a mine. You and some of your towns-
people have sought refuge in the cellar of a large
house. Outside you hear the voices of soldiers
who have come to search the house for valuables.
A baby with no parents begins to cry loudly. You
cover her mouth to block the sound. If you re-
move your hand from her mouth the crying will
summon the attention of the soldiers who will
capture you and the others hiding out in the cellar.
To save yourself and the others from laboring in
the mine you must smother the child to death.
Is it appropriate for
you to smother the
child in order to
save yourself and
the other townspeo-
ple from being cap-
tured?
Abortion incon-
gruent
You are a surgeon. A young woman you know be-
comes pregnant, but her body reacts in an unusual
fashion. She develops a severe case of preeclamp-
sia, a dangerous syndrome that leads to rapid in-
creases in blood pressure. The only treatment is
to deliver the baby. Unless the baby is delivered
soon, the mother will die. However, the baby is
too young to survive on its own. If it is delivered,
it will die. So, although it is very di�cult for her,
the mother asks you to abort the baby.
Is it appropriate for
you to perform an
abortion in order to
save the mother’s
life?
133

Appendix A
Abortion con-
gruent
You are a surgeon. A young woman you know be-
comes pregnant, but she is not yet ready for chil-
dren. She has not finished high school, has no in-
come, and was abandoned by the father. If she has
the baby now, she will be stuck as a single mother
on welfare for the rest of her life. This will make
things very hard on her and the baby. She thinks
that it would be smarter to wait and have children
later. So, although it is very di�cult for her, she
asks you to abort the baby.
Is it appropriate for
you to perform an
abortion in order to
let the mother live a
better life?
Torture incon-
gruent
You are a police o�cer, and have recently caught
a criminal you have been hunting for some time.
He is allegedly responsible for rigging a series of
explosive devices: some that have already gone
o↵ and some that have yet to detonate. He places
explosives outside city cafes and sets them to
go o↵ at a time when people are drinking cof-
fee on the patios. In this manner, he has in-
jured many people and might injure many more.
Now that the criminal is in custody, you want to
know where the unexploded bombs are so you can
defuse them. He refuses to talk, so you decide
to use “aggressive interrogation techniques” like
holding his head under water and beating him.
Is it appropri-
ate for you to
use “aggressive
interrogation tech-
niques” in order
to find and defuse
the unexploded
bombs?
134

Appendix A
Torture con-
gruent
You are a police o�cer, and have recently caught
a criminal you have been hunting for some time.
He is allegedly responsible for rigging a series of
explosive devices: some that have already gone
o↵ and some that have yet to detonate. He places
explosives outside city cafes and sets them to go
o↵ at a time when no one is around. His ex-
plosives are inside paint cans so that they spray
nearby objects with paint. In this manner, he has
sprayed many cafes with paint and might spray
many more. Now that the criminal is in custody,
you want to know where the unexploded bombs
are so you can defuse them. He refuses to talk, so
you decide to use “aggressive interrogation tech-
niques” like holding his head under water and
beating him.
Is it appropri-
ate for you to
use “aggressive
interrogation tech-
niques” in order
to find and defuse
the unexploded
bombs?
Vaccine
Policy
incon-
gruent
You are a doctor in a health clinic overrun by pa-
tients with a serious disease. You just received
a shipment of drugs that can cure the disease but
the drugs have their own severe side e↵ects. If
you administer the drugs to your patients, a small
number will die from the side e↵ects but most will
live. If you do not, most will die from the disease.
Is it appropriate for
you to administer
the drug to your pa-
tients?
135

Appendix A
Vaccine
Policy
con-
gruent
You are a doctor in a health clinic overrun by
patients with the latest flu virus. You just re-
ceived a shipment of drugs that can cure the flu
but the drugs have their own severe side e↵ects. If
you administer the drugs to your patients, a small
number will die from the side e↵ects but most will
live. If you do not, most will continue to su↵er
from the e↵ects of the flu virus for some time.
Is it appropriate for
you to administer
the drug to your pa-
tients?
Animal
Research
incon-
gruent
You have been hired by a pharmaceutical com-
pany to conduct research on their products. Since
products must be fit for human use, they are first
tried out on animals. Your job is to find out the
e↵ects various chemicals have on rats, pigeons,
rabbits, and monkeys. Most chemicals have only
minor e↵ects on the animals, but some cause
them discomfort or even permanent damage. The
chemicals you are researching are slated to form
part of a new AIDS drug cocktail that will give
new hope to millions of AIDS victims around the
world. You anticipate saving many lives with the
chemicals.
Is it appropriate to
test these chemicals
on animals?
136

Appendix A
Animal
Research
con-
gruent
You have been hired by a pharmaceutical com-
pany to conduct research on their products. Since
products must be fit for human use, they are first
tried out on animals. Your job is to find out the
e↵ects various chemicals have on rats, pigeons,
rabbits, and monkeys. Most chemicals have only
minor e↵ects on the animals, but some cause
them discomfort or even permanent damage. The
chemicals you are researching are slated to form
part of a new acne facial cleanser that will give
new hope to people with pimples and greasy skin.
You anticipate making many people feel better
about their appearance with the chemicals.
Is it appropriate to
test these chemicals
on animals?
137

Appendix B
B.1 Instructions and Materials for the Online Task (Study 2)
“Please read the short essay with three paragraphs that contain spelling errors. Note that
some lines may have a word with an error, but some may not. Please find as many errors
as you can on each line, and write it down in each corresponding box. For example, if you
saw an error on the 3rd line, you can write down what the incorrect word is, and how it
needs to be changed. For example, [Febraury!February].”
Many academics have writtten about professional ethics; however, there
has been relatively little study on the question of how and to what degree ethics
in one profession clash with the ethics of another, or with the generally acepted
social ethics. For many lines of work, there is little variance between the ac-
cepted moral standrads of the profession and the surrounding culture and in-
stiutions. Typically the variance is a subtle matter of degree or a di↵erence
in the priorites assigned to particular duties or funtions. It is a di↵erence of
emphasis, not substance.
Consider the example of medical ethics. Hippocrates cultvated a requsite
code for the medical profession requiring confidentiality in the doctor-patient
138

Appendix B
relationship. A refusal to divurge another person’s most private matters is a
moral standard to which all citizens are considered to be bound, but physicians
are expected to follow this standard more stringently to ensure the trust of their
pateints who must divulge all matter of secrets to allow a proper diagosis. A
doctor’s code of ethics also requires using medical expertise only for the good
of patients. This is expected of everybody, but is especially true of a doctor who
has an unusual capacity to do harm. Likewise, while all of us are expected to be
truthful, a colleege professor must take special care in delivering information
to students.
Do the same circomstances apply to the pursuit of profit? Since the begin-
ning of the world trade route, writers have asserted the benefits of commerce
in their zeal to promote the role of the middel class in a benevolent society.
Trade encuraged the exchange of ideas and culture among disparate people,
fostering understanding and tolerance. Trade made di↵erent societies aware of
their interdependence. Although principles of generosity and sharing are not
generaly advanced by trade, justice and eqaulity are. Still, while many were
quick to laud the advanteges of commerce, many eighteenth century moralists
pointed out contradictions between the teachings of the dominant world reli-
gions and the rules of trade. Today, there are many practices often admisible in
the pursiut of monetary gain that would meet with stern disapproval in society
at large. The unspoken rules of partecular professions are pitted against wider
cultural mores. Durkheim points to a conflict between a soldeir who must be
obedient to a hierarchical command structure and a scientist whose moral duty
is to question entranched authority.
139
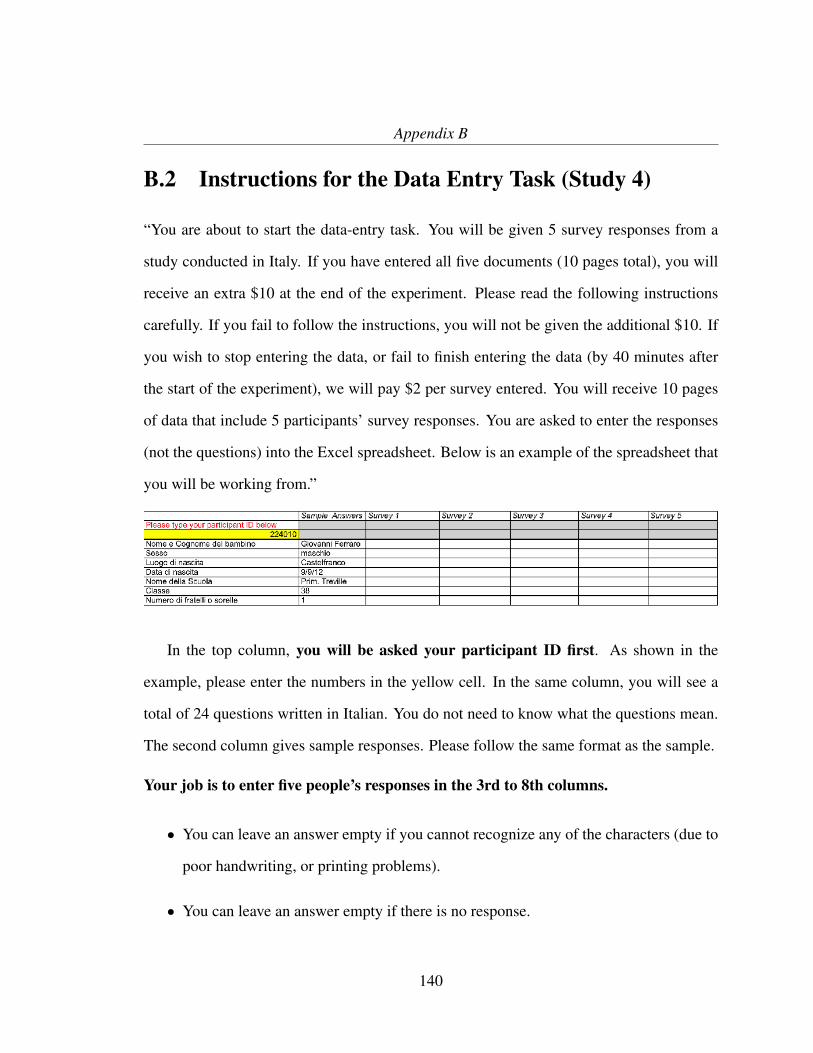
Appendix B
B.2 Instructions for the Data Entry Task (Study 4)
“You are about to start the data-entry task. You will be given 5 survey responses from a
study conducted in Italy. If you have entered all five documents (10 pages total), you will
receive an extra $10 at the end of the experiment. Please read the following instructions
carefully. If you fail to follow the instructions, you will not be given the additional $10. If
you wish to stop entering the data, or fail to finish entering the data (by 40 minutes after
the start of the experiment), we will pay $2 per survey entered. You will receive 10 pages
of data that include 5 participants’ survey responses. You are asked to enter the responses
(not the questions) into the Excel spreadsheet. Below is an example of the spreadsheet that
you will be working from.”
In the top column, you will be asked your participant ID first. As shown in the
example, please enter the numbers in the yellow cell. In the same column, you will see a
total of 24 questions written in Italian. You do not need to know what the questions mean.
The second column gives sample responses. Please follow the same format as the sample.
Your job is to enter five people’s responses in the 3rd to 8th columns.
• You can leave an answer empty if you cannot recognize any of the characters (due to
poor handwriting, or printing problems).
• You can leave an answer empty if there is no response.
140

Appendix C
141

Appendix C
C.1 Treatment Booklet
Reflected Best Self Exercise
In this exercise, you will be asked to write your best-self stories. All responses will remain strictly confidential. Only you will have access to your own stories.
142

Appendix C
2
While you’re waiting for your stories from respondents, please engage in deeper personal reflection about times when you believe you were at your best. You will analyze your own best-self stories, and the analysis will be part of your final reflected best-self portrait.
Step I. Write Your Own Best-Self Stories
1
Think about three times in
your life when you were at
your best. Allow yourself
to think of stories from all
contexts and time periods.
For three of these
memories, write a story
about what happened. In
the story you may choose
to describe the context,
the role you played, the
actions you took, the
characteristics you
displayed, the results, and
the reasons behind your
actions. The examples
and explanation in the
sample can be helpful.
2
Sample Story
I feel I was at my best helping
my organization create and
pursue a new vision. We had
been in existence for ten years
and had tried and learned so
many things along the way. I
believed in the organization’s
mission but wanted to move us
in a new direction to expand
our impact. I reflected on what
was possible and crafted a
vision of our team at our best. I
presented the vision to my
team and was delighted to
incorporate their ideas into
mine, thus creating something
entirely new in a way that
united the team.
143

Appendix C
3
Your turn: Pretend you received the story request you sent a while ago. Reflect about times when you were, and normally are, at your best and capture the stories that exemplify that time in the same space, document, or file that will eventually house the stories you receive from respondents.
Story I.
144

Appendix C
4
Story II.
145

Appendix C
5
Story III.
Now, please go back to the computer screen, press CONTINUE, and follow the instructions.
146

Appendix C
6
Step II. Read Your Best-Self Stories
Please first read each of your stories from respondents carefully. These are the stories that have been compiled for you. WARNING: Reading these stories can stir up a great deal of emotions for you. It is normal to find yourself surprised by how people saw you positively. When you have thought deeply about each of the stories, look for patterns and themes that emerge from considering the stories and analysis together. When you are ready, please turn to the next page.
147

Appendix C
7
Step III. Compose the Reflected
Best-Self Portrait
Create a portrait of your best-self that captures the wisdom in your personal and reflected best-self analysis. The portrait is meant to be an aggregated articulation of your personal and reflected best-self which you can refer to and revise well in to the future.
Sample Reflected Best-Self Portrait
When I am at my best, I tend to be creative. I am enthusiastic about
ideas and I craft bold visions. I am an innovative builder who perseveres
in the pursuit of the new. I do not waste energy thinking about missed
opportunities or past failures nor do I take on the negative energy of the
insecure or worry about critics. I stay centered and focused on what is
possible and important.
I use frameworks to help me make sense of complex issues. I can see
disparate ideas and integrate them. So I make points others do not
readily see. In doing so, I frame experiences in compelling and
engaging ways. I paint visions and provide new ways for people to see.
I use metaphors and stories to do this. I find the stories in everyday
experiences, and people find it easy to understand them. The new
images that follow help people to take action.
In helping others, I try to empathize with them and understand their
needs. I give them my attention and energy but I allow them to be in
charge. In exercising influence, I try to enroll people, not force them, in
new directions. I invite people to work with me. I use dialog to help
people surface their ideas, and then I weave them together with others
until we create knowledge in real time. I ignore symptoms and focus on
deep causes. I help people and groups surface the darkest realities
and the most painful conflicts. From these emergent tensions comes the
energy for transformation, I liberate people from their fears and help
them embrace new paths. In all of this, I try to model the message of
integrity, growth, and transformation.
148

Appendix C
8
Reflected
Best-Self Portrait
Please feel free to take this booklet as well as the respondents’ stories with you. Now, please go back to the computer screen, press CONTINUE, and follow the instructions.
149

Appendix C
C.2 Control Booklet
Writing Exercise
In this exercise, you will be asked to write about your daily activities. All responses will remain strictly confidential. Only you will have access to your own stories.
150
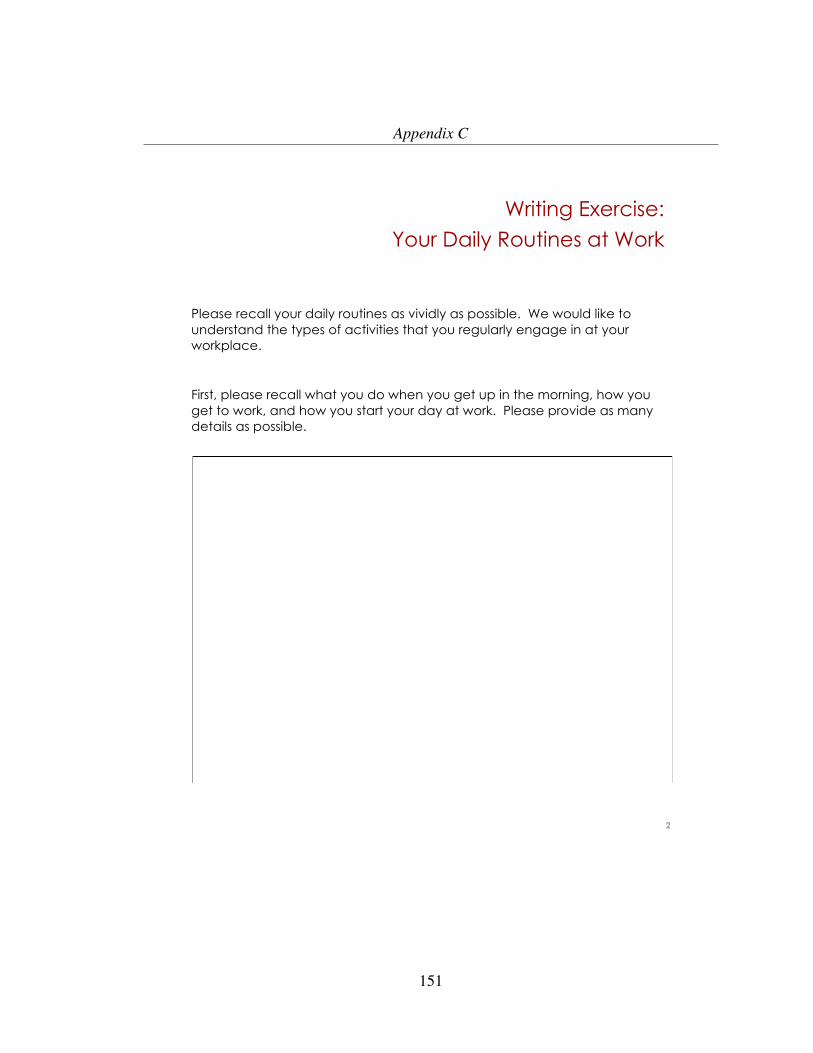
Appendix C
2
Please recall your daily routines as vividly as possible. We would like to understand the types of activities that you regularly engage in at your workplace.
First, please recall what you do when you get up in the morning, how you get to work, and how you start your day at work. Please provide as many details as possible.
Writing Exercise: Your Daily Routines at Work
151

Appendix C
3
Second, please recall what you do during your normal work hours. What are the responsibilities you have at work? Please provide as many details as possible.
152

Appendix C
4
Third, please recall what you do after you are done with work. What do you normally do when you return home until you go to bed? Please provide as many details as possible.
Please feel free to take this booklet with you. Now, please go back to
the computer screen, press CONTINUE, and follow the instructions.
153

Appendix C
C.3 Sample Email from the Senior Executive Fellows Pro-
gram
Dear Participant, As a participant in the Senior Executive Fellows (SEF) program at Harvard Kennedy School, we ask that you participate in a 360 degree assessment prior to your arrival in Cambridge. The instrument we employ is the 1Self Assessment. The assessment is distributed by Essentic, a small UK-based firm. The 1Self assessment focuses in particular on how you can foster excellence by identifying and harnessing your unique strengths. For the External Assessment, you will be asked to nominate a minimum of 5-10 individuals to provide feedback in the form of brief stories - accounts of times when you were at your very best, when you made a positive and lasting impact on people and situations. This will be of greatest value to you if at least five stories come from those in your professional life- professional colleagues, mentors, superiors and subordinates. We encourage you to ask friends or family members, who know you in a different context and whose stories can supplement feedback from the professional world. The goal is to focus on your strengths and unique contribution. These stories should be brief accounts (approximately 250 words or less). For the Self Assessment, you will be asked for your own account of when you are at your personal best. Your External Assessment and Self Assessment will be combined into a report which you alone will receive. Neither Harvard nor Essentic retains any of your information. It is collected, collated and provided only to you. During the program, we will discuss the theory and research underlying this approach and how to interpret the results. You will be contacted separately by Essentic, the provider of the 1Self Assessment by Thursday, March 27. They will send detailed instructions for accessing and completing the 1Self. Please add [email protected] to your email contacts/address book to ensure the mail reaches your inbox. More information on 1Self is available through the Essentic website: www.essentic.com We look forward to seeing you in Cambridge! Senior Executive Fellows Program Team Harvard Kennedy School
154

Appendix C
C.4 Sample Best-Self Report
1Self Signature Strengths Assessment for Sample Report
A new lens into who you are when you’re at your best
155
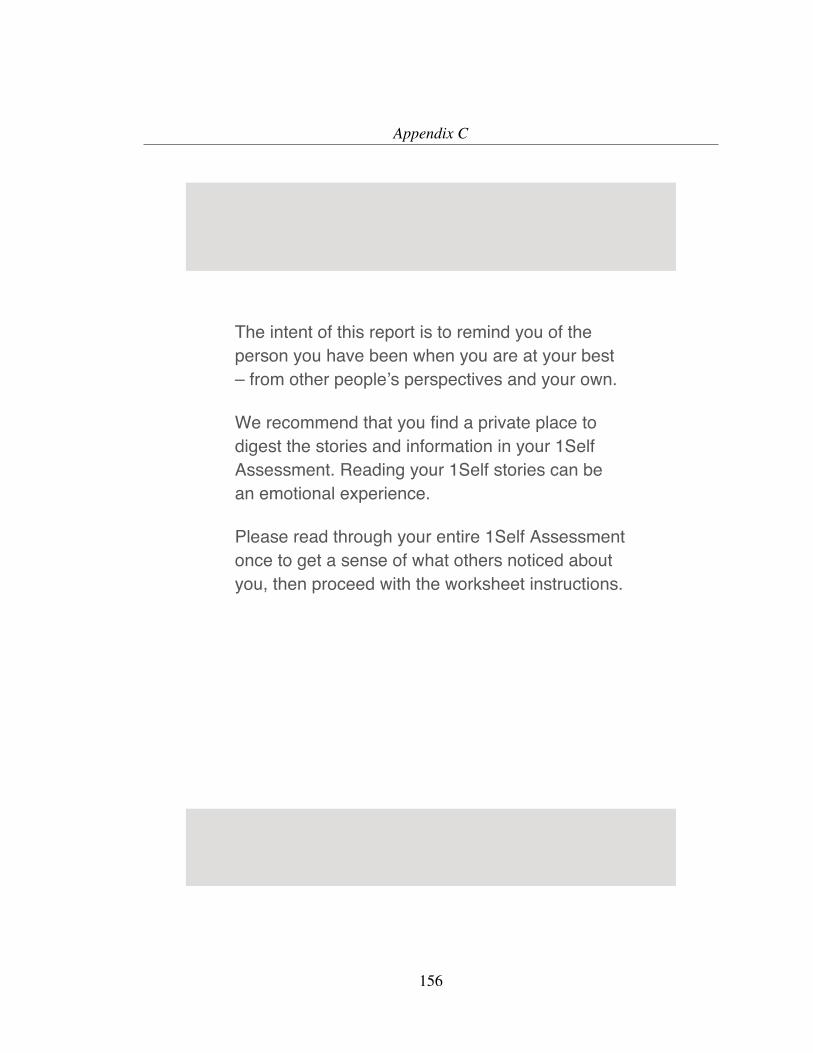
Appendix C
The intent of this report is to remind you of theperson you have been when you are at your best– from other people’s perspectives and your own.
We recommend that you find a private place todigest the stories and information in your 1SelfAssessment. Reading your 1Self stories can bean emotional experience.
Please read through your entire 1Self Assessmentonce to get a sense of what others noticed aboutyou, then proceed with the worksheet instructions.
156
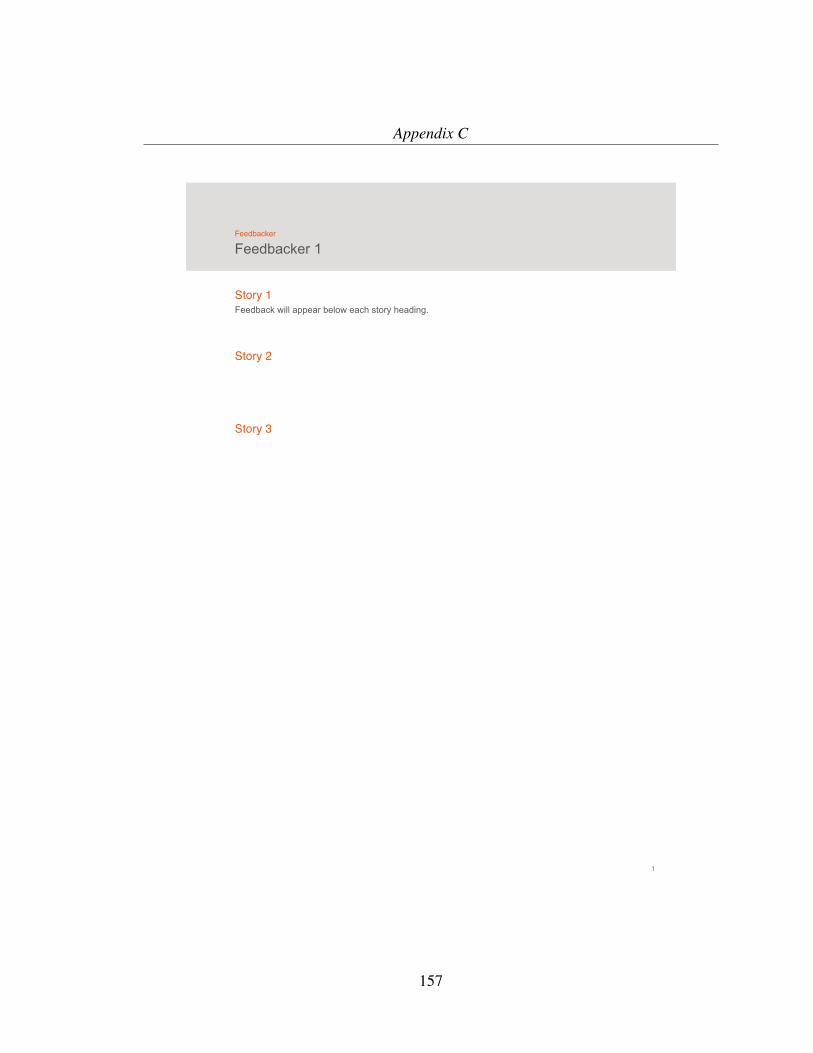
Appendix C
Feedbacker
Feedbacker 1
1
Story 1Feedback will appear below each story heading.
Story 2
Story 3
157

Appendix C
Feedbacker
Feedbacker 2
2
Story 1Feedback will appear below head story heading.
Story 2
Story 3
158

Appendix C
Feedbacker
Feedbacker 3
3
Story 1Feedback will appear below each story heading
Story 2
Story 3
159

Appendix C
Self Assessment: You at Your Best
4
Story 1Participants Self Assessment text will appear below each story heading.
Story 2
Story 3
160

Appendix C
C.5 Treatment Worksheet
STRENGTH-BASED LEADERSHIP ASSIGNMENT You do not have to turn in your 1Self report, or this booklet. However, please keep in mind that this booklet is to help you refresh your memories for future discussions. We ask you to spend 30 minutes filling it out. Please do not discuss any details about this assignment. Reflecting Upon Your Core Strength Now, please read through your 1Self report a second time. In particular, think about the signature strengths and themes which emerge from each story. Please search for patterns across your report. You may be surprised by signature strengths and events which did not seem so important to you, but touched others consistently. Patterns Across Your Feedback Read all of your feedback and take notes on the key insights. Look for commonalities across the responses. Create themes where you find a commonality and link any relevant examples to it. The themes can include: strengths you displayed during these episodes, emotions you experienced during these episodes, and how others experienced you at your best. You may find it useful to fill in the table below. Commonality/Theme Examples Given My Interpretation Creative
1. Innovative builder of new projects for education. 2. Find new solutions for old problems in department relationships with my boss. 3. Guided company in transforming itself.
My ideas tend to be bold and creative. I am an innovative builder of the new. I tend to bring a new vision to the old.
161

Appendix C
162

Appendix C
Characteristics of Your Core Strength
Your goal now is to integrate the evidence across your sources and develop a statement of the person you are when you are at your best. This is your 1Self Statement, and you may find you come back to it when you need to ignite energy, unleash innovation or need courage to use your signature strengths and be your best more often.
163

Appendix C
C.6 Control Worksheet
LEADERSHIP OBSERVATION ASSIGNMENT You do not have to turn in this assignment. However, please keep in mind that this booklet is to help you refresh your memories for future discussions. We ask you to spend 30 minutes filling it out. Please do not discuss any details about this assignment. Reflecting Upon Communication Experience Effective communication is essential to the success of any organization. Good communication can lead to extraordinary performance even for small or poorly equipped organizations, and poor communication can be devastating even for the most well established organizations. Think about three times in your career when you observed a leader’s impressive communication success, or a leader’s communication failure. For each episode, write the story of what happened, including how the episode got started, what kept it going, and how it came to an end. Episode 1:
164

Appendix C
Episode 2:
Episode 3:
165

Appendix C
Characteristics of Communication
Review the three episodes you just described and search for patterns of behavior and experience that emerged in the episodes. What strengths did a leader display during these episodes?
What weaknesses did a leader display during these episodes?
What emotions did you experience during these episodes?
166

Appendix C
Communication in your Organization
Combine your observations about the three episodes into a written summary that captures what you think are the most important aspects of communication. Read all of your observations and take notes on the key insights. Look for commonalities across the episodes. Create themes where you find a commonality and link any relevant examples to it. Then, explain how these insights can be tied to the communication structure of your current organization. Write your summary here: Commonality/Theme Examples Given My Interpretation
167

Appendix C
C.7 MERS Assignment
Senior Executive Fellows Program October 2014
You are a member of a small interagency team (composed of members of your SEF discussion group) working in Massachusetts state government. With the discovery of a dangerous coronavirus here in the Commonwealth, the Governor’s chief of staff has contacted your team leader and tasked the group to monitor progress of the virus, assess the threat to public health and safety, identify options for action by public health and emergency management authorities, and recommend a preferred course of action. You should complete your assessment prior to Friday, October 24. The chief of staff explains that the Bay State Medical Center in Springfield, MA admitted two patients Saturday evening with intense flu like symptoms. Both were in respiratory distress. As it happened there was a young Saudi medical doctor working in the Bay State Emergency Room as part of his medical residency. He suggested that the patients might be suffering from the!Middle East Respiratory Syndrome (MERS-CoV), a rare, recently discovered coronavirus, heretofore only seen in the Middle East, with a few cases in Europe. Massachusetts Public Health Commissioner Cheryl Bartlett spoke this morning with Dr Tom Frieden, Director of the US Center for Disease Control (CDC), the nation’s leading public health agency. Dr Frieden shared with Commissioner Bartlett what is known about MERS-CoV and confirmed that the two cases in Springfield are MERS CoV or a closely allied strain. They agreed that they would collaborate on public statements concerning MERS, particularly important in light of the many misleading, alarming and misinformed reports in today’s media concerning Ebola and Enterovirus-68. On Friday morning, October 24, you will conduct a formal oral briefing of the Governor’s top executives and staff (the Commissioner of the Department of Public Health, the Director of the Massachusetts Emergency Management Agency, and the Governor’s director of communications and political advisor) on your assessment and recommendations for state action. The chief of staff asks that you highlight any specific actions involving the Governor, and that with all recommendations, you should be as specific as possible about timing, sequence, and future contingencies.
**** Between now and the day of the briefing, SEF participants will receive periodic news briefs and announcements from public health agencies about events in the developing epidemic. This material and other information that discussion group members may gather should be incorporated in your group’s work on this assignment.
168
Appendix C
On Friday, the 24th, each SEF discussion group team will conduct its briefing before a panel of Harvard faculty and actual senior state officials from the relevant departments. Review panel members will rate and critique each discussion group’s briefing individually following each presentation. They will also provide substantive comments on the potential epidemic and their overall impressions of the simulated briefings in full SEF sessions in the late morning and after lunch.
169

Appendix C
C.8 Sample Evaluation Sheet for Expert Panel
Team Name/Number: _____________________________
Evaluation of Team Presentation The purpose of evaluating the presentation is to recognize strengths and identify areas of needed improvement. Please evaluate the presentation using the items listed below and circling the appropriate rating level. You are also encouraged to use the space provided to include comments that support your ratings.
1
Needs Improve
ment
2 3 4
5
6 7 Excellent
Effectiveness of overall presentation
• Did the presentation have a logical structure appropriate for the topic?
• Did the presenter(s) provide convincing support for his/her recommendations?
1 2 3 4 5 6 7
Overall team cohesiveness • Were other team members
attentive while presenter(s) spoke?
• Did the team show an ability to relate to each other?
1 2 3 4 5 6 7
Contents (1) -- Creativity • Did the team show creative
and innovative thinking in the policy recommendations?
1 2 3 4 5 6 7
Contents (2) – Clarity • Did the presenter(s) give
clear and concrete recommendations?
1 2 3 4 5
6 7
Contents (3) – Feasibility • Were the policy
recommendations realistic and feasible in terms of execution?
1 2 3 4 5 6 7
Overall value to the decision-maker
1 2 3 4 5 6 7
170

Bibliography
Aldrich, D. and Kage, R. (2003). Mars and Venus at twilight: A critical investigation ofmoralism, age e↵ects, and sex di↵erences. Political Psychology, 24(1):23–40.
Amabile, T. M., Barsade, S. G., Mueller, J. S., and Staw, B. M. (2005). A↵ect and creativityat work. Administrative Science Quarterly, 50(3):367–403.
Amit, E. and Greene, J. D. (2012). You see, the ends don’t justify the means: Visualimagery and moral judgment. Psychological Science, 23(8):861–868.
Asghar, R. (2014). Why happiness is sweeping the American workplace.Retrieved from http://www.forbes.com/sites/robasghar/2014/10/22/why-touchy-feely-mindfulness-is-sweeping-the-american-workplace/.
Ashby, F. G., Isen, A. M., and Turken, A. U. (1999). A neuropsychological theory ofpositive a↵ect and its influence on cognition. Psychological Review, 106(3):529–550.
Ashforth, B. (2000). Role Transitions in Organizational Life. Routledge.
Bailey, B. and Konstan, J. (2006). On the need for attention-aware systems: Measuringe↵ects of interruption on task performance, error rate, and a↵ective state. Computers inHuman Behavior, 22(4):685–708.
Bartels, D. M. (2008). Principled moral sentiment and the flexibility of moral judgmentand decision making. Cognition, 108(2):381–417.
Baumeister, R. F., Bratslavsky, E., Finkenauer, C., and Vohs, K. D. (2001). Bad is strongerthan good. Review of General Psychology, 5(4):323–370.
Bazhenova, O. V., Plonskaia, O., and Porges, S. W. (2001). Vagal reactivity and a↵ectiveadjustment in infants during interaction challenges. Child Development, 72(5):1314–1326.
Beauchaine, T. (2001). Vagal tone, development, and Gray’s motivational theory: Towardan integrated model of autonomic nervous system functioning in psychopathology. De-velopment and Psychopathology, 13(2):183–214.
171

Bibliography
Berdahl, J. L. (2007). Harassment based on sex: Protecting social status in the context ofgender hierarchy. Academy of Management Review, 32(2):641–658.
Blair, R. J. R. (1995). A cognitive developmental approach to morality: Investigating thepsychopath. Cognition, 57(1):1–29.
Blascovich, J. and Tomaka, J. (1996). The biopsychosocial model of arousal regulation.Advances in Experimental Social Psychology, 28:1–51.
Bonanno, G. A. and Keltner, D. (1997). Facial expressions of emotion and the course ofconjugal bereavement. Journal of Abnormal Psychology, 106(1):126–137.
Bonanno, G. A., Papa, A., Lalande, K., Westphal, M., and Coifman, K. (2004). The impor-tance of being flexible. Psychological Science, 15(7):482–487.
Bond, S. A., Tuckey, M. R., and Dollard, M. F. (2010). Psychosocial safety climate, work-place bullying, and symptoms of posttraumatic stress. Organization Development Jour-nal, 28:37–56.
Brabeck, M. M. and Shore, E. L. (2003). Gender di↵erences in intellectual and moral de-velopment? In Handbook of Adult Development, pages 351–368. Springer US, Boston,MA.
Bruner, J. S. (1990). Acts of Meaning. Harvard University Press.
Buckingham, M. and Clifton, D. O. (2001). Now, Discover Your Strengths.
Bush, L. K., Hess, U., and Wolford, G. (1993). Transformations for within-subject designs:A Monte Carlo investigation. Psychological Bulletin, 113(3):566–579.
Butler, E. A., Eglo↵, B., Wlhelm, F. H., Smith, N. C., Erickson, E. A., and Gross, J. J.(2003). The social consequences of expressive suppression. Emotion, 3(1):48–67.
Butler, E. A., Wilhelm, F. H., and Gross, J. J. (2006). Respiratory sinus arrhythmia, emo-tion, and emotion regulation during social interaction. Psychophysiology, 43(6):612–622.
Cable, D. M., Gino, F., and Staats, B. R. (2013). Breaking them in or eliciting their best?Reframing socialization around newcomers’ authentic self-expression. AdministrativeScience Quarterly, 58(1):1–36.
Cachon, G., Gallino, S., and Olivares, M. (2011). Severe weather and automobile assemblyproductivity. Working paper.
Cacioppo, J. T. and Patrick, W. (2009). Loneliness. W. W. Norton & Company.
172

Bibliography
Cameron, C. D. and Payne, B. K. (2011). Escaping a↵ect: How motivated emotion regula-tion creates insensitivity to mass su↵ering. Journal of Personality and Social Psychology,100:1–15.
Chen, C. B., Ryan, D. A., and Tudor-Locke, C. (2006). Relationship between objectivemeasures of physical activity and weather: A longitudinal study. International Journalof Behavioral Nutrition and Physical Activity, 3(21).
Ciaramelli, E., Muccioli, M., Ladavas, E., and di Pellegrino, G. (2007). Selective deficitin personal moral judgment following damage to ventromedial prefrontal cortex. SocialCognitive and A↵ective Neuroscience, 2(2):84–92.
Cogan, R., Cogan, D., Waltz, W., and McCue, M. (1987). E↵ects of laughter and relaxationon discomfort thresholds. Journal of Behavioral Medicine, 10(2):139–144.
Cohen, G., Garcia, J., Apfel, N., and Master, A. (2006). Reducing the racial achievementgap: A social-psychological intervention. Science, 313:1307–1310.
Cohen, G. L., Aronson, J., and Steele, C. M. (2000). When beliefs yield to evidence:reducing Biased evaluation by a�rming the self. Personality and Social PsychologyBulletin, 26(9):1151–1164.
Cohen, G. L., Garcia, J., Purdie-Vaughns, V., Apfel, N., and Brzustoski, P. (2009). Re-cursive processes in self-a�rmation: Intervening to close the minority achievement gap.Science, 324(5925):400–403.
Cohen, G. L., Sherman, D. K., Bastardi, A., Hsu, L., McGoey, M., and Ross, L.(2007). Bridging the partisan divide: Self-a�rmation reduces ideological closed-mindedness and inflexibility in negotiation. Journal of Personality and Social Psychol-ogy, 93(3):415–430.
Cohen, S., Tyrrell, D. A., and Smith, A. P. (1991). Psychological stress and susceptibilityto the common cold. New England Journal of Medicine, 325(9):606–612.
Connolly, M. (2008). Here comes the rain again: Weather and the intertemporal substitutionof leisure. Journal of Labor Economics, 26(1):73–100.
Conway, P. and Gawronski, B. (2013). Deontological and utilitarian inclinations in moraldecision making: A process dissociation approach. Journal of Personality and SocialPsychology, 104(2):216–235.
Cooper, J. and Duncan, B. L. (1971). Cognitive dissonance as a function of self-esteemand logical inconsistency. Journal of Personality, 39:289–302.
173

Bibliography
Côté, S. (1999). A↵ect and performance in organizational settings. Current Directions inPsychological Science, 8(2):65–68.
Creswell, J. D., Dutcher, J. M., Klein, W. M. P., Harris, P. R., and Levine, J. M. (2013).Self-a�rmation improves problem-solving under stress. PLoS ONE, 8(5):e62593.
Creswell, J. D., Lam, S., Stanton, A. L., Taylor, S. E., Bower, J. E., and Sherman, D. K.(2007). Does self-a�rmation, cognitive processing, or discovery of meaning explaincancer-related health benefits of expressive writing? Personality and Social PsychologyBulletin, 33(2):238–250.
Creswell, J. D., Welch, W. T., Taylor, S. E., Sherman, D. K., Gruenewald, T. L., andMann, T. (2005). A�rmation of personal values bu↵ers neuroendocrine and psycho-logical stress responses. Psychological Science, 16(11):846–851.
Crocker, J., Niiya, Y., and Mischkowski, D. (2008). Why does writing about importantvalues reduce defensiveness? Self-a�rmation and the role of positive other-directedfeelings. Psychological Science, 19(7):740–747.
Cunningham, M. (1979). Weather, mood, and helping behavior: Quasi experiments withthe sunshine Samaritan. Journal of Personality and Social Psychology, 37(11):1947–1956.
Cushman, F., Gray, K., Ga↵ey, A., and Mendes, W. B. (2012). Simulating murder: theaversion to harmful action. Emotion, 12(1):2.
Darr, W. and Johns, G. (2008). Work strain, health and absenteeism: A meta-analysis.Journal of Occupational Health Psychology, 13(4):293–318.
Davies, P. G., Spencer, S. J., and Steele, C. M. (2005). Clearing the air: Identity safetymoderates the e↵ects of stereotype threat on women’s leadership aspirations. Journal ofPersonality and Social Psychology, 88(2):276–287.
Davis, J. I., Senghas, A., Brandt, F., and Ochsner, K. N. (2010). The e↵ects of BOTOXinjections on emotional experience. Emotion, 10(3):433–440.
De Dreu, C. K. W., Baas, M., and Nijstad, B. A. (2008). Hedonic tone and activationlevel in the mood-creativity link: Toward a dual pathway to creativity model. Journal ofPersonality and Social Psychology, 94(5):739–756.
Deutsch, M. (1969). Socially relevant science: Reflections on some studies of interpersonalconflict. American Psychologist, 24(12):1076–1092.
DiPietro, J. A., Porges, S. W., and Uhly, B. (1992). Reactivity and developmental compe-tence in preterm and full-term infants. Developmental Psychology, 28:831–841.
174

Bibliography
Drigotas, S. M., Rusbult, C. E., and Wieselquist, J. (1999). Close partner as sculptor ofthe ideal self: behavioral a�rmation and the Michelangelo phenomenon. Journal ofPersonality and Social Psychology, 96:61–82.
Duncker, K. (1945). On problem-solving. Psychological Monographs, 58(5). Whole No.270.
Dutton, J. E. and Heaphy, E. D. (2003). The power of high-quality connections. PositiveOrganizational Scholarship: Foundations of a New Discipline, 3:263–278.
Dutton, J. E., Roberts, L. M., and Bednar, J. (2010). Pathways for positive identity con-struction at work: Four types of positive identity and the building of social resources.Academy of Management Review, 35(2):265–293.
Elsbach, K. D. (2003). Relating physical environment to self-categorizations: Identitythreat and a�rmation in a non-territorial o�ce space. Administrative Science Quarterly,48(4):622–654.
Estrada, C. A., Isen, A. M., and Young, M. J. (1994). Positive a↵ect improves creativeproblem solving and influences reported source of practice satisfaction in physicians.Motivation and Emotion, 18(4):285–299.
Feinberg, M., Willer, R., Antonenko, O., and John, O. P. (2012). Liberating reason fromthe passions: Overriding intuitionist moral judgments through emotion reappraisal. Psy-chological Science, 23(7):788–795.
Feltz, A. and Cokely, E. T. (2008). The fragmented folk: More evidence of stable individualdi↵erences in moral judgments and folk intuitions. In Proceedings of the 30th AnnualConference of the Cognitive Science Society, pages 1771–1776.
Figner, B. and Murphy, R. O. (2011). Using skin conductance in judgment and decisionmaking research. In Schulte-Mecklenbeck, M., Kuehberger, A., and Ranyard, R., editors,A Handbook of Process Tracing Methods for Decision Research, pages 163–184.
Fisher, C. D. (1998). E↵ects of external and internal interruptions on boredom at work:Two studies. Journal of Organizational Behavior, 19:503–522.
Flynn, E. A., Barker, K. N., Gibson, J. T., Pearson, R. E., Berger, B. A., and Smith, L. A.(1999). Impact of interruptions and distractions on dispensing errors in an ambulatorycare pharmacy. American Journal of Health-System Pharmacy, 56:1319–1325.
Folger, R. and Skarlicki, D. P. (1998). When tough times make tough bosses: Managerialdistancing as a function of layo↵ blame. Academy of Management Journal, 41(1):79–87.
175

Bibliography
Fredrickson, B. L. (2000). Cultivating positive emotions to optimize health and well-being.Prevention & Treatment, 3(1):1.
Fredrickson, B. L., Mancuso, R. A., Branigan, C., and Tugade, M. M. (2000). The undoinge↵ect of positive emotions. Motivation and Emotion, 24(4):237–258.
Fredrickson, B. L., Tugade, M. M., Waugh, C. E., and Larkin, G. R. (2003). What good arepositive emotions in crisis? A prospective study of resilience and emotions following theterrorist attacks on the United States on September 11th, 2001. Journal of Personalityand Social Psychology, 84(2):365–376.
Freiberg, K. and Freiberg, J. (1998). Nuts!: Southwest Airlines’ Crazy Recipe for Businessand Personal Success. Crown Business.
Ganster, D. C. (2005). Executive job demands: Suggestions from a stress and decision-making perspective. Academy of Management Review, 30(3):492–502.
Giambra, L. M. (1995). A laboratory method for investigating influences on switchingattention to task-unrelated imagery and thought. Consciousness and Cognition, 4:1–21.
Gilligan, C. (1982). In a Di↵erent Voice: Psychological Theory and Women’s Development.Harvard University Press, Cambridge, MA.
Glaser, R., Kiecolt-Glaser, J. K., Speicher, C. E., and Holliday, J. E. (1985). Stress, loneli-ness, and changes in herpesvirus latency. Journal of Behavioral Medicine, 8(3):249–260.
Glucksberg, S. and Weisberg, R. W. (1966). Verbal behavior and problem solving: Somee↵ects of labeling in a functional fixedness problem. Journal of Experimental Psychol-ogy, 71(5):659–664.
Goldstein, K. (1972). Weather, mood, and internal-external control. Perceptual and MotorSkills, 35(3):786.
Gollwitzer, P. M. and Sheeran, P. (2006). Implementation intentions and goal achievement:A meta-analysis of e↵ects and processes. Advances in Experimental Social Psychology,38:69–119.
Greenberg, J. (2010). Insidious Workplace Behavior. Routledge.
Greene, J. D. (2001). An fMRI investigation of emotional engagement in moral judgment.Science, 293(5537):2105–2108.
Greene, J. D. (2007). Why are VMPFC patients more utilitarian? A dual-process theoryof moral judgment explains. Trends in Cognitive Sciences, 11(8):322–323.
176

Bibliography
Greene, J. D., Morelli, S. A., Lowenberg, K., Nystrom, L. E., and Cohen, J. D.(2008). Cognitive load selectively interferes with utilitarian moral judgment. Cogni-tion, 107(3):1144–1154.
Greene, J. D., Nystrom, L. E., Engell, A. D., Darley, J. M., and Cohen, J. D. (2004). Theneural bases of cognitive conflict and control in moral judgment. Neuron, 44(2):389–400.
Gross, J. J. (1998). Antecedent- and response-focused emotion regulation: Divergent con-sequences for experience, expression, and physiology. Journal of Personality and SocialPsychology, 74(1):224–237.
Gross, J. J. (2002). Emotion regulation: A↵ective, cognitive, and social consequences.Psychophysiology, 39(3):281–291.
Gross, J. J. and John, O. P. (2003). Individual di↵erences in two emotion regulation pro-cesses: Implications for a↵ect, relationships, and well-being. Journal of Personality andSocial Psychology, 85(2):348–362.
Gross, J. J. and Levenson, R. W. (1993). Emotional suppression: Physiology, self-report,and expressive behavior. Journal of Personality and Social Psychology, 64(6):970–986.
Gross, J. J. and Levenson, R. W. (1997). Hiding feelings: the acute e↵ects of inhibitingnegative and positive emotion. Journal of Abnormal Psychology, 106(1):95–103.
Guilford, J. P. (1950). Creativity. American Psychologist, 5(9):444–454.
Halpern, D. F. (2005). How time-flexible work policies can reduce stress, improve health,and save money. Stress and Health, 21(3):157–168.
Harris, P. R. and Epton, T. (2010). The impact of self-a�rmation on health-related cog-nition and health behavior: Issues and prospects. Social and Personality PsychologyCompass, 4(7):439–454.
Harris, P. R., Mayle, K., Mabbott, L., and Napper, L. (2007). Self-a�rmation reducessmokers’ defensiveness to graphic on-pack cigarette warning labels. Health Psychology,26(4):437–446.
Harris, P. R. and Napper, L. (2005). Self-a�rmation and the biased processing of threat-ening health-risk information. Personality and Social Psychology Bulletin, 31(9):1250–1263.
Harter, J. K., Schmidt, F. L., and Hayes, T. L. (2002). Business-unit-level relationshipbetween employee satisfaction, employee engagement, and business outcomes: a meta-analysis. Journal of Applied Psychology, 87(2):268–279.
177

Bibliography
Harzer, C. and Ruch, W. (2012). When the job is a calling: The role of applying one’ssignature strengths at work. The Journal of Positive Psychology, 7(5):362–371.
Harzer, C. and Ruch, W. (2013). The application of signature character strengths andpositive experiences at work. Journal of Happiness Studies, 14(3):965–983.
Heaphy, E. D. and Dutton, J. E. (2008). Positive social interactions and the human bodyat work: Linking organizations and physiology. Academy of Management Review,33(1):137–162.
Hirshleifer, D. and Shumway, T. (2003). Good day sunshine: Stock returns and the weather.Journal of Finance, 58:1009 –1032.
Hsieh, T. (2010). Zappos’s CEO on going to extremes for customers. Harvard BusinessReview, 88(7):41–45.
Ibarra, H. (2013). Working Identity. Harvard Business Press.
Ibarra, H. and Barbulescu, R. (2010). Identity as narrative: Prevalence, e↵ectiveness, andconsequences of narrative identity work in macro work role transitions. Academy ofManagement Review, 35(1):135–154.
Ilgen, D. and Davis, C. (2000). Bearing bad news: Reactions to negative performancefeedback. Applied Psychology, 49(3):550–565.
Indick, W., Kim, J., Oelberger, B., and Semino, L. (2000). Gender di↵erences in moraljudgment: Is non-consequential reasoning a factor? Current Research in Social Psy-chology, 5(20).
Ingjaldsson, J. T., Laberg, J. C., and Thayer, J. F. (2003). Reduced heart rate variabilityin chronic alcohol abuse: relationship with negative mood, chronic thought suppression,and compulsive drinking. Biological Psychiatry, 54(12):1427–1436.
Isen, A. M., Daubman, K. A., and Nowicki, G. P. (1987). Positive a↵ect facilitates creativeproblem solving. Journal of Personality and Social Psychology, 52(6):1122–1131.
Isen, A. M. and Reeve, J. (2005). The influence of positive a↵ect on intrinsic and extrinsicmotivation: Facilitating enjoyment of play, responsible work behavior, and self-control.Motivation and Emotion, 29(4):295–323.
Jackson, D. C., Malmstadt, J. R., Larson, C. L., and Davidson, R. J. (2000). Suppres-sion and enhancement of emotional responses to unpleasant pictures. Psychophysiology,37(4):515–522.
178

Bibliography
Jacoby, L. L. (1991). A process dissociation framework: Separating automatic from inten-tional uses of memory. Journal of Memory and Language, 30(5):513–541.
Ja↵ee, S. and Hyde, J. S. (2000). Gender di↵erences in moral orientation: A meta-analysis.Psychological Bulletin, 126(5):703–726.
Jaremka, L. M., Fagundes, C. P., Peng, J., Bennett, J. M., Glaser, R., Malarkey, W. B.,and Kiecolt-Glaser, J. K. (2013). Loneliness promotes inflammation during acute stress.Psychological Science, 24(7):1089–1097.
Jehn, K. A. and Mannix, E. A. (2001). The dynamic nature of conflict: A longitudinalstudy of intragroup conflict and group performance. Academy of Management Journal,44(2):238–251.
Jehn, K. A., Northcraft, G. B., and Neale, M. A. (1999). Why di↵erences make a di↵er-ence: A field study of diversity, conflict and performance in workgroups. AdministrativeScience Quarterly, 44(4):741–763.
Jett, Q. and George, J. (2003). Work interrupted: A closer look at the role of interruptionsin organizational life. Academy of Management Review, 28(3):494–509.
Josselson, R. (2004). On becoming the narrator of one’s own life. In Lieblich, A.,McAdams, D. P., and Josselson, R., editors, Healing Plots: The Narrative Basis of Psy-chotherapy, pages 111–127. American Psychological Association, Washington, DC.
Judge, T. A., Erez, A., and Bono, J. E. (1998). The power of being positive: The relationbetween positive self-concept and job Performance. Human Performance, 11(2–3):167–187.
Judge, T. A., Van Vianen, A., and De Pater, I. E. (2004). Emotional stability, core self-evaluations, and job outcomes: A review of the evidence and an agenda for future re-search. Human Performance, 17(3):325–346.
KC, D. and Terwiesch, C. (2009). Impact of workload on service time and patient safety:An econometric analysis of hospital operations. Management Science, 55(9):1486–1498.
Keller, M., Fredrickson, B., Ybarra, O., Côté, S., Johnson, K., Mikels, J., Conway, A., andWager, T. (2005). A warm heart and a clear head the contingent e↵ects of weather onmood and cognition. Psychological Science, 16(9):724–731.
Keltner, D., Locke, K. D., and Aurain, P. C. (1993). The influence of attributions on therelevance of negative feelings to personal satisfaction. Personality and Social PsychologyBulletin, 19(1):21–29.
179
Bibliography
Keough, K. A. and Markus, H. R. (1998). The role of the self in building the bridge fromphilosophy to biology. Psychological Inquiry, 9(1):49–53.
Kiecolt-Glaser, J. K., Garner, W., Speicher, C., Penn, G. M., Holliday, J., and Glaser, R.(1984). Psychosocial modifiers of immunocompetence in medical students. Psychoso-matic Medicine, 46(1):7–14.
Kiecolt-Glaser, J. K., McGuire, L., Robles, T. F., and Glaser, R. (2002). Psychoneuroim-munology: psychological influences on immune function and health. Journal of Con-sulting and Clinical Psychology, 70(3):537–547.
Killingsworth, M. A. and Gilbert, D. T. (2010). A wandering mind is an unhappy mind.Science, 330:932.
Klimstra, T., Frijns, T., Keijsers, L., Denissen, J., Raaijmakers, Q., van Aken, M., Koot, H.,van Lier, P., and Meeus, W. (2011). Come rain or come shine: Individual di↵erences inhow weather a↵ects mood. Emotion, 11(6):1495–1499.
Koenigs, M., Young, L., Adolphs, R., Tranel, D., Cushman, F., Hauser, M., and Dama-sio, A. (2007). Damage to the prefrontal cortex increases utilitarian moral judgements.Nature, 446(7138):908–911.
Kok, B. E., Co↵ey, K. A., Cohn, M. A., Catalino, L. I., Vacharkulksemsuk, T., Algoe,S. B., Brantley, M., and Fredrickson, B. L. (2013). How positive emotions build physi-cal health: Perceived positive social connections account for the upward spiral betweenpositive emotions and vagal tone. Psychological Science, 24(7):1123–1132.
Kovensky, J. (2014). Chief happiness o�cer is the latest, creepiest job in corporate Amer-ica. Retrieved from http://www.newrepublic.com/article/118804/happiness-o�cers-are-spreading-across-america-why-its-bad.
Lang, P. J., Bradley, M. M., and Cuthbert, B. N. (1999). International A↵ective PictureSystem (IAPS): Instruction Manual and A↵ective Ratings. The Center for Research inPsychophysiology.
Larrick, R. P., Timmerman, T. A., Carton, A. M., and Abrevaya, J. (2011). Temper, tem-perature, and temptation: Heat-related retaliation in baseball. Psychological Science,23(6):1–6.
Larsen, R. J. and Fredrickson, B. L. (1999). Measurement issues in emotion research. InKahneman, D., Diener, E., and Schwarz, N., editors, Well-being: Foundations of hedonicpsychology, pages 40–60. Russell Sage, New York, NY.
180
Bibliography
Lave, J. and Wenger, E. (1991). Situated Learning: Legitimate peripheral participation.Cambridge University Press.
Linde, C. (1993). Life Stories: The Creation of Coherence. Oxford University Press.
Liston, C., McEwen, B. S., and Casey, B. J. (2009). Psychosocial stress reversibly disruptsprefrontal processing and attentional control. Proceedings of the National Academy ofSciences, 106(3):912–917.
Louis, M. R. (1980). Surprise and sense making: What newcomers experience in enteringunfamiliar organizational settings. Administrative Science Quarterly, 25(2):226–251.
Luce, M. F., Bettman, J. R., and Payne, J. W. (1997). Choice processing in emotionallydi�cult decisions. Journal of Experimental Psychology: Learning, Memory, and Cog-nition, 23(2):384.
Maddux, W. W. and Galinsky, A. D. (2009). Cultural borders and mental barriers: therelationship between living abroad and creativity. Journal of Personality and SocialPsychology, 96(5):1047–1061.
Malloy, T. E., Albright, L., and Kenny, D. A. (1997). Interpersonal perception and meta-perception in nonoverlapping social groups. Journal of Personality, 72:390–398.
Manly, T., Robertson, I. H., Galloway, M., and Hawkins, K. (1999). The absent mind:Further investigations of sustained attention to response. Neuropsychologia, 37:661–670.
Margolis, J. D. and Molinsky, A. (2008). Navigating the bind of necessary evils: Psycho-logical engagement and the production of interpersonally sensitive behavior. Academyof Management Journal, 51(5):847–872.
Martens, A., Johns, M., Greenberg, J., and Schimel, J. (2006). Combating stereotypethreat: The e↵ect of self-a�rmation on women’s intellectual performance. Journal ofExperimental Social Psychology, 42(2):236–243.
McAdams, D. P. (1988a). Biography, narrative, and lives: An introduction. Journal ofPersonality, 56(1):1–18.
McAdams, D. P. (1988b). Power, Intimacy, and the Life Story. Guilford Press.
McAdams, D. P. (1996). Personality, modernity, and the storied self: A contemporaryframework for studying persons. Psychological Inquiry, 7(4):295–321.
McAdams, D. P. (1999). Personal narratives and the life story. Handbook of Personality:Theory and Research, 2:478–500.
181

Bibliography
McQueen, A. and Klein, W. M. P. (2006). Experimental manipulations of self-a�rmation:A systematic review. Self and Identity, 5(4):289–354.
Mendes, W. B. (2009). Assessing autonomic nervous system activity. Methods in SocialNeuroscience, pages 118–147.
Miyake, A., Kost-Smith, L. E., Finkelstein, N. D., Pollock, S. J., Cohen, G. L., and Ito,T. A. (2010). Reducing the gender achievement gap in college science: A classroomstudy of values a�rmation. Science, 330(6008):1234–1237.
Molinsky, A. and Margolis, J. (2005). Necessary evils and interpersonal sensitivity inorganizations. Academy of Management Review, 30(2):245–268.
Moore, A. B., Clark, B. A., and Kane, M. J. (2008). Who shalt not kill? Individual di↵er-ences in working memory capacity, executive control, and moral judgment. Psychologi-cal Science, 19(6):549–557.
Murray, K., Di Muro, F., Finn, A., and Popkowski Leszczyc, P. (2010). The e↵ect ofweather on consumer spending. Journal of Retailing and Consumer Services, 17:512–520.
Nag, R., Corley, K. G., and Gioia, D. A. (2007). The intersection of organizational identity,knowledge, and practice: Attempting strategic change via knowledge grafting. Academyof Management Journal, 50:821–847.
Neal, D. T. and Chartrand, T. L. (2011). Embodied emotion perception: Amplifying anddampening facial feedback modulates emotion perception accuracy. Social Psychologi-cal and Personality Science, 2(6):673–678.
Nummenmaa, L. and Niemi, P. (2004). Inducing a↵ective states with success-failure ma-nipulations: A meta-analysis. Emotion, 4(2):207–214.
Ochsner, K. N., Bunge, S. A., Gross, J. J., and Gabrieli, J. D. E. (2002). Rethinkingfeelings: An fmri study of the cognitive regulation of emotion. Journal of CognitiveNeuroscience, 14(8):1215–1229.
Ochsner, K. N. and Gross, J. J. (2005). The cognitive control of emotion. Trends inCognitive Sciences, 9(5):242–249.
Ochsner, K. N. and Gross, J. J. (2008). Cognitive emotion regulation: Insights from so-cial cognitive and a↵ective neuroscience. Current Directions in Psychological Science,17(2):153–158.
Parrott, W. and Sabini, J. (1990). Mood and memory under natural conditions: Evidence formood incongruent recall. Journal of Personality and Social Psychology, 59(2):321–336.
182

Bibliography
Pentland, B. T. (1999). Building process theory with narrative: From description to expla-nation. Academy of Management Review, 24(4):711–724.
Petriglieri, J. L. (2011). Under threat: Responses to and the consequences of threats toindividuals’ identities. Academy of Management Review, 36(4):641–662.
Petrinovich, L., O’Neill, P., and Jorgensen, M. (1993). An empirical study of moral in-tuitions: Toward an evolutionary ethics. Journal of Personality and Social Psychology,64(3):467.
Polzer, J. T., Milton, L. P., and Swarm, W. B. (2002). Capitalizing on diversity: Interper-sonal congruence in small work groups. Administrative Science Quarterly, 47(2):296–324.
Poole, P. P., Gioia, D. A., and Gray, B. (1989). Influence modes, schema change, andorganizational transformation. The Journal of Applied Behavioral Science, 25(3):271–289.
Porges, S. W. (1995). Orienting in a defensive world: Mammalian modifications of ourevolutionary heritage. A polyvagal theory. Psychophysiology, 32(4):301–318.
Pressman, S. D. and Cohen, S. (2005). Does positive a↵ect influence health? PsychologicalBulletin, 131(6):925–971.
Pressman, S. D., Cohen, S., Miller, G. E., Barkin, A., Rabin, B. S., and Treanor, J. J.(2005). Loneliness, social network size, and immune response to influenza vaccinationin college freshmen. Health Psychology, 24(3):297–306.
Quinn, R. E., Dutton, J. E., and Spreitzer, G. M. (2003). Reflected Best Self Exercise:Assignment and instructions to participants.
Richards, J. M. (2004). The cognitive consequences of concealing feelings. Current Di-rections in Psychological Science, 13(4):131–134.
Richards, J. M. and Gross, J. J. (1999). Composure at any cost? The cognitiveconsequences of emotion suppression. Personality and Social Psychology Bulletin,25(8):1033–1044.
Richards, J. M. and Gross, J. J. (2000). Emotion regulation and memory: the cognitivecosts of keeping one’s cool. Journal of Personality and Social Psychology, 79(3):410.
Rind, B. (1996). E↵ect of beliefs about weather conditions on tipping. Journal of AppliedSocial Psychology, 26:137–147.
183

Bibliography
Roberts, L. M., Dutton, J. E., Spreitzer, G. M., Heaphy, E. D., and Quinn, R. E. (2005).Composing the reflected best-self portrait: Building pathways for becoming extraordi-nary in work organizations. Academy of Management Review, 30(4):712–736.
Robertson, I. H., Manly, T., Andrade, J., Baddeley, B. T., and Yiend, J. (1997). Oops:Performance correlates of everyday attentional failures in traumatic brain injured andnormal subjects. Neuropsychologia, 35:747–758.
Ross, L. and Nisbett, R. E. (2011). The Person and the Situation. Pinter & Martin Publish-ers.
Rucker, D. D., Preacher, K. J., Tormala, Z. L., and Petty, R. E. (2011). Mediation analysis insocial psychology: Current practices and new recommendations. Social and PersonalityPsychology Compass, 5/6:359–371.
Salovey, P., Rothman, A. J., Detweiler, J. B., and Steward, W. T. (2000). Emotional statesand physical health. American Psychologist, 55(1):110–121.
Sarbin, T. R. (1986). Narrative Psychology. Praeger Publishers.
Saunders, E. (1993). Stock prices and wall street weather. American Economic Review,83:1337–1345.
Schmeichel, B. J. and Martens, A. (2005). Self-a�rmation and mortality salience: A�rm-ing values reduces worldview defense and death-thought accessibility. Personality andSocial Psychology, 31(5):658–667.
Schwarz, N. and Clore, G. (1983). Mood, misattribution, and judgments of well-being:Informative and directive functions of a↵ective states. Journal of Personality and SocialPsychology, 45(3):513–523.
Sheldon, K. M. and Lyubomirsky, S. (2006). How to increase and sustain positive emotion:The e↵ects of expressing gratitude and visualizing best possible selves. The Journal ofPositive Psychology, 1(2):73–82.
Sheppes, G., Catran, E., and Meiran, N. (2009). Reappraisal (but not distraction) is goingto make you sweat: Physiological evidence for self-control e↵ort. International Journalof Psychophysiology, 71(2):91–96.
Sheppes, G. and Meiran, N. (2007). Better late than never? On the dynamics of onlineregulation of sadness using distraction and cognitive reappraisal. Personality and SocialPsychology Bulletin, 33(11):1518–1532.
Sheppes, G. and Meiran, N. (2008). Divergent cognitive costs for online forms of reap-praisal and distraction. Emotion, 8(6):870–874.
184
Bibliography
Sheppes, G., Scheibe, S., Suri, G., and Gross, J. J. (2011). Emotion-regulation choice.Psychological Science, 22(11):1391–1396.
Sheppes, G., Scheibe, S., Suri, G., Radu, P., Blechert, J., and Gross, J. J. (2014). Emo-tion regulation choice: A conceptual framework and supporting evidence. Journal ofExperimental Psychology: General, 143(1):163–181.
Sherman, D. K. (2013). Self-a�rmation: Understanding the e↵ects. Social and PersonalityPsychology Compass, 7(11):834–845.
Sherman, D. K. and Cohen, G. L. (2002). Accepting threatening information: Self–a�rmation and the reduction of defensive biases. Current Directions in PsychologicalScience, 11(4):119–123.
Sherman, D. K. and Cohen, G. L. (2006). The psychology of self-defense: Self-a�rmationtheory. Advances in Experimental Social Psychology, 38:183.
Sherman, D. K., Cohen, G. L., Nelson, L. D., Nussbaum, A. D., Bunyan, D. P., and Garcia,J. (2009). A�rmed yet unaware: Exploring the role of awareness in the process ofself-a�rmation. Journal of Personality and Social Psychology, 97(5):745–764.
Shiota, M. N. and Levenson, R. W. (2009). E↵ects of aging on experimentally instructeddetached reappraisal, positive reappraisal, and emotional behavior suppression. Psychol-ogy and Aging, 24(4):890–900.
Shockley, K. M., Ispas, D., Rossi, M. E., and Levine, E. L. (2012). A meta-analytic inves-tigation of the relationship between state a↵ect, discrete emotions, and job performance.Human Performance, 25:377–411.
Simonsohn, U. (2010). Weather to go to college. The Economic Journal, 120(543):270–280.
Singer, J. A. (1997). Message in a Bottle: Stories of Men and Addiction. Free Press, NewYork.
Singer, J. A. and Salovey, P. (2010). Remembered Self. Simon and Schuster.
Sivanathan, N., Molden, D. C., Galinsky, A. D., and Ku, G. (2008). The promise andperil of self-a�rmation in de-escalation of commitment. Organizational Behavior andHuman Decision Processes, 107(1):1–14.
Smallwood, J. and Schooler, J. W. (2006). The restless mind. Psychological Bulletin,132:946–958.
185

Bibliography
Speier, C., Valacich, J., and Vessey, I. (1999). The influence of task interruption on in-dividual decision making: An information overload perspective. Decision Sciences,30(2):337–360.
Spencer, S. J., Zanna, M. P., and Fong, G. T. (2005). Establishing a causal chain: Why ex-periments are often more e↵ective than mediational analyses in examining psychologicalprocesses. Journal of Personality and Social Psychology, 89:845–851.
Srivastava, S., Tamir, M., McGonigal, K. M., John, O. P., and Gross, J. J. (2009). Thesocial costs of emotional suppression: A prospective study of the transition to college.Journal of Personality and Social Psychology, 96(4):883–897.
Staats, B. and Gino, F. (2012). Specialization and variety in repetitive tasks: Evidence froma Japanese bank. Management Science, 58(6):1141–1159.
Stalikas, A. and Fitzpatrick, M. R. (2008). Employee positive emotion and favorable out-comes at the workplace. Journal of Research in Personality, 42(1):22–42.
Steele, C. M. (1988). The psychology of self-a�rmation: Sustaining the integrity of theself. In Advances in Experimental Social Psychology, volume 21, pages 261–302.
Steele, C. M. (1997). A threat in the air: How stereotypes shape intellectual identity andperformance. American Psychologist, 52(6):613–629.
Stets, J. E. and Burke, P. J. (2003). A Sociological Approach to Self and Identity. In Leary,M. R. and Tangney, J. P., editors, Handbook of Self and Identity, pages 128–152. TheGuilford Press, New York.
Stryker, S. (1980). Symbolic Interactionism: A Social Structural Version. Blackburn Press.
Tadmor, C. T., Satterstrom, P., Jang, S., and Polzer, J. T. (2012). Beyond individual cre-ativity: The superadditive benefits of multicultural experience for collective creativity inculturally diverse teams. Journal of Cross-Cultural Psychology, 43(3):384–392.
Tamres, L. K., Janicki, D., and Helgeson, V. S. (2002). Sex di↵erences in coping behavior:A meta-analytic review and an examination of relative coping. Personality and SocialPsychology Review, 6(1):2–30.
Tassy, S., Oullier, O., Mancini, J., and Wicker, B. (2013). Discrepancies between judgmentand choice of action in moral dilemmas. Frontiers in Psychology, 4:1–8.
Taylor, S. E. and Brown, J. D. (1988). Illusion and well-being: A social psychologicalperspective on mental health. Psychological Bulletin, 103(2):193–210.
186

Bibliography
Tetlock, P. E., Kristel, O. V., Elson, S. B., Green, M. C., and Lerner, J. S. (2000). Thepsychology of the unthinkable: Taboo trade-o↵s, forbidden base rates, and hereticalcounterfactuals. Journal of Personality and Social Psychology, 78(5):853–870.
Thompson, L., Kray, L. J., and Lind, E. A. (1998). Cohesion and respect: An examinationof group decision making in social and escalation dilemmas. Journal of ExperimentalSocial Psychology, 34(3):289–311.
Togo, F., Watanabe, E., Park, H., Shephard, R. J., and Aoyagi, Y. (2005). Meteorologyand the physical activity of the elderly: The Nakanojo study. International Journal ofBiometeorology, 50:83–89.
Tomkins, S. S. (1963). A↵ect, Imagery, Consciousness: The Negative A↵ects (Vol. 2).Springer, New York.
Trevor, C. O. and Nyberg, A. J. (2008). Keeping your headcount when all about youare losing theirs: Downsizing, voluntary turnover rates, and the moderating role of HRpractices. Academy of Management Journal, 51(2):259–276.
Trougakos, J. P., Hideg, I., Cheng, B. H., and Beal, D. J. (2014). Lunch breaks unpacked:The role of autonomy as a moderator of recovery during lunch. Academy of ManagementJournal, 57(2):406–421.
Uchino, B. N., Cacioppo, J. T., and Kiecolt-Glaser, J. K. (1996). The relationship be-tween social support and physiological processes: A review with emphasis on underlyingmechanisms and implications for health. Psychological Bulletin, 119(3):488–531.
Uhlmann, E. L., Zhu, L. L., and Tannenbaum, D. (2013). When it takes a bad person to dothe right thing. Cognition, 126(2):326–334.
Van Der Vegt, G. and Emans, B. (2000). Team members’ a↵ective responses to patternsof intragroup interdependence and job complexity. Journal of Management, 26(4):633–655.
Vancouver, J. B., More, K. M., and Yoder, R. J. (2008). Self-e�cacy and resource alloca-tion: Support for a nonmonotonic, discontinuous model. Journal of Applied Psychology,93(1):35–47.
Vancouver, J. B. and Thompson, C. M. (2002). Two studies examining the negative e↵ectof self-e�cacy on performance. Journal of Applied Psychology, 87(3):506–516.
Vohs, K. D., Park, J. K., and Schmeichel, B. J. (2013). Self-a�rmation can enable goaldisengagement. Journal of Personality and Social Psychology, 104(1):14–27.
187

Bibliography
Ward, A., Atkins, D. C., Lepper, M. R., and Ross, L. (2011). A�rming the self to pro-mote agreement with another: Lowering a psychological barrier to conflict resolution.Personality and Social Psychology Bulletin, 37(9):1216–1228.
Watson, D., Clark, L. A., and Tellegen, A. (1988). Development and validation of briefmeasures of positive and negative a↵ect: the PANAS scales. Journal of Personality andSocial Psychology, 54(6):1063–1070.
Wilhelm, F. H., Alpers, G. W., Meuret, A. E., and Roth, W. T. (2001). Respiratory patho-physiology of clinical anxiety outside the laboratory: Assessment of end-tidal pCO2,respiratory pattern variability, and transfer function RSA. In Progress in AmbulatoryAssessment, pages 313–343. Hogrefe & Huber Publishers.
Williams, K. D. and Jarvis, B. (2006). Cyberball: A program for use in research on inter-personal ostracism and acceptance. Behavior Research Methods, 38(1):174–180.
Wood, J. V., Perunovic, W. Q. E., and Lee, J. W. (2009). Positive self-statements power forsome, peril for others. Psychological Science, 20(7):860–866.
Woolley, A. W., Chabris, C. F., Pentland, A., Hashmi, N., and Malone, T. W. (2010). Evi-dence for a collective intelligence factor in the performance of human groups. Science,330(6004):686–688.
Wright, R. A. and Dismukes, A. (1995). Cardiovascular e↵ects of experimentally inducede�cacy (ability) appraisals at low and high levels of avoidant task demand. Psychophys-iology, 32(2):172–176.
Zadro, L., Williams, K. D., and Richardson, R. (2004). How low can you go? Ostracism bya computer is su�cient to lower self-reported levels of belonging, control, self-esteem,and meaningful existence. Journal of Experimental Social Psychology, 40(4):560–567.
Zellars, K. L., Meurs, J. A., Perrewé, P. L., Kacmar, C. J., and Rossi, A. M. (2009). React-ing to and recovering from a stressful situation: The negative a↵ectivity-physiologicalarousal relationship. Journal of Occupational Health Psychology, 14(1):11–22.
Zivin, J. G. and Neidell, M. J. (2010). Temperature and the allocation of time: Implicationsfor climate change.
188