ESCRI - Milestone 5 - General Project Report Final Rev 2 or ness of e taken present make respect ......
378
ES Ene Sou An Eme MI Dece Pha SC rgy Sto th Aust erging Renew ILEST mber 20 ase 1 – CRI orage f o tralia wables “Mea T ON 15 – Gen I-SA or Com asure” projec NE 5 neral A mercia ct with the A Proje l Renew Australian Re ct Re wable I enewable Ene port ntegra ergy Agency tion
Transcript of ESCRI - Milestone 5 - General Project Report Final Rev 2 or ness of e taken present make respect ......

ESEne
Sou
An Eme
MI
Dece
Pha
SCrgy Sto
th Aust
erging Renew
ILEST
mber 20
ase 1 –
CRIorage fo
tralia
wables “Mea
TON
15
– Gen
I-SAor Com
asure” projec
NE 5neral
A
mercia
ct with the A
Proje
l Renew
Australian Re
ct Re
wable I
enewable Ene
port
ntegra
ergy Agency
tion

Discla
This ReServiceAustrali14 Augissued ARENA
Copyingdirected
The Auand reqtargetinenergy,possibleand othReport has bee
a. b.
c. d.
The Audetailedthe Info
This Reas reprea full recomm
The Auof any other thusefulnReport achieve
FurtherpurposeconnecAuthorsundertamaking
aimer
eport has bes Pty Ltd (ian Renewa
gust 2014 bin accordan
A and the Au
g, reproducd by ARENA
uthors have quirements ng the deve, and have e given the
her third paris valid only
en prepared
In accordanWith the asEnergy MaOn the basIn reliance review wasthe Authors
uthors have d verificationormation.
eport must esentative oand comp
mendations
uthors accepuse or purhan ARENAess of the Ithat any a
ed.
r, this Repoes of obtaintion with an
s recommeake indepen any decisio
een prepar“WP”) and able Energybetween AGnce with theuthors.
ction or distA) is not pe
used all reof the Emeelopment otaken all r
e data and rties (“Infory for the cod:
nce with thessistance ofrket Operat
sis of the Infon the Inf
s carried ous.
not conducn of the Info
only be reaof the gene
prehensive about the P
pt no liabilitported reliaA in accordInformation
assumed co
ort does nning legal ony investmeend that alndent investon regardin
ed collaborElectraNet
y Agency (“GL and ARe Agreemen
tribution of rmitted.
easonable eerging Reneof emergingreasonable informationmation”) an
onditions rep
e instructionf AGL, EN, tor personnformation; aormation asut, without f
cted, and wormation an
ad in its entral findings assessmen
Project.
ty or responance upon tdance with contained
onditions co
ot addressr financial i
ent in or funl parties stigations regg the Projec
ratively by At Pty Ltd (“
“ARENA”) pRENA (“Agrnt and is pro
this Report
endeavoursewables Prog technolog
steps to en provided bnd the scopported here
ns of ARENWorleyPar
el; and s being cofurther inve
were not reqnd the Autho
tirety and eof the Rep
nt of the
nsibility whathis Reportthe Agree
in this Reponcerning t
s and canninformation nding of theseek indepgarding thect.
AGL EnergyEN”), (colle
pursuant to eement”). Tovided in a
t by any pa
s to inform togram (“Prgies and consure that by AGL, ENpe of servicein and as o
A; rsons, Oakl
mplete, trueestigation o
quired by Aors have no
xcerpts fromort. The Reviability o
atsoever ort or any pament or thort. The Authe subject
not be relieor advice i
e Project or endent fina
e matters co
y Ltd (“AGLectively “thethe FundingThis Reporform appro
arty other th
themselvesroject”), a poncepts relthe Report
N, ARENA, es under th
of the date i
ey Greenw
e and correr inquiry be
ARENA to cot verified th
m the Repoeport is not iof the Proj
r howsoevert of this Re accuracy
uthors do nomatter of
ed upon orn respect oany part of
ancial and ontained in t
L”), Worleye Authors”)g Agreemert is subjectoved and ag
han ARENA
s of the parprogram of lated to rent is as accuits represe
he Agreemessued. This
wood, the Au
ect at the teing undert
conduct an he complete
ort cannot bintended toject nor to
er arising in Report by any, completeot representhe Report
r extracted of any interef the Projeclegal adv
this Report
Parsons , for the nt dated t to and greed by
A (or as
rameters ARENA newable urate as entatives ent. This s Report
ustralian
time the aken by
audit or eness of
be taken present
o make
respect ny party
eness or t by this t will be
for the est or in ct. The
vice and , prior to

The Auof this presentthis Repparty w
MILESTO
REV D
AA D
O SA
1 Mb
2 F
thors reserReport if thtly availableport. It is Aho was pro
ONE 5 REPO
DESCRIPTION
Draft
Submitted to ARENA
Minor edits req y ARENA incl
Final
rve the righthey considee (for whate
ARENA’s resvided with t
ORT: ESCRI-S
WORLEYPAR
REVIEWER
P. Ebert
P Ebert
P Ebert
P Ebert
t, but are noer it prudenever reasonsponsibility the prior ver
SA - PHASE 1
RSONS ELE
REV
H. K
H K
H K
H K
ot obliged, nt to do so n) becomingto provide rsion.
1 – GENERAL
ECTRANET
VIEWER
Klingenberg
Klingenberg
Klingenberg
Klingenberg
to update, in light of ag known toa copy of a
L PROJECT R
AGL
REVIEWE
B. Benne
B Bennet
B Bennet
B Bennet
review and any additio the Authorny revised v
REPORT
ER
ett
tt
tt
tt
amend all nal informars after theversion to a
FINAL APPROV
P. Knisp
P Knispe
P Knispe
P Knispe
aspects ation not e date of any third
VAL DATE
pel
el
el
el

Table
1.
2.
3.
4.
5.
6.
of Conte
EXECUTIV
INTRODUC
2.1 CON
2.2 BAS
2.3 NOM
RENEWAB
3.1 SOU
METHODO
4.1 PRE
4.2 BUS
SUMMARY
5.1 REG
5.1.1 Reg5.1.2 Inad5.1.3 Reg
5.2 SITE
5.2.1 Site 5.2.2 Site 5.2.3 Ben
5.3 COM
5.3.1 Intro5.3.2 App5.3.3 Key5.3.4 Rec
5.4 STAT
5.5 SPE
5.5.1 Math5.5.2 ESD5.5.3 Req5.5.4 Res5.5.5 DecCase Asses
BUSINESS
6.1 OVE
6.2 SUM
6.3 SUM
6.4 FINA
ents
VE SUMMA
CTION AND
NTEXT AND PU
IC ESD CONC
MENCLATURE
BLE ENERG
UTH AUSTRALI
OLOGY & A
EVIOUS MILEST
SINESS CASE A
Y OF PREV
GULATORY OV
gulatory landsdvertent regugulatory deve
E SELECTION . selection cri assessmen
nefit quantific
MMERCIAL FRA
oduction ......proach ..........y Findings ....commendatio
TE OF THE AR
CIFICATION AN
hematical MD Specificatioquest for Infosults of RFI Pcisions Followssment .........
S CASE .....
ERVIEW OF ES
MMARY OF ES
MMARY OF COM
ANCIAL MODE
RY AND PR
D SCOPE ..
URPOSE OF TH
CEPT ............
USED IN REP
GY CONTE
IAN CONTEXT
APPROACH
TONES ..........
APPROACH ...
VIOUS MILE
VERVIEW ........scape for ESulatory barrieelopments im
....................riteria ............t and shortlis
cation and fin
AMEWORK .................................................................
ons ...............
RT REVIEW ....
ND PROCURE
odelling .......on ................rmation (RFI
Process ........wing RFI Pro....................
..................
SD PROPOSAL
D PROPOSAL
MMERCIAL ST
L ..................
ROJECT P
..................
HIS REPORT ..
....................
ORT .............
EXT .............
T ...................
H.................
....................
....................
ESTONE FI
....................SDs ..............ers ................mpacting on E
....................
....................sting ............nal site selec
....................
....................
....................
....................
....................
....................
EMENT ...................................................I) Process .......................
ocess – Dem....................
..................
L BENEFITS ..
L SPECIFICATI
RUCTURE .....
....................
HASE 2 CO
..................
...................
...................
...................
..................
...................
..................
...................
...................
NDINGS ...
...................
....................
....................ESDs ...........
...................
....................
....................tion ..............
...................
....................
....................
....................
....................
...................
...................
....................
....................
....................
....................onstration Pl....................
..................
...................
ON ..............
...................
...................
ONCEPT ....
..................
....................
....................
....................
..................
....................
..................
....................
....................
..................
....................
....................
....................
....................
....................
....................
....................
....................
....................
....................
....................
....................
....................
....................
....................
....................
....................
....................
....................lant Configur....................
..................
....................
....................
....................
....................
..................
..................
...................
...................
...................
..................
...................
..................
...................
...................
..................
...................
...................
...................
...................
...................
...................
...................
...................
...................
...................
...................
...................
...................
...................
...................
...................
...................
...................
...................ration for Bu...................
..................
...................
...................
...................
...................
..................
................. 1
...................
...................
...................
................. 1
................... 2
................. 2
................... 2
................... 2
................. 3
...................
...................
...................
...................
...................
...................
...................
...................
...................
...................
...................
...................
...................
...................
...................
...................
...................
...................
................... siness ...................
................. 5
...................
...................
...................
...................
.. 8
16
16
17
18
19
20
26
26
28
30
30 31 31 32
32 32 33 34
36 36 36 36 36
37
38 39 41 42 43
46
52
52
53
54
54

7.
8.
9.
APPEN
APPEN
APPEN
APPEN
APPEN
6.5 ESD
6.6 ESD6.6.1 EPC6.6.2 Curr
6.7 PRO
6.7.1 Mar6.7.2 Rev6.7.3 Valu6.7.4 Anc
6.8 PRO
6.9 PRO
6.10 KEY
6.11 PRO
6.12 KEY
6.12.1 Com6.12.2 Red6.12.3 Cap6.12.4 Cap6.12.5 Incr6.12.6 Tech
THE CASE
7.1 THE
7.2 EST
7.3 PRO
REFERENC
APPENDIC
NDIX A G
NDIX B S
NDIX C S
NDIX D L
NDIX E R
D PROPOSAL A
D PROPOSAL CC contract ....rency exposu
OJECT REVENU
rket Trading Rvenue from Mue of expectecillary service
OJECT OPERAT
OJECT FUNDIN
Y FINANCIAL M
OJECT SENSITI
Y RISKS TO AC
mplexity of islduction in volpacity withdrapacity withdrareased penethnology forw
E FOR ESC
CASE FOR E
IMATED BUSIN
OPOSED CONC
CES ..........
CES ...........
GENERAL
SUMMARY
SUMMARYSYSTEMS
LIST OF RF
RAW RFI E
ASSUMPTIONS
CAPITAL COS
....................ure ...............
UES ...............Revenue .....
MLF benefit ..ed unserved es revenue ...
TING COSTS ..
NG SOURCES .
METRICS ........
IVITIES ..........
CHIEVING THE
land mode olatility ...........awals from thawals do not tration of ren
ward curve ....
RI-SA PHA
SD EXPERIEN
NESS CASE IM
CEPT FOR ESC
..................
..................
ESD NOME
Y OF MILES
Y OF MILES..................
FI RESPON
EVALUATIO
S .................
STS .......................................................
....................
....................
....................energy .......
....................
....................
....................
....................
....................
BUSINESS CA
operation ..........................he market ....t occur .........newable gene....................
ASE 2 .........
NCE ..............
MPROVEMENT
CRI-SA PHAS
..................
..................
ENCLATUR
STONE 2 R
STONE 3 R..................
NDENTS &
ON SHEET
...................
...................
....................
....................
...................
....................
....................
....................
....................
...................
...................
...................
...................
ASE .............................................................................................eration .............................
..................
...................
TS .................
SE 2 .............
..................
..................
RE USED I
REPORT – S
REPORT – E..................
RESULTS
.................
....................
....................
....................
....................
....................
....................
....................
....................
....................
....................
....................
....................
....................
....................
....................
....................
....................
....................
....................
....................
..................
....................
....................
....................
..................
..................
N REPORT
SITE SELEC
ENERGY ST..................
..................
..................
...................
...................
...................
...................
...................
...................
...................
...................
...................
...................
...................
...................
...................
...................
...................
...................
...................
...................
...................
...................
..................
...................
...................
...................
..................
..................
T ................
CTION ......
TORAGE ..................
..................
..................
...................
...................
...................
...................
...................
...................
...................
...................
...................
...................
...................
...................
...................
...................
...................
...................
...................
...................
...................
...................
................. 7
...................
...................
...................
................. 7
................. 8
................. 8
................. 8
............... 10
............... 10
............... 11
55
56 57 57
58 58 63 63 64
65
66
66
67
67 68 68 68 69 69 69
71
71
74
76
79
81
81
82
04
09
13

10.
ANNEXUR
Milestone 1
Milestone 2
Milestone 3
Milestone 3
Milestone 3
RES ............
1 - Regulato
2 - Site Sele
3 - State of
3 - Commer
3 - RFI Spec
..................
ory Framew
ection Rev 0
the Art Tec
rcial Framew
cification –
..................
work Rev 0 (
0 (Final)
ch Review R
work REP (
Energy Sto
..................
(Final)
Rev 0 (Final)
(Final)
orage Devic
..................
l)
e Rev 2 (F
..................
Final)
............... 1114

Acron
AC
AEMC
AEMO
AER
ARENA
ARP
CAES
DC
ESCRI-
ESD
ESD Pr
FX
FCAS
IRR
MinSOC
NEM
NEMMC
NPV
MLF
PABX
PCS
Power C
RFI
SCADA
TNSP
WPWF
nyms
A
-SA
roposal
C
CO
Charge Rat
A
Alternat
Australi
Australi
Australi
Australi
Advanc
Compre
Direct C
Energy Australi
Energy
Project
Foreign
Frequen
Internal
Minimum
Nationa
Nationa
Net Pre
Margina
Public a
Power C
ting The ES
The Req
Supervi
Transm
Wattle P
ting Current
an Energy
an Energy
an Energy
an Renewa
ing Renewa
essed Air En
Current
Storage fa
Storage De
configuratio
Exchange
ncy Control
Rate of Re
m State of C
al Electricity
al Electricity
sent Value
al Loss Fact
and Busines
Conversion
D charge/d
quest for In
sory Contro
ission Netw
Point Wind
t
Market Com
Market Ope
Regulator
able Energy
ables Progr
nergy Stora
for Comme
evice
on used in t
Ancillary S
eturn
Charge (of t
y Market
y Market Ma
tor
ss Exchang
System
ischarge ra
nformation p
ol and Data
work Service
Farm
mmission
erator
y Agency
ramme
age
ercial Ren
the Busines
Services
the ESD)
anagement
ge
ate under no
process for t
Acquisition
e Provider
ewable Int
ss Case ana
Company L
ormal opera
the ESCRI-
n
tegration –
alysis of Se
Limited
ating conditi
-SA Project
– South
ction 6
ons

1.
The Auknown athe Projof a nosystem ancillarystorageaddition
The Pro
This ReoverviewequipmAgreemto AREoperatiowith the
This Rethe:
The Resensitiv
The Phproject,the actuwork, w
Regula
No partfound. Afencing precludregulatoAustrali(AEMOESDs arecently
EXECU
ustralian Reas the Ener
oject) under on-hydro E
specificallyy and netw
e adds valunal services
oject was un
eport has bw of the invent supplie
ment with ARENA with cons or confe provisions
eport is a c
RegulatorySiting of suEnergy stofunction; aCommerci
eport then svities.
hase 1 busi with Phasual ESD as
which can be
atory Revie
ticular regulA number of regulate the operaory review ian Energy
O), who are are treatedy published
UTIVE SU
enewable Ergy Storagetheir Emer
Energy Story designed
work servicee to renew
s to improve
ndertaken b
been prepavestigationsers as partRENA. It iscommerciallidential cos
s of the Fun
complete de
y environmeuch an asseorage technd the procal framewo
sets out a
ness case e 2 being t
sset. Phasee summaris
ew
atory impedof potentiated networation of a lincluded dMarket Coaware of th. The maby the AEM
UMMARY
nergy Agene for Renewrging Renewrage Device
to leverages. A key owable energe its busines
by AGL, Ele
ared by thes and findingt of the K
s a version oly sensitive
st estimatesding Agree
escription o
ent in whichet nology use
curement ofrk under wh
business c
work was athe plannine 2 is to be sed briefly a
diment to thl unintenderk businessarge-scale
discussions mmission (Ahese constrajor ProjectMC.
Y and PR
ncy (ARENAwable Integrwables Proge (ESD) w
ge value froobjective ofgy, with thess case.
ectraNet and
e Consortiugs of Phase
Knowledge of the Phase informatios from suppment with A
of the work
h such an as
ed in termsf the assethich the ass
case in term
always integ, building, considered
as follows:
he ownershed constrainses, which ESD with with the A
AEMC), anraints and at outcomes
ROJECT
A) has partration Southgram. The
within the Som the enef the Projec ESD targe
d WorleyPa
m for the e 1 for deveSharing ob
se 1 Final Bon around liers deleted
ARENA.
carried out
sset would
s of the sta
set would be
ms of ESD
ended to be operation
d based on
ip or operatnts do exis
may undeboth markeAustralian Ed the Austr
are likely to in this res
PHASE 2
t funded Phh Australia P
Project is eSouth Austrergy marketct is to demeting that o
arsons as a
sole purposelopers, the bligations uusiness CaAGL and
d or normal
t to date wh
operate
ate-of-the-a
e owned an
commercia
e the first pand testingthe outcom
tion of an Et particularler certain et and netwEnergy Regralian Energ
review thespect agree
2 CONCE
hase 1 of aProject (ESexamining ralian transt and throu
monstrate thoutcome as
Consortium
se of provi general puunder the ase Report p
ElectraNet’lised in acc
hich has ex
art globally
nd outputs t
al return, ri
part of a twog the applicmes of the P
ESD asset hly around townership
work benefitgulator (AEgy Market Oese in termse with thos
Page | 8
EPT
a project CRI-SA, the role
smission ugh both hat such
well as
m.
iding an ublic and Funding provided ’s asset ordance
xamined
and its
raded
sks and
o phase cation of Phase 1
as been the ring-
models ts. This ER), the Operator s of how se most

An initiaMilestoof this R
ESD Si
An extelocationtask incapabilservices
The sitiwas mato geneestablisbenefitsEyre Peprocess
Categ
Gene
Netw
(due const
Netw
(to inc
Based Peninsuprovideand is sESD Si
Techno
A reviewto asseincludeddevelopAustraliinitial mcompar
al report onne 1 of the Report. A co
ting
ensive sitinns to install volving nuity significas that might
ing work ceade on costerator co-loshed which s. Three loceninsula, ths are shown
gory
erated Energ
work Support
to reliability traints)
work Support
crease Mark
on these ula, located
ed to ARENAsummarisedting Report
ology State
w was undeess potentiad considerapment and ia. This inf
modelling wre potential
the regulatfunding agropy of this R
ng study wan ESD witmerous ite
antly impact be provide
entred on alt, practicalitcation (partresulted in
cations withhe Yorke Pen in the Tab
y Value
ket Benefit)
consideratiod at DalrymA as the prd in Section is annexed
e of the Art
ertaken of aal candidateation of theoperation aformation a
work used sites.
tory work wreement, anRegulatory
was undertathin the Sou
erations, pated on the ed.
ll (88) of Ely and reventicularly winn a scoringh the higheseninsula andble below.
Benefit cla1. Ma
reve2. Ma
3. Net4. Loc5. Exp
6. Hey7. Mu8. Loc9. Grid10. Anc11. Avo
Ser
ons, a preple. An initiimary deliven 5.2 and ud to this Rep
t Review
a broad rane technologe technical and what pralso includeto define t
was providednd has beenReview Re
aken whichuth Australiaarticularly a best locat
ectraNet’s nue groundnd farms). g and weigst potential d the River
ass rket Trading enue as welrginal Loss F
twork Augmecalised Frequpected Unse
ywood Intercrraylink Intercal Generatod Support Cocillary Servicoided Wind Frvice (FCAS)
eferred site ial report coerable unde
updated in Aport.
nge of non-ies and supcapabilities
rojects had ed public dothe function
d to ARENAn summarisport is anne
h involved an networkas the costion for suc
transmissiods, although
A two parhting procewere identland. The b
Revenue (Ml as Cap tradFactor (MLF)
entation Capuency Supporved Energy
connector Corconnector Cor Constraint ost Reductio
ces Support (Farm Freque) obligation
was identovering thiser MilestoneAppendix B
hydro energppliers for ts of each tbeen prog
omain cost nal algorith
A as the prised and updexed to this
the assess. This provt of the E
ch an asse
on substatioh consideratt screening
ess based ified as thebenefits use
Market time sding revenue) Impact
ital Deferral ort
(USE) reduc
onstraint RedConstraint Re
Reduction n (System Freqncy and Con
tified on ths siting worke 2 of the F of this Rep
gy storage the Project.technology,ressed bothinformation
m for the
mary delivedated in Sec
Report.
sment of pved to be a cESD and teet and the
ons, and a dtion was als
g methodoloon estimat
e primary foed in the sc
shifting tradine)
ction
duction eduction
quency Suppntrol Ancillary
he Southernrk and proceunding Agrport. A cop
technology. This asse the experh in and oun that was ESD, and
Page | 9
erable of ction 5.1
potential complex echnical network
decision so given ogy was ed ESD cus; the creening
ng
port) y
n Yorke ess was reement, y of this
y options essment ience in utside of used in to help

A stateFundingReport.
Comme
VariousESD foto own be. As framewframew
This prTransmEach wnumber
Eventuapotentiatrading revenueWPWF
A commof the Fthis Com
-of-the-art rg Agreeme A copy of t
ercial Fram
s commercillowing a prsuch an aswith much
works are pwork for the a
rocess consmission Netwwere analysr of alternat
ally for the al Phase 2
componene item flowsto the Watt
mercial framFunding Agrmmercial F
report was ent and hasthe Techno
mework
al frameworocess whicsset, and thof the Phas
possible, aasset was t
sidered thrework Systemed in termsive models
business cproject inv
nt leased ts are showtle Point Wi
mework reporeement anramework R
provided tos been sumlogy State o
orks were inch establishhen what thse 1 work thlthough thethe primary
ee primary m Provider,s of key frainvolving o
ase analysivolving owno AGL. Tn in green –nd Farm.
ort was prod has beenReport is an
o ARENA ammarised of the Art R
nvestigatedhed the potehe basic elehis was a hie general objective.
ownership, a third pa
amework tether interes
is a commenership of tThis is sho– note that
vided to ARn summarisennexed to th
as a deliverin Section
Review is an
d for the owential role oements of tighly iterativprinciple o
p models –arty providerms and th
sts were als
ercial framethe asset bown diagram
MLF refers
RENA as a ed in Sectiohis report.
able under 5.4 and Anex to this
wnership anof the ESD, the resultingve process of optimisin
an “energyr and a come particularo assessed
ework modeby ElectraNmmatically s to Margin
deliverableon 5.3 of this
P
Milestone Appendix CReport.
nd operatiowho wouldg frameworas several
ng the com
y trading” embination or issues arid.
el was chosNet with the
below, whnal Loss Fac
e under Miles Report. A
Page | 10
3 of the C of this
n of the be best
rk would different
mmercial
entity, a of these. sing. A
sen for a e market here the ctor and
estone 3 A copy of

Modell
A mathtechnolalgorithdifferenassessmstoragePhase 1
This movariety ESD Sp
The resReport.ARENA
Procur
A Requreal infinvolvinthe-art submissproject.
Seven 20-200 of 20 yoperatiothere w
In generange ois immcompanincludinstorageResponexpecti
Followinpositivetake adreplaceused ul
The proin Sectito ARESection
ing and Fu
hematical mogies and ms, with th
nt technical ment utilise
e market inf1 work.
odel was pof market
pecification
sults of app A complie
A.
rement
uest for Infoformation ong firstly an
review andsions being
potential MWh, so a
years was on, being n
was evidence
eral the leveof prices an
mature. Arnies, not enng Lithium-ie; hydrogenndents alsong cost red
ng modelline, with sevedvantage of ements. A dtimately as
ocurement ion 5.5.3 an
ENA under n 5.5.2 of th
unctional S
model was capabilities
he output oconfigurati
ed informatioformation o
particularly algorithms to be resolv
lying this med version
ormation pron ESD tec
approach td knowledgg submitted
configuratioas to allow
sought agnetwork, mae that a sig
el of submind approachrguably thenergy storagon, Sodiumn generatioo provided uctions of a
ng of each ral variation
f future lowedecision wathe basis fo
process, thnd Section 5Milestone is Report. A
pecificatio
produced s to be asof the modions could on from the
obtained thr
useful for to be usedved. This t
mathematicaof this ma
ocess was chnology cato forty two
ge of the cowith eight o
ons of ESprice compainst a sp
arket and isnificant netw
ssions washes taken. Te best subge vendors,
m-Sulphur aon and stoinformation
about 50% w
submissionns tried in teer costs, anas made toor the detai
e bidders a5.5.4 of this3 of the Fu
A copy of th
on
which allosessed in el being a be compar
e public domrough the p
quantifyingd and comphen informe
al model andathematical
undertakenapability an internationonsortium of these ulti
SD were sparison betwpecification slanding mowork benefi
s considereThe percepbmissions , with subm
and Advancorage; andn on cost within five y
n it was fouerms of sitinnd ESD cono choose thled busines
and their evs Report. Tunding Agre Functiona
wed the wparallel alobasic Net
red in an emain but waprocuremen
market vapared and ed the Proc
d are summmodel is
n to the enend pricing. nal entities imembers, imately sho
sought, ranween energ
that includode. Islandit might acc
ed good, altption resultinwere from
missions acrced Lead Ac a numbetrajectories
years.
und that nong and marnfiguration ie best perf
ss case.
valuation anThe Functionreement, bual Specifica
wide range ong with diPresent V
equivalent bas ultimatelynt process
alue, as it athe essentiurement pro
marised in Sis available
ergy storagA formal
identified thresulting inrtlisted for a
nging fromy storage sded three ding capabcrue with su
though therng is that th
Power Cross a rangcid batterier of differeinto the f
o project coket algorithincluding vaforming var
nd scoring rnal Specificut is also dtion is anne
P
of optionsifferent ope
Value index basis. Initiy used withundertaken
allowed forial function
rocess.
Section 5.5.e on reque
ge market tprocess wa
hrough the sn seventeena potential
m 10-20 Msizes. A deprimary mility was soch.
re was a vehe storage
Conversion e of storag
es; molten sent flow bfuture with
ould be mam, project tariations onriation and t
results are cation was pdescribed bexed to this
Page | 11
s across erational
so that ially this h energy n for the
r a wide s of the
1 of this est from
o obtain as used state-of-n formal Phase 2
MW and esign life odes of
ought as
ery wide industry System
e media salt heat atteries. several
de NPV timing to n battery this was
detailed provided briefly in report.

Busine
A detaiDalrympenergy charactthe bas
The ass
An asstargeted
The ESgiven b30 June
To be contribudisappoquantifiThis is d
ess Case
led businesple substatgeneration
teristics to lsis of the bu
set was def
Market tradA lowering Expected Uand downsFrequency
et with a ted. A range
SD asset wbelow, basee 2016.
Des
Ma
Rev
Exp
Anc
(A)
Ope
Cap
(B)
Pre
Tax
Pos
Pro
Res
Imp
commerciaution from ointing resued may madiscussed w
ss case waion on the n (Wattle Peverage vasiness case
fined to leve
ding essentiof the Marg
Unserved Etream load Control An
en year opof project s
was found toed on a po
scription
rket trading
venue from
pected unse
cillary servi
Total reven
ex
pex
Total cost o
e-tax NPV (A
x effect
st-tax NPV
oposed ARE
sidual fundi
plied IRR (%
ally viable,ARENA or
ult, the futuake such anwithin the R
as undertakYorke PenPoint Windalue from sue as this sh
erage reven
ially throughginal Loss Fnergy – undcan island, cillary Serv
erational lifsensitivities
o be signifiost-tax nom
g revenue
MLF benefi
erved energy
ces revenue
nue from ES
of ESD
A+B)
ENA grant
ng shortfall
%)
this projer other funre price cun asset a co
Report and is
ken for a 1insula, cho
d Farm) anuch ESD siowed the b
nue across f
h time shiftiFactor at theder conting with the ES
vices
fe starting were also i
icantly NPVminal disco
t
y revenue
e (FCAS)
SD
l
ect would nding sourcrves and pommercial s the basis
0 MW, 20 sen as it hnd appearszing. A Litest overall
four primary
ng trading ae Wattle Poency conditSD expecte
commerciainvestigated
V negative, unt rate of
($ 00
require ances (in NPVpotential forproposition of the Phas
MWh ESD as significa
s to have hium-Ion bametrics.
y revenue s
and market int Wind Fations the Dad to cover t
l operationsd.
with the kef 7.5% and
NPV 00 real FY16
2,81
74
2,67
5
6,29
(1,63
(23,42
(25,06
(18,77
3,97
(14,80
(14,80
7
n approximV terms). r additional within the
se 2 Project
P
D asset siteant local ren
the most attery was
streams, be
high eventarm alrymple suthe islanded
s in mid-20
ey financiad valuation
6)
18.3
43.1
78.4
52.0
91.9
34.8)
29.6)
64.4)
72.5)
70.2
02.3)
02.3)
-
7.5%
mately 63%While thisrevenue y
next 5 to 1t recommen
Page | 12
d at the newable suitable used as
ing;
s
ubstation d load
017 was
l results date of
capital s was a et to be 0 years. ndation.

Changi
South Asystem of syncprimaryemerginfurther Electricand Eleevaluat
There iassets optimisservicestechnolunknow
There igloballyaround system of this is
ESD asand theand ban
The Ca
Battery includinintermit
Therefoapplicatthan in generat
Given tdemonsand pofundingenergy
The Phsumma
ing Genera
Australia haworldwide.
chronous coy SA-Victorng system srenewable
city Market cectraNet aring possible
s, howeverand the ESing such sts – put siogy and ev
wn at grid sc
s a sense y it is clear
a potentiaof the futu
s likely ove
ssets are coere is a neenked.
ase for ESC
storage isng at the trttent large-s
ore, there istion of transSouth Aus
tion relative
he poor Phstratrion pro
otentially fro to leveragsector from
ase 2 concarised as:
Progressionominal rat
o Stato Sta
ation Mix
as one of th Given recoal and garian intercosecurity andeployme
could face re investigae solutions,
r, very limiteSCRI-SA Porage, as wmply, there
ven the bascale and uti
of urgencythat battery
al wave of re, while our the next fi
omplicated, ed to gain re
CRI Phase 2
s expected ransmissionscale renew
s an urgensmission levstralia, whice to demand
ase 1 businoject wouldom other sge the ESCm the funds
ept, based
n of an ESting of 10 - 2
tutory approkeholder m
he highest cent generats generatio
onnector tod market chnt. At somsuch issues
ating these of which en
ed practicaPhase 1 wowell as a gee is a lot sic planninglity standard
around thiy storage isstorage de
ur systems ve years.
offer more eal world e
2
to play an n level whe
wable genera
t need to dvel battery sch has word.
ness case red require adtakeholders
CRI-SA objegranted.
on the proje
SD demons20 MW and
ovals for theanagement
renewable tion dispatc
on in the So manage hallenges tme point ins. Currentl
challengesnergy stora
al experiencork has demeneral immato learn a
g, procuremd.
is and conss seen as a evices that and stakeh
services toexperience s
important ere it can sation.
develop reastorage. Thrld leading
esults, movdditional fus, with the ectives – b
ect develop
stration prod 10 - 20, in
e constructit of the proje
penetrationch experienState, and a
increasinghat will neen the futury the Austrs for Southge is poten
ce with the monstrated aturity in thbout the a
ment and op
sidering thekey renewwill be req
holders are
markets thso that proj
role in thesupport the
al world exhere is no belevels of in
ving forwardnding suppfocus to m
basically ge
ped in the P
oject at the cluding:
on of the asect;
n levels of ace, announan increasin
market ved to be ade every paralian Energh Australia tially one.
applicationboth a lev
he providersapplication perational is
e deploymeable enablequired to mnot prepare
an simple tects can be
e power syse integration
perience inetter place tntermittent w
d to implemeport, most lmaximise tht the most
Phase 1 bus
Dalrymple
sset;
P
any interconcements ofng reliance
volatility, thdressed to
art of the gy Market Owhich will
n of grid-scavel of comps of equipmof energy
ssues are r
ent of ESD er. This urgmanage theed – and th
time shiftinge both cham
stem of then of high l
n Australia to demonstwind and s
ent a Phaselikely from he impact for the ren
siness case
e substation
Page | 13
onnected f closure e on the ere are support
National Operator
lead to
ale ESD plexity in ment and
storage relatively
devices gency is e power e timing
g trading mpioned
e future, evels of
with the trate this solar PV
e 2 ESD ARENA of such newable
, can be
n with a

Given tbusines
The Coalso seformal A
Knowle
The Coresults includin
o Proshodowmod
o Theo A fo
comThe develo
o Marleas
o A reben
o Suplossthe and
o Freq
The develo
o Theo The
syno The
in thloca
o Sta
he poor busss case sho
Scaling dobenefits Revisiting texperienceExploring awith potent
onsortium iseking suppARENA Exp
edge Shari
onsortium haof the proje
ng: PresentatioPresentatioPresentatioPresentatioPresentatioPresentatio
curement oortlisted RFIwn, includindels, and coe productionormal busin
mmercial opopment and
rket tradingse arrangemeduction in
nefit of whicpply of exps of supply, Wattle Poin
d in parallel quency Con
opment of a
e evolution oe demonstrachronous g
e ability to phis instanceal rooftop PVkeholders’ v
siness caseortfall includ
own the siz
the benefitsd in South A
alternative cial ESD sup
s seeking toort from othpression of
ng
as as part oect and the
on at the Enon at the Auon to ARENon to the ARon to AEMCon to Energy
of equipmen Responde
ng the inveonfirmation n of legal coness case erations daimplementa
g (energy ament; n Marginal h would accected unseinvolving th
nt Wind Farsupply the ntrol Ancilla
testing and
of the functiation of theeneration in
provide targee the specifV generatiovisibility of t
e in Phase 1ing:
ze of the E
s of the ESAustralia commercialppliers
o reduce thher stakehoInterest for
of its Knowcase for Ph
nergy Storagustralian EnA and Gove
RENA AdvisC/ AER, Novy Storage A
nt and servents aimed estigation of the most
ommercial indecision to
ate of mid-2ation of a fu
and capacit
Loss Factocrue to AGLerved energhe islandingrm which wload; and
ary Services
d Knowledg
ional algorite role of en South Auseted value sfic interactio
on; and the asset in
1 the Conso
ESD to red
SD in light o
l framework
he businessolders beforr a Phase 2
wledge Sharhase 2 to a
ge World Foergy Storagernment Stasory Panel, vember 201Australia 20
vices througat driving thof alternatt effective anstruments o proceed w017. unctional alg
ty) underta
or for the WL; gy to the log of the ene
would remai
s to the mar
e Sharing p
thms to maxnergy storastralia; services toon with the
n terms of its
ortium is inv
uce costs
of the highe
ks to reduc
s case shore considerdemonstra
ring commitrange of st
orum, Melbge Conferenakeholders,November 5 15 Confere
gh further nhe capital aive delivery
asset configbetween pawith the pr
gorithm for
ken by AG
Wattle Poin
ocal Dalrymergy storagen in service
rket.
program wh
ximise overage in rega
renewable e Wattle Po
s function a
vestigating w
while still c
er market v
ce costs, in
rtfall to lessing whethetion project
tments prestakeholders
ourne, Sepnce, Sydney, November2015
nce, Novem
P
negotiation and operatiry and opeuration; arties; and roject with
the ESD ta
GL under a
nt Wind Fa
mple load fe device aloe at reduced
hich allows f
rall storage ards to the
energy genoint Wind Fa
and evolutio
ways to red
capturing s
volaltility no
cluding neg
s than 50%r to proceet.
sented the Ps in differen
ptember 201y, June 201r 2015
mber 2015
Page | 14
with the ng price erational
a target
rgeting:
an asset
arm, the
following ong with d output
for:
value; lack of
neration, arm and
n.
duce the
sufficient
w being
gotiation
% and is d with a
Phase 1 t forums
15 15

The prethe chaThe ESapplicatof reneSA Gov
The Coexperieto imple
PresentatioPresentatioPresentatio
esentations anging electSCRI-SA prtion that wo
ewable enevernment.
onsortium hence with thement a Pha
on to AEMOon to the Vicon to the So
have genetricity indusroject has bould supporrgy. This in
has receivehe applicatioase 2 demo
O, Novembectorian Govouth Austral
erally been stry environbeen widelyrt the operancudes stat
ed general on of a tranonstration p
er 2015 vernment, Nlian Govern
well receivment and h
y quoted anation of the tements in
support fonsmission leproject.
November 20ment, Dece
ved as timehave genernd referred
future powpublication
or the impoevel ESD in
015 ember 2015
ly, informatrated considto as an e
wer system ns by the A
ortance of n South Aus
P
5
tive and relderable disc
example of and the int
AEMC, AEM
gaining reastralia and
Page | 15
evant in cussion. an ESD egration MO and
al world pushing

2.
The Enproject businesSouth Aby the consort
The Pro
The Pro
To helpwhich im
2.1
This dothe Fun
INTRO
nergy Stora(the Proje
ss case for Australian re
Australiantium (the Co
AGL Energeneration ElectraNet(TNSP) in SWorleyParSydney wh
oject is struc
Phase 1 –(ESD) in ARENA’s EPhase 2 –“Project” u
oject has a
demonstraNEM test that smarkets if prove thatoutput andresolve thincluding t
p meet thesmpact the E
the regulatsiting of suthe commestate of thethe resultiSouth Austhe commsensitivitie
Context
ocument is tnding Agree
DUCTIO
age for Comect) was inuse of medegion of then Renewabonsortium) c
rgy Ltd - aand retail, w
t - ElectraNSouth Austrrsons - Wo provides
ctured as tw
– investigatiSouth Aus
Emerging R– procuring, under AREN
number of k
ate that ene
such a faccombined wt the technod a functionahe commerhe identifica
se objectiveESD busine
tory environuch a deviceercial framee art and exng function
stralian contercial busin
es
t and Purp
the Generaement betwe
N AND S
mmercial Rnitiated in Sium size (5-
e National Eble Energy consisting o
an S&P/ASwho has beNet is the ralia orleyParsonservices to
wo phases:
ing the busstralia, whiRenewables
delivering aNA’s ERP, d
key objectiv
ergy storage
ility can hawith a netwoology involval sense rcial framewation and re
es, the Phasss case, in
nment undee and what ework that thxperience innal specificatext ness case
pose of thi
l Project Reeen ARENA
SCOPE
Renewable September -30 MWpk) n
Electricity My Agency (of:
SX 50 listeeen operatin
principal T
ns is an Sthe energy
siness case ch has be
s Program (and testing depending o
ves, includin
e increases
ave a comork and/or sved can m
work on wemoval of a
se 1 work hparticular:
er which an value streahe ESD wonternationalation and p
for ESD de
is Report
eport, a keyA and AGL.
Integration 2014 and
non-hydro eMarket (NEM
(ARENA),
d energy cng in AustraTransmissio
S&P/ASX 1y and resour
for deployieen progre(ERP) the ESD as
on Phase 1
ng to:
the value o
mercial rolsystem anceet utility s
which such ny current r
has been in
ESD wouldams can be uld be operly in non-hyprocuremen
eployment
y deliverabl
South Ausd has beenenergy stora
M). The Prohas been
company calia for over on Network
00 listed crces sector
ng an Enerssed as a
sset, possiboutcomes
of renewabl
e within Aillary servicstandards b
assets woregulatory b
nvestigating
be owned captured
rated withinydro energynt of such a
and the as
e for Milest
P
stralia (ESCn investigaage sited woject, in par
undertake
covering ex175 years
k Service P
company b
rgy Storagea “Measure
bly progress
e energy w
Australian ece value both in a q
ould be debarriers
g a range o
and operat
n y storage syan ESD wi
ssociated ri
tone 5 acco
Page | 16
CRI-SA) ting the
within the t funded n by a
xtraction,
Provider
based in
e Device e” under
sed as a
within the
lectricity
uality of
eployed,
of issues
ed
ystems ithin the
sks and
ording to

The purenewa
Summawell as as the wthose e
This ReSection
2.2
Since ttechnola decison the rscale p
A basicof Desivarious remaine
rpose of thable energy
state-of-theengineeringessential ecommercia
aries of the specific upwork has p
earlier repor
eport shouldn 8, and refe
Basic ES
the start ofogy would
sion made brelatively smumped hyd
c descriptionign docume issues of ed largely u
the ability site (the Sany requirsystems oconversionconnectionvoltage of works” eleany requirisolation/oa Supervimachine inrequired Pdata sourcfor the benan earthingconnectionany requirprotection stations, ean operatoa maintenaany roadsequipment
his Report ienabler wit
e-art globallg, regulatorlements of t
al framework
previous Mpdates to eaprogressed. rts.
d be read ierred to in th
SD Conce
f the Projecbe considebefore the Fmall energyro unecono
n of the highent [1]. Wdeploying
unchanged,
to store andite) within Sred convertor any othn to/from elen(s) to the S
33 kV to pctrical suppred switcheperation/intsory Contrnterface at
PABX and/oces or contrnefit of the og system inn to municipred safety sor fire-fightxhaust fans
or office andance storag/civil workst at the Site
is to providthin the NEM
y y and sitingthe businesk that could
ilestone reparlier Milesto
This will c
n conjunctihe text.
ept
ct, the Conred althougFunding Agstorage qu
omic.
h level concWith time, th
an ESD bconsisting
d release eSouth Austraters, accumher device ectrical eneSouth Austprovide botply es or electteraction witol and DatSite and c
or data conol signals aowner and wcluding ligh
pal water sesystem to cting systems, emergencd staff amenge and any s required t
de an overvM, including
g issues thass case andd be used
ports are incone report dconsolidate
ion with a n
nsortium hagh it specificgreement wuantum targ
cept for thehe details obecame cleof:
electrical enalia
mulators, gerequired f
ergy tralian electth electrical
trical protecth the netwota Acquisitconnection nnection), aas part of thwithin accephtning proteervices comply with , emergenccy egress pnities required woto give acce
view of the g the:
at need to bed sensitivitie
cluded for rdeliverables unresolved
number of r
as been necally exclud
was signed weted, which
ESD was pof this Basearer. Howe
ergy, locate
enerators, tfor the saf
trical transml storage in
ction equipork tion (SCADto various nd which ce control stptable stand
ection
relevant sacy personnepoints and b
orkshop facess to and
role of En
e addressedes, and
reference ws that have d issues for
references
eutral to whed large scwith ARENAh was expec
produced veis of Desigever, the b
ed at a secu
anks, safetfe storage
mission netwnputs/output
ment to al
DA) system external pa
can also intrategy, anddards while
afety standael wash-dowbreathing ap
cility allow insta
P
nergy Stora
d
within the Re only becomr example
noted and
hat energy cale pumpeA. This wacted to mak
ery early ingn changedbasic ESD
ure area at
ty release (of energy
work at a mts, and a “u
llow safe e
with a huarties (throuteract with
d operate the unmanned
ards such awn facilities,pparatus
allation of t
Page | 17
ge as a
eport, as me clear noted in
listed in
storage d hydro, s based
ke large-
a Basis d as the concept
a single
(energy) y and/or
minimum used on
electrical
uman to ugh any external e facility
d
as a fire first aid
the ESD

The acmechangases, to be ehydroelenergy
The Bawithin tAustralimanualwould Standar
The initleverag
It was ato deveand tecin Austr
In the inand tradlegally oto invesbusinestype in
2.3
There istoragedescrip
1 TypicAustrCons
any securiany envirospillage co
ctual energnical kineticor a combilectrical eneectric desig(water head
asis of Desihe environmian Standarly, dependbe designerds that app
tial functionaed three po
the time-sAustralia the provisServices (anetwork sesystem
anticipated telop a positchnically. Aralia previou
nitial conceded, whereoperated wstigate andss case for the NEM.
Nomenc
s a wide rae technologtion of that
cally called ralian Energsortium
ty fencing aonmental prontainment
y storage c energy, cnation of thergy. It wagn, meanind) or releas
gn also notmental and rds; would hing on opeed to operply in South
al concept wotential serv
shifting1 of
sion of marand others)ervices – i
that it wouldive busines
As far as theusly for any
ept, it was ue it would siithin the NE answer tha potential
clature Us
ange of nomy. For theused throug
energy “arbgy Rules (A
and/or secuotection eqand/or vola
form was chemical enhese, althouas noted in ng it will nosing energy
ted that theoperationa
have the aberator requrate in acc
h Australia.
was for the vices or valu
energy ge
rket ancilla) defined witn this case
d be necessss case ande Consortiu
y grid-scale
uncertain wited, what sEM regulatohese questioPhase 2 pro
ed in Rep
menclature e purposes ghout the P
bitrage”, but AER) the te
rity equipmuipment inc
atile materia
not specifinergy and/ough the primthe Basis o
ot be storinthrough a w
e ESD woual conditionsbility to opeirements acordance w
ESD to stoue streams,
enerated b
ary servicesthin the ma
e, providing
sary to captd that this mum is awareenergy stor
ho would osize it wouldory framewoons, and to
roject that w
port
used throuof this Rep
Project.
as this termerm “time-sh
ent cluding bunl containme
ied and coor potential mary input aof Design thng energy iwater driven
ld be desigs of the Siterate autonond/or modewith any a
ore and rele, namely:
by AGL’s w
s, such as rket rules
g value to u
ture multiplemight provee, these charage device
own the assd be and eork. Phase o use that
would build a
ughout the lport, Appen
m also has hifting” has
ds, emissioent/storage
ould be in energy su
and outputshat the ESDn the form n turbine.
ned to withe and accoromously, see of operatpplicable H
ase energy
wind farm
Frequency
users of th
e value stree difficult legallenges hae connected
set, how it wven if such1 of the proinformationan ESD ass
literature inndix A (9) p
a separate been used
P
on capture m
the form ch as com
s of the projD would be of water p
hstand and rding to all
emi-automattion requireHealth and
y in a manne
portfolio in
y Control A
he SA trans
eams such agally, comm
ave not beed to the NEM
would be coh an asset coject set ou
n as the baset as the fi
n regards toprovides a
meaning wd by the ES
Page | 18
material,
of heat, pressed ject was
e of non-potential
operate relevant tically or ed, and; d Safety
er which
n South
Ancillary
smission
as these mercially n tested
M.
ontrolled could be ut in part asis of a rst of its
o energy general
within the SCRI-SA

3.
The intelargely the emeon tradialso drlinking f
At leastwind faand lowtechnolregulatovarious investmbut the
As reneelectriccharact“synchrtechnoldependrenewa
Wind apenetrainvolvedterms odifferensmaller electrica
For a tunits wsuch retraditionhas bee
Howevesituatioresultinstandarprefereelectrica
For exabetter mimpactsunless the incuclosure
RENEW
egration of driven by Gergence of itional electiving renewfrom being
t in the shorm and roofwest risk oogy pricesory, market bioenergy
ments in hydexact deplo
ewable eneity has beteristics of ronous” genogies. Wh
ding on opeable resourc
nd PV are ation into eld, for theseof power rant inertial cr facilities, wal topology
raditional eith large roenewable enal interconen relatively
er, as penen becomesg electricityrds, but eqnces that dal systems
ample, the amatched tos (and possa system loumbent gen, which can
WABLE E
renewable Governmencomplementricity sectorwable energreliant on p
ort term a laf-top photovoptions. In fall furthe and financ
y projects, dro-electric oyment traje
rgy generaten generathermal a
neration capile bioenergerations an
ce input whi
consideredectrical sys
e generatorsamp rates,
characteristiwhich in theand are lar
electricity sytating inerti
energy can nnected eley straightfor
etration of rs more comy systems toqually impodrive electricfrom such c
ability for dio the genesibly lead toad is increaneration fleen have a pro
ENERGY
energy intot climate ch
ntary technor business mgy investme
policy and ris
arge share ovoltaic (PV)time this
er, as socice environm
solar-thermfacilities anectory and m
tion grows, ted in Ausnd gas tupacity, this gy can provnd heat stoch, while it
d as intermistems increas also have transient cs and rese case of rrgely not co
ystem desigia, and smagenerally
ctricity systrward as a c
renewablesplex. This o remain st
ortant are ccity sector cchange.
screte loadration sourto a lower asing, polic
et, eventuallofound impa
Y CONTE
o Australia’hange policologies andmodels, givent. As a sing on its o
of this incre) technologymay chang
ial-license-tments adjustmal technond even othmix will dep
there are testralia for orbine technis not necevide similarorage, bothcan be pred
ittent generase. Interme different cresponses,
sponses torooftop PV ntrollable in
gned arounaller, fasterbe well actems to absconsequenc
s increases complexity
table and schanges inchange. Th
control thrrce, which cost and m
cy to drive mly leading toact on syste
XT
’s electricitycy. More r customer cing rise to dconsequen
own comme
easing reney, which proge as our to-operate t. Hence, llogies, urber newer te
pend on ma
echnical issover 100 ynologies, inessarily the r capacity ah wind anddicted, cann
rators and mittency thocharacterist, the ability system faappear hig
n any forma
nd larger, cr response ccommodatsorb intermce.
and traditioy is a resultecure withi
n the markhere are bo
ough smartcan soften
more dynammore renewo changes iem operatio
y supply harecently thechoice is alsdisruption ance, renewaercial terms
ewable geneovide argua
electricity issues playarger utility
ban PV witechnologiesny issues.
sues to manyears and n that theycase for th
and solar-thd PV outpunot be contr
bring new cough is onlyics to tradity to supplyaults. Theyhly distribul way.
centralised tbalancing ued. World
mittent renew
onal generat of the techn acceptabets, loads,
oth positives
t devices al the renew
mic retail owable genera
n their operns.
P
as been ince lowering oso putting pnd change able energ
s.
eration will ably the low
systems ry out and
y scale PV pth storage,
s are also p
nage. Whilehas many
y can suphe other renhermal to aut are dictrolled.
challenges y one of thetional geney reactive y are also
uted through
thermal geunits, the imdwide the awable ener
ation is rethnical abilit
ble quality opolicy and
s and nega
lows the loawable intermoptions). Hation will imration, or ev
Page | 19
creasing, of costs, pressure which is y is de-
be from west cost respond,
as the projects, further robable,
e hydro-y of the ply firm newable n extent tated by
as their e issues ration in support, usually
hout the
neration mpact of ability of gy input
ired this ty of the
of supply d social tives for
ad to be mittency
However, mpact on ven their

In Ausstraightboth thecomplexAustrali
3.1
South Ato demaenergy and eleregion gAustraliintercongeneratpenetra
stralia, thetforward, alte market anxity where ia being the
South A
Australia haand. Of thegeneration
ectrical loadgeneration ia was onnnected systed for the
ation approa
Figure 3‐1
e growth though on tnd regulatedalternative
e region of t
Australian
as world leae NEM regfrom wind . Figure 3-– essentia
n average stem. The
State are aching 40%
1 – Historical w
of renewahe NEM thed business solutions mhe NEM mo
Context
ding levels ions, Southand solar a-1 shows thlly the windclose to 3general trenshown in.
wind generation
able energere have beside. Some
may be neeost likely to
of intermitteh Australia has a percenhe wind ened penetratio35%, whicnds across Figure 3-2
penetration in
gy into meen implicate issues are
eded as renexperience
ent wind anhas the higtage of both
ergy contribon – which ch is high
generation, which ind
n selected NEM
arkets hastions and che beginning
newables ine this first.
nd solar PV hest penetrh installed gution as a pat the endby world
sources indicates aver
regions to end
P
s been rhanges reqg to reach ancrease, wit
generationration of rengeneration cpercentage of 2014 fostandards
n terms of erage PV a
d 2014, [2].
Page | 20
relatively uired on
a level of th South
n relative newable capacity of NEM
or South for an
lectricity nd wind

South Ain 4 hourate ovforecasto insta
Figure
2 Whileindus
Figure 3‐2
Australia alsuseholds no
ver the last st for residell small ene
e 3‐3 – Forecast
e not explicitstrials
2 – Historical e
so has the how having 18 months
ntial and coergy storage
t future residen
tly defined in
lectricity gener
highest takegeneration s of over 1ommercial2
e systems, [
tial and comme“Integrated
n [5], “comm
ration in South
e-up of urbafrom PV on
10 MW perrooftop PV [5].
ercial PV installPV and Storage
mercial” is int
Australia, by fu
an rooftop Pn their roofsr month, [4systems, in
led capacity fore Systems”. Fro
erpreted as
el type, to end
PV systemss, with an a]. Figure 3-ncluding tho
r South Australiom [5].
businesses
P
2014, [3].
s in Australiaaverage ins-3 shows aose which a
ia. Here IPSS re
not conside
Page | 21
a, with 1 stallation a recent are likely
efers to
red large

It is woEnergy demandrooftop minimuAustralirooftops
As reposystem 2014, 1penetra
South Ageneratplannedindicatequantumand 500
Figure 3
orth putting Market Op
d of 790 MWPV. AEMOm demandian system s.
orted in [7]demand w
109% of syations of gre
Australia is tion. Figurd projects we a potentiam, with AEM0 MW of PV
3‐4 – South Aus
this uptakeperator (AEW comprisiO concludedds would b
load would
, wind contwith significaystem demaeater than 7
still attractire 3-1 showwhich have al wind farmMO and EleV on-line by
stralian generaproposals an
e of renewaEMO) report
ng 1,235 Md that, basee completed at times
tribution is ant overall aand was s
75% occurre
ng significaws the exisbeen flagg
m portfolio ectraNet, [7]
2020.
tion capacity atd retirements,
able generated a meas
MW of user ed on curreely met by be covered
already oftaverage peupplied by ed on sever
ant developsting State
ged to be dof around ], predicting
t August 2015, [9]. Note this d
ation in perssured Southdemand ofnt trends, brooftop PV
d by solar
ten exceedienetrations.
wind in Soral days in 2
ment interegeneration
eveloped athree times
g in 2014 an
showing currendoes not includ
spective. Inh Australianffset by 445by 2023-24 V, meaninggeneration
ing 100% o At 4:15am
outh Austra2014.
est for moren portfolio ond commiss the curren additional
nt portfolio by tde rooftop PV.
P
n [6], the Aun system m5 MW of essystem ope
g the entire on, mostly
of South Aum on 28 Sealia, while
e renewableof 4,753 M
ssioned. Font wind gel 1,000 MW
technology and
Page | 22
ustralian minimum sentially erational e South y, urban
ustralian ptember average
e energy MW, and orecasts neration
W of wind
d known

Figure have anState. retiremestationscapacityMW ‘A”being w
The remin termcertain in theormean insome rpricing.
Such geboth AEthe StacircumsState-wthe timefrequenvoltage services
South AFigure link. plannedconstratermina
In [7], potentiaand/or complenon-crebetter ucircums
Since [7has beeenergy South Ain the m[8], whic
3 AC is A
3-4 also indn impact onThis is the
ent around s at Port Ay in early 2” station in
withdrawn fr
moval of sums of energ
generation ry this shouncreased venewable o
eneration cEMO and Eate, [7]. stances wh
wide outagee – this is bncy control control. Ws at the leve
Australia is 3-5, being It should b
d to be inaints will stilal stations.
with low oal scenariosgenerator te disconne
edible contiunderstandistances to e
7] was written confirmeplant deve
Australia at most recentch indicates
Alternating C
dicates a vn the abilitye recent re
the end ofAugusta, the2016 and T
2017 whicrom the syst
ch generatigy pricing w
technologiuld resolve volatility in toptions, alth
change alsolectraNet inThis studyere zero o to occur, dbecause syand contrib
Wind and sels required
connected the twin cir
be noted thcreased byl exist at tim
r zero syncs involving shedding,
ection of thngency, theng the role
ensure that
en, the retired making lopment. Atimes when
t update to s that this s
Current; HVD
ery importay for furthemoval of thf March 20e planned
Torrens Islach, in total, tem.
on has a nwhich, as tes and relato give the
the market hough this
o impacts onn 2014 study indicates r very low depending oynchronousbute significsolar PV pld.
to Victoria rcuit AC3 cohat the Heyy 190 MWmes in the t
chronous gthe Heywoor even a
he Heywoode study recof rooftop system sec
rement of sthis situati
lso, there hn there is athe Electricituation is li
DC is High Vo
ant shift in ter renewablehe 240 MW16 of the 5mothballing
and plans towill result
umber of imthe market ated networe best outco
which coulwould dep
n the dynamied this in re
that therelevels of s
on the confgenerators
cantly to maant cannot
through twonnection vywood Inter
W in 2016 transmissio
generation ood intercona state-widd interconncommendePV and the
curity can be
significant syion more chave been aa credible ricity Statemeikely to dete
oltage Direct
the South Ae energy g
W Playford 546 MW Nog of 239 Mo mothball in 1505 MW
mpacts incluresponds,
rk investmeome for conld favour faend on a r
mics of the elation to ree may be ynchronousfiguration ans provide neaintaining sy
currently p
wo high voltvia Heywoorconnector‘sto that sh
on network b
on-line thennector thae power oector whiled a range
e inertia in se maintaine
ynchronouscentral to tha number osk of separent of Oppoeriorate unle
t Current
Australian peneration dB, and ann
orthern, botMW of Peliits conventW of synch
uding potencan chang
nt decisionsnsumers, it ast respondrange of fac
South Austenewable en
the potens generationd portfolio early all of ystem fault provide suc
tage intercood, and the s nominal town in thebetween Pa
Study shot may lead
outage. We in operatio
of prudentspinning wined.
s generationhe issue ofof high FCAration from ortunities puess new sol
P
portfolio whdevelopmennouncementh coal firedcan Point’s
tional gas-fihronous ge
ntial market ge and pres. While ut could for eding gas plactors includ
tralian systenergy integntial under n are on-linof plant ruthe system
t levels andch system a
onnectors sMurraylink
transfer cape Figure, hara and Sou
owed a nud to significaWhile prese
on is consit actions, innd turbines
n in South Af further ren
AS pricing ethe NEM, aublished bylutions eme
Page | 23
ich may nt in the nt of the d power s CCGT ired 480 neration
impacts eference ltimately example ant over ding gas
em, and ration in
certain ne for a nning at
m inertia, d system ancillary
shown in k HVDC3 pacity is however uth East
mber of ant load ntly the dered a ncluding
s in such
Australia newable
events in as noted y AEMO, erge.

While temergecontingprovidegenerat
This matied in pthe reneissues wthe basinto the
he exact pe may be mency risk. E
e a range otion time-sh
ay mean thpart to the ewable enewill also em
sic technicae future acro
ath is unclearket basedEnergy storof additionahifting, whic
hat the futuintroduction
ergy generamerge there
l issues remoss these re
ear and thed incentivesrage may beal services h in combin
re of more n into that mation portfoli. While themain, meanegions.
ere are a rs to providee capable othat simila
nation may m
renewablemarket of enio expands
ere are signning that en
range of poe system seof providing arly supportmake a com
e energy genergy storain other regificant differergy storag
otential soluecurity servi
such servict renewable
mmercial ca
eneration inage. Extrapgions it is prences betw
ge may have
P
utions, one ices to allevces – and me energy, s
ase attractiv
n South Auspolating forwpossible thaween NEM e a very bro
Page | 24
thing to viate the may also such as
ve.
stralia is ward, as at similar regions, oad role

Figure 3‐5 –– South Australian transmissio
on and generatiion system. Image constructe
P
ed from [10].
Page | 25

4.
4.1
The ESundertadefinedshows significa
These ccollectivneededcommethe tecdevice. busines
As ESboundathere wpumpedwhat is streamsprocess
METHO
Previou
SCRI-SA woaken largely in the AREthese core
ant interacti
Figure 4‐
core elemeve knowled
d addressinercial and rehnical and These iss
ss case cou
CRI-SA invaries, and inwere few pd hydro opeclear from
s is a new s for a busin
ODOLOG
s Mileston
ork was divy in paralleENA Fundine elements ion between
‐1 – Consortium
nts were idge of Cons
ng in the coegulatory ensocial env
sues combinuld be obtain
volved a nnvolved tecrecedents terates alreathe work unconcept w
ness case, f
GY & APP
nes
vided into cel, but repng Agreeme
and the rn them.
m structure sho
entified dursortium memontext of thnvironment ironment thned to set tned.
number of chnologies to follow. ady on the ndertaken iswith complefor example
PROACH
ore “work bported chroent. The Coresponsible
owing the core w
ring the prembers and he Australiathat the as
hat would lathe procure
f new conconly just eWhile eneNEM and ss that grid-s
ex paths. Te.
H
breakdown nologically onsortium sparties alt
work elements
-proposal sperception
an electricisset would bargely dictament pathw
cepts whicmerging in rgy storage
some batterscale storagThere is no
structure” eaccording
structure, shthough in p
and responsibl
stage to ARof the like
ty sector. be operatedate the phyway so that
ch crossed commercia
e is not nery systems ge leveragino straightfo
P
elements thto the Mil
hown in Figpractice the
le parties.
ENA, basedely ESD iss
This includ within, as
ysical naturekey metrics
traditionaal settings gew to Austrhave been
ng multiple orward optim
Page | 26
hat were lestones
gure 4-1, ere was
d on the ues that ded the
s well as e of the s for the
l sector globally, ralia, as trialled, revenue misation

A resulvarious requiredinto accthis wothe Apsumma
ESCR
MilestRegul
Milest
Site S
MilestComm
MilestEnergthe Ar
Reque– Invit
Energ– Spe
The woand primSectionPhase 2
The appPlease method
lt of this, n stages of d draft repocount the firk are presependices.
arised in Tab
RI-SA Outpu
tone 1 Repatory Review
tone 2 Repor
Selection
tone 3 Repmercial Fram
tone 3 Repgy Storage Srt Report
est for Infortation
gy Storage ecification
ork presentemary object
n 6. Once 2 project co
proach andrefer to
dologies, an
not fully apf the core orts to be dndings fromented in Se The key ble 4-1 belo
t De
port – w
A ran
rt – A sitithean
port – ework
A rtheund
port – State of
An curthePha
rmation
Theto sa sPhaand
Device
A resproscoproexp
Table 4‐1 – F
ed in Sectiotive of the Ethat Busine
ould be mad
methodolothe other
d other ESC
preciated aelement weveloped fo
m subsequeection 5, witreports an
ow.
scription
review of theESD asset
description ng, the meth
e short-list of ESD at thes
review of thee ESD includder which the
investigationrrently in useeir potential ase 2
e invitation tsupply informshort-list for ase 2, and fod services fo
high level spondents toocess were ope of work, ocurement anpected siting
Formal delivera
on 5 provideESCRI-SA ess Case ade and this
ogy adoptedr MilestoneCRI-SA inte
at the comwork were sor each Mileent reports.th a summa
nd outputs
e regulatory
of the issuhodology usef final sites, ase sites
e potential coing ownershe asset woul
n of the enee internationa
for use for
to the energymation that w
potential enor the purpos
or the Phase
specificatioo the Reque
quoting agafunctionality
nd delivery c and environ
ables developed
es the backPhase 1 w
and its sensis described
d to preparee reports erim outputs
mencemenstrongly iteestone, whi The maiary of the ware refere
environmen
ues consideed in the sitiand the pote
ommercial frip and commd be operate
rgy storage ally and in Ar the ESCR
y storage vewould be usengagement inses of costin1 Business C
on for theest for Informainst, in tery, engineerincontracting enmental cond
d during the ES
kground of tork, the bu
sitivities wed in Section
e the businefor their
s, as conso
t of the prrative or inich were then findings a
work undertaenced in S
nt in regards
ered aroundng selectionntial value of
ramework formercial termsed
technologiesAustralia, andRI-SA project
endor marketd to producen ESCRI-SAg equipmentCase
ESD thatmation (RFI)rms of ESDg standards
expectationsditions
CRI‐SA work.
the main thsiness casere understo
n 6.
ess case is srespective lidated in T
P
roject was nterdependen updatedand concluaken behin
Section 8, a
ReferencSection 8
s [11
d , f
[12
r s [13
s d t
[14
t e A t
[15
t )
D , ,
[16
heme of thise, which is ood, the ca
summarisedapproach
Table 4-1.
Page | 27
that the ent and
d to take sions of d this in and are
ce in 8
]
]
]
]
]
]
s Report given in se for a
d below. es and

4.2
A primalarge-scbegan asset minfluencissues outcomcase wo
One of can becapabilto own capabiloptimisathis com
The sitassessethese sscreeniThis ressubstatthe rem
The rev
Howevestoragetechnoltechnolthis infoInforma
The Cocommethe asshow suframewcommeof provvalue of
Busines
ary objectivecale ESD aduring the must first ced who coare inter-rees of core ork.
the key lea. There isity and costthe resultinities, and soation procemplexity.
te selectioned all 88 osites down ng in whichsulted in a ion (Yorke
maining itera
venue analy
responsive (i.e. 5 minuable to opeable to stoself-discha
er, being coe equipmenogies consogies still s
ormation spation during
ommercial ercial framewset would buch econom
work drivingercial structuiding a netwf which cou
ss Case A
e of the ESasset. The
Milestone be feasible
ould own theelated, the elements to
arnings froms very signt which influng project. olving this iss, which a
n report, [1of ElectraNeto some 1
h possible rshortlist coPeninsula)
ative selectio
ysis sugges
enough ute dispatcherate indepere significarge
ommerciallyt which is idered in thsubject to fpecifically so
the Milesto
Frameworkwork for the
be operatedmic benefit g the commure as one wwork suppo
uld be captu
pproach
SCRI-SA studevelopme1 Regulatoe within the asset and
Consortiumo ensure a
m the ESCRnificant inteuences whe
Energy stonterplay as
aims to find
12], the suet’s transm6 substatiorevenue stromprising Pand Monason process
ted that the
to be di periods)
endently of tnt quantitie
y focused, relatively m
he researchuture cost ought in theone 3 period
k report, pe ESD includ. It conside
could be dmercial benwhere the Tort function ured by a ma
udy was to ent of this reory Review he existing d so forth thm continuan efficient o
RI-SA Phaserplay betwere the best orage techns a result tathe most ef
ubject of tmission subsons, whichreams werePort Lincolnsh substatioinvolving te
e technology
ispatchable
the grid infres of energy
the ESCRImature and h and develoimproveme
e procuremed.
part of Miluding owneered the podistributed nefit. The TNSP ownsas well as
arket partic
undertake aequired a hwork, [11],regulatory
hrough the ally had to outcome wa
e 1 work isween service
site for thenologies cankes significffective com
he Milestostations uswere then
e identified, n substationon (Riverlanechnology a
y should be
on the
requently –y for severa
I-SA Projec“off the sh
opment domnts (estimaent process
estone 3,rship and c
otential souand descrianalysis id
s and operas serving ancipant under
a business ighly iterativ as the op
y environmestudy elemiterate ba
as presente
how compe value, fuasset is an
n have verycant effort. mmercial res
ne 2 subming generasubjected characteris
n (Eyre Pennd) which pand function
:
National
that is, islanal hours or
ct specificalhelf” and somain. It didated forward, undertake
[13], reviecommercial rces of ecobed the kedentified thates the ESn energy trr agreed co
P
case analyve approac
peration of sent and th
ments. As aack and aded for the b
plex these itunction, tecnd even whoy different teThe businesult, must d
mission to l criteria toto a seconsed and quninsula), Daprovided a fn.
Electricity
nd electricar days with
lly targetedo it did notd, however,d cost curven as a Req
ewed the pterms unde
onomic beney elementshe most pr
SD with the rading functmmercial te
Page | 28
ysis for a ch which such an his then all of the djust the business
terations chnology o is best echnical
ess case deal with
ARENA o screen nd stage uantified. alrymple focus for
market
ally minimal
d energy include
include ves) with quest for
potential er which nefit and s of the romising purpose tion, the erms.

The Tetechnolenergy cost estogetheestimatresultin
From thESCRI-neutral life of 2matchebetwee(+/- 25%
The en(RFI) prand resestabliscapabilAppendfurther full tend
The NPNPV refacility aof the o
Further (less co(Wattle of the Srenewaparticulwind peimprovesuch a
Given tcapacityowner.
The promodellioperatioConsor
chnology Rogy has its relationshi
stimates froer with the es to be cg calculated
his work the-SA projectbasis for a
20 years) ones that typicn technolog
% capex an
ngagement rocess throsulted in 17shed usingity and co
dix E). Shoproof-of-co
der process
PV analysisemained negat the lower
order of 10 y
r work on thostly), its EPoint) and
SA grid in able generaar, were alsenetration ied understasituation is
the preliminy of the ES AGL was n
oject busineng with eons and mrtium’s own
Review, also own inhereps, depth oom public revenue strcalculated fd NPVs all w
e various bat. Howeven ESD (pown a turnkeycal of electgies using ad opex cos
with the mugh a form
7 responsesg technologommercial auld Phase 2ncept discu
s.
s was updagative in alr end of theyears.
he site seleExpected U
its networkthat Yorke
ation. Theseso seen to increases aanding of thvaluable.
nary CommeSD and thenominated a
ess case westimates omaintenanceproject dev
o part of Milent characteof dischargedomain soream estimfor each ofwere negat
attery/fuel cer, it was dewer rating 5y Engineer rical plant da cost, benet estimation
marketplace al RFI Invitas from intergy suitabilacceptability2 proceed, ussions, lea
ated with tel cases. Th
e cost range
ction identinserved Enk characteri
Peninsula e last two align with t
and less efe contributi
ercial Framabove site
as the energ
was based of engineee (O&M)
velopment e
lestone 3, [eristics (e.ge, number ources and
mates allowef the ESD tive.
ell technoloecided to g5 to 10 MWProcure andelivery inefit and riskn accuracy)
was undeation, [15],rnational suity, maturiy selectionit is expecte
ading possib
echnical andhis outcomee to be ope
fied Dalrymnergy revenistics - in farelies on a
points and the renewafficient powon (e.g. fre
mework findie selection, gy retailer.
on historicaering, procucosts infor
experience.
14], recogng. responseof cycles e
d internal ced prelimin
candidate
ogies seemego to the m
Wpk, energy nd Construc
Australia. k analysis bcould be u
ertaken usinand RFI Pe
uppliers. A ty, whole-o
n criteria (red that thesbly to a red
d financial e caused thrated as a
mple as the nue benefitact, this sitea single fee
the focus able energywer stations
quency con
ngs (MilestElectraNet
al unservedurement armed from
ised that ea time, capa
etc.) and prcost databaary Net Pretechnologi
ed to providmarket placrating 20 to
ct (EPC) coFollowing
based on vendertaken.
ng a Requeerformance
shortlist ofof-life costrefer to evse companiduced short
vendor supe Project todemonstrat
preferred s, its proxim can be seeeder and hon a demoobjectives
retire in Sntrol) that an
tone 3), thet was nomin
d energy annd constru
the RFI
P
ach energy acity range, rovided preases. Thesesent Valueies and sit
de the best ce on a teco 200 MWhontract basisthis, a com
endor suppl
est for InfoSpecificati
f 8 compant, project valuation mes will be in
tlist to proce
pplied data o focus on tion plant w
site, given imity to a wien as a mic
has significaonstration pof the proj
South Austrn ESD can
e selected tenated as th
nalysis anduction (EPprocess; a
Page | 29
storage power /
eliminary se costs e (NPV) es. The
fit to the chnology , project s, which
mparison ied data
ormation on, [16],
nies was delivery
matrix in nvited to eed to a
but the an ESD
with a life
its scale nd farm crocosm ant local plant, in ject. As ralia, an make in
echnical he asset
d market PC) and and the

5.
This sepreviouprocuredeliveraReportsnature othe bus
The prdiscuss
5.1
The Micomprescale e
Since thcommeconsideAEMC’sfurther summawith reg
SUMMA
ection provisly to ARE
ement and ables to ARs, there werof the work
siness case
revious wosed in turn b
Regulatory Site SelectCommerciaState of theSpecificatio
Regulat
ilestone 1 ehensively cnergy stora
Generator and whetheMarket vs nwhether it generation Use of sysconnected transmissioAncillary separticipate suggested amounts ofTNSP ringtransmissiorevenue of
he report wercial frameeration of ths project to context an
ary builds ogards to the
ARY OF
des a sumENA in Mile
technologRENA are lisre a numbe– this resoof Section
rk undertabelow:
Overview; ion; al Framewoe Art Reviewon and Proc
ory Overv
Regulatorycovered all tage device (
registrationer the outpunon-market
receives behind a co
stem chargto a distri
on system, uervices – th
in frequenthat the maf intermitteng fencing –on assets athe project
was written, ework and he regulatoinvestigate
nd confirman the Miles
e regulatory
PREVIO
mary and estones 1-3gy selectiosted in Tabler of remainlution is und6.
ken is sum
rk; w; and curement.
view
y Overview the areas o(ESD) in the
n – for an Eut is schedut – in the camoney fromonnection pes – for Ebution netwuse of systehe technicalncy controarket for freqnt generatio– TNSPs are used bdoes not ex
the consorsite choic
ry framewoe the impactation of thstone 1 Reg
framework
OUS MILE
update of t3 under theon work thle 4-1). In p
ning uncleardertaken he
mmarised
report, [11of regulatione NEM. For
ESD, registuled with AEase of ESDm the poopoint. SDs, use o
work. If an em chargesl nature of l and blacquency conn, which reare allowe
by others foxceed five p
rtium has hace for theork. Meetint of storagee key regugulatory Ovk for ESDs.
ESTONE
the key woe Project’s hat has oparticular, ar areas to bere in terms
into the fo
1], was wrn relevant tor example:
tration categEMO. s this refers
ol or is no
of system cESD is cl
s would not ESDs sugg
ck start anntrol is likelypresents an
ed to enteor market oper cent of
ad the oppo ESD, wh
ngs with AEe devices onulatory con
verview repo
FINDING
ork undertakFunding Ag
occurred sias noted in e resolved
s of the fina
ollowing se
itten in Noo the implem
gories will
s to its staton-market a
charges maassed as aapply.
gests they wncillary servy to increasen opportunitr into partopportunitietheir annua
ortunity to fhich has aER and AEMn the NEM nsiderationsort to highli
P
GS
ken and prAgreement,
ince. (Theprevious Mdue to the l ESD case
ections, wh
ovember 20mentation o
depend on
tus with AEand simply
ay be appla generato
would be elrvices. AEMe in areas wty for ESDstnerships wes, as longal revenues.
further consallowed forMO, as wehave also p
s for ESDsight the key
Page | 30
resented and the formal
Milestone iterative
e used in
hich are
014 and f a large
its size
MO and y offsets
icable if or in the
ligible to MO has with high . whereby g as the .
sider the r further ll as the provided s. This y issues

5.1.1
After mof the vESDs. existing
5.1.2
Discusscharge inadverallow focustomchargesseeminand insgeneralunfavou
Transmand couuse anguidelinrevenuemay prconside
While trteam, itbusinesbeing afencing busines
The AEexpect fencing by the integrat
Regulato
eeting with view that thIn other wo
g rules and f
AEMO conffor pumpedloss factor
AEMO saidload, whichcharges, if charges as
Inadverte
sions with tuse of sys
rtent barrieror DUOS ers. On ts. As ESDgly localise
stallations. Al applicabiurable.
mission Netwuld be proh
n ESD for nes allow me for the TNrohibit largeered by the
ransmissiont would alssses. It willable to utilis provisions
sses.
ER has signthat such a arrangemeAEMC in
tion of energ
ory landsca
regulatory hey are likeords, they aframeworks
firmed that d hydro storapplication
d it would bh means thtransmissio both a cus
ent regulat
the AER histem chargrs being plato be chathe transmDs only cured or small cAs ESDs ality of NE
work Servichibitive in sinetwork m
mixed use NSP involveer sizes orConsortium
n business so be worth be importa
se ESDs to do not lock
nalled a reva review is ents. Seve
early Decgy storage
ape for ESD
bodies suchely to take re unlikely t
s can be use
it understanrage would for ESDs is
be very likehat ESDs won connectetomer and a
tory barrier
ighlighted tges (DUOSaced on ESrged to geission netwrrently havecharges can
are likely toEM regulat
e Provider tuations wh
managementonly when
ed. This is ur more widem is mixed u
ring fencinghwhile consant to strikereduce ove
k out invest
view of the likely to learal of these
cember 201into the NE
Ds
h as the AEa non-discto introduceed. Importa
nds that thebe applicab
s likely to de
ly to categowould not bed, but coua generator
rs
that rules pS) would neSDs on the enerators owork, only e a very mn impact on
o be classetions, DUO
(TNSP) ringhere TNSPst and mark revenue w
unlikely to pe spread u
use to maxim
g is pertinesidering thee the right
erall asset etment that w
distributionad to correse are discus15 in term
EM, [17].
ER, AEMC acriminatory e specific anantly:
e current regble to ESDsepend on th
orise ESDsbe charged
uld be chargr if distributi
pertaining toeed to be distribution
on the distcustomers arginal posn decisions d as gener
OS charges
g fencing gs and a maket tradingwill not exc
prevent instause. The cmise the bu
nt to the cue ring fencbalance be
expenditurewould natur
n ring fencisponding ressed in thes of the r
and AEMO, approach tnd new regu
gistration ans. Howeverhe size of th
s as a gened transmissged distribuon connect
o how distrconsidered network. ribution neare charg
sitive net prto go ahea
rators for ths for gen
uidelines warket partici. Currentlyceed five pallation of surrent busi
usiness case
urrent focuscing guidelinetween mo
e, as well asally take pla
ng arrangeeview of the most receegulatory i
P
the projectto the reguulations for
nd rules frar, the dual mhe device.
erator rathesion use of ution use ofted.
ribution busd in order t
Currently tetwork, as ed use of resent valu
ad with invehe purposeerators wo
were written ipant wish ty the ring
per cent ofsmall size Einess modee for invest
s of the Connes for dis
onopoly buss ensuring tace by unre
ements ande transmiss
ent report puimplications
Page | 31
t team is lation of ESDs if
amework marginal
r than a system
f system
sinesses to avoid he rules well as system
ue, even estments s of the ould be
in 2002 to jointly fencing
f annual SDs but el being ment.
nsortium tribution
sinesses that ring egulated
TNSPs sion ring ublished s of the

5.1.3
Cost reESDs. contribunetworkmay inctheir loabona fidnet ben
Demanby the Afor choincentiv
AEMO The Sofrequenin the fThere menough
5.2
Site selincludedpotentiaintendeNEM crProject recommone fina
5.2.1
The Miland thehigh levnot conHowevein Soutdevelopin finalisB.
4 http:/Conn
Regulato
eflective net The idea
uted to peak componencrease the vad profile tde long runnefit to distri
d managemAEMC4, whoosing demvise distribu
has a growouth Austrancy control face of gromay be a grh to justify in
Site Sele
lection was d the factoal sites tha
ed novel usereates a nutaking on a
mended thaal site selec
Site sele
lestone 2 ree applicationvel quantificnsider the der, site conth Australiapment and sing the site
//www.aemc.nection-I
ory develop
twork tariffsa behind cak load at nt of their rvalue of ESto avoid pe marginal cbution netw
ment incenthich could smand manation busine
wing interesalian renewancillary se
owing intermrowing opponvestment.
ection
performed ors that wert were exae of an Eneumber of unan iterative t three shor
ction. This c
ction criter
eport [11] din of these cation of thedeploymentnection cos
a. ESD deptherefore ine selection.
.gov.au/Rule
pments imp
s, once impcost reflectpeak demaetail tariff.
SDs in ‘behineak chargescost (LRMCwork reflecte
tive schemeee distributagement ssses to con
st in purchawables inteervices in enmittent genortunity for
as part of re used to
amined andergy Storagncertaintiesform. One ort-listed site
change in sc
ria
iscussed sitcriteria ande benefit clat cost of ansts were conployment conformed Mil
A summary
e-Changes/D
pacting on
plemented, tive networand times w
Once this nd the metes without n) distributioed in the pri
es for distrition businessolutions ovnsider ESDs
asing ancillaegration pronsuring theeration andESDs to of
Milestone 2select a si
d the rationge Device (s and unknooutcome of es are progrcope was a
te selectiond methodoloasses. It is n ESD whicnsidered atosts were dlestone 4 (ty of the Mile
Demand-Man
ESDs
may have rk tariffs iswill be charcharging fraer’ locationseeding to r
on pricing micing arrang
ibution bussses receivever traditios for deman
ary servicesoject, [7], South Ausd reductionffer this ser
2 of the ESite, what coale behind ESD) to peowns, whichf this iterativressed furthgreed with A
n criteria, sitogy to Soutimportant toch may inflt a high levedeterminedthis report) estone 2 re
agement-Em
an impact s that cusrged a highamework iss, as customreduce actu
methodologygements for
inesses aree an additio
onal asset nd managem
s from non-thighlights
stralian mars in convevice should
CRI-SA ARonstraints w
final shorterform varioh in turn have nature wher rather thARENA.
te screeningth Australiao note that tuence the el in shortlis as input iof the Meaport can be
mbedded-Ge
P
on the locstomers whher amounts implemenmers seek tual energy y is likely to r the ESD.
e being cononal income
build. Thiment purpos
traditional sthe import
rket stays bentional gend payments
RENA Measwere identift-list selectious functionave resulted
was that Milehan recomm
g and methn sites, incthe Milestofinal site s
sting potentinto busineasure, and ae found in A
eneration-
Page | 32
cation of ho have t on the ted, this
to flatten use. A see the
nsidered e stream s could ses.
sources. ance of
balanced neration.
be high
sure and fied, the on. The
ns in the d in this estone 2 mending
hodology cluding a ne 2 did
selected. tial sites ss case assisted
Appendix

A broadcharact
The brodetermiwere nexclusivat this sof sites
Categ
Gene
Netw
(due const
Netw
(to inBene
Ta
5.2.2
The siteof Soutfrom thSouth AprocessscreeniYorke P
The EyPeninsuline outPeninsuinterconshort-lisdetailed
d range of Steristics as w
Generated Network SuNetwork Su
oad range oined not to
not considevity of benestage. The land high-le
gory
erated Energ
work Support
to reliability traints)
work Support
ncrease Markefit)
able 5‐1 ‐ Bene
Site asse
e assessmeth Australia he assessmAustralia ans introducedng identifie
Peninsula a
yre Peninsula due to ttage conditula, due tonnection costed, one ind analysis.
Site Selectiwell as pote
Energy Valupport (dueupport (to in
of criteria webe relevant
ered. Also, efits and co-
ist of benefevel benefit
y Value
ket
fit classes used
essment an
ent coveredand sites b
ment. The innd resulted d rankings aed that the nd in the R
ula (Port the additiontions. Sites o low cononstraints. Fn each geog
on Criteria ential benef
lue; to reliability
ncrease Ma
ere evaluatt unless ES
detailed a-optimisatiofit classes inquantificati
Benefit cla1. Ma
rev2. Ma
3. Net4. Loc5. Exp
6. Hey7. Mu8. Loc9. Grid10. Anc11. Avo
Ser
d for the screen
nd shortlist
d all 88 of Ebelonging tonitial screen
in a shortland weightihighest raniverland.
Lincoln Tenal requirem
in the Rivenection difFrom the agraphic area
was develofits categori
y constraintrket Benefit
ted and redDs become
aspects liken of benefitn Table 5-1ion.
ass rket Trading
venue as welrginal Loss F
twork Augmecalised Frequpected Unse
ywood Intercrraylink Intercal Generatod Support Cocillary Servicoided Wind Frvice (FCAS)
ing, short‐listin
ting
ElectraNet’so generatorning study list of 16 sings of the nked sites
erminal) wament to superland werefficulty andabove it waa, to optimis
oped to capsed as follo
ts); and t).
uced in nume widespreae the potets in the deswere used
Revenue (Mll as Cap tradFactor (MLF)
entation Capuency Supporved Energy
connector Corconnector Cor Constraint ost Reductio
cer Support (SFarm Freque) obligation
ng of sites and h
s transmissirs or SA Poconsideredites. The sSite Selectiwere all loc
as ranked pply load viae ranked ned the poteas concludese the site
pture local sows:
mber after sad in the futuntial interp
sign have nofor the scre
Market time sding revenue) Impact
ital Deferral ort
(USE) reduc
onstraint RedConstraint Re
Reduction n System Freqncy and Con
high‐level benef
on substatower Netwod all connececond stagion Criteria.cated on th
first, highea contractedext, after thntial for reed that threchoice in a
P
site issues,
some benefure. These
play and/orot been coneening, sho
shifting tradine)
ction
duction eduction
quency Suppntrol Ancillary
fit quantificatio
tions. Sitesorks were ection point
ge of the sc. The seconhe Eyre Pe
er than thed generatiohe Eyre aneduced Muee sites sh more rigor
Page | 33
network
fits were benefits mutual
nsidered ort-listing
ng
port) y
on.
outside excluded
sites in creening nd stage eninsula,
e Yorke on under d Yorke urraylink hould be rous and
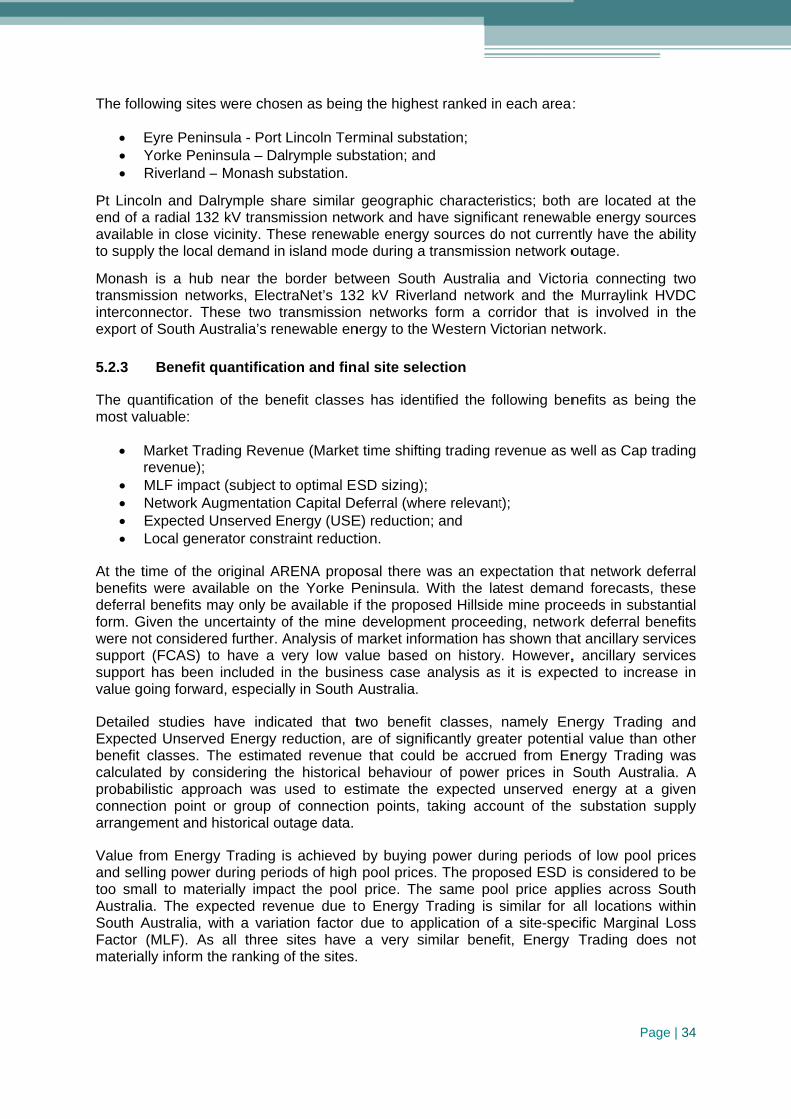
The foll
Pt Lincoend of aavailablto supp
Monashtransmiinterconexport o
5.2.3
The qumost va
At the tbenefitsdeferralform. Gwere nosupportsupportvalue g
DetailedExpectebenefit calculatprobabiconnecarrange
Value fand seltoo smaAustraliSouth AFactor materia
owing sites
Eyre PeninYorke PeniRiverland –
oln and Daa radial 132le in close v
ply the local
h is a hub ssion netwnnector. Thof South Au
Benefit q
antification aluable:
Market Trarevenue); MLF impacNetwork AuExpected ULocal gene
time of the s were aval benefits m
Given the unot consideret (FCAS) tot has been oing forwar
d studies ed Unserveclasses. T
ted by conilistic approtion point o
ement and h
from Energyling power all to mateia. The expAustralia, w(MLF). As
ally inform th
s were chos
sula - Port nsula – Da
– Monash s
alrymple sh2 kV transmvicinity. Thedemand in
near the bworks, Electhese two trustralia’s ren
quantificati
of the ben
ding Reven
ct (subject tougmentationUnserved Eerator constr
original ARailable on thmay only bencertainty oed further. Ao have a v
included inrd, especial
have indicaed Energy rThe estimatnsidering thoach was uor group ohistorical ou
y Trading isduring perio
erially impacpected revewith a varia
all three he ranking o
sen as being
Lincoln Terlrymple sububstation.
are similar mission netwese renewaisland mod
border betwtraNet’s 132ransmissionnewable en
ion and fina
nefit classes
nue (Market
o optimal ESn Capital Denergy (USEraint reduct
RENA propohe Yorke P available if
of the mine Analysis of very low van the businly in South A
ated that treduction, aed revenuee historicaused to esf connectio
utage data.
s achieved ods of high ct the pool enue due totion factor sites have of the sites.
g the highes
rminal substbstation; and
geographicwork and haable energyde during a
ween South2 kV Rivern networks nergy to the
al site sele
s has ident
t time shiftin
SD sizing);eferral (whe
E) reductiontion.
osal there wPeninsula. Wf the propodevelopme
market infoalue based ness case aAustralia.
two benefitare of signife that couldl behaviour
stimate the on points, t
by buying pool prices price. Theo Energy Tdue to appa very sim
st ranked in
tation; d
c characterave significa
sources dotransmissio
h Australia rland netwo
form a coWestern V
ection
tified the fo
ng trading re
ere relevantn; and
was an expWith the lased Hillsideent proceedrmation hason history
analysis as
t classes, ficantly gread be accrur of power
expected taking acco
power duris. The prope same pooTrading is splication of milar benef
n each area
istics; both ant renewabo not currenon network o
and Victorork and theorridor that ictorian netw
ollowing ben
evenue as w
t);
pectation thtest deman
e mine procding, netwos shown tha
y. However, it is expec
namely Enater potentiaed from Enprices in unserved e
ount of the
ing periods osed ESD ol price appsimilar for a site-spec
fit, Energy
P
:
are locateble energy ntly have thoutage.
ria connecte Murraylink
is involvedwork.
nefits as be
well as Cap
at network nd forecastsceeds in subrk deferral at ancillary s, ancillary scted to incr
nergy Tradal value thanergy TradSouth Ausenergy at substation
s of low poois considereplies acrosall locationcific MarginTrading d
Page | 34
d at the sources
he ability
ting two k HVDC d in the
eing the
p trading
deferral s, these bstantial benefits services services rease in
ing and an other ing was tralia. A a given
n supply
ol prices ed to be s South
ns within nal Loss oes not

An ESDconnecoutage,connecdurationtransmi
The hisare sum
The busyet comrespectdemonsTherefodemons
Given tthe purp
A signifMonashDalrymp
Key B
Local
Back-
Size o
Size Devic
Distan
D can act ation point le, especiallytion pointsn of suppssion supp
storical unplmmarised Ta
No. of un
Max. sing
Total inte
Average d
Average i
Table 5‐2 ‐ H
siness casemmercially t to aspectsstration piloore, this restration pilo
he potentiapose of a de
ficantly largh. A smalleple was sel
Benefit
maximum d
-up supply av
of the Inverte
of the Ence
nce from Ade
as an alternevel are typ
y for radial . Diesel gely outagesly.
lanned line able 5-2.
planned inte
gle interruptio
rruption dura
duration per
interruption d
Historical unpla
e, documenviable. Ho
s of ESD anot project wport propos
ot plant.
al benefits femonstratio
er ESD willer ESD is pected as th
emand
vailable
er
nergy Stora
elaide
Table 5‐3
ative supplypically causconnection
enerators as. In contr
outages fo
rruptions
on duration
ation
single interru
duration per
anned line outa
ted later in owever, thend grid intewould assisses an ES
rom all threon pilot plan
be requiredpreferred foe preferred
Pt
ExpecteE
3
10 -
ge 5
6
– Criteria used
y during a psed by a trn points. Boare currentrast, Mona
or Port Linco
P
1
8
6
uption 6
year 6
ages for Port Lin
this report,ere are nuegration thast to bette
SD installat
ee short-listnt, the criter
d to provideor the purp location.
Lincoln
ed unservedEnergy
38 MW
Yes
- 20 MW
5 hours
647 km
d to assess dem
power outaransmissionoth Pt Linctly used atsh has m
oln and Da
Pt Lincoln
18
8.87 hours
61.92 hours
6.98 hours
6.19 Hours
ncoln and Dalry
concludes umerous cht are unknor understanion in Sou
ed sites areria in Table
e the identifpose of a te
Dalry
ExpectedEne
8 M
N
5 -10(Pref
2 h(Pref
209(Pref
onstration pilot
ge. Power n line outagcoln and Dat Pt Lincolultiple sou
lrymple ove
Dalry
22
3.18
35.18
1.6 h
3.52
ymple over the
that utility sharacteristicown and furnd the emth Australia
e not signifi5-3 were co
fied potentiaechnology
ymple
d unserved ergy
MW
No
0 MW ferred)
ours ferred)
9 km ferred)
t plant site
P
interruptionge or a tranalrymple arn to minim
urces of e
er the last 1
ymple
hours
8 hours
ours
hours
last 10 years
scale storagcs, especiarther studieerging techa to be bu
icantly diffeonsidered.
al at Pt Lincdemonstrat
Monas
Inter-Conn
N/A
Yes
10 – 20
5 hour
235 km
Page | 35
ns at the nsformer re radial
mise the lectricity
10 years
ge is not ally with es and a hnology. uilt as a
erent, for
coln and tion and
sh
nector
MW
rs
m

5.3
5.3.1
The Miland fun
The inteframewsheet. Sharing
5.3.2
At a higcomme
To inforfollowin
5.3.3
The Coconsidein this s
Some oconsidethe poteReport
5.3.4
The Cooperateof the Echarge
Comme
Introduct
lestone 3 Rnctional spe
ention of thworks and fu
It is intendg material p
Approac
gh level, theercial framew
Identify theIdentify theDefine the
rm the abovng:
Potential soPotential sdistributed?Key elemen
Key Find
onsortium’s eration. Thsection of th
FrameworkFrameworkFrameworkand Framework
other commered less atential comm– Commerc
Recomm
onsortium hes the ESD ESCRI-SA pand discha
rcial Fram
tion
Report, [12]cifications t
he report wunctional sed that thisroduced un
ch
e purpose work consid
e ESD primae asset ownebasic eleme
ve, the Con
ources of ecsources of?); and nts of the fr
dings
analysis toe four pote
he report:
k 1: Energy k 2: TNSP Ok 3: 3rd Pa
k 4: Mixed N
mercial framttractive optmercial framcial Framew
mendations
has determand also m
project. Thearge.
mework
, provided to be consid
was to provipecification
s will be incnder the Fun
of the Milesdered the fo
ary role/s; er; and ents of the f
nsortium ide
conomic bef commerc
amework d
o date hasential comm
Trading – MOwner Operarty Provide
Network and
meworks wetions for themeworks idework [13].
ined that amanages isoe Generato
an outline dered as pa
ide a high ns in a formcluded in thending Agree
stone 3 Reollowing:
framework.
entified for
enefit for encial impact
riving the c
s identified mercial fram
Market Benrator – Netwer – Larger
d Market Be
ere considee various stentified is i
a commerciolations of t
or / Retailer
of the propart of the ES
level descrm which coe final repoement.
eport was to
each poten
ergy storagt (i.e. how
ommercial
four potenework optio
efit Model;work Benefi
Scale Prim
enefit Mode
ered as parakeholdersncluded in
al structurethe equipmwould cont
posed commSCRI SA pro
iption of poould form thort for AREN
o determine
ntial framew
e; w is the
benefit.
tial operations contem
t Model; marily Netw
l.
rt of this re. A summathe “ESCR
e where theent is approrol the disp
P
mercial framoject.
otential comhe basis ofNA and Kno
e for each p
work conside
economic
ing framewmplated are
work Benefit
eview althoary of key te
RI-SA - Mile
e TNSP owopriate for P
patching the
Page | 36
meworks
mmercial f a term owledge
potential
ered the
benefit
works for detailed
t Model;
ugh are erms for estone 3
wns and Phase 2
e ESD to

The suTable 5
Pr
Ow
Op
ES
ES
Di
Co
Ma
Co
5.4
The purstorageProject,definitioAppend
ummary of 5-4.
roject Term
wner
perator
SD Location
SD Capacity
spatch Right
ounterparties
arket Particip
ontractual Te
State of
rpose of thee technolog, and to asson. A summdix C.
the recom
S
ts
s
pant G
erm
Table 5‐4 ‐ Sum
f the Art R
e state of thgies being sist in early mary of the
mmended k
Structure
TNSP
TNSP
Site Spec
TNSP aGenerator/R
Generator/Rand TNS
TNSP aGenerator/R
Generator/R
Life of As
mmary Recomm
eview
e art reviewdeveloped modelling wMilestone
key comme
P
P
cific
and Retailer
Retailer SP
and Retailer
Retailer
sset
mended Comm
w, [13], wasand deplo
work undert3 report (E
ercial frame
Ownedthe RA
TNSP the plequipm
Site deto levewhile hdefaulrequire
MinimTNSP require
Capacother r
TNSPto GspecifESD ifor ne
ESD TNSP netwo
Generlease right tESD c
Generregistethe cowith A
Part of
ercial Framewo
to provide oyed globataken in sitinergy Stora
ework term
d by TNSP aAB.
to operate ant and op
ment.
etermined byel of network having regart retailer sitinements
um capacity network sup
ements city amendedrevenue stre
P to assign Generator/ fic provisions to operatetwork suppoowned and
to primrk support rator/Retailerpayment to o manage t
charging/discrator/Retailerered Market ounter party EMO
f asset includ
ork – Key Terms
an overviewlly of a typng and funcage System
P
ms is prese
and included
e and maintperate isolat
y TNSP subj constraints rd to local ng
determined pport
d to improve eams
dispatch rigRetailer w
ns of how te when requirort d operated marily prov
r makes ann TNSP for the dispatchcharging r is tParticipant afor settlem
ded in RAB.
s
w of variouspe relevantctional spec
ms) can be
Page | 37
ented in
d in
tain ting
ect
by
hts with the red
by vide
ual the of
the and ent
s energy t to the cification found in

The patpreviouOf parttechnolthe SouMWpk ocompreinvolvin
The ESwhat teonly “noand behlarge qubut the are still the Proj
Anothercurrentlthermalimmatuinefficie
The ES“utility linternattraditioncomme
In sumStorageLead aBromine
A brief charactpresent
The widover, housed to
5.5
For a bfinal funestimatconsortconscioas the fyield the
th by whichsly in Soutticular noteogies and t
uth Australiaoutput, inclession storang chemical
SCRI-SA Prchnologies on-hydro” ehind this is uantities alsize of tho novel aspeject, they w
r storage tely utilised inl storage). rity of thes
encies in su
SCRI-SA Pevel”. Whitionally to snal utility fra
ercial power
mary, the e (PHS), coacid, Lithiume (ZnBr), H
discussionteristics wated.
de ranging owever the
o inform a fir
Specific
business canctionality he (+/- 25%tium debateous of the sfast pace oe best resu
the ESCRIh Australia
e was a Sthe basic buan market, [uding largeage, throug and mecha
roject choseare applica
energy storaan assumpready, incluse facilitiesects of wate
were include
echnology nn several so
The primase media foch a config
roject is alile this lattesee large scanchise, wi
r plant deve
energy stoompressed m ion, Sodydrogen fue
n of each as presente
nature of tkey parame
rst level pas
cation and
ase to be whad to be kn% accuracy)ed internallysignificant leof change inlts, starting
I-SA Projecin relation
tudy underusiness cas[18]. That Se pumped gh to smaanical stora
e to focus oable. In defage (essentption that nouding in Au is generaller based sted in the rev
not coveredolar thermal ary reason for storing euration if pr
so about eer terminolocale use ofithin this reloper, utility
rage technAir Energy
dium Sulphuel cells, cap
of the diffeed and des
the review eters of eacss to for any
d Procurem
written the cnown in som), a formay the best evels of inten the induswith a Req
ct evolved into energy
rtaken in 2se for their Study coverhydro, com
aller scale ge.
on the smalfinitions of tially Pumpe
ot only havestralia – anly larger thatorage faciliview.
d was thermprojects, o
for not purselectrical enroducing ele
energy storogy is somef small, disteport the eny or formal m
ologies thay Storage (Cur (NaS), V
pacitors and
erent energscriptions o
necessarilych technoloy given elec
ment
capital cost me detail, aal approachway to ap
erest acrosstry. It wasquest for Info
ncluded constorage as
2011 whichuse to increred a rangempressed atechnologie
ler end of the Project wed Hydro Ste PHS systend, thereforan sought inties and, w
mal energy r chilled wasuing such nergy (in/ouectricity as a
rage at Traewhat vagutributed enenergy storamarket entr
at were purCAES), FlywVanadium d supercapa
gy storage of some ty
y meant thaogy were idectrical stora
of the ESDand for this, h to the m
pproach thes a broad r
s concludedormation (R
nsideration oa renewab
h examinedease renew
e of technoloair facilitieses in the
his market work and aitorage (PHSems been pe, are not pn the Projec
where these
storage, ster (and varwas both t
ut), and thean end prod
ansmission e given tha
ergy storagege asset isant would b
rsued includwheel EnerRedox Bat
acitors.
technologiypical know
at many deentified andge applicati
D, its deployand to ach
market was e market forange of stad that a stagRFI).
P
of work undble energy d potential wable energogies in thes and gas
1-30 MWp
and this infims, it is staS)) will be ppursued andparticularly ct. Howevewere appli
such as moriants, incluthe relative e likely endduct.
System levat there aree systems
s of a size be consider
de Pumpedrgy Storagetteries (VRB
es based wn example
etails were the reviewion.
yment pathhieve a clas
undertakeor informatioakeholders,ged proces
Page | 38
dertaken enabler. storage y use in
e 100s of pipeline
pk range
fluences ated that pursued, d built in novel –
er, there cable to
lten salt uding ice
level of d-to-end
vel – or e moves within a either a ing.
d Hydro e (FES), B), Zinc
on their es were
glossed w may be
h and its ss 2 cost n. The on, very , as well ss would

To achithe ESfunding
To deaexpectemathem
5.5.1
A purpinvestignetworkoptimisaa wide commemodelle
Each mconditioby stepmarket (betweeperform
The momarket renewaestimatwhen mearly ruhence fbut not are give
Extensicertain functionactuallyrevenuerevenue
eve this, anD and how requireme
“The specifa manner which allowvendors, thwill be usspecificatiothey were rto the locat
al with the led operatiomatical mod
Mathema
pose built gation of vark and maration. This array of d
ercial paramed output.
model run sons with theping througincome. T
en 2012 amed to ident
odel could – that is, it
able energyes, showed
maximising un for an arbflywheels, wtime shiftin
en in Table
ve iterationstorage o
nal specificy do. The e stream, be for a com
n ESD Specw it would nts, in partic
fication for which suits
ws a reasohe productioed within
on will be suresolved, brtion chosen
large numbon of the Eel, [19], to t
atical Mode
mathematicrious combket behaviomodel was
ifferent enemeters - F
imulated the ultimate ogh such opeThe modelleand 2014). ify risks ass
calculate et was not sy plant. Ind that only cthe availabbitrary timewhich have ng purposes5-5.
ns of the moptions or cation – in
early analbut even unmercial pro
cification alsbe procurecular:
the energy s the chosenable classon of a mathe Measu
upplied – idroadly appli”
ber of energESD in functest basic p
elling
cal modelinations andour, and p
s written andergy storageigure 5-1 s
e operationutput a Net
eration in timed electricit
In the ulsociated wit
nergy tradispecifically tnitial runs,certain optiole differenti-shifting casshort durat
s, compare
mathematicafunctionalitother wor
ysis indicatnder pure mposition acr
so had to beed. This p
storage syen procurems of price easter schedure’s financdentifying thlicable withi
gy storage ctional formrinciples in
of the Ed permutati
provided a d compiled e types to shows one
n of such at Present V
me across aty market ctimate busth changes
ng value btargeting thbased on
ons were likial in the mse – here ntion outputspoorly. The
al model wty was prerds, the exted that enmarket differoss the ma
e written whrocess also
ystem will bement and cestimation adule. This ccial model. e key enginin Australia,
configuratiom, it was n
terms of va
SD was pons of storameans to in the Mathbe inputted
e of the in
n asset witValue (NPV)a defined maconditions wsiness caseto such ass
ut only conhe time-shift
the State kely to be c
market. Figuno account s which are e metrics us
were underteferable, wxpectation anergy tradinerentials waajor energy
hich could bo had to a
e fully explocontracting and, followicapital estim
A high neering requ, rather than
on options,necessary talue propos
produced wage medium
begin the hematica sod in terms nput screen
th respect t) calculationarket periodwere basede a sensitsumptions.
nsidered theting of geneof the Art
close to or Nure 5-2 for is made of better for r
sed in this e
taken to trywhich wouldaround whang was a sas unlikely storage tec
P
be used to dlign with A
ored and demethodolo
ing discussmate and slevel perfouirements an specific fu
, and to deto build anition..
which allowm in relation process o
oftware and of operatio
ns and ass
to assumedn. It calculad and accumd on historitivity analys
e differentiaeration outpt Report [1NPV positivexample shnetwork varegulation searly NPV
y and deted help infoat the ESDsignificant pto provide
chnology typ
Page | 39
describe ARENA’s
efined in ogy, and sion with schedule ormance and how functions
efine the d run a
wed the n to both of asset allowed
onal and sociated
d market ated this mulating cal data sis was
al in the put from 14] cost ve, even hows an lue, and
services, analysis
ermine if orm the D would potential enough
pes.

It was avarious provideSectionhelp clsensitivenergy
Figure
Pa
Pro
Dis
Re
always inte options pu
ed the majon 6, but prioarify what
vity in revestorage typ
5‐1 – Sample s
rameter
oject life
scount rate
evenue
Table 5‐5 – Me
ended that tut forward brity of eneror to RFI in
functions enue from pes.
creen from ESCstorage o
Valu
20 y
10 %
BaseacroThisbene
etrics used for t
this modely proponengy trading v
nformation bof the ESDdifferences
CRI‐SA mathemperational valu
ue
years
%
ed on maximoss the Souths means thatefit value inc
the purpose of
would be unts as part ovalue estimbeing availaD would b
s functions
matical model, tues. Results can
mising energyh Australia Nthere was n
cluded in the
early technolog
updated anof the RFI p
mates for theable the mobe most be
and opera
his one showinn be viewed im
y trading valuNEM market.
o network analysis.
gy comparisons
d then useprocess. Ule business odel was a eneficial, anational capa
g one used to imediately.
P
ue
s
ed to help cltimately thicase, descvery usefu
nd particulabilities of
nput particular
Page | 40
compare s model
cribed in ul tool to arly the various
r energy

Figure 5‐public do
5.5.2
An ESDformal r
After sproponeprocurewith suproject not provdiscuss
‐2 – Example ofomain cost infor
found very sen
ESD Spe
D Specificatresponders
The designenvironmendevice and Contractorsbe providedEngineeringcompliancearound elecSpecific teproject schperformancMiscellaneoand Enviro
ome discusents on a lu
ed in Austrach experienrisk onto thvide the low
sed more in
f initial results frmation. Initia
nsitive to assum
ecification
tion, [16], wto the RFI
n philosophyntal conditi the grid cos Scope of d, and wherg expectat
e with codesctrical, mecchnical exphedule, conce guaranteous supply nment (HSE
ssion withiump sum E
alia so matcnce were lihe Contractwest cost opSection 6.
from mathematl results were a
mptions and ass
was written process, wi
y – includinions, expec
onnection exWork – def
re the termiions – incs and laws,
chanical andpectations ntractor su
ees, and Opexpectatio
E), risk man
n the ConEPC contracches with thikely to be tor which, iption simply
tical modelling,all close to or Net functions. N
by the Conith the purp
ng basic dected servicxpectationsfining the Cnal points o
cluding exp, and particd civil plant,of supply –
upplied ESDperations anns – includnagement a
nsortium it ct basis. Te culture offavoured. n an emergy as uncerta
, here for a certPV negative in
NPV calculation
nsortium whose of defin
escription ances, the fu
Consortium’on the contrpectations acular local e and the gr– in particuD mathemand Maintenading projectand enginee
was decidThis is typicf supply, an However, ging area sainty is buil
tain energy timearly model runbased on metr
ich was ultning the ass
nd conceptunctional ex
s expectatioract would baround appxpectationsid connectioular, the exatical modeance (O&M)
managemeering deliver
ed to seekcal of how ud means thit also mov
such as enet into any p
P
me‐shifting casens, although rarics in Table 5‐5
imately proset in relatio
t, siting, desxpectations
ons on whabe plicable stas in South Aon process xpectationsel, warrant) ent, Healthrable contro
k informatioutility technhat only proves the maergy storagpricing. Thi
Page | 41
based on nking was
5.
vided to on to:
sign life, s of the
at would
andards, Australia
around ties and
h, Safety ol
on from nology is ponents
ajority of e, might s will be

The funoperatio
1.
2.
3.
The Spachieveproponewhich cfunctionsolutioncontext electrica
There wwas to applicattrends, terms othat the
5.5.3
The Cocompanspecificand comanagegeneral
nctional desonal modes
Market Traprices are hIslanded Mislanded foNetwork Mconstraints
ecification wed, schedulents in the could, for exns and requns put forwa and operaal plant ope
was much dbe sought
tions at tarthe size ran
of capital ane mathemat
Request
onsortium dnies to appc informationmpare propeable, as it l release wa
scription in s, being:
ading Modehigh, and asMode – whellowing a co
Mode – whe or provide
was not inteed or contrRFI proces
xample, havuirements oard to meet ations of theerating in Au
discussion win the RFI
rget sites fonge specifiend O&M coical model c
Option
1
2
3
4
5
6
7
Tab
for Inform
decided noproach with n requestedposals. Thwas believ
as made. Th
the ESD S
e – where ths a load where the ESDontingency ere dispatchspecific Ne
ended to berolled, and ss to put forve involved of the assetthe risk ex
e NEM, anustralia.
within the CI process. or the ESDed in Table stings, but could be us
P (MW
5
5
5
10
10
10
10
ble 5‐6 – Size ra
ation (RFI)
ot to advera RFI Inv
d from prophe decisionved that conhe full list o
Specification
he ESD is dhenever pooD supplies event
h as a load etwork value
e overly preas a result
rward innovhybrids of t, and contpectations ad the utility
onsortium aBased on
D installatio5-6 was realso in term
sed to deter
Wpk)
5
5
5
0
0
0
0
ange of ESD sou
) Process
rtise the Ritation, [15]onents and
n not to adnsiderable nf companie
n targeted a
dispatched ol prices area portion of
or generatoe
scriptive ont was technvative approtechnology
tracting prefand appetity norms an
about what the initial m
on and seequested froms of base mine result
Q (MW
20
40
60
40
80
120
200
ught in RFI Proc
RFI, but rat], which de the criteriavertise was
noise from ts targeted i
an asset ca
as a generae low f the Netwo
or is made
n how thesenology agnooaches to th. However,ferences, we of the Cod generally
size of enemodelling wking a mea
om proponetechnology
ing NPVs.
Wh)
0
0
cess
ther selecteefined the pa that woulds made to the marketps given in A
P
apable of th
ator whene
ork which h
to alleviate
e modes weostic. This he functions, certain sta
were mandaonsortium wy high stand
ergy storagework, the pans of esta
ents – particy character
ed a list oprocess timd be used to
make the place was liAppendix D
Page | 42
hree key
ver pool
as been
e system
ere to be allowed
s sought andards, atory for
within the dards of
e system particular ablishing cularly in istics so
of target ming, the o assess process ikely if a .

An initiaprior to as the dor consanswer
Final reIntegratenergy playersindicate
The Coprocessdocumenoted ththe Confurther
5.5.4
A total multi-crdirectly short-listo be at
ProposaAppendis also gtypicallymore etechnol
As expincludinFlow, Vpropose
No smacompanother sproposaexpectanorms. extreme
al approachreceiving th
documentatsortiums. Qrs made kno
esponses wtors (typicastorage de. A signif
ed in Appen
onsortium hs, but the nentation suchat the likelnsortium lefin Section 6
Results o
of 17 proporiteria evalu
linked to tsted status,ttained.
als were tydix D – notegiven in Apy an integraenergy stoogy develo
pected, cheng various Vanadium Fed, includin
Hybrids of characterisA proposalof a compleA proposal
all Compresnies contacstated that als also failations in A This was
ely limited a
h was madehe RFI docution was rel
Questions poown to the f
were receivlly, EPC wr
evice supplyficant numbndix D.
ad always nature of thch a shortlisly path fromft the option6 in relation
of RFI Proc
osals were uation procethe RFI Inv all thresho
ypically of ge the raw fopendix E. Mator (or Porage vendpers also p
mical batteLithium-IonFlow and Rg;
different tystics of each using heatete thermal using hydro
ssed Air Encted stating
the projecled to adeq
Australia – not unexpe
and there is
to each coumentation.eased, so t
osed by profull list – so
ed from a rap offers) y only), andber of parti
intended toe relationshsting was p
m there couln open for to recomm
cess
received froess. The vitation nar
old criteria h
good qualityorm of the oMost propo
ower Conveors, althouroposed co
ery technolo types, So
Redox Flow
ypes of bah when applt storage inisland (steaogen storag
ergy Storagthey were
ct was conquately impparticularly
ected, as thno suite of
ompany see. The full listhat companoponents pri
the process
range of inand energy
d included fies coopera
o shortlist rhip from thproposed fold be a forman alternat
mendations a
om the marprocess us
rrative and had to be pa
y and are inoriginal evaosals involveersion Systeugh a nummplete sup
ogy dominaodium Sulphw types. S
attery energlied to the v molten salam to turbinge
ge (CAES) too busy w
nsidered toress the as
y around ce energy stf standards
eking interesst of proponnies had theior to final ss was run a
ndustry pary storage teinal offers fated or for
espondentsere was un
or a potentiamal tender toive procurearound pric
rket and 8 wsed both thSpecificatio
assed and a
ndicated in luation sheed a mixtureem (PCS)
mber of laply.
ated the suhur, AdvancSome highly
gy storage, various modlt technologne plant)
proposals wwith anotheoo small fossessors oncompliance torage suppin common
st and to adnents was the ability to fosubmission ws a formal t
ticipants inechnology pfrom nationamed relatio
s at the conncertain. Inal Phase 2 o that shortment path. e reduction
were finally hreshold anon. For a an aggrega
relation to et used to ce of compasupplier) wrger indust
ubmissions,ced Lead Ay innovativ
to benefit des of operagy, which in
were receivr commerc
or their tecn their abilitwith stand
plier experie use for suc
P
dvise of the hen made kform partnewere collatetender wou
cluding tecproviders (tal and interonships, wh
nclusion of n the RFI Inproject, an
tlist alone, a This is dis.
shortlistednd scored proposal t
ated score >
final shortlcompare prnies in part
working withtrials and
, with technAcid, Zinc-B
ve ideas we
from the ation soughnvolved the
ved, with oncial issue, wchnology. ty to meet
dards and ence in Ausch an asset
Page | 43
process known rships ed and ld.
chnology typically, rnational hich are
the RFI nvitation d it was
although scussed
using a criterion to reach >3.5 had
listing in roposals tnership, h one or
storage
nologies Bromine ere also
different ht
building
ne of the while the
Several delivery delivery
stralia is t.

Feedbawas limstorageResponand a n
The RFconsidetypicallyshows tof the placemEnviron
Of partifor an Ethe assenergy
In hindsto the Responneededadd mothese dsignifica
Considecapabiland lifesought,ResponanalysisSection
ack on the mited. Feede device pundents that number of R
FI also souerably with y varying wthe normaliexpected Eent the Ow
nmental app
cular intereESD which set. Influenstorage pro
sight the abproposed
ndents provd, which alsore storage depending ant impact o
Figure 5‐3
ering also ities – for eetimes – a a number
ndents. Uls, which w
n 6.
RFI specifidback on tht forward cthe exact a
Respondents
ught timelinthe period
with technolosed scheduEPC timelin
wner would rprovals.
est were thecould meet
ncing interpoviders were
bility to meeprices. F
vided signiso influence
as that alron techno
on costs ac
3 – Normalised
that differexample dend standarr of issuestimately, th
was used b
cation was e ESD func
could meet lgorithms tos sought cla
ne estimated between ogy selectioule taken frone associatrequire a pe
e capital andt the technicretation of e prepared
et SpecificatFor exampficantly mo
ed their oveready installogy characross initial d
RFI results in t
rent energypths of discrd product s combinedhe only wayby the Con
sought asctionality sothe functio
o be deployarification o
es from ReEPC orde
on and the eom proponeted with baeriod of the
d O&M costcal requiremcosts was to offer, wh
tion at yearle, in man
ore energy rall price relled droppecteristics. delivery and
terms of Phase
y storage charge and sizes that
d to make y to filter tnsortium in
part of theought was mnality reque
yed on the don certain te
espondentser placemenenergy storent submissattery techne order of 6
ts proposedments sougalso the gu
hich vary gr
r 20 was onny instance
storage celative to oted in perfor
This differd ongoing o
2 Delivery Sche
technologienumber ofdid not neit difficult
these differn the Busin
e RFI procemostly confoested. It wdevice wereechnical poi
. Those nt and comrage requiresions and isnologies. Pmonths for
d, with the Sht until yeauarantees aeatly betwe
nerous and es to meetcapacity in hers. Othemance, whrence in moperations.
edule, by option
es had diff cycles, rouecessarily mto compar
rences wasness Case
P
ess, althouorming – thawas noted be yet to be snts.
submitted mmercial oements. Figs broadly in
Prior to EPr Developm
Specificatioar 20, the lifand warraneen Respon
added signt this requyear 1 th
ers chose tohile others rmethodology
n number.
fferent engund trip effimatch the re pricing bs to apply a
analysis g
Page | 44
gh such at is, the by many specified
differed peration gure 5-3 ndicative C order
ment and
n calling fetime of ties that
ndents.
nificantly uirement han was o simply replaced y had a
ineering ciencies Options
between an NPV given in

Figuressuppliefrom oSpecificcategorbattery individu
Figure anonymfrom anindicatehigher tthe grou
FiguresTable 5assumptechnollocationwere no
All of thanalysisacross longer s
The splarge diprovideprobablperform
All of thnetworkin NPVmarket not uneanalysis
RFI restechnolpotentiacost vasummaprotect althougpublishe
s 5.4 - 5.7rs, must thnly those cation, [16] rised in Secstorage tec
ual technolo
5-4 showsmous batteryny particulae some linethe cost, anup appears
s 5.4 – 5.7 5-6. Also ptions giveogies with b
n of the ESot known.
he Figures s – that isall options storage dep
read of resifference in
er is availaly the emb
mance guara
he results wk value wou
V when asscircumstan
expected ans presented
spondents wogy, whichally addressaried signifiarised typica
commerciah it is noteded in the re
7, which ierefore be submission– so CAPE
ction 6. In thchnologies ogy type.
s all short-ly technolog
ar technologarity with Mnd that ther generally g
demonstratshown for n in Tablebetter servicD at this po
demonstra, no technoand respon
pth, appeari
sults was athe approa
ble and yeryonic natuantees, O&M
were significuld add to tsuming certnces would nd is tested d in Section
were also as was also s the commicantly betwal expectatal informatid that in ge
ecent report
ndicate gecautiously
ns shortlistEX does nohese Figurethemselves
isted resultgy. Generagy, and a g
MWh, meanre is some egreater than
te the variaeach optio
e 5-5. Suchce value ovoint the ana
ate that theology that nses, althoung to have
lso significaach from Reet a large ure of the iM pricing an
cantly NPV he revenuetain networbe a commin detail in 6.
sked to proa criterion
merciality of ween technion across ion the exa
eneral the cprepared b
eneral cost interpreted
ted for theot include des to protecs are not id
ts by CAPlly speakinggreat deal ing that theefficiency inn 1.
ance acrosson is a “bah an analy
ver storage alysis was
ere was noshowed a ugh certainan advanta
ant even aespondents spread of ndustry, wind balance
negative ue side, and rk values, imercial prop
relation to
vide the ex in the suban ESD int
nology andall responsact battery
claimed pricby the CSIR
informatio. Here raw
e scope ofdevelopmenct commercientified, alt
EX againstg the graphof data spr
e more quan scale as t
s technologase case” ysis tends duration, buunknown, a
clear techsignificant batteries a
age for parti
cross the s– for examresults wa
ith still signof plant cos
nder the bainitial resultt is unlikelyposition in ithe recomm
xpectation obmission ato the future Respondeses of cost
y technologce trajectoryRO for the A
on (CAPEXw cost inforf work pront or ownerial informatithough resu
t MWh ands indicate liread. The bntum of enethe d(MWh)
y for OptionNPV analyto prejudic
ut was neceand hence t
hnology preNPV bene
appear to becularly Opti
same technmple, only onas presentenificant varists.
ase case asts showed sy that an Eits own righmended Pha
n costs intossessmentse. While exents, Table s relative ty is not g
y is more agAEMC, [20].
P
X) from shrmation is povided in trs costs, wion of suppults are gro
d MW grouittle obviousbottom grapergy stored)/d(CAPEX
ns 1, 4 andysis, basedce slightly essary as ththe actual s
eference unefit over thee better opion 7 (Figur
nology, indine NaS tec
ed. This iniation in re
ssumptionssome improESD underht. This resase 2 proje
o the future s and whicxpectations
e 5-7 indicato 2015. Aiven in theggressive t
Page | 45
hortlisted provided the RFI hich are
pliers the uped by
uped by s benefit ph does
d (Q) the ) across
d 7 from on the against
he exact services
nder this e others tions for re 5-7).
cating a chnology ndicates lation to
s. While ovement r current sult was
ect in the
of each ch could s around ates the
Again, to e Table, han that

Techno
Battery
Battery
Battery
Battery
Table 5‐7
5.5.5
Followinnext stecommerelativefrom enThese t
HowevetechnolAustralirenewaargued securityhappenconnec
This focsmaller installatexpendbattery most ofpilot pla
ology
technology A
technology C
technology D
technology E
7 – Average exp
DecisionBusiness
ng the RFI eps for the
ercial in its ly high cosnergy tradinthings are c
er, there isogy, which ian power
ables relativin Section
y and technn relatively t.
cused the r end of thetion and oiture. Conoption and
f the Respoant could fo
Ty
A
C
D
E
pectation of Reswho spec
ns Followins Case Ass
process theProject intoown right b
st of energyng in Southcanvassed i
s a need is expectedsystem, w
ve to dema3.1, energyical issues quickly to
attention oe Option s
operational sidering co this becam
ondents werreseeably t
ypical claimescale i
No chan
spondents to tecifically provide
ng RFI Prosessment
e Consortiumo Phase 2. based on cuy storage teh Australia n detail in S
to gain locd to play anwhich has nd and they storage isarising fromavoid comp
f the Conscale in Tabaspects o
osts at suchme the focure relativelyrial a numb
ed prospectinstallations
2020
57%
50%
nge envisage
50%
echnology priceed advice on co
ocess – D
m held a wo What wasurrent markechnologiesand throug
Section 6.
cal real won important
world leae decreasings expected m the changpromising t
sortium ontoble 5-6, to
of the ESDh scale, it ws for the bu
y agnostic aer of differe
tive price ofs) relative to
ed
e in future relatst trajectories a
Demonstrat
orkshop in ws clear is thaket circumss and the r
gh current n
orld experit role in theading peneg levels of to be one
ging generathe ability o
o a potentigain expe
D conceptwas likely tusiness casabout the acent storage
f battery teco the base p
No cha
N
ive to 2015 – oare shown
ion Plant
which to coat the ESD
stances, a prevenue thanetwork sup
ence with future opetration levesynchronoof the soluttion mix, anof more ren
al demonsterience with
while limitihat this wose for this Rctual storagtechnologie
P
chnology (foprice in 2015
2025
42%
46%
nge envisag
Not given
only those short
Configurat
onsider the pD was unlikeproduct of bat can be opport oppor
applicationeration of thels of inteus generattions to thend this maynewable en
tration planh the procuing un-com
ould favour Report, althge media uses.
Page | 46
or utility 5
ed
tlisted and
tion for
potential ely to be both the obtained rtunities.
n of the he South ermittent ion. As
e system y have to nergy to
nt at the urement, mmercial
a Li-Ion ough as sed, any

In termsnetworkDalrymp132 kVintermitthrougha reasostation made fosupply within tpossible
This thnumberDalrympSection
s of Site, thk there hasple area ha
V line, – wttent renewah the “Heywonable expeis isolated or an ESD ofollowing suhe island, ae.
en led to r of project ple Sub-Sta
n 6.
he Consortius many of tas significan
which can bable genera
wood” SA-Viected unservthrough a coperation. uch a fault,and various
the formal configuratio
ation on th
um eventuahe attributent wind enebe consideration with thctoria intercved energycontingencyTo achieve including p
s Responde
business ons based
he Yorke P
ally selectedes of the SAergy generared analoghe only AC connector. y requiremey event, to we this, the pipotentially ments had ind
case work,on Lithium-
Peninsula.
d DalrympleA region ofation within ous to SouconnectionElectraNet nt which ocwhich a reglot plant womaintainingdicated that
, which wa-Ion batteryThis busin
e, a decisionf the NEM. it and is se
uth Australn to the restalso calcula
ccurs when gulated reveould have to some of tht such com
as undertaky technologess case w
P
n made as t For exam
erviced by lia’s high let of the NEated that ththe Dalrym
enue case co establish ihe wind geplex operat
ken investigy connectework is det
Page | 47
the local mple, the
a single evels of M being
here was ple sub-could be islanded neration tion was
gating a ed to the tailed in

Figure
e 5‐4 – Shortlistted capital pricees for RFI Speci(bottom graph
ification scope,h) across all opt
showing CAPEtions submitted
X by MWpk (topd
P
p graph) and by
Page | 48
y MWh

Figure 55‐5 – CAPEX (topfrom Ta
p) and NPV (boable 5‐6 (5 MW
ttom) for shortWpk, 5 MWh) wit
tlisted options gth NPV calculati
grouped by eneions based on t
ergy storage tecthe metrics in T
P
chnology – for Table 5‐5
Page | 49
Option 1

Figure 55‐6 ‐ CAPEX (topfrom Tab
p) and NPV (botble 5‐6 (10 MW
ttom) for shortWpk, 40 MWh) w
tlisted options gith NPV calcula
grouped by eneations based on
ergy storage tecthe metrics in
P
chnology – for OTable 5‐5
Page | 50
Option 4

Figure 55‐7 – CAPEX (topfrom Tab
p) and NPV (bole 5‐6 (10 MWp
ttom) for short
pk, 200 MWh) wtlisted options g
with NPV calculagrouped by eneations based on
ergy storage tecn the metrics in
P
chnology – for n Table 5‐5
Page | 51
Option 7

6.
In this 20 MWhSouth AProposa
A Lithiucommeinvolve value foSection
The ESoutcomoutlines
6.1
During shortlistprepara
The absuccessthe follo
p
f
f
BUSIN
section a dh based onAustralia. Tal”, which fo
um-Ion baseercial result
further proor money. Tn 7.3.
SD Proposae, which pr
s the approa
Overview
the site selted for such
ation of the
Market Tra
Marginal Lo
Expected U
Ancillary se
bove benefsful implemowing benef
Energy Traperiods). Wpricing. Thprices are hdirectly to tinstance, wduring low further windrequired instorage is ifact that asbehaviour i
Improvemenetwork coProposal, bPoint - Dalload when dispatch wconsistent
ESS CAS
detailed bun Lithium-IoThis configuollows on fr
ed project isbased on
ocurement This is disc
al presenterovides the ach to the c
w of ESD
ection proch an asset business ca
ading Reven
oss Factor
Unserved E
ervices supp
fits are dismentation of
fits:
ading (ShifWind generae ESD wouhigh. The bthe operato
wind farms wind condid generatio order to gntroduced s more winn the marke
ent in MLFngestion, abeing sited rymple 132the Wattle
when WPWwith dispa
SE
siness casn storage teuration is rerom the narr
s presentedRFI resultsnegotiation
cussed more
ed here thestarting po
commercial
Proposal
cess variousat Dalrympase:
nue;
(MLF) impa
Energy (USE
port (System
scussed in a utility sca
ft energy gation often uld act as
benefits to tor exploitingwould be ations when
on to be cogenerate aprice volatild generatioet will increa
F: Energy snd thereforat Dalrymp
2 kV line. Foe Point WinF is genertch/charge
se is presenechnology ceferred to inrative of Se
d as the ESs. The fina
n to achieve around de
en providesoint for the d
issues that
Benefits
s benefit clale. The follo
act;
E) reduction
m frequenc
turn belowale battery
generation occurs ovea load whe
this are twog price diffeable to suppool prices
onnected ton income flity will decron is connease.
storage care, capture ple, will enaor this bene
nd Farm (Wrating at lo
price sign
nted on anconnected n this businection 5.5.5.
D Proposall technologe the best etailed proc
s one versdevelopment the Conso
asses were owing bene
n; and
cy support /
w. The Costorage stra
from low ernight, duen prices a
ofold; in the erentials (epply a portios are high, the grid. Wfor a standrease. Howected to the
an modify energy thatable improvefit to accru
WPWF) is gow or zero als under
ESD asseat the Dalryess case se
as it appeagy chosen f
formal concurement sc
ion of an ent of a Phartium is like
consideredefits were qu
FCAS).
onsortium categy at Da
value perioring times are low and
first instancnergy tradion of their thus increa
We note thadalone schewever, counte region, ne
marginal lot would otheved loss facue the ESDgenerating a
output. Ththe market
P
et of 10 MWymple subsection as th
ars to offer for Phase ntract positcope for Ph
expected Pase 2 propoely to take.
d and subseuantified du
considers talrymple wil
ods to higof low or n
d dispatchece, benefitsng). In the energy to
asing the viaat price voeme, and ateracting thegative pric
oss factorserwise be loctors on the
D has to opeat high outhis will be t trading o
Page | 52
Wpk and station in he “ESD
a better 2 would tion and ase 2 in
Phase 2 sal, and
equently uring the
that the ll deliver
gh value negative ed when s accrue
second the grid ability of latility is as more his is the ce spike
s during ost. The e Wattle erate as tput and broadly
perating

f
6.2
The spe
Item
En
OE
EP
Loc
Gri
ML
Siz
Ra
5 In prcounnot fobene
mode, andgeneration MLF regiongeneration
Expected Ua network eenergy reqenergy lostenergy dispenergy. UlSpecificallyenergy in th
Network ansystem secfrequency Generatorsgenerating services mprovide ancvein, the prtrading func
Summar
ecifications
m
ergy storag
EM
PC contracto
cation
id connectio
LF
ze (nominal
ted storage
actice this ister-cyclicallyor others. S
efits will often
d therefore often requi
ns. Being abto connect
Unserved Eevent/outag
quired by cut is known apatch durintimately, b
y, the Prophe event tha
ncillary sercurity AEMcontrol (FC
s are generain order to
may be in ccillary servicrovision of action.
ry of ESD
of the ESD
ge technolog
or
on
power)
s not straighy to wind farimilarly using
n cause ener
tends not ires a sizeable to modifinto the grid
Energy (USEge. Without ustomers isas expectedg these evattery stora
posal incorpat the 132 k
vices (SystMO purchas
CAS), voltaally relied u
o provide thconflict withces operatinancillary ser
Proposal
D Proposal a
gy
tforward – dm output mag a storage rgy trading be
to diminisable footprinfy or improvd.
E) reductionenergy sto
s unable tod unservedvents and reage could porates thekV line to Da
tem frequenses serviceage controupon to prohem. Accorh generationg in eitherrvices by th
Specifica
are summar
Desc
Lithiu
To be
To be
Dalry
Dalry
0.87
10 M
2 hou
detailed analay give enerdevice to re
enefits to be
h the marknt, these sitve the MLF
n in a regionrage capab
o be supplienergy. Baeduce the vincrease t
e benefit ofalrymple is
ncy suppors from ma
ol (VCAS) ovide such ardingly, the on strategy.r charging ohe ESD may
ation
rised in Tab
cription
um Ion batter
e determined
e determined
ymple
ymple
MW
urs
ysis showedrgy trading beduce system
significantly
ket trading tes tend to will ultimate
n that may bility or netwed during tttery technovolume of ehe reliabilitf avoided etripped.
rt / FCAS).arket particiand systemancillary seobjective t A grid co
or dischargey be in conf
ble 6-1.
ry
d at Phase 2
d at Phase 2
d that operatbenefits for sm losses and
eroded.
P
benefit5. Abe located
ely allow mo
arise as a work augmethese evenology wouldexpected uty of the nexpected u
To ensureipants, spem restart
ervices but to provide aonnected Ee mode. In aflict with the
2
2
ting a storagsome wind fd hence rea
Page | 53
As wind d in poor ore wind
result of entation, nts. This d enable nserved network. nserved
e power ecifically, (SRAS). must be ancillary
ESD can a similar e market
ge device farms but alise MLF

De
Pow
Cy
Nu
Eq
6.3
Due to structurbenefic
6.4
The Coand bendiscouncapital Accordipresent
The out
pth of disch
wer Charge
yclical efficie
umber of cyc
uivalent use
Summar
the multipre given iniaries.
Financia
onsortium hnefits assocnted cash fand operatingly, the mt value.
tputs of the
Net PresenEstimated f
harge
e Rating
ency
cles
eful life
Table 6‐1 –
ry of com
le objective Figure 6-
al Model
as developciated with flow model ting costs.
model applie
model inclu
nt value of cfunding sho
Specification of
mercial st
es of this E1, which
ped a financimplementawhich incoProject cas
es a post-tax
ude:
costs and beortfall requir
100%
10 M
92.2%
1000is prdevic
10 ye
f project as use
tructure
ESD Propossets out th
cial model tation of the
orporates fosh flows arx nominal d
enefits attribred to make
%
MW
%
0–10,000 – toreferable to ce
ears
ed for business
sal we havhe revenue
to quantify e ESD Proporecast revere derived
discount rate
butable to the the ESD P
o preserve tavoid fully
case analysis
e determine streams a
the expecteposal. The fenue streamon a post-e to discoun
he ESD ProProposal via
P
the battery lidischarging
ed the comand the res
ted economfinancial moms and ass-tax nominant cash flow
oposal able.
Page | 54
fe it the
mmercial spective
mic costs odel is a sociated al basis. ws to net

6.5
This seConsorbased oby Woroperatioown pro
The key
D
V
W
C
T
U
S
D
ESD Pro
ction descrrtium has baon unserverleyParsonsons and maoject develo
y assumptio
Description
Valuation da
WACC post
CPI escalati
Tax rate3
Useful life4
Spot USD/A
Depreciation
T
Figure 6
oposal As
ribes the indased its ESd energy as; estimateaintenance opment exp
ons used to
ate
tax nomina
on2
UD5
n method6,7
Table 6‐2 – Key
6‐1 – Commerc
sumption
dicative ProjSD Proposanalysis unds of engin(O&M) infoerience.
evaluate th
l1
project assump
ial structure as
s
oject Budgetal. The Consdertaken by neering, proormed from
he Proposa
%
%
%
Year
USD
ptions used in b
sumed in busin
t and majorsortium hasElectraNet
ocurement the RFI pr
l are summ
Un
s
per 1 AUD
business case (s
ness case
r assumptios developedt, market mand constr
rocess; and
arised in Ta
nits
3
see Notes below
P
ons upon whd its project
modelling coruction (EP
d The Cons
able 6-2.
Valu
30 June 201
7.5%
2.5%
30.0%
10 year
0.7
Straight lin
w)
Page | 55
hich The t budget
onducted PC) and sortium’s
ue
6
%
%
%
rs
71
ne

Notes on
1.
2. 3. 4. 5. 6.
7.
6.6
Based throughthe mar The Coare indprohibitdecreasis moreaspect Table 6Figure 6
Ca
EP
Co
La
O
D
Co
To
Notes:
1. 2. 3. 4. 5.
Table Table 6
The post-tax cost of capitaCPI escalatioCorporate taxEquivalent of Prevailing spAs the ESD wprime cost. It is expectedof capital exp
ESD Pro
on simulahput rangingrket. This w
onsortium hadicative. Bative levels. se based o
e economic is explored
6-3 provides6-2 illustrate
apital cost ele
PC contract1
onnection2
and acquisitio
Owners costs
evelopment4
ontingency5
otal
The EPC conIncludes site eLand currentlyDevelopment Contingency h
6-2:
nominal discl (WACC), pern rate applied
x rate in Austrathe technical
pot FX rate as will in part be
that The Proenditure is de
oposal Ca
tion using g from 400 was calculat
as undertakattery storaHowever, an a declininthan early yin more de
s a summares the capit
ement
on3
Table 6‐3 –
tract, indicativestablishmenty owned by Eapprovals
has been dete
ount rate appr the AER fina as the midpoalia. life of proposeat 1 Septemb
e included in E
posal satisfiespreciated upfr
pital Cost
historical to 1,500 M
ted using th
ken an RFI age is an as the technng trajectoryyears, assu
etail within th
ry of projecttal expendit
– Assumed capit
ve pricing infort costs. lectraNet.
ermined at 10%
plied is equivaal determinatiooint RBA's infla
ed Lithium Ionber 2015. ElectraNet’s R
s the eligibilityront.
ts
data the EMWh per yehe mathema
process anemerging
nology entey which impuming that fhe key proje
t capital costure profile.
Co
C
C
C
C
C
tal cost breakd
rmed by RFI,
% given conce
alent to Electon for 2013 – 2ation target of
n technology a
Regulated Ass
y criteria for R
ESD Propoear, dependatical mode
nd equipmetechnology
ers a growthplies that plforeign exchect sensitivi
st breakdow
$ 000
ommercial inconfidence
Commercial inconfidence
Commercial inconfidence
Commercial inconfidence
Commercial inconfidence
Commercial inconfidence
24,880.0
own used in bu
described in fu
ept stage of pr
raNet’s regula2018, released2.0% to 3.0%
as informed by
set Base it wi
&D tax conce
osal derivesent on the l presented
nt costs proy and costsh phase, cosant construhange remaities further
wn for the E
%pro
n Coc
n Coc
n Coc
n Coc
n Coc
n Coc
usiness case.
urther detail b
roject
P
ated weightedd April 2013.
% in long term.
y RFI process.
ll be deprecia
ession, accord
s an acculevel of vo in Section
ovided in Ts are currsts are exp
uction in lateains constar below.
ESD Propos
% of Total oject capital
ommercial in confidence ommercial in confidence ommercial in confidence ommercial in confidence ommercial in confidence ommercial in confidence
100.0%
below.
Page | 56
d average
.
ated using
ingly 40%
mulated latility in 5.5.1.
able 6-3 rently at ected to er years nt. This
sal while

6.6.1
The motechnoltypical plant pa
EPC coEPC es
To provinterestscope oeither o
It is notforeign
6.6.2
The ESApproxisubject
At or imcosts wproject.and rem
6 Spot US
‐
5.0
10.0
15.0
20.0
25.0$
mill
ion
EPC con
ost significogy and otsplit observackage (inv
ost estimatestimates are
vide certaint (EOI) procof works wilof the same
ted that the exchange a
Currency
SD Proposaimately 90%to foreign e
mmediately bwhich are s This will en
move all fore
SD/AUD rate a
0
0
0
0
0
Jun 16 Jul 1
Figure 6‐2
ntract
ant elementher equipmved across erters, PCS
es have beee representa
nty around cess will bel be better dmagnitude
capital cosand commo
y exposure
al pricing is% of the suexchange ra
before finansubject to fnable the Ceign exchan
as at 1 Septem
16 Aug 16 Sep
– Capital expen
nt of the cment being
the submisS etc) is 60:
en informedative of exp
project coe run in Phadefined, cosor lower th
t estimates odity prices
e
s based onupply and inate fluctuati
ncial close, foreign exc
Consortium tnge risk.
mber 2015
p 16 Oct 16 Nov
Periodi
nditure profile
capital costsupplied an
ssions betw40.
d by the RFpected 2017
osting it is ase 2. It isst estimatesan the cost
are subjecover the de
n the prevanstallation ions.
the Consorchange rateto obtain fix
v 16 Dec 16 Jan
c Cumulative
assumed in bus
ts for the nd installed
ween battery
I process a7 implement
envisaged s expected s will becomts incorpora
ct to variatioelivery and c
ailing spot, cost is den
rtium will ares to be hexed Australia
n 17 Feb 17 M
siness case.
ESD Propod by an EPy package a
nd as such tation cost.
a competithat throug
me more robted within t
n dependinconstruction
i.e. 0.71 Unominated i
range for thedged for tan dollar pr
ar 17 Apr 17 M
P
osal is the PC contracto
and the ba
are indicat
itive expresgh this procbust and shhe Busines
ng on fluctuan period.
USD to 1.00n USD and
he proportiothe durationricing for the
May 17 Jun 17
Page | 57
battery or. The lance of
tive. The
ssion of cess the hould be ss Case.
ations in
0 AUD6. d will be
ons of its n of the e project

The Coadjusteassumeeconom
6.7
The follProposato seve
Each of
6.7.1
Charge
The madistinct
The chalgorith
onsortium hd at financ
ed FX ratesmics.
Project
lowing reveal. These reral stakeho
Market trapeak/peak in the ComMLF benefiValue of exin the regioAncillary sespecified in
f these reve
Market T
e and disch
arket tradintrading stra
Market off peachargedis triggattributeincreasCap traprotect instrum$300/Mat $300premiumfrom puand discap inst
harge and dm given in
has assumecial close tos and the cu
revenues
enue streamevenue strelders:
ding revenpricing diffemercial Stru
fit associatexpected uns
on ervices rev
n the propos
enue stream
Trading Rev
harge profi
ng revenueategies, as o
time-shiftinak price did when pricered with ed to cyclice in price. M
ading stratethe purcha
ment is consMWh; the op0/MWh. Them is inhereurchasing caspatching dtruments.
discharge pTable 6-4.
ed that theo reflect anurrent forwa
ms have beeeams are u
nues, arisinerentials, wucture
ed with WPWserved ene
venues accrsed Comme
ms are desc
venue
ile
e comprisesoutlined bel
ng trading sfferentials.
ces are low reference
cal efficiencMarket eneregy refers toser from prsidered to bption holder’e provision ently represaps can alsuring spike
profile of th
e amount ony differencard FX rate
en incorporunlikely to a
ng from shwould accrue
WF accrue tergy accrue
rue to AGLercial Struct
cribed in furt
s two distilow.
strategy canUnder theand wouldto a price
cy is, at a rgy trading o trading orice spikes be “in-the-m’s exposureof a cap eentative of
so be replice events. O
he ESD Pr
of funding tces (increase, in order to
rated into thaccrue to a
hifting energe to AGL, a
to AGL, as to various
L Energy, ature
ther detail b
nct revenu
n be broadlye ESD Pro dispatch wthreshold,
minimum, roccurs at p
option derivain the wholemoney” whee to pool pricearns the se
the level oated by beiur analysis
roposal has
to be provise or decreo maintain t
he Businesssingle owne
gy generatas the energ
the operatomarket gen
as the oper
below.
ue streams
y identified oposal, the when prices
such thatrecouped inrice points batives, knowesale markeen the poolce spikes iseller a cap of market vong long in pis premise
s been det
P
ided by ARease) betwthe Busines
s Case for ter, but may
tion to expgy retailer s
or of the WPnerator part
rator of the
derived fr
as exploitin device w are high. Dt any volumn a commebelow $300wn as capset. Such a fl price rises
s effectivelypremium. T
olatility. Thephysical ge
ed upon the
termined us
Page | 58
RENA is ween the
ss Case
the ESD y accrue
ploit off-specified
PWF ticipants
e device
rom two
ng peak-ould be Dispatch me loss ensurate 0/MWh s, which financial s above
y capped The cap e payoff neration
e sale of
sing the

Rule
Cha
Disc
Cha
Disc
Each of
Item
Ma
Pow
Min
Loo
Ch
Dis
Cyc
Ca
MinDe
Hig
Min
Notes:
1. 2.
e
arge
charge Po
arge
charge
f the param
m
arket time-sh
wer Charge
nimum state
okback peri
arging trigg
spatch trigg
cle efficienc
p trading st
n Charge lepth of disch
gh Price trig
n SOC Char
This relates toTo enable thebattery is avaassumed to eDalrymple 13diversity will a
M
Pool price
Pool
ool price > (mefficien
Pool price
Stora
Pool p
T
eters in Tab
hifting tradin
Rating1
e of charge
od3
ger
er
cy4
rategy
evel (Equivharge of 100
gger6
rging trigger
Ta
o the charge/de cap trading sailable to dispaenable local
32 kV line. Thallow the 15
Conditio
Market time-
< median of
AND
price < Char
median of looncy) plus Dis
Cap
e < MinSOC C
AND
age balance
price > High
Table 6‐4 – Cha
ble 6-4 are
ng
(MinSOC)2
valent to a 0%)5
r7
able 6‐5 – Defin
discharge ratestrategy a minatch during spDalrymple loahe infrequencyMWh reserve
on
-shifting trad
lookback sa
rging trigger
okback sampspatch trigge
trading stra
Charging trig
< MinSOC
Price trigger
arge/discharge
defined in T
Max
nition of param
e under normanimum state ofpike events. Sad to continuecy of both higed for price ev
ding strateg
mple
ple/cycle r
ategy
gger
r
profile used in
Table 6-5.
Units
MW
MWh
Days
$/MWh
$/MWh
%
MWh
$/MWh
$/MWh
eters of Table 6
l operating cof charge of 15
Similarly a mine to be supph price eventvents above $
A
gy
Charge at R
Discharge aR
A
Maintain bal
Charge at R
Discharge aR
A
Max depth
business case
6‐4
nditions. 5 MWh is assunimum state olied in the evts and 132 kV$300 to also b
P
Action
Power CharRating
at Power ChaRating
AND
lance of MinS
Power CharRating
at Power ChaRating
AND
h of discharg
Value
10
15
3
60
40
92.2
0
300
100
umed to ensurof charge of 1vent of a failuV line failure be used to pr
Page | 59
rge
arge
SOC
rge
arge
ge
re that the 0 MWh is
ure of the and their
rovide the

3. 4.
5. 6. 7.
Spot pr
The alghourly mtrading profile o
From Fwhich iobservebalancestrategy
The ouand as price da
10 MWh reseavailable for tEquivalent to Cycle efficiendetail below. Under a high High price trigIn the event providing the available for t
rice data
gorithm of Tmarket spotstrategy.
of the ESD
Figure 6‐3 – C
igure 6-3, ts represened that oute which is ry.
tcomes aresuch we h
ata, shown
erve assumed he execution 144 historical
ncy relates to
price event pogger is set to $the state of c pool price isthe next spike
Table 6-4 ht prices spaBased on tProposal as
Charge and disc
there is a clntative of thside of spirepresentati
e highly dephave furtherin Table 6-6
for 132 kV linof the market pool price saround trip lo
ower output is$300/MWh repcharge falls bs less than $event.
has been reanning one the algorithsset has be
harge profile of
lear correlahe value inke events ive of the e
pendent onr back-teste6.
ne failure. Accenergy strate
amples. osses attribute
s increased to presentative obelow the Min100, this acc
etrospectiveyear to illus
hm and the een determi
f the ESD Propo
ation in battenherent in tthere are s
energy shift
n price volaed the algo
cordingly, the gy at pool pric
ed to the batt
maximise theof selling $300/nSOC, the baelerates the r
ely applied tstrate the oprice datas
ned, set ou
osal asset based
ery dispatchthe cap trasmaller scaing value a
atility observorithm on a
remaining 5 Mces below $30
ery technolog
revenue unde/MWh cap der
attery is chargrecharge of th
to a historicoperation of set the chat graphically
d on one year o
h and pool ding strate
ale fluctuatiottributed to
ved within tfurther 3 y
P
MWh of stora00.
gy, described
er spike eventrivatives. ged up to thehe battery so
cal data sef the marketarge and diy in Figure
of market data.
price spikeegy. It can ons in the the market
the sampleyear period
Page | 60
age will be
in further
ts.
e MinSOC o that it is
et of half t energy scharge 6-3.
e events, also be storage
t trading
e period, of pool

Ye
20
20
20
Av
The totvolatilityvariatiorepresemarket conservforecas
Losses
Subseqthe ESDyield. Tis referrcan be of the esignificais suffic
A geneProposafactors estimat(DLFs) in weakwill be s
The los
Des
Cyc
ML
Market
Based oone yea
ear Cap rev
$
012 9
013 5
014 1
vg 2
Ta
tal market y prevailingn over the
entative of thconditions
vative and st period of
s
quently, the D Proposal
The differencred to as thfully discha
energy goingant for derivciently high
rator is paidal incorporto derive
es are dercan change
k parts of thsignificantly
ss factors in
scription
clical efficie
LF
t trading re
on the histoar period ha
trading venue
$ 000
V
94.2
521.3
52.5
56.0
able 6‐6 – Exam
trading beng in any give period. Whe volatility in SA an reasonable
10 years.
model take asset (cabce between
he cyclical earged, so ng in 10% ofving a markto offset cyc
d accordingrates realisan energy
rived. Transe substantiahe grid. It y more gene
corporated
ency
Ta
venues
orical simulave been ad
Volume (MWh) c
100
400
180
226.7
mple variation in
nefit fluctuaven year. Th
While the voin any one
increase ine proxy, the
es into accbling lossesn the chargeefficiency. Ao energy isf volume wi
ket trading sclical efficie
g to energy stic, third-pay yield at tsmission Loally when neis noted thaeration intro
into the ES
able 6‐7 – Loss f
ation abovedopted as s
Average cap payoff($/MWh)
941.62
1,303.34
847.22
1,129.41
n total market
ates year tohe payoff polatility exh
e year timefrn volatility ise historical
count all pos, heat etc.)e going intoA cyclical es lost. A cyll be lost (ty
strategy, as ency losses
actually delarty calculathe regionaoss Factorsew generatat as the Moduced in th
SD Proposa
factors used in
e the averaummarised
Market tradingrevenue
$ 000
28.8
129.3
66.0
74.4
revenue over 3
o year as iper MWh itshibited in thrame, it is as likely to m dataset h
tential sour) in order too the asset fficiency of
yclical efficieypically as hdispatch sh
.
livered to thated transmal node, fros (MLFs) aion is introdLF is alread
his part of th
l are summ
Units
%
the business ca
age market d in Table 6-
Volume(MWh)
385
1,540
800
908.3
3 successive yea
t is dependself does nhis data seassumed thamaterialise.as been ex
rces of eneo derive theand the ch100% impl
ency of, sayheat). The chould ideall
he node. Acmission anom which and Distribuduced into ady poor it ishe grid.
arised in Ta
ase
energy trad-8.
P
e )
Avg mtradinpayo
($/MW
74.7
83.3
82.4
81.8
ars
dent on ponot show siget is by noat given the. Accordingxtrapolated
ergy losses e round trip
harge cominies energy y, 90% impcyclical efficly occur wh
ccordingly, tnd distributi
operating ution Loss an area, pars unlikely th
able 6-7.
Value
92.2%
0.87
ding revenu
Page | 61
mkt ng off Wh)
77
33
44
86
ool price gnificant
o means e current gly, as a for the
through p energy ng out of going in
plies that ciency is en price
the ESD ion loss revenue Factors
rticularly hat there
ues for a

Ou
Ma
Ma
Ma
The caagainst maximuprice evbeen dmarket,
A
Notes: 1. 2.
3.
The impnote thAccordiwas ado
Descri
Capaci
Cap pr
MLF
Volatili
Cap tra
Notes:
1. At thethis fo
tputs
arket energy
arket energy
arket energy
p trading re the capaci
um of 2 houvents. Theetermined, , as set out
Year
2012
2013
2014
Average
Represents averaEquivalent cap re$/MWh)
Implied level of E
plied volatilhe results ingly for theopted. The
ption
ity
remium1
ity capture
ading reven
e date of writingorward market.
y trading dis
y trading cha
y trading rev
Tabl
evenue comty of the ESurs, it is expe level of vo
having refin Table 6-9
Cap tradrevenu
$ 000
94.2
521.3
152.5
256.0
Table 6‐9 –
age option payofevenue assuming
ESD availability to
lity capture varied sig
e Businesse cap trading
ue
T
g, cap derivativeAccordingly, a
scharge reve
arging costs
venue
e 6‐8 – Market
mponent haSD. Based pected that olatility capference to t9.
ding ue1 0
2
3
5
0
Level of volatil
ff from exercise eg 10 MW, 100% v
o capture spike p
of 44% is nificantly yCase a vo
g revenue a
Table 6‐10 – Ca
es for calendar liquidity discoun
enue
s
trading revenu
ave been don a minim
t the ESD wpture impliethe prevaili
Cap price($/MWh)
8.75
7.66
6.32
7.58
ity captured by
events (Payoff = Svolatility capture
rice events..
broadly coyear to yeolatility captassumption
ap trading reve
year 2016 are tnt of 20% has b
$ 000 real
FY16
138.1
(63.7)
74.4
ue used in busin
erived basemum storagewould captud by simulang cap pre
Cap r($
6
5
4
5
y ESD, used in b
Spot ‐ $300/MWhand MLF of 0.87
nsistent witar, dependture of 40%is summar
Un
$ 000
nue assumptio
trading above $een applied, res
MWh
908.0
908.0
908.0
ness case
ed on selline capacity oure approximated cap traemiums trad
revenue2 000)
66.9
83.8
81.7
77.4
business case
h) 7 (10 MW x 8,760
th expectatiding on po% for the ESised in Tabl
nits
MW
$/MWh
%
real FY16
n
$12/MWh, howesulting in cap pr
P
$/MWhF
15
(7
8
ng cap instof 1.5 hoursmately 40%rading revended in the
Implied vocaptur
(%)
14.1
89.3
31.7
44.3
0hr x 100% x 0.87
ions; howevool price vSD Proposle 6-10.
Value
10
0
4
30
ever there is lowrice of $10/MWh
Page | 62
h real FY16
52.00
0.14)
81.86
ruments s up to a
% of high nue has forward
olatility re3
3
7
3
7 x cap price
ver, it is volatility. al asset
10.0
0.00
0.87
40.0
04.8
w liquidity in h .

Based oout on i
Descr
Marke
Cap p
Busin
6.7.2
The exithe trancircuit lcombin
The insin the Mtheoretia lessecharge/trading
The est
The MLbenefit farm waESD is
D
M
W
V
V
Table 6‐12
6.7.3
The bereferencoutagesidentifie
on the abovn Table 6-1
ription
et Energy Tr
premium rev
ness Case m
Revenue
isting genernsmission liine, with Sation of the
stallation of MLF. The Mically dispater extent /discharge mode and w
timated ben
LF benefit iswould accras exportinfully charge
Description
MLF uplift
WPWF annu
Value of bun
Value of ML
2 – Estimated b
Value of
enefit attribuce to histos on the 1ed:
Outageaverage
ve the total 11.
rading reven
venue
market tradin
e from MLF
ration at WPnk from Da
Snowtown Wese element
load electrMLF benefittch in a couthe outputrules are liwill not can
nefit attribute
s dependenrue if the ESg more thaed.
ual producti
ndled energ
F benefit pe
benefit attributa
expected u
uted to exrical outage132 kV Da
e events oce, each yea
market trad
nue
ng revenue
Table 6‐11 – T
F benefit
PWF typicalrymple bac
Windfarm (Sts results in
ically closet associatedunter cyclicat of SWF,kely to be nibalise any
ed to lost e
t on the opeSD was alw
an 90% of r
on
gy (including
er annum
able to avoided
unserved e
pected unse rates and
alrymple lin
ccurred 22 ar
ding benefit
Total Market T
ally exceedsck to the neSWF) also a poor MLF
r to WPWFd with instalal manner t has beeconsistent y market tra
nergy avoid
erating regiways able torated capac
g REC)
d lost energy at
energy
served ened duration.
ne has bee
times per
t incorporate
U
$ 0
$ 0
$ 00
rading Benefit
s the local loearest load connecting
F for WPWF
F is expectelling at batteto the genen quantifiewith the pr
ading benef
ded at WPW
me employo charge whcity which is
Uni
%
GW
$/MW
$ 000 rea
the Wattle Poi
ergy avoide The last
en reviewe
year totalli
ed in the Bu
Units
00 real FY16
00 real FY16
00 real FY16
oad at Dalrycentre is on
g to the gridF generatio
ed to result ery at Dalryration outpu
ed. It is rice signalsfit.
WF is set ou
ed by the Ehenever thes not possib
ts
Wh
Wh
al FY16
nt Wind Farm,
d has beeten years
d with the
ng 3.5 hou
P
usiness Cas
Valu
6
6
6
rymple. In anly a 132 kd on this li
on of 0.87.
in a small iymple, whicut of WPWFnoted tha
s under the
ut in Table 6
ESD. The me Wattle Poble at any t
Valu
+0.
250.
80.
100.
used in busine
en determinof data rel following
urs in dura
Page | 63
se is set
ue
74.4
304.8
379.2
addition, kV single ne. The
ncrease ch would F and to
at these e market
6-12.
maximum oint wind time the
e
5
0
0
.0
ess case
ned with lating to insights
ation, on
During “blackecharge supply SectionHowevethe avo
Accordias set o
D
A
O
Aa
The vaestimatyielding
Descri
Total avoide
Value
Value
Note thproject.parties insteadElectraN
6.7.4
The revreferenc
7 Excludi8 http://ww
Average22 outa3 hoursAverage
these histod-out”. Imin the ESDfrom the tra
n 6.7.1 mayer, this is ex
oided expec
ingly, the aout in Table
Description
Average dem
Outage dura
Avoided exannum
Table
lue of avoided by app
g a total ann
iption
expected ed
of Custome
of avoided e
Table
hat the avo Avoided eimpacted b, it providesNet’s regula
Ancillary
venue attribce to histor
ng large indusww.aemo.com
e duration ages excees e demand d
orical outagmplementatD during reansmission y result in xpected to oted unserve
verage expe 6-13.
mand during
ation per an
xpected un
e 6‐13 – Expecte
ded expectlying AEMO
nual benefit
unserved
er Reliability
expected un
6‐14 – Estimat
oided expecexpected unby the ESDs a basis oated asset b
y services r
buted to thrical FCAS
strial customem.au/Electricity
of a singleding 2 hou
during outag
es local deion of the
egular operanetwork isthe ESD
occur for lesed energy.
pected unse
g outage
num
nserved en
ed unserved en
ed unserveO’s Value ofrom of $36
energy pe
y
nserved ene
ted total value o
cted unservnserved ene
D. This doen which a pbase Ancilla
revenue
he provisionpayment d
rs y/Data/Ancilla
e interruptiours, and on
ges is 2.70
emand at DESD Propoation, woul
s unavailablcharge fallss than 1 pe
erved energ
ergy per
nergy estimate
ed energy aof Custome60,420 per
er annum
ergy
of expected un
ved energyergy reflectses not haveportion of thary services
n of ancillaata (AEMO
ry-Services/A
on was 1.5 nly 2 out o
MW
Dalrymple wosal, includd supply loe. The Capling below ercent of tim
gy avoided
Uni
MW
hr
MW
per MWh assu
attributed toer Reliabilitannum, as
Units
M
$/MWh
$ 000
served energy
y is in effecs the potente a real cashe ESD caps revenue.
ary servicesO8) and netw
Ancillary-Servic
hours, withof the 22 o
was unserveding reserviocal Dalrymp trading str
10 MWh fme, with a n
per MWh h
ts
W
r
Wh
med in busines
o the ESD ty for SA oset out in T
MWh
real FY16
real FY16
used in busines
ct a ‘non-catial value ofsh impact opital cost co
s has beenwork events
ces-Payments
P
h only 6 ououtages ex
ed, meaninng about 1
mple demanrategy descfrom time
negligible im
has been es
Valu
2.7
3.5
9.5
ss case
proposal haof $38,090/Table 6-14.
Value
ss case
ash’ benefif the projecton project rould be inc
n estimateds. It must b
s-and-Recover
Page | 64
ut of the xceeding
g it was 10 MWh nd when cribed in to time.
mpact on
stimated
e
70
52
51
as been /MWh7 ,
9.5
38,090
360
it of the t to third revenue; cluded in
d having be noted
ry

that theoccurre
HistoricFCAS ifuture ifSouth Aupside section FCAS r
It is nobattery of Markthe batt
The est
De
FC
Vo
Tot
Ancillarexpectefuture d
6.8
A contramaintenconstruassume
The est
De
MS
Ot
Ov
9 This wdispatche
e requiremeence of netw
cally, the ren South Auf the FCASAustralia asto the Businbelow. In
revenue rate
oted that opstorage. A
ket trading tery is in op
timated anc
scription
CAS revenue
lume
tal ancillary
Ta
ry service ed revenue due to the is
Project
actor will benance servction of the
ed to contin
timated ann
escription
SA
ther site ope
verhead
will vary from yed.
ents for this work events
evenue thatustralia is aS market iss conventioness Case the absence of $0.70/M
perating in Accordingly,mode. As a
peration dur
cillary servic
e rate
y services re
able 6‐15 – Estim
revenue costream; ho
ssues discu
Operating
e engaged tvices agreee ESD reacue until the
nual operati
erating expe
year to year
service vars.
t has beenpproximatere-designe
nal generatand is desc
ce of more rMWh within
Market Tra the ESD Pa consequeing a netwo
ces revenue
evenue
mated market a
omprises awever, it isssed in Sec
g Costs
to provide oement (MSAches practiend of the
ng costs for
$
enses $
$
depending on
ry from yea
n allocated ly $0.70 pe
ed to addretion is retirecribed furthrobust infor the Busine
ading modeProposal haence, any aork event.
e is set out i
ancillary service
an insignificexpect this
ction 7.
operations aA). The Mical compleuseful life o
r the ESD P
Units
000 real FY
000 real FY
000 real FY
n the number
ar to year a
to generater MWh. Thess the sysed. This aser in the Kermation we ess Case.
e provides s been opti
ancillary ser
in Table 6-1
Units
$/MWh
MWh
$ 000 real F
e value assume
cant propos could incre
and maintenMSA wouldetion. The of the ESD.
Proposal are
Y16
Y16
Y16
r of FCAS ev
nd highly d
tion participhis is subjetem securit
spect could ey Risks to have conse
the greatesmised to mrvices can
15.
h
FY16
d in business ca
ortion of thease materi
nance (O&Mcommenc
term of the
e presented
Commercia
Commercia
Commercia
ents and the
P
ependent u
pants in resect to changty issues a provide sigthe Busineervatively a
st value in maximise the
only be pro
Va
1,0
$
ase
he Proposaially within t
M) services ce as soone O&M ser
d in Table 6
Va
al in confiden
al in confiden
al in confiden
times that th
Page | 65
upon the
spect of ge in the rising in gnificant ss Case
applied a
use for e benefit ovided if
alue
0.7
0009
$7.0
al’s total the near
under a as the rvices is
-16.
lue
nce
nce
nce
he ESD is

To
6.9
The Coare calElectraN
Fu
Sha
Notes:
1.
2.
3.
4.
6.10
The key
Descri
Marke
Reven
Expec
Ancilla
(A) To
Opex
Capex
(B) To
Pre-tax
Tax ef
Post-ta
Propo
otal opex
Project
onsortium plculated asNet. Table
unding ($m)3
are of capex
Funding contr
Assumes 100%that the utilisatiby ARENA at fi
Funding amou
Based on the$3.9 million wbeing recover
Key Fina
y financial o
iption
t trading rev
nue from ML
cted unserve
ary services
tal revenue
x
tal cost of E
x NPV (A+B
ffect
ax NPV
sed ARENA
Table 6‐16 – E
Funding S
roposes to s pre-tax g
6-17 indica
3
x
Table 6‐1
ributions from
% pre-tax grant aion is less due nancial close to
unts quoted e
e Expected Uwill be added red through a
ancial Met
outcomes u
venue
LF benefit
ed energy re
s revenue (F
from ESD
ESD
B)
A grant
$
Estimated annu
Sources
fund the Erant funds
ates the leve
Total Capex
24.9
100%
7 – Expectation
ARENA and E
applied to the pato tax circumsta
o reflect any diffe
xclusive of GS
nserved Reveto ElectraNetcommercial le
trics
nderpinning
evenue
FCAS)
000 real FY
ual operating co
ESD Proposreceived f
el of funding
x
ns on level of fu
ElectraNet ass
ayment of capitances the Consferences in the u
ST
enue making t Regulated Aease arrangem
g the Busine
Y16
osts used in the
sal as explafrom ARENg required f
ARENA1,2
15.7
63%
unding required
sumed to be c
tal expenditure asortium will seeutilisation of gra
up 43% of thAsset Base wiment with AGL
ess Case a
e business case
ained belowNA, plus cfrom each o
2
d, by entity
contributed in
associated with k to increase amnt funds.\
he total reventh the remain
L over the life o
re summari
($
P
22
w. Source capital provof those sou
ElectraN
9.24
37%
line with S-cu
the Proposal, imount of fundin
nue, it is expender of the caof the project.
ised in Tabl
NPV1 000 real FY
2
2
6
(1,
(23,
(25,
(18,
3
(14,
(14,
Page | 66
0.0
of funds vided by urces.
et1
rve
n the event ng provided
ected that apital cost
le 6-18
Y16)
2,818.3
743.1
2,678.4
52.0
6,291.9
,634.8)
,429.6)
,064.4)
,772.5)
3,970.2
,802.3)
,802.3)

Residu
Implie
6.11
Figure 6
The keycompardenomi
The revderivatithat therenewaand imp
6.12
This seoutcom
ual funding
d IRR (%)
Note 1: Net p
Project
6-4 depicts
y sensitivityred to NPVnated in US
venue fromves is the p
e cap tradinable generaprove the vi
Key Ris
ction descre to that se
shortfall
Table present value bas
sensitiviti
s the key pro
y is capital cV of revenuSD, the bus
cap tradinprimary drivng revenue tion enters ability of the
ks to Ach
ibes the priet out in our
6‐18 – Key finaed on post tax no
ies
oject sensit
Figure 6‐4
costs givene of $6.2 m
siness case
g strategy, ver of variat
is highly dthe system
e Business
ieving the
ncipal risksBusiness C
ancial outcomeominal discount r
tivities.
– Key project s
the capitalmillion. Accis also high
whether thtion in reven
dependent om, this woul
Case econ
e Business
identified tCase, includ
s of the businesrate of 7.5% and
sensitivities
l costs net ocordingly, whly sensitive
hrough longnue within ton market vld serve to
nomics.
s Case
o achievingding both up
ss case valuation date of
of grant repwith 90% ofe to deterior
g physical ethe businesvolatility. Toincrease th
g a materiallpside and d
P
f 30 June 2016
present $8.6f the EPC ration in the
exposure oss case. It o the extenhe level of
ly different fdownside ris
Page | 67
-
7.5%
6 million contract
e AUD.
r selling is noted t further volatility
financial sks.

6.12.1
The disnetworkReturn detaileddistribunetworkscope aa large detectiothe tota
A seconthe ESDlocal Dcontrollthe isla(providethe RFI
All of ththe requ
6.12.2
A signiflarge inincreas
The deutility scESD Pr
6.12.3
With theexistinghas resPoint, Tbusinesannounmarket trading
Complex
stribution nek that stretc
(SWER) fed design fotion network is supplieand estimatflywheel, o
on and assoal ESD insta
nd complexD control, toalrymple deed togethernded systeme a voltage , while also
hese technicuired techn
Reductio
ficant downncrease in ded penetrat
evelopment cale storageroposal.
Capacity
e increasedg conventiosulted in theTorrens Islss case hancements. T
and hencestrategy.
xity of islan
etwork supches over 1eeders, wh
or the ESDrk will be aed by the Ete does notr an upgradociated protallation.
xity regardino ensure thaemand is ar so that qum can remaand freque
o working in
cal issues hical reliabilit
on in volati
nside risk isdemand sidtion of resid
of thermal e would als
y withdrawa
d penetrational/baseloae recent annland Poweas been prThe effect
e increases
nd mode op
pplied by th100 km to shich in turnD will be to
ble to be aESD and Wt currently inde in protectection. If re
ng island opat wind farmable to sinkuality of supain stable. ency sourceparallel wit
have to be oty expected
lity
s if a reducde participadential behin
gas turbino serve to r
als from th
n of residenad generationouncemenr Station Aremised upof such cavalue asso
peration
he Dalrympsupply 11 kn supply LVo ensure thappropriatel
Wattle Point nclude any
ction systemequired, this
peration is m supply dok. The ESDpply to the This will reqe), a technith a large e
overcome ad.
ction in volaation and/ornd the mete
ne generatioreduce mar
he market
ntial solar Pon plant arents of capacA, Northernpon a histoapacity wit
ociated with
le connectikV feeders V custome
hat any fauly detected wind farm additional t
ms), that migs has the po
the integratoes not exceD and the W
islanded loquire the abcal requiremnergy contr
and be prov
atility materr less peaker energy st
on, or otherket volatility
PV and utilitye becomingcity withdrawn Power Sorical pool thdrawals i both the m
on point coand 19 kV
ers. An impults on the
and safelyin island m
technology ght be needotential to in
tion of windeed the leveWind Farm oad is maintbility for the ment soughributor, the w
ven before t
ialises. Thisky load, as torage solut
r market py and hence
y scale windg less econwals from t
Station). Thprice sam
ncreases thmarket ener
P
onsists of aV Single Wiportant par
extremitiesy cleared wmode. The (e.g. instal
ded to facilitncrease the
d farm contrel that the E
would havtained, andESD to for
ht from provwind farm.
the asset c
s may be da consequ
tions.
participants e the viabili
d generationomic to ruthe market he analysis
mple prior the volatilityrgy trading
Page | 68
a 33 kV re Earth t of the s of the
when the existing lation of
tate fault e cost of
rols with ESD and ve to be d so that m a grid viders in
an meet
due to a uence of
building ty of the
on in SA, un. This (Pelican
s in this o these y in the and cap

6.12.4
As a cothe eminterconcapacityoccur inreservechangethe mar
6.12.5
Increasthat assthe Proquantifiwhich wconnec
6.12.6
Utility scapital implemeconomon distrIt is envcurve a
The forbusinesstreams
Capacity
onsequencemergence onnector. Py paymentsn the form e. While thees, this may rket eroding
Increase
sed penetratsumed in thoposal. It ied within thwould servted generat
Technolo
cale batteryexpenditureenting a
mically feasributed storavisaged tha
and improve
recast techss case is s.
y withdrawa
e of recent f energy sossible solus to incentof ancillary e ESD woualso result
g the marke
d penetrat
tion of renehe Businesss noted tha
his analysis,e to improtion.
ogy forwar
y storage ise and limitedistributed ible in its oage solutionat advanceme economic
nology forwpresented
als do not
announcemsecurity issutions to adivise existinservices p
uld be expecin a reduct
et trading rev
ion of rene
ewable genes Case. That a signific, is the implve the eco
rd curve
s an immatued ability to
storage sown right. Hns, this hasments in teviability in t
ward curve in the be
occur
ments of caues in SAddress eneng generato
payments tocted to bention in pricevenue bene
ewable gen
eration wouhis would scant benefilementationonomics of
ure technoloo accuratelstrategy, tHowever, w
s seen the echnology wthe future.
used in thelow Figure
apacity withA, particularergy securitors to rema
o generatorsnefit from sue volatility if efit.
neration
ld introduceerve to impt, which ha
n of distributdevelopme
ogy globallyly quantify he busines
with marketsemergence will result in
his analysise 6-5, assu
hdrawals in rly if there y could resain in the ms for the pruch ancillarygenerators
e additional prove the ecas not beented utility scent of furth
y. At currenall the theoss case is showing aof many teca decline t
s and resultuming no c
P
SA, this his a fault
sult in a mamarket. Trovision of sry services s continue to
volatility reconomic vian capable ocale batteryher renewa
nt levels of oretical beis not conan increasechnology prtechnology
ting impactchange in
Page | 69
as seen on the
arket for his may spinning revenue o supply
elative to ability of of being storage
able grid
installed nefits of nsidered ed focus roviders. forward
t on the revenue

Figure 6‐
‐5 – Forward prrice curve for coonstruction of tchang
the ESD Proposge in revenue st
al and impact otreams.
on business cas
P
se. Note this as
Page | 70
ssumes no

7.
7.1
Battery includinintermit
The wopotentianumerocapabilfound a
The enmeaninperceptpresumand col
There isto the orecent challengESCRI-an asse
In time for regoperatiowhich cneed fo5.1 and
The mopoor ascommeIn shorcurrentl
Is there
The CoAustralito demoand sol
THE CA
The Cas
storage isng at the trttent large-s
ork undertaal uses of aous “degreeity and cos
a more com
nergy storagg there is tion of the c
mably as thelaboration a
s certainly pownership o
work by oging if it is-SA work haet within the
this positioulated netwons of ESDcould be puor regulatoryd recently re
ost importans presented
ercial reasonrt, energy sly within So
e then a cas
onsortium bia with the aonstrate thiar PV gene
ASE FOR
se for ESD
s expected ransmissionscale renew
aken by than ESD wies of freedst. This coplex path th
ge supply an immat
consortium e long term a better alig
potential in or role of suothers. Whs leveraginas shown t
e NEM.
on may be fwork owne
D assets. Thursued in thy change, s
eported by t
nt outcome d for the En to pursue storage techouth Austral
se to pursue
believes thapplication s than in S
eration relat
R ESCRI-
D Experien
to play an n level whe
wable genera
e Consortithin the NEdom” in noompounds than anticipa
and deliveturity in apis that venup-side is p
gnment of pa
the ESD coch within thhile capturg market, hat comme
rustrated, ars may behe commerhese circumsomething he AEMC.
in the ESCESD Propos
such an ashnology is ia too small
e the ESCR
ere is an of transmisouth Austraive to dema
-SA PHA
nce
important ere it can sation.
ium has exEM and traot only tecthe difficult
ated to reso
ery experienpproach, inndors are vpotentially varties, and
oncept and he current rering full vaancillary s
ercial framew
as the constecome an rcial work dmstances, scanvassed
CRI-SA studsal. Unde
sset, at leastoo expensl.
RI-SA projec
urgent neession level balia, with itsand.
ASE 2
role in thesupport the
xposed theansmission chnology cty in ESD lve the best
nce is alson costing aery keen tovery attractia better pric
no particulegulatory enlue from thervice and works can
traints on nimpedimentid indicate a
so there arein the regu
dy is arouner current mst in South Asive, and th
ct further?
ed to devebattery stors world lead
e power syse integration
e complexitsystem. Ehoice, but definition at project to
o very limitand supplieo be involveve, but equce, is likely.
ar impedimnvironment,he asset c
network vbe develop
on-regulatet to the fua number oe options, bulatory revie
d the businmarket condAustralia at he revenue
lop real wrage. Thereding levels o
P
stem of then of high l
ty surroundEnergy stora
also functand the conprogress.
ted at utilityer capabilityed with the ually with m.
ment could b, which agrecan be convalue togetped to opera
ed revenue urther delivof alternativbut this hintew work of
ness case, wditions thertransmissio
e streams a
world experie is no bettof intermitte
Page | 71
e future, evels of
ding the age has tionality, nsortium
y scale, y. The project,
ore time
be found ees with nsidered her, the ate such
allowed ery and e routes ts at the Section
which is re is no on level. available
ience in er place ent wind

The argcosts inalso a ndevelopnot undlooked can onl
Much oassociathis issuthis willthis, AEwill basto be bthat marenewaESD minto the
This stucertain examplpotentiacircumsthese ndownsid
Perhapchangeand glohighly dthere is
Figure DepartmSandia scale, gThe Figall flywhgiven inplant. Monly jus
gument cenn the futureneed to streped in Austrderstood, evalien to they be overco
of the narratated with incue appears l result in imEMO and Ese this on knbankable anarket constrables. This ay not be th
e suitability o
udy has alcircumstan
e, the circual currently stances. Hnetwork servdes. Banki
s the most e occurring iobally, and disruptive es no clear in
7-1 showsment of En
National Lgrid connecgure indicatheel energyn the detailMost recentst emerging
ntres on thee, and the eeamline anralia – this Pven on the
e mainstreamome with pr
tive in Sectcreasing renmanageab
mpacts to tElectraNet wnowledge and thereforeructs for deis a clear r
he most pruof an ESD s
so suggestnces, makemstances inexists, but
owever, thevices, as thng such pro
compellingin the energprecedent e
element of tdication of j
s the currennergy, whicLaboratoriescted projectes the stron
y storage – l provided itly, the stron.
e need to genabling imd evolve thProject demvendor sid
m electricityractical expe
ion 3 demonewable pe
ble, but it mathe renewawill seek a lat the time, e proven. ealing with trisk, and awudent resposolution, wo
ted that othe energy stn South Aust this coulde ESD assehe nature ofojects witho
g reason to gy storage aelsewhere. he future ajust how the
nt non-hydch holds ans, [21]. Thts in terms ng early insand then thin [21], is nngest grow
get experiempact storaghe way suchmonstrated t
e – and jusy sector, soerience.
onstrates aenetration, pay not be sble sector lowest costand opinionWithout anthe issues
waiting a beonse. A demould assist.
her revenutorage a mstralia are t
d add very et would haf the contra
out preceden
pursue theand renewa There is l
and potentiae relationsh
ro ESD insn energy she Figure sof GW nam
stallation rathe strong grnearly all mwth rate is in
nce, likely ge could hah projects athat basic mst as the w
o does energ
developing particularly o easy in thacross the t path solutn on the futy referencemay prejud
etter businemonstration
e streams more commthat no transsignificant
ave to haveacts involvent then bec
ESCRI-SAable energylittle doubt al enabler ohip will grow
stallations gstorage proshows the imeplate ratite of electrorowth in the
molten salt sn electro-ch
changes inave on reneare plannedmechanics oind industrygy storage
issue arouin South Au
he future anNEM. In pion from thture. Such e or benchmdice againsess case to
plant, prov
are possibmercial propsmission carevenue to
e high confid would likeomes probl
A Project fury markets bthat storage
of renewablew in time. .
globally acoject databanstallationsng, up unti
o-mechanicrmal energystorage useemical stora
P
n both revenewables. Td for, procuof such projy two decanow. Thes
und system ustralia. At nd it is possplanning to
he marketplsolutions w
mark, it is st both stora
emerge aroviding early
ble which cposition noapital augmo the ESD fidence in pely include ematic.
rther is the both within Ae is emerge energy in
ccording to ase hosteds by year fil Septembecal storage y storage wed in solar rage, which
Page | 72
nue and There is
ured and ects are des ago
se things
security present
sible that resolve
ace and will need possible age and ound an insights
could, in w. For entation in other
providing punitive
pace of Australia ing as a
nput, but
the US by the
for utility er 2015. – nearly
which, as thermal is really

Figure 7‐
Figure 7‐2
‐1 – Operating
– Operating no
non‐hydro ESD
on‐hydro ESD p
D installations, g
projects by role,
global, from [21
, global, from [2
1], as at Septem
21], as at Septe
P
mber 2015
ember 2015
Page | 73

Of partfunctionparticulenablindominaare numvalue a
The thirfor. Tdistribucontrol,notion talso shpossible
Energy confirmthe eme
Unlike Atake-upgaining storageone of tthese m
In the ainvestmstorageleverag
The quesuch pothe prim
7.2
The bacapital commeSectionpresentare at le
On cosroughlyaggressAustralifuture. meanindifferen
ticular interen of each barly of interg renewabl
ating the promerous, smcross multip
rd thing is thThis coverstion service transport athat such s
hows just he.
storage ths the originergence of t
Australia, op, with moti of experie
e industry. the most ac
motives, [22
absence of sments to kee product be the most
estion thenolicy driversmary concep
Estimate
asic challenand operat
ercial and fn 6, the revt. While thieast plausib
sts, Respony 50% decsive when ia, by the CThere is alg that with
nt procurem
est is whatby technolorest here; thle energy gojects – notaller projecple roles.
he very bro not just t
es, general and even ctorage is ce
how disrupt
en, by its nnal concept the technolo
other countrves likely t
ence with a The Califo
ctive energy], with the r
such policy eep pace. but providefrom that in
arises hows and how, pt for ESCR
ed Busine
nge to the tional costsfinancial covenue woulis is discouble within th
ndents to threase in ecompared
CSIRO for thso likely to collaboratioent method
t this storagogy coveringhe first beinggeneration. t by project cts being pu
ad nature othe renewasystem stab
customer loertainly emive the tec
nature, has for the ESCogy, albeit a
ries have po include thlikely disru
ornian Indepy storage menewable e
drivers andThis also
s more incnvestment.
w to improvein time, tha
RI-SA Phase
ess Case I
use of enes. Assuminonstruct to d need to
uraging, the he next five
he RFI for nergy storato the mo
he AEMC, gbe significaon and pote
dologies, a b
ge is usedg the sameg that two o The seconsize, but b
ut forward u
of the uses able energybility issues
oad shiftingerging as a
chnology is
significant CRI-SA woat modest s
articular pohe loweringuptive technpendent Sy
markets drivenergy enab
d any currensupports t
centive to
e the businat businesse 2.
Improvem
ergy storagng a 50% that presemore than consortiumyears, whic
the Projectage prices ost recent generally coant risk builentially riskbetter price
for, and Fe data as Fof the top fivnd is that thby installatiousing batter
that batteryy enabling s such as sp, among ota primary in
with a mu
cross-overrk. Internatscale for now
olicy driversg of integranology andystem Operven by policbling compo
nt roadmapthe case tomaximise t
ness case fos case can
ments
e is to increduction inted in thedouble for
m is of the och can be a
t made it qin the ne
independeosts are expt into pricing sharing, anoutcome is
Figure 7-2 sFigure 7-1. ve uses are he electro-con number. y technolog
y energy stoarea, but
pinning resehers. This
nfluencer ofuch broader
r in value ptional precew.
s which are ation costs
the drivingrator (ISO), y, is quite c
onent the ke
, Australia mo continue the busines
or ESCRI-Simprove. T
rease reven capital pe Businessr a commeopinion thatrgued as fo
quite clear xt five yeant study oected to falg received fnd consider
s likely.
P
shows the Three thi
e directly invchemical st This mea
gies and lev
orage is bei transmisserve and ra
s then suppf renewabler value pro
proposition edent also s
leading to of renewab
g of a local which opeclear on all ey priority.
must make exploration
ss case –
SA Phase 2This concep
enue and dprice, and as Case anarcial propot such adju
ollows.
that they ears. Whilen battery cll significantfrom Resporation of po
Page | 74
primary ings are volved in orage is ns there veraging
ng used ion and
amp rate ports the es, but it oposition
and this supports
storage bles, the l energy
erates in three of
prudent n of the
that is,
2 without pt drives
ecrease a similar alysis of sition to
ustments
expect a e this is costs in tly in the ondents, otentially

On revedefineddefinitioconsidedefinedcurrent
enue, the C and value
on path alreration. Ho well enouelectricity c
The potentopportunityif the right could moreESD, altholost and theservice.
If the marincrease inappropriate
o At candfarmnot veryfromSouexpby netw
An increappIf thenedisctimegenyield
o A sdevthe therPV andfromoccbe awouwhe
Consortiumed at acceready exist
owever, thergh within c
construct in
tial to augy presents in
opportunitye than doubugh impacte operation
rket penetran the futureely-configure
current leved planned lms in South
applied cony low SA pom South Auuth Australiort transferlimits withiwork.
increased ease in timlication of w
he ESD wergy that wo
charged at es, the discerators. Thd an econom
econd benvelop due to
amount of re may be tand local w
d particularlym Wattle Purrence of able to chauld otherwisen the lo
have consptable levets particulare are othecurrent knowthe NEM, b
ment transn South Ausy emerges le the curres on other rof the asse
ation of re, three added ESD:
els of wind evels of in
h Australia hnstraints to ool prices haustralia is an wind fas across then South A
penetrationmes wherewind generaere to be could otherwi
a time whecharged eneis would incmic benefit
efit may aro an increa
installed roimes when wind farms y at the poi
Point wind high voltage
arge from wse be consocal limita
sidered souels of definarly in thosr potential rwledge, sobut which in
smission castralia, althoand the ES
ent revenuerevenue su
et would nee
enewable editional ben
farm penetnterconnecthave not belimit wind g
ave sometimconstrained
arms reduce Heywood
Australia, o
n of wind fe wind geation constrconfigured ise be consen the interergy wouldcrease the through av
rise throughased penetrooftop solaa combinatproduce loint of connefarm may e levels at
wind energytrained, lateations of
urces that anition, and se requiringrevenue so
ome of whicnclude:
apital upgraough this mSD function projectionsch as expeed careful c
energy in Snefits may b
tration in Sor transfer
een explicitlgeneration mes been od. At such ce their outd interconner by limits
farms in Sneration israints by AEto charge
strained), thrconnector displace eoverall conoided fuel c
h the reducration of roor PV increation of high cal high voection for Wneed to bthese times
y output fromer releasing
wind fa
are known in which sg a regulaurces whichch do not y
ades – at may involve s
ality is provs alone for acted unserv
consideratio
South Austbe able to
outh Austracapability,
y constrainin these sit
observed attimes, it a
tput. It shoector can be
deeper w
South Austrs constrainEMO or by up at suche stored enwas uncon
energy fromtribution fro
costs.
ction of futuoftop solar ases on theoutput fromltages on th
Wattle Pointbe constrains. An ESD am Wattle Pg the storedarm outpu
P
well enougsome preceated netwoh simply cayet exist w
present, nsignificant pven. In thea strategicaved energy
on around m
tralia contibe provide
alia and for output fro
ned (i.e. AEtuations). Ht times wheappears thaould be noe constrainewithin the V
ralia could ned, either
low markeh times (fronergy could nstrained.
m gas- or com wind far
ure constraPV genera
e Yorke Pem both roofthe 132 kV t wind farmned to redat Dalrympl
Point wind fad energy a
ut have
Page | 75
gh to be edent or rk base
annot be ithin the
no such potential eory this ally sited
may be modes of
nues to d by an
r current om wind MO has
However, n export at some ted that
ed either Victorian
see an by the
t prices. om wind
later be At such oal-fired
rms, and
ints that ation. As eninsula, top solar network . Output uce the le would arm that
at a time passed.

It is simremain potentiafavour o
7.3
The sitConsorthat a Plong terSouth Aincreasless effe
The CoPhase right, ainvolve
The Cothe proj
o A thservandservconsuppenwheSouAusfurth
At tfreqlow the 500a thensof thhowSouAus
mply not pospossibilitie
al here thouof such an E
Propose
tuation in Srtium met toPhase 2 ESrm future whAustralia aes, meaninective.
onsortium a2 project. nd will neediscussions
onsortium thject develop
Progressionominal rat
o Stato Sta
hird benefit vices in So
d AEMO sivices existsventional g
pplied by exnetration of en as few auth Australiastralia couldher at times
times whenuency contvalue as F275 kV ci kV circuits
hreshold quaure adequahe NEM be
w to value tuth Australiastralian frequ
ssible to qus only. Thugh, and inESD asset.
ed concep
South Austo consider tSCRI-SA prohich does n
are likely tong reliance
lso agrees Irrespective
ed additionas with key p
hough does ped in the P
n at the Dting around
tutory approkeholder m
could be oouth Austragnalling tos. Frequegenerators xisting solawind farms
as four conva. An incred see the nus of renewa
n both circutrol ancillaryCAS sourcercuits betwin Victoria
antity of FCate frequence lost followthis potentiaa would beuency.
antify thesehe Consortin time the
pt for ESC
tralia is evthese chanoject would not involve eo emerge
on traditio
that there se, the Projeal funding sproject stake
have a reaPhase 1 bus
alrymple su10 – 20 MW
ovals for theanagement
obtained thrlia, which r
o the markeency contro
as an ancar PV or ws and solarventional ge
eased penetumber of in-ble generat
uits of the y services (ed elsewhe
ween Tailembetween H
CAS must bcy regulatio
wing the neal benefit, he able to c
e potential bium is of threlatively c
RI-SA Pha
volving quitges, and a still be of benergy storain other S
onal interco
still remainsect will not support andeholders, in
asonably wesiness case
ubstation oW and 10 –
e constructit around the
rough a conrecently haet that an
ol services cillary serv
wind farm ter PV in Souenerators htration of wi-service contion output.
Heywood FCAS) in S
ere in the Nm Bend anHeywood anbe sourced on should text contingehowever, a
contribute to
benefits at he opinion complex iss
ase 2
te quickly. s a conseqbroad beneage in sometates as re
onnector ne
s some waybe a comm
d cost redun particular
ell defined ce, which can
of an ESD – 20 MWh, in
on of the ase project;
ntribution toave shown
opportunityare traditio
ice, and aechnologiesuth Australihave been oind farms onventional g
interconnecSouth AustraEM. In cond South Ead Moorabofrom withinhe intercon
ency. It is n ESD siteo the regul
any level ofthat there ues involve
In late Noquence remfit. Furthere form, as tenewable e
etwork solut
y to go to fumercial proctions – soARENA and
concept for n be summa
demonstrancluding:
sset;
P
o frequencyincreased
ty to providonally suppre not ables. The incia has led tobserved o
or solar PV igenerators d
ctor are in-alia have thntrast, whenast, or one
ool, is out ofn South Ausnnection to currently u
ed anywheration of th
f accuracy,is significa
ed may pla
ovember 2mains of ther, it is hard the issues aenergy pentions may
ully define oposition in omething wd suppliers
Phase 2, barised as:
ation projec
Page | 76
y control volatility de such plied by e to be creasing to times n-line in in South drop still
-service, he same n one of e of the f service stralia to the rest ncertain
re within e South
so they nt value
ay out in
015 the opinion
to see a arising in netration become
the best its own
hich will .
ased on
t with a

In justifProject fundingparticul
Size &
The prexpendThe sizundertaeffectivesmaller effective
The copursue about atechnolprefere
Locatio
o A cafunc
o Proshodowmod
o Theo A fo
com
The develoo Sup
lossthe and
o Marleas
o An whic
o Freq
The develo
o Theo The
synincr
o Thein thloca
o Sta
fying this cin regards programmar the cons
Project Ty
roject is biture but ste put forwa
aken to dateness of th
r device mayely at the sa
onsortium rethat which
application togies throunces of stak
on
ase to the Rctions; curement o
ortlisted RFI wn, includingdels, and coe productionormal businemmercial op
opment and pply of expes of supply, Wattle Poin
d in parallel rket trading se arrangemimprovemech would acquency Con
opment of a
e evolution oe demonstrachronous greasing intee ability to phis instanceal rooftop PVkeholders’ v
oncept, the to the pare, the Adva
sortium note
ype
being presetill allow for
ard is at the te and, whhe ESD acry not allow ame time.
emains agndelivers th
than technough a singkeholders.
Regulator fo
of equipmenResponden
g the investonfirmation n of legal coess case deerations da
implementaected unservinvolving th
nt Wind Farsupply the (energy an
ment; nt in Marginccrue to AGntrol Ancilla
testing and
of the functiation of the eneration inrmittent renrovide targe
e the specifiV generatiovisibility of t
e consortiumrticular objeancing Renes the follow
ented at dr the primasmall end oile an evenross the futhe parallel
nostic to whe optimumology. The gle Power
or regulated
nt and servicnts aimed atigation of aof the most
ommercial inecision to p
ate of mid 20
ation of a fuved energyhe islandingrm which woload;
nd capacity)
nal Loss FaGL; and ary Services
d Knowledg
ional algoritrole of enern South Ausnewable eneeted value sic interactioon; and the asset in
m has atteectives of Eewables Pr
wing:
demonstratiary objectiveof the assetn smaller sll spectruml services of
which energ business cconsortiumConversio
d revenue fo
ces throughat driving thealternative dt effective anstruments roceed with017.
unctional alg to the loca
g of the eneould remain
) undertaken
actor for the
s to the mar
e Sharing p
thms to maxrgy storagestralia, partergy generaservices to n with the W
n terms of its
mpted to mESCRI-SA, rogramme (
on size toes of the Ets consideresize is pos
m of servicef market an
gy storage case, althomay consid
n System
or the asset
h further nege capital an
delivery andasset config
between pah the project
gorithm for l Dalrymplergy storage
n in service
n by AGL u
Wattle Poin
rket.
program wh
ximise overin regards
icularly in reation in the renewable
Wattle Point
s function a
maximise thand the mo
(ARP), for f
o both minESCRI-SA ced in the prossible, this es sought. d network v
technologyugh the proder a hybridinterface,
P
t’s network
gotiation wind operatingd operationauration; arties; and
ct with a targ
the ESD tae load followe device aloat reduced
nder an ass
nt Wind Far
hich allows f
rall storage to the lack elation to State; energy gent Wind Farm
and evolutio
he benefit fost logical funding sup
nimise theconcept to rocurement will likely As an exa
value to be
y is used oject is read of energy depending
Page | 77
th the g price al
get
rgeting: wing ng with output
set
rm,
for:
value; of
neration, m and
n.
from the ARENA
pport. In
capital be met. process limit the
ample, a realised
and will lly more storage on the

A locatiminimu
Dalrymprenewaneed exsingle ifarm is impactsincludin
This lonecessa
Advanc
The Phcore Pr
The Ph
ARENA
Given tbusines
ion has beem ESD size
ple in manable energy xists for nencoming traparticularly
s at the wng at times w
ocation alsoarily availab
cing Renew
ase 2 projerogramme O
Increase inincrease in providing aImprovemeenergy tecrenewable of plant Reductionremoving sinto systemIncreased technologexperienceprocuremeof such as
ase 2 proje
Addressinintegrating Advancingtechnologassist in gacommercia
A & Other S
he poor busss case sho
Scaling dobenefits Revisiting texperience
en chosen te configurat
y ways is generation
etwork servansmissiony relevant, ind farm, awhen the sy
o allows able at other
wables Pro
ect is expecOutcomes:
n the value the value o
a means of ient in tech
chnologiesenergy pen
in or remosystem consms
skills, capies – by pro
e base withinnt process, asset
ect also align
g barriers renewables
g the commies – in par
aining experal scale stora
Stakeholde
siness caseortfall includ
own the siz
the benefitsd in South A
o maximisetion.
a small ven through thvices in the connectionwith the E
and potentiystem island
broad ranlocations.
ogramme O
cted to mee
e delivered of energy prntegrating mnology rea– as energ
netration, an
oval of barrstraints whic
acity and kogressing an Australia as well as
ns with the
to the longs within grid
mercial devrticular the erience with, age deploym
er Contribu
e in Phase 1ing:
ze of the E
s of the ESAustralia
e the demon
rsion of thehe Wattle P form of exn. The inte
ESD impactially maximds.
nge of fun
Objectives
et the ARP o
by renewaroduced by more renewadiness angy storage isnd therefore
riers to rench may prev
knowledgea real, live eon both thesupplying k
investment
g-term uptads, a priorityvelopment energy stora and dealinment at tran
ution
1 the Conso
ESD to red
SD in light o
nstration va
e entire StaPoint Wind xpected uneraction beting positiv
mising the r
nctionality t
objectives b
able energyrenewables
wable energd commercs likely to bee can be co
newable envent renewa
relevant tonergy stora
e owner andknowledge o
t focus area
ake of reney for the proof renewabage compog with the isnsmission le
ortium is inv
uce costs
of the highe
alue and ass
ate, includinFarm and
served enetween the ely the Marenewable
to be teste
by contribut
y – by provis in a marke
gy into our ecial readinee a key enansidered as
nergy technable energy
o renewablage asset, thd supplier sion the plann
s of:
ewables – inogramme ble energy nent where ssues that aevel
vestigating w
while still c
er market v
P
set impact f
ng significawhere an
ergy, servicESD and t
arginal Lossenergy ge
ed, which
ting to the f
ding both aet sense, aelectrical syess of reneabler of highs effective b
nologies – y generation
le energy his will growide of the ning and op
n particular
and enable the Projectarise, aroun
ways to red
capturing s
volaltility no
Page | 78
from the
ant local existing ed by a
the wind s Factor neration
are not
following
an nd by stems ewable her balance
by n input
w the
peration
ing t will nd
duce the
sufficient
w being

The Coalso seformal A
8.
[1]
[2]
[3]
[4]
[5]
[6]
[7]
[8]
[9]
[10]
[11]
[12]
[13]
Exploring awith potent
onsortium iseking suppARENA Exp
REFER
“ESCRI-Novemb
“State oAustralia
“South Operato
“Solar P
“EmerginReport”,
“NationaMarket”,
“RenewaAustralia
“Update Market”,
Generatacross aat: Informat
] “South A
] “ESCRI-CommerElectraN
] “ESCRI-CommerElectraN
] “ESCRI-for ComElectraN
alternative cial ESD sup
s seeking toort from othpression of
RENCES
-SA Basis ber 2014
of the eneran Energy R
Australian r, January 2
V Report Ju
ng Techno Australian
al Electricity Australian
able Integraan Energy M
– Electric AEMO, 26
tor Informaa number o
www.aemtion
Australian T
-SA - Milestrcial Rene
Net and Wor
-SA - Milercial Rene
Net and Wor
-SA - Milestmmercial RNet and Wor
commercialppliers
o reduce thher stakehoInterest for
of Design,
rgy market Regulator, 1
Fuel and 2015
une 2015”,
ologies InfoEnergy Ma
y ForecastiEnergy Ma
ation in SouMarket Ope
ity Stateme October 20
tion from f sources,
mo.com.au/
Transmissio
tone 1 Repewable InterleyParsons
stone 2 Rewable InterleyParsons
tone 3 Repenewable rleyParsons
l framework
he businessolders beforr a Phase 2
Energy S
2014 – C19 Decembe
Technolog
Energy Sup
ormation Paarket Operat
ng Report arket Operat
uth Australrator and E
ent of Opp015
the Austrapublished b/Electricity/P
n Annual P
port – Reguegration, Ss, Novembe
Report – Segration, Ss, January 2
port – CommIntegration,s, June 201
ks to reduc
s case shore considerdemonstra
torage Dev
Chapter 1 –er 2014
gy Report”
pply Associ
aper – Nator, June 20
Overview tor, June 20
ia – Joint AElectraNet, O
portunities –
alian Energby AEMO APlanning/Re
lanning Rep
latory OverSouth Auser 2014
ite SelectioSouth Aus2015
mercial Fra, South Au5
ce costs, in
rtfall to lessing whethetion project
vice”, ESCR
– National
”, Australia
ation of Aus
ational Elec015
– For the 015
AEMO and October 201
– For the
gy Market August 13 2elated-Inform
port”, Electr
rview”, the Etralia, Con
on”, the Etralia, Con
mework”, thustralia, Co
P
cluding neg
s than 50%r to proceet.
RI-SA Con
electricity
an Energy
stralia, June
ctricity Fore
National E
ElectraNet14.
National E
Operator, 2015, and amation/Gen
raNet, May
Energy Stonsortium o
nergy Stornsortium o
he Energy onsortium o
Page | 79
gotiation
% and is d with a
sortium,
market”,
Market
e 2015
ecasting
lectricity
t Study”,
lectricity
collated available neration-
2015
orage for of AGL,
rage for of AGL,
Storage of AGL,
[14]
[15]
[16]
[17]
[18]
[19]
[20]
[21]
[22]
] “ESCRI-CommerElectraN
] “ESCRI-CommerElectraN
] “ESCRI-CommerElectraN
] “Integrat2015
] “Energy WorleyP
] “ESCRI-IntegratiAugust 2
] “Future potentiathe CSIR
] “US DeSandia N
] “AdvancCaliforni2014
-SA – Statercial Rene
Net and Wor
-SA – Reqrcial Rene
Net and Wor
-SA – Enercial Rene
Net and Wor
tion of Ene
Storage TParsons and
-SA Mathemon, South A2015
Energy Stl uptake anRO for the A
partment oNational La
cing and Maian Roadma
of the Art iewable InterleyParsons
quest for Iewable InterleyParsons
ergy Storagewable InterleyParsons
ergy Storag
Technologied SKM-MMA
matical ModAustralia, C
torage Trend impacts oAEMC, Sep
of Energy Gboratories,
aximising theap”, the Cal
in Energy Segration, Ss, May 2015
nformation egration, Ss, May 2015
ge Device egration, Ss, May 2015
ge – Regula
es – SouthA, Governm
del”, the EnConsortium
nds – An of electrical ptember 201
Global Eneat: www.en
e Value of Elifornian Ind
Storage – RSouth Aus5
– InvitatioSouth Aus5
SpecificatioSouth Aus5
atory Implic
h Australia ment of Sout
ergy Storagof AGL, El
assessmeenergy stor
15
ergy Storagnergystorag
Energy Stordependent S
eport”, the tralia, Con
on”, the Etralia, Con
on”, the Etralia, Con
cations”, AE
– Initial Pth Australia
ge for CommectraNet an
nt of the rage on the
ge Databaseexchange
rage TechnSystem Ope
P
Energy Stonsortium o
nergy Stornsortium o
Energy Stornsortium o
EMC, 3 De
Phase Repa, 2011
mercial Rennd WorleyP
economic e NEM 2015
se”, hosted.org
nology – A erator, Dece
Page | 80
orage for of AGL,
rage for of AGL,
rage for of AGL,
ecember
port”, by
newable Parsons,
viability, 5–2035”,
by the
ember

9.
Appe
The foll
Power
This pain the sof chargand out
Energy
This is in this Rrating o
Depth o
DoD rethe DoD
Discha
This is tthe MW
Round
This is discharusually
Respon
This is discharservices
Self-dis
This is amountOnly ceheight)
Durabi
Durabiltimes (1
APPEN
ndix A G
owing nom
rating (P)
arameter detored energge and disct of the ESD
y rating (sto
the quantityRFI are in M
of the device
of discharg
presents thD of the bat
arge time (D
the maximuWpk and the
trip efficie
the ratio ofrge cycle. is released
nse time (R
the time rging energys and/or ne
scharge (S
the portiont of non-useertain potencould be co
lity (lifetim
ity is typica1 cycle corr
NDICES
General E
enclature is
etermines thgy conversiocharge. WitD (designate
orage capa
y of availabMWh whiche and the ho
ge (DoD)
e limit of ditery is 0 %,
DT)
um power d response t
ency or cyc
f whole sysIt provides
d as heat to
RT)
required foy. The spe
etwork servic
SD)
of energy e time (i.e. ntial energyonsidered to
e and cycl
ally expressresponds to
ESD Nom
s used throu
he constitution chain anhin this RFed Pin and P
acity) (Q)
ble energy ih allows a dours of stor
scharge de while a full
ischarge dutime the sys
cle efficienc
tem electrica measurethe atmosp
or an enereed of respoces.
that was inair leakage
y storage so have zero
ing time or
ed as lifetimone charge
menclatu
ughout this
ion and sizend is used toI it is statedPout respect
n the storadirect converage it has a
epth (i.e. if aly discharge
uration. It destem.
cy (Eff)
city output e of the losphere.
rgy storageonse may b
nitially storee loses in Csystems (suo self-discha
r cycling ca
me in yearse and one d
ure Used
Report in re
e of the moo representd in MW. Pively), and a
ge system ersion betwavailable.
a battery is ed battery h
epends on t
to the electsses in an
e device tobe importan
d and whicCAES, elecuch as raisarge.
apacity) (D
s or cycling discharge) [
in Repo
egards to th
otor-generatt maximum Power ratingare often dif
after chargween the ma
100 % fullyhas a DoD o
the DoD, th
tricity input energy stor
o be capabt in frequen
h has dissictrochemicaing a solid
D)
capacity in3].
P
ort
he ESD.
tor or invert(nameplate
gs can be bfferent.
ing. Energyaximum na
y charged, iof 100%).
he storage c
over a charage device
ble of charncy control a
pated over al losses BE
mass to a
n number of
Page | 81
ter used e) power both into
y ratings meplate
t means
capacity,
arge and e, which
rging or ancillary
a given ES etc.). a certain
f cycling

Appe
B1 I
The objbased ooriginal finalised
Screena site fcriteria
A numbsite duconsideexcludin
These sthat pedetailed
B2 S
The crit
The ben
The ben
ndix B S
Introduc
jective of Mon a wide ra site selectd in this rep
ing criteria for the instawas then d
ber of high-ring the fir
ered to be ng sites from
sites that parformed we
d, and quan
Site Sele
teria that ha
Benefit valuof benefit thLocal site difficulty wisite under c
nefit realisa
Generated Network SuNetwork Su
nefit classe
Summary
tion
Milestone 2 ange of faction report rport.
were first dallation of aeveloped to
-level consirst stage o
both potem further co
assed the fiell in the sntitative, ass
ection Cr
ave been de
ue realisatiohat could beand netwoith which anconsideratio
ation criteria
Energy Vaupport (Reliupport (Mar
s for each c
y of Mile
(Site Selecctors includiresulted in
eveloped toan ESD. A o short-list p
iderations wof screeninentially feasonsideration
irst stage scecond scresessment.
riteria
eveloped ca
on criteria, we achieved rk characten ESD devion.
a were sub-d
lue; ability); and
rket Benefit)
category ab
stone 2
ction) was tong physicathree sites
o enable a A two-stage potential site
were used g. Sites tsible and vn were capt
creening weeening stag
an be broad
which reflecat the site u
eristics criteice could b
divided into
d ).
bove are bri
Report –
o determinel, commercbeing shor
high-level asite screen
es.
to determinthat passevaluable. tured by this
ere qualitatge were the
dly split into
ct the potenunder consieria, which e connecte
o the followin
efly describ
– Site Sel
e a site for ial and techrt-listed with
assessmentning proces
ne potentiald this screImportantly
s screening
ively scoreden easily id
two catego
ntial value oderation; anassess the
ed to the ex
ng categorie
bed in the se
P
lection
the proposhnical aspeh the site s
t of the suitass based o
l suitability eening stagy, the reasg step.
d and rankedentified for
ories:
of the variound e potential xisting netw
es:
ections that
Page | 82
sed ESD cts. The
selection
ability of on these
of each ge were sons for
ed. Sites r further
us types
ease or work at a
t follow.

B2.1 G
Table Bthe loca
No.
1
2
B2.2 N
Table Bat a givcustom
No.
3
Generated E
B1 shows thation of an E
Criteria
Ability tparticipate in energtrading
Marginal Limproveme
Table B
Network Su
B2 shows thven site wilers, or assi
Criteria
Network AugmentatiCapital Deferral
Energy Val
he criteria aESD at a giv
to
gy
Ability transfer from geto ESD
Ability transfer from Eload
Evidencwind spilling times prices
Loss Factorent
B1 - Criteria
pport (Reli
he criteria tl provide nst in mainta
ion Thermlimitat
VoltagLimitaVoltag
VoltagLimitaVoltag
ue
and assessven site wil
C
to energy
neration
AwrewnetraE
to energy
ESD to
AwElimen
ce of farms
wind at of low
Tcoap
r (MLF) Atimhige
associated w
iability)
hat have beetwork sup
aining existi
mal tions
ge Control ations (Low ge)
ge Control ations (High ge)
sment keys l improve th
Comment
Assessed onwould be inenewable so
wind farms, setwork limit
ransfer of eneESD.
Assessed onwould be incESD to loadsmitations arenergy from th
his has bomparison wppear to spil
Appropriate cmes of highigh demandenerators an
with improve
een used topport of a tyng levels of
Commen
If downslimitation, augmentatimes.
w
If in a locmaintain nacceptablcould dereleasing decrease
If in a locmaintain nacceptablcould deffacilities b
that have he value of
n the magnincurred wheurces of gensolar systemtations are ergy from loc
n the magnicurred whens in the neare likely to he ESD to lo
been observwith other nl wind.
control of theh generationd) could imnd/or local loa
ment of gene
o assess wype that wif reliability i
t
stream of the ESD
ation by rele
ality where fnetwork voltae levels at
efer the neenergy at higthe net local
ality where fnetwork voltae levels at
fer the needby storing en
been used generated e
tude of eleen transferreration in the
ms) to the Elikely to c
cal renewabl
tude of ele transferringrby area, andconstrain th
ocal loads.
ved at soearby wind
e ESD (e.g., releasing emprove theads.
erated energ
hether the ll improve nto the futu
a known could defe
asing energ
future investage levels abhigh deman
eed for volgh demand tl load).
future investage levels below demandfor addition
ergy at low d
P
to assess energy.
ectrical lossering energye nearby areESD, and wconstrain thle generation
ectrical losseg energy frod whether n
he free tran
ome locatiofarms that
. storing eneenergy at time MLFs of
gy value
location of supply relia
ure.
thermal neer the neey at high de
tment is neebove the min
nd times, theltage suppotimes (i.e. ac
tment is neeelow the maxd times, thenal voltage cdemand time
Page | 83
whether
es that y from ea (e.g. whether e free n to the
es that om the network sfer of
ns by do not
ergy at mes of f local
an ESD ability to
etwork ed for emand
ded to nimum e ESD ort by cting to
ded to ximum e ESD control es (i.e.

No.
4
5
B2.3 N
Table Bat a givnetwork
No.
6
7
8
9
10
11
Criteria
Localised fr
Expected Ureduction
Tab
Network Su
B3 shows thven site wik, and there
Criteria
Heywood constraint r
Murraylink constraint r
Local genreduction
Grid suppor
Ancillary (System fre
Avoided wiControl A(FCAS) obl
Table
requency sup
Unserved En
ble B2 – Crite
pport (Mar
he criteria tll provide n
eby allow low
Intercoeduction
Intercoeduction
nerator co
rt cost reduc
services equency supp
nd farm FreAncillary igation
B3 – Criteria
pport
nergy (USE)
eria associate
rket Benefit
hat have benetwork supwer-cost op
Co
onnector MrereHepo
onnector If tneIntobanRe
onstraint A colim
ction If timsu
support port)
If pothgrth
equency Service
Mthobre
a associated
Commen
acting to i
An ESD menable losupply locnetwork.
An ESD mwhen islan
ed with relia
t)
een used topport of a peration of t
omment
arket benefieduction of egion, which eywood Inteool price.
the ESD opeetwork to terconnectorbtained fromnd a reductiegional Victo
benefit will onstraints onmitations.
able to promes of islaupport costs
configured ower during e ESD coulrid. This serve main grid i
any wind fae FCAS mbligations. If educe these f
with market
t
ncrease the
may be able ocal wind facal load whe
may be ablended from th
bility-related
o assess wtype that w
the electricit
ts may be onetwork cowould facilita
erconnector a
erates to incrsupport flo
r into Regio both the imion in expecorian 220 kV
accrue to n their ope
ovide partial anding from may be incu
to increase times of falld provide fr
vice is most utself.
rms currentlmarket to m
configured financial pay
benefit-relat
net local loa
to provide frerms to contn islanded fr
e to supply e rest of the
network sup
hether the will reduce ty market.
obtained if thonstraints in ate higher traand result in
rease the abows acrossnal Victoria,
mpact on Viccted unservenetwork.
generators ieration due
or full suppthe grid,
rred.
output powing frequenc
requency suuseful when
y make finameet their f
appropriatelment obligat
ted network s
P
ad).
requency continue operatrom the rest
a small loca network.
pport
location of constraints
he ESD ena the Southansfers acron lower who
ility of Electrs the Mur, benefits mctorian pool ed energy o
if there are to local ne
ply to load fewer gene
wer/decreasecy and vice
upport to thelocated near
ancial paymefrequency cly, the ESD tions.
support
Page | 84
ntrol to ting to of the
al load
an ESD s on the
bles a h East oss the olesale
raNet’s raylink
may be prices
on the
fewer etwork
during eration
e input versa,
e main r or on
ents to control
could

B2.4 L
To minand to suitabledevelopacknowElectraN
Existingto be bthere areasonsIsland).and the
Similarlwhich pgeneralexpectainformathat wowould esites co
On the State aPower Ninclude transmisites, athe sublandow
The folphysicarenewa
Local Site a
imise projekeep the b
e land curreper with exwledged thaNet and AG
g SA Poweeyond the s
are some ss potentiall However,
ese are not
y, there arepresent an lly privatelyations and bation, the mould apply equally apponsidered a
SA transmiand the AdeNetworks s275/66 kV,ssion and nd in somebstation. Tners for agr
lowing factal selection able integrat
Only existinAvailability Availability property owAvailability landownersPotential simpact of aStatutory aCultural Heexisting suapproval unAvailability
and Networ
ect developreadth of th
ently ownedxisting land at as incumGL that may
r Network dscope of thsites in they represenno comme
included in
e 30 registeopportunityy owned benefits fromain focus wto an Electly to the winlso act as p
ission netwoelaide Metrohare the sa, 132/33 kVdistribution
e sites locahe extra laricultural ac
ors were taof sites th
tion in Sout
ng ElectraNof suitableof suitable
wned by Eleof suitable
s; takeholders
additional eleapproval reqeritage (devubstation bnder South of medium
rk Characte
ment risks he task mad/easily acq
interests wmbent asset
not be ava
distribution e Project a South Au
nt valuable ent can be p
this Report
red generaty to connecand hencem the imple
was on ElectraNet genend farm con
proxies for th
ork ElectraNopolitan are
ame site andV connection
networks. ted in rural and is eith
ctivities.
aken into chat could bh Australia:
Net substatioe land withine land outsiectraNet; e land for p
s and local ectrical infraquirements velopment a
boundary isAustralia Dvoltage or
eristics
such as lanageable, i
quired by eiwould likely owners in
ailable to all
and direct and thereforustralian dis
locations, provided ont.
tors in Soutct an ESD. e will presementation ctraNet ownerator connnnected to the generato
Net owns 8ea. In a nud have sepn and is a le
ElectraNet areas it ha
her manage
consideratiobe feasible :
on sites aren the existinide the exis
purchase ou
communityastructure;such as Deassociated
s exemptedDevelopmen
low voltage
and acquisiit was decidther Electra
y approach South Ausdevelopers
connect cure not includstribution n
(such as n their feasib
th Australia However,
sent a ranof an ESD.
ned sites. Hnection sitethat substator sites in th
8 high voltaumber of suarate land oegacy of fot owns theas generoued by Elec
on in the prfor the en
e consideredng substatiosting substa
utside the e
y concerns
evelopmentwith electr
d from appnt Act and Re bus for con
tion and Stded to limit aNet or AGsiting simil
stralia an as.
stomer siteded in this etwork thatVictor Harbbility or othe
including 1each of thenge of difDue to acc
However, thee, e.g. Daltion. Therefhe vicinity.
age substatiubstations, ownership. rmer verticaland for a
s land ownctraNet or
reliminary anergy stora
d; n boundaryation bound
existing sub
and issues
t Approval, ricity transfoproval such
Regulations)nnection pu
P
tatutory Ap the site op
GL. Any othlarly, althou
advantage e
es were conprocess. Ht would forbor and Kaerwise at th
6 wind farmese generafferent comcess to site e range of lrymple subfore, the Ele
ions througElectraNet These sitesal integratioall of its sunership surr
leased to
assessmentage for com
y; dary but w
bstation fro
s in regard
Native Vegormation wh as deve) urposes.
Page | 85
pprovals, ptions to her ESD ugh it is exists to
nsidered However, r similar angaroo
his stage
ms, all of ators are mmercial
specific benefits bstation, ectraNet
hout the and SA s mostly on of the ubstation rounding
nearby
t for the mmercial
ithin the
om other
s to the
getation, ithin the lopment

B2.5 B
Some bto be cconside
Just onwhich cutility as
The futsignificacentraligrid-conupfront residen
B2.5.1
As discbattery from tenrestart a
Howevenetworkgeneratnot bee
B2.5.2
The tratimes linterconavoid ngeneratthe netwto netwimprove
Should future yto impro
Benefits No
benefits havconsidered deration are:
those that wthose whicbecomes m
e example can both cossets, includ
ture realisaant amountssed controlnnected sto
protocols tial battery
System R
cussed in thstorage pro
ndering for a large gen
er, should tk in future ting units. A
en considere
Transie
ansfer capalimited by nnector flownetwork dyntor. The conwork underwork capacement and h
the installayears, they ove network
ot Consider
ve not beenduring the
would realisch may onmuch more w
topical in thonsume andding larger
ation of sos of storage of wide sporage devic
and standstorage.
Restart Anc
he Regulatooject with aSRAS proverating unit
the installatyears, they
Any future ved as part o
ent Stability
bility acrosstransient n
ws are connamic instantrol systemr such condcity) would has not bee
ation of multmay have
k transient s
red
n consideredcourse of t
se only a smnly becomewidespread
he literatured provide escale stora
me of these installed aread small/rces. This wdards were
cillary Serv
ory Overviewa maximumvision, if its lt. In essenc
tion of multy may havvalue that cof this site s
y Improvem
s the Southnetwork st
nstrained beability for cem of an ESDditions. How
provide men considere
tiple storagan aggregastability.
d in the sitethis project.
mall benefit e realisabled in the futur
e is the inteelectrical enge.
se benefitsacross the eresidential swould be me in place
vice (SRAS
w report, thm capability
limited capace, at this s
iple storageve an aggrecould be reselection rep
ment
h Australia tability conelow the thertain criticaD may be c
wever, the sminimal ased as part o
e devices oate capacity
e selection . Benefits t
compared te if the pere.
erplay betwenergy, and
s could be electricity nestorage dev
made easiebefore th
S)
he technicalin the rangacity and/orcale such a
e devices oegate capaalised fromport.
to Victoria straints. At
hermal capal outages,configured tsmall size osistance foof this site s
occur acrosy sufficient
process, anhat have be
to other bennetration o
een grid anhow these
achieved etwork, andvices in coner in the fue widespre
parameterge of 5-30 Mr location ma service is v
occur acrosscity sufficie providing s
Heywood it these timacity of thee.g. the lo
to provide dof ESD conor network selection rep
s the SA elto provide m
P
nd are not ieen exclud
nefit classeof storage
nd electric vmight inter
by coordind may requinjunction wituture if appead installa
rs and locatMW may p
means it is uvery unlikel
s the SA eent to restasuch a serv
nterconnecmes the He interconnoss of a sigdynamic su
nsidered (cotransient
port.
lectricity nemeaningful
Page | 86
ntended ded from
s; and devices
vehicles, ract with
ation of re some th larger propriate ation of
tion of a revent it nable to ly.
lectricity art large vice has
ctor is at Heywood
ector to gnificant
upport to ompared
stability
etwork in support

B2.5.3
One of would nprices dwould nprices wpart of t
When Eprices, be addr
B2.5.4
Where farm mamay leawind picto othemagnitu
B2.5.5
A nearbconnecto stay allowedvoltage
ESDs mwhich mhave bewith thereducin
Once tcapabilcircumsinterconline, the
The potnew wiconside
Inter-reg
the base anot impact difference bnot affect gwould be inthis project.
ESD penetthis will learessed in th
Wind far
a wind farmay be limitead to spilledcks up quic
er benefit cude lower a
Ride thr
by fault on ttion point. Iconnected
d to connec dip.
make use omay assist een disconne Generatorg or elimina
the generaity has the stances, i.ennecting thee generator
tential ride tind farm cered as part
gional effec
assumptionson the who
between NEgeneration nfluenced. T.
tration achied to diminis
he formulatio
rm ramping
m is of subed to a maxd wind resockly leadingclasses, enand has not
rough assi
the networkt is advantato the grid
ct to the gr
of inverter ta wind farmnected. Thir Performanating the us
ator has bepotential t
e. for a faule generatowill be disc
through assonnections t of this proj
cts
s of the Proolesale pric
EM regions.dispatch toTherefore,
eves a leveshing other on of the bu
g
bstantial sizximum rampources if the to potentia
nergy lost dbeen consi
stance
k can resultageous for d during thisrid, it must
echnology m to ride-ths ESD connce Standase of other c
een commio avoid unlt close to r to the gri
connected w
sistance thaby reduci
ject.
oject is thatce of electr In other woo the exteninter-region
el where itbenefits, es
usiness cas
ze comparep rate to lime wind farmal power oudue to ramidered part
t in a dramaboth the sys temporarydemonstra
that can behrough a nentrol mode pard for the incontrol devic
issioned, annecessary the generad. (If the g
when the fa
at could be png or optim
t the scale ricity, e.g. pords, it is ant that the nal effects
t starts to ispecially Pr
se.
ed to the lomit the impam output hatput exceed
mping is coof this proje
atic short-teystem and thy voltage date that it c
e configureetwork faultpotentially rnitial installces.
any additionshut down
ator, on a lienerator isulted line is
provided bymising cap
of such ESpotentially rssumed tharegional whave not b
mpact on rice Arbitrag
ocal networkct on the ne
as to be conding the ramonsidered tect.
erm reductiohe generatoip. Before a
can ride thr
d to providet for which reduces theation of the
nal incremes of the geine which iconnected
s isolated).
y an ESD is ital costs a
P
SD implemereducing what ESD dep
wholesale ebeen consid
regional whge. This risk
k capabilityetwork. Thisnstrained wmp rate. Coto be an o
on in voltagor for the gea generatorough a sh
e transient it would ot
e cost of coe generator
ental ride enerator in s not the o
d radially vi
s mainly releand has n
Page | 87
entations holesale
ployment lectricity
dered as
holesale k should
y a wind s in turn
when the ompared order of
ge at the enerator r will be ort term
support therwise
omplying , e.g. by
through specific
only line a single
evant for ot been

B3 B
This sean ESDmethod
An oveESD is
1.
2.
3.
Estimatto modevalue fo
As the impactiof the d
The ide
B3.1 E
The estby conssimulatfollowin
Benefit Q
ection coverD. These
dology appli
erview of thgiven below
Determine Identify andthat may re
Determine ensure thabenefits are
tes of the vel the dispaor the assoc
ESD will bng on the o
device is set
entified bene
Time shiftincheap electhe pool priDispatchingnetwork coDispatchingto planned Dispatchingorder to redthey are cloDispatchingDispatching
Energy Trad
timated possidering theion of the
ng reasonab
That the deThat the mrating; and That the de(or, in the c
Quantific
rs the rangebenefit claed to determ
e methodow:
the various
d evaluate ealize marke
how the vaat double coe left unacc
various maratch of the dciated dispa
be used fooptimum ratt out in the s
efits that co
ng power sctricity as thice is high. g the ESD nstraint. g the ESD aor unplanne
g the ESD duce netwooser to unityg the ESD tg the ESD t
ding Value
ssible revene historical
device disble assumpt
evice is not agnitude of
evice will nocase where
cation Me
e of potentiasses are mine the be
ology adopte
uses that a
various netet benefits
arious markounting of
counted for.
ket benefitsdevice undeatch behavio
r several dtings. The losections be
ould accrue
so that the he fuel sour
as a load o
as a generaed outages contra cyc
ork losses ay. to provide frto provide re
nue that cobehaviour
spatch behtions:
large enougf the charge
ot be dispait is dispatc
ethodolo
ial benefit caligned wi
enefit for ea
ed for dete
an ESD can
twork conn
ket benefitsbenefits do
s were carrer various cror.
different purogic associ
elow.
from an ES
ESD effectrce and der
or as a gen
ator in the e to prevent
clically to wand modify
requency coeactive pow
ould be accof power
haviour wa
gh to matere and discha
tched if theched as a lo
ogy
classes conith the site
ach class is
ermining an
n be utilized
ection sites
s of an ESoes not occ
ried out usinredible scen
rposes – thated with d
SD are:
tively acts lrives an inc
nerator in o
event of a locurtailment
wind generanetwork M
ontrol ancillwer ancillary
rued from eprices in Ss construc
rially impactarge power
ere is insuffoad, storage
sidered for e selectiondiscussed b
nd assessin
d for.
s on the SA
D interact cur, and al
ng modellinnarios and e
here are coetermining
ike a poweome from s
order to relie
oss of transmt of load. ation and aLFs (margin
ary servicesy services to
energy tradSouth Austrted which
t the pool prr levels is lim
icient availae capacity).
P
r the deployn criteria, abelow.
ng the value
A transmiss
with each lso that no
ng which atestimated a
ompeting dthe optimu
er station thselling pow
eve a trans
mission sup
associated nal loss fac
s to the neto the netwo
ding was caralia. Specidepended
rice; mited by the
able stored
Page | 88
yment of and the
e of the
sion grid
other to o market
tempted a market
emands m rating
hat uses er when
smission
pply due
loads in ctors) so
twork. ork
alculated fically a on the
e device
energy,

In this advantause mathat con
The adoan ESDparamerevenuemarket
The rescurrent
B3.2 M
At locatpossiblePreliminminor cmore co
This is aorder to
For twoRocks awhich aThis loo
In orderof indepthe ESpower s
MLF mwas alshistoricais dispaeffect. (
MLF at
The curto the fthe tranSouth A
By operoutput owind faESD is plant m
mode the age of diffearket swapsnventional b
opted methD could geneters were e stream toconditions.
sult of dispswap price
MLF Modific
tions on thee for the snary investcompared tomplex sim
a complex mo check and
o sites, (Poand Wattle aimed at disoked at max
r to investigpendent comD was dispsource to a
odification so consideal power floatched to m(I.e. the dev
Dalrymple
rrent MLF (Mfact that thensmission sAustralian re
rating the Eof Wattle Prm, it is posdispatcheday be nega
ESD acts aring market
s to allow thbase load co
odology wanerate if it w
varied usio various a
atching thees was then
cation Valu
e network wstorage devtigations indo the possulations we
modelling tad cross chec
ort Lincoln aPoint respe
spatching thximising the
gate the effemponents wpatched to baseload u
as a side ered. The reows near eamaximise itsvice is not d
e
Marginal Loe existing gsystem is deeference no
ESD so thatoint, the loassible to mod in this waated.
as a genert spot pricehe ESD to ponsumers a
as to use hiswas dispatcng a math
assumptions
e ESD direccompared.
ue
which have vice to havdicated thaible revenu
ere performe
ask and as ck differing
and Dalrymectively conhe ESD in oe effect depe
ect of an ESwas used toconvert a
unit.
effect to opesults obtaach locations energy traispatched t
oss Factor) eneration aesigned suode at Para
t it is dispatad at Dalrymodify the M
ay, the reve
rator and aes at differeprovide poware shielded
storical poohed accord
hematical ms, whilst av
ctly onto th
low fault levve an impaat the possue that coued as the si
a result waapproaches
mple) which nnected neaorder to maxending on s
SD on all exo determinegiven wind
peration to mined in the
n. In these sading valueto maximise
at Dalrympat Wattle Poch that Dalsubstation
tched in a cmple and toLF at Dalry
enue genera
a load at dient times. Awer during d from occa
ol prices andding to a premodel to evvoiding ove
e market v
vels relativeact on the ible commeld accrue fiting options
as approachs.
currently harby, a detaximize the Mstorage cap
xisting winde what cost farm outp
maximise ree simulationscenarios ite, and the Me the MLF b
ple is very point typicalllrymple is o.
counter cyco a lesser eymple to a sated by ope
fferent timeA variation periods of hsional very
d evaluate eset algorithvaluate ther fitting the
versus using
e to the sizeMarginal Lercial impafrom energys consolidat
hed in sever
have the wiailed analysMLF at eacacity and E
farms in theor benefit wut from a v
evenue duen studies w was assumMLF benefienefit).
oor for geney exceeds
only weakly
lical manneextent the osmall degreerating the
P
es in order on this thehigh pool phigh pool p
how much hm. The a
e sensitivitye model to
g market s
e of the devLoss Factoract of this ey trading, ated.
ral different
indfarms Csis was undch connectioESD rating.
e state, the would be acvariable ren
e to energywere basedmed that thefits occur as
eration (~0the local lo
y linked bac
er to the geoutput of Snee. HoweveESD as a
Page | 89
to take me is to
prices so prices.
revenue lgorithm
y of the specific
waps at
vice it is r (MLF). effect is although
ways in
athedral dertaken on point.
method ccrued if newable
y trading d on the e device s a side
.87) due oad, and ck to the
neration nowtown er, if the peaking

In the eduring hit is poson the effect oMW, an
The ESwind faper ann
This is to affecMLF vato mark
Previoudispatccapacity
This cacapacity+/- 2 MW
So for approxiWattlep
B3.3 N
The opcapacitytimes o(e.g. by
The Nebenefitsnetworkproject
The tota
If the Epotentialimitatioattributaannuali
event that high price sssible for a energy trad
on MLF is snd is estima
SD itself is rm is 0.000
num.
effectively zct the MLF. alues for Waket trading o
us analysis hed contra-y.
an be achiey of 10 MWW.
a 5 MW,mately $10
point will imp
Network Au
peration of y and deferf high local
y the therma
et Present Vs discountek augmentayear compa
al potential
SD can defal annual beon can be mable to the sed cost of
the ESD isspike eventssmall impacding revenusimilar to thated to chan
unable to c005 x reven
zero and woHowever,
attle Point wopportunitie
indicated t-cyclically t
eved for exWh, or if t
10 MWh 0k (which is prove slight
ugmentatio
an ESD car network anetwork de
al rating of n
Value (NPVed back to ation deferrared to a de
benefit was
fer the needenefit is eqmost econoESD devicthe avoided
s configureds, and only ct on MLF tue generateat expected
nge the MLF
capture thisue of wattle
ould be theit is also po
whilst still ms and supp
the device to Wattle po
xample, if the device
device, thadditional t
tly from say
n Capital D
an potentialugmentatio
emand, whenetwork pla
) of a projecthe value o
ral is the dieferred proje
s calculated
1
d for netwouivalent to mically resoe for the ded or deferm
d so that itoperates atto be factored by operd to occur bF at Dalrym
s benefit, be point -> E
e result if weossible to d
maintaining cort load at D
would be aoint, and to
the device has a cap
he ESD wto its respo
y 0.87 to 0.8
Deferral
l configuredon. The ESDen the localnt).
ct represenof money toifference beect year.
d as followin
ork augmentthe annualiolved by a eferral of ne
ment of augm
t can rapidt a low levered in whilstating the Eby increasinple by 0.00
but the estiquivalent o
e rely only odispatch thecharge in thDalrymple.
able to geno do this w
is dispatcpacity of 20
would get aonse to pool871.
d to provideD can achie network w
nts the aggroday. The etween a p
ng:
1
tation for thised projectnon-netwoetwork augmentation p
ly dischargel (< 5 MW) t having onl
ESD as a png the load005, which
mated benef generating
on the enere ESD at a he device to
nerate $9,9would requir
hed at +/- 0 MWh and
an energy l price peak
e additionaeve this by ould otherw
regate futurepotential m
project’s NP
he foreseeat cost. If therk solution, mentation i
project.
P
ge (e.g. at 2at all other
ly a minimapeaking plad at Dalrym
is very sma
efit to Wattg an extra 1
rgy trading dlow level to
o allow it to
985 per MWre 9 hrs of
1 MW andd is dispat
trading beks), and the
al effective exporting p
wise be con
re project comaximum bePV in the p
ble future, te identified the annuais equivalen
Page | 90
20 MW) r times – al impact nt. The ple by 5 all.
tle Point 10 MWh
dispatch o impact respond
W if it is storage
d has a tched at
enefit of e MLF of
network power at strained
osts and enefit of roposed
then the network l benefit nt to the

Voltage
If a lowbenefit conventhe sam
Voltage
Similar addresssupport
B3.4 L
Many rerely oninterrupand mu
It may bthe gridinstallatinterrup
The valenergy can be (includi
B3.5 E
An ESDconnecoutage,estimatpoints,
These t
For theoutage.demandunserve
The staAEMO’sunless s
e Control L
w voltage liof an ES
tional capame limitation
e Control L
to the situasing high vot device tha
Localised F
enewable gn the availption to grid ust remain o
be possibled is unavations to re
ption as an i
lue of the bthat would quantified
ng RECs) fo
Expected U
D can act ation point le, especiallye the expectaking into a
two types o
1. Pla
2. For
original re. Both transd. The histoed energy.
ate averages Value of stated othe
Limitations
mitation haD providingcitive reacti
n.
Limitations
ation for lowoltage limitaat would oth
Frequency S
generation sability of asupply, suc
out-of-servic
e to configurailable. Thismain connislanded sy
benefit to thotherwise busing an aor a wind fa
nserved En
as an alternevel are typy for radiacted unservaccount the
f outage we
anned outag
rced outage
port typical sformers anorical load d
Value of CCustomer rwise.
s – Low Vol
as been ideg equivalenive support
s – High Vo
w voltage limations, is theerwise be r
Support
sources suca synchronch sources ce until grid
re an ESD ts may makected, so stem.
he generatobe spilt. It m
assumed enarm, and so
nergy Redu
ative supplypically causl connectioved energy e substation
ere conside
ge (Mainten
e (Fault).
data was und lines werduration cur
Customer ReReliability r
ltage
entified at ant voltage device tha
oltage
mitations, the annualiserequired to a
ch as wind nising frequof generatisupply is re
to maintain ke it possias to cont
ors was detemost naturanergy valueo forth depe
uction
y during a psed by a tron points.
at a given n arrangeme
red when c
nance); and
used for there assumedrve was the
eliability (VCreview publ
a particular support is
t would oth
he annual bd cost the caddress the
turbines anuency fromon will be uestored.
a frequencble for loctinue to su
ermined asally accruese - say $70 nding on ge
power outaransmissionA probabilconnection
ent and hist
calculating e
e frequencyd to be equan used to e
CR) of $38,ished on 30
connection the annuaerwise be r
enefit an ESconventionae same limit
nd solar phom the grid.
nable to co
cy referenceal wind far
upply local
the value s directly to
per MWh eneration ty
ge. Power n line outaglistic appron point or gtorical outag
expected un
y and duratally likely toestimate the
,090/MWh, 0 Septembe
P
n point, thealised costrequired to
SD may proal inductive tation.
otovoltaics On occas
ontinue to ge
e when suprms and sload follow
of locally-pthe generaof supplied
ype.
interruptionge or a tranoach was group of conge data.
nserved ene
tion of eacho fail at anye average e
in accordaner 2014, w
Page | 91
e annual t of the address
ovide, in reactive
typically sions of enerate,
ply from olar PV wing an
roduced ator, and d energy
ns at the nsformer used to nnection
ergy:
h type of y level of expected
nce with as used

FactorsESD ataffectedis 50% outage
B3.6 H
An ESDinto Sothe fuelVictoriacould tawould ty
In the obenefit.Intercon
B3.7 M
An ESDnetworkthe BallWemenmost crBallarat
The valthe openetworkVictoriaexpecte
B3.8 L
Non-SclocationLimiter differ frlocal EDbenefit
SCADAthe eneto estim
s that couldt the time od customerscharged at rates for th
Heywood In
D could provuth Australl costs in S
a at those tiake on addypically be
original site Further innector con
Murraylink I
D at Monask. The Weslarat, Bendin Terminal Sritical limitat–Bendigo l
lue of the peration of thk by the ESan 220 kV ed USE, mu
Local Gene
cheduled rens may be (GDL) or a
rom locationDS could taclass does
A and Nationergy spill dumate the ene
Actual geneGDL LimitsEnergy ava
d affect thisof an outages. For quanthe time of e Dalrymple
nterconnec
vide an effeia is constr
South Austrimes. At timditional stocheaper tha
selection rnvestigatio
nstraint redu
Interconne
h can suppstern Victoriigo, FostervStations. Thations are tine loading
potential behe ESD is thSD via Murr
networks aultiplied by t
rator Cons
newable geconstrainedsimilar con
n to locatioake an adva
not cover e
n Grid Meteue to such lergy spill:
eration (30 s – SCADA ailability fore
s class of be, the actuantification of
an unplanne site were
ctor Constr
ective increarained, a realia, which
mes when eored energyan Victorian
eport this bn has led uction bene
ector Const
port higher tan 220 kV ville, Glenrohis transmisthe Moorablimitation.
nefit providhe total eneraylink at timare constrathe relevant
straint Redu
enerators (ed by the lontrol schemeon. Such geantage by stenergy tradi
ering (NGM)ocal genera
minutes en ecast – SCA
benefits inclal duration f this potentned outage.used to cal
raint Reduc
ase in intercelease of sto
are typicalexport from y producedn generation
benefit was to the cfit is captur
traint Redu
transfers actransmissio
owan, Horshssion netwobool - Balla
ded by the rergy expectmes when ained. Thet VCR.
uction
especially ecal TNSP (e to avoid venerators htoring the uing, nor inte
) data over ator constra
nergy) – NG
ADA
lude the amof the outatial benefit, . As a refinelculate this
ction
connector cored energyly more exSouth Aus
by South n at those ti
listed as donclusion ed as part o
uction
cross Murraon network ham, Keranork has limiarat No.1 li
reduction oed to be suboth the Ri
e benefit w
early wind f(ElectraNetvarious netwhave to spiln-utilised e
er-regional c
a three-yeaaints. The fo
GM
mount of enge and the it was assu
ement for thbenefit.
capacity. At y from the pensive tha
stralia is conAustralian mes.
istinct from that this pof energy tra
ylink into thsupplies th
ng, Red Cliffted networkne loading
f expected upplied to thiverland 132
was calcula
farm develo) using a Gwork issuesl energy wnergy to preconstraints.
ar period waollowing info
P
nergy storee actual VCumed that this report th
t times wheESD would
an the fuel nstrained, tgeneration
the energypotential Hrading bene
he Victorianhe regional ffs, Sheppark capacity, limitation
USE in Viche Victorian2 kV and th
ated as the
opments) atGenerator Ds. The sche
while constraevent the s
as used to eformation w
Page | 92
d in the R of the the ESD he actual
n import d reduce costs in
the ESD n, which
y trading Heywood
fit.
n 220 kV loads at rton and and the and the
ctoria by n 220 kV he West e saved
t remote Dispatch me may ained; a pill. This
estimate was used

The enenergy forecascomparthe gen
Once thby the averagethat an be able
B3.9 G
The gripotentia
These t
Reduct
An ESDlocated providebenefit,
Similar the timeESD wiwas desupport
Reduct
The beexistingexpectepotentiathe incubasis.
10 Table
nergy spill igeneration
st (claimed) ring the clainerator was
he energy sprevailing
ed over theESD can c
e to capture
Grid Suppo
d support cal benefit ar
Reduction requiremenPotential focomes up f
two potentia
tion in ope
D has the c on the sa
ed by diese the energy
to USE, thee of an unpill be 50% cetermined bt over the la
tion in size
enefit an ESg contracteded to result al benefit isumbent grid
28, p73, Low
is the diffe. The potenenergy av
med energynot constra
spill was estwholesale
e three yeacapture thethe total sp
rt Cost Red
cost reductrises in two
in operationnts from theor the ESD for renewal.
al benefits a
rational co
capability toame netwoel powered y supplied b
e ability to aplanned outacharged on by multiplyiast three yea
e of contrac
SD may prd grid suppin a propor
s heavily ded support p
wer Eyre Pe
rence betwntial energyailability. A y availabilit
ained.
timated, theelectricity prs. For quamaximum
pilt energy d
duction
tion benefit forms:
nal costs du grid suppoto reduce th.
are discusse
ost
o reduce thrk that reliegeneration
by an ESD w
access this age. The waverage. Tng the avears with hal
cted grid su
ovide has port, followertional redu
ependent onprovider, th
ninsula Tech
ween the poy availability
scaling facty and the a
e benefit is tprice plus antification potential b
due to size,
class cove
ue to the ESort contract; he size of c
ed in turn b
e operationes on said, and for thwill be value
benefit depworking assuThe value oerage annulf the capac
upport
to be asseed by an asction of the
n the possibhis benefit h
hnical Netwo
otential eney was first ector for eacactual energ
the estimateRECs (assof this poteenefit. Howcapacity or
ers existing
SD displaciand
contracted g
elow.
nal cost of d grid supphe purposeed at an ave
pends on thumption usef the reduct
ual numbercity of the E
essed whetssessment e annual fixeble reductiohas to be a
rk Options A
ergy availabestimated bch generatogy output du
ed to be ensume a totaential benefwever, an acr other techn
contracted
ng some (o
grid support
contracted port. Typicas of quanti
erage of $30
he energy sted for quantion in annur of dispatcSD.
her it can whether thed fee. Sincon that can assessed o
Analysis Repo
P
ble and theby scaling dor is determuring the tim
ergy spill mal $70/MWfit, it was actual ESD nical limitat
d grid supp
or all) of the
t when the
grid suppoally grid suifying the a00/MWh10.
tored in thentification is ual operatioches of ge
reduce thehe size reduce the valube negotia
on a case
ort
Page | 93
e actual own the
mined by me while
multiplied h), then
assumed may not ions.
ort. The
e energy
contract
ort if it is pport is
available
e ESD at that the
onal cost neration
e size of uction is e of this
ated with by case

B3.10 A
The ESassumior low s
The req
HistoricSouth Amarket South A
Analysivery lowanalysis
B3.11 A
Similarlcommeto a sto
AlthougchangeFCAS in
B4 S
This sefollowin
The abo
B4.1 S
The ARdeployispecificNationasuggesarea forgeneratrenewainstallatstorage
Ancillary S
SD is able tng it has a system freq
quirements
cally the revAustralia is
is re-desigAustralia as
s of marketw value bass as it is ex
Avoided W
y to the ercial impactorage device
gh the valuee that and mn future.
Site Asse
ection preseng:
Sites that scope; Initial screeSecond-staLocality facConclusion
ove-mentio
Sites Exclud
RENA Measng a grid-co
cally designal Electricityts that transr potential stion on the
able generations signif
e itself is dis
Services Su
to supply Fcontrol alguency even
for this serv
venue that approximat
gned to add convention
t informatiosed on histpected to in
Wind Farm F
section abt of this effee from ener
e of FCAS may lead to
essment
ents how po
may have
ening of all tage screenictors for shon for short-lis
ned topics a
ded
sure (this pronnected u
ned to faciliy Market (NEsmission cosites. WindSouth Aus
ation sourceficantly smascussed furt
upport (Sys
Frequency corithm whic
nts.
vice vary fro
has been ately $ 0.70 pdress the snal generati
n has showtory. Howevncrease in v
FCAS Oblig
bove, prelimect is minor gy trading.
has historlarge scale
t
otential site
been suita
transmissiong to determort-listed sitested sites.
are covered
roject) “covetility scale nitate the inEM)”. This sonnection pd farms are tralian marke, the aggall that sucther below.
stem Frequ
control ancich overrides
om year to y
allocated toper MWh. Tsystem secon is retired
wn that systver, FCAS value going
gation
minary invecompared
rically beene ESDs bein
es were scr
able but we
on connectiomine shortlies; and
d in turn bel
ers the devnon-hydro etegration oscope, as w
points or winalso the on
ket, and whregation prch were no
uency Sup
illary servics its norma
year.
o generationThis may chcurity issuesd.
tem frequenhas been iforward, es
estigations to the poss
low, changng economi
reened and
ere exclude
on point siteisted sites;
low.
velopment oenergy storaf intermitte
well as the cnd farms innly primary hile aggregarocess is sot consider
port)
es whenevl operation
n for the prohange in thes that are c
ncy supportncluded in
specially in
indicated ible revenu
ging generac to possibl
shortlisted
ed because
es in South
of a detailedage systemnt renewabcompositionSouth Auslarge scaleated roof-tosignificantly red. Smal
P
ver it is on to respond
ovision of Fe future if thcurrently a
t (FCAS) tothe busineSouth Aust
that the e that could
ation patterly provide s
d by discus
e they were
Australia;
d business m in South Able energy n of the constralia are the renewableop PV is a sy complex ll scale dis
Page | 94
line and d to high
FCAS in he FCAS rising in
o have a ess case tralia.
possible d accrue
rns may synthetic
sing the
e out of
case for Australia into the sortium, he focus e energy sizeable and the stributed

Sites oconsidethat ma
B4.1.1
The Oaenergy limitatiobetweeMW. TOaklandassist w
B4.1.2
Althougfollowin
B4.2 In
The firseach sit
Site fac
outside of ered. Howevay warrant c
Sites ou
aklands Hill storage on
ons usually n 55 MW a
The above ds Hill wind
with potentia
Distribu
gh distributing distributio
In the Ademore feasibespecially tThe electriundersea csupply the of limited ustation outpthe installatThe FleuriePV installatA utility scNetworks’ s
nitial Scree
st screeningte:
ctors
Does ElectDoes Electexpanding Are the imrelationshipenvironmenIs it possibknown futuAre suitable
South Ausver, for com
consideratio
utside of So
wind farm n site. The
constrain and 60 MWvalues ind
d farm in redal network is
tion netwo
ion networkon applicatio
laide Metroble. The suthe availabicity supply
cable. SA Pisland in th
use with theput, ESD, retion on Kingeu Peninsultions resultiale ESD msub-transm
ening
g test cons
raNet own straNet own the site?
mpacts on ps, proximityntal consideble to makere plans? e voltage le
stralia and mpleteness,on in future.
outh Austra
in Western installed cgeneration
W, and somedicate that ducing locassues.
ork connect
k connectioons may be
opolitan areitability of ality of spaceto Kangaro
Power Netwe event of
e current neenewable eg Island (alba south of Aing at times
may be an oission netw
sisted of the
spare land wland outsid
neighboursy of the siteerations)? use of exi
evels availab
distribution, a few sites
alia
n Victoria wocapacity of output to etimes sucan ESD m
l generator
tions
ons have nenefit from c
ea distributea utility scalee in the metoo Island is
works operatloss of sup
etwork confinergy and abeit at a largAdelaide has in backfeeoption to a
work where t
e applicatio
within the sde the site,
rs manageae to existing
isting exits
ble for an in
n network s of this typ
ould benefithis wind less than
h as days omay demonconstraints
not been cocloser analy
ed small-scae ESD will dtropolitan as currently tes a small ply from theiguration. Hadditional cger scale).as a very hied into the 6ssist voltagthere is spa
on of the fo
site? or is there
able (e.g. g neighbours
or develop
nexpensive
connectionpe are brief
t more thanfarm is 6763 MW, oof a total finstrate goo
s. In addition
onsidered iysis:
ale storagedepend on area. dependent power stat
e mainland.However, co
ontrols cou
gh penetrat66 kV suppge managece available
ollowing ‘Ye
e a low anti
based on s, and inclu
spare exits
connection
P
ns have nofly discusse
n most from7 MW, but often in sumre ban dowod benefitsn an ESD m
in this proj
e is expectea variety of
t on a radiation at King. An ESD w
ombining thld potential
tion of rooftply to Victor ment in SAe.
es/No’ indic
icipated diff
known neuding site no
s without im
n of an ESD
Page | 95
ot been ed below
m having network
mmer to wn to 42 s to the may also
ject, the
ed to be f factors,
al 33 kV scote to
would be e power ly mimic
top solar Harbor.
A Power
cators to
ficulty of
eighbour oise and
mpeding
?

Value f
o
o
o
Based each s(‘Yes/Njudgempotentia
B4.3 In
Sites thscreeni
factors
Would abso
o aid the
o provide
o provideexisting
on the ansite to deteo’). Similarent was apally provide
nitial Scree
hat passedng stage, a
Substatio
Angas Cre
Ardrossan W
Back Calling
Baroota
Berri
Blanche
Brinkwort
Bungama
Cherry Gard
Clare Nor
Cultana
Dalrympl
Davenpo
Dorrien
Happy Val
Hummock
orbing or inj
e provision o
e network s
e network sg or emergi
wers to eacrmine its orly, based pplied to designificant
ening Resu
d both the as shown in
on Sit
eek
West
gton
a
e
th
a
dens
rth
a
e
ort
ley
ks
jecting real
of any poten
upport throu
support throng generato
ch of the soverall abilion the ansetermine woverall valu
ults
site test aTable B4.
te factors
No
Yes
No
Yes
No
No
Yes
Yes
Yes
No
Yes
Yes
Yes
No
No
Yes
power at th
ntial energy
ugh a poten
ough a potor or netwo
ite factor cty to accoswers to e
whether the ue.
and the va
Value facto
No
Yes
No
No
Yes
Yes
No
No
No
No
No
Yes
No
No
No
No
he site:
y trading ben
ntial reliabili
tential markork constrain
onsideratiommodate a
each of thelocation of
lue test ar
or Listed fo
nefit;
ity benefit; a
ket benefit nts?
ns, judgema lower-cose value facf an ESD a
e then liste
or the secon
No
Ye
No
No
No
No
No
No
No
No
No
Ye
No
No
No
No
P
and/or
by address
ment was apst ESD conctor consideat each sit
ed for the
nd screenin
o
es
o
o
o
o
o
o
o
o
o
es
o
o
o
o
Page | 96
sing any
pplied to nnection erations, e would
second
g stage

L
M
Substatio
Kadina Ea
Keith
Kilburn
Kincraig
LeFevre
Leigh Creek C
Leigh Creek S
Magill
Mannum
MAPS1
MAPS2
MAPS3
Mayurra
MHPS1
MHPS2
MHPS3
Middlebac
Millbrook
Mintaro
Mobilong
Monash
Morphett Vale
Mount Bar
Mount Barker
Mount Gam
Mount Gun
Mount Mil
MWPS1
MWPS2
on Sit
ast
g
e
oalfield
South
m
2
3
a
2
3
ck
k
g
h
e East
ker
South
mbier
son
lar
1
2
te factors
No
Yes
No
Yes
No
No
No
No
Yes
No
No
No
No
No
No
No
No
No
No
Yes
Yes
No
No
No
No
Yes
Yes
No
No
Value facto
No
No
No
No
No
No
No
No
No
No
No
No
Yes
No
No
No
No
No
No
No
Yes
No
No
No
Yes
No
Yes
No
No
or Listed foor the secon
No
No
No
No
No
No
No
No
No
No
No
No
No
No
No
No
No
No
No
No
Ye
No
No
No
No
No
Ye
No
No
P
nd screenin
o
o
o
o
o
o
o
o
o
o
o
o
o
o
o
o
o
o
o
o
es
o
o
o
o
o
es
o
o
Page | 97
g stage

Pa
P
Substatio
MWPS3
MWPS4
Neuroodl
New Osbo
North West B
Northfield
Para
arafield Garde
Pelican Po
Penola We
Pimba
Playford A
Playford
Port Lincoln Te
Port Pirie
Red Hill T
Robertstow
Rosewort
Sleaford
Snugger
South Ea
Stony Poi
Tailem Be
Templers
Templers W
Torrens Isla
Waterloo
Whyalla Ce
Whyalla Term
on Sit
3
4
la
rne
Bend
d
ens West
oint
est
A
B
erminal
e
T
wn
hy
d
ry
st
int
end
s
West
and
o
ntral
minal
te factors
No
No
No
No
Yes
No
Yes
No
No
Yes
Yes
No
No
Yes
No
No
Yes
No
No
No
Yes
No
Yes
No
Yes
No
Yes
No
Yes
Value facto
No
No
No
No
Yes
No
No
No
No
No
No
No
No
Yes
No
No
Yes
No
Yes
Yes
Yes
No
No
No
No
No
Yes
No
No
or Listed foor the secon
No
No
No
No
Ye
No
No
No
No
No
No
No
No
Ye
No
No
Ye
No
No
No
Ye
No
No
No
No
No
Ye
No
No
P
nd screenin
o
o
o
o
es
o
o
o
o
o
o
o
o
es
o
o
es
o
o
o
es
o
o
o
o
o
es
o
o
Page | 98
g stage

The init
B4.4 S
The secscreenitrading screeni
Each ite
Conneclevel anleast dif
Individuconsidevalue).
The res
Substatio
Woomer
Wudinna
Yadnarie
Table
tial screenin
Region
Eyre Pe
Mid Nonetwork
Mid Nor
Mid Nor
Riverlan
South E
Second-Sta
cond screenng stage. and netwo
ng test.
em within th
ction difficund spare exfficult. The
ual aspects ered importa
sults of seco
on Sit
a
a
e
B4 – Criteria
ng identified
eninsula
orth (Yorke k)
rth (Meshed
rth (275 kV M
nd
East
Table B5 –
age Screen
ning test apThe weightork suppor
hese aspect
lty combinexit availabilit
overall wei
of energy ance and s
ond stage s
te factors
No
Yes
Yes
a associated
d the 16 site
Peninsula
132 kV netw
Main Grid)
– Sites that m
ing
pplied weightings and st aspects
ts was assig
ed aspects ty. A judgeghting was
trading andscored from
screening is
Value facto
No
Yes
Yes
with market
es shown in
S
P
Y
W
M
132 kV D
A
S
work) R
W
B
B
C
M
M
N
S
made it throu
hted scoresscores add(reliability/m
gned a judg
such as lanement score
judged to b
d network sm 0 (lowest
given in Ta
or Listed fo
benefit-relat
Table B5,
Site
Port Lincoln
Yadnarie
Wudinna
Mount Millar
Dalrymple
Ardrossan W
Snowtown
Robertstown
Waterloo
Belalie
Blyth West
Canowie
Mokota
Monash
North West B
South East
ugh the initial
s to each ofdressed themarket) tha
gement wei
nd availabile of 1 represbe in propor
support werperceived v
able B6.
or the secon
No
Ye
Ye
ted network s
across six b
Terminal
West
Bend
screening.
f the sites the ease of ct were ass
ghting.
ity, site expsented the rtion to the o
re weightedvalue) to 3
P
nd screenin
o
es
es
support
broad regio
hat passed connection,sessed in
pandability,most difficuother aspec
d according(highest pe
Page | 99
g stage
ns.
the first energy the first
voltage ult, 3 the cts.
to their erceived

Table B6 – Re
esults of second sttage screening.
Page | 10 00

Yorke Pwithout significa
Althougreprese
The secEyre Pe
B4.5 S
The topTable B
Ra
1
2
3
4
5
6
7
8
For the
The EyPeninsuline out
Sites inconnec
From tharea, to
Peninsula sthe poten
antly chang
gh no metrentative site
cond stageeninsula, Yo
Second-Sta
p sites withB7.
ank Wit
Port
Dalr
Ard
Yad
Mou
Wud
Mon
Nor
Eyre and Y
the radial nthe low capthe high imthe losses athe existing
yre Peninsula due to tage conditio
n the Riverltion difficult
he above it o optimise th
sites (Ardrontial connees network
ropolitan se to confirm
screening orke Penins
age Screen
h and witho
h Hillside co
t Lincoln Ter
rymple (York
rossan West
dnarie (Eyre)
unt Millar (Ey
dinna (Eyre)
nash (Riverla
rth West Ben
Table B7
Yorke Penin
nature of thepacity of thepedance ofassociated
g wind farms
ula (Port the additionons.
land were ty and the p
was concluhe site choi
ossan Wesection of Hloading.
ites passedit would ha
identified thsula and in t
ing Results
out the Hil
opper mine
rminal (Eyre)
ke)
t (Yorke)
yre)
and)
nd (Riverland
7 – Top sites
nsula these
e existing trae existing traf the existinwith the exs / conventi
Lincoln Tenal requirem
ranked nexpotential for
uded that thce in a mor
st and DalrHillside co
d the initiave a relativ
hat the highthe Riverlan
s
lside coppe
)
d)
with/without
finding can
ansmissionansmission g transmiss
xisting transional gener
erminal) wament to sup
xt, after thereduced M
ree sites shre rigorous a
rymple) wepper mine
al screeninely low rank
hest rankednd.
er mine de
Without Hi
Port Lincoln
Yadnarie (E
Dalrymple (
Mount Milla
Ardrossan W
Wudinna (E
Monash (R
North West
t Hillside cop
n largely be
n networks;networks;
sion networmission netators conne
as ranked pply load via
e Eyre and Murraylink in
hould be chand detailed
re conside because
ng, Para wking when s
d sites were
evelopment
llside coppe
n Terminal (E
Eyre)
(Yorke)
ar (Eyre)
West (Yorke
Eyre)
iverland)
t Bend (River
pper mine.
explained b
ks; tworks; andected to the
first, highea contracted
Yorke Penterconnecti
hosen, one id analysis.
Pa
ered both wthis deve
was includescored.
e all located
are shown
er mine
Eyre)
e)
rland)
by:
d ese network
er than thed generatio
ninsula, dueon constrai
in each geo
age | 101
with and lopment
ed as a
d on the
n in the
ks.
e Yorke on under
e to low nts.
ographic

The foll
SensitivPeninsu
B4.6 L
B4.6.1
The suPeninsuaccess small cr
Port Lin(33 kV) parcel o
It is enjurisdictfacilitiesEnvironnature.
B4.6.2
The subPeninsuaccess with cro
Dalrympinfrastruland to
It is enjurisdictfacilitiesvegetatVegetatvegetatlow but
B4.6.3
The subis appr
owing sites
Eyre PeninYorke PeniRiverland –
vity analysisula, Yorke P
Locality Fac
Port Linc
ubstation isula. Port Linfrom Flinde
ropping act
ncoln Termi infrastructuof land to th
nvisaged ttion either s on Electrnmental and
Dalrymp
bstation is ula. Stansbfrom St Vin
opping and
ple Substatucture. Electhe north a
nvisaged ttion either s on Electration presention Counction is to bewould requ
Monash Su
bstation is lroximately 2
s were chos
sula - Port nsula – Da
– Monash s
s of the weigPeninsula a
ctors for Sh
oln Termin
located ancoln is apers Highwayivities.
inal Substature. Electrahe north and
hat develoState Deve
raNet land d cultural h
le Substati
located appbury is apprncent Highwgrazing act
tion site hactraNet ownnd south of
hat develoState Deve
aNet land bnt on Electcil and Dee removed uire some d
ubstation
ocated app240 km fro
sen as being
Lincoln Terlrymple sububstation.
ghting and and in the R
hort-Listed
nal Substat
pproximateproximatelyy with land
tion site hasNet owns th
d east of the
opment appelopment Abut outsid
heritage ris
ion
proximatelyroximately 2way with laivities.
as both Elens the landf the substa
opment appelopment Abut outside raNet land
epartment ofor construue diligence
proximately om Adelaid
g the highes
rminal substbstation; and
scoring indRiverland co
d Sites
tion
ely 7 km ny 645 km fruse near th
s both Eleche land whee substation
proval wouAssessmentde the Portsks are rela
y 7 km sout200 km fro
and use nea
ectraNet (13d where it htion (40 Ha
proval wouAssessmentthe Dalrym that will rof Natural uction purpoe assessme
4 km northde by road.
st ranked in
tation; d
icated that tnsistently p
orth-west orom Adelaidhe substatio
ctraNet (132ere it has Hn (10 Ha plu
uld be requt Commisst Lincoln Tatively low
th-west of Som Adelaidear the subst
32 kV) and has HV ass plus).
uld be requt Commiss
mple substatrequire perEnvironme
ose. Culturaent.
of Berri To. The site
n each area
the identifieresented as
of City Porde by road. n consisting
2 kV) and SV asset and
us).
uired from ion or locaerminal sudue to the
Stansbury Te by road. tation consi
SA Powerset and also
uired from ion or location boundarmission froent and Real heritage
ownship in thas good
Pa
:
ed sites on ts being top
rt Lincoln oThe site h
g of rural liv
SA Power Nd also a sub
relevant pal councils bstation boe current la
Township oThe site haisting of rur
r Networks o a large p
relevant pal councils ary. There iom the SAesources irisks are r
the Riverlanaccess fro
age | 102
the Eyre ranked.
on Eyre as good ving with
Networks bstantial
planning for any
oundary. and use
on Yorke as good ral living
(33 kV) parcel of
planning for any
is native A Native f native
relatively
nd. Berri om Sturt

Highwaactivitie
Monashthe landvicinity.with Vic
There isESCRI-planninany facvegetatVegetatvegetatlow but
B4.7 C
The quvaluable
The follreceive
Note: Inlisted aconclusof energancillarybeen inforward
It is wothat netforecasproceed
This ESsite selselectio
ay with landes.
h Substatiod where it The Subs
ctoria. The M
s some land-SA. It is eg jurisdictioilities on Eletion presention Counction is to bewould requ
Conclusion
antification e:
Market TraMLF impacNetwork AuExpected ULocal gene
lowing bened limited att
Localised fGrid suppoAvoided wiRide-throug
n the originaas distinct sion that thigy trading by services
ncluded in td, especially
orth noting ttwork deferr
sts, these dds in substa
SCRI-SA Prlections weon is docum
d use near
n site has has HV as
station is alMurraylink C
d available envisaged on either StaectraNet lan
nt on Electcil and Dee removed uire some d
for Short-
of the ben
ding Revenct (subject tougmentationUnserved Eerator constr
efits were fotention duri
requency sort cost redund farm FCgh assistan
al site selecfrom the e
is potential benefit. Alssupport (FCthe busines
y in South A
that at the tral benefits deferral beantial form.
roject had tere further pmented in the
the substat
ElectraNet ssets and dso the conConverter S
within Electhat develoate Developnd but outsiraNet land
epartment ofor construue diligence
Listed Site
efit classes
nue; o optimal ESn Capital Denergy (USEraint reduct
ound to be ong detailed
upport; uction; CAS obligati
ce.
ction report energy tradInterconneo, althoughCAS) to hass case an
Australia.
time of the were availa
enefits may
taken on anprogressed e body of th
tion consist
(132 kV andoes not ownnection poStation is ad
ctraNet subsopment apppment Asseide the Mon that will rof Natural uction purpoe assessme
es
s identified
SD sizing);eferral (whe
E) reductiontion.
of low value investigatio
on; and
the “Intercoding benef
ector constrah historic mave a very lnalysis as it
original ARable on the y only be a
n iterative f when prep
his report.
ting of crop
nd 66 kV) inwn any addint for the
djacent to th
station site proval wouessment Conash substarequire perEnvironme
ose. Culturaent.
the followin
ere relevantn; and
e in the curon:
onnector coit. Further aint reductiarket informow value, at is expecte
RENA propoYorke Pen
available if
form. The rparing the
pping and a
nfrastructureditional landDC Murray
he Monash
which couldld be requ
ommission oation boundarmission froent and Real heritage
ng benefits
t);
rent regulat
nstraint redinvestigatioon benefit
mation has ancillary seed to increa
osal there winsula. Withf the propo
esult was tbusiness c
Pa
agricultural
e. ElectraNd in the suylink IntercoSubstation.
d be utiliseduired from or local couary. There om the SAesources irisks are r
as being t
tory framew
duction” benon has ledis capturedshown that
ervices suppase in valu
was an exph the latest osed Hillsid
that the shocase. The f
age | 103
industry
et owns ubstation onnector .
d for the relevant
uncils for is native
A Native f native
relatively
he most
work and
nefit was d to the d as part t system port has
ue going
pectation demand de mine
ort listed final site

Appe
The Mitechnol(CAES)StorageSupercocurrent storage
It is recpower technolbased o& Clark
Figure
The apstorageare in lead-acand fue
The setechnollonger. self-disc
ndix C SS
lestone 3 dogies nam), Battery Ee (VRB, Znonducting research a
e technologi
cognised thasystem apogies. Figon their typ
ke, 2015).
C1: Compar
pplication ofe system. Ty
the order cid, Li-ion anel cells mayb
lf-dischargeogy. Energy
Table C1charge and
SummarySystems
document, ely Flywhe
Energy StornBr and HyMagnetic and develoes were dis
at a single epplications ure D1 illusical power
rison of powe
f energy stypical dischof millisec
nd ZnBr sysbe longer th
e rate detey storage te
1 summaris suitable sto
y of Mi
[13], provideel Energy rage (lead ydrogen fueEnergy Stopment focu
scussed.
energy stordue to the
strates the ratings and
er rating and
torage depharge times conds throustems are uhan 10 hour
rmines theechnologiesses the eorage durat
lestone
des a detaStorage (Facid, Li-ionel cells) (Forage, (SMusses; perfo
rage technoe inherent placements
d rated ener
d rated energ
pends on that rated po
ugh to minup to ~10 hrs, from (Lu
e maximum s with smallnergy stortions.
3 Repo
iled overvieFES), Comn and NaS)FBES), capMES). The ormance a
ology cannocharacteris
s of variousrgy capaciti
gy capacities
he typical dower of FESnutes, overhours and u
o, Wang, D
suitable ster rate of se
rage techn
ort – En
ew of variompressed A) (BES), Floacitors, suptechnologi
nd cost cha
ot meet the stics of thes energy stoes, from (L
of various st
discharge tS, super-capr ground snderground
Dooner, & C
torage duraelf-dischargologies ba
Pa
nergy St
ous energy Air Energy ow Batteryper-capacitical progrearacteristics
requiremene existing orage technuo, Wang,
torage techn
time of thepacitors and
small scale d large scal
Clarke, 2015
ation for a ge can be stased on th
age | 104
torage
storage Storage Energy
tors and ess with s of the
nts of all storage
nologies Dooner,
nologies
energy d SMES
CAES, e CAES
5).
specific tored for he daily

Da
M
Tabl
The sizsystemcited froconsumdensitietechnollower thLi-ion s
Figu
aily Self Disc
Small
Medium (up to
High
e C1 - Summ
ze of the sto. Figure C2om (Luo, W
ming technoes are neaogies are ahan those oystems.
ure C2 - Com
charge
o 5 %)
mary of energdura
orage device compares
Wang, Dooneologies (i.e.ar the bottoat the top riof BES sys
mparison of e
Suitabl
(ho
M(m
(m
gy storage teation (Luo, W
e is anothethe energy er, & Clarke PHS, largom left coright hand cstems. In B
nergy and po
le Storage D
Long – termours to mont
Medium – terminutes to da
Short – terminutes to hou
echnologies Wang, Doone
er important and power
e, 2015)). Ae-scale CArner of thecorner. The BES, densit
ower densitie
Duration
m ths)
rm ys)
m urs)
based on dar & Clarke, 2
factor in der densities oAs shown inAES) whiche diagram
densities oies of lead
es of various
Energy Sto
(BE
C
Sup
aily self-disch2015)
etermining aof various ten Figure C2
have low whereas th
of FBES syacid syste
s energy stor
Pa
orage Techn
PHS
CAES
NaS
FBES
ES) Lead acid
Li ion
FES
Capacitors
percapacitors
SMES
harge and sto
a choice of echnologies2, the largeenergy and
he highly cystems are ems are low
rage technolo
age | 105
nologies
d
s
orage
storage s (values e volume d power compact typically
wer than
ogies

The eneefficiencdischarused in
The rourange othan ~8comparhigher Hydrogstill a dimproveof CAE(Luo, W
Two moof usef2015):
ergy lossescy, which is
rged. This f the cycling
undtrip efficof roundtrip85 %). In rison with lein BES sysen fuel celldeveloping ed with the S has impro
Wang, Doon
F
ore importaul cycles. T
Electrical eare able toto be replacMechanica10,000 cha
s that an eles defined byfigure will v
g.
ciency rangep efficiencieBES syste
ead-acid (ustems (leadls). Hydrogetechnologyprogress ofoved from 4er, & Clarke
Figure C3 ‐ Com
ant characteThese are
energy stora experienceced. l energy sto
arge and dis
ectrical story the powevary accord
es of energyes of FES, ems, Li-ion p to 90 %).d acid, Li ioen fuel cellsy. In generaf research a42 % (in 19e, 2015).
mparison of rou
eristics of ensummarise
age systeme a large nu
orage systescharge cyc
rage deviceer loss expeding to the
y storage tesupercapachas a hig
. The top raon and Nas have rela
ral, the efficand develop978), ~54 %
und trip efficien
nergy storaed as follow
s – capacitumber of cy
ems – CAEcles before e
e will experierienced wh
depth of d
echnologiescitors and
gher efficienange of rou
aS) comparatively low rciencies of pment effort
% (in 1991)
cies of various
age technolows, from (Lu
tors, supercycles (> 20,
S and FESequipment
ence depenhen the devischarge a
s are shownSMES are ncy reachinund trip efficed to FBESround trip e
the technots (i.e. the rand 70 % (
energy storage
ogies are lifuo, Wang,
capacitors a,000) before
are able toneed to be
Pa
nd on the rvice is chargnd state of
n in Figure very high
ng up to 9ciencies is S (VRB, Zn
efficiencies wologies havround trip e(for project
e technologies
fetime and Dooner, &
and SMES e equipmen
o experiencreplaced.
age | 106
oundtrip ged and f charge
C3. The (greater
97 % in typically nBr and which is ve been fficiency ADELE)
number Clarke,
typically nt needs
ce about

Lifetimestoragecosts d
Figuresand opthese atechnol
Chemical eafter a reldeterioratiotechnologieof Li ion (10
e and cyclie system. Sue to maint
s C4 and Cperation andare subject ogies.
energy storatively low
on with accues are typic000 – 20,00
ng time haSystems witenance and
C5 compared maintenato change
rage systemw number oumulated oally less tha
00), VRB (1
ave an impth low lifetid replaceme
the energyance costs as resear
Figure C4 ‐ Com
ms – BES aof charge perating timan 5000 wit2,000 +) an
pact on theime and cyent of equip
y and powerespectivel
rch and dev
mparison of ene
and FBES and discha
me. The numth the excend Hydroge
e overall inycling timespment.
er capital cly uncoverevelopment
ergy and power
typically nearge cyclesmber of useption of repn fuel cells
nvestment cs increase
osts and ened by the is carried o
r capital costs
Pa
eed to be rs due to ceful cycles ported cyclin(20,000 +).
cost of thethe overall
nergy capitliterature sout for the
age | 107
replaced chemical of these ng times
energy lifetime
tal costs search –
various

From recosts ascale, hand the
With retypicallymainten
Emissiotoxicity catastrosupercorelating
In concissues making intendeconcern
Fig
eference tond low powhigh power erefore mos
egard to capy have relanance costs
ons from cof chemica
ophic failureonducting m to environm
clusion thereto consider factors for
ed applications.
gure C5 ‐ Comp
Figure C4wer costs, m
applicationt economica
pital and opatively lows as shown
ombustion als in battee of equipmmagnetic ement, health
e are many r when detchoosing a
ons of stor
arison of energ
, supercapamaking these
s. PHS andal in large s
peration anto moder
in Figure C
of natural ery and flowment in flywnergy storah and safety
technical atermining a a suitable strage, the si
gy capital costs
acitors, FESe technologd large scalscale applic
d maintenarate capital
C5 for lead a
gas in comw battery e
wheel energage systemy.
and econom suitable sttorage techize of the
and annual ope
S and SMEgies more ee CAES ha
cations.
ance costs, energy co
acid, VRB a
mpressed aenergy systgy systems ms are som
mical charactorage syst
hnology will network, lo
eration and ma
ES have relaeconomical tave relativel
BES and Fosts but hnd NaS tec
air energy tems, contaand strong
me of the i
cteristics andtem. Overabe differen
ocation and
Pa
aintenance cost
atively highto be used ly low energ
FBES technhigh operatchnologies.
storage, fiainment in g magnetic identified c
d health anall the key dnt depending health and
age | 108
ts
h energy in small
gy costs
nologies ion and
res and case of fields in
concerns
nd safety decision g on the d safety

Appe
Table Dfinal poARENAremove
Suppl
Short
Not sho
ABB
Abengo
Alstom
Ambri
AmericaVanadiu
Aquion
Bosch
BYD
CPP
CORVUS
Dynapo
Dresser
ndix D L
D1 below shosition at thA Milestone ed for this pu
ier
sure
tlisted
ortlisted
oa
an um
Yesof o
Yesof o
S
ower
r‐Rand
List of RF
hows the enhe end of th
4 report bublic report
Final ubmission eceived?
Yes
Yes
Yes
No
No
No
s in support other bid(s)
s in support other bid(s)
Yes
No
No
No
FI Respo
ntities that whe completut because.
Energy storage
technolog
Commercial confidence
Commercial confidence
Commercial confidence
Commercial confidence
Commercial confidence
Commercial confidence
Commercial confidence
Commercial confidence
Commercial confidence
ondents
were invitedted processe of the con
gy
Finsubmisevalua
sco
(/5
in e
Commeconfid
in e
Commeconfid
in e
Commeconfid
in e
Commeconfid
in e
Commeconfid
in e
Commeconfid
in e
Commeconfid
in e
Commeconfid
in e
Commeconfid
& Result
d to take pas. Columnsnfidential na
nal ssion ation
ore
5)
Gen
rcial in ence
Comrcial in ence rcial in ence rcial in ence
rcial in ence
rcial in ence
. rcial in ence rcial in ence
.
rcial in ence
ts
art in the ESs 3-5 were ature of the
neral comm
mmercial in co
Pa
SCRI RFI a completed
e results hav
ments
onfidence
age | 109
and their d for the ve been

Suppl
Short
Not sho
Eaton
Eccoult
Emerso
Energen
Enervau
EOS
FIAMM
GE Storage
GCX Storage
Halotec
HCB STechno
Ingetea
JohnsonControl
LECLAN
LG Chem
MitsubiHeavy Industri
NEC
ier
sure
tlisted
ortlisted
on
n
ult
Yesof o
Energy e
Energy e
chnics Yesof o
Standby logies
m Yesof o
n s
CHE
m Yesof o
ishi
ies
Final ubmission eceived?
No
No
No
Yes
No
s in support other bid(s)
No
No
No
s in support other bid(s)
No
s in support other bid(s)
No
Yes
s in support other bid(s)
Yes
Yes
Energy storage
technolog
Commercial confidence
Commercial confidence
Commercial confidence
gy
Finsubmisevalua
sco
(/5
in e
Commeconfid
in e
Commeconfid
in e
Commeconfid
nal ssion ation
ore
5)
Gen
rcial in ence
rcial in ence
rcial in ence
neral comm
Pa
ments
age | 110

Suppl
Short
Not sho
NGK
Parker Hannafi
Panason
Primus
Redflow
S&C
Saft
Samsun
Schneid
Siemen
SMA
Solar Re
SumitomElectric
ier
sure
tlisted
ortlisted
Yesof o
in Yesof o
nic
Power
w Yesof o
Yesof o
ng SDI Yesof o
der
s
eserve
mo Yesof o
Final ubmission eceived?
s in support other bid(s)
s in support other bid(s)
Yes
Yes
s in support other bid(s)
Yes
s in support other bid(s)
s in support other bid(s)
Yes
Yes
No
No
s in support other bid(s)
Energy storage
technolog
Commercial confidence
Commercial confidence
Commercial confidence
Commercial confidence
Commercial confidence
Commercial confidence
Commercial confidence
Commercial confidence
Commercial confidence
Commercial confidence
gy
Finsubmisevalua
sco
(/5
in e
Commeconfid
in e
Commeconfid
in e
Commeconfid
in e
Commeconfid
in e
Commeconfid
in e
Commeconfid
in e
Commeconfid
in e
Commeconfid
in e
Commeconfid
in e
Commeconfid
Commeconfid
nal ssion ation
ore
5)
Gen
rcial in ence
rcial in ence rcial in ence rcial in ence rcial in ence rcial in ence
rcial in ence
ercial in ence rcial in ence rcial in ence
rcial in ence
neral comm
Pa
ments
age | 111

Suppl
Short
Not sho
Tesla
Toshiba
Tranter
TSK
UET Techno
ViZn
WS TEC
Younico
ZBB Ene
ier
sure
tlisted
ortlisted
a
r
Yesof o
logies Yesof o
CH
os
ergy
Final ubmission eceived?
Yes
Yes
Yes
s in support other bid(s)
s in support other bid(s)
No
Yes
No
No
T
Energy storage
technolog
Commercial confidence
Commercial confidence
Commercial confidence
Commercial confidence
Table D1 – List
gy
Finsubmisevalua
sco
(/5
in e
Commeconfid
in e
Commeconfid
in e
Commeconfid
in e
of RFI Respond
nal ssion ation
ore
5)
Gen
rcial in ence
ercial in ence
rcial in ence
dents and result
neral comm
ts
Pa
ments
age | 112

AppIMPLEME
Weightin
ABB ‐ Optio
ABB ‐Optio
ABB‐ Optio
Abengoa ‐
Abengoa ‐
Alstom ‐Op
Alstom ‐ Op
Asltom‐Op
Bosch
CPP Centu
Energen
Lechanche
MHI
S&C Electr
S&C Electr
S&C Electr
S&C Electr
S&C Electr
S&C Electr
Schneider‐
Schneider
Schneider
Schneider
Siemens
Tesla
Toshiba
Tranter UET
WS Tech (H
ZBB Energy
pendix E ENTATION OF A UTILIT
ng Factor (total 100%
on 1
on 2
on 3
Option 1
Option 2
ption 1
ption 2
ption 3
ry
e
ics ‐ Option 1
ics‐ Option 2
ics ‐Option 3
ics ‐ Option 4
ics ‐ Option 5
ics ‐ Option 6
‐ Option 1
‐Option 2
‐Option 3
‐ Option 4
T
Helios)
ySCORING
Raw RFTY SCALE ENERGY S
Description
Clause Reference
%) 100.0%
MUST meet thres
SCORE
5
4
3
2
1
FI EvaluaTORAGE DEVICE IN S
Operating Plant Size
TechComExpe
Spec cl 2.4 Spe
Threshold 1
sholds and achieve
> 3
> 2
> 1
< 1
No
ation SheSOUTH AUSTRALIA
hnology mercial
erience
SignEnvironsocial o
impa
ec cl 2.2 Spec
0.0% Thre
>3.5 to be considere
3 years
2 years
1 year
1 year
o data
eet
ificant nmental, or safety acts?
Overall E
cf 7.1Spec cl 5
cl 4.attach
eshold 20
ed for Shortlist
>8
>8
>
>7
<7
Te
EfficiencyComplia
CodeStand
5.4.1, Invite .1.5 & hment 3
Spec cl 4in
0.0% 5.0
85% Meet
80% Meets
>75 Meets
70% Meets
70% Mini
echnical
nce with es & dards
Ability tofunctional
& operaexpecta
4.1 to 4.4 cl
Spec cl 2.45.3
0% Thresh
ts All
s <75%
< 50%
< 25 %
imal
o meet l control ational ations
ExperiencAust /eq
utilitie
4.9, 5.1 & 3
Spec cl 4.2
hold 5.0%
40.0%
Less than 5 y
Aust
Between 5‐1
in Aust or ove
utility
> 10 years ag
utility
Minimal
None
ce w ith quiv es
Operationproviding s
servic
2 & 4.3
Spec cl
% 5.0%
%
years In > 3 yea
0 years
erseas > 2 yea
go in o/s > 1 ye
< 1 ye
No dat
nal and similar
ces
TechnolMaturi
2.2 Spec cl
% 5.0%
arsExists for mo
5 years on a
commercial s
ars
Exists for 5 ye
but difficult t
deploy on uti
scale
ar
Being w idelydeployed nowonly used at commercial sfor less thanyears
ar
2-5 years existence, lousage, OperPilot
taNew technoNo Pilot
Maturity of Te
ogy ity
Certaintytechnolo
improvembased on ev
2.2New (implie
forw ard costreques
3.0%
13%
re than
scale
High level of
confidence
ears
to
ility Med‐ high conf
y w - but
scale n 3
Medium level
confidence
ow rational
Med-Low con
logy -Low confiden
chnology
y of ogy
ments vidence
Net Present
per MWh
ed by t curve
stInvite
30.0%
Lowest
fidence
of
nfidence
nce Highest
cost
h
Cost reductio
potential in fut
Invite cl 4.1.
5.0%
35%
Greatest
Least
Financial
on
ture
Position in Indu
Technical capab
delivery ris
5 Invite cl 4.1.4.
5.0%
Indudtry Leader
substantial and
consistent track
record; compani
have successfull
worked together
before
New entrant;
companies have
worked together
before
stry &
bility ‐
sk
Financial capa
business r
b & e Invite cl 4.
Thresho
with
k
ies
ly
r
e not
r
ability ‐
risk
Knowledge
under A
Agreem
1.1c Invite 4
old Thresh
Capability
e sharing
ARENA
ment
Track reco
delivery of
servic
.1.6 f Invite cl 4
hold 5.0%
10%
More than 2
successfully
completed
at least one
successfully
completed
similar in pr
related in p
Nil
ord on
f similar
ce
Alignment
contractin
delivery expe
4.1.6 Invite & Spec
% Thresho
%
2 similar
y
e
y
rogress
rogress
t with
ng and
ectations
Warranty
Guarant
(various) Spec 5
old Thresho
Commerc
Pag
y and
tees
Value for M
Service relatio
support fut
growth
5.4Invite cl 4.1.6
g
old 2.0%
Compelling
undertakings
Not addresse
cial
ge | 113
oney,
onship,
ture
h
6 d, e &
d

10
0. AANNEXXURES
Pagee | 114

ESCRI-SA
Energy Storage for Commercial Renewable Integration
South Australia
An Emerging Renewables “Measure” project with the Australian Renewable Energy Agency
Milestone 1
November 2014
Regulatory overview

Confidentiality
This document has been prepared for the sole purpose of documenting the Regulatory
Review milestone 1 deliverable associated with the Energy Storage for Commercial
Renewable Integration project for South Australia by AGL, Electranet and WorleyParsons, as
part of an Emerging Renewables project with the Australian Renewable Energy Agency
(ARENA).
It is expected that this document and its contents, including work scope, methodology and
any commercial terms will be treated in accordance with the Funding Agreement between
ARENA and AGL.
MILESTONE 1 REPORT: ESCRI-SA PHASE 1 – REGULATORY OVERVIEW
REV DESCRIPTION WORLEYPARSONS
REVIEWER
ELECTRANET
REVIEWER
AGL
REVIEWER
FINAL APPROVAL
DATE
0 Issued to ARENA
P. Ebert S. Abbleby B. Bennet

Table of Contents
1. Background to regulatory overview and executive summary ................................................ 5
1.1. Background ............................................................................................................................... 5
1.2. Summary overview ................................................................................................................... 5
2. Overarching regulatory framework ............................................................................................ 7
3. The status of energy storage in the Rules ....................................................................................... 8
3.1. Registration considerations ........................................................................................................ 8
3.1.1. Generator registration ............................................................................................................ 8
3.1.2. Market vs Non-market ............................................................................................................ 9
3.1.3. Scheduled vs Semi-Scheduled vs Non-scheduled ................................................................. 10
3.1.4. Exemptions and options not requiring registration .............................................................. 12
3.1.5. Registration decision matrix ................................................................................................. 13
3.2. Connection considerations and technical performance standards .......................................... 15
3.3. Transmission service charges .................................................................................................... 15
3.4. Jurisdictional licensing obligations ............................................................................................ 17
Local licensing obligations differ between jurisdictions. For example: ....................................... 17
4. Ancillary services which the ESD could potentially provide, and provision for accessing
associated revenue ............................................................................................................................... 18
5. The role of the RIT-T in procurement as a prescribed service ...................................................... 23
6. Asset ownership options ............................................................................................................... 25
6.1. General ...................................................................................................................................... 25
6.2. Ownership by network service provider ................................................................................... 25
7. Commercial frameworks under various ownership models ......................................................... 27
8. Summary of issues to be resolved and recommendations ........................................................... 29
Appendices
APPENDIX 1. Diagrammatic of connection options
APPENDIX 2. Examples of generator classification and exemption categories

Acronyms
AEMC Australian Energy Market Commission
AEMO Australian Energy Market Operator
AER Australian Energy Regulator
ARENA Australian Renewable Energy Agency
ASRR Annual Service Revenue Requirements
ESD Energy Storage Device
FCAS Frequency Control Ancillary Services
NEM National Electricity Market
MLF Marginal Loss Factor
NEB Net Energy Balance
NLAS Network Loading Control
NSCAS Network Support and Control Ancillary Services
SRAS System Restart Ancillary Services
TUOS Transmission Use of System
TOSAS Transient and Oscillatory Stability Ancillary Service
VCAS Voltage Control Ancillary Services

5 | P a g e
1. Background to regulatory overview and executive
summary
1.1. Background
The ESCRI-SA project contemplates the trial of a 1-30 MWpk non-hydro energy storage
device (ESD) within the South Australian National Electricity Market (NEM) Region (the
Project). This Project is being funded by the Australian Renewable Energy Agency
(ARENA) under the Emerging Renewables – Measures Program.
The ESD may potentially act as both a consumer and producer of electricity (presenting an
energy arbitrage opportunity), a provider of system ancillary services (whether market or
non-market services), and/or a provider of network support services. To aid commerciality,
the Project is attempting to maximise the value of the ESD by potentially accessing each of
these revenue streams in combination.
As part of the Milestone 1 deliverables under the ARENA Funding Agreement, a review of
the regulatory environment under which such an asset could be operated within the NEM is
required, which this Report provides.
1.2. Summary overview
The ESD would be subject to the National Electricity Law and the National Electricity Rules,
which prescribe how the device would operate and interact with the market and the network
to which it is connected. However, within this governing construct, this regulatory review
reveals that there are a number of choices to be made regarding ownership and registration.
Although there are some regulatory prescriptions which are relevant to determination of a
preferred registration and ownership model such as:
potential limitations on the ability of a transmission network operator (TNSP) to
receive revenue from energy sales;
the interaction between generator / customer classification and liability for
transmission use of system charges; and
capability or otherwise for the ESD to respond to dispatch instructions, which in turn
influences whether and how it might participate in the energy and ancillary service
spot markets operated by the Australian Energy Market Operator (AEMO),
this paper demonstrates that the final decision is likely to be influenced as much by the
governing regulatory regime as by:
the selected technological solution and preferred project location;
the materiality of expected returns from each potential revenue stream (energy
arbitrage, network support / deferred spend, ancillary service markets);
the associated costs of participation, registration, connection and use of system
charges; and, critically
identified need.

6 | P a g e
Furthermore, although it might theoretically be possible from a regulatory perspective to
establish the ESD in such a way as to allow it to access revenue from all of energy arbitrage,
ancillary service markets and network support, technical limitations in the ESD are likely to
prevent it undertaking all of these activities concurrently. The priority given to these services
is then likely to be influenced both by where the greatest value lies and any contractual
commitments made.
In light of the wide range of Project structuring options, this is expected to be an iterative
process with a preferred model not likely to be identified until the Project is further
progressed. At this stage, therefore, the regulatory review provides a reasonably high-level
overview commensurate with this degree of uncertainty. The range of regulatory issues for
further investigation or clarification that are identified throughout the report are summarised
in section 8. Additional regulatory ambiguities or obstacles may emerge once the preferred
ownership and operating model, together with the technical characteristics, have been
settled-upon and even when the practical steps for implementation begin.
Milestone 1 requires the following key outputs with respect to the regulatory and commercial
framework (per Sch. 2, Item 2(d) Emerging Renewables Program Funding Agreement):
1. Definition of energy storage within the rules - an overview of the regulatory
environment as it relates to the subject of the Measure (refer sections 2 and 3);
2. The range of ancillary services which the ESD the subject of the Measure could
provide, including the provision for accessing such revenue (refer section 4);
3. The application of the regulatory investment test for network asset investment in
accordance with the requirements of the National Electricity Rules (refer section 5);
4. Asset ownership - who can own the ESD and what, if any, restrictions might apply to
its operations (refer section 6); and
5. The most effective commercial framework for operation amongst identified
stakeholders/commercial entities (refer section 7).
In each case, a summary of relevant considerations and any potential regulatory obstacles
or grey areas are identified.

7 | P a g e
2. Overarching regulatory framework
The NEM operates under a complex legal and regulatory framework established by the
National Electricity Law (the Law) and a suite of subordinate rules and regulations, most
notably the National Electricity Rules (the Rules). The Law is contained in a schedule to the
National Electricity (South Australia) Act 1996 and is mirrored in identical State laws of
participating jurisdictions. These jurisdictions – New South Wales, the Australian Capital
Territory, Queensland, South Australia, Victoria and Tasmania – together comprise the
NEM.
Synopsis of Law and Rules
Law Sets out the national electricity objective.
Makes high-level provision for participation in the market by generators, customers
and network operators.
Establishes the governance framework for the market, including:
- conferring ongoing rule making and market development functions on the
Australian Energy Market Commission (AEMC), and enforcement and
economic regulatory functions on the Australian Energy Regulator (AER);
and
- reserving policy oversight to Ministerial representatives of each
participating Sate and Territory.
Provides for the operation of the market by the Australian Energy Market Operator
(AEMO).
Provides a framework for access to distribution and transmission networks by
prospective users.
Prescribes the high-level content of the Rules.
Rules Sets out detailed rules for (amongst others):
- participant registration;
- market operation;
- power system security;
- network connection;
- economic regulation of distribution services and transmission services; and
- metering.
There are also jurisdictional electrical safety and licensing laws that apply.

8 | P a g e
3. The status of energy storage in the Rules
3.1. Registration considerations
Registration is a prerequisite for participation in the NEM. Existing participant categories
include generator, small generation aggregator, customer, network service provider, re-
allocator and trader. Chapter 2 of the Rules contains the registration requirements and
eligibility criteria for each NEM participant category. These are also summarised in AEMO’s
publication ‘Participant categories in the National Electricity Market.’1
‘Energy storage device’ is not currently a category of participant contemplated under the Law
or Rules. This is largely as expected since the Law and Rules focus primarily on the
function or role that a participant is performing, rather than the particular technology
underpinning this performance. Thus, if viewed from a functional perspective, the ESD could
register in the market as a generator and/or a customer, or be subsumed into the operations
of a network operator. Subject to the ring-fencing provisions applying to network service
providers (which are discussed in sections 5 and 6 below), a participant may register in more
than one capacity (Rules, r2.8.1). The closest existing example of an ESD participating in
the NEM is a pumped hydro system – the Snowy Hydro and Hydro Tasmania schemes
being perhaps the most well-known examples of systems which include pumping capability.
3.1.1. Generator registration
Any person who owns, controls, or operates a generating system connected to a
transmission or distribution network must register as a generator, except where they meet
the exemption criteria. Exemptions may apply for certain generating systems under 5 MW,
or under 30 MW with annual exports below 20 GWh. 2
When registering as a Generator with AEMO, a generating unit / generating system must be
classified as either:
- a Scheduled Generator or a Non-scheduled Generator; and either
- a Market Generator or a Non-market Generator.
The general rules of classification are stepped out below with an initial comment on
implications for the ESD, however AEMO has residual discretion to approve a particular
classification on such terms and conditions as it considers appropriate (e.g. for power
system security or other reasons). These classification options are relevant considerations
when determining ESD location, connection and ownership, rather than obstacles to the
deployment of the ESD.
Ultimately how the ESD is registered (or whether it is granted an exemption) will depend on
the technical specifications of the ESD and what the primary revenue stream / function is
intended to be, which will also direct where and how the ESD is connected into the electricity
system. Appendix 1 depicts diagrammatically four of the most likely connection options.
1 AEMO, ‘Participant categories in the National Electricity Market’, available at
http://www.aemo.com.au/About-the-Industry/Registration/Registration-Overview 2 http://www.aemo.com.au/About-the-Industry/Registration/Registration-Overview

9 | P a g e
This section 3.1 concludes with a summary decision matrix for the registration
decision.
The table in Appendix 2 provides further high level examples of generator classification and
exemption categories. AEMO also maintains a current list of NEM registrations and
exemptions.3
3.1.2. Market vs Non-market
A Market Generator must both sell its entire output into, and purchase its entire energy
consumption from, the NEM gross pool (Rules, r 2.2.4).
Implication for ESD:
If registered as a Market Generator, the ESD would be able to discharge at times of
high pool prices, and to recharge at times of low pool prices. This may be the most
obvious means for realising arbitraged energy value, one of the Measure’s
objectives. However, it should be recognised that this mode of energy arbitrage will
be most valuable in a volatile market environment (characterised by frequent swings
between very high and very low prices). The NEM is currently substantially
oversupplied so that these kind of price events are becoming less frequent. Further,
each participant which enters the market with the purpose of capturing this value will,
by doing so, cause a marginal diminution of background volatility making the value
proposition for the next entrant harder to establish.
Market registration also provides a pathway to accessing the AEMO-operated
markets for ancillary services (discussed in section 4.1 below).
Classification of a connection point as a market load or market generating unit
connection point impacts upon a number of ancillary issues, including:
prudential requirements: as these relate to a market participant’s net position,
and generation will offset market load at the connection point;
participant fees: market generators are generally levied more heavily than
non-market generators;4
ancillary service payments: since Regulating Frequency Control Ancillary
Services (Regulating FCAS) (refer section 4.1 below) is funded solely by
market generators and market loads, in accordance with Causer Pays
principles;5 and
Transmission Use of System Charges (TUOS): these are not generally
payable by market generators and examples exist of market generators
drawing significant standing loads from the transmission network when not
3 http://www.aemo.com.au/About-the-Industry/Registration/Current-Registration-and-Exemption-
lists?sc_camp=F7B215EEDF054086B8696B5CB2A56AA0&ec_as=0E7A32FC32214F28B88EE8F79F016F3D 4 AEMO, Determination and Report – Structure of Participant Fees in the NEM, March 2011, available from
http://www.aemo.com.au/About-AEMO/Corporate-Publications/Energy-Market-Budget-and-Fees/Structure-of-Participant-Fees-in-the-National-Electricity-Market-July-to-June 5 Australian Energy Market Operator, Causer Pays: Procedure for Determining Contribution Factors (Causer
Pays Procedures), document No: 160-0379, 15 December 2013

10 | P a g e
generating which are settled directly from the pool and do not incur prescribed
network charges. TUOS is discussed in greater detail in section 3.3 below.6
A Non-market Generator must, under normal conditions, sell its entire output to the Local
Retailer (requiring the system to be connected within the local area of that Local Retailer) or
another customer at the connection point (requiring the load and generating unit to
effectively be net metered) (r 2.2.5).7
Implication for ESD:
If the owner of the ESD was associated with the Local Retailer, arbitraged energy
value could be realised by the avoided cost of purchasing energy to satisfy its retail
load on market at times of high prices. Where the project proponent is not associated
with the Local Retailer, it would be necessary to negotiate an off-market arrangement
with the Local Retailer to realise this value thereby encountering transaction costs
that do not arise with direct market access.
Alternatively, the ESD could enter an off-market agreement to sell all output directly
to a large customer at the connection point. Depending on the customer’s existing
electricity purchasing arrangements, this may be another avenue for realising
arbitraged energy value. It is also an option which minimises transmission losses on
ESD output.
If the ESD is registered as a Non-market Generator then it would need to make
separate arrangements for the electricity consumed by the facility – either by
registering as a Market Customer in respect of a market load and purchasing all
electricity directly from the NEM, or as a First- or Second-Tier Customer (Rules, r
2.3.1). As a Customer, the ESD will be liable for TUOS charges.
While the ESD would not be able to access the AEMO-run markets for ancillary
services, it would be able to enter bi-lateral arrangements with AEMO or the relevant
network operator for provision of non-market ancillary services (discussed further
below) (Rules, r2.2.6).
3.1.3. Scheduled vs Semi-Scheduled vs Non-scheduled
A Scheduled Generator must operate any scheduled generating unit in accordance with the
co-ordinated central dispatch process operated by AEMO. A generator with an aggregate
nameplate capacity of 30 MW or more is usually classified as scheduled if it has appropriate
equipment to participate in the central dispatch process managed by AEMO. (Rules, r2.2.2)
Implications for ESD:
The ESD seems unlikely to meet the capacity rating for prima facie scheduled
classification. If it did, a further consideration would be its communications / telemetry
capability.
6 AEMO registration guide
7 AEMO, NEM Generator Registration Guide, Appendix 4 – AEMO’s Policy on Registration as a Non-Market
Generator

11 | P a g e
However the ESD may choose scheduled registration in order to participate in the
ancillary service markets operated by AEMO under central despatch (discussed
further in section 4.1 below).
A generator with a nameplate rating <30 MW is usually classified as non-scheduled
provided:
1. the primary purpose for which the relevant generating unit operates is local use; or
2. the physical and technical attributes of the relevant generating unit are such that it is not
practicable for it to participate in central dispatch. (Rules, r 2.2.3)
Implications for ESD:
If the primary purpose of the ESD is local use (i.e. more than 50% of output sold to a
customer at the connection point or the Local Retailer8) then this seems to be the
most logical classification of the ESD and it provides relief from the requirement to
participate in central dispatch.
However, if market access is important for realising the arbitraged energy value of
the ESD, then it would need to attempt non-scheduled classification under the
second limb of the test – namely, that the characteristics of the ESD make it
unsuitable for central dispatch. According to the NEM Generator Registration Guide,
a generator is a good candidate for non-scheduled classification if:
the fuel or energy source for generation is dependent on some other industrial
process not related to electricity production; or
the generating unit is unable to vary output in response to a dispatch
instruction for some technical reason (other than fuel supply constraints).
This would be something to explore with AEMO once the technical and operational
parameters of the ESD are better known.
As a market, non-scheduled generator, the ESD could choose when to access the
market and so optimise energy arbitrage value, and would only rarely be constrained
off. However, it will always be a market price-taker.
While the ESD would not be able to access the AEMO-run markets for ancillary
services, it could potentially enter bi-lateral arrangements with AEMO or the relevant
network operator for provision of non-market ancillary services (discussed further
below) (Rules, r2.2.6).
A generator with a nameplate rating >30 MW will be classified as semi-scheduled where
the output of the generating unit is intermittent. Under the Rules, intermittent is defined as ‘a
generating unit whose output is not readily predictable, including, without limitation, solar
generators, wave turbine generators, wind turbine generators and hydro-generators without
any material storage capability’ (Chpt 10 NER).
Implications for ESD:
8 AEMO, NEM Generator Registration Guide, Appendix 2 – AEMO’s Policy on classification of Generation Units
as on-Scheduled generating Units

12 | P a g e
A wind farm is typically registered as a Semi-scheduled, Market Generator. If the
ESD were installed behind the meter at an existing connected wind farm, it may be
possible to treat it as part of the same generator and leverage the existing
registrations of the wind farm.
Under this arrangement, the ESD could assist to regulate the wind farm’s output and
reduce its required contribution to funding Regulating FCAS, which is allocated
according to ‘causer pays’ principles. However, without firm scheduling capability, it
seems unlikely to itself register as a provider of FCAS.
It also potentially allows the realisation of energy arbitrage value by the wind farm
directing its output to recharging the storage system during times of low market
prices, and discharging the battery during times of high market prices. However this
approach would lock the ESD into semi-scheduled operation which, under constraint
conditions, requires it to compete on price for dispatch (cf non-scheduled
classification).
As the capacity of the ESD increases in size and potentially even begins to approach
the installed capacity of the wind farm itself, then there may be a tipping point at
which AEMO would no longer consider the installation ‘intermittent’ and the option to
connect the system in this way and leverage existing registrations may not be
available. This would be a potential issue to explore with AEMO.
3.1.4. Exemptions and options not requiring registration
AEMO has the power to exempt a person from the requirement to register as a Generator,
subject to such conditions as it deems appropriate and where exemption would not be
inconsistent with the National Electricity Objective (Rule r2.2.1).
Generally, generating systems with a nameplate rating <5 MW benefit from a standing
exemption from registration, and a generating unit that has a nameplate rating <30 MW may
under exceptional circumstances also be exempted by AEMO if it exports less than 20 GWh
into the grid in a year or extenuating circumstances apply.9
Implications for ESD:
Persons who own an exempt generating system are not required to pay Participant
Fees and are not scheduled or settled in the market (unless they do so under the
small generator or intermediary exemptions discussed below). Consequently, nor can
they access the market as a provider of FCAS. However the exempt generator could
pursue local off-market sales of its output and provide non-market ancillary services
(e.g. NSCAS) via a bi-lateral agreement with a network service provider.
The small generator exemption and the intermediary exemption, discussed below,
may allow the generator to access the benefits of on-market participation via a third
party without itself going through the registration process.
9 AEMO, NEM Generator Registration Guide, Appendix 6 – Guideline on Exemption from Registration as a
Generator, accessible from http://www.aemo.com.au/About-the-Industry/Registration/How-to-Register/Application-Forms-and-Supporting-Documentation/NEM-Generator

13 | P a g e
Small generator exemption: The Small Generation Aggregator provisions are a
reasonably recent addition to the NER and allow a generating unit that is individually
exempt to be classified by a Market Small Generation Aggregator as a ‘small
generating unit’ (Rules r2.3A). This allows the output of the exempt generating unit to
be settled on market by the Small Generation Aggregator, who may manage the
supply of electricity from one or more small generating units.
Intermediary exemption: AEMO may exempt a person from registration as a
generator where an ‘intermediary’ is instead nominated to be registered in respect of
the generating unit (Rule r2.9.3). The intermediary must then satisfy all relevant
registration requirements and for the purposes of the Rules will be treated as the
owner of the generating unit(s). Where there are multiple parties involved in
ownership, control and operation of the generator, one of them can be appointed as
an intermediary and the others can apply for exemption.10
Depending on the characteristics of the ESD, there are various options under which
registration may not be required. For example:
Locating the ESD within the site of a large customer load (and not connecting it
directly to the network) would enable the sale of output directly to that customer. The
nature of the energy arbitrage value would then depend on that customer’s electricity
purchasing arrangements – e.g. whether they are a directly connected market
customer exposed to the NEM spot price, whether they purchase from a retailer
under a market pass-through pricing arrangement or under peak/off-peak or stepped
pricing arrangements etc. This arrangement may also reduce the TUOS charges
payable by that customer (as it reduces the electricity demand drawn from the
network). It essentially involves the establishment of a simple embedded network.
Locating the ESD within a transmission network service provider’s own substation
compound. Here the ESD would conceptually form part of the transmission system
infrastructure itself, rather than constituting a connection to it. Under this
arrangement, the primary purpose of the installed ESD would likely be the provision
of network support. As discussed in sections 5 and 6 below, the TNSP may be
restricted in the amount of revenue generated from the export of energy from the
ESD.
3.1.5. Registration decision matrix
The following provides a consolidated decision matrix under which the registration path of an
ESD can be evaluated according to the Rules.
10
NEM Generator Registration Guide

14 | P a g e

APPENDICES
3.2. Connection considerations and technical performance
standards
Connection application procedures are set out in Chapter 5 and 5A of the Rules.
Performance and technical connection standards are contained in the schedules to these
chapters. Schedule 5.2 sets out the conditions for connection of Generators, and schedule
5.3 sets out conditions for connection of Customers.
The connection application process will be influenced by whether the connection of the ESD
constitutes:
a connection of new generating plant (and / or new customer load);
the connection of an embedded generating unit under rule 5.3A (i.e. where the
generating unit is connected directly to a distribution network);
an alteration to an existing connected generating system connected to the
transmission network under rule 5.3.9 (e.g. if battery sited behind the meter at an
existing wind farm site, as per Option C in Appendix 1); or
an alteration to an existing connected load (e.g. if sited within an existing customer
site, as per Option B within Appendix 1).
These will in turn influence the applicable distribution or transmission network loss factor (or
‘marginal loss factor’ (MLF)), the former determined by the distribution network service
provider and the latter by AEMO under rule 3.6.2 by applying the Forward-Looking
Transmission Loss Factors: Calculation Methodology.11 These MLFs apply at a particular
connection point and are used to adjust prices paid and received at each location on the
transmission network to reflect the energy lost in transporting electricity from the Regional
Reference Node (where the Regional Reference Price is set by the NEM clearing engine),12
and thereby influences the arbitraged energy value that might be realised by the ESD.
Since mid-2011, the calculation methodology allows for AEMO to apply dual MLFs to
connection points classified as ‘Pump Storage Schemes’ (i.e. pumped hydro generating
units) and other transmission network connection points where the net energy balance
(NEB) (which considers the ratio of energy generated and consumed at a connection point)
is less than 30%. The inclusion of an ESD in this regime would be something to explore with
AEMO.
3.3. Transmission service charges
Part J, Chapter 6A of the Rules sets out the arrangements for pricing and charging of
prescribed transmission services. These arrangements require the maintenance of pricing
methodology guidelines by the AER and the maintenance of AER approved pricing
methodologies by each Transmission Network Service Provider (TNSP).
11
AEMO, Forward-Looking Transmission Loss Factors: Calculation Methodology, October 2014, available at http://www.aemo.com.au/Electricity/Market-Operations/Loss-Factors-and-Regional-Boundaries/Methodology-for-Calculating-ForwardLooking-Transmission-Loss-Factors 12
Ibid.

APPENDICES
ElectraNet’s pricing methodology,13 by way of example, describes the pricing and charging
arrangements for the provision of prescribed transmission services in the South Australian
region by ElectraNet and Murraylink and any other TNSP who provide prescribed
transmission services within the South Australian region. Consistent with the rules these
services include:
Shared transmission services provided to customers directly connected to the
transmission network and connected Network Service Providers (prescribed TUOS
services);
Connection services provided to connect the distribution network to the transmission
network (prescribed exit services);
Grandfathered connection services provided to Generators and customers directly
connected to the transmission network for connections that were in place or
committed to be in place on 9 February 2006 (prescribed entry services and
prescribed exit services); and
Services required under the Rules or in accordance with jurisdictional electricity
legislation that are necessary to ensure the integrity of the transmission network,
including the maintenance of power system security and assisting in the planning of
the power system (prescribed common transmission services).
Under the prevailing arrangements the annual service revenue requirements (ASRR) for
prescribed TUOS services and prescribed common services (for the purposes of this
section, together referred to as TUOS) are allocated to transmission network connection
points of Transmission Customers and network service providers only (Rules, r 6A.23.3(c)
and r 6A.23.3(f))). A transmission customer is defined to be a person who both engages in
the activity of purchasing electricity supplied through a transmission or distribution system to
a connection point and is registered or eligible to be registered by AEMO as a Customer, but
excludes a person who purchases electricity directly from the spot market without Customer
registration (Rules, Chpt 10). As such, these charges do not apply to market generator
connection points which (as detailed in section 3.1.2 above) are required to purchase directly
from the spot market but do not require Customer registration.
In South Australia where a market generator draws house loads from the transmission
network either via its entry point or a connection point in close proximity to its entry point
TUOS is not charged. Where the entry point and a related exit, such as a mine, are widely
geographically separated TUOS is charged to the exit point. This is understood to be
consistent with practice in other NEM regions.
Implications for ESD:
In order to avoid paying TUOS the ESD must not be registered or eligible for
registration as a Customer under Chapter 2 of the Rules. Under the existing regime,
the ESD can achieve this by registering as a market generator. However, where the
ESD is registered off-market or exempt then it would attract these charges. This is a
relevant factor when considering how to connect and register the ESD. It may be
worthwhile pursuing a change to the Rules which would always treat an ESD as
13
Available at: http://www.electranet.com.au/assets/Uploads/Appendix-AA-Proposed-Pricing-Methodology.pdf

APPENDICES
exempt from TUOS, or otherwise seeking clarification of their treatment under the
Rules and AEMO registration procedures, as the ESD will be a net energy consumer
(as are pumped storage units).
3.4. Jurisdictional licensing obligations
Local licensing obligations differ between jurisdictions. For example:
In SA, a generation licence is generally required for generating systems with a name
plate rating >100 kVA.14
In NSW, no generation licence is required.
In VIC, a generation licence is required unless the generator’s output is <30MW and
the total exported output is sold to a licenced retailer (that is, not sold in the NEM
gross pool).15
In QLD, a generation licence is only required for generating systems >30MW.16
14
Clause 15, Electricity (General) Regulations 2012, made under the Electricity Act 1996 (SA). 15
Order in Council made under section 17 of the Electricity Act 2000 (VIC), 1 May 2002 16
Clause 130, Electricity Regulation 2006 (QLD) made under the Electricity Act 1994 (QLD).

APPENDICES
4. Ancillary services which the ESD could potentially provide, and
provision for accessing associated revenue
AEMO is responsible under the Law and Rules for achieving and maintaining power system
security and reliability (s49 Law, r4.1 Rules). ‘Ancillary services’ are acquired from market
participants in order to maintain the key technical characteristics of the power system,
including frequency and voltage.17
There are currently three types of ancillary services employed to manage power system
security:
frequency control ancillary services (FCAS);
system restart ancillary services (SRAS); and
network support and control ancillary service (NSCAS).18
As discussed further below, FCAS is a category of ‘market ancillary service’ acquired by
AEMO as part of the spot market, whereas SRAS and NSCAS are ‘non-market ancillary
services’ acquired under bi-lateral ancillary service agreements entered into between the
service provider and either AEMO (in the case of SRAS) or the TNSP or AEMO (in the case
of NSCAS) (Rules, r 3.11.1).
4.1. FREQUENCY CONTROL ANCILLARY SERVICES (FCAS)
FCAS seek to maintain the power system frequency within the NEM standards.19
FCAS are market ancillary services acquired by AEMO as part of the spot market, with
prices determined according to the dispatch algorithm (Rules, r 3.11.1) and paid to
generators who provide the service during a particular dispatch interval. This determines an
ancillary service price for each market ancillary service at each regional reference node for
every dispatch interval (Rules, r 3.2.2).
Implication for ESD:
Since FCAS is provided in a dynamic market setting, the value that can be realised
by participating in the market is inevitably impacted by prevailing levels of supply and
demand. To the extent the NEM (or a particular region of the NEM) does not
experience substantial frequency fluctuations and/or has generators running below
capacity that are available to provide the service, then the value to the ESD of
participating in the FCAS markets may be limited. AEMO frequently publishes market
ancillary service payment data which provides an indication of realistic price
expectations under current market conditions:
http://www.aemo.com.au/Electricity/Data/Ancillary-Services/Payments.
17
AEMO, Guide to Ancillary Services in the National Electricity Market, July 2010, accessible at http://www.aemo.com.au/Electricity/Market-Operations/Ancillary-Services 18
Ibid. 19
AEMO, Guide to Ancillary Services in the National Electricity Market, July 2010, accessible at http://www.aemo.com.au/Electricity/Market-Operations/Ancillary-Services

APPENDICES
There are currently 8 categories of FCAS procured by AEMO: fast raise; fast lower; slow
raise; slow lower; regulating raise; regulating lower; delayed raise; and delayed lower (Rules,
r 3.11.2). The regulating raise and regulation lower services are known as Regulating FCAS
and payment for the provision of these services is recovered on a ‘causer pays’ basis.20 The
remainder are known as Contingency FCAS, with payments for contingency raise services
recovered from generators and payments for contingency lower services recovered from
customers, each on a pro rata basis.21 A detailed description of each, including the qualifying
performance parameters and requirements, is set out in the Market Ancillary Service
Specification.22
Implications for ESD:
The Market Ancillary Service Specification should be considered in the technical
design / setting the operating parameters of the ESD if participation in existing FCAS
markets is an important part of the ESD value proposition. If the ESD can meet these
specifications, then FCAS presents a potential revenue stream for the ESD. In
particular, and unlike most other market participants, the ESD may be able to provide
both frequency raise and lower services.
An ‘Ancillary Service Provider’ in respect of an ‘ancillary service generating unit’ may
participate in the spot market (including central dispatch) by making market ancillary service
offers (Rules, r 3.8.7A). Market ancillary service offers will only be included in the central
dispatch process if AEMO is satisfied that adequate communication and/or telemetry is
available to support the issuing of dispatch instructions and the audit of responses (Rules, r
3.8.2).
Implications for ESD:
If participation in FCAS markets is an important part of the ESD value proposition,
then the technical parameters of the ESD would need to include capability to respond
to dispatch instructions. The ESD would also need to register as a market generating
unit.
AEMO/ElectraNet recently published their report ‘Renewable Energy Integration in South
Australia’ which assessed the secure operation of the power system with a high
concentration of non-synchronous wind and PV generation.23 In the event that SA temporary
separated from the NEM (e.g. due to outage at Heywood Interconnector), ‘under frequency
load shedding’ would be used to arrest the likely fall in frequency. In order to avoid customer
load shedding in these circumstances, AEMO will investigate arrangements to ensure
minimum levels of synchronous generation remain online in SA. This may include
developing new ancillary service markets such as local provision of inertia and frequency
regulation.
20
Ibid. 21
Ibid. 22
AEMO, Market Ancillary Service Specification, available at: http://www.aemo.com.au/Electricity/Market-Operations/Ancillary-Services/Specifications-and-Standards/Market-Ancillary-Service-Specification 23
AEMO and ElectraNet, Renewable Energy Integration in South Australia: Joint Study, October 2014 available at: http://www.aemo.com.au/Electricity/Planning/Integrating-Renewable-Energy

APPENDICES
Implications for ESD: The potential for a new category of FCAS – such as localised
provision of inertia and frequency regulation – has been raised in the
AEMO/ElectraNet report and could be pursued by the ESD proponent if it is likely to
be a suitable provider. If this initiative were implemented, then this may provide
another potential revenue stream for the ESD.
4.2. Network Support and Control Ancillary Service (NSCAS)
Network Support and Control Ancillary Services (NSCAS) can be subdivided into three
distinct categories24:
Network Loading Control (NLAS);
Voltage Control (VCAS); and
Transient and Oscillatory Stability Ancillary Service (TOSAS).
NSCAS are ‘non-market ancillary services’ acquired under bi-lateral ancillary service
agreements entered into between the service provider and the TNSP, or AEMO through
competitive tender (Rules, r 3.11.1). There are no specific registration requirements for an
NSCAS provider, although they must be technically capable of reliably providing the
designated service (and satisfy the AER of this) since this is a means of deferring or
avoiding alternative network augmentation options.
NLAS controls the power flow in and out of a transmission network in order to:
maintain power flow in transmission lines within ratings under credible contingent
system conditions; and
maintain or increase capability of the transmission network, allowing increased
loading on transmission network components, with the purpose to maximise the
present value of net economic benefit to all those who produce, consume or transport
electricity in the market.
The NLAS allows an increase in power transfer of a transmission network by ensuring that
the network will operate at a secure operating state.
Implications for ESD:
Design of the ESD control scheme would need to incorporate the ability to reduce
transmission network thermal rating constraints by selecting an appropriate level of
import/export from the ESD, if provision of NLAS is an important part of the ESD
value proposition.
VCAS controls the power flow in and out of a transmission network in order to:
maintain transmission network’s voltages within prescribed limits as well as voltage
stability under credible contingent system conditions; and
24
AEMO, Network Support and Control Ancillary Service (NSCAS) Description, December 2011, accessible at http://www.aemo.com.au/Electricity/Market-Operations/Ancillary-Services

APPENDICES
maintain or increase capability of the transmission network, by voltage control and
voltage stability improvement, with the purpose to maximise the present value of net
economic benefit to all those who produce, consume or transport electricity in the
market.
The VCAS controls power flows on the transmission network within prescribed voltage limits
and with proper maintenance of voltage stability.
Implications for ESD: Design of the ESD control scheme would need to incorporate
the ability to improve transmission network voltage levels by selecting an appropriate
level of import/export from the ESD, if provision of VCAS is an important part of the
ESD value proposition.
TOSAS controls the power flow in and out of a transmission network in order to:
maintain transmission network within its transient or oscillatory stability limits; and
maintain or increase capability of the transmission network, by transient or oscillatory
stability improvement, with the purpose of maximising the present value of net
economic benefit to all those who produce, consume or transport electricity in the
market.
The aim of TOSAS is to increase power flows on transmission network through increase the
transient or oscillatory stability limits of the network.
Implications for ESD: Design of the ESD control scheme would need to incorporate
the ability to increase the transient or oscillatory stability limits by selecting an
appropriate level of import/export from the ESD, and be able to implement quick
changes in the level import/export power from the ESD, if provision of TOAS is an
important part of the ESD value proposition.
4.3. System restart ancillary services (SRAS)
SRAS are non-market ancillary services procured by AEMO from generators to mitigate the
impact of a major supply disruption (Rules r3.11.4A). They provide the capability to restart
the power system when there is a loss of power supply in a region.
SRAS is currently procured by AEMO by competitive tender, following an initial expression of
interest process (EOI).25 The amount of SRAS procured is based on the System Restart
Standard determined by the Reliability Panel (Rules r8.8.1). AEMO has flexibility as to the
combination and form of services procured to meet the Standard. The capability of a
generating unit to provide SRAS will be modelled, assessed and tested according to the
SRAS Assessment Guidelines (Rules r3.11.4A).
If successful, a tenderer will enter a contract with AEMO (SRAS Agreement) under which
they agree to provide SRAS in return for payment by AEMO usually comprised of: an
‘availability charge’ for each trading interval during which the SRAS is available; a ‘usage
25
Refer to SRAS EOI and tender documentation available at: http://www.aemo.com.au/Consultations/National-Electricity-Market/Open/2014-System-Restart-Ancillary-Services-Consultations

APPENDICES
charge’ per major supply disruption in respect of which SRAS has been provided; and a
‘testing charge’ payable for each (usually annual) test that is required to be carried out. A pro
forma SRAS Agreement is available on the AEMO website.26
Until recently there has been a 100 MW minimum capacity requirement for an SRAS
provider.27 Now the threshold is expressed in terms of ‘capability to provide an SRAS
service’ which in turn is defined in the NER as being ‘sufficient to restart large generating
units’.28 AEMO will expect prospective tenderers to make their own assessment of their plant
capabilities before determining whether to submit an EOI. AEMO will conduct its own
detailed assessment of each EOI before a prospective provider is invited to tender.29
Implications for ESD:
The technical parameters and location of the battery storage project may prevent it
from tendering for SRAS provision (i.e. if its limited capacity and/or location means it
is unable to restart a large generating unit). Nevertheless, with advancement in
battery storage technology this might be a potential revenue stream for the ESD or
there might be configurations whereby an ESD allows a more traditional generator
(like a gas turbine) to offer up SRAS.
However, an SRAS provider must always reserve sufficient capacity to restart a large
generating unit, then this might limit the opportunity for the ESD to also participate in
other ancillary service and energy markets.
The procurement of SRAS is currently the subject of a rule change consultation process
examining potential amendments to the governance framework for the procurement of
SRAS. Despite the ongoing rule change process, SRAS will be procured by AEMO from
mid-2015 when the existing contracts draw to a close. The contracts commencing in 2015
are expected to have a minimum 3 year term, with two 1 year options.30
Implications for ESD:
This potentially presents a timing obstacle since the next opportunity to tender for the
provision of these services is likely to be after 2018.
26
http://www.aemo.com.au/Consultations/National-Electricity-Market/Open/2014-System-Restart-Ancillary-Services-Consultations 27
AEMO, SRAS Documents Consultation, Final Report and Determination, September 2014, available at: http://www.aemo.com.au/Consultations/National-Electricity-Market/Open/2014-System-Restart-Ancillary-Services-Consultations 28
Ibid. 29
Ibid. 30
Refer to SRAS EOI and tender documentation available at: http://www.aemo.com.au/Consultations/National-Electricity-Market/Open/2014-System-Restart-Ancillary-Services-Consultations

APPENDICES
5. The role of the RIT-T in procurement as a prescribed service
The purpose of the Regulatory Investment Test for Transmission (RIT-T) is to identify
transmission investments which maximise net economic benefits in the NEM and, where
applicable, meet the relevant jurisdictional or Rule based reliability standards.
The AER has published RIT-T application guidelines for the operation and application of the
RIT-T (AER RIT-T Guidelines). The application guidelines are designed to provide guidance
to businesses applying the RIT-T and enhance transparency and consistency in investment
decision making.
Clause 5.6.5B of the Rules states that the purpose of the RIT-T is to:
… identify the credible option that maximises the present value of net economic
benefit to all those who produce consume and transport electricity in the market (the
preferred option). For the avoidance of doubt, a preferred option may, in the relevant
circumstances, have a negative net economic benefit (that is a net economic cost)
where the identified need is for reliability corrective action.
Clause 5.6.5C of the Rules provides that a TNSP must apply the RIT-T to all proposed
transmission investments unless the investment falls under defined circumstances.
A transmission investment is defined in the Rules as:
Expenditure on assets and services which is undertaken by a transmission network
service provider or any other person to address an identified need in respect of its
transmission network.
The circumstances where a TNSP does not need to apply the RIT-T include among other
things:
the estimated capital cost of the most expensive option to address the identified need
is which is technically and economically feasible is less than $5 million;
the proposed investment relates to maintenance or replacement and is not intended
to augment the transmission network. If the maintenance or replacement results in an
augmentation of the transmission network, the augmentation component is exempt if
the estimated capital cost of the augmentation is less than $5 million;
the proposed investment is designed to address limitations on a distribution network.
The RIT-T explicitly requires the consideration both of credible network and non-network
options.
In the event that a RIT-T leads to a solution which requires a transmission investment by the
TNSP and the investment is undertaken that asset would be added to the TNSP’s regulated
asset base (RAB) and a regulated return on investment provided.
In the event the RIT-T leads to a solution that involves an operational expense only that
expense would be provided for by regulated operating expenditure allowance. In certain
circumstances these costs would be recovered via the network support pass-through
arrangements administered by the AER.

APPENDICES
A regulated investment is able to be used for the provision of other services which yield
unregulated income. In order to do this the regulated value of the asset may be apportioned
between regulated and non-regulated consistent with the TNSP’s approved cost allocation
methodology31 (CAM) or the unregulated revenue shared with customers via the AER’s
shared asset guideline32 which sets out “how electricity consumers will share in the benefits
of using assets paid for by electricity consumers to also provide other, unregulated, services
where revenue from such source exceeds 1% of total annual regulated revenue.”
Implications for ESD:
A RIT-T could yield a credible option via an ESD for a network support (deferral) or
NSCAS service either provided by the TNSP or a third party.
31
ElectraNet’s current CAM: http://www.electranet.com.au/assets/Uploads/costallocationmethodology.pdf 32
http://www.aer.gov.au/node/18878

APPENDICES
6. Asset ownership options
6.1. General
The ESD could conceivably be owned by a third party new to the NEM or an existing
registered participant. Unless the owner is also a registered network service provider, there
are generally no ownership restrictions provided the owner can satisfy the relevant
registration criteria. A registered participant can register in more than one participant
category (Rules, r 2.8.1).
Here the non-network service provider could:
- register as a generator and earn a revenue from energy sales – whether on or off
market;
- seek exemption and sell output off market;
- register as a customer to purchase electricity from a retailer or the spot market;
- participate in ancillary service markets; and/or
- enter into ancillary service agreements with AEMO or the TNSP for the provision of
non-market ancillary services.
6.2. Ownership by network service provider
There are no restrictions on a network service provider owning an ESD to fulfil network
support functions or defer network spend and, subject to RIT-T hurdles, in including this in its
regulated revenue / asset base. However, where revenue is also intended to be earned from
energy sales (on- or off-market) or the offer of ancillary services (other than NSCAS), the
situation is less clear.
The Transmission Ring-Fencing Guidelines, in clause 7.1, provide that a TNSP that supplies
‘ring-fenced services’ (that is, prescribed services) must not carry on a ‘related business’
(defined as generation, distribution and electricity retail activities).33 This restriction extends
to the TNSP as a member of a partnership, joint venture or other unincorporated association.
However there is an exception where it carries on a related business that attracts a total
revenue of less than or equal to 5% of the TNSP’s total annual revenue. Depending on the
quantum or materiality of the ESD’s energy sales or from providing market ancillary services,
this may provide an avenue for the TNSP to earn this revenue without breaching the
guidelines.
In the case of ElectraNet, 5% of total annual revenue would be approximately $15 million per
annum. An ESD which was principally procured to provide a prescribed service in the size
range envisaged is unlikely to exceed net revenue of $15 million per annum from market
activities.
If the revenue from the ESD’s energy sales or ancillary service market participation would
exceed this limit, then there is a question to be explored further as to how this revenue is to
be treated if pursued as part of the TNSP’s regulated activities.
33
ACCC, Statement of Principles for the Regulation of Transmission Revenues: Transmission Ring-Fencing Guidelines, 15 August 2002

APPENDICES
In considering TNSP ownership the principles supporting ring fencing should be considered
including:
operating protocols to ensure the ESD in operated to satisfy its prescribed services
obligations; and
options for abstracting the energy sales component from the TNSP either by
contracting out the commercial operation or treating the consumption and generation
of the device as losses as is the case for other network elements.
Implications for ESD:
The treatment of energy sales and costs under TNSP ownership is to be addressed
by further work after the completion of the Measure. This might also consider
whether, if the ESD is located within the TNSP sub-station, it constitutes part of the
transmission infrastructure with energy consumption and production simply treated
as losses / gains of the system.
While it is not obvious that the ring fencing guideline would allow for the TNSP to
establish a separate, ancillary business that is appropriately ring-fenced from the
ring-fenced services the 5% threshold will leave a number of potential opportunities
available. This is another question to be explored further.

APPENDICES
7. Commercial frameworks under various ownership models
The preceding sections demonstrate that there are a number of choices to be made
regarding ESD ownership and registration. In theory, an ESD could act in multiple capacities
and realise revenue in each of those capacities. However, there will be some natural
limitations to this, such as:
Where the ESD has contracted to provide NSCAS to a TNSP or SRAS to AEMO,
then it would be prevented from undertaking other activities which would compromise
its ability to meets its contractual commitments. So it could not bid into the spot
market or FCAS markets if that meant it was technically incapable of providing the
contracted NSCAS or SRAS. However, if those agreements only required the ESD
to be available during particular times, then the ESD could conceivably bid into those
markets at other times.
Although the ESD might be registered as both a market generator and an ancillary
service generator, it might technically only be capable of either generating energy or
providing FCAS at a particular time. Accordingly, the ESD would determine at a
particular time whether market conditions were such that it would realise the greatest
revenue from one or other of those markets and adjust its offer schedule accordingly.
There is also the residual query raised in section 6 above regarding the ability of a
TNSP to itself realise value from an ESD that goes beyond network support /
deferred network spend. The limits of TNSP ownership are certainly an area to be
tested further.
As well as technical capability, the ownership and registration decisions will also be
influenced by siting and connection decisions. For example, by siting the ESD in a
particularly stressed or constrained part of the network, then the primary value stream may
overwhelmingly come from avoided network spend / network support, such that a TNSP is
the natural owner and issues around energy arbitrage and access to alternative markets
become moot. Alternatively, the primary purpose may be to smooth a wind farm’s output or
insulate a large customer from retail electricity prices and these factors will largely determine
registration and ownership decisions.
The table which follows provides a summary overview of the interaction between ownership
decisions and revenue options.

APPENDICES

APPENDICES
8. Summary of issues to be resolved and recommendations
The foregoing discussion raised a number of issues requiring greater clarity or further
investigation in order to fully understand available options for realising all potential value
from the integration of a large scale ESD in the NEM:
Limitations on TNSP ownership: A primary question to be resolved is the extent to
which a TNSP might be permitted to either itself realise the energy value associated
with an ESD that has been installed for the primary purpose of providing network
support or its ability to offer this up to another market participant potentially for a
service payment or similar. Alternatively, would an associated, but ring-fenced, TNSP
business be permitted to carry-on this activity? Where the TNSP is not permitted to
realise this value, then it would be useful to seek clarification from AEMO as to
whether the ESD’s imports and exports are to simply be treated as gains and losses
in the system.
Characterisation as a transmission customer: a market generator is currently
exempt from the requirement to pay TUOS. There might be scope to seek a
treatment or clarification under the Rules that would mean all ESD’s are excluded
from these charges, however they are registered and whether they are a net importer
or exporter of energy.
Suitability of ESD for non-scheduled classification: A generating unit may be
classified by AEMO as non-scheduled where its physical and technical attributes are
such that it is not practicable for it to participate in central dispatch. It should be
explored with AEMO whether it would consider it practicable for an ESD to participate
in central dispatch. This will likely depend on the ESD’s technical characteristics
(including meeting connection requirements under the Rules) and operating
envelope.
Impact of ESD integration in wind farm system: Where a wind farm is registered
on a semi-scheduled basis, some clarification could be sought from AEMO as to
whether the integration of an ESD would impact the perceived ‘intermittency’ of the
generating unit. This might depend on the technical capabilities and operating
envelope of the ESD itself, as well as the ratio of output sent out from the ESD
versus the installed wind turbines.
Application of a marginal loss factor: We would expect the dual loss factor regime
that applies to pumped hydro schemes to also apply to an ESD, however this should
be clarified with AEMO.
Expansion of ancillary service markets for inertia and frequency regulation: In
regions characterised by a large degree of installed wind energy, there may be a
case for developing a new category of market ancillary service that involves the
provision of inertia and frequency regulation. As the ESD is likely to be a natural
provider of such services, then it would be worthwhile pursing this development
further.
The above should not be considered an exhaustive list since additional regulatory
ambiguities or obstacles may emerge once the preferred ownership and operating model,
together with the technical characteristics, have been settled-upon and even when the
practical steps for implementation begin.

APPENDICES
APPENDIX 1. Diagrammatic of connection options

APPENDICES

APPENDICES
APPENDIX 2. Examples of generator classification and exemption
categories
The table below provides examples of the generator classification and exemption categories.
It is taken from AEMO’s Guide to NEM Generator Classification and Exemption, August
2014 (p7) available from: http://www.aemo.com.au/About-the-Industry/Registration/How-to-
Register/Exemption-and-Classification-Guides

ESCRI-SA
Energy Storage for Commercial Renewable Integration
South Australia
An Emerging Renewables “Measure” project with the Australian Renewable Energy Agency
Milestone 2 January 2015
Site Selection

ESCRI-SA MILESTONE 2: SITE SELECTION January 2015
ESCRI-SA Site Selection Report - Ver 1 - Issue 1.docx Version 1.0 Page 2 of 59
Confidentiality
This document has been prepared for the sole purpose of documenting the Site Selection milestone 2 deliverable associated with the Energy Storage for Commercial Renewable Integration project for South Australia by AGL, ElectraNet and WorleyParsons, as part of an Emerging Renewables project with the Australian Renewable Energy Agency (ARENA).
It is expected that this document and its contents, including work scope, methodology and any commercial terms will be treated in accordance with the Funding Agreement between ARENA and AGL.
Revision Record
Date Version Description Author Reviewed By Approved By
19/1/2015 0.1 First draft for comment
Various
21/1/2015 0.2 Second draft to Steering Committee
Various
Project Team
29/1/2015
0.3
Final Draft
Hugo Klingenberg (ElectraNet), Brad Parker (ElectraNet)
30/1/2015
1.0
Issue 1
Hugo Klingenberg (ElectraNet), Brad Parker (ElectraNet)
Project Team Steering Committee
Bruce Bennett (AGL) Rainer Korte (ElectraNet) Paul Ebert (WorleyParsons)

ESCRI-SA MILESTONE 2: SITE SELECTION January 2015
ESCRI-SA Site Selection Report - Ver 1 - Issue 1.docx Version 1.0 Page 3 of 59
Contents
1. INTRODUCTION .................................................................................................................. 9
2. SCOPE ............................................................................................................................... 10
2.1 ISSUES NOT YET CONSIDERED .............................................................................................. 11 2.1.1 Interplay, hierarchy and/or possible mutual exclusivity of some benefit classes ................. 12 2.1.2 Co-optimisation .................................................................................................................. 12 2.1.3 ESD losses ........................................................................................................................ 12
2.2 BENEFITS NOT CONSIDERED ................................................................................................. 12 2.2.1 System Restart Ancillary Service (SRAS) .......................................................................... 12 2.2.2 Transient Stability Improvement ......................................................................................... 13 2.2.3 Frequency Control for South Australia ............................................................................... 13 2.2.4 Inter-regional effects .......................................................................................................... 13 2.2.5 Wind farm ramping ............................................................................................................. 14 2.2.6 Ride through assistance ..................................................................................................... 14
3. SITE SELECTION CRITERIA ............................................................................................ 15
3.1 GENERATED ENERGY VALUE ................................................................................................. 15
3.2 NETWORK SUPPORT (RELIABILITY) ........................................................................................ 16
3.3 NETWORK SUPPORT (MARKET BENEFIT) ................................................................................ 16
3.4 LOCAL SITE AND NETWORK CHARACTERISTICS ....................................................................... 17
4. SITE ASSESSMENT APPROACH .................................................................................... 19
4.1 INITIAL SCREENING STUDY APPROACH ................................................................................... 19 4.1.1 Site factors ......................................................................................................................... 19 4.1.2 Value factors ...................................................................................................................... 19
4.2 SECOND-STAGE SCREENING APPROACH ............................................................................... 20
4.3 BENEFIT QUANTIFICATION METHODOLOGY ............................................................................. 20 4.3.1 Price Arbitrage Value ......................................................................................................... 20 4.3.2 MLF Modification Value ...................................................................................................... 21 4.3.3 Network Augmentation Capital Deferral ............................................................................. 21 4.3.4 Localised Frequency Support ............................................................................................. 23 4.3.5 Expected Unserved Energy Reduction ............................................................................... 24 4.3.6 Heywood Interconnector Constraint Reduction .................................................................. 24 4.3.7 Murraylink Interconnector Constraint Reduction ................................................................. 25 4.3.8 Local Generator Constraint Reduction ............................................................................... 25 4.3.9 Grid Support Cost Reduction ............................................................................................. 26 4.3.10 System Frequency Support ................................................................................................ 27 4.3.11 Avoided Wind Farm FCAS Obligation ................................................................................ 27
5. SITE ASSESSMENT ......................................................................................................... 28
5.1 SITES EXCLUDED ................................................................................................................. 28 5.1.1 Sites outside of South Australia ......................................................................................... 28 5.1.2 Distribution network connections ........................................................................................ 28
5.2 INITIAL SCREENING ............................................................................................................... 29

ESCRI-SA MILESTONE 2: SITE SELECTION January 2015
ESCRI-SA Site Selection Report - Ver 1 - Issue 1.docx Version 1.0 Page 4 of 59
5.3 SECOND-STAGE SCREENING ................................................................................................. 29 5.3.1 Sensitivity Analysis............................................................................................................. 31
5.4 LOCALITY FACTORS FOR SHORT-LISTED SITES ....................................................................... 31 5.4.1 Port Lincoln Terminal Substation ....................................................................................... 31 5.4.2 Dalrymple Substation ......................................................................................................... 31 5.4.3 Monash Substation ............................................................................................................ 31
5.5 ASSESSMENT OF BENEFITS AT SHORT-LISTED SITES .............................................................. 32 5.5.1 Potential Value of Available Benefits .................................................................................. 32
5.6 CALCULATION OF AVAILABLE BENEFITS .................................................................................. 33 5.6.1 Price Arbitrage Value ......................................................................................................... 33 5.6.2 Modification of System MLFs ............................................................................................. 35 5.6.3 Network Augmentation Capital Deferral ............................................................................. 40 5.6.4 Localised Frequency Support ............................................................................................. 40 5.6.5 Expected Unserved Energy (USE) reduction ..................................................................... 42 5.6.6 Heywood Interconnector Constraint Reduction .................................................................. 42 5.6.7 Murraylink Interconnector Constraint Reduction ................................................................. 43 5.6.8 Local Generator Constraint Reduction ............................................................................... 44 5.6.9 Grid Support Cost Reduction ............................................................................................. 44 5.6.10 System Frequency Support ................................................................................................ 44 5.6.11 Avoided Wind Farm FCAS Obligation ................................................................................ 45
6. CONCLUSIONS ................................................................................................................. 46
APPENDICES ................................................................................................................................ 49
APPENDIX A INITIAL SCREENING RESULTS ........................................................................... 50
APPENDIX B SECOND-STAGE SCREENING RESULTS ........................................................... 51
APPENDIX C SHORT-LISTED SITE LOCALITY VIEWS ............................................................. 52
C1 PORT LINCOLN ..................................................................................................................... 52
C2 DALRYMPLE ......................................................................................................................... 53
C3 MONASH .............................................................................................................................. 54
APPENDIX D ENERGY ARBITRAGE AND MLF IMPACT ASSESSMENT................................. 55
Tables
Table 1: Criteria associated with improvement of generated energy value ................................... 15
Table 2: Criteria associated with reliability-related network support .............................................. 16
Table 3: Criteria associated with market benefit-related network support ..................................... 16

ESCRI-SA MILESTONE 2: SITE SELECTION January 2015
ESCRI-SA Site Selection Report - Ver 1 - Issue 1.docx Version 1.0 Page 5 of 59
Glossary of Terms
Term Description
AEMO Australian Energy Market Operator
ARENA Australian Renewable Energy Agency
Consortium AGL, ElectraNet and WorleyParsons
DC Direct Current
ESCRI-SA Energy Storage for Commercial Renewable Integration – South Australia
ESD Energy Storage Device
FCAS Frequency Control Ancillary Services
GDL Generator Dispatch Limiter
HV High Voltage
Measure The milestones against which Project progress are assessed by ARENA, as defined in the Emerging Renewables Program Funding Agreement number A00602 between ARENA and AGL
MLF Marginal Loss Factor
MW Mega Watt
MWh Mega Watt Hour
NEB Net Energy Balance
NEM National Electricity Market
NGM National Grid Metering
NPV Net Present Value
Project The Energy Storage for Commercial Renewable Integration – South Australia Project
PV Photovoltaics
REC Renewable Energy Certificate
RET Renewable Energy Target
RIT-T Regulatory Investment Test for Transmission
SCADA Supervisory Control and Data Acquisition
SRAS System Restart Ancillary Service
SVC Static VAR Compensator
TNSP Transmission Network Service Provider
USE Unserved Energy
VCR Value of Customer Reliability
WACC Weighted Average Cost Of Capital

ESCRI-SA MILESTONE 2: SITE SELECTION January 2015
ESCRI-SA Site Selection Report - Ver 1 - Issue 1.docx Version 1.0 Page 6 of 59
Executive Summary
The Energy Storage for Commercial Renewable Integration – South Australia (ESCRI-SA) project is examining the role of medium to large scale (5-30 MW) non-hydro energy storage in the integration of intermittent renewable energy into the South Australian Region of the National Electricity Market (NEM) (the Project). This Project is examining the value of such storage across three broad areas: the time-shifting of renewable energy generated, the network value to the transmission system as well as the ancillary service value that can be provided to the South Australian system. A business case for the trial of a full scale energy storage system in South Australia will be formulated as one of the project objectives. This Project is being progressed by a consortium consisting of AGL, ElectraNet and WorleyParsons (the Consortium).
This Site Selection Report forms part of Milestone 2 of the ESCRI-SA ARENA Measure and includes the factors that were used to select a site, what constraints were identified, the potential sites that were examined and the rationale behind final short-list selection. The intended novel use of an Energy Storage Device (ESD) to perform various functions in the NEM creates a number of uncertainties and unknowns, which in turn have resulted in this Project taking on an iterative form. One outcome of this iterative nature is that this Milestone 2 recommends that three short-listed sites are progressed further rather than recommending one final site selection. This change in scope has been agreed with ARENA and is discussed in more detail in section 2.
The body of this Report contains three main sections:
Section 3 – Site Selection Criteria;
Section 4 – Site Assessment Approach (Screening and benefit quantification methodology); and
Section 5 – Site Assessment.
Sections 3 and 4 of the Report deal with site selection criteria, site screening and methodology, which can be applied anywhere in the NEM. Section 5 focusses on applying these criteria and methodology to South Australian sites, including a high level quantification of the benefit classes. It is important to note that this Site Selection Report has not considered the deployment cost of an ESD which may influence the final site selected. However, site connection costs have been considered at a high level in shortlisting potential sites in South Australia. ESD deployment costs will be determined as input into business case development and therefore inform Milestone 4 of the Measure, and assist in finalising the site selection. The outcome of the above three report Sections are summarised in turn below.
A broad range of Site Selection Criteria was developed to capture local site issues, network characteristics as well as potential benefits categorised as follows:
Generated Energy Value;
Network Support (due to reliability constraints); and
Network Support (to increase Market Benefit).
The broad range of criteria were evaluated and reduced in number after some benefits were determined not to be relevant unless ESDs become widespread in the future. These benefits were not considered. Also, detailed aspects like the potential interplay and/or mutual exclusivity of benefits and co-optimisation of benefits in the design have not been considered at this stage. The following list of benefit classes were used for the screening, short-listing of sites and high-level benefit quantification:

ESCRI-SA MILESTONE 2: SITE SELECTION January 2015
ESCRI-SA Site Selection Report - Ver 1 - Issue 1.docx Version 1.0 Page 7 of 59
Category Benefit class
Generated Energy Value
1. Price Arbitrage Value
2. Marginal Loss Factor (MLF) Impact
Network Support (due to reliability constraints)
3. Network Augmentation Capital Deferral
4. Localised Frequency Support
5. Expected Unserved Energy (USE) reduction
Network Support (to increase Market Benefit)
6. Heywood Interconnector Constraint Reduction
7. Murraylink Interconnector Constraint Reduction
8. Local Generator Constraint Reduction
9. Grid Support Cost Reduction
10. System Frequency Support
11. Avoided Wind Farm Frequency and Control Ancillary Service (FCAS) obligation
The Site Assessment Approach (Section 4) covers the screening approach followed and also documents the proposed approach to quantify the various benefit classes. This section is intended to be as generic as possible to enable the approach to be replicated in other NEM jurisdictions.
The Site Assessment (Section 5) covered all of ElectraNet’s 88 high voltage substations. Sites outside of South Australia and sites belonging to generators or SA Power Networks were excluded from the assessment. The initial screening study considered all connection point sites in South Australia and resulted in a shortlist of 16 sites. The second stage of the screening process introduced rankings and weightings of the Site Selection Criteria. The second stage screening identified that the highest ranked sites were all located on the Eyre Peninsula, Yorke Peninsula and in the Riverland.
The Eyre Peninsula (Port Lincoln Terminal) was ranked first, higher than the Yorke Peninsula due to the additional requirement to supply load via contracted generation under line outage conditions. Sites in the Riverland were ranked next, after the Eyre and Yorke Peninsula, due to low connection difficulty and the potential for reduced Murraylink interconnection constraints. From the above it was concluded that three sites should be short-listed, one in each geographic area, to optimise the site choice in a more rigorous and detailed analysis.
The following sites were chosen as being the highest ranked in each area:
Eyre Peninsula - Port Lincoln Terminal substation;
Yorke Peninsula – Dalrymple substation; and
Riverland – Monash substation.

ESCRI-SA MILESTONE 2: SITE SELECTION January 2015
ESCRI-SA Site Selection Report - Ver 1 - Issue 1.docx Version 1.0 Page 8 of 59
The quantification of the benefit classes has identified the following benefits as being the most valuable:
Price Arbitrage;
MLF impact (subject to optimal ESD sizing);
Network Augmentation Capital Deferral (where relevant);
Expected Unserved Energy (USE) reduction;
Interconnector constraint reduction; and
Local generator constraint reduction.
The following benefits were found to be of low value in the current regulatory framework and are unlikely to warrant further detailed investigation:
Localised frequency support;
Grid support cost reduction;
System frequency support;
Avoided wind farm FCAS obligation; and
Ride-through assistance.
It is worth noting that at the time of the original ARENA proposal there was an expectation that network deferral benefits were available on the Yorke Peninsula. With the latest demand forecasts, these deferral benefits may only be available if the proposed Hillside mine proceeds in substantial form.
As mentioned before, this ESCRI-SA Project has taken on an iterative form. The result is that the short listed site selections are a work in progress. More work is required to reduce some of the uncertainties and also to determine the various cost components, e.g. losses in the ESD have not been considered yet. The outputs of this Report will feed into the Basis of Design document which will be used later in the Project.
Final site selection will be performed as part of the business case development and be guided by:
Implications flowing from the technology review;
Footprint of the proposed installation;
Environmental implications;
Cost of the ESD, including connection costs; and
Further refinements of benefits, including the inter-relationship between benefit types and how an ESD could physically be configured to maximise these benefits.

ESCRI-SA MILESTONE 2: SITE SELECTION January 2015
ESCRI-SA Site Selection Report - Ver 1 - Issue 1.docx Version 1.0 Page 9 of 59
1. Introduction
The Energy Storage for Commercial Renewable Integration – South Australia (ESCRI-SA) project contemplates the trial of a 5-30 MW non-hydro energy storage device (ESD) within the South Australian Region of the National Electricity Market (NEM) (the Project). This Project is being progressed by a consortium consisting of AGL, ElectraNet and WorleyParsons (the Consortium).
Under the Project, The Energy Storage Device (ESD) may potentially act as a consumer of electricity, a producer of electricity, a provider of system ancillary services, and/or a provider of network support services. This is the first time in Australia that an energy storage asset has been considered which combines all of these potential roles.
Such a novel asset requires careful consideration of its physical siting, which is influenced by a wide range of issues including physical, commercial and technical components. This Site Selection Report covers the process by which such siting was investigated and the findings of that work.
By its nature, the Project is iterative and a final site selection cannot be determined until a range of other work progresses to completion. For example, the siting will be influenced by final technology selection, which in turn itself will be influenced by capital price and ESD functionality, which can only be resolved completely in the final Business Case. As such, this Report does not intend to complete the site selection process but to articulate and quantify the issues, and conclude with a short-list of options to be considered further.
This Project is being funded by the Australian Renewable Energy Agency (ARENA) under the Emerging Renewables – Measures Program. This Report is an important deliverable under Milestone 2 of the Project Funding Agreement and it was the original intention in that Agreement to progress the siting to conclusion in this Report. However, this has not been possible due to the iterative nature of the process as described above, and ARENA have subsequently approved a short-list of siting options as an acceptable result.
At a later stage in the Project a final site selection will be made. It is anticipated that this final result, and a description of the final process and methodology to determine this, will be included in both the Final Report for ARENA, and Knowledge Sharing material produced under the Funding Agreement.

ESCRI-SA MILESTONE 2: SITE SELECTION January 2015
ESCRI-SA Site Selection Report - Ver 1 - Issue 1.docx Version 1.0 Page 10 of 59
2. Scope
The scope of this ARENA funded ESCRI-SA project (Measure) covers the following:
Select a preferred storage technology and develop technical specifications appropriate to the South Australian electricity market;
Analyse deployment costs and benefits, siting options and optimise the delivery model. This includes modelling device operations in the South Australian energy market and determining the form of long-term commercial relationships between consortium members, e.g. for delivering network services;
Examine any regulatory barriers to deployment and establish safety and environmental requirements; and
Share knowledge with relevant parties through a range of forums and reports.
The formal deliverables to ARENA on the above Measure include the following series of Milestone reports:
1. Summary report detailing the regulatory overview, including a synopsis of the relevant regulatory environment and the particular Regulations that apply and a summary of the particular roadblocks identified and the suggested path to resolve these;
2. A summary designating the site selection. The report must include the factors that were used to select the site and what constraints were identified and the potential sites that were examined and the rationale behind final selection;
3. A summary report outlining the commercial framework and functional specification including the basic form of the commercial framework envisaged, the basic terms for that commercial framework and the basic issues identified in the functional specification and how these were resolved;
4. A summary report supporting a proposed business case, including the basic results from the business case analysis and a summary of the Stage 2 Emerging Renewables Project submission; and
5. The Final Report including a summary of the Knowledge Sharing Activities and results as well as a summary of the Measure deliverables and essential results.
This Site Selection Report documents the Site Selection Milestone 2 deliverable associated with the ESCRI-SA project.
Work undertaken during Site Selection and determining Network Value/Constraints included:
Screening of potential sites from a technical, commercial and approvals perspective;
At short-listed sites, system modelling to determine any particular network related functionality required, system impacts (if any) and what network value service the storage could deliver as input to the financial model; and
Reducing the project site to no more than three sites.

ESCRI-SA MILESTONE 2: SITE SELECTION January 2015
ESCRI-SA Site Selection Report - Ver 1 - Issue 1.docx Version 1.0 Page 11 of 59
As mentioned in the Introduction, the site selection process has resulted in a short list of potential sites, which is a change from the original scope. This change in scope has been agreed with ARENA with the following changes being implemented between ARENA and AGL as the contracting party.
The Milestone 2 Report is varied by substituting
“A summary designating the site selection. The report must include:
The factors that were used to select the site and what constraints were identified
The potential sites that were examined and the rationale behind final selection.”
with
“A summary designating the short-list of sites. The report must include:
The factors that were used to select the short-list of no more than three sites and what constraints were identified
The potential sites that were examined and the rationale behind final short-list selection.”
The Milestone 4 Report is varied by substituting
“A summary report supporting a proposed business case, including:
The basic results from the business case analysis
A summary of the Stage 2 Emerging Renewables Project submission.”
with
“A summary report supporting a proposed business case, including:
The basic results from the business case analysis
The final site selection and the rationale behind the final site selection
A summary of the Stage 2 Emerging Renewables Project submission.”
2.1 Issues Not Yet Considered
The focus of this site selection report is on the screening of potential sites from a technical, commercial and approvals perspective and to narrow down the number of short-listed sites to no more than three sites. The value of various benefit classes may be influenced by the commercial framework, functional specification and business case, all of which are future milestones of this project. The recommendation of a single site will be finalised with the business case when current unknowns have been worked through.
For the purposes of this site selection report the following issues have not been considered yet:

ESCRI-SA MILESTONE 2: SITE SELECTION January 2015
ESCRI-SA Site Selection Report - Ver 1 - Issue 1.docx Version 1.0 Page 12 of 59
2.1.1 Interplay, hierarchy and/or possible mutual exclusivity of some benefit classes
The potential interplay, hierarchy and/or possible mutual exclusivity of some benefit classes have not been considered yet, e.g. when an ESD is contracted as a non-network solution, the availability of this support is paramount under specific conditions (typically maximum demand) which would then prevent any other potential service at that time that would not use the ESD in the same way.
2.1.2 Co-optimisation
Some benefit classes will require that the ESD is not fully charged or fully discharged, e.g. to provide frequency raise support or low voltage support relies on an available battery charge to facilitate this support. Reducing the available range between lowest charge and highest charge consequently inhibits the capacity available for price arbitrage.
2.1.3 ESD losses
An ESD generates losses between the storage of energy and subsequent output of energy. These include 'round trip' and “self discharge’ losses, which will be considered in the development of the Project business case.
2.2 Benefits Not Considered
Some benefits have not been considered in this site selection process, and are not intended to be considered during the course of this project. Benefits that have been excluded from consideration are:
those that would realise only a small benefit compared to other benefit classes; and
those which may only become realisable if the penetration of storage devices becomes much more widespread in the future.
Just one example topical in the literature is the interplay between grid and electric vehicles, which can both consume and provide electrical energy, and how these might interact with utility assets, including larger scale storage.
The future realisation of some of these benefits could be achieved by coordination of significant amounts of storage installed across the electricity network, and may require some centralised control of wide spread small/residential storage devices in conjunction with larger grid-connected storage devices. This would be made easier in the future if appropriate upfront protocols and standards were in place before the widespread installation of residential battery storage.
2.2.1 System Restart Ancillary Service (SRAS)
As discussed in the Regulatory Overview report, the technical parameters and location of a battery storage project with a maximum capability in the range of 5-30 MW may prevent it from tendering for SRAS provision, if its limited capacity and/or location means it is unable to restart a large generating unit. In essence, at this scale such a service is very unlikely.

ESCRI-SA MILESTONE 2: SITE SELECTION January 2015
ESCRI-SA Site Selection Report - Ver 1 - Issue 1.docx Version 1.0 Page 13 of 59
However, should the installation of multiple storage devices occur across the SA electricity network in future years, they may have an aggregate capacity sufficient to restart large generating units. Any future value that could be realised from providing such a service has not been considered as part of this site selection report.
2.2.2 Transient Stability Improvement
The transfer capability across the South Australia to Victoria Heywood interconnector is at times limited by transient network stability constraints. At these times the Heywood interconnector flows are constrained below the thermal capacity of the interconnector to avoid network dynamic instability for certain critical outages, e.g. the loss of a significant generator. The control system of an ESD may be configured to provide dynamic support to the network under such conditions. However, the small size of ESD considered (compared to network capacity) would provide minimal assistance for network transient stability improvement and has not been considered as part of this site selection report.
Should the installation of multiple storage devices occur across the SA electricity network in future years, they may have an aggregate capacity sufficient to provide meaningful support to improve network transient stability.
2.2.3 Frequency Control for South Australia
Frequency control for an islanded South Australian system following loss of the Heywood Interconnector is typically provided by a number of conventional generators. If a significant penetration of appropriately-configured ESDs was achieved (which could be through any combination of centrally-connected storage devices and small customer-level storage devices), the combined ability of the ESDs could provide stable frequency control following loss of the Heywood Interconnector, with less conventional generation in service than is currently typically required.
This would either reduce market fuel costs (if conventional generators would otherwise be constrained in-service to provide the required frequency stability), or avoid the loss of all supply to South Australian grid-connected customers following loss of the interconnector (if the number of conventional generators if allowed to go below the minimum level required for post-contingency frequency stability).
However, in the present study the size of the ESD being proposed is not capable of supplying this service so this potential value was not considered.
2.2.4 Inter-regional effects
One of the base assumptions of the Project is that the scale of such ESD implementations would not impact on the wholesale price of electricity, e.g. potentially reducing wholesale prices difference between NEM regions. In other words, it is assumed that ESD deployment would not affect generation dispatch to the extent that the regional wholesale electricity prices would be influenced. Therefore, inter-regional effects have not been considered as part of this project.
When ESD penetration achieves a level where it starts to impact on regional wholesale prices, this will lead to diminishing other benefits, especially Price Arbitrage. This risk should be addressed in the formulation of the business case.

ESCRI-SA MILESTONE 2: SITE SELECTION January 2015
ESCRI-SA Site Selection Report - Ver 1 - Issue 1.docx Version 1.0 Page 14 of 59
2.2.5 Wind farm ramping
Where a wind farm is of substantial size compared to the local network capability a wind farm may be limited to a maximum ramp rate to limit the impact on the network. This in turn may lead to spilled wind resources if the wind farm output has to be constrained when the wind picks up quickly leading to potential power output exceeding the ramp rate. Compared to other benefit classes, energy lost due to ramping is considered to be an order of magnitude lower and has not been considered part of this project.
2.2.6 Ride through assistance
A nearby fault on the network can result in a dramatic short-term reduction in voltage at the connection point. It is advantageous for both the system and the generator for the generator to stay connected to the grid during this temporary voltage dip. Before a generator will be allowed to connect to the grid, it must demonstrate that it can ride through a short term voltage dip.
ESDs make use of inverter technology that can be configured to provide transient support which may assist a wind farm to ride-through a network fault for which it would otherwise have been disconnected. This ESD control mode potentially reduces the cost of complying with the Generator Performance Standard for the initial installation of the generator, e.g. by reducing or eliminating the use of other control devices.
Once the generator has been commissioned, any additional incremental ride through capability has the potential to avoid unnecessary shut downs of the generator in specific circumstances, i.e. for a fault close to the generator, on a line which is not the only line interconnecting the generator to the grid. (If the generator is connected radially via single line, the generator will be disconnected when the faulted line is isolated).
The potential ride through assistance that could be provided by an ESD is mainly relevant for new wind farm connections by reducing or optimising capital costs and has not been considered as part of this project.

ESCRI-SA MILESTONE 2: SITE SELECTION January 2015
ESCRI-SA Site Selection Report - Ver 1 - Issue 1.docx Version 1.0 Page 15 of 59
3. Site Selection Criteria
Screening criteria have been developed to enable a high-level assessment of the suitability of a site for the installation of an ESD. The criteria that have been developed can be broadly split into two types:
Benefit value realisation criteria, which reflect the potential value of the various types of benefit that could be achieved at the site under consideration; and
Local site and network characteristics criteria, which assess the potential ease or difficulty with which an ESD device could be connected to the existing network at a site under consideration.
The benefit realisation criteria have been sub-divided into the following categories:
Generated Energy Value;
Network Support (Reliability); and
Network Support (Market Benefit).
The benefit classes for each category above are briefly described in the sections that follow.
3.1 Generated Energy Value
Table 1 shows the criteria and assessment keys that have been used to assess whether the location of an ESD at a given site will improve the value of generated energy.
Table 1: Criteria associated with improvement of generated energy value
No. Criteria Comment
1
Ability to participate in energy arbitrage
Ability to transfer energy from generation to ESD
Assessed on the magnitude of electrical losses that would be incurred when transferring energy from renewable sources of generation in the nearby area (e.g. wind farms, solar systems) to the ESD, and whether network limitations are likely to constrain the free transfer of energy from local renewable generation to the ESD.
Ability to transfer energy from ESD to load
Assessed on the magnitude of electrical losses that would be incurred when transferring energy from the ESD to loads in the nearby area, and whether network limitations are likely to constrain the free transfer of energy from the ESD to local loads.
Evidence of wind farms spilling wind at times of low prices
This has been observed at some locations by comparison with other nearby wind farms that do not appear to spill wind.
2 Marginal Loss Factor (MLF) improvement
Appropriate control of the ESD (e.g. storing energy at times of high generation, releasing energy at times of high demand) could improve the MLFs of local generators and/or local loads.

ESCRI-SA MILESTONE 2: SITE SELECTION January 2015
ESCRI-SA Site Selection Report - Ver 1 - Issue 1.docx Version 1.0 Page 16 of 59
3.2 Network Support (Reliability)
Table 2 shows the criteria that have been used to assess whether the location of an ESD at a given site will provide network support of a type that will improve supply reliability to customers, or assist in maintaining existing levels of reliability into the future.
Table 2: Criteria associated with reliability-related network support
No. Criteria Comment
3 Network Augmentation Capital Deferral
Thermal limitations
If downstream of a known thermal network limitation, the ESD could defer the need for augmentation by releasing energy at high demand times.
Voltage Control Limitations (Low Voltage)
If in a locality where future investment is needed to maintain network voltage levels above the minimum acceptable levels at high demand times, the ESD could defer the need for voltage support by releasing energy at high demand times (i.e. acting to decrease the net local load).
Voltage Control Limitations (High Voltage)
If in a locality where future investment is needed to maintain network voltage levels below the maximum acceptable levels at low demand times, the ESD could defer the need for additional voltage control facilities by storing energy at low demand times (i.e. acting to increase the net local load).
4 Localised frequency support An ESD may be able to provide frequency control to enable local wind farms to continue operating to supply local load when islanded from the rest of the network.
5 Expected Unserved Energy (USE) reduction
An ESD may be able to supply a small local load when islanded from the rest of the network.
3.3 Network Support (Market Benefit)
Table 3 shows the criteria that have been used to assess whether the location of an ESD at a given site will provide network support of a type that will reduce constraints on the network, and thereby allow lower-cost operation of the electricity market.
Table 3: Criteria associated with market benefit-related network support
No. Criteria Comment
6 Heywood Interconnector constraint reduction
Market benefits may be obtained if the ESD enables a reduction of network constraints in the South East region, which would facilitate higher transfers across the Heywood Interconnector and result in lower wholesale pool price.
7 Murraylink Interconnector constraint reduction
If the ESD operates to increase the ability of ElectraNet’s network to support flows across the Murraylink Interconnector into Regional Victoria, benefits may be obtained from both the impact on Victorian pool prices and a reduction in expected unserved energy on the Regional Victorian 220 kV network.
8 Local generator constraint reduction
A benefit will accrue to generators if there are fewer constraints on their operation due to local network limitations.

ESCRI-SA MILESTONE 2: SITE SELECTION January 2015
ESCRI-SA Site Selection Report - Ver 1 - Issue 1.docx Version 1.0 Page 17 of 59
9 Grid support cost reduction If able to provide partial or full supply to load during times of islanding from the grid, fewer generation support costs may be incurred.
10 System frequency support If configured to increase output power/decrease input power during times of falling frequency and vice versa, the ESD could provide frequency support to the main grid. This service is most useful when located near or on the main grid itself.
11 Avoided wind farm Frequency Control Ancillary Service (FCAS) obligation
Many wind farms currently make financial payments to the FCAS market to meet their frequency control obligations. If configured appropriately, the ESD could reduce these financial payment obligations.
3.4 Local Site and Network Characteristics
To minimise project development risks such as land acquisition and Statutory Approvals, and to keep the breadth of the task manageable, it was decided to limit the site options to suitable land currently owned/easily acquired by either ElectraNet or AGL. Any other ESD developer with existing land interests would likely approach siting similarly, although it is acknowledged that as incumbent asset owners in South Australia an advantage exists to ElectraNet and AGL that may not be available to all developers.
Existing SA Power Network distribution and direct connect customer sites were considered to be beyond the scope of the Project and therefore not included in this process. However, there are some sites in the South Australian distribution network that would for similar reasons potentially represent valuable locations, (such as Victor Harbor and Kangaroo Island). However, no comment can be provided on their feasibility or otherwise at this stage and these are not included in this Report.
Similarly, there are 30 registered generators in South Australia including 16 wind farms, all of which present an opportunity to connect an ESD. However, each of these generators are generally privately owned and hence will present a range of different commercial expectations and benefits from the implementation of an ESD. Due to access to site specific information, the main focus was on ElectraNet owned sites. However, the range of benefits that would apply to an ElectraNet generator connection site, e.g. Dalrymple substation, would equally apply to the wind farm connected to that substation. Therefore, the ElectraNet sites considered also act as proxies for the generator sites in the vicinity.
On the SA transmission network ElectraNet owns 88 high voltage substations throughout the State and the Adelaide Metropolitan area. In a number of substations, ElectraNet and SA Power Networks share the same site and have separate land ownership. These sites mostly include 275/66 kV, 132/33 kV connection and is a legacy of former vertical integration of the transmission and distribution networks. ElectraNet owns the land for all of its substation sites, and in some sites located in rural areas it has generous land ownership surrounding the substation. The extra land is either managed by ElectraNet or leased to nearby landowners for agricultural activities.
The following factors were taken into consideration in the preliminary assessment for the physical selection of sites that could be feasible for the energy storage for commercial renewable integration in South Australia:

ESCRI-SA MILESTONE 2: SITE SELECTION January 2015
ESCRI-SA Site Selection Report - Ver 1 - Issue 1.docx Version 1.0 Page 18 of 59
Only existing ElectraNet substation sites are considered;
Availability of suitable land within the existing substation boundary;
Availability of suitable land outside the existing substation boundary but within the property owned by ElectraNet;
Availability of suitable land for purchase outside the existing substation from other landowners;
Potential stakeholders and local community concerns and issues in regards to the impact of additional electrical infrastructure;
Statutory approval requirements such as Development Approval, Native Vegetation, Cultural Heritage (development associated with electricity transformation within the existing substation boundary is exempted from approval such as development approval under South Australia Development Act and Regulations)
Availability of medium voltage or low voltage bus for connection purposes.

ESCRI-SA MILESTONE 2: SITE SELECTION January 2015
ESCRI-SA Site Selection Report - Ver 1 - Issue 1.docx Version 1.0 Page 19 of 59
4. Site Assessment Approach
A two-stage site screening process was developed for application to existing ElectraNet sites.
The first screening stage focussed on assessing a number of high-level considerations to determine if each site is potentially suitable. Sites that passed this screening stage were considered to be both potentially feasible and valuable. Importantly, the reason for excluding sites from further consideration were captured by this screening step.
The more detailed second screening stage qualitatively scored and ranked sites that passed the first screening stage. Sites that performed well in this screening stage were then easily identified for further detailed, and quantitative, assessment.
4.1 Initial Screening Study Approach
The first screening test consisted of the application of the following ‘Yes/No’ indicators to each site:
4.1.1 Site factors
Does ElectraNet own spare land within the site?
Does ElectraNet own land outside the site, or is there a low anticipated difficulty of expanding the site?
Are the impacts on neighbours manageable (e.g. based on known neighbour relationships, proximity of the site to existing neighbours, and including site noise and environmental considerations)?
Is it possible to make use of existing exits or develop spare exits without impeding known future plans?
Are suitable voltage levels available for an inexpensive connection of an ESD?
4.1.2 Value factors
Would absorbing or injecting real power at the site:
o aid the provision of any potential price arbitrage benefit;
o provide network support through a potential reliability benefit; and/or
o provide network support through a potential market benefit by addressing any existing or emerging generator or network constraints?
Each of the three “value factors” were assessed by considering the aspects described previously in Table 1, Table 2, and Table 3 respectively.
Based on the answers to each of the site factor considerations, judgement was applied to each site to determine its overall ability to accommodate a lower-cost ESD connection (‘Yes/No’). Similarly, based on the answers to each of the value factor considerations, judgement was applied to determine whether the location of an ESD at each site would potentially provide significant overall value.

ESCRI-SA MILESTONE 2: SITE SELECTION January 2015
ESCRI-SA Site Selection Report - Ver 1 - Issue 1.docx Version 1.0 Page 20 of 59
Sites that passed both the site test and the value test are then listed for the second screening stage.
4.2 Second-Stage Screening Approach
The second screening test applied weighted scores to each of the sites that passed the first screening stage. The weightings and scores addressed the ease of connection, price arbitrage and network support aspects (reliability/market) that were assessed in the first screening test.
Each item within these aspects was assigned a judgement weighting.
Connection difficulty combined aspects such as land availability, site expandability, voltage level and spare exit availability. A judgement score of 1 represented the most difficult, 3 the least difficult. The overall weighting was judged to be in proportion to the other aspects.
Individual aspects of price arbitrage and network support were weighted according to their considered importance and scored from 0 (lowest perceived value) to 3 (highest perceived value).
4.3 Benefit Quantification Methodology
This section covers the range of potential benefit classes considered for the deployment of an ESD. These benefit classes are aligned with the site selection criteria listed in section 2.2.
The methodology applied to determine each benefit class is discussed in turn below, with the outcome reported in section 5.5. The description in the body of this report has been kept concise, with any required clarification or details appearing in the Appendices to this report.
4.3.1 Price Arbitrage Value
The estimated possible revenue that could be accrued from Arbitrage (i.e. by buying power during periods of low pool prices and selling power during periods of high pool prices) was calculated by considering the historical behaviour of power prices in South Australia (more detail is provided in section 5.6.1). Specifically a simulation of the device dispatch behaviour was constructed which depended on the following reasonable assumptions:
That the device is not large enough to materially impact the pool price;
That the magnitude of the charge and discharge power levels is limited by the device rating; and
That the device will not be dispatched if there is insufficient available stored energy, (or, in the case where it is dispatched as a load, storage capacity).
Note that this is a relatively simple analysis. It does not, for example, include any of the value that might be accrued in a trading sense by optimising arbitrage across a portfolio of generation – such as potential impacts on AGLs gas turbine fleet through fuel cost issues by time shifting wind farm output – nor does it specifically target renewable

ESCRI-SA MILESTONE 2: SITE SELECTION January 2015
ESCRI-SA Site Selection Report - Ver 1 - Issue 1.docx Version 1.0 Page 21 of 59
energy arbitrage. It is anticipated that this analysis will be significantly more complex as the ESCRI business case is confirmed.
4.3.2 MLF Modification Value
At locations on the network which have low fault levels relative to the size of the device it is possible for the storage device to have an impact on the Marginal Loss Factor (MLF). Preliminary investigations indicated that the possible commercial impact of this effect is minor compared to the possible revenue that could accrue from arbitrage, although more complex simulations were performed as the siting options consolidated..
To assess the impact that a storage device has on a local MLF involves complex load flow and dispatch calculations which are detailed in the Appendix D to this Report.
MLF modification as a side effect to operation to maximise revenue due to arbitrage
The results obtained in the simulation studies were based on the historical power flows near each location. It was assumed that the device is dispatched to maximise its arbitrage value, and the MLF benefits occur as a side effect. (I.e. the device is not dispatched to maximise the MLF benefit).
MLF modification assuming storage dispatched to maximise MLF benefits
Simulations were also conducted to investigate the impact on MLF’s at Wattle Point (Dalrymple) and Cathedral Rocks (Port Lincoln) assuming the device is dispatched solely to maximize benefits to local MLF’s.
4.3.3 Network Augmentation Capital Deferral
The operation of an ESD can be configured to provide additional effective network capacity and defer significant network augmentation. The ESD can achieve this by exporting power at times of high local network demand, when the local network would otherwise be constrained (e.g. by the thermal rating of network plant).
South Australia has a very peaky electricity demand profile due to its extreme weather conditions and increasing solar PV penetration - an extreme electricity demand might occur only few hours a year. Where network augmentations are proposed to prevent power interruption for relatively short periods of time in a year, these network augmentations might be able to be deferred with an appropriately configured ESD.
The Net Present Value (NPV) of a project represents the aggregate future project costs and benefits discounted back to the value of money today. The potential maximum benefit of network augmentation deferral is the difference between a project’s NPV in the proposed project year compared to a deferred project year.
The proposed project year, , is the project timing published in ElectraNet’s annual planning report. The deferred project year, , is determined based on the demand forecast from SA Power Network and the capacity of an energy storage device. ElectraNet’s internal cost estimate is used to determine the project cost. A 10% discount rate, , is applied for the NPV calculation in line with common practice within the Australian electricity industry.

ESCRI-SA MILESTONE 2: SITE SELECTION January 2015
ESCRI-SA Site Selection Report - Ver 1 - Issue 1.docx Version 1.0 Page 22 of 59
The total potential benefit is then calculated as following:
1
1
If the ESD can defer the need for network augmentation for the foreseeable future, then the potential annual benefit is equivalent to the annualised project cost.
If the identified network limitation can be most economically resolved by a non-network solution, the annual benefit attributable to the ESD device for the deferral of network augmentation is equivalent to the annualised cost of the avoided augmentation project.
The actual maximum benefit available is the total potential benefit reduced by any network expenditure that is required to facilitate the required response from the ESD (e.g. telecommunications).
The network augmentation deferral benefit is driven by the demand foreseen at the time of assessment; the actual benefit might change due to updates to demand forecasts.
Currently, no South Australian transmission network augmentation that could be deferred with an ESD has been identified within the foreseeable future. However, there are scenarios where future augmentation may be driven by the connection of a new large customer, or by the expansion of an existing large customer.
Voltage Control Limitations – Low Voltage
ElectraNet has an obligation to maintain the voltage level on transmission network within the range 95% to 105% of the nominal voltage under system normal conditions, and within the range 90% to 110% of the nominal voltage from five seconds after a single credible contingency event.
Depending on the technology, an energy storage device might have the capability to provide voltage support when needed. Conventional reactive support devices such as capacitor banks and static VAR compensators (SVC) are widely used across ElectraNet’s transmission network to address potential low voltage limitations. An energy storage device can be considered as an alternative solution to conventional reactive support devices.
If a low voltage limitation has been identified at a particular connection point, the annual benefit of an ESD providing equivalent voltage support is the annualised cost of the conventional capacitive reactive support device that would otherwise be required to address the same limitation.
The actual maximum benefit available is the total potential benefit reduced by any network expenditure that is required to facilitate the required response from the ESD (e.g. telecommunications).

ESCRI-SA MILESTONE 2: SITE SELECTION January 2015
ESCRI-SA Site Selection Report - Ver 1 - Issue 1.docx Version 1.0 Page 23 of 59
Voltage Control Limitations – High Voltage
ElectraNet experiences high voltage limitations under light load conditions frequently in recent years. This is due to lower system minimum demand alone with increasing solar PV installation and wind generation. Reactors (which consume reactive power) are installed across ElectraNet’s network to address high voltage limitation.
An energy storage device acts as a load when it is charging. Depending on the capacity, the energy storage device could manage the high voltage limitation by increasing the net demand at a connection point.
Similar to the situation for low voltage limitations, the annual benefit an ESD may provide, in addressing high voltage limitations, is the annualised cost the conventional inductive reactive support device that would otherwise be required to address the same limitation.
The actual maximum benefit available is the total potential benefit reduced by any network expenditure that is required to facilitate the required response from the ESD (e.g. telecommunications).
4.3.4 Localised Frequency Support
Many renewable generation sources such as wind turbines and solar photovoltaics typically rely on the availability of a synchronising frequency from the grid. On occasions of interruption to grid supply, such sources of generation will be unable to continue to generate, and must remain out-of-service until grid supply is restored.
It may be possible to configure an ESD to maintain a frequency reference when supply from the grid is unavailable. This may make it possible for local wind farms and solar PV installations to remain connected, so as to continue to supply local load following an interruption as an islanded system.
This benefit is realisable at times when the average aggregate generation output (this could be wind, solar and/or other renewables, or combinations of these with other generation types) approximately matches or exceeds the local demand while supply from the grid is unavailable. The ESD could then be configured to make up any difference, to the extent possible until the supply of stored energy is exhausted.
The quantification of the value of this benefit to the wind farm generator is based on a determination of the expected duration for which grid supply is likely to be unavailable in a typical year. This determination can be based on the network configuration and typical outage statistics.
The value of the benefit to the generators is determined as the value of locally-produced energy that would otherwise be spilt. It most naturally accrues directly to the generator, and can be quantified using an assumed energy value - say $70 per MWh of supplied energy (including RECs) for a wind farm, and so forth depending on generation type.
Additional benefits will accrue through the avoidance of local load shedding; those benefits are considered separately, in the following section.

ESCRI-SA MILESTONE 2: SITE SELECTION January 2015
ESCRI-SA Site Selection Report - Ver 1 - Issue 1.docx Version 1.0 Page 24 of 59
4.3.5 Expected Unserved Energy Reduction
An ESD can act as an alternative supply during a power outage. Power interruptions at the connection point level are typically caused by a transmission line outage or a transformer outage, especially for radial connection points. A probabilistic approach is used to estimate the expected unserved energy at a given connection point or group of connection points, taking into account the substation arrangement and historical outage data.
These two types of outage are considered when calculating unserved energy:
1. Planned outage (Maintenance); and
2. Forced outage (Fault).
Typical data is used for the frequency and duration of each type of outage.
Both transformers and lines are assumed to be equally likely to fail at any level of demand. The historical load duration curve is then used to estimate the average unserved energy.
Support from the distribution network is also taken into account to estimate a more realistic unserved energy value. In some regions, the distribution network might be able to be switched so that part of the load can be supplied from another connection point following completion of the switching operation.
The unserved energy calculation uses the native demand of a connection point, which is higher than the apparent demand measured at the NGM meter. This is due to solar PV generation embedded in the distribution network. As solar PV does not typically continue to operate during a power outage, the additional energy that is unsupplied by the solar PV systems is included in the calculation of unsupplied native demand.
The state average Value of Customer Reliability (VCR) of $38,090/MWh, in accordance with AEMO’s Value of Customer Reliability review published on 30 September 2014, is used unless stated otherwise.
Factors that could affect this class of benefits include the amount of energy stored in the ESD at the time of an outage, the actual duration of the outage and the actual VCR of the affected customers. For quantification of this potential benefit, it has been assumed that the ESD is 50% charged at the time of an unplanned outage.
4.3.6 Heywood Interconnector Constraint Reduction
The market benefit assessment for the Heywood Interconnector Upgrade RIT-T found the gross benefits of a “firm” 1 MW improvement to the Heywood Interconnector transfer capacity was $1.9 million (total), over the forecast horizon of 40 years.
An ESD could provide an effective increase in interconnector capacity. At times when import into South Australia is constrained, a release of stored energy from the ESD would reduce the fuel costs in South Australia, which are typically more expensive than the fuel costs in Victoria at those times. At times when export from South Australia is constrained, the ESD could take on additional stored energy produced by South Australian generation, which would typically be cheaper than Victorian generation at those times. Compared to a firm increase in transfer capacity, the benefit that could be provided by an ESD per MW of storage will be less than that which would be provided by

ESCRI-SA MILESTONE 2: SITE SELECTION January 2015
ESCRI-SA Site Selection Report - Ver 1 - Issue 1.docx Version 1.0 Page 25 of 59
a firm increase to the interconnector transfer capacity, as the benefit will no longer be available once the storage capacity of the ESD has been exhausted.
The effect of the energy-limited nature of the ESD on the benefit value that can be realised can be estimated based on the duration of consecutive constraints, i.e. how frequently did the interconnector bind consecutively for 1 hour, 12 hours, 24 hours etc.
This approach is consistent with the approach used to determine net market benefits through application of the RIT-T. The net benefits, if sufficient, could justify the inclusion of an ESD as part of ElectraNet’s regulated asset base.
4.3.7 Murraylink Interconnector Constraint Reduction
The Western Victorian 220 kV transmission network supplies the regional loads at the Ballarat, Bendigo, Fosterville, Glenrowan, Horsham, Kerang, Red Cliffs, Shepparton and Wemen Terminal Stations. This transmission network has limited network capacity, and the most critical limitations are the Moorabool - Ballarat No.1 line loading limitation and the Ballarat–Bendigo line loading limitation. Murraylink Interconnector is one of four transmission network connections to the Western Victorian 220 kV transmission network.
To support the Western Victorian 220 kV network during high Western Victorian demand conditions, it is advantageous for the Murraylink Interconnector to export power to Victoria from the Riverland 132 kV network. Murraylink’s export capacity is limited by ElectraNet’s Riverland 132 kV network capacity. Load supplied from the Western Victorian 220 kV network was at risk for an average of 15.83 hours per year over 2013 and 2014. The load at risk could be alleviated if higher exports across Murraylink from South Australia to Victoria were possible
An ESD at Monash can support higher transfers across Murraylink into the Victorian 220 kV network. The value of the potential benefit provided by the reduction of expected USE in Victoria by the operation of the ESD is the total energy expected to be supplied to the Victorian 220 kV network by the ESD via Murraylink at times when both the Riverland 132 kV and the West Victorian 220 kV networks are constrained. The benefit is calculated as the saved expected USE, multiplied by the relevant VCR.
4.3.8 Local Generator Constraint Reduction
Non-Scheduled renewable generators (especially early wind farm development) at remote locations may be constrained by the local TNSP (ElectraNet) using a Generator Dispatch Limiter (GDL) or a similar control scheme to avoid various network issues. The scheme may differ from location to location. Such generators have to spill energy while constrained; a local EDS could take an advantage by storing the un-utilised energy to prevent the spill. This benefit class does not cover price arbitrage, nor inter-regional constraints.
SCADA and Nation Grid Metering (NGM) data over a three-year period was used to estimate the energy spill due to such local generator constraints. A GDL or similar control scheme calculates the maximum generation limit based on information such as network configuration, line ratings and weather conditions regularly and sends a signal to the non-scheduled generator; the generator needs then to adjust its output so that it does not exceed this limit. Unfortunately, the exact spilled energy is not recorded. But the following information can be used to estimate the energy spill:

ESCRI-SA MILESTONE 2: SITE SELECTION January 2015
ESCRI-SA Site Selection Report - Ver 1 - Issue 1.docx Version 1.0 Page 26 of 59
Actual generation (30 minutes energy) – NGM
GDL Limits – SCADA
Energy availability forecast – SCADA
A generator participating in the electricity market has a NGM which records the actual energy output for each dispatch interval. If the GDL is implemented by the TNSP, the GDL limit is recorded in the SCADA. In addition, a non-scheduled generator may (but is not required to) forecast its energy availability; the TNSP records this information in the SCADA system if available.
A non-scheduled generator has no obligation to provide as much energy as it claims, and such a generator tend to over forecasts its energy availability. Consequently, it is difficult to determine the exact time which a non-schedule is actually constrained. However, it is possible to determine the time which such generator is definitely not constrained.
The energy spill is the difference between the actual energy availability and the actual energy generation. The actual energy availability is first estimated by scaling down the forecast (claimed) energy availability. A scaling factor for each generator is determined by comparing the claimed energy availability and the actual energy output during the time while the generator is definitely not constrained.
Once the energy spill is estimated, the benefit is the estimated energy spill multiplied by the prevailing wholesale electricity price plus RECs (assume say a total $70/MWh), then averaged over the three years.
For quantification of this potential benefit, it has been assumed that an ESD can capture the maximum potential benefit. However, a 10 MW, 50 MWh ESD might not be able to capture the total spilt energy due to size, capacity or other technical limitations.
4.3.9 Grid Support Cost Reduction
The grid support cost reduction benefit class covers existing contracted grid support. The potential benefit arises in two forms:
Reduction in operational costs due to the ESD displacing some (or all) of the energy requirements from the grid support contract; and
Potential for the ESD to reduce the size of contracted grid support when the contract comes up for renewal.
These two potential benefits are discussed in turn below.
Definitely constrained
Maybe Constrained (Unknown)
Definitely not
constrained

ESCRI-SA MILESTONE 2: SITE SELECTION January 2015
ESCRI-SA Site Selection Report - Ver 1 - Issue 1.docx Version 1.0 Page 27 of 59
Reduction in operational cost
An ESD has the capability to reduce the operational cost of contracted grid support if it is located on the same network that relies on said grid support. Typically grid support is provided by diesel powered generation, and for the purposes of quantifying the available benefit, the energy supplied by an ESD will be valued at an average of $300/MWh1
Methodology:
The value of the reduction in annual operational cost is determined by multiplying the average annual number of dispatches of generation support over the last three years with half the capacity of the ESD. (It is assumed the ESD is also used for other purposes and half the capacity will generally be available should grid support be required.
Similar to USE, the ability to access this benefit depends on the energy stored in the ESD at the time of an unplanned outage. The working assumption used for quantification is that the ESD will be 50% charged on average, but this might vary depending on the selected operational strategy for the ESD.
Reduction in size of contracted grid support
This benefit is limited to where an ESD can reduce the size of contracted grid support when the contract comes up for renewal. Future or additional grid support is assessed as part of the network augmentation capital deferral benefit class.
The benefit an ESD may provide has to be assessed whether it can reduce the size of the contracted grid support, followed by an assessment whether the size reduction is expected to result in a proportional reduction of the annual fixed fee. Since the value of this potential benefit is heavily dependent on the possible reduction that can be negotiated with the incumbent grid support provider, this benefit has not been further assessed for this Report.
4.3.10 System Frequency Support
Preliminary investigations indicated that the possible commercial impact of this effect is minor compared to the possible revenue that could accrue to a storage device from arbitrage. Further detail is provided in section 5.6.10.
4.3.11 Avoided Wind Farm FCAS Obligation
Similarly to the section above, preliminary investigations indicated that the possible commercial impact of this effect is minor compared to the possible revenue that could accrue to a storage device from arbitrage. Further detail is provided in sections 5.6.10 and 5.6.11.
1 Table 28, p73, Lower Eyre Peninsula Technical Network Options Analysis Report

ESCRI-SA MILESTONE 2: SITE SELECTION January 2015
ESCRI-SA Site Selection Report - Ver 1 - Issue 1.docx Version 1.0 Page 28 of 59
5. Site Assessment
This chapter presents how potential sites were screened and shortlisted by discussing the following:
Sites that may have been suitable but were excluded because they were out of scope;
Initial screening of all transmission connection point sites in South Australia;
Second-stage screening to determine shortlisted sites;
Locality factors for short-listed sites; and
Potential value of available benefits at short-listed sites.
The above-mentioned topics are covered in turn below.
5.1 Sites Excluded
The ARENA Measure (this project) “covers the development of a detailed business case for deploying a grid-connected utility scale non-hydro energy storage system in South Australia specifically designed to facilitate the integration of intermittent renewable energy into the National Electricity Market (NEM)”. This scope, as well as the composition of the consortium, suggests that transmission connection points or wind farms in South Australia are the focus area for potential sites. Wind farms are also the only primary large scale renewable energy generation on the South Australian market, and while aggregated roof-top PV is a sizeable renewable generation source, the aggregation process is significantly complex and the installations significantly small that such were not considered. Small scale distributed storage itself is discussed further below.
Sites outside of South Australia and distribution network connections have not been considered. However, for completeness, a few sites of this type are briefly discussed below that may warrant consideration in future.
5.1.1 Sites outside of South Australia
The Oaklands Hill wind farm in Western Victoria would benefit more than most from having energy storage on site. The installed capacity of this wind farm is 67 MW, but network limitations usually constrain generation output to less than 63 MW, often in summer to between 55 MW and 60 MW, and sometimes such as days of a total fire ban down to 42 MW. The above values indicate that an ESD may demonstrate good benefits to the Oaklands Hill wind farm in reducing local generator constraints. In addition an ESD may also assist with potential network issues.
5.1.2 Distribution network connections
Although distribution network connections have not been considered in this project, the following distribution applications may benefit from closer analysis:
In the Adelaide Metropolitan area distributed small-scale storage is expected to be more feasible. The suitability of a utility scale ESD will depend on a variety of factors, especially the availability of space in the metropolitan area.

ESCRI-SA MILESTONE 2: SITE SELECTION January 2015
ESCRI-SA Site Selection Report - Ver 1 - Issue 1.docx Version 1.0 Page 29 of 59
The electricity supply to Kangaroo Island is currently dependent on a radial 33 kV undersea cable. SA Power Networks operates a small power station at Kingscote to supply the island in the event of loss of supply from the mainland. An ESD would be of limited use with the current network configuration. However, combining the power station output, ESD, renewable energy and additional controls could potentially mimic the installation on King Island (albeit at a larger scale).
The Fleurieu Peninsula south of Adelaide has a very high penetration of rooftop solar PV installations resulting at times in backfeed into the 66 kV supply to Victor Harbor. A utility scale ESD may be an option to assist voltage management in SA Power Networks’ sub-transmission network where there is space available.
5.2 Initial Screening
The initial screening identified the following 16 sites, across six broad regions:
Region Site
Eyre Peninsula Port Lincoln Terminal
Yadnarie
Wudinna
Mount Millar
Mid North (Yorke Peninsula 132 kV network) Dalrymple
Ardrossan West
Snowtown
Mid North (Meshed 132 kV network) Robertstown
Waterloo
Mid North (275 kV Main Grid) Belalie
Blyth West
Canowie
Mokota
Riverland Monash
North West Bend
South East South East
The table showing the initial assessment of all sites reducing to the above 16 is in Appendix A.
5.3 Second-Stage Screening
Yorke Peninsula sites (Ardrossan West and Dalrymple) were considered both with and without the potential connection of Hillside copper mine because this development significantly changes network loading.
Although no metropolitan sites passed the initial screening, Para was included as a representative site to confirm it would have a relatively low ranking when scored.

ESCRI-SA MILESTONE 2: SITE SELECTION January 2015
ESCRI-SA Site Selection Report - Ver 1 - Issue 1.docx Version 1.0 Page 30 of 59
The second stage screening identified that the highest ranked sites were all located on the Eyre Peninsula, Yorke Peninsula and in the Riverland.
The top sites with and without the Hillside copper mine development are shown in the following table.
Rank With Hillside copper mine Without Hillside copper mine
1 Port Lincoln Terminal (Eyre) Port Lincoln Terminal (Eyre)
2 Dalrymple (Yorke) Yadnarie (Eyre)
3 Ardrossan West (Yorke) Dalrymple (Yorke)
4 Yadnarie (Eyre) Mount Millar (Eyre)
5 Mount Millar (Eyre) Ardrossan West (Yorke)
6 Wudinna (Eyre) Wudinna (Eyre)
7 Monash (Riverland) Monash (Riverland)
8 North West Bend (Riverland) North West Bend (Riverland)
For the Eyre and Yorke Peninsula these finding can largely be explained by:
the radial nature of the existing transmission networks;
the low capacity of the existing transmission networks;
the high impedance of the existing transmission networks;
the losses associated with the existing transmission networks; and
the existing wind farms / conventional generators connected to these networks.
The Eyre Peninsula (Port Lincoln Terminal) was ranked first, higher than the Yorke Peninsula due to the additional requirement to supply load via contracted generation under line outage conditions.
Sites in the Riverland were ranked next, after the Eyre and Yorke Peninsula, due to low connection difficulty and the potential for reduced Murraylink interconnection constraints.
From the above it was concluded that three sites should be chosen, one in each geographic area, to optimise the site choice in a more rigorous and detailed analysis.
The following sites were chosen as being the highest ranked in each area:
Eyre Peninsula - Port Lincoln Terminal substation;
Yorke Peninsula – Dalrymple substation; and
Riverland – Monash substation.
The table showing this weighting, scoring and ranking can be found in Appendix B.
Maps which indicate the location of each of the three shortlisted sites, along with aerial views of the three sites, are provided in Appendix C.

ESCRI-SA MILESTONE 2: SITE SELECTION January 2015
ESCRI-SA Site Selection Report - Ver 1 - Issue 1.docx Version 1.0 Page 31 of 59
5.3.1 Sensitivity Analysis
Sensitivity analysis of the weighting and scoring indicated that the identified sites on the Eyre Peninsula, Yorke Peninsula and in the Riverland consistently presented as being top ranked.
5.4 Locality Factors for Short-Listed Sites
5.4.1 Port Lincoln Terminal Substation
The substation is located approximately 7 km north-west of City Port Lincoln on Eyre Peninsula. Port Lincoln is approximately 645 km from Adelaide by road. The site has good access from Flinders Highway with land use near the substation consisting of rural living with small cropping activities.
Port Lincoln Terminal Substation site has both ElectraNet (132 kV) and SA Power Networks (33 kV) infrastructure. ElectraNet owns the land where it has HV asset and also a substantial parcel of land to the north and east of the substation (10 Ha plus).
It is envisaged that development approval would be required from relevant planning jurisdiction either State Development Assessment Commission or local councils for any facilities on ElectraNet land but outside the Port Lincoln Terminal substation boundary. Environmental and cultural heritage risks are relatively low due to the current land use nature.
5.4.2 Dalrymple Substation
The substation is located approximately 7 km south-west of Stansbury Township on Yorke Peninsula. Stansbury is approximately 200 km from Adelaide by road. The site has good access from St Vincent Highway with land use near the substation consisting of rural living with cropping and grazing activities.
Dalrymple Substation site has both ElectraNet (132 kV) and SA Power Networks (33 kV) infrastructure. ElectraNet owns the land where it has HV asset and also a large parcel of land to the north and south of the substation (40 Ha plus).
It is envisaged that development approval would be required from relevant planning jurisdiction either State Development Assessment Commission or local councils for any facilities on ElectraNet land but outside the Dalrymple substation boundary. There is native vegetation present on ElectraNet land that will require permission from the SA Native Vegetation Council and Department of Natural Environment and Resources if native vegetation is to be removed for construction purpose. Cultural heritage risks are relatively low but would require some due diligence assessment.
5.4.3 Monash Substation
The substation is located approximately 4 km north of Berri Township in the Riverland. Berri is approximately 240 km from Adelaide by road. The site has good access from Sturt Highway with land use near the substation consisting of cropping and agricultural industry activities.
Monash Substation site has ElectraNet (132 kV and 66 kV) infrastructure. ElectraNet owns the land where it has HV assets and does not own any additional land in the

ESCRI-SA MILESTONE 2: SITE SELECTION January 2015
ESCRI-SA Site Selection Report - Ver 1 - Issue 1.docx Version 1.0 Page 32 of 59
substation vicinity. The Substation is also the connection point for the DC Murraylink Interconnector with Victoria. The Murraylink Converter Station is adjacent to the Monash Substation.
There is some land available within ElectraNet substation site which could be utilised for the ESCRI-SA. It is envisaged that development approval would be required from relevant planning jurisdiction either State Development Assessment Commission or local councils for any facilities on ElectraNet land but outside the Monash substation boundary. There is native vegetation present on ElectraNet land that will require permission from the SA Native Vegetation Council and Department of Natural Environment and Resources if native vegetation is to be removed for construction purpose. Cultural heritage risks are relatively low but would require some due diligence assessment.
5.5 Assessment of Benefits at Short-Listed Sites
5.5.1 Potential Value of Available Benefits
The following table shows a summary of the benefits based on a 10 MW, 50 MWh device at each of the top-ranked sites.
Benefit
Potential benefit value [$’000 p.a.]
Port Lincoln
Dalrymple Monash
1 Price Arbitrage Value 1 124 963 1 239
2 MLF Impact 32 -89 N/A
3
Network Augmentation Deferral
Thermal
Low Voltage
High Voltage
N/A 235 N/A
4 Localised Frequency Support 70 10 N/A
5 Expected Unserved Energy (USE) reduction 283 84 N/A
6 Heywood Interconnector Constraint Reduction 818 818 818
7 Murraylink Interconnector Constraint Reduction N/A N/A 352
8 Local Generator Constraint Reduction 75 121 N/A
9 Grid Support Cost Reduction 16 N/A N/A
10 System Frequency Support 5 5 5
11 Avoided Wind Farm FCAS Obligation 5 5 N/A
TOTAL 2 428 2 152 2 414

ESCRI-SA MILESTONE 2: SITE SELECTION January 2015
ESCRI-SA Site Selection Report - Ver 1 - Issue 1.docx Version 1.0 Page 33 of 59
5.6 Calculation of Available Benefits
This section provides a summary of the calculations performed to determine the available benefits at short-listed sites. Given the high-level assumptions made in certain instances and limited data availability for others, these benefit calculations should be treated as indicative at this stage. The calculations for relevant benefit classes progressing to the business case will be refined as the Project progresses.
Where the benefit calculation consisted of more detail, these calculations can be found in the Appendices.
5.6.1 Price Arbitrage Value
The calculated simulations are based on historical market behaviour for the period of October 2013 through to October 2014. Accordingly it should be noted that if the market behaviour changes, the possible revenue that a hypothetical device could generate will also change. A full financial risk assessment should include possible changes in market behaviour, however the point should be noted that creating revenue from arbitrage depends on market price volatility not on the average cost of power.
It was found that significant possible revenue can be obtained if:
the unit is dispatched as a generator whenever the pool price is a threshold above the median price calculated for the previous 24 hour period.2
The unit is dispatched as a load whenever the pool price is below a set threshold of the median price calculated for the previous 24 hour period.
The possible revenue that the simulations indicate could have been obtained for the period of October 2013 to October 2014 period if a device were already installed is tabulated below:
Assumed Ratio of Storage (MWh) to Power (MW) Rating
(hours of Storage)
Simulated Optimum Annual Revenue per MW of device rating
1 $ 5 176 (~ $ 5 k)
2 $12 715 ( ~ $12.7 k)
6 $ 24 925 (~ $ 24.9 k)
10 $ 47 870 ( ~ $ 48 k)
14 $ 63 749 (~ $ 63.7 k)
20 $ 96 536 ( ~ $ 96.5 k)
25 $ 99 386 ( ~ $ 99 k)
35 $ 102 429 ( ~ $ 102 k)
48 $ 115 924 ( ~ $ 116 k)
60 $ 129 161 ( ~$ 129 k)
2 Slightly better results can be obtained if it is assumed that median pool prices can be predicted one day ahead – but this was not considered in the simulation results.

ESCRI-SA MILESTONE 2: SITE SELECTION January 2015
ESCRI-SA Site Selection Report - Ver 1 - Issue 1.docx Version 1.0 Page 34 of 59
As can be seen from the Table, the possible revenue that can be obtained is proportional to both the size of the device and the amount of storage capacity. The Table also indicates that if the ratio of storage to rating is higher than 20 the advantages of additional storage capacity are subject to a law of diminishing returns. This appears to be because most of the variation on pool price occurs over a daily (24 hour) cycle. Accordingly having a storage capacity of nearly 24 hours allows the device to be able to take advantage of most arbitrage opportunities. Plotting the simulated incomes on a chart (as shown below) clearly shows this behaviour:
The results are based on a relatively simple dispatch strategy and it may be possible to improve the performance of the smaller storage scenarios using market predictive techniques but the possible enhancement in revenue is not likely to be large.
Depth of discharge considerations
All systems based on electrochemical processes will be sensitive to equipment deterioration due to depth of discharge. This varies according to the type of battery that is used but in principal the life of all battery banks is generally inversely proportional to the depth of discharge each cycle. Fortunately for the dispatch strategy that is considered in the simulations, the depth of discharge is typically relatively small (~ 10 -20 %) for each cycle. When reliable costing information becomes available, the effect of the dispatch strategy on the equipment wear and tear due to cycling will be assessed further to optimise the revenue vs. the operating costs of the device.
The effect of Marginal loss factors on revenue obtained from Arbitrage
To a first approximation the MLF at the connection point of the device will have no impact on the revenue that is accrued due to arbitrage because the revenue depends on the difference between buying and selling prices of electric power. However, a more detailed analysis reveals this is not strictly true, as the following argument shows.
Case 1: MLF = 1
Assume the buy price is $ 15 per MWh
Sell price is $ 50 per MWh
Profit = 1 x 50 – 1 x 15 = $ 35 per MWh.

ESCRI-SA MILESTONE 2: SITE SELECTION January 2015
ESCRI-SA Site Selection Report - Ver 1 - Issue 1.docx Version 1.0 Page 35 of 59
Case 2: MLF = 1.1
Buy and sell pool price is the same but now it is multiplied by the MLF of 1.1
Profit for case 2 is 1.1x 50 – 1.1 x 15 = $ 38.50 per MWh = 1.1 x $ 35.
Therefore, the revenue that can be obtained due to arbitrage is multiplied by the loss factor at the connection point. This implies that storage devices are best situated in regions of the grid which have large MLF values which tends to be where the loads are located and sites remote from generation sources.
In the event that the device does not share its network connection point with a significant load or generation source, i.e. the transmission network connection point is such that the net energy balance (NEB) is less than 30%; then the device is likely to be subject to two MLF’s; one to apply when it is dispatched as a generator and one to apply when it is dispatched as a load. Pump storage systems on the NEM already operate under this arrangement.
The effect of two MLF’s is to add an operating cost as the MLF when it operates as a generator is invariably lower than when it is dispatched as a load. In effect the dual MLF system acts in a similar manner to the losses incurred by the device during the charge and discharge cycles with respect to its effect on revenue.
For example case 2 above may be modified as follows when two MLFs are in use:
Case 2A: assuming MLF = 1.09 when the storage device is dispatched as a generator and 1.11 when dispatched as a load
Buy and sell pool price is the same as for case 2 above, but now they are multiplied by the MLF of 1.09 or 1.11
Profit for case 2 becomes 1.09 x 50 – 1.11 x 15 = $ 37.85 per MWh = 1.08 x $ 35.
In general the effective final factor (in this case 1.08) will be less than the factor that would result due to one MLF only.
The expected revenue due to base arbitrage will be the same for all locations within SA, but will be modified by the specific MLF regime that applies where the device is connected.
Different revenues would be calculated for other market regions because they have different regional markets.
Further background is available in Appendix D.
5.6.2 Modification of System MLFs
Modification of MLF as a side effect to Arbitrage
The Figures below summarize the results of these calculations (see Appendix D) for two considered site locations and various device ratings.
For location of a storage device at Port Lincoln substation, the following effect on MLFs is expected:

ESCRI-SA MILESTONE 2: SITE SELECTION January 2015
ESCRI-SA Site Selection Report - Ver 1 - Issue 1.docx Version 1.0 Page 36 of 59
Some notes on these figures are provided as follows:
The vertical axis specifies the rating of the device in MW; i.e. the maximum rate at which the proposed device can charge or discharge power at the point of connection.
The horizontal axis indicates the ratio of storage capacity to rating; e.g. if the device is rated to 10 MW (y-axis) and has a storage size ratio of 10, this implies its physical storage is 10 x 10 = 100 MWh. Whereas if the rating is 5 MW and the storage size ratio is 10, this implies a physical storage of 5 x 10 = 50 MWh. This also corresponds to the number of hours of storage capacity (at peak power).
The coloured contours represent the factor by which the MLFs are affected. I.e. to estimate the actual MLF at the connection points use the existing MLF and multiply by the estimated factor.
For a storage device at Port Lincoln, it can be seen that the MLF will generally be modified to increase it from its existing value. However, there are also instances of size and storage capacity where the MLF will be decreased. This can occur because the device is not necessarily dispatched to reduce system losses – it is dispatched to optimise the value from arbitrage.
In 2014/15 the MLF at Cathedral rocks windfarm is 0.8774, the graph above indicates that a 10 MW, 200 MWh (coordinates x = 20, y = 10) storage device could change this to 0.8774 x 1.02 = 0.8949.
For location of a storage device at Dalrymple substation the following figure applies:

ESCRI-SA MILESTONE 2: SITE SELECTION January 2015
ESCRI-SA Site Selection Report - Ver 1 - Issue 1.docx Version 1.0 Page 37 of 59
It can be seen that the degree to which the MLF can be affected by a storage device is different depending on the location. This is because the power flows in a given location are different due to local load and generation behaviour.
As a generalisation, if a storage device is dispatched in order to maximise its value due to arbitrage – this will tend to cause it to behave as a generator during periods of high system demand, and as a load during periods of low system demand. This tends to reduce the system losses which mean that MLFs at a given location are modified so they are closer to unity; however, this is by no means definitive, and each case should be analysed separately.
For these particular cases the commercial value of changes to the MLF would accrue to the local generation at Wattle Point and Cathedral rocks.
A simplified calculation indicates that the overall annual benefit would be of the following order of magnitude (the example calculations are based on a 10 MW and 200 MWh, i.e. 20 hour, device rating):
Windfarm Rating
(MW) Assumed wind farm capacity factor
Average hourly rate (incl. RET)
Change in MLF (from figures above)
Annual Benefit/ loss
Cathedral Rocks 66 30% $75/MWh 2% $130 k
Wattle Point 91 30% $75/MWh 1.5 % $269 k
If the storage capacity is reduced, a simplified calculation indicates that the overall annual benefit/loss would be of the following order of magnitude (in this example, calculations are based on a 10 MW and 50 MWh, i.e. 5 hour, device rating):

ESCRI-SA MILESTONE 2: SITE SELECTION January 2015
ESCRI-SA Site Selection Report - Ver 1 - Issue 1.docx Version 1.0 Page 38 of 59
Windfarm Rating (MW)
Assumed wind farm capacity factor
Average hourly rate (incl. RET)
Change in MLF (from figures above)
Annual Benefit/loss
Cathedral Rocks 66 30% $75/MWh 0.25% $32 k
Wattle Point 91 30% $75/MWh -0.5 % -$89 k
The overall reduction in system losses would be of benefit to all market participants but cannot be easily captured by a storage project.
Dispatching the device to maximise Modification of system MLFs
The following figure shows the expected change in MLF at Dalrymple assuming the device is always large enough to fully clip the output of Wattle Point wind farm. The figure indicates that the MLFs are modified according to a quadratic relationship with the device size.
The storage requirements of a device dispatched in order to modify MLFs for windfarms depend on the percentage of time the device has enough capacity to fully clip the output of the windfarm when it is operating at high power levels. This is represented in the chart below where 10%, 50%, 80% and 90% quantiles are shown.

ESCRI-SA MILESTONE 2: SITE SELECTION January 2015
ESCRI-SA Site Selection Report - Ver 1 - Issue 1.docx Version 1.0 Page 39 of 59
The chart above indicates a law of diminishing returns as additional storage capacity is added. For example – the large increment required to go from 80% coverage to 90% coverage may make the storage installation more cost effective if it is built for a lower storage rating.
A similar analysis was carried out for Cathedral Rocks but in that case the issues were complicated by the existing voltage constraint issues that occur on the 132 kV line between Port Lincoln and Port Augusta. In effect, before any MLF benefits can be realized on this line, the storage device provides benefits in the form of relieving network constraints.
A simplified calculation indicates that the overall annual benefit would be of the following order of magnitude (the example calculations are based on a 10 MW and 110 MWh, i.e. 11 hour, device rating):
Windfarm Rating
(MW) Assumed wind farm capacity factor
Average hourly rate (incl. RET)
Change in MLF (from figures above)
Annual Benefit/ loss
Cathedral Rocks 66 30% $75/MWh 1.8% $234 k
Wattle Point 91 30% $75/MWh 1.8 % $323 k
If the storage capacity is reduced, a simplified calculation indicates that the overall annual benefit/loss would be of the following order of magnitude (in this example, calculations are based on a 10 MW and 50 MWh, i.e. a 5 hour, device rating):
Out[59]=
105080
90

ESCRI-SA MILESTONE 2: SITE SELECTION January 2015
ESCRI-SA Site Selection Report - Ver 1 - Issue 1.docx Version 1.0 Page 40 of 59
Windfarm Rating
(MW) Assumed wind farm capacity factor
Average hourly rate (incl. RET)
Change in MLF (from figures above)
Annual Benefit/loss
Cathedral Rocks 66 30% $75/MWh 0.9% $117 k
Wattle Point 91 30% $75/MWh 0.9 % $161 k
To realize these benefits will require significant forgoing of possible arbitrage opportunities.
The overall reduction in system losses would be of benefit to all market participants but cannot be easily captured by a storage project.
Further background is available in Appendix D.
5.6.3 Network Augmentation Capital Deferral
The only site of the final three for which an augmentation deferral benefit may be realisable is Dalrymple, with the assumed future connection of Hillside copper mine.
It has been assumed that the ESD may be able to be configured to provide voltage control at Dalrymple, which it is estimated would reduce Hillside copper mine’s capital costs by about $2 million to $3 million, by reducing the amount of voltage control equipment that would need to be installed by the copper mine proponent.
Based on an assumed capital cost saving to the Hillside copper mine proponent of $2 million, an assumed mine life of 20 years, and a yearly discount rate of 10%, the annualised capital saving can be calculated to be $235,000 per annum.
5.6.4 Localised Frequency Support
Many renewable generation sources such as wind turbines and solar photovoltaics typically rely on the availability of a synchronising frequency from the grid. On occasions of interruption to grid supply, such sources of generation will be unable to continue to generate, and must remain out-of-service until grid supply is restored. It may be possible to configure an ESD to maintain a frequency reference when supply from the grid is unavailable. This may make it possible for local wind farms and solar PV installations to remain connected, so as to continue to supply local load following an interruption as an islanded system.
Port Lincoln
Based on the configuration of the transmission network that supplies Port Lincoln and typical outage rates for 132 kV lines, grid supply to Port Lincoln is expected to be unavailable for an average of 2.28 hours for unplanned outages (over 1.82 events per annum), and 90.6 hours for planned outages each year.
With the additional frequency control that could be provided by an ESD at Port Lincoln, it has been assumed that the Cathedral Rocks wind farm would be able to continue to generate at least up to the value of the Port Lincoln local demand during the total duration of both planned and unplanned outages. Based on 2014 calendar year data, this would amount to about 996 MWh of additional wind generation per annum. At an

ESCRI-SA MILESTONE 2: SITE SELECTION January 2015
ESCRI-SA Site Selection Report - Ver 1 - Issue 1.docx Version 1.0 Page 41 of 59
assumed average value of $70 / MWh for wind generation, this yields a value for this benefit of about $283,000 per annum.
Dalrymple
Assumed Method
Based on the configuration of the transmission network that supplies Dalrymple and typical outage rates for 132 kV lines, grid supply to Dalrymple is expected to be unavailable for an average of 0.88 hours for unplanned outages and 60.4 hours for planned outages each year. The average demand at Dalrymple during both planned and unplanned outages can be determined to be 166 MWh per year, based on the 2014 calendar year.
For the current system configuration, Wattle Point wind farm is unable to generate during both planned and unplanned outages.
Based on observations from the 2014 calendar year, output from the Wattle Point wind farm equalled or exceeded the local Dalrymple net demand for 84.0% of the time. The value of the additional wind farm generation that could be facilitated by the installation of an ESD at Dalrymple for the provision of frequency control has been calculated as:
Value = $70 / MWh * 166 MWh * 84.0 %
Which yields a value of about $10,000 per annum.
Alternative Method
An alternative way of enabling a wind farm to continue to generate when the transmission network was unavailable would be for the generated wind energy to be stored in the ESD, and released when network availability is later restored. Using this approach, for a 10 MW, 50 MWh ESD that stores wind energy during unplanned outages for an expected average of 0.88 hours per year, the total stored energy would be a maximum of 8.8 MWh. This yields a value for unplanned outages of $616 per year. Due to the short expected duration, assuming that the ESD would on average have only half of its capacity available at the time of an unplanned outage would not limit the energy that could be stored.
For planned outages, it may be able to be assumed that the ESD would be managed such that the full capacity would be available at the commencement of each planned outage. In this case, up to 50 MWh of wind energy could be stored during each planned outage event, for later release. This would yield a maximum value of $3,500 per planned outage event. The value of this alternative method could only exceed the value of the assumed method (above) if more than three planned outage events occurred in a single year.
It should also be noted that for this alternative method, no benefits would be available from the reduction of expected unserved energy at Dalrymple.

ESCRI-SA MILESTONE 2: SITE SELECTION January 2015
ESCRI-SA Site Selection Report - Ver 1 - Issue 1.docx Version 1.0 Page 42 of 59
5.6.5 Expected Unserved Energy (USE) reduction
Port Lincoln
Planned outages can be excluded from the calculation of this benefit, as the diesel-fired generation at Port Lincoln is typically engaged to maintain supply to the Port Lincoln demand during planned outages.
The average net demand at the Port Lincoln connection point over the 2014 calendar year was 15.8 MW. Based on 1.82 unplanned outage events per annum with an expected outage duration of 0.5 hours per event, the expected unserved energy at Port Lincoln is 14.5 MWh per annum.
Using the SA average VCR of $38,090 / MWh yields a potential value for this benefit of $69,000 per annum.
Dalrymple
Planned outages can be excluded from the calculation of this benefit value, as they are typically taken at times when the local Dalrymple demand can be supplied by the use of distribution network transfers.
The average net demand at the Dalrymple connection point over the 2014 calendar year was 2.7 MW. Based on 0.88 hours of unplanned outages per annum, the expected unserved energy at Dalrymple is 2.4 MWh per annum.
Using the SA average VCR of $38,090 per MWh yields a potential value for this benefit of $9,000 per annum.
5.6.6 Heywood Interconnector Constraint Reduction
The results of a study into the benefit of an ESD compared to a firm increase of interconnector transfer capacity indicate that, with the full capacity of a say 50 MWh ESD available at the commencement of an interconnector constraint event (i.e. full storage at the commencement of an import constraint, or empty storage at the commencement of an export constraint), an ESD would deliver about 55% of the benefits of an interconnector, i.e. $1 million per MW (total benefit over 40 years).
Based on an assumption that a 50 MWh device will on average be half-full at the commencement of an interconnector constraint event, the value of available benefits reduces by a further 20%, to $0.8 million per MW (total benefit over 45 years). This corresponds to an annual benefit of about $81,000 per MW per annum.

ESCRI-SA MILESTONE 2: SITE SELECTION January 2015
ESCRI-SA Site Selection Report - Ver 1 - Issue 1.docx Version 1.0 Page 43 of 59
5.6.7 Murraylink Interconnector Constraint Reduction
The support that a 10 MW, 50 MWh ESD at Monash could provide was estimated by running a simulation using the 5-minutes network constraint data collected in 2013 and 2014. The simulation considered the following limitation:
charge and discharge capacity,
battery size,
West Victorian 220 kV network limitation,
the Riverland 132 kV network limitation, and
Murrylink export limitation.
While the benefit appears to be significant, AEMO has also proposed several projects to address the limitations:
Stage 1: install a wind monitoring facility on the Ballarat - Bendigo 220 kV line in 2015-16
Stage 2: install the third Moorabool - Ballarat 220 kV circuit in 2017-18; and
Stage 3: up-rate the Ballarat - Bendigo 220 kV line by 2019-20
Stage 1 and 2 are under development. AEMO estimates expected USE will reduce to 138 MWh in 2017-18, after the stage 2 completion3. The appropriate solution for stage 3 is still under investigation and may further reduce the expected USE. Finally, ElectraNet is currently consulting on projects that are also expected to reduce the occurrence of Murraylink export constraints, which will correspondingly reduce predicted benefits that could accrue to an ESD. More information is required for a detailed calculation of the likely benefits of ESD in this location.
An ESD at Monash could provide the following benefits, based on constraint data collected in 2013 and 2014.
Year Constrained Hours ESD Energy
Delivery [MWh] Benefit
2013 8.25 82.50 $ 3.14 m 2014 23.42 210.00 $ 8.00 m
Average 15.83 146.25 $ 5.57 m
Following the implementation of AEMO and ElectraNet’s planned and proposed network augmentation projects, it is anticipated that the number of constrained hours each year will reduce to something in the order of 1 hour. The average historical value of this potential benefit has therefore been reduced by a factor of 15.83, to determine a rough estimate of the future value of this benefit.
3 Regional Victorian Thermal Capacity Upgrade RIT-T – Stage 3 Published in June 2014

ESCRI-SA MILESTONE 2: SITE SELECTION January 2015
ESCRI-SA Site Selection Report - Ver 1 - Issue 1.docx Version 1.0 Page 44 of 59
5.6.8 Local Generator Constraint Reduction
Wattle Point wind farm at Dalrymple and Cathedral Rocks wind farm at Port Lincoln are both non-scheduled generators. The wind farms are estimated to spill about 0.6% to 0.7% of its total energy.
Year Actual Energy
Estimated Spill %
Estimated Energy Spill
Benefit
Wattle Point
2012 255,996.73 0.76% 1,945.58 136,190.26
2013* 273,411.87 1.36% 3,718.40 260,288.10
2014 250,854.71 0.60% 1,505.13 105,358.98
Average 1,725.35 120,774.62
Cathedral Rocks
2012 176,143.54 0.55% 968.79 67,815.26
2013* 190,724.41 1.82% 3,471.18 242,982.89
2014 177,216.53 0.66% 1,169.63 81,874.04
Average 1,069.21 74,844.65
* Both wind farms had been constrained for network project works in year 2013; this year has therefore been excluded from the calculation of the average.
5.6.9 Grid Support Cost Reduction
Reduction in operational cost
Of the three shortlisted sites, Port Lincoln is the only location where grid support has been contracted. The size of this grid support is able to supply the maximum demand at Port Lincoln, which has exceeded 40 MW.
The Port Lincoln generators have been used 10 times between 2011 and 2014, including 2 planned outages for routine maintenance, 2 planned outages for network project and 6 unplanned outages. It is assumed that the network would require generation support at Port Lincoln 8 times in 3 years. The potential value of a 10 MW ESD (with 4 hours of storage) could provide is estimated at $16.0 k (0.5 x 10 x 4 x 300 x 8/3)
Given the level of grid support required, even a 30 MW ESD could be used, providing a potential benefit of $12.0 k per annum
5.6.10 System Frequency Support
To assess the impact that a storage device has on frequency support involves complex dispatch calculations which are detailed in Appendix D.
Assuming the device is designed to be relatively responsive there is no reason why it could not take part in all of the ancillary services markets (frequency and reactive power) and also be able to partially support the local grid in the event of local outages. Accordingly, whenever the device is connected to the system and operating as a generator or as a load it should also be able to play a part in the ancillary services markets.

ESCRI-SA MILESTONE 2: SITE SELECTION January 2015
ESCRI-SA Site Selection Report - Ver 1 - Issue 1.docx Version 1.0 Page 45 of 59
In order to calculate the amount of ancillary support the device can provide, the approach that was taken was to multiply the simulated device output (which is defined by the arbitrage calculations) by the value of the ancillary services market at the time.
The table below summarizes the results of these calculations for various device ratings:
Assumed Ratio of Storage (MWh) to Power
(MW) Rating Simulated FCAS Annual Revenue per MW of
device rating
1 $ 300
3 $ 400
6 $ 800
10 $ 1 300
14 $ 1 500
20 $1 700
The reason for the different revenue amounts for differing amounts of storage is due to the fact that FCAS can only be recovered if the unit is on-line at a specific power level. When storage is limited the device dispatch is more likely to be constrained.
FCAS payments are not subject to modification by Marginal Loss Factors.
FCAS payments are not sensitive to the device location within specific market regions such as South Australia.
5.6.11 Avoided Wind Farm FCAS Obligation
To assess the impact that a storage device has on frequency support for specific generators involves complex dispatch calculations.
The results in this case are expected to be identical to the section above except that the beneficiary would be the owner of the wind farm or other generator who would use the storage device to partially offset losses due to FCAS penalties.

ESCRI-SA MILESTONE 2: SITE SELECTION January 2015
ESCRI-SA Site Selection Report - Ver 1 - Issue 1.docx Version 1.0 Page 46 of 59
6. Conclusions
This Site Selection Report is a Milestone 2 deliverable of the ARENA ESCRI-SA Project. Given the iterative nature of this project, this Report should be treated as a work in progress. As uncertainties and project costs are addressed, the benefit quantifications will be refined as part of the Project business case development.
The conclusions of this Report are summarised below under the following headings:
Site Selection;
Site Selection Criteria;
Uncertainties and risks; and
Basis of Design recommendations.
Site Selection
The site assessment covered all of ElectraNet’s 88 high voltage substations. Sites outside of South Australia and sites belonging to generators or SA Power Networks were excluded from the assessment. The initial screening study considered all connection point sites in South Australia and resulted in a shortlist of 16 sites. The second stage of the screening process introduced rankings and weightings of the Site Selection Criteria. The second stage screening identified that the highest ranked sites were all located on the Eyre Peninsula, Yorke Peninsula and in the Riverland.
The Eyre Peninsula (Port Lincoln Terminal) ranks higher than the Yorke Peninsula due to the additional requirement to supply load via contracted generation under line outage conditions. Sites in the Riverland were ranked after the Eyre and Yorke Peninsula due to low connection difficulty and the potential for reduced Murraylink interconnection constraints. From the above it was concluded that three sites should be short-listed, one in each geographic area, to optimise the site choice in a more rigorous and detailed analysis.
In summary, the following sites were therefore chosen as being the highest ranked in each area and are the short-listed choice:
Eyre Peninsula - Port Lincoln Terminal;
Yorke Peninsula – Dalrymple; and
Riverland – Monash.
Site Selection Criteria
A broad range of Site Selection Criteria was developed to capture local site issues, network characteristics as well as the potential benefits. This broad range of criteria was evaluated and some benefits were determined not to be relevant unless ESDs become widespread in the future - these benefits were not considered. Also, detailed aspects like the potential interplay and/or mutual exclusivity of benefits and co-optimisation of benefits in the design have not been considered at this stage. A list of twelve benefit classes was used for the screening, short-listing of sites and high-level benefit quantification resulting in the following outcome.

ESCRI-SA MILESTONE 2: SITE SELECTION January 2015
ESCRI-SA Site Selection Report - Ver 1 - Issue 1.docx Version 1.0 Page 47 of 59
The quantification of the benefit classes has identified the following benefits as being the most valuable:
Price Arbitrage4;
MLF impact (subject to optimal ESD sizing);
Network Augmentation Deferral (where relevant);
Expected Unserved Energy (USE) reduction;
Interconnector constraint reduction; and
Local generator constraint reduction.
The following benefits were found to be of low value in the current regulatory framework and are unlikely to warrant further detailed investigation:
Localised frequency support;
Grid support cost reduction;
System frequency support; and
Avoided wind farm FCAS obligation.
Uncertainties and risks
It is important to note that this Site Selection Report has not considered the deployment cost of an ESD. However, site connections costs have been considered at a high level in shortlisting potential sites in South Australia. ESD deployment costs will be determined as input into Project business case development and therefor inform milestone 4 and assist in finalising the site selection.
Also, at the time of the original ARENA proposal there was an expectation that network deferral benefits were available on the Yorke Peninsula. With the latest demand forecasts, these deferral benefits may only be available if the proposed Hillside mine proceeds in substantial form.
As mentioned before, this Project has taken on an iterative form. The result is that the short listed site selections are a work in progress. More work is required to reduce some of the uncertainties and also to determine the various cost components, e.g. Losses in the ESD have not been considered yet, although a 20% loss figure has been assumed in the Arbitrage simulations. The outputs of this Report will feed into the Basis of Design document which will be used later in the Project.
The revenue associated with Arbitrage payments is subject to the volatility of the market, accordingly there is a risk that if the total quantity of storage is increased on the grid that it will lead to a reduction in market volatility and consequent reduction in revenue. On the other hand, as the penetration of renewable generation increases, the volatility of the
4 The revenue that can be realized from Arbitrage is proportional to the MLF at the connection point, accordingly the two remote sites identified in this report (Port Lincoln and Dalrymple) are at a disadvantage when compared to the proposed connection at Monash.

ESCRI-SA MILESTONE 2: SITE SELECTION January 2015
ESCRI-SA Site Selection Report - Ver 1 - Issue 1.docx Version 1.0 Page 48 of 59
market would be expected to increase which would be of benefit to the operators of a storage device which is dispatched for arbitrage purposes.
Basis of Design recommendations
The simulation studies have identified some issues that should be considered in the basis of design documentation and the analysis of technologies. Specifically, the dominant revenue stream (in most situations) has been identified to be due to price arbitrage, however this is heavily dependent on how the device is dispatched and what total storage capacity is available to the device.
In order to get the most benefit from Arbitrage the device should be dispatched based on pool prices and this should occur as often as possible. Accordingly the device should be capable of many cycles before replacement of storage components (e.g. batteries, compressors, pipes etc.) becomes necessary. The control system of the device needs to be designed to ensure that it cannot be damaged or lifetime shortened due to inappropriate cycling. This is a particular consideration for battery systems which can be severely constrained by depth of discharge and over charging considerations.
Regardless of whether the device is dispatched for arbitrage purposes or not, it will have a small impact on the MLFs local to where the device is connected. The modelling indicates that this could have a small but significant effect on the revenue base for local generation – in particular for wind farms which only operate at peak load for short durations. To realize these benefits will require a suitably specified control system which will need to be included in the basis of design and eventual functional specification documentation.
The simulation studies have also shown that the storage capacity of the device is a significant driver of the possible revenue that such a device can generate, but that this is interrelated with how the device is interconnected to the system and how the device is controlled. To capture the benefits in practice requires a good understanding of how the device is dispatched and how the device components are affected by the proposed duty. Accordingly the basis of design document should incorporate appropriate requirements in order to obtain the data required to make informed equipment procurement decisions.
As mentioned before, this ESCRI-SA Project has taken on an iterative form. The result is that the short listed site selections are a work in progress. More work is required to reduce some of the uncertainties and also to determine the various cost components, e.g. losses in the ESD have not been considered yet. The outputs of this Report will feed into the Basis of Design document which will be used later in the Project. Final site selection will be performed as part of the business case development and be guided by:
Implications flowing from the technology review;
Footprint of the proposed installation;
Environmental implications;
Cost of the ESD, including connection costs; and
Further refinements of benefits, including the inter-relationship between benefit types and how an ESD could physically be configured to maximise these benefits.

Energy Storage for Commercial Integration South Australia
Appendices January 2015
Version 1.0

ESCRI-SA MILESTONE 2: SITE SELECTION January 2015
ESCRI-SA Site Selection Report - Ver 1 - Issue 1.docx Version 1.0 Page 50 of 59
Appendix A Initial Screening Results
The following sites stood out from others as they are physically capable to connect an ESD and indicated market benefits.
Low losses/ constraints generation ‐> storage
Low losses/ constraints storage ‐>
load
WFs spilling generation at low price?
Downstream of thermal network limitation
Voltage support
need ‐ high demand
Voltage control
need ‐ low demand
Localised island
frequency support
Radial site USE
reduction potential
Reduce Heywood constraints
Reduce Murraylink constraints
Reduce local
generator constraints
Reduce market fuel
costs
System frequency support
Ardrossan West N N N N N Y Y Y Y (if small) NContingent on
HillsideN
Y ‐ medium impact
Potential Y N
Slight impact on Waterloo‐Robertstown constraints
Y N Y Y
Dalrymple N MAYBE Y N/A N Y Y Y Y (if small) NContingent on
HillsideN
Y ‐ high impact
Potential Y N
Slight impact on Waterloo‐Robertstown constraints
Y N Y Y
Monash Y MAYBE N N/A Y N Y N Y N N Y Y Y N N Y Y (slight) N Y Y
Mount Millar N Y? N Y? N Y? Y Y (small) Potential N N N
Y (in conjunction with local gens)
Y N N YY (rare
occasions?)Y Y
North West Bend N N N N N Y Y N Y N N Y Y Y N N Y Y (slight) N Y Y
Port Lincoln Terminal
N N Y N/A Y Y Y Y Y N N N Y Y Y (1 hour) N N Y Y Y Y
Robertstown N N N N N N Y Y Y N N N Y N N N N Y? N Y
Y (subject to actual
impact on local
generator constraints)
South East Y N N N/A Y N Y Y Y Y
Y? (reduced once SECS
implemented)
N N N N Y N Y? N Y Y
Waterloo Y Y Y N/A N Y Y Y Y Y N N N N N N Y Y N Y Y
Wudinna N MAYBE N N N Y Y N Y (small) Potential N N N
Y (in conjunction with local gens)
Y N N YY (rare
occasions?)Y Y
Yadnarie N MAYBE N N N Y Y Y Y (small) Potential N N N
Y (in conjunction with local gens)
Y N N YY (rare
occasions?)Y Y
Y
Belalie N N N Y Y Y N N N N N N N Potential N Y Y
Blyth West N N N Y Y Y N N N N N N N Potential N Y Y
Canowie N N N Y Y Y N N N N N N N Potential N Y Y
Mokota N N N Y Y Y N N N N N N N Potential N Y Y
Snowtown N N N Y Y Y N N N N N N N Potential N Y Y
SA Power Networks LV bus available for connection
Overall Physical Site
Assessment
Price arbitrage Network support (reliability) Network support (market)
Shortlist based on benefits?
ElectraNet LV bus available
for connection?
Substation name
Spare room inside fenced substation boundary? (i.e. no DA needed)
LA Land Aerial Pics
ElectraNet owns land surrounding substation?
Potential difficulty purchasing
land?

ESCRI-SA MILESTONE 2: SITE SELECTION January 2015
ESCRI-SA Site Selection Report - Ver 1 - Issue 1.docx Version 1.0 Page 51 of 59
Appendix B Second-Stage Screening Results
Benefits and weighting are applied to further evaluate each potential site.
Low losses/ constraints
generation ‐> storage
Low losses/ constraints storage ‐>
load
WFs spilling generation at low price?
MLF reduction
Downstream of thermal network limitation
Voltage support need
‐ high demand
Voltage control need ‐low demand
Localised island
frequency support
Radial site USE
reduction potential
Reduce Heywood constraints
Reduce Murraylink constraints
Reduce local generator constraints (incl. ride‐through
assistance)
Reduce market fuel costs (e.g. grid support operating costs)
System frequency
support (incl. avoided FCAS
obligations)
5 5 10 5 10 5 5 1 10 5 2 10 5 5
Ardrossan West 2 3 2 0 2 0 0 2 1 2 0 1 2 0 1 153 7
Ardrossan West (+Hillside) 2 3 3 0 2 2 3 2 1 2 0 1 2 0 1 193 3
Dalrymple 2 3 2 0 3 0 0 3 2 2 0 1 3 0 1 174 5
Dalrymple (+Hillside) 2 3 3 0 2 2 3 3 2 2 0 1 3 0 1 209 2
Monash 3 0 3 0 1 0 2 1 1 0 0 3 0 0 2 142 9
Mount Millar 1 3 2 3 2 1 0 0 1 2 0 0 3 1 1 166 6
North West Bend 3 1 3 0 1 0 1 0 0 0 0 2 0 0 2 134 10
Port Lincoln Terminal 2 3 3 3 2 2 0 2 2 1 0 0 3 3 1 222 1
Robertstown 1 3 2 0 0 0 0 1 0 0 0 1 1 0 2 82 18
South East 1 3 2 3 0 0 0 0 0 0 2 0 1 0 3 120 11
Waterloo 2 2 2 0 0 0 0 0 0 0 0 2 1 0 1 99 13
Wudinna 2 1 2 3 1 0 0 0 1 1 0 0 2 1 1 151 8
Yadnarie 2 3 2 3 2 0 0 0 2 2 0 0 3 1 1 187 4
Para 2 2 3 0 0 0 0 1 0 0 0 0 0 0 3 105 12
Snowtown 1 3 2 0 1 0 0 0 0 0 0 1 1 0 1 77 19
Belalie 1 3 1 0 1 0 0 1 0 0 0 0 1 0 3 85 14
Blyth West 1 3 1 0 1 0 0 1 0 0 0 0 1 0 3 85 14
Canowie 1 3 1 0 1 0 0 1 0 0 0 0 1 0 3 85 14
Mokota 1 3 1 0 1 0 0 1 0 0 0 0 1 0 3 85 14
Weighted benefit
Rank
Network support (reliability) Network support (market)
3031 27
Substation nameConnection Difficulty
25
Price arbitrage
Weighting

ESCRI-SA MILESTONE 2: SITE SELECTION January 2015
ESCRI-SA Site Selection Report - Ver 1 - Issue 1.docx Version 1.0 Page 52 of 59
Appendix C Short-Listed Site Locality Views
C1 Port Lincoln

ESCRI-SA MILESTONE 2: SITE SELECTION January 2015
ESCRI-SA Site Selection Report - Ver 1 - Issue 1.docx Version 1.0 Page 53 of 59
C2 Dalrymple

ESCRI-SA MILESTONE 2: SITE SELECTION January 2015
ESCRI-SA Site Selection Report - Ver 1 - Issue 1.docx Version 1.0 Page 54 of 59
C3 Monash

ESCRI-SA MILESTONE 2: SITE SELECTION January 2015
ESCRI-SA Site Selection Report - Ver 1 - Issue 1.docx Version 1.0 Page 55 of 59
Appendix D Energy Arbitrage and MLF Impact Assessment
Working definition of a storage device
►A “working definition” of a storage device in this context is:
It is a Power station which uses Electricity as its Fuel Source
To be commercially viable it has to be able to provide a service which is valued over and above its operating costs which includes the cost of its Fuel (i.e. Power)
It has to be able to compete with other Power stations which do not use Electricity as the fuel source

ESCRI-SA MILESTONE 2: SITE SELECTION January 2015
ESCRI-SA Site Selection Report - Ver 1 - Issue 1.docx Version 1.0 Page 56 of 59
Modelling of Arbitrage
► Time shifting Power (arbitrage and Peaking duty)
24�06�Tuesday 26�06�Thursday 28�06�Saturday 30�06�Monday�100
�50
0
50
100
150
200
Date
Perc
enta
geou
tput
and
pool
pric
e$�MWh
Typical Dispatch behaviour for arbitrage purposes
different dispatch periods and magnitudes are chosen
based on the amount of capacity available
24�06�Tuesday 26�06�Thursday 28�06�Saturday 30�06�Monday
0
50
100
Date
Arb
itrag
eVal
ue$
Typical Dispatch arbitrage Cost and income
based on the amount of capacity available
and the pool price
The revenue stream from arbitrage was modelled by assuming a device would be dispatched as a generator when the price is high, and as a load when the price was low. The income is then obtained by :
revenue = price x dispatch
Limits on dispatch were applied if the storage capacity was exceeded.
The graphs show percentage output/revenue for several different storage rating scenarios.
Modelling of Arbitrage
Oct Jan Apr Jul Oct�100
0
100
200
300
400
500
HistoricalPoolPrices in SA
Oct Jan Apr Jul Oct
0
20000
40000
60000
80000
100000
Accumulated Estimated Income $ per MW ratingWhen estimating the revenue over a long period of time it can be seen that revenue will increase in steps whenever a high pool price event occurs.
Low rate of revenue occurs if pool price has low volatility
Low average pool prices may still give a reasonable rate of return as long as significant volatility of pool prices occurs.

ESCRI-SA MILESTONE 2: SITE SELECTION January 2015
ESCRI-SA Site Selection Report - Ver 1 - Issue 1.docx Version 1.0 Page 57 of 59
Modelling of Arbitrage
02�06�Monday 09�06�Monday 16�06�Monday 23�06�Monday 30�06�Monday
0
20
40
60
DateAcc
umul
ateS
tora
geou
tput
MW
h
Typical Dispatch behaviour for arbitrage purposes
based on the amount of capacity available
Out[314 ]=
The model assumes that the device will “on average” discharge and charge so as to maintain a long term constant storage.
The allowable variation is determined by the amount of storage available.
I.e. the amount of energy discharged should equal the amount of energy charged ( not including losses)
For a given storage capacity (e.g. 25 MWh) the model assumes the device will usually be close to ½ its storage capacity (so it has room to move in either direction).
Modelling of Arbitrage
Out[291]=
The annual revenue that the device can accrue depends on the buy and sell price signals that it uses to decide when to operate as a generator and when to operate as a load.
The graph to the right indicates that the optimum revenue occurs when the buy and sell price thresholds are relatively close to each other ( ~ $ 2 difference).
The revenue will rapidly reduce if the buy price is set too low ( horizontal axis) - whereas if the sell price is set higher ($ 1 - $ 6) the revenue is reduced slightly.
If the sell and buy prices are set too close to each other (~ $1 difference) –the revenue will collapse because the device will charge and discharge without making any profit.

ESCRI-SA MILESTONE 2: SITE SELECTION January 2015
ESCRI-SA Site Selection Report - Ver 1 - Issue 1.docx Version 1.0 Page 58 of 59
Modification of MLFs
► Modifying network Marginal loss factors (and reducing losses)
May 12 May 19
0
20
40
60
80
100
Effectof Storageon Powerflows
Red trace withoutstorage
Green trace with storagedevice
MLFs will change when the device is dispatched to maximise arbitrage, because it will also affect power flows on the network.
The changed power flows will affect the losses experienced by the network and hence Marginal Loss factors (MLF).
The graph shows the power flows on the 132kV network from Ardrossan West to Dalrymple. The red line shows the actual historical flows, whereas the green line shows a typical case study which assumed a storage device was installed at Dalrymple.
Modification of MLFs
Out[122]=
The degree to which MLFs will be modified depends on both the MW rating and storage rating (MWh) of the device.
The graph presents the degree to which a storage device of a particular rating and capacity would affect the MLF at Dalrymple (or Wattle Point Wind farm) if it is dispatched to maximise revenue due to arbitrage.
The new MLF is calculated by:
MLFnew = MLFold x factor (from graph)

ESCRI-SA MILESTONE 2: SITE SELECTION January 2015
ESCRI-SA Site Selection Report - Ver 1 - Issue 1.docx Version 1.0 Page 59 of 59
Modification of MLFs
Out[61]=
The degree to which MLFs will be modified depends on both the MW rating and storage rating (MWh) of the device.
This determines how much of an impact the device will have on existing power system flows.
As an example, the MLF for 2014/15 at Cathedral rocks windfarm is 0.8774.
The graph indicates that a 10 MW, 200 MWh (coordinates x = 20, y = 10) storage device would change this to
0.8774 x 1.02 = 0.8949.
The annual benefit to Cathedral Rocks Wind farm would be approximately $ 65 k.

ESCRI-SA
Energy Storage for Commercial Renewable Integration
South Australia
An Emerging Renewables “Measure” project with the Australian Renewable Energy Agency
Milestone 3
June 2015
Energy Storage Systems

ESCRI-SA MILESTONE 3: ENERGY STORAGE SYSTEMS June 2015
State of Art ES (ESCRI Format) - 2015-06-02 clean skin.docx Version A Page 2 of 93
Confidentiality
This document has been prepared for the sole purpose of documenting the Site Selction milestone 2 deliverable associated with the Energy Storage for Commercial Renewable Integration project for South Australia by AGL, Electranet and WorleyParsons, as part of an Emerging Renewables project with the Australian Renewable Energy Agency (ARENA).
It is expected that this document and its contents, including work scope, methodology and any commercial terms will be treated in accordance with the Funding Agreement between ARENA and AGL.
Revision Record
Date Version Description Author Checked By Approved By
June 2015
A Revised report B.J.Miller, V.Dissanayake, R.Partow
P.Knispel P. Ebert

ESCRI-SA MILESTONE 3: ENERGY STORAGE SYSTEMS June 2015
State of Art ES (ESCRI Format) - 2015-06-02 clean skin.docx Version A Page 3 of 93
Contents
1. INTRODUCTION ............................................................................................................. 19
1.1 CONTEXT FOR THIS REPORT ................................................................................................... 19
1.2 PURPOSE OF THIS REPORT ..................................................................................................... 19
1.3 BACKGROUND ........................................................................................................................ 21
1.4 A NOTE ON NOMENCLATURE .................................................................................................... 22
2. PUMPED HYDRO STORAGE (PHS) .............................................................................. 25
2.1 CURRENT STATUS .................................................................................................................. 26
2.2 SUMMARY OF MAIN ECONOMIC AND PHYSICAL CHARACTERISITCS - PHS ................................... 28 2.2.1 Physical Characteristics ....................................................................................................... 28 2.2.2 Economic Characteristics .................................................................................................... 29
3. FLYWHEEL ENERGY STORAGE (FES) ........................................................................ 30
3.1.1 Current Status ...................................................................................................................... 31
3.1.2 Current Commercial Uses .................................................................................................... 32 3.1.3 Learnings from Commercial Development/Operation .......................................................... 33
3.2 SUMMARY OF MAIN ECONOMIC AND PHYSICAL CHARACTERISITCS - FES ................................... 33 3.2.1 Physical Characteristics ....................................................................................................... 33 3.2.2 Economic Characteristics .................................................................................................... 35
4. COMPRESSED AIR ENERGY STORAGE (CAES) ........................................................ 36
4.1 DIABATIC COMPRESSED AIR ENERGY STORAGE (D-CAES) ..................................................... 37
4.1.1 Challenges and Barriers ...................................................................................................... 37 4.1.2 Current Status ...................................................................................................................... 37
4.2 ADAVANCED ADIABATIC COMPRESSED AIR ENERGY STORAGE (AA-CAES) .............................. 40 4.2.1 Challenges and Barriers ...................................................................................................... 40
4.2.2 Current Status ...................................................................................................................... 40
4.3 ISOTHERMAL COMPRESSED AIR ENERGY STORAGE (I-CAES) .................................................. 40 4.3.1 Challenges and Barriers ...................................................................................................... 40 4.3.2 Current Status ...................................................................................................................... 40
4.4 CAES - SUMMARY ................................................................................................................. 42
4.5 SUMMARY OF MAIN ECONOMIC AND PHYSICAL CHARACTERISITCS - CAES ................................ 43 4.5.1 Physical Characteristics ....................................................................................................... 43 4.5.2 Economic Characteristics .................................................................................................... 44
5. BATTERY ENERGY STORAGE (BES) .......................................................................... 45
5.1 LEAD-ACID BATTERIES ........................................................................................................... 46 5.1.1 Current Status ...................................................................................................................... 46
5.2 LITHIUM-ION (LI-ION) BATTERIES ............................................................................................. 48 5.2.1 Current Status ...................................................................................................................... 48
5.3 SODIUM SULPHUR (NAS) BATTERIES....................................................................................... 51

ESCRI-SA MILESTONE 3: ENERGY STORAGE SYSTEMS June 2015
State of Art ES (ESCRI Format) - 2015-06-02 clean skin.docx Version A Page 4 of 93
5.3.1 Current Status ...................................................................................................................... 51
5.4 EOS SYSTEMS (ZINC) ............................................................................................................ 53 5.4.1 Current Status ...................................................................................................................... 53
5.5 AQUION SYSTEMS (SODIUM AND LITHIUM) ............................................................................... 54 5.5.1 Current Status ...................................................................................................................... 55
5.5.2 Summary of Physical and Technical Characteristics of Aquion systems ............................ 56
5.6 BATTERY ENERGY STORAGE (BES)- SUMMARY ...................................................................... 57 5.6.1 Physical Characteristics ....................................................................................................... 57 5.6.2 Economic Characteristics .................................................................................................... 59
6. FLOW BATTERY ENERGY STORAGE (FBES) ............................................................. 60
6.1 VANADIUM REDOX FLOW BATTERY (VRB) ............................................................................... 61 6.1.1 Current Status ...................................................................................................................... 61
6.2 ZINC BROMINE (ZNBR) FLOW BATTERY .................................................................................. 63 6.2.1 Current Status ...................................................................................................................... 63
6.3 FUEL CELLS ........................................................................................................................... 65
6.4 FLOW BATTERY ENERGY STORAGE (FBES) - SUMMARY .......................................................... 70
6.5 SUMMARY OF MAIN ECONOMIC AND PHYSICAL CHARACTERISITCS – (FBES) .............................. 70 6.5.1 Physical Characteristics ....................................................................................................... 70 6.5.2 Economic Characteristics .................................................................................................... 71
7. CAPACITOR AND SUPERCAPACITOR (CAP) ............................................................. 72
7.1.1 Current Status ...................................................................................................................... 74
7.2 SUMMARY OF MAIN ECONOMIC CHARACTERISITCS (CAP) ......................................................... 75
7.2.1 Physical Characteristics ....................................................................................................... 75 7.2.2 Economic Characteristics .................................................................................................... 76
8. SUPERCONDUCTING MAGNETIC ENERGY STORAGE (SMES) ................................ 77
8.1.1 Current Status ...................................................................................................................... 78
8.2 SUMMARY OF MAIN ECONOMIC AND PHYSICAL CHARACTERISITCS (SMES) ................................ 78 8.2.1 Physical Characteristics ....................................................................................................... 78 8.2.2 Economic Characteristics .................................................................................................... 79
9. OVERALL SUMMARY .................................................................................................... 81
10. ENERGY STORAGE FOR THE ESCRI-SA PROJECT ................................................... 86
10.1 TECHNOLOGIES APPLICABLE TO ESCRI-SA ............................................................................ 86
10.2 CONSTRUCTABILITY & OPERABILITY IN AN AUSTRALIAN CONTEXT ............................................. 87
11. BIBLIOGRAPHY ............................................................................................................. 88
APPENDICES............................................................................................................................. 93

ESCRI-SA MILESTONE 3: ENERGY STORAGE SYSTEMS June 2015
State of Art ES (ESCRI Format) - 2015-06-02 clean skin.docx Version A Page 5 of 93
Figures
Figure 1: Comparison of power rating and rated energy capacities of various storage technologies ........................................................................................................................ 12
Figure 2: Comparison of energy and power densities of various energy storage technologies ........................................................................................................................................... 14
Figure 3: Comparison of round trip efficiencies of various energy storage technologies ...... 15
Figure 4: Comparison of energy and power capital costs .................................................... 16
Figure 5: Comparison of energy capital costs and annual operation and maintenance costs ........................................................................................................................................... 16
Figure 6: Layout of a typical PHS plant [1] .......................................................................... 25
Figure 7: Yanbaru seawater PHS system in Okinawa, Japan [11] ....................................... 27
Figure 8: Components of a FES system [1] ......................................................................... 30
Figure 9: Components of a low speed flywheel (left) and a high speed flywheel (right) [14] 31
Figure 10: Modular configuration of Beacon Power’s flywheel systems [16] ........................ 32
Figure 11: Schematic diagram of a CAES plant showing the main components [19] ........... 37
Figure 12: Ariel picture of the McIntosh CAES Plant [21] .................................................... 39
Figure 13: Schematic of a BES system [1] .......................................................................... 45
Figure 14: Schematic of Ergon Energy GUSS deployment [31] ........................................... 49
Figure 15: GESS for distribution network support [33] ......................................................... 50
Figure 16: Schematic of a NaS battery cell and its operation [36] ....................................... 51
Figure 17 a) internal features of a “battery 1” unit, b) Stack of 8 “battery 1” units, [63] c) demonstration on how an AHI cell may be combined into grid-scale electric energy storage solutions [64]. ...................................................................................................................... 55
Figure 18: Schematic of flow battery [5] .............................................................................. 60
Figure 19: Schematic of a structure of a VRB [1] ................................................................. 61
Figure 20: Schematic of a ZnBr battery [38] ........................................................................ 63
Figure 21 Schematic of a generic Fuel Cell [41] .................................................................. 65
Figure 22 Top 10 venture capital and private equity investors in fuel cells, by country and company (Cumulative 2000-2013) [44] ............................................................................... 68
Figure 23 graphs showing the growth of Fuel Cells by shipments and Megawatts by application from 2009-2013 [48] .......................................................................................... 69

ESCRI-SA MILESTONE 3: ENERGY STORAGE SYSTEMS June 2015
State of Art ES (ESCRI Format) - 2015-06-02 clean skin.docx Version A Page 6 of 93
Figure 24: Schematic of a capacitor (left) [52] and a supercapacitor system (right) [1] ........ 72
Figure 25: Schematic of a SMES system [5] ....................................................................... 77
Figure 26: Comparison of power rating and rated energy capacities of various storage technologies ........................................................................................................................ 81
Figure 27: Comparison of energy and power densities of various energy storage technologies ........................................................................................................................ 82
Figure 28: Comparison of round trip efficiencies of various energy storage technologies .... 83
Figure 29: Comparison of energy and power capital costs .................................................. 84
Figure 30: Comparison of energy capital costs and annual operation and maintenance costs ........................................................................................................................................... 84
• Figure 31: Comparison of power rating and rated energy capacities of various storage technologies ........................................................................................................... 86
Tables
Table 1: Summary of energy storage technologies based on daily self discharge and storage duration ............................................................................................................................... 13
Table 2: Advantages and disadvantages of PHS [1], [5] ...................................................... 26
Table 3: Selected PHS facilities [4] ..................................................................................... 27
Table 4: Physical and technical characteristics of PHS [1] .................................................. 28
Table 5: Environment and health and safety concerns of PHS [5], [10], [12] ....................... 29
Table 6: Economic characteristics of PHS [1] ...................................................................... 29
Table 7: Advantages and disadvantages of FES system [14], [1] ........................................ 31
Table 8: Selected FES facilities [4] ...................................................................................... 33
Table 9: Physical and technical characteristics of FES [1] ................................................... 33
Table 10: Environment and health and safety concerns of FES [5], [12] ............................. 34
Table 11: Economic characteristics of FES [1] .................................................................... 35
Table 12: Specifications of the Huntorf CAES plant [19] ...................................................... 37
Table 13: Comparison of CAES systems [18] ..................................................................... 42
Table 14: Novel CAES technologies [8] .............................................................................. 42

ESCRI-SA MILESTONE 3: ENERGY STORAGE SYSTEMS June 2015
State of Art ES (ESCRI Format) - 2015-06-02 clean skin.docx Version A Page 7 of 93
Table 15: Physical and technical characteristics of PHS [1] ................................................ 43
Table 16: Environment and health and safety concerns of PHS [5], [12] ............................. 44
Table 17: Economic characteristics of CAES [1] ................................................................. 44
Table 18: Advantages and disadvantages of lead-acid batteries [5], [1] .............................. 46
Table 19: Selected lead acid battery energy storage facilities [4] ........................................ 46
Table 20: Advantages and disadvantages of Li-ion batteries [1], [30] .................................. 48
Table 21: Advantages and disadvantages of NaS batteries [1] ........................................... 51
Table 22: Selected NaS battery energy storage facilities [4]................................................ 52
Table 23 Advantages and disadvantages of EOS systems [60] .......................................... 53
Table 24 Advantages and disadvantages of Aquion systems .............................................. 55
Table 25: Physical and technical characteristics of Aquion systems [66] ............................. 56
Table 26: Physical and technical characteristics of various BES technologies [1] ............... 57
Table 27: Environment and health and safety concerns of BES [12] .................................. 59
Table 28: Economic characteristics of BES [1] .................................................................... 59
Table 29: Advantages and disadvantages of VRBs [1], [30] ................................................ 61
Table 30: Selected VRB energy storage facilities [4] ........................................................... 62
Table 31: Advantages and disadvantages of ZnBr flow batteries [1], [30] ............................ 63
Table 32: Selected ZnBr energy storage facilities [4]........................................................... 64
Table 33 Table showing the various types of fuel cells [39], [42] ......................................... 66
Table 34 Advantages and disadvantages of fuel cell technology ......................................... 68
Table 35: Physical and technical characteristics of various FBES technologies [1] ............. 70
Table 36: Environment and health and safety concerns of FBES [12] ................................. 71
Table 37: Economic characteristics of FBES [1] .................................................................. 71
Table 38: Advantages and disadvantages of capacitors and supercapacitors [1] ................ 72
Table 39: Selected manufacturers of supercapacitors [1], [53], [54] .................................... 74
Table 40: Selected supercapacitor storage based projects [4] ............................................ 74
Table 41: Physical and technical characteristics of CAP systems [1] .................................. 75
Table 42: Environment and health and safety concerns of CAP systems [5] ....................... 76

ESCRI-SA MILESTONE 3: ENERGY STORAGE SYSTEMS June 2015
State of Art ES (ESCRI Format) - 2015-06-02 clean skin.docx Version A Page 8 of 93
Table 43: Economic characteristics of CAP systems [1] ...................................................... 76
Table 44: Advantages and disadvantages of SMES [1] ....................................................... 77
Table 45: Selected projects of SMES [1] ............................................................................. 78
Table 46: Physical and technical characteristics of SMES systems [1] ................................ 78
Table 47: Environment and health and safety concerns of SMES systems [5] .................... 79
Table 48: Economic characteristics of SMES systems [1] ................................................... 80
Table 49: Summary of energy storage technologies based on daily self discharge and storage duration .................................................................................................................. 81

ESCRI-SA MILESTONE 3: ENERGY STORAGE SYSTEMS June 2015
State of Art ES (ESCRI Format) - 2015-06-02 clean skin.docx Version A Page 9 of 93
Glossary of Terms
Term Description
AA-CAES Advanced Adiabatic Compressed Air Energy Storage
AC Alternating Current
BES Battery Energy Storage
BIES Building-Integrated Energy Storage System
CAES Compressed Air Energy Storage
CAP Capacitors and Supercapacitors
CSIRO Commonwealth Scientific and Industrial Research Organisation
DC Direct Current
D-CAES Diabatic Compressed Air Energy Storage
DoD Depth of Discharge
EDLC Electric Double Layer Capacitor
ESCRI-SA Energy Storage for Commercial Renewable Intergration – South Australia (the Project)
FES Flywheel Energy Storage
GCAES General Compression Advanced Energy Storage
GESS Grid Energy Storage System
GUSS Grid Utility Support Systems
HTS High Temperature Superconducting
I-CAES Isothermal Compressed Air Energy Storage
KIREIP King Island Renewable Energy Integration Project
KIREX King Island Renewable Energy Expansion
Li-ion Lithium Ion
LTS Low Temperature Superconducting
NaS Sodium Sulphur
NEM National Electricity Market
NiCd Nickel Cadmium
PHS Pumped Hydro Storage
SCE Southern California Edison
SCSC Smart Grid Smart City
SMES Superconducting Magnetic Energy Storage
SNS Smarter Network Storage
SWER Single Wire Earth Return

ESCRI-SA MILESTONE 3: ENERGY STORAGE SYSTEMS June 2015
State of Art ES (ESCRI Format) - 2015-06-02 clean skin.docx Version A Page 10 of 93
Term Description
UNSW University of New South Wales
VRB Vanadium Redox Battery
ZBM Zinc Bromide Modules
ZnBr Zinc Bromine

ESCRI-SA MILESTONE 3: ENERGY STORAGE SYSTEMS June 2015
State of Art ES (ESCRI Format) - 2015-06-02 clean skin.docx Version A Page 11 of 93
Physical Units
Physical Quantity Units of Measurements
Comments
Apparent Power VA, kVA, MVA Typically expressed in multiple of Volt-Ampere (VA)
Capacitance F F - Farad is an unit of electrical capacitance
Current A Expressed in Amperes
Energy J, Wh, kWh, MWh Although the SI unit of energy is Joules (J) . It is common to use Wh as this can be directly related to meter readings
Energy volume or mass density
Wh/l, Wh/kg Energy volume density (Wh/l) and mass density (Wh/kg)
Power W, kW, MW Typically expressed in multiple units of Watts (SI unit of power - Watt)
Power volume or mass density
W/l, W/kg Power volume density (W/l, mass density W/kg)
Pressure bar Metric unit of pressure (1 bar = 10
5 Pa, Pa is
the SI unit)
Speed rpm rpm - revolutions per minute
Temperature ºC, K ºC - Degrees, K - Kelvin
Time s, h s - seconds, h - hours
Voltage V, kV Typlically expressed in multiples of volts
Volume m3 m3 - cubic meters
Weight or mass kg SI unit

ESCRI-SA MILESTONE 3: ENERGY STORAGE SYSTEMS June 2015
State of Art ES (ESCRI Format) - 2015-06-02 clean skin.docx Version A Page 12 of 93
Executive Summary
This document provides a detailed overview of various energy storage technologies namely
• Pumped hydro energy storage
• Flywheel energy storage
• Compressed air energy storage
• Battery energy storage (lead acid, Lithium ion and Sodium Sulphur)
• Flow battery energy storage (Vanadium Redox, Zinc Bromide and Hydrogen fuel
cells)
• Capacitors
• Supercapacitors
• SMES
The technological progress with current research and development focusses, performance and cost characteristics of the storage technologies are discussed.
It is recognised that a single energy storage technology cannot meet all of the requirements of all power system applications due to the inherent characteristics of the existing storage technologies. Figure 1 illustrates the placements of various energy storage technologies based on their typical power ratings and rated energy capacities [1].
Figure 1: Comparison of power rating and rated energy capacities of various storage technologies
The application of energy storage depends on the typical discharge time of the energy storage system. Typical discharge times at rated power of
• Flywheels, supercapacitors and superconducting magnetic energy storage systems
are in the order of milliseconds through to minutes,
• Above ground small scale compressed air energy storage and battery systems are
up to ~10 hours
• Underground large scale compressed air energy storage and flow batteries/fuel cells
could be longer than 10 hours [1].

ESCRI-SA MILESTONE 3: ENERGY STORAGE SYSTEMS June 2015
State of Art ES (ESCRI Format) - 2015-06-02 clean skin.docx Version A Page 13 of 93
The self discharge rate determines the maximum suitable storage duration for a specific technology. Energy storage technologies with smaller rate of self discharge can be stored for longer. Table 1 summarises the energy storage technologies based on the daily self discharge and suitable storage durations.
Table 1: Summary of energy storage technologies based on daily self discharge and storage duration
Daily Self Discharge Suitable Storage
Duration Energy Storage Technologies
Small Long – term
(hours to months)
Pumped hydro energy storage
Compressed air energy storage
Sodium Sulphur battery
Flow battery systems
Medium (up to 5 %) Medium – term
(minutes to days)
Lead acid battery system
Lithium ion battery system
High Short – term
(minutes to hours)
Flywheel
Capacitors
Supercapacitors
Superconducting magnetic energy storage
The physical size of the storage device is also an important factor in determining a choice of storage system.
Figure 2 compares the energy and power densities of various technologies (values cited from [1]).
As shown in Figure 2, the large volume consuming technologies (i.e. pumped hyro energy storage, large-scale compressed air energy storage) which have low energy and power densities are near the bottom left corner of the diagram whereas the more compact technologies are at the top right hand corner. The densities of flow battery energy storage systems are typically lower than those of static battery energy storage systems. Amongst the static battery energy storage, densities of lead acid systems are lower than Lithium ion systems.

ESCRI-SA MILESTONE 3: ENERGY STORAGE SYSTEMS June 2015
State of Art ES (ESCRI Format) - 2015-06-02 clean skin.docx Version A Page 14 of 93
Figure 2: Comparison of energy and power densities of various energy storage technologies
The energy losses that an electrical storage device will experience depend on the roundtrip efficiency, which is defined by the power loss experienced when the device is charged and discharged. This figure will generally vary according to the depth of discharge and state of charge used in the cycling.
The roundtrip efficiency ranges of various energy storage technologies are shown in Figure 3 (values cited from [1]). The range of roundtrip efficiencies of flywheel energy storage, supercapacitors and superconducting magnetic energy storage are very high (greater than ~85 %).
In static battery systems, Lithium ion has a higher efficiency reaching up to 97 % in comparison with lead-acid (up to 90 %). The top range of round trip efficiencies is typically higher in static battery systems (lead acid, Lithium ion and Sodium Sulphur) compared to flow battery energy systems (Vanadium Redox battery, Zinc Bromide and Hydrogen fuel cells). Hydrogen fuel cells have relatively low round trip efficiencies which is still a developing technology.
In general, the efficiencies of the technologies have been improved with the progress of research and development efforts (i.e. the round trip efficiency of compressed air energy storage has improved from 42 % (in 1978), ~54 % (in 1991) and 70 % (for project ADELE) [1].

ESCRI-SA MILESTONE 3: ENERGY STORAGE SYSTEMS June 2015
State of Art ES (ESCRI Format) - 2015-06-02 clean skin.docx Version A Page 15 of 93
Figure 3: Comparison of round trip efficiencies of various energy storage technologies
Two more important characteristics of energy storage technologies are lifetime and number of useful cycles. These are summarised as follows [1]:
• Electrical energy storage systems – capacitors, supercapacitors and
superconducting magnetic energy storage systems typically are able to experience a
large number of cycles (> 20,000) before equipment needs to be replaced.
• Mechanical energy storage systems – compressed air energy storage and flywheel
energy storage systems are able to experience about 10,000 charge and discharge
cycles before equipment need to be replaced.
• Chemical energy storage systems – static battery and flow battery energy storage
systems typically need to be replaced after a relatively low number of charge and
discharge cycles due to chemical deterioration with accumulated operating time. The
number of useful cycles of these technologies are typically less than 5000 with the
exception of reported number of cycles for Lithium ion (1000 – 20,000), Vanadium
Redox batteries (12,000 +) and Hydrogen fuel cells (20,000 +). Chemical energy
storage systems are also sensitive to the depth of discharge and to possible
overcharging, either of which can significantly decrease the useful life of the device.
Lifetime and useful number of cycles have an impact on the overall investment cost of the energy storage system. Systems with low lifetime and low useful number of cycles increase the overall costs due to maintenance and replacement of equipment. These influences should be carefully modelled when developing a business case for a storage installation.
Figure 4 and Figure 5 compare the typical energy and power capital costs and energy capital costs and operation & maintenance costs respectively.

ESCRI-SA MILESTONE 3: ENERGY STORAGE SYSTEMS June 2015
State of Art ES (ESCRI Format) - 2015-06-02 clean skin.docx Version A Page 16 of 93
Figure 4: Comparison of energy and power capital costs
Figure 5: Comparison of energy capital costs and annual operation and maintenance costs

ESCRI-SA MILESTONE 3: ENERGY STORAGE SYSTEMS June 2015
State of Art ES (ESCRI Format) - 2015-06-02 clean skin.docx Version A Page 17 of 93
From reference to Figure 4, supercapacitors, flywheel and superconducting magnetic energy storage have relatively high energy costs and low power costs, making these technologies more economical to be used in small scale, high power applications. Pumped hydro storage and large scale compressed air energy storage systems have relatively low energy costs and therefore are most economical in large scale applications.
With regard to capital and operation & maintenance costs, battery and flywheel energy storage technologies typically have relatively low to moderate capital energy costs but high operation and maintenance costs as shown in Figure 5.
Some of the identified concerns relating to environment, health and safety are:
• Emissions from combustion of natural gas in compressed air energy storage, • fires and toxicity of chemicals in static battery and flow battery energy systems, • containment in case of catastrophic failure of equipment in flywheel energy systems
and strong magnetic fields in superconducting magnetic energy storage systems .
For the ESCRI-SA project we require a technology that is:
• responsive enough to be dispatchable on the National Electricity market (i.e. 5 minute dispatch periods)
• in infrequent cases be able to operate independently of the grid.
• able to store significant quantities of energy for several hours or days with minimal self-discharge
This latter requirement effectively rules out capacitor, supercapacitor and superconducting magnetic storage systems. While these systems can charge and discharge large amounts of power, their total energy storage capabilities are severly limited – which makes them ineffective for this application.
Similarly, mechanical flywheels and small scale compressed air systems have similar restrictions on the total energy that they can store and on the length of time that the energy can be stored for. In practice flywheels have been used on islanded systems in order to improve power system inertia and provide a short time backup to allow other emergency power generation to come on line. Flywheels on their own cannot meet the requirements of this application – although they may be useful as part of a more general system.
At the other end of the energy and power spectrum is the pump hydro and large scale compressed air systems. These can store large amounts of energy and are dispatchable in a similar way to existing generation. Pump hydro is already the most commonly used storage technology on the NEM and is the most mature technology. Both of these technologies require favourable landscapes in which to be situated which may not necessarily correspond with the needs of the network. The capital cost of an installation is highly dependant on favourable site conditions being available.
For the ESCRI-SA project – the preference is to consider technologies which can be located at existing wind farms or substations. This makes application of pump hydro and

ESCRI-SA MILESTONE 3: ENERGY STORAGE SYSTEMS June 2015
State of Art ES (ESCRI Format) - 2015-06-02 clean skin.docx Version A Page 18 of 93
large scale compressed air technologies problematic – but at this stage they have not been ruled out.
The various battery/fuel cell technologies seem to provide the best fit to the ESCRI-SA project – and to distinguish between them it is necessary to do a cost,benefit and risk analysis based on vendor supplied data.
In conclusion there are many technical and economical characteristics and health and safety issues to consider when determining a suitable storage system. Overall the key decision making factors for choosing a suitable storage technology will be different depending on the intended applications of storage, the size of the network, location and health and safety concerns.

ESCRI-SA MILESTONE 3: ENERGY STORAGE SYSTEMS June 2015
State of Art ES (ESCRI Format) - 2015-06-02 clean skin.docx Version A Page 19 of 93
1. Introduction
1.1 Context for this Report
This Report forms part of the output from the Energy Storage for Commercial Renewable Integration – South Australia (ESCRI-SA) project (the Project) which is examining the potential to utilise non-hydro energy storage in the 1-30MWpk range within the South Australian National Electricity (NEM) Market Region.
The Project is being progressed by a consortium consisting of AGL, ElectraNet and WorleyParsons, and is part funded by the Australian Renewable Energy Agency (ARENA) to which this Report is a deliverable required for Milestone 3 of their Funding Agreement.
The Project is considering a wide range of technologies and is focused on presenting a business case for such an asset in a commercial context, as well as assessing the impact such a device would have in aiding the development of additional renewable (particularly wind) generation in South Australia. To aid the commerciality, the Project is attempting to maximise the value of such an asset by combining:
1. the arbitrage of renewable energy output into the market
2. the provision of ancillary market services
3. the provision of network services
all potentially supplied by the one asset.
By its nature the Project must consider a wide range of issues including the regulatory setting and rules, the value proposition of the services on offer, how technically such an asset would function and where it would be sited, and the commercial arrangements including capital cost, equipment supply contracts and conditions, revenues and return for the owner, and any necessary contracts for the supply of the service offered to the asset’s customer(s). The Project must also consider barriers to entry and how these might be targeted for relaxation or change.
Being commercially focused, the Project is targeting energy storage equipment which is relatively mature and “off the shelf”, so it is not considering technology considered in the research and development domain. Part of determining what technologies might be applicable then is to investigate energy storage systems in development and deployment elsewhere, and this Report provides the outcomes from that work.
1.2 Purpose of this Report
The purpose of this document is to provide an overview of various energy storage technologies being developed and deployed globally of a type relevant to the ESCRI-SA Project.

ESCRI-SA MILESTONE 3: ENERGY STORAGE SYSTEMS June 2015
State of Art ES (ESCRI Format) - 2015-06-02 clean skin.docx Version A Page 20 of 93
The path by which the ESCRI-SA Project evolved included consideration of work undertaken previously in South Australia in relation to energy storage as a renewable energy enabler. Of particular note was a Study undertaken in 2011 which examined potential storage technologies and and the basic business case for their use to increase renewable energy use in the South Australian market (reference “2011, Government of South Australia, “Energy Storage Technologies – South Australia – Initial Phase Report”, by WorleyParsons and SKM-MMA). That Study covered a range of technologies in the 100s of MWpk output, including large pumped hydro, compressed air facilities and gas pipeline compression storage, through to smaller scale technologies in the 1-30MWpk range involving chemical and mechanical storage.
The ESCRI-SA Project chose to focus on the smaller end of this market and this inflluences what technologies are applicable. In definitions of the Project work and aims, it is stated that only “non-hydro” energy storage (essentially Pumped Hydro Storage (PHS)) will be pursued, and behind this is an assumption that not only have PHS systems been pursued and built in large quantities already, including in Australia – and, therefore, are not particularly novel – but the size of those facilities is generally larger than sought in the Project. However, there are still novel aspects of water based storage facilities and, where these were applicable to the Project, they are included in this Report.
Another storage technology not covered was thermal energy storage, such as molten salt currently utilised in several solar thermal projects, or chilled water (and variants, including ice thermal storage). The primary reason for not pusuing such was both the relative level of immaturity of these media for storing electrical energy (in/out), and the likely inefficiencies in such a configuration. Hydrogen storage was not considered due to the immaturity of the technology as a commercial product, and the relatively small size of working examples. However, this does not mean such storage media may not have an increasing role in the future.
The ESCRI-SA Project is also about energy storage at the Transmission System level – or “utility level”. While this latter terminology is somewhat vague given that there are moves internationally to see large scale use of small, distributed energy storage systems within a traditional utility franchise, within this report the energy storage asset is of a size that either a commercial power plant developer, utility or formal market entrant would consider.
In summary, the energy storage technologies presented herein include:
• Pumped Hydro Storage (PHS), • compressed Air Energy Storage (CAES), • Flywheel Energy Storage (FES), • Static batteries Lead acid, Lithium ion (LI-Ion), Sodium Sulphur (NaS), • Flow batteries Vanadium Redox Batteries (VRB), Zinc Bromine (ZnBr), Hydrogen fuel
cells, • capacitors and supercapacitors.
This document includes a description of these technologies, a brief exposition of their relative advantages and disadvantages, current status indicating research and development areas, listing of several energy storage technology providers and projects.
A brief discussion on each of the different energy storage technologies based on their characteristics is also presented.

ESCRI-SA MILESTONE 3: ENERGY STORAGE SYSTEMS June 2015
State of Art ES (ESCRI Format) - 2015-06-02 clean skin.docx Version A Page 21 of 93
1.3 Background
Energy storage technologies are becoming of more interest in electrical systems with
deployments at various scales being implemented worldwide and the rate of installations
increasing. This is partly due to the continuing drop in the cost of equipment, but also as
particular drivers have emerged including electric vehicles, the rise of distributed energy
systems, realisation of their value in network ancillary service provision, and increasing
renewable energy use where the technology can be used to enable renewable energy
integration including the arbitrage of energy, lowering impacts on systems or for roles such
as islanded loads).
Such new entrant technologies are often stimulated by policy and in some countries specific
incentives are being introduced to stimulate energy storage deployment in electrical
systems. An example of this is California, which has recently mandated through the
Californian Public Utilities Commission (CPUC) for the use of energy storage, essentially to
allow for higher penetration of renewable energy into the State’s grid (reference “Advancing
And Maximising the Value of Energy Storage Technology”, Californian Independent System
Operator, December 2014).
According to Navigant Research's estimates, 362.8 MWpk1 of energy storage projects have
been announced globally in the 2013-2014 period with an almost equal distribution between
North America (103.3pk MW), Asia Pacific (100.5 MWpk), and Western Europe (91.1 MWpk)
[2]. The US Department of Energy Global Energy Storage Database (reference
http://www.energystorageexchange.org/projects/) hosted by the Sandia National
Laboratories, reports that approximately 433 “grid connected” projects across electro-
chemical and electro-mechanical sub-groups currently in operation, representing around
1.9GWpk of storage peak capacity globally.
While the rate of such storage projects are increasing, the majority of energy storage used worldwide on electricity grids is pumped hydro. Sandia reports approximately 150GWpk of operational pumped hydro systems worldwide at an average installed peak capacity of 168MWpk, reflecting both the maturity of that technology and its lower price. This compares to a total peark electrical generation capacity globally of around 5,500GW (reference is US Energy Information Administration at http://www.eia.gov/ ).
Energy storage systems operate by charging their devices by converting energy from one form (mainly electrical energy) to another (mainly chemical or potential energy). This energy is then stored for a period of time and discharged when needed by converting the stored energy back to electrical energy as a supply for electrical power systems.
Energy storage systems can serve various applications in power systems such as meeting peak load demands, transmission and distribution infrastructure investment deferral, arbitrage, frequency regulation, load following, voltage support, and transmission grid black start.
The technologies used in energy storage systems can be classified based on:
• their applications,
• the form of energy stored,
1 Where MWpk is the peak MW that can be delivered under normal operation, often referred to as
nameplate rating, refer to Section Error! Reference source not found.

ESCRI-SA MILESTONE 3: ENERGY STORAGE SYSTEMS June 2015
State of Art ES (ESCRI Format) - 2015-06-02 clean skin.docx Version A Page 22 of 93
• the suitable storage duration etc.
Classification of energy storage technologies based on the form of energy stored is as follows:
• Mechanical (PHS, CAES and FES)
• Chemical and Electrochemical (Batteries, FBES including Hydrogen fuel cells)
• Electrical (capacitors, supercapacitors and Superconducting Magnetic Energy
Storage or SMES)
• Thermal and thermochemical (solar fuels and sensible/latent heat storage)
Section 2 defines the main characteristics of energy storage technologies followed by Sections 3 to 9 where each of the above technologies are discussed in detail including their advantages and disadvantages, current status indicating research and development focuses, listing of several energy storage technology providers and projects and their physical and economical characteristics.
The document concludes with Section 10 which presents an overall discussion on the different energy storage technologies based on their characteristics.
1.4 A note on nomenclature
Energy storage systems are devices that are different to generation equipment and electrical
loads in that they can both produce and consume energy. They also have important
physical attributes, such as limitations on the rates at which energy is delivered/consumed,
and discharge level constraints, which are very important in determining what technology is
appropriate for a given circumstance.
It is very important then to use a consistant nomenclature which is suitable for the entire
suite of energy storage technologies.
All currencies quoted in this report are in (US$) unless stated otherwise, and the following
terms used in this report are defined as follows:
• Power rating
This parameter determines the constitution and size of the motor-generator or
inverter used in the stored energy conversion chain and is often used to represent
maximum power of charge and discharge [3]. Power ratings are typically presented in
the physical units W (joules/s), kW or MW. Where MWpk is used, this signifies the
maximum nameplate rate of energy delivery that the device can normally supply in
MW.
• Energy rating (storage capacity)
This is the quantity of available energy in the storage system after charging [3].
Energy ratings are typically presented in Wh, kWh or MWh which allows a direct
conversion between the rating of the device and the hours of storage it has available.

ESCRI-SA MILESTONE 3: ENERGY STORAGE SYSTEMS June 2015
State of Art ES (ESCRI Format) - 2015-06-02 clean skin.docx Version A Page 23 of 93
• Depth of discharge (DoD)
Depth of discharge is the converse term of charge. DoD represents the limit of
discharge depth (i.e. if a battery is 100 % fully charged, it means the DoD of the
battery is 0 %, while a fully discharged battery has a DoD of 100%). The allowable
Depth of discharge may be less than 100 % if the battery cannot be discharged to
zero without damage.
• Discharge time
This is the maximum power discharge duration. It depends on the allowable DoD, the
storage capacity, the MWpk and operational conditions of the system [3].
• Round trip efficiency or cycle efficiency
This is the ratio of whole system electricity output to the electricity input over a
charge and discharge cycle [1]. It provides a measure of the losses in an energy
storage device, which usually is released as heat to the environment.
• Discharge efficiency
This represents the energy transmission ability from the energy storage phase to the
energy discharged phase, which contributes to the overall cycle efficiency achieved
[1].
• Response time
This is the time required for an energy storage device to be capable of either
charging or discharging energy when it is initially in a quiescent state or operating in
an opposing charging direction.
• Self-discharge
This is the portion of energy that was initially stored and which is dissipated over a
given amount of non-use time (i.e. air leakage loses in CAES, electrochemical losses
BES etc.) [1], [3]. Only certain potential energy storage systems (such as raising a
solid mass to a certain height) could be considered to have zero self-discharge.
• Power and energy densities
These represent the power and energy accumulated per unit of device mass
(typically presented in W/kg or Wh/kg) or volume (typically presented in W/l or Wh/l)
of the storage unit [3]. These provide a metric for determining the size and the weight
of a storage system.

ESCRI-SA MILESTONE 3: ENERGY STORAGE SYSTEMS June 2015
State of Art ES (ESCRI Format) - 2015-06-02 clean skin.docx Version A Page 24 of 93
• Durability (lifetime and cycling time or cycling capacity)
Durability is typically expressed as lifetime in years or cycling capacity in number of
cycling times (1 cycle corresponds to one charge and one discharge) [3].
• Costs
The capital invested and operational costs (maintenance, energy lost during cycling,
aging) are two important economic factors to consider for the entire life of the system
[3]. The capital cost of energy storage systems can be expressed in power capital
cost ($/kW) or energy capital costs ($/kWh).
In addition to the characteristics described above, operational constraints, operational
flexibility, reliability, health and safety, environmental aspects also need to be considered for
energy storage systems.

ESCRI-SA MILESTONE 3: ENERGY STORAGE SYSTEMS June 2015
State of Art ES (ESCRI Format) - 2015-06-02 clean skin.docx Version A Page 25 of 93
2. Pumped Hydro Storage (PHS)
PHS is by far the most widely implemented large scale electrical energy storage technology.
It has a long history, high technical maturity and large energy capacity [1].
Currently (2014/15) the world has an installed capacity of approximately 142.11 GW across
292 projects that are operational [4].
A PHS system typically consists of two reservoirs located at different elevations, a unit to
pump water to the high elevation reservoir during the off-peak period (that stores the
electricity in the form of hydraulic potential energy) and a turbine to generate electricity when
the water is released to the lower reservoir during the peak demand period (that converts the
potential energy to electricity) [5].
Figure 6 shows a schematic diagram of a typical PHS plant layout.
Figure 6: Layout of a typical PHS plant [1]
Many of the recently proposed pumped storage projects are often classified as “closed loop”
or “open loop” systems, depending on their connection with rivers or other flowing water
bodies [6]. The Federal Energy Regulatory Commission in the U.S. defines these two
systems as follows:
• Closed-loop pumped storage projects are not continuously connected to a naturally-
flowing water feature.
• Open-loop pumped storage projects are continuously connected to a naturally-
flowing water feature.
Closed loop systems are often preferred because of the fewer environmental impacts
associated with these developments [6].
Table 2 presents the advantages and disadvantages of PHS.

ESCRI-SA MILESTONE 3: ENERGY STORAGE SYSTEMS June 2015
State of Art ES (ESCRI Format) - 2015-06-02 clean skin.docx Version A Page 26 of 93
Table 2: Advantages and disadvantages of PHS [1], [5]
Advantages Disadvantages
• Mature technology
• Long discharge periods (owing to small evaporation and penetration)
• Can accommodate very high power ratings
• Site selection restrictions
• Long construction time
• High capital investment
2.1 Current Status
There are currently at least 341 projects totalling 177,427 MW worldwide that are operational, announced, contracted, under construction or off-line [4]. In Australia, PHS accounts for about 1,490 MW of installed capacity, which are mostly based on large-scale PHS systems (i.e. Wivenhoe Power Station – 500 MW, Kangaroo Valley Pumping and Power Station – 160 MW etc. ) [4], [7].
Innovative research has led to several novel PHS technologies that incorporate designs with different types of turbines (e.g. variable speed), different types of reservoirs (e.g. aquifers, old mine shafts, tanks, the ocean) [8]. Elmhurst Quarry pumped storage project developed by DuPage County, Illinois, U.S. has been proposed to use an abandoned mine and quarry for both reservoirs, with a rating of 50 – 250 MW / 708.5 GWh [9].
The Okinawa Yanbaru PHS system uses the sea as its lower reservoir [9]. The plant utilizes the effective head of 136 m between the upper pond and the sea, and it generates a maximum of 30 MW, using 26 m3 of seawater [10]. The Yanbaru PSH system has been in operation since 1999 [10]. This is the only PHS plant that currently uses seawater whilst several other large-scale storage projects have been proposed to use a similar concept [9].
Although construction of a lower pond is not required, the list below provides several issues facing a seawater PHS system [10].
• Evaluations of measures taken to prevent permeation and pollution by seawater from the upper pond into the ground and/or into ground water.
• Efficiency reduction in power generation and pumping as a result of adhesion of marine organisms to the waterways and the turbine.
• Corrosion of metal materials that come into contact with seawater under high pressure and high flow speed created by the pump-turbine.
• To ensure stable power output through steady intake and discharge of seawater at the outlet against high waves.
• Impacts on plants, animals and other biological systems around the site by the wind's dispersion of seawater from the upper pond.
• Impacts on coral and other marine organisms that live near the outlet.
Figure 7 shows an image of the Yanbaru sea water PHS system in Okinawa, Japan.

ESCRI-SA MILESTONE 3: ENERGY STORAGE SYSTEMS June 2015
State of Art ES (ESCRI Format) - 2015-06-02 clean skin.docx Version A Page 27 of 93
Figure 7: Yanbaru seawater PHS system in Okinawa, Japan [11]
In addition, Archimedes’ screw, Energy Island, in-ground storage pipe with piston and in-reservoir tube with bubbles are examples of several other innovative PSH or PSH-like technologies.
Table 3 presents several other selected small to medium scale (i.e. with power ratings up to 30 MW) PHS facilities.
Table 3: Selected PHS facilities2 [4]
Project Name Rated Power
in kW Status
State /Province
Country
O'Neill Powerplant 25,200 Operational California United States
Flatiron Powerplant 8,500 Operational Colorado United States
Rocky River Pumped Storage Plant 29,000 Operational Connecticut United States
Kubanskaya PSP 15,900 Operational Prikubansky Russia
MAREX (Seawater Open-loop Pumped Hydro Storage)
1,500 Announced Connaght Ireland
Rellswerk Pumped Hydro Project 12,000 Under Construction
Vadans Austria
2 Entries marked in red are noted as unverified in [4]

ESCRI-SA MILESTONE 3: ENERGY STORAGE SYSTEMS June 2015
State of Art ES (ESCRI Format) - 2015-06-02 clean skin.docx Version A Page 28 of 93
2.2 Summary of Main economic and Physical characterisitcs - PHS
2.2.1 Physical Characteristics
Table 4 and Table 5 present the physical and technical characteristics and environmental, health and safety concerns of PHS irrespective of scale of the storage system.
Table 4: Physical and technical characteristics of PHS [1]
Category Technical Characteristic Values
Power and Energy Ratings
Power Rating (MW)
100–5000
30
<4000
Energy Rating (MWh)
500–8,000
180 Okinawa PHS
Energy and Power Densities
Energy Density (Wh/l) 0.5 – 1.5
1 - 2
Power Density (W/l) 0.5–1.5
~1
Specific Energy (Wh/kg) 0.5 – 1.5
Specific Power (W/kg) -
Response& Discharge Times and Storage Duration
Response Time
Minutes
Not rapid discharge
Discharge Time (At Power Rating)
1–24 h+
6–10 h
10 h
Daily Self Discharge (%) Very small
Suitable Storage Duration Hours–months
long-term
Efficiencies
Round Trip Efficiency / Cycle Efficiency (%)
70–85
70–80
87
75–85
Discharge Efficiency (%) ~87
Lifetime and Cycling Capacities Lifetime (years)
40–60
40+
30+
Cycling Capacity (cycles) 10,000–30,000

ESCRI-SA MILESTONE 3: ENERGY STORAGE SYSTEMS June 2015
State of Art ES (ESCRI Format) - 2015-06-02 clean skin.docx Version A Page 29 of 93
Table 5: Environment and health and safety concerns of PHS [5], [10], [12]
Category Concerns
Environment
Negative Influence
Destruction of trees and green land for building reservoirs [5]
Impact on sweater and marine organisms in seawater PHS [10]
Health and Safety Conventional PHS is well understood without large uncertainty remaining concerning its safety [12]
2.2.2 Economic Characteristics
A summary of cost data for PHS is presented in Table 6 irrespective of scale of the storage system.
Table 6: Economic characteristics of PHS [1]
Cost Description Cost Value
Power Capital Cost (S/kW) 2,500–4,300 2,000–4,000
Energy Capital Cost ($/kWh) 5–100
10–12
Operating and Maintenance Cost 0.004 $/kW h
~3 $/kW/year

ESCRI-SA MILESTONE 3: ENERGY STORAGE SYSTEMS June 2015
State of Art ES (ESCRI Format) - 2015-06-02 clean skin.docx Version A Page 30 of 93
3. Flywheel Energy Storage (FES)
A mass which rotates about an axis is called a flywheel [13]. A FES system consists of a
flywheel (rotor), motor/generator, power conversion/conditioning system (power electronics),
rotor bearings, controllers and containment (vacuum enclosures are used to reduce the
idling losses of the FES system) [14].
Figure 8 provides a schematic of a FES system.
Figure 8: Components of a FES system [1]
The FES system charges by using the electrical supply to accelerate the flywheel, which is coupled to a machine enabling it to store the energy in the form of kinetic energy. The amount of energy stored is dependent on the rotating speed of the flywheel and its inertia [1]. As the stored energy is required the flywheel discharges its kinetic energy. The integrated machine works as a motor during charging and a generator during discharging [14].
There are two basic schemes of FES operation – low speed and high speed flywheels. Low speed flywheels typically use steel as the flywheel material and rotate below 6 000 – 8 000 rpm [14], [1]. These systems are typically used for short-term and medium/high power applications [1]. High speed flywheels use advanced composite materials (i.e. carbon fibre) for the flywheels which can speed up to 10,000 rpm [1]. Applications of this technology are continuously expanding mainly in high power quality and ride-through power service in traction and aerospace industry [1]. Figure 9 shows the components of a low speed and a high speed flywheel.

ESCRI-SA MILESTONE 3: ENERGY STORAGE SYSTEMS June 2015
State of Art ES (ESCRI Format) - 2015-06-02 clean skin.docx Version A Page 31 of 93
Figure 9: Components of a low speed flywheel (left) and a high speed flywheel (right) [14]
Table 7 tabulates the advantages and the disadvantages of FES systems.
Table 7: Advantages and disadvantages of FES system [14], [1]
Advantages Disadvantages
• High cycle efficiency (up to ~ 95% at rated power [1]
• Relatively high power density [1]
• No depth of discharge effects [1]
• Easy maintenance [1]
• Fast response [14]
• High self-discharge (up to ~ 20 % of store capacity per hour) [1]
• Limitation in storing energy for longer periods of time [14]
• Safety concerns in case of rotor failure as in some FES systems the rotor is heavy which may be perilous [14]
3.1.1 Current Status
The current research and development of FES focuses are:
• material of the flywheel for increasing their rotation speed capabilities and power
densities,
• high speed electrical machines,
• high carrying capacity of bearings and the flywheel array technology [1].
Recently a new bearing using high temperature superconducting (HTS) materials was introduced which lead to significant reduction in idling losses, supports quicker switching and lower costs but requires liquid nitrogen for cryogenic cooling [15].

ESCRI-SA MILESTONE 3: ENERGY STORAGE SYSTEMS June 2015
State of Art ES (ESCRI Format) - 2015-06-02 clean skin.docx Version A Page 32 of 93
ABB, Active Power, Amber Kinetics, Beacon Power, Temporal Power Ltd and VYCON are some of the vendors that provide the FES technology. Beacon Power’s modular design of their flywheel system is shown in Figure 10. Three-piece, pre-cast concrete flywheel foundations (similar in construction to highway storm drains) are installed in the ground, levelled, and surrounded by crushed stone [16]. Concrete pads are built for the power control module, cooling systems and switchgear. Underground conduit is placed to run power and signal cables between components [16].
Figure 10: Modular configuration of Beacon Power’s flywheel systems [16]
3.1.2 Current Commercial Uses
Due to its high cost and low storage capacity, and high self discharge, this type of technology can be ruled out for the applications considered in this project. However the technology is very useful for applications on islanded grid systems which require high responsiveness, a means of augmenting system inertia and are often provided as a high speed backup in conjunction with battery systems .
In Australia, currently there are two FES projects that are operational – Coral Bay (wind – diesel hybrid system) and Marble Bar (solar – diesel hybrid system) in Western Australia [4]. Both projects include a 1 x 500 kW (18MWs) ABB PowerStoreTM flywheel system that is used for voltage support and frequency regulation [4], [17].
Leinster Nickel Operation PowerStore flywheel is another project that included the flywheel technology, which is now decommissioned [4]. The project included a FES rated at 1 MW (60 s storage at rated power) at the BHP Billition’s Leinster nickel mine in Western Australia [4].
Table 8 lists several FES systems worldwide that have relatively high power ratings.

ESCRI-SA MILESTONE 3: ENERGY STORAGE SYSTEMS June 2015
State of Art ES (ESCRI Format) - 2015-06-02 clean skin.docx Version A Page 33 of 93
Table 8: Selected FES facilities3 [4]
Project Name Rated
Power in kW
Duration at Rated Power HH:MM
Status State
/Province Country
Beacon Power 20 MW Flywheel Frequency Regulation Plant (Stephentown, NY)
20 000 0:15.00 Operational New York United States
Beacon Power 20 MW Flywheel Frequency Regulation Plant (Hazle Township, PA)
20 000 0:15.00 Operational Pennsylvania United States
Clear Creek Flywheel Wind Farm Project
5 000 0:6.00 Under Construction
Ontario Canada
EFDA JET Fusion Flywheel 400 000 0:0.50 Operational Oxfordshire United Kingdom
Institute of Plasma Physics (IPP) Flywheel System
70 000 0:0.05 Operational Prague Czech Republic
Max Planck Institute ASDEX-Upgrade Pulsed Power Supply System
387 000 0:0.12 Operational Bavaria Germany
VYCON Lights-Out Data Center 8 000 0:0.50 Contracted Texas United States
Austin Energy Control Center VYCON Flywheels
4 800 0:0.50 Operational Texas United States
EMC Durham Cloud Data Center VYCON Flywheels
4 000 0:0.40 Operational North Carolina
United States
Net Powersafe Active Power UPS 9 000 0:0.23 Operational Switzerland Switzerland
Pacific Northwest Active Power UPS
11 000 0:0.23 Operational Oregon United States
3.1.3 Learnings from Commercial Development/Operation
Mechanical wear and tear on the flywheel components is understood to be the main factor limiting the longevity of FES installations.
3.2 Summary of Main economic and Physical characterisitcs - FES
3.2.1 Physical Characteristics
Table 9 and Table 10 presents the physical and technical characteristics and environmental, health and safety concerns of FES respectively.
Table 9: Physical and technical characteristics of FES [1]
Category Technical Characteristic Values
Power and Energy Ratings Power Rating (MW)
<0.25
3.6
0.1–20
3 Entries marked in red are noted as unverified in [4]

ESCRI-SA MILESTONE 3: ENERGY STORAGE SYSTEMS June 2015
State of Art ES (ESCRI Format) - 2015-06-02 clean skin.docx Version A Page 34 of 93
Category Technical Characteristic Values
Energy Rating (MWh)
0.0052
0.75
up to 5
Energy and Power Densities
Energy Density (Wh/l) 20–80
Power Density (W/l) 1000–2000
~5000
Specific Energy (Wh/kg)
10–30
5–100
5–80
Specific Power (W/kg) 400–1500
Response& Discharge Times and Storage Duration
Response Time <1 cycle (20 ms)
Seconds
Discharge Time (At Power Rating) Up to 8 s
15 s–15 min
Daily Self Discharge (%) 100
¥ 20% per hour
Suitable Storage Duration Seconds–minutes
short-term(<1 h)
Efficiencies
Round Trip Efficiency / Cycle Efficiency (%)
~90–95
90 & 95
Discharge Efficiency (%) 90 – 93
Lifetime and Cycling Capacities
Lifetime (years)
~15
15+
20
Cycling Capacity (cycles) 20,000+
21,000+
Table 10: Environment and health and safety concerns of FES [5], [12]
Category Concerns
Environment Almost no influence on the environment [5]
Health and Safety
Flywheels typically have large rotational masses that in the case of catastrophic radial failure need a robust enclosure to contain the debris [12].
The engineering designs and safety factors in containing flywheels are not currently widely established by the codes, standards and regulations and require further research [12].
Current safety validation testing involves the following [12]:
− Burst testing to probe containment integrity − Loss of vacuum testing − Over-speed testing of systems − Fatigue testing of sample materials

ESCRI-SA MILESTONE 3: ENERGY STORAGE SYSTEMS June 2015
State of Art ES (ESCRI Format) - 2015-06-02 clean skin.docx Version A Page 35 of 93
3.2.2 Economic Characteristics
A summary of cost data for FES is presented in Table 11.
Table 11: Economic characteristics of FES [1]
Cost Description Values
Power Capital Cost (S/kW) 250–350
Energy Capital Cost ($/kWh) 1,000–5,000
1,000–14,000
Operating and Maintenance Cost ~0.004 $/kW h
~20 $/kW/year

ESCRI-SA MILESTONE 3: ENERGY STORAGE SYSTEMS June 2015
State of Art ES (ESCRI Format) - 2015-06-02 clean skin.docx Version A Page 36 of 93
4. Compressed Air Energy Storage (CAES)
CAES system is an electromechanical storage which is designed to store high pressure air
during periods of low electricity demand and release air during periods of high demand. It is
the only other commercially available technology, other than PHS4 capable of providing very
large energy storage deliverability (i.e. above 100 MW with a single unit).
4 Pump Hydro Storage

ESCRI-SA MILESTONE 3: ENERGY STORAGE SYSTEMS June 2015
State of Art ES (ESCRI Format) - 2015-06-02 clean skin.docx Version A Page 37 of 93
4.1 Diabatic Compressed Air Energy Storage (D-CAES)
In conventional diabatic, meaning to lose heat, the air is cooled and compressed into an
underground cavern, typically 4-8 MPa (charging) during off peak periods [5], [18]. The heat
generated during air compression is released to the atmosphere. During peak periods, the
stored air is drawn from the cavern, heated in a natural gas or diesel fired combustion
chamber and then expanded through a turbine that spins an electrical generator
(discharging) [5], [18] . The components of a CAES are shown in Figure 11.
(1) Compressor train
(2) Motor – generator unit
(3) Gas turbine
(4) Underground compressed air
storage
Figure 11: Schematic diagram of a CAES plant showing the main components [19]
4.1.1 Challenges and Barriers
• Reliance on favourable geography – requirement for an underground cavern
• Dissipation of heat into the atmosphere
• Consumption of fossil fuels
• Generation of pollutants emissions from the combustion process [20]
4.1.2 Current Status
There are two conventional CAES plants currently in operation. The first CAES plant is in
Huntorf Germany commissioned in 1978. The plant runs on a daily cycle with approximately
8 hours of charging and can generate 290 MW for 2 hours. Table 12 tabulates the key data
of the Huntorf plant.
Table 12: Specifications of the Huntorf CAES plant [19]

ESCRI-SA MILESTONE 3: ENERGY STORAGE SYSTEMS June 2015
State of Art ES (ESCRI Format) - 2015-06-02 clean skin.docx Version A Page 38 of 93
Description Specifications
Output
� Turbine operation � Compressor operation
290 MW (≤ 3 hours) 60 MW (≤ 12 hours)
Air flow rates
� Turbine operation � Compressor operation � Air mass flow ration (in/out)
417 kg/s
108 kg/s
1/4
Number of air caverns 2
Air cavern volumes (single) Total cavern volume
≈ 140 000 m3
≈ 170 000 m3
≈ 310 000 m3
Cavern location
� Top � Bottom
≈ 650 m
≈ 800 m
Maximum diameter ≈ 60 m
Well spacing 220 m
Cavern pressures
� Minimum permissible � Minimum operational (exceptional) � Minimum operational (regular) � Maximum permissible & operational
1 bar 20 bar 43 bar 70 bar
Maximum pressure reduction rate 15 bar/h
The second CAES plant is in McIntosh, Alabama, USA commissioned in 1991 by Alabama
Electric Coop (now PowerSouth). The storage capacity is over 500 000 m3 with a generating
capacity of 110 MW and up to 26 hours working duration. This system utilises a recuperator
to reuse the heat from the gas turbine which reduces the fuel consumption by ~25% in
comparison with the Huntorf plant [10]. Both Huntorf and McIntosh plants have achieved
availability and starting reliability in excess of 90% and 99% respectively [12]. Figure 10
shows an aerial picture of the McIntosh plant.

ESCRI-SA MILESTONE 3: ENERGY STORAGE SYSTEMS June 2015
State of Art ES (ESCRI Format) - 2015-06-02 clean skin.docx Version A Page 39 of 93
Figure 12: Ariel picture of the McIntosh CAES Plant [21]
There are 2 conventional CAES plants being planned – the Norton Ohio Project (9 x 300
MW) by Haddington Ventures Inc (now FirstEnergy) and PG&E California (300 MW) [18],
[22]. The Norton Ohio Project is on development hold due to poor market conditions and
PG&E is scheduled to issue a RFP in 2015.
Iowa Stored Energy Park, Iowa, USA (270 MW), Seneca, New York, USA (150 MW),
Donbas, Ukraine (1050 MW) and Soyland, Illinois, USA (220 MW) are some of the failed D-
CAES projects primarily due to unfavourable geology and economic infeasibility [18].

ESCRI-SA MILESTONE 3: ENERGY STORAGE SYSTEMS June 2015
State of Art ES (ESCRI Format) - 2015-06-02 clean skin.docx Version A Page 40 of 93
4.2 Adavanced Adiabatic Compressed Air Energy Storage (AA-CAES)
The advanced adiabatic (meaning to conserve heat) CAES plants, includes thermal storage,
that stores the compression heat for later use during expansion which in effect reduces or
eliminates the need for additional fuel inputs [18].
4.2.1 Challenges and Barriers
• Cost-effective thermal energy storage designs to absorb and store energy with
minimal thermal losses at temperatures up to 600 ºC.
• New HP compressor designs will be required to handle high compression
temperatures [18].
4.2.2 Current Status
There is currently one AA-CAES project in planning stage – Project ADELE at Saxony-
Anhalt in Germany - a joint effort between RWE, General Electric, Zueblin, and the German
Aerospace Center [23]. This project is set for commissioning in 2020 [18]. The plant will have
a storage capacity of 360 MWh, electric output of 90 MW and aiming to achieve system
efficiencies of ~70% [20], [1].
4.3 Isothermal Compressed Air Energy Storage (I-CAES)
The isothermal (meaning constant temperature) CAES technology attempts to achieve near
isothermal compression , avoiding external heat exchanger to compress and expand air,
yielding improved efficiencies of ~70%-80% with fuel free operation and less thermal stress
on equipment [18].
4.3.1 Challenges and Barriers
• Improving efficiencies of liquid/air heat transfer at high flow rates
• Developing effective liquid/air separation devices [18].
4.3.2 Current Status
I-CAES technology is now operational on the following pilot scale plants:
• General Compression
In early 2011, General Compression commissioned ARPA-E's first successful
project, a 100 kW multi-stage GCAES™ unit in Watertown, Massachusetts [24].

ESCRI-SA MILESTONE 3: ENERGY STORAGE SYSTEMS June 2015
State of Art ES (ESCRI Format) - 2015-06-02 clean skin.docx Version A Page 41 of 93
The Gaines, Texas Dispatchable Wind Project is a 2.0MW/500 MWh wind
generation project located in West Texas. It is owned and operated by Texas
Dispatachable Wind 1, LLC, a subsidiary of General Compression. The project
consists of a wind turbine, a General Compression Advanced Energy Storage
(GCAES™) system, salt cavern storage, and other electrical & ancillary facilities.
The project has the capability, during periods of low demand, to store portions of
the energy generated by the wind turbine and later, during periods of increased
demand, release the stored energy. Construction of the project began in 2011
and the project was commissioned in late 2012 [DoE database] & [25].
• SustainX
SustainX has constructed a 1.5 MW/1.5 MWh I-CAES system located at
SustainX headquarters in Seabrook, New Hampshire, USA. SustainX’s I-CAES
system captures the heat produced during compression, traps it in water, and
stores the warmed air-water mixture in pipes. When electricity is needed back on
the grid, the process reverses and the air expands, driving a generator. Therefor
fossil fuel is not needed to reheat the air and emissions are not produced. The
system is designed for a 20-year lifetime [26].
• LightSail Energy
LightSail Energy in Berkeley, California, USA has built two prototypes using the I-
CAES technology. Similar to SustanX, LightSail also use specially built
containers addressing the siting issue with modularity, rather than underground
caverns to store compressed air [25], [27].

ESCRI-SA MILESTONE 3: ENERGY STORAGE SYSTEMS June 2015
State of Art ES (ESCRI Format) - 2015-06-02 clean skin.docx Version A Page 42 of 93
4.4 CAES - Summary
Table 13 compares technical characteristics and capital cost data of the above mentioned
three primary CAES thermodynamic technologies. The capital cost values are extracted
from reference and provided in US$/kW (in 2012 terms).
Table 13: Comparison of CAES systems [18]
Parameter D-CAES AA-CAES I-CAES
System efficiency 42 – 54% 65 – 70% 70-80%
Cycle temperature ºC Up to 750 ºC 500 – 600 ºC < 80 ºC
Fuel requirement Natural gas Minimal None
Typical air storage medium Underground Underground, aboveground
Near surface, aboveground
Technical maturity
Capital capacity cost, 2012 US$/kW
$760 – $1 200 $850 – $1 870 $500 at 50 MW+ scale $1 500 – $6 000 at pilot scale
Apart from using liquid extracted salt and hard rock caverns and acquifiers, near surface buried concrete poly or composite pipework, above ground fibre wound tanks and under-water HDPE bags ballasted to the sea floor are other major approaches to CAES [18]. Above ground and near surface storage approaches have been developed by several commercial groups (i.e. SustainX, LightSail Energy) to provide siting flexibility and reduce structural risks. It has been suggested that above-ground storage be limited to 3-5 hours output to provide cost competitiveness with underground storage [18].
Applications of large-scale CAES plants involve load shifting, peak shaving, frequency and voltage control and smoothing outputs of intermittent renewable energy applications. In addition distributed, stand-alone and uninterrupted power supply (UPS) applications of CAES offer an alternative to battery systems. Compressed air battery systems developed by the UK based Flowbattery (previously named Pnu Power) were recently commercialised [18], [1].
In addition to the traditional CAES discussed above, there are several innovative CAES technologies being developed. The list below provides several novel CAES and associated companies [8].
Table 14: Novel CAES technologies [8]
Novel CAES Technology Associated Companies
Adsorption-enhanced CAES Energy Compression
Hydrokinetic Energy Moonburg, LLC
Diabatic (Solar-assisted) CAES Brayton Energy, LLC and Southwest Solar Technologies, Inc.
Liquid Air Energy Storage Air Products and Chemicals, Mitsubishi Heavy Industries, Inc., and Expansion Energy, LLC.
Transportable CAES EnisEnerGen
Underwater CAES Bright Earth Technologies, Brayton, and Exuadrum

ESCRI-SA MILESTONE 3: ENERGY STORAGE SYSTEMS June 2015
State of Art ES (ESCRI Format) - 2015-06-02 clean skin.docx Version A Page 43 of 93
Novel CAES Technology Associated Companies
Vehicle Compression Darren McKnight of Integrity Applications, Inc
4.5 Summary of Main economic and Physical characterisitcs - CAES
4.5.1 Physical Characteristics
Table 15 and Table 16 presents the physical and technical characteristics and environmental, health and safety concerns of PHS respectively.
Table 15: Physical and technical characteristics of PHS [1]
Category Technical
Characteristic
Values
Large-scale CAES Over-ground Small
CAES
Power and Energy Ratings
Power Rating (MW)
Up to 300
110 & 290
1000
0.003 – 3
Potential ~10
Energy Rating (MWh) ~ < 1000
580 & 2860
~0.01
~0.002–0.0083
Energy and Power Densities
Energy Density (Wh/l) 3–6
2–6
Higher than large-scale CAES
Power Density (W/l) 0.5–2
~1
Higher than large-scale CAES
Specific Energy (Wh/kg)
30–60 140 at 300 bar
Specific Power (W/kg) – –
Response& Discharge Times and Storage Duration
Response Time Minutes Seconds – minutes
Discharge Time (at power rating)
1–24 h+
8–20 h
30 s–40 min
3 h
Daily Self Discharge (%)
Small
Almost Zero Very small
Suitable Storage Duration
Hours–months
long-term
Hours–months
long term
Efficiencies
Round Trip Efficiency / Cycle Efficiency (%)
42
54
AA-CAES 70
-
Discharge Efficiency (%)
~70–79 ~75–90
Lifetime and Cycling Capacities
Lifetime (years)
20–40
30
20+
23+

ESCRI-SA MILESTONE 3: ENERGY STORAGE SYSTEMS June 2015
State of Art ES (ESCRI Format) - 2015-06-02 clean skin.docx Version A Page 44 of 93
Category Technical
Characteristic
Values
Large-scale CAES Over-ground Small
CAES
Cycling Capacity (cycles)
8000–12,000 Test 30,000 stop
/starts
Table 16: Environment and health and safety concerns of PHS [5], [12]
Category Concerns
Environment Negative Influence due to emissions from combustion of natural gas [5].
Health and Safety
Established safety codes address the above-ground CAES pressure vessel concerns (these are well mitigated with pressure relief valves implemented at pressures equal to 40% of the rupture pressure in steel vessels and 20% of the rupture pressure for fibre-wound vessels – as defined by code) [12].
4.5.2 Economic Characteristics
In addition to capital cost data for various CAES systems presented in Table 13, a general summary of cost data including operational costs for CAES extracted from [1] is presented in Table 17.
Table 17: Economic characteristics of CAES [1]
Cost Description Values
Large-scale CAES Over-ground Small CAES
Power Capital Cost (S/kW) 400–800
800–1000
517
1300–1550
Energy Capital Cost ($/kWh)
2–50
2–120
2
1MVA from £296 k
200–250
Operating and Maintenance Cost
0.003 $/kW h 19–25 $/kW/year
Very low

ESCRI-SA MILESTONE 3: ENERGY STORAGE SYSTEMS June 2015
State of Art ES (ESCRI Format) - 2015-06-02 clean skin.docx Version A Page 45 of 93
5. Battery Energy Storage (BES)
BES stores electricity in the form of chemical energy and is one of the most widely used storage technologies in industry and daily life [5], [1]. A conventional BES system consists of number of electrochemical cells connected in series or parallel that produces electricity at a desired voltage from an electrochemical reaction. Each cell consists of an electrolyte which can be in liquid, paste or solid state and two electrodes – an anode and a cathode [5]. A battery is charged by an internal chemical reaction when an external voltage is applied to both electrodes. This is reversible allowing the stored energy to be discharged by generating a flow of electrons through an external circuit.
Figure 13: Schematic of a BES system [1]

ESCRI-SA MILESTONE 3: ENERGY STORAGE SYSTEMS June 2015
State of Art ES (ESCRI Format) - 2015-06-02 clean skin.docx Version A Page 46 of 93
5.1 Lead-Acid Batteries
Lead-acid batteries generally use lead and lead oxide as the electrodes and sulphuric acid as electrolyte. It is one of the most widely used battery technology [1]. Table 18 lists the advantages and disadvantages of lead-acid batteries.
Table 18: Advantages and disadvantages of lead-acid batteries [5], [1]
Advantages Disadvantages
• Fast response times
• Small daily self-discharge rates (<0.3%)
• Relatively high cycle efficiencies (63%-90%)
• Low capital costs (50-600 $/kWh)
• Relatively short cycle life (up to ~2000 cycles)
• Low energy density due to inherent high density of lead (25 – 50 Wh/kg)
• Poor performance at low temperatures (thus require a thermal management system)
5.1.1 Current Status
Power output from lead-acid batteries is non-linear and their lifetime varies significantly depending on the application, discharge rate, and number of deep discharge cycles, which can significantly reduce life.
Currently research and development of lead-acid batteries focuses on innovating materials for performance improvement (improving cycling life and deep discharge capability) and implementing the technology in wind, PV power integration and automotive applications [1].
Several advanced lead-acid batteries that address some of the above mentioned issues are being developed or in the demonstration phase such as Ecoult UltraBatteryTM and Xtreme Power (now Younicos) advanced lead-acid “dry cell” [1].
Currently there are two projects in Australia that utilizes advanced lead-acid battery storage – King Island Renewable Energy Integration Project (KIREIP) and Hampton Wind Park [4]. In both of which the energy storage technology provider is Ecoult. The KIREIP includes a 3MW/1.6 MWh UltraBatteryTM storage system and 1 MW/0.5 MWh (based on 30 minutes at 1 MW) storage system at Hampton Wind Park to smooth the 5 minute ramp rate of the wind farm ( [4], [28], [29]).
Table 19 lists selected several lead-acid energy storage facilities.
Table 19: Selected lead acid battery energy storage facilities5 [4]
Project Name Rated
Power in kW
Duration at Rated Power HH:MM
Status State/Province Country
Kahuku Wind Farm 15 0:15.00 Offline/Under Repair
Hawaii United States
5 Entries marked in red are noted as unverified in [4]

ESCRI-SA MILESTONE 3: ENERGY STORAGE SYSTEMS June 2015
State of Art ES (ESCRI Format) - 2015-06-02 clean skin.docx Version A Page 47 of 93
Project Name Rated
Power in kW
Duration at Rated Power HH:MM
Status State/Province Country
Duke Energy Notrees Wind Storage Demonstration Project
36 0:40.00 Operational Texas United States
Kaheawa Wind Power Project II
10 0:45.00 Operational Hawaii United States
Shiura Wind Park 5 2:20.00 Operational Aomori Japan
STMicroelectronics UBS System
10 0:0.50 Operational Arizona United States
PREPA BESS 1 21 0:40.00 De-Commissioned
Puerto Rico United States
PREPA BESS 2 20 0:40.00 Offline/Under Repair
Puerto Rico United States

ESCRI-SA MILESTONE 3: ENERGY STORAGE SYSTEMS June 2015
State of Art ES (ESCRI Format) - 2015-06-02 clean skin.docx Version A Page 48 of 93
5.2 Lithium-Ion (Li-Ion) Batteries
In a Li-ion battery, the cathode is made of a lithium metal oxide (LiCoO2, LiMO2, LiNiO2) and the anode is made of graphite carbon. The electrolyte is made of lithium salts dissolved in organic carbonates [5].
Table 20 lists the advantages and disadvantages of lead-acid batteries.
Table 20: Advantages and disadvantages of Li-ion batteries [1], [30]
Advantages Disadvantages
• Response time in the order of milliseconds
• Relatively high power and energy densities
• High efficiencies
• Cycle depth of discharge (DoD) can affect the battery life
• High production costs (requires an on-board computer to manage its operation)
5.2.1 Current Status
There are three types of Li-ion batteries in commercial use – cobalt, manganese and phosphate [30]. Developers of Li-ion batteries are seeking to lower maintenance and operating costs, deliver high efficiency and ensure that large banks of batteries can be controlled [30]. Some of the current research and development focusses are to increase the battery power capability with the use of nanoscale materials and enhance the battery specific energy by developing advanced electrode materials and electrolyte solutions [1].
In Australia Ergon Energy expects to roll out Grid Utility Support Systems (GUSS) by mid-2015 to reduce network augmentation costs and improve the quality and reliability of electricity supply to rural customers on constrained single wire high voltage distribution voltage lines, known as SWER (Single Wire Earth Return). S&C Electric Company is to provide 20 x 25 kVA/100 kWh GUSS units [31].

ESCRI-SA MILESTONE 3: ENERGY STORAGE SYSTEMS June 2015
State of Art ES (ESCRI Format) - 2015-06-02 clean skin.docx Version A Page 49 of 93
Figure 14: Schematic of Ergon Energy GUSS deployment [31]
In 2012 SP AusNet initiated the Grid Energy Storage System (GESS) trial to explore the potential of using BES to manage network peak demand and defer network upgrades. The GESS trial will be connected to the 22 kV distribution network at Watsonia. The GESS system is a 1 MW/1 MWh battery system and smart inverter system initially supporting the peak load at Watsonia. The rating of the battery is extended with a 1 MW diesel generator. ABB Australia Pty Ltd and Samsung SDI have been awarded the contract to supply the GESS. The project is due to be completed in 2014 followed by a 2 year trial period [32].

ESCRI-SA MILESTONE 3: ENERGY STORAGE SYSTEMS June 2015
State of Art ES (ESCRI Format) - 2015-06-02 clean skin.docx Version A Page 50 of 93
Figure 15: GESS for distribution network support [33]
In November 2014, AES Southland announced that it has been awarded a 20-year Power Purchase Agreement by Southern California Edison (SCE), to provide 100 MW of interconnected battery-based energy storage, a 200 MW flexible power resource. This new capacity can deliver 400 MWh of energy and will be built south of Los Angeles at the Alamitos Power Center in Long Beach, California [4].
Smarter Network Storage (SNS) project, Europe’s largest battery storage project that was launched in December 2014 - a collaboration by S&C Electric, Samsung SDI, UK Power Networks and Younicos. The facility is being installed at Leighton Buzzard Befordshire, UK using a battery cell technology based on Li-ion chemistry (a Lithium-Manganese blend) [34], [35].
Li-ion batteries are also used in Hybrid and full Electric Vehicles that has capacities of 15-20 kWh and 50 kWh respectively [1].
Some of the other technology providers involved in Li-ion batteries are 123 Systems (NEC Energy Solutions), Toshiba, LG Chem Ltd and BYD America to name a few [4].

ESCRI-SA MILESTONE 3: ENERGY STORAGE SYSTEMS June 2015
State of Art ES (ESCRI Format) - 2015-06-02 clean skin.docx Version A Page 51 of 93
5.3 Sodium Sulphur (NaS) Batteries
NaS batteries consist of molten sulphur at the cathode, sodium at the anode. The anode and the cathode are separated by beta alumina membrane ceramic electrolyte (NaO and Al2O3). The electrolyte allows the sodium to pass through it and then combine with sulphur to produce sodium polysulphides [20]. Figure 16 is a schematic diagram of a NaS cell and illustrates its operation.
Figure 16: Schematic of a NaS battery cell and its operation [36]
NaS batteries are maintained a temperature of 300-350 ºC [20]. Table 21 tabulates the advantages and disadvantages of NaS batteries.
Table 21: Advantages and disadvantages of NaS batteries [1]
Advantages Disadvantages
• Relatively high energy densities (150 – 300 W h/l)
• Almost zero daily self-discharge
• Higher rated capacity than other batteries (up to 244.8 MWh)
• High pulse capability
• Uses inexpensive, non-toxic materials (high recyclability ~99%)
• High annual operating costs (80 $/kW/year)
• Extra system is required to ensure its operating temperature
5.3.1 Current Status
Table 22 lists selected NaS storage facilities around the world at different operational stages. Utility-scale NaS batteries are manufactured by only one company, NGK Insulators Limited (Nagoya, Japan) [30].

ESCRI-SA MILESTONE 3: ENERGY STORAGE SYSTEMS June 2015
State of Art ES (ESCRI Format) - 2015-06-02 clean skin.docx Version A Page 52 of 93
The research and development focuses for the NaS battery technology include enhancing the cell performance indices and decreasing/eliminating the high temperature operating constraints [1].
Table 22: Selected NaS battery energy storage facilities6 [4]
Project Name Rated
Power in kW
Duration at Rated Power HH:MM
Status State/Province Country
XCEL MinnWind Wind-to-Battery Project
1 000 7:12.00 Operational Minnesota United States
Long Island Bus BESS 1 000 6:30.00 De-Commissioned
New York United States
NaS Battery Installation at Ibaraki Prefecture
2 000 6:0.00 De-Commissioned
Ibaraki Japan
Sodium Sulfur Battery at Ohito Substation
6 000 8:0.00 De-Commissioned
Shizuoka Japan
PG&E Vaca Battery Energy Storage Pilot Project
2 000 7:0.00 Operational California United States
PG&E Yerba Buena Battery Energy Storage Pilot Project
4 000 7:0.00 Operational California United States
Rokkasho Village Wind Farm
34 000 7:0.00 Operational Aomori Japan
BC Hydro Field Battery Energy Storage
1 000 6:30.00 Operational British Columbia
Canada
Reunion Island Pegase Project
1 000 7:12.00 Operational Reunion France
Younicos and Vattenfall Project: Sodium Sulfur
1 000 6:0.00 Operational Berlin Germany
ADWEA NaS BESS 8 000 6:0.00 Operational Abu Dhabi United Arab Emirates
Terna SANC Project (1) 12 000 8:0.00 Under Construction
Campania Italy
Terna SANC Project (2) 12 000 8:0.00 Under Construction
Campania Italy
Terna SANC Project (3) 10 800 8:0.00 Under Construction
Campania Italy
6 Entries marked in red are noted as unverified in [4]

ESCRI-SA MILESTONE 3: ENERGY STORAGE SYSTEMS June 2015
State of Art ES (ESCRI Format) - 2015-06-02 clean skin.docx Version A Page 53 of 93
5.4 EOS Systems (Zinc)
Eos Aurora offer a Zinc based technology which is claimed to have significant cost advantages over other battery systems. The Eos Aurora 1000│4000 is marketed as a low-cost DC battery system designed specifically to meet the requirements of the grid-scale energy storage market. The modular design means the Aurora system is scalable and can be configurable.
5.4.1 Current Status
EOS is working with its Genesis Partners to develop a real energy storage solution that maximizes value and reduces cost for both utilities and customers.
Some of the Genesis partners include [60]:
• ConEdison (NYC) • Enel (Europe and Latin America) • GDF Suez • National Grid (North East US and Great Britain) • NRG (US) • PNM (New Mexico)
EOS also works with several manufacturing partners [60]:
• Incodema (New York) • Newcut (New York) • BASF (worldwide – offices in 80 countries)
The company has been quoted to say that they can produce battery systems with the ability to reach costs as low as $160/kWh which would make this technology competitive with any other battery technologies.
No installations are known at the time of writing.
Table 23 Advantages and disadvantages of EOS systems [60]
Advantages Disadvantages
Low Cost/kWh At $160/kWh for the DC system, Eos is cost competitive with existing peakers
The batteries store less energy by weight and volume than lithium-ion batteries do, so they’re not practical for cars or portable electronics
Made from safe materials Yet to be developed to be fully commercial.
Extremely Long Lived Aurora is projected to last 10,000 cycles for a 30- year calendar
High Energy Density Aurora has an energy capacity of 4 MWh housed in four 40ft containers

ESCRI-SA MILESTONE 3: ENERGY STORAGE SYSTEMS June 2015
State of Art ES (ESCRI Format) - 2015-06-02 clean skin.docx Version A Page 54 of 93
5.5 Aquion Systems (Sodium and Lithium)
Aquion’s Aqueous Hybrid Ion (AHI™) battery systems are based on a composite anode comprising blended NASICON-structured NaTi2(PO4)3 and activated carbon implemented in an aqueous electrolyte electrochemical energy storage device [63].
Both Na+ and Li+ cations can participate in the charge storage reactions. Use of this composite anode in concert with a l-MnO2- based cathode results in an energy storage device that is claimed to be low cost, robust, and of sufficient energy density to be implemented in stationary applications [63].
Error! Reference source not found. a) shows there are 4 series-contacted cavities that
house sets of electrodes connected electrically in parallel, while b) shows that the manner in which a multiple “battery 1” units are stacked together [63], and c) demonstrates an AHI cell, which can be combined into grid-scale electric energy storage solutions [64].

ESCRI-SA MILESTONE 3: ENERGY STORAGE SYSTEMS June 2015
State of Art ES (ESCRI Format) - 2015-06-02 clean skin.docx Version A Page 55 of 93
c)
Figure 17 a) internal features of a “battery 1” unit, b) Stack of 8 “battery 1” units, [63] c) demonstration on how an AHI cell may be combined into grid-scale electric energy storage
solutions [64].
The following tableError! Reference source not found. highlights the advantage and disadvantages of Aquion systems.
Table 24 Advantages and disadvantages of Aquion systems
Advantages Disadvantages
Cost about as much as a lead-acid battery—one of the cheapest types of battery available—but will last more than twice as long [62].
The batteries store less energy by weight and volume than lithium-ion batteries do, so they’re not practical for cars or portable electronics [62]
Made from safe materials [62] Yet to be developed to be fully commercial.
Low cost - Made from inexpensive materials [62] [63]
5.5.1 Current Status
Aquion has secured many investors to bring its techonology from the lab to full commercialisation, including [66]:
• Advanced Technology Ventures • Bright Capital • Constellation Technology Ventures • Foundation Capital • Bill Gates • Kleiner Perkins Caufield & Byers • Prelude Ventures

ESCRI-SA MILESTONE 3: ENERGY STORAGE SYSTEMS June 2015
State of Art ES (ESCRI Format) - 2015-06-02 clean skin.docx Version A Page 56 of 93
• Total Energy Ventures • Yung’s Enterprise
Additionally, Princeton Power Systems and Aquion Energy team up to Construct the world's largest AHI battery system [66].
However, at time of writing – the technology is yet to be fully commercialised.
5.5.2 Summary of Physical and Technical Characteristics of Aquion systems
Error! Reference source not found. presents the physical and technical characteristics of several Aquion systems [66]:
Table 25: Physical and technical characteristics of Aquion systems [66]
S20-008F M100-LS82(M100-L082)
Voltage Range 30 to 59 V 30 to 59 Vdc
Nominal Capacity (at 30°°°°C)*
51 Ah 612 Ah
Nominal Energy (at 30°°°°C)*
2.4 kWh 28.6 kWh
Cycle Life >3,000 cycles >3,000 cycles
Usable Depth of Discharge
100% 100%
Operating Temperature Range
-5 to 40°C -5 to 40°C
Height 935 mm (36.8”) 1,159 mm (45.6”)
Width 330 mm (13.0”) 1,321 mm (52.0”)
Depth 310 mm (12.2”) 1,016 mm (40.0”)
Weight 113 kg (249 lbs) 1,440 kg (3,175 lbs)
In-Line Fusing 15 A (Unfused Model Available) Voltage, Current, temperature
(unsensed)
Note:
*At 20 hour discharge

ESCRI-SA MILESTONE 3: ENERGY STORAGE SYSTEMS June 2015
State of Art ES (ESCRI Format) - 2015-06-02 clean skin.docx Version A Page 57 of 93
5.6 Battery Energy Storage (BES)- Summary
Static Battery energy storage is one of the most widely used energy storage technology both in industry and daily life. There is a large range of applications of BES due to its inherent characteristics. Renewables capacity firming, voltage support, frequency regulation, arbitrage, transport systems are several applications of BES.
Short lead time (construction can be completed approximately within a year) and flexibility in location are some of the main advantages of BES [1], [5].
The disadvantages of BES are its relatively short cycle life, high maintenance costs and environmental, health and safety impact due to toxicity of chemical materials [1], [5]. In addition many types of batteries cannot be completely discharged as the cycle DoD has a severe impact on their operational life [1].
5.6.1 Physical Characteristics
Table 26 and Table 27 presents the physical and technical characteristics and environmental, health and safety concerns of common commercially available BES technologies respectively.
Table 26: Physical and technical characteristics of various BES technologies [1]
Category Technical
Characteristic
Values
Lead acid Li – ion NaS
Power and Energy Ratings
Power Rating (MW)
0–20
0–40
0.05–10
0–0.1
1–100
0.005–50
<8
<34
Energy Rating (MWh)
0.001–40
More than 0.0005
0.024
~0.004–10
0.4–244.8
0.4
Energy and Power Densities
Energy Density (Wh/l)
50–80
50–90
200–500
200–400
150
150–250
150–300
Power Density (W/l) 10–400 1500–10,000 ~140–180
Specific Energy (Wh/kg)
30–50
25–50
75–200
90
120–200
150–240
100
174
Specific Power (W/kg)
75–300
250
180
150–315
300
500–2000
150–230
90–230
115
Response & Response Time <1/4 cycle Milliseconds -

ESCRI-SA MILESTONE 3: ENERGY STORAGE SYSTEMS June 2015
State of Art ES (ESCRI Format) - 2015-06-02 clean skin.docx Version A Page 58 of 93
Category Technical
Characteristic
Values
Lead acid Li – ion NaS
Discharge Times and Storage Duration
milliseconds <1/4 cycle
Discharge Time (at power rating)
Seconds–hours
Up to 10 h
Minutes–hours
~1–8 h
Seconds–hours
~1 h
Daily Self Discharge (%)
0.1–0.3
<0.1
0.2
0.1–0.3
1 & 5 Almost zero
Suitable Storage Duration
Minutes–days
short-to-medium term
Minutes–days
short-to-medium term
Long term
Efficiencies
Round Trip Efficiency / Cycle Efficiency (%)
70–80
63–90
75–80
~90–97
75–90
~75–90
75
75–85
Discharge Efficiency (%)
85 85 85
Lifetime and Cycling Capacities
Lifetime (years) 5–15
13
5– 15
14–16
10–15
15
12–20
Cycling Capacity (cycles)
500–1000
200–1800
1000–10,000
up to 20,000
2500
3000
2500–4500

ESCRI-SA MILESTONE 3: ENERGY STORAGE SYSTEMS June 2015
State of Art ES (ESCRI Format) - 2015-06-02 clean skin.docx Version A Page 59 of 93
Table 27: Environment and health and safety concerns of BES [12]
Category Concerns
Environment
− Toxicity of gas species evolved from a cell during abuse or when exposed to abnormal environments.
− Toxicity of electrolyte during a cell breach.
− Environmental impact of water runoff used to extinguish a battery fire containing heavy metals.
Health and Safety
− Breaching of NaS battery could result in exposure of molten materials and heat transfer to adjacent cells.
− Evolution of H2 from lead-acid cells or H2 and solvent vapour from Li-ion batteries during overcharge abuse could results in a flammable/combustible gas mixture.
− Thermal runaway in Li-ion cells could transfer heat to adjacent cells and propagate the failure through a battery.
5.6.2 Economic Characteristics
A summary of cost data for BES is presented in Table 28.
Table 28: Economic characteristics of BES [1]
Cost Description
Values
Lead acid Li – ion NaS
Power Capital Cost (S/kW)
300–600
200–300
400
1200–4000
900–1300
1590
1000–3000
350–3000
Energy Capital Cost ($/kWh)
200–400
50–100
330
600–2500
2770–3800
300–500
350
450
Operating and Maintenance Cost
~50 $/kW/year – ~80 $/kW/year

ESCRI-SA MILESTONE 3: ENERGY STORAGE SYSTEMS June 2015
State of Art ES (ESCRI Format) - 2015-06-02 clean skin.docx Version A Page 60 of 93
6. Flow Battery Energy Storage (FBES)
A flow battery is a form of a battery in which the electrolyte contains one or more dissolved electro-active species flows through a power cell (or reactor) in which the chemical energy is converted to electricity. Additional electrolyte is stored externally, generally in tanks and usually pumped through the cell (or cells) of the reactor. The reaction is reversible allowing the battery to be charged and discharged. In contrast to the conventional batteries, flow batteries store energy in the electrolyte solutions [5].
Flow batteries can be classified into 3 categories – redox flow batteries and hybrid flow batteries depending on whether all electro-active components can be dissolved in the electrolyte [1]. The third category in which the electrolytes are gases, or direct fuels (e.g. ethanol or other hydrocarbons) is normally referred to as a fuel cell.
A schematic of a typical flow battery is shown in Figure 18.
Figure 18: Schematic of flow battery [5]

ESCRI-SA MILESTONE 3: ENERGY STORAGE SYSTEMS June 2015
State of Art ES (ESCRI Format) - 2015-06-02 clean skin.docx Version A Page 61 of 93
6.1 Vanadium Redox Flow Battery (VRB)
The VRB is a type of rechargeable flow battery that employs vanadium ions in different oxidation states (V2+/ V3+ and V4+/V5+) to store chemical potential energy [1], [30]. VRBs exploit the vanadium in four different oxidation states and use this property to make a battery that has just one electro-active element [30]. During charging and discharging, H+ ions are exchanged through the ion selective membrane [1].
Figure 19: Schematic of a structure of a VRB [1]
Table 29 presents the advantages and disadvantages of VRBs.
Table 29: Advantages and disadvantages of VRBs [1], [30]
Advantages Disadvantages
• Long cycle life (10,000 – 16,000+ cycles) [1]
• Quick responses (faster than 0.001 s) [1]
• Relatively high efficiencies [1]
• Can be designed to provide continuous power (discharge duration time 24+ hours) [1]
• Low electrolyte stability and solubility leading to low quality of energy density [1]
• Relatively high operating costs [1]
• System complexity in comparison with the standard BES [30]
6.1.1 Current Status
VRB was pioneered in the University of New South Wales (UNSW), Australia in the early 1980s [5]. The Australian Pinnacle VRB bought the basic patents in 1998 and licensed them to Sumitomo Electric Industries and VRB Power [5]. Prudent Energy Systems (VRB Power Systems’ assets were acquired by Prudent Energy in 2009). REDT, Uni Energy Technologies, Rongke Power and Gildemeister Energy Solutions are several other energy storage technology providers involved in VRB based energy storage projects [4], [37].

ESCRI-SA MILESTONE 3: ENERGY STORAGE SYSTEMS June 2015
State of Art ES (ESCRI Format) - 2015-06-02 clean skin.docx Version A Page 62 of 93
In Australia, a VRB system was installed in 2003 as part of the King Island Renewable Energy Expansion (KIREX) project [28]. The system was found to be not sufficiently robust and failed after a relatively short life [28]. It was decommissioned as part of the KIREIP project because an investigation into restoring the VRB system concluded that it was not economically viable [28].
Several VRB projects around the world are presented in Table 30.
Table 30: Selected VRB energy storage facilities7 [4]
Project Name Rated Power in kW
Duration at Rated Power HH:MM
Status State
/Province Country
City of Painesville Municipal Power Vanadium Redox Battery Demonstration
1 080 8:0.00 Contracted Ohio United States
Zhangbei National Wind and Solar Energy Storage and Transmission Demonstration Project
2 000 4:0.00 Operational Hebei China
Snohomish PUD - MESA 2 BESS
2 000 2:0.00 Contracted Washington United States
Terna Storage Lab 1, Sardinia (8)
1 000 4:0.00 Announced Sardinia Italy
Tomamae Wind Farm 4 000 1:30.00 Operational Hokkaido Japan
Gigha Wind Farm Battery Project
100 12:0.00 Contracted Scotland United Kingdom
Minami Hayakita Substation Vanadium Redox Flow Battery
15 000 4:0.00 Contracted Hokkaido Japan
Avista UET BESS 1 000 3:12.00 Contracted Washington United States
GuoDian LongYuan Wind Farm VFB
5 000 2:0.00 Operational Liaoning China
7 Entries marked in red are noted as unverified in [4]

ESCRI-SA MILESTONE 3: ENERGY STORAGE SYSTEMS June 2015
State of Art ES (ESCRI Format) - 2015-06-02 clean skin.docx Version A Page 63 of 93
6.2 Zinc Bromine (ZNBR) Flow Battery
ZnBr batteries belong to the hybrid flow batteries category [1]. In a ZnBr battery, 2 aqueous electrolyte solutions contain zinc and bromine elements which are stored in 2 external tanks [1]. During charging and discharging, these electrolyte solutions flow through the cell stack consisting of electrodes with compartments. The reversible electrochemical reactions occur in these electrolytic cells [1].
Figure 20: Schematic of a ZnBr battery [38]
Table 31 lists advantages and disadvantages of ZnBr flow batteries.
Table 31: Advantages and disadvantages of ZnBr flow batteries [1], [30]
Advantages Disadvantages
• Relatively high energy density [30]
• Deep discharge capability (capability of 100% DoD on a daily basis [30]
• High cycle life at deep depths of discharge (more than 2000 cycles at 100 % depth of discharge) [30]
• Estimated long lifetime (10 – 20 years) [1]
• Scalable capacities (10 kWh to >500 kWh systems) [30]
• Material corrosion [1]
• Dendrite formation [1]
• Relatively low cycle efficiencies (around 65 – 75 %) [1]
• Operates in a narrow temperature range [1]
6.2.1 Current Status
ZnBr based utility electrical energy storage applications are in the early stage of demonstration/commercialization [1]. Companies that provide ZnBr storage technology include ZBB Energy Corporation, Premium Power, Primus Power and the firm RedFlow in Australia.

ESCRI-SA MILESTONE 3: ENERGY STORAGE SYSTEMS June 2015
State of Art ES (ESCRI Format) - 2015-06-02 clean skin.docx Version A Page 64 of 93
In Australia, as part of the Smart Grid, Smart City (SCSC) project, 40 RedFlow domestic systems in NewCastle, 20 RedFlow systems in Scone which resulted in a total of 200 kW/400 kWh and 100 kW/200 kWh of storage respectively were trialled for a short period and decommissioned in August 2013 [4].
In conjunction with the CSIRO, a ZBB Experimental Zinc-Bromide Flow Battery (100 kW/500 kWh) and RedFlow’s M90 energy storage system at the University of Queensland (90kW / 240kWh which houses 24 of RedFlow's Zinc Bromide Modules (ZBM) in a 20ft shipping container) are two other ZnBr based storage demonstration projects have been trialled and decommissioned [4]. In addition, RedFlow's M120 building-integrated energy storage system (BIES) has been operational since September 2013 [4]. M120 is rated at 120kW / 288kWh and houses 36 of RedFlow's ZBMs in the basement of the University of Queensland's new Global Change Institute building.
A ZnBr storage system provided by ZBB Energy (25 kW /50 kWh – 2 hours at 25 kW) is under construction at University of Technology in Sydney [4]. Several other ZnBr based projects in various other countries are presented in Table 32.
Table 32: Selected ZnBr energy storage facilities8 [4]
Project Name Rated Power in kW
Duration at Rated Power HH:MM
Status State
/Province Country
MID Primus Power Wind Firming EnergyFarm
28 000 4:0.00 Announced California United States
National Grid Distributed Energy Storage Systems Demonstration, Everette, MA
500 6:0.00 Contracted Massachusetts United States
National Grid Distributed Energy Storage Systems Demonstration, Worcester, MA
500 6:0.00 Contracted Massachusetts United States
Powerco's Redflow Battery Demonstration
3 2:40.00 Operational Taranaki New Zealand
Tetiaroa Brando Resort 1 000 2:0.00 Under Construction
Tahiti French Polynesia
8 Entries marked in red are noted as unverified in [4]

ESCRI-SA MILESTONE 3: ENERGY STORAGE SYSTEMS June 2015
State of Art ES (ESCRI Format) - 2015-06-02 clean skin.docx Version A Page 65 of 93
6.3 Fuel Cells
Fuel cells are very similar (in concept) to flow batteries discussed in the previous sections, except they use hydrogen gas or hydrocarbons as the reacting chemicals instead of chemical solutions. Unless otherwise stated, the following description pertains mainly to hydrogen fuel cells because this technology is easily adapted to storage applications (using O2 and H2 as the energy storage medium).
A typical schematic of a fuel cell is shown below. Between the electrodes the fuel cell contains an electrolyte, which serves to carry electrically charged particles from one electrode to another. The electrolyte plays a key role as it must permit only the appropriate ions to pass between the anode and cathode [39]. Additionally, there is usually also a catalyst which speeds the reactions at the electrodes [39].
Fuel cells require a fuel source and also oxygen or another oxidising agent [39]. The fuel source that is required for use in a fuel cell is typically hydrogen rich (Hydrocarbon fuels; methanol, ethanol, natural gas, petroleum distillates, liquid propane and gasified coal) [40]. Typically oxygen from the air is reacted with the fuel source to form the reaction products which is water in the case of Hydrogen fuel cells. This is a redox process in which electrons are transferred.
Figure 21 Schematic of a generic Fuel Cell [41]
There are different types of fuel cells and their applications as shown in the Table 33 below.

ESCRI-SA MILESTONE 3: ENERGY STORAGE SYSTEMS June 2015
State of Art ES (ESCRI Format) - 2015-06-02 clean skin.docx Version A Page 66 of 93
Table 33 Table showing the various types of fuel cells [39], [42]
Type Electrolyte Efficiency Operating Temperature
Cell Output
Applications Fuel Cell Project Countries [43]
Notes
Alkali (AFC)
Solution of potassium hydroxide (chemically, KOH) in water.
70% 150 to 200 degrees C
300 watts (W) to 5 kilowatts (kW)
Military Space
Germany, Greece, UK, Australia, New Zealand
They require pure hydrogen fuel, and platinum electrode catalysts are expensive.
Molten Carbonate (MCFC)
Use high-temperature compounds of salt (like sodium or magnesium) carbonates (chemically, CO3)
60-80% 650 degrees C
output up to 2 megawatts (MW)
Electric utility Large distributed generation
UK, Austria, South Korea, Germany, Japan, Denmark, Italy, Spain, Canada, France, Bavaria, Slovak Republic, Indonesia
The nickel electrode-catalysts are inexpensive compared to the platinum used in other cells. High temperature limits the materials Carbonate ions from the electrolyte get used up in the reactions, making it necessary to inject carbon dioxide to compensate.
Phosphoric Acid (PAFC)
Phosphoric acid 40-80% 150 to 200 degrees C
up to 200 kW
Distributed generation
Switzerland, Japan, Australia, Germany, India, Brazil, France, Sweden, Denmark, Spain, Austria, South Korea, China, Italy, Canada, Russia, UK, Finland
Carbon monoxide concentration of about 1.5 percent is tolerated, which broadens the choice of fuels (eg: gasoline, but sulfur must be removed. Platinum electrode-catalysts are needed, and internal parts must be able to withstand the corrosive acid.)

ESCRI-SA MILESTONE 3: ENERGY STORAGE SYSTEMS June 2015
State of Art ES (ESCRI Format) - 2015-06-02 clean skin.docx Version A Page 67 of 93
Type Electrolyte Efficiency Operating Temperature
Cell Output
Applications Fuel Cell Project Countries [43]
Notes
Proton Exchange Membrane (PEMFC)
Polymer 40-50% 80 degrees C 50 to 250 kW
Back-up power Portable power Small distributed generation Transportation
Japan, Italy, Netherlands, France, Germany, Austria, UK, China, Canada, Antarctica, South Africa, Greece, Switzerland, Sweden, India, Portugal, Iceland, Spain, Puerto Rico, Greenland, Belgium, Mexico, Indonesia, Venezuela, Finland, New Zealand, Trinidad and Tobago, Kuwait
Solid, flexible electrolyte will not leak or crack and these cells operate at a low enough temperature, to be suitable for homes and cars. The fuels must be purified, and platinum catalyst is used on both sides of the membrane, raising costs.
Solid Oxide (SOFC)
Hard, ceramic compound of metal (like calcium or zirconium) oxides (chemically, O2)
60% 1,000 degrees C up to 100 kW
Auxiliary power Electric utility Large distributed generation
Germany, Russia, Canada, Australia, Switzerland, Netherlands, UK, Italy, japan, Brazil, France, Sweden, Spain, New Zealand, Norway, Finland, Austria, Belgium
Waste heat can be recycled.
Figure 22 on the next page highlights the cumulative dollar figure from 2000 to 2013 of the top 10 venture capital and private equity investors in fuel cells, by country and company. The top of the list being Credit Suisse from Switzerland with $136.2 million invested, and the US having the highest level of private investment in fuel cells, with $789.9 million invested.

ESCRI-SA MILESTONE 3: ENERGY STORAGE SYSTEMS June 2015
State of Art ES (ESCRI Format) - 2015-06-02 clean skin.docx Version A Page 68 of 93
Figure 22 Top 10 venture capital and private equity investors in fuel cells, by country and company (Cumulative 2000-2013) [44]
Table 34 lists advantages and disadvantages of fuel cells.
Table 34 Advantages and disadvantages of fuel cell technology
Advantages Disadvantages
• An advantage of fuel cells is that they generate electricity with very little pollution. [39].
• They do not become discharged like traditional batteries - they exploit electrolysis reactions in a similar manner to traditional batteries however the reagents are constantly resupplied to the cell [45].
• Fuel cells can be designed to use a variety of fuels.
• Fuelling fuel cells is still a major problem since the production, transportation, distribution and storage of gases like Hydrogen is difficult. [46]
• Fuel cells are in general slightly bigger than comparable batteries or engines (However, the size of the units is decreasing.) and are very expensive as they use expensive materials. [46] [47]
• The technology is not yet fully developed and only a limited range of products is available. [46], [47]

ESCRI-SA MILESTONE 3: ENERGY STORAGE SYSTEMS June 2015
State of Art ES (ESCRI Format) - 2015-06-02 clean skin.docx Version A Page 69 of 93
Figure 23 graphs showing the growth of Fuel Cells by shipments and Megawatts by application from 2009-2013
[48]
Future of Fuel Cells
It is anticipated that the global demand for commercial fuel cells will triple by 2017 to $4 billion, and will triple again to $12 billion in 2022, driven by technological advances and efficiencies in manufacturing processes that will see reduction in costs to levels that are competitive in a number of growing applications [49]. Japan and the US will remain by far the largest markets, while China and South Korea is expected to grow the fastest [49].
It is anticipated that the electric power generation will remain the largest market as it is, to date, the most successful fuel cell application. In 2012, the electrical power generation market accounted for 75% of all commercial revenue, and this market is expected to keep growing at a steady pace through to 2022.[49].

ESCRI-SA MILESTONE 3: ENERGY STORAGE SYSTEMS June 2015
State of Art ES (ESCRI Format) - 2015-06-02 clean skin.docx Version A Page 70 of 93
6.4 Flow Battery Energy Storage (FBES) - Summary
In contrast to conventional (static) BES, FBES stores energy in electrolyte solutions usually stored in tanks.
The main operational advantage of FBES is that the power and energy ratings are independent of each other. The power rating is determined by the size of the electrodes and the number of cells in the stack whereas the energy rating (storage capacity) is determined by the concentration and the amount of electrolyte [1]. This decouples the power rating from the energy rating of the device which gives more flexibility to the design of a specific installation.
Another advantage of FBES is it has very small self-discharge because the electrolytes are stored in separate tanks [1].
Disadvantages of FBES include low performance (due to non-uniform pressure drops and the reactant mass transfer limitations), relatively high manufacturing costs and more complicated system requirements compared to conventional BES [1]. For systems which use pumps to circulate the reactants – there is a response time issue in moving from a quiescent to operational status.
6.5 Summary of Main economic and Physical characterisitcs – (FBES)
6.5.1 Physical Characteristics
Table 35 and Table 36 present the physical and technical characteristics and environmental, health and safety concerns of FBES technologies respectively.
Table 35: Physical and technical characteristics of various FBES technologies [1]
Category Technical
Characteristic
Values
VRB ZnBr Hydrogen Fuel
Cells
Power and Energy Ratings
Power Rating (MW)
~0.03–3
2
possible 50
0.05–2
1–10
<50
<10
58.8
Energy Rating (MWh)
<60
2
3.6
0.1–3
4
0.05 & 0.5
0.312
Developing 39
Energy and Power Densities
Energy Density (Wh/l)
16–33
25–35
30–60
~55–65 500–3000
Power Density (W/l) ~ < 2 ~ < 25 500+
Specific Energy (Wh/kg)
10–30
30–50
80
75
800–10,000
~150–1500
Specific Power (W/kg)
166 100
45
500+
~5–800

ESCRI-SA MILESTONE 3: ENERGY STORAGE SYSTEMS June 2015
State of Art ES (ESCRI Format) - 2015-06-02 clean skin.docx Version A Page 71 of 93
Category Technical
Characteristic
Values
VRB ZnBr Hydrogen Fuel
Cells
Response & Discharge Times and Storage Duration
Response Time <1/4 cycle <1/4cycle Seconds
<1/4 cycle
Discharge Time (at power rating)
Seconds–24 h+
2–12 h
Seconds–10 h+
~10 h Seconds–24 h+
Daily Self Discharge (%)
Small
Very low Small Almost zero
Suitable Storage Duration
Hours–months
Long term
Hours–months
Long term
Hours–months
Long term
Efficiencies
Round Trip Efficiency / Cycle Efficiency (%)
75–85
65–75
~65–75
66–80
66
~20–50
32
45–66
Discharge Efficiency (%)
~75–82 ~60–70 59
Lifetime and Cycling Capacities
Lifetime (years) 5–10
20
5–10
10
8–10
5–15
20
20+
Cycling Capacity (cycles)
12,000+
13,342
2000+
1500
1000+
20,000+
Table 36: Environment and health and safety concerns of FBES [12]
Category Concerns
Environment Toxicity of electrolyte during a spill in a VRB
Health and Safety
Toxicity of electrolyte during a spill in a VRB
6.5.2 Economic Characteristics
A summary of cost data for FBES is presented in Table 37.
Table 37: Economic characteristics of FBES [1]
Cost Description Values
VRB ZnBr Hydrogen Fuel Cells
Power Capital Cost (S/kW) 600–1500
700–2500
400
200
500
1500–3000

ESCRI-SA MILESTONE 3: ENERGY STORAGE SYSTEMS June 2015
State of Art ES (ESCRI Format) - 2015-06-02 clean skin.docx Version A Page 72 of 93
Cost Description Values
VRB ZnBr Hydrogen Fuel Cells
Energy Capital Cost ($/kWh) 150–1000
600
150–1000
500
15
2–15€/kW h
Operating and Maintenance Cost
~70 $/kW/year - 0.0019–0.0153 $/kW
7. Capacitor and Supercapacitor (CAP)
A capacitor is composed of two electrical conductors separated by a thin layer of insulator (dielectric). When charged, energy is stored in the dielectric material in an electrostatic filed [1], [52]. A supercapacitor (also named double-layer capacitors or ultracapacitors) contains two conductor electrodes, an electrolyte and a porous membrane separator. The energy is stored in the form of static charge on the surfaces between the electrolyte and the two conductor electrodes [1]. Figure 24 shows a schematic diagram of a supercapacitor system.
Figure 24: Schematic of a capacitor (left) [52] and a supercapacitor system (right) [1]
Table 38 presents the advantages and disadvantages of capacitors and supercapacitors.
Table 38: Advantages and disadvantages of capacitors and supercapacitors [1]
Technology Advantages Disadvantages
Capacitors • Higher power density (compared to conventional batteries)
• Shorter charging time (compared to conventional batteries)
• Limited capacity
• Relatively low energy density
• High energy dissipation due to high self-discharge losses

ESCRI-SA MILESTONE 3: ENERGY STORAGE SYSTEMS June 2015
State of Art ES (ESCRI Format) - 2015-06-02 clean skin.docx Version A Page 73 of 93
Supercapacitors • Long cycling times (1 x 10⁵ cycles)
• High cycle efficiency (~84 – 97 %)
• High daily self-discharge rate (~5 – 40 %)
• High capital cost (in excess of 6000$/kWh)
The power and energy densities of supercapacitors are between those of traditional capacitors and rechargeable batteries [1].

ESCRI-SA MILESTONE 3: ENERGY STORAGE SYSTEMS June 2015
State of Art ES (ESCRI Format) - 2015-06-02 clean skin.docx Version A Page 74 of 93
7.1.1 Current Status Research and development in supercapacitors has been very active in recent years and recent reviews have focused on the development of materials for chemical capacitive energy storage such as carbon materials and graphene based electrodes [1]. Several manufacturers of supercapacitors and supercapacitor based projects are presented in Table 39 and Table 40 respectively.
Table 39: Selected manufacturers of supercapacitors [1], [53], [54]
Device/Company Name Country Technical Information
Super capacitor, CAP-XX Australia
• Single cell 2.3 – 2.9 V
• Upto ~ 2.4 F
• 23 – 358 K
Gold capacitor, Panasonic Japan • Single cell 2.3 – 5.5 V
• 0.1 – 2000 F
Ultracapacitor/ Bosstcap, Maxwell
U.S. • Single cell 2.2 – 2.7 V
• 1 – 3000 F
Supercapacitor, Siemens Germany • 21 MJ/5.7 Wh
• 2600 F
Supercapacitor, TVA company
U.S. • 200 kW
Electric Double Layer Capacitor (EDLC), NESSCAP
Canada/Korea • 2.3 V & 2.7 V
• 3 – 5000 F
Ultracapacitors (Snap-In, Multi-Pin and iCAP®), Ioxus
U.S. • 2.7 V – 2.85 V
• 100 – 3000 F
Table 40: Selected supercapacitor storage based projects9 [4]
Project Name Rated Power in kW
Duration at Rated Power HH:MM
Status State
/Province Country
LIRR Malverne WESS: Maxwell Technologies
1 000 0:1.00 Operational New York United States
GigaCapacitor Rosh Pinna Test Project (IL)
15 000 10:0.00 Under Construction
Galil Israel
GigaCapacitor Putrajaya Test Project (IL)
15 000 10:0.00 Under Construction
Wilayah Persekutuan
Malaysia
GigaCapacitor Hyperadad Test Project (IL)
15 000 10:0.00 Under Construction
Andhra Pradesh
India
UC San Diego CPV Firming - Maxwell Technologies 28kW
28 0:5.00 Under California United
9 Entries marked in red are noted as unverified in [4]

ESCRI-SA MILESTONE 3: ENERGY STORAGE SYSTEMS June 2015
State of Art ES (ESCRI Format) - 2015-06-02 clean skin.docx Version A Page 75 of 93
Project Name Rated Power in kW
Duration at Rated Power HH:MM
Status State
/Province Country
Ultracapacitor Construction States
LIRR Malverne WESS: Ioxus 1 000 0:1.00 Operational New York United States
Terna Storage Lab 1, Sardinia (9)
1 000 0:1.00 Announced Sardinia Italy
Terna Storage Lab 2, Sicily (7) 920 0:1.00 Announced Sicily Italy
Woojin/Maxwell Seoul Line 2 - Seocho Station (224)
2 340 0:0.33 Operational Seoul Korea, South
7.2 Summary of Main economic characterisitcs (CAP)
7.2.1 Physical Characteristics Table 41 and Table 42 present the physical and technical characteristics and environmental, health and safety concerns of FBES technologies respectively.
Table 41: Physical and technical characteristics of CAP systems [1]
Category Technical Characteristic Values
Capacitor Supercapacitor
Power and Energy Ratings
Power Rating (MW) 0–0.05
0–0.3
~0.3+
~0.001–0.1
Energy Rating (MWh) - 0.0005
Energy and Power Densities
Energy Density (Wh/l) 2–10
~0.05
10–30
~10–30
Power Density (W/l) 100,000+ 100,000+
Specific Energy (Wh/kg) 0.05–5
<~0.05
2.5–15
~0.05–15
Specific Power (W/kg) ~100,000
>~3000–107
500–5000
~10,000
Response& Discharge Times and Storage Duration
Response Time Milliseconds
<1/4 cycle
Milliseconds
1/4 cycle
Discharge Time (at power rating) Milliseconds–1 h
Milliseconds–1 h
1 min
10 s
Daily Self Discharge (%)
40
~50 in about 15 minutes
20–40
5
10–20

ESCRI-SA MILESTONE 3: ENERGY STORAGE SYSTEMS June 2015
State of Art ES (ESCRI Format) - 2015-06-02 clean skin.docx Version A Page 76 of 93
Category Technical Characteristic Values
Capacitor Supercapacitor
Suitable Storage Duration Seconds–hours
~5 h
Seconds–hours
short-term(<1 h)
Efficiencies
Round Trip Efficiency / Cycle Efficiency (%)
~60–70
70+
~90–97
84–95
Discharge Efficiency (%) ~75–90 95
Up to ~98
Lifetime and Cycling Capacities
Lifetime (years) ~5
~1–10
10–30
10–12
Cycling Capacity (cycles) 50,000+
5000 (100% DoD)
100,000+
50,000+
Table 42: Environment and health and safety concerns of CAP systems [5]
Category Concerns
Environment Small influence on environment due to little amount of remains.
Health and Safety -
7.2.2 Economic Characteristics
A summary of cost data for CAP systems is presented in Table 43.
Table 43: Economic characteristics of CAP systems [1]
Cost Description Values
Capacitor Supercapacitor
Power Capital Cost (S/kW) 200–400 100–300
250–450
Energy Capital Cost ($/kWh) 500–1000 300–2000
Operating and Maintenance Cost 13 $/kW/year
<0.05 $/kW h
0.005 $/kW h
~6 $/kW-year
Capacitors have been combined with lead acid batteries in order to improve the overall response of the combined system. However, in isolation they are considered to have too small an energy storage rating to be viable for this application.

ESCRI-SA MILESTONE 3: ENERGY STORAGE SYSTEMS June 2015
State of Art ES (ESCRI Format) - 2015-06-02 clean skin.docx Version A Page 77 of 93
8. Superconducting Magnetic Energy Storage (SMES) The SMES system stores electrical energy in the magnetic field generated by the direct current (DC) in the superconducting coil [1]. The coil is maintained in the superconducting state by immersing it in liquid helium contained in a vacuum-insulated cryostat [5]. Typically the conductor is made of niobium-titanium and the coolant is liquid helium at 4.2 K or super fluid helium at 1.8 K [5]. During the discharging phase, the SMES can release the stored electrical energy back to the AC system by a connected power conversion system [1]. A typical SMES system is composed of three main components – a superconducting coil unit, a power conversion system and a cryostat system (refrigeration and vacuum system) [5], [1]. A schematic diagram of a SMES system is shown in Figure 25.
Figure 25: Schematic of a SMES system [5]
Table 44 presents advantages and disadvantages of SMES.
Table 44: Advantages and disadvantages of SMES [1]
Advantages Disadvantages
• Relatively high power density (up to ~4 000 W/L)
• Fast response time (millisecond level)
• Very quick full discharge time (less than 1 min)
• High cycle efficiency (~ 95% - 98 %)
• Long life time (up to ~ 30 years)
• Capability of discharging near to the totality of the stored energy with little degradation after thousands of full cycles
• High capital cost (up to 10,000 $/kWh, 72,000 $/kW)
• High daily self-discharge (10 – 15 %)
• Negative environmental impact due to the strong magnetic field
• Possible loss of energy due to the sensitivity of the coil to small temperature changes

ESCRI-SA MILESTONE 3: ENERGY STORAGE SYSTEMS June 2015
State of Art ES (ESCRI Format) - 2015-06-02 clean skin.docx Version A Page 78 of 93
8.1.1 Current Status The Low Temperature Superconducting (LTS) SMES technology (based on coils working at ~5 K) is more mature and commercially available whereas the High Temperature Superconducting (HTS) SMES technology (based on coils working at ~70 K) is in the development stage [1]. The recent research and development of SMES focus on reducing the costs of superconducting coils and related refrigeration systems and developing HTS coil materials which are less cryogenically sensitive [1]. The earliest SMES installation was in United States with the capacity of 30 MJ. This installation was tested by Bonneville Power to provide a controlled system and frequency regulation on long transmission lines along the west coast [55]. Several other selected SMES projects are provided in Table 45.
Table 45: Selected projects of SMES [1]
Locations/Organizations Technical Data Features/Applications
Proof principle, tested in a grid in Germany
5 KJ, 2 s to max 100 A at 25 K World first significant HTS-SMES, by ASC
Nosoo power station in Japan 10 MW Improve system stability and power quality
Upper Wisconsin by American Transmission
3 MW/0.83 kW h, each 8 MV A Power quality application reactive power support
Bruker EST in Germany 2 MJ High temperature superconductors
Korea Electric Power Corporation, Hyundai
3 MJ, 750 kV A Improving power supply quality for sensitive loads
Chubu Electric Power Co. in Japan
7.3 MJ/5MW and 1 MJ Provide comparison to transient voltage
University of Houston, SuperPower & others
20 kW, up to 2 MJ class UHF-SMES, voltage distribution
8.2 Summary of Main economic and Physical characterisitcs (SMES)
8.2.1 Physical Characteristics
Table 46 and Table 47 present the physical and technical characteristics and environmental, health and safety concerns of SMES respectively.
Table 46: Physical and technical characteristics of SMES systems [1]
Category Technical Characteristic Values
Power and Energy Ratings Power Rating (MW)
0.1–10
~1–10
Energy Rating (MWh) 0.0008

ESCRI-SA MILESTONE 3: ENERGY STORAGE SYSTEMS June 2015
State of Art ES (ESCRI Format) - 2015-06-02 clean skin.docx Version A Page 79 of 93
Category Technical Characteristic Values
0.015
0.001
Energy and Power Densities
Energy Density (Wh/l) 0.2–2.5
~6
Power Density (W/l) 1000–4000
~2500
Specific Energy (Wh/kg) 0.5–5
10–75
Specific Power (W/kg) 500–2000
Response& Discharge Times and Storage Duration
Response Time Milliseconds
<1/4 cycle
Discharge Time (At Power Rating) Milliseconds–8 s
Up to 30 min
Daily Self Discharge (%) 10–15
Suitable Storage Duration Minutes–hours
short-term (<1 h)
Efficiencies
Round Trip Efficiency / Cycle Efficiency (%)
~95–97
95–98
95
Discharge Efficiency (%) 95
Lifetime and Cycling Capacities
Lifetime (years) 20+
30
Cycling Capacity (cycles) 100,000+
20,000+
Table 47: Environment and health and safety concerns of SMES systems [5]
Category Concerns
Environment Negative influence on environment due to strong magnetic fields
Health and Safety Not known
8.2.2 Economic Characteristics
A summary of cost data for SMES systems is presented in Table 48.

ESCRI-SA MILESTONE 3: ENERGY STORAGE SYSTEMS June 2015
State of Art ES (ESCRI Format) - 2015-06-02 clean skin.docx Version A Page 80 of 93
Table 48: Economic characteristics of SMES systems [1]
Cost Description Values
Power Capital Cost (S/kW)
200–300
300
380–489
Energy Capital Cost ($/kWh) 1000–10,000
500–72,000
Operating and Maintenance Cost 0.001 $/kW h
18.5 $/kW/year
For the envisaged application of electrical energy storage investigated for this project, the SMES has too small an energy storage rating to be of practical use.

ESCRI-SA MILESTONE 3: ENERGY STORAGE SYSTEMS June 2015
State of Art ES (ESCRI Format) - 2015-06-02 clean skin.docx Version A Page 81 of 93
9. Overall Summary
This document provides a detailed overview of various energy storage technologies namely FES, CAES, BES (lead acid, Li-ion and NaS), FBES (VRB, ZnBr and Hydrogen fuel cells), capacitors, supercapacitors and SMES. The technological progress with current research and development focusses, performance and cost characteristics of the storage technologies are discussed.
It is recognised that a single energy storage technology cannot meet the requirements of all power system applications due to the inherent characteristics of the existing storage technologies. Figure 26 illustrates the placements of various energy storage technologies based on their typical power ratings and rated energy capacities [1].
Figure 26: Comparison of power rating and rated energy capacities of various storage technologies
The application of energy storage depends on the typical discharge time of the energy storage system. Typical discharge times at rated power of FES, supercapacitors and SMES are in the order of milliseconds through to minutes, above ground small scale CAES, lead-acid, Li-ion and ZnBr systems are in the order of ~10 hours and underground large scale CAES and fuel cells have pratical storage times which can be made much longer than 10 hours [1].
The self discharge rate determines the maximum suitable storage duration for a specific technology. Energy storage technologies with smaller rate of self discharge can store their energy for longer. Table 49 summarises the energy storage technologies based on the daily self discharge and suitable storage durations.
Table 49: Summary of energy storage technologies based on daily self discharge and storage duration
Daily Self Discharge Suitable Storage Duration Energy Storage Technologies
Small Long – term
(hours to months)
PHS
CAES
NaS

ESCRI-SA MILESTONE 3: ENERGY STORAGE SYSTEMS June 2015
State of Art ES (ESCRI Format) - 2015-06-02 clean skin.docx Version A Page 82 of 93
Daily Self Discharge Suitable Storage Duration Energy Storage Technologies
FBES
Medium (up to 5 %) Medium – term
(minutes to days)
Lead acid
Li ion
High Short – term
(minutes to hours)
FES
Capacitors
Supercapacitors
SMES
The physical size of the storage device is another important factor in determining the choice of storage system for a given application.
Figure 27 compares the energy and power densities of various technologies (values cited from [1]). As shown in Figure 27, the large volume consuming technologies (i.e. PHS, large-scale CAES) which have low energy and power densities are near the bottom left corner of the diagram whereas the highly compact technologies are at the top right hand corner. The densities of FBES systems are typically lower than those of BES systems. In BES, densities of lead acid systems are lower than Li-ion systems.
Figure 27: Comparison of energy and power densities of various energy storage technologies
The energy losses that an electrical storage device will experience depend on the roundtrip efficiency, which is defined by the power loss experienced when the device is charged and discharged. This figure will vary according to the depth of discharge and state of charge used in the cycling.
The roundtrip efficiency ranges of energy storage technologies are shown in Figure 28 (values cited from [1]). The range of roundtrip efficiencies of FES, supercapacitors and SMES are relatively high (greater than ~85 %).

ESCRI-SA MILESTONE 3: ENERGY STORAGE SYSTEMS June 2015
State of Art ES (ESCRI Format) - 2015-06-02 clean skin.docx Version A Page 83 of 93
Of the static BES systems, Li-ion has a higher efficiency reaching up to 97 % in comparison with lead-acid (up to 90 %). The top range of round trip efficiencies is typically higher in BES systems (lead acid, Li ion and NaS) compared to FBES (VRB, ZnBr and Hydrogen fuel cells).
Hydrogen fuel cells have a relatively low round trip efficiency which is still being improved.
In general, the efficiencies of all of the technologies have been improved with the progress of research and development efforts (e.g.. the round trip efficiency of CAES has improved from 42 % (in 1978), ~54 % (in 1991) and 70 % (for project ADELE) [1].
Figure 28: Comparison of round trip efficiencies of various energy storage technologies
Two more important characteristics of energy storage technologies are their operational lifetime and number of useful cycles. These are summarised as follows [1]:
• Electrical energy storage systems – capacitors, supercapacitors and SMES typically are
able to experience a large number of cycles (> 20,000) before equipment needs to be
replaced.
• Mechanical energy storage systems – CAES and FES are able to experience about
10,000 charge and discharge cycles before equipment need to be replaced.
• Chemical energy storage systems – BES and FBES typically need to be replaced after a
relatively low number of charge and discharge cycles due to chemical deterioration with
accumulated operating time. The number of useful cycles of these technologies are
typically less than 5 000 with the exception of reported cycling times of Li ion (1 000 –
20,000), VRB (12,000 +) and Hydrogen fuel cells (20,000 +).
Lifetime and cycling time have an impact on the overall investment cost of the energy storage system. Systems with low lifetime and cycling times increase the overall costs due to maintenance and replacement of equipment. These effects need to be carefully modelled when developing a business case for a storage installation.

ESCRI-SA MILESTONE 3: ENERGY STORAGE SYSTEMS June 2015
State of Art ES (ESCRI Format) - 2015-06-02 clean skin.docx Version A Page 84 of 93
Figure 29 and Figure 30 compare the energy and power capital costs and energy capital costs and operation and maintenance costs respectively.
Figure 29: Comparison of energy and power capital costs
Figure 30: Comparison of energy capital costs and annual operation and maintenance costs

ESCRI-SA MILESTONE 3: ENERGY STORAGE SYSTEMS June 2015
State of Art ES (ESCRI Format) - 2015-06-02 clean skin.docx Version A Page 85 of 93
From reference to Figure 29, supercapacitors, FES and SMES have relatively high energy costs and low power costs, making these technologies more economical to be used in small scale, high power applications. PHS and large scale CAES have relatively low energy costs and therefore most economical in large scale applications.
With regard to capital and operation and maintenance costs, BES and FES technologies typically have relatively low to moderate capital energy costs but high operation and maintenance costs as shown in Figure 30 for lead acid, VRB and NaS technologies.
Emissions from combustion of natural gas in compressed air energy storage, fires and toxicity of chemicals in battery and flow battery energy systems, containment in case of catastrophic failure of equipment in flywheel energy systems and strong magnetic fields in superconducting magnetic energy storage systems are some of the identified concerns relating to environment, health and safety.
In conclusion there are many technical and economical characteristics and health and safety issues to consider when determining a suitable storage system. Overall the key decision making factors for choosing a suitable storage technology will be different depending on the intended applications of storage, the size of the network, location and health and safety concerns.

ESCRI-SA MILESTONE 3: ENERGY STORAGE SYSTEMS June 2015
State of Art ES (ESCRI Format) - 2015-06-02 clean skin.docx Version A Page 86 of 93
10. Energy Storage for the ESCRI-SA Project
10.1 Technologies Applicable to ESCRI-SA
For the ESCRI-SA project we require a technology that is:
• responsive enough to be dispatchable on the National Electricity market (i.e. 5 minute dispatch periods)
• in infrequent cases be able to operate independently of the grid.
• able to store significant quantities of energy for several hours or days with minimal self-discharge
•
• Figure 31: Comparison of power rating and rated energy capacities of various storage technologies
This latter requirement effectively rules out capacitor, supercapacitor and superconducting magnetic storage systems. While these systems can charge and discharge large amounts of power, their total energy storage capabilities are severly limited – which makes them ineffective for this application.
Similarly, mechanical flywheels and small scale compressed air systems have similar restrictions on the total energy that they can store and on the length of time that the energy can be stored for. In practice flywheels have been used on islanded systems in order to improve power system inertia and provide a short time backup to allow other emergency power generation to come on line. Flywheels on their own cannot meet the requirements of this application – although they may be useful as part of a more general system.
At the other end of the energy and power spectrum is the pump hydro and large scale compressed air systems. These can store large amounts of energy and are dispatchable in a similar way to existing generation. Pump hydro is already the most commonly used storage technology on the NEM and is the most mature technology. Both of these technologies require favourable landscapes in which to be situated which may not necessarily correspond with the

ESCRI-SA MILESTONE 3: ENERGY STORAGE SYSTEMS June 2015
State of Art ES (ESCRI Format) - 2015-06-02 clean skin.docx Version A Page 87 of 93
needs of the network. The capital cost of an installation is highly dependant on favourable site conditions being available.
For the ESCRI-SA project – the preference is to consider technologies which can be located at existing wind farms or substations. This makes application of pump hydro and large scale compressed air technologies problematic – but at this stage they cannot be ruled out.
The various battery/fuel cell technologies seem to provide the best fit to the ESCRI-SA project – and to distinguish between them it is necessary to do a cost,benefit and risk analysis based on vendor supplied data.
10.2 Constructability & Operability in an Australian Context
Other than project cost the main issue to consider in an Australian context is probably environmental risk – in particular the risk of fire if the chosen site location is vulnerable to bush fire hazards. Some battery installations have experienced fires in the past (e.g. Lithium Ion) and a comprehensive fire protection system is required to ensure that the installation is not a hazard to the general locale.
The characterisitics of the installations should comply with all local standards and regulations – but this is a common issue experienced by the industry and should pose no show stopping issues.
For the next stage of the ESRCI-SA project – vendors will be approached to provide information which will be used to evaluate the various technologies further.

ESCRI-SA MILESTONE 3: ENERGY STORAGE SYSTEMS June 2015
State of Art ES (ESCRI Format) - 2015-06-02 clean skin.docx Version A Page 88 of 93
11. Bibliography
[1] X. Luo, J. Wang, M. Dooner and J. Clarke, “Overview of current development in electrical energy storage technologies and the application potential in power system operation,” Applied Energy, vol. 137, pp. 511-536, 1 January 2015.
[2] Navigant Research, “Energy Storage Tracker 3Q14”.
[3] H. Ibrahim, A. Ilinca and J. Perron, “Energy storage systems—Characteristics and comparisons,” Renewable and Sustainable Energy Reviews, vol. 12, pp. 1221-1250, 2008.
[4] Department of Energy and Sandia National Laboratories, “DOE Global Energy Storage Database,” [Online]. Available: http://www.energystorageexchange.org/. [Accessed 19 December 2014].
[5] H. Chen, T. N. Cong, W. Yang, C. Tan, Y. Li and Y. Ding, “Progress in electrical energy storage system: A critical review,” Progress in Natural Science, vol. 19, no. 3, pp. 291-312, 2009.
[6] Energy Storage Association, “Surface Reservoir Pumped Hydroelectric Storage,” [Online]. Available: http://energystorage.org/energy-storage/technologies/surface-reservoir-pumped-hydroelectric-storage. [Accessed 13 January 2015].
[7] Geoscience Australia and ABARE, “Australian Energy Resource Assessment,” Australian Energy Resource Assessment, Canberra, 2010.
[8] P. Agrawal, A. Noura, L. Markel, R. Fioravanti, N. T. Paul Gordon and a. G. Huff, “Characterization and Assessment of Novel Bulk Storage Technologies,” Sandia National Laboratories, California, 2011.
[9] R. R. D.O. Akinyele, “Review of energy storage technologies for sustainable power networks,” Sustainable Energy Technologies and Assessments, vol. 8, pp. 74-91, December 2014.
[10] Japan Commission on Large Dams, “Japan Commission on Large Dams,” [Online]. Available: http://classic-web.archive.org/web/20030430004611/http://www.jcold.or.jp/Eng/Seawater/Summary.htm. [Accessed 28 January 2015].
[11] T. Sakamoto, “Kyoto 2012: Dams for a Changing World,” HRW-Hydro Review Worldwide, 05 January 2012. [Online]. Available: http://www.hydroworld.com/articles/print/volume-20/issue-3/articles/kyoto-2012-dams-for-a-changing-world.html. [Accessed 28 January 2015].
[12] U.S. Department of Energy, Office of Electricity Delivery and Energy Reliability, “Energy Storage Safety Plan,” 2014.
[13] V. T. N. R. N. P. H. M. Sam Koohi-Kamali, “Emergence of energy storage technologies as the solution for reliable operation of smart power systems: A review,” Renewable and Sustainable Energy Reviews, vol. 25, pp. 135-165, September 2013.

ESCRI-SA MILESTONE 3: ENERGY STORAGE SYSTEMS June 2015
State of Art ES (ESCRI Format) - 2015-06-02 clean skin.docx Version A Page 89 of 93
[14] M. Daoud, A. Abdel-Khalik, A. Massoud, S. Ahmed and N. Abbasy, “On the development of flywheel storage systems for power system applications: A survey,” in Electrical Machines (ICEM), 2012 XXth International Conference, Marseille, 2-5 September 2012.
[15] T. Mahlia, T. Saktisahdan, A. Jannifar, M. Hasan and H. Matseelar, “A review of available methods and development on energy storage; technology update,” Renewable and Sustainable Energy Reviews, vol. 33, pp. 532-545, May 2014.
[16] “Beacon Power - System Installation,” [Online]. Available: http://beaconpower.com/system-installation/. [Accessed 12 January 2015].
[17] ABB, “Case Study - Coral Bay wind/diesel/PowerStore, Western Australia,” 2012. [Online]. Available: http://www05.abb.com/global/scot/scot221.nsf/veritydisplay/33d7473dc0436cc7c1257afd004e3d8c/$file/Case%20study_Coral%20Bay_9AKK100580A2549_Dec2012_HR.pdf. [Accessed 12 January 2015].
[18] A. Rogers, A. Henderson, X. Wang and M. Negnevitsky, “Compressed air energy storage: Thermodynamic and economic review,” in PES General Meeting | Conference & Exposition, 2014 IEEE, National Harbor, MD, 27-31 July 2014.
[19] F. Crotogino, K.-U. M. Scharf and D. Roland, “Huntorf CAES: More than 20 Years of Successful Operation,” 15-18 April 2001. [Online]. Available: http://www.wearemichigan.com/JobsAndEnergy/documents/AKE2003H03c_Crotogino_ea_HuntorfCAES_CompressedAirEnergyStorage.pdf. [Accessed 09 December 2014].
[20] D. Akinyele and R. Rayudu, “Review of energy storage technologies for sustainable power networks,” Sustainable Energy Technologies and Assessments, vol. 8, pp. 74-91, December 2014.
[21] “CCGT Power Plants in Alabama,” 20 Jan 2013. [Online]. Available: http://www.industcards.com/cc-usa-al.htm. [Accessed 09 December 2014].
[22] J. Funk, “FirstEnergy postpones project to generate elecricity with compressed air,” 05 July 2013. [Online]. Available: http://www.cleveland.com/business/index.ssf/2013/07/firstenergy_postpones_project.html. [Accessed 09 December 2014].
[23] RWE Power, “ADELE – ADIABATIC COMPRESSED-AIR ENERGY STORAGE FOR ELECTRICITY SUPPLY,” January 2010. [Online]. Available: http://www.rwe.com/web/cms/mediablob/en/391748/data/364260/1/rwe-power-ag/innovations/Brochure-ADELE.pdf. [Accessed 09 December 2014].
[24] General Compression, “General Compression,” 2014. [Online]. Available: http://www.generalcompression.com/index.php/who. [Accessed 10 December 2014].
[25] E. Gies, “A Storage Solution Is in the Air,” The New York Times, 01 October 2012. [Online]. Available: http://www.nytimes.com/2012/10/02/business/energy-environment/a-storage-solution-is-in-the-air.html?pagewanted=all&_r=0. [Accessed 10 December 2014].
[26] SustainX, “SustainX Begins Startup of World's First Grid-Scale Isothermal Compressed Air

ESCRI-SA MILESTONE 3: ENERGY STORAGE SYSTEMS June 2015
State of Art ES (ESCRI Format) - 2015-06-02 clean skin.docx Version A Page 90 of 93
Energy Storage System,” 09 November 2013. [Online]. Available: http://www.sustainx.com/about-us-news-events.htm. [Accessed 09 December 2014].
[27] LightSail Energy, “LightSail Energy,” [Online]. Available: http://www.lightsail.com/. [Accessed 10 December 2014].
[28] Hydro Tasmania, “Energy Storage System,” [Online]. Available: http://www.kingislandrenewableenergy.com.au/project-information/energy-storage-system. [Accessed 17 December 2014].
[29] Ecoult, “Ecoult to supply storage to King Island renewables scheme,” 31 October 2012. [Online]. Available: http://www.ecoult.com/wp-content/uploads/2012/04/Read-more6.pdf. [Accessed 17 December 2014].
[30] A. Poullikkas, “A comparative overview of large-scale battery systems for electricity storage,” Renewable and Sustainable Energy Reviews, vol. 27, pp. 778-788, 2013.
[31] Ergon Energy, “Battery technology on electricity network an Australian first,” 16 October 2014. [Online]. Available: https://www.ergon.com.au/about-us/news-hub/media-releases/regions/general/battery-technology-on-electricity-network-and-australian-first. [Accessed 05 January 2015].
[32] SP AusNet, “Demand Management Grid Energy Storage System,” [Online]. Available: http://ausnetservices.com.au/assets/projects/4%20-%20Energy%20Storage%20Case%20Study.pdf. [Accessed 05 January 2015].
[33] ABB, “ABB to build first Embedded Generation system with Battery Grid Energy Storage for distribution network support in Australia,” [Online]. Available: http://www.abbaustralia.com.au/cawp/seitp202/3d5f9727659ed3dec1257c67002c3533.aspx. [Accessed 05 January 2015].
[34] Younicos, “Europe's Largest Battery Storage Project Becomes Operational in the UK,” 15 December 2014. [Online]. Available: http://www.younicos.com/en/media_library/news/024_2014_12_15_Opening_Battery_Park_Leighton_Buzzard.html. [Accessed 05 January 2015].
[35] UK Power Networks, “Smarter Network Storage Frequently Asked Questions (FAQs),” [Online]. Available: http://innovation.ukpowernetworks.co.uk/innovation/en/Projects/tier-2-projects/Smarter-Network-Storage-(SNS)/Smarter%20Network%20Storage%20FAQs.pdf. [Accessed 05 January 2015].
[36] NGK Insulators, LTD, “NAS Batteries Principle,” [Online]. Available: http://www.ngk.co.jp/english/products/power/nas/principle/index.html. [Accessed 05 January 2015].
[37] Prudent Energy, “Prudent Energy announces its assets acquisition of VRB Power Systems Inc,” 29 January 2009. [Online]. Available: http://www.pdenergy.com/news-012909-acquisition.php. [Accessed 07 January 2015].
[38] CEC/DOE Energy Storage Collaboration, “Zinc Bromine Battery (ZBB) - Technology Description,” [Online]. Available: http://energystoragedemo.epri.com/cec/zbb/tech_desc.asp. [Accessed 07 January 2015].

ESCRI-SA MILESTONE 3: ENERGY STORAGE SYSTEMS June 2015
State of Art ES (ESCRI Format) - 2015-06-02 clean skin.docx Version A Page 91 of 93
[39] “Fuel Cell Basics,” [Online]. Available: http://americanhistory.si.edu/fuelcells/basics.htm. [Accessed 15 01 2015].
[40] “Fuel Cells 2000,” [Online]. Available: http://www.fuelcells.org/base.cgim?template=faq. [Accessed 19 01 15].
[41] “Fuel Cells,” [Online]. Available: http://www.aboutweston.com/fuelcells.html. [Accessed 19 01 2015].
[42] “Hydrogen Fuel Cells,” [Online]. Available: http://www.hydrogen.energy.gov/pdfs/doe_fuelcell_factsheet.pdf. [Accessed 16 01 15].
[43] “The online fuel cell information resource,” Fuel Cells 2000, [Online]. Available: http://www.fuelcells.org/db/index.cgim?sess=f2a0c93afe79e8a16b21c4c951325b35&CELL_TYPE=AFC. [Accessed 19 01 15].
[44] “Energy.gov - Office of energy efficiency and renewable energy,” [Online]. Available: http://energy.gov/sites/prod/files/2014/11/f19/fcto_2013_market_report.pdf.
[45] “University of Cambridge: Department of Chemical Engineering and Biotechnology – Fuel Cells,” [Online]. Available: http://www.ceb.cam.ac.uk/research/groups/rg-eme/teaching-notes/fuelcells. [Accessed 15 01 15].
[46] “Fuel Cell Steering Committee,” [Online]. Available: http://en.fcc.gov.ir/FuelCell-Goodness.aspx. [Accessed 15 01 15].
[47] “Fuel Cells: Current Status and Future Challenges.,” National Academy of Engineering of the National Academies, [Online]. Available: https://www.nae.edu/Publications/Bridge/Cutting-EdgeResearchinEngineering/FuelCellsCurrentStatusandFutureChallenges.aspx. [Accessed 16 01 15].
[48] “The Fuel Cell Industry Review 2013,” Fuel Cell Today, [Online]. Available: http://www.fuelcelltoday.com/media/1889744/fct_review_2013.pdf. [Accessed 16 01 15].
[49] “World Fuel Cells - Industry Market Research, Market Share, Market Size, Sales, Demand Forecast, Market Leaders, Company Profiles, Industry Trends,” [Online]. Available: http://www.freedoniagroup.com/World-Fuel-Cells.html. [Accessed 20 01 15].
[50] “FUEL CELL INDUSTRY REVIEW 2014,” E4tech - Strategic Thinking in sustainable energy, [Online]. Available: http://www.fuelcells.org/pdfs/TheFuelCellIndustryReview2014.pdf.
[51] “The Future of Fuel Cell Technology,” [Online]. Available: http://duke-energy.com.au/fuel-cell-technology/. [Accessed 20 01 15].
[52] “Capacitor,” [Online]. Available: http://en.wikipedia.org/wiki/Capacitor#. [Accessed 08 January 2015].
[53] NESSCAP, “Ultracapacitor - Powered to Move,” [Online]. Available: http://www.nesscap.com/images/news/Nesscap_201312.pdf. [Accessed 08 January 2015].

ESCRI-SA MILESTONE 3: ENERGY STORAGE SYSTEMS June 2015
State of Art ES (ESCRI Format) - 2015-06-02 clean skin.docx Version A Page 92 of 93
[54] IOXUS, “Our Ultracapacitors,” [Online]. Available: http://www.ioxus.com/ultracapacitors/. [Accessed 08 January 2015].
[55] N. S. Hasan, M. Y. Hassan, M. S. Majid and H. A. Rahman, “Review of storage schemes for wind energy systems,” Renewable and Sustainable Energy Reviews, vol. 21, pp. 237-247, May 2013.

ESCRI-SA MILESTONE 2: SITE SELECTION January 2015
State of Art ES (ESCRI Format) - 2015-06-02 clean skin.docx Version x Page 93 of 93
Energy Storage for Commercial Integration South Australia
Appendices
January 2015
Version 0.1

ESCRI-SA
Energy Storage for Commercial Renewable Integration
South Australia
An Emerging Renewables “Measure” project with the Australian Renewable Energy Agency
Commercial Framework
Milestone 3
June 2015

ESCRI-SA MILESTONE 3: COMMERCIAL FRAMEWORK June 2015
Page 2 of 22
Confidentiality
This document has been prepared for the sole purpose of documenting the Commercial Review milestone 3 deliverable associated with the Energy Storage for Commercial Renewable Integration project for South Australia by AGL, ElectraNet and WorleyParsons, as part of an Emerging Renewables project with the Australian Renewable Energy Agency (ARENA).
It is expected that this document and its contents, including work scope, methodology and any commercial terms will be treated in accordance with the Funding Agreement between ARENA and AGL.
MILESTONE 3 REPORT: ESCRI-SA - PHASE 1 – COMMERCIAL FRAMEWORK
REV DESCRIPTION WORLEYPARSONS
REVIEWER
ELECTRANET
REVIEWER
AGL
REVIEWER
FINAL APPROVAL
DATE
0 Final release to ARENA
P. Ebert S. Abbleby B. Bennett H
Klingenberg

ESCRI-SA MILESTONE 3: COMMERCIAL FRAMEWORK June 2015
Page 3 of 22
Contents
GLOSSARY OF TERMS .............................................................................................................. 4
1. INTRODUCTION ............................................................................................................... 5
2. SCOPE ............................................................................................................................. 6
3. APPROACH ...................................................................................................................... 7
3.1 PHASE 1 – IDENTIFY PRIMARY ROLE .......................................................................................... 8
3.2 PHASE 2 – SELECT OWNER ....................................................................................................... 9
3.3 PHASE 3 – DEFINE DETAILED TERMS ....................................................................................... 10
4. EXAMPLE COMMERCIAL FRAMEWORKS .................................................................. 11
4.1 FRAMEWORK 1: ENERGY TRADEING – MARKET BENEFIT MODEL ............................................... 11
4.2 FRAMEWORK 2: TNSP OWNER OPERATOR – NETWORK BENEFIT MODEL ................................. 13
4.3 FRAMEWORK 3: 3RD
PARTY PROVIDER – LARGER SCALE PRIMARILY NETWORK BENEFIT MODEL 14
4.4 FRAMEWORK 4: MIXED NETWORK AND MARKET BENEFIT MODEL .............................................. 16
4.5 OTHER OPTIONS .................................................................................................................... 18
APPENDICES ............................................................................................................................ 19
APPENDIX A FIRST PRINCIPLES ANALYSIS ......................................................................... 20
Table A-1: Map of Potential Economic Benefits to Commercial Benefit .......................................... 20 Table A-2: Mapping Commercial Benefit to Framework Stakeholder .............................................. 21 Table A-3: Mapping Commercial Benefits to Elements of the Framework ...................................... 22
Tables
Table 4-1: Summary Commercial Framework – Key Terms ........................................................12
Table 4-2: Summary Commercial Framework – Key Terms ........................................................14
Table 4-3: Summary Commercial Framework – Key Terms ........................................................15
Table 4-4: Summary Commercial Framework – Key Terms ........................................................17

ESCRI-SA MILESTONE 3: COMMERCIAL FRAMEWORK June 2015
Page 4 of 22
Glossary of Terms
Term Description
AEMO Australian Energy Market Operator
ARENA Australian Renewable Energy Agency
ESD Energy Storage Device
FCAS Frequency Control Ancillary Services
MLF Marginal Loss Factor
NEM National Electricity Market
USE Unserved Energy

ESCRI-SA MILESTONE 3: COMMERCIAL FRAMEWORK June 2015
Page 5 of 22
1. Introduction
The Energy Storage for Commercial Renewable Integration – South Australia (ESCRI-SA) project is examining the role of medium to large scale (5-30 MW) non-hydro energy storage in the integration of intermittent renewable energy into the South Australian Region of the National Electricity Market (NEM) (the Project). This Project is examining the value of such storage across three broad areas: the time-shifting of renewable energy generated, the network value to the transmission system as well as the ancillary service value that can be provided to the South Australian system. A business case for the trial of a full scale energy storage system in South Australia will be formulated as one of the project objectives. This Project is being progressed by a consortium consisting of AGL, ElectraNet and WorleyParsons (the Consortium).
The ESD may potentially act as a consumer and producer of electricity (presenting an energy trading opportunity), a provider of system ancillary services (whether market or non-market services), and/or a provider of network support services. To aid commerciality, the Project is attempting to maximise the value of the ESD by potentially accessing each of these revenue streams in combination.
Consistent with the Milestone 3 deliverables under the ARENA Funding Agreement, this report provides an outline of the proposed commercial frameworks and functional specifications to be considered.
It should be noted that this Project is iterative in nature and therefore a definitive commercial framework will not be resolved completely until the preferred ESD technology, project siting and regulatory status are confirmed as these aspects will potentially influence the preferred framework and functionality.
As such, this report is not intended to confirm the preferred commercial framework and functionality, but rather provide a short-list of options and articulate and quantify potential issues to be considered further.
It is intended that a final high level description of potential commercial frameworks and functional specifications in a form which could form the basis of a term sheet will be included in the final report for ARENA and Knowledge Sharing material produced under the Funding Agreement.

ESCRI-SA MILESTONE 3: COMMERCIAL FRAMEWORK June 2015
Page 6 of 22
2. Scope
The scope of the ARENA funded ESCRI-SA project (Measure) covers the following:
• Select a preferred storage technology and develop technical specifications appropriate to the South Australian electricity market;
• Analyse deployment costs and benefits, siting options and optimize the delivery model. This includes modelling device operations in the South Australian energy market and determining the form of long term commercial relationships between consortium members, e.g. for delivering network services;
• Examine any regulatory barriers to deployment and establish safety and environmental requirements; and
• Share knowledge with relevant parties through a range of forums and reports.
The formal deliverables to ARENA on the above Measure include the following series of Milestone reports:
1. Summary report detailing the regulatory overview, including a synopsis of the relevant regulatory environment and the particular Regulations that apply and a summary of the particular roadblocks identified and the suggested path to resolve these;
2. A summary designating the site selection. The report must include the factors that were used to select the site and what constraints were identified and the potential sites that were examined and the rationale behind final selection;
3. A summary report outlining the commercial framework and functional specification including the basic form of the commercial framework envisaged, the basic terms for the commercial framework and the basic issues identified in the functional specification and how these were resolved;
4. A summary report supporting a proposed business case, including the basic results from the business case analysis and a summary of the Stage 2 Emerging Renewables Project submission; and
5. The Final Report including a summary of the Knowledge Sharing Activities and results as well as a summary of the Measure deliverables and essential results.
This Report documents the Commercial Framework and Functional Specification Milestone 3 deliverable associated with the ESCRI-SA project. This report provides an outline of the preferred commercial framework and functional specification envisaged including:
• The basic form of the commercial framework foreseen;
• The basic terms of the preferred commercial framework; and
• The basic issues identified in the functional specification and how these are to be resolved.

ESCRI-SA MILESTONE 3: COMMERCIAL FRAMEWORK June 2015
Page 7 of 22
3. Approach
The overarching approach was to develop potential viable alternative commercial frameworks which could be considered based on the findings so far established and presented in Milestone 1 and 2.
Independent energy industry experts Oakley Greenwood were engaged by ElectraNet to assist the Consortium partners in developing viable options for a commercial framework for the ESD. The approach applied by Oakley Greenwood in consultation with the Consortium was developed to meet the objectives for Milestone 3 and is described in detail in this section of the report.
In developing the optimal commercial framework for various potential ESD storage options considered, the Consortium has addressed the options with a view of the key areas of focus of this project. In particular, the Consortium has considered the potential commercial framework outcomes with a view to the requirement for new technologies or the application of new technologies to add to the improved integration and penetration of renewables into electricity networks.
Oakley Greenwood held workshops with ElectraNet initially and then with the wider Consortium to discuss the potential basic forms of the commercial framework foreseen under various operating scenarios.
The approach described below was used to develop four potentially viable commercial frameworks. The example frameworks are described in detail in the following sections of the report.
At a high level, the purpose was to determine for each potential commercial framework considered the following:
• Identify the ESD primary role/s;
• Identify the asset owner; and
• Define the basic elements of the framework.
To inform the above, the Consortium identified for each potential framework considered the following:
• Potential sources of economic benefit for energy storage;
• Potential sources of commercial impact (i.e. how is the economic benefit distributed?); and
• Key elements of the framework driving the commercial benefit.
The following figure summarises the key components of commercial framework design process undertaken:

ESCRI-SA MILESTONE 3: COMMERCIAL FRAMEWORK June 2015
Page 8 of 22
Figure 3-1: Design Process – Development ESD Commercial Framework
A first principles analysis was applied in parallel to the design process to the workshop outcomes to assist the Consortium in identifying the optimal commercial framework. The first principles analysis seeks to understand the following:
Figure 3-2: First Principles Analysis
The approach undertaken by the Consortium is described in more detail in the remainder of this section of the report.
3.1 Phase 1 – Identify Primary Role
The Milestone 2 report identified a number of potential sources of economic benefit for ESD being of most value including:
• Energy Trading;
• MLF improvement (subject to optimal ESD sizing);
• Network augmentation capital deferral or network support (where relevant);
• Expected Unserved Energy (USE) reduction;
• Interconnector constraint reduction; and
• Local generator constraint reduction.
Flexibility
Capacity
Location
Technical Design for Optimal
Economic Benefit
Ownership
Transaction
Dispatch Rights
Counter Parties
Develop details to maximisethe commercial benefit
Revise if regulatory provisions compromise commercial provisions which are consistent with
the optimum economic outcome
Overall Economic
Benefit
Overall Commercial
Benefit
Allocation of
Commercial Benefit
Elements of Commercial Framework

ESCRI-SA MILESTONE 3: COMMERCIAL FRAMEWORK June 2015
Page 9 of 22
The following benefits were found to be of low value in the current regulatory framework and are unlikely to warrant further detailed investigation:
• Localised frequency support;
• Grid support cost reduction;
• System frequency support;
• Avoided wind farm FCAS obligation; and
• Ride-through assistance.
The review conducted by independent expert Oakley Greenwood concurred with the view presented in the Milestone 2 report as to the broad description of identified potential sources of economic benefit. This report is focused on those potential sources of economic benefit recognised as being of most value.
In establishing the primary role/s of the ESD it is important to understand the realisable economic value of services and to be provided and potential commercial impact of the proposed ESD solution.
As noted previously, Oakley Greenwood have identified that a first principles analysis approach should be used to assist in identifying the optimal ESD solution and commercial framework. Once the role/s of the ESD under each model are determined, ideally potential economic benefits of the ESD role/s identified should be mapped to potential commercial impacts. This can assist in identifying the value of the economic benefit and how the commercial benefits would flow under various ESD solutions.
Table 1 in Appendix A maps potential sources of economic benefits identified as in the Milestone 2 Report to the source of the commercial impact. It should be noted that this is an example only and this would need to be applied to the actual ESD purpose/s and specifications once they have been formalised.
The interplay and / or possible mutual exclusivity of some benefit classes’ needs to be understood in each case from the table above. The interplay between potential sources of benefit needs to be considered noting that different economic benefits may be additive, mutually exclusive and subtractive depending on the operational circumstances.
3.2 Phase 2 – Select Owner
Selecting an owner will be largely dependent the identified role/s of the ESD. For example, if the primary role of the ESD is to trade energy, then the ownership is likely to be more appealing to a gen-tailer or generator with core expertise in energy trading enabling the trading benefit to be optimised.
Conversely, where the primary role of the ESD provides largely network benefits, then a TNSP or specialist 3rd party asset manager may be commercially better placed owning the ESD.
As part of the first principles analysis, Table 2 in Appendix A identifies sources of commercial impact and attempts to identify how the commercial benefits, costs and risks are allocated to various stakeholders under various operating scenarios. This can help inform who the logical owner of the ESD would be given the identified purpose/s of the ESD.

ESCRI-SA MILESTONE 3: COMMERCIAL FRAMEWORK June 2015
Page 10 of 22
Section 4 of this report illustrates some example ownership structures based on the ESD fulfilling different purposes. Who owns the ESD will in turn define the detailed commercial terms under the framework.
3.3 Phase 3 – Define Detailed Terms
Getting the key elements of the commercial framework right is essential to realising an optimal commercial benefit. The following drivers are considered the key elements of an optimal commercial framework and need to be understood under each scenario considered:
• Site location;
• Asset capacity;
• Asset Flexibility of the ESD to provide various services;
• Dispatch rights; and
• Commercial Transaction specifically;
- Forecast Revenue;
- Forecast Expenses;
- Contract counterparties; and
- Contract duration.
Ownership will drive to a large extent the elements of the framework, but the final framework in turn will still be influenced by the defined role/s of the ESD.
Applying a first principles analysis, Table 3 in Appendix A shows the potential commercial impacts of an ESD and how they may relate to the various elements of the commercial framework identified above.
It should be noted that in the above table, for each identified commercial impact, ownership of dispatch rights is critical. That is, the commercial benefits largely flow to the party which controls the output except in the case where the ESD is owned within the RAB.
As is demonstrated in the following section of this report, this does not necessarily mean that this is the asset owner.

ESCRI-SA MILESTONE 3: COMMERCIAL FRAMEWORK June 2015
Page 11 of 22
4. Example Commercial Frameworks
The final commercial framework which maximises the economic benefit cannot be determined until the location, technical design and the proposed ESD is finalised. However, the consortium’s analysis to date has identified four potential operating frameworks for consideration. The four potential commercial framework options contemplated are detailed in this section of the report:
• Framework 1: Energy Trading – Market Benefit Model;
• Framework 2: TNSP Owner Operator – Network Benefit Model;
• Framework 3: 3rd Party Provider – Larger Scale Primarily Network Benefit Model; and
• Framework 4: Mixed Network and Market Benefit Model.
4.1 Framework 1: Energy Tradeing – Market Benefit Model
Key Aspects
Framework one has assumed a generator or gen-tailer owned ESD with the primary purpose of serving an energy trading function. This example framework has a number of key aspects presented below:
• Under this framework the ESD is owned and operated by either a generator or gen-tailer with the primary purpose of the ESD being serving an energy trading function. For the purposes of this example, it is assumed that the existing regulatory arrangements remain in place;
• Site location is not likely to be of particular issue although ideally it would be situated in an area with low network constraint. Under this scenario, potentially the ESD could be installed ‘behind the meter’ at an existing connected wind farm. This has some implications which were described in detail in the Milestone 1 report. Specifically the Milestone 1 Report noted that:
- ‘Behind the meter’ may allow the ESD to assist in regulating a wind farm’s output reducing required funding of regulating FCAS although without firm scheduling capability this is unlikely; and
- If the ESD is considered too large in capacity, that is, reaching the capacity of the wind farm itself, AEMO may no longer consider the installation intermittent and therefore the ESD may not be able to leverage existing wind farm generation registrations.
• Capacity of the ESD will be determined by the generator / gen-tailer and will reflect the required volume which optimises the realisable trading benefit;
• Dispatch rights will be controlled by the generator / gen-tailer as purpose of the ESD will primarily be energy trading function. Potentially under this model there could also be opportunity to provide some ancillary services or network support to the TNSP. This last service would be dependent upon the site location;
• Likely that the generator / gen-tailer will enter agreed term contracts with energy traders and potentially AEMO for ancillary services. There may be the opportunity to enter some sort of network support agreement with the TNSP.
A summary of the key commercial framework terms under this example is presented in the following table:

ESCRI-SA MILESTONE 3: COMMERCIAL FRAMEWORK June 2015
Page 12 of 22
Table 4-1: Summary Commercial Framework – Key Terms
Project Terms Structure
Owner 3rd Party (Gen-tailer / generator)
Operator 3rd Party (Gen-tailer / generator)
ESD Location Not site specific
• Determined by gen-tailer / generator. Likely to be a location with a low network constraint.
• Could potentially be installed ‘behind the meter’ at existing connected wind farm which is constrained.
ESD Capacity 3rd Party (Gen-tailer / generator)
• Capacity which optimises energy trading benefit.
ESD Primary Purpose Energy Trading
• High asset flexibility switching from load to generator as primary purpose is energy trading.
Dispatch Rights 3rd Party (Gen-tailer / generator)
Counterparties Energy Traders / AEMO / TNSP
• Contracting energy to traders and AEMO for ancillary services. Potentially selling some network support to TNSP.
Contractual Term Agreed Contractual terms
Issues
There are some issues which will need to be considered in developing an effective commercial framework for this proposed operating model. Of particular note is that under the above operating model the ESD will be required to register as a generator. How the ESD is registered will depend upon the technical specifications and the primary revenue stream / function.
The implications of each generator classification are detailed in the Milestone 1 Report. The generator classification rules need to be considered carefully in developing the eventual ESD specifications and commercial framework.
However, as noted previously, a site location ‘behind the meter’ of an existing connected wind farm may enable the ESD to potentially leverage existing wind farm generation registrations.

ESCRI-SA MILESTONE 3: COMMERCIAL FRAMEWORK June 2015
Page 13 of 22
4.2 Framework 2: TNSP Owner Operator – Network Benefit Model
Key Aspects
Framework two has assumed a TNSP owned ESD with the primary purpose of providing a network support function. This example framework has a number of key aspects presented below:
• The ESD is owned by the TNSP. As noted in the Milestone 1 report, there are no restrictions on an NSP owning an ESD to fulfil network support functions or defer network expenditure and subject to RIT-T hurdles, include the asset in the NSP’s regulated asset base.
• Site location under this example framework would be determined by the TNSP. The siting of the ESD would likely be in a constrained part of the network and therefore the primary purpose of the ESD would be to provide a network support function. This would mean that the primary economic benefit would be derived by consumers through deferred future network capital expenditure.
• ESD capacity would also be determined by the requirements of the TNSP, that is, the level of energy required to adequately support the network support activity.
• Under this framework the dispatch rights would be controlled by the TNSP. Under this scenario, although not considered in this example, there may be significant energy trading benefits which could be derived by:
- The TNSP trading surplus energy by dispatching energy when the price is high regardless of whether there is a network constraint present to reduce costs to consumers through lower operating costs; or
- The TNSP selling residual dispatch rights to traders with the additional revenue potentially treated as reduced TNSP opex with the benefit flowing through to consumers.
• The example framework would exist for the life of the asset as the ESD would be contained within the TNSP’s RAB. As the ESD is absorbed within the RAB and therefore the contractual term is for the life of the asset, this will potentially make it easier to finance the project.
A summary of the key commercial framework terms under this example is presented in the following table:

ESCRI-SA MILESTONE 3: COMMERCIAL FRAMEWORK June 2015
Page 14 of 22
Table 4-2: Summary Commercial Framework – Key Terms
Project Term Structure
Owner TNSP • Owned by TNSP and included
in the RAB.
Operator TNSP
ESD Location Site Specific • Site determined by TNSP
subject to level of network constraints.
ESD Capacity TNSP • Determined by TNSP network
support requirements.
ESD Primary Purpose Network Support • Determined by TNSP as primary
purpose would be to provide network support.
Dispatch Rights TNSP
Counterparties N/A • ESD owned and operated by
TNSP to primarily provide network support
Contractual Term Life of Asset • Life of asset as asset part of
RAB.
Issues
A core issue to resolve with this model will be that, if energy trading benefits are to be realised under this example, there is the issue of the appropriate size of the ESD. If the ESD is designed to deliver trading benefits in excess of the TNSP’s network support requirements, as the Milestone 1 report noted, there is the question as to how revenue and capex associated with trading activities are treated if pursued as part of the TNSP’s regulated activities.
4.3 Framework 3: 3rd Party Provider – Larger Scale Primarily Network Benefit Model
Key Aspects
Framework three assumes a larger scale 3rd party owned and operated ESD with the predominant purpose of providing network support services. This framework has the following key aspects:
• Under this framework a 3rd party owns and operates the ESD;
• The predominant purpose of the ESD is to provide a network support function to the TNSP. The TNSP controls output of the ESD through purchase of dispatch rights from the 3rd party. Costs to the TNSP would be considered network support payments and as such be treated as operating expenditure and passed through to consumers; and
• TNSP would likely enter shorter term contracts than the life of the asset with the 3rd party to provide network support services.

ESCRI-SA MILESTONE 3: COMMERCIAL FRAMEWORK June 2015
Page 15 of 22
A summary of the key commercial framework terms under this example is presented in the following table:
Table 4-3: Summary Commercial Framework – Key Terms
Project Term Structure
Owner 3rd Party • TNSP purchases dispatch rights
from a 3rd party.
ESD Location Site Specific • As negotiated with TNSP as
primary purpose is provide network support.
ESD Capacity TNSP
• As negotiated with TNSP. Capacity largely determined by TNSP network support requirements.
ESD Primary Purpose Network Support
• As negotiated with TNSP. Primary purpose will be to provide network support to TNSP.
Dispatch Rights TNSP • Primarily dispatch rights to
TNSP.
Counterparties TNSP
• TNSP primary counterparty for network support. Opportunity for opportunistic energy trading by 3rd party
Contractual Term Short term contracts
• TNSP likely to seek short term contracts.
Issues
There are a number of issues which will need to be considered in developing an effective commercial framework for this proposed operating model including:
• The 3rd party would be expected to register as either a scheduled or non-scheduled generator and either as a market load or non-market load generator. There are implications for how the ESD could operate under each classification and how the generator is registered will depend to a large extent upon the capacity and purpose of the installed ESD. The Milestone 1 report sets out the generator registration requirements and potential implications under each classification in detail.
• The assumption that the TNSP will likely enter shorter term contracts with the 3rd party than for the life of the asset could potentially mean that funding the ESD is more difficult. This will particularly be the case if the 3rd party provider cannot generate additional revenues from energy trading activities; and
• It would be important under this operating scenario to develop dispatch rights that balance the access requirements of the TNSP to the energy output whilst ensuring transparency and minimal impact on energy market outcomes.

ESCRI-SA MILESTONE 3: COMMERCIAL FRAMEWORK June 2015
Page 16 of 22
4.4 Framework 4: Mixed Network and Market Benefit Model
Key Aspects
Framework four proposes a more mixed purpose commercial framework whereby the ESD is used to provide a network as well as market benefit. From the initial analysis prepared as part of this project, this model potentially represents the most economically and commercially viable option. However, the framework to deliver the commercial benefits is likely to be particularly complex. This framework has the following key aspects:
• Under this framework, the ESD a number of potential owners could be considered including a 3rd party, generator / gen-tailer or TNSP (within the RAB);
• This example provides a mixed network and markets benefits model whereby the ESD has the purpose of providing a network support function the TNSP, but also has an additional purpose of providing a commercial benefit to a third party energy trader;
• Therefore, if the ESD is owned by a TNSP dispatch rights would be sold to an energy trader or conversely, the TNSP would acquire dispatch rights if the ESD is owned by another party. A third party could sell dispatch rights to both an energy trader and TNSP;
• As a core function of the ESD is providing a network support function, the site location is likely to be determined by the constraint identified by the TNSP; and
• Capacity of the ESD will be subject to the off taker requirements, but the device would be expected to be highly flexible to manage trading and network support activities.
A summary of the key commercial framework terms under this example is presented in the following table:

ESCRI-SA MILESTONE 3: COMMERCIAL FRAMEWORK June 2015
Page 17 of 22
Table 4-4: Summary Commercial Framework – Key Terms
Project Term Structure
Owner TNSP / 3rd Party /
Gen-tailer
Operator 3rd Party / Energy
Trader
ESD Location Site Specific
• Most likely to be driven by TNSP as network support likely to represent largest economic benefit.
ESD Capacity TNSP • Determined by owner subject to
all off take requirements.
ESD Primary Purpose Network Support /
Energy Trading
• High asset flexibility required as used for energy trading and network support activities.
Dispatch Rights TNSP / Energy
Trader
• Complex arrangement inc. specific dispatch requirements for TNSP with off-take agreement with energy trader.
Counterparties Energy Trader • Off take agreement/s with TNSP
and energy trader.
Contractual Term Agreed term
• Network support agreement with TNSP likely to be less than the life of the asset if owned by 3rd party or gen-tailer.
• Other off take agreements likely less than life of the asset.
Issues
As mentioned previously, the detailed terms of this commercial framework are likely to be complex. There are a number of issues which will need to be considered in developing an effective framework under this proposed operating model including:
• How are the dispatch rights of the different types of off takers managed in practice?;
• As identified in framework two, there is the issue of the appropriate size of the ESD. If the ESD is designed to deliver trading benefits in excess of the TNSP’s network support requirements, how is revenue and capex associated with trading activities are treated if pursued as part of the TNSP’s regulated activities?;
• How will the TNSP be able to provide a network support function as well as enable an additional energy trading function under the current TNSP Ring Fencing Guidelines? This is described in detail in the Milestone 1 Report and needs to be considered carefully in developing a mixed benefits model; and
• What is the most efficient way to determine the value of each of the dispatch rights? A number of mechanisms could be used. This report looked at some from

ESCRI-SA MILESTONE 3: COMMERCIAL FRAMEWORK June 2015
Page 18 of 22
the perspective of the TNSP owning the ESD and dispatch rights and are summarised below:
- TNSP owns the ESD & sells dispatch rights by negotiated agreement to one or more traders. That is, the TNSP establishes a reserve capacity and sells the residual capacity to a trader via negotiation (most likely an annual fee) reflected in reduced opex to TNSP customers;
- The other examples considered are just minor derivations of the above model whereby the TNSP could also sell residual dispatch rights via:
� Tender;
� Auction; or
� Royalty fee.
4.5 Other Options
Some other commercial frameworks were considered as part of this review although are considered less attractive options for the various stakeholders.
A joint venture between TNSP and trader with each contributing capital is considered a less attractive option for both the TNSP and trader as:
• The TNSP holds lower capex; and
• The trader (or other third party would likely need to make a long term capital commitment (i.e. for the life of the asset).

Page 19 of 22
Commercial Framework
Appendices
May 2015
Version 1.0

ESCRI-SA MILESTONE 3: COMMERCIAL FRAMEWORK May 2015
Page 20 of 22
Appendix A First Principles Analysis
Table A-1: Map of Potential Economic Benefits to Commercial Benefit
Potential Economic Benefit
Po
ten
tial C
om
me
rcia
l Im
pa
ct
NSP Capex Deferral
NSP Opex Reduction
Generation Capex
Generation Opex Market Ancillary Service
Network Loss Reduction
Reduced NSP RAB
Reduces investment as ESD peak shaves provides immediate (initial) response to outages
Reduced NSP Opex
Reduced maintenance (less tap changing etc.) Greater flexibility
Lower peak flows – marginal impact
Lower/ Fewer Network Constraints
Lower impact of energy market incentive
Requires dispatch rights with NSP. Reduced off-loading to low cost generator
Reduced Ancillary Service Costs
Lower network support capital costs as alternative to network asset investment
Lower operational network support costs as alternative network asset investment
Lower cost source of AS (FCAS, SRAS)
Energy Price Conditional on dispatch rights available to energy trader Reduced peaking capacity, lower cap prices.
Requires dispatch rights to be available to the energy trader:
• Time shift for lower fuel cost (termed energy arbitrage)
• Interconnector loading control
• Reduced risk unit cycling at low load
Improved MLF therefor higher revenue to generators and lower expenses for retailers

ESCRI-SA MILESTONE 3: COMMERCIAL FRAMEWORK May 2015
Page 21 of 22
Table A-2: Mapping Commercial Benefit to Framework Stakeholder
Allocation of Commercial Cost /Benefit / Risk
So
urc
es
of C
om
me
rcia
l Im
pa
ct /
Ris
k
Regulated NSP Generator 3
rd Party Owner /
TNSP Unregulated
Retailer Consumer
Reduced NSP RAB
Reduces RAB by difference between network and ESD cost
Mark-up on sale of network support to TNSP limited by TNSP ability pay and include in RAB and opex
Regulated NSP ability to pay limited by RIT-T hence mark-up limited. Additional benefits potentially unregulated.
Mark-up on sale of network support to TNSP limited by TNSP ability to pay and include in the RAB
Lower network tariff
Reduced NSP Opex
Greater flexibility – but in the long term benefit passed through
See above
Lower operating cost and / or lower tariff for ESD service
Indifferent Lower network tariff
Lower/ Fewer Network Constraints
Improved incentive payments
May firm intermittent generators. Reduces risk, improves contracting capability
Additional benefits potentially unregulated.
Indifferent Lower network tariff
Reduced Ancillary Services
Indifferent (apart from lower reputational risk)
Competitor for AS market – may take market share
Additional benefits potentially unregulated.
Indifferent to A.S. generally passed through
Lower retail price
Energy Price
Commercially indifferent but increased risk of regulatory risk due to impact of dispatch of ESD controlled by TNSP
May firm intermittent generators. Reduces risk, increases contracting capability
Additional benefits potentially unregulated. Effectively a cap. Also a floor. Benefit linked to market price.
Competitive advantage but indifferent in the long term (benefit passed through)
Lower retail price
Risk Factors
• Energy trading is non-core risk
• Delivery energy market benefits in doubt
• Non-core asset • Technology risk
• Performance risk (early marques)
• Non-core asset
• Technology risk
• Performance and technology risks similar to other ownership options but likely mitigated by specialist entity
• Asset management is non-core
• Performance risk (early marques)
• Technology risk
• N/A

ESCRI-SA MILESTONE 3: COMMERCIAL FRAMEWORK May 2015
Page 22 of 22
Table A-3: Mapping Commercial Benefits to Elements of the Framework
Elements of Commercial Framework
So
urc
es
of C
om
me
rcia
l Im
pact
Location Asset Capacity Asset Flexibility Dispatch Rights
Reduced NSP RAB
Case specific Impact related to size
5-30 minute to commence discharge (rare conditions may need fast charge)
Critical
Reduced NSP Opex
Case specific Moderate impact
Sub 5 minute charge and discharge (e.g. voltage control) But retains some bene fit from 30 minute
Critical
Lower / Fewer Network Constraints
Case specific Impact related to size
5 minute to discharge (rare conditions may require charge as well)
Critical
Reduced Ancillary Service Costs
Important for some, AS not for others
Impact related to size
Sub 5 minute to discharge and charge
Critical
Energy Price Potentially relevant but generally not
Impact related to size
5 minute charge and discharge
Critical

ESCRI-SA
Energy Storage for Commercial Renewable Integration
South Australia
An Emerging Renewables “Measure” project with the Australian Renewable Energy Agency
RFI SPECIFICATION
Revision 2, May 2015
Energy Storage Device

Confidentiality
This document has been prepared for the sole purpose of documenting the RFI Specification
associated with the Energy Storage for Commercial Renewable Integration project for South
Australia by AGL, ElectraNet and WorleyParsons, as part of an Emerging Renewables project
with the Australian Renewable Energy Agency (ARENA).
It is expected that this document and its contents, including work scope, methodology and
any commercial terms will be treated in accordance with the Funding Agreement between
ARENA and AGL.
This document is being released to participating equipment suppliers as part of the Request
for Information (RFI) process of the Project.
RFI SPECIFICATION: ESCRI-SA
REV DESCRIPTION WORLEYPARSONS
REVIEWER
ELECTRANET
REVIEWER
AGL
REVIEWER
FINAL APPROVAL
DATE
0 Final
07/05/15
P. Ebert H. Klingenberg B. Bennett P. Knispel
1 Slight changes Section 1
08/05/15
P. Ebert H. Klingenberg B. Bennet P. Knispel
2 Slight changes Section 4.3- Release to Recipient
11/05/15
P. Ebert H. Klingenberg B. Bennet P. Knispel

Table of Contents
1 THE PURPOSE OF THIS RFI SPECIFICATION ____________________________________ 6
2 GENERAL ENERGY STORAGE DEVICE (ESD) DESCRIPTION ________________________ 7
2.1 Basic ESD Concept ________________________________________________________ 7
2.2 Candidate Technologies ____________________________________________________ 8
2.3 Project Location and Reference Site __________________________________________ 8
2.4 Design philosophy ________________________________________________________ 9
2.4.1 General ________________________________________________________________________ 9
2.4.2 Design life ______________________________________________________________________ 9
2.4.3 Expected Fundamental ESD Design Parameters _______________________________________ 10
2.4.4 Reference Site Conditions ________________________________________________________ 10
2.4.5 Reference Site Services ___________________________________________________________ 11
2.4.6 Site Security____________________________________________________________________ 12
2.4.7 Fire Protection _________________________________________________________________ 12
2.4.8 Basic Topology _________________________________________________________________ 12
2.4.9 Functional Control & Operation ____________________________________________________ 13
2.4.10 Grid Connection ______________________________________________________________ 15
3 CONTRACTOR SCOPE ____________________________________________________ 16
3.1 Scope of Work __________________________________________________________ 16
3.2 Terminal Points__________________________________________________________ 17
4 ENGINEERING EXPECTATIONS ____________________________________________ 18
4.1 Design Appropriate for Site Conditions & Local Laws ____________________________ 18
4.2 Compliance with Codes, Standards and Australian Norms _______________________ 18
4.2.1 Units _________________________________________________________________________ 18
4.2.2 General Applicable Standards _____________________________________________________ 18
4.2.3 Australian Energy Rules & Transmission Technical Compliance ___________________________ 18
4.3 Electrical Plant __________________________________________________________ 19
4.3.1 Energy storage device ____________________________________________________________ 19
4.3.2 Power Conversion Systems _______________________________________________________ 19
4.3.3 DC/DC Inverters ________________________________________________________________ 20
4.3.4 Step-up Transformers ____________________________________________________________ 20
4.3.5 Network connection _____________________________________________________________ 20
4.4 Mechanical Plant ________________________________________________________ 21
4.5 Civil ___________________________________________________________________ 22
5 IMPORTANT TECHNICAL DETAILS of TENDER ________________________________ 23
5.1 ESD Algorithm & Modelling ________________________________________________ 23

5.2 Project Schedule _________________________________________________________ 23
5.3 Mathematical Model of ESD _______________________________________________ 23
5.4 Performance Guarantees __________________________________________________ 24
5.4.1 Performance ___________________________________________________________________ 24
5.4.2 System Capacity Maintenance _____________________________________________________ 24
5.5 Warranties _____________________________________________________________ 24
5.6 Performance Testing Protocol - Commissioning ________________________________ 24
5.7 Operation and Maintenance (O&M) _________________________________________ 25
6 MISCELLANEOUS SUPPLY EXPECTATIONS ___________________________________ 26
6.1 Document Control _______________________________________________________ 26
6.2 Factory Acceptance Tests/Quality Control ____________________________________ 26
6.3 Commissioning __________________________________________________________ 26
6.4 Health, Safety and Environment (HSE) _______________________________________ 27
6.5 Risk Management ________________________________________________________ 27
6.6 Delivery Project Management & Client Consortiums Engineer ____________________ 27
6.7 DATA Submission and Engineering Deliverables _______________________________ 27
7 REGULATIONS, CODES and STANDARDS ____________________________________ 29
7.1 General ________________________________________________________________ 29
7.2 Units of measurement ____________________________________________________ 29
7.3 Particular Australian Standards _____________________________________________ 30
8 REFERENCES __________________________________________________________ 33
Appendices
Appendix A. South Australian Transmission System & the Preferred ESD Sites
Appendix B. Details of the Reference Site
Appendix C. ESD Specific Nomenclature
Appendix D. Extract of National Electricity Rules Requirements
Appendix E. Envisaged Market Trading Mode Operation

Acronyms
AC Alternating Current
ARENA Australian Renewable Energy Agency
CAES Compressed Air Energy Storage
DC Direct Current
ESCRI-SA Energy Storage for Commercial Renewable Integration – South Australia
ESD Energy Storage Device
GPO General Purpose Outlet
NEM National Electricity Market
NEMMCO National Electricity Market Management Company Limited
MLF Marginal Loss Factor
PABX Public and Business Exchange
PCC Point of Common Coupling
PCS Power Conversion System
RFI The Request for Information process for the ESCRI-SA Project
SCADA Supervisory Control and Data Acquisition
TNSP Transmission Network Service Provider

Page 6
1 THE PURPOSE OF THIS RFI SPECIFICATION
This Request for Information (RFI) Specification forms part of a RFI process being run for
the Energy Storage for Commercial Renewable Integration South Australia (ESCRI-SA)
project, which is examining the role and business case of an Energy Storage Device (ESD)
within the South Australian region of the National Electricity Market (NEM) (the Project).
This Project is being pursued by a consortium of AGL, ElectraNet and WorleyParsons (the
Consortium) in part funded by the Australian Renewable Energy Agency (ARENA).
This RFI Specification is an attachment to, and should be read in conjunction with, the RFI
Invitation document, which provides the context of the RFI, the objectives and initial results
of the Project, and the specific information sought in the RFI process. This RFI process is
being managed by WorleyParsons for the Consortium.
This RFI Specification provides more detailed technical and performance information of the
ESD and its potential delivery phase. It introduces the ESD, the design principles under
which it is being progressed, the likely siting and conditions under which it would operate,
and the expectations around engineering and related delivery methodology to inform
replying organisations (Respondents) of what would be expected from any final selected
Contractor (the Contractor).
This RFI Specification is not intended to be overly prescriptive, therefore allowing
Respondents to innovate and fit their product capability within the Project objectives.
Respondents are explicitly encouraged to put forward solutions that they think may offer
increased value to the Consortium.
However, it is noted that certain standards, functions and requirements of the ESD asset,
and contracting preferences, will be mandatory for solutions put forward to meet the risk
expectations and appetite of the Consortium within the context and operations of the NEM,
and the utility norms and generally high standards of electrical plant operating in Australia.

Page 7
2 GENERAL ENERGY STORAGE DEVICE (ESD)
DESCRIPTION
2.1 Basic ESD Concept
The ESD will consist of;
a medium with the ability to store and release electrical energy, located at a secure
area at a single site (the Site) within South Australia
any required converters, accumulators, generators, tanks, safety release (energy)
systems or any other device required for the safe storage of energy and/or
conversion to/from electrical energy
connection(s) to the South Australian electrical transmission network at a minimum
voltage of 33kV to provide both electrical storage inputs/outputs, and a “used on
works” electrical supply
any required switches or electrical protection equipment to allow safe electrical
isolation/operation/interaction with the network
a Supervisory Control and Data Acquisition (SCADA) system with a human to
machine interface at Site and connection to various external parties (through any
required PABX and/or data connection), and which can also interact with external
data sources or control signals as part of the control strategy, and operate the facility
for the benefit of the owner and within acceptable standards while unmanned
an earthing system including lightning protection
connection to municipal water services
any required safety system to comply with relevant safety standards such as a fire
protection or fire-fighting system, emergency personnel wash-down facilities, first aid
stations, exhaust fans, emergency egress points and breathing apparatus
an operator office and staff amenities
a maintenance storage and any required workshop facility
any roads/civil works required to give access to and allow installation of the ESD
equipment at the Site
any security fencing and/or security equipment
any environmental protection equipment including bunds, emission capture material,
spillage containment and/or volatile material containment/storage
The actual energy storage may be in the form of heat, mechanical kinetic energy, chemical
energy and/or potential energy such as compressed gases, or a combination of these,
although the primary input and outputs at the project battery limits shall be electrical energy.
The ESD will be of non-hydroelectric design, meaning it will not be storing energy in the form
of water potential energy (water head) or releasing energy through a water driven turbine.
The ESD will be designed to withstand and operate within the environmental and operational
conditions of the Site and according to all relevant Australian Standards.
The ESD will have the ability to operate autonomously, semi-automatically or manually,
depending on operator requirements and/or mode of operation required.

Page 8
The ESD will be designed to operate in accordance with any applicable Health and Safety
Standard that apply in South Australia.
2.2 Candidate Technologies
This RFI Specification seeks to define acceptable and commercially available Energy
Storage systems in a variety of configurations which include:
Battery Systems including lead acid, Nickel cadmium or Nickel metal hydride,
Lithium ion, Sodium Sulphur or Sodium Nickle Chloride, Vanadium Redox Flow
Batteries, Zinc Bromine Flow Batteries, Battery/Ultra capacitor hybrid systems
Hydrogen or other Chemical Fuel storage plus generation
Flywheels or small Compressed Air Energy Systems (CAES)
Thermal Energy Storage
This RFI Specification is more attuned to battery systems, as these are the most familiar to
the Consortium. However, the Consortium is interested in other technologies which are in
the market and may offer a better overall solution. Note, however, the RFI Invitation outlines
ultimate selection criteria, which includes criterion around the maturity of technology
including deployment and operational experience so untried or early deployment phase
technologies are unlikely to be viewed favourably.
2.3 Project Location and Reference Site
The Energy Storage Device will be located within South Australia, connected to the South
Australian transmission system, which is shown in Figure A1 in Appendix 1. It will be located
at one single Site.
Currently the exact location for the ESD is unknown and will depend on a range of factors
including the response to this RFI process. However, the ESD siting preferences of the
Consortium are currently at the following three locations;
Location 1 – Eyre Peninsula, Port Lincoln terminal substation
Location 2 – Yorke Peninsula, Dalrymple substation
Location 3 – Riverland, Monash Substation
These three sites are indicated in Figure A of Appendix A, and one of these may be chosen
as the ultimate location for the Phase 2 Project.
For response purposes, Respondents shall assume that the device is located at Location 1
and this will be known as the reference site (the Reference Site), described in more detail in
Appendix B. Respondents shall note in their response any significant additional differences
that might accrue in logistical cost terms between the three Sites noted above.

Page 9
2.4 Design philosophy
2.4.1 General The ESD will be designed to run automatically and unmanned, receiving and responding to
control signals from a variety of inputs on a cascade of hierarchy to consume or provide
electrical energy (& potentially other services, such as voltage control) as required for market
trading, market ancillary services or network services. It will employ an algorithm to
determine and optimise commercial outcomes for the asset owner and service off-takers,
while keeping the ESD within acceptable operational ranges, and will be capable of remote
control should system requirements dictate a change in operational algorithm.
The basic design philosophy of the ESD will include consideration of:
Safe operation within the environment in which it is sited
Compatibility and operability within the ElectraNet Transmission environment
Optimal commercial use of the ESD within the engineering capability of the
technology employed
Any restrictions on the operation of the device due to environment or safety
considerations
Compliance with all local and any relevant international Standards
The Consortium has considered a range of services that the ESD could provide and this
analysis indicates that the following are likely the most profitable and form the focus of the
ESD operational algorithm:
Energy trading (including the time shifting of energy through charging and
discharging)
Marginal Loss Factor (MLF) impact (subject to optimal ESD sizing)
Network augmentation capital deferral (where relevant)
Expected unserved energy reduction
Interconnector constraint reduction (the “Interconnector” here being one of those
between South Australia and Victoria)
Local generator constraint reduction
Other services which are unlikely to bring significant asset revenue but which may be
considered additionally include:
Localised frequency support
Grid support cost reduction
System frequency support
Avoided wind farm FCAS obligation
Ride-through assistance
2.4.2 Design life The design life of the Energy Storage Device will be 20 years. The actual energy storage
medium may have a minimum design life and, if so, will be capable of being easily replaced.

Page 10
2.4.3 Expected Fundamental ESD Design Parameters Table 1 provides the expectations of fundamental ESD design parameters, which are
described and defined in Appendix A.
DESCRIPTION SYMBOL INFORMATION
Power rating (import) Pin 5-10 MW
Power rating (export) Pout 5-10 MW
Energy Rating (storage capacity)
Q 4-20 hrs at Pout
Depth of Discharge DoD Contractor defined
Round trip efficiency Eff Contractor defined
Response time RT Contractor defined
Self-discharge SD Contractor defined
Durability D Contractor defined
Table 1 Expected fundamental ESD Design Parameters – definitions are given in Appendix C
2.4.4 Reference Site Conditions Table 2 provides the Site conditions that shall be assumed for the Reference Site.
DESCRIPTION INFORMATION
Project Location Reference Site
Minimum Dry Bulb Temperature -5 ºC
Maximum Dry Bulb Temperature 55 ºC Peak 48 ºC 1 hour average 37 ºC 24 hour average
Mean number of days above 30 ºC 25 days per year
Mean number of days below 2 ºC 0.3 days per year
Relative Humidity
100% Maximum Up to 55% mean summer Up to 90% mean winter 15% Minimum
Maximum solar radiation 1.1 kW/m2
Pollution As per AS4436 - Level 3

Page 11
Site Maximum Elevation (asl) 100 meters
Site Road Access Within 10 meters of an all-weather public gravel road
Seismic Withstand Criteria
As per AS1170.4: Earth quake design category II AIS switchgear: Importance Level 3 GIS switchgear: Importance Level 4 Hazard Factor 0.14 Annual PoE 1/1000
Maximum Wind Speed 46m/s to AS1170.2
Average yearly rainfall 490 mm per year
Maximum 24 hr Rainfall 110 mm per day
Subsurface Soil Conditions
Topsoil consisting of low to medium plasticity sandy clay 0.2 to 0.3m deep. Low to medium plasticity sandy clay and clayey sands 0.5 to 0.9m deep. Sandy clay underlaid by thin (0.1 to 0.35m thick) calcrete cap, itself underlaid by calcareous silty sand down to 3m. No groundwater at this depth.
Soil electrical resistivity 105.31 Ωm (ground level to 7m deep) 10.56 Ωm (7m to 10m deep) 300 Ωm (below 10m deep)
Surface Conditions Cleared, no trees No known archaeological or historic in situ No known endangered flora and/or fauna
Table 2 Reference Site Conditions
2.4.5 Reference Site Services The Respondent shall assume that the Reference Site has the following services ready for
connection to within the boundary of the Site;
Public telephone system (landline)
Mobile (cellular) phone coverage at 3G
ElectraNet Telecommunication Network, located at the control room of the adjacent
ElectraNet substation. Voice and data services, up to 10Mbps (uplink and downlink),
can be extended to the reference site over multimode fibre. The ElectraNet
telecommunications network operates at a target availability of 99.9% per annum.
Services from the Reference Site can terminate at the adjacent ElectraNet
Substation, or at the System Control Centre, 300 Pirie St, Adelaide
Potable water connection point
All weather road access to the Site

Page 12
2.4.6 Site Security The Site will not be open to the general public.
A purpose built galvanized wire fence with an anti-climb top (such as barbed wire) will
surround the ESD leaving enough room for all construction and operation activities. A
single, secure, lockable gate across the incoming road will form the egress/access point to
the Site.
All Site buildings will be lockable, vandal resistant and have intruder alarming. All locks will
be keyed similar and their distribution controlled.
There will be automatic security floodlighting of the Site, and/or in accordance with any local
ordinance or approval.
There will be no video surveillance of the Site.
2.4.7 Fire Protection The Site will include fire protection buffers extending 5 m around the peripheral fence-line
where vegetation is kept slashed to ground level. The Site will include suitable portable fire
extinguishers placed inside and at strategic outside locations. Such extinguishers will be
capable of meeting the requirements of of the relevant Australian Standard.
The Site may include fire hose reels connected to the local water municipal water supply (if
available) or provisioned from rain-water tanks with electric or petrol driven pumps, if such is
required for the ESD technology deployed.
The ESD components may include fire suppression technology, depending on the ESD
technology deployed. This will be capable of meeting the requirements of the relevant
Australian Standard.
All interior open ground surfaces will be covered in fire proof material, such as crushed rock,
concrete or local gravel.
2.4.8 Basic Topology A basic representation of the ESD topology concept is shown in Figure 1.
The SCADA system will be based on a main controller which will include a computer based
algorithm that uses these control parameters to constantly evaluate incoming market,
generation fleet and network status data to action and optimise operation. This algorithm will
have the ability to run autonomously, semi-autonomously or manually, and include the
following basic SCADA structure:
An industrial Programmable Logic Controller (PLC) based Central Processor, which
provides overall plant control and interface to remote sensors or slave control units,
and remote peripherals
Either a backup PLC controller or the ability to default to a safe mode of operation in
the event of main PLC failure
A Battery Management System (BMS) either within the central processor or
specifically part of the Energy Storage Medium

Page 13
A data storage and collation medium to allow storage, retrieval and regular
automatic and manual collated reporting of plant performance (including faults),
operational staff log-in details and system changes.
A human to machine interface, allowing visibility of operational performance
parameters, the scrutiny of logged performance data, the scrutiny and clearing of
fault flags and through suitable password control the adjustment of operational
parameters, peripheral device locations/numbers/setups, and security level control
for operational staff and remote control/visibility units.
Through an appropriate data connection technology, provide connection to remote
control/visibility units, including;
o AGL
o ElectraNet
o The Australian Energy Market Operator (AEMO)
o Operational Contractor(s)
where the amount of visibility and control is governed by the security level of connection.
Figure 1 Basic ESD Topology.
2.4.9 Functional Control & Operation The ESD will be used for the following purposes:
Be automatically dispatched as a generator whenever pool prices are high and be
dispatched as a load whenever pool prices are low (Market Trading Mode)
Be automatically dispatched to supply an isolated system whenever the local system
is isolated from the grid (that is, operated in Islanded Mode)
Be automatically dispatched (as a load or generator) to relieve system constraints
whenever a signal is received from the local supply authority (Network Mode).

Page 14
The ESD will be equipped with an appropriate software algorithm which will be incorporated
within the Central Processor or Battery Management System. The software algorithm used
will be available to the operator for modification if it is deemed that market conditions have
changed to warrant it.
As a minimum the Market Trading Mode shall include:
A filtering algorithm which filters the input 5 minute samples of market pool prices to
an appropriately designed low pass filter (implemented in software)
A threshold setting so that the device is dispatched as a load if the actual pool price
(in the 5 minute dispatch period) is below the output of the low pass filter (-
threshold).
A threshold setting so that the device is dispatched as a generator if the actual pool
price (in the 5 minute dispatch period) is above the output of the low pass filter output
(plus threshold value).
The device shall be switched off if the actual pool price is between the filtered output
+/- the dead band threshold limits.
In the event that the storage device looks to be at risk of under or over charging, the
device shall also be automatically switched off.
Appendix E contains more information about this Market Trading Mode, particularly around
expected duty cycles.
In the event that the device is isolated from the grid is will enter Islanded Mode, and it will be
dispatched to supply the local load unless the load exceeds the device rating or the device
does not contain sufficient stored energy. In this latter case the device will be switched off or
placed in standby. In order to supply the local load the device has to be capable of load
following and frequency control (providing “the grid”).
If the device receives an external signal to be dispatched as a load or a generator from the
local Network Authority it will enter Network Mode, and this will override all other functions
unless the device is at risk of under or over charging, in this event the device shall be
automatically switched off or placed in standby. Just prior to Network Mode it is possible
that an intermediate or fourth mode of operation may be required if a network contingency
probability increases, such as approaching a peak on a very hot day. In this case the ESD
can have time to prepare itself to remove the risk of it being under or over charged for the
network related duty expected.
It is also possible, in line with the dialogue in Section 2.4.1, that other grid support functions
may be valuable. Respondents should consider whether such other functions are possible
with the technology offered and how these might be included within the modes sought.
Note that respondents may offer a device which is dispatched only in a ternary mode, i.e.:
Generation at full output or
Switched off or
Dispatched as a system load at full output
Consideration will also be given to devices which can operate at all outputs from full charge
to full discharge rating.

Page 15
2.4.10 Grid Connection The Energy Storage Device will connect to the local electricity system at 33 kV according to
the basic Single Line Diagram given in Appendix B, refer specifically Figure B4c.
The device will meet the requirements of the National Electricity Rules (NER) with respect to
Schedule 5, and in particular;
The ESD will be capable of operating at a range of power factors. As a minimum the
device should be able to meet a power factor of 0.93 leading to 0.93 lagging at all
loads or generation operating points.
The ESD will meet the requirements for fault ride through; power quality and
protection systems (refer to Appendix D for specific applicable references from the
NER).

Page 16
3 CONTRACTOR SCOPE
This Section is to inform Respondents of the basic expectations around Scope of Work for
the purposes of replying to the RFI. This Scope of Work will be termed the Contractor’s
Scope of Work. Any final Contractor’s Scope of Work in a formal tender process may
change, depending on the responses provided and the ultimate timing of the Project.
3.1 Scope of Work
For the purposes of this RFI Specification, the Contractor’s Scope of Work covers the
design, procurement, construction, commissioning, defects liability, performance guarantees,
warranties and 20 years of ongoing maintenance of an ESD comprising but not limited to the
following;
All layouts and arrangements on Site
All energy storage and related operation equipment
All control equipment
All remote monitoring and communications equipment
All power conversion equipment
All electrical equipment up to the Point of Common Coupling (PCC)
All site civil works (including site geotechnical testing, preparation, levelling,
foundations, stormwater treatment and civil works associated with services)
All site service connections including potable water and mobile phone services
All buildings including those for the energy storage, maintenance, spare parts,
operations and personnel amenities
All mathematical models of the ESD required for transmission access studies
All fire-fighting or other safety equipment
All building security equipment and lighting
All transport to Site of any equipment
All consumables involved in commissioning and maintenance
All commissioning tests
All operations and maintenance manuals, as-built drawings and other documents
Perimeter fencing and entrance gate
all in accordance with this RFI Specification.
For the purposes of this RFI Specification, the Contractor’s Scope of Work does not include;
Any Statutory project approvals
Any land acquisition or tenure
Any transmission access studies and/or approvals
Modifications to the existing 33kV primary equipment at the Reference Site to
terminate a 33kV cable from the ESD. This cable termination will be the Point of
Common Coupling (PCC)
Any equipment required to connect to the ElectraNet Telecommunications Network
all of which will be provided by others.

Page 17
3.2 Terminal Points
This section defines the terminal points for the Contractor Scope of Work for the respective
systems indicated below. Physical locations are described below.
The Primary Terminal points for equipment supply include:
The site boundary which is defined as the fenced and gated perimeter of the project
Site upon which the ESD will be constructed
The Point of Common Coupling (PCC), which is the 33kV cable termination
(supplied and installed by the Contractor)connecting to the Reference Site 33kV
circuit breaker owned by ElectraNet
The existing sub-station potable water supply at the Site
The Telstra Landline Network
The Mobile Phone 3G network
The ElectraNet telecommunications network can be extended from the adjacent
ElectraNet Control room to the Energy Storage Control Room.
Battery Limit Terminal Point Condition & Value
Point of Common
Coupling (PCC) to
grid
Voltage 33 kV
Current 33kV Incomer
Protection settings Selected to coordinate with
upstream protection
Data connection
point(s)
ElectraNet
Telecommunications
Network EtherNet Point of
Presence
Ethernet – 10Mbps for
SCADA (DNP/IP), and any
other data services.
Optical fibre – C37.94 or
direct on fibre, for inter-trip
(if required).
Mobile Phone
Connections 3G Network Telstra NextG
Potable water
supply - existing
substation supply
Substation water main 20mm diameter copper
system
Table 3 Battery Limits & Terminal Point Conditions

Page 18
4 ENGINEERING EXPECTATIONS
This Section is to inform Respondents of the basic expectations around Engineering that
would apply in a more formal tender for the Project. This should be used by Respondents in
forming their response to the RFI in line with the Contractors Scope of Works defined in
Section 3.1. As per the commentary in Section 1 the intention here is not to be overly
prescriptive, to allow the best solution to emerge from Respondents, although certain
aspects of this Section are considered mandatory, denoted by the term “shall”.
4.1 Design Appropriate for Site Conditions & Local Laws
The ESD shall be designed for continuous normal operation within the expected
environmental conditions of the Site provided in Section 2.4.4.
Any buildings, including containerised solutions, shall meet the requirements of the Building
Code of Australia and all applicable local Laws, Ordinances, Regulations, and Standards of
the City of Port Lincoln, in addition to the requirements of this RFI Specification.
The Energy Storage Medium shall not present a safety or environmental risk to the Site or its
immediate surrounds. Any potential harmful components shall be contained and/or the risk
treated, and evidence of that treatment shall be provided by the Contractor.
4.2 Compliance with Codes, Standards and Australian Norms
4.2.1 Units All plant shall be designed and rated according to the SI (metric) unit system, as described in
Section 7.2.
4.2.2 General Applicable Standards The ESD shall comply with all relevant Australian and International Standards that may
apply, including those listed in Section 7, others noted throughout this RFI Specification and
others that may apply to the final tendered solution. The Contractor shall ultimately provide
evidence of such compliance during a formal tender process.
4.2.3 Australian Energy Rules & Transmission Technical Compliance The ESD connection to the transmission network is subject to the requirements of Chapter 5
of the National Electricity Rules (NER), and more specifically as outlined in NER Schedule
5.2 “Conditions for Connection of Generators”. Performance standards will need to be
established in accordance with NER Schedule 5.2.5 “Technical requirements” with the
detailed requirements for each clause to be negotiated and agreed between the proponent,
ElectraNet and AEMO.
It is expected that the main technical requirements will relate to:
S5.2.5.1 Reactive Power capability
S5.2.5.2 Quality of electricity generated
S5.2.5.5. Generating system response to disturbances following contingency events
S5.2.5.11 Frequency control
S5.2.5.12 Impact on network capability

Page 19
S5.2.5.13 Voltage and reactive power control
An extract of the abovementioned sections of the NER is provided in Appendix D.
In Responding to this RFI, Respondents are asked to indicate for each of the above
technical requirements whether the automatic access could be achieved, and if not, whether
the minimum access standard could at least be achieved.
4.3 Electrical Plant
4.3.1 Energy storage device This Energy Storage System shall meet the requirements of any Australian Standard for
Energy Storage facilities (of relevance to the energy storage medium supplied) and shall
meet all applicable state and local electrical Codes and Standards. Some of these
Standarda and Codes are indicated in Section 7.
Electrical power delivered by the ESD to the PCC shall at 33kV and 50 Hertz alternating
current (AC).
All wiring, fusing, protection, color coding, arrangements, housing and rating of electrical
equipment shall conform to AS3000 and any other relevant Australian Standard or
international equivalent. All General Purpose Outlets (GPOs) shall be of Australian design,
rating and voltage.
Power developed by a chemical storage technology (battery) shall be at a direct current (DC)
voltage ranging from 600 to 875 DC Volts. The DC power will then be converted to AC
voltage by a Power Conversion System (“PCS”) nominally rated in kW to match the basic
“building block” battery module size, and will be stepped-up to the grid voltage by medium
voltage step-up transformers located at the Power Conversion Units. Together, the Power
Conversion Units, transformers, and the SCADA make up the conversion equipment of
multiple supplier defined building blocks. The PCS shall deliver AC power within a voltage
range of 300-440 volts to a step-up transformer rated to the full capacity of the PCS.
4.3.2 Power Conversion Systems Any PCS shall be bi-directional and rated for the basic ESD building block described in
Section 4.3.1 in increments ranging from 100kw to 500 kW rated at >0.99 power factor. The
PCS’s SCADA shall aggregate SCADA I/O from the PCS, transformers, for transmission to
Central Processor.
PCSs shall be certified to UL1741 “Standard for Inverters, Converters, Controllers and
Interconnection System Equipment for Use with Distributed Energy Resources” and comply
with the following standards (or recognised equivalent), as a minimum:
IEC 62477 – Safety Requirements for Power Electronic Converter Systems and
Equipment
UL 9540 Ed. 1 (2014) - Energy Storage Systems And Equipment
IEEE 1547 - Interconnecting Distributed Resources With Electric Power Systems
NEC CODE and Security Standards set out in UL9540, UL1741, FCC Part 15, IEEE
C37.90.1 and IEEE C37.90.2
Page 20
In addition, the PCS shall have a <3% total harmonic distortion (THD) at rated power output,
be temporarily capable of 110 percent of rated output or better across the temperature
conditions expected at the Reference Site, be matched in rating to the DC power source
(building block) and be equipped with all hardware for data collection and communication to
the ESD Central Processor, BMS or SCADA system, whichever is relevant.
4.3.3 DC/DC Inverters For battery solutions, DC/DC inverters may be required to match battery voltage output of
each battery string to the input voltage of the Power Conversion Units and meet the full
requirements of the UL and Codes and Standards applicable.
4.3.4 Step-up Transformers Main ESD step-up transformer(s) shall be rated for expected maximum inputs and outputs
(including, if a battery system, the PCS 110% requirement of Section 4.3.2) across the
relevant power factor range, and shall have BIL ratings for HV and LV Voltages as defined
by good utility practice and relevant Australian Standards. The configuration of the
transformers shall be appropriate for the design transformation requirements, rated for air
cooling only, have an insulation rating for a 65 deg C rise over highest site ambient
temperature at the Site, guarantee an efficiency of no less than 98%, and be dry or wet type
(non-flammable insulating medium). The transformer will be fitted with all utility required
accessories.
4.3.5 Network connection
4.3.5.1 Plant Switchgear
All switchgear shall be appropriate for the application of the ESD and shall meet the
requirements of the applicable standards for medium and high voltage switchgear applied to
the ElectraNet System (generally the IEC/AS 62271 series of standards, examples of which
are listed in section 7.3). Switchgear monitoring hardware shall be included to meet the
requirements of AGL/ELECTRANET.
4.3.5.2 Grounding / Earthing
A grounding electrode system comprising a buried ring consisting of bare cable will be
installed at each unit comprising the Energy Storage Device.
The earthing system must be designed in accordance with the latest version of the following
standards and guidelines. In the event of a discrepancy between the referenced standard,
the Contractor shall get direction from the Consortium on which standard shall take
precedent:
IEEE Standard 80 , Guide for Safety in AC Substation Grounding;
IEEE 837/2002, IEEE Standard for Qualifying Permanent Connections Used in
Substation Grounding;
ENA EG1-2006 Substation Earthing Guide;
ENA EG-0 Power System Earthing Guide;
AS/NZS 3000, Wiring Rules;

Page 21
IEEE 81: IEEE Guide for Measuring Earth Resistivity , Ground Impedance and Earth
Surface Potentials of Ground System;
AS 1746: Conductors – Bare overhead – Hard-drawn copper;
AS 1125: Conductors in insulated electric cables and flexible cords;
AS 2067: Switchgear assemblies and ancillary equipment for alternating voltages
above 1 kV;
IEC 60479-1 Effects of current on human beings and livestock Part 1 General
aspects;
IEC 60479-5 Effects of current on human beings and livestock Part 5 Touch
Voltages threshold values for physiological effects;
AS 4853 Electrical Hazards on Metallic Pipelines; and
AS/NZS 3835.1 Earth Potential Rise - Protection of telecommunications network
users, personnel and plant.
Contractor shall submit to the Consortium for approval grounding and lightning calculation
for assurance of safe step and touch potentials on the project site in accordance with
Consortium approved standards.
4.3.5.3 Electrical Protection
The electrical protection system’s design and performance shall conform to the technical
requirements for a transmission network service provider as defined in the National
Electricity Rules. The protection systems installed at the connection point between the
transmission Network User and ElectraNet shall provide protection of all high voltage assets
owned by the transmission Network User, from the nominated asset interface boundary.
The protection system technical requirements must satisfy the following:
All protection systems installed by the transmission Network User which have the
potential to reduce power system security shall be approved by ElectraNet
All Network User owned assets are to be protected by duplicate or complementary
protection systems
Each protection system is to be independently capable of effectively and safely
disconnecting and isolating their equipment at the connection point automatically,
following a system abnormal condition
Each protection system shall be industry standard high speed protection systems
that operate within the time period set out by ElectraNet for voltages below 100 kV;
and
Backup protection systems for each connection point primary protection system
shall be provided if ElectraNet’s and the Network User’s circuit breaker fail to
operate within the given fault clearance times.
4.4 Mechanical Plant
Mechanical Plant used within the ESD shall be designed for continuous, safe, trouble free
operation within the environmental conditions of the Site and the expected operational
demands on the asset.
Areas of particular focus by the Consortium will be;

Page 22
Rotating equipment, where focus will be given to plant safety, the potential for
vibrations and noise, and the complexity and lifecycle costs associated with plant
maintenance
Mechanical (rotational or potential) energy storage, including a focus on the
conversion to and reconversion of electrical energy, the quantum of storage and
application within the functional requirements of Section 2.4.9, the efficiency of and
limitations of that process, and the lifetime of the process
Any pressurised systems or accumulators, where the potential for pressure related
incident is high and compliance with pressure related standards is mandatory
4.5 Civil
All civil work shall be undertaken in accordance with all relevant Australian Standards,
Codes and Local Ordinances applicable to the Reference Site and be based on a site
specific Geotechnical Report. For the purposes of fulfilling the costing requirements sought
in the RFI Invitation, Respondents are to assume that the site is flat, cleared of vegetation
and has the basic geotechnical parameters specified in Table 2.

Page 23
5 IMPORTANT TECHNICAL DETAILS of TENDER
This Section is to inform Respondents of particular issues that are likely to be important in
any formal Tender that may occur for the Project. This should be used by Respondents in
forming their response to the RFI in line with the Contractors Scope of Works defined in
Section 3.1. As per the commentary in Section 1, the intention here is not to be overly
prescriptive, to allow the best solution to emerge from Respondents, although certain
aspects of this Section are considered mandatory, denoted by the term “shall”.
5.1 ESD Algorithm & Modelling
The ESD will be required to operate in a certain manner for the business case metrics to be
achieved and the operational algorithm employed on the device will be a critical component
of this. The Consortium will likely specify this algorithm as a series of performance
requirements, within the known limitations of the ESD, but it shall be the responsibility of the
Contractor to confirm this capability, if required put forward and justify changes to those
requirements, and design the necessary control into the device.
At this stage, the functions given in Section 2.4.9 form the basis of the Consortium thinking
in regards to maximising value of the ESD within the South Australian markets.
It is likely that the consortium will model the commercial outcomes that result from any
formal tender process, although the expectation is that from a functional perspective the
Contractor will have the ability to model the physical response of the ESD to functional
commands. It is likely that the consortium will seek details of such modelling or model run
results for incorporation into the commercial model.
5.2 Project Schedule
A formal Schedule will be sought from Contractors with a time period as defined in the
commercial documents associated with the Tender. The Project Schedule shall be a
composite of the Engineering Schedule, the Procurement and Delivery Schedule, and the
Training Schedule (whichever applies). The Engineering Schedule shall be broken down
into major phases as required adequately describing, scheduling, and controlling the design
process for the Project. The Procurement Schedule shall cover all equipment and materials
to be furnished by the Contractor and accepted by the Owner. This schedule shall indicate
times for approval of manufacturer's drawings, fabrication, delivery, testing, and other
significant project milestones.
5.3 Mathematical Model of ESD
It is a mandatory requirement that the Contractor shall provide a mathematical model of the
device which will enable AEMO to assess the behaviour of the device under system
transient conditions. The model should be supplied to enable inclusion in the PSS/E
software program which is currently used to model transmission system behaviour by
AEMO. This model shall cover all expected functionality of the device.

Page 24
5.4 Performance Guarantees
5.4.1 Performance The Contractor shall provide performance estimates of the ESD output in MWhrs as a curve for discharge periods of 2, 4, 10, and 20 hours as a function of the State of Charge of the complete ESD in their Tender. The Contractor shall provide a description of the modelling software to be used (GE PSLF or equivalent). The Contractor shall provide performance for two (2) evaluation cases nominated in the Tender which would illustrate the expected and guaranteed performance of the ESD over the nominated discharge periods at the capacity specified. Base Case Round Trip Efficiency shall be stated for each of the discharge periods nominated.
5.4.2 System Capacity Maintenance The Contractor shall specify the degradation associated with the equipment proposed for the first year and each subsequent year up to 20 years for the charge/discharge period specified. The Contractor shall provide a planned program for adding additional capacity or providing a complete repowering of the system(s) (if applicable) in order to maintain the guaranteed original output at the end of the Project life.
5.5 Warranties
The Consortium will expect a Warranty over both the total ESD, through a defects liability period which shall be a minimum of 2 years, and the energy storage medium which shall be a minimum of 5 years. The basis of any such warranties will see the replacement of defective plant at the Contractors cost. Respondents should outline their approach to warranties in general. The Consortium would look very favourably on energy storage technology that could provide a warranty of a greater time period that indicated above.
5.6 Performance Testing Protocol - Commissioning
The following outlines the basic performance tests that shall be undertaken for the ESD program during commissioning. The Contractor shall develop a detailed test procedure applicable to their proposed ESD technology generally in accordance with all applicable standards for an electric generation facility connected to the ElectraNet Grid. All testing shall be undertaken with instrumentation fitted to the ESD facility, calibrated and working, including any additional instrumentation required to meet the specific requirements of the applicable International Codes and Standards for the technology inclusive of internationally recognized Power Test Codes. Performance Tests will be undertaken for a range of state of charge conditions and periods. As a minimum, the performance tests shall be developed to ensure that the representations and guarantees by the ESD provider can be achieved for representative periods of dispatch, States of Charge ranging from minimum to maximum, response times, Unity Power Factor of Output delivered at the Point of Interconnection, and other relevant tests as developed by the parties, including:

Page 25
Maximum Power/Full Duty Cycle Efficiency/Daily Efficiency/Power Quality (X full
cycles)
Stored Energy Capacity
Site Specific Required Duty Cycle (consecutive days)
Partial Duty Cycle ( consecutive days)
Response Time Test
Standby Self-Discharge
Standby Energy Consumption
Power Factor (Real and Reactive Power)
Frequency Regulation
Automatic, semi-automatic and manual operational modes
Remote control and data capture
Islanding tests (as required)
5.7 Operation and Maintenance (O&M)
The Contractor shall prepare and provide a recommended Operations and Maintenance (O&M) Plan related to the ESD in order to maintain the plant Performance Guarantee. The Contractor shall prepare and provide a training program and schedule that is designed with sufficient detail to effectively train Operating personnel in the operation of the completed ESD system. The Contractor shall prepare and provide a complete set of O&M documentation, including but not limited to;
Complete as-built engineering drawings and layouts
A complete list of spare parts, noting type, manufacturer, specifications and original
supplier details
A complete Operations manual, describing the ESD functions, performance, faults,
component operational bounds, alarms and responses
A complete Maintenance manual, describing the scheduled maintenance program,
spare part inventory, unscheduled maintenance response
The Contractor shall also provide a methodology by which operational algorithms can be updated describing the formulation, testing and approved application process to comply with both Performance Guarantees and Warranties. This is expected to be a very important aspect of the Tender, as significant change to operational algorithms are likely as the relevant electricity markets evolve and the ESD service value shifts.

Page 26
6 MISCELLANEOUS SUPPLY EXPECTATIONS
6.1 Document Control
A formal document management system will be employed to manage the delivery of the project. This will manage the interaction between the Contractor and the Consortium, and include;
A Web based portal for document exchange
A formal register and revision process
A formal transmittal recording process
Document archiving
Contractors will be required to use this document management process as a condition of
Tender.
It is expected that the presentation and approval by the Consortium of certain documents at
certain times within the Project Schedule will be a requirement of Contract.
6.2 Factory Acceptance Tests/Quality Control
Depending on ESD solution, it is likely that the Consortium will require certain equipment to
be tested within the manufacturing factory to prove compliance with relevant standards or
performance prior to transport to Site – such tests are known as Factory Acceptance Tests,
and Contractors will have to allow for these hold points in their delivery.
A quality assurance plan detailing the application of the supplier’s quality system to the
Contractor’s Scope of Work shall be submitted for the Consortium's approval, prior to
commencement of any work. The plan must specifically detail how each element of the
quality standard is applied and must contain:
An outline of the Supplier’s Quality Management System, including details on
certification to international (ISO) standards
The supplier’s organisation chart for the Work
Roles and responsibilities of QA/QC staff
The list of the procedures that will be used for the Work
The list of the inspection and test plans for the Work
A schedule identifying internal and external audit
6.3 Commissioning
Contractors will be required to prepare and provide an extensive Project Commissioning
Plan, in draft with their Tender and which will be formulated in consultation with, and
approved by, the Consortium prior to Commissioning beginning. This will be a staged,
logical Plan taking into account the operational environment of the Site and any relevant
stakeholders identified by the Consortium.

Page 27
6.4 Health, Safety and Environment (HSE)
The Contractor will have primacy of the Site. This means that they will be responsible for and manage all safety and environmental issues on the Site until the Project reaches Practical Completion. The Contractor shall prepare and provide an extensive Health, Safety and Environment (HSE) Management Plan, in draft with their Tender and to be approved by the Consortium prior to Works commencing and which will cover the detailed design, construction and commissioning periods. As a minimum, this HSE Plan will include;
A formal Project structure including clear responsibilities and expectations for HSE
issues
A risk based assessment and treatment approach to HSE issues which is included
in the Project Risk Register, and which includes interaction with relevant Project
stakeholders
HAZID and HAZOP processes to inform both the design process and construction,
undertaken and updated at regular intervals
A means of tracking and responding to HSE incidents
A formal permit process for construction activities considered of higher risk
Regular safety briefings and updates to Project staff and sub-contractors
6.5 Risk Management
A risk based approach to the Project will be expected from the Contractor, which shall include as a minimum;
A Risk Management Governance framework consistent with Australian Standards
A Project Risk Register, compiled for the Project and updated regularly through input
from Project Stakeholders
A formal process of assessing and treating risks in alignment with the “As Low As
Reasonably Possible” (ALARP) principal
A means of allocating and tracking actions in regards to risk treatments
6.6 Delivery Project Management & Client Consortiums Engineer
It is expected that the Contractor shall report to a Consortium Project Management Team which will include a formal Project Manager, who will provide Governance over the Contract, and an Owner’s Engineer Team, who will provide review of all engineering deliverables in terms of meeting the final Specification.
6.7 DATA Submission and Engineering Deliverables
A range of Deliverables will be expected from the Contractor during the Project. The Contractor shall, as a minimum, submit the following data for ALL electrical and mechanical components, as part of the bid package:
Equipment/component specifications
Accelerated life testing results and data

Page 28
Standard Technical drawings
General Plant Layout
The Contractor shall develop a comprehensive Engineering Design Package consisting of drawings generated in AutoCAD, latest version. Drawing format shall be acceptable to the Consortium. Drawings and specifications shall be prepared to eliminate field engineering design and any possible construction delays. The Engineering Design Package shall be complete covering all work and shall include, but not limited to, the following information and drawings:
Cover sheet
Dimensions Site plan
Symbols, abbreviations and notes
Structural plans, details and elevations
Plant and Equipment Electrical single line , three line , and control schematic
diagrams
Battery, Power Conversion Units, and Plant Switchgear installation plans
Grounding plans
Power and control wiring plans, including AC and DC systems
SCADA system design and details
Lightning protection (if required)
As-built drawings and documentation
Equipment operation and maintenance manuals
Engineering Calculation
Others as required

Page 29
7 REGULATIONS, CODES and STANDARDS
7.1 General
The Energy Storage Device will comply with all relevant legislation and standards. This
includes those of South Australia, or of Australia, or International Standards, depending on
coverage and issue.
Where an Australian Standard does not exist for an element of the Device, a suitable
International Standard will be sourced and agreed between the consortium members.
7.2 Units of measurement
The following provide the basic units of measurement to be used for the Energy Storage
Device, which is based on the International Metric System of SI Units.
Unit Explanation
ºC Degree Celsius
dB Decibel
dB(A) Decibel (on ‘A’ scale)
Hz Hertz (cycles per second)
kg kilogram
kg/h kilograms per hour
kg/L kilograms per litre
kg/m3 kilograms per cubic metre
kg/s kilogram per second
kJ/h kilojoules per hour
kJ/kWh kilojoules per kilowatt hour
kPa Kilopascal (defined as absolute)
kPa (a) kilopascals absolute
kPa (g) kilopascal gauge
kV kilovolt
kW kilowatts
kW/m2 kilowatts per square metre
kW/m3 kilowatts per cubic metre
m metre
m2 square metre
m3 cubic metre
m3/s cubic metres per second
mA milliampere
mg milligram
mg/L milligrams per litre

Page 30
Unit Explanation
ML Megalitre
mm millimetre
MPa Megapascal (defined as absolute)
m/s Meters per second
MVA Megavolt amperes
MVAr Megavolt amperes reactive
MW Megawatts
Nm3 Normal cubic metres
Pa Pascal
ppb Parts per billion
ppm Parts per million
rpm Revolutions per minute
V Volts
7.3 Particular Australian Standards
The following Australian Standards are expected to apply to the Energy Storage Device,
depending on final energy storage medium – this list should not be considered to cover all of
the applicable standards or relevance, but is supplied for indicative purposes only.
AS/NZS 3000 Electrical Wiring Rules
AS 1852 International Electrotechnical Vocabulary
AS 2650 Common Specifications for High Voltage Switchgear and Controlgear
Standards
AS 62271.100 High Voltage AC Switchgear and Controlgear – Part 100: High-voltage
Alternating Current Circuit Breakers
IEC 62271-100 High Voltage AC Switchgear and Controlgear – Part 100: High-voltage
Alternating Current Circuit Breakers
AS 62271.102 High Voltage AC Switchgear and Controlgear - AC Disconnectors and earth
switches
AS 1307.2 Surge arresters - Metal-oxide surge arresters without gaps for a.c. systems

Page 31
AS 62271.301 Dimensional Standardisation of Terminals
AS 60044.1 Instrument Transformers – Part1: Current Transformers
AS 60044.2 to
AS 60044.5 Instrument Transformers – Voltage Transformers
AS 4436 Guide for the selection of insulators in respect of polluted conditions
AS 1170.2 Structural design actions - Wind actions
IEC 60376 Specification and acceptance of new SF6
AS 60529 Degrees of protection provided by enclosures for electrical equipment
AS 2067 Substations and high voltage installations exceeding 1kV a.c.
AS 4398.1 Insulators - Ceramic and Glass-Station Posts for indoor and outdoor use-
voltages greater than 1000V AC – Characteristics
AS 4398.2 Insulators - Ceramic and Glass-Station Posts for indoor and outdoor use-
voltages greater than 1000V AC 2 – Tests
IEC60437 Insulators – Ceramic Type Testing Radio Interference
AS 2374 Power Transformers
AS1768 Lightning Protection
AS/NZS 1170.2 Wind Loads
AS/NZS
61558.2.4:2001 Safety of power transformers, power supply units
AS2067 Substations and high voltage installations exceeding 1kV a.c.
AS3010 Electrical installations - Generating

Page 32
AS4044 Battery chargers for stationary batteries
AS4777 Grid Connections of Energy Systems via Inverters
AS2676 Installation and maintenance of batteries in buildings
AS3011 Electrical installations - Secondary batteries
AS/NZS 3197 portable electrical control or conditioning devices
AS/NZS 60950 Information technology equipment
AS4086 Secondary Batteries for use with stand-alone power systems
AS4509 Stand-alone power systems
C-Tick EMC, EME and radio communications compliance
Code of Practice Australian Battery Industry Association Code of Practice
AS IEC 62040.3 Uninterruptible power systems

Page 33
8 REFERENCES
[1] The Work Health and Safety Act 2012 (SA)
[2] The Work Health and Safety Regulations 2012 (SA) and supporting Codes of Practice.

APPENDICES
Appendix A. South Australian Transmission System & the
Preferred ESD Sites
Figure A1 – Map of the South Australian Transmission Network, indicating the three preferred Sites
for the ESD. Source: ElectraNet
Location 1
Location 2
Location 3

APPENDICES
Appendix B. Details of the Reference Site
Port Lincoln Terminal Substation
The Reference Site is located at the Port Lincoln Terminal Substation which is on Pound
Lane, approximately 7 km north-west of the City of Port Lincoln on Eyre Peninsula, South
Australia. Port Lincoln is approximately 645 km from Adelaide by road. An aerial photograph
is provided of the Site in Figure B1, a location with reference to the existing Eyre Peninsula
transmission system in Figure B2, and a location map in Figure B3.
The coordinates of the Substation are at approximately: 34º 41’ 59.66”S, 135º 48’ 17.06”E
Port Lincoln Terminal Substation site has both ElectraNet (132 kV) and SA Power Networks
(33 kV) infrastructure and includes existing backup generation used for network support
services. ElectraNet owns the land where it has HV assets and also a substantial parcel of
land adjacent to the north and east of the substation (10 Ha plus), potentially where the ESD
could be installed. A single line diagram of the Substation is shown in Figures B4a-c which
indicates the assumed connection point for the ESD (in Figure B4c).
Port Lincoln Terminal Substation site is connected to the greater ElectraNet
Telecommunications Network via a 155Mbps Radio. Both circuit switched and packet
switched circuits terminate at the substation, and can be extended to the Energy Storage
Site as required over multimode fibre cable.
Figure B1. Aerial photograph of Port Lincoln Terminal Substation looking West.

APPENDICES
Figure B2. Location relative to existing Transmission assets.
Figure B3. Location map.
Port Lincoln
Terminal
Substation
Port Lincoln
Terminal
Substation
This figure is licensed by Google Earth for WorleyParsons use only. WorleyParsons is not permitted to grant a licence to use this figure. This figure
is not to be copied or distributed without the appropriate licence from Google Earth. Contours & Cadastre © Dept Lands, 2009.

APPENDICES
Figure B4a. Port Lincoln Terminal Substation Single Line Diagram (1 of 3)

APPENDICES
Figure B4b. Port Lincoln Terminal Substation Single Line Diagram (2 of 3)

APPENDICES
Figure B4c – Port Lincoln Terminal Substation Single Line Diagram (3 of 3), showing the
potential connection point for the ESD.

APPENDICES
Appendix C. ESD Specific Nomenclature
The following nomenclature is used throughout this RFI Specification in regards to the ESD.
Power rating (P)
This parameter determines the constitution and size of the motor-generator or inverter used
in the stored energy conversion chain and is used to represent maximum (nameplate) power
of charge and discharge. Within this RFI it is stated in MW. Power ratings can be both into
and out of the ESD (designated Pin and Pout respectively), and are often different.
Energy rating (storage capacity) (Q)
This is the quantity of available energy in the storage system after charging. Energy ratings
in this RFI are in MWh which allows a direct conversion between the maximum nameplate
rating of the device and the hours of storage it has available.
Depth of discharge (DoD)
DoD represents the limit of discharge depth (i.e. if a battery is 100 % fully charged, it means
the DoD of the battery is 0 %, while a fully discharged battery has a DoD of 100%).
Discharge time (DT)
This is the maximum power discharge duration. It depends on the DoD, the storage capacity,
the MWpk and the response time the system.
Round trip efficiency or cycle efficiency (Eff)
This is the ratio of whole system electricity output to the electricity input over a charge and
discharge cycle. It provides a measure of the losses in an energy storage device, which
usually is released as heat to the atmosphere.
Response time (RT)
This is the time required for an energy storage device to be capable of charging or
discharging energy. The speed of response may be important in frequency control ancillary
services and/or network services.
Self-discharge (SD)
This is the portion of energy that was initially stored and which has dissipated over a given
amount of non-use time (i.e. air leakage loses in CAES, electrochemical losses BES etc.).
Only certain potential energy storage systems (such as raising a solid mass to a certain
height) could be considered to have zero self-discharge.
Durability (lifetime and cycling time or cycling capacity) (D)
Durability is typically expressed as lifetime in years or cycling capacity in number of cycling
times (1 cycle corresponds to one charge and one discharge) [3].

APPENDICES
Appendix D. Extract of National Electricity Rules Requirements
The ESD connection to the transmission network is subject to the requirements of Chapter 5
of the National Electricity Rules (NER), and more specifically as outlined in NER Schedule
5.2 “Conditions for Connection of Generators”. The NER can be found at:
http://www.aemc.gov.au/Energy-Rules/National-electricity-rules/Current-Rules
Following below is an extract of the NER covering the technical requirements deemed most
relevant to the ESD.
Technical requirements
S5.2.5.1 Reactive power capability
Automatic access standard
(a) The automatic access standard is a generating system operating at:
(1) any level of active power output; and
(2) any voltage at the connection point within the limits established under
clause S5.1a.4 without a contingency event,
must be capable of supplying and absorbing continuously at its connection
point an amount of reactive power of at least the amount equal to the
product of the rated active power of the generating system and 0.395.
Minimum access standard
(b) The minimum access standard is no capability is required to supply or
absorb reactive power at the connection point.
Negotiated access standard
(c) When negotiating a negotiated access standard, the Generator and the
Network Service Provider:
(1) must subject to any agreement under paragraph (d)(4), ensure that the
reactive power capability of the generating system is sufficient to
ensure that all relevant system standards are met before and after
credible contingency events under normal and planned outage
operating conditions of the power system, taking into account at least
existing projects and considered projects;
(2) may negotiate either a range of reactive power absorption and supply,
or a range of power factor, at the connection point, within which the
plant must be operated; and
(3) may negotiate a limit that describes how the reactive power capability
varies as a function of active power output due to a design
characteristic of the plant.
(d) If the generating system is not capable of the level of performance
established under paragraph (c)(1) the Generator, depending on what is
reasonable in the circumstances, must:

APPENDICES
(1) pay compensation to the Network Service Provider for the provision
of the deficit of reactive power (supply and absorption) from within
the network;
(2) install additional equipment connecting at the generating system’s
connection point or another location, to provide the deficit of reactive
power (supply and absorption), and such equipment is deemed to be
part of the generating system;
(3) reach a commercial arrangement with a Registered Participant to
provide the deficit of reactive power (supply and absorption); or
(4) if the inability to meet the performance level only occurs for
particular operating conditions, agree to and document as part of the
proposed negotiated access standard, operational arrangements by
which the plant can achieve an agreed level of performance for those
operating conditions.
(e) The Generator may select one or more options referred to in paragraph (d).
General requirements
(f) An access standard must record the agreed value for rated active power
and where relevant the method of determining the value.
(g) An access standard for consumption of energy by a generating system
when not supplying or absorbing reactive power under an ancillary services
agreement is to be established under clause S5.3.5 as if the Generator were
a Market Customer.
S5.2.5.2 Quality of electricity generated
(a) For the purpose of this clause S5.2.5.2 in respect of a synchronous
generating unit, AS 1359.101 and IEC 60034-1 are plant standards for
harmonic voltage distortion.
Automatic access standard
(b) The automatic access standard is a generating system when generating and
when not generating must not produce at any of its connection points for
generation:
(1) voltage fluctuation greater than the limits allocated by the Network
Service Provider under clause S5.1.5(a);
(2) harmonic voltage distortion greater than the emission limits specified
by a plant standard under paragraph (a) or allocated by the Network
Service Provider under clause S5.1.6(a); and
(3) voltage unbalance greater than the limits allocated by the Network
Service Provider in accordance with clause S5.1.7(c).
Minimum access standard
(c) The minimum access standard is a generating system when generating and
when not generating must not produce at any of its connection points for
generation:

APPENDICES
(1) voltage fluctuations greater than limits determined under clause
S5.1.5(b);
(2) harmonic voltage distortion more than the lesser of the emission
limits determined by the relevant Network Service Provider under
clause S5.1.6(b) and specified by a plant standard under paragraph
(a); and
(3) voltage unbalance more than limits determined under clause
S5.1.7(c).
Negotiated access standard
(d) A negotiated access standard negotiated under this clause S5.2.5.2 must not
prevent the Network Service Provider meeting the system standards or
contractual obligations to existing Network Users.
S5.2.5.5 Generating system response to disturbances following contingency events
(a) In this clause S5.2.5.5 a fault includes:
(1) a fault of the relevant type having a metallic conducting path; and
(2) a fault of the relevant type resulting from reclosure onto a fault by the
operation of automatic reclose equipment.
Automatic access standard
(b) The automatic access standard is:
(1) a generating system and each of its generating units must remain in
continuous uninterrupted operation for a disturbance caused by an
event that is:
(i) a credible contingency event other than a fault referred to in
subparagraph (iv);
(ii) a three phase fault in a transmission system cleared by all
relevant primary protection systems;
(iii) a two phase to ground, phase to phase or phase to ground fault
in a transmission system cleared in:
(A) the longest time expected to be taken for a relevant
breaker fail protection system to clear the fault; or
(B) if a protection system referred to in subparagraph (A) is
not installed, the greater of the time specified in column 4
of Table S5.1a.2 (or if none is specified, 430
milliseconds) and the longest time expected to be taken
for all relevant primary protection systems to clear the
fault; and
(iv) a three phase, two phase to ground, phase to phase or phase to
ground fault in a distribution network cleared in:
(A) the longest time expected to be taken for the breaker fail
protection system to clear the fault; or

APPENDICES
(B) if a protection system referred to in subparagraph (A) is
not installed, the greater of 430 milliseconds and the
longest time expected to be taken for all relevant primary
protection systems to clear the fault,
provided that the event is not one that would disconnect the
generating unit from the power system by removing network elements
from service; and
(2) subject to any changed power system conditions or energy source
availability beyond the Generator’s reasonable control, a generating
system and each of its generating units, in respect of the types of fault
described in subparagraphs (1)(ii) to (iv), must supply to or absorb
from the network:
(i) to assist the maintenance of power system voltages during the
application of the fault, capacitive reactive current of at least the
greater of its pre-disturbance reactive current and 4% of the
maximum continuous current of the generating system
including all operating generating units (in the absence of a
disturbance) for each 1% reduction (from its pre-fault level) of
connection point voltage during the fault;
(ii) after disconnection of the faulted element, reactive power
sufficient to ensure that the connection point voltage is within
the range for continuous uninterrupted operation under clause
S5.2.5.4; and
(iii) from 100 milliseconds after disconnection of the faulted
element, active power of at least 95% of the level existing just
prior to the fault.
Minimum access standard
(c) The minimum access standard is:
(1) a generating system and each of its generating units must remain in
continuous uninterrupted operation for the disturbance caused by an
event that is:
(i) a credible contingency event other than a fault referred to in
subparagraph (iii);
(ii) a single phase to ground, phase to phase or two phase to ground
fault in a transmission system cleared in the longest time
expected to be taken for all relevant primary protection systems
to clear the fault unless AEMO and the Network Service
Provider agree that:
(A) the total reduction of generation in the power system due
to that fault would not exceed 100 MW;
(B) there is unlikely to be an adverse impact on quality of
supply to other Network Users; and
(C) there is unlikely to be a material adverse impact on power
system security; and

APPENDICES
(iii) a single phase to ground, phase to phase or two phase to ground
fault in a distribution network, cleared in the longest time
expected to be taken for all relevant primary protection systems
to clear the fault, unless AEMO and the Network Service
Provider agree that:
(A) the total reduction of generation in the power system due
to that fault would not exceed 100 MW;
(B) there is unlikely to be a material adverse impact on quality
of supply to other Network Users; and
(C) there is unlikely to be a material adverse impact on power
system security,
provided that the event is not one that would disconnect the
generating unit from the power system by removing network elements
from service; and
(2) subject to any changed power system conditions or energy source
availability beyond the Generator’s reasonable control after
disconnection of the faulted element, each generating system must, in
respect of the types of fault described in subparagraphs (1)(ii) and
(iii), deliver to the network, active power and supply or absorb
leading or lagging reactive power, sufficient to ensure that the
connection point voltage is within the range for continuous
uninterrupted operation agreed under clause S5.2.5.4.
Negotiated access standard
(d) In carrying out assessments of proposed negotiated access standards under
this clause S5.2.5.5, the Network Service Provider and AEMO must take
into account, without limitation:
(1) the expected performance of:
(i) existing networks and considered projects;
(ii) existing generating plant and other relevant projects; and
(iii) control systems and protection systems, including auxiliary
systems and automatic reclose equipment; and
(2) the expected range of power system operating conditions.
(e) A proposed negotiated access standard may be accepted if the connection
of the plant at the proposed access level would not cause other generating
plant or loads to trip as a result of an event, when they would otherwise not
have tripped for the same event.
(f) AEMO must advise on matters relating to negotiated access standards
under this clause S5.2.5.5.
General requirement
(g) The access standard must include any operational arrangements to ensure
the generating system including all operating generating units will meet its
agreed performance levels under abnormal network or generating system
conditions.

APPENDICES
S5.2.5.11 Frequency control
(a) For the purpose of this clause S5.2.5.11:
maximum operating level means in relation to:
(1) a non-scheduled generating unit, the maximum sent out generation
consistent with its nameplate rating;
(2) a scheduled generating unit or semi-scheduled generating unit, the
maximum sent out generation;
(3) a non-scheduled generating system, the combined maximum sent out
generation consistent with the nameplate ratings of its in-service
generating units; and
(4) a scheduled generating system or semi-scheduled generating system,
the combined maximum sent out generation of its in-service
generating units.
minimum operating level means in relation to:
(1) a non-scheduled generating unit, its minimum sent out generation for
continuous stable operation;
(2) a scheduled generating unit or semi-scheduled generating unit, its
minimum sent out generation for continuous stable operation
consistent with its registered bid and offer data;
(3) a non-scheduled generating system, the combined minimum operating
level of its in-service generating units; and
(4) a scheduled generating system or semi-scheduled generating system,
the combined minimum sent out generation of its in-service
generating units, consistent with its registered bid and offer data.
pre-disturbance level means in relation to a generating unit and a
frequency disturbance, the generating unit's level of output just before the
system frequency first exceeds the upper or lower limit of the normal
operating frequency band during the frequency disturbance.
system frequency means the frequency of the transmission system or
distribution system to which the generating unit or generating system is
connected.
Automatic access standard
(b) The automatic access standard is:
(1) a generating system’s active power transfer to the power system must
not:
(i) increase in response to a rise in system frequency; or
(ii) decrease in response to a fall in system frequency;
(2) a generating system must be capable of automatically reducing its
active power transfer to the power system:
(i) whenever the system frequency exceeds the upper limit of the
normal operating frequency band;

APPENDICES
(ii) by an amount that equals or exceeds the least of:
(A) 20% of its maximum operating level times the frequency
difference between system frequency and the upper limit
of the normal operating frequency band;
(B) 10% of its maximum operating level; and
(C) the difference between the generating unit's pre-
disturbance level and minimum operating level, but zero
if the difference is negative; and
(iii) sufficiently rapidly for the Generator to be in a position to offer
measurable amounts of lower services to the spot market for
market ancillary services; and
(3) a generating system must be capable of automatically increasing its
active power transfer to the power system:
(i) whenever the system frequency falls below the lower limit of
the normal operating frequency band;
(ii) by the amount that equals or exceeds the least of:
(A) 20% of its maximum operating level times the percentage
frequency difference between the lower limit of the
normal operating frequency band and system frequency;
(B) 5% of its maximum operating level; and
(C) one third of the difference between the generating unit's
maximum operating level and pre-disturbance level, but
zero if the difference is negative; and
(iii) sufficiently rapidly for the Generator to be in a position to offer
measurable amounts of raise services to the spot market for
market ancillary services.
Minimum access standard
(c) The minimum access standard is a generating system under relatively stable
input energy, active power transfer to the power system must not:
(1) increase in response to a rise in system frequency; and
(2) decrease more than 2% per Hz in response to a fall in system
frequency.
Negotiated access standard
(d) A Generator proposing a negotiated access standard in respect of
paragraph (c)(2) must demonstrate to AEMO that the proposed increase and
decrease in active power transfer to the power system are as close as
practicable to the automatic access standard for that plant.
(e) The negotiated access standard must record the agreed values for
maximum operating level and minimum operating level, and where relevant
the method of determining the values and the values for a generating system
must take into account its in-service generating units.

APPENDICES
(f) AEMO must advise on matters relating to negotiated access standards
under this clause S5.2.5.11.
General requirements
(g) Each control system used to satisfy this clause S5.2.5.11 must be
adequately damped.
(h) The amount of a relevant market ancillary service for which the plant may
be registered must not exceed the amount that would be consistent with the
performance standard registered in respect of this requirement.
S5.2.5.12 Impact on network capability
Automatic access standard
(a) The automatic access standard is a generating system must have plant
capabilities and control systems that are sufficient so that when connected it
does not reduce any inter-regional or intra-regional power transfer
capability below the level that would apply if the generating system were
not connected.
Minimum access standard
(b) The minimum access standard is a generating system must have plant
capabilities, control systems and operational arrangements sufficient to
ensure there is no reduction in:
(1) the ability to supply Customer load as a result of a reduction in power
transfer capability; and
(2) power transfer capabilities into a region by more than the combined
sent out generation of its generating units.
Negotiated access standard
(c) In carrying out assessments of proposed negotiated access standards under
this clause S5.2.5.12, the Network Service Provider and AEMO must take
into account:
(1) the expected performance of:
(i) existing networks and considered projects;
(ii) existing generating plant and other relevant projects; and
(iii) control systems and protection systems, including automatic
reclose equipment; and
(2) the expected range of power system operating conditions.
(d) The negotiated access standard must include:
(1) control systems to minimise any reduction in power transfer
capabilities; and
(2) operational arrangements, including curtailment of the generating
system’s output if necessary to ensure that the generating plant is
operated in a way that meets at least the minimum access standard

APPENDICES
under abnormal network and generating system conditions, so that
power system security can be maintained.
(e) A negotiated access standard under this clause S5.2.5.12 must detail the
plant capabilities, control systems and operational arrangements that will be
maintained by the Generator, notwithstanding that change to the power
system, but not changes to the generating system, may reduce the efficacy
of the plant capabilities, control systems and operational arrangements over
time.
(f) AEMO must advise on matters relating to negotiated access standards
under this clause S5.2.5.12.
General requirement
(g) If a Network Service Provider considers that power transfer capabilities of
its network would be increased through provision of additional control
system facilities to a generating system (such as a power system stabiliser),
the Network Service Provider and the Generator may negotiate for the
provision of such additional control system facilities as a commercial
arrangement.
S5.2.5.13 Voltage and reactive power control
(a) For the purpose of this clause S5.2.5.13:
rise time means in relation to a step response test or simulation of a control
system, the time taken for an output quantity to rise from 10% to 90% of the
maximum change induced in that quantity by a step change of an input
quantity.
settling time means in relation to a step response test or simulation of a
control system, the time measured from initiation of a step change in an
input quantity to the time when the magnitude of error between the output
quantity and its final settling value remains less than 10% of:
(1) if the sustained change in the quantity is less than half of the
maximum change in that output quantity, the maximum change
induced in that output quantity; or
(2) the sustained change induced in that output quantity.
static excitation system means in relation to a synchronous generating
unit, an excitation control system that does not use rotating machinery to
produce the field current.
Automatic access standard
(b) The automatic access standard is:
(1) a generating system must have plant capabilities and control systems
sufficient to ensure that:
(i) power system oscillations, for the frequencies of oscillation of
the generating unit against any other generating unit, are
adequately damped;

APPENDICES
(ii) operation of the generating system does not degrade the
damping of any critical mode of oscillation of the power system;
and
(iii) operation of the generating system does not cause instability
(including hunting of tap-changing transformer control
systems) that would adversely impact other Registered
Participants;
(2) a control system must have:
(i) for the purposes of disturbance monitoring and testing,
permanently installed and operational, monitoring and recording
facilities for key variables including each input and output; and
(ii) facilities for testing the control system sufficient to establish its
dynamic operational characteristics;
(3) a synchronous generating system must have an excitation control
system that:
(i) regulates voltage at the connection point or another agreed
location in the power system (including within the generating
system) to within 0.5% of the setpoint;
(ii) is able to operate the stator continuously at 105% of nominal
voltage with rated active power output;
(iii) regulates voltage in a manner that helps to support network
voltages during faults and does not prevent the Network Service
Provider from achieving the requirements of clause S5.1a.3 and
S5.1a.4;
(iv) allows the voltage setpoint to be continuously controllable in
the range of at least 95% to 105% of normal voltage at the
connection point or the agreed location, without reliance on a
tap-changing transformer;
(v) has limiting devices to ensure that a voltage disturbance does
not cause the generating unit to trip at the limits of its operating
capability;
(vi) has an excitation ceiling voltage of at least:
(A) for a static excitation system, 2.3 times; or
(B) for other excitation control systems, 1.5 times,
the excitation required to achieve generation at the nameplate
rating for rated power factor, rated speed and nominal voltage;
(vii) has settling times for a step change of voltage setpoint or
voltage at the location agreed under subparagraph (i) of:
(A) generated voltage less than 2.5 seconds for a 5% voltage
disturbance with the generating unit not synchronised;
(B) active power, reactive power and voltage less than 5.0
seconds for a 5% voltage disturbance with the generating
unit synchronised, from an operating point where the

APPENDICES
voltage disturbance would not cause any limiting device
to operate; and
(C) in respect of each limiting device, active power, reactive
power and voltage less than 7.5 seconds for a 5% voltage
disturbance with the generating unit synchronised, when
operating into a limiting device from an operating point
where a voltage disturbance of 2.5% would just cause the
limiting device to operate;
(viii) is able to increase field voltage from rated field voltage to the
excitation ceiling voltage in less than:
(A) 0.05 second for a static excitation system; or
(B) 0.5 second for other excitation control systems;
(ix) has a power system stabiliser with sufficient flexibility to enable
damping performance to be maximised, with characteristics as
described in paragraph (c); and
(x) has reactive current compensation settable for boost or droop;
and
(4) a generating system, other than one comprised of synchronous
generating units, must have a voltage control system that:
(i) regulates voltage at the connection point or an agreed location
in the power system (including within the generating system) to
within 0.5% of its setpoint;
(ii) regulates voltage in a manner that helps to support network
voltages during faults and does not prevent the Network Service
Provider from achieving the requirements of clauses S5.1a.3
and S5.1a.4;
(iii) allows the voltage setpoint to be continuously controllable in
the range of at least 95% to 105% of normal voltage at the
connection point or agreed location in the power system,
without reliance on a tap changing transformer;
(iv) has limiting devices to ensure that a voltage disturbance does
not cause the generating unit to trip at the limits of its operating
capability;
(v) with the generating system connected to the power system, has
settling times for active power, reactive power and voltage due
to a step change of voltage setpoint or voltage at the location
agreed under clause subparagraph (i), of less than:
(A) 5.0 seconds for a 5% voltage disturbance with the
generating system connected to the power system, from an
operating point where the voltage disturbance would not
cause any limiting device to operate; and
(B) 7.5 seconds for a 5% voltage disturbance with the
generating system connected to the power system, when
operating into any limiting device from an operating point

APPENDICES
where a voltage disturbance of 2.5% would just cause the
limiting device to operate;
(vi) has reactive power rise time, for a 5% step change in the
voltage setpoint, of less than 2 seconds;
(vii) has a power system stabiliser with sufficient flexibility to enable
damping performance to be maximised, with characteristics as
described in paragraph (c); and
(viii) has reactive current compensation.
(c) A power system stabiliser provided under paragraph (b) must have:
(1) for a synchronous generating unit, measurements of rotor speed and
active power output of the generating unit as inputs, and otherwise,
measurements of power system frequency and active power output of
the generating unit as inputs;
(2) two washout filters for each input, with ability to bypass one of them
if necessary;
(3) sufficient (and not less than two) lead-lag transfer function blocks (or
equivalent number of complex poles and zeros) with adjustable gain
and time-constants, to compensate fully for the phase lags due to the
generating plant;
(4) an output limiter, which for a synchronous generating unit is
continually adjustable over the range of –10% to +10% of stator
voltage;
(5) monitoring and recording facilities for key variables including inputs,
output and the inputs to the lead-lag transfer function blocks; and
(6) facilities to permit testing of the power system stabiliser in isolation
from the power system by injection of test signals, sufficient to
establish the transfer function of the power system stabiliser.
Minimum access standard
(d) The minimum access standard is:
(1) a generating system must have plant capabilities and control systems,
including, if appropriate, a power system stabiliser, sufficient to
ensure that:
(i) power system oscillations, for the frequencies of oscillation of
the generating unit against any other generating unit, are
adequately damped;
(ii) operation of the generating unit does not degrade:
(A) any mode of oscillation that is within 0.3 nepers per
second of being unstable, by more than 0.01 nepers per
second; and
(B) any other mode of oscillation to within 0.29 nepers per
second of being unstable; and

APPENDICES
(iii) operation of the generating unit does not cause instability
(including hunting of tap-changing transformer control
systems) that would adversely impact other Registered
Participants;
(2) a generating system comprised of generating units with a combined
nameplate rating of 30 MW or more must have facilities for testing
its control systems sufficient to establish their dynamic operational
characteristics;
(3) a generating unit or generating system must have facilities:
(i) where the connection point nominal voltage is 100 kV or more,
to regulate voltage in a manner that does not prevent the
Network Service Provider from achieving the requirements of
clauses S5.1a.3 and S5.1a.4; or
(ii) where the connection point nominal voltage is less than 100 kV,
to regulate voltage or reactive power or power factor in a
manner that does not prevent the Network Service Provider
from achieving the requirements of clauses S5.1a.3 and S5.1a.4,
and sufficient to achieve the performance agreed in respect of clauses
S5.2.5.1, S5.2.5.2, S5.2.5.3, S5.2.5.4, S5.2.5.5, S5.2.5.6 and
S5.2.5.12;
(4) a synchronous generating unit, that is part of a generating system
comprised of generating units with a combined nameplate rating of
30 MW or more, must have an excitation control system that:
(i) regulates voltage, power factor or reactive power as agreed with
the Network Service Provider and AEMO;
(ii) has excitation ceiling voltage of at least 1.5 times the excitation
required to achieve generation at the nameplate rating for rated
power factor, rated speed and nominal voltage;
(iii) subject to co-ordination under paragraph (i), has a settling time
of less than 5.0 seconds for a 5% voltage disturbance with the
generating unit synchronised, from an operating point where
such a voltage disturbance would not cause any limiting device
to operate; and
(iv) has over and under excitation limiting devices sufficient to
ensure that a voltage disturbance does not cause the generating
unit to trip at the limits of its operating capability; and
(5) a generating system comprised of generating units with a combined
nameplate rating of 30 MW or more and which are asynchronous
generating units, must have a control system that:
(i) regulates voltage, power factor or reactive power as agreed with
the Network Service Provider and AEMO;
(ii) subject to co-ordination under subparagraph (i), has a settling
time less than 7.5 seconds for a 5% voltage disturbance with the
generating unit electrically connected to the power system from

APPENDICES
an operating point where such a voltage disturbance would not
cause any limiting device to operate; and
(iii) has limiting devices to ensure that a voltage disturbance would
not cause the generating unit to trip at the limits of its operating
capability.
Negotiated access standard
(e) If a generating system cannot meet the automatic access standard, the
Generator must demonstrate to the Network Service Provider why that
standard could not be reasonably achieved and propose a negotiated access
standard.
(f) The negotiated access standard proposed by the Generator under paragraph
(e) must be the highest level that the generating system can reasonably
achieve, including by installation of additional dynamic reactive power
equipment, and through optimising its control systems.
(g) AEMO must advise on matters relating to negotiated access standards
under this clause S5.2.5.13.
General requirements
(h) A limiting device provided under paragraphs (b) and (c) must:
(1) not detract from the performance of any power system stabiliser; and
(2) be co-ordinated with all protection systems.
(i) The Network Service Provider may require that the design and operation of
the control systems of a generating unit or generating system be
coordinated with the existing voltage control systems of the Network
Service Provider and of other Network Users, in order to avoid or manage
interactions that would adversely impact on the Network Service Provider
and other Network Users.
(j) Any requirements imposed by the Network Service Provider under
paragraph (i) must be recorded in the access standard.
(k) The assessment of impact of the generating units on power system stability
and damping of power system oscillations shall be in accordance with the
guidelines for power system stability established under clause 4.3.4(h).

APPENDICES
Appendix E. Envisaged Market Trading Mode Operation
The following provides a general description of the Market Trading function that the ESD
would be envisaged to have, using output from the ESD model that has been built by the
ESCRI Consortium. At this stage this thinking is preliminary and subject to change, but is
provided to give Respondents an indication of the type of duty cycle envisaged while the
device is in Market Trading Mode – that is, when the device is dispatched to maximise the
market value due to time shifting of electrical power.
In this mode it is envisaged it will switch according to the pool price that is defined by the
market for each 30 minute dispatch period. In the event that the device is dispatched to
support the network (Network Mode), this will override any pricing signals it receives and that
Mode will likely have priority – however, simulations indicate this is unlikely to greatly impact
on the frequency of dispatch of the device.
The electricity pool prices typically proceed in a pattern as shown in figure E1 below. A daily
signal can be discerned in most pool price trajectories whereby prices are high during peak
periods and low during off-peak periods. However, the pool price is controlled by market
conditions - accordingly price spikes and chaotic behaviour is not unusual.
Figure E1 Typical trajectory of SA pool prices over a period of 2 weeks (672 x 30 minute
market dispatch periods)
The envisaged device will be too small to impact on the market behaviour of the pool price,
but it can take advantage of the differences in pricing to generate revenue by time shifting
power.
Figure E2 below shows a two week period whereby price thresholds are set up in order to
decide when the device should be dispatched as a generator and when it should be
dispatched as a load.
Figure E2 Typical two week trading interval showing typical threshold levels

APPENDICES
It is envisaged that the storage device will be dispatched as a generator whenever the pool
price is above a pre-set threshold (for example $ 31 /MWh) and dispatched as a load
whenever the pool price is below another threshold (for example $ 29/MWh). Whenever the
pool price is between thresholds the device is switched off or in standby.
In order to maximise the possible revenue from this form of dispatch, it is envisaged that the
device will normally be either fully on or fully off whenever it receives an automated signal to
dispatch, although this algorithm may require further consideration to optimise.
The device will continue in this mode until the pool price falls back below (or above) the
relevant threshold, or if the device has fully charged (load dispatch case) or discharged
(generation dispatch case), in which case the device will be switched off or placed in
standby.
Figure E3 shows the simulated dispatch of a 5 hour rated storage device under these
conditions for an arbitrary trading interval.
Figure E3 In general the device will be dispatched whenever the pool price is above its
relevant threshold. However in the event that the device is fully charged or discharged it will
switch off or go into standby.
The Figures above indicate that in this case the storage device would be dispatched as a
generator 22 times over a 14 day period, and 22 times as a load. I.e. on average the device
is dispatched about 1.6 times per day as a generator or as a load. This coincides with the
fact that in general there are two system peaks in a day – except for weekends and public
holidays – in South Australia.
Increasing the amount of storage enables the device to be switched on for longer periods
before reaching its fully charged or fully discharged state, as shown in Figure E4.

APPENDICES
Figure E4 The graphs above are generated by the same pool price trajectory and trading
interval as for Figure E3. However, in this case it is assumed the amount of storage available
is increased from 5 hours to 24 hours.
In Figure E4 the storage is increased from 5 hours to 25 hours, and the Figure indicates that
in this case the storage device would be dispatched as a generator 22 times over a 14 day
period, and 21 times as a load, which is almost the same as the case shown in Figure E3.
The main difference is in the period the device is on – not the number of times it is switched.
Once again, on average the device is about 1.6 times per day as a generator or as a load.
This seems to be typical behaviour for the device over various times of the year.
Larger storage times affect the duty expected of the storage medium. Larger amounts of
storage translate into a lesser percentage of duty and wear and tear on the battery as
indicated in the group of graphs of Figure E5 on the next page. ESCRI is seeking through
the RFI process information about battery story technology which will help optimise such
fundamental parameters to aid in business case determination.

APPENDICES
Figure E5 The difference in expected MWh throughput for 5 and 24 hour storage cases. For
the 5 hour case (top) the MWh through put for two weeks use is simulated to be about 120
MWh. For the 24 hour case (bottom) the MWh throughput for two weeks use is simulated to
be about 260 MWh – i.e. only about double even though the capacity of the device has been
increased by a factor of nearly 5.